|
Date of report (Date of earliest event reported)
|
August 29, 2024
|
|
Connecticut
|
001-39063
|
06-0854886
|
|
(State or Other Jurisdiction of) Incorporation
|
(Commission File Number)
|
(IRS Employer Identification No.) |
|
15 Secor Road, Brookfield, CT
|
|
06804 |
|
(Address of principal executive offices)
|
|
(Zip Code)
|
|
Registrant's Telephone Number, including area code
|
(203) 775-9000
|
| ☐ |
Written communications pursuant to Rule 425 under the Securities Act (17 CFR 230.425)
|
| ☐ |
Soliciting material pursuant to Rule 14a-12 under the Exchange Act (17 CFR 240.14a-12)
|
| ☐ |
Pre-commencement communications pursuant to Rule 14d-2(b) under the Exchange Act (17 CFR 240.14d-2(b))
|
| ☐ |
Pre-commencement communications pursuant to Rule 13e-4(c) under the Exchange Act (17 CFR 240.13e-4(c))
|
|
Title of each class
|
Trading Symbol(s)
|
Name of each exchange on which registered
|
|
COMMON STOCK, $0.01 par value per share
|
PLAB
|
NASDAQ Global Select Market
|
| Item 2.02. |
Results of Operations and Financial Condition.
|
| Item 9.01. |
Financial Statements and Exhibits.
|
| (d) |
Exhibits
|
|
Press Release August 29, 2024.
|
|
|
Condensed Consolidated Statements of Income.
|
|
|
Condensed Consolidated Balance Sheets.
|
|
|
Condensed Consolidated Statements of Cash Flows.
|
|
|
Reconciliation of GAAP to Non-GAAP Financial Information.
|
|
|
Photronics Q3 2024 Financial Results Conference Call August 29, 2024 slides.
|
|
PHOTRONICS, INC. (Registrant)
|
||
|
By:
|
/s/ Eric Rivera
|
|
|
Name:
|
Eric Rivera
|
|
|
Title:
|
Chief Financial Officer
|
|
|
Date: August 29, 2024
|
||

|
For Further Information:
Eric Rivera
Chief Financial Officer
203.740.5301
investorrelations@photronics.com
|
|
|
• |
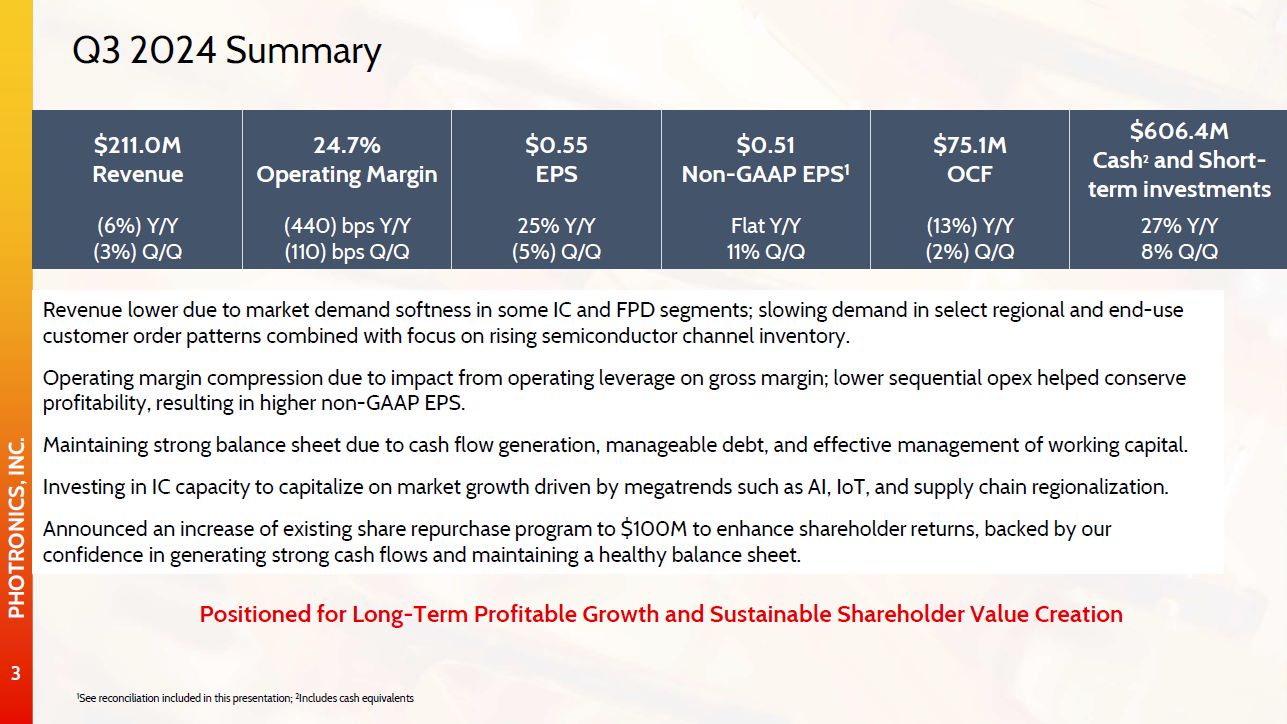
Revenue was $211.0 million, down 6% year-over-year and 3% sequentially.
|
|
|
• |
GAAP Net income attributable to Photronics, Inc. shareholders was $34.4 million, or $0.55 per diluted share, compared with $27.0 million, or $0.44 per diluted share in the third
quarter of 2023 and $36.3 million, or $0.58 per diluted share in the second quarter of 2024.
|
|
|
• |
Non-GAAP Net income attributable to Photronics, Inc. shareholders was $32.0 million, or $0.51 per diluted share, compared with $31.6 million, or $0.51 per diluted share in the
third quarter of 2023 and $28.7 million, or $0.46 per diluted share in the second quarter of 2024.
|
|
|
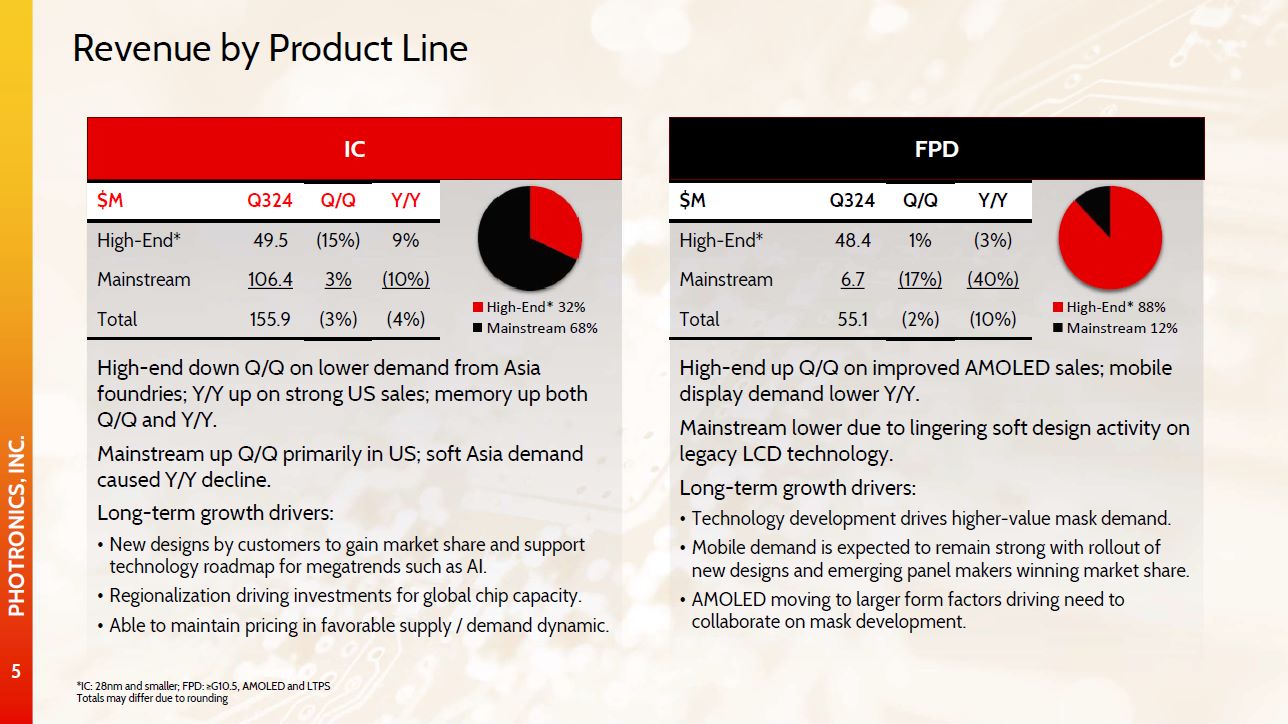
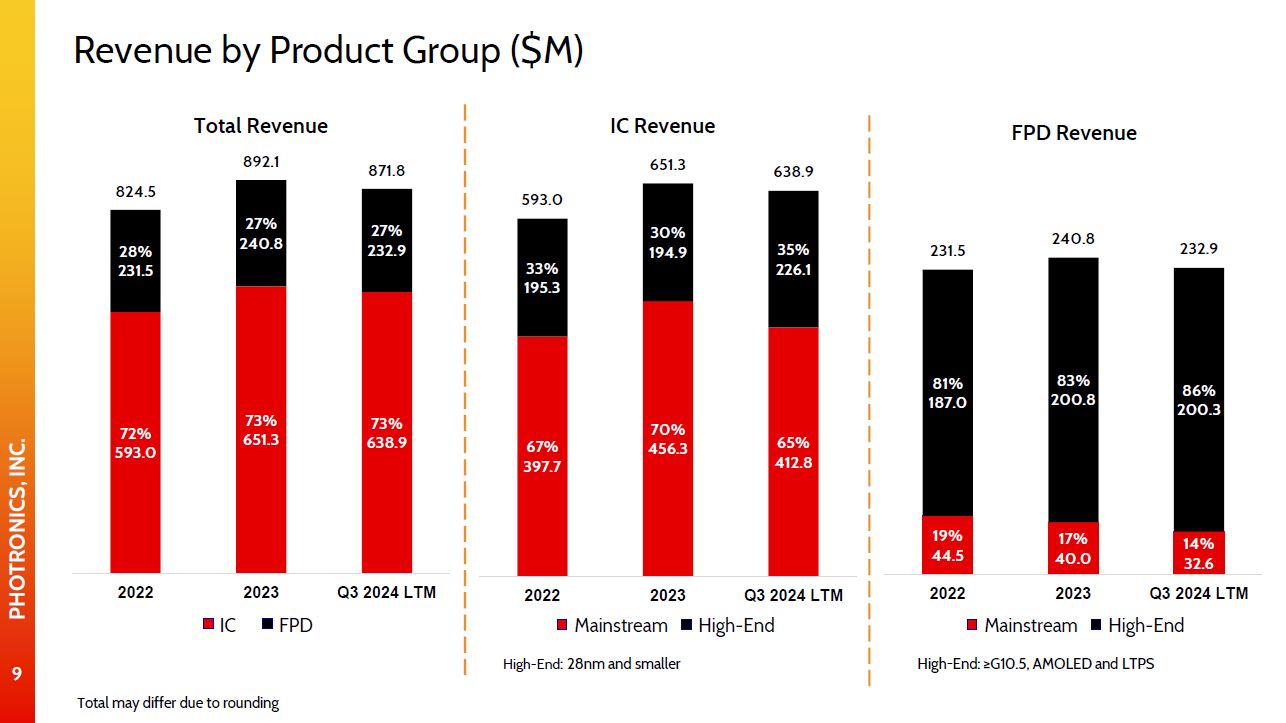
• |
IC revenue was $155.9 million, down 4% year-over-year and 3% sequentially.
|
|
|
• |
FPD revenue was $55.1 million, down 10% from the same quarter last year and 2% sequentially.
|
|
|
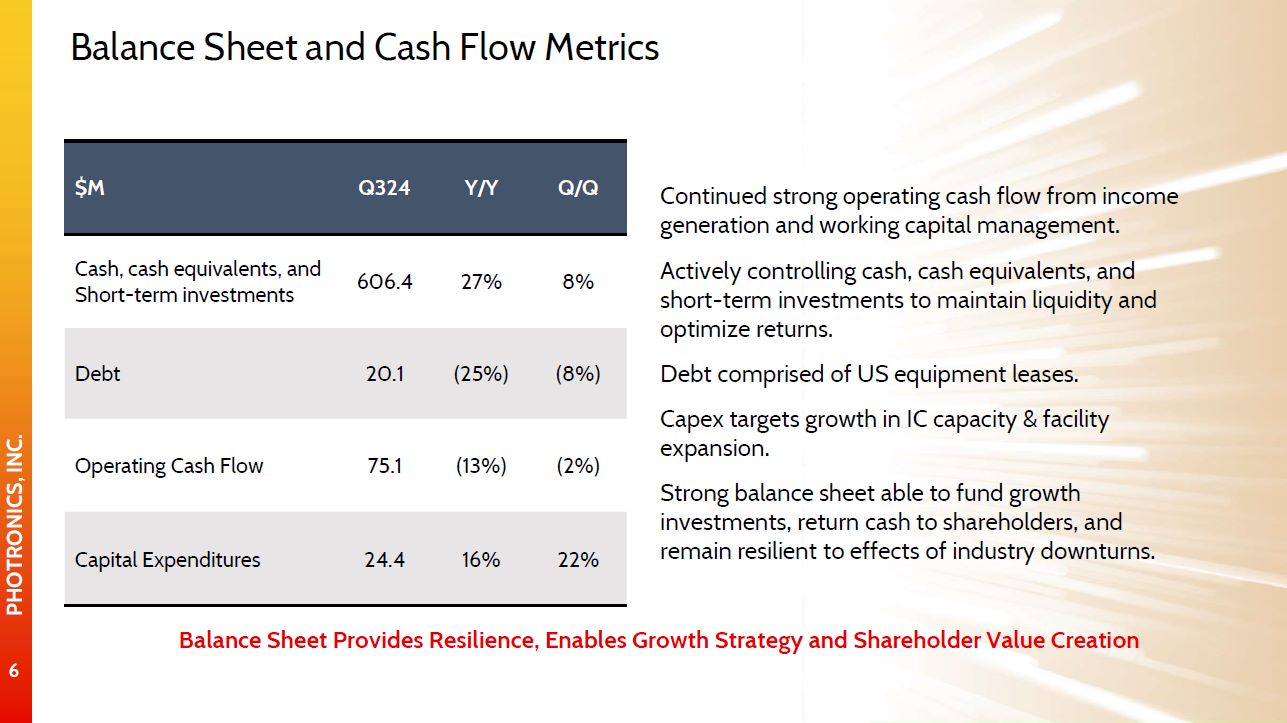
• |
Cash generated from operating activities was $75.1 million, and cash invested in organic growth through capital expenditures was $24.4 million.
|
|
|
• |
Cash and Short-term investments at the end of the quarter were $606.4 million, and Debt was $20.1 million.
|
|
Three Months Ended
|
Nine Months Ended
|
|||||||||||||||||||
|
July 28,
2024
|
April 28,
2024
|
July 30,
2023
|
July 28,
2024
|
July 30,
2023
|
||||||||||||||||
|
Revenue
|
$
|
210,984
|
$
|
217,000
|
$
|
224,206
|
$
|
644,318
|
$
|
664,603
|
||||||||||
|
Cost of goods sold
|
135,846
|
137,749
|
137,405
|
410,674
|
413,323
|
|||||||||||||||
|
Gross Profit
|
75,138
|
79,251
|
86,801
|
233,644
|
251,280
|
|||||||||||||||
|
Operating Expenses:
|
||||||||||||||||||||
|
Selling, general and administrative
|
19,436
|
18,996
|
18,032
|
56,753
|
52,728
|
|||||||||||||||
|
Research and development
|
3,555
|
4,292
|
3,505
|
11,291
|
10,287
|
|||||||||||||||
|
Total Operating Expenses
|
22,991
|
23,288
|
21,537
|
68,044
|
63,015
|
|||||||||||||||
|
Other operating gain
|
1
|
89
|
-
|
90
|
-
|
|||||||||||||||
|
Operating Income
|
52,148
|
56,052
|
65,264
|
165,690
|
188,265
|
|||||||||||||||
|
Non-operating (loss) income, net
|
10,145
|
20,534
|
(911
|
)
|
26,931
|
(1,764
|
)
|
|||||||||||||
|
Income Before Income Tax Provision
|
62,293
|
76,586
|
64,353
|
192,621
|
186,501
|
|||||||||||||||
|
Income tax provision
|
14,124
|
20,214
|
16,098
|
48,998
|
50,023
|
|||||||||||||||
|
Net Income
|
48,169
|
56,372
|
48,255
|
143,623
|
136,478
|
|||||||||||||||
|
Net income attributable to noncontrolling interests
|
13,781
|
20,121
|
21,296
|
46,804
|
55,604
|
|||||||||||||||
|
Net income attributable to Photronics, Inc. shareholders
|
$
|
34,388
|
$
|
36,251
|
$
|
26,959
|
$
|
96,819
|
$
|
80,874
|
||||||||||
|
Earnings per share:
|
||||||||||||||||||||
|
Basic
|
$
|
0.56
|
$
|
0.59
|
$
|
0.44
|
$
|
1.57
|
$
|
1.32
|
||||||||||
|
Diluted
|
$
|
0.55
|
$
|
0.58
|
$
|
0.44
|
$
|
1.55
|
$
|
1.31
|
||||||||||
|
Weighted-average number of common shares outstanding:
|
||||||||||||||||||||
|
Basic
|
61,815
|
61,771
|
61,233
|
61,681
|
61,089
|
|||||||||||||||
|
Diluted
|
62,414
|
62,409
|
61,974
|
62,369
|
61,650
|
|||||||||||||||
|
July 28,
|
October 31,
|
|||||||
|
2024
|
2023
|
|||||||
|
Assets
|
||||||||
|
Current assets:
|
||||||||
|
Cash and cash equivalents
|
$
|
537,331
|
$
|
499,292
|
||||
|
Short-term investments
|
69,046
|
12,915
|
||||||
|
Accounts receivable
|
199,926
|
194,927
|
||||||
|
Inventories
|
55,472
|
49,963
|
||||||
|
Other current assets
|
30,865
|
28,353
|
||||||
|
Total current assets
|
892,640
|
785,450
|
||||||
|
Property, plant and equipment, net
|
722,638
|
709,244
|
||||||
|
Other assets
|
29,823
|
31,527
|
||||||
|
Total assets
|
$
|
1,645,101
|
$
|
1,526,221
|
||||
|
Liabilities and Equity
|
||||||||
|
Current liabilities:
|
||||||||
|
Current portion of long-term debt
|
$
|
20,090
|
$
|
6,621
|
||||
|
Accounts payable and accrued liabilities
|
171,036
|
178,602
|
||||||
|
Total current liabilities
|
191,126
|
185,223
|
||||||
|
Long-term debt
|
28
|
17,998
|
||||||
|
Other liabilities
|
40,518
|
47,391
|
||||||
|
Equity:
|
||||||||
|
Photronics, Inc. shareholders' equity
|
1,067,994
|
975,008
|
||||||
|
Noncontrolling interests
|
345,435
|
300,601
|
||||||
|
Total equity
|
1,413,429
|
1,275,609
|
||||||
|
Total liabilities and equity
|
$
|
1,645,101
|
$
|
1,526,221
|
||||
|
Nine Months Ended
|
||||||||
|
July 28,
2024
|
July 30,
2023
|
|||||||
|
Cash flows from operating activities:
|
||||||||
|
Net income
|
$
|
143,623
|
$
|
136,478
|
||||
|
Adjustments to reconcile net income to net cash
|
||||||||
|
provided by operating activities:
|
||||||||
|
Depreciation and amortization
|
61,613
|
59,523
|
||||||
|
Share-based compensation
|
9,841
|
5,874
|
||||||
|
Changes in operating assets, liabilities and other
|
(22,003
|
)
|
(6,319
|
)
|
||||
|
Net cash provided by operating activities
|
193,074
|
195,556
|
||||||
|
Cash flows from investing activities:
|
||||||||
|
Purchases of property, plant and equipment
|
(87,733
|
)
|
(78,813
|
)
|
||||
|
Purchases of short-term investments
|
(100,558
|
)
|
(9,837
|
)
|
||||
|
Proceeds from maturities of short-term investments
|
44,696
|
22,500
|
||||||
|
Government incentives
|
1,541
|
2,033
|
||||||
|
Other
|
(4
|
)
|
(116
|
)
|
||||
|
Net cash used in investing activities
|
(142,058
|
)
|
(64,233
|
)
|
||||
|
Cash flows from financing activities:
|
||||||||
|
Repayments of debt
|
(4,500
|
)
|
(16,351
|
)
|
||||
|
Proceeds from share-based arrangements
|
1,074
|
1,241
|
||||||
|
Net settlements of restricted stock awards
|
(3,002
|
)
|
(1,292
|
)
|
||||
|
Net cash used in financing activities
|
(6,428
|
)
|
(16,402
|
)
|
||||
|
Effects of exchange rate changes on cash, cash equivalents, and restricted cash
|
(6,454
|
)
|
13,813
|
|||||
|
Net increase in cash, cash equivalents, and restricted cash
|
38,134
|
128,734
|
||||||
|
Cash, cash equivalents, and restricted cash, beginning of period
|
501,867
|
322,409
|
||||||
|
Cash, cash equivalents, and restricted cash, end of period
|
$
|
540,001
|
$
|
451,143
|
||||
|
Three Months ended
|
||||||||||||
|
July 28,
2024
|
April 28,
2024
|
July 30,
2023
|
||||||||||
|
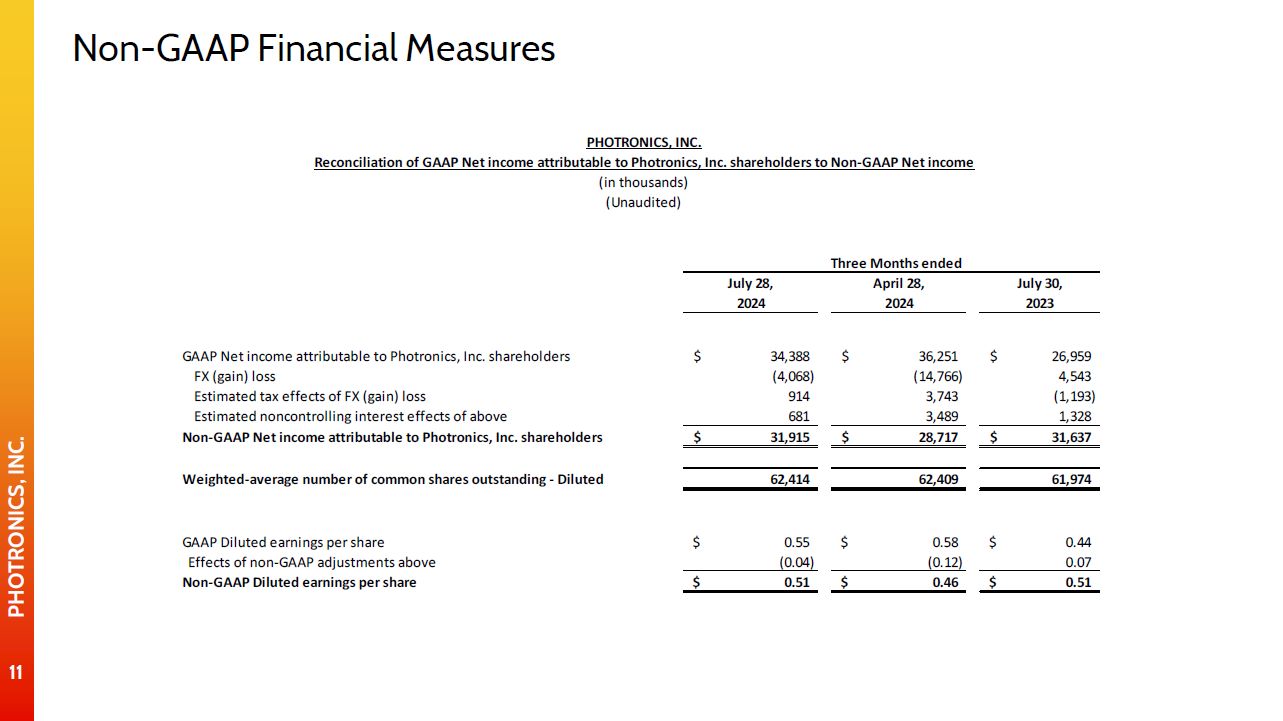
GAAP Net income attributable to Photronics, Inc. shareholders
|
$
|
34,388
|
$
|
36,251
|
$
|
26,959
|
||||||
|
FX (gain) loss
|
(4,068
|
)
|
(14,766
|
)
|
4,543
|
|||||||
|
Estimated tax effects of FX (gain) loss
|
914
|
3,743
|
(1,193
|
)
|
||||||||
|
Estimated noncontrolling interest effects of above
|
681
|
3,489
|
1,328
|
|||||||||
|
Non-GAAP Net income attributable to Photronics, Inc. shareholders
|
$
|
31,915
|
$
|
28,717
|
$
|
31,637
|
||||||
|
Weighted-average number of common shares outstanding - Diluted
|
62,414
|
62,409
|
61,974
|
|||||||||
|
GAAP Diluted earnings per share
|
$
|
0.55
|
$
|
0.58
|
$
|
0.44
|
||||||
|
Effects of non-GAAP adjustments above
|
(0.04
|
)
|
(0.12
|
)
|
0.07
|
|||||||
|
Non-GAAP Diluted earnings per share
|
$
|
0.51
|
$
|
0.46
|
$
|
0.51
|
||||||