|
Puerto Rico
|
001-14793
|
66-0561882
|
|
(State or Other Jurisdiction of Incorporation)
|
(Commission File Number)
|
(I.R.S. Employer Identification No.)
|
|
1519 Ponce de Leon Ave.
P.O. Box 9146
San Juan, Puerto Rico
|
|
00908-0146
|
|
(Address of Principal Executive Offices)
|
|
(Zip Code)
|
| ☐ |
Written communications pursuant to Rule 425 under the Securities Act (17 CFR 230.425)
|
| ☐ |
Soliciting material pursuant to Rule 14a-12 under the Exchange Act (17 CFR 240.14a-12)
|
| ☐ |
Pre-commencement communications pursuant to Rule 14d-2(b) under the Exchange Act (17 CFR 240.14d-2(b))
|
| ☐ |
Pre-commencement communications pursuant to Rule 13e-4(c) under the Exchange Act (17 CFR 240.13e-4(c))
|
|
Title of each class
|
Trading
Symbol(s)
|
Name of each exchange on which
registered
|
| Common Stock ($0.10 par value) |
FBP |
New York Stock Exchange |
| Item 2.02 |
Results of Operations and Financial Condition.
|
| Item 9.01 |
Financial Statements and Exhibits
|
|
(d)
|
Exhibits
|
|
Exhibit
|
|
Description of Exhibit
|
|
99.1
|
Press Release dated July 23, 2024 - First BanCorp Announces Earnings for the quarter ended June 30, 2024
|
|
|
99.2
|
First BanCorp Conference Call Presentation – Financial Results for the quarter ended June 30, 2024
|
|
|
104
|
Cover Page Interactive Data File (embedded within the Inline XBRL document).
|
|
|
Exhibits 99.1 and 99.2 referenced therein, shall not be deemed “filed” for purposes of Section 18 of the Securities Exchange Act of 1934, as amended, nor shall
Exhibits 99.1 and 99.2 be deemed incorporated by reference in any filings under the Securities Act of 1933, as amended.
|
|
Exhibit
|
|
Description of Exhibit
|
|
Press Release dated July 23, 2024 - First BanCorp Announces Earnings for the quarter ended June 30, 2024
|
||
|
First BanCorp Conference Call Presentation – Financial Results for the quarter ended June 30, 2024
|
||
|
104
|
Cover Page Interactive Data File (embedded within the Inline XBRL document).
|
|
|
Exhibits 99.1 and 99.2 referenced therein, shall not be deemed “filed” for purposes of Section 18 of the Securities Exchange Act of 1934, as amended, nor shall
Exhibits 99.1 and 99.2 be deemed incorporated by reference in any filings under the Securities Act of 1933, as amended.
|
|
Date: July 23, 2024
|
First BanCorp.
|
|
|
By:
|
/s/ Orlando Berges
|
|
|
Name:
|
Orlando Berges
|
|
|
Title:
|
EVP and Chief Financial Officer
|
|

|
Q2
|
Q1
|
Q2
|
YTD June
|
|||||||||||||||||
|
(In thousands, except per share information and financial ratios)
|
2024
|
2024
|
2023
|
2024
|
2023
|
|||||||||||||||
|
Financial Highlights
|
||||||||||||||||||||
|
Net interest income
|
$
|
199,628
|
$
|
196,520
|
$
|
199,815
|
$
|
396,148
|
$
|
400,700
|
||||||||||
|
Provision for credit losses
|
11,605
|
12,167
|
22,230
|
23,772
|
37,732
|
|||||||||||||||
|
Non-interest income
|
32,038
|
33,983
|
36,271
|
66,021
|
68,789
|
|||||||||||||||
|
Non-interest expenses
|
118,682
|
120,923
|
112,917
|
239,605
|
228,185
|
|||||||||||||||
|
Income before income taxes
|
101,379
|
97,413
|
100,939
|
198,792
|
203,572
|
|||||||||||||||
|
Income tax expense
|
25,541
|
23,955
|
30,284
|
49,496
|
62,219
|
|||||||||||||||
|
Net income
|
$
|
75,838
|
$
|
73,458
|
$
|
70,655
|
$
|
149,296
|
$
|
141,353
|
||||||||||
| |
||||||||||||||||||||
|
Selected Financial Data
|
||||||||||||||||||||
|
Net interest margin
|
4.22
|
%
|
4.16
|
%
|
4.23
|
%
|
4.19
|
%
|
4.29
|
%
|
||||||||||
|
Efficiency ratio
|
51.23
|
%
|
52.46
|
%
|
47.83
|
%
|
51.84
|
%
|
48.60
|
%
|
||||||||||
|
Earnings per share - diluted
|
$
|
0.46
|
$
|
0.44
|
$
|
0.39
|
$
|
0.90
|
$
|
0.78
|
||||||||||
|
Book value per share
|
$
|
9.10
|
$
|
8.88
|
$
|
7.78
|
$
|
9.10
|
$
|
7.78
|
||||||||||
|
Tangible book value per share (1)
|
$
|
8.81
|
$
|
8.58
|
$
|
7.47
|
$
|
8.81
|
$
|
7.47
|
||||||||||
|
Return on average equity
|
20.80
|
%
|
19.56
|
%
|
19.66
|
%
|
20.17
|
%
|
20.31
|
%
|
||||||||||
|
Return on average assets
|
1.61
|
%
|
1.56
|
%
|
1.51
|
%
|
1.59
|
%
|
1.53
|
%
|
||||||||||
|
(1) Represents a non-GAAP financial measure. Refer to Non-GAAP
Disclosures - Non-GAAP Financial Measures for the definition of and additional information about this non-GAAP financial measure.
|
|
|
|
Results for Second Quarter of 2024 compared to First Quarter of 2024
|
||||
|
Profitability
|
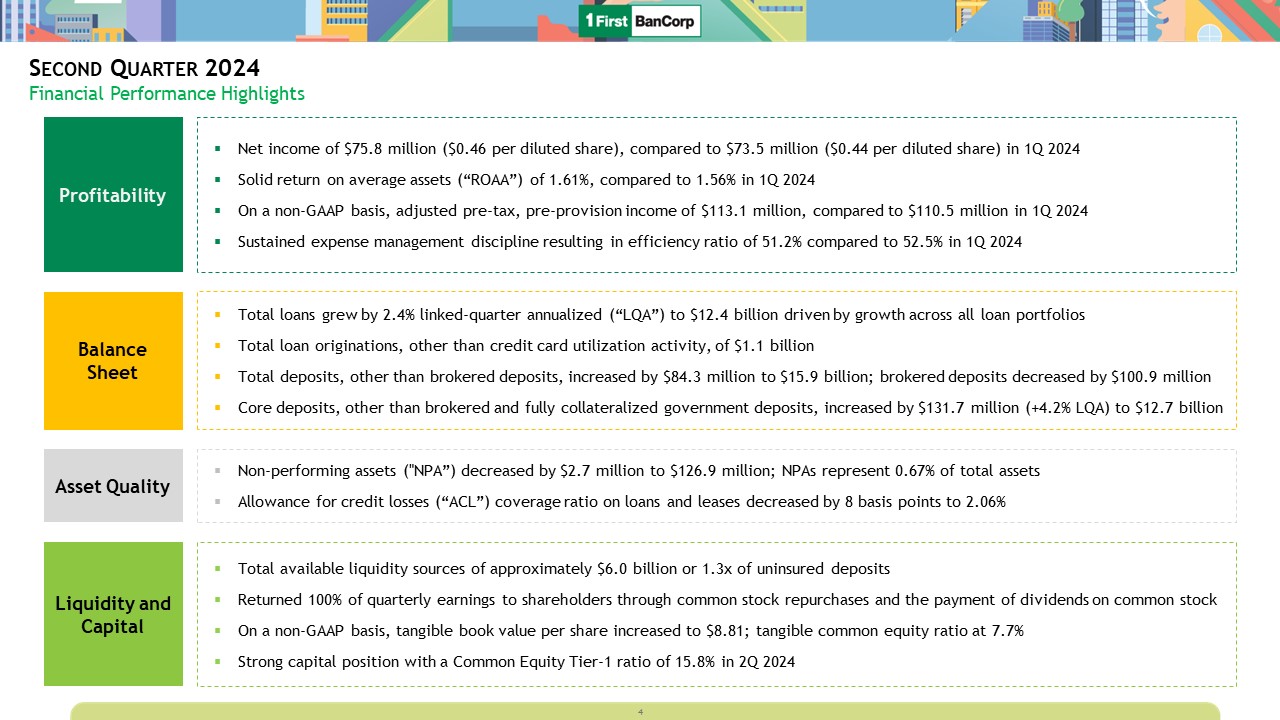
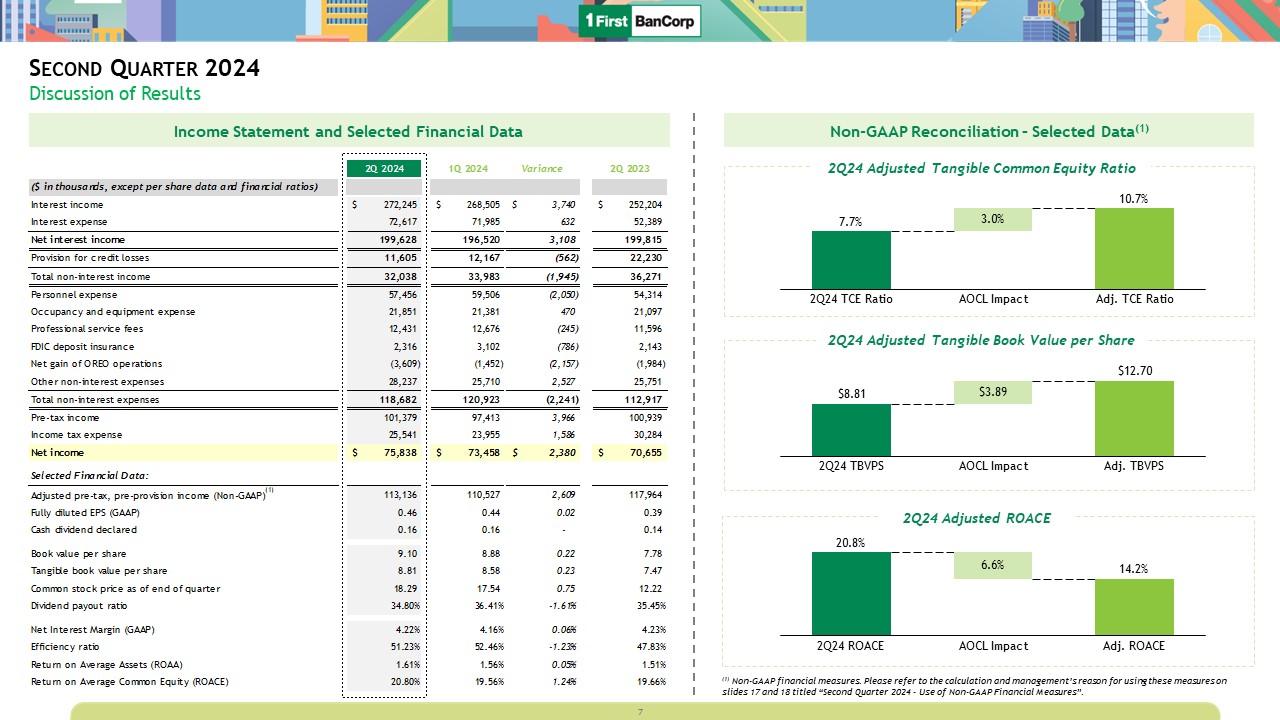
Net income – $75.8
million, or $0.46 per diluted share compared to $73.5 million, or $0.44 per diluted share.
Income before income taxes – $101.3 million compared to $97.4 million.
Adjusted pre-tax, pre-provision income (Non-GAAP)(1) – $113.1 million, compared to $110.5 million.
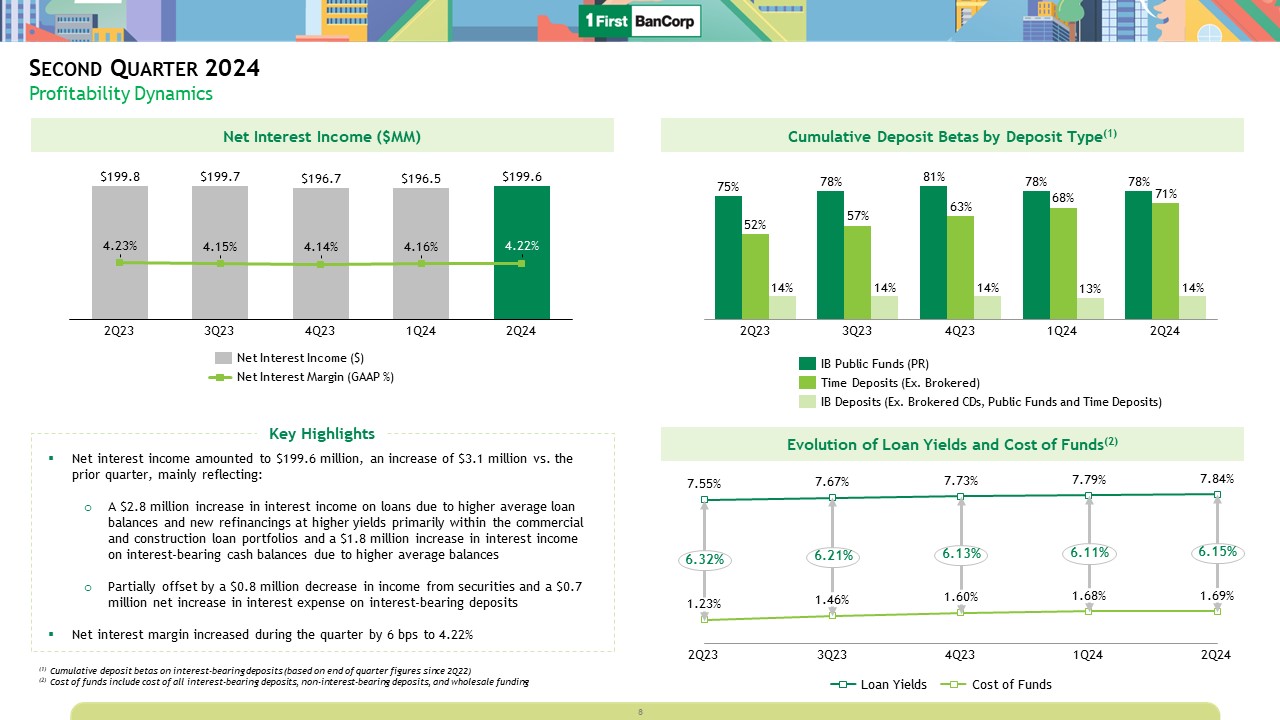
Net interest income –
$199.6 million compared to $196.5 million. The increase was mainly in commercial and construction loans due to higher volume and refinancings at higher market interest rates and higher average balances in interest-bearing cash balances.
Net interest margin increased to 4.22%, compared to 4.16%.
Provision for credit losses – $11.6 million compared to $12.2 million. The decrease reflects a $10.1 million reduction in the provision for the residential mortgage loan portfolio associated with updated historical loss experience, particularly in the Puerto
Rico region, and a $1.4 million reduction in the provision for the commercial and construction loan portfolios as a result of improvements in projections of macroeconomic variables, primarily in the commercial mortgage loan portfolio in
the Puerto Rico region. Such decrease was partially offset by a $10.5 million increase in provision expense for consumer loans, in part driven by a $9.5 million recovery in the first quarter of 2024 associated with a bulk sale of fully
charged-off consumer loans.
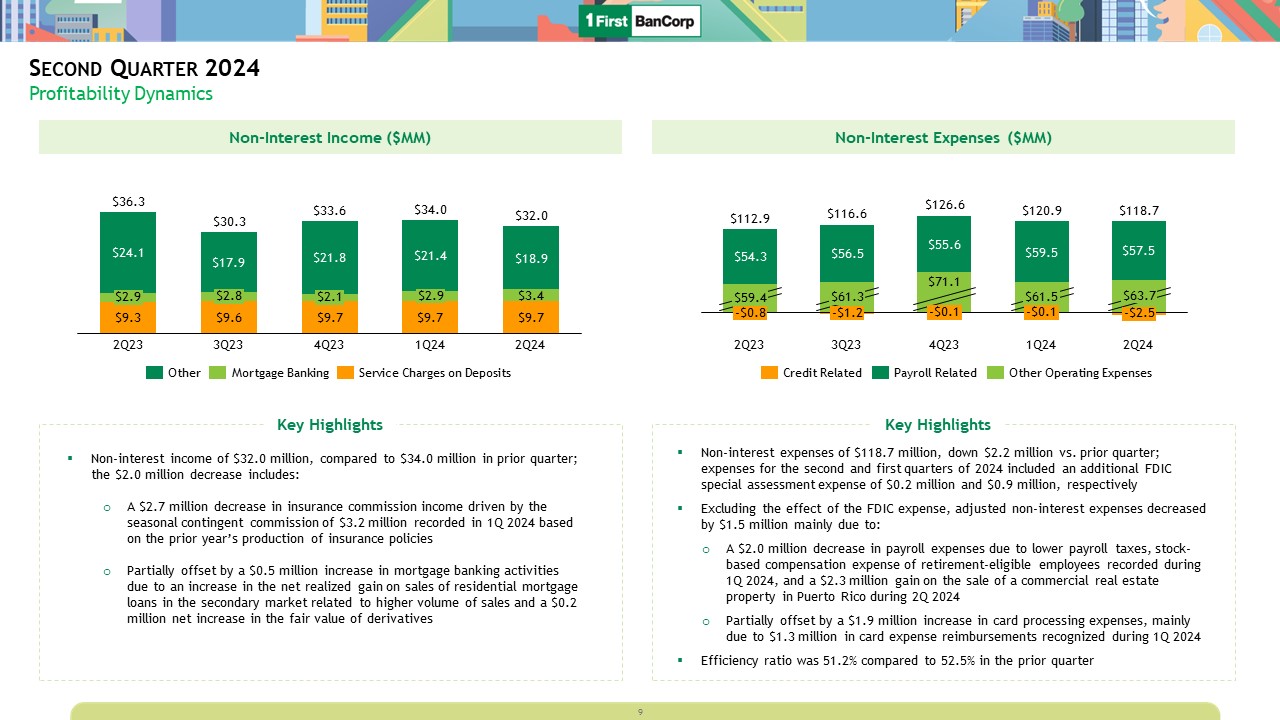
Non-interest income –
$32.0 million compared to $34.0 million, mainly driven by $3.2 million in seasonal contingent commissions recorded in the first quarter of 2024.
Non-interest expenses –
$118.7 million compared to $120.9 million, mainly driven by a $2.3 million realized gain on the sale of a commercial real estate OREO property in the Puerto Rico region in the second quarter of 2024. The efficiency ratio was 51.23%,
compared to 52.46%.
|
|||
|
Balance
Sheet
|
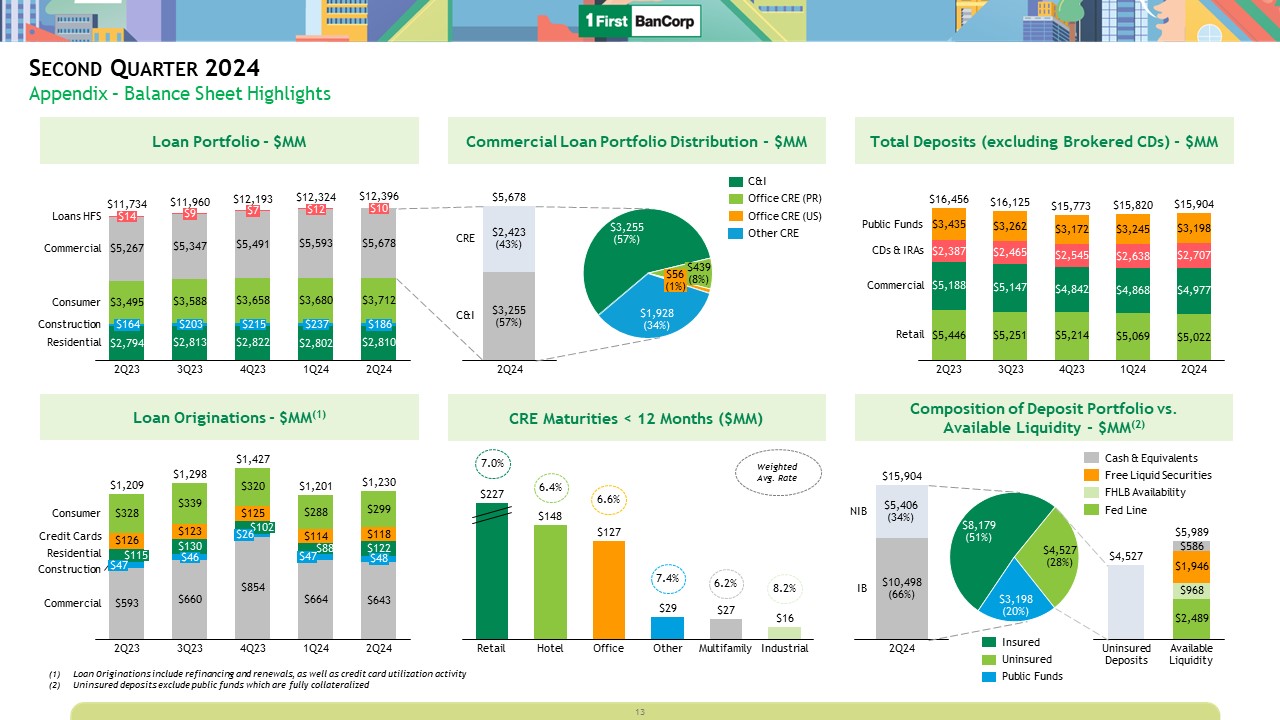
Total loans – grew by $72.4 million to
$12.4 billion, primarily attributed to growth in the commercial and construction and consumer loan portfolios in the Puerto Rico region. Total loan originations, other than credit card utilization activity, of $1.1 billion, up $25.3
million.
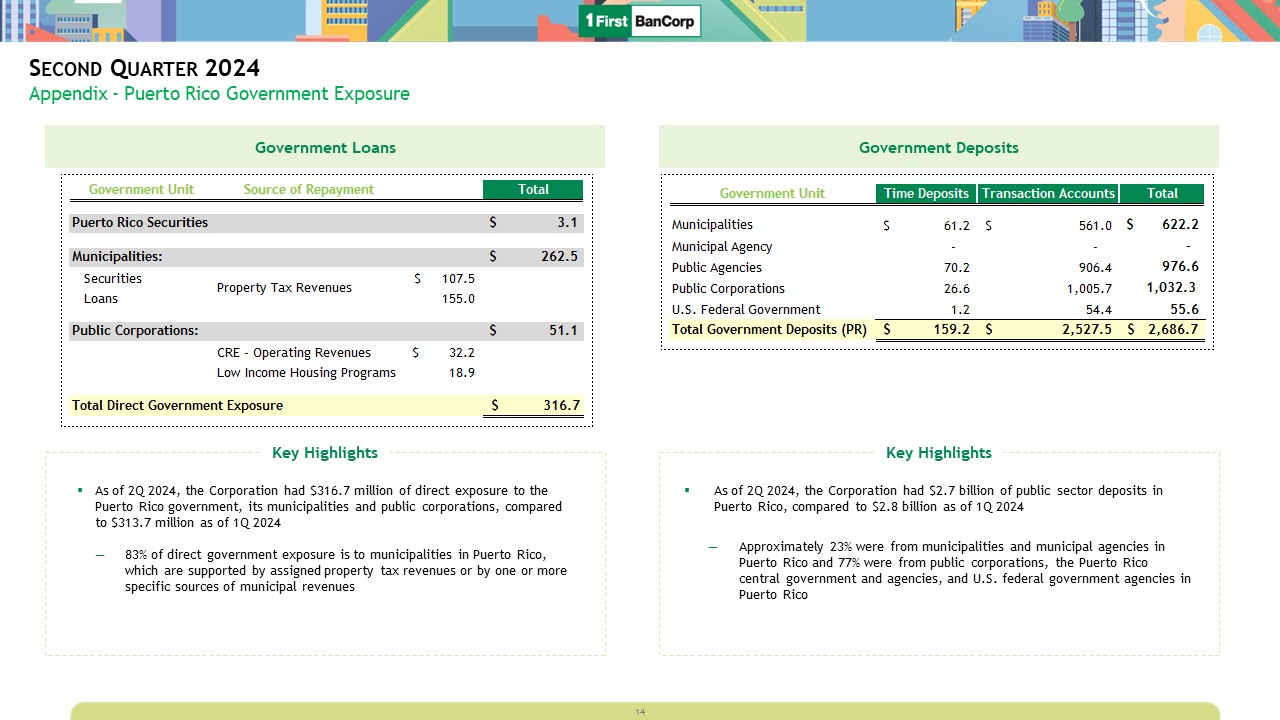
Core deposits (other than brokered and government deposits) –increased by $131.7 million to $12.7 billion, reflecting growth of $70.4 million in the Puerto Rico region, $41.4 million in the Florida region, and $19.9 million in the Virgin Islands region. This increase
includes a $68.5 million increase in time deposits and a $46.8 million increase in non-interest-bearing deposits.
Government deposits (fully collateralized) – decreased by $47.4 million to $3.2 billion. Variance mainly reflects a decline of $76.6 million in the Puerto Rico region, partially offset by an increase of $28.3 million in the Virgin Islands region.
|
|||
|
Asset
Quality
|
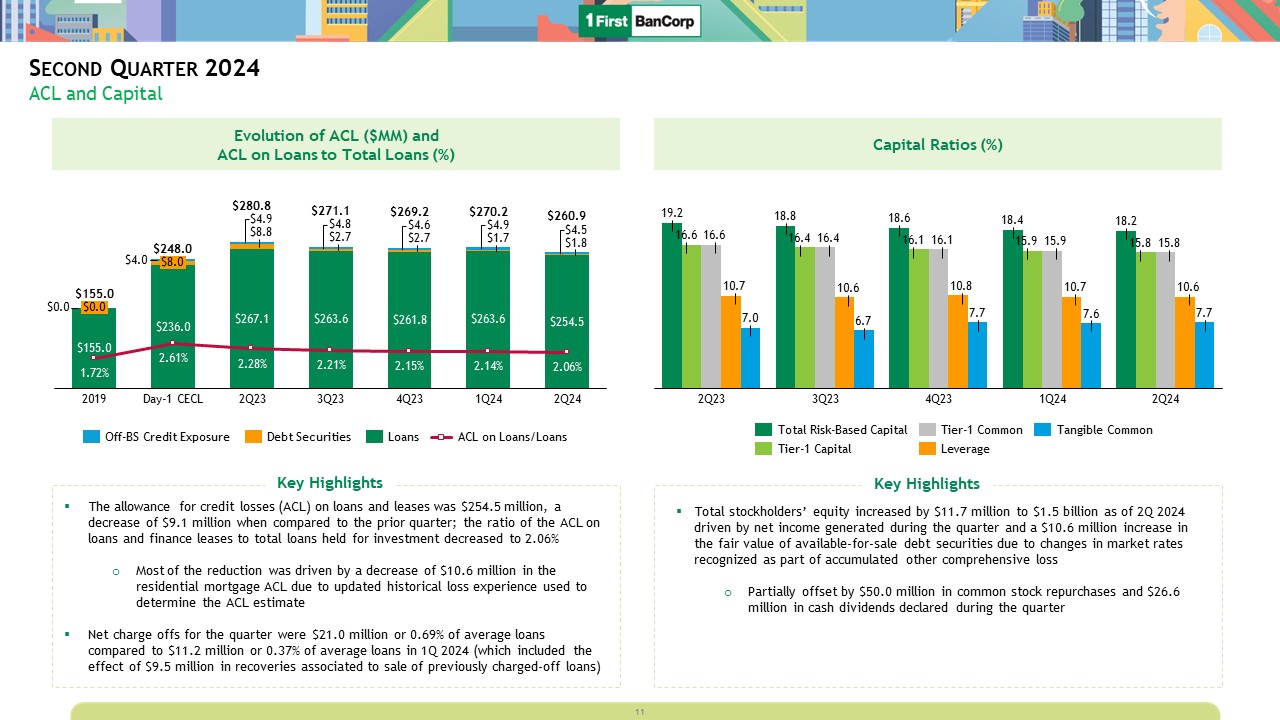
Allowance for credit losses (“ACL”) coverage ratio – amounted to 2.06%, compared to 2.14%. Annualized net charge-offs to average loans ratio increased to 0.69%, compared to 0.37%. First
quarter of 2024 reflects a 31 basis points decrease due to the $9.5 million recovery associated with a bulk sale of fully charged-off consumer loans.
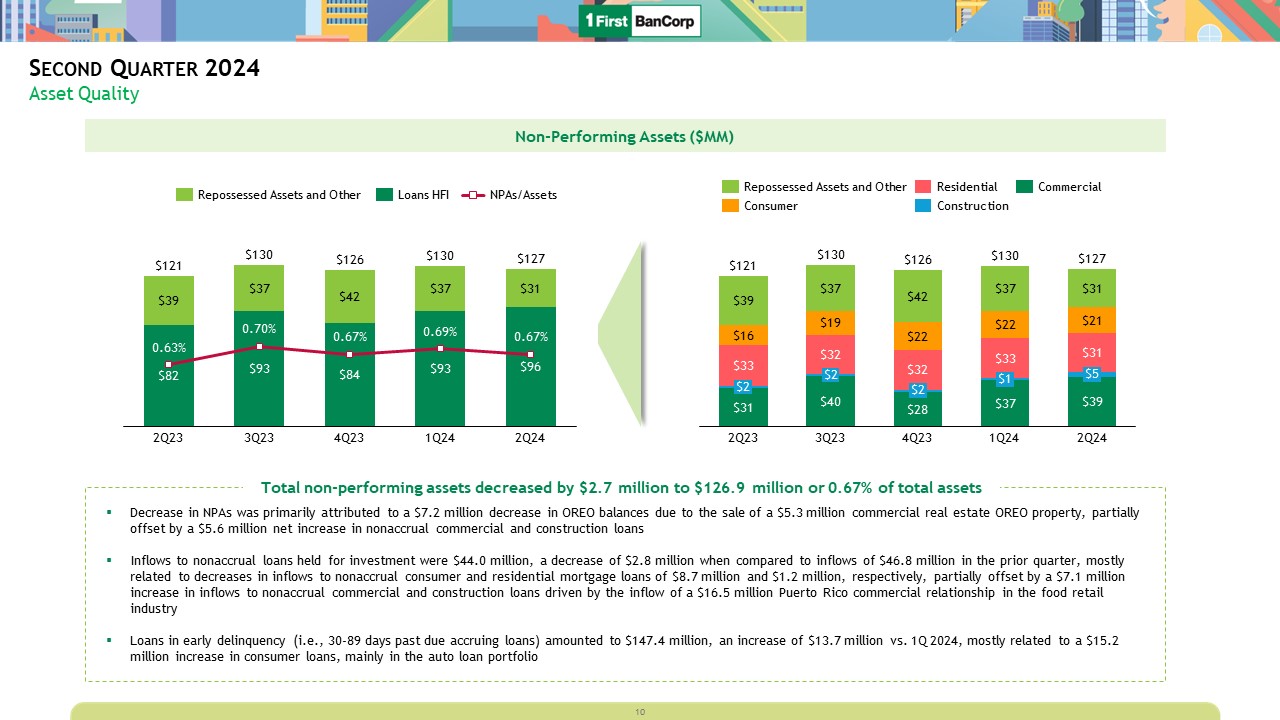
Non-performing assets – decreased by
$2.7 million to $126.9 million, mainly driven by the effect during the second quarter of 2024 of both the restoration to accrual status of a $10.0 million commercial and industrial (“C&I”) loan in the Florida region in the power
generation industry and a $7.2 million decrease in the OREO portfolio balance, partially offset by the inflow of a $16.5 million commercial relationship in the Puerto Rico region in the food retail industry.
|
|||
|
Liquidity
and
Capital
|
Liquidity – Cash and cash equivalents
amounted to $586.3 million, compared to $684.5 million. When adding $1.9 billion of free high-quality liquid securities that could be liquidated or pledged within one day, total core liquidity amounted to $2.5 billion, or 13.37% of total
assets, compared to 14.45%. Including the $968.1 million in available lending capacity at the Federal Home Loan Bank (“FHLB”), available liquidity amounted to 18.50% of total assets, compared to 19.60%.
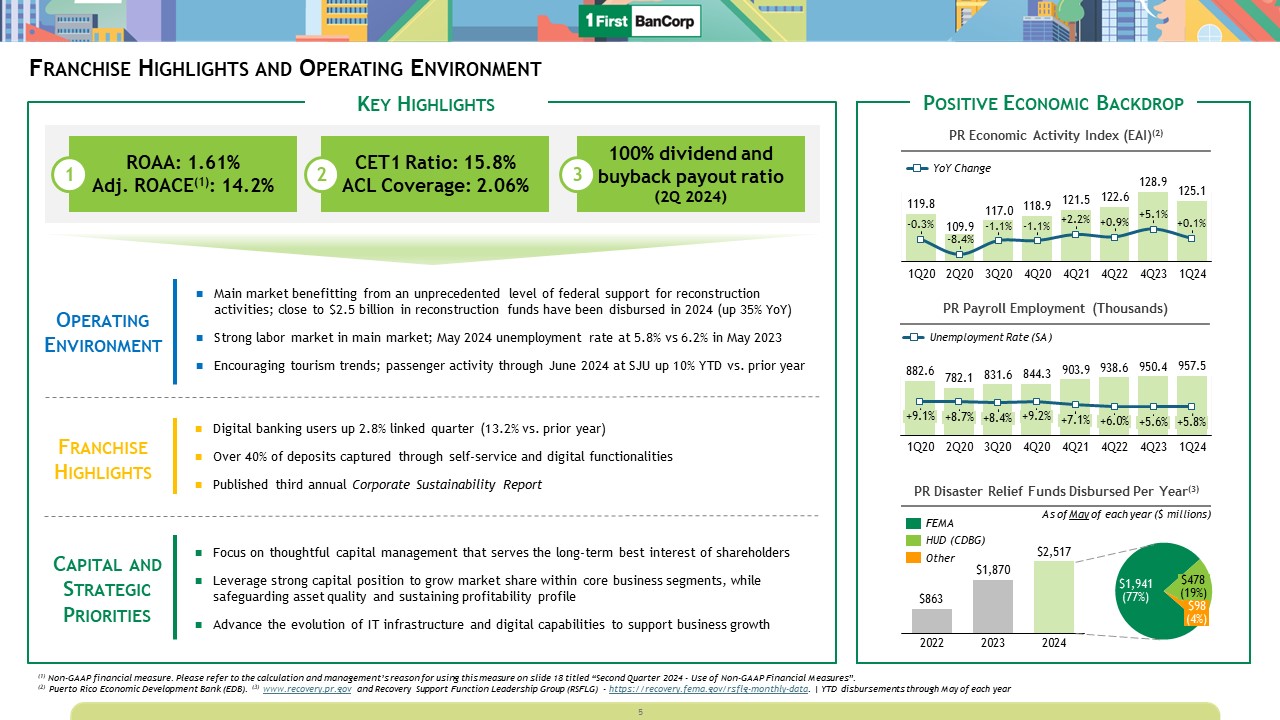
Capital – Repurchased $50.0 million of
common stock and paid $26.3 million in common stock dividends. Capital ratios exceeded required regulatory levels. The Corporation’s estimated total capital, common equity tier 1 (“CET1”) capital, tier 1 capital, and leverage ratios were
18.21%, 15.77%, 15.77%, and 10.63%, respectively, as of June 30, 2024. On a non-GAAP basis, the tangible common equity ratio(1) amounted to 7.66% compared to 7.59%.
|
|||
|
Quarter Ended
|
||||||||||||||||||||
|
(Dollars in thousands)
|
June 30, 2024
|
March 31, 2024
|
December 31, 2023
|
September 30, 2023
|
June 30, 2023
|
|||||||||||||||
|
Net Interest Income
|
||||||||||||||||||||
|
Interest income
|
$
|
272,245
|
$
|
268,505
|
$
|
265,481
|
$
|
263,405
|
$
|
252,204
|
||||||||||
|
Interest expense
|
72,617
|
71,985
|
68,799
|
63,677
|
52,389
|
|||||||||||||||
|
Net interest income
|
$
|
199,628
|
$
|
196,520
|
$
|
196,682
|
$
|
199,728
|
$
|
199,815
|
||||||||||
|
Average Balances
|
||||||||||||||||||||
|
Loans and leases
|
$
|
12,272,816
|
$
|
12,207,840
|
$
|
12,004,881
|
$
|
11,783,456
|
$
|
11,591,516
|
||||||||||
|
Total securities, other short-term investments and interest-bearing cash balances
|
6,698,609
|
6,720,395
|
6,835,407
|
7,325,226
|
7,333,989
|
|||||||||||||||
|
Average interest-earning assets
|
$
|
18,971,425
|
$
|
18,928,235
|
$
|
18,840,288
|
$
|
19,108,682
|
$
|
18,925,505
|
||||||||||
|
Average interest-bearing liabilities
|
$
|
11,868,658
|
$
|
11,838,159
|
$
|
11,665,459
|
$
|
11,671,938
|
$
|
11,176,385
|
||||||||||
|
Average Yield/Rate
|
||||||||||||||||||||
|
Average yield on interest-earning assets - GAAP
|
5.76
|
%
|
5.69
|
%
|
5.59
|
%
|
5.47
|
%
|
5.35
|
%
|
||||||||||
|
Average rate on interest-bearing liabilities - GAAP
|
2.45
|
%
|
2.44
|
%
|
2.34
|
%
|
2.16
|
%
|
1.88
|
%
|
||||||||||
|
Net interest spread - GAAP
|
3.31
|
%
|
3.25
|
%
|
3.25
|
%
|
3.31
|
%
|
3.47
|
%
|
||||||||||
|
Net interest margin - GAAP
|
4.22
|
%
|
4.16
|
%
|
4.14
|
%
|
4.15
|
%
|
4.23
|
%
|
||||||||||
|
|
• |
A $2.8 million increase in interest income on loans, driven by:
|
|
|
- |
A $2.2 million increase in interest income on commercial and construction loans, due to a $1.4 million increase in interest income, which includes refinancings at higher market interest rates and
$0.5 million in interest income recognized as a result of the repayment of two previously charged-off loans in the Florida region; and a $0.8 million increase in interest income mainly associated with a $50.2 million increase in the average
balance of this portfolio.
|
|
|
- |
A $0.4 million increase in interest income on consumer loans and finance leases, mainly in the auto loans and finance leases portfolios.
|
|
|
• |
A $1.8 million increase in interest income from interest-bearing cash balances, driven by a $133.8 million increase in the average balance of interest-bearing cash balances, primarily consisting of
cash balances deposited at the Federal Reserve Bank (the “FED”).
|
|
|
• |
A $0.8 million net decrease in interest income from investment securities, driven by a $0.5 million decrease in interest income on debt securities associated with a $156.1 million decrease in the
average balance and a $0.5 million decrease related to a higher level of premium amortization expense due to changes in anticipated prepayments of U.S. agency mortgage-backed securities (“MBS”), partially offset by a $0.2 million increase
in interest income on other equity securities.
|
|
|
• |
A $0.7 million net increase in interest expense on interest-bearing deposits, consisting of:
|
|
|
- |
A $2.2 million increase in interest expense on time deposits, excluding brokered CDs, mainly due to approximately $1.2 million associated with higher rates paid in the second quarter of 2024 on new
issuances and renewals, and $1.0 million of additional interest expense associated with a $109.8 million increase in the average balance. The average cost of non-brokered time deposits in the second quarter of 2024 increased 16 basis points
to 3.55% when compared to the previous quarter.
|
|
|
- |
A $1.1 million decrease in interest expense on brokered CDs, primarily related to a $73.3 million decrease in the average balance of this portfolio.
|
|
|
- |
A $0.4 million decrease in interest expense on interest-bearing checking and saving accounts, mainly associated with a decrease in average rates in the second quarter of 2024 due to a change in mix
within public sector deposits. The average cost of interest-bearing checking and saving accounts, excluding public sector deposits, remained flat at 0.75% in the second quarter of 2024, when compared to the previous quarter.
|
|
Quarter Ended
|
||||||||||||||||||||
|
June 30, 2024
|
March 31, 2024
|
December 31, 2023
|
September 30, 2023
|
June 30, 2023
|
||||||||||||||||
|
(In thousands)
|
||||||||||||||||||||
|
Service charges and fees on deposit accounts
|
$
|
9,725
|
$
|
9,662
|
$
|
9,662
|
$
|
9,552
|
$
|
9,287
|
||||||||||
|
Mortgage banking activities
|
3,419
|
2,882
|
2,094
|
2,821
|
2,860
|
|||||||||||||||
|
Gain on early extinguishment of debt
|
-
|
-
|
-
|
-
|
1,605
|
|||||||||||||||
|
Insurance commission income
|
2,786
|
5,507
|
2,379
|
2,790
|
2,747
|
|||||||||||||||
|
Card and processing income
|
11,523
|
11,312
|
11,015
|
10,841
|
11,135
|
|||||||||||||||
|
Other non-interest income
|
4,585
|
4,620
|
8,459
|
4,292
|
8,637
|
|||||||||||||||
|
Non-interest income
|
$
|
32,038
|
$
|
33,983
|
$
|
33,609
|
$
|
30,296
|
$
|
36,271
|
||||||||||
|
|
• |
A $2.7 million decrease in insurance commission income mainly driven by $3.2 million in seasonal contingent commissions recorded in the first quarter of 2024 based on the prior year’s production of
insurance policies.
|
|
|
• |
A $0.5 million increase in revenues from mortgage banking activities, mainly driven by an increase in the net realized gain on sales of residential mortgage loans in the secondary market due to a
higher volume of sales and a $0.2 million net increase in the fair value of to-be-announced forward contracts and interest rate lock commitments. During the second and first quarters of 2024, net realized gains of $1.5 million and $1.1
million, respectively, were recognized as a result of Government National Mortgage Association (“GNMA”) securitization transactions and whole loan sales to U.S. government-sponsored enterprises amounting to $43.5 million and $31.5 million,
respectively.
|
|
Quarter Ended
|
||||||||||||||||||||
|
June 30, 2024
|
March 31, 2024
|
December 31, 2023
|
September 30, 2023
|
June 30, 2023
|
||||||||||||||||
|
(In thousands)
|
||||||||||||||||||||
|
Employees' compensation and benefits
|
$
|
57,456
|
$
|
59,506
|
$
|
55,584
|
$
|
56,535
|
$
|
54,314
|
||||||||||
|
Occupancy and equipment
|
21,851
|
21,381
|
21,847
|
21,781
|
21,097
|
|||||||||||||||
|
Business promotion
|
4,359
|
3,842
|
6,725
|
4,759
|
4,167
|
|||||||||||||||
|
Professional service fees:
|
||||||||||||||||||||
|
Collections, appraisals and other credit-related fees
|
1,149
|
1,366
|
952
|
930
|
1,231
|
|||||||||||||||
|
Outsourcing technology services
|
7,698
|
7,469
|
7,003
|
7,261
|
7,278
|
|||||||||||||||
|
Other professional fees
|
3,584
|
3,841
|
3,295
|
2,831
|
3,087
|
|||||||||||||||
|
Taxes, other than income taxes
|
5,408
|
5,129
|
5,535
|
5,465
|
5,124
|
|||||||||||||||
|
FDIC deposit insurance
|
2,316
|
3,102
|
8,454
|
2,143
|
2,143
|
|||||||||||||||
|
Other insurance and supervisory fees
|
2,287
|
2,293
|
2,308
|
2,356
|
2,352
|
|||||||||||||||
|
Net gain on OREO operations
|
(3,609
|
)
|
(1,452
|
)
|
(1,005
|
)
|
(2,153
|
)
|
(1,984
|
)
|
||||||||||
|
Credit and debit card processing expenses
|
7,607
|
5,751
|
7,360
|
6,779
|
6,540
|
|||||||||||||||
|
Communications
|
2,261
|
2,097
|
2,134
|
2,219
|
1,992
|
|||||||||||||||
|
Other non-interest expenses
|
6,315
|
6,598
|
6,413
|
5,732
|
5,576
|
|||||||||||||||
|
Total non-interest expenses
|
$
|
118,682
|
$
|
120,923
|
$
|
126,605
|
$
|
116,638
|
$
|
112,917
|
||||||||||
|
|
• |
A $2.1 million decrease in employees’ compensation and benefits expense, mainly driven by stock-based compensation expense of retirement-eligible employees recognized during the first quarter of 2024 and a decrease in payroll taxes due to employees reaching maximum taxable amounts.
|
|
|
• |
A $2.2 million increase in net gain on other real estate owned (“OREO”) operations, mainly driven by the aforementioned $2.3 million realized gain on sale of a commercial real estate OREO property
in Puerto Rico.
|
|
|
• |
A $1.9 million increase in credit and debit card processing expenses, mainly due to $1.3 million in
certain credit card expense reimbursements recognized during the first quarter of 2024.
|
|
|
• |
A $0.5 million increase in occupancy and equipment expenses.
|
|
|
• |
A $0.5 million increase in business promotion expenses as part of ongoing marketing efforts.
|
|
(Dollars in thousands)
|
June 30, 2024
|
March 31, 2024
|
December 31, 2023
|
September 30, 2023
|
June 30, 2023
|
|||||||||||||||
|
Nonaccrual loans held for investment:
|
||||||||||||||||||||
|
Residential mortgage
|
$
|
31,396
|
$
|
32,685
|
$
|
32,239
|
$
|
31,946
|
$
|
33,252
|
||||||||||
|
Construction
|
4,742
|
1,498
|
1,569
|
1,640
|
1,677
|
|||||||||||||||
|
Commercial mortgage
|
11,736
|
11,976
|
12,205
|
21,632
|
21,536
|
|||||||||||||||
|
C&I
|
27,661
|
25,067
|
15,250
|
18,809
|
9,194
|
|||||||||||||||
|
Consumer and finance leases
|
20,638
|
21,739
|
22,444
|
19,137
|
16,362
|
|||||||||||||||
|
Total nonaccrual loans held for investment
|
$
|
96,173
|
$
|
92,965
|
$
|
83,707
|
$
|
93,164
|
$
|
82,021
|
||||||||||
|
OREO
|
21,682
|
28,864
|
32,669
|
28,563
|
31,571
|
|||||||||||||||
|
Other repossessed property
|
7,513
|
6,226
|
8,115
|
7,063
|
5,404
|
|||||||||||||||
|
Other assets (1)
|
1,532
|
1,551
|
1,415
|
1,448
|
2,111
|
|||||||||||||||
|
Total non-performing assets (2)
|
$
|
126,900
|
$
|
129,606
|
$
|
125,906
|
$
|
130,238
|
$
|
121,107
|
||||||||||
|
Past due loans 90 days and still accruing (3)
|
$
|
47,173
|
$
|
57,515
|
$
|
59,452
|
$
|
62,892
|
$
|
63,211
|
||||||||||
|
Nonaccrual loans held for investment to total loans held for investment
|
0.78
|
%
|
0.76
|
%
|
0.69
|
%
|
0.78
|
%
|
0.70
|
%
|
||||||||||
|
Nonaccrual loans to total loans
|
0.78
|
%
|
0.75
|
%
|
0.69
|
%
|
0.78
|
%
|
0.70
|
%
|
||||||||||
|
Non-performing assets to total assets
|
0.67
|
%
|
0.69
|
%
|
0.67
|
%
|
0.70
|
%
|
0.63
|
%
|
||||||||||
| (1) |
Residential pass-through MBS issued by the Puerto Rico Housing Finance Authority (“PRHFA”) held as part of the available-for-sale debt
securities portfolio.
|
| (2) |
Excludes purchased-credit deteriorated (“PCD”) loans previously accounted for under Accounting Standards Codification (“ASC”) Subtopic
310-30 for which the Corporation made the accounting policy election of maintaining pools of loans as “units of account” both at the time of adoption of current expected credit losses (“CECL”) on January 1, 2020 and on an ongoing basis for
credit loss measurement. These loans will continue to be excluded from nonaccrual loan statistics as long as the Corporation can reasonably estimate the timing and amount of cash flows expected to be collected on the loan pools. The portion
of such loans contractually past due 90 days or more amounted to $7.4 million as of June 30, 2024 (March 31, 2024- $8.6 million; December 31, 2023 - $8.3 million; September 30, 2023 - $8.9 million; June 30, 2023 - $9.5 million).
|
| (3) |
These include rebooked loans, which were previously pooled into GNMA securities, amounting to $6.8 million as of June 30, 2024 (March 31,
2024- $8.8 million; December 31, 2023 - $7.9 million; September 30, 2023 - $8.5 million; June 30, 2023 - $6.5 million). Under the GNMA program, the Corporation has the option but not the obligation to repurchase loans that meet GNMA’s
specified delinquency criteria. For accounting purposes, the loans subject to the repurchase option are required to be reflected on the financial statements with an offsetting liability.
|
|
|
• |
Total non-performing assets decreased by $2.7 million to $126.9 million as of June 30, 2024, compared
to $129.6 million as of March 31, 2024. Total nonaccrual loans held for investment increased by $3.2 million to $96.2
million as of June 30, 2024, compared to $93.0 million as of March 31, 2024.
|
|
|
- |
A $7.2 million decrease in the OREO portfolio balance, mainly attributable to the aforementioned sale of a $5.3 million commercial real estate OREO property in Puerto Rico.
|
|
|
- |
A $1.3 million decrease in nonaccrual residential mortgage loans.
|
|
|
- |
A $1.1 million decrease in nonaccrual consumer loans, consisting mainly of auto loans and finance leases.
|
|
|
- |
A $5.6 million increase in nonaccrual commercial and construction loans, mainly related to the aforementioned inflow of a $16.5 million commercial relationship in the Puerto Rico region in the food
retail industry, partially offset by the restoration to accrual status of a $10.0 million C&I loan in the Florida region in the power generation industry during the second quarter of 2024.
|
|
|
- |
A $1.3 million increase in other repossessed property, consisting of repossessed automobiles.
|
|
|
• |
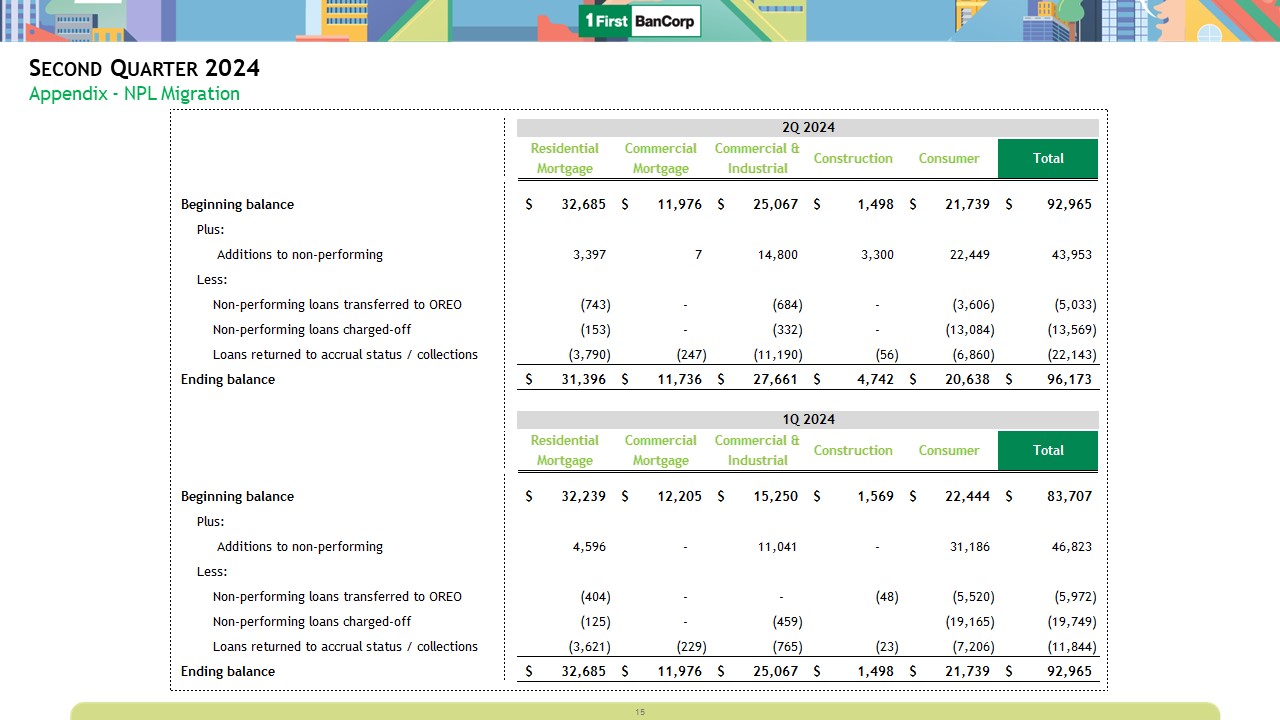
Inflows to nonaccrual loans held for investment were $44.0 million in the second quarter of 2024, a decrease of $2.8 million, compared to inflows of $46.8 million in the first quarter of 2024.
Inflows to nonaccrual consumer loans were $22.5 million in the second quarter of 2024, a decrease of $8.7 million compared to inflows of $31.2 million in the first quarter of 2024. Inflows to nonaccrual residential mortgage loans were $3.4
million in the second quarter of 2024, a decrease of $1.2 million compared to inflows of $4.6 million in the first quarter of 2024. Inflows to nonaccrual commercial and construction loans were $18.1 million in the second quarter of 2024, an
increase of $7.1 million compared to inflows of $11.0 million in the first quarter of 2024. The net increase in inflows of commercial and construction loans was mostly related to the aforementioned $16.5 million commercial relationship in
the Puerto Rico region. See Early Delinquency below for additional information.
|
|
|
• |
Adversely classified commercial and construction loans increased by $10.3 million to $86.8 million as of June 30, 2024,
also driven by the aforementioned inflow of a $16.5 million commercial relationship in the Puerto Rico region and the downgrade of a $5.1 million commercial mortgage loan in the Puerto Rico region, partially offset by an upgrade related to
the aforementioned restoration to accrual status of a $10.0 million C&I loan in the Florida region.
|
|
Quarter Ended June 30, 2024
|
||||||||||||||||||||||||||||||||
|
Loans and Finance Leases
|
Debt Securities
|
|||||||||||||||||||||||||||||||
|
Residential Mortgage Loans
|
Commercial and Construction Loans
|
Consumer Loans and Finance Leases
|
Total Loans and Finance Leases
|
Unfunded Loans Commitments
|
Held-to-Maturity
|
Available-for-Sale
|
Total ACL
|
|||||||||||||||||||||||||
|
Allowance for Credit Losses
|
||||||||||||||||||||||||||||||||
|
(Dollars in thousands)
|
||||||||||||||||||||||||||||||||
|
Allowance for credit losses, beginning balance
|
$
|
56,689
|
$
|
73,337
|
$
|
133,566
|
$
|
263,592
|
$
|
4,919
|
$
|
1,235
|
$
|
442
|
$
|
270,188
|
||||||||||||||||
|
Provision for credit losses - (benefit) expense
|
(10,593
|
)
|
(4,198
|
)
|
26,721
|
11,930
|
(417
|
)
|
32
|
60
|
11,605
|
|||||||||||||||||||||
|
Net (charge-offs) recoveries
|
(45
|
)
|
1,033
|
(21,978
|
)
|
(20,990
|
)
|
-
|
-
|
47
|
(20,943
|
)
|
||||||||||||||||||||
|
Allowance for credit losses, end of period
|
$
|
46,051
|
$
|
70,172
|
$
|
138,309
|
$
|
254,532
|
$
|
4,502
|
$
|
1,267
|
$
|
549
|
$
|
260,850
|
||||||||||||||||
|
Amortized cost of loans and finance leases
|
$
|
2,809,666
|
$
|
5,863,843
|
$
|
3,711,999
|
$
|
12,385,508
|
||||||||||||||||||||||||
|
Allowance for credit losses on loans to amortized cost
|
1.64
|
%
|
1.20
|
%
|
3.73
|
%
|
2.06
|
%
|
||||||||||||||||||||||||
|
Quarter Ended March 31, 2024
|
||||||||||||||||||||||||||||||||
|
Loans and Finance Leases
|
Debt Securities
|
|||||||||||||||||||||||||||||||
|
Residential Mortgage Loans
|
Commercial and Construction Loans
|
Consumer Loans and Finance Leases
|
Total Loans and Finance Leases
|
Unfunded Loans Commitments
|
Held-to-Maturity
|
Available-for-Sale
|
Total ACL
|
|||||||||||||||||||||||||
|
Allowance for Credit Losses
|
||||||||||||||||||||||||||||||||
|
(Dollars in thousands)
|
||||||||||||||||||||||||||||||||
|
Allowance for credit losses, beginning balance
|
$
|
57,397
|
$
|
71,426
|
$
|
133,020
|
$
|
261,843
|
$
|
4,638
|
$
|
2,197
|
$
|
511
|
$
|
269,189
|
||||||||||||||||
|
Provision for credit losses - (benefit) expense
|
(464
|
)
|
(2,799
|
)
|
16,180
|
12,917
|
281
|
(962
|
)
|
(69
|
)
|
12,167
|
||||||||||||||||||||
|
Net (charge-offs) recoveries
|
(244
|
)
|
4,710
|
(15,634
|
)
|
(11,168
|
)
|
-
|
-
|
-
|
(11,168
|
)
|
||||||||||||||||||||
|
Allowance for credit losses, end of period
|
$
|
56,689
|
$
|
73,337
|
$
|
133,566
|
$
|
263,592
|
$
|
4,919
|
$
|
1,235
|
$
|
442
|
$
|
270,188
|
||||||||||||||||
|
Amortized cost of loans and finance leases
|
$
|
2,801,587
|
$
|
5,830,014
|
$
|
3,679,847
|
$
|
12,311,448
|
||||||||||||||||||||||||
|
Allowance for credit losses on loans to amortized cost
|
2.02
|
%
|
1.26
|
%
|
3.63
|
%
|
2.14
|
%
|
||||||||||||||||||||||||
|
|
• |
Provision for credit losses for the residential mortgage loan portfolio was a net benefit of $10.6 million for the second quarter of 2024, compared to a net benefit of $0.5 million for the first
quarter of 2024. The increase in net benefit during the second quarter of 2024 was mainly the result of the aforementioned updated historical loss experience.
|
|
|
• |
Provision for credit losses for the commercial and construction loan portfolios was a net benefit of $4.2 million for the second quarter of 2024, compared to a net benefit of $2.8 million for the
first quarter of 2024. The increase in net benefit during the second quarter of 2024 was mainly driven by an improvement on the economic outlook of certain macroeconomic variables, particularly in variables associated with commercial real
estate property performance, and $1.2 million in recoveries of two commercial loans in the Florida region during the second quarter of 2024, compared to a $5.0 million recovery of a C&I loan in the Puerto Rico region during the first
quarter of 2024.
|
|
|
• |
Provision for credit losses for the consumer loan and finance lease portfolios was an expense of $26.7 million for the second quarter of 2024, compared to an expense of $16.2 million for the first
quarter of 2024. The increase in provision expense was mainly driven by the $9.5 million recovery associated with the aforementioned bulk sale of fully charged-off consumer loans during the first quarter of 2024, the upward historical loss
experience resulting in higher required reserve levels in the auto loans and finance leases portfolios, increases in portfolio volumes, and increases in historical charge-off levels.
|
|
Quarter Ended
|
|||||||||||||||||||||
|
June 30, 2024
|
March 31, 2024
|
December 31, 2023
|
September 30, 2023
|
June 30, 2023
|
|||||||||||||||||
|
Residential mortgage
|
0.01
|
%
|
0.03
|
%
|
-0.04
|
%
|
-0.01
|
%
|
0.06
|
%
|
|||||||||||
|
Construction
|
-0.02
|
%
|
-0.02
|
%
|
0.01
|
%
|
-3.18
|
%
|
-0.99
|
%
|
|||||||||||
|
Commercial mortgage
|
-0.07
|
%
|
-0.01
|
%
|
0.09
|
%
|
-0.01
|
%
|
0.01
|
%
|
|||||||||||
|
Commercial and Industrial
|
-0.08
|
%
|
-0.59
|
%
|
0.00
|
%
|
-0.02
|
%
|
0.87
|
%
|
|||||||||||
|
Consumer loans and finance leases
|
2.38
|
%
|
1.70
|
%
|
(1) |
2.26
|
%
|
1.79
|
%
|
1.51
|
%
|
||||||||||
|
Total loans
|
0.69
|
%
|
0.37
|
%
|
(1) |
0.69
|
%
|
0.48
|
%
|
0.67
|
%
|
||||||||||
| (1) |
The $9.5 million recovery associated with the bulk sale of fully charged-off consumer loans during the first quarter of 2024 reduced the consumer loans and finance
leases and total net charge-offs to related average loans ratio for the quarter ended March 31, 2024 by 104 basis points and 31 basis points, respectively.
|
|
|
• |
A $98.2 million decrease in cash and cash equivalents, related to loan growth, the repurchases of common stock, the payment of common stock dividends, and repayment of matured brokered CDs, partially offset by cash inflows from the investment securities
portfolio.
|
|
|
• |
A $95.1 million decrease in investment securities, mainly driven by principal repayments of $132.9 million, which include scheduled repayments of $97.9 million and maturities of $35.0 million,
partially offset by $28.0 million in purchases of Community Reinvestment Act qualified debt securities during the second quarter of 2024 and a $10.6 million increase in the fair value of available-for-sale debt securities attributable to
changes in market interest rates.
|
|
|
• |
A $72.4 million increase in total loans. The variance consisted of increases of $47.6 million in the Puerto Rico region, $17.7 million in the Florida region, and $7.1 million in the Virgin Islands
region. On a portfolio basis, the variance consisted of increases of $33.8 million in commercial and construction loans, $32.2 million in consumer loans, primarily auto loans and finance leases in the Puerto Rico region, and $6.4 million in
residential mortgage loans. The growth in commercial and construction loans was mainly in the Puerto Rico region, driven by a $43.1 million increase in the floor plan lines of credit portfolio and a $9.6 million disbursement of a
construction loan, partially offset by $27.4 million in payoffs associated with two C&I loans.
|
|
|
• |
Total deposits decreased $16.6 million consisting of:
|
|
|
o |
A $100.9 million decrease in brokered CDs. The decline reflects maturing short-term brokered CDs amounting to $174.6 million with an all-in cost of 5.51% that were paid off during the second
quarter of 2024, partially offset by $73.7 million of new issuances with original average maturities of approximately 1 year and an all-in cost of 5.18%.
|
|
|
o |
A $47.4 million decrease in government deposits, which includes a decline of $76.6 million in the Puerto Rico region, partially
offset by increases of $28.3 million in the Virgin Islands region and $0.9 million in the Florida region.
|
|
|
o |
A $131.7 million increase in deposits, excluding brokered CDs and government deposits, reflecting growth of $70.4 million in the Puerto Rico region, $41.4 million in the Florida region, and $19.9
million in the Virgin Islands region. The increase in such deposits includes a $68.5 million increase in time deposits and a $46.8 million increase in non-interest-bearing deposits.
|
|
June 30, 2024
|
March 31, 2024
|
December 31, 2023
|
September 30, 2023
|
June 30, 2023
|
||||||||||||||||
|
(In thousands, except ratios and per share information)
|
||||||||||||||||||||
|
Tangible Equity:
|
||||||||||||||||||||
|
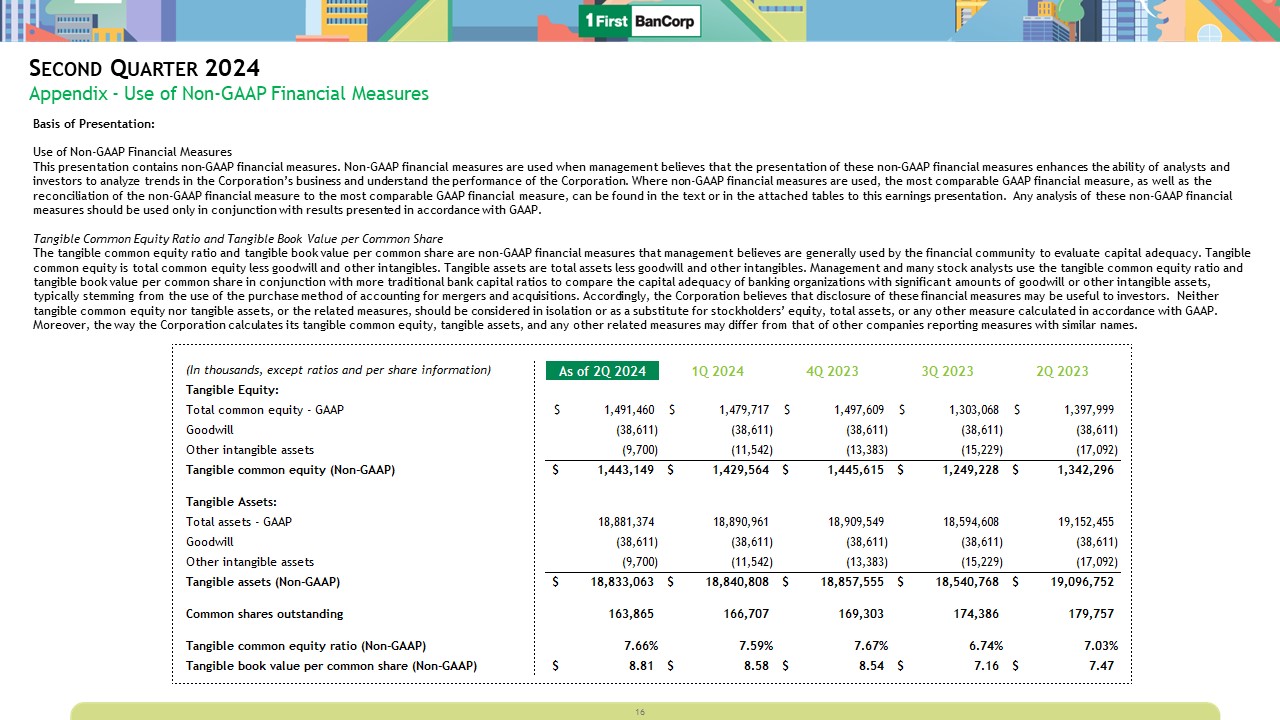
Total common equity - GAAP
|
$
|
1,491,460
|
$
|
1,479,717
|
$
|
1,497,609
|
$
|
1,303,068
|
$
|
1,397,999
|
||||||||||
|
Goodwill
|
(38,611
|
)
|
(38,611
|
)
|
(38,611
|
)
|
(38,611
|
)
|
(38,611
|
)
|
||||||||||
|
Other intangible assets
|
(9,700
|
)
|
(11,542
|
)
|
(13,383
|
)
|
(15,229
|
)
|
(17,092
|
)
|
||||||||||
|
Tangible common equity - non-GAAP
|
$
|
1,443,149
|
$
|
1,429,564
|
$
|
1,445,615
|
$
|
1,249,228
|
$
|
1,342,296
|
||||||||||
|
Tangible Assets:
|
||||||||||||||||||||
|
Total assets - GAAP
|
$
|
18,881,374
|
$
|
18,890,961
|
$
|
18,909,549
|
$
|
18,594,608
|
$
|
19,152,455
|
||||||||||
|
Goodwill
|
(38,611
|
)
|
(38,611
|
)
|
(38,611
|
)
|
(38,611
|
)
|
(38,611
|
)
|
||||||||||
|
Other intangible assets
|
(9,700
|
)
|
(11,542
|
)
|
(13,383
|
)
|
(15,229
|
)
|
(17,092
|
)
|
||||||||||
|
Tangible assets - non-GAAP
|
$
|
18,833,063
|
$
|
18,840,808
|
$
|
18,857,555
|
$
|
18,540,768
|
$
|
19,096,752
|
||||||||||
|
Common shares outstanding
|
163,865
|
166,707
|
169,303
|
174,386
|
179,757
|
|||||||||||||||
|
|
||||||||||||||||||||
|
Tangible common equity ratio - non-GAAP
|
7.66
|
%
|
7.59
|
%
|
7.67
|
%
|
6.74
|
%
|
7.03
|
%
|
||||||||||
|
Tangible book value per common share - non-GAAP
|
$
|
8.81
|
$
|
8.58
|
$
|
8.54
|
$
|
7.16
|
$
|
7.47
|
||||||||||
|
Quarter Ended
|
Six-Month Period Ended
|
|||||||||||||||||||
|
June 30, 2024
|
March 31, 2024
|
June 30, 2023
|
June 30, 2024
|
June 30, 2023
|
||||||||||||||||
|
(In thousands, except per share information)
|
||||||||||||||||||||
|
Net income, as reported (GAAP)
|
$
|
75,838
|
$
|
73,458
|
$
|
70,655
|
$
|
149,296
|
$
|
141,353
|
||||||||||
|
Adjustments:
|
||||||||||||||||||||
|
FDIC special assessment expense
|
152
|
947
|
-
|
1,099
|
-
|
|||||||||||||||
|
Gain recognized from legal settlement
|
-
|
-
|
(3,600
|
)
|
-
|
(3,600
|
)
|
|||||||||||||
|
Gain on early extinguishment of debt
|
-
|
-
|
(1,605
|
)
|
-
|
(1,605
|
)
|
|||||||||||||
|
Income tax impact of adjustments (1)
|
(57
|
)
|
(355
|
)
|
1,350
|
(412
|
)
|
1,350
|
||||||||||||
|
Adjusted net income attributable to common stockholders (non-GAAP)
|
$
|
75,933
|
$
|
74,050
|
$
|
66,800
|
$
|
149,983
|
$
|
137,498
|
||||||||||
|
Weighted-average diluted shares outstanding
|
165,543
|
167,798
|
179,277
|
166,670
|
180,253
|
|||||||||||||||
|
Earnings Per Share - diluted (GAAP)
|
$
|
0.46
|
$
|
0.44
|
$
|
0.39
|
$
|
0.90
|
$
|
0.78
|
||||||||||
|
Adjusted Earnings Per Share - diluted (non-GAAP)
|
$
|
0.46
|
$
|
0.44
|
$
|
0.37
|
$
|
0.90
|
$
|
0.76
|
||||||||||
|
(1)
|
See Non-GAAP Disclosures - Special Items above for discussion of the individual tax impact related to the above adjustments.
|
|
Quarter Ended
|
Six-Month Period Ended
|
|||||||||||||||||||||||||||
|
June 30, 2024
|
March 31, 2024
|
December 31, 2023
|
September 30, 2023
|
June 30, 2023
|
June 30, 2024
|
June 30, 2023
|
||||||||||||||||||||||
|
(Dollars in thousands)
|
||||||||||||||||||||||||||||
|
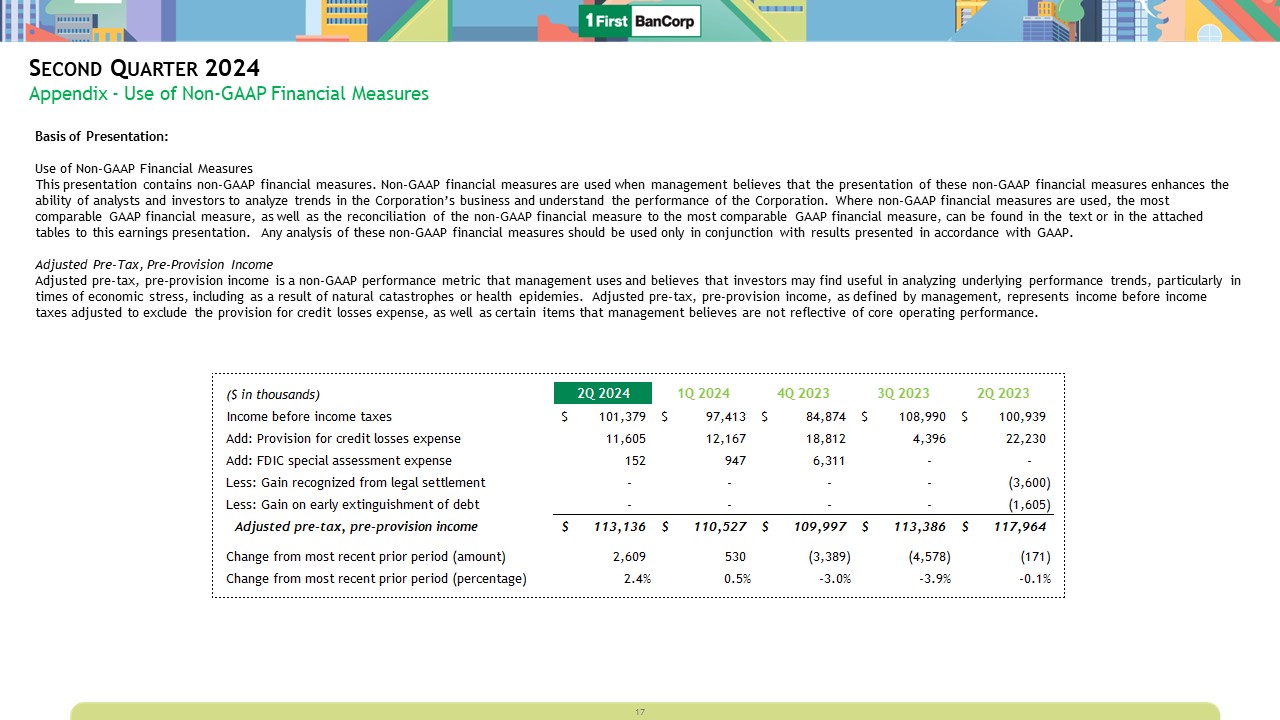
Income before income taxes
|
$
|
101,379
|
$
|
97,413
|
$
|
84,874
|
$
|
108,990
|
$
|
100,939
|
$
|
198,792
|
$
|
203,572
|
||||||||||||||
|
Add: Provision for credit losses expense
|
11,605
|
12,167
|
18,812
|
4,396
|
22,230
|
23,772
|
37,732
|
|||||||||||||||||||||
|
Add: FDIC special assessment expense
|
152
|
947
|
6,311
|
-
|
-
|
1,099
|
-
|
|||||||||||||||||||||
|
Less: Gain recognized from legal settlement
|
-
|
-
|
-
|
-
|
(3,600
|
)
|
-
|
(3,600
|
)
|
|||||||||||||||||||
|
Less: Gain on early extinguishment of debt
|
-
|
-
|
-
|
-
|
(1,605
|
)
|
-
|
(1,605
|
)
|
|||||||||||||||||||
|
Adjusted pre-tax, pre-provision income (1)
|
$
|
113,136
|
$
|
110,527
|
$
|
109,997
|
$
|
113,386
|
$
|
117,964
|
$
|
223,663
|
$
|
236,099
|
||||||||||||||
|
Change from most recent prior period (amount)
|
$
|
2,609
|
$
|
530
|
$
|
(3,389
|
)
|
$
|
(4,578
|
)
|
$
|
(171
|
)
|
$
|
(12,436
|
)
|
$
|
5,475
|
||||||||||
|
Change from most recent prior period (percentage)
|
2.4
|
%
|
0.5
|
%
|
-3.0
|
%
|
-3.9
|
%
|
-0.1
|
%
|
-5.3
|
%
|
2.4
|
%
|
||||||||||||||
|
(1)
|
Non-GAAP financial measure. See Non-GAAP Disclosures above for the definition and additional information about this non-GAAP financial measure.
|
|
|
As of
|
|||||||||||
|
|
June 30, 2024
|
March 31, 2024
|
December 31, 2023
|
|||||||||
|
(In thousands, except for share information)
|
||||||||||||
|
ASSETS
|
||||||||||||
|
Cash and due from banks
|
$
|
581,843
|
$
|
680,734
|
$
|
661,925
|
||||||
|
Money market investments:
|
||||||||||||
|
Time deposits with other financial institutions
|
500
|
300
|
300
|
|||||||||
|
Other short-term investments
|
3,939
|
3,485
|
939
|
|||||||||
|
Total money market investments
|
4,439
|
3,785
|
1,239
|
|||||||||
|
Debt securities available for sale, at fair value (ACL of $549 as of June 30, 2024; $442 as of March 31, 2024; and $511 as of December 31, 2023)
|
4,957,311
|
5,047,179
|
5,229,984
|
|||||||||
|
Debt securities held to maturity, at amortized cost, net of ACL of $1,267 as of June 30, 2024; $1,235 as of March 30, 2024; and $2,197 as of December 31, 2023 (fair value of $333,690 as of
June 30, 2024;$338,120 as of March 31, 2024; and $346,132 as of December 31, 2023)
|
343,168
|
348,095
|
351,981
|
|||||||||
|
Total debt securities
|
5,300,479
|
5,395,274
|
5,581,965
|
|||||||||
|
Equity securities
|
51,037
|
51,390
|
49,675
|
|||||||||
|
Total investment securities
|
5,351,516
|
5,446,664
|
5,631,640
|
|||||||||
|
|
||||||||||||
|
Loans, net of ACL of $254,532 as of June 30, 2024; $263,592 as of March 31, 2024; and $261,843 as of December 31, 2023
|
12,130,976
|
12,047,856
|
11,923,640
|
|||||||||
|
Loans held for sale, at lower of cost or market
|
10,392
|
12,080
|
7,368
|
|||||||||
|
Total loans, net
|
12,141,368
|
12,059,936
|
11,931,008
|
|||||||||
|
Accrued interest receivable on loans and investments
|
77,895
|
73,154
|
77,716
|
|||||||||
|
Premises and equipment, net
|
138,554
|
141,471
|
142,016
|
|||||||||
|
OREO
|
21,682
|
28,864
|
32,669
|
|||||||||
|
Deferred tax asset, net
|
142,725
|
147,743
|
150,127
|
|||||||||
|
Goodwill
|
38,611
|
38,611
|
38,611
|
|||||||||
|
Other intangible assets
|
9,700
|
11,542
|
13,383
|
|||||||||
|
Other assets
|
373,041
|
258,457
|
229,215
|
|||||||||
|
Total assets
|
$
|
18,881,374
|
$
|
18,890,961
|
$
|
18,909,549
|
||||||
|
LIABILITIES
|
||||||||||||
|
Deposits:
|
||||||||||||
|
Non-interest-bearing deposits
|
$
|
5,406,054
|
$
|
5,346,326
|
$
|
5,404,121
|
||||||
|
Interest-bearing deposits
|
11,122,902
|
11,199,185
|
11,151,864
|
|||||||||
|
Total deposits
|
16,528,956
|
16,545,511
|
16,555,985
|
|||||||||
|
Advances from the FHLB
|
500,000
|
500,000
|
500,000
|
|||||||||
|
Other borrowings
|
161,700
|
161,700
|
161,700
|
|||||||||
|
Accounts payable and other liabilities
|
199,258
|
204,033
|
194,255
|
|||||||||
|
Total liabilities
|
17,389,914
|
17,411,244
|
17,411,940
|
|||||||||
|
STOCKHOLDERSʼ EQUITY
|
||||||||||||
|
Common stock, $0.10 par value, 223,663,116 shares issued (June 30, 2024 - 163,865,453 shares outstanding;
|
||||||||||||
|
March 31, 2024 - 166,707,047 shares outstanding; and December 31, 2023 - 169,302,812 shares outstanding)
|
22,366
|
22,366
|
22,366
|
|||||||||
|
Additional paid-in capital
|
961,254
|
959,319
|
965,707
|
|||||||||
|
Retained earnings
|
1,941,980
|
1,892,714
|
1,846,112
|
|||||||||
|
Treasury stock, at cost (June 30, 2024 - 59,797,663 shares; March 31, 2024 - 56,956,069 shares; and
|
||||||||||||
|
December 31, 2023 - 54,360,304 shares)
|
(790,465
|
)
|
(740,447
|
)
|
(697,406
|
)
|
||||||
|
Accumulated other comprehensive loss
|
(643,675
|
)
|
(654,235
|
)
|
(639,170
|
)
|
||||||
|
Total stockholdersʼ equity
|
1,491,460
|
1,479,717
|
1,497,609
|
|||||||||
|
Total liabilities and stockholdersʼ equity
|
$
|
18,881,374
|
$
|
18,890,961
|
$
|
18,909,549
|
||||||
|
Quarter Ended
|
Six-Month Period Ended
|
|||||||||||||||||||
|
June 30, 2024
|
March 31, 2024
|
June 30, 2023
|
June 30, 2024
|
June 30, 2023
|
||||||||||||||||
|
(In thousands, except per share information)
|
||||||||||||||||||||
|
Net interest income:
|
||||||||||||||||||||
|
Interest income
|
$
|
272,245
|
$
|
268,505
|
$
|
252,204
|
$
|
540,750
|
$
|
494,600
|
||||||||||
|
Interest expense
|
72,617
|
71,985
|
52,389
|
144,602
|
93,900
|
|||||||||||||||
|
Net interest income
|
199,628
|
196,520
|
199,815
|
396,148
|
400,700
|
|||||||||||||||
|
Provision for credit losses - expense (benefit):
|
||||||||||||||||||||
|
Loans
|
11,930
|
12,917
|
20,770
|
24,847
|
37,026
|
|||||||||||||||
|
Unfunded loan commitments
|
(417
|
)
|
281
|
721
|
(136
|
)
|
616
|
|||||||||||||
|
Debt securities
|
92
|
(1,031
|
)
|
739
|
(939
|
)
|
90
|
|||||||||||||
|
Provision for credit losses - expense
|
11,605
|
12,167
|
22,230
|
23,772
|
37,732
|
|||||||||||||||
|
Net interest income after provision for credit losses
|
188,023
|
184,353
|
177,585
|
372,376
|
362,968
|
|||||||||||||||
|
Non-interest income:
|
||||||||||||||||||||
|
Service charges and fees on deposit accounts
|
9,725
|
9,662
|
9,287
|
19,387
|
18,828
|
|||||||||||||||
|
Mortgage banking activities
|
3,419
|
2,882
|
2,860
|
6,301
|
5,672
|
|||||||||||||||
|
Gain on early extinguishment of debt
|
-
|
-
|
1,605
|
-
|
1,605
|
|||||||||||||||
|
Card and processing income
|
11,523
|
11,312
|
11,135
|
22,835
|
22,053
|
|||||||||||||||
|
Other non-interest income
|
7,371
|
10,127
|
11,384
|
17,498
|
20,631
|
|||||||||||||||
|
Total non-interest income
|
32,038
|
33,983
|
36,271
|
66,021
|
68,789
|
|||||||||||||||
|
Non-interest expenses:
|
||||||||||||||||||||
|
Employees’ compensation and benefits
|
57,456
|
59,506
|
54,314
|
116,962
|
110,736
|
|||||||||||||||
|
Occupancy and equipment
|
21,851
|
21,381
|
21,097
|
43,232
|
42,283
|
|||||||||||||||
|
Business promotion
|
4,359
|
3,842
|
4,167
|
8,201
|
8,142
|
|||||||||||||||
|
Professional service fees
|
12,431
|
12,676
|
11,596
|
25,107
|
23,569
|
|||||||||||||||
|
Taxes, other than income taxes
|
5,408
|
5,129
|
5,124
|
10,537
|
10,236
|
|||||||||||||||
|
FDIC deposit insurance
|
2,316
|
3,102
|
2,143
|
5,418
|
4,276
|
|||||||||||||||
|
Net gain on OREO operations
|
(3,609
|
)
|
(1,452
|
)
|
(1,984
|
)
|
(5,061
|
)
|
(3,980
|
)
|
||||||||||
|
Credit and debit card processing expenses
|
7,607
|
5,751
|
6,540
|
13,358
|
11,858
|
|||||||||||||||
|
Other non-interest expenses
|
10,863
|
10,988
|
9,920
|
21,851
|
21,065
|
|||||||||||||||
|
Total non-interest expenses
|
118,682
|
120,923
|
112,917
|
239,605
|
228,185
|
|||||||||||||||
|
Income before income taxes
|
101,379
|
97,413
|
100,939
|
198,792
|
203,572
|
|||||||||||||||
|
Income tax expense
|
25,541
|
23,955
|
30,284
|
49,496
|
62,219
|
|||||||||||||||
|
Net income
|
$
|
75,838
|
$
|
73,458
|
$
|
70,655
|
$
|
149,296
|
$
|
141,353
|
||||||||||
|
Net income attributable to common stockholders
|
$
|
75,838
|
$
|
73,458
|
$
|
70,655
|
$
|
149,296
|
$
|
141,353
|
||||||||||
|
Earnings per common share:
|
||||||||||||||||||||
|
Basic
|
$
|
0.46
|
$
|
0.44
|
$
|
0.39
|
$
|
0.90
|
$
|
0.79
|
||||||||||
|
Diluted
|
$
|
0.46
|
$
|
0.44
|
$
|
0.39
|
$
|
0.90
|
$
|
0.78
|
||||||||||
|
Quarter Ended
|
Six-Month Period Ended
|
|||||||||||||||||||
|
June 30, 2024
|
March 31, 2024
|
June 30, 2023
|
June 30, 2024
|
June 30, 2023
|
||||||||||||||||
|
(Shares in thousands)
|
||||||||||||||||||||
|
Per Common Share Results:
|
||||||||||||||||||||
|
Net earnings per share - basic
|
$
|
0.46
|
$
|
0.44
|
$
|
0.39
|
$
|
0.90
|
$
|
0.79
|
||||||||||
|
Net earnings per share - diluted
|
$
|
0.46
|
$
|
0.44
|
$
|
0.39
|
$
|
0.90
|
$
|
0.78
|
||||||||||
|
Cash dividends declared
|
$
|
0.16
|
$
|
0.16
|
$
|
0.14
|
$
|
0.32
|
$
|
0.28
|
||||||||||
|
Average shares outstanding
|
164,945
|
167,142
|
178,926
|
166,043
|
179,567
|
|||||||||||||||
|
Average shares outstanding diluted
|
165,543
|
167,798
|
179,277
|
166,670
|
180,253
|
|||||||||||||||
|
Book value per common share
|
$
|
9.10
|
$
|
8.88
|
$
|
7.78
|
$
|
9.10
|
$
|
7.78
|
||||||||||
|
Tangible book value per common share (1)
|
$
|
8.81
|
$
|
8.58
|
$
|
7.47
|
$
|
8.81
|
$
|
7.47
|
||||||||||
|
Common stock price: end of period
|
$
|
18.29
|
$
|
17.54
|
$
|
12.22
|
$
|
18.29
|
$
|
12.22
|
||||||||||
|
Selected Financial Ratios (In Percent):
|
||||||||||||||||||||
|
Profitability:
|
||||||||||||||||||||
|
Return on average assets
|
1.61
|
1.56
|
1.51
|
1.59
|
1.53
|
|||||||||||||||
|
Return on average equity
|
20.80
|
19.56
|
19.66
|
20.17
|
20.31
|
|||||||||||||||
|
Interest rate spread (2)
|
3.41
|
3.35
|
3.58
|
3.38
|
3.71
|
|||||||||||||||
|
Net interest margin (2)
|
4.32
|
4.27
|
4.35
|
4.29
|
4.42
|
|||||||||||||||
|
Efficiency ratio (3)
|
51.23
|
52.46
|
47.83
|
51.84
|
48.60
|
|||||||||||||||
|
Capital and Other:
|
||||||||||||||||||||
|
Average total equity to average total assets
|
7.74
|
7.99
|
7.67
|
7.87
|
7.52
|
|||||||||||||||
|
Total capital
|
18.21
|
18.36
|
19.15
|
18.21
|
19.15
|
|||||||||||||||
|
Common equity Tier 1 capital
|
15.77
|
15.90
|
16.64
|
15.77
|
16.64
|
|||||||||||||||
|
Tier 1 capital
|
15.77
|
15.90
|
16.64
|
15.77
|
16.64
|
|||||||||||||||
|
Leverage
|
10.63
|
10.65
|
10.73
|
10.63
|
10.73
|
|||||||||||||||
|
Tangible common equity ratio (1)
|
7.66
|
7.59
|
7.03
|
7.66
|
7.03
|
|||||||||||||||
|
Dividend payout ratio
|
34.80
|
36.41
|
35.45
|
35.59
|
35.57
|
|||||||||||||||
|
Basic liquidity ratio (4)
|
18.50
|
19.60
|
21.82
|
18.50
|
21.82
|
|||||||||||||||
|
Core liquidity ratio (5)
|
13.37
|
14.45
|
16.70
|
13.37
|
16.70
|
|||||||||||||||
|
Loan to deposit ratio
|
75.00
|
74.48
|
69.76
|
75.00
|
69.76
|
|||||||||||||||
|
Uninsured deposits, excluding fully collateralized deposits, to total deposits (6)
|
28.46
|
27.93
|
27.12
|
28.46
|
27.12
|
|||||||||||||||
|
Asset Quality:
|
||||||||||||||||||||
|
Allowance for credit losses for loans and finance leases to total loans held for investment
|
2.06
|
2.14
|
2.28
|
2.06
|
2.28
|
|||||||||||||||
|
Net charge-offs (annualized) to average loans outstanding
|
0.69
|
0.37
|
0.67
|
0.53
|
0.56
|
|||||||||||||||
|
Provision for credit losses for loans and finance leases to net charge-offs
|
56.84
|
115.66
|
107.73
|
77.27
|
113.76
|
|||||||||||||||
|
Non-performing assets to total assets
|
0.67
|
0.69
|
0.63
|
0.67
|
0.63
|
|||||||||||||||
|
Nonaccrual loans held for investment to total loans held for investment
|
0.78
|
0.76
|
0.70
|
0.78
|
0.70
|
|||||||||||||||
|
Allowance for credit losses for loans and finance leases to total nonaccrual loans held for investment
|
264.66
|
283.54
|
325.60
|
264.66
|
325.60
|
|||||||||||||||
|
Allowance for credit losses for loans and finance leases to total nonaccrual loans held for investment, excluding residential estate loans
|
392.94
|
437.28
|
547.60
|
392.94
|
547.60
|
|||||||||||||||
| (1) |
Non-GAAP financial measures. Refer to Non-GAAP Disclosures and Statement of Financial Condition - Tangible Common Equity
(Non-GAAP) above for additional information about the components and a reconciliation of these measures.
|
| (2) |
Non-GAAP financial measures reported on a tax-equivalent basis and excluding changes in the fair value of derivative instruments. Refer to Non-GAAP Disclosures and
Table 4 below for additional information and a reconciliation of these measures.
|
| (3) |
Non-interest expenses to the sum of net interest income and non-interest income.
|
| (4) |
Defined as the sum of cash and cash equivalents, free high quality liquid assets that could be liquidated within one day, and available secured lines of credit with the FHLB to total assets.
|
| (5) |
Defined as the sum of cash and cash equivalents and free high quality liquid assets that could be liquidated within one day to total assets.
|
| (6) |
Exclude insured deposits not covered by federal deposit insurance.
|
|
Quarter Ended
|
Six-Month Period Ended
|
|||||||||||||||||||
|
(Dollars in thousands)
|
June 30, 2024
|
March 31, 2024
|
June 30, 2023
|
June 30, 2024
|
June 30, 2023
|
|||||||||||||||
|
Net Interest Income
|
||||||||||||||||||||
|
Interest income - GAAP
|
$
|
272,245
|
$
|
268,505
|
$
|
252,204
|
$
|
540,750
|
$
|
494,600
|
||||||||||
|
Unrealized (gain) loss on derivative instruments
|
-
|
(2
|
)
|
(3
|
)
|
(2
|
)
|
3
|
||||||||||||
|
Interest income excluding valuations - non-GAAP
|
272,245
|
268,503
|
252,201
|
540,748
|
494,603
|
|||||||||||||||
|
Tax-equivalent adjustment
|
4,866
|
4,813
|
5,540
|
9,679
|
11,887
|
|||||||||||||||
|
Interest income on a tax-equivalent basis and excluding valuations - non-GAAP
|
$
|
277,111
|
$
|
273,316
|
$
|
257,741
|
$
|
550,427
|
$
|
506,490
|
||||||||||
|
Interest expense - GAAP
|
$
|
72,617
|
$
|
71,985
|
$
|
52,389
|
$
|
144,602
|
$
|
93,900
|
||||||||||
|
Net interest income - GAAP
|
$
|
199,628
|
$
|
196,520
|
$
|
199,815
|
$
|
396,148
|
$
|
400,700
|
||||||||||
|
Net interest income excluding valuations - non-GAAP
|
$
|
199,628
|
$
|
196,518
|
$
|
199,812
|
$
|
396,146
|
$
|
400,703
|
||||||||||
|
Net interest income on a tax-equivalent basis and excluding valuations - non-GAAP
|
$
|
204,494
|
$
|
201,331
|
$
|
205,352
|
$
|
405,825
|
$
|
412,590
|
||||||||||
|
Average Balances
|
||||||||||||||||||||
|
Loans and leases
|
$
|
12,272,816
|
$
|
12,207,840
|
$
|
11,591,516
|
$
|
12,240,328
|
$
|
11,555,659
|
||||||||||
|
Total securities, other short-term investments and interest-bearing cash balances
|
6,698,609
|
6,720,395
|
7,333,989
|
6,709,502
|
7,283,450
|
|||||||||||||||
|
Average Interest-Earning Assets
|
$
|
18,971,425
|
$
|
18,928,235
|
$
|
18,925,505
|
$
|
18,949,830
|
$
|
18,839,109
|
||||||||||
|
Average Interest-Bearing Liabilities
|
$
|
11,868,658
|
$
|
11,838,159
|
$
|
11,176,385
|
$
|
11,853,409
|
$
|
11,067,741
|
||||||||||
|
Average Assets (1)
|
$
|
18,884,431
|
$
|
18,858,299
|
$
|
18,788,578
|
$
|
18,871,365
|
$
|
18,673,506
|
||||||||||
|
Average Non-Interest-Bearing Deposits
|
$
|
5,351,308
|
$
|
5,308,531
|
$
|
5,968,892
|
$
|
5,329,920
|
$
|
5,983,896
|
||||||||||
|
Average Yield/Rate
|
||||||||||||||||||||
|
Average yield on interest-earning assets - GAAP
|
5.76
|
%
|
5.69
|
%
|
5.35
|
%
|
5.72
|
%
|
5.29
|
%
|
||||||||||
|
Average rate on interest-bearing liabilities - GAAP
|
2.45
|
%
|
2.44
|
%
|
1.88
|
%
|
2.45
|
%
|
1.71
|
%
|
||||||||||
|
Net interest spread - GAAP
|
3.31
|
%
|
3.25
|
%
|
3.47
|
%
|
3.27
|
%
|
3.58
|
%
|
||||||||||
|
Net interest margin - GAAP
|
4.22
|
%
|
4.16
|
%
|
4.23
|
%
|
4.19
|
%
|
4.29
|
%
|
||||||||||
|
Average yield on interest-earning assets excluding valuations - non-GAAP
|
5.76
|
%
|
5.69
|
%
|
5.35
|
%
|
5.72
|
%
|
5.29
|
%
|
||||||||||
|
Average rate on interest-bearing liabilities
|
2.45
|
%
|
2.44
|
%
|
1.88
|
%
|
2.45
|
%
|
1.71
|
%
|
||||||||||
|
Net interest spread excluding valuations - non-GAAP
|
3.31
|
%
|
3.25
|
%
|
3.47
|
%
|
3.27
|
%
|
3.58
|
%
|
||||||||||
|
Net interest margin excluding valuations - non-GAAP
|
4.22
|
%
|
4.16
|
%
|
4.23
|
%
|
4.19
|
%
|
4.29
|
%
|
||||||||||
|
Average yield on interest-earning assets on a tax-equivalent basis and excluding valuations - non-GAAP
|
5.86
|
%
|
5.79
|
%
|
5.46
|
%
|
5.83
|
%
|
5.42
|
%
|
||||||||||
|
Average rate on interest-bearing liabilities
|
2.45
|
%
|
2.44
|
%
|
1.88
|
%
|
2.45
|
%
|
1.71
|
%
|
||||||||||
|
Net interest spread on a tax-equivalent basis and excluding valuations - non-GAAP
|
3.41
|
%
|
3.35
|
%
|
3.58
|
%
|
3.38
|
%
|
3.71
|
%
|
||||||||||
|
Net interest margin on a tax-equivalent basis and excluding valuations - non-GAAP
|
4.32
|
%
|
4.27
|
%
|
4.35
|
%
|
4.29
|
%
|
4.42
|
%
|
||||||||||
|
(1)
|
Includes, among other things, the ACL on loans and finance leases and debt securities, as well as unrealized gains and losses on available-for-sale debt securities.
|
|
Average Volume
|
Interest Income (1) / Expense
|
Average Rate (1)
|
||||||||||||||||||||||||||||||||||
|
Quarter Ended
|
June 30,
|
March 31,
|
June 30,
|
June 30,
|
March 31,
|
June 30,
|
June 30,
|
March 31,
|
June 30,
|
|||||||||||||||||||||||||||
|
2024
|
2024
|
2023
|
2024
|
2024
|
2023
|
2024
|
2024
|
2023
|
||||||||||||||||||||||||||||
|
(Dollars in thousands)
|
||||||||||||||||||||||||||||||||||||
|
Interest-earning assets:
|
||||||||||||||||||||||||||||||||||||
|
Money market and other short-term investments
|
$
|
667,564
|
$
|
533,747
|
$
|
617,356
|
$
|
9,060
|
$
|
7,254
|
$
|
7,880
|
5.44
|
%
|
5.45
|
%
|
5.12
|
%
|
||||||||||||||||||
|
Government obligations (2)
|
2,619,778
|
2,684,169
|
2,909,204
|
8,947
|
9,053
|
10,973
|
1.37
|
%
|
1.35
|
%
|
1.51
|
%
|
||||||||||||||||||||||||
|
MBS
|
3,359,598
|
3,451,293
|
3,757,425
|
14,339
|
15,238
|
17,087
|
1.71
|
%
|
1.77
|
%
|
1.82
|
%
|
||||||||||||||||||||||||
|
FHLB stock
|
34,032
|
34,635
|
36,265
|
818
|
854
|
780
|
9.64
|
%
|
9.89
|
%
|
8.63
|
%
|
||||||||||||||||||||||||
|
Other investments
|
17,637
|
16,551
|
13,739
|
244
|
66
|
58
|
5.55
|
%
|
1.60
|
%
|
1.69
|
%
|
||||||||||||||||||||||||
|
Total investments (3)
|
6,698,609
|
6,720,395
|
7,333,989
|
33,408
|
32,465
|
36,778
|
2.00
|
%
|
1.94
|
%
|
2.01
|
%
|
||||||||||||||||||||||||
|
Residential mortgage loans
|
2,807,639
|
2,810,304
|
2,808,465
|
40,686
|
40,473
|
39,864
|
5.81
|
%
|
5.78
|
%
|
5.69
|
%
|
||||||||||||||||||||||||
|
Construction loans
|
245,219
|
218,854
|
149,783
|
4,955
|
4,537
|
2,903
|
8.10
|
%
|
8.32
|
%
|
7.77
|
%
|
||||||||||||||||||||||||
|
C&I and commercial mortgage loans
|
5,528,607
|
5,504,782
|
5,191,040
|
100,919
|
99,074
|
89,290
|
7.32
|
%
|
7.22
|
%
|
6.90
|
%
|
||||||||||||||||||||||||
|
Finance leases
|
873,908
|
863,685
|
769,316
|
17,255
|
17,127
|
14,714
|
7.92
|
%
|
7.95
|
%
|
7.67
|
%
|
||||||||||||||||||||||||
|
Consumer loans
|
2,817,443
|
2,810,215
|
2,672,912
|
79,888
|
79,640
|
74,192
|
11.37
|
%
|
11.37
|
%
|
11.13
|
%
|
||||||||||||||||||||||||
|
Total loans (4) (5)
|
12,272,816
|
12,207,840
|
11,591,516
|
243,703
|
240,851
|
220,963
|
7.96
|
%
|
7.91
|
%
|
7.65
|
%
|
||||||||||||||||||||||||
|
Total interest-earning assets
|
$
|
18,971,425
|
$
|
18,928,235
|
$
|
18,925,505
|
$
|
277,111
|
$
|
273,316
|
$
|
257,741
|
5.86
|
%
|
5.79
|
%
|
5.46
|
%
|
||||||||||||||||||
|
Interest-bearing liabilities:
|
||||||||||||||||||||||||||||||||||||
|
Time deposits
|
$
|
3,002,159
|
$
|
2,892,355
|
$
|
2,511,504
|
$
|
26,588
|
$
|
24,410
|
$
|
15,667
|
3.55
|
%
|
3.39
|
%
|
2.50
|
%
|
||||||||||||||||||
|
Brokered CDs
|
676,421
|
749,760
|
333,557
|
8,590
|
9,680
|
3,761
|
5.09
|
%
|
5.18
|
%
|
4.52
|
%
|
||||||||||||||||||||||||
|
Other interest-bearing deposits
|
7,528,378
|
7,534,344
|
7,517,995
|
28,493
|
28,935
|
22,176
|
1.52
|
%
|
1.54
|
%
|
1.18
|
%
|
||||||||||||||||||||||||
|
Securities sold under agreements to repurchase
|
-
|
-
|
101,397
|
-
|
-
|
1,328
|
0.00
|
%
|
0.00
|
%
|
5.25
|
%
|
||||||||||||||||||||||||
|
Advances from the FHLB
|
500,000
|
500,000
|
534,231
|
5,610
|
5,610
|
6,048
|
4.50
|
%
|
4.50
|
%
|
4.54
|
%
|
||||||||||||||||||||||||
|
Other borrowings
|
161,700
|
161,700
|
177,701
|
3,336
|
3,350
|
3,409
|
8.27
|
%
|
8.31
|
%
|
7.69
|
%
|
||||||||||||||||||||||||
|
Total interest-bearing liabilities
|
$
|
11,868,658
|
$
|
11,838,159
|
$
|
11,176,385
|
$
|
72,617
|
$
|
71,985
|
$
|
52,389
|
2.45
|
%
|
2.44
|
%
|
1.88
|
%
|
||||||||||||||||||
|
Net interest income
|
$
|
204,494
|
$
|
201,331
|
$
|
205,352
|
||||||||||||||||||||||||||||||
|
Interest rate spread
|
3.41
|
%
|
3.35
|
%
|
3.58
|
%
|
||||||||||||||||||||||||||||||
|
Net interest margin
|
4.32
|
%
|
4.27
|
%
|
4.35
|
%
|
||||||||||||||||||||||||||||||
| (1) |
Non-GAAP financial measures reported on a tax-equivalent basis. The tax-equivalent yield was estimated by dividing the interest rate spread on exempt assets by 1 less the Puerto Rico statutory tax rate of
37.5% and adding to it the cost of interest-bearing liabilities. When adjusted to a tax-equivalent basis, yields on taxable and exempt assets are comparable. Changes in the fair value of derivative instruments are excluded from interest
income because the changes in valuation do not affect interest paid or received. Refer to Non-GAAP Disclosures - Non-GAAP Financial Measures and Table 4 above for additional information and a
reconciliation of these measures.
|
| (2) |
Government obligations include debt issued by government-sponsored agencies.
|
| (3) |
Unrealized gains and losses on available-for-sale debt securities are excluded from the average volumes.
|
| (4) |
Average loan balances include the average of non-performing loans.
|
| (5) |
Interest income on loans includes $3.1 million, $3.2 million, and $2.9 million, for the quarters ended June 30, 2024, March 31, 2024, and June 30, 2023, respectively, of income from prepayment penalties and
late fees related to the Corporation’s loan portfolio.
|
|
Average Volume
|
Interest Income (1) / Expense
|
Average Rate (1)
|
||||||||||||||||||||||
|
Six-Month Period Ended
|
June 30, 2024
|
June 30, 2023
|
June 30, 2024
|
June 30, 2023
|
June 30, 2024
|
June 30, 2023
|
||||||||||||||||||
|
(Dollars in thousands)
|
||||||||||||||||||||||||
|
Interest-earning assets:
|
||||||||||||||||||||||||
|
Money market and other short-term investments
|
$
|
600,655
|
$
|
511,392
|
$
|
16,314
|
$
|
12,530
|
5.45
|
%
|
4.94
|
%
|
||||||||||||
|
Government obligations (2)
|
2,651,974
|
2,909,587
|
18,000
|
21,738
|
1.36
|
%
|
1.51
|
%
|
||||||||||||||||
|
MBS
|
3,405,445
|
3,810,491
|
29,577
|
36,483
|
1.74
|
%
|
1.93
|
%
|
||||||||||||||||
|
FHLB stock
|
34,334
|
38,539
|
1,672
|
1,201
|
9.77
|
%
|
6.28
|
%
|
||||||||||||||||
|
Other investments
|
17,094
|
13,441
|
310
|
197
|
3.64
|
%
|
2.96
|
%
|
||||||||||||||||
|
Total investments (3)
|
6,709,502
|
7,283,450
|
65,873
|
72,149
|
1.97
|
%
|
2.00
|
%
|
||||||||||||||||
|
Residential mortgage loans
|
2,808,972
|
2,821,779
|
81,159
|
79,658
|
5.79
|
%
|
5.69
|
%
|
||||||||||||||||
|
Construction loans
|
232,036
|
147,923
|
9,492
|
5,579
|
8.20
|
%
|
7.61
|
%
|
||||||||||||||||
|
C&I and commercial mortgage loans
|
5,516,695
|
5,179,448
|
199,993
|
175,175
|
7.27
|
%
|
6.82
|
%
|
||||||||||||||||
|
Finance leases
|
868,796
|
752,501
|
34,382
|
28,523
|
7.94
|
%
|
7.64
|
%
|
||||||||||||||||
|
Consumer loans
|
2,813,829
|
2,654,008
|
159,528
|
145,406
|
11.37
|
%
|
11.05
|
%
|
||||||||||||||||
|
Total loans (4) (5)
|
12,240,328
|
11,555,659
|
484,554
|
434,341
|
7.94
|
%
|
7.58
|
%
|
||||||||||||||||
|
Total interest-earning assets
|
$
|
18,949,830
|
$
|
18,839,109
|
$
|
550,427
|
$
|
506,490
|
5.83
|
%
|
5.42
|
%
|
||||||||||||
|
Interest-bearing liabilities:
|
||||||||||||||||||||||||
|
Time deposits
|
$
|
2,947,257
|
$
|
2,427,399
|
$
|
50,998
|
$
|
26,449
|
3.47
|
%
|
2.20
|
%
|
||||||||||||
|
Brokered CDs
|
713,091
|
250,588
|
18,270
|
5,348
|
5.14
|
%
|
4.30
|
%
|
||||||||||||||||
|
Other interest-bearing deposits
|
7,531,361
|
7,531,374
|
57,428
|
39,692
|
1.53
|
%
|
1.06
|
%
|
||||||||||||||||
|
Securities sold under agreements to repurchase
|
-
|
96,229
|
-
|
2,397
|
0.00
|
%
|
5.02
|
%
|
||||||||||||||||
|
Advances from the FHLB
|
500,000
|
581,436
|
11,220
|
13,224
|
4.50
|
%
|
4.59
|
%
|
||||||||||||||||
|
Other borrowings
|
161,700
|
180,715
|
6,686
|
6,790
|
8.29
|
%
|
7.58
|
%
|
||||||||||||||||
|
Total interest-bearing liabilities
|
$
|
11,853,409
|
$
|
11,067,741
|
$
|
144,602
|
$
|
93,900
|
2.45
|
%
|
1.71
|
%
|
||||||||||||
|
Net interest income
|
$
|
405,825
|
$
|
412,590
|
||||||||||||||||||||
|
Interest rate spread
|
3.38
|
%
|
3.71
|
%
|
||||||||||||||||||||
|
Net interest margin
|
4.29
|
%
|
4.42
|
%
|
||||||||||||||||||||
| (1) |
Non-GAAP financial measures reported on a tax-equivalent basis. The tax-equivalent yield was estimated by dividing the interest rate spread on exempt assets by 1 less the Puerto Rico statutory tax rate of
37.5% and adding to it the cost of interest-bearing liabilities. When adjusted to a tax-equivalent basis, yields on taxable and exempt assets are comparable. Changes in the fair value of derivative instruments are excluded from interest
income because the changes in valuation do not affect interest paid or received. Refer to Non-GAAP Disclosures - Non-GAAP Financial Measures and Table 4 above for additional information and a
reconciliation of these measures.
|
| (2) |
Government obligations include debt issued by government-sponsored agencies.
|
| (3) |
Unrealized gains and losses on available-for-sale debt securities are excluded from the average volumes.
|
| (4) |
Average loan balances include the average of non-performing loans.
|
| (5) |
Interest income on loans includes $6.3 million and $6.0 million for the six-month periods ended June 30, 2024 and 2023, respectively, of income from prepayment penalties and late fees related to the
Corporation's loan portfolio.
|
|
As of June 30, 2024
|
||||||||||||||||
|
Puerto Rico
|
Virgin Islands
|
United States
|
Consolidated
|
|||||||||||||
|
(In thousands)
|
||||||||||||||||
|
Residential mortgage loans
|
$
|
2,163,245
|
$
|
161,057
|
$
|
485,364
|
$
|
2,809,666
|
||||||||
|
Commercial loans:
|
||||||||||||||||
|
Construction loans
|
160,093
|
3,681
|
22,183
|
185,957
|
||||||||||||
|
Commercial mortgage loans
|
1,697,939
|
62,821
|
662,549
|
2,423,309
|
||||||||||||
|
Commercial and Industrial loans
|
2,176,489
|
135,456
|
942,632
|
3,254,577
|
||||||||||||
|
Commercial loans
|
4,034,521
|
201,958
|
1,627,364
|
5,863,843
|
||||||||||||
|
Finance leases
|
880,312
|
-
|
-
|
880,312
|
||||||||||||
|
Consumer loans
|
2,755,077
|
68,540
|
8,070
|
2,831,687
|
||||||||||||
|
Loans held for investment
|
9,833,155
|
431,555
|
2,120,798
|
12,385,508
|
||||||||||||
|
Loans held for sale
|
10,392
|
-
|
-
|
10,392
|
||||||||||||
|
Total loans
|
$
|
9,843,547
|
$
|
431,555
|
$
|
2,120,798
|
$
|
12,395,900
|
||||||||
|
As of March 31, 2024
|
||||||||||||||||
|
Puerto Rico
|
Virgin Islands
|
United States
|
Consolidated
|
|||||||||||||
|
(In thousands)
|
||||||||||||||||
|
Residential mortgage loans
|
$
|
2,164,347
|
$
|
162,893
|
$
|
474,347
|
$
|
2,801,587
|
||||||||
|
Commercial loans:
|
||||||||||||||||
|
Construction loans
|
144,094
|
3,530
|
89,664
|
237,288
|
||||||||||||
|
Commercial mortgage loans
|
1,705,745
|
63,502
|
592,484
|
2,361,731
|
||||||||||||
|
Commercial and Industrial loans
|
2,163,439
|
126,560
|
940,996
|
3,230,995
|
||||||||||||
|
Commercial loans
|
4,013,278
|
193,592
|
1,623,144
|
5,830,014
|
||||||||||||
|
Finance leases
|
871,927
|
-
|
-
|
871,927
|
||||||||||||
|
Consumer loans
|
2,734,347
|
67,946
|
5,627
|
2,807,920
|
||||||||||||
|
Loans held for investment
|
9,783,899
|
424,431
|
2,103,118
|
12,311,448
|
||||||||||||
|
Loans held for sale
|
12,080
|
-
|
-
|
12,080
|
||||||||||||
|
Total loans
|
$
|
9,795,979
|
$
|
424,431
|
$
|
2,103,118
|
$
|
12,323,528
|
||||||||
|
As of December 31, 2023
|
||||||||||||||||
|
Puerto Rico
|
Virgin Islands
|
United States
|
Consolidated
|
|||||||||||||
|
(In thousands)
|
||||||||||||||||
|
Residential mortgage loans
|
$
|
2,187,875
|
$
|
168,131
|
$
|
465,720
|
$
|
2,821,726
|
||||||||
|
Commercial loans:
|
||||||||||||||||
|
Construction loans
|
111,664
|
3,737
|
99,376
|
214,777
|
||||||||||||
|
Commercial mortgage loans
|
1,725,325
|
65,312
|
526,446
|
2,317,083
|
||||||||||||
|
Commercial and Industrial loans
|
2,130,368
|
119,040
|
924,824
|
3,174,232
|
||||||||||||
|
Commercial loans
|
3,967,357
|
188,089
|
1,550,646
|
5,706,092
|
||||||||||||
|
Finance leases
|
856,815
|
-
|
-
|
856,815
|
||||||||||||
|
Consumer loans
|
2,726,457
|
68,498
|
5,895
|
2,800,850
|
||||||||||||
|
Loans held for investment
|
9,738,504
|
424,718
|
2,022,261
|
12,185,483
|
||||||||||||
|
Loans held for sale
|
7,368
|
-
|
-
|
7,368
|
||||||||||||
|
Total loans
|
$
|
9,745,872
|
$
|
424,718
|
$
|
2,022,261
|
$
|
12,192,851
|
||||||||
|
As of June 30, 2024
|
||||||||||||||||
|
(In thousands)
|
Puerto Rico
|
Virgin Islands
|
United States
|
Total
|
||||||||||||
|
Nonaccrual loans held for investment:
|
||||||||||||||||
|
Residential mortgage
|
$
|
16,895
|
$
|
6,446
|
$
|
8,055
|
$
|
31,396
|
||||||||
|
Construction
|
3,776
|
966
|
-
|
4,742
|
||||||||||||
|
Commercial mortgage
|
2,865
|
8,871
|
-
|
11,736
|
||||||||||||
|
Commercial and Industrial
|
26,387
|
1,274
|
-
|
27,661
|
||||||||||||
|
Consumer and finance leases
|
20,276
|
326
|
36
|
20,638
|
||||||||||||
|
Total nonaccrual loans held for investment
|
70,199
|
17,883
|
8,091
|
96,173
|
||||||||||||
|
OREO
|
17,413
|
4,202
|
67
|
21,682
|
||||||||||||
|
Other repossessed property
|
7,330
|
183
|
-
|
7,513
|
||||||||||||
|
Other assets (1)
|
1,532
|
-
|
-
|
1,532
|
||||||||||||
|
Total non-performing assets (2)
|
$
|
96,474
|
$
|
22,268
|
$
|
8,158
|
$
|
126,900
|
||||||||
|
Past due loans 90 days and still accruing (3)
|
$
|
44,028
|
$
|
3,145
|
$
|
-
|
$
|
47,173
|
||||||||
|
As of March 31, 2024
|
||||||||||||||||
|
(In thousands)
|
Puerto Rico
|
Virgin Islands
|
United States
|
Total
|
||||||||||||
|
Nonaccrual loans held for investment:
|
||||||||||||||||
|
Residential mortgage
|
$
|
17,521
|
$
|
6,693
|
$
|
8,471
|
$
|
32,685
|
||||||||
|
Construction
|
531
|
967
|
-
|
1,498
|
||||||||||||
|
Commercial mortgage
|
3,037
|
8,939
|
-
|
11,976
|
||||||||||||
|
Commercial and Industrial
|
13,431
|
1,119
|
10,517
|
25,067
|
||||||||||||
|
Consumer and finance leases
|
21,503
|
203
|
33
|
21,739
|
||||||||||||
|
Total nonaccrual loans held for investment
|
56,023
|
17,921
|
19,021
|
92,965
|
||||||||||||
|
OREO
|
24,577
|
4,287
|
-
|
28,864
|
||||||||||||
|
Other repossessed property
|
5,916
|
287
|
23
|
6,226
|
||||||||||||
|
Other assets (1)
|
1,551
|
-
|
-
|
1,551
|
||||||||||||
|
Total non-performing assets (2)
|
$
|
88,067
|
$
|
22,495
|
$
|
19,044
|
$
|
129,606
|
||||||||
|
Past due loans 90 days and still accruing (3)
|
$
|
51,614
|
$
|
5,762
|
$
|
139
|
$
|
57,515
|
||||||||
|
As of December 31, 2023
|
||||||||||||||||
|
(In thousands)
|
Puerto Rico
|
Virgin Islands
|
United States
|
Total
|
||||||||||||
|
Nonaccrual loans held for investment:
|
||||||||||||||||
|
Residential mortgage
|
$
|
18,324
|
$
|
6,688
|
$
|
7,227
|
$
|
32,239
|
||||||||
|
Construction
|
595
|
974
|
-
|
1,569
|
||||||||||||
|
Commercial mortgage
|
3,106
|
9,099
|
-
|
12,205
|
||||||||||||
|
Commercial and Industrial
|
13,414
|
1,169
|
667
|
15,250
|
||||||||||||
|
Consumer and finance leases
|
21,954
|
419
|
71
|
22,444
|
||||||||||||
|
Total nonaccrual loans held for investment
|
57,393
|
18,349
|
7,965
|
83,707
|
||||||||||||
|
OREO
|
28,382
|
4,287
|
-
|
32,669
|
||||||||||||
|
Other repossessed property
|
7,857
|
252
|
6
|
8,115
|
||||||||||||
|
Other assets (1)
|
1,415
|
-
|
-
|
1,415
|
||||||||||||
|
Total non-performing assets (2)
|
$
|
95,047
|
$
|
22,888
|
$
|
7,971
|
$
|
125,906
|
||||||||
|
Past due loans 90 days and still accruing (3)
|
$
|
53,308
|
$
|
6,005
|
$
|
139
|
$
|
59,452
|
||||||||
| (1) |
Residential pass-through MBS issued by the PRHFA held as part of the available-for-sale debt securities portfolio.
|
| (2) |
Excludes PCD loans previously accounted for under ASC Subtopic 310-30 for which the Corporation made the accounting policy election of maintaining pools of loans as “units of account” both at the time of
adoption of CECL on January 1, 2020 and on an ongoing basis for credit loss measurement. These loans will continue to be excluded from nonaccrual loan statistics as long as the Corporation can reasonably estimate the timing and amount of
cash flows expected to be collected on the loan pools. The portion of such loans contractually past due 90 days or more amounted to $7.4 million as of June 30, 2024 (March 31, 2024 - $8.6 million; December 31, 2023 - $8.3 million).
|
| (3) |
These include rebooked loans, which were previously pooled into GNMA securities, amounting to $6.8 million as of June 30, 2024 (March 31, 2024 - $8.8 million; December 31, 2023 - $7.9 million). Under the
GNMA program, the Corporation has the option but not the obligation to repurchase loans that meet GNMA's specified delinquency criteria. For accounting purposes, the loans subject to the repurchase option are required to be reflected on
the financial statements with an offsetting liability.
|
|
Quarter Ended
|
Six-Month Period Ended
|
|||||||||||||||||||||
|
June 30,
|
March 31,
|
June 30,
|
June 30,
|
June 30,
|
||||||||||||||||||
|
2024
|
2024
|
2023
|
2024
|
2023
|
||||||||||||||||||
|
(Dollars in thousands)
|
||||||||||||||||||||||
|
Allowance for credit losses on loans and finance leases, beginning of period
|
$
|
263,592
|
$
|
261,843
|
$
|
265,567
|
$
|
261,843
|
$
|
260,464
|
||||||||||||
|
Impact of adoption of ASU 2022-02
|
-
|
-
|
-
|
-
|
2,116
|
|||||||||||||||||
|
Provision for credit losses on loans and finance leases expense
|
11,930
|
12,917
|
20,770
|
24,847
|
37,026
|
|||||||||||||||||
|
Net (charge-offs) recoveries of loans and finance leases:
|
||||||||||||||||||||||
|
Residential mortgage
|
(45
|
)
|
(244
|
)
|
(389
|
)
|
(289
|
)
|
(875
|
)
|
||||||||||||
|
Construction
|
14
|
10
|
371
|
24
|
434
|
|||||||||||||||||
|
Commercial mortgage
|
393
|
40
|
(32
|
)
|
433
|
118
|
||||||||||||||||
|
Commercial and Industrial
|
626
|
4,660
|
(6,218
|
)
|
5,286
|
(6,246
|
)
|
|||||||||||||||
|
Consumer loans and finance leases
|
(21,978
|
)
|
(15,634
|
)(1)
|
|
(13,011
|
)
|
(37,612
|
)(1)
|
|
(25,979
|
)
|
||||||||||
|
Net charge-offs
|
(20,990
|
)
|
(11,168
|
)(1)
|
|
(19,279
|
)
|
(32,158
|
)(1)
|
|
(32,548
|
)
|
||||||||||
|
Allowance for credit losses on loans and finance leases, end of period
|
$
|
254,532
|
$
|
263,592
|
$
|
267,058
|
$
|
254,532
|
$
|
267,058
|
||||||||||||
|
Allowance for credit losses on loans and finance leases to period end total
loans held for investment
|
2.06
|
%
|
2.14
|
%
|
2.28
|
%
|
2.06
|
%
|
2.28
|
%
|
||||||||||||
|
Net charge-offs (annualized) to average loans outstanding during the period
|
0.69
|
%
|
0.37
|
%
|
0.67
|
%
|
0.53
|
%
|
0.56
|
%
|
||||||||||||
|
Provision for credit losses on loans and finance leases to net charge-offs during the period
|
0.57
|
x
|
1.16
|
x
|
1.08
|
x
|
0.77
|
x
|
1.14
|
x
|
||||||||||||
| (1) |
For the quarter ended March 31, 2024 and six-month period ended June 30 2024, includes a recovery totaling $9.5 million associated with the aforementioned bulk sale of fully charged-off consumer loans.
|
|
Quarter Ended
|
Six-Month Period Ended
|
|||||||||||||||||||
|
June 30, 2024
|
March 31, 2024
|
June 30, 2023
|
June 30, 2024
|
June 30, 2023
|
||||||||||||||||
|
Residential mortgage
|
0.01
|
%
|
0.03
|
%
|
0.06
|
%
|
0.02
|
%
|
0.06
|
%
|
||||||||||
|
Construction
|
-0.02
|
%
|
-0.02
|
%
|
-0.99
|
%
|
-0.02
|
%
|
-0.59
|
%
|
||||||||||
|
Commercial mortgage
|
-0.07
|
%
|
-0.01
|
%
|
0.01
|
%
|
-0.04
|
%
|
-0.01
|
%
|
||||||||||
|
Commercial and Industrial
|
-0.08
|
%
|
-0.59
|
%
|
0.87
|
%
|
-0.33
|
%
|
0.44
|
%
|
||||||||||
|
Consumer loans and finance leases
|
2.38
|
%
|
1.70
|
%
|
(1)
|
1.51
|
%
|
2.04
|
%
|
(1)
|
1.53
|
%
|
||||||||
|
Total loans
|
0.69
|
%
|
0.37
|
%
|
(1)
|
0.67
|
%
|
0.53
|
%
|
(1)
|
0.56
|
%
|
||||||||
| (1) |
The $9.5 million recovery associated with the aforementioned bulk sale reduced the consumer loans and finance leases and total net charge-offs to related average loans ratio for the quarter ended March 31,
2024 by 104 basis points and 31 basis points, respectively, and for the six-month period ended June 30, 2024 by 52 basis points and 15 basis points, respectively.
|
|
As of
|
||||||||||||
|
June 30, 2024
|
March 31, 2024
|
December 31, 2023
|
||||||||||
|
(In thousands)
|
||||||||||||
|
Time deposits
|
$
|
3,037,120
|
$
|
2,961,526
|
$
|
2,833,730
|
||||||
|
Interest-bearing saving and checking accounts
|
7,461,003
|
7,511,973
|
7,534,800
|
|||||||||
|
Non-interest-bearing deposits
|
5,406,054
|
5,346,326
|
5,404,121
|
|||||||||
|
Total deposits, excluding brokered CDs (1)
|
15,904,177
|
15,819,825
|
15,772,651
|
|||||||||
|
Brokered CDs
|
624,779
|
725,686
|
783,334
|
|||||||||
|
Total deposits
|
$
|
16,528,956
|
$
|
16,545,511
|
$
|
16,555,985
|
||||||
|
Total deposits, excluding brokered CDs and government deposits
|
$
|
12,706,646
|
$
|
12,574,900
|
$
|
12,600,719
|
||||||
| (1) |
As of each of June 30, 2024, March 31, 2024 and December 31, 2023, government deposits amounted to $3.2 billion.
|