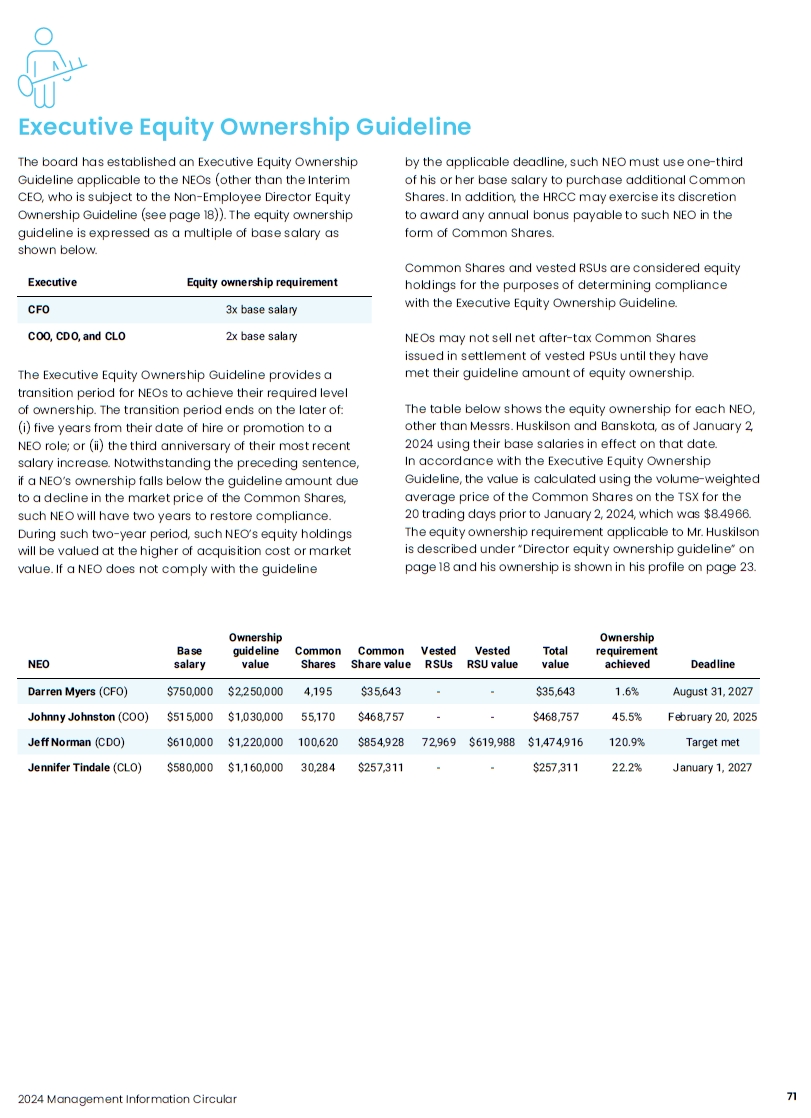
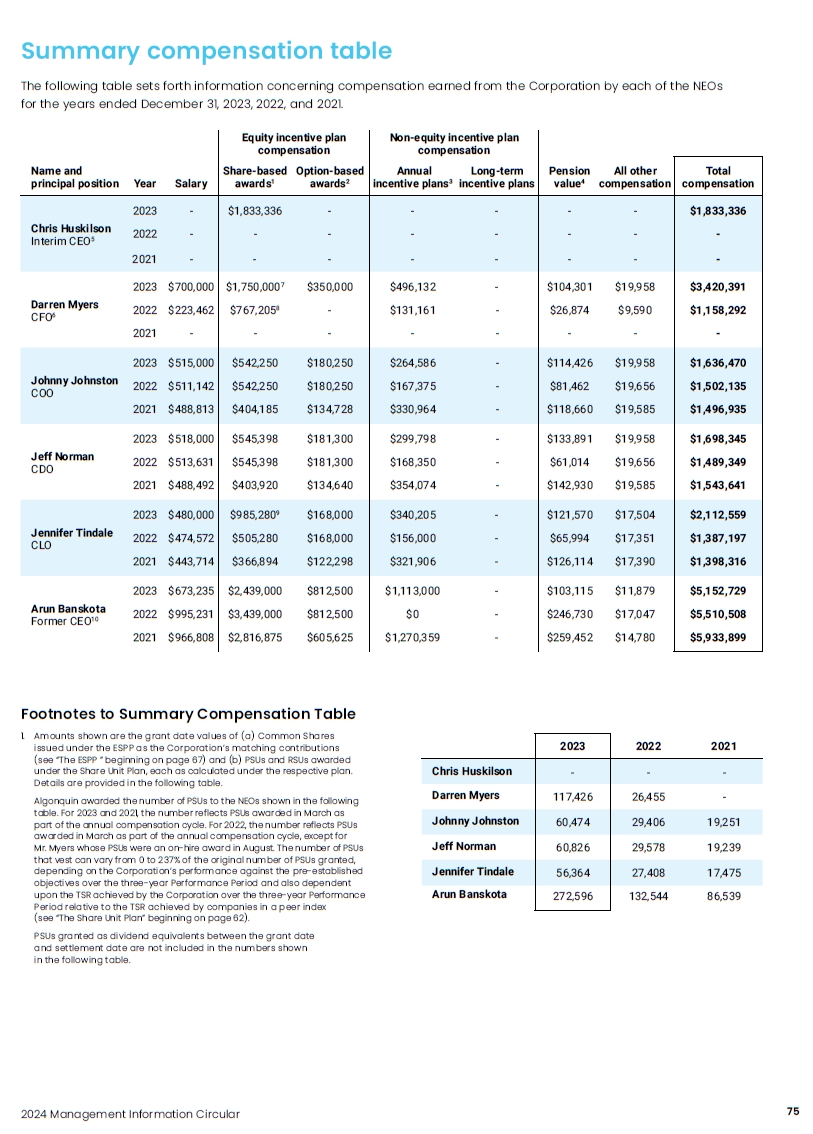
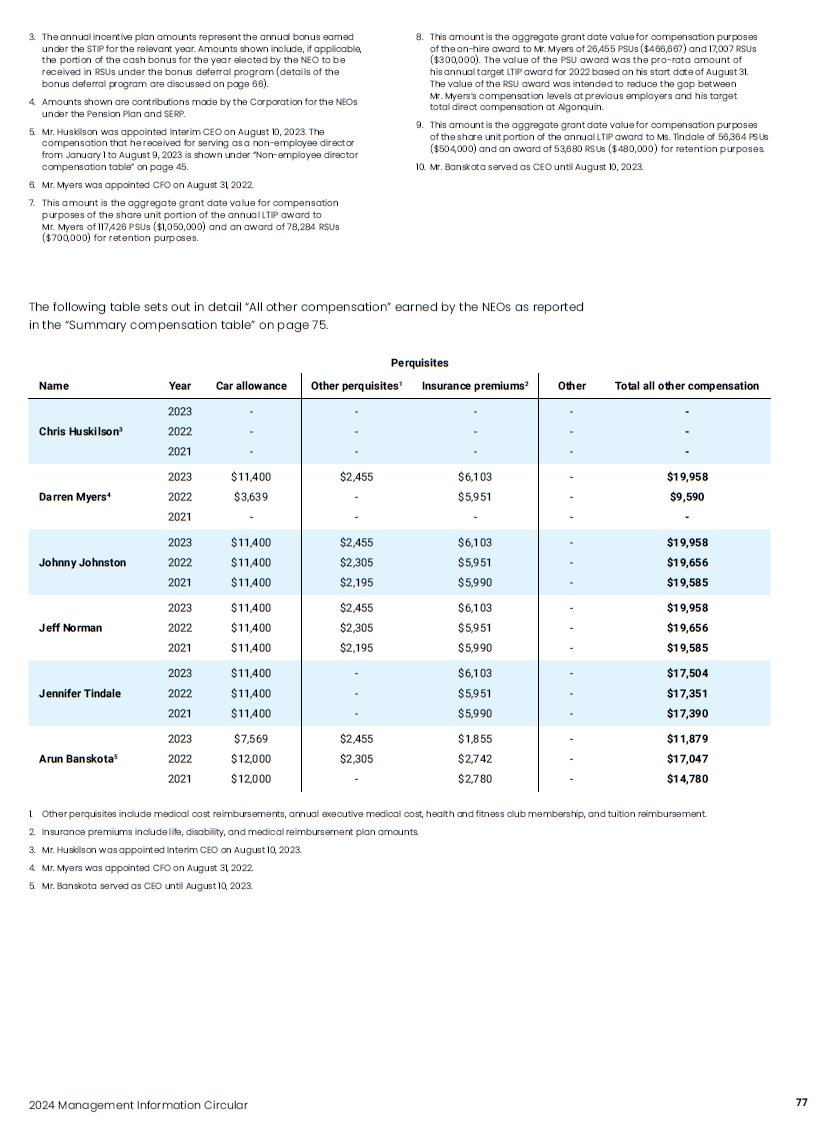
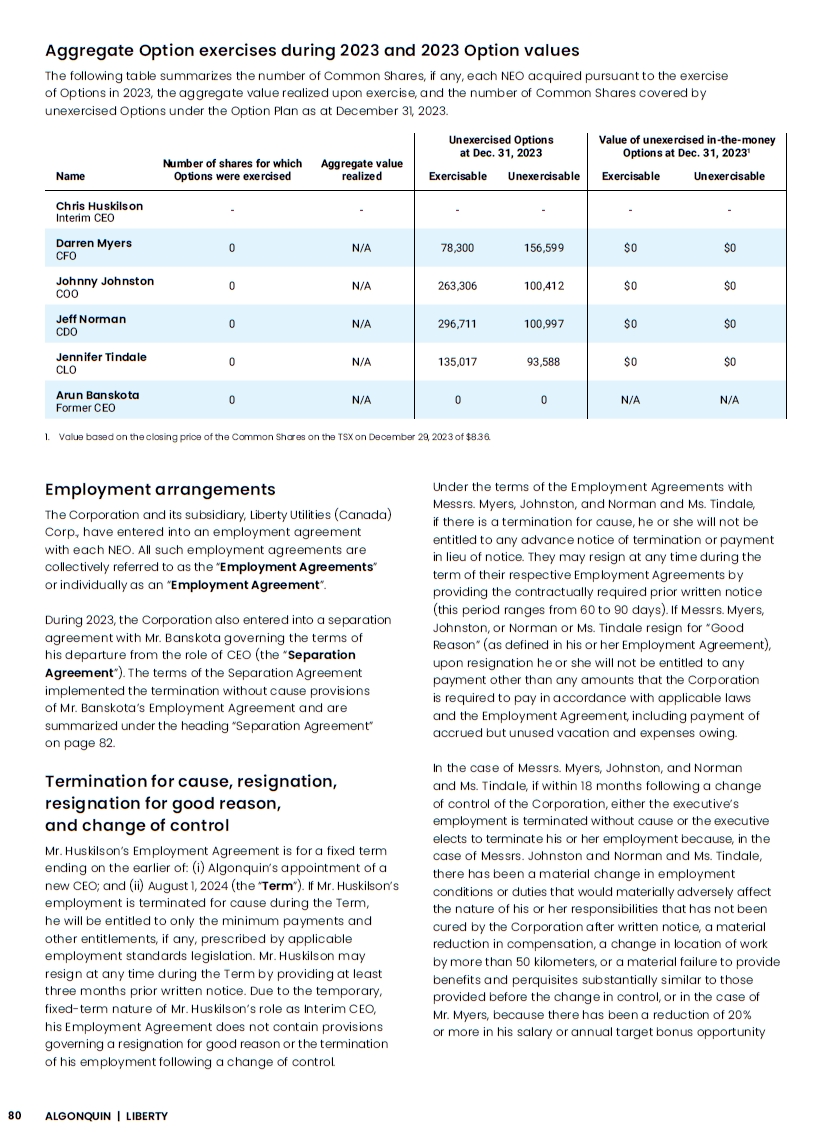
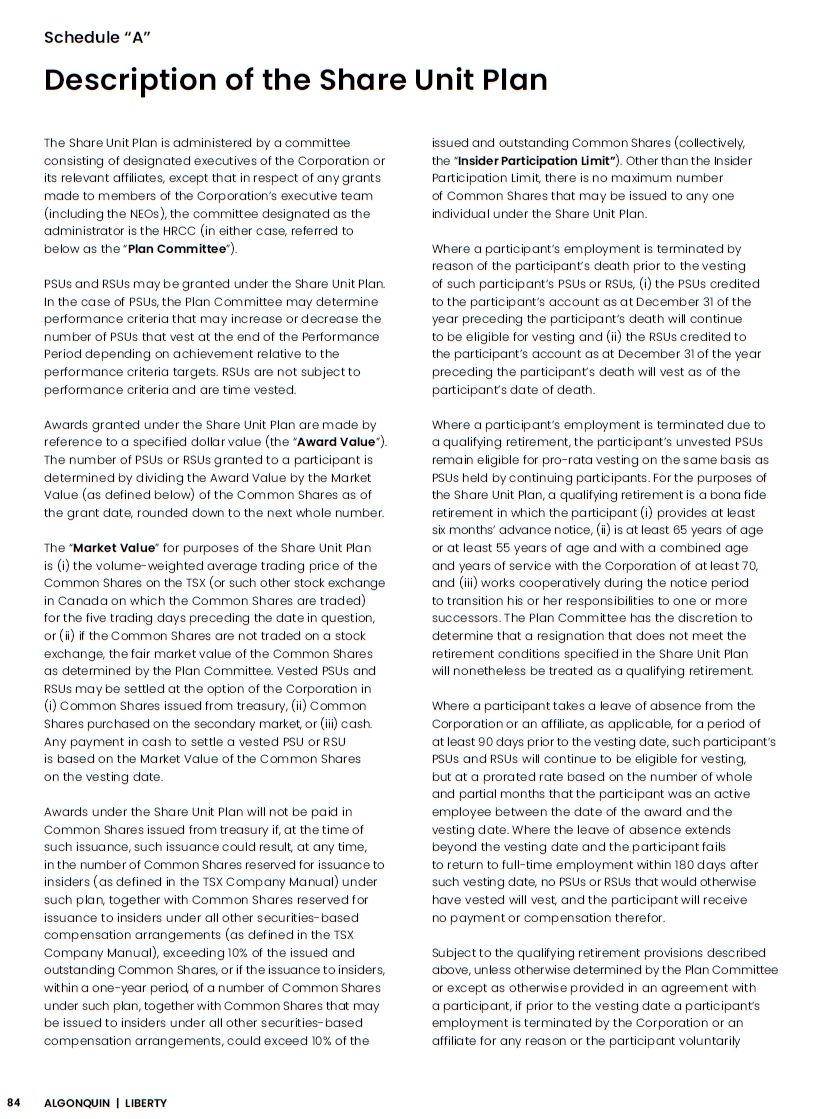
2024 Management Information Circular 75 Summary compensation table The
following table sets forth information concerning compensation earned from the Corporation by each of the NEOs for the years ended December 31, 2023, 2022, and 2021. Name and principal position Year Salary Equity incentive plan
compensation Share-based Option-based awards1 awards2 Non-equity incentive plan compensation Annual Long-term incentive plans3 incentive plans Pension value4 All other compensation Total compensation Chris Huskilson Interim
CEO5 2023 2022 2021 - - - $1,833,336 - - - - - - - - - - - - - - - - - $1,833,336 - - 2023 $700,000 $1,750,0007 $350,000 $496,132 - $104,301 $19,958 $3,420,391 Darren
Myers CFO6 2022 $223,462 $767,2058 - $131,161 - $26,874 $9,590 $1,158,292 2021 - - - - - - - - 2023 $515,000 $542,250 $180,250 $264,586 - $114,426 $19,958 $1,636,470 Johnny
Johnston COO 2022 $511,142 $542,250 $180,250 $167,375 - $81,462 $19,656 $1,502,135 2021 $488,813 $404,185 $134,728 $330,964 - $118,660 $19,585 $1,496,935 2023 $518,000 $545,398 $181,300 $299,798 - $133,891 $19,958 $1,698,345 Jeff
Norman CDO 2022 $513,631 $545,398 $181,300 $168,350 - $61,014 $19,656 $1,489,349 2021 $488,492 $403,920 $134,640 $354,074 - $142,930 $19,585 $1,543,641 2023 $480,000 $985,2809 $168,000 $340,205 - $121,570 $17,504 $2,112,559 Jennifer
Tindale CLO 2022 $474,572 $505,280 $168,000 $156,000 - $65,994 $17,351 $1,387,197 2021 $443,714 $366,894 $122,298 $321,906 - $126,114 $17,390 $1,398,316 2023 $673,235 $2,439,000 $812,500 $1,113,000 - $103,115 $11,879 $5,152,729 Arun
Banskota Former CEO10 2022 $995,231 $3,439,000 $812,500 $0 - $246,730 $17,047 $5,510,508 2021 $966,808 $2,816,875 $605,625 $1,270,359 - $259,452 $14,780 $5,933,899 Footnotes to Summary Compensation Table 1. Amounts shown
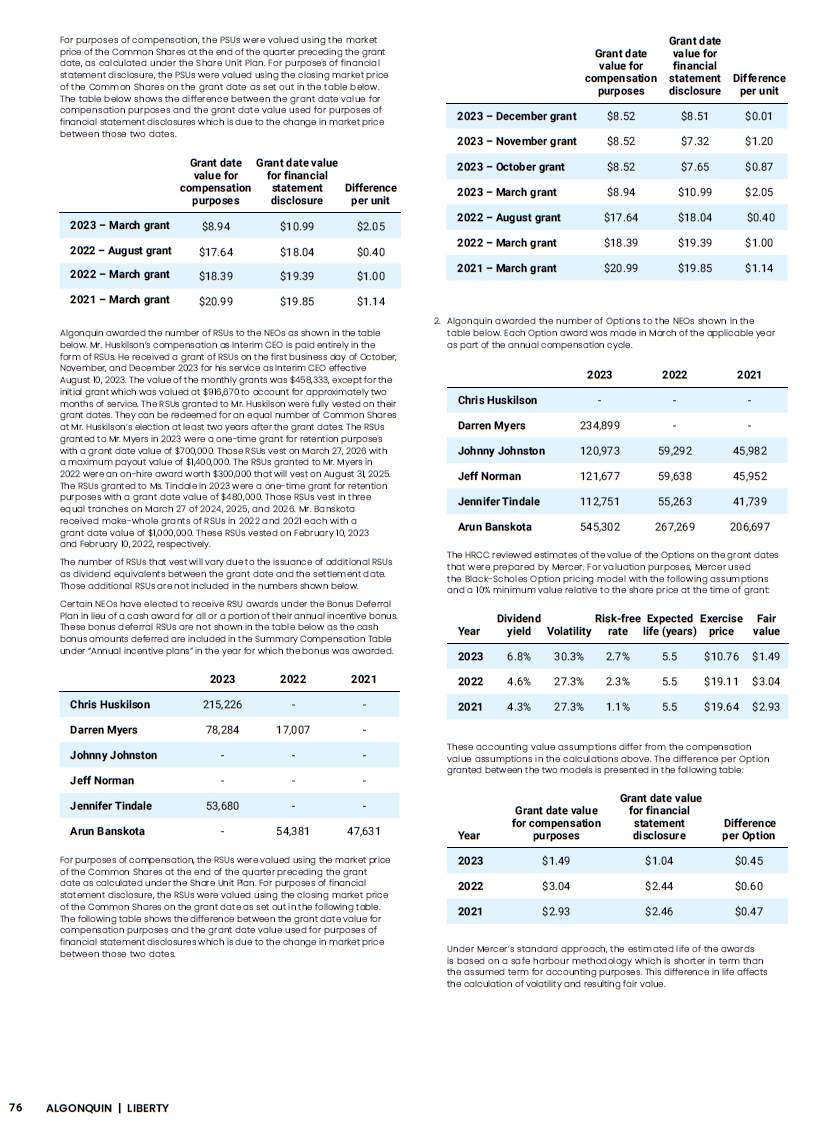
are the grant date values of (a) Common Shares issued under the ESPP as the Corporation’s matching contributions (see “The ESPP ” beginning on page 67) and (b) PSUs and RSUs awarded under the Share Unit Plan, each as calculated under the
respective plan. Details are provided in the following table. Algonquin awarded the number of PSUs to the NEOs shown in the following table. For 2023 and 2021, the number reflects PSUs awarded in March as part of the annual compensation cycle.
For 2022, the number reflects PSUs awarded in March as part of the annual compensation cycle, except for Mr. Myers whose PSUs were an on-hire award in August. The number of PSUs that vest can vary from 0 to 237% of the original number of PSUs
granted, depending on the Corporation’s performance against the pre-established objectives over the three-year Performance Period and also dependent upon the TSR achieved by the Corporation over the three-year Performance Period relative to the
TSR achieved by companies in a peer index (see “The Share Unit Plan” beginning on page 62). PSUs granted as dividend equivalents between the grant date and settlement date are not included in the numbers shown in the following
table. 2023 2022 2021 Chris Huskilson - - - Darren Myers 117,426 26,455 - Johnny Johnston 60,474 29,406 19,251 Jeff Norman 60,826 29,578 19,239 Jennifer Tindale 56,364 27,408 17,475 Arun
Banskota 272,596 132,544 86,539

