|
Wisconsin
|
001-07626
|
39-0561070
|
|
(State or other jurisdiction of incorporation)
|
(Commission File Number)
|
(IRS Employer Identification No.)
|
| ☐ |
Written communications pursuant to Rule 425 under the Securities Act (17 CFR 230.425)
|
| ☐ |
Soliciting material pursuant to Rule 14a-12 under the Exchange Act (17 CFR 240.14a-12)
|
| ☐ |
Pre-commencement communications pursuant to Rule 14d-2(b) under the Exchange Act (17 CFR 240.14d-2(b))
|
| ☐ |
Pre-commencement communications pursuant to Rule 13e-4(c) under the Exchange Act (17 CFR 240.13e-4(c))
|
|
Title of each class
|
Trading Symbol(s)
|
Name of each exchange on which registered
|
|
Common stock, par value $0.10 per share
|
SXT
|
New York Stock Exchange
|
| Item 2.02 |
Results of Operations and Financial Condition.
|
| Item 7.01 |
Regulation FD Disclosure.
|
| Item 9.01 |
Financial Statements and Exhibits.
|
|
|
(d) |
Exhibits. The following exhibits are furnished with this Current Report
on Form 8-K:
|
|
Exhibit
Number
|
Description
|
|
Sensient Technologies Corporation Earnings Press Release for the Quarter Ended March 31, 2024.
|
|
|
Sensient Technologies Corporation Investor Presentation – Q1 2024.
|
|
| 104 |
Cover Page Interactive Data File (embedded within the Inline XBRL document).
|
|
SENSIENT TECHNOLOGIES CORPORATION
|
|||
|
By:
|
/s/ John J. Manning
|
||
|
Name:
|
John J. Manning
|
||
|
Title:
|
Senior Vice President, General Counsel, and Secretary
|
||
|
Date:
|
April 26, 2024
|
||
|
|
Contact:
|
|
Amy Agallar
|
|
|
(414) 347-3706
|
|
|
investor.relations@sensient.com
|
|
|
• |
Reported revenue increased 4.2% to $384.7 million in the first quarter of 2024 versus last year’s first quarter results of $369.0 million. On a local currency basis(1), revenue increased
3.8%.
|
|
|
• |
Reported operating income decreased 2.8% to $49.4 million compared to $50.8 million recorded in the first quarter of 2023. In the first quarter of 2024, the Company recorded $2.8 million of costs
related to its recently enacted Portfolio Optimization Plan. Local currency adjusted operating income(1) and local currency adjusted EBITDA(1) increased 2.6% and 2.2%, respectively, in the first quarter.
|
|
|
• |
Reported diluted earnings per share decreased 8.8% to 73 cents in the first quarter of 2024 compared to 80 cents in the first quarter of 2023. Local currency adjusted EPS(1) decreased 1.3%
in the first quarter primarily as a result of higher interest expense and a higher tax rate.
|
| Sensient Technologies Corporation | Page 2 |
| Earnings Release – Quarter Ended March 31, 2024 | |
| April 26, 2024 |
|
Revenue
|
Reported
Quarter
|
Local Currency(1)
Quarter
|
||||||
|
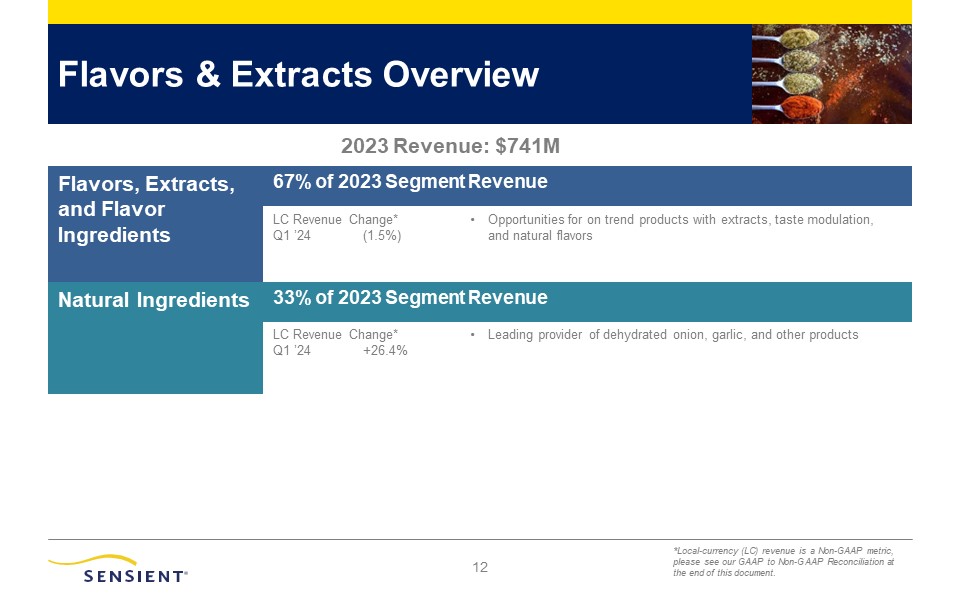
Flavors & Extracts
|
8.0
|
%
|
6.9
|
%
|
||||
|
Color
|
-0.7
|
%
|
-1.7
|
%
|
||||
|
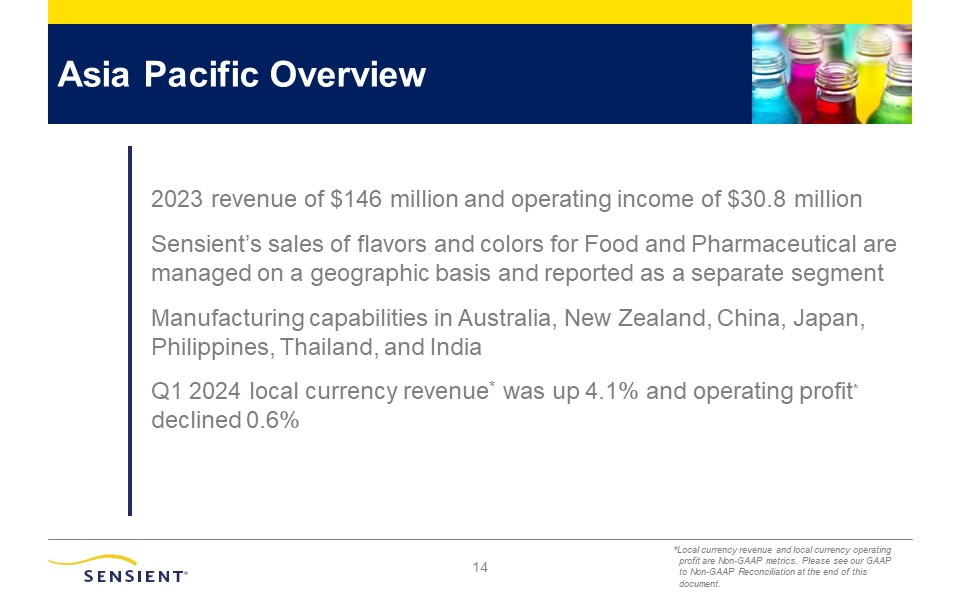
Asia Pacific
|
0.6
|
%
|
4.1
|
%
|
||||
|
Total Revenue
|
4.2
|
%
|
3.8
|
%
|
||||
|
Operating Income
|
Reported
Quarter
|
Adjusted Local Currency(1)
Quarter
|
||||||
|
Flavors & Extracts
|
6.8
|
% |
6.3
|
% | ||||
|
Color
|
-0.6
|
% |
-1.8
|
% | ||||
|
Asia Pacific
|
-5.0
|
% |
-0.6
|
% | ||||
|
Total Operating Income
|
-2.8
|
% |
2.6
|
% | ||||
| Sensient Technologies Corporation | Page 3 |
| Earnings Release – Quarter Ended March 31, 2024 | |
| April 26, 2024 |
| Sensient Technologies Corporation | Page 4 |
| Earnings Release – Quarter Ended March 31, 2024 | |
| April 26, 2024 |
| (1) |
Please refer to “Reconciliation of Non-GAAP Amounts” at the end of this release for more information regarding our non-GAAP
financial measures.
|
| Sensient Technologies Corporation | Page 5 |
| Earnings Release – Quarter Ended March 31, 2024 | |
| April 26, 2024 |
| Sensient Technologies Corporation | Page 6 |
| Earnings Release – Quarter Ended March 31, 2024 | |
| April 26, 2024 |
|
Consolidated Statements of Earnings
|
Three Months Ended March 31,
|
|||||||||||
|
2024
|
2023
|
% Change
|
||||||||||
|
Revenue
|
$
|
384,670
|
$
|
369,006
|
4.2
|
%
|
||||||
|
Cost of products sold
|
258,121
|
244,343
|
5.6
|
%
|
||||||||
|
Selling and administrative expenses
|
77,143
|
73,825
|
4.5
|
%
|
||||||||
|
Operating income
|
49,406
|
50,838
|
(2.8
|
%)
|
||||||||
|
Interest expense
|
7,045
|
6,002
|
||||||||||
|
Earnings before income taxes
|
42,361
|
44,836
|
||||||||||
|
Income taxes
|
11,421
|
11,185
|
||||||||||
|
Net earnings
|
$
|
30,940
|
$
|
33,651
|
(8.1
|
%)
|
||||||
|
Earnings per share of common stock:
|
||||||||||||
|
Basic
|
$
|
0.73
|
$
|
0.80
|
||||||||
|
Diluted
|
$
|
0.73
|
$
|
0.80
|
||||||||
|
Average common shares outstanding:
|
||||||||||||
|
Basic
|
42,104
|
41,970
|
||||||||||
|
Diluted
|
42,305
|
42,255
|
||||||||||
|
Results by Segment
|
Three Months Ended March 31,
|
|||||||||||
|
Revenue
|
2024
|
2023
|
% Change
|
|||||||||
|
Flavors & Extracts
|
$
|
193,092
|
$
|
178,852
|
8.0
|
%
|
||||||
|
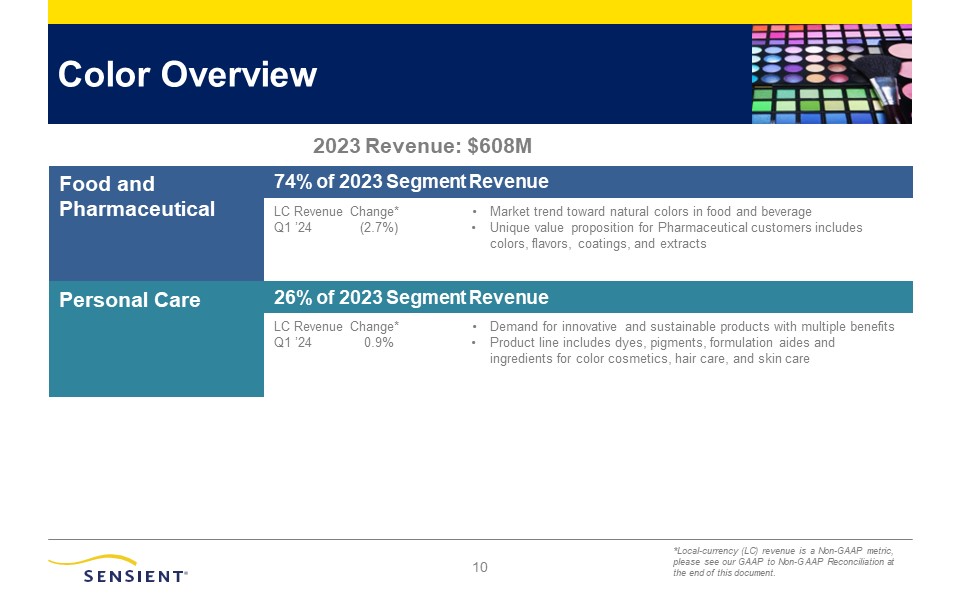
Color
|
160,025
|
161,161
|
(0.7
|
%)
|
||||||||
|
Asia Pacific
|
40,306
|
40,085
|
0.6
|
%
|
||||||||
|
Intersegment elimination
|
(8,753
|
)
|
(11,092
|
)
|
||||||||
|
Consolidated
|
$
|
384,670
|
$
|
369,006
|
4.2
|
%
|
||||||
|
Operating Income
|
||||||||||||
|
Flavors & Extracts
|
$
|
23,678
|
$
|
22,180
|
6.8
|
%
|
||||||
|
Color
|
31,679
|
31,885
|
(0.6
|
%)
|
||||||||
|
Asia Pacific
|
8,776
|
9,241
|
(5.0
|
%)
|
||||||||
|
Corporate & Other
|
(14,727
|
)
|
(12,468
|
)
|
||||||||
|
Consolidated
|
$
|
49,406
|
$
|
50,838
|
(2.8
|
%)
|
||||||
|
Consolidated Condensed Balance Sheets
|
March 31,
2024
|
December 31,
2023
|
||||||
|
Cash and cash equivalents
|
$
|
25,417
|
$
|
28,934
|
||||
|
Trade accounts receivable
|
298,488
|
272,164
|
||||||
|
Inventories
|
568,547
|
598,399
|
||||||
|
Prepaid expenses and other current assets
|
50,391
|
37,119
|
||||||
|
Total Current Assets
|
942,843
|
936,616
|
||||||
|
Goodwill & intangible assets (net)
|
432,247
|
436,177
|
||||||
|
Property, plant, and equipment (net)
|
498,188
|
505,277
|
||||||
|
Other assets
|
132,404
|
136,437
|
||||||
|
Total Assets
|
$
|
2,005,682
|
$
|
2,014,507
|
||||
|
Trade accounts payable
|
$
|
104,834
|
$
|
131,114
|
||||
|
Short-term borrowings
|
19,439
|
13,460
|
||||||
|
Other current liabilities
|
94,586
|
91,732
|
||||||
|
Total Current Liabilities
|
218,859
|
236,306
|
||||||
|
Long-term debt
|
643,511
|
645,085
|
||||||
|
Accrued employee and retiree benefits
|
28,276
|
27,715
|
||||||
|
Other liabilities
|
51,100
|
52,077
|
||||||
|
Shareholders’ Equity
|
1,063,936
|
1,053,324
|
||||||
|
Total Liabilities and Shareholders’ Equity
|
$
|
2,005,682
|
$
|
2,014,507
|
||||
|
Consolidated Statements of Cash Flows
|
||||||||
|
Three Months Ended March 31,
|
||||||||
|
2024
|
2023
|
|||||||
|
Cash flows from operating activities:
|
||||||||
|
Net earnings
|
$
|
30,940
|
$
|
33,651
|
||||
|
Adjustments to arrive at net cash provided by operating activities:
|
||||||||
|
Depreciation and amortization
|
14,709
|
14,150
|
||||||
|
Share-based compensation expense
|
1,995
|
2,267
|
||||||
|
Net loss (gain) on assets
|
(193
|
)
|
8
|
|||||
|
Portfolio Optimization Plan costs
|
1,189
|
-
|
||||||
|
Deferred income taxes
|
(4
|
)
|
(2,351
|
)
|
||||
|
Changes in operating assets and liabilities:
|
||||||||
|
Trade accounts receivable
|
(28,331
|
)
|
(7,142
|
)
|
||||
|
Inventories
|
26,624
|
(4,374
|
)
|
|||||
|
Prepaid expenses and other assets
|
(13,655
|
)
|
(2,062
|
)
|
||||
|
Trade accounts payable and other accrued expenses
|
(21,993
|
)
|
(19,251
|
)
|
||||
|
Accrued salaries, wages, and withholdings
|
29
|
(21,187
|
)
|
|||||
|
Income taxes
|
3,150
|
2,548
|
||||||
|
Other liabilities
|
674
|
698
|
||||||
|
Net cash provided by (used in) operating activities
|
15,134
|
(3,045
|
)
|
|||||
|
Cash flows from investing activities:
|
||||||||
|
Acquisition of property, plant, and equipment
|
(11,030
|
)
|
(22,278
|
)
|
||||
|
Proceeds from sale of assets
|
93
|
1
|
||||||
|
Other investing activities
|
(1
|
)
|
(602
|
)
|
||||
|
Net cash used in investing activities
|
(10,938
|
)
|
(22,879
|
)
|
||||
|
Cash flows from financing activities:
|
||||||||
|
Proceeds from additional borrowings
|
38,053
|
50,827
|
||||||
|
Debt payments
|
(27,031
|
)
|
(1,351
|
)
|
||||
|
Dividends paid
|
(17,312
|
)
|
(17,255
|
)
|
||||
|
Other financing activities
|
(2,828
|
)
|
(7,669
|
)
|
||||
|
Net cash (used in) provided by financing activities
|
(9,118
|
)
|
24,552
|
|||||
|
Effect of exchange rate changes on cash and cash equivalents
|
1,405
|
4,468
|
||||||
|
Net (decrease) increase in cash and cash equivalents
|
(3,517
|
)
|
3,096
|
|||||
|
Cash and cash equivalents at beginning of period
|
28,934
|
20,921
|
||||||
|
Cash and cash equivalents at end of period
|
$
|
25,417
|
$
|
24,017
|
||||
|
Supplemental Information
|
||||||||
|
Three Months Ended March 31,
|
2024
|
2023
|
||||||
|
Dividends paid per share
|
$
|
0.41
|
$
|
0.41
|
||||
|
Three Months Ended March 31,
|
||||||||||||
|
2024
|
2023
|
% Change
|
||||||||||
|
Operating income (GAAP)
|
$
|
49,406
|
$
|
50,838
|
(2.8
|
%)
|
||||||
|
Portfolio Optimization Plan costs – Cost of products sold
|
107
|
-
|
||||||||||
|
Portfolio Optimization Plan costs – Selling and administrative
|
||||||||||||
|
expenses
|
2,705
|
-
|
||||||||||
|
Adjusted operating income
|
$
|
52,218
|
$
|
50,838
|
2.7
|
%
|
||||||
|
Net earnings (GAAP)
|
$
|
30,940
|
$
|
33,651
|
(8.1
|
%)
|
||||||
|
Portfolio Optimization Plan costs, before tax
|
2,812
|
-
|
||||||||||
|
Tax impact of Portfolio Optimization Plan costs(1)
|
(355
|
)
|
-
|
|||||||||
|
Adjusted net earnings
|
$
|
33,397
|
$
|
33,651
|
(0.8
|
%)
|
||||||
|
Diluted earnings per share (GAAP)
|
$
|
0.73
|
$
|
0.80
|
(8.8
|
%)
|
||||||
|
Portfolio Optimization Plan costs, net of tax
|
0.06
|
-
|
||||||||||
|
Adjusted diluted earnings per share
|
$
|
0.79
|
$
|
0.80
|
(1.3
|
%)
|
||||||
| (1) |
Tax impact adjustments were determined based on the nature of the underlying non-GAAP adjustments and their relevant jurisdictional tax rates.
|
|
Results by Segment
|
Three Months Ended March 31,
|
|||||||||||||||||||||||
|
Operating Income
|
2024
|
Adjustments(2)
|
Adjusted
2024
|
2023
|
Adjustments(2)
|
Adjusted
2023
|
||||||||||||||||||
|
Flavors & Extracts
|
$
|
23,678
|
$
|
-
|
$
|
23,678
|
$
|
22,180
|
$
|
-
|
$
|
22,180
|
||||||||||||
|
Color
|
31,679
|
-
|
31,679
|
31,885
|
-
|
31,885
|
||||||||||||||||||
|
Asia Pacific
|
8,776
|
-
|
8,776
|
9,241
|
-
|
9,241
|
||||||||||||||||||
|
Corporate & Other
|
(14,727
|
)
|
2,812
|
(11,915
|
)
|
(12,468
|
)
|
-
|
(12,468
|
)
|
||||||||||||||
|
Consolidated
|
$
|
49,406
|
$
|
2,812
|
$
|
52,218
|
$
|
50,838
|
$
|
-
|
$
|
50,838
|
||||||||||||
| (2) |
Adjustments consist of Portfolio Optimization Plan costs.
|
|
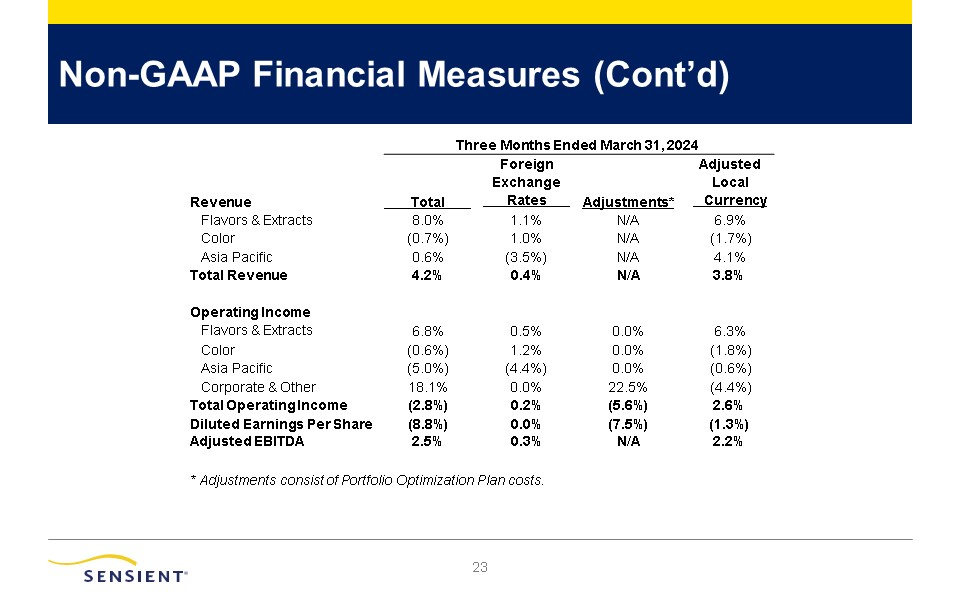
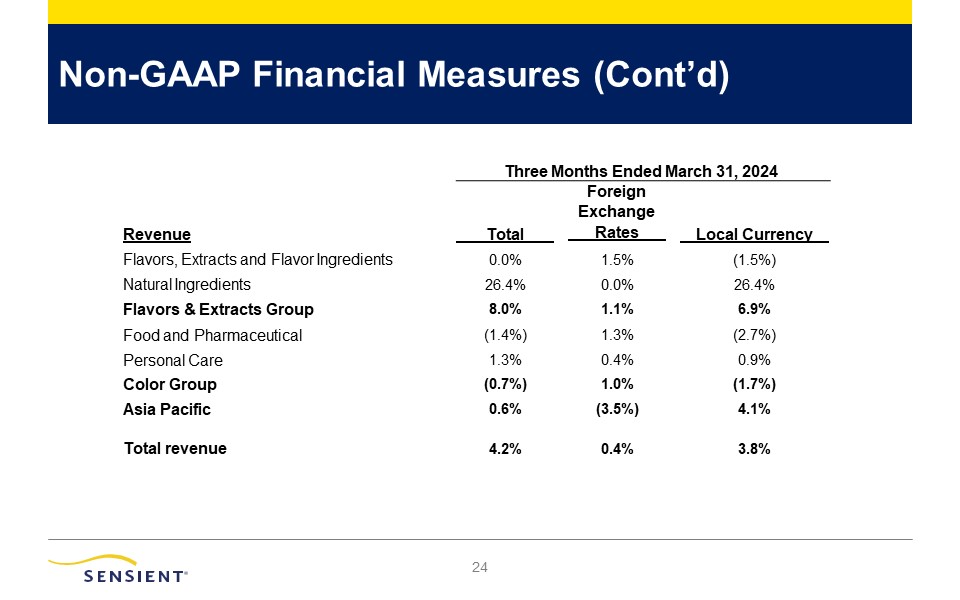
Three Months Ended March 31,
|
||||||||||||||||
|
Revenue
|
Total
|
Foreign
Exchange
Rates
|
Adjustments(3)
|
Adjusted
Local
Currency
|
||||||||||||
|
Flavors & Extracts
|
8.0
|
%
|
1.1
|
%
|
N/A
|
6.9
|
%
|
|||||||||
|
Color
|
(0.7
|
%)
|
1.0
|
%
|
N/A
|
(1.7
|
%)
|
|||||||||
|
Asia Pacific
|
0.6
|
%
|
(3.5
|
%)
|
N/A
|
4.1
|
%
|
|||||||||
|
Total Revenue
|
4.2
|
%
|
0.4
|
%
|
N/A
|
3.8
|
%
|
|||||||||
|
Operating Income
|
||||||||||||||||
|
Flavors & Extracts
|
6.8
|
%
|
0.5
|
%
|
0.0
|
%
|
6.3
|
%
|
||||||||
|
Color
|
(0.6
|
%)
|
1.2
|
%
|
0.0
|
%
|
(1.8
|
%)
|
||||||||
|
Asia Pacific
|
(5.0
|
%)
|
(4.4
|
%)
|
0.0
|
%
|
(0.6
|
%)
|
||||||||
|
Corporate & Other
|
18.1
|
%
|
0.0
|
%
|
22.5
|
%
|
(4.4
|
%)
|
||||||||
|
Total Operating Income
|
(2.8
|
%)
|
0.2
|
%
|
(5.6
|
%)
|
2.6
|
%
|
||||||||
|
Diluted Earnings Per Share
|
(8.8
|
%)
|
0.0
|
%
|
(7.5
|
%)
|
(1.3
|
%)
|
||||||||
|
Adjusted EBITDA
|
2.5
|
%
|
0.3
|
%
|
N/A
|
2.2
|
%
|
|||||||||
| (3) |
Adjustments consist of Portfolio Optimization Plan costs.
|
|
Three Months Ended March 31,
|
||||||||||||
|
2024
|
2023
|
% Change
|
||||||||||
|
Operating income (GAAP)
|
$
|
49,406
|
$
|
50,838
|
(2.8
|
%)
|
||||||
|
Depreciation and amortization
|
14,709
|
14,150
|
||||||||||
|
Share-based compensation expense
|
1,995
|
2,267
|
||||||||||
|
Portfolio Optimization Plan costs, before tax
|
2,812
|
-
|
||||||||||
|
Adjusted EBITDA
|
$
|
68,922
|
$
|
67,255
|
2.5
|
%
|
||||||
|
March 31,
|
||||||||
|
Debt
|
2024
|
2023
|
||||||
|
Short-term borrowings
|
$
|
19,439
|
$
|
24,849
|
||||
|
Long-term debt
|
643,511
|
679,779
|
||||||
|
Credit Agreement adjustments(1)
|
(13,775
|
)
|
(11,525
|
)
|
||||
|
Net Debt
|
$
|
649,175
|
$
|
693,103
|
||||
|
Operating income (GAAP)
|
$
|
153,591
|
$
|
194,800
|
||||
|
Depreciation and amortization
|
58,379
|
53,561
|
||||||
|
Share-based compensation expense
|
8,661
|
14,242
|
||||||
|
Portfolio Optimization Plan costs, before tax
|
30,653
|
-
|
||||||
|
Other non-operating gains(2)
|
(1,055
|
)
|
(3,359
|
)
|
||||
|
Credit Adjusted EBITDA
|
$
|
250,229
|
$
|
259,244
|
||||
|
Net Debt to Credit Adjusted EBITDA
|
2.6
|
x
|
2.7
|
x
|
||||
|
(1)
|
Adjustments include cash and cash equivalents, as described in the Company’s Third Amended and Restated Credit Agreement (Credit Agreement),
and certain letters of credit and hedge contracts.
|
|
(2)
|
Adjustments consist of certain financing transaction costs, certain non-financing interest items, and gains and losses related to certain
non-cash, non-operating, and/or non-recurring items as described in the Credit Agreement.
|
|
Twelve Months Ended December 31,
|
||||
|
2023
|
||||
|
Diluted earnings per share (GAAP)
|
$
|
2.21
|
||
|
Portfolio Optimization Plan costs, net of tax
|
0.65
|
|||
|
Adjusted diluted earnings per share
|
$
|
2.86
|
||