|
Ohio
|
31-1359191
|
|
(State of incorporation)
|
(I.R.S. Employer Identification No.)
|
|
420 Third Avenue,
Gallipolis, Ohio
|
45631
|
|
(Address of principal executive offices)
|
(ZIP Code)
|
|
Title of each class
|
Trading Symbol
|
Name of each exchange on which registered
|
|
Common Shares, without par value
|
OVBC
|
The NASDAQ Stock Market LLC
(The NASDAQ Global Market)
|
|
Large accelerated filer □
|
Accelerated filer □
|
|
|
Non-accelerated filer ☑
|
Smaller reporting company ☑
|
|
|
Emerging growth company ☐
|
|
(1)
|
Portions of the 2023 Annual Report to Shareholders of Ohio Valley Banc Corp. (Exhibit 13) are incorporated by
reference into Part I, Items 1 and 2 and Part II, Items 5, 6, 7, 7A, 8 and 9A.
|
|
(2)
|
Portions of the Proxy Statement for the Annual Meeting of Shareholders to be held on May 15, 2024, are
incorporated by reference into Part III, Items 10, 11, 12, 13 and 14.
|
|
•
|
acquire direct or indirect ownership or control of more than 5% of the voting shares of any bank that is not already majority-owned by it;
|
|
•
|
acquire all or substantially all of the assets of another bank or bank holding company; or
|
|
•
|
merge or consolidate with any other bank holding company.
|
|
•
|
Community Reinvestment Act of 1977: imposes a continuing and affirmative obligation to fulfill the credit needs of its
entire community, including low- and moderate-income neighborhoods.
|
|
•
|
Equal Credit Opportunity Act: prohibits discrimination in any credit transaction on the basis of any of various
criteria.
|
|
•
|
Truth in Lending Act: requires that credit terms are disclosed in a manner that permits a consumer to understand and
compare credit terms more readily and knowledgeably.
|
|
•
|
Fair Housing Act: makes it unlawful for a lender to discriminate in its housing-related lending activities against any
person on the basis of any of certain criteria.
|
|
•
|
Home Mortgage Disclosure Act: requires financial institutions to collect data that enables regulatory agencies to
determine whether the financial institutions are serving the housing credit needs of the communities in which they are located.
|
|
•
|
Real Estate Settlement Procedures Act: requires that lenders provide borrowers with disclosures regarding the nature and
cost of real estate settlements and prohibits abusive practices that increase borrowers’ costs.
|
|
•
|
Privacy provisions of the Gramm-Leach-Bliley Act: requires financial institutions to establish policies and procedures to
restrict the sharing of non-public customer data with non-affiliated parties and to protect customer information from unauthorized access.
|
| A. & B |
The average balance sheet information and the related analysis of net interest earnings for the years ended December 31, 2023 and 2022 are incorporated herein by reference to the information appearing under the caption “Table I – Consolidated Average Balance Sheet & Analysis of Net Interest Income,” within “Management’s Discussion and Analysis of Financial Condition and Results of Operations” located in Ohio Valley’s 2023 Annual Report to Shareholders. |
|
|
C. |
Tables setting forth the effect of volume and rate changes on interest income and expense for the years ended December 31, 2023 and 2022 are incorporated herein by
reference to the information appearing under the caption “Table II - Rate Volume Analysis of Changes in Interest Income & Expense,” within “Management’s Discussion and Analysis of Financial Condition and Results of Operations” located
in Ohio Valley’s 2023 Annual Report to Shareholders.
|
|
|
A. |
Information required by this item is incorporated herein by reference to the information appearing under the caption “Table III - Securities,” within “Management’s
Discussion and Analysis of Financial Condition and Results of Operations” located in Ohio Valley’s 2023 Annual Report to Shareholders
|
|
|
B. |
Excluding obligations of the United States Government and its agencies, no concentration of securities exists of any issuer that is greater than 10% of shareholders’
equity of Ohio Valley.
|
| A. | Maturities and Sensitivities of Loans to Changes in Interest Rates - Information required by this item is incorporated herein by reference to the information appearing under the caption “Table V - Maturity and Repricing Data of Loans,” within “Management’s Discussion and Analysis of Financial Condition and Results of Operations” located in Ohio Valley’s 2023 Annual Report to Shareholders. |
| A. & B |
Discussion of factors that influenced management in determining the amount of additions charged to provision expense is incorporated herein by reference to the information appearing under the captions “Provision Expense” and “Allowance for Credit Losses” within “Management’s Discussion and Analysis of Financial Condition and Results of Operations” located in Ohio Valley’s 2023 Annual Report to Shareholders. |
|
|
A. |
Deposit Summary - Information required by this item is incorporated herein by reference to the information appearing under the caption “Table I - Consolidated Average
Balance Sheet & Analysis of Net Interest Income,” within “Management’s Discussion and Analysis of Financial Condition and Results of Operations” located in Ohio Valley’s 2023 Annual Report to Shareholders.
|
| C & D |
Foreign Deposits - There were no foreign deposits outstanding at December 31, 2023 or 2022. |
|
|
E. |
Uninsured Deposits – Uninsured deposits were estimated at $366,649 and $254,993 at December 31, 2023 and December 31, 2022, respectively.
|
|
|
F. |
Schedule of Maturities - The following table provides the uninsured portion of time deposits at December 31, 2023, with a maturity of:
|
|
December 31, 2023
|
Over
|
Over
|
||||||||||||||
|
(dollars in thousands)
|
3 months
|
3 through
|
6 through
|
Over
|
||||||||||||
|
or less
|
6 months
|
12 months
|
12 months
|
|||||||||||||
|
Total uninsured time deposits
|
$
|
36,254
|
$
|
7,466
|
$
|
18,906
|
$
|
15,174
|
||||||||
|
•
|
the time and costs associated with identifying and evaluating potential acquisitions or new products or services;
|
|
•
|
the potential inaccuracy of estimates and judgments used to evaluate credit, operations, management and market risk with
respect to the target institutions;
|
|
•
|
the time and costs of evaluating new markets, hiring local management and opening new offices, and the delay between
commencing these activities and the generation of profits from the expansion;
|
|
•
|
our ability to finance an acquisition or other expansion and the possible dilution to our existing shareholders;
|
|
•
|
the diversion of management’s attention to the negotiation of a transaction and the integration of the operations and
personnel of the combining businesses;
|
|
•
|
entry into unfamiliar markets;
|
|
•
|
the possible failure of the introduction of new products and services into our existing business;
|
|
•
|
the incurrence and possible impairment of goodwill associated with an acquisition and possible adverse short-term effects
on our results of operations; and
|
|
•
|
the risk of loss of key employees and customers.
|
|
•
|
Maintaining policies and procedures regarding security operations and governance through the implementation of the Company’s Information
Security Program;
|
|
•
|
Implementing multi-layered controls to avoid reliance on single controls;
|
|
•
|
Utilizing both preventative and detective tools to monitor and block suspicious activity and to alert us of potential threats;
|
|
•
|
Keeping abreast of new technology and evaluating tools to help respond to threats to cybersecurity in an efficient and effective manner;
|
|
•
|
Collaborating with third-party cybersecurity consultants that perform regular penetration testing, vulnerability assessments, and other
procedures to identify potential weaknesses in our systems and processes;
|
|
•
|
Utilizing a third-party risk management program for purposes of identifying, assessing, and managing risks involved with external service
providers;
|
|
•
|
Conducting thorough due diligence concerning our third-party service providers, including evaluating their cybersecurity practices; and
|
|
•
|
Providing regular cybersecurity training for both our employees and our Board of Directors.
|
|
•
|
Identify and analyze cybersecurity risks;
|
|
•
|
Provide the Company with direction on effectively managing such risks;
|
|
•
|
Approve information security plans, policies, and programs;
|
|
•
|
Assess whether the Company’s current security programs are effective; and
|
|
•
|
Provide recommendations for corrective action.
|
|
(a)
|
None.
|
|
(b)
|
None.
|
|
Exhibit Number
|
Exhibit Description
|
|
|
3.1
|
||
|
3.2
|
||
|
4.1
|
||
|
4.2
|
||
|
10.1*
|
||
|
10.2*
|
||
|
10.3(a)*
|
||
|
10.3(b)*
|
||
|
10.4(a)*
|
||
|
|
|
Exhibit Number
|
Exhibit Description
|
|
|
10.4(b)*
|
||
|
10.5(a)*
|
||
|
10.5(b)*
|
||
|
10.5(c)*
|
||
|
10.5(d)*
|
||
|
10.6(a)*
|
||
|
10.6(b)*
|
||
|
10.6(c)*
|
|
Exhibit Number
|
Exhibit Description
|
|
|
10.6(d)*
|
||
|
10.6(e)*
|
||
|
10.6(f)*
|
||
|
10.6(g)*
|
||
|
10.7*
|
||
|
10.8*
|
Summary
of Bonus Program of Ohio Valley Banc Corp.: Filed herewith.
|
|
|
10.9*
|
||
|
10.10*
|
||
|
10.11*
|
|
Exhibit Number
|
Exhibit Description
|
|
|
10.12*
|
||
|
10.13*
|
||
|
10.14*
|
||
|
10.15*
|
||
|
10.16*
|
||
|
10.17*
|
||
|
10.18*
|
||
|
10.19(a)*
|
|
Exhibit Number
|
Exhibit Description
|
|
|
10.19(b)*
|
||
|
10.20(a)*
|
||
|
10.20(b)*
|
||
|
13
|
Ohio
Valley’s Annual Report to Shareholders for the fiscal year ended December 31, 2023: Filed herewith. (Not deemed filed except for portions thereof specifically incorporated by reference into this Annual Report on Form 10-K.)
|
|
|
19
|
Ohio
Valley Banc Corp. Insider Trading Policy: Filed herewith.
|
|
|
21
|
Subsidiaries
of Ohio Valley: Filed herewith.
|
|
|
23
|
Consent
of Crowe LLP.: Filed herewith.
|
|
|
31.1
|
Rule
13a-14(a)/15d-14(a) Certification (Principal Executive Officer): Filed herewith.
|
|
|
31.2
|
Rule
13a-14(a)/15d-14(a) Certification (Principal Financial Officer): Filed herewith.
|
|
|
32
|
||
|
97
|
||
|
101.INS #
|
XBRL Instance Document: Submitted electronically herewith. #
|
|
|
101.SCH #
|
XBRL Taxonomy Extension Schema: Submitted electronically herewith. #
|
|
|
101.CAL #
|
XBRL Taxonomy Extension Calculation Linkbase: Submitted electronically herewith. #
|
|
|
101.DEF #
|
XBRL Taxonomy Extension Definition Linkbase: Submitted electronically herewith. #
|
|
|
Exhibit Number
|
Exhibit Description
|
|
|
101.LAB #
|
XBRL Taxonomy Extension Label Linkbase: Submitted electronically herewith. #
|
|
|
101.PRE #
|
XBRL Taxonomy Extension Presentation Linkbase: Submitted electronically herewith. #
|
|
|
104
|
Cover Page Interactive Data File (formatted as Inline XBRL and contained in Exhibit 101)
|
|
# Attached as Exhibit 101 to Ohio Valley’s Annual Report on Form 10-K for the fiscal year ended December 31, 2023 are the following documents
formatted in XBRL (eXtensive Business Reporting Language): (i) Consolidated Statements of Condition at December 31, 2023 and December 31, 2022; (ii) Consolidated Statements of Income for the years ended December 31, 2023 and 2022; (iii)
Consolidated Statements of Comprehensive Income for the years ended December 31, 2023 and 2022; (iv) Consolidated Statements of Changes in Shareholders’ Equity for the years ended December 31, 2023 and 2022; (v) Consolidated Statements of
Cash Flows for the years ended December 31, 2023 and 2022; and (vi) Notes to the Consolidated Financial Statements.
|
|
OHIO VALLEY BANC CORP.
|
|||
|
Date:
|
March 15, 2024
|
By:
|
/s/Larry E. Miller, II |
|
Larry E. Miller, II
|
|||
|
President and Chief Executive Officer
|
|
Name
|
Capacity
|
|
| /s/Larry E. Miller, II |
President and Chief Executive Officer
|
|
|
Larry E. Miller, II
|
(principal executive officer) and Director
|
|
| /s/Scott W. Shockey |
Senior Vice President and Chief
|
|
|
Scott W. Shockey
|
Financial Officer (principal financial officer and principal accounting officer)
|
|
| /s/Thomas E. Wiseman |
Chairman of the Board
|
|
|
Thomas E. Wiseman
|
||
| /s/Anna P. Barnitz |
Director
|
|
|
Anna P. Barnitz
|
||
| /s/David W. Thomas |
Director
|
|
|
David W. Thomas
|
||
| /s/Brent A. Saunders |
Director
|
|
|
Brent A. Saunders
|
||
| /s/Brent R. Eastman |
Director
|
|
|
Brent R. Eastman
|
||
| /s/Kimberly A. Canady |
Director
|
|
|
Kimberly A. Canady
|
||
| /s/Edward J. Robins |
Director
|
|
|
Edward J. Robbins
|
||
| /s/K. Ryan Smith |
Director
|
|
|
K. Ryan Smith
|
||
| /s/Edward B. Roberts |
Director
|
|
|
Edward B. Roberts
|
||
| /s/Larry E. Miller, II |
|
Larry E. Miller, II
|
|
President and Chief Executive Officer
|
|
Ohio Valley Banc Corp.
|
|
Name
|
Current Salary
|
|
Thomas E. Wiseman
|
247,770
|
|
Larry E. Miller II
|
355,794
|
|
Scott W. Shockey
|
223,529
|


|
As of December 31
|
||||||||
|
|
2023
|
2022
|
||||||
|
(dollars in thousands, except share and per share data)
|
||||||||
|
Assets
|
||||||||
|
Cash and noninterest-bearing deposits with banks
|
$
|
14,252
|
$
|
14,330
|
||||
|
Interest-bearing deposits with banks
|
113,874
|
31,660
|
||||||
|
Total cash and cash equivalents
|
128,126
|
45,990
|
||||||
|
Certificates of deposit in financial institutions
|
—
|
1,862
|
||||||
|
Securities available for sale
|
162,258
|
184,074
|
||||||
|
Securities held to maturity, net of allowance for credit losses of $2 in 2023 and $0 in 2022; (estimated fair value: 2023 - $7,390; 2022 - $8,460)
|
7,986
|
9,226
|
||||||
|
Restricted investments in bank stocks
|
5,037
|
5,953
|
||||||
|
Total loans
|
971,900
|
885,049
|
||||||
|
Less: Allowance for credit losses
|
(8,767
|
)
|
(5,269
|
)
|
||||
|
Net loans
|
963,133
|
879,780
|
||||||
|
Premises and equipment, net
|
21,450
|
20,436
|
||||||
|
Premises and equipment held for sale, net
|
573
|
593
|
||||||
|
Accrued interest receivable
|
3,606
|
3,112
|
||||||
|
Goodwill
|
7,319
|
7,319
|
||||||
|
Other intangible assets, net
|
8
|
29
|
||||||
|
Bank owned life insurance and annuity assets
|
40,593
|
39,627
|
||||||
|
Operating lease right-of-use asset, net
|
1,205
|
1,294
|
||||||
| Deferred tax assets | 6,306 | 6,266 | ||||||
|
Other assets
|
4,535
|
5,226
|
||||||
|
Total assets
|
$
|
1,352,135
|
$
|
1,210,787
|
||||
|
Liabilities
|
||||||||
|
Noninterest-bearing deposits
|
$
|
322,222
|
$
|
354,413
|
||||
|
Interest-bearing deposits
|
804,914
|
673,242
|
||||||
|
Total deposits
|
1,127,136
|
1,027,655
|
||||||
|
Other borrowed funds
|
44,593
|
17,945
|
||||||
|
Subordinated debentures
|
8,500
|
8,500
|
||||||
|
Operating lease liability
|
1,205
|
1,294
|
||||||
| Allowance for credit losses on off-balance sheet commitments |
692 | — | ||||||
|
Other liabilities
|
26,002
|
20,365
|
||||||
|
Total liabilities
|
1,208,128
|
1,075,759
|
||||||
|
Commitments and Contingent Liabilities (See Note L)
|
||||||||
|
Shareholders’ Equity
|
||||||||
|
Common stock ($1.00 stated value per share, 10,000,000 shares authorized; 2023 - 5,470,453
shares issued; 2022 - 5,465,707 shares issued)
|
5,470
|
5,465
|
||||||
|
Additional paid-in capital
|
51,842
|
51,722
|
||||||
|
Retained earnings
|
114,871
|
109,320
|
||||||
|
Accumulated other comprehensive income (loss)
|
(11,428
|
)
|
(14,813
|
)
|
||||
|
Treasury stock, at cost (2023 - 697,321 shares; 2022 – 693,933 shares)
|
(16,748
|
)
|
(16,666
|
)
|
||||
|
Total shareholders’ equity
|
144,007
|
135,028
|
||||||
|
Total liabilities and shareholders’ equity
|
$
|
1,352,135
|
$
|
1,210,787
|
||||
|
For the years ended December 31
|
2023
|
2022
|
||||||
|
(dollars in thousands, except per share data)
|
||||||||
|
Interest and dividend income:
|
||||||||
|
Loans, including fees
|
$
|
54,821
|
$
|
42,273
|
||||
|
Securities:
|
||||||||
|
Taxable
|
3,678
|
3,340
|
||||||
|
Tax exempt
|
162
|
180
|
||||||
|
Dividends
|
324
|
316
|
||||||
|
Interest-bearing deposits with banks
|
2,870
|
1,493
|
||||||
|
Other interest
|
10
|
14
|
||||||
|
61,865
|
47,616
|
|||||||
|
Interest expense:
|
||||||||
|
Deposits
|
14,174
|
2,130
|
||||||
|
Other borrowed funds
|
1,067
|
412
|
||||||
|
Subordinated debentures
|
597
|
296
|
||||||
|
15,838
|
2,838
|
|||||||
|
Net interest income
|
46,027
|
44,778
|
||||||
|
Provision for (recovery of) credit losses
|
2,090
|
(32
|
)
|
|||||
|
Net interest income after provision for (recovery of) credit losses
|
43,937
|
44,810
|
||||||
|
Noninterest income:
|
||||||||
|
Service charges on deposit accounts
|
2,700
|
2,443
|
||||||
|
Trust fees
|
326
|
325
|
||||||
|
Income from bank owned life insurance and annuity assets
|
860
|
883
|
||||||
|
Mortgage banking income
|
175
|
697
|
||||||
|
Electronic refund check / deposit fees
|
675
|
675
|
||||||
|
Debit / credit card interchange income
|
4,860
|
4,862
|
||||||
|
Loss on sale of securities
|
(23 | ) | (1,537 | ) | ||||
|
Tax preparation fees
|
669
|
743
|
||||||
|
Other
|
2,387
|
1,071
|
||||||
|
12,629
|
10,162
|
|||||||
|
Noninterest expense:
|
||||||||
|
Salaries and employee benefits
|
23,391
|
21,615
|
||||||
|
Occupancy
|
1,903
|
1,910
|
||||||
|
Furniture and equipment
|
1,321
|
1,170
|
||||||
|
Professional fees
|
1,656
|
1,609
|
||||||
|
Marketing expense
|
1,010
|
1,428
|
||||||
|
FDIC insurance
|
569
|
335
|
||||||
|
Data processing
|
2,809
|
2,761
|
||||||
|
Software
|
2,649
|
2,197
|
||||||
|
Foreclosed assets
|
15
|
63
|
||||||
|
Amortization of intangibles
|
21
|
35
|
||||||
|
Other
|
6,024
|
5,917
|
||||||
|
41,368
|
39,040
|
|||||||
|
Income before income taxes
|
15,198
|
15,932
|
||||||
|
Provision for income taxes
|
2,567
|
2,594
|
||||||
|
NET INCOME
|
$
|
12,631
|
$
|
13,338
|
||||
|
Earnings per share
|
$
|
2.65
|
$
|
2.80
|
||||
|
For the years ended December 31
|
2023
|
2022
|
||||||
|
(dollars in thousands)
|
||||||||
|
NET INCOME
|
$
|
12,631
|
$
|
13,338
|
||||
|
Other comprehensive income (loss):
|
||||||||
|
Change in unrealized gain (loss) on available for sale securities
|
4,067
|
(21,184
|
)
|
|||||
| Reclassification adjustment for realized losses |
23 | 1,537 | ||||||
| 4,090 | (19,647 | ) | ||||||
|
Related tax effect
|
(705
|
)
|
4,126
|
|||||
|
Total other comprehensive income (loss), net of tax
|
3,385
|
(15,521
|
)
|
|||||
|
Total comprehensive income
|
$
|
16,016
|
$
|
(2,183
|
)
|
|||
|
For the years ended December 31, 2023 and 2022
|
||||||||||||||||||||||||
|
(dollars in thousands, except share and per share data)
|
||||||||||||||||||||||||
|
Common
Stock
|
Additional Paid-In
Capital
|
Retained
Earnings
|
Accumulated Other
Comprehensive
Income (Loss)
|
Treasury
Stock
|
Total
Shareholders’
Equity
|
|||||||||||||||||||
|
Balances at January 1, 2022
|
$
|
5,447
|
$
|
51,165
|
$
|
100,702
|
$
|
708
|
$
|
(16,666
|
)
|
$
|
141,356
|
|||||||||||
|
Net income
|
—
|
—
|
13,338
|
—
|
—
|
13,338
|
||||||||||||||||||
|
Other comprehensive income (loss), net
|
—
|
—
|
—
|
(15,521
|
)
|
—
|
(15,521
|
)
|
||||||||||||||||
|
Cash dividends, $0.99 per share
|
—
|
—
|
(4,720
|
)
|
—
|
—
|
(4,720
|
)
|
||||||||||||||||
|
Common stock issued to
ESOP, 18,522 shares
|
18 | 557 | — | — | — | 575 | ||||||||||||||||||
|
Balances at December 31, 2022
|
5,465
|
51,722
|
109,320
|
(14,813
|
)
|
(16,666
|
)
|
135,028
|
||||||||||||||||
|
Cumulative change in
adopting ASU 2016-13
|
— | — | (2,209 | ) | — | — | (2,209 | ) | ||||||||||||||||
|
Balance at January 1,
2023 (as adjusted for change in adopting ASU 2016-13)
|
5,465 | 51,722 | 107,111 | (14,813 | ) | (16,666 | ) | 132,819 | ||||||||||||||||
|
Net income
|
—
|
—
|
12,631
|
—
|
—
|
12,631
|
||||||||||||||||||
|
Other comprehensive income (loss), net
|
—
|
—
|
—
|
3,385
|
—
|
3,385
|
||||||||||||||||||
|
Cash dividends, $1.02 per share
|
— | — | (4,871 | ) | — | — | (4,871 | ) | ||||||||||||||||
|
Common Stock issued to ESOP, 4,746 shares
|
5
|
120
|
—
|
—
|
—
|
125
|
||||||||||||||||||
| Shares acquired for treasury, 3,388
shares |
— | — | — | — | (82 | ) | (82 | ) | ||||||||||||||||
|
Balances at December 31, 2023
|
$
|
5,470
|
$
|
51,842
|
$
|
114,871
|
$
|
(11,428
|
)
|
$
|
(16,748
|
)
|
$
|
144,007
|
||||||||||
|
For the years ended December 31
|
2023
|
2022
|
||||||
|
(dollars in thousands)
|
||||||||
|
Cash flows from operating activities:
|
||||||||
|
Net income
|
$
|
12,631
|
$
|
13,338
|
||||
|
Adjustments to reconcile net income to net cash provided by operating activities:
|
||||||||
|
Provision for (recovery of)
credit losses
|
2,090 | (32 | ) | |||||
|
Depreciation of premises and equipment
|
1,562
|
1,464
|
||||||
|
Accretion of building grant
|
(4 | ) | (3 | ) | ||||
|
Net amortization (accretion) of purchase accounting adjustments
|
(1
|
)
|
34
|
|||||
|
Net amortization (accretion) of securities
|
(478
|
)
|
100
|
|||||
|
Net realized loss on sale of securities
|
23 | 1,537 | ||||||
|
Proceeds from sale of loans in secondary market
|
125
|
7,831
|
||||||
|
Loans disbursed for sale in secondary market
|
(124
|
)
|
(7,134
|
)
|
||||
|
Amortization of mortgage servicing rights
|
53
|
71
|
||||||
|
Gain on sale of loans
|
(228
|
)
|
(768
|
)
|
||||
|
Amortization of intangible assets
|
21
|
35
|
||||||
|
Amortization of certificates of deposit premiums
|
7 | 22 | ||||||
|
Deferred tax (benefit) expense
|
(745
|
)
|
288
|
|||||
|
Contribution of common stock to ESOP
|
125 | 575 | ||||||
|
Earnings on bank owned life insurance and annuity assets
|
(860
|
)
|
(883
|
)
|
||||
|
Change in accrued interest receivable
|
(494
|
)
|
(417
|
)
|
||||
|
Change in other liabilities
|
5,567
|
1,223
|
||||||
|
Change in other assets
|
1,477
|
(1,291
|
)
|
|||||
|
Net cash provided by operating activities
|
20,747
|
15,990
|
||||||
|
Cash flows from investing activities:
|
||||||||
|
Proceeds from sales of securities available for sale
|
1,067 | 10,963 | ||||||
|
Proceeds from maturities and paydowns of securities available for sale
|
25,901
|
27,524
|
||||||
|
Purchases of securities available for sale
|
(586
|
)
|
(66,821
|
)
|
||||
|
Proceeds from calls and maturities of securities held to maturity
|
1,217
|
1,044
|
||||||
|
Proceeds from maturities of certificates of deposit in financial institutions
|
2,100
|
445
|
||||||
|
Purchases of certificates of deposit in financial institutions
|
(245
|
)
|
—
|
|||||
|
Purchases of restricted
investments in bank stocks
|
(969 | ) | — | |||||
|
Redemptions of restricted investments in bank stocks
|
1,885 | 1,312 | ||||||
|
Net change in loans
|
(87,481 | ) | (55,028 | ) | ||||
|
Purchases of premises and equipment
|
(2,689
|
)
|
(1,988
|
)
|
||||
|
Disposals of premises and equipment
|
219
|
420
|
||||||
|
Proceeds from building grant
|
— | 200 | ||||||
|
Reimbursement of building
grant
|
(100 | ) | — | |||||
|
Purchases of bank owned life insurance and annuity assets
|
(250 | ) | (1,463 | ) | ||||
|
Withdrawals from bank owned life insurance and annuity assets
|
144
|
—
|
||||||
|
Net cash (used in) investing activities
|
(59,787
|
)
|
(83,392
|
)
|
||||
|
Cash flows from financing activities:
|
||||||||
|
Change in deposits
|
99,481
|
(32,253
|
)
|
|||||
|
Cash dividends
|
(4,871
|
)
|
(4,720
|
)
|
||||
|
Purchases of treasury stock
|
(82 | ) | — | |||||
|
Proceeds from Federal Home Loan Bank borrowings
|
30,001
|
2
|
||||||
|
Repayment of Federal Home Loan Bank borrowings
|
(3,371
|
)
|
(1,909
|
)
|
||||
|
Change in other short-term borrowings
|
18
|
238
|
||||||
|
Net cash provided by (used in) financing activities
|
121,176
|
(38,642
|
)
|
|||||
|
Cash and cash equivalents:
|
||||||||
|
Change in cash and cash equivalents
|
82,136
|
(106,044
|
)
|
|||||
|
Cash and cash equivalents at beginning of year
|
45,990
|
152,034
|
||||||
|
Cash and cash equivalents at end of year
|
$
|
128,126
|
$
|
45,990
|
||||
|
Supplemental disclosure:
|
||||||||
|
Cash paid for interest
|
$
|
9,674
|
$
|
2,845
|
||||
|
Cash paid for income taxes
|
2,750
|
1,975
|
||||||
|
Transfers from loans to other real estate owned
|
129
|
—
|
||||||
|
Operating lease liability arising from obtaining right-of-use asset
|
187
|
108
|
||||||
|
Portfolio Segment
|
Measurement Method
|
Loss Driver
|
||
|
Residential real estate
|
Cumulative Undiscounted Expected Loss
|
National Unemployment, National GDP
|
||
|
Commercial real estate:
|
||||
|
Owner-occupied
|
Cumulative Undiscounted Expected Loss
|
National Unemployment, National GDP
|
||
|
Nonowner-occupied
|
Cumulative Undiscounted Expected Loss
|
National Unemployment, National GDP
|
||
|
Construction
|
Cumulative Undiscounted Expected Loss
|
National Unemployment, National GDP
|
||
|
Commercial and industrial
|
Cumulative Undiscounted Expected Loss
|
National Unemployment, National GDP
|
||
|
Consumer:
|
||||
|
Automobile
|
Cumulative Undiscounted Expected Loss
|
National Unemployment
|
||
|
Home equity
|
Cumulative Undiscounted Expected Loss
|
National Unemployment
|
||
|
Other
|
Cumulative Undiscounted Expected Loss,
Remaining Life Method
|
National Unemployment
|
|
% of Total Loans
|
||||||||
|
2023
|
2022
|
|||||||
|
Residential real estate loans
|
32.88
|
%
|
33.56
|
%
|
||||
|
Commercial real estate loans
|
33.22
|
%
|
32.63
|
%
|
||||
|
Consumer loans
|
17.72
|
%
|
16.72
|
%
|
||||
|
Commercial and industrial loans
|
16.18
|
%
|
17.09
|
%
|
||||
|
100.00
|
%
|
100.00
|
%
|
|||||
|
|
January 1, 2023
|
|||||||||||
|
As Reported
Under ASC
326
|
Pre-ASC 326
Adoption
|
Impact of
ASC 326
Adoption
|
||||||||||
|
Assets:
|
||||||||||||
|
ACL - HTM debt securities
|
||||||||||||
|
Obligations of states and political subdivisions
|
$
|
3
|
$
|
—
|
$
|
3
|
||||||
|
ACL - Loans
|
||||||||||||
|
Residential real estate
|
2,026
|
681
|
1,345
|
|||||||||
|
Commercial real estate
|
2,200
|
2,038
|
162
|
|||||||||
|
Commercial and industrial
|
1,177
|
1,293
|
(116
|
)
|
||||||||
|
Consumer
|
2,028
|
1,257
|
771
|
|||||||||
|
Total ACL - Loans
|
$
|
7,431
|
$
|
5,269
|
$
|
2,162
|
||||||
|
Deferred tax assets
|
$
|
6,853
|
$
|
6,266
|
$
|
587
|
||||||
|
Liabilities:
|
||||||||||||
|
ACL - Off-balance sheet commitments
|
$
|
631
|
$
|
—
|
$
|
631
|
||||||
|
|
Amortized
Cost
|
Gross Unrealized
Gains
|
Gross Unrealized
Losses
|
Estimated
Fair Value
|
||||||||||||
|
Securities Available for Sale
|
||||||||||||||||
|
December 31, 2023
|
||||||||||||||||
|
U.S. Government securities
|
$ | 52,174 | $ | — | $ | (1,877 | ) | $ | 50,297 | |||||||
|
U.S. Government sponsored entity securities
|
6,527
|
—
|
(650
|
)
|
5,877
|
|||||||||||
|
Agency mortgage-backed securities, residential
|
118,218
|
—
|
(12,134
|
)
|
106,084
|
|||||||||||
|
Total securities
|
$
|
176,919
|
$
|
—
|
$
|
(14,661
|
)
|
$
|
162,258
|
|||||||
|
December 31, 2022
|
||||||||||||||||
|
U.S. Government securities
|
$ | 57,698 | $ | — | $ | (2,906 | ) | $ | 54,792 | |||||||
|
U.S. Government sponsored entity securities
|
8,845
|
—
|
(862
|
)
|
7,983
|
|||||||||||
|
Agency mortgage-backed securities, residential
|
136,282
|
—
|
(14,983
|
)
|
121,299
|
|||||||||||
|
Total securities
|
$
|
202,825
|
$
|
—
|
$
|
(18,751
|
)
|
$
|
184,074
|
|||||||
|
Amortized
Cost
|
Gross Unrecognized
Gains
|
Gross Unrecognized
Losses
|
Estimated
Fair Value
|
Allowance for Credit
Losses
|
||||||||||||||||
|
Securities Held to Maturity
|
||||||||||||||||||||
|
December 31, 2023
|
||||||||||||||||||||
|
Obligations of states and political subdivisions
|
$
|
7,987
|
$
|
17
|
$
|
(615
|
)
|
$
|
7,389
|
$ | (2 | ) | ||||||||
|
Agency mortgage-backed securities, residential
|
1
|
—
|
—
|
1
|
— | |||||||||||||||
|
Total securities
|
$
|
7,988
|
$
|
17
|
$
|
(615
|
)
|
$
|
7,390
|
$ |
(2 | ) | ||||||||
|
December 31, 2022
|
||||||||||||||||||||
|
Obligations of states and political subdivisions
|
$
|
9,225
|
$
|
32
|
$
|
(798
|
)
|
$
|
8,459
|
|||||||||||
|
Agency mortgage-backed securities, residential
|
1
|
—
|
—
|
1
|
||||||||||||||||
|
Total securities
|
$
|
9,226
|
$
|
32
|
$
|
(798
|
)
|
$
|
8,460
|
|||||||||||
|
Available for Sale
|
Held to Maturity
|
|||||||||||||||
|
Debt Securities:
|
Amortized
Cost
|
Estimated
Fair
Value
|
Amortized
Cost
|
Estimated
Fair
Value
|
||||||||||||
|
Due in one year or less
|
$
|
17,424
|
$
|
17,257
|
$
|
397
|
$
|
392
|
||||||||
|
Due in one to five years
|
41,277
|
38,917
|
3,974
|
3,780
|
||||||||||||
|
Due in five to ten years
|
—
|
—
|
1,490
|
1,297
|
||||||||||||
|
Due after ten years
|
— | — | 2,126 | 1,920 | ||||||||||||
|
Agency mortgage-backed securities, residential
|
118,218
|
106,084
|
1
|
1
|
||||||||||||
|
Total debt securities
|
$
|
176,919
|
$
|
162,258
|
$
|
7,988
|
$
|
7,390
|
||||||||
|
December 31, 2023
|
Less than 12 Months
|
12 Months or More
|
Total
|
|||||||||||||||||||||
|
Securities Available for Sale
|
Fair
Value
|
Unrealized
Loss
|
Fair
Value
|
Unrealized
Loss
|
Fair
Value
|
Unrealized
Loss
|
||||||||||||||||||
|
U.S. Government securities
|
$ | 9,474 | $ | (52 | ) | $ | 40,823 | $ | (1,825 | ) | $ | 50,297 | $ | (1,877 | ) | |||||||||
|
U.S. Government sponsored entity securities
|
— | — | 5,877 | (650 | ) | 5,877 | (650 | ) | ||||||||||||||||
|
Agency mortgage-backed securities, residential
|
—
|
—
|
106,084
|
(12,134
|
)
|
106,084
|
(12,134
|
)
|
||||||||||||||||
|
Total available for sale
|
$
|
9,474
|
$
|
(52
|
)
|
$
|
152,784
|
$
|
(14,609
|
)
|
$
|
162,258
|
$
|
(14,661
|
)
|
|||||||||
|
December 31, 2022
|
Less than 12 Months
|
12 Months or More
|
Total
|
|||||||||||||||||||||
|
Securities Available for Sale
|
Fair
Value
|
Unrealized
Loss
|
Fair
Value
|
Unrealized
Loss
|
Fair
Value
|
Unrealized
Loss
|
||||||||||||||||||
|
U.S. Government securities
|
$ | 36,460 | $ | (977 | ) | $ | 18,332 | $ | (1,929 | ) | $ | 54,792 | $ | (2,906 | ) | |||||||||
|
U.S. Government sponsored entity securities
|
2,786 | (60 | ) | 5,197 | (802 | ) | 7,983 | (862 | ) | |||||||||||||||
|
Agency mortgage-backed securities, residential
|
71,510
|
(7,178
|
)
|
49,789
|
(7,805
|
)
|
121,299
|
(14,983
|
)
|
|||||||||||||||
|
Total available for sale
|
$
|
110,756
|
$
|
(8,215
|
)
|
$
|
73,318
|
$
|
(10,536
|
)
|
$
|
184,074
|
$
|
(18,751
|
)
|
|||||||||
|
Held to Maturity Debt Securities
|
2023
|
|||
|
Allowance for credit losses:
|
||||
|
Beginning balance
|
$
|
—
|
||
|
Impact of adopting ASC 326
|
3
|
|||
|
Provision for (recovery of) credit loss expense
|
(1
|
)
|
||
|
Allowance for credit losses ending balance
|
$
|
2
|
||
|
2023
|
2022
|
|||||||
|
Residential real estate
|
$
|
319,504
|
$
|
297,036
|
||||
|
Commercial real estate:
|
||||||||
|
Owner-occupied
|
82,356
|
72,719
|
||||||
|
Nonowner-occupied
|
178,201
|
182,831
|
||||||
|
Construction
|
62,337
|
33,205
|
||||||
|
Commercial and industrial
|
157,298
|
151,232
|
||||||
|
Consumer:
|
||||||||
|
Automobile
|
61,461
|
54,837
|
||||||
|
Home equity
|
35,893
|
27,791
|
||||||
|
Other
|
74,850
|
65,398
|
||||||
|
971,900
|
885,049
|
|||||||
|
Less: Allowance for credit losses
|
(8,767
|
)
|
(5,269
|
)
|
||||
|
Loans, net
|
$
|
963,133
|
$
|
879,780
|
||||
| December 31, 2023 |
Loans Past
Due
90 Days And
Still Accruing
|
Nonaccrual
Loans With
No ACL
|
Nonaccrual
Loans With
an ACL
|
Total
Nonaccrual
Loans
|
||||||||||||
|
Residential real estate
|
$
|
9
|
$ | — | $ | 1,234 |
$
|
1,234
|
||||||||
|
Commercial real estate:
|
||||||||||||||||
|
Owner-occupied
|
—
|
775 | — |
775
|
||||||||||||
|
Nonowner-occupied
|
—
|
— | 61 |
61
|
||||||||||||
|
Construction
|
—
|
— | 1 |
1
|
||||||||||||
|
Commercial and industrial
|
—
|
— | 48 |
48
|
||||||||||||
|
Consumer:
|
||||||||||||||||
|
Automobile
|
56
|
— | 78 |
78
|
||||||||||||
|
Home equity
|
—
|
— | 95 |
95
|
||||||||||||
|
Other
|
54
|
— | 100 |
100
|
||||||||||||
|
Total
|
$
|
119
|
$ | 775 | $ | 1,617 |
$
|
2,392
|
||||||||
| December 31, 2022 |
Loans Past
Due 90 Days
And Still
Accruing
|
Nonaccrual
|
||||||
|
Residential real estate
|
$
|
100
|
$
|
1,708
|
||||
|
Commercial real estate:
|
||||||||
|
Owner-occupied
|
—
|
938
|
||||||
|
Nonowner-occupied
|
—
|
70
|
||||||
|
Construction
|
—
|
75
|
||||||
|
Commercial and industrial
|
—
|
150
|
||||||
|
Consumer:
|
||||||||
|
Automobile
|
27
|
82
|
||||||
|
Home equity
|
—
|
151
|
||||||
|
Other
|
411
|
59
|
||||||
|
Total
|
$
|
538
|
$
|
3,233
|
||||
|
December 31, 2023
|
30-59
Days
Past Due
|
60-89
Days
Past Due
|
90 Days
Or More
Past Due
|
Total
Past Due
|
Loans Not
Past Due
|
Total
|
||||||||||||||||||
|
Residential real estate
|
$
|
2,705
|
$
|
368
|
$
|
481
|
$
|
3,554
|
$
|
315,950
|
$
|
319,504
|
||||||||||||
|
Commercial real estate:
|
||||||||||||||||||||||||
|
Owner-occupied
|
2,580
|
—
|
775
|
3,355
|
79,001
|
82,356
|
||||||||||||||||||
|
Nonowner-occupied
|
681
|
—
|
—
|
681
|
177,520
|
178,201
|
||||||||||||||||||
|
Construction
|
—
|
—
|
—
|
—
|
62,337
|
62,337
|
||||||||||||||||||
|
Commercial and industrial
|
3,338
|
—
|
48
|
3,386
|
153,912
|
157,298
|
||||||||||||||||||
|
Consumer:
|
||||||||||||||||||||||||
|
Automobile
|
782
|
210
|
117
|
1,109
|
60,352
|
61,461
|
||||||||||||||||||
|
Home equity
|
353
|
62
|
95
|
510
|
35,383
|
35,893
|
||||||||||||||||||
|
Other
|
658
|
121
|
148
|
927
|
73,923
|
74,850
|
||||||||||||||||||
|
Total
|
$
|
11,097
|
$
|
761
|
$
|
1,664
|
$
|
13,522
|
$
|
958,378
|
$
|
971,900
|
||||||||||||
|
December 31, 2022
|
30-59
Days
Past Due
|
60-89
Days
Past Due
|
90 Days
Or More
Past Due
|
Total
Past Due
|
Loans Not
Past Due
|
Total
|
||||||||||||||||||
|
Residential real estate
|
$
|
1,799
|
$
|
701
|
$
|
497
|
$
|
2,997
|
$
|
294,039
|
$
|
297,036
|
||||||||||||
|
Commercial real estate:
|
||||||||||||||||||||||||
|
Owner-occupied
|
97
|
—
|
938
|
1,035
|
71,684
|
72,719
|
||||||||||||||||||
|
Nonowner-occupied
|
626
|
5
|
—
|
631
|
182,200
|
182,831
|
||||||||||||||||||
|
Construction
|
40
|
45
|
17
|
102
|
33,103
|
33,205
|
||||||||||||||||||
|
Commercial and industrial
|
21
|
—
|
150
|
171
|
151,061
|
151,232
|
||||||||||||||||||
|
Consumer:
|
||||||||||||||||||||||||
|
Automobile
|
804
|
240
|
97
|
1,141
|
53,696
|
54,837
|
||||||||||||||||||
|
Home equity
|
204
|
—
|
151
|
355
|
27,436
|
27,791
|
||||||||||||||||||
|
Other
|
875
|
113
|
452
|
1,440
|
63,958
|
65,398
|
||||||||||||||||||
|
Total
|
$
|
4,466
|
$
|
1,104
|
$
|
2,302
|
$
|
7,872
|
$
|
877,177
|
$
|
885,049
|
||||||||||||
|
Term Loans Amortized Cost Basis by Origination Year
|
||||||||||||||||||||||||||||||||
|
December 31, 2023
|
2023
|
2022
|
2021
|
2020
|
2019
|
Prior
|
Revolving
Loans
Amortized
Cost Basis
|
Total
|
||||||||||||||||||||||||
|
Commercial real estate:
|
||||||||||||||||||||||||||||||||
|
Owner-occupied
|
||||||||||||||||||||||||||||||||
|
Risk Rating
|
||||||||||||||||||||||||||||||||
|
Pass
|
$
|
18,120
|
$
|
7,911
|
$
|
10,679
|
$
|
5,973
|
$
|
6,125
|
$
|
15,925
|
$
|
459
|
$
|
65,192
|
||||||||||||||||
|
Special Mention
|
—
|
—
|
—
|
—
|
— |
427
|
—
|
427
|
||||||||||||||||||||||||
|
Substandard
|
—
|
— |
13,934
|
—
|
498
|
2,005
|
300
|
16,737
|
||||||||||||||||||||||||
|
Doubtful
|
—
|
—
|
—
|
—
|
—
|
—
|
— |
—
|
||||||||||||||||||||||||
|
Total
|
$
|
18,120
|
$
|
7,911
|
$
|
24,613
|
$
|
5,973
|
$
|
6,623
|
$
|
18,357
|
$
|
759
|
$
|
82,356
|
||||||||||||||||
|
Current Period gross charge-offs
|
$
|
—
|
$
|
—
|
$
|
—
|
$
|
—
|
$
|
—
|
$
|
—
|
$
|
—
|
$
|
—
|
||||||||||||||||
|
Term Loans Amortized Cost Basis by Origination Year
|
|
|||||||||||||||||||||||||||||||
|
December 31, 2023
|
2023
|
2022
|
2021
|
2020
|
2019
|
Prior
|
Revolving
Loans
Amortized
Cost Basis
|
Total
|
||||||||||||||||||||||||
|
Commercial real estate:
|
||||||||||||||||||||||||||||||||
|
Nonowner occupied
|
||||||||||||||||||||||||||||||||
|
Risk Rating
|
||||||||||||||||||||||||||||||||
|
Pass
|
$
|
12,688
|
$
|
29,344
|
$
|
32,235
|
$
|
20,484
|
$
|
15,415
|
$
|
61,809
|
$
|
1,128
|
$
|
173,103
|
||||||||||||||||
|
Special Mention
|
—
|
—
|
768
|
3,226
|
—
|
1,034
|
—
|
5,028
|
||||||||||||||||||||||||
|
Substandard
|
—
|
— |
70
|
— |
—
|
— |
—
|
70
|
||||||||||||||||||||||||
|
Doubtful
|
—
|
—
|
—
|
—
|
—
|
—
|
—
|
— | ||||||||||||||||||||||||
|
Total
|
$
|
12,688
|
$
|
29,344
|
$
|
33,073
|
$
|
23,710
|
$
|
15,415
|
$
|
62,843
|
$
|
1,128
|
$
|
178,201
|
||||||||||||||||
|
Current Period gross charge-offs
|
$
|
— |
$
|
— |
$
|
132
|
$
|
—
|
$
|
—
|
$
|
—
|
$
|
— |
$
|
132
|
||||||||||||||||
|
Term Loans Amortized Cost Basis by Origination Year
|
|
|||||||||||||||||||||||||||||||
|
December 31, 2023
|
2023
|
2022
|
2021
|
2020
|
2019
|
Prior
|
Revolving
Loans
Amortized
Cost Basis
|
Total
|
||||||||||||||||||||||||
|
Commercial real estate:
|
||||||||||||||||||||||||||||||||
|
Construction
|
||||||||||||||||||||||||||||||||
|
Risk Rating
|
||||||||||||||||||||||||||||||||
|
Pass
|
$
|
28,055
|
$
|
29,174
|
$
|
1,231
|
$
|
302
|
$
|
392
|
$
|
2,937
|
$
|
— |
$
|
62,091
|
||||||||||||||||
|
Special Mention
|
—
|
—
|
— |
—
|
—
|
—
|
—
|
—
|
||||||||||||||||||||||||
|
Substandard
|
—
|
— |
—
|
—
|
—
|
246
|
— |
246
|
||||||||||||||||||||||||
|
Doubtful
|
—
|
—
|
— |
—
|
—
|
—
|
— |
—
|
||||||||||||||||||||||||
|
Total
|
$
|
28,055
|
$
|
29,174
|
$
|
1,231
|
$
|
302
|
$
|
392
|
$
|
3,183
|
$
|
—
|
$
|
62,337
|
||||||||||||||||
|
Current Period gross charge-offs
|
$
|
— |
$
|
— |
$
|
—
|
$
|
—
|
$
|
— |
$
|
—
|
$
|
—
|
$
|
— | ||||||||||||||||
|
Term Loans Amortized Cost Basis by Origination Year
|
||||||||||||||||||||||||||||||||
|
December 31, 2023
|
2023
|
2022
|
2021
|
2020
|
2019
|
Prior
|
Revolving
Loans
Amortized
Cost Basis
|
Total
|
||||||||||||||||||||||||
|
Commercial and Industrial
|
||||||||||||||||||||||||||||||||
|
Risk Rating
|
||||||||||||||||||||||||||||||||
|
Pass
|
$
|
8,770
|
$
|
30,885
|
$
|
26,806
|
$
|
31,247
|
$
|
344
|
$
|
27,632
|
$
|
27,510
|
$
|
153,194
|
||||||||||||||||
|
Special Mention
|
140
|
—
|
—
|
— | — |
8
|
66
|
214
|
||||||||||||||||||||||||
|
Substandard
|
—
|
— |
58
|
1,363
|
4
|
182
|
2,283
|
3,890
|
||||||||||||||||||||||||
|
Doubtful
|
—
|
—
|
—
|
—
|
—
|
— |
—
|
—
|
||||||||||||||||||||||||
|
Total
|
$
|
8,910
|
$
|
30,885
|
$
|
26,864
|
$
|
32,610
|
$
|
348
|
$
|
27,822
|
$
|
29,859
|
$
|
157,298
|
||||||||||||||||
|
Current Period gross charge-offs
|
$
|
— |
$
|
—
|
$
|
— |
$
|
—
|
$
|
— |
$
|
—
|
$
|
29
|
$
|
29
|
||||||||||||||||
|
December 31, 2022
|
Pass
|
Criticized
|
Classified
|
Total
|
||||||||||||
|
Commercial real estate:
|
||||||||||||||||
|
Owner-occupied
|
$
|
68,236
|
$
|
3,545
|
$
|
938
|
$
|
72,719
|
||||||||
|
Nonowner-occupied
|
177,479
|
5,352
|
—
|
182,831
|
||||||||||||
|
Construction
|
33,143
|
—
|
62
|
33,205
|
||||||||||||
|
Commercial and industrial
|
147,627
|
1,879
|
1,726
|
151,232
|
||||||||||||
|
Total
|
$
|
426,485
|
$
|
10,776
|
$
|
2,726
|
$
|
439,987
|
||||||||
|
Term Loans Amortized Cost Basis by Origination Year
|
||||||||||||||||||||||||||||||||
|
December 31, 2023
|
2023
|
2022
|
2021
|
2020
|
2019
|
Prior
|
Revolving
Loans
Amortized
Cost Basis
|
Total
|
||||||||||||||||||||||||
|
Residential Real Estate:
|
||||||||||||||||||||||||||||||||
|
Payment Performance
|
||||||||||||||||||||||||||||||||
|
Performing
|
$
|
50,484
|
$
|
44,640
|
$
|
50,949
|
$
|
44,818
|
$
|
21,854
|
$
|
91,956
|
$
|
13,560
|
$
|
318,261
|
||||||||||||||||
|
Nonperforming
|
—
|
—
|
— |
—
|
182
|
1,061
|
—
|
1,243
|
||||||||||||||||||||||||
|
Total
|
$
|
50,484
|
$
|
44,640
|
$
|
50,949
|
$
|
44,818
|
$
|
22,036
|
$
|
93,017
|
$
|
13,560
|
$
|
319,504
|
||||||||||||||||
|
|
||||||||||||||||||||||||||||||||
|
Current Period gross charge-offs
|
$ | — |
$
|
—
|
$
|
3
|
$
|
—
|
$ | — |
$
|
118
|
$
|
—
|
$
|
121
|
||||||||||||||||
|
Term Loans Amortized Cost Basis by Origination Year
|
|
|||||||||||||||||||||||||||||||
|
December 31, 2023
|
2023
|
2022
|
2021
|
2020
|
2019
|
Prior
|
Revolving
Loans
Amortized
Cost Basis
|
Total
|
||||||||||||||||||||||||
|
Consumer:
|
||||||||||||||||||||||||||||||||
|
Automobile
|
||||||||||||||||||||||||||||||||
|
Payment Performance
|
||||||||||||||||||||||||||||||||
|
Performing
|
$
|
28,939
|
$
|
20,376
|
$
|
7,013
|
$
|
3,028
|
$
|
1,212
|
$
|
759
|
$ | — |
$
|
61,327
|
||||||||||||||||
|
Nonperforming
|
34
|
60
|
15
|
1
|
9
|
15
|
—
|
134
|
||||||||||||||||||||||||
|
Total
|
$
|
28,973
|
$
|
20,436
|
$
|
7,028
|
$
|
3,029
|
$
|
1,221
|
$
|
774
|
$
|
—
|
$
|
61,461
|
||||||||||||||||
|
|
||||||||||||||||||||||||||||||||
|
Current Period gross charge-offs
|
$
|
51
|
$
|
163
|
$
|
116
|
$
|
6
|
$
|
29
|
$
|
3
|
$
|
—
|
$
|
368
|
||||||||||||||||
|
|
Term Loans Amortized Cost Basis by Origination Year
|
|
||||||||||||||||||||||||||||||
|
December 31, 2023
|
2023
|
2022
|
2021
|
2020
|
2019
|
Prior
|
Revolving
Loans
Amortized
Cost Basis
|
Total
|
||||||||||||||||||||||||
|
Consumer:
|
||||||||||||||||||||||||||||||||
|
Home Equity
|
||||||||||||||||||||||||||||||||
|
Payment Performance
|
||||||||||||||||||||||||||||||||
|
Performing
|
$
|
1,649
|
$
|
79
|
$ | — |
$
|
—
|
$
|
—
|
$
|
—
|
$
|
34,070
|
$
|
35,798
|
||||||||||||||||
|
Nonperforming
|
—
|
—
|
—
|
—
|
—
|
—
|
95
|
95
|
||||||||||||||||||||||||
|
Total
|
$
|
1,649
|
$
|
79
|
$
|
—
|
$
|
—
|
$
|
—
|
$ | — |
$
|
34,165
|
$
|
35,893
|
||||||||||||||||
|
|
||||||||||||||||||||||||||||||||
|
Current Period gross charge-offs
|
$
|
—
|
$
|
—
|
$
|
—
|
$
|
—
|
$
|
—
|
$ | — |
$
|
87
|
$
|
87
|
||||||||||||||||
|
Term Loans Amortized Cost Basis by Origination Year
|
|
|||||||||||||||||||||||||||||||
|
December 31, 2023
|
2023
|
2022
|
2021
|
2020
|
2019
|
Prior
|
Revolving
Loans
Amortized
Cost Basis
|
Total
|
||||||||||||||||||||||||
|
Consumer:
|
||||||||||||||||||||||||||||||||
|
Other
|
||||||||||||||||||||||||||||||||
|
Payment Performance
|
||||||||||||||||||||||||||||||||
|
Performing
|
$
|
18,377
|
$
|
24,904
|
$
|
10,800
|
$
|
4,482
|
$
|
1,093
|
$
|
953
|
$
|
14,087
|
$
|
74,696
|
||||||||||||||||
|
Nonperforming
|
11
|
17
|
67
|
53
|
1
|
4
|
1
|
154
|
||||||||||||||||||||||||
|
Total
|
$
|
18,388
|
$
|
24,921
|
$
|
10,867
|
$
|
4,535
|
$
|
1,094
|
$
|
957
|
$
|
14,088
|
$
|
74,850
|
||||||||||||||||
|
|
||||||||||||||||||||||||||||||||
|
Current Period gross charge-offs
|
$
|
306
|
$
|
119
|
$
|
119
|
$
|
84
|
$
|
28
|
$
|
53
|
$
|
246
|
$
|
955
|
||||||||||||||||
|
Consumer
|
||||||||||||||||||||
|
December 31, 2022
|
Automobile
|
Home Equity
|
Other
|
Residential
Real Estate
|
Total
|
|||||||||||||||
|
Performing
|
$
|
54,728
|
$
|
27,640
|
$
|
64,928
|
$
|
295,228
|
$
|
442,524
|
||||||||||
|
Nonperforming
|
109
|
151
|
470
|
1,808
|
2,538
|
|||||||||||||||
|
Total
|
$
|
54,837
|
$
|
27,791
|
$
|
65,398
|
$
|
297,036
|
$
|
445,062
|
||||||||||
|
December 31, 2023
|
Residential
Real Estate
|
Commercial
Real Estate
|
Commercial
& Industrial
|
Consumer
|
Total
|
|||||||||||||||
|
Allowance for credit losses:
|
||||||||||||||||||||
|
Beginning balance
|
$
|
681
|
$
|
2,038
|
$
|
1,293
|
$
|
1,257
|
$
|
5,269
|
||||||||||
|
Impact of adopting ASC 326
|
1,345 | 162 | (116 | ) | 771 | 2,162 | ||||||||||||||
|
Provision for credit losses
|
251
|
824
|
(85
|
)
|
1,040
|
2,030
|
||||||||||||||
|
Loans charged off
|
(121
|
)
|
(132
|
)
|
(29
|
)
|
(1,410
|
)
|
(1,692
|
)
|
||||||||||
|
Recoveries
|
57
|
155
|
212
|
574
|
998
|
|||||||||||||||
|
Total ending allowance balance
|
$
|
2,213
|
$
|
3,047
|
$
|
1,275
|
$
|
2,232
|
$
|
8,767
|
||||||||||
|
December 31, 2022
|
Residential
Real Estate
|
Commercial
Real Estate
|
Commercial
& Industrial
|
Consumer
|
Total
|
|||||||||||||||
|
Allowance for credit losses:
|
||||||||||||||||||||
|
Beginning balance
|
$
|
980
|
$
|
2,548
|
$
|
1,571
|
$
|
1,384
|
$
|
6,483
|
||||||||||
|
Provision for credit losses
|
(318
|
)
|
(556
|
)
|
283
|
559
|
(32
|
)
|
||||||||||||
|
Loans charged off
|
(135
|
)
|
(36
|
)
|
(618
|
)
|
(1,399
|
)
|
(2,188
|
)
|
||||||||||
|
Recoveries
|
154
|
82
|
57
|
713
|
1,006
|
|||||||||||||||
|
Total ending allowance balance
|
$
|
681
|
$
|
2,038
|
$
|
1,293
|
$
|
1,257
|
$
|
5,269
|
||||||||||
|
December 31, 2022
|
Residential
Real Estate
|
Commercial
Real Estate
|
Commercial
& Industrial
|
Consumer
|
Total
|
|||||||||||||||
|
Allowance for credit losses:
|
||||||||||||||||||||
|
Ending allowance balance attributable to loans:
|
||||||||||||||||||||
|
Individually evaluated for impairment
|
$
|
—
|
$
|
—
|
$
|
—
|
$
|
—
|
$
|
—
|
||||||||||
|
Collectively evaluated for impairment
|
681
|
2,038
|
1,293
|
1,257
|
5,269
|
|||||||||||||||
|
Total ending allowance balance
|
$
|
681
|
$
|
2,038
|
$
|
1,293
|
$
|
1,257
|
$
|
5,269
|
||||||||||
|
Loans:
|
||||||||||||||||||||
|
Loans individually evaluated for impairment
|
$
|
—
|
$
|
1,986
|
$
|
—
|
$
|
28
|
$
|
2,014
|
||||||||||
|
Loans collectively evaluated for impairment
|
297,036
|
286,769
|
151,232
|
147,998
|
883,035
|
|||||||||||||||
|
Total ending loans balance
|
$
|
297,036
|
$
|
288,755
|
$
|
151,232
|
$
|
148,026
|
$
|
885,049
|
||||||||||
|
|
Collateral Type
|
|||||||||||
|
December 31, 2023
|
Real Estate
|
Business Assets
|
Total
|
|||||||||
|
Residential real estate
|
$
|
1,663
|
$
|
—
|
$
|
1,663
|
||||||
|
Commercial real estate:
|
||||||||||||
|
Owner-occupied
|
700
|
258
|
958
|
|||||||||
|
Consumer:
|
||||||||||||
|
Home equity
|
27
|
—
|
27
|
|||||||||
|
Total collateral dependent loans
|
$
|
2,390
|
$
|
258
|
$
|
2,648
|
||||||
|
December 31, 2022
|
Unpaid
Principal
Balance
|
Recorded
Investment
|
Allowance
for
Loan Losses
Allocated
|
Average
Impaired
Loans
|
Interest
Income
Recognized
|
Cash Basis
Interest
Recognized
|
||||||||||||||||||
| With an allowance recorded: | $ | — | $ | — | $ | — | $ | — | $ | — | $ | — | ||||||||||||
|
With no related allowance recorded:
|
||||||||||||||||||||||||
|
Commercial real estate:
|
||||||||||||||||||||||||
|
Owner-occupied
|
1,692
|
1,607
|
—
|
1,662
|
97
|
97
|
||||||||||||||||||
|
Nonowner-occupied
|
379
|
379
|
—
|
382
|
29
|
29
|
||||||||||||||||||
|
Consumer:
|
||||||||||||||||||||||||
|
Home equity
|
28
|
28
|
—
|
23
|
2
|
2
|
||||||||||||||||||
|
Total
|
$
|
2,099
|
$
|
2,014
|
$
|
—
|
$
|
2,067
|
$
|
128
|
$
|
128
|
||||||||||||
|
2023
|
2022
|
|||||||
|
Land
|
$
|
2,568
|
$
|
2,486
|
||||
|
Buildings
|
23,867
|
22,526
|
||||||
|
Leasehold improvements
|
1,555
|
1,509
|
||||||
|
Furniture and equipment
|
11,137
|
10,410
|
||||||
|
39,127
|
36,931
|
|||||||
|
Less accumulated depreciation
|
17,677
|
16,495
|
||||||
|
Total premises and equipment
|
$
|
21,450
|
$
|
20,436
|
||||
|
2023
|
2022
|
|||||||
|
Land
|
$
|
84
|
$
|
84
|
||||
|
Buildings
|
594
|
594
|
||||||
|
678
|
678
|
|||||||
|
Less accumulated depreciation
|
105
|
85
|
||||||
|
Total premises and equipment held for sale
|
$
|
573
|
$
|
593
|
||||
|
2023
|
2022
|
|||||||
|
Operating leases:
|
||||||||
|
Operating lease right-of-use assets
|
$
|
1,205
|
$
|
1,294
|
||||
|
Operating lease liabilities
|
1,205
|
1,294
|
||||||
|
2023
|
2022
|
|||||||
|
Operating lease cost
|
$
|
204
|
$
|
185
|
||||
|
Short-term lease expense
|
17
|
35
|
||||||
|
Operating
Leases
|
||||
|
2024
|
$
|
195
|
||
|
2025
|
195
|
|||
|
2026
|
140
|
|||
|
2027
|
109
|
|||
|
2028
|
111
|
|||
|
Thereafter
|
764
|
|||
|
Total lease payments
|
1,514
|
|||
|
Less: Imputed Interest
|
(309 | ) | ||
|
Total operating leases
|
$
|
1,205
|
||
|
2023
|
2022
|
|||||||
|
Weighted-average remaining lease term for operating leases
|
13.0 years
|
12.1 years
|
||||||
|
Weighted-average discount rate for operating leases
|
2.91
|
%
|
2.70
|
%
|
||||
| Gross Carrying Amount |
||||||||
|
2023
|
2022
|
|||||||
|
Goodwill
|
$
|
7,319
|
$
|
7,319
|
||||
|
2023
|
2022
|
|||||||||||||||
|
Gross Carrying
Amount
|
Accumulated
Amortization
|
Gross Carrying
Amount
|
Accumulated
Amortization
|
|||||||||||||
|
Amortized intangible assets:
|
||||||||||||||||
|
Core deposit intangibles
|
$
|
738
|
$
|
730
|
$
|
738
|
$
|
709
|
||||||||
|
2024
|
$
|
8
|
||
|
2025
|
—
|
|||
|
2026
|
—
|
|||
|
2027
|
—
|
|||
|
2028
|
—
|
|||
|
Total
|
$
|
8
|
|
2023
|
2022
|
|||||||
|
Noninterest-bearing deposits
|
$ | 322,222 | $ | 354,413 | ||||
|
Interest-bearing deposits:
|
||||||||
|
NOW accounts
|
170,422
|
209,758
|
||||||
|
Savings and Money Market
|
255,369
|
311,565
|
||||||
|
Time deposits in denominations of $250 or less
|
301,323
|
115,049
|
||||||
|
Time deposits in denominations of more than $250
|
77,800
|
36,870
|
||||||
|
Total time deposits
|
379,123
|
151,919
|
||||||
|
Total interest-bearing deposits
|
804,914
|
673,242
|
||||||
|
Total deposits
|
$ | 1,127,136 | $ | 1,027,655 | ||||
|
2024
|
$
|
261,922
|
||
|
2025
|
95,860
|
|||
|
2026
|
19,001
|
|||
|
2027
|
1,139
|
|||
|
2028
|
1,023
|
|||
|
Thereafter
|
178
|
|||
|
Total
|
$
|
379,123
|
|
FHLB
Borrowings
|
Promissory
Notes
|
Totals
|
||||||||||
|
2023
|
$
|
42,199
|
$
|
2,394
|
$
|
44,593
|
||||||
|
2022
|
$
|
15,569
|
$
|
2,376
|
$
|
17,945
|
||||||
|
|
FHLB
Borrowings
|
Promissory
Notes
|
Totals
|
|||||||||
|
2024
|
$
|
5,412
|
$
|
2,394
|
$
|
7,806
|
||||||
|
2025
|
4,983
|
—
|
4,983
|
|||||||||
|
2026
|
12,908
|
—
|
12,908
|
|||||||||
|
2027
|
11,397
|
—
|
11,397
|
|||||||||
|
2028
|
1,349
|
—
|
1,349
|
|||||||||
|
Thereafter
|
6,150
|
—
|
6,150
|
|||||||||
|
$
|
42,199
|
$
|
2,394
|
$
|
44,593
|
|||||||
|
2023
|
2022
|
|||||||
|
Current tax expense
|
$
|
3,312
|
$
|
2,306
|
||||
|
Deferred tax (benefit) expense
|
(745
|
)
|
288
|
|||||
|
Total income taxes
|
$
|
2,567
|
$
|
2,594
|
||||
|
2023
|
2022
|
|||||||
|
Items giving rise to deferred tax assets:
|
||||||||
|
Other reserves
|
$ | 152 | $ | — | ||||
|
Allowance for loan losses
|
1,916
|
|
1,146
|
|||||
|
Unrealized loss on securities available for sale
|
3,233 | 3,938 | ||||||
|
Deferred compensation
|
2,176
|
2,058
|
||||||
|
Deferred loan fees/costs
|
169
|
137
|
||||||
|
Accrued bonus
|
249
|
266
|
||||||
|
Purchase accounting adjustments
|
11
|
6
|
||||||
|
Net operating loss
|
49
|
66
|
||||||
|
Lease liability
|
332
|
355
|
||||||
|
Nonaccrual interest income
|
113 | 204 | ||||||
|
Other
|
43
|
294
|
||||||
|
Items giving rise to deferred tax liabilities:
|
||||||||
|
Mortgage servicing rights
|
(88
|
)
|
(99
|
)
|
||||
|
FHLB stock dividends
|
(442
|
)
|
(676
|
)
|
||||
|
Prepaid expenses
|
(35
|
)
|
(231
|
)
|
||||
|
Depreciation and amortization
|
(841
|
)
|
(843
|
)
|
||||
|
Right-of-use asset
|
(332
|
)
|
(355
|
)
|
||||
|
Other
|
(399 | ) | — | |||||
|
Net deferred tax asset
|
$
|
6,306
|
$
|
6,266
|
||||
|
2023
|
2022
|
|||||||
|
Statutory tax (21%)
|
$
|
3,192
|
$
|
3,346
|
||||
|
Effect of nontaxable interest
|
(468
|
)
|
(385
|
)
|
||||
|
Effect of nontaxable insurance premiums
|
(205
|
)
|
(240
|
)
|
||||
|
Income from bank owned insurance, net
|
(181
|
)
|
(168
|
)
|
||||
|
Effect of postretirement benefits
|
45
|
(112
|
)
|
|||||
|
Effect of state income tax
|
170
|
155
|
||||||
|
Tax credits
|
(25
|
)
|
(37
|
)
|
||||
|
Other items
|
39
|
35
|
||||||
|
Total income taxes(1)
|
$
|
2,567
|
$
|
2,594
|
||||
|
2023
|
2022
|
|||||||
|
Fixed rate
|
$
|
1,331
|
$
|
1,110
|
||||
|
Variable rate
|
181,622
|
177,151
|
||||||
|
Standby letters of credit
|
9,210
|
3,441
|
||||||
|
Total loans at January 1, 2023
|
$
|
16,696
|
||
|
New loans
|
855
|
|||
|
Repayments
|
(1,065
|
)
|
||
|
Other changes
|
—
|
|||
|
Total loans at December 31, 2023
|
$
|
16,486
|
|
Years ended December 31
|
||||||||
|
2023
|
2022
|
|||||||
|
Number of shares issued
|
4,746
|
18,522
|
||||||
|
Fair value of stock contributed
|
$
|
125
|
$
|
575
|
||||
|
Cash contributed
|
473
|
—
|
||||||
|
Total expense
|
$
|
598
|
$
|
575
|
||||
|
Fair Value Measurements at December 31, 2023, Using
|
||||||||||||
|
Quoted Prices in
Active Markets
for Identical
Assets
(Level 1)
|
Significant Other
Observable
Inputs
(Level 2)
|
Significant
Unobservable
Inputs
(Level 3)
|
||||||||||
|
Assets:
|
||||||||||||
| U.S. Government securities | $ |
50,297 | $ |
— | $ |
— | ||||||
|
U.S. Government sponsored entity securities
|
—
|
|
5,877
|
—
|
||||||||
|
Agency mortgage-backed securities, residential
|
—
|
106,084
|
—
|
|||||||||
|
Interest rate swap derivatives
|
—
|
1,147
|
—
|
|||||||||
|
Liabilities:
|
||||||||||||
|
Interest rate swap derivatives
|
—
|
(1,147
|
)
|
—
|
||||||||
|
Fair Value Measurements at December 31, 2022, Using
|
||||||||||||
|
Quoted Prices in
Active Markets
for Identical
Assets
(Level 1)
|
Significant Other
Observable
Inputs
(Level 2)
|
Significant
Unobservable
Inputs
(Level 3)
|
||||||||||
|
Assets:
|
||||||||||||
| U.S. Government securities | $ |
54,792 | $ |
— | $ |
— | ||||||
|
U.S. Government sponsored entity securities
|
—
|
|
7,983
|
—
|
||||||||
|
Agency mortgage-backed securities, residential
|
—
|
121,299
|
—
|
|||||||||
|
Interest rate swap derivatives
|
—
|
1,340
|
—
|
|||||||||
|
Liabilities:
|
||||||||||||
|
Interest rate swap derivatives
|
—
|
(1,340
|
)
|
—
|
||||||||
|
Fair Value Measurements at December 31, 2023 Using:
|
||||||||||||||||||||
|
Carrying
Value
|
Level 1
|
Level 2
|
Level 3
|
Total
|
||||||||||||||||
|
Financial Assets:
|
||||||||||||||||||||
|
Cash and cash equivalents
|
$
|
128,126
|
$
|
128,126
|
$
|
—
|
$
|
—
|
$
|
128,126
|
||||||||||
|
Certificates of deposit in financial institutions
|
—
|
—
|
—
|
—
|
—
|
|||||||||||||||
|
Securities available for sale
|
162,258
|
50,297
|
111,961
|
—
|
162,258
|
|||||||||||||||
|
Securities held to maturity
|
7,986
|
—
|
4,281
|
3,109
|
7,390
|
|||||||||||||||
|
Loans, net
|
963,133
|
—
|
—
|
944,544
|
944,544
|
|||||||||||||||
|
Interest rate swap derivatives
|
1,147
|
—
|
1,147
|
—
|
1,147
|
|||||||||||||||
|
Accrued interest receivable
|
3,606
|
—
|
466
|
3,140
|
3,606
|
|||||||||||||||
|
Financial Liabilities:
|
||||||||||||||||||||
|
Deposits
|
1,127,136
|
748,013
|
379,455
|
—
|
1,127,468
|
|||||||||||||||
|
Other borrowed funds
|
44,593
|
—
|
45,799
|
—
|
45,799
|
|||||||||||||||
|
Subordinated debentures
|
8,500
|
—
|
8,500
|
—
|
8,500
|
|||||||||||||||
|
Interest rate swap derivatives
|
1,147
|
—
|
1,147
|
—
|
1,147
|
|||||||||||||||
|
Accrued interest payable
|
6,597
|
1
|
6,596
|
—
|
6,597
|
|||||||||||||||
|
Fair Value Measurements at December 31, 2022 Using:
|
||||||||||||||||||||
|
Carrying
Value
|
Level 1
|
Level 2
|
Level 3
|
Total
|
||||||||||||||||
|
Financial Assets:
|
||||||||||||||||||||
|
Cash and cash equivalents
|
$
|
45,990
|
$
|
45,990
|
$
|
—
|
$
|
—
|
$
|
45,990
|
||||||||||
|
Certificates of deposit in financial institutions
|
1,862
|
—
|
1,862
|
—
|
1,862
|
|||||||||||||||
|
Securities available for sale
|
184,074
|
54,792
|
129,282
|
—
|
184,074
|
|||||||||||||||
|
Securities held to maturity
|
9,226
|
—
|
4,987
|
3,473
|
8,460
|
|||||||||||||||
|
Loans, net
|
879,780
|
—
|
—
|
846,870
|
846,870
|
|||||||||||||||
|
Interest rate swap derivatives
|
1,340
|
—
|
1,340
|
—
|
1,340
|
|||||||||||||||
|
Accrued interest receivable
|
3,112
|
—
|
485
|
2,627
|
3,112
|
|||||||||||||||
|
Financial Liabilities:
|
||||||||||||||||||||
|
Deposits
|
1,027,655
|
875,736
|
149,974
|
—
|
1,025,710
|
|||||||||||||||
|
Other borrowed funds
|
17,945
|
—
|
16,364
|
—
|
16,364
|
|||||||||||||||
|
Subordinated debentures
|
8,500
|
—
|
8,500
|
—
|
8,500
|
|||||||||||||||
|
Interest rate swap derivatives
|
1,340
|
—
|
1,340
|
—
|
1,340
|
|||||||||||||||
|
Accrued interest payable
|
432
|
1
|
431
|
—
|
432
|
|||||||||||||||
|
Actual
|
To Be Well Capitalized
Under Prompt Corrective
Action Regulations
|
|||||||||||||||
|
Bank
|
Amount
|
Ratio
|
Amount
|
Ratio
|
||||||||||||
|
Tier 1 capital (to average assets)
|
||||||||||||||||
|
December 31, 2023
|
$
|
142,895
|
10.8
|
%
|
$
|
118,910
|
9.0
|
%
|
||||||||
|
December 31, 2022
|
135,404
|
11.0
|
110,806
|
9.0
|
||||||||||||
|
Years ended December 31:
|
||||||||
|
Assets
|
2023
|
2022
|
||||||
|
Cash and cash equivalents
|
$
|
6,248
|
$
|
4,697
|
||||
|
Investment in subsidiaries
|
148,597
|
141,402
|
||||||
|
Notes receivable – subsidiaries
|
2,683
|
2,365
|
||||||
|
Other assets
|
293
|
259
|
||||||
|
Total assets
|
$
|
157,821
|
$
|
148,723
|
||||
|
Liabilities
|
||||||||
|
Notes payable
|
$
|
2,394
|
$
|
2,376
|
||||
|
Subordinated debentures
|
8,500
|
8,500
|
||||||
|
Other liabilities
|
2,920
|
2,819
|
||||||
|
Total liabilities
|
13,814
|
13,695
|
||||||
|
Shareholders’ Equity
|
||||||||
|
Total shareholders’ equity
|
144,007
|
135,028
|
||||||
|
Total liabilities and shareholders’ equity
|
$
|
157,821
|
$
|
148,723
|
||||
|
Years ended December 31:
|
||||||||
|
Income:
|
2023
|
2022
|
||||||
|
Interest on notes
|
$
|
91
|
$
|
29
|
||||
|
Dividends from subsidiaries
|
5,020
|
4,180
|
||||||
|
Expenses:
|
||||||||
|
Interest on notes
|
91
|
29
|
||||||
|
Interest on subordinated debentures
|
598
|
296
|
||||||
|
Operating expenses
|
369
|
396
|
||||||
|
Income before income taxes and equity in undistributed earnings of subsidiaries
|
4,053
|
3,488
|
||||||
|
Income tax benefit
|
196
|
141
|
||||||
|
Equity in undistributed earnings of subsidiaries
|
8,382
|
9,709
|
||||||
|
Net Income
|
$
|
12,631
|
$
|
13,338
|
||||
|
Other comprehensive income (loss), net of tax
|
3,385 | (15,521 | ) | |||||
|
Comprehensive Income
|
$
|
16,016
|
$
|
(2,183
|
)
|
|||
|
Years ended December 31:
|
||||||||
|
Cash flows from operating activities:
|
2023
|
2022
|
||||||
|
Net Income
|
$
|
12,631
|
$
|
13,338
|
||||
|
Adjustments to reconcile net income to net cash provided by operating activities:
|
||||||||
|
Equity in undistributed earnings of subsidiaries
|
(8,382
|
)
|
(9,709
|
)
|
||||
|
Common stock issued to ESOP
|
124 | 575 | ||||||
|
Change in other assets
|
(34
|
)
|
(221
|
)
|
||||
|
Change in other liabilities
|
101
|
72
|
||||||
|
Net cash provided by operating activities
|
4,440
|
4,055
|
||||||
|
Cash flows from investing activities:
|
||||||||
|
Proceeds from closing of OVBC Captive
|
2,364
|
— |
||||||
|
Change in notes receivable
|
(318
|
)
|
(242
|
)
|
||||
|
Net cash provided by (used in) investing activities
|
2,046
|
(242
|
)
|
|||||
|
Cash flows from financing activities:
|
|
|
||||||
|
Change in notes payable
|
18
|
238
|
||||||
|
Purchases of treasury stock
|
(82 | ) | — | |||||
|
Cash dividends paid
|
(4,871
|
)
|
(4,720
|
)
|
||||
|
Net cash used in financing activities
|
(4,935
|
)
|
(4,482
|
)
|
||||
|
Cash and cash equivalents:
|
||||||||
|
Change in cash and cash equivalents
|
1,551
|
(669
|
)
|
|||||
|
Cash and cash equivalents at beginning of year
|
4,697
|
5,366
|
||||||
|
Cash and cash equivalents at end of year
|
$
|
6,248
|
$
|
4,697
|
||||
|
Year Ended December 31, 2023
|
||||||||||||
|
Banking
|
Consumer
Finance
|
Total
Company
|
||||||||||
|
Net interest income
|
$
|
43,711
|
$
|
2,316
|
$
|
46,027
|
||||||
|
Provision for (recovery of) loan losses
|
2,025
|
65
|
2,090
|
|||||||||
|
Noninterest income
|
11,513
|
1,116
|
12,629
|
|||||||||
|
Noninterest expense
|
38,833
|
2,535
|
41,368
|
|||||||||
|
Provision for income taxes
|
2,394
|
173
|
2,567
|
|||||||||
|
Net income
|
11,972
|
659
|
12,631
|
|||||||||
|
Assets
|
1,336,861
|
15,274
|
1,352,135
|
|||||||||
|
Year Ended December 31, 2022
|
||||||||||||
|
Banking
|
Consumer
Finance
|
Total
Company |
||||||||||
|
Net interest income
|
$
|
42,529
|
$
|
2,249
|
$
|
44,778
|
||||||
|
Provision for (recovery of) loan losses
|
(100
|
)
|
68
|
(32
|
)
|
|||||||
|
Noninterest income
|
9,121
|
1,041
|
10,162
|
|||||||||
|
Noninterest expense
|
36,612
|
2,428
|
39,040
|
|||||||||
|
Provision for income taxes
|
2,429
|
165
|
2,594
|
|||||||||
|
Net income
|
12,709
|
629
|
13,338
|
|||||||||
|
Assets
|
1,195,974
|
14,813
|
1,210,787
|
|||||||||
|
•
|
With the assistance of our valuation specialists, evaluating the appropriateness and conceptual design of the Cumulative Undiscounted Expected
Loss model including the evaluation of the reasonable and supportable forecast adjustments and the mathematical accuracy of the model.
|
|
•
|
Evaluating of the relevance and reliability of data used in the model development and the determination of reasonable and supportable forecast adjustments
|
|
|
|
/s/Crowe LLP
|
|
|
|
Crowe LLP
|
|
|
|
|
|
We have served as the Company’s auditor since 1992.
|
|
|
|
|
|
|
|
Cleveland, Ohio
|
|
|
|
March 15, 2024
|
|
|
|
|
|
|
Larry E. Miller, II
President and Chief Executive Officer
|
Scott W. Shockey
Senior Vice President, CFO
|
|
March 15, 2024
|
|
|
December 31
|
|||||||||||||||||||||||
|
Table I
|
2023
|
2022
|
||||||||||||||||||||||
|
(dollars in thousands)
|
Average Balance
|
Income/
Expense
|
Yield/
Average
|
Average Balance
|
Income/
Expense
|
Yield/
Average
|
||||||||||||||||||
|
Assets
|
||||||||||||||||||||||||
|
Interest-earning assets:
|
||||||||||||||||||||||||
|
Interest-bearing balances with banks
|
$
|
59,475
|
$
|
2,880
|
4.84
|
%
|
$
|
112,112
|
$
|
1,507
|
1.34
|
%
|
||||||||||||
|
Securities:
|
||||||||||||||||||||||||
|
Taxable
|
179,501
|
4,002
|
2.23
|
199,446
|
3,656
|
1.83
|
||||||||||||||||||
|
Tax exempt
|
7,407
|
200
|
2.70
|
8,028
|
227
|
2.83
|
||||||||||||||||||
|
Loans
|
935,772
|
55,374
|
5.92
|
844,413
|
42,712
|
5.06
|
||||||||||||||||||
|
Total interest-earning assets
|
1,182,155
|
62,456
|
5.28
|
%
|
1,163,999
|
48,102
|
4.13
|
%
|
||||||||||||||||
|
|
||||||||||||||||||||||||
|
Noninterest-earning assets:
|
||||||||||||||||||||||||
|
Cash and due from banks
|
15,024
|
14,767
|
||||||||||||||||||||||
|
Other nonearning assets
|
86,077
|
81,303
|
||||||||||||||||||||||
|
Allowance for loan losses
|
(7,749
|
)
|
(5,417
|
)
|
||||||||||||||||||||
|
Total noninterest-earning assets
|
93,352
|
90,653
|
||||||||||||||||||||||
|
Total assets
|
$
|
1,275,507
|
$
|
1,254,652
|
||||||||||||||||||||
|
|
||||||||||||||||||||||||
|
Liabilities and Shareholders’ Equity
|
||||||||||||||||||||||||
|
Interest-bearing liabilities:
|
||||||||||||||||||||||||
|
NOW accounts
|
$
|
196,086
|
$
|
1,988
|
1.01
|
%
|
$
|
226,709
|
$
|
778
|
0.34
|
%
|
||||||||||||
|
Savings and money market
|
272,217
|
2,213
|
0.81
|
322,272
|
242
|
0.08
|
||||||||||||||||||
|
Time deposits
|
279,260
|
9,973
|
3.57
|
169,682
|
1,110
|
0.65
|
||||||||||||||||||
|
Other borrowed money
|
31,865
|
1,067
|
3.35
|
19,954
|
412
|
2.06
|
||||||||||||||||||
|
Subordinated debentures
|
8,500
|
597
|
7.03
|
8,500
|
296
|
3.48
|
||||||||||||||||||
|
Total int.-bearing liabilities
|
787,928
|
15,838
|
2.01
|
%
|
747,117
|
2,838
|
0.38
|
%
|
||||||||||||||||
|
|
||||||||||||||||||||||||
|
Noninterest-bearing liabilities:
|
||||||||||||||||||||||||
|
Demand deposit accounts
|
328,573
|
353,019
|
||||||||||||||||||||||
|
Other liabilities
|
22,237
|
19,295
|
||||||||||||||||||||||
|
Total noninterest-bearing liabilities
|
350,810
|
372,314
|
||||||||||||||||||||||
|
|
||||||||||||||||||||||||
|
Shareholders’ equity
|
136,769
|
135,221
|
||||||||||||||||||||||
|
Total liabilities and shareholders’ equity
|
$
|
1,275,507
|
$
|
1,254,652
|
||||||||||||||||||||
|
|
||||||||||||||||||||||||
|
Net interest earnings
|
$
|
46,618
|
$
|
45,264
|
||||||||||||||||||||
|
Net interest margin
|
3.94
|
%
|
3.89
|
%
|
||||||||||||||||||||
|
Net interest rate spread
|
3.27
|
%
|
3.75
|
%
|
||||||||||||||||||||
|
Average interest-bearing liabilities to average earning assets
|
66.65
|
%
|
64.19
|
%
|
||||||||||||||||||||
|
RATE VOLUME ANALYSIS OF CHANGES IN INTEREST INCOME & EXPENSE
Table II
|
|
(dollars in thousands)
|
2023
|
2022
|
||||||||||||||||||||||
|
|
Increase (Decrease)
From Previous Year Due to
|
Increase (Decrease)
From Previous Year Due to
|
||||||||||||||||||||||
|
|
Volume
|
Yield/Rate
|
Total
|
Volume
|
Yield/Rate
|
Total
|
||||||||||||||||||
|
Interest income
|
||||||||||||||||||||||||
|
Interest-bearing balances with banks
|
$
|
(989
|
)
|
$
|
2,362
|
$
|
1,373
|
$
|
(40
|
)
|
$
|
1,352
|
$
|
1,312
|
||||||||||
|
Securities:
|
||||||||||||||||||||||||
|
Taxable
|
(391
|
)
|
737
|
346
|
565
|
912
|
1,477
|
|||||||||||||||||
|
Tax exempt
|
(17
|
)
|
(10
|
)
|
(27
|
)
|
(20
|
)
|
(50
|
)
|
(70
|
)
|
||||||||||||
|
Loans
|
4,927
|
7,735
|
12,662
|
138
|
55
|
193
|
||||||||||||||||||
|
Total interest income
|
3,530
|
10,824
|
14,354
|
643
|
2,269
|
2,912
|
||||||||||||||||||
|
|
||||||||||||||||||||||||
|
Interest expense
|
||||||||||||||||||||||||
|
NOW accounts
|
(118
|
)
|
1,328
|
1,210
|
50
|
48
|
98
|
|||||||||||||||||
|
Savings and money market
|
(43
|
)
|
2,014
|
1,971
|
20
|
(43
|
)
|
(23
|
)
|
|||||||||||||||
|
Time deposits
|
1,121
|
7,742
|
8,863
|
(279
|
)
|
(643
|
)
|
(922
|
)
|
|||||||||||||||
|
Other borrowed money
|
321
|
334
|
655
|
(127
|
)
|
(25
|
)
|
(152
|
)
|
|||||||||||||||
|
Subordinated debentures
|
----
|
301
|
301
|
----
|
138
|
138
|
||||||||||||||||||
|
Total interest expense
|
1,281
|
11,719
|
13,000
|
(336
|
)
|
(525
|
)
|
(861
|
)
|
|||||||||||||||
|
Net interest earnings
|
$
|
2,249
|
$
|
(895
|
)
|
$
|
1,354
|
$
|
979
|
$
|
(2,794
|
)
|
$
|
3,773
|
||||||||||
| Investment Portfolio Composition |
|
| at December 31, 2023 |
at December 31, 2022 |
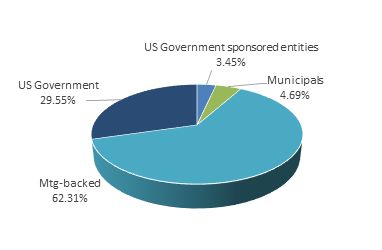
|
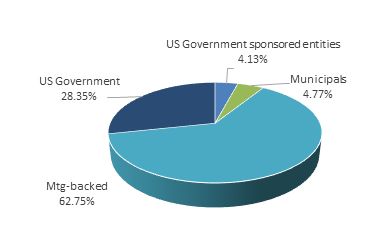
|
|
|
MATURING
|
|||||||||||||||||||||||||||||||
|
As of December 31, 2023
|
Within One Year
|
After One but Within Five Years
|
After Five but Within Ten Years
|
After Ten Years
|
||||||||||||||||||||||||||||
|
(dollars in thousands)
|
Amount
|
Yield
|
Amount
|
Yield
|
Amount
|
Yield
|
Amount
|
Yield
|
||||||||||||||||||||||||
|
|
||||||||||||||||||||||||||||||||
|
U.S. Government securities
|
$
|
17,257
|
2.88
|
%
|
$
|
33,040
|
2.01
|
%
|
$
|
----
|
----
|
$
|
----
|
----
|
||||||||||||||||||
|
U.S. Government sponsored entity
securities
|
----
|
----
|
5,877
|
1.57
|
%
|
----
|
----
|
----
|
----
|
|||||||||||||||||||||||
|
Obligations of states and
political subdivisions
|
392
|
2.94
|
%
|
3,780
|
2.87
|
%
|
1,298
|
2.57
|
%
|
1,920
|
2.81
|
%
|
||||||||||||||||||||
|
Agency mortgage-backed
securities, residential
|
21
|
3.99
|
%
|
4,003
|
2.48
|
%
|
36,842
|
2.05
|
%
|
65,218
|
1.60
|
%
|
||||||||||||||||||||
|
Total securities
|
$
|
17,670
|
2.88
|
%
|
$
|
46,700
|
2.06
|
%
|
$
|
38,140
|
2.07
|
%
|
$
|
67,138
|
1.68
|
%
|
||||||||||||||||
|
Tax-equivalent adjustments of $38 have been made in calculating yields on obligations of states and political subdivisions using a 21% rate. Weighted average yields are calculated on the basis of the
cost and effective yields weighted for the scheduled maturity of each security. Mortgage-backed securities, which have prepayment provisions, are assigned to a maturity category based on estimated average lives. Securities are shown at
their fair values, which include the market value adjustments for AFS securities.
|
|
Loan Portfolio Composition
|
|
|
at December 31, 2023
|
at December 31, 2022
|
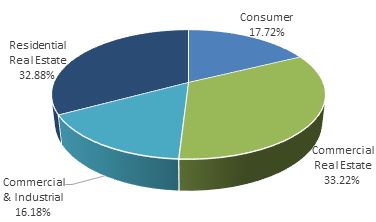 |
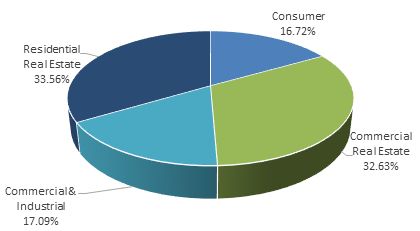
|
|
(dollars in thousands)
|
||||||||
|
|
Amount
|
% of Total
|
||||||
|
Real Estate Rental and Leasing
|
$
|
145,302
|
45.00
|
%
|
||||
|
Accommodation and Food Services
|
50,421
|
15.61
|
%
|
|||||
|
Health Care and Social Assistance
|
24,628
|
7.63
|
%
|
|||||
|
Construction
|
22,490
|
6.96
|
%
|
|||||
|
Manufacturing
|
20,688
|
6.41
|
%
|
|||||
|
Retail Trade
|
17,714
|
5.49
|
%
|
|||||
|
All Other
|
41,651
|
12.90
|
%
|
|||||
|
Total
|
$
|
322,894
|
100.00
|
%
|
||||
|
|
| (dollars in thousands) | |||||||||||||||||||
|
|
Within One Year
|
After One
but Within
Five Years
|
After Five
but Within
Fifteen Years
|
After
Fifteen Years
|
Total
|
||||||||||||||
|
Residential real estate loans
|
$
|
63,948
|
$
|
197,328
|
$
|
53,954
|
$
|
4,274
|
$
|
319,504
|
|||||||||
|
Commercial real estate loans
|
89,420
|
199,993
|
32,836
|
645
|
322,894
|
||||||||||||||
|
Commercial and industrial loans
|
50,170
|
41,792
|
39,773
|
25,563
|
157,298
|
||||||||||||||
|
Consumer loans(1)
|
66,593
|
70,595
|
35,016
|
----
|
172,204
|
||||||||||||||
|
Total loans
|
$
|
270,131
|
$
|
509,708
|
$
|
161,579
|
$
|
30,482
|
$
|
971,900
|
|||||||||
|
Loans maturing or repricing after one year with:
|
Variable Interest
Rates
|
Fixed Interest Rates
|
Total
|
|||||||||
|
Residential real estate loans
|
$
|
207,515
|
$
|
48,041
|
$
|
255,556
|
||||||
|
Commercial real estate loans
|
198,873
|
34,601
|
233,474
|
|||||||||
|
Commercial and industrial loans
|
27,730
|
79,398
|
107,128
|
|||||||||
|
Consumer loans(1)
|
84
|
105,527
|
105,611
|
|||||||||
|
Total loans
|
$
|
434,202
|
$
|
267,567
|
$
|
701,769
|
||||||
|
(dollars in thousands)
|
||||||||
|
Years Ended December 31
|
||||||||
|
|
2023
|
2022
|
||||||
|
Residential real estate loans
|
$
|
2,213
|
$
|
681
|
||||
|
Percentage of loans to total loans
|
32.87
|
%
|
33.56
|
%
|
||||
|
Percentage of net charge-offs to average loans
|
.02
|
%
|
-.01
|
%
|
||||
|
Commercial real estate loans
|
3,047
|
2,038
|
||||||
|
Percentage of loans to total loans
|
33.22
|
%
|
32.63
|
%
|
||||
|
Percentage of net charge-offs to average loans
|
-.01
|
%
|
-.02
|
%
|
||||
|
Commercial and industrial loans
|
1,275
|
1,293
|
||||||
|
Percentage of loans to total loans
|
16.18
|
%
|
17.09
|
%
|
||||
|
Percentage of net charge-offs to average loans
|
-.12
|
%
|
.38
|
%
|
||||
|
Consumer loans(1)
|
2,232
|
1,257
|
||||||
|
Percentage of loans to total loans
|
17.72
|
%
|
16.73
|
%
|
||||
|
Percentage of net charge-offs to average loans
|
.51
|
%
|
.50
|
%
|
||||
|
Allowance for loan losses
|
$
|
8,767
|
$
|
5,269
|
||||
|
Total loans percentage
|
100.00
|
%
|
100.00
|
%
|
||||
|
Net charge-offs to average loans
|
.07
|
%
|
.14
|
%
|
||||
|
(dollars in thousands)
|
||||||||
|
Years Ended December 31
|
||||||||
|
|
2023
|
2022
|
||||||
|
Loans
|
$
|
971,900
|
$
|
885,049
|
||||
|
Allowance for loan losses
|
8,767
|
5,269
|
||||||
|
Past due 90 days or more and still accruing
|
119
|
538
|
||||||
|
Nonaccrual
|
2,392
|
3,233
|
||||||
|
Allowance for loan losses to total loans
|
.90
|
%
|
.60
|
%
|
||||
|
Nonaccrual loans to total loans
|
.25
|
%
|
.37
|
%
|
||||
|
Allowance for loan losses to nonaccrual loans
|
366.51
|
%
|
162.98
|
%
|
||||
|
Composition of Total Deposits
|
|
|
at December 31, 2023
|
at December 31, 2022
|
 |
 |
|
|
2023
|
2022
|
2021
|
2020
|
2019
|
|||||||||||||||
|
|
||||||||||||||||||||
|
Return on average assets
|
.99
|
%
|
1.06
|
%
|
.95
|
%
|
.94
|
%
|
.96
|
%
|
||||||||||
|
Return on average equity
|
9.24
|
%
|
9.86
|
%
|
8.45
|
%
|
7.83
|
%
|
8.10
|
%
|
||||||||||
|
Dividend payout ratio
|
38.56
|
%
|
35.39
|
%
|
34.25
|
%
|
39.20
|
%
|
40.37
|
%
|
||||||||||
|
Average equity to average assets
|
10.72
|
%
|
10.78
|
%
|
11.25
|
%
|
11.95
|
%
|
11.82
|
%
|
||||||||||

|
•
|
Projections of future earnings or losses, or other earnings guidance;
|
|
•
|
Changes to previously announced earnings guidance, or the decision to suspend earnings guidance;
|
|
•
|
A pending or proposed merger, acquisition, joint venture, or tender offer;
|
|
•
|
A pending or proposed acquisition or disposition of a significant asset;
|
|
•
|
Significant related party transactions;
|
|
•
|
A change in dividend policy, the declaration of a stock split, or an offering of additional securities;
|
|
•
|
Bank borrowings or other financing transactions out of the ordinary course;
|
|
•
|
The establishment of a repurchase program for Company Stock;
|
|
•
|
A change in management;
|
|
•
|
A change in auditors or notification that the auditor's reports may no longer be relied upon;
|
|
•
|
Pending or threatened significant litigation, or the resolution of such litigation;
|
|
•
|
Impending bankruptcy or the existence of severe liquidity problems;
|
|
•
|
A cybersecurity incident, including, but not limited to, a breach of our information systems; a discovered vulnerability of
our information systems; an accidental release of confidential information; a disruption of our system due to malware, ransomware or a distributed denial-of-service attack; or a cyber-incident suffered by a third party that affects the
Company; or
|
|
•
|
The imposition of an event-specific restriction on trading in Company Stock or the securities of another company.
|
|
•
|
Short-Term Trading. Short-term
trading of Company Stock may be distracting to the person and may unduly focus the person on the Company's short-term stock market performance instead of the Company's long-term business objectives. For these reasons, any director,
officer, or other employee of the Company who purchases Company Stock in the open market may not sell any Company Stock of the same class during the six months following the purchase (or vice versa). This prohibition applies only to
purchases in the open market, and does not apply to stock option exercises or other employee benefit plan transactions.
|
|
•
|
Short Sales. Short sales of
Company Stock (i.e., the sale of a security that the seller does not own) may evidence an expectation on the part of the seller that
the securities will decline in value, and therefore have the potential to signal to the market that the seller lacks confidence in the Company's prospects. In addition, short sales may reduce a seller's incentive to seek to improve the
Company's performance. For these reasons, short sales of Company Stock are prohibited. In addition, Section 16(c) of the Exchange Act prohibits officers and directors from engaging in short sales. (Short sales arising from certain types
of hedging transactions are governed by the paragraph below captioned "Hedging Transactions.")
|
|
•
|
Publicly-Traded Options. Given
the relatively short term of publicly-traded options, transactions in options may create the appearance that a director, officer, or employee is trading based on material non-public information and focus a director's, officer's, or other
employee's attention on short-term performance at the expense of the Company's long-term objectives. Accordingly, transactions in put options, call options or other derivative securities, on an exchange or in any other organized market,
are prohibited by this Policy. (Option positions arising from certain types of hedging transactions are governed by the next paragraph below.)
|
|
•
|
Hedging Transactions. Hedging or
monetization transactions can be accomplished through a number of possible mechanisms, including through the use of financial instruments such as prepaid variable forwards, equity swaps, collars and exchange funds. Such transactions may
permit a director, officer or employee to continue to own Company Stock obtained through employee benefit plans or otherwise, but without the full risks and rewards of ownership. When that occurs, the director, officer, or employee may no
longer have the same objectives as the Company's other shareholders. Therefore, the Company strongly discourages you from engaging in such transactions. The Company requires that any such transaction be reviewed by Larry Miller or Tom
Shepherd prior to the time you enter into it. Such officer will assess the proposed transaction and, in light of the facts and circumstances, make a determination as to whether the proposed transaction may be completed or would violate
this Policy.
|
|
•
|
Margin Accounts and Pledged Securities. Securities
held in a margin account as collateral for a margin loan may be sold by the broker without the customer's consent if the customer fails to meet a margin call. Similarly, securities pledged (or hypothecated) as collateral for a loan may be
sold in foreclosure if the borrower defaults on the loan. Because a margin sale or foreclosure sale may occur at a time when the pledgor is aware of material non-public information or otherwise is not permitted to trade in Company Stock,
directors, officers, and other employees are, except as otherwise noted herein, prohibited from holding Company Stock in a margin account or otherwise pledging Company Stock as collateral for a loan. (Pledges of Company Stock arising from
certain types of hedging transactions are governed by the paragraph above captioned "Hedging Transactions.") If you wish to pursue any such transaction, the Company requires that the transaction be approved by Larry Miller or Tom Shepherd
prior to the time you enter into it. Such officer will assess the proposed transaction and, in light of the facts and circumstances, make a determination as to whether the proposed transaction may be completed or would violate this
Policy.
|
|
•
|
Standing and Limit Orders. Standing
and limit orders (except standing and limit orders under approved Rule 10b5-1 Plans) create heightened risks for insider trading violations similar to the use of margin accounts. There is no control over the timing of purchases or sales
that result from standing instructions to a broker, and as a result, the broker could execute a transaction when a director, officer, or other employee is in possession of material non-public information. The Company therefore discourages
placing standing or limit orders on Company Stock. If a person subject to this Policy determines that they must use a standing order or limit order, the order should be limited to short duration and should be approved by Larry Miller or
Tom Shepherd prior to the time you enter into it.
|
|
•
|
Stock Option Exercises. This
Policy does not apply to the exercise of an employee stock option acquired pursuant to the Company's plans, or to the exercise of a tax withholding right pursuant to which a person has elected to have the Company withhold shares subject
to an option to satisfy tax withholding requirements. This Policy does apply, however, to any sale of stock as part of a broker-assisted cashless exercise of an option, or any other market sale for the purpose of generating the cash
needed to pay the exercise price of an option.
|
|
•
|
Restricted Stock Awards. This
Policy does not apply to the vesting of restricted stock, or the exercise of a tax withholding right pursuant to which you elect to have the Company withhold shares of stock to satisfy tax withholding requirements upon the vesting of any
restricted stock. The Policy does apply, however, to any market sale of restricted stock.
|
|
•
|
Dividend Reinvestment Plan. This
Policy does not apply to purchases of Company Stock under the Company's dividend reinvestment plan resulting from your reinvestment of dividends paid on Company Stock. This Policy does apply, however, to voluntary purchases of Company
Stock resulting from additional contributions you choose to make to the dividend reinvestment plan, and to your election to participate in the plan or increase your level of participation in the plan. This Policy also applies to your sale
of any Company Stock purchased pursuant to the plan.
|
|
•
|
Closed Window. Except as
otherwise provided herein, neither you or any Family Member, nor any Controlled Entity, may buy, sell or pledge Company Stock or engage in any other transaction involving Company Stock for a period beginning after the close of business on
the 15th day prior to the end of each fiscal quarter and ending the third business day following the public release by the Company of the prior quarter's or prior year's financial results.
|
|
•
|
Pre-Clearance. All transactions
involving Company Stock (including pledging, option, hedging and margin account transactions) by you, any Family Member, or any Controlled Entity must be pre-cleared by Larry Miller or Tom Shepherd. You must also pre-clear gifts of
Company Stock. If a transaction is contemplated, please contact one of such people in advance. Prior clearance is required for all purchases, sales and inclusion of Company Stock in a margin account. Each proposed transaction will be
evaluated to determine if it raises insider trading concerns or other concerns under the federal or state securities or banking laws and regulations or compliance with the Company's Code of Ethics. Any advice will relate solely to the
restraints imposed by law and will not constitute advice regarding the investment aspects of any transaction. Clearance of a transaction is valid only for a 48-hour period. If the transaction does not occur within that 48-hour period,
clearance of the transaction must be re-requested. If clearance is denied, the fact of such denial must be kept confidential by the person requesting such clearance.
|
|
NAME
|
STATE OF
INCORPORATION
|
PERCENTAGE
OF OWNERSHIP
|
||
|
The Ohio Valley Bank Company
|
Ohio
|
100%
|
||
|
Loan Central, Inc.
|
Ohio
|
100%
|
||
|
Ohio Valley Financial Services Agency, LLC
|
Ohio
|
100%
|
||
|
Ohio Valley Statutory Trust III
|
Delaware
|
100%
|
||
|
|
(a) |
designed such disclosure controls and procedures, or caused such disclosure controls and procedures to be designed under our supervision, to ensure that material
information relating to the registrant, including its consolidated subsidiaries, is made known to us by others within those entities, particularly during the period in which this report is being prepared;
|
|
|
(b) |
designed such internal control over financial reporting, or caused such internal control over financial reporting to be designed under our
supervision, to provide reasonable assurance regarding the reliability of financial reporting and the preparation of financial statements for external purposes in accordance with generally accepted accounting principles;
|
|
|
(c) |
evaluated the effectiveness of the registrant’s disclosure controls and procedures and presented in this report our conclusions about the
effectiveness of the disclosure controls and procedures, as of the end of the period covered by this report based on such evaluation; and
|
|
|
(d) |
disclosed in this report any change in the registrant’s internal control over financial reporting that occurred during the registrant’s most recent
fiscal quarter that has materially affected, or is reasonably likely to materially affect, the registrant’s internal control over financial reporting; and
|
|
|
(a) |
all significant deficiencies and material weaknesses in the design or operation of internal control over financial reporting which are reasonably
likely to adversely affect the registrant’s ability to record, process, summarize and report financial information; and
|
|
|
(b) |
any fraud, whether or not material, that involves management or other employees who have a significant role in the registrant’s internal control over financial
reporting.
|
|
Date: March 15, 2024
|
By:
|
/s/Larry E. Miller, II |
|
Larry E. Miller, II, President and CEO
|
||
|
(Principal Executive Officer)
|
|
|
(a) |
designed such disclosure controls and procedures, or caused such disclosure controls and procedures to be designed under our supervision, to ensure
that material information relating to the registrant, including its consolidated subsidiaries, is made known to us by others within those entities, particularly during the period in which this report is being prepared;
|
|
|
(b) |
designed such internal control over financial reporting, or caused such internal control over financial reporting to be designed under our
supervision, to provide reasonable assurance regarding the reliability of financial reporting and the preparation of financial statements for external purposes in accordance with generally accepted accounting principles;
|
|
|
(c) |
evaluated the effectiveness of the registrant’s disclosure controls and procedures and presented in this report our conclusions about the
effectiveness of the disclosure controls and procedures, as of the end of the period covered by this report based on such evaluation; and
|
|
|
(d) |
disclosed in this report any change in the registrant’s internal control over financial reporting that occurred during the registrant’s most recent
fiscal quarter that has materially affected, or is reasonably likely to materially affect, the registrant’s internal control over financial reporting; and
|
|
|
(a) |
all significant deficiencies and material weaknesses in the design or operation of internal control over financial reporting which are reasonably
likely to adversely affect the registrant’s ability to record, process, summarize and report financial information; and
|
|
|
(b) |
any fraud, whether or not material, that involves management or other employees who have a significant role in the registrant’s internal controls over financial
reporting.
|
|
Date: March 15, 2024
|
By:
|
/s/Scott W. Shockey |
|
Scott W. Shockey, Senior Vice President and CFO
|
||
|
(Principal Financial Officer)
|
|
|
(1) |
The Report fully complies with the requirements of Section 13(a) or 15(d) of the Securities Exchange Act of 1934; and
|
|
|
(2) |
The information contained in the Report fairly presents, in all material respects, the financial condition and results of operations of the
Corporation.
|
|
*/s/Larry E. Miller, II
|
*/s/Scott W. Shockey
|
|
|
Larry E. Miller, II
|
Scott W. Shockey
|
|
|
President and Chief Executive Officer
|
Senior Vice President and Chief Financial Officer
|
|
|
Dated: March 15, 2024
|
Dated: March 15, 2024
|
| * |
This certification is being furnished as required by Rule 13a-14(b) under the Securities Exchange Act of 1934 (the “Exchange
Act”) and Section 1350 of Chapter 63 of Title 18 of the United States Code, and shall not be deemed “filed” for purposes of Section 18 of the Exchange Act or otherwise subject to the liability of that Section. This certification shall not
be deemed to be incorporated by reference into any filing under the Securities Act of 1933 or the Exchange Act, except to the extent that the Corporation specifically incorporates it by reference in any such filing.
|
|
1.
|
Purpose. The
purpose of this Policy is to describe the circumstances in which Executive Officers will be required to repay or return Erroneously Awarded Compensation to members of the Company Group. Each Executive Officer shall be required to sign
and return to the Company the Acknowledgement Form attached hereto as Exhibit A pursuant to which such Executive Officer
will agree to be bound by the terms and comply with this Policy.
|
|
2.
|
Administration. This
Policy shall be administered by the Committee. Any determinations made by the Committee shall be final and binding on all affected individuals.
|
|
3.
|
Definitions. For
purposes of this Policy, the following capitalized terms shall have the meanings set forth below:
|
|
(a)
|
“Accounting
Restatement” shall mean an accounting restatement (i) due to the material noncompliance of the Company with any financial reporting requirement under the securities laws, including any required accounting restatement to correct
an error in previously issued financial restatements that is material to the previously issued financial statements (a “Big R” restatement), or (ii) that corrects an error that is not material to previously issued financial statements,
but would result in a material misstatement if the error were not corrected the current period or left uncorrected in the current period (a “little r” restatement).
|
|
(b)
|
“Board” shall mean the Board of Directors of the Company.
|
|
(c)
|
“Clawback
Eligible Incentive Compensation” shall mean, in connection with an Accounting Restatement and with respect to each individual who served as an Executive Officer at any time during the applicable performance period for any
Incentive-based Compensation (whether or not such Executive Officer is serving at the time the Erroneously Awarded Compensation is required to be repaid to the Company Group), all Incentive-based Compensation Received by such Executive
Officer (i) on or after the Effective Date, (ii) after beginning service as an Executive Officer, (iii) while the Company has a class of securities listed on a national securities exchange or a national securities association, and (iv)
during the applicable Clawback Period.
|
|
(d)
|
“Clawback Period” shall mean, with respect to any Accounting Restatement, the three completed fiscal years of the Company immediately preceding the Restatement Date and any transition period (that results from a change
in the Company’s fiscal year) of less than nine months within or immediately following those three completed fiscal years.
|
|
(e)
|
“Committee”
shall mean the Compensation and Management Succession Committee of the Board if composed entirely of independent directors, or in the absence of such a committee, a majority of independent directors serving on the Board.
|
|
(f)
|
“Company” shall mean Ohio Valley Banc Corp., an Ohio corporation.
|
|
(g)
|
“Company Group” shall mean the Company, together with each of its direct and indirect subsidiaries.
|
|
(h)
|
“Effective Date” shall mean October 2, 2023.
|
|
(i)
|
“Erroneously
Awarded Compensation” shall mean, with respect to each Executive Officer in connection with an Accounting Restatement, the amount of Clawback Eligible Incentive Compensation that exceeds the amount of Incentive-based
Compensation that otherwise would have been Received had it been determined based on the restated amounts, computed without regard to any taxes paid.
|
|
(j)
|
“Executive Officer” shall mean each individual who is currently or was previously designated as an “officer” of the Company as defined in 17 C.F.R. 240.16a-1(f). For the avoidance of doubt, the identification of an executive
officer for purposes of this Policy shall include the Company’s president, principal financial officer, principal accounting officer (or if there is no such accounting officer, the Company’s controller), any vice president of the Company
in charge of a principal business unit, division, or function (such as sales, administration, or finance), any other officer who performs a policy-making function, or any other person who performs similar policy- making functions for the
Company. Executive officers of the Company’s subsidiaries are deemed executive officer of the Company if they perform such policy-making functions for the Company. Policy-making function, for purposes of this definition, is not intended
to include policy-making functions that are not significant. Identification of an executive officer for purposes of this Policy would include at a minimum executive officers identified pursuant to 17 C.F.R. 229.401(b).
|
|
(k)
|
“Financial
Reporting Measures” shall mean measures that are determined and presented in accordance with the accounting principles used in preparing the Company’s financial statements, and all other measures that are derived wholly or in
part from such measures. Stock price and total shareholder return (and any measures that are derived wholly or in part from stock price or total shareholder return) shall for purposes of this Policy be considered Financial Reporting
Measures. For the avoidance of doubt, a Financial Reporting Measure need not be presented in the Company’s financial statements or included in a filing with the SEC.
|
|
(l)
|
“Incentive-based Compensation” shall mean any compensation that is granted, earned or vested based wholly or in part upon the attainment of a Financial Reporting Measure.
|
|
(m)
|
“Nasdaq” shall mean The Nasdaq Stock Market.
|
|
(n)
|
“Policy” shall mean this Policy for the Recovery of Erroneously Awarded Compensation, as the same may be amended and/or restated from time to time.
|
|
(o)
|
“Received” shall, with respect to any Incentive-based Compensation, mean actual or deemed receipt, and Incentive-based Compensation shall be deemed received in the Company’s fiscal period during which the Financial Reporting
Measure specified in the Incentive-based Compensation award is attained, even if payment or grant of the Incentive-based Compensation occurs after the end of that period.
|
|
(p)
|
“Restatement
Date” shall mean the earlier to occur of (i) the date the Board, a committee of the Board or the officers of the Company authorized to take such action if Boardaction is not required, concludes, or reasonably should have
concluded, that the Company is required to prepare an Accounting Restatement, or (ii) the date of court, regulator or other legally authorized body directs the Company to prepare an Accounting Restatement.
|
|
(q)
|
“SEC” shall
mean the U.S. Securities and Exchange Commission.
|
|
4.
|
Repayment of Erroneously Awarded Compensation.
|
|
(a)
|
In the event of an Accounting Restatement, the Company shall reasonably promptly recover the Erroneously Awarded
Compensation Received in accordance with Nasdaq Rules and 17 C.F.R. 240.10D-1. After an Accounting Restatement the Committee shall promptly determine the amount of any Erroneously Awarded Compensation for each Executive Officer in
connection with such Accounting Restatement and shall promptly thereafter provide each Executive Officer with a written notice containing the amount of Erroneously Awarded Compensation and a demand for repayment or return, as applicable.
For Incentive-based Compensation based on (or derived from) the Company’s stock price or total shareholder return where the amount of Erroneously Awarded Compensation is not subject to mathematical recalculation directly from the
information in the applicable Accounting Restatement, the amount shall be determined by the Committee based on a reasonable estimate of the effect of the Accounting Restatement on the Company’s stock price or total shareholder return upon
which the Incentive-based Compensation was Received (in which case, the Company shall maintain documentation of such determination of that reasonable estimate and provide such documentation to Nasdaq).
|
|
(b)
|
The Committee shall have broad discretion to determine the appropriate means of recovery of Erroneously Awarded Compensation
based on all applicable facts and circumstances and taking into account the time value of money and the cost to shareholders of delaying recovery. Except as set forth in Section 4(d) below, in no event may the Company Group accept an
amount that is less than the amount of Erroneously Awarded Compensation in satisfaction of an Executive Officer’s obligations hereunder.
|
|
(c)
|
To the extent that an Executive Officer fails to repay all Erroneously Awarded Compensation to
the Company Group when due (as determined in accordance with Section 4(b) above), the Company shall, or shall cause one or more other members of the Company Group to, take all actions reasonable and appropriate to recover such Erroneously
Awarded Compensation from the applicable Executive Officer. The applicable Executive Officer shall be required to reimburse the Company Group for any and all expenses reasonably incurred (including legal fees) by the Company Group in
recovering such Erroneously Awarded Compensation in accordance with the immediately preceding sentence.
|
|
(d)
|
Notwithstanding anything herein to the contrary, the Company shall not be required to take the actions contemplated by
Section 4(b) above if the Committee determines that recovery would be impracticable and that any of the following conditions are met:
|
|
(i)
|
The direct expenses paid to a third party to assist in enforcing the Policy against an Executive
Officer would exceed the amount to be recovered, after the Company has made a reasonable attempt to recover the applicable Erroneously Awarded Compensation, documented such reasonable attempt(s) to recover and provided such documentation
to Nasdaq;
|
|
(ii)
|
Recovery would likely cause an otherwise tax-qualified retirement plan, under which benefits are
broadly available to employees of the Company Group, to fail to meet the requirements of 26 U.S.C. 401(a)(13) or 26 U.S.C. 411(a), as amended, and regulations thereunder.
|
|
5.
|
Reporting and Disclosure. The
Company shall file all disclosures with respect to this Policy in accordance with the requirement of the federal securities laws, including the disclosure required by the applicable SEC filings.
|
|
6.
|
Indemnification Prohibition. No
member of the Company Group shall be permitted to indemnify any Executive Officer against (a) the loss of any Erroneously Awarded Compensation that is repaid, returned or recovered pursuant to the terms of this Policy, or (b) any claims
relating to the Company Group’s enforcement of its rights under this Policy. Further, no member of the Company Group shall enter into any agreement that exempts any Incentive-based Compensation that is granted, paid, or awarded to an
Executive Officer from the application of this Policy or that waives the Company Group’s right to recovery of any Erroneously Awarded Compensation and this Policy shall supersede any such agreement (whether entered into before, on or
after the Effective Date).
|
|
7.
|
Interpretation. The Committee is authorized to interpret and construe this Policy and to make all determinations necessary, appropriate, or advisable for the administration of this Policy.
|
|
8.
|
Effective
Date. This Policy shall be effective as of the Effective Date.
|
|
9.
|
Amendment; Termination. The
Committee may amend this Policy from time to time in its discretion and shall amend this Policy as the Committee deems necessary, including as and when the Committee determines that it is legally required by any federal securities laws,
SEC rule or the rules of any national securities exchange or national securities association on which the Company’s securities are listed. The Committee may terminate this Policy at any time. Notwithstanding anything in this Section 9 to
the contrary, no amendment or termination of this Policy shall be effective if such amendment or termination would (after taking into account any actions taken by the Company contemporaneously with such amendment or termination) cause the
Company to violate any federal securities laws, SEC rule or the rules of any national securities exchange or national securities association on which the Company’s securities are listed.
|
|
10.
|
Other Recoupment Rights; No Additional
Payments. The Committee intends that this Policy will be applied to the fullest extent of the law. The Committee may require that any employment agreement, equity award agreement, or any other agreement entered into on or after
the Effective Date shall, as a condition to the grant of any benefit thereunder, require an Executive Officer to agree to abide by the terms of this Policy. Any right of recoupment under this Policy is in addition to, and not in lieu of,
any other remedies or rights of recoupment that may be available to the Company Group under applicable law, regulation or rule or pursuant to the terms of any similar policy in any employment agreement, equity award agreement, or similar
agreement and any other legal remedies available to the Company Group.
|
|
11.
|
Successors. This Policy shall be binding and enforceable against all Executive Officers and their beneficiaries, heirs, executors, administrators or other legal representatives.
|
|
Signature
|
|
Printed Name
|
|
Date
|