|
☒ Form 20-F
|
☐ Form 40-F
|
|
Integrated Annual Report for Atlantica Sustainable Infrastructure plc for the year ended December 31, 2023 that has been made available to the shareholders on March 4, 2024
|
|
ATLANTICA SUSTAINABLE INFRASTRUCTURE PLC
|
||
|
By:
|
/s/Santiago Seage
|
|
|
Name:
|
Santiago Seage
|
|
|
Title:
|
Chief Executive Officer
|
|
|
Date:
|
March 14, 2024
|
|
Exhibit 99.1

| Content |
| Atlantica in Two Minutes | 3 |
| Our Purpose and Values | 5 |
| About This Report | 6 |
| Strategic Report | 11 |
| Our Sustainable Business Model and Strategy | 12 |
| Events During the Period | 20 |
| Key Performance Indicators | 30 |
| A Fair Review of the Business | 33 |
| Financial Review | 38 |
| Principal Risks and Uncertainties | 56 |
| ESG Materiality Analysis | 74 |
| Environmental Sustainability | 80 |
| Social Sustainability | 117 |
| Asset Management | 150 |
| Innovation Management | 154 |
| Cybersecurity and Data Privacy | 155 |
| Tax Management | 158 |
| Section 172 Statement | 160 |
| Going Concern Basis | 165 |
| Governance | 167 |
| Business Ethics |
167 |
| Sustainability Governance | 174 |
| Directors’ Report | 178 |
| Audit Committee Report | 198 |
| Directors’ Remuneration Report | 204 |
| Directors’ Responsibilities Statement | 230 |
| Shareholder Engagement | 232 |
| Other Information | 233 |
| Asset Portfolio | 234 |
| Definitions | 236 |
| Reconciliations | 242 |
| Global Reporting Initiative (GRI) Content Index | 244 |
| Sustainability Accounting Standards Board (SASB) Index | 253 |
| Environmental, Social and Other Key Performance Indicators | 257 |
| Independent Auditor’s Report | 270 |
| Consolidated Financial Statements | 280 |
| Company Financial Statements | 366 |
Atlantica in Two Minutes
| Our Business |

| 2023 Selected Financial and Operational Metrics |
|
Revenue
$1,100 Million |
Adjusted EBITDA
$795 Million |
Cash available for Distribution
$236 Million |
|
Operating Profit
$342 Million |
Dividends Paid per Share
$1.78 |
Renewable Energy
5,458 GWh Produced |
|
Total Assets as of December 31, 2023 $8.7 bn |
Renewable Generation Pipeline Growth ▲12% vs. 2022 |
|
1 100% Contracted or regulated. Regulated revenues in Spain, Chile TL 3 and Italy and non-contracted nor regulated in the case of Chile PV 1 and Chile PV 3.
2 Based on CAFD estimates for the 2024-2027 period as of March 1, 2024, for the assets as of December 31, 2023, including assets that have reached COD before March 1, 2023.
3 We refer to section “Strategic Report” for further detail regarding the pipeline description.
| Our Values |
|
Integrity, Compliance and Safety Value Creation Sustainability |
Excellence and Efficiency Collaborative Environment
|
| Enabling the Energy Transition |
|
Science Based Targets initiative (SBTi) approved target: Reduce Scope 1 and 2 GHG emissions per kWh of energy generated by 70% by 2035 from a 2020 base year |
|
Other Targets
ü Reduce Scope 3 GHG emissions per kWh of energy generated by 70% by 2035 from a 2020 base year ü Achieve Net Zero GHG emissions by 2040 ü Reduce non-GHG emissions per kWh of energy generated by 50% by 2035 from a 2020 ü Reduce our water consumption per kWh of energy generated by 50% by 2035 from a 2020 base year ü Reduce our hazardous and non-hazardous waste4 per unit of energy generated by 30% and 40%, respectively, by 2035 from a 2023 base year. |
| Key KPIS | |||
| EU Taxonomy assessment: 97% of CapEx invested in sustainable activities according to EU Taxonomy. |
GHG Emissions Avoided 7.0 million tons of CO2e |
GHG Emissions Offset 380 thousand tons of CO2e ▲ 23% vs 2021 |
Scope 1&2 emission rate per unit of energy generated 162 tons of gCO2/kWh Improved 9% vs 2021 |
| 2023 Selected Social Metrics |
|
Health and Safety: LTFI5 and TRFI4 below sector average
ü LTFI and TRFI Decreased vs. 2022
|
Training hours per employee
33 as of Dec. 2023 |
Local Communities
$1.5 million invested |
4 The target does not include the waste generated during end-of-life decommissioning of the assets.
5 We refer to section “Occupational Health and Safety” for further detail.
Our Purpose and Values
| Our Purpose |
Our purpose is to support the transition towards a more sustainable world by developing, building, investing in and managing sustainable infrastructure assets, while creating long-term value for our stakeholders.
| Our Values |
Our values define who we are and how we behave both as individuals and as a Company. These values, described below in order of importance, serve as a compass for our day-to-day decisions and guide our relationships with stakeholders.

|
Integrity, Compliance and Safety. We will always do what is right. We are strongly committed to complying with all rules and regulations. |
 |
Value creation. We pursue a proactive approach to creating long-term value for our shareholders. Our core corporate policies are supported by a solid commitment to risk management that guides all our decisions. |
 |
Sustainability. We invest in assets that are environmentally sustainable and we manage them in a sustainable manner. We follow policies that analyse, evaluate, and propose measures aimed at minimising the environmental impacts of our business activity. |
 |
Excellence and Efficiency. We believe in outstanding and disciplined asset management of our operations to be the best-in-class operator, while seeking excellence on a cost-efficient basis. |
 |
Collaborative Environment. Respect and Teamwork are key to achieving our goals. We treat others as we would like to be treated ourselves and we put the team ahead of personal success. To build strong teams, we recruit, train, and promote the best people. |
About This Report
Atlantica Sustainable Infrastructure plc and its subsidiaries (“Atlantica” or “the Company”), as part of its commitment to transparency and reporting best practices, has published an Integrated Annual Report, which integrates our financial and non-financial information, including environment, social and governance (ESG) disclosures.
Integrated Annual Report Information
Atlantica’s Integrated Annual Report has been prepared in accordance with the relevant U.K. requirements for the year ended December 31, 2023.
The Consolidated Financial Statements contained in this Report have been prepared in accordance with International Financial Reporting Standards as issued by the International Accounting Standards Board (“IASB”) and UK adopted International Accounting Standards (collectively as “IFRS”), on a basis consistent with the prior year. The Parent Company Financial Statements have been prepared in conformity with Financial Reporting Standard 101 “Reduced Disclosure Framework (“FRS 101”)”. We refer to Note 2 to the Consolidated Financial Statements, and Note 1 to the Parent Company Financial Statements for accounting policies detailed information.
In addition, this report has been prepared by Management in accordance with the Global Reporting Initiative (GRI) Standards. We report GRI in line with the matters that are important and / or material to our business.
This report has also been prepared by Management in accordance with the SASB Electric Utilities & Power Generators sustainability accounting standard and its reporting requirements. In addition, we have followed SASB Solar Technology & Project Developers sustainability accounting standards and its reporting requirements for aspects which are material to our business.
Data in this report for the year ended and as of December 31, 2023, except where otherwise noted. Comparative data for the years ended December 31, 2022, and 2021 is also provided. Our 2022, 2021 and 2020 Integrated Annual Report, U.K. Annual Reports and ESG Reports are available for download from our website.
ESG data reported corresponds to all consolidated subsidiaries. For Companies where Atlantica has joint financial control, we are consolidating the percentage of equity ownership for each of the ESG KPIs reported. Green House Gas emissions are accounted for following the financial control approach from the GHG Protocol. Emissions from joint ventures where partners have joint financial control are accounted for based on the equity share approach. We are accounting for proportional scope 1 and scope 2 emissions of equity investments in scope 3, category 15 (Investments).
A multi-disciplinary team participated in the preparation of this report.
Currency amounts are expressed in U.S. Dollars unless otherwise noted.
ESG Data Review
Atlantica’s management is responsible for the completeness, accuracy and validity of the information contained in this report. The data presented is based on the input received from internal data collection, management systems and external stakeholders. Certain parts of this report have been subject to external and/or internal assurance. We conduct regular internal audits to review our management system, including the procedures to collect information from our assets and the main data reported.
In 2023, independent third parties have been engaged to verify our reported Scope 1, 2 and 3 GHG emissions under a reasonable level of assurance.
DNV, an independent expert in assurance and risk management, verifies all our reported Scope 1, 2 and 3 GHG emissions in all the geographies where we are present. In addition, we also hired:
| - | ANCE, a leading certification association across industries in Mexico, to verify Scope 1 and 2 greenhouse emissions in that geography, |
| - | AENOR, a not-for-profit entity that fosters standardisation and certification across industrial and service sectors in Spain, to review our Scope 1 stationary GHG emissions in that geography. |
In addition, DNV has also been engaged to verify Atlantica’s air quality (i.e., non-GHG emissions), waste and water indicators and their compliance with GRI Reporting under a limited level of assurance.
In addition, in 2023 Atlantica’s Internal Audit team reviewed the completeness and accuracy of certain environmental, social and governance performance indicators, including GHG emissions, water and waste management, health and safety, energy consumption, supply chain, people and culture and investment in local communities.
Furthermore, Atlantica’s Accounting and Disclosure Committee reviewed this Integrated Annual Report prior to its publication.
Atlantica’s Board of Directors approved this report prior to its publication.
Non-GAAP Financial Measures:
This report contains non-GAAP financial measures including Adjusted EBITDA, CAFD and CAFD per share.
Non-GAAP financial measures are not measurements of our performance or liquidity under IFRS and should not be considered alternatives to operating profit or profit for the period or any other performance measures derived in accordance with IFRS or any other generally accepted accounting principles or as alternatives to cash flow from operating, investing or financing activities. Please refer to the section “Other Information- Reconciliation of non-GAAP measures” of this report for a reconciliation of the non-GAAP financial measures included in this Report to the most directly comparable financial measures prepared in accordance with IFRS. Also, please refer to the following paragraphs in this section for an explanation of the reasons why management believes the use of non-GAAP financial measures (including CAFD, CAFD per share and Adjusted EBITDA) in this Report provides useful information to investors.
We present non-GAAP financial measures because we believe that they and other similar measures are widely used by certain investors, securities analysts and other interested parties as supplemental measures of performance and liquidity. The non-GAAP financial measures may not be comparable to other similarly titled measures employed by other companies and they may have limitations as analytical tools. These measures may not be fit for isolated consideration or as a substitute for analysis of our operating results as reported under IFRS as issued by the IASB. Non-GAAP financial measures and ratios are not measurements of our performance or liquidity under IFRS as issued by the IASB. Thus, they should not be considered as alternatives to operating profit, profit for the period, any other performance measures derived in accordance with IFRS as issued by the IASB, any other generally accepted accounting principles or as alternatives to cash flow from operating, investing or financing activities. Some of the limitations of these non-GAAP measures are:
Some of the limitations of these non-GAAP measures are:
| • | they do not reflect our cash expenditures or future requirements for capital expenditures or contractual commitments; |
| • | they do not reflect changes in, or cash requirements for, our working capital needs; |
| • | they may not reflect the significant interest expense, or the cash requirements necessary, to service interest or principal payments, on our debts; |
| • | although depreciation and amortisation are non-cash charges, the assets being depreciated and amortised will often need to be replaced in the future and Adjusted EBITDA, CAFD and CAFD per share do not reflect any cash requirements that would be required for such replacements; and |
| • | the fact that other companies in our industry may calculate Adjusted EBITDA, CAFD and CAFD per share differently than we do, which limits their usefulness as comparative measures. |
We define Adjusted EBITDA as profit/(loss) for the period attributable to the parent company, after adding back loss/(profit) attributable to noncontrolling interest, income tax expense, financial expense (net), depreciation, amortisation and impairment charges of entities included in our Annual Consolidated Financial Statements and depreciation and amortisation, financial expense and income tax expense of unconsolidated affiliates (pro-rata of our equity ownership). CAFD is calculated as cash distributions received by the Company from its subsidiaries minus cash expenses of the Company, including third-party debt service and general and administrative expenses and including proceeds from the sale of assets. CAFD per share is calculated as CAFD divided by the weighted average number of outstanding ordinary shares of the Company during the period.
Our management believes Adjusted EBITDA, CAFD and CAFD per share are useful to investors and other users of our financial statements in evaluating our operating performance because such measures provide investors with additional tools to compare business performance across companies and across periods. Adjusted EBITDA is widely used by investors to measure a company’s operating performance without regard to items such as interest expense, taxes, depreciation and amortisation, which can vary substantially from company to company depending upon accounting methods and book value of assets, capital structure and the method by which assets were acquired. Our management believes CAFD and CAFD per share are relevant supplemental measure of the Company’s ability to earn and distribute cash returns to investors and is useful to investors in evaluating our operating performance because securities analysts and other interested parties use such calculations as a measure of our ability to make quarterly distributions. In addition, CAFD and CAFD per share are used by our management team for determining future acquisitions and managing our growth. Our management uses Adjusted EBITDA, CAFD and CAFD per share as measures of operating performance to assist in comparing performance from period to period and aims to use them on a consistent basis moving forward. They also readily view operating trends as a measure for planning and forecasting overall expectations, for evaluating actual results against such expectations, and for communicating with our board of directors, shareholders, creditors, analysts and investors concerning our financial performance. Adjusted EBITDA, CAFD and CAFD per share are widely used by other companies in the same industry.
Information presented as the pro rata share of our unconsolidated affiliates reflects our proportionate ownership of each asset in our portfolio that we do not consolidate and has been calculated by multiplying our unconsolidated affiliates’ financial statement line items by the Company’s percentage ownership thereto. Note 7 to the Annual Consolidated Financial Statements includes a description of our unconsolidated affiliates and our pro rata share thereof. We do not control the unconsolidated affiliates. Multiplying our unconsolidated affiliates’ financial statement line items by the Company’s percentage ownership may not accurately represent the legal and economic implications of holding a non-controlling interest in an unconsolidated affiliate. We include depreciation and amortisation, financial expense and income tax expense of unconsolidated affiliates (pro rata of our equity ownership) because we believe it assists investors in estimating the effect of such items in the profit/(loss) of entities carried under the equity method (which is included in the calculation of our Adjusted EBITDA) based on our economic interest in such unconsolidated affiliates. Each unconsolidated affiliate may report a specific line item in its financial statements in a different manner. In addition, other companies in our industry may calculate their proportionate interest in unconsolidated affiliates differently than we do, limiting the usefulness of such information as a comparative measure. Because of these limitations, the information presented as the pro rata share of our unconsolidated affiliates should not be considered in isolation or as a substitute for our or such unconsolidated affiliates’ financial statements as reported under applicable accounting principles. Please refer to “Other Information” section for additional information regarding reconciliations from non-GAAP measures.

| Strategic Report |
Strategic Report
This Strategic Report has been prepared to provide shareholders with information that will aid them in assessing Atlantica’s strategies and the potential of such strategies to succeed.
The Strategic Report contains certain forward-looking statements that are made by the directors in good faith and based on the information available to them up to the time of their approval of this report. These statements should be treated with caution due to the uncertainties, including both economic and business risk factors, inherent in such forward-looking information.
The directors have prepared this Strategic Report in compliance with Section 414C of the Companies Act 2006.
The Strategic Report discusses the following areas:
| - | Our sustainable business model and strategy. |
| - | Events during the period. |
| - | United Nations Global Compact (UNGC). |
| - | Key performance indicators. |
| - | A fair review of the business. |
| - | Principal risks and uncertainties. |
| - | Environment sustainability. |
| - | Social sustainability. |
| - | Asset management |
| - | Cybersecurity and data privacy. |
| - | Innovation management. |
| - | Tax management. |
| - | Section 172 statement. |
| - | Non-Financial and Sustainability Information Statement. |
| - | Going concern basis. |
Our Sustainable Business Model and Strategy
Our Business
We are a sustainable infrastructure company with a majority of our business in renewable energy assets. Our purpose is to support the transition towards a more sustainable world by developing, building, investing and managing sustainable infrastructure assets, while creating long-term value for our investors and the rest of our stakeholders. In 2023, renewables represented 73% of our revenue, with solar energy representing 63%. We complement our renewable assets portfolio with storage, efficient natural gas and transmission infrastructure assets, as enablers of the transition towards a clean energy mix. We also hold water assets, a relevant sector for sustainable development.
As of the date of this annual report, we own or have an interest in a portfolio of assets and new projects under development diversified in terms of business sector and geographic footprint. Our portfolio consists of 45 assets with 2,171 MW of aggregate renewable energy installed generation capacity (of which approximately 73% is solar), 343 MW of efficient natural gas-fired power generation capacity, 55 MWt of district heating capacity, 1,229 miles of electric transmission lines and 17.5 M ft3 per day of water desalination.
We currently own and manage operating facilities and projects under development in North America (United States, Canada and Mexico), South America (Peru, Chile, Colombia and Uruguay) and EMEA (Spain, Italy, Algeria and South Africa). Our assets generally have contracted or regulated revenue. As of December 31, 2023, our assets had a weighted average remaining contract life of approximately 13 years6.
We intend to grow our business through the development and construction of projects including expansion and repowering opportunities, as well as greenfield developments, third-party acquisitions, and the optimisation of our existing portfolio. We currently have a pipeline of assets under development of approximately 2.2 GW of renewable energy and 6.0 GWh of storage. Approximately 47% of the projects are PV, 41% storage, 11% wind and 1% other projects, while 22% are expected to reach ready-to-build (“RTB”) in 2024-2025, 28% are in an advanced development stage and 50% are in early stage. Also, 20% are expansion or repowering opportunities of existing assets and 80% greenfield developments.
Our objective is to pay a consistent and growing cash dividend to shareholders that is sustainable on a long-term basis. We expect to distribute a significant percentage of our cash available for distribution as cash dividends and we will seek to increase such cash dividends over time through organic growth, investments in new assets and acquisitions.
Our plan for executing this strategy includes the following key components:
Grow our business by developing new projects and investing in new assets with a focus on renewable energy and storage.
We intend to develop new assets and, in some cases, to invest in assets under development or construction. We believe that our know-how and operating expertise in our key markets together with a critical mass of assets in several geographic areas as well as our access to capital will assist us in achieving our growth plans.
Focus on stable assets in renewable energy, storage and transmission, generally contracted or regulated.
We intend to focus on owning and operating stable, sustainable infrastructure assets, with long useful lives, generally contracted, for which we believe we have extensive experience and proven systems and management processes, as well as the critical mass to benefit from operating efficiencies and scale. We intend to maintain a diversified portfolio with a large majority of our Adjusted EBITDA generated from low-carbon footprint assets, as we believe these sectors will see significant growth in our targeted geographies.
Maintain diversification across our business sectors and geographies.
Our focus on three core geographies, North America, Europe and South America, helps to ensure exposure to markets in which we believe renewable energy, storage and transmission will continue to grow significantly. We believe that our diversification by business sector and geography limits risks, reinforces stability and provides us with better growth opportunities.
Grow our business through the optimisation of the existing portfolio and through investments in the expansion of our current assets.
We intend to grow our business through organic growth that we expect to deliver through the optimisation of the existing portfolio, price escalation factors in many of our assets as well as through investments in the expansion and repowering of our current assets and hybridisation of existing assets with other complementary technologies including storage, particularly in our renewable energy assets and transmission lines.
6 Calculated as weighted average years remaining as of December 31, 2023 based on CAFD estimates for the 2024-2027 period, including assets that have reached COD before March 1, 2024.
Maintain a low-risk approach.
We intend to maintain a portfolio of sustainable infrastructure assets, generally totally or partially contracted, with a low-risk profile for a significant part of our revenue. We generally seek to invest in assets with proven technologies in which we generally have significant experience, located in countries where we believe conditions to be stable and safe. We may complement our portfolio with investments or co-investments in assets with shorter contracts or with partially contracted or merchant revenue or in assets with revenue in currencies other than the U.S. dollar or euro. We have a set of policies and a risk management system in place which define thorough risk management processes.
Maintain a prudent financial policy and financial flexibility.
Non-recourse project debt is an important principle for us. We intend to continue financing our assets with project debt progressively amortised using the cash flows from each asset and where lenders do not have recourse to the holding company assets. The majority of our consolidated debt is project debt.
In addition, we hedge a significant portion of our interest rate risk exposure. We estimate that as of December 31, 2023, approximately 93% of our total interest risk exposure was fixed or hedged, generally for the long-term. We also limit our foreign exchange exposure. We intend to ensure that at least 80% of our cash available for distribution is always in U.S. dollars and euros. Furthermore, we hedge net distributions in euros for the upcoming 24 months on a rolling basis.
We also intend to maintain a solid financial position through a combination of cash on hand
and undrawn credit facilities. In order to maintain financial flexibility, we use diversified sources of financing in our project and corporate debt including banks, capital markets and private investor financing. In recent years we have been active
in green financing initiatives, improving our access to new debt investors.

Our Competitive Strengths
We believe that we are well-positioned to execute our business strategies thanks to the following competitive strengths:
Stable and predictable long-term cash flows.
We believe that our portfolio of sustainable infrastructure has a stable cash flow profile. We estimate that the off-take agreements or regulation in place at our assets have a weighted average remaining term of approximately 137 years as of December 31, 2023, providing long-term cash flow visibility. In 2023, approximately 54% of our revenue was non-dependent on natural resource, not subject to the volatility that natural resource may have, especially solar and wind resources. This includes our transmission lines, our efficient natural gas plant, our water assets and approximately 76% of the revenue received from our solar assets in Spain with most of their revenues based on capacity in accordance with the regulation in place. In these assets, our revenue is not subject to (or has low dependence on) solar, wind or geothermal resources, which translates into a more stable cash-flow generation. Going forward, our new investments will probably be more dependent on the natural resource. Additionally, our facilities have minimal or no fuel risk.
Our diversification by geography and business sector also strengthens the stability of our cash flow generation. We expect our well-diversified asset portfolio, in terms of business sector and geography to maintain cash flow stability.
Positioned in business sectors with high growth prospects.
The renewable energy industry has grown significantly in recent years and it is expected to continue to grow in the coming decades. According to Bloomberg New Energy Finance (BNEF), the next three decades will require between $46 trillion and $131 trillion of investment which translates into an annual range of $1.5-$4.4 trillion. BNEF projects an annual investment of $1.2-$3.9 trillion in low-carbon energy sources, including renewables, surpassing the $1 trillion invested in 20228. Furthermore, clean energy is on track to set new records. Global installation of wind, solar and storage is expected to exceed 680 GW in 2024, up 22% from 2023. Solar is anticipated to lead the way in 2024 with over 500 GW expected to be installed; which will likely make it the largest source of new capacity and new generation worldwide. Onshore wind follows as the second-highest, with close to 100 GW projected to be installed in 2024, followed by storage capacity, of which around 50 GW is expected to be installed9.
The significant increase expected in the renewable energy space over the coming decades also requires significant new investments in electric transmission and distribution lines for power supply, as well as storage and natural gas generation for dispatchability, with each becoming key elements to support additional wind and solar energy generation. We believe that we are well positioned in sectors with solid growth expectations.
We also believe that our diversified exposure to international markets will allow us to pursue improved growth opportunities and achieve higher returns than we would have if we had a narrower geographic or technological focus. If certain geographies and business sectors become more competitive for investments in the future, we believe we can continue to execute on our growth strategy by having the flexibility to invest in other regions or in other business sectors.
7 Calculated as weighted average years remaining as of December 31, 2023 based on CAFD estimates for the 2024-2027 period, including assets that have reached COD before March 1, 2024.
8 BNEF Theme: Energy Investment and Climate Scenarios.
9 Where Energy Markets and Climate Policy Are Headed in 2024: BNEF.
Well positioned to capture growth opportunities.
We have in-house development capabilities and partnerships with third parties to co-develop new projects. Our development asset identification is supported by rigorous analysis and deeply rooted industry knowledge and experience. In addition, we follow a disciplined approach to make capital allocation decisions and we have strict minimum required returns for development projects and acquisitions that we update frequently. In addition, our current portfolio of assets offers growth opportunities through the expansion and repowering of existing assets and through hybridisation of existing assets with other complementary technologies. We can also grow by adding storage to our existing renewable assets or by developing standalone storage close to our existing assets.
Proven capabilities in operation and maintenance.
We perform operation and maintenance in-house in a majority of our assets. We believe this approach allows us to have full control of our assets and to optimise their performance. We can benefit from synergies in shared resources and centralised purchasing management, among other advantages. Our corporate operations departments have a plan to periodically review all our assets in detail to identify best practices and improvement actions which are then implemented across the portfolio.
Solid financing expertise.
Our Finance team has extensive experience in project financing and project refinancing in our different geographies. In our corporate financing, we have access to different pools of capital. We have issued bonds in the public markets, including convertibles, private placements with different types of investors, bank financing and commercial paper. Since a portion of the assets have revenues denominated in euros, we can issue corporate financings in euros, to take advantage of lower costs.
Lean corporate structure focused on value added activities.
We operate a lean and efficient organisation where corporate functions support each operating asset. Our core corporate policies are supported by a solid commitment to risk management that guides all our decisions. We believe that our internal management system ensures a nimble decision-making process while ensuring compliance with our policies and risk management system.
Well positioned in ESG.
In 2023, 72% of our Adjusted EBITDA was derived from renewable energy and 62% of our Adjusted EBITDA corresponded to solar energy production. Adjusted EBITDA from low carbon footprint assets represented 89%, including renewable energy, transmission infrastructure, as well as water assets. We have set a target to maintain over 85% of our Adjusted EBITDA generated from low-carbon footprint assets.
We have set a target to reduce our scope 1 and scope 2 GHG emissions per unit of energy generated10 by 70% by 2035, with 2020 as base year. This target was validated in 2021 by the Science Based Targets initiative. We have also set a target to reduce our scope 3 emissions per unit of energy generated by 70% by 2035 from a 2020 base year. With this, we target to achieve net zero GHG emissions by 2040. Additionally, we have also set targets to reduce non-GHG emissions per unit of energy generated and to reduce our water consumption per unit of energy generated.
In 2023, our key health and safety indicators met annual targets and remained below the sector average in all our geographies. Health and Safety is our number one priority, and we want our employees, partners, and contractors to apply the highest standards to ensure safe and sustainable operations.
10 Including thermal generation.
Regarding our local communities, we acknowledge that our day-to-day activities have impacts on nearby communities. We recognise that the communities where we operate are where some of our employees and other stakeholders live and raise their families, and where part of our future workforce is educated and trained. We foster communities’ economic prosperity through local purchases and by hiring local employees. As such, it is key for us to be both proactive and a valued member of our communities. In 2023 we invested $1.5 million. Atlantica’s investments in local communities are focused on improving infrastructure and supporting education.
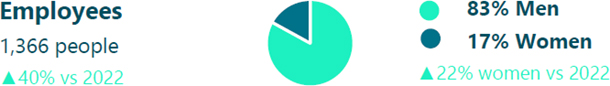
In terms of governance, we maintain a simple structure with one class of shares. The majority of our Directors are independent, and all the board committees are formed exclusively by independent directors. 22% of our directors are women. We believe that we have a solid compliance framework with a set of policies approved and reviewed annually by the Board of Directors, a Code of Conduct which is acknowledged by all employees annually and internal procedures aimed at ensuring that all geographies comply with our policies.
We have been rated by various ESG rating agencies, which we believe can provide relevant information for investors.
Growth Visibility
Development Pipeline
We are developing new projects in most of our core geographies. In some cases, we do this with our local in-house teams and in other cases we have been working with local partners with whom we jointly invest in developing projects or with whom we have agreements based on milestones.
By focusing our development activities on locations where we already have assets in operation and by working in many cases with partners, we have been able to maintain our development cost at what we believe are low levels.
We currently have a pipeline of assets under development of approximately 2.2 GW of renewable energy and 6.0 GWh of storage. Approximately 47% of the projects are in PV, 41% in storage and 11% in wind, while 22% of the projects are expected to reach ready to build (“Rtb”) in 2023 or 2024, 28% are in an advanced development stage and 50% are in early stage.
Pipeline of Assets Under Development11
| Renewable Energy (GW) | Storage (GWh) | |
| North America | 1.2 | 4.3 |
| Europe | 0.4 | 1.6 |
| South America | 0.6 | 0.1 |
| Total | 2.2 | 6.0 |

11 Only includes projects estimated to be ready to build before or in 2030 of approximately 3.7 GW, 2.2 GW of renewable energy and 1.5 GW of storage (equivalent to 6.0 GWh). Capacity measured by multiplying the size of each project by Atlantica’s ownership. Potential expansions of transmission lines not included.

Events During the Period
Assets that entered into operation
During 2023, four assets that were under construction entered into operation:
| ● | Albisu, the 10 MW PV asset wholly owned by us reached COD in January 2023. Albisu is located in Uruguay and has a 15-year PPA with Montevideo Refrescos, S.R.L., a subsidiary of Coca-Cola Femsa, S.A.B. de C.V. The PPA is denominated in local currency with a maximum and minimum price in U.S. dollars and is adjusted monthly based on a formula referring to the U.S. Producer Price Index (PPI), Uruguay’s Consumer Price Index (CPI) and the applicable UYU/U.S. dollar exchange rate. |
| ● | La Tolua and Tierra Linda are two wholly owned solar PV assets in Colombia with a combined capacity of 30 MW both of which reached COD in the first quarter of 2023. Each plant has a 10-year PPA in local currency with Coenersa, the largest independent electricity wholesaler in Colombia. Each PPA provides for the sale of electricity at fixed base price indexed to local CPI. |
| ● | Honda 1, a 10 MW PV asset in Colombia reached COD in December 2023. Honda 1 is a 10 MW plant where we have a 50% ownership. The asset has a 7-year PPA with Enel Colombia, a major electricity company in the country. The PPA is denominated in local currency, with fixed base price, indexed to the local CPI. |
Assets under construction
As of December 31, 2023 we had the following assets under construction or ready to start construction in the short-term:
| Asset | Type | Location | Capacity (Gross) |
Expected COD |
Expected ($ million) |
Off-taker |
| Coso Batteries 1 | Battery Storage | California, US | 100 MWh | 2025 | 40-50 | Investment
grade utility |
| Coso Batteries 2 | Battery Storage | California, US | 80 MWh | 2025 | 35-45 | Investment grade utility |
| Chile PMGD2 | Solar PV | Chile | 80 MW | 2024 - 2025 | 303 | Regulated |
| ATN Expansion 3 | Transmission Line | Peru | 2.4 miles
220kV |
2024 | 12 | Conelsur |
| ATS Expansion 1 | Transmission Line | Peru | n.a. (substation) |
2025 | 30 | Republic of Peru |
| Honda 24 | Solar PV | Colombia | 10 MW | 2024 | 5.5 | Enel Colombia |
| Apulo 14 | Solar PV | Colombia | 10 MW | 2024 | 15.5 | - |
Notes-
(1) Includes nominal capacity on a 100% basis, not considering Atlantica’s ownership.
(2) Atlantica owns 49% of the shares, with joint control, in Chile PMGD.
(3) Corresponds to the expected investment by Atlantica.
(4) Atlantica owns 50% of the shares in Honda 1, Honda 2 and Apulo 1.
| ● | In October 2023, we entered into two 15-year tolling agreements (PPAs) with an investment grade utility for Coso Batteries 1 and Coso Batteries 2. Under each of the tolling agreements, Coso Batteries 1 and 2 will receive fixed monthly payments adjusted by the financial settlement of CAISO’s Day-Ahead market. In addition, we expect to obtain revenue from ancillary services in each of the asset. |
Coso Batteries 1 is a standalone battery storage project of 100 MWh (4 hours) capacity located inside Coso, our geothermal asset in California. Additionally, Coso Batteries 2 is a standalone battery storage project with 80 MWh (4 hours) capacity also located inside Coso. Our investment is expected to be in the range of $40 million to $50 million for Coso Batteries 1, and in the range of $35 to $45 million for Coso Batteries 2. Both projects were fully developed in-house and are now under construction. We have closed a contract with Tesla for the procurement of the batteries. COD is expected in 2025 for both projects.
| ● | In November 2022, we closed the acquisition of a 49% interest, with joint control, in an 80 MW portfolio of solar PV projects in Chile which is currently under construction (Chile PMGD). Our economic rights are expected to be approximately 70%. Total investment in equity and preferred equity is expected to be approximately $30 million and COD is expected to be progressive in 2024 and 2025. Revenue for these assets is regulated under the Small Distributed Generation Means Regulation Regime (“PMGD”) for projects with a capacity equal or lower than 9 MW which allows to sell electricity at a stabilized price. |
| ● | In July 2022 we closed a 17-year transmission service agreement denominated in U.S. dollars that will allow us to build a substation and a 2.4-mile transmission line connected to our ATN transmission line serving a new mine in Peru (ATN Expansion 3). The substation is expected to enter in operation in 2024 and the investment is expected to be approximately $12 million. |
| ● | In July 2023, as part of the New Transmission Plan Update in Peru, the Ministry of Energy and Mines published the Ministerial Resolution that enables to start construction of our ATS Expansion 1 project, consisting in the reinforcement of two existing substation with new equipment. The expansion will be part of our existing concession contract, a 30-year contract with a fixed-price tariff base denominated in U.S. dollars adjusted annually in accordance with the U.S. Finished Goods Less Foods and Energy Index as published by the U.S. Department of Labor. Given that the concession ends in 2044, we will be compensated with a one-time payment for the remaining 9 years of concession. The expansion is expected to enter in operation in 2025 and the investment is expected to be approximately $30 million. |
| ● | In May 2022, we agreed to develop and construct Honda 1 and 2, two PV assets in Colombia with a combined capacity of 20 MW where we have a 50% ownership. Each plant has a 7-year PPA with Enel Colombia. Our investment is expected to be $5.5 million for each plant. Honda 1 entered in operation in December 2023 and Honda 2 is expected to enter into operation in the second quarter of 2024. |
Advanced Projects
| ● | In February 2024, we entered into a 15-year busbar PPA with an investment grade utility for Overnight. Overnight is a 150 MW PV project located in California. Under the PPA, Overnight is set to receive a fixed price per MWh, with no basis risk. The project is currently in an advanced development stage. Total investment is anticipated to be within the range of $165 to $185 million. We expect to include storage in a second phase of the project. |
| ● | In January 2024, we acquired from Liberty GES two PV projects in advanced development stage in Southern Spain with approximately 90 MW of combined generation capacity. The acquisition of land and interconnection are secured and the process for permits is well advanced. The projects were acquired in exchange for assuming the necessary guarantees, at no additional cost. |
Potential Asset Sale
Our partner in Monterrey initiated a process to sell its 70% stake in the asset. Such process is well advanced and, as part of it, we intend to sell our interest as well under the same terms. The net proceeds to Atlantica are expected to be in the range of $45 to $52 million, after tax. The closing of the transaction is subject to certain conditions precedent. We cannot guarantee that the transaction will finally close.
Project Debt Refinancing
In March 2023, we refinanced the Solaben 2 and Solaben 3 project debt by entering into two green senior euro-denominated loan agreements for the two assets with a syndicate of banks for a total amount of €198.0 million. The new project debt replaced the previous project loans for a similar amount and maturity was extended from December 2030 to June 2037.
In addition, in June 2023 we extended the maturity of the debt for Logrosan Solar Inversiones, S.A, the subsidiary-holding company of Solaben 2 & 3 and Solaben 1 & 6 from April 2025 to December 2028. We refer to section “Liquidity” under “Financial Review” for more information.
Operation and Maintenance
In March 2023, we completed the process of transitioning in-house the O&M services for our assets in Spain through the acquisition of the business of an Abengoa subsidiary which was still providing those services to some of our assets.
In addition, in July 2023 we internalised the O&M services for ATN, which were previously performed by Omega Peru. Additionally, the O&M contract for ATS with Omega Peru, which could be terminated every five years was modified and can now be terminated every three years (or two years under certain circumstances) and the contract for ATN2, which was a long-term contract expiring in 2027, was also amended to reflect the same termination provision.
Currently, we perform O&M services with our own personnel for assets representing approximately 74% of our consolidated revenue for the year ended December 31, 2023.
Regulation in Spain
In June 2023, the final parameters for the year 2023 were published, including a revised assumption for electricity prices for the years 2023, 2024 and 2025.
| Useful Life 2023 |
Remuneration on Investment 2023-2025 (Euros /MW) |
Remuneration on Operation 2024 (Euros/MW) |
Adjustment Rate |
Maximum Hours |
Minimum Hours 2024- 2025 |
Operating Threshold 2024-2025 |
|
| Solaben 2 | 25 years | 378,506 | 0 | 0.9854 | 2,004 | 1,202 | 701 |
| Solaben 3 | 25 years | 378,506 | 0 | 0.9854 | 2,004 | 1,202 | 701 |
| Solacor 1 | 25 years | 378,506 | 0 | 0.9854 | 2,004 | 1,202 | 701 |
| Solacor 2 | 25 years | 378,506 | 0 | 0.9854 | 2,004 | 1,202 | 701 |
| PS 10 | 25 years | 533,115 | 19.798 | 0.9948 | 1,837 | 1,102 | 643 |
| PS 20 | 25 years | 393,001 | 14.044 | 0.9942 | 1,837 | 1,102 | 643 |
| Helioenergy 1 | 25 years | 372,549 | 0 | 0.9845 | 2,004 | 1,202 | 701 |
| Helioenergy 2 | 25 years | 372,549 | 0 | 0.9845 | 2,004 | 1,202 | 701 |
| Helios 1 | 25 years | 387,136 | 0 | 0.9857 | 2,004 | 1,202 | 701 |
| Helios 2 | 25 years | 387,136 | 0 | 0.9857 | 2,004 | 1,202 | 701 |
| Solnova 1 | 25 years | 392,031 | 0 | 0.9849 | 2,004 | 1,202 | 701 |
| Solnova 3 | 25 years | 392,031 | 0 | 0.9849 | 2,004 | 1,202 | 701 |
| Solnova 4 | 25 years | 392,031 | 0 | 0.9849 | 2,004 | 1,202 | 701 |
| Solaben 1 | 25 years | 384,318 | 0 | 0.9860 | 2,004 | 1,202 | 701 |
| Solaben 6 | 25 years | 384,318 | 0 | 0.9860 | 2,004 | 1,202 | 701 |
| Seville PV | 30 years | 677,855 | 0 | 0.9809 | 2,030 | 1,218 | 711 |
Strategic Review
On February 21, 2023, Atlantica’s board of directors commenced a process to explore and evaluate potential strategic alternatives that may be available to Atlantica to maximise shareholder value. The Company believes it has attractive growth and other opportunities in front of it and is committed to ensuring it is best positioned to take advantage of those opportunities. The decision has the support of the Company’s largest shareholder, Algonquin. Atlantica expects to continue executing on its existing plans while the review of strategic alternatives is ongoing, including its current growth plan. As of the date of this annual report, the strategic review is ongoing. There is no assurance that any specific transaction will be consummated, or other strategic change will be implemented as a result of this strategic review. Please refer to the section: “Principal Risk and Uncertainties”.
Main ESG Actions during the year
Investing in and developing new sustainable infrastructure projects are only one part of our strategy. Managing those assets in a sustainable way is key to creating long-term value. We have launched several initiatives to ensure that we efficiently and sustainably manage key areas of our Company:
| 1. | Improved our Health and Safety Metrics: Health and Safety is our number one priority, and we want our employees, partners, and contractors to apply the highest standards to ensure safe and sustainable operations. In 2023, all our key health and safety indicators met annual targets, improved with respect to 2022 and remained below the sector average in all our geographies. Refer to the occupational health and safety section for further details on our safety culture. |
| 2. | Reduced our GHG emissions: We have reduced our Scope 1 and 2 GHG emissions per KWh of energy generated and our Scope 3 GHG emissions per KWh of energy generated for the fourth consecutive year. We refer to the “Environment” section for further detail on our environmental performance in 2023. |
| 3. | Offset our GHG emissions: Global warming is a challenge that requires the active participation of public and private organisations. In 2023, as part of our commitment to sustainability, we continued mitigating our GHG emissions. We encourage you to read our GHG emissions section for detailed information on our mechanism to offset GHG emissions. |
| 4. | Invested 97% of our capex in activities aligned with EU Taxonomy: 100% of our economic activities are eligible following the EU Taxonomy and 97% of our CapEx investment is aligned to the EU Taxonomy. We refer to the “Reporting under the European Union Taxonomy” section for further details on clean revenues, Adjusted EBITDA, and capital allocation and capital expenditures (investments and maintenance capex). |
| 5. | Reduced water consumption: We continue to reduce water consumption at our power generation assets. In 2023 water consumption decreased by 5% compared to 2022 mainly due to higher production efficiency at our solar assets in Spain and the U.S. (more recycled water in cooling towers). We refer to the “Environment” section for further detail on our environmental performance in 2023. |
| 6. | Reduced hazardous waste: Third consecutive year reducing our hazardous waste. In 2023, we reduced total hazardous waste by 27% compared to previous year. This reduction was mainly driven by an innovative water treatment
system installed at one of our solar assets in Spain. We refer to the “Environment” section for further detail on our environmental performance in 2023. |
| 7. | Improved our Ethics and Corporate Governance culture: In December 2023, the Board approved our Water Policy and updated the following documents: |
| ü | Stakeholder Policy |
| ü | Biodiversity Policy |
| ü | Environmental Policy |
| ü | Health and Safety Policy |
These policies are available on our website.
| 8. | Green Financing: We have developed a Green Finance Framework to issue green finance instruments to finance or refinance renewable energy infrastructure, as well as transmission lines dedicated to supplying renewable energy to the grid. The Framework is aligned with our strategy and the use of proceeds will contribute to the advancement of the United Nations Sustainable Development Goals (SDGs) of Affordable and Clean Energy. The framework has a Second Party Opinion (SPO) delivered by Sustainalytics. |
In 2023 we did two green project refinancings:
| (1) | In March 2023 we refinanced Solaben 2&3 for €198.0 million. The new project debt replaced the previous project loans. We refer to “Project Debt Refinancing” under “Events During the Period” section. |
| (2) | In June 2023 we extended the maturity of the debt of Logrosan Solar Inversiones, S.A.U., the sub-holding company of Solaben 1&6 and Solaben 2&3. The Green Project Finance was extended from April 2025 to December 2028 and the initial nominal amount was €140 million. |
| 9. | Improved our environment and social awareness: In 2023, we actively posted ESG content on social media to increase ESG awareness among our stakeholders. |
| 10. | Action Declaration on climate policy engagement: In November 2022, Atlantica endorsed the “Action Declaration on climate policy engagement” activities, an initiative from Corporate Knights and the Global 100 Council. This declaration intends to close the say-do gap on countries’ emission reductions by: |
| - | supporting climate action aligned with the Paris Agreement when engaging with trade associations; |
| - | working with major trade associations to advance alignment with the Paris Agreement; and |
| - | monitoring and disclosing climate policy alignment for our trade association. |
In 2023 we have assessed the trade associations with whom we collaborate. We refer to section “Trade Associations” under the “Governance” section for further detail.

Contribution to the Sustainable Development Goals
Atlantica is a signatory to the UNGC, the world’s largest corporate sustainability initiative with more than 20,000 signatories in over 160 countries. The UNGC is an initiative that encourages companies and organisations worldwide to adopt sustainable and socially responsible policies. Participation in the UNGC is voluntary and those entities that sign it pledge to uphold and promote the principles and report on their progress once they apply them in their management.
Atlantica formally adopted the ten fundamental UNGC principles in the fields of human rights, labour, environment, and anti-corruption and made the UNGC and its principles an integral part of our strategy, culture, and day-to-day operations.
The table below summarises Atlantica’s contribution to achieving 7 of the 17 Sustainable Development Goals (SDG): climate action; affordable and clean energy; clean water and sanitation; decent work and economic growth; gender equality; life on land; and industry, innovation, and infrastructure.
 |
|
 |
We are committed to using water efficiently in our power generation and water desalination activities. We plan to reduce our water consumption at our generating assets that use cycled water in the turbine circuit and in refrigeration processes. In 2023, we recycled 17% more water, which mainly contributed to a 4% decrease in our overall water consumption. In addition, we have a target approved by the Board of Directors to reduce our water consumption per unit of energy generated (KWh) by 50% by 2035, from a 2020 base year. In 2023, our water consumption per unit of energy generated decreased by 5% compared to 2022. We invest in water desalination plants that generate drinking water for local communities and industries through the desalination of sea water. In 2023, these assets generated purified seawater to meet the water needs of approximately 3 million people in regions with limited access to fresh water. We encourage you to read our water management section for more detailed information. |
|
The renewable energy industry has grown significantly in recent years and it is expected to continue to grow in the coming decades. This requires significant new investments in, among others, storage for dispatchability to support additional wind and solar energy generation. In 2023, our renewable sector accounted for 73% of our revenue, with solar energy representing 63%. We intend to grow our business through the development and construction of projects including expansion and repowering opportunities, as well as greenfield developments, third-party acquisitions and the optimisation of our portfolio. During 2023, four assets that were under construction entered into operation: - Albisu, the 10 MW PV asset reached COD in January 2023. - La Tolua and Tierra Linda, two PV assets with a combined capacity of 30 MW both reached COD in the first quarter of 2023. - Honda 1, a 10 MW PV asset reached COD in December 2023. In addition, we have 3 PV projects, 2 storage projects and 2 transmission lines that are currently under construction. We currently have a pipeline of assets under development of approximately 2.2 GW of renewable energy and 6.0 GWh of storage. We are also in the process of selling our 30% stake in one of our efficient natural gas assets. We encourage you to read section “Growth visibility” for further details on affordable and clean energy investments. |

|
We protect labour rights and are committed to promoting safe and secure working environments for all workers. We are committed to providing decent work for all women and men, young people and persons with disabilities and equal pay for work of equal value. We have always prioritised the health and safety of all our employees, contractors and partners working at our premises. Our key health and safety indicators met 2023 targets, improved with respect to 2022 and remained below the sector average in all our geographies. We have internal policies and procedures to support and ensure human rights, including the Human Rights Policy, the Code of Conduct and the Supplier Code of Conduct (available on our website). Our internal compliance team annually: (i) monitors human rights are internally respected, (ii) provides human rights related training to our employees, and (iii) assesses the supply chain across the jurisdictions in which we operate to identify any potential breach regarding human rights. In May 2023, the Board amended and approved our “U.K. Anti-Modern Slavery and Human Trafficking Statements” under the Modern Slavery Act, 2015 (available on our website). No human rights incidents were reported or identified during 2023. We are committed to supporting long-term development of the communities where we operate as part of our culture at Atlantica. It is key for us to be a proactive and valued member of our communities and to foster communities’ economic prosperity. In addition, we support local economic growth by choosing to buy from local businesses. In 2023, more than 90% of our total purchases in the geographies where we have assets were made to local suppliers. We encourage you to read our Social and Governance sections for details on occupational health and safety, human rights, supply chain management and training-related activities. |

|
Our activity has a positive impact on mitigating climate change. We are committed to the reduction of greenhouse gas emissions (GHG) by investing in renewable energy assets. Following our long-term commitment to sustainability, we have set an ambitious plan to reduce: 1. Our GHG emissions. We target to: (i) reduce our Scopes 1 and 2 GHG emissions per kWh of energy generated by 70% by 2035 from a 2020 base year12. This target has been approved by the Science Based Targets initiative (SBTi) (ii) reduce Scope 3 GHG emissions per kWh of energy generated by 70% by 2035 from a 2020 base year, and (iii) achieve Net Zero GHG emissions by 2040. 2. Our non-GHG emissions. We target to reduce our non-GHG emissions per kWh of energy generated by 50% by 2035 from a 2020 base year. In addition, we have a goal to maintain over 85% of our adjusted EBITDA generated from low carbon footprint assets including renewable energy, storage, transmission infrastructure and water assets. In 2023, we reduced (i) our Scopes 1 and 2 GHG emissions per kWh of energy generated by 14% compared to 2020 and (ii) our Scope 3 GHG emissions per kWh of energy generated by 20% compared to 2020. In addition, we helped avoid up to 7.0 million tonnes of equivalent CO2 compared to a 100% fossil fuel-based generation plant. Please read our Environmental Sustainability section for further details on our climate change related activities. |
12 The target boundary includes steam generation.
Atlantica also supports other SDGs, as outlined below:
 |
We promote equal opportunities for our employees and stakeholders. Atlantica’s Diversity and Inclusion Policy was approved by the Board of Directors in May 2020 and was last amended in December 2021 Atlantica stands for greater equality for women. We work to ensure that men and women are treated equally and have the same work opportunities. We aim to perform a human capital analysis every 4 years at certain locations. The objective of this analysis is to guarantee equal opportunities to our employees and to promote a culture of diversity and inclusion. We analyse gender pay gap, for the year ended December 31, 2023 the total overall pay gap decreased and was 5%. We encourage you to read the Social and Governance sections for further details on gender equality. |

|
We work to protect flora and fauna in and around our assets. We are committed to achieving “no net loss” of biodiversity and “no net deforestation” in the areas where we operate and in all project phases through the application of the Mitigation Hierarchy. In 2023, we continued to: (i) monitor the impact of spinning blades on local species of birds at our wind farms in Uruguay, and (ii) collaborate with local administrations and other key stakeholders to protect species settled close to our assets in the U.S. and Spain. We have set a target to reduce our hazardous and non-hazardous waste per unit of energy generated by 30% and 40%, respectively, by 2035 from a 2023 base year. In addition, in 2023 we continued to deliver on our reforestation programme in Spain, where we invested approximately $445 thousand in reforesting a new 48-hectare area and maintaining previously reforested areas. We encourage you to read the Environmental Sustainability section for further details on our biodiversity initiatives. |

|
Infrastructure is a key driver of economic growth and social value creation. At Atlantica, we produce and transport electricity and we provide drinking water to approximately 3 million people living in high or extremely high-water stress areas. Our solar asset in South Africa contributes to providing clean electricity in a country that requires additional power capacity. In South America, our transmission lines help transport electricity to remote areas. In addition, we foster communities’ economic prosperity through local purchasing and by hiring local employees. In 2023, four PV assets that were under construction reached COD in Uruguay and Colombia. In addition, as of December 31, 2023, we have 2 battery storage projects in the U.S., 1 PV project in Chile, 2 transmission lines in Peru and 2 additional PV projects in Colombia that are under construction and that we expect will reach COD during 2024-2025. We also have a pipeline of assets under development of approximately 2.2 GW of renewable energy and 6.0 GWh of storage. Within the energy sector, innovation contributes to the fight against climate change through new or enhanced technologies that enable more sustainable, reliable and efficient solutions, including storage and green hydrogen solutions. To ensure reliability of our assets we: (1) own 22 patents and technology licences, as well as 4 patents currently in approval process, related to key components of our assets, to processes and to solutions to monitor, operate and maintain our assets in a sustainable and cost effective manner, (2) have an operations department to identify potential measures to improve asset performance, reducing operating costs and developing tools to manage our assets more efficiently, and (3) have an advanced analytics team to improve the performance of our technologies through data analytics and machine learning technologies. We encourage you to read the Asset Management and Innovation sections for further details on our industry, innovation and infrastructure initiatives. |
Communication on Progress (COP):
This Integrated Annual Report constitutes Atlantica’s “Communication on Progress” under the UNGC.

Key Performance Indicators
| Financial KPIs |
| $ in millions | 2023 | 2022 | 2021 |
| Revenue | 1,100 | 1,102 | 1,212 |
| Operating Profit | 342 | 278 | 354 |
| Adjusted EBITDA | 795 | 797 | 824 |
| Cash Available for Distribution (CAFD) | 236 | 238 | 226 |
| Cash Available for Distribution (CAFD) per share (in USD) | 2.03 | 2.07 | 2.03 |
| Total dividends paid | 207 | 203 | 190 |
| Operational KPIs |
| 2023 | 2022 | 2021 | |
| Renewable energy | |||
| MW in operation13 | 2,171 | 2,121 | 2,044 |
| GWh produced14 | 5,458 | 5,319 | 4,655 |
| Efficient natural gas | |||
| MW in operation15 | 398 | 398 | 398 |
| GWh produced16 | 2,549 | 2,501 | 2,292 |
| Electric Availability (%) | 99.6% | 98.9% | 100.6% |
| Electric transmission lines | |||
| Miles in operation | 1,229 | 1,229 | 1,166 |
| Availability (%) | 100.0% | 100.0% | 100.0% |
| Water | |||
| Mft3 in operation16 | 17.5 | 17.5 | 17.5 |
| Availability (%) | 99.7% | 102.3% | 97.9% |
We closely monitor the following key drivers of our business sectors’ performance to plan for our needs, and to adjust our expectations, financial budgets, and forecasts appropriately.
| • | MW in operation in the case of Renewable energy and Efficient natural gas and heat assets, miles in operation in the case of Transmission lines and Mft3 per day in operation in the case of Water assets, are indicators which provide information about the installed capacity or size of our portfolio of assets. |
| • | Production measured in GWh in our Renewable energy and Efficient natural gas and heat assets provides information about the performance of these assets. |
| • | Availability in the case of our Efficient natural gas and heat assets, Transmission lines and Water assets also provides information on the performance of the assets. In these business segments revenues are based on availability, which is the time during which the asset was available to our client totally or partially divided by contracted availability or budgeted availability, as applicable. |
13 Represents total installed capacity in assets owned or consolidated at the end of the year, regardless of our percentage of ownership in each of the assets except for Vento II for which we have included our 49% interest.
14 Includes 49% of Vento II wind portfolio production since its acquisition. Includes curtailment in wind assets for which we receive compensation.
15 Includes 43 MW corresponding to our 30% share in Monterrey and 55 MWt corresponding to Calgary District Heating.
16 GWh produced includes 30% of the production from Monterrey.

|
Selected Environmental Metrics |
| 2023 | 2022 | 2021 | |||
| Maintain over 85% of adjusted EBITDA from low carbon footprint assets | % | 89% | 89% | 88% | |
| GHG Emissions Breakdown Including Offset GHG Emissions | Scope 1 | thousand tonnes of CO2e | 1,395 | 1,524 | 1,535 |
| Scope 2 | 250 | 249 | 237 | ||
| Scope 3 | 799 | 814 | 798 | ||
| Total | 2,444 | 2,587 | 2,570 | ||
| Offset GHG Emissions | Scope 1 | thousand tonnes of CO2e | 380 | 320 | 260 |
| GHG Emissions Breakdown (without Offsets) | Scope 1 | thousand tonnes of CO2e | 1,775 | 1,844 | 1,795 |
| Scope 2 | 250 | 249 | 237 | ||
| Scope 3 | 799 | 814 | 798 | ||
| Total | 2,824 | 2,907 | 2,830 | ||
| Scopes 1 and 2 GHG Emission Rate per Unit of Energy Generated | gCO2/kWh | 162 | 168 | 185 | |
| GHG Emissions Avoided | million tonnes of CO2e | 7.0 | 6.9 | 5.9 | |
| Water Management in Power Generation | Withdrawal | m3 per MWh | 1.46 | 1.54 | 1.64 |
| Discharges | 0.17 | 0.18 | 0.22 | ||
| Waste Management | Hazardous waste | tonnes of waste | 1,402 | 1,908 | 2,576 |
| Non-hazardous waste | 25,993 | 23,142 | 22,212 | ||
Notes:
| 1. | Our target is to reduce our Scope 1 and Scope 2 GHG emissions per unit of energy generated by 70% by 2035, with 2020 as the base year (57gCO2/KWh by 2035). |
| 2. | Calculated considering GHG emissions Scope 1 and 2 and energy generation of our power generation assets, both electric and thermal energy. The GHG Equivalences Calculator uses the Avoided Emissions and Generation Tool (AVERT) U.S. national weighted average CO2 marginal emissions rate to convert reductions of Kilowatt-hours into avoided units of carbon dioxide emissions |
Selected Social Metrics
| 2023 | 2022 | 2021 | ||
| Health and Safety | Total Recordable Frequency Index | 4.3 | 5.2 | 6.4 |
| Lost Time Frequency Index | 1.9 | 3.1 | 2.4 | |
| Total Recordable Deviation Index | 1,714 | 1,246 | 1,623 | |
| Employees | Voluntary Turnover by year-end | 7.6% | 12.8% | 11.0% |
| Total turnover by year-end | 10.7% | 16.8% | 15.9% | |
| Average Annual Training per employee (in hours) | 33 | 29 | 37 | |
| Percentage of Women | At Management Level | 17% | 23% | 23% |
| Over Total Number of Employees | 17% | 20% | 25% | |
| Gender Pay Gap3 | Total overall pay gap | 5% | 13% | 26% |
| Community Investment and Development | Investments focused on improving infrastructure and supporting education | |||
Notes:
| 1. | Turnover rates calculated based on the average number of employees in each year excluding temporary employees and employees hired to replace sick or leaves. |
| 2. | Health and safety industry benchmarks provided in the Health and Safety section. job function, level, education, performance, location, or exchange rate differences. Overtime has not been included. |
| 3. | Data includes fixed salary, short-term bonus and long-term incentive plans without adjusting for factors such as CEO has been excluded from the analysis as we believe that including his compensation would distort the results. |
| 4. | Total Recordable Frequency Index (TRFI) represents the total number of recordable accidents with and without leave (lost time injury) recorded in the last twelve months per one million worked hours. |
| 5. | Lost Time Frequency Index (LTFI) represents the total number of recordable accidents with leave (lost time injury) recorded in the last twelve months per one million worked hours |
A Fair Review of the Business
Factors that Affect Comparability of our Results of Operations
| ▪ | Investments |
The results of operations of Chile TL4, Italy PV 4 and Chile PV 3 have been fully consolidated since January 2022, April 2022 and September 2022, respectively and the results of Albisu, Tierra Linda and La Tolua have been fully consolidated since these assets entered into operation in the first quarter of 2023. For the full year 2023, these investments represented revenues and Adjusted EBITDA of $14.1 million and $10.5 million respectively, which represents an increase of $7.9 million in revenue and $7.6 million in Adjusted EBITDA for the year ended December 31, 2023 with respect to 2022.
| ▪ | Impairment |
In 2023, considering that expected electricity prices in Chile over the remaining useful life of Chile PV1 have decreased, we have identified an impairment triggering event, in accordance with IAS 36 (Impairment of Assets). As a result, an impairment test has been performed and resulted in an impairment loss of $16.1 million in 2023 in the line “Depreciation, amortisation, and impairment charges”. In 2022, we also recorded an impairment loss of $20.4 million in Chile PV1 and Chile PV2. Our equity interest in Chile PV 1 and Chile PV 2 is 35%. As a result, the impact of the impairment charges in “Profit / (loss) for the year attributable to the parent company” after non-controlling interest was $5.6 million in 2023 and $7.1 million in 2022.
During 2022 we recorded an impairment loss of $41.2 million in Solana with no corresponding triggering event and impairment in 2023.
In addition, IFRS 9 requires impairment provisions to be based on expected credit losses on financial assets rather than on actual credit losses, which affects the concessional assets accounted for as financial assets. For the year 2023 we recorded a decrease in the expected credit loss impairment provision of $13.2 million reflected in the line item “Depreciation, amortisation, and impairment charges” and was primarily related to ACT ($10.9 million). In 2022 we recorded an increase in the expected credit loss impairment provision of $6.7 million, also primarily related to ACT ($4.0 million).
| ▪ | Electricity market prices |
Total revenues in Spain were stable in 2023 compared to the previous year. In addition to regulated revenue, our solar assets in Spain receive revenue from the sale of electricity at market prices. The average electricity market price captured by our assets was approximately €69.9 per MWh during 2023 compared to approximately €145.3 per MWh during 2022. Revenue from the sale of electricity at current market prices represented $84.3 million during 2023, compared to $142.9 million in 2022. Regulated revenues are revised periodically to reflect, among other things, the difference between expected and actual market prices if the difference is higher than a pre-defined threshold and as a result, we record a provision. We decreased our provision by $3.5 million in 2023, with no cash impact, compared to an increase of $25.3 million in the previous year.
In 2023, we have calculated the provision assuming that the average market price must be corrected using the solar time of day adjustment factor (“coeficiente de apuntamiento”), as it was stated in the regulations published since 2020. This factor, which is 90% for 2023, aims to capture the difference between the daily (24 hours) average market price and the price captured by solar assets. Although the factor is not mentioned in the regulation for 2023, we believe the last order includes a clerical error that we expect is going to be corrected.
On May 12, 2022, remuneration parameters in Spain for the year 2022 were published and became final on December 14, 2022, with a decrease in regulated revenue. In addition, on June 30, 2023, the new parameters were published, including a revised assumption on electricity prices for the years 2023, 2024 and 2025. Revenue from the sale of electricity at market prices net of the incremental market price provision was $84.0 million for the full year 2023, compared to $117.6 million for the full year 2022. This decrease was offset by higher production in 2023.
Additionally, in 2022 we collected revenue from our assets in line with the parameters corresponding to the regulation in place at the beginning of the year 2022, however revenue for the year ended December 31, 2022 was recorded in accordance with the new parameters that became final on December 14, 2022, which were lower. Collections were regularised in the first quarter of 2023.
| ▪ | Exchange rates |
We refer to “Exchange rates” below.
Significant Trends Affecting Results of Operations
| ▪ | Investments and acquisitions |
If the recently built assets and the recently closed acquisitions perform as anticipated, we expect these assets to positively impact our results of operations in 2024 and upcoming years.
| ▪ | Solar, wind and geothermal resources |
The availability of solar, wind and geothermal resources affects the financial performance of our renewable assets, which may impact our overall financial performance. Due to the variable nature of solar, wind and geothermal resources, we cannot predict future availabilities or potential variances from expected performance levels from quarter to quarter. Based on the extent to which the solar, wind and geothermal resources are not available at expected levels, this could have a negative impact on our results of operations.
| ▪ | Capital markets conditions |
The capital markets in general are subject to volatility that is unrelated to the operating performance of companies. Our growth strategy depends on our ability to close acquisitions, which often requires access to debt and equity financing to complete these acquisitions. Fluctuations in capital markets may affect our ability to access this capital through debt or equity financings.
| ▪ | Exchange rates |
Our presentation currency and the functional currency of most of our subsidiaries is the U.S. dollar, as most of their revenue and expenses are denominated or linked to U.S. dollars. All our companies located in North America, with the exception of Calgary, with revenue in Canadian dollars, and most of our companies in South America have their revenue and financing contracts signed in or indexed totally or partially to U.S. dollars. Our solar power plants in Europe have their revenue and expenses denominated in euros; Kaxu, our solar plant in South Africa, has its revenue and expenses denominated in South African rand, La Sierpe, La Tolua and Tierra Linda, Honda 1, our solar plants in Colombia, have their revenue and expenses denominated in Colombian pesos and Albisu, our solar plant in Uruguay, has its revenue denominated in Uruguayan pesos, with a maximum and a minimum price in U.S. dollars.
Project financing is typically denominated in the same currency as that of the contracted revenue agreement, which limits our exposure to foreign exchange risk. In addition, we maintain part of our corporate general and administrative expenses and part of our corporate debt in euros which creates a natural hedge for the distributions we receive from our assets in Europe. To further mitigate this exposure, our strategy is to hedge cash distributions from our assets in Europe. We hedge the exchange rate for the net distributions in euros (after deducting interest payments and general and administrative expenses in euros). Through currency options, we have hedged 100% of our euro-denominated net exposure for the next 12 months and 75% of our euro-denominated net exposure for the following 12 months. We expect to continue with this hedging strategy on a rolling basis.
Although we hedge cash-flows in euros, fluctuations in the value of the euro in relation to the U.S. dollar may affect our operating results. For example, revenue in euro-denominated companies could decrease when translated to U.S. dollars at the average foreign exchange rate solely due to a decrease in the average foreign exchange rate, in spite of revenue in the original currency being stable. Fluctuations in the value of the South African rand and Colombian peso with respect to the U.S. dollar may also affect our operating results.
In our discussion of operating results, we have included foreign exchange impacts in our revenue by providing constant currency revenue growth. The constant currency presentation is not a measure recognised under IFRS and excludes the impact of fluctuations in foreign currency exchange rates. We believe providing constant currency information provides valuable supplemental information regarding our results of operations. We calculate constant currency amounts by converting our current period local currency revenue using the prior period foreign currency average exchange rates and comparing these adjusted amounts to our prior period reported results. This calculation may differ from similarly titled measures used by others and, accordingly, the constant currency presentation is not meant to substitute recorded amounts presented in conformity with IFRS as issued by the IASB, nor should such amounts be considered in isolation.
| ▪ | Interest rates |
We incur significant indebtedness at the corporate and asset level. The interest rate risk arises mainly from indebtedness at variable interest rates. To mitigate interest rate risk, we primarily use long-term interest rate swaps and interest rate options which, in exchange for a fee, offer protection against a rise in interest rates. As of December 31, 2023, approximately 92% of our project debt and close to 94% of our corporate debt either has fixed interest rates or has been hedged with swaps or caps. Nevertheless, our results of operations can be affected by changes in interest rates with respect to the unhedged portion of our indebtedness that bears interest at floating rates, which typically bear a spread over EURIBOR or SOFR.
| ▪ | Trends on electricity market prices |
As previously discussed, our solar assets in Spain receive revenue from the sale of electricity at market prices in addition to regulated revenue. Regulated revenues are revised periodically to reflect the difference between expected and actual market prices if the difference is higher than a pre-defined threshold. Additionally, our assets in Italy have contracted revenues through a regulated feed-in premium in addition to merchant revenues for the energy sold to the wholesale market.
Furthermore, we currently have three assets with merchant revenues (Chile PV 1 and Chile PV 3, where we have a 35% ownership, and Lone Star II, where we have a 49% ownership) and one asset with partially contracted revenues (Chile PV 2, where we have a 35% ownership). Our exposure to merchant electricity prices represents less than 1% of our portfolio in terms of Adjusted EBITDA. At Lone Star II we are analysing, together with our partner, the option to repower or recontract the asset in the context of the IRA, at a point in time to be determined.
Due to low electricity prices in Chile, the project debts of Chile PV 1 and 2 are
under an event of default as of December 31, 2023 and as of the date of this report. Chile PV 1 was not able to maintain the minimum required cash in its debt service reserve account as of December 31, 2023 and did not make its debt service payment
in January. In addition, in October 2023, Chile PV 2 did not make its debt service payment. This asset obtained additional financing from the banks and made the debt service payment in December, although it was not able to fund its debt service
reserve account subsequently. As a result, although we do not expect an acceleration of the debt to be declared by the credit entities, as of December 31, 2023 Chile PV 1 and 2 did not have an unconditional right to defer the settlement of the debt
for at least twelve months and the project debt was classified as current in our Annual Consolidated Financial Statements. We are in conversations with the banks, together with our partner, regarding a potential waiver. Impairments were recorded in
these assets in 2023 and 2022. The value of the net assets contributed by Chile PV 1 and 2 to the Annual Consolidated Financial Statements, excluding non-controlling interest, was close to zero as of December 31, 2023.

Financial Review
| 2023 | 2022 | 2021 | |
| Renewable energy | |||
| MW in operation1 | 2,171 | 2,121 | 2,044 |
| GWh produced2 | 5,458 | 5,319 | 4,655 |
| Efficient natural gas | |||
| MW in operation3 | 398 | 398 | 398 |
| GWh produced4 | 2,549 | 2,501 | 2,292 |
| Electric Availability (%) | 99.6% | 98.9% | 100.6% |
| Electric transmission lines | |||
| Miles in operation | 1,229 | 1,229 | 1,166 |
| Availability (%) | 100.0% | 100% | 100.0% |
| Water | |||
| Mft3 in operation | 17.5 | 17.5 | 17.5 |
| Availability (%) | 99.7% | 102.3% | 97.9% |
Note:
| (1) | Represents total installed capacity in assets owned or consolidated at the end of the year, regardless of our percentage of ownership in each of the assets except for Vento II for which we have included our 49% interest. |
| (2) | Includes 49% of Vento II wind portfolio production since its acquisition. Includes curtailment in wind assets for which we receive compensation. |
| (3) | Includes 43 MW corresponding to our 30% share in Monterrey and 55MWt corresponding to Calgary District Heating. |
| (4) | GWh produced includes 30% of the production from Monterrey. |
Production in the renewable business sector increased by 2.6% in 2023, compared to 2022. The increase was largely due to an increase in production in our solar assets in Spain and to the contribution from the assets recently consolidated or which have entered into operation recently, including Chile PV 3, La Tolua, Tierra Linda, Albisu and Italy PV 4, bringing approximately 147.9 MWh of additional electricity generation during the year 2023.
| ● | In our solar assets in the U.S., production increased by 7.4% in 2023 compared to 2022, in spite of lower solar radiation in average during the year. The increase was mainly due to greater availability of the storage system in Solana. On the other hand, production decreased by 9.8% in our wind assets in the U.S., due to lower wind resource in 2023 compared to 2022. Production also decreased at Coso mostly due to scheduled maintenance stops and to lower availability of the transmission line due to the snow storm in California in the first quarter of 2023. |
| ● | In Chile, production at our Chile PV 1 and Chile PV 2 assets decreased by 11.5% in 2023 compared to 2022 mainly because of higher curtailments. At our wind assets in South America, production increased by 6.6% due to better wind resource. |
| ● | In Spain, production at our solar assets increased by 17.5% in 2023 mostly due to better solar radiation compared to 2022, with good performance of the assets. |
| ● | At Kaxu, production decreased by 48.6% in 2023 compared to 2022 mostly due to an outage of the plant. In the third quarter, a scheduled turbine major overhaul was carried out by Siemens, the original equipment manufacturer and took approximately 30 days longer than expected. After restarting production, at the end of September, a problem was found in the turbine, likely related to the major overhaul. The plant restarted operations in mid-February. Part of the damage and the business interruption is covered by our insurance property policy, after a 60-day deductible. |
Our efficient natural gas and heat assets, our water assets and our transmission lines, for which revenue is based on availability, continued at very high levels during 2023.
Results of Operations
The table below details our results of operations for the years ended December 31, 2023, and 2022.
|
|
Year ended December 31, |
|
| $ in millions | 2023 | 2022 |
| Revenue | 1,099.9 | 1,102.0 |
| Other operating income | 101.1 | 80.8 |
| Employee benefit expenses | (104.1) | (80.2) |
| Depreciation, amortisation, and impairment charges | (418.3) | (473.6) |
| Other operating expenses | (336.6) | (351.3) |
| Operating profit | 342.0 | 277.7 |
| Financial income | 25.0 | 10.1 |
| Financial expense | (323.7) | (330.4) |
| Net exchange differences | (2.5) | 10.3 |
| Other financial income/(expense), net | (16.6) | (0.9) |
| Financial expense, net1 | (318.0) | (310.9) |
| Share of profit/(loss) of entities carried under the equity method | 13.2 | 21.4 |
| Profit/(loss) before income tax | 37.2 | (11.8) |
| Income tax | (0.8) | 9.7 |
| Profit/(loss) for the year | 36.5 | (2.1) |
| Profit attributable to non-controlling interests | 6.9 | (3.3) |
| Profit/(loss) for the year attributable to the parent company | 43.4 | (5.4) |
Notes:
| (1) | Classification within Financial income and financial expense has been revised to show a more meaningful classification of financial income and expense following the increase in interest rates. Prior period classification has been revised accordingly. |
Revenue
Revenue decreased to $1,099.9 million for the year 2023 compared to $1,102.0 million for 2022. Revenue decreased primarily due to the decrease in production at Kaxu resulting from the unscheduled outage and the maintenance stop previously explained. Revenue at Kaxu decreased by $45.8 million. Part of the damage and the business interruption is covered by our insurance property policy, after deductibles, and as such we have recorded a $15.3 million insurance income in Other operating income.
These effects were partially offset by higher revenues at our solar assets in the U.S. due to higher electricity production especially in Solana, as previously explained. Revenue also increased at our transmission lines in 2023 compared to 2022 mostly as a result of inflation adjustments to tariffs, including a positive tariff adjustment in Chile TL 3 corresponding to previous years, which was published in the second quarter of 2023. In addition, the Company generated additional revenue from assets recently consolidated and assets that entered into operation recently, which together represented a total of $14.1 million of revenue in 2023 compared to $6.2 million in 2022. Revenue remained stable at our solar assets in Spain, since higher production during the period was offset by lower electricity prices, net of its corresponding accounting provision (due to the factors described under “—Factors that Affect Comparability of our Results of Operations — Electricity Market prices”).
Other Operating Income
The following table details our other operating income for the years ended December 31, 2023, and 2022:
|
|
Year ended December 31, |
||
| $ in millions | 2023 | 2022 | |
| Grants | 58.7 | 59.1 | |
| Insurance proceeds and other | 35.8 | 21.7 | |
| Income from subcontracted construction services for our assets and concessions | 6.6 | - | |
| Total | 101.1 | 80.8 | |
“Grants” represent the financial support provided by the U.S. Department of the Treasury to Solana and Mojave and consist of an ITC Cash Grant and an implicit grant related to the below market interest rates of the project loans with the Federal Financing Bank. Grants were stable during 2023, compared to 2022.
“Insurance proceeds and other” increased by $14.1 million in 2023 compared to 2022. In 2023, “Insurance proceeds and other” included $15.3 million of insurance proceeds related to the Kaxu unscheduled outage, as previously explained. In addition, it included $4.6 million income from the sale of part of our equity interest in our development company in Colombia to a partner who now holds a 50% equity interest, with joint control. Finally, it includes $4.8 million related to improvements in our Calgary district heating asset which are re-invoiced to the municipality, with the corresponding cost recorded in “Other operating expenses”. In 2022, “Insurance proceeds and other” included an insurance income of $9.5 million.
“Income from construction services for our assets and concessions” is related to the construction of ATS Expansion 1 and ATN Expansion 3. Since these assets are accounted for under IFRIC 12, we are required to account for income from construction services as “Other operating income”, with the corresponding construction cost recorded within “Other operating expenses, Construction costs”.
Employee Benefit Expenses
Employee benefit expenses increased by 29.7% to $104.1 million for 2023, compared to $80.2 million in 2022 mainly due to the internalisation of the O&M services at Kaxu in 2022 and at our solar assets in Spain in 2022 and 2023.
Depreciation, Amortisation, and Impairment Charges
Depreciation, amortisation, and impairment charges decreased by 11.7% to $418.3 million for the year ended December 31, 2023, compared to $473.6 million for the year ended December 31, 2022. The decrease was mainly due to the $41 million impairment loss recorded at Solana in 2022, with no corresponding amount in 2023. The decrease was also due to a decrease of the expected credit loss impairment provision at ACT. IFRS 9 requires impairment provisions to be based on the expected credit loss of the financial assets in addition to actual credit losses. ACT recorded a decrease in the credit loss impairment provision of $10.9 million in 2023, while in 2022, it recorded an increase in the credit loss impairment provision of $4.0 million. In Chile, we recorded an impairment of $16.1 million related to Chile PV1. In 2022 we also recorded an impairment of $20.4 million at Chile PV 1 and Chile PV 2. On the other hand, these effects on depreciation, amortisation and impairment were partially offset by increased charges due to the consolidation of assets recently acquired or which entered in operation recently.
Other Operating Expenses
The following table details our other operating expenses for the years ended December 31, 2023, and 2022:
| Year ended December 31, | ||||||||
| 2023 | 2022 | |||||||
| Other operating expenses | $ in millions | % of revenue | $ in millions | % of revenue | ||||
| Raw materials | 35.4 | 3.2% | 19.7 | 1.8% | ||||
| Leases and fees | 14.4 | 1.3% | 11.5 | 1.0% | ||||
| Operation and maintenance | 130.4 | 11.9% | 140.4 | 12.7% | ||||
| Independent professional services | 30.7 | 2.8% | 38.9 | 3.6% | ||||
| Supplies | 37.8 | 3.4% | 59.3 | 5.4% | ||||
| Insurance | 41.1 | 3.7% | 45.8 | 4.2% | ||||
| Levies and duties | 15.0 | 1.4% | 19.8 | 1.8% | ||||
| Other expenses | 25.2 | 2.3% | 16.0 | 1.3% | ||||
| Construction costs | 6.6 | 0.6% | - | - | ||||
| Total | 336.6 | 30.6% | 351.3 | 31.8% | ||||
Other operating expenses decreased by 4.2% to $336.6 million for the year ended December 31, 2023, compared to $351.3 million for the year ended December 31, 2022 mainly due to lower cost of “Supplies” and lower “Operation and maintenance” costs.
Cost of supplies decreased mostly due to lower price of electricity in our assets in Spain. In addition, our operation and maintenance costs decreased during 2023, compared to 2022 mainly due to lower O&M costs in Spain, where these services have been internalised and are now provided by employees of Atlantica, with the cost classified in “Employee benefit” expenses.
On the other hand, the cost of “Raw Materials” increased in the subsidiaries which are now performing the operation and maintenance which was previously subcontracted, as these costs are now assumed directly by subsidiaries of Atlantica. “Other expenses” include costs related to improvements in our Calgary district heating asset which are re-invoiced to the municipality, as previously discussed.
“Construction costs” refers to the cost of construction of ATS Expansion 1 and ATN Expansion 3.
Operating Profit
As a result of the previously above-mentioned factors, operating profit increased by 23.2% to $342.0 million for the year ended December 31, 2023, compared with $277.7 million for the year ended December 31, 2022.
Financial Income and Financial Expense17
| Year ended December 31, 2023 | ||
| $ in millions | 2023 | 2022 |
| Financial income | 25.0 | 10.1 |
| Financial expense | (323.8) | (330.4) |
| Net exchange differences | (2.5) | 10.3 |
| Other financial income/(loss), net | (16.7) | (0.9) |
| Financial expense, net | (318.0) | (310.9) |
17 Classification within Financial income and financial expense has been revised to show a more meaningful classification of financial income and expense following the increase in interest rates. Prior period classification has been revised accordingly.
Financial Income
The following table details our financial income for the years ended December 31, 2023, and 2022:
| $ in millions |
Year ended December 31, 2023 |
||||
| 2023 | 2022 | ||||
| Interest income on deposits and current accounts | 21.7 | 7.7 | |||
| Interest on loans and credits | 2.9 | 1.3 | |||
| Interest rates losses derivatives: cash flow hedges | 0.4 | 1.1 | |||
| Total | 25.0 | 10.1 | |||
Financial income increased from $10.1 million in 2022 to $25.0 million 2023 mostly due to higher remuneration of deposits resulting from higher interest rates.
Financial Expense
The following table details our financial expense for the years ended December 31, 2023, and 2022:
| $ in millions |
Year ended December 31, 2023 |
||||
| 2023 | 2022 | ||||
| Interest on loans and notes | (350.4) | (292.0) | |||
| Interest rates gains / losses derivatives: cash flow hedges | 26.6 | (38.4) | |||
| Total | (323.8) | (330.4) | |||
Financial expense decreased to $323.8 million in 2023 compared to $330.4 million in 2022. Interest rates have been higher in 2023 than in 2022, causing an increase in interest on loans and notes, which has been more than offset by the impact in our income statement of the derivatives hedging our loans. The decrease is due to a $26.6 million gain in “Interest rate gains/losses on derivatives: cash flow hedges”, where we record transfers from equity to the income statement when the hedged item impacts profit and loss compared to a $38.4 million loss in 2022, due to the increase in the reference rates in 2023, compared to 2022. Considering interest gains on hedge instruments of such loans and notes, total interest decreased in 2023 as in 2022, which is primarily due to the repayment of project and corporate debt in accordance with the financing arrangements.
Net Exchange Differences
Net exchange differences decreased to a $2.5 million loss in 2023 compared to a $10.3 million income in 2022. The decrease was mainly due to the change in fair value of caps hedging our net cash flows in Euros, which was largely stable in 2023 while it increased in 2022.
Other Financial Income/(Expense), Net
| Year ended December 31, | |||
| $ in millions | 2023 | 2022 | |
| Other financial income/(expenses) | |||
| Other financial income | 8.8 | 20.5 | |
| Other financial expense | (25.5) | (21.4) | |
| Total | (16.7) | (0.9) | |
Other financial income/(expense), net increased to a net expense of $16.7 million in 2023, compared to a net expense of $0.9 million in 2022.
Other financial income in 2023, primarily includes an income of $3.9 million corresponding to the change in the fair value of the conversion option of the Green Exchangeable Notes in the period, (compared to $12.0 million in 2022). Other financial income also includes a non-monetary change to the fair value of derivatives of Kaxu for which hedge accounting is not applied for $0.1 million (compared to $6.2 million in the 2022) and a one-time income related to the extension in the maturity of the Green Project Finance, which qualifies as a refinancing from an accounting perspective.
Other financial expense increased in 2023, mainly due to the financial impact related to the electricity market prices provision recorded at our solar assets in Spain. This is a long-term provision recorded at present value in accordance with the effective interest method, which progressively accrues a financial expense. Other financial expense also includes expenses for guarantees and letters of credit, wire transfers, other bank fees and other minor financial expenses.
Share of Profit of Associates Carried Under the Equity Method
Share of profit of associates carried under the equity method decreased to $13.2 million in the year ended December 31, 2023, compared to $21.4 million in the year ended December 31, 2022 primarily due to a lower profit at Vento II, resulting from lower production and a lower price at Lone Star II after its PPA expired in January 2023.
Profit/(loss) Before Income Tax
As a result of the previously mentioned factors, we reported a profit before income tax of $37.2 million for the year ended December 31, 2023, compared to a loss before income tax of $11.8 million for the year ended December 31, 2022.
Income Tax
The reconciliation between the theoretical income tax resulting from applying an average statutory tax rate to profit before income tax and the actual income tax expense recognised in the consolidated income statements for the years ended December 31, 2023 and 2022, is as follows:
| Year ended December 31, | ||||
| 2023 | 2022 | |||
| $ in millions | ||||
| Consolidated profit/(loss) before tax | 37.2 | (11.8) | ||
| Average statutory tax rate1 | 25% | 25% | ||
| Corporate income tax at average statutory tax rate | (9.3) | 2.9 | ||
| Income tax of associates, net | 3.3 | 5.4 | ||
| Differences in statutory tax rates | (4.3) | (4.3) | ||
| Unrecognised NOLS and deferred tax assets | (11.1) | (10.9) | ||
| Other Permanent differences | 17.5 | 4.0 | ||
| Other non-taxable income/(expense) | 3.1 | 12.7 | ||
| Corporate Income Tax | (0.8) | 9.7 | ||
Note:
| (1) | The average statutory tax rate was calculated as an average of the statutory tax rates applicable to each of our subsidiaries weighted by the Income Before Tax. |
For the year ended December 31, 2023 the overall effective tax rate was different than the statutory rate of 25% primarily due to permanent differences, most of which relate to exchange rate differences in Mexico, where taxes are calculated in local currency, which was partially offset by unrecognized tax credits in several jurisdictions.
Loss/(profit) Attributable to Non-Controlling Interests
Loss attributable to non-controlling interests was $6.9 million for the year ended December 31, 2023 compared to $3.4 million profit for the year ended December 31, 2022. Loss /(profit) attributable to non-controlling interests corresponds to the portion attributable to our partners in the assets that we consolidate (Kaxu, Skikda, Solaben 2 & 3, Solacor 1 & 2, Seville PV, Chile PV 1, Chile PV 2, Chile PV 3 and Tenes). The loss in profit attributable to non-controlling interest in 2023 was mainly due to the loss reported in Kaxu resulting from lower production as previously explained.
Profit / (Loss) Attributable to the Parent Company
As a result of the previously mentioned factors, profit attributable to the parent company was $43.4 million for the year ended December 31, 2023, compared to a loss of $5.4 million for the year ended December 31, 2022.
Comparison of the Years Ended December 31, 2022 and 2021
The significant variances or variances of the significant components of the results of operations between the years ended December 31, 2021 and December 31, 2021, are discussed in the 2022 Consolidated Annual Report and Financial Statements.
Our Segment Reporting
We organise our business into the following three geographies where the contracted assets and concessions are located: North America, South America and EMEA. In addition, we have identified four business sectors based on the type of activity: Renewable energy, Efficient natural gas and heat, Transmission lines and Water. We report our results in accordance with both criteria.
| Year ended December 31, | ||||
| 2023 | 2022 | |||
| Revenue by geography | $ in millions | % of revenue | $ in millions | % of revenue |
| North America | 424.9 | 38.6% | 405.1 | 36.8% |
| South America | 188.1 | 17.1% | 166.4 | 15.1% |
| EMEA | 486.9 | 44.3% | 530.5 | 48.1% |
| Total revenue | 1,099.9 | 100.0% | 1,102.0 | 100.0% |
| Year ended December 31, | ||||
| 2023 | 2022 | |||
| Adjusted EBITDA by geography | $ in millions | % of Adjusted EBITDA | $ in millions | % of Adjusted EBITDA |
| North America | 319.3 | 40.1% | 310.0 | 38.9% |
| South America | 146.7 | 18.5% | 126.5 | 15.9% |
| EMEA | 328.9 | 41.4% | 360.6 | 45.2% |
| Adjusted EBITDA1 | 794.9 | 100.0% | 797.1 | 100.0% |
Note:
| (1) | We refer to section “Non-GAAP Financial Measures”, for a definition of our Adjusted EBITDA and to section “Other Information” for a detailed reconciliation. |
Volume produced/availability
| Year ended December 31, | ||
| Volume/ availability by geography | 2023 | 2022 |
| North America (GWh)1 | 5,749 | 5,743 |
| North America availability2 | 99.6% | 98.9% |
| South America (GWh)3 | 957 | 799 |
| South America availability2 | 99.9% | 99.9% |
| EMEA (GWh) | 1,301 | 1,278 |
| EMEA availability | 99.7% | 102.3% |
Note:
| (1) | GWh produced includes 30% of the production from Monterrey and our 49% of Vento II wind portfolio production since its acquisition. |
| (2) | Availability includes only those assets that have revenue based on availability. |
| (3) | Includes curtailment production in wind assets for which we receive compensation. |
North America
Revenue increased by 4.9% to $424.9 million for the year ended December 31, 2023, compared to $405.1 million for the year ended December 31, 2022, while Adjusted EBITDA increased by 3.0% to $319.3 million for the year ended December 31, 2023, compared to $310.0 million for 2022. The increase in revenue was mainly due to higher electricity production in our solar assets in the U.S. as previously discussed, together with higher revenue at ACT (see “Efficient natural gas & heat” below), which was partially offset by lower revenue at Coso due to lower production. Adjusted EBITDA increased mainly due to the increase in revenue and lower costs in our solar assets in the US, mostly caused by lower insurance costs and lower O&M costs at Mojave. These effects were partially offset by lower EBITDA at Vento II, caused by lower production and lower prices at Lone Star II after the end of its PPA.
South America
Revenue increased by 13.0% to $188.1 million for the year ended December 31, 2023, compared to $166.4 million for the year ended December 31, 2022. The increase was mainly due to indexation to inflation in our revenue in transmission lines, including a positive tariff adjustment in Chile TL 3 corresponding to previous years which was published in the second quarter of 2023, and in wind assets in South America. Revenue also increased due to assets recently consolidated and assets which entered in operation recently. This increase was partially offset by lower revenue at our PV assets in Chile, where production decreased mostly due to lower electricity prices and, to a lower extent, curtailments. Adjusted EBITDA increased by 15.9% to $146.7 million for the year ended December 31, 2023, compared to $126.5 million for the year ended December 31, 2022, mostly due to the increase in revenue and to a $4.6 million gain from the sale of part of our equity interest in our development company in Colombia to a partner in the first quarter of 2023.
EMEA
Revenue decreased to $486.9 million for the year ended December 31, 2023, which represents a decrease of 8.2% compared to $530.5 million for the year ended December 31, 2022. The decrease was mainly due to lower revenue at Kaxu by $45.8 million, mostly due to an unscheduled outage coupled with a prolonged maintenance stop, as previously explained. Revenue at our solar assets in Spain remained stable.
Adjusted EBITDA decreased to $328.9 million for the year ended December 31, 2023, which represents a decrease of 8.8% compared to $360.6 million for the year ended December 31, 2022. Adjusted EBITDA decreased mainly due to the outage at Kaxu causing a $26.6 million decrease in EBITDA. The impact in Adjusted EBITDA was lower as a result of insurance income.
| Year ended December 31, | ||||
| 2023 | 2022 | |||
| Revenue by business sector | $ in millions | % of revenue | $ in millions | % of revenue |
| Renewable energy | 802.8 | 73.0% | 821.4 | 74.5% |
| Efficient natural gas & heat | 118.4 | 10.8% | 113.6 | 10.3% |
| Transmission lines | 123.5 | 11.2% | 113.2 | 10.3% |
| Water | 55.2 | 5.0% | 53.8 | 4.9% |
| Total revenue | 1,099.9 | 100.0% | 1,102.0 | 100.0% |
| Year ended December 31, | ||||
| 2023 | 2022 | |||
| Adjusted EBITDA by business sector | $ in millions |
% of Adjusted EBITDA |
$ in millions |
% of Adjusted EBITDA |
| Renewable energy | 575.7 | 72.4% | 588.0 | 73.8% |
| Efficient natural gas & heat | 87.4 | 11.0% | 84.6 | 10.6% |
| Transmission lines | 96.0 | 12.1% | 88.0 | 11.0% |
| Water | 35.8 | 4.5% | 36.5 | 4.6% |
| Adjusted EBITDA1 | 794.9 | 100.0% | 797.1 | 100.0% |
Note:
| (1) | We refer to the section “Non-GAAP Financial Measures”, for a definition of our Adjusted EBITDA and to the section “Other Information” for a detailed reconciliation. |
Volume produced/availability
| Year ended December 31, | ||
| Volume by business sector | 2023 | 2022 |
| Renewable energy (GWh)1 | 5,458 | 5,319 |
| Efficient natural gas & Heat (GWh)2 | 2,549 | 2,501 |
| Efficient natural gas & Heat availability | 99.6% | 98.9% |
| Transmission lines availability | 100.0% | 100.0% |
| Water availability | 99.7% | 102.3% |
Note:
| (1) | Includes curtailment production in wind assets for which we receive compensation. Includes our 49% of Vento II wind portfolio production since its acquisition. |
| (2) | GWh produced includes 30% of the production from Monterrey. |
Renewable Energy
Revenue decreased to $802.8 million for the year ended December 31, 2023, which represents a decrease of 2.3% compared to $821.4 million for the year ended December 31, 2022. The decrease in revenue was primarily due to lower revenue at Kaxu as previously discussed. On the other hand, revenue increased at our solar assets in the U.S. due to higher electricity production as previously explained and at our wind assets in South America due to higher production and price indexation to inflation, together with the contribution of assets recently consolidated. As previously explained, revenue at our solar assets in Spain remained stable.
Adjusted EBITDA decreased to $575.7 million for the year ended December 31, 2023, which represents a decrease of 2.1% compared to $588.0 million for the year ended December 31, 2022. The decrease in Adjusted EBITDA was mainly due to the decrease in revenue and to lower EBITDA at Vento II, as previously explained.
Efficient Natural Gas and Heat
Revenue increased by 4.2% to $118.4 million for the year ended December 31, 2023, compared to $113.6 million for the year ended December 31, 2022, while Adjusted EBITDA increased by 3.3% to $87.4 million for the year ended December 31, 2023, compared to $84.6 million for the year ended December 31, 2022. Revenue and Adjusted EBITDA increased at ACT with Adjusted EBITDA increasing by less mainly due to higher O&M costs, since there is a portion of revenue related to O&M services plus a margin.
Transmission Lines
Revenue increased by 9.0% to $123.5 million for the year ended December 31, 2023, compared to $113.2 million for year ended December 31, 2022, while Adjusted EBITDA increased by 9.1% to $96.0 million for the year ended December 31, 2023 compared to $88.0 million for the year ended December 31, 2022. The increase in revenue and Adjusted EBITDA was mainly due to tariff indexation to inflation including a positive tariff adjustment in Chile TL 3 corresponding to previous years.
Water
Revenue increased to $55.2 million for the year ended December 31, 2023, which represents a 2.6% increase compared to $53.8 million for the year ended December 31, 2022. Adjusted EBITDA decreased to $35.7 million for the year ended December 31, 2023, which represents a 1.9% decrease compared to $36.5 million for year ended December 31, 2022. Adjusted EBITDA decreased while Revenue increased because of higher O&M costs, which are indexed to inflation.
Comparison of the Years Ended December 31, 2022 and 2021
The significant variances in the revenue and volume, by geographic region and business sector, between the years ended December 31, 2022 and December 31, 2021, are discussed in the Form 20-F filed with the SEC on February 28, 2023.
Liquidity and Capital Resources
Our principal liquidity and capital requirements consist of the following:
| ● | debt service requirements on our existing and future debt; |
| ● | cash dividends to investors; and |
| ● | investments in new assets and companies and operations. |
As part of our business, depending on market conditions, we will from time to time consider opportunities to repay, redeem, repurchase or refinance our indebtedness. Changes in our operating plans, lower than anticipated sales, increased expenses, acquisitions or other events may cause us to seek additional debt or equity financing in future periods. There can be no guarantee that financing will be available on acceptable terms or at all. Debt financing, if available, could impose additional cash payment obligations and additional covenants and operating restrictions. In addition, any of the items discussed in detail under “Principal Risk and Uncertainties” and other factors may also significantly impact our liquidity.
Liquidity Position
| Year ended December 31, | ||
| 2023 | 2022 | |
| ($ in millions) | ||
| Corporate liquidity | ||
| Cash and cash equivalents at Atlantica Sustainable Infrastructure, plc, excluding subsidiaries | 33.0 | 60.8 |
| Revolving credit facility availability | 378.1 | 385.1 |
| Total Corporate liquidity1 | 411.1 | 445.9 |
| Liquidity at project companies | ||
| Restricted cash | 177.0 | 207.6 |
| Non-restricted cash | 238.3 | 332.6 |
| Total cash at project companies | 415.3 | 540.2 |
Note:
| (1) | Corporate liquidity means cash and cash equivalents held at Atlantica Sustainable Infrastructure plc as of December 31, 2023, and available revolver capacity as of December 31, 2023. |
Cash at the project level includes $177.0 million and $207.6 million restricted cash balances as of December 31, 2023 and 2022, respectively. Restricted cash consists primarily of funds required to meet the requirements of certain project debt arrangements. In the case of Solana, part of the restricted cash is being used and is expected to be used for equipment replacement.
As of December 31, 2023, $16.9 million of letters of credit were outstanding under the Revolving Credit Facility and we had $55 million of borrowings. As a result, as of December 31, 2023, $378.1 million was available under the Revolving Credit Facility. As of December 31, 2022, we had $30 million of borrowings and $34.9 million of letters of credit outstanding and $385.1 million was available under our Revolving Credit Facility.
Non-restricted cash at project companies includes among others, the cash that is required for day-to-day management of the companies, as well as amounts that are earmarked to be used for debt service and distributions in the future.
Management believes that the Company’s liquidity position, cash flows from operations and availability under its Revolving Credit Facility will be adequate to meet the Company’s working capital requirements, financial commitments and debt obligations; growth, operating and maintenance capital expenditures; and dividend distributions to shareholders. Management continues to regularly monitor the Company’s ability to finance the needs of its operating, financing and investing activities within the guidelines of prudent balance sheet management.
Credit Ratings
Credit rating agencies rate us and part of our debt securities. These ratings are used by the debt markets to evaluate our credit risk. Ratings influence the price paid to issue new debt securities as they indicate to the market our ability to pay principal, interest and dividends.
The following table summarises our credit ratings as of December 31, 2023. The ratings outlook is stable for S&P and Fitch.
| S&P | Fitch | |||
| Atlantica Sustainable Infrastructure corporate rating | BB+ | BB+ | ||
| Senior secured debt | BBB- | BBB- | ||
| Senior unsecured debt | BB+ | BB+ | ||
Sources of Liquidity
We expect our ongoing sources of liquidity to include cash on hand, cash generated from our operations, project debt arrangements, corporate debt and the issuance of additional equity securities, as appropriate, and given market conditions. Our financing agreements consist mainly of the project-level financing for our various assets and our corporate debt financings, including our Green Exchangeable Notes, the Note Issuance Facility 2020, the 2020 Green Private Placement, the Green Senior Notes, the Revolving Credit Facility, the “at-the-market programme”, other credit lines and our commercial paper programme.
| Maturity | 2023 | 2022 | |
| $ in millions | |||
| Revolving Credit Facility | 2025 | 54.4 | 29.4 |
| Other Facilities1 | 2024-2028 | 53.3 | 30.1 |
| Green Exchangeable Notes | 2025 | 110.0 | 107.1 |
| 2020 Green Private Placement | 2026 | 318.7 | 308.4 |
| Note Issuance Facility 2020 | 2027 | 152.4 | 147.2 |
| Green Senior Notes | 2028 | 396.0 | 395.1 |
| Total Corporate Debt2 | 1,084.8 | 1,017.2 | |
| Total Project Debt | 4,319.3 | 4,553.1 | |
Note:
| (1) | Other facilities include the commercial paper programme, accrued interest payable and other debts. |
| (2) | Accounting amounts may differ from notional amounts. |
A) Corporate Debt Agreements
Green Senior Notes
On May 18, 2021, we issued the Green Senior Notes with an aggregate principal amount of $400 million due in 2028. The Green Senior Notes bear interest at a rate of 4.125% per year, payable on June 15 and December 15 of each year, commencing December 15, 2021, and will mature on June 15, 2028.
The Green Senior Notes were issued pursuant to an Indenture, dated May 18, 2021, by and among Atlantica as issuer, Atlantica Peru S.A., ACT Holding, S.A. de C.V., Atlantica Infraestructura Sostenible, S.L.U., Atlantica Investments Limited, Atlantica Newco Limited, Atlantica North America LLC, as guarantors, BNY Mellon Corporate Trustee Services Limited, as trustee, The Bank of New York Mellon, London Branch, as paying agent, and The Bank of New York Mellon SA/NV, Dublin Branch, as registrar and transfer agent.
Our obligations under the Green Senior Notes rank equal in right of payment with our outstanding obligations under the Revolving Credit Facility, the 2020 Green Private Placement, the Note Issuance Facility 2020, the Green Exchangeable Notes and the credit line with Export Development Canada.
Green Exchangeable Notes
On July 17, 2020, we issued 4.00% Green Exchangeable Notes amounting to an aggregate principal amount of $100 million due in 2025. On July 29, 2020, we issued an additional $15 million aggregate principal amount in Green Exchangeable Notes. The Green Exchangeable Notes are the senior unsecured obligations of Atlantica Jersey, a wholly owned subsidiary of Atlantica, and fully and unconditionally guaranteed by Atlantica on a senior, unsecured basis. The notes mature on July 15, 2025, unless they are repurchased or redeemed earlier by Atlantica or exchanged, and bear interest at a rate of 4.00% per annum.
Noteholders may exchange all or any portion of their notes at their option at any time prior to the close of business on the scheduled trading day immediately preceding April 15, 2025, only during certain periods and upon satisfaction of certain conditions. Noteholders may exchange all or any portion of their notes during any calendar quarter if the last reported sale price of Atlantica’s ordinary shares for at least 20 trading days during a period of 30 consecutive trading days, ending on the last trading day of the immediately preceding calendar quarter is greater than 120% of the exchange price on each applicable trading day. On or after April 15, 2025, until the close of business on the second scheduled trading day immediately preceding the maturity date thereof, noteholders may exchange any of their notes at any time, at the option of the noteholder. Upon exchange, the notes may be settled, at our election, into Atlantica ordinary shares, cash or a combination of both. The initial exchange rate of the notes is 29.1070 ordinary shares per $1,000 of the principal amount of notes (which is equivalent to an initial exchange price of $34.36 per ordinary share). The exchange rate is subject to adjustment upon the occurrence of certain events.
Our obligations under the Green Exchangeable Notes rank equal in right of payment with our outstanding obligations under the Revolving Credit Facility, the 2020 Green Private Placement, the Note Issuance Facility 2020, the Green Senior Notes, and the credit line with Export Development Canada.
Note Issuance Facility 2020
On July 8, 2020, we entered into the Note Issuance Facility 2020, a senior unsecured euro-denominated financing with a group of funds managed by Westbourne Capital as purchasers of the notes issued thereunder for a total amount of €140 million ($155 million). The notes under the Note Issuance Facility 2020 were issued on August 12, 2020 and are due on August 12, 2027. Interest accrues at a rate per annum equal to the sum of the three-month EURIBOR plus a margin of 5.25% with a floor of 0% for the EURIBOR. We had a cap at 0% for the EURIBOR with 3.5 years maturity and in December 2023, we entered into a cap at 4% to hedge the variable interest rate risk with maturity on December 31, 2024.
Our obligations under the Note Issuance Facility 2020 rank equal in right of payment with our outstanding obligations under the Revolving Credit Facility, the 2020 Green Private Placement, the Green Exchangeable Notes, the Green Senior Notes, and the credit line with Export Development Canada. The notes issued under the Note Issuance Facility 2020 are guaranteed on a senior unsecured basis by our subsidiaries Atlantica Infraestructura Sostenible, S.L.U., Atlantica Peru, S.A., ACT Holding, S.A. de C.V., Atlantica Investments Limited, Atlantica Newco Limited and Atlantica North America LLC.
2020 Green Private Placement
On March 20, 2020, we entered into a senior secured note purchase agreement with a group of institutional investors as purchasers providing for the 2020 Green Private Placement. The transaction closed on April 1, 2020, and we issued notes for a total principal amount of €290 million ($320 million), maturing on June 20, 2026. Interest accrues at a rate per annum equal to 1.96%. If at any time the rating of these senior secured notes is below investment grade, the interest rate thereon would increase by 100 basis points until such notes are again rated investment grade.
Our obligations under the 2020 Green Private Placement rank equal in right of payment with our outstanding obligations under the Revolving Credit Facility, the Note Issuance Facility 2020, the Green Senior Notes and the credit line with Export Development Canada. Our payment obligations under the 2020 Green Private Placement are guaranteed on a senior secured basis by our subsidiaries Atlantica Infraestructura Sostenible, S.L.U., Atlantica Peru, S.A., ACT Holding, S.A. de C.V., Atlantica Investments Limited, Atlantica Newco Limited and Atlantica North America LLC. The 2020 Green Private Placement is also secured with a pledge over the shares of the subsidiary guarantors, the collateral of which is shared with the lenders under the Revolving Credit Facility.
Revolving Credit Facility
On May 10, 2018, we entered into a $215 million Revolving Credit Facility with a syndicate of banks. The Revolving Credit Facility was increased by $85 million to $300 million on January 25, 2019, and was further increased by $125 million (to a total limit of $425 million) on August 2, 2019. On March 1, 2021, this facility was further increased by $25 million (to a total limit of $450 million). On May 30, 2023, the maturity of the Revolving Credit Facility was extended to December 31, 2025. Under the Revolving Credit Facility, we are also able to request the issuance of letters of credit, which are subject to a sublimit of $100 million that are included in the aggregate commitments available under the Revolving Credit Facility.
Loans under the Revolving Credit Facility accrue interest at a rate per annum equal to: (A) for Eurodollar rate loans, Term SOFR, plus a Term SOFR Adjustment equal to 0.10% per annum, plus a percentage determined by reference to our leverage ratio, ranging between 1.60% and 2.25% and (B) for base rate loans, the highest of (i) the rate per annum equal to the weighted average of the rates on overnight U.S. Federal funds transactions with members of the U.S. Federal Reserve System arranged by U.S. federal funds brokers on such day plus ½ of 1.00%, (ii) the prime rate of the administrative agent under the Revolving Credit Facility and (iii) Term SOFR plus 1.00%, in any case, plus a percentage determined by reference to our leverage ratio, ranging between 0.60% and 1.00%.
Our obligations under the Revolving Credit Facility rank equal in right of payment with our outstanding obligations under the 2020 Green Private Placement, the Note Issuance Facility 2020, the Green Exchangeable Notes, the Green Senior Notes and the credit line with Export Development Canada. Our payment obligations under the Revolving Credit Facility are guaranteed on a senior secured basis by Atlantica Infraestructura Sostenible, S.L.U., Atlantica Peru, S.A., ACT Holding, S.A. de C.V., Atlantica Investments Limited, Atlantica Newco Limited and Atlantica North America LLC. The Revolving Credit Facility is also secured with a pledge over the shares of the subsidiary guarantors, the collateral of which is shared with the holders of the notes issued under the 2020 Green Private Placement.
Credit Line with Export Development Canada
In June 2023 we entered into a senior unsecured $50 million line of credit with Export Development Canada with a 3 year maturity. The purpose of the credit line is to finance the construction of sustainable projects. The interest is at a rate per annum equal to Term SOFR plus a percentage determined by reference to our leverage ratio, ranging between 2.46% and 3.11%, with a floor of 0% for the Term SOFR. The facility matures on May 25, 2026 and was fully available as of December 31, 2023.
Our obligations under this credit line are equal in right of payment with our outstanding obligations under the 2020 Green Private Placement, the Note Issuance Facility 2020, the Green Exchangeable Notes, the Green Senior Notes, the Revolving Credit Facility. Our payment obligations under this line are guaranteed on a senior secured basis by Atlantica Infraestructura Sostenible, S.L.U., Atlantica Peru, S.A., ACT Holding, S.A. de C.V., Atlantica Investments Limited, Atlantica Newco Limited and Atlantica North America LLC, and are also secured with a pledge over the shares of the subsidiary guarantors, the collateral of which is shared with the holders of the notes issued under the 2020 Green Private Placement.
Other Credit Lines
In July 2017, we signed a line of credit with a bank for up to €10.0 million ($11.0 million) which was available in Euros or U.S. Dollars. Amounts drawn accrue interest at a rate per annum equal to the sum of the three-month EURIBOR or SOFR, plus a margin of 2%, with a floor of 0% for the EURIBOR or SOFR. On August 7, 2023 the limit was increased to €15 million ($16.6 million) and the maturity was extended until July 2025. As of December 31, 2023, €9.0 million ($9.9 million) where drawn from this credit line.
In December 2020 and January 2022, we also entered into two different loans with banks for €5 million ($5.5 million) each. The maturity dates are December 4, 2025 and January 31, 2026, respectively, and such loans accrue interest at a rate per annum equal to 2.50% and 1.90%, respectively. Furthermore, in February 2023, we entered into a loan with a bank for €7 million ($7.7 million) with maturity in February 2028 accrues interest at a rate per annum equal to 4.2%.
Commercial Paper Programme
On November 21, 2023, we filed a euro commercial paper programme with the Alternative Fixed Income Market (MARF) in Spain. The programme has a maturity of twelve months. The programme allows Atlantica to issue short term notes for up to €100 million, with such notes having a tenor of up to two years. As of December 31, 2023, we had €23.3 million ($25.7 million) issued and outstanding under the Commercial Paper Programme at an average cost of 5.23% maturing on or before June 2024.
Covenants, restrictions, and events of default
The Note Issuance Facility 2020, the 2020 Green Private Placement, the Green Senior Notes and the Revolving Credit Facility contain covenants that limit certain of our and the guarantors’ activities. The Note Issuance Facility 2020, the 2020 Green Private Placement and the Green Exchangeable Notes also contain customary events of default, including a cross-default with respect to our indebtedness, indebtedness of the guarantors thereunder and indebtedness of our material non-recourse subsidiaries (project-subsidiaries) representing more than 25% of our cash available for distribution distributed in the previous four fiscal quarters, which in excess of certain thresholds could trigger a default. Additionally, under the 2020 Green Private Placement, the Revolving Credit Facility and the Note Issuance Facility 2020 we are required to comply with a leverage ratio of our corporate indebtedness excluding non-recourse project debt to our cash available for distribution of 5.00:1.00 (which may be increased under certain conditions to 5.50:1.00 for a limited period in the event we consummate certain acquisitions).
Furthermore, our corporate debt agreements contain customary change of control provisions (as such term is defined in each of those agreements) or similar provisions. Under the Revolving Credit Facility, a change of control without required lenders’ consent would trigger an event of default. In the other corporate debt agreements or securities, a change of control or similar provision without the consent of the relevant required holders would trigger the obligation to make an offer to purchase the respective notes at (i) 100% of the principal amount in the case of the 2020 Green Private Placement and Green Exchangeable Notes and at (ii) 101% of the principal amount in the case of the Note Issuance Facility 2020 and the Green Senior Notes. In the case of the Green Senior Notes, such prepayment obligation would be triggered only if there is a credit rating downgrade by any of the agencies.
B) At-The-Market Programme
On February 28, 2022, we established an “at-the-market programme” and entered into the Distribution Agreement with BofA Securities, Inc., MUFG Securities Americas Inc. and RBC Capital Markets LLC, as our sales agents, under which we may offer and sell from time to time up to $150 million of our ordinary shares, including in “at-the-market” offerings under our shelf registration statement on Form F-3 filed with the SEC on August 3, 2021, and a prospectus supplement that we filed on February 28, 2022. During the year 2023, we did not issue and sell any ordinary shares under the programme.
C) Project debt refinancing
In March 2023 we refinanced Solaben 2&3. We entered into two green senior euro-denominated loan agreements for the two assets with a syndicate of banks for a total amount of €198.0 million. The new project debt replaced the previous project loans and maturity was extended from December 2030 to June 2037. The interest on the loans accrues at a rate per annum equal to the sum of six-month EURIBOR plus a margin of 1.50% between 2023 and June 2028, 1.60% between June 2028 and June 2033 and 1.70% from June 2033 onwards. The principal is 90% hedged for the life of the loan through a combination of the following instruments:
| ● | a pre-existing cap with a 1.0% strike with notional of €115.1 million starting in March 2023 and decreasing over time until December 2025, |
| ● | a swap with a 3.16% strike with initial notional of €64.9 million starting in March 2023. The notional increases progressively until June 2026 and decreases progressively thereafter until maturity to ensure that the principal hedged stays at 90% over the life of the loan |
The financing agreement also includes a mechanism under which, in the case that electricity market prices are above certain levels defined in the contract, a reserve account should be established and funded on a six-month rolling basis for the additional revenue arising from the difference between actual prices and prices defined in the agreement. Under certain conditions, such amounts, if any, should be used for early prepayments upon regulatory parameters changes.
The total outstanding balance of these loans as of December 31, 2023 was $202.9 million for both Solaben 2 and Solaben 3. The financing arrangements permit cash distributions to shareholders twice per year if the debt service coverage ratio is at least 1.10x.
In addition, on April 8, 2020, Logrosan Solar Inversiones, S.A, the subsidiary-holding company of Solaben 2 & 3 and Solaben 1 & 6 entered into the Green Project Finance with ING Bank, B.V. and Banco Santander S.A. The facility is a green project financing euro-denominated agreement. The Green Project Finance is guaranteed by the shares of Logrosan and its lenders have no recourse to Atlantica corporate level.
In June 2023 we extended the maturity of the debt from April 2025 to December 2028. The facility had an initial notional of €140 million of which approximately 37% is amortised between the signing date and maturity. The outstanding balance of this facility as of December 31, 2023, was $118.2 million, of which €23.2 million is progressively amortised with a two-year grace period and the remaining €87.8 million is expected to be refinanced at maturity.
The interest on the loans accrues at a rate per annum equal to the sum of six-month EURIBOR plus a margin of 3.25%. The principal is 100% hedged for the life of the loan through a combination of the following instruments:
| ● | a pre-existing cap with a 0% strike with notional of €115.9 million starting by June 2023 and decreasing over time until December 2025. |
| ● | a cap with a 3.5% strike with initial notional of €2.5 million starting in June 2023. The notional increases progressively until June 2025 up to €110.9 million and decreases progressively thereafter until maturity to ensure that the principal hedged stays at 100% over the life of the loan. |
The Green Project Finance permits cash distribution to shareholders twice per year if Logrosan sub-holding company debt service coverage ratio is at least 1.20x and the debt service coverage ratio of the sub-consolidated group of Logrosan and the Solaben 1 & 6 and Solaben 2 & 3 assets is at least 1.075x.
The financing agreement also includes a mechanism under which, in the case that electricity market prices are above certain levels defined in the contract, a reserve account should be established and funded on a six-month rolling basis for the additional revenue arising from the difference between actual prices and prices defined in the agreement. Under certain conditions, such amounts, if any, should be used for early prepayments upon regulatory parameters changes.
Use of Liquidity and Capital Requirements
| A) | Debt service |
Principal payments on debt as of December 31, 2023, are due in the following periods according to their contracted maturities:
| $ in millions | 2024 | 2025 | 2026 | 2027 | 2028 | Subsequent Years |
Total | |
| Project Debt1,2 | 320.3 | 325.3 | 352.5 | 500.0 | 464.6 | 2,356.5 | 4,319.2 | |
| Corporate Debt | 34.0 | 179.1 | 321.0 | 154.0 | 396.8 | - | 1,048.8 | |
| Total Debt | 354.3 | 504.4 | 673.5 | 654.0 | 861.4 | 2,356.5 | 5,404.0 |
Note:
| (1) | Includes the outstanding amount of the Project Finance from Coso. Of which, on July 15, 2021 the notional amount was $233 million. From that amount, $93 million is progressively repaid following a theoretical 2036 maturity, with a legal maturity in 2027. The remaining $140 million are expected to be refinanced on or before 2027. |
| (2) | Includes the outstanding amount of the Green Project Finance from the sub-holding company of Solaben 1 & 6 and Solaben 2 & 3. This facility is 25% progressively amortised over its 5-year term and the remaining 75% is expected to be refinanced before maturity. The project debt maturities will be repaid with cash flows generated from the projects in respect of which that financing was incurred. |
| B) | Contractual obligations |
In addition to the principal repayment debt obligations detailed above, we have other contractual obligations to make future payments. The material obligations consist of interest related to our project debt and corporate debt and agreements in which we enter in the normal course of business.
|
$ in millions |
Total | Up to one year |
Between one and three years |
Between three and five years |
Subsequent years |
| Purchase commitments | 713.8 | 81.9 | 100.0 | 97.0 | 434.6 |
| Accrued interest estimate during useful life of loans | 1,717.8 | 264.2 | 481.4 | 359.4 | 612.8 |
Purchase obligations include agreements for the purchase of goods or services that are enforceable and legally binding and that specify all significant terms.
Accrued interest estimate during the useful life of loans represents the estimation for the total amount of interest to be paid or accumulated over the useful life of the loans, notes and bonds, taking into consideration the hedging contracts.
| C) | Cash dividends to investors |
We intend to distribute a significant portion of our cash available for distribution to shareholders on an annual basis less reserves for the prudent conduct of our business, on an annual basis. We intend to distribute a quarterly dividend to shareholders. Our board of directors may, by resolution, amend the cash dividend policy at any time (See “Directors Report”).
| D) | Investments and Acquisitions |
The investments and the assets under construction detailed in “Significant events in 2023” have been part of the use of our liquidity in 2023. In addition, we have made investments in assets which are currently under development or construction.
We intend to grow our business through the development and construction of our project pipeline including expansion and repowering opportunities, as well as greenfield developments, third-party acquisitions and the optimisation of our existing portfolio. We currently have a pipeline of assets under development of approximately 2.2 GW of renewable energy and 6.0 GWh of storage. Approximately 47% of the projects are PV, 41% storage, 11% wind and 1% other projects, while 22% are expected to reach ready-to-build (“RTB”) in 2024-2025, 28% are in an advanced development stage and 50% are in early stage. Also, 20% are expansion or repowering opportunities of existing assets and 80% greenfield developments.
| E) | Capital Expenditures |
In 2023, we invested $27.9 million in maintenance capital expenditures in our assets. In 2022, we invested $39.1 million in maintenance capital expenditures in our assets, mainly corresponding to capital expenditures and equipment replacements at Solana. In some cases, maintenance capex is included in the operation and maintenance agreement, therefore it is included in operating expenses within our income statement.

Principal Risks and Uncertainties
Effective risk management is an essential part of our culture and strategy. Our corporate policies are supported by a solid commitment to risk management that guides all our decisions.
Our risk management system is based on risk identification, assessment, prioritisation, mitigation and monitoring processes, which are continually evaluated, improved and enhanced in line with best practice. Considerations regarding climate change are fully integrated within our risk management system.
Understanding and mitigating our risks is critical to our future success. We are therefore committed to an effective, robust system of risk identification and an effective response to such risks, in order to support the achievement of our objectives.
Our Approach to Risk
| ● | We recognise that risks are inherent to our business. Only through adequate risk management we can reduce uncertainty to make the right strategic decisions and to implement our growth plan and investment strategy. |
| ● | Exposure to risks must be consistent with our risk appetite. The Board regularly reviews the acceptable level of exposure to principal and emerging risks. |
| ● | Risks are aligned with our risk appetite, taking into consideration the balance between threats and opportunities. |
| ● | We recognise the importance of a strong culture, which refers to our shared attitudes, values and standards that shape behaviours related to risk awareness, risk taking and risk management. |
| ● | All our people are responsible for risk management, with the ultimate accountability residing with the Board. Each business geography carries out risk evaluations to ensure the sound identification, management, monitoring and reporting of risks that could impact the achievement of our goals. |
| ● | Risk is analysed using a consistent framework. Our risk management methodology is applied to all our operating companies, projects, development activities and support areas so that we have a comprehensive view of the uncertainties that could affect us in achieving our strategic goals. |
| ● | We are committed to continuous improvement. Lessons learned and best practices are incorporated into our procedures to protect and unlock sustainable value. |
Our Risk Appetite
We define risk appetite as the nature and extent of risk Atlantica is willing to accept in relation to the pursuit of its objectives. A scale is used to help determine the risk appetite threshold for each risk, keeping in consideration that risk appetite may change over time. The risk management approach is based on the assessment of risk appetite performed by management and shared with the Board of Directors.
The following principles guide Atlantica´s overarching appetite for risk and determine how our businesses and risks are managed.
Operating model and business practice
| ● | We are committed to prioritising and actively promoting health and safety as a tool to protect the integrity and health of our employees, subcontractors and partners involved in our business activity. |
| ● | We are strongly committed to complying with all rules and regulations. We continuously strive for the highest standards of business conduct, safety and professionalism. |
| ● | We aim to deliver sustainable and consistent returns for shareholders in line with a conservative risk appetite and strong risk management capability. |
| ● | We are committed to managing the climate risks that have an impact on our business and delivering on our emissions reduction targets. |
Maintain a contracted portfolio of operational assets with a low risk profile
| ● | We intend to maintain a portfolio with a majority of assets contracted or regulated with long useful life and a stable and predictable long-term cash flow profile. |
| ● | We seek to invest generally in assets with proven technologies in which we normally have significant experience, located in countries where we believe conditions to be stable. |
| ● | We may complement our portfolio with investments or co-investments in assets with shorter contracts or with partially contracted or merchant revenue or in assets with revenue in currencies other than U.S. dollar or euro. |
| ● | In terms of operational efficiency, we focus on ensuring long-term availability, reliability and asset integrity with maintenance and monitoring. |
Grow our business through the development and construction of assets
| ● | We intend to grow our business maintaining renewable energy as our main segment with a primary focus on North America and Europe |
| ● | Our development asset identification is supported by rigorous analysis and industry knowledge and experience. |
| ● | We follow a disciplined approach to capital allocation and required returns for development projects and acquisitions. |
Maintain a prudent financial policy and financial flexibility
| ● | Non-recourse project debt is an important principle for us. We intend to continue financing our assets with project debt progressively amortised using the cash flows from each asset and where lenders do not have recourse to the holding company assets. |
| ● | We hedge a significant portion of our interest rate risk exposure for the long-term. |
| ● | We limit our foreign exchange exposure. We intend to ensure that at least 80% of our cash available for distribution is always in U.S. dollars and euros. Furthermore, we hedge net distributions in euros for the upcoming 24 months on a rolling basis. |
| ● | We intend to maintain a solid liquidity position through a combination of cash on hand and undrawn credit facilities. |
| ● | In order to maintain financial flexibility, we use diversified sources of financing in our project and corporate debt including banks, capital markets and private investor financing. |
Additionally, our policies and management systems include thorough risk analysis and risk management processes applied on an ongoing basis from the date of asset acquisition or the beginning of construction.
We seek to build our business for the long term by balancing social, environmental and economic considerations in the decisions we make. Our strategic priorities are underpinned by our endeavour to operate in a sustainable way. This helps us to manage the risk profile of the business.
Our Risk Management Framework
Risk Governance
The Board, with the support of management, has overall responsibility for risk management and determines the nature and extent of the principal and emerging risks that we will accept in order to achieve our strategic objectives. The Board receives detailed analysis of key matters in advance of Board meetings. This includes reports on our operating performance including safety and health, financial, environmental, legal and social matters, and key progresses in our business development activities, as well as information on talent management and analysis of financial investments. The provision of this information allows the early identification of potential issues and the assessment of any necessary preventive and mitigating actions.
The Audit Committee assists the Board by reviewing the effectiveness of the risk management process and monitoring principal and emerging risks, preventive and mitigation procedures and action plans. The Chair of the Audit Committee reports to the Board when required and, if necessary, the Board discusses the matters raised in greater detail.
The Risk Management Department is responsible for risk management systems across the Company. It implements the Company’s risk management policy, vision and purpose to ensure a strong risk management culture at all levels of the organisation. The Department supports business areas in analysing their risks, identifying existing preventive and mitigating controls and defining further action plans. It maintains and regularly updates the Company’s risk map matrix.
The Business Committee, which is comprised of our Geographic VPs and top management assesses the Company’s principal risks and their potential impact on the achievement of our strategic goals. The Committee promotes our risk management culture in each of the business areas.
Atlantica has developed a risk analysis methodology based on ISO 31000 standard and on common market practices. The risk analysis comprises the following steps:
| - | Risk Identification (ex-ante): identify causes that may turn into a risk situation, classifying those potential causes as natural, human, intentioned, accidental, and technological. |
| - | Risk Assessment: evaluate the risk considering its likelihood and potential impact. |
| - | Risk Management Plan: focused on mitigating risk effects. To prevent unexpected events, Atlantica’s Risk Management corporate team in collaboration with Geographic VPs, analyse potential risks in each of our geographies and define a Prevention and Mitigation Plan for each risk. |
The Head of Risk Management coordinates the risk identification, assessment, monitoring and mitigation effort primarily with the Geographic VPs. The resulting Risk Heat Map is periodically reviewed and approved by the senior management team including Atlantica’s VPs, the Chief Financial Officer, and the Chief Executive Officer and reported to the Board quarterly.
Atlantica’s risk management process follows a multidisciplinary approach to identifying risks in different areas, assigning probability distributions, and estimating potential economic impacts in order to develop action plans to mitigate the main risks facing the Company. The process includes completing a questionnaire regarding risk indicators and economic impact. An output of the process includes reporting on each major risk including the risk assessment, mitigation strategies, deadlines, and responsible parties. Risks are re-assessed on a quarterly basis.
The Finance Committee monitors market risks such as interest rate risk, foreign exchange risk and credit risk and is also responsible for monitoring and managing liquidity risks.
In addition, the Operations Department and the Operations Committee are responsible for monitoring and
preventing health and safety, operational and environmental risks.
Risk management Structure

Board of Directors
| ● | Overall responsibility for risk management and its alignment with the strategy |
| ● | Defines risk appetite and sets the “tone from the top” |
| ● | Reviews, challenges and monitors principal risks |
Audit Committee
| ● | Makes recommendations to the Board on the risk management system |
| ● | Reviews the effectiveness and implementation of the risk management system |
Business Committee
| ● | Assesses risks and their potential impact on the achievement of our strategic goals |
| ● | Promotes our risk management culture in each of the business areas |
| ● | Is the owner of principal risks |
| ● | Approves the Risk Management Policies |
Third Line of Defence
| ● | The Internal Audit Department provides assurance on the risk management process, including the effectiveness of the performance of the first and second lines of defence. |
Second Line of Defence
| ● | The Risk Management Department is accountable for monitoring our overall risk profile and risk management performance, registering risks and issuing alerts if any deviation is detected. |
| ● | Make recommendations on the risk management system. |
First Line of Defence
| ● | Each person is responsible for identifying, preventing and mitigating risks in their business area and escalating concerns to the appropriate level if required. |
Principal risks
The Company and its underlying assets are subject to a number of risks. The processes and systems implemented have been designed to mitigate those risks to the extent possible.
At the end of 2022, we included the potential impacts of dependence on certain key personnel because employee turnover increased in 2022 as one of our risks. During 2023, turnover has decreased and the relevance of this risk in our risk map has also decreased. In addition, in 2023, we included as one of our significant risks the potential delays and extra costs in projects under construction, as our development and construction activities continued increasing as planned. During the year 2023, we have also considered the potential increase in long-term interest rates as one of or significant risks.
We include the following table as a summary of some of those risks and action plans carried out to mitigate them:
| Risk / Impact | Risk Appetite |
Risk Trend |
Assessment of Change Year-on-Year |
Mitigation of Risk |
|
Safety and health incidents could result in harm to our employees, contractors and local communities and expose us to significant financial losses, as well as civil and criminal liabilities.
The ownership, construction and operation of our assets often put our employees and others, including those of our subcontractors, in close proximity with large pieces of mechanised equipment, moving vehicles, manufacturing or industrial processes, electrical equipment, batteries, heat or liquids stored under pressure or at high temperatures and highly regulated materials. On most assets and at most facilities, we, in some cases together with the operation and maintenance suppliers or the construction company, are responsible for safety. Accordingly, we must implement safe practices and safety procedures, which are also applicable to on-site subcontractors.
If we or a supplier or the construction company fail to design and implement such practices and procedures or if the practices and procedures are ineffective or if our operation and maintenance service providers or the contractors in charge of the construction of our assets or other suppliers do not follow them, our employees and others may become injured. This could result in civil and criminal liabilities against the Company.
We are also subject to regulations dealing with occupational health and safety and environmental work procedures throughout our organisation. The failure to comply with such regulations could subject us to reputational damage and/or liability.
|
Low |
|
As our construction activity increases, our exposure to accidents has also increased, since accident performance indicators are typically higher in construction activities compared to operation and maintenance.
In 2023 all our key health and safety indicators met annual targets and remained below sector average. LTFI (Lost Time Frequency Index18) was 1.9 and improved with respect to 3,1 in 2022. TRFI (Total Recordable Frequency Index19) was 4.3 and also improved compared to 5.2 in 2022 (see “Occupational Health and Safety”). After an increase in 2022 in LTFI caused by our construction activities, and following our efforts, the KPI improved in 2023. We continue to closely monitor all accidents and incidents. As the construction activity of new projects increases in 2023 and 2024, the exposure to this risk is expected to increase.
|
- Safety is our top priority and one of our core values.
- Atlantica has implemented a Health and Safety programme, which is key to mitigating this risk and has been in place since 2017. We regularly audit our assets and implement new best practices based on lessons learned in other assets, as well as from peers, contractors and suppliers.
- We have defined a plan to reinforce our health and safety procedures during the construction phase and to involve the construction companies.
- We have different initiatives in our assets to ensure a safe work environment, such as the SafeStart and the Dupont-Bradley programmes (we refer to our “Occupational Health and Safety section on Page 123)
- To integrate recently acquired assets we have performed specific external and internal audits, issued new safety campaigns and bulletins, performed safety inspections, procedures and training, and extended health and safety bonuses to certain employees to improve supervision.
- The short-term variable compensation of our CEO, Geographic VPs, Head of Operations and other members of our management includes Health and Safety targets.
- See section “Occupational Health and Safety” for a comprehensive description of our initiatives.
|
18 Lost Time Frequency Index represents the total number of lost-time accidents recorded, including major injuries (defined as death or serious accidents), in the last 12 months per 1,000,000 hours worked. Differs from the metric generally used in the U.S. which is calculated per 200,000 hours worked.
19 Total Recordable Frequency Index TRFI represents the total number of recordable accidents with and without lost-time recorded in the last 12 months per 1,000,000 hours worked. Differs from the metric generally used in the U.S. which is calculated per 200,000 hours worked.
| Risk / Impact | Risk Appetite |
Risk Trend |
Assessment of Change Year-on-Year |
Mitigation of Risk |
|
Counterparty credit risk
Not being able to collect our revenues.
A significant portion of the electric power we generate, the transmission capacity we have, and our desalination capacity are sold under long-term off-take agreements with public utilities, industrial or commercial end-users or governmental entities, with a weighted average remaining duration of approximately 13 years as of December 31, 2023.
If any of our clients are unable or unwilling to fulfil their contractual obligations or if they delay payments, our business, financial condition, results of operations and cash flow may be materially adversely affected.
Pemex’s credit rating is currently BBB, B3 and B+ from S&P Global Rating (“S&P”), Moody’s Investor Service Inc. (“Moody’s”) and Fitch Ratings Inc. (“Fitch”), respectively. We have experienced delays in collections from Pemex in the past, especially since the second half of 2019, which have been significant in certain quarters, including the fourth quarter of 2023.
In addition, Eskom is the off-taker of our Kaxu solar plant, a state-owned, limited liability company, wholly owned by the Republic of South Africa. The credit rating of Eskom has weakened in the last few years and is currently B from S&P, B2 from Moody’s and B from Fitch.
|
Medium |
|
There was a downgrade of Pemex credit rating by Fitch in 2023. In the past, we have experienced delays in collections and periods when such delays were reduced. As of December 2023, delays in collections were higher than usual.
In the case of Eskom, the credit rating of S&P has improved during 2023 and we have never experienced delays in collections.
|
In the case of Pemex, during 2023 we have maintained a pro-active approach including fluid dialogue with our client and we have increased the number of meetings with them. We are currently working with them on a plan to reduce the amount due in the upcoming months.
In the case of Kaxu, Eskom’s payment guarantees to our Kaxu solar plant are underwritten by the South African Department of Energy, under the terms of an implementation agreement. The credit ratings of the Republic of South Africa as of the date of this report are BB-/Ba2/BB- by S&P, Moody’s and Fitch, respectively and all these ratings have remained stable during 2023.
|
|
Poor performance of assets
If our assets perform worse than expected, we can experience loss of revenues and cash flows at the project level, which subsequently impacts cash returns to the Company.
The ability of certain assets in our portfolio to meet our performance expectations is subject to the risks inherent to the operation of such facilities, including, but not limited to, degradation of equipment in excess of our expectations, system failures and outages and more operational costs or maintenance capital expenditures than initially expected.
In addition, Atlantica relies on third parties for the supply of services and equipment, including technologically complex equipment and software, and certain operation and maintenance services to operate our assets. |
Low
|
 |
During 2023, our assets have generally performed fairly in line with expectations.
However, at Solana, we have been working on repairs and replacements in the storage system since 2021 until the first half of 2023. During this period, availability in the storage system was lower than expected. We cannot guarantee that the repairs will be effective, that Solana will reach expected production or that additional repairs will not be required.
In addition, in 2023 an unscheduled outage occurred at Kaxu when a problem was found in the turbine, a few weeks after a scheduled turbine major overhaul was carried out by Siemens, the original equipment manufacturer. The plant restarted operations in mid-February. |
- Dedicated supervisory and management teams in place at our assets.
- Reporting and monitoring systems in place.
- Asset managers are responsible for completing checklists designed to identify operational, maintenance and engineering, risks, improve efficiency and reduce costs at asset level.
- Our corporate operations team performs regular operational, maintenance and engineering audits to identify risks, implement and follow-up on mitigation plans and best practices and share insights gained from other assets.
- Risk-related training courses are regularly provided to our employees and subcontractors to improve their skills, identify new risk management practices and report them to management.
|
| Risk / Impact | Risk Appetite |
Risk Trend |
Assessment of Change Year-on-Year |
Mitigation of Risk |
|
Equipment may not last as long as expected and we may need to replace it earlier than planned.
Damages to our equipment may not be covered by insurance in place. Our property damage and business interruption policies have significant deductibles and exclusions with respect to some key equipment which, if damaged, could result in financial losses and business interruption. In some cases, the replacement of damaged equipment can take a long period of time, which can cause our plants to curtail or cease operations during that time.
|
|
|
- Operation and maintenance can be either carried out in-house or contracted with specialists. We have internalised operation and maintenance services in some of our assets. We have also tracked down alternative operation and maintenance opportunities in the market.
- On-going analysis of insurance alternatives in the market and on-going dialogue with insurance companies present in our programme as well as alternative insurers.
- With respect to the outage at Kaxu, part of the damage and the business interruption is covered by our insurance property policy, after a 60-day deductible.
- The local teams, the Operations Department and the Insurance Department take ownership of managing this risk.
|
|
Dependence on key personnel and risk of work stoppages
In some of our geographies, competition for qualified personnel is high. Some of our assets are in remote locations, and it may be difficult for us to retain employees or to cover certain positions. We may experience difficulty in hiring and retaining employees with appropriate qualifications. We may face high turnover, requiring us to dedicate time and resources to find and train new employees. The challenging markets in which we compete for talent may also require us to invest significant amounts of cash and equity to attract and retain employees. If we fail to attract new personnel or fail to retain and motivate our current personnel, this could adversely impact the performance of our assets, our business and future growth prospects and our ability to compete.
In addition, the operation and maintenance of most of our assets is labour intensive and in many cases our employees and our operators’ employees are covered by collective bargaining agreements. A dispute with a union or employees represented by a union could result in production interruptions caused by work stoppages. If our employees or our operators’ employees were to initiate a work stoppage, we may not be able to reach an agreement with them in a timely fashion. If a strike or work stoppage or disruption were to occur, our business, financial conditions, results of operations and cash flows may be materially adversely affected.
|
Low
|
|
In 2023, our turnover has decreased, in particular in the United States.
In addition, in March 2023, we completed the process of transitioning in-house the O&M services for our assets in Spain. In July 2023 we also internalised the O&M services for ATN. Currently, we perform O&M services with our own personnel for assets representing approximately 74% of our consolidated revenue for the year ended December 31, 2023.
|
- Remuneration packages attractive to employee, taking into account the specific geography. - Identification of employees with high potential and who are more difficult to replace. - The local teams and the People and Culture Department take ownership of managing this risk. - We believe that having the O&M services performed by our own personnel provides a better control of the process and permits a direct dialogue with employees in charge of these activities, which can help to decrease turnover for these employees, who have experienced traditionally a higher turnover rate.
|
| Risk / Impact | Risk Appetite |
Risk Trend |
Assessment of Change Year-on-Year |
Mitigation of Risk |
|
Climate change
Climate change is causing an increasing number of severe, chronic and extreme weather events, which are a risk to our facilities and may impact them. In addition, climate change may cause transition risks, related to existing and emerging regulation related to climate change. These risks include:
- Acute physical. Severe and extreme weather events include severe winds and rains, hail, hurricanes, cyclones, droughts, as well as the risk of fire and flooding. In particular:
(1) Severe floods could damage our solar generation assets or our water facilities. Floods can also cause landslides which may affect our transmission lines.
(2) If our transmission assets caused a fire, we could be found liable if the fire damaged third parties.
(3) Severe winter weather, like the storm in February 2021 in Texas, could cause supply from wind farms to decline due to wind turbine equipment freezing. In 2023, a winter storm affected a transmission line in our geothermal asset Coso in California and affected production for several days. Also, natural gas assets and battery systems could face operational issues caused by freezing or very cold conditions.
● Rising temperatures and droughts could cause wildfires like the ones that have affected California in recent years. In California wildfires have been especially catastrophic, causing human fatalities and significant material losses. Although our assets in California are located in areas without trees and vegetation, wildfires affected PG&E, one of our clients in 2018 and 2019. Severe winds could cause damage the solar fields at our solar assets.
Furthermore, components of our equipment and systems, such as structures, mirrors, absorber tubes, blades, batteries, PV panels or transformers are susceptible to being damaged by severe weather, including for example by hail or lightning.
- Chronic physical. An increase in temperatures can reduce efficiency and increase operating costs at our plants. The main impacts of rising temperatures include: lower efficiency in battery systems
(1) Lower turbine efficiency in our efficient natural gas asset. |
Low
|
|
No significant change |
Acute physical: Our geographic VPs and our corporate operations team monitor weather conditions in-real time at each of the assets to adopt the required protection measures. For example, if high winds are forecasted, our solar fields are placed in a defence mode. In addition, we also have: - Insurance policies covering: (i) physical damage and (ii) l business interruption. - A crisis management procedure defining specific action plans for all our assets. - An automatic alert system using information from U.S. National Agencies and from local weather forecast agencies. - A specific procedure for extreme weather. - Furthermore, Atlantica does not have in the U.S. any hedge contract in place with an obligation to deliver electricity with the potential risk of having to purchase it at market price.
Chronic physical: - Our corporate operations department closely monitors the performance of each of our assets to identify measures that improve efficiency. - In addition, Atlantica has historically only withdrawn approximately 50% of the total regulatory limit of water permitted at our solar assets. Even if the water limits were to be reduced, we believe to have margin to withdraw enough water to keep our plants working properly. Our local asset management teams systematically track and monitor water availability as a key asset KPI.
Regulation: - Current regulation: asset managers are responsible for monitoring asset activities in line with local regulation and contractual requirements (environmental, permits, servitudes, etc.). Local compliance managers are responsible for managing and solving compliance issues in their geographies under their responsibility, including the supervision of compliance with current regulation. At the Corporate level, the ESG team tracks and applies all the reporting requirements. |
| Risk / Impact | Risk Appetite |
Risk Trend |
Assessment of Change Year-on-Year |
Mitigation of Risk |
|
(2) Reduced efficiency at our solar photovoltaic generation assets. (3) Lower air density at our wind facilities. (4) Lower efficiency in battery systems.
Furthermore, a reduction of mean precipitation may result in a reduction of availability of water from aquifers and could also modify the main water properties at our generation facilities. Droughts could result in water restrictions that may affect our operations, and which may force us to stop generation at some of our facilities. A deterioration of the quality of the water would also have a negative impact on chemical costs in our water treatment plants at our generating facilities.
- Current Regulation. Atlantica is directly affected by environmental regulation at all our assets. This includes climate-related risks driven by laws, regulation, taxation, disclosure of emissions and other practices
- Emerging regulation. Changes in regulation could have a negative impact on Atlantica’s growth or cause an increase in cost.
- Reputation. While a significant part of our business consists of renewable energy assets, we also own assets that can be considered less environmentally friendly, currently consisting of a 300 MW efficient natural gas plant and a non-controlling stake in a gas engines facility which uses natural gas, both in Mexico. If our reputation worsened, our cost of capital could increase and our access to capital may become more difficult. In addition, some potential employees, clients, and /or suppliers could perceive Atlantica as a less appealing company due to a deterioration in our reputation.
- Downstream. Some of our clients are large utilities or industrial corporations. These are also exposed to significant climate change related risks, including current and emerging regulation, acute and chronic physical risks. If our clients are affected by climate related risks, this could impact their credit quality and affect their ability to comply with the existing contract.
|
- Emerging regulation: Various internal working groups and management regularly review risks arising from new regulatory developments and potential impacts. At the Corporate level, the ESG team analyses the applicability of new reporting requirements and conveys them to the appropriate departments.
Reputation: - We refer to the Environment, Social and Governance section in this Report. - Atlantica has developed a risk analysis methodology based on the ISO 31000 and on common market practices. - We use a multidisciplinary approach to identify risks in different areas and develop appropriate mitigation plans. - Management, local teams and the corporate operations department take ownership of managing this risk.
|
|||
|
Risks Related to Our Relationship with Algonquin
Algonquin is our largest shareholder and exercises substantial influence over us.
Currently, Algonquin beneficially owns 42.2% of our ordinary shares and is entitled to vote on approximately 41.5% of our ordinary shares. As a result of this ownership, Algonquin has substantial influence over our affairs and their ownership interest and voting power constitute a significant percentage of the shares eligible to vote on any matter requiring the approval of our shareholders.
|
Not Relevant
|
 |
In 2023, Algonquin conducted a strategic review which concluded in August with the announcement that they will pursue the sale of its renewable energy business and their intention focus on their regulated business. This announcement did not include Algonquin’s ownership in Atlantica. It is possible that in the future Algonquin may have interest in selling part or all of its equity interest in Atlantica. Uncertainty about Algonquin’s plans or strategy with respect to the holding or disposition of all or any portion of its equity interest in Atlantica and such uncertainty may negatively affect the market price for our shares and our ability to raise capital by offering equity or equity-related securities. |
- Any transaction between us and Liberty GES or Algonquin (including the acquisition of any ROFO assets or any co-investment with Liberty GES or Algonquin or any investment in an Algonquin asset) is subject to our related party transactions policy, which requires prior approval of such transactions by the Related Party Transactions Committee, which is composed of independent directors.
|
| Risk / Impact | Risk Appetite |
Risk Trend |
Assessment of Change Year-on-Year |
Mitigation of Risk |
|
Liberty GES and Algonquin are related parties and may have interests that differ from our interests, including with respect to growth appetite, the types of investments made, the timing and amount of the dividends paid by us, the reinvestment of returns generated by our operations, the use of leverage when making investments and the appointment of outside advisors and service providers.
In addition, our reputation is closely related to that of Algonquin. Any damage to the public image or reputation of Algonquin could have a material adverse effect on our business, financial condition, results of operations and cash flows.
Furthermore, dispositions of substantial amounts of the shares, or the anticipation or perception by the market that such dispositions could occur, could adversely affect prevailing trading prices of the shares and could impair our ability to raise capital through future offerings of equity or equity-related securities
Additionally, if any investor acquires over 50.0% of our shares or if our ordinary shares cease to be listed, we may be required to refinance all or part of our corporate debt or obtain waivers from the related noteholders or lenders, as applicable, due to the fact that all of our corporate financing agreements contain customary change of control provisions and delisting restrictions. If we fail to obtain such waivers and the related noteholders or lenders, as applicable, elect to accelerate the relevant corporate debt, we may not be able to repay or refinance such debt, which may have a material adverse effect on our business, financial condition results of operations and cash flows. Additionally, in the event of a change of control we could see an increase in the yearly state property tax payment in Mojave, which would be reassessed by the tax authority at the time the change of control potentially occurred. There could also be other tax impacts and other impacts that we have not yet identified. Furthermore, a change of control could trigger an ownership change under Section 382 of the IRC (see risks related to Taxation below).
|
|
- Algonquin has to comply with our Related Parties Transaction Committee and Terms of Reference
- Algonquin has the right to appoint directors proportionally to their ownership but in any event no more than (i) such number of directors as corresponds to 41.5% of our voting securities; and (ii) 50% of our Board less one.
- Furthermore, Algonquin’s voting rights are limited to 41.5% and the additional shares (the difference between the actual shares beneficially owned by Algonquin and shares representing 41.5% of voting rights) votes replicating non-Algonquin’s shareholders vote.
- The Board of Directors takes ownership of managing this risk.
|
| Risk / Impact | Risk Appetite |
Risk Trend |
Assessment of Change Year-on-Year |
Mitigation of Risk |
|
The financing agreements of our project subsidiaries
These are primarily loan agreements which provide that the repayment of the loans (and interest thereon) is secured solely by the shares, physical assets, contracts and the cash flow of that project company.
Our project finance agreements include covenants and restrictions which may limit our ability to distribute cash from project companies to the holding company level.
In addition, if we fail to satisfy any of our debt service obligations or breach any related financial or operating covenants, the applicable lender could declare the full amount of the relevant project debt to be immediately due and payable and could foreclose on any assets pledged as collateral.
|
Low
|
|
Due to low electricity prices in Chile, the project debts of Chile PV 1 and 2 are under an event of default as of December 31, 2023. Chile PV 1 was not able to maintain the minimum required cash in its debt service reserve account as of December 31, 2023 and did not make its debt service payment in January. In addition, in October 2023, Chile PV 2 did not make its debt service payment. This asset obtained additional financing from the banks and made the debt service payment in December 2023, although it was not able to sufficiently fund its debt service reserve account subsequently. We do not expect an acceleration of the debt to be declared by the credit entities. |
- With respect to Chile PV1 and Chile PV2, we are in conversations with the banks, together with our partner, regarding a potential waiver. The value of the net assets contributed by Chile PV 1 and 2 to our Annual Consolidated Financial Statements, excluding non-controlling interest, was close to zero as of December 31, 2023.
- In general, to monitor this risk we have the following measures:
● Reporting and monitoring of covenants in each contract.
● Forecasts by local teams, reviewed by our corporate departments to monitor the main covenants and identify any potential future restriction to take measures in advance.
● Management and specialised compliance and legal teams constantly tracking any change.
● The local teams take ownership of managing this risk.
● A quarterly report is provided to the Audit Committee from Internal Audit on covenant compliance.
● Local teams and the corporate controlling department (under the CFO supervision) take ownership of this risk. |
|
Liquidity Risk and Access to capital
Our liquidity at the corporate level depends on distribution from the project level entities, most of which have project debt in place. Distributions are generally subject to the compliance with covenants and other conditions under our project finance agreements
Liquidity risk involves:
- Not being able to meet our payment obligations as they fall due. - Not being able to meet our covenants and obligations under our corporate financing arrangements. - Failing to meet the required or desired financing for acquisitions and for the successfully refinancing of Company’s project and corporate indebtedness.
The global capital and credit markets have experienced in the past and may continue to experience, periods of extreme volatility and disruption. At times, our access to financing was curtailed by market conditions and other factors. Continued disruptions, uncertainty or volatility in the global capital and credit markets may limit our access to additional capital required to refinance our debt on satisfactory terms or at all, may limit our ability to replace, in a timely manner, maturing liabilities, and may limit our access to new debt and equity capital to make further acquisitions. Volatility in debt markets may also limit our ability to fund or refinance many of our projects and corporate level debt, even in cases where such capital has already been committed.
|
Low
|
|
Capital markets have been experiencing high volatility during 2022 and 2023 both in the United States and Europe. High inflation, interest rate increases, war in Ukraine, energy crisis in Europe, high electricity prices particularly in Europe, tensions between the U.S., Russia and China, the availability and cost of credit, and the economic conditions and concerns of a global recession have exacerbated and contributed to increased volatility in capital markets and worsened expectations for the economy. During the year 2023, the valuations of renewable ETFs and renewable companies in the United States and Europe have generally decreased.
|
- The objective of our financing and liquidity policy is to ensure that we maintain sufficient funds to meet our financial obligations as they fall due.
- Project finance borrowing permits us to finance projects through project debt and thereby insulate the rest of our assets from such credit exposure. We incur project finance debt on a project-by-project basis or by groups of projects. The repayment profile of each project is established based on the projected cash flow generation of the business. This ensures that sufficient financing is available to meet deadlines and maturities, which mitigates the liquidity risk. In addition, we maintain a periodic communication with our lenders and regular monitoring of debt covenants and minimum ratios. - Appropriate cash management to ensure appropriate levels of cash: as of December 31, 2023, we had $411.1 million liquidity at the corporate level, comprised of $33.0 million of cash on hand at the corporate level and $378.1 million available under our Revolving Credit Facility. |
| Risk / Impact | Risk Appetite |
Risk Trend |
Assessment of Change Year-on-Year |
Mitigation of Risk |
|
|
|
In addition, our high pay-out ratio may hamper our ability to manage liquidity in moments when accessing capital markets becomes more challenging.
|
- Managing debt maturities and refinancing our corporate debt when the markets are favourable. - Management continues to regularly monitor the Company’s ability to finance the needs of its operating, financing and investing activities within the guidelines of prudent balance sheet management.
- A portion of cash flows generated and distributed by our project companies to the holding company are retained at the holding company level.
- Regular discussions with rating agencies.
- Our Board of Directors may change our dividend policy at any point in time if required, or modify the dividend for specific quarters taking into consideration the prevailing conditions.
- The Finance Committee and the Board of Directors take ownership of managing this risk. |
|
|
Interest rate risk
Some of our indebtedness (including project-level indebtedness) bears interest at variable rates, generally linked to market benchmarks such as EURIBOR and SOFR. Increases in interest rates would raise our finance expenses at project companies or corporate level.
|
Low
|
|
During 2023, the U.S. Federal Reserve increased the reference interest rates in the United States from a targeted range between 4.25% and 4.50% to a range between 5.25% to 5.50%. Similarly, the European Central Bank increased the reference interest rates in the Euro zone from 2% up to 4.5% in 2023.
Any increase in interest rates would increase our finance expenses relating to our un-hedged variable rate indebtedness and increase the costs of refinancing our existing indebtedness and issuing new debt.
|
As of December 31, 2023, approximately 92% of our project debt and approximately 94% of our corporate debt either has fixed interest rates or has been hedged with swaps or caps. To mitigate interest rate risk, we primarily use long-term interest rate swaps and interest rate options which, in exchange for a fee, offer protection against a rise in interest rates.
The Finance Committee and local management teams take ownership of managing this risk. CFO¿?
|
|
Foreign currency exchange rate
Revenue and expenses of our solar assets in Europe, South Africa, Colombia and Uruguay are denominated in euros, South African Rands, Colombian pesos and Uruguayan pesos (with a maximum and minimum price in U.S. dollars in the case of Uruguayan pesos), respectively. Depreciation in the value of these currencies against the U.S. dollar may have a negative impact on our operating results and our cash available for distribution.
|
Low
|
|
During the year 2023, the euro remained stable and the South African rand depreciated against the U.S. dollar. |
The main cash flows in our subsidiaries are cash collections arising from long-term contracts with clients and debt payments arising from project finance repayment. Project financing is typically denominated in the same currency as that of the contracted revenue agreement, which limits our exposure to foreign exchange risk. In addition, we maintain part of our corporate general and administrative expenses and part of our corporate debt in euros which creates a natural hedge for the distributions we receive from our assets in Europe.
|
| Risk / Impact | Risk Appetite |
Risk Trend |
Assessment of Change Year-on-Year |
Mitigation of Risk |
|
To further mitigate this exposure, our strategy is to hedge cash distributions from our assets in Europe. Through currency options, we have hedged 100% of our net euro-denominated net exposure for the next 12 months and 75% of our euro-denominated net exposure for the following 12 months. We expect to continue with this hedging strategy on a rolling basis.
The Finance Committee and local management teams take ownership of managing this risk. |
||||
|
Risks Related to Our Growth Strategy
We may not be successful in finding investment opportunities or we may invest in projects and assets with a higher risk profile.
Our growth strategy depends on our ability to successfully identify and evaluate investment opportunities, develop and build new assets and consummate acquisitions on favourable terms. The number of investment opportunities may be limited. We are competing with other local and international developers for the development and construction of new assets, which may hamper our ability to grow. Our ability to develop and build new assets depends, among other things, on our ability to secure transmission interconnection access or agreements, to secure land rights to secure PPAs or similar schemes and to obtain licences and permits and we cannot guarantee that we will be successful obtaining them. Similarly, we are competing with local and international companies for acquisition opportunities from third parties, which may increase our cost of making investments or cause us to refrain from making acquisitions from third parties. Our ability to consummate future investments and acquisitions may also depend on our ability to obtain any required government or regulatory approvals. If we are unable to identify and complete future investments and acquisitions, it will impede our ability to execute our growth strategy and limit our ability to increase the amount of dividends paid to our shareholders.
|
Medium
|
|
In 2023, following the trend of recent years, competition to develop and acquire renewable assets remained high. In our development and construction activities in some geographies we have seen longer periods required to obtain permits and interconnections. Some of our competitors for investments were ready to bid for PPAs at lower prices or were ready to pay more for investments and acquisitions, especially during the first part of the year.
In addition, in 2023 we continued to increase our investments in assets under development and construction, in assets with revenue denominated in local currency and assets with exposure to electricity prices.
|
We have a proven track record of closing acquisitions and investments in development and construction, and we have diversified sources of growth:
We intend to develop new projects and, in some cases, to invest in assets under development or construction with a focus on renewable energy and storage. We believe that our know-how and operating expertise in our key markets together with a critical mass of assets in several geographic areas as well as our access to capital will assist us in achieving our growth plans.
We intend to grow our business organically through the optimisation of the existing portfolio, price escalation factors in many of our assets as well as through investments in the expansion and repowering of our current assets and hybridisation of existing assets with other complementary technologies including storage, particularly in our renewable energy assets and transmission lines.
Additionally, we expect to complement our development and construction growth through the acquisition of assets from third parties leveraging the local presence and network we have in geographies and sectors in which we operate.
We intend to maintain a portfolio where a majority of the assets have stable and predictable cash flows. Every time we make an investment decision, we always consider the impact the potential investment will have on the overall portfolio, in order to preserve its low risk profile. |
| Risk / Impact | Risk Appetite |
Risk Trend |
Assessment of Change Year-on-Year |
Mitigation of Risk |
|
In addition, in order to grow our business, we may develop and build or acquire assets and businesses which may have a higher risk profile than certain of the assets we currently own. In addition, we
may consider investing more in assets which are not contracted or not fully contracted, for which revenues will depend on the price of the electricity. We may also consider investing in businesses which are regulated or which are contracted
with “as contracted” agreements or hedge agreements where we need to deliver the contracted power even if the facility is not in operation or which are subject to demand risk. We have recently invested and may consider investing in business
sectors where we do not have previous experience and may not be able to achieve the expected returns. We may also consider investing in new technologies where we do not have for the moment a long historical track record as proven as our
current assets, such as storage, district heating, geothermal, offshore wind, distributed generation or hydrogen. Furthermore, we may consider investing in assets in new markets or with revenues not denominated in U.S. dollars or euros, which
would increase our exposure to local currency, and which could generate higher volatility in the cash flows we generate. In all these types of assets and businesses, the risk of not meeting the expected cash flow generation and expected
returns is higher than in contracted assets.
|
The Investment Committee and the Board of Directors take ownership of managing this risk. | |||
|
Our investments may not perform as expected and development and construction activities are subject to specific risks
Our investments are subject to substantial risks, including unknown or contingent liabilities, the failure to identify material problems during due diligence, the risk of over-paying for assets and the ability to retain customers.
Development and construction activities are subject to failure rate and different types of risks. Our ability to develop new assets is dependent on our ability to secure or renew our rights to an attractive site on reasonable terms; accurately measuring resource availability; the ability to secure new or renewed approvals, licences and permits; the acceptance of local communities; the ability to secure transmission interconnection access or agreements; the ability to acquire suitable labour, equipment and construction services on acceptable terms; the ability to attract project financing; and the ability to secure PPAs or other sales contracts on reasonable terms. Failure to achieve any one of these elements may prevent the development and construction of a project. If any of the foregoing were to occur, we may lose all of our investment in development expenditures and may be required to write-off project development assets.
|
Low
|
|
In 2023 we continued to increase our investments in development and construction with partners or on our own. During the year, four assets fully developed in-house entered in operation. In addition, as of December 31, 2023 we had seven assets under construction, including PV and battery storage assets as well as expansions of our transmission lines.
In addition, we currently have a pipeline of assets under development, including both repowering or expansion opportunities of existing assets and greenfield development, of approximately 2.2 GW of renewable energy and 6.0 GWh of storage. As we continue increasing our pipeline and as our projects get to construction phase, our construction risk is expected to continue to increase. |
- We have in-house development capabilities and partnerships with third parties to co-develop new projects.
- The identificaction of new projects to be developed is supported by rigorous analysis and deeply rooted industry knowledge and experience.
- We follow a disciplined approach to make capital allocation decisions and we have strict minimum required returns for development projects and acquisitions that we update frequently.
- Detailed due diligences both for acquisitions and project development, carried out either in-house or contracted with specialists.
- Senior management, including Geographic VPs, and local teams take ownership of managing this risk.
|
| Risk / Impact | Risk Appetite |
Risk Trend |
Assessment of Change Year-on-Year |
Mitigation of Risk |
|
In addition, the construction and development of new projects is subject to environmental, engineering and construction risks that could result in cost-overruns, delays and reduced performance. A delay
in the projected completion of a project can result in a material increase in total project construction costs through higher capitalised interest charges, additional labour and other expenses, and a delay in the commencement of cash flow.
|
||||
|
International operations including in emerging markets.
We operate our activities in a range of international locations, including North America (Canada, the United States and Mexico), South America (Peru, Chile, Uruguay and Colombia), and EMEA (Spain, Italy, Algeria and South Africa), and we may expand our operations to certain core countries within these regions. Accordingly, we face several risks associated with operating and investing in different countries that may have a material adverse effect on our business, financial condition, results of operations and cash flows. These risks include, but are not limited to, adapting to the regulatory requirements of such countries, compliance with changes in laws and regulations applicable to foreign corporations, the uncertainty of judicial processes, and the absence, loss or non-renewal of favourable treaties, or similar agreements, with local authorities, or political, social and economic instability, all of which can place disproportionate demands on our management, as well as significant demands on our operational and financial personnel. As a result, we can provide no assurance that our future international operations and investments will remain profitable.
|
Medium
|
|
No significant change.
|
We intend to grow our portfolio mainly in countries that we consider stable in North America, South America and Europe. North America represents 52% of our total pipeline in renewables and 67% of our pipeline in storage.
We expect that investments in countries with a higher risk profile such as Algeria and South Africa will always represent a small portion of our portfolio.
We also have a political risk insurance policy in place with the Multinational Investment Guarantee Agency for Kaxu. The insurance provides protection for breach of contract up to $47.0 million in the event that the South African Department of Energy does not comply with its obligations as guarantor. We lso have a political insurance for two of our assets in Algeria up to $35.8 million, including 2 years dividend coverage. This insurance policy does not cover credit risk.
Our local presence in each region provides us with good knowledge and expertise to operate in these regions.
The geographic VPs together with the local teams and support from the compliance department take ownership of managing this risk. |
|
Risks Related to Regulation: legal, environmental and general compliance of each asset
We are subject to extensive regulation of our business in the countries in which we operate. Such laws and regulations require licences, permits and other approvals to be obtained in connection with the operations of our activities. This regulatory framework imposes significant actual, day-to-day compliance burdens, costs and risks on us. In addition, we need to adapt to the regulatory requirements of the different countries where we operate.
|
Low
|
|
In 2022 electricity market prices increased in Spain, which resulted in higher cash collections in 2022. Since our renewable assets in Spain have the right to receive a “reasonable rate of return”, higher electricity prices caused a reduction of the regulated remuneration component in 2023 (we refer to “Regulation in Spain” under “Events during the period” section). During 2023, electricity market prices have been lower than the price expected by the regulation. If electricity market prices continue to be lower than the market price assumed in the regulation and the regulated parameters are not revised until 2026, we may have an adverse effect on revenues, results of operations and cash flows in 2024 and 2025, which we expect will be compensated starting in 2026 in accordance with the regulation in place.
|
- An individual responsible for local compliance has been appointed in each geography where we are present to solve day to-day issues. These employees report to the General Counsel. We have local legal teams in each geography that are usually assisted by local external lawyers. Our local internal and external lawyers are in close contact with the regulation and potential regulation changes in each geography. These, together with the asset managers, proactively track and monitor any potential regulatory change.
|
| Risk / Impact | Risk Appetite |
Risk Trend |
Assessment of Change Year-on-Year |
Mitigation of Risk |
|
Uncertainty or changes to any such regulation in any of the countries where we operate could adversely affect the return of our current plants and our results of operations and cash flows.
We are also subject to significant environmental regulation, which, among other things, requires us to obtain and maintain regulatory licences, permits and other approvals and comply with the requirements of such licences, permits and other approvals and perform environmental impact studies on changes to projects. In addition, our assets need to comply with strict environmental regulation on air emissions, water usage and contaminating spills, among others. As a company with a focus on ESG and most of the business in renewable energy, environmental incidents can also significantly harm our reputation.
In addition, in several of the jurisdictions in which we operate including Spain and Chile, we are exposed to remuneration schemes which contain both regulated incentives and market price components. In such jurisdictions, the regulated incentive or the contracted component may not compensate for fluctuations in the market price component, and, consequently, total remuneration may be volatile. Our assets in Spain receive a remuneration based on a “reasonable rate of return”.
|
|
|
- We have a corporate Compliance team supervising the activity of our different geographies.
- We have a Quality, Environmental, and Health and Safety Management System in-place certified under ISO 9001, 14001 and 45001 standards, which are audited annually by an external third party.
- The corporate operations department performs annual internal audits on our assets to ensure compliance with regulation and our best practices and to promote continuous improvement.
Geographic VPS and local teams take ownership of managing this risk, with the support of the Compliance Management Committee.
|
|
Risks Related to Taxation: changes to tax regulations could adversely affect the return of our current assets. We are subject to changes in tax regulation in all the jurisdictions where we have assets. Our future tax liability may be greater than expected if we do not use sufficient NOLs to offset our taxable income.
We have NOLs that we can use to offset future taxable income. Based on our current portfolio of assets, which includes renewable assets that benefit from an accelerated tax depreciation schedule, and subject to potential tax audits, which may result in income, sales, use or other tax obligations, we do not expect to pay significant taxes in the upcoming years in most of our assets.
|
Low
|
|
Changes in tax regulation have been announced in some countries where we operate. We currently do not expect any material impact from these changes.
|
- Management and specialised teams with broad experience monitor these developments.
- Engagement with local authorities on tax matters.
- Support of reputable external tax consultants with proven expertise in each jurisdiction.
- The Corporate Tax Department (under the CFO supervision) and local teams take ownership of managing this risk.
|
| Risk / Impact | Risk Appetite |
Risk Trend |
Assessment of Change Year-on-Year |
Mitigation of Risk |
|
Although we expect that these NOLs will be available as a future benefit, in the event that they are not generated as expected, or are successfully challenged by the local tax authorities, or are subject to future limitations, our ability to realise these benefits may be limited.
Some countries where we operate could implement changes to regulations regarding tax loss, the content of which are largely uncertain at this time.
|
|
Around 140 countries agreed to implement the “Two Pillars Solution”, an OECD/ G20 Inclusive Framework initiative, which aims to reform the international taxation policies and ensure that multinational companies pay taxes wherever they operate and generate profits. “Pillar Two” of this initiative generally provides for an effective global minimum corporate tax rate of 15% on profits generated by multinational companies with consolidated revenues of at least €750 million, calculated on a country-by country basis. This minimum tax will be applied on profits in any jurisdiction wherever the effective tax rate, determined on a jurisdictional basis, is below 15%. Any additional tax liability resulting from the application of this minimum tax will generally be payable by the parent entity of the multinational group to the tax authority in such parent’s country of residence. The new legislation related to Pillar Two has been enacted or substantially enacted in certain jurisdictions in which Atlantica operates, including the U.K. The new legislation will be effective for Atlantica’s financial years beginning on or after December 31, 2023. We have performed a preliminary assessment of the potential exposure to Pillar Two top-up taxes. The assessment is based on the most recent country-by-country tax reporting and financial statements available for the constituent entities of the group. Based on the assessment performed, the Pillar Two effective tax rates in most of the jurisdictions in which Atlantica operates are above 15% and in all of them meet the requirements to apply the relevant transitional “safe harbors” as defined by OECD, with the exception of one jurisdiction, whose impact is not material. Therefore, we currently do not expect a material impact on our business, financial condition, results of operations and cash flows.
|
|
| Risk / Impact | Risk Appetite |
Risk Trend |
Assessment of Change Year-on-Year |
Mitigation of Risk |
|
In addition, our NOL carryforwards and certain recognised built-in losses may be limited by Section 382 of the IRC if we experience an “ownership change.” In general, an “ownership change” occurs if 5% shareholders of our stock increase their collective ownership of the aggregate amount of the outstanding shares of our company by more than 50 percentage points, generally over a three-year testing period. In addition, the IRS has issued proposed regulations concerning the calculation of built-in gains and losses under Section 382 which, if finalised, may significantly limit our annual use of pre-ownership change U.S. NOLs in the event that a new ownership change occurs after the new rule is in place.
In 2022, the government of South Africa approved tax limitations on deductions for tax years ending on or after March 31, 2023. The net interest expense has been limited to 30% of the EBITDA and any NOLs carried forward may only be applied to offset 80% of a corporation’s taxable income. These new limitations may have a negative impact on our cash flows. |
||||
|
Cybersecurity risk
We are dependent upon information technology systems to run our operations. Our information technology systems are subject to disruption, damage or failure from a variety of sources, including, without limitation, computer viruses, security breaches, cyber-attacks, ransomware attacks, malicious or destructive code, phishing attacks, natural disasters, design defects, denial-of-service attacks or information or fraud or other security breaches.
|
Low
|
|
The number of cyber-attacks to companies has been increasing in the last few years. Many of these attacks have focused on critical infrastructure.
|
- We have implemented prevention, monitoring and threat-detection measures following international standards including ISO 27000.
- Internal and external audits to ensure that our cybersecurity controls are effective, including simulated and targeted cyberattacks to our servers and employees accounts.
- Employees training to detect, monitor and prevent threats. |
| Risk / Impact | Risk Appetite |
Risk Trend |
Assessment of Change Year-on-Year |
Mitigation of Risk |
| Given the unpredictability of the timing, nature and scope of information technology disruptions, we could be subject to production stops, unavailability in our transmission lines, operational delays, the compromising of confidential or otherwise protected information, destruction or corruption of data, security breaches, other manipulation or improper use of our systems and networks or financial losses from remedial actions, any of which could have a material adverse effect on our financial condition, results of operations or cash flows. | There have been cyberattacks
within the energy industry on electricity infrastructure such as substations and related assets in the past and there may be such attacks in the future. Our generation assets, transmission facilities, storage facilities, information technology
systems and other infrastructure facilities and systems could be direct targets of, or otherwise be materially adversely affected by such activities. |
- Our information systems that support business processes are certified under the ISO 27001 standard and are audited annually by an external third party.
- We have a cyber-security insurance policy.
- The Corporate IT team (under the CFO’s supervision) and local teams take ownership of managing this risk. |
Financial Risk Management
We refer to Note 3 to the Consolidated Financial Statements for more detail on Financial Risk Management.
Materiality Analysis
Stakeholder Inclusiveness
Our stakeholders have a broad range of interests and viewpoints. We believe that collaboration with them is key to our success. As such, we listen and do our best to gain stakeholders’ trust, thus leading to a more stable and long-term relationships. Across the Company, we engage with our stakeholders to obtain input that can be helpful as we execute on our strategy.
We believe that systematic stakeholder engagement, executed properly, is likely to result in ongoing learning within the Company, as well as increased accountability to a wide range of stakeholders.
Atlantica has a Stakeholder Policy in-place to emphasise the importance of collaboration with our shareholders, employees, suppliers, customers, business partners, local communities, and debt investors to generate a stable and predictable business environment.
We have made a two-way engagement channel available for our stakeholders to build trusting long-term relationships:
| Key Stakeholders | |||||||
| Shareholders | Employees | Suppliers | Customers | Business Partners | Local Communities | Debt Investors | |
| Face-to-face meetings, video, or phone calls1 | ✓ | ✓ | ✓ | ✓ | ✓ | ✓ | ✓ |
| Annual Reports2 | ✓ | ✓ | ✓ | ✓ | ✓ | ✓ | ✓ |
| Social Media1 | ✓ | ✓ | ✓ | ✓ | ✓ | ✓ | ✓ |
| Materiality Assessment Survey2 | ✓ | ✓ | ✓ | ✓ | ✓ | ✓ | |
| Press Releases1 | ✓ | ✓ | ✓ | ✓ | ✓ | ✓ | ✓ |
| Website Content1 | ✓ | ✓ | ✓ | ✓ | ✓ | ✓ | ✓ |
| Whistleblower Channel3 | ✓ | ✓ | ✓ | ✓ | ✓ | ✓ | ✓ |
| Annual General Meeting (AGM)2 | ✓ | ||||||
| Quarterly Earnings Presentations | ✓ | ✓ | |||||
| Roadshows4 | ✓ | ✓ | |||||
| Intranet1 | ✓ | ||||||
| Employee Climate Survey4 | ✓ | ||||||
| Training1 | ✓ | ✓ | |||||
(1) Regular or on an as-needed basis; (2) On an annual basis; (3) Always available; (4) At least every three years.
ESG Materiality Assessment
Our materiality assessment is based on international sustainability standards GRI and SASB, and ESG rating entity assessments.
We have performed a double materiality assessment where we have identified the most important impacts on society (i.e., impacts on the economy, the environment and people) and the most important impacts on the Company.
This analysis enables us to identify potential risks and opportunities, focus on key ESG priorities that may materially impact our stakeholders and our businesses, on how we can best mitigate these impacts, and to respond adequately in a dynamic and rapidly changing sustainability landscape.
The materiality assessment process consists of five steps, as shown in the table below:
|
Step 1. Identify material topics |
Update the list of material topics or significant impacts. |
| Step 2. Prioritise topics based on their impact on our society |
Identify material impacts on our society (i.e., economic, environment and people) across Atlantica’s activities and business relationships. |
|
Step 3. Prioritise topics based on their impact on our business |
Identify material impacts on our business and its financial impacts as risks and opportunities. |
|
Step 4. Set a response and an implementation plan |
Agree priorities with senior management, anchor the prioritised topics in our internal governance structure and implement ESG programmes and initiatives into our day-to-day business activities |
|
Step 5. Disclose ESG-related information |
Publish annual ESG key performance indicators. Disclosure should serve towards the continued dialogue on ESG material topics |
Step 1: In previous years we gained input from 50 internal and external stakeholders, these inputs helped us to identify the most significant impacts that Atlantica had on society. Considering that we engage with our stakeholders on a continuous basis, we believe to have an up-to-date understanding of themes that our stakeholders consider material. To assess significant impacts on our business, we have considered the company’s strategy, risk reports, taxonomy and policies.
We identified 4 main categories: Climate Change, Occupational Health and Safety, Human Rights, Ethics and Integrity and Environmental Impacts.
Steps 2 - 5: Prioritise topics based on their impact on society and on our business, set a response and an implementation plan and disclose ESG related information:
| Climate Change | Occupational Health and Safety | Human Rights, Ethics and Integrity | Environmental Impacts | |
| Impact on Society |
Positive impact: 89% of our 2023 adjusted EBITDA was from low carbon footprint assets. With our renewable energy production, in 2023 we avoided the emission of 7.0 million tonnes of CO2e, helping to mitigate climate change. Negative impact: However, we also generate GHG emissions in our business, mostly at ACT, our efficient natural gas plant in Mexico.
|
Potential negative impact: Incidents could harm (i) our employees, (ii) those of our contractors working at our assets and (iii) close-by local communities. |
Our business impacts the lives of people across our own operations, our supply chains, and communities. Positive impact: We foster communities’ economic prosperity through local purchasing, the hiring of local employees, etc. Potential negative impact: However, we need to make sure that we always respect human rights in everything we do and that no one is adversely impacted, specifically in regions or industries where regulations are weaker.
|
Our assets occupy large areas of land, generate hazardous and non-hazardous waste, and some of our power generation assets use water in power generation processes. In addition, we currently have several projects under construction in different geographies. These activities also generate GHG emissions, non-hazardous and hazardous waste. Potential negative impact: If we do not properly manage our waste, it could damage the environment and biodiversity in or close to our assets. Hazardous waste could also harm our employees and those of our contractors working at our assets. Positive impact: we perform Environmental Impact Assessments at all our assets before starting the construction process. In those assets in operation, we have reforestation programmes and targeted biodiversity programmes. |
| Impact on Business | Positive and negative impacts: Our assets and operations are exposed to climate-related risks and opportunities, including physical and transition risks, as well as opportunities (detailed information provided in the TCFD section). | Potential negative impacts: Health and safety incidents at our premises could generate potential financial losses, civil and criminal liabilities, damaging our reputation. | Potential negative impact: If we do not ensure that human rights are respected across our operations, supply chains, and communities, we risk severe regulatory and reputational damage to our business. |
Potential negative impacts: Incidents or accidents causing spills, an inappropriate use of water or non-compliance with environmental regulation, including water management, could generate potential financial losses, civil and criminal liabilities, damaging our reputation. |
| Climate Change | Occupational Health and Safety | Human Rights, Ethics and Integrity | Environmental Impacts | |
| Our Response |
✓ We intend to continue investing in renewable energy assets ✓ Approved SBTi intensity target to reduce Scopes 1 and 2 per unit of energy generated ✓ Internal targets to: (i) reduce Scope 3 emissions and (ii) achieve Net Zero GHG emissions ✓ Process to offset GHG emissions ✓ Monitor weather conditions in-real time ✓ Insurance policy ✓ Transition and physical risks evaluated through scenario analysis ✓ The LTIP included in the Remuneration Policy proposed for approval in 2024 that would apply to the CEO and Executives includes the following strategic objectives: - Increase installed capacity under construction by 25% over a three-year period - Increase development pipeline by 20% over a three-year period - Reduce Scope 1 GHG emission per unit of energy generated - Maintain CDP and Sustainalytics ratings among the top quartile of peers |
✓ Health and safety policy, processes and procedures ✓ ISO 45001 compliant ✓ Comprehensive safety programmes ✓ Regular internal and external audits ✓ Reinforced safety procedures during the construction phase ✓ Provided safety training to our employees and those of our contractors ✓ Short term variable compensation of CEO and Geographic VPs include safety targets ✓ The LTIP included in the Remuneration Policy proposed for approval in 2024 includes the objective of improving by 10% on key Health and Safety KPIs (TRIR,LTIR). This LTIP would apply to the CEO and Executives.
|
✓ Human rights policies, processes and procedures ✓ Human rights matters reviewed as part of the internal compliance annual due diligence activities ✓ Compliance with FCPA and UK Bribery Act ✓ Internal and external verification on our policies with local rules and regulations ✓ Internal and external due diligence processes for new suppliers ✓ Communication channels in-place to report any misconduct or instances of non-compliance
|
✓ Environment and biodiversity policy, processes and procedures ✓ ISO 14001 compliant ✓ Regular monitoring of environmental KPIs ✓ Analysis of initiatives to reduce leaks and water consumption ✓ Regular internal and external audits ✓ New internal target to reduce water consumption at our power generation assets
|
|
Reference
|
We refer to the table below “Material Topics” and “References”. | |||
We have identified 10 material topics based on the significant impacts on our society and our business:

Note: Atlantica’s Management considers all topics disclosed in the Materiality Matrix when planning and executing business activities, independently to their impact as shown in the Matrix.
Significant changes compared to previous year:
| - | Supplier Management – The growing relevance of the topic for business and society is due to the increased importance given to environmental criteria in the supply chain, namely the reduction of CO2 emissions in the context of decarbonisation, in light of global goals. Supply chain transparency has emerged as a critical component of sustainable business practices. |
| - | Cybersecurity: There’s growing pressure for businesses to exhibit transparency regarding their corporate commitment to cybersecurity. Cybersecurity has garnered increased attention from regulators, who now demand prompt and comprehensive incident notification, as well as disclosure of an organisation’s cybersecurity control maturity. |
| Material Topics | Reference |
| Occupational Health and Safety |
- Occupational Health and Safety (Strategic Report; Social Sustainability) - Key Performance Indicators (Strategic Report) - Section 172 Statement (Strategic Report) |
| Climate Change |
- Our Sustainable Business Model and Strategy; Key Performance Indicators; Environmental Sustainability and TCFD (Strategic Report) |
| Human Rights, Ethics and Integrity |
- Human Rights and Anti-Slavery and Human Trafficking Statement (Strategic Report; Social Sustainability) - Business Ethics (Governance Section) - Section 172 Statement (Strategic Report) |
| Environmental Impact (waste, water and biodiversity) |
- Environmental Sustainability (waste, water and biodiversity sections); Key Performance Indicators (Strategic Report);
Section 172 Statement (Strategic Report)
|
| Asset Management |
- Asset Management (Strategic Report)
|
| Data Security |
- Cybersecurity and Data Privacy; Section 172 Statement (Strategic Report)
|
| Human Capital |
- People and Culture (Strategic Report; Social Sustainability) - Section 172 Statement (Strategic Report) |
| Diversity and Equal Opportunities |
- People and Culture (Strategic Report; Social Sustainability) - Key Performance Indicators (Strategic Report) - Business Ethics (Governance Section) |
| Supply Chain Management |
- Supply Chain Management (Strategic Report; Social Sustainability) - Section 172 Statement (Strategic Report) |
| Community Development |
- Local Communities (Strategic Report; Social Sustainability) - Key Performance Indicators (Strategic Report) - Section 172 Statement (Strategic Report) |
Note 1: Corporate Governance and ESG-related documents and policies are available on our website.
Note 2: Material topics are addressed in the Global Reporting Initiative (GRI) Content index and Sustainability Accounting Standards Board (SASB) Index (“Other Information” Section).
Atlantica’s management determined while reviewing 2023’s materiality assessment process, and after analysing international best practices, ESG rating assessments, and peer frameworks, that in addition to these topics, it was important to address the Company’s approach to innovation and tax management.
In 2024, we will look into how we can further strengthen our double materiality assessment.
Environment Sustainability
Task Force on Climate-Related Financial Disclosures (TCFD)
We have reported climate-related financial disclosures consistent with Listing Rule 9.8.6R(8) and the 2017 Annex to the TCFD Recommendations and Recommended Disclosures. We have reported climate-related financial disclosures largely consistent with the recommendations of TCFD Guidance 2021 on climate-related financial disclosures. We will continue working towards improving these disclosures acknowledging this is an evolving area.
This section is structured using the four TCFD pillars: Governance, Strategy, Risk Management, and Metrics and Targets.
The analysis has been prepared based on the TCFD guidance, advice of expert third-party consultants, and internal expertise.
| TCFD Elements | Recommended Disclosure | Cross Reference | Current Status | Future Priorities |
| 1) Governance | a) Describe the Board’s oversight of climate related risks and opportunities | Sustainability Governance (Business ethics section) P. 167 and section 1 below |
- Board and Management Committees review risks and opportunities as part of their areas of responsibility
- Climate related risks and opportunities are integrated into our strategy and business model
- Climate change and environmental sustainability is a major consideration of our business at all levels
- Climate change and ESG-related training provided to employees (including management) |
- At Board level: continue supervising ESG and climate-related matters, initiatives, risks and opportunities
- At Management level: maintain different committees to efficiently address ESG and climate-related matters
- Increased linkages between sustainability performance and remuneration P 204 from the Rem report the LTIP included in the Remuneration Policy proposed for approval in 2024 that would apply to the CEO and Executives includes additional ESG related objectives. |
| b) Describe management’s role in assessing and managing climate related risks and opportunities |
Sustainability Governance (Business ethics section) P. 167 and section 1 below
|
|||
| 2) Strategy | a) Describe the climate related risks and opportunities the organisation has identified over the short, medium and long term | Section 2 below |
- Screened for potential climate-related risks and opportunities and conducted climate-related scenario analysis to determine and assess Atlantica’s 2030 and 2050 key risk and opportunity impacts
- ESG and climate change integrated into financial planning |
- Continue screening and analysing potential climate-related risks and opportunities
- Continue investing in assets that are environmentally sustainable and managing them sustainably |
| b) Describe the impact of climate related risks and opportunities on the organisation’s businesses, strategy and financial planning | Section 2 below | |||
| c) Describe the resilience of the organisation’s strategy, taking into consideration different climate related scenarios, including a 2C or lower scenario | Section 2 below |
| TCFD Elements | Recommended Disclosure | Cross Reference | Current Status | Future Priorities |
| 3) Risk Management | a) Describe the organisation’s processes for identifying and assessing climate related risks | Principal Risks and Uncertainties section P. 56 and section 3 below |
- ISO 31000 aligned risk management framework incorporating climate-related risks
- Climate change is considered a strategic risk, hence is continually reviewed across at business and corporate level
- Transition and physical risks evaluated through scenario analysis
- Climate-related risks included in our Risk Map |
- Continue developing our risk assessment processes to better identify emerging climate-related risks and to manage climate-related risks effectively |
| b) Describe the organisation’s processes for managing climate related risks | Principal Risks and Uncertainties section P. 56 and section 3 below | |||
| c) Describe how processes for identifying, assessing and managing climate related risks are integrated into the organisation’s overall risk management | Principal Risks and Uncertainties section P. 56 and section 3 below | |||
| 4) Metrics and Targets | a) Disclose the metrics used by the organisation to assess climate related risks and opportunities in line with its strategy and risk management process | Environmental Sustainability P. 91 and section 4 below |
- Scopes 1 and 2 reported since 2015 and Scope 3 since 2019
- Externally reviewed 100% of Scopes 1, 2 and 3 since 2020
- Approved SBTi intensity target to reduce Scopes 1 and 2 per unit of energy generated
- Internal targets to: (1) reduce Scope 3 emissions and achieve Net Zero GHG emissions, (2) reduce non-GHG emissions, (3) reduce water consumption at generating assets and (4) reduce our hazardous and non-hazardous waste.
- Internal carbon price of $20-$35 per ton of CO2 to evaluate investment opportunities1
- Process to offset GHG emissions |
- Continue analysing and implementing climate-related reporting best practices
- Measure progress to reach targets
|
| b) Disclose Scope 1, Scope 2 and if appropriate Scope 3 greenhouse gas (GHG) emissions, and the related risks | Environmental Sustainability P91 and section 4 below | |||
|
c) Describe the targets used by the organisation to manage climate related risks and opportunities and performance against these targets
|
Environmental Sustainability P. 91 and section 4 below |
1 We apply a carbon price when we evaluate investments in natural gas assets with long-term useful life. The economic impact is evaluated as an additional cost. In 2023 and 2022, we did not evaluate investments in natural gas assets. In 2021, when the carbon pricing cost was factored in the investment opportunity model of a gas plant in North America, the Investment Committee decided that the potential investment was not reaching the minimum returns required for the specific sector and geography and rejected any potential investment.
| 1. | Governance |
We refer to the subsections Business Ethics and Sustainability Governance within the Governance section for a description of the role of the Board of Directors and Management in terms of climate-change.
We refer to the Directors’ Report for details on the Board of Directors’ profiles.
| 2. | Strategy |
We have screened for potential climate-related risks and opportunities and conducted a climate-related scenario analysis to analyse Atlantica’s 2030 and 2050 key risk and opportunity impacts.
The risks were identified following a two-step process. In the first place, an initial screening was carried out to determine which physical and transition risks are most likely to affect all our businesses and geographies. Once the initial screening was completed, company-specific data (e.g., historical records of past events, input from internal stakeholders) was taken into account to determine the key risks most likely to affect Atlantica as well as their potential impact on our activities.
We refer to the ESG Materiality Analysis for details on our materiality assessment.
Due to the nature of climate risks and opportunities we are monitoring them across a number of time horizons. Short term (1-2 years), medium-term (3 to 10 years) and long-term (over 11 years) horizons. We have updated this climate-related classification based on our long-term decarbonisation strategy and SBTIs updated guidance. As of December 31, 2023, Atlantica’s portfolio of assets have 13 years of weighted average contract life remaining2. We expect to progressively repower our assets, hybridize them with other technologies, include storage in certain cases and replace our existing fleet with newer renewable and storage assets. In any case, long term risks and opportunities have a very low impact on our current portfolio of assets.
Physical Risks: Methodology and Key Findings
The physical risk analysis covered fourteen regions and eight different climate hazards. The selection took into consideration Atlantica’s key technologies, countries and assets, past events that affected Atlantica’s or other peers’ operations, and climate scenarios that project how the intensity or frequency of certain climate hazards might change as a result of global warming.
Summary of Potential Impacts of Physical Climate Risks3
| Risk | Technology | Potential Impacts |
|
Changing wind patterns |
Wind power | The wind power plants are designed for the prevalent wind direction to work as efficiently as possible. A change in the wind direction and /or wind speeds may impact the power production efficiency. |
| Increase in mean temperatures | Solar, wind power |
Increasing temperatures reduce the efficiency of solar power production. Increasing mean air temperature lowers air density which causes less efficient wind power production. Solar PV panels exposed to high temperatures age more quickly. |
| Droughts/water scarcity | Solar, geothermal energy | Water is needed for steam turbines, cooling condensers etc. If there is less water available, water costs may increase. Water restrictions may occur affecting the cooling capacity of the plants. |
| Increasing mean water temperatures | Water desalination | Warmer sea water may contribute to the growth of algae that negatively affect the membranes inside the desalination plant. In addition, higher water temperatures reduce the feed pressure and the membranes performance. |
| Landslides caused by heavy precipitation | Solar, transmission infrastructure |
Heavy rains can cause flooding close to transmission lines, which can result in landslide which can damage towers. This can lead to business interruption and requiring repair work. Flooding of solar PV fields may prevent access to the site or destroy components. |
| Severe winds/ wind gusts | Solar | Severe winds can damage solar fields and destroy components, requiring repair work. |
| Wildfires |
Transmission infrastructure |
If the transmission lines cause a wildfire, it could result in damage, including damage to third parties and subsequent liabilities. |
| Severe winter weather and hail | Wind power, natural gas, solar | Severe winter weather, like the storm in February 2021 in Texas, could cause supply from wind farms to decline due to wind turbine equipment freezing. In addition, natural gas assets could trip offline due to operational issues caused by freezing conditions. Furthermore, hail can damage solar fields and destroy components, requiring repair work. |
2 Calculated as weighted average years remaining as of December 31, 2023 based on CAFD estimates for the 2024-2027 period, including assets that have reached COD before March 1, 2024.
3 From a climate-related perspective, potential physical climate risks include short-term (1-2 years), medium-term (3 to 10 years) and long-term (over 11 years) horizons. We have updated this climate-related classification based on our long-term decarbonisation strategy and SBTIs updated guidance.
Assessment of the current and short-term exposure to potential impacts of physical climate risks:
| Risk | Type of Risk | Evaluation |
| Chronic Physical | Changing wind patterns | The design of our plants is appropriate considering the current prevailing wind direction. |
| Increase in mean temperatures |
Our solar and wind plants have been in operation for approximately 10 years. Since our plants started operations, we have not observed a decrease in efficiency that might be attributable to an increase in temperatures, even in those years with higher temperatures. To avoid health and safety issues, we undertake operation and maintenance activities in those timeframes with less heat intensity. |
|
| Droughts/water scarcity | Atlantica has historically only withdrawn approximately 50% of the total regulatory water limits permitted at our solar assets. Even if the water limits were reduced, we believe we have sufficient margin to withdraw enough water to keep our plants working properly. Our local asset management teams systematically track and monitor water availability as a key KPI of the asset. | |
| Increasing mean water temperatures | Water temperature in the region where our desalination plants are located typically ranges from 15ºC in winter to 26ºC in summer (monthly averages). For the moment, we have not experienced a proliferation of algae which may result in a loss of efficiency in the desalination process. | |
| Acute Physical | Landslides caused by heavy precipitation | In our transmission lines, heavy precipitation may cause landslides which can damage the towers in our transmission lines. In the case that we faced an event such as this, it would typically affect one or two towers, especially taking into consideration the distance between towers. An event like this is covered by our insurance policy after the customary deductibles, thus the remaining risk is currently not considered material. |
| Severe winds/wind gusts | Our geographic VPs and our operations team monitor weather conditions in real-time at each of the assets to adopt the required protection measures. An event like this is covered by our insurance policy after the customary deductibles, so the remaining risk is currently not considered material. | |
| Wildfires |
Our largest transmission lines ATS and ATN are located in arid regions, with little or no vegetation. Most of our transmission lines in Chile are also located in areas with low risk of wildfires. After the acquisition of Chile TL4, we dedicated significant efforts to manage the vegetation in proximity to the line. In addition, in 2019 one of our off-takers, PG&E, a large utility company in California, filed for bankruptcy protection under Chapter 11 due to liabilities related to its potential involvement in wildfires in California in 2017 and 2018. PG&E emerged from Chapter 11 in 2020. During this process, a Wildfire Fund was created to pay eligible claims for liabilities arising from wildfires. New regulation further mitigates this risk. |
|
| Severe winter weather and hail | Hail impacting our solar panels is covered by our insurance policy after the customary deductibles, so the remaining risk is currently not considered material. In addition, we do not have hedge agreements where we need to deliver the contracted power even if the facility is not in operation. |
We believe that physical climate risks are adequately managed based on our policies, procedures, processes and systems in-place.
Assessment of the medium and long-term exposure to potential impacts of physical climate risks through scenario analysis
We evaluated the potential changes in the selected risks as projected by the Representative Concentration Pathway (RCP) 8.5, a business-as-usual scenario. This scenario assumes that GHG emissions will continue rising at today’s rate until the end of the century, with little mitigation efforts. By the end of the century, the RCP 8.5 scenario projects a rise of approximately 4ºC in global mean temperature by 2100, compared to pre-industrial levels.
Under the RCP 8.5 scenario, chronic and acute physical risks become greater and more frequent as a result of the increase in the average global temperature.
The analysis carried out focused on the Company’s specific locations. Furthermore, scientific literature such as the (i) NASA Centre for Climate Simulations (NCCS), and (ii) Aqueduct Floods Hazard Maps and Aqueduct Global Maps 3.0 from the World Resources Institute (WRI) that included projections from different climate models were consulted to further analyse future climate conditions in the medium (2030) and long term (2050).
A qualitative rating was assigned, ranging from low to high, which reflects the future changes in the frequency and/or severity of the hazard from baseline conditions under the RCP 8.5 scenario.
Potential Changes in Frequency and Severity of the Hazard from Baseline Conditions under RCP 8.5

We have completed a detailed analysis of four physical risks which have been selected based on (i) potential change in 2030 and 2050 with respect to baseline conditions, (ii) risk exposure at asset level, and (iii) Atlantica’s management assessment. The identified physical climate risks impacts were:
Potential Physical Climate Risks Impacts
| Risk | Results |
| Changing wind patterns in wind assets | We do not expect a change in the wind direction and/or wind speeds may significantly impact the power production efficiency in the mid-term. |
| Increase in mean temperatures in solar and wind assets | We estimate that (i) a reduction of the efficiency of solar power production, and (ii) lower air density which causes less efficient wind power production, could have, if no additional mitigation measures were implemented, a maximum annual revenue loss of approximately $1 million in 2030. |
| Droughts/water scarcity in solar assets | If there is less water available, water costs may increase. Water restrictions may affect the cooling capacity of the plants. For example, we estimate that droughts and water scarcity in Spain could have, if no additional mitigation measures were implemented, an annual revenue loss between approximately $75 thousand and $1.1 million in 2030. |
| Landslides caused by heavy precipitation in transmission infrastructure | Flooding close to transmission lines can damage towers. This can lead to business interruption and require repair work. We estimate that landslides could have, if no additional mitigation measures were implemented, an annual damage between approximately $30 thousand and $3.0 million in 2030. |
Notes:
| 1. | Different hypothesis and approaches have been used to calculate these physical climate risks impacts, including the advice of expert third-party consultants and internal expertise (including the Chief Executive Officer and other senior managers). Additional disclosure on physical climate risks impacts calculations is provided in Atlantica’s 2023 CDP’s Climate Change questionnaire (section C2 Risks and Opportunities) available on our website. |
| 2. | By 2050, some of the physical climate-related risks analysed may not impact us since we could replace some of the existing technologies with others with for example, lower water consumption. By 2050, we expect physical climate risks impacts to be immaterial. |
Based on the work completed (i.e., including historical records of past events, input from different stakeholders and RCP 8.5 scenario analysis where chronic and acute physical risks become greater and more frequent as a result of the increase in the average global temperature), the potential impact of physical climate-related risks on our short, medium and long-term assets’ financial performance (i.e., revenues, costs) and financial position (i.e., asset, liabilities) is expected to be immaterial4. From a physical risk perspective, the results of the work completed indicate that Atlantica’s short, medium and long-term strategy and asset portfolio would be resilient to physical climate-related changes.
4 We categorize risks depending on their potential impact on (1) CAFD pre-corporate debt service and asset value (equity value) of the company and (2) health and safety and environment. Additional disclosure on risk impacts is provided in Atlantica’s 2022 CDP’s Climate Change questionnaire (section C2 Risks and Opportunities) available on our website.
Transition Risks and Opportunities: Methodology and Key Findings
Transition Climate Risks Description and Mitigation
| Risk | Risk Description | Risk Mitigation |
| Current Regulation (policy and legal) | Atlantica is directly affected by climate-related risks driven by laws, regulations, taxation, disclosure of emissions and other practices. For example, we are subject to the requirements of the U.K. Climate Change Act 2008 on GHG emissions reporting. In addition, our U.S. solar plants are for example, subject to permits under the Clean Air Act. | - Asset managers are responsible for monitoring asset activities in line with local regulations and contractual requirements (environmental, permits, etc.). Local compliance managers are responsible for managing and resolving compliance issues in the geographies under their responsibility, including ensuring compliance with current regulations. |
| Emerging regulation (policy and legal) | Changes in regulation could have a negative impact on Atlantica’s future growth or profitability. On January 5, 2023, the European Union Corporate Sustainability Reporting Directive (“CSRD”) entered into force. Among other things, the CSRD expands the number of companies required to publicly report sustainability and ESG-related information on their management report to understand how sustainability matters affect their own development, performance and position, and defines the related information that companies are required to report in accordance with European Sustainability Reporting Standards (“ESRS”). | - Various internal working groups and management regularly review risks that arise from new regulatory developments and its potential impacts. |
| Reputation | If our reputation suffered, our cost of capital could increase, and it could be more difficult for us to access capital. In addition, some potential employees, clients, and /or suppliers could perceive Atlantica as a less appealing company as a result of a deterioration in our reputation. |
- GHG reduction objective on Scope 1 and 2 emissions approved by the Science Based Targets initiative (SBTi). - We target to maintaining over 85% of our adjusted EBITDA generated from low carbon footprint assets. - We have set internal targets to reduce: (1) Scope 3, (2) non-GHG emissions and (3) water consumption - We have an internal target to achieve Net Zero GHG emissions. - In 2023 we set a new target to reduce our waste.
|
| Downstream | Some of our clients are large utilities or industrial corporations. They are also exposed to significant climate change-related risks, including current and emerging regulation, acute and chronic physical risks. A negative climate-related risk impact on our clients, including their credit quality could lead to their inability to comply with their obligations under our existing contracts. | - Large utilities and industrial corporations strive to comply with the highest ESG and climate change standards and to maintain their credit ratings. |
Note: all these transition-related risks and their mitigation plans apply to the Company in the short, medium and long-term. We refer to Atlantica’s 2023 CDP’s Climate Change questionnaire (section C2) for additional details on transition-related risks.
The transition risks prioritised for this analysis relate to policy, technology and market developments. The analysis considered two of the scenarios provided in the World Energy Outlooks (WEO) 2021 report prepared by the International Energy Agency (IEA).
| IEA Sustainable Development Scenario (SDS) |
- Assumes strong policy support and international cooperation in meeting the United Nations Sustainable Development Goals (SDGs) along with a major transformation of the global energy system - Full alignment with the Paris Agreement - Global average temperature increase is limited to below 2°C by the end of the century |
| IEA Stated Policies Scenario (STEPS) |
- Assumes current and announced policies, plans, and trajectories and their implications for energy demand, emissions, carbon markets, and energy security - Global average temperature increases of approximately 3°C by the end of the century. |
As global decarbonisation ambitions increase, the physical impacts of climate change decrease, but transition risk increases as more aggressive and disruptive policies are required to achieve the necessary global warming temperature goal.
Based on the work completed (i.e., including historical records, input from different stakeholders and existing risk mitigation plans), the potential impact of transition-related risks on our short, medium and long-term assets’ financial performance (i.e., revenues, costs) and financial position (i.e., asset, liabilities) is expected to be immaterial, hence we have not analysed transition-related risks under SDS and STEPS scenarios.
Opportunities
We have focused on two opportunities for our medium and long-term scenario analysis:
| Opportunity | Scenario | Geography | Potential Changes in 2030 and 2050 |
| 1.Changes in Demand for Low-Carbon Products and Services may lead to increased demand for products and services due to rising adoption of renewables. | STEPS | US |
This scenario assumes an extension of renewable tax credits for solar, and onshore and offshore wind, as well as 100% carbon-free electricity by 2050 in 20 states. This scenario projects that there will be an increase in demand for renewable energy, which will be more prominent between 2030-2050 compared to 2020-2030. |
| EU | This scenario assumes that the renewable energy market in the EU will continue to grow, as country members move rapidly toward decarbonisation. This includes a successful completion of the already announced coal phase-out plans considered in 16 member states, including Spain. This scenario assumes a strengthening of national energy transition plans with a particular focus on offshore wind targets and increased electrification of the economy, particularly in transport. These developments could further de-risk renewable energy investments which could in turn, facilitate the penetration of renewables in the power generation mix. | ||
| SDS | US | Demand for renewable energy is projected to grow rapidly, accelerating during the period 2020-2030 compared to 2030-2050. | |
| EU | Demand for renewable energy is projected to grow rapidly, accelerating during the period 2020-2030 compared to 2030-2050. |
| Opportunity | Scenario | Geography | Potential Changes in 2030 and 2050 |
|
2.Changes in Government Supporting Schemes may lead to increased competitiveness and to a lower risk when investing in renewable energy.
|
STEPS | US | The US has achieved notable reductions in CO2 emissions over the past decade, led by the transformation of the power sector. Policy dynamics are expected to be supportive for the development of the renewable energy market. The opportunity is assessed to be higher in the long run, as more stringent policies are expected to be implemented in the US to further reduce its GHG emissions footprint. |
| UK | The UK has set ambitious goals to reach its carbon neutrality goal by 2050, with the electricity sector shifting due to investment in offshore wind and solar PV. The government’s support for the development of renewable energy in order to meet its climate commitments is expected to intensify during 2030-2050. | ||
| SDS | US | The ambitious 2021 U.S. Long-Term Strategy “Pathways to Net-Zero Greenhouse Gas Emissions by 2050” is consistent with limiting global warming to 1.5°C. The policies that would need to be implemented by the U.S. to reach this goal represent an opportunity for Atlantica, with more initiatives to be expected during the period 2030-2050. | |
| EU | The EU’s track record in decarbonising the electricity system through renewable energy technologies, notably offshore wind, but also solar photovoltaic, suggests that the EU is on track to reach its climate targets. This opportunity has a higher consideration in the long-term than in the mid-term, taking into consideration that the policies aiming to deliver the EU’s Green Deal will intensify during that period. | ||
| UK | This scenario assumes that the U.K. administration will implement all policies required to reduce emissions down to a level consistent with the Paris Agreement. The changes in the government supporting schemes in the long-term is expected to favour the renewable energy market more than in the mid-term. |
Note: We refer to “Our Sustainable Business Model and Strategy” for additional disclosures on our: (i) short-term opportunities (“growth visibility” section), (ii) growth pipeline of assets under development pipeline and (iii) competitive strengths to execute our business strategies.
A qualitative rating was assigned, ranging from low to high, which reflects the potential future changes in (i) demand for low-carbon products, and (ii) government supporting schemes under STEPS and SDS scenarios.
Potential Opportunities by Geography under STEPS and SDS
Scenarios in the
Medium (2030) and Long-Term (2050)

From a transition perspective, the combination of market trends, including the growing demand for clean energy supported by expanding GHG reduction targets, and the increasingly favourable economics of clean energy, creates many opportunities for our business.
According to Bloomberg New Energy Finance (BNEF), the next three decades will require between $46 trillion and $131 trillion of investment which translates into an annual range of $1.5-$4.4 trillion. BNEF projects an annual investment of $1.2-$3.9 trillion in low-carbon energy sources, including renewables, surpassing the $1 trillion invested in 20225 . Furthermore, clean energy is on track to set new records. Global installation of wind, solar and storage is expected to exceed 680 GW in 2024, up 22% from 2023. Solar is anticipated to lead the way in 2024 with over 500 GW expected to be installed, which will likely make it the largest source of new capacity and new generation worldwide. Onshore wind follows as the second-highest, with close to 100 GW projected to be installed in 2024, followed by storage capacity, of which around 50 GW is expected to be installed6.
In addition, in the U.S. the Inflation Reduction Act was signed into law in 2022 and includes a bundle of measures to incentivise clean energy investment and storage.
We have a majority of our business in renewable energy assets. In addition, we are developing new projects in most of our core geographies. We currently have a pipeline of assets under development of approximately 2.2 GW7 of renewable energy and 6.0 GWh7 of storage. We believe that our diversification by business sector and geography (including the U.S. and the European Union), our know-how in project development and operating expertise in our key markets together with a critical mass of assets in several geographic areas, as well as our access to capital will assist us in benefiting from the expected transition towards a green energy generation mix in our markets.
Based on the work completed (i.e., including historical investments, our competitive strengths, identified growth opportunities and SDS and STEPS scenario analysis), Atlantica’s short, medium and long-term strategy would be resilient and would be well positioned to take advantage of transition-related opportunities.
We refer to “Our Sustainable Business Model and Strategy” section for further details on our growth plans.
We refer to Atlantica’s 2023 CDP’s Climate Change questionnaire (section C2) for additional details on transition climate-related opportunities.
5 BNEF Theme: Energy Investment and Climate Scenarios
6 Where Energy Markets and Climate Policy Are Headed in 2024: BNEF
7 Only includes projects estimated to be ready to build before or in 2030 of approximately 3.7 GW, 2.2 GW of renewable energy and 1.5 GW of storage (equivalent to 6.0 GWh). Capacity measured by multiplying the size of each project by Atlantica’s ownership. Potential expansions of transmission lines not included.
We refer to the “Reporting under the European Union Taxonomy” section for further details on clean revenues, Adjusted EBITDA, and capital allocation and capital expenditures (investments and maintenance capex).
| 3. | Risk Management |
Atlantica’s Board of Directors is responsible for supervising climate change risk analysis. Day-to-day risk management activities are led by the Head of Risk Management8. Climate change risks and opportunities are also discussed, whenever considered, in the ESG Committee and in the Geographic Committees. In addition, when we evaluate potential investments, the Investment Committee evaluates all potential risks related to the potential investment, including ESG and climate-related risks. Atlantica has developed a risk analysis methodology based on ISO 31000 and on standard market practices.
We refer to the “Principal Risks and Uncertainties” section for a detailed description of our risks, including how our risks are assessed and prioritised (i.e., based on their likelihood and magnitude of the impact).
We refer to the “Sustainability Governance” section for further details on processes and committees for identifying, assessing and managing ESG and climate-related risks.
| 4. | Metrics and Targets |
We use a number of key metrics and targets to assess and manage climate risks and opportunities
We refer to the Annual Integrated Report and Atlantica’s 2023 CDP’s Climate Change questionnaire, sections C2 and C3, for additional metrics on climate-related risks and opportunities, and on our climate strategy, respectively.
| a) Disclose the metrics used by the organization to assess climate-related risks and opportunities in line with its strategy and risk management process. |
Atlantica has considered the key metrics following the guidance of Tables A1.1 and A1.2 as well as the metrics consistent with the cross-industry, climate-related metric categories described in Table A2.1 This Integrated Annual Report discloses our annual performance across many climate-change related areas. This information is disclosed in the Environmental Sustainability section. We refer to sections “Greenhouse Gas Emissions” and “Water Management” and “Waste management”. |
| b) Disclose Scope 1, Scope 2, and, if appropriate, Scope 3 greenhouse gas (GHG) emissions, and the related risks. |
- GHG Emissions Breakdown by Scope Including Offset GHG Emissions Page 94 - GHG Emissions Breakdown by Scope P 95 - Scopes 1 and 2 GHG Emissions Rate per Unit of Energy Generated P 94-95 - % of Reviewed GHG Emissions in 2022, 2021 and 2020 P 92 Additionally, we refer to Atlantica’s 2023 CDP’s Climate Change questionnaire sections C5 and C6, for additional breakdowns on GHG emissions. |
| c) Describe the targets used by the organization to manage climate related risks and opportunities and performance against targets. |
Our targets are: - Science Based Targets initiative (SBTi) approved target: Reduce Scope 1 and 2 GHG emissions per kWh of energy generated by 70% by 2035 from a 2020 base year. - Reduce Scope 3 GHG emissions per kWh of energy generated by 70% by 2035 from a 2020 base year. - Achieve Net Zero GHG emissions by 2040. - Reduce non-GHG emissions per kWh of energy generated by 50% by 2035 from a 2020 base year. - Reduce our water consumption per kWh of energy generated by 50% by 2035 from a 2020 base year. - Reduce our hazardous and non-hazardous waste per unit of energy generated by 30% and 40%, respectively, by 2035 from a 2023 base year. The performance against our targets can be found on pages 93. |
8 The Head of Risk Management participated in the screening for potential climate-related risks and opportunities and in the climate-related scenario analysis to analyse Atlantica’s 2030 and 2050 key risk and opportunity impacts.
Greenhouse Gas Emissions
| GHG emissions reduction targets: | ||
| ✓ | Reduce Scope 1 and 2 GHG emissions per kWh of energy produced by 70% by 2035 from a 2020 base year. Approved by Science Based Target | |
| ✓ | Reduce Scope 3 GHG emissions per kWh of energy produced by 70% by 2035 from a 2020-year base. | |
| ✓ | Achieve net zero GHG emissions by 2040. | |
| Key facts: | ||
| ✓ | Scope 1 and 2 GHG emission rate per unit of energy generated continue decreasing year-over-year | |
| ✓ | Scope 3 GHG emission rate per unit of energy generated continue decreasing year-over-year | |
| ✓ | Increased CO2e emissions avoided vs. 2022 | |
| ✓ | Offset 380 thousand tons of Scope 1 GHG emissions (▲ 19% vs. 2022) | |
Information on our Reporting
Atlantica complies with the (i) 2008 U.K. Climate Change Act on GHG reporting, (ii) Commission Regulation (EU) No 601/2012, (iii) ISO 14064-1:2018 Greenhouse gases, Part 1, on quantification and reporting of GHG emissions and removals, and (iv) GHG Protocol on GHG quantification.
In 2023 we have followed the financial control approach to calculate our GHG emissions. 2022 and 2021 GHG emissions have been revised following the new approach. Under the financial control approach, a company accounts for 100% of the GHG emissions from operations over which it has financial control. Emissions from joint ventures where partners have joint financial control are accounted for based on the equity share approach. We are accounting for proportional Scope 1 and Scope 2 emissions of equity investments in Scope 3, category 15 (Investments).
We quantified and reported on the GHG emissions figures following the GHG Protocol:
| - | Scope 1: Direct emissions of GHG from sources that are owned or controlled by the Company. |
| - | Scope 2: Indirect emissions of GHG from consumption of purchased electricity, heat or steam. |
| - | Scope 3: Indirect emissions of GHG not included in Scope 2 that occur in the Company’s value chain, including both upstream and downstream emissions, and the investments in joint ventures where partners have control. |
Our reported emissions include emissions of carbon dioxide (CO2), methane (CH4), and nitrous oxide (N2O) as CO2 equivalents9. CH4 and N2O emissions represent 0.53% and 0.04%, respectively, of our total Scope 1 GHG emissions.
We calculated Scopes 1 and 2 emissions using the GHG inventories conversion factors indicated by the organisations listed below:
9 Some of our transmission lines use sulfur hexafluoride (SF6). We analysed this KPI following our internal process and procedures and concluded that the SF6-related GHG emissions are not significant.
| - | Intergovernmental Panel on Climate Change (“IPCC”). |
| - | United States Environmental Protection Agency (“EPA”). |
| - | 2023 GHG National Inventory from the Ministry of Ecological Transition in Spain. |
As previously explained, independent third parties have been engaged to verify our reported Scope 1, 2 and 3 GHG emissions under a reasonable level of assurance.
% of Reviewed GHG Emissions in 2023, 2022 and 2021
| 2023 | 2022 | 2021 | |
| Scopes 1, 2 and 3 Reviewed Emissions | 100% | 100% | 100% |
Highlights
As of December 31, 2023, and 2022, approximately 89% of our Adjusted EBITDA comes from low carbon footprint assets (renewable energy, transmission lines and water assets) complying with our goal of having over 85% of our Adjusted EBITDA generated from low carbon footprint assets. The remaining 11% of our Adjusted EBITDA refers to ACT and Monterrey, two efficient natural gas-fired power generation assets in Mexico, and one district heating plant in Canada. Our partner in Monterrey initiated a process to sell its 70% stake in the asset. Such process is well advanced and, as part of it, we intend to sell our interest as well under the same terms.
| Adjusted EBITDA as of December 31, 2023 |
|
|
| Note: Adjusted EBITDA from Low carbon footprint assets includes renewable energy assets, transmission lines and water assets |
ACT is located in a natural gas complex belonging to our client. Our plant does not purchase or pay for the natural gas, it is just one more step in our client’s production process (i.e., ACT receives natural gas and water from its client under a tolling Agreement and in exchange provides electricity and steam). The client bears the cost and also all the responsibility for environmental obligations. Nevertheless, following reporting best practices we are consolidating all ACT’s environmental indicators, including GHG emissions, water and waste.
ACT has an “efficient cogeneration facility” status granted by the Mexican energy regulator that is renewed each year. The Mexican regulator categorises facilities that deliver energy above a defined efficiency threshold as “efficient plants”. This status allows ACT to benefit from certain favourable conditions regarding interconnection and transmission.
GHG Emissions Avoided by Power Generation Assets
|
In million tonnes |
2023 | 2022 | 2021 |
| Scopes 1, 2 and 3 GHG Emissions Avoided | 7.0 | 6.9 | 5.9 |
We base our avoided emissions calculations on the “Greenhouse Gas Equivalencies Calculator” and the Avoided Emissions and Generation Tool (AVERT) U.S. national weighted average CO2 marginal emission rate, to convert reductions of kilowatt-hours into avoided units of CO2 emissions. We consider electric and steam generation in the calculation.
In 2023, the GHG emissions avoided increased compared to 2022 largely due to the increase in production at our solar assets in Spain where solar radiation was higher in 2023 compared to 2022 with good performance of the assets.
Emissions Reduction Targets
| (1) | Atlantica targets to reduce Scope 1 and 2 GHG emissions per kWh of energy produced by 70% by 2035 from a 2020 base year, approved by the Science Based Targets initiative (SBTi). |
This objective is particularly ambitious for a company like Atlantica, where approximately 74% of our 2023 revenues consists of renewable energy production, an activity which already has a very low rate of emissions per unit of energy produced. In 2023, Atlantica’s Scope 1 and 2 GHG emissions rate per unit of energy generated decreased compared to 2022 demonstrating our commitment to achieve our target.
Scope 1 and 2 GHG Emissions rate per unit of energy generated

Source: In-house
| (2) | In addition, following our commitment to achieve Net Zero GHG emissions by 2040, we set another target to reduce our Scope 3 GHG emissions per kWh of energy generated by 70% by 2035 from a 2020 base year. |
Scope 3 GHG Emissions rate per unit of energy generated

Source: In-house
| (3) | Atlantica has also set a goal to maintain over 85% of our adjusted EBITDA generated from low carbon footprint assets including renewable energy, storage, transmission infrastructure and water assets. |
Scopes 1, 2 and 3 absolute emissions
In 2023, approximately 70% of the Scopes 1 and 3 GHG emissions generated came from our efficient natural gas plant in Mexico and 80% of the Scope 2 GHG emissions generated came from our water assets.
Scope 1, 2 and 3 GHG Emissions by Technology

Note: 2022 was the first full year we consolidated COSO, our geothermal asset in the U.S.
Following U.K. GHG regulation disclosure, GHG emissions generated in the U.K. were less than 0.001% in both 2023 and 2022.
In 2023, as part of our commitment to sustainability, we offset 380 thousand tonnes of Scope 1 CO2 emissions through Certified Emissions Reduction (CERs) credits, compared to 320 thousand tonnes of Scope 1 CO2 offset emissions in 2022.
GHG Emissions Breakdown by Scope Including Offset GHG Emissions

Note: Scope 2 market-based figure
The GHG emissions offsetting mechanism reduced our total GHG emissions by 13% and our Scope 1 GHG emissions by 21%, compared to 11% and 17%, respectively, in 2022, and 9% and 14%, respectively, in 2021. We believe this initiative proves our sustainability focus and further demonstrates Atlantica’s commitment to fighting climate change.
The graph below shows our GHG emissions in 2021, 2022 and 2023 (without offsets):
Scope 1, 2 and 3 GHG emission as of December 31, 2023, 2022 and 2021

Note: Scope 2 market-based figure
In 2023, our Scopes 1 and 3 emissions decreased mainly due to lower availability at our efficient natural gas asset, ACT, due to the scheduled major overhaul performed in the turbines. Natural gas consumption decreased and consequently emissions were lower. Scope 2 emissions remained stable in 2023 compared to 2022.
In 2022, our Scope 1 emissions increased mainly due to Coso, as this asset was fully consolidated for the entire year 2022 while only for 8 months in 2021 (i.e., we closed the acquisition of Coso in April 2021).
Coso is our geothermal asset located in California. The area where our asset is located releases GHG emissions to the atmosphere, mostly in the form of CO2 that already exists and is released progressively in a natural process. With our activity, while we produce electricity, we are accelerating this process of release of already existing CO2. Following the GHG protocol, we record these emissions as part of our Scope 1 emissions even though these emissions were not created by Atlantica.
Scope 3 GHG emissions average for the years ended as of December 31, 2023, 2022 and 2021

We have identified the following Scope 3 categories as relevant for Atlantica:
| - | Category 3. Fuel-and-energy-related-activities (not included in Scope 1 or 2): This category is the most relevant for Atlantica and represents 75% of total Scope 3 GHG emissions for the three-year average. It includes upstream emissions of purchased fuels and electricity (well-to-tank), and transmission and distribution (T&D) losses. For the three-year average, 84% of this category is related to ACT, our efficient natural gas asset. |
| - | Category 1. Purchased goods and services: this category includes all upstream (i.e., cradle-to-gate) emissions from the production of products purchased or acquired by the reporting company in the reporting year. Products include both goods (tangible products) and services (intangible products). |
| - | Category 15. Investments: We are accounting for Scopes 1 and 2 emissions generated by the assets in which we do not have financial control. This category corresponds to our investments in our efficient natural gas plant, Monterrey, and one water asset, Honaine. |
Other categories: the rest of our Scope 3 emissions, which in total represent 1%, correspond to Upstream transportation and distribution, Waste generated in operations, Business travel, Employee commuting, Upstream leased assets and Downstream transportation and distribution.
Non-Greenhouse Gas Emissions
| |
|
| Non GHG emissions reduction target: | |
| Reduce non- GHG emissions per kWh of energy generated by 50% by 2035 from a 2020-year base. | |
Atlantica generates (i) nitrogen oxide (NOx), excluding nitrous oxide (N2O) which is computed within the GHG emission calculation, (ii) sulphur dioxide (SO2), and (iii) carbon monoxide (CO). Our efficient natural gas plants in Mexico generate most of these emissions.
NOx, SO2 and CO Emissions as of December 31, 2023, 2022 and 2021
| 2023 | 2022 | 2021 | |||||||
| Tonnes | NOx | SO2 | CO | NOx | SO2 | CO | NOx | SO2 | CO |
| Mexico | 430.4 | 0.0 | 317.6 | 485.5 | 0.0 | 319.1 | 438.9 | 0.0 | 315.5 |
| Spain | 15.0 | 0.6 | 5.8 | 15.1 | 0.6 | 5.9 | 15.4 | 0.6 | 6.0 |
| Algeria | 6.8 | 0.3 | 2.7 | 6.5 | 0.3 | 2.5 | 8.4 | 0.4 | 3.3 |
| Canada | 1.8 | 0.0 | 7.5 | 1.6 | 0.0 | 9.5 | 1.2 | 0.0 | 7.3 |
| Total | 454.0 | 0.9 | 333.6 | 508.7 | 0.9 | 337.0 | 464.0 | 1.0 | 332.0 |
NOx and CO emissions decreased mainly due to lower production at ACT, which resulted in lower emissions.
Our assets do not generate any lead (Pb) or mercury (Hg), and limited amounts of particulate matter (PM), volatile organic compounds (VOC) and hazardous air pollutants (HAP).
Following our long-term commitment to sustainability, in 2022 we set a non-GHG emissions reduction target. We target to reduce our non-GHG emissions10 per kWh of energy generated by 50% by 2035 from a 2020-year base. In 2023, we reduced our NOx, SO2 and CO emissions per kWh of energy generated by 25%, 20% and 27%, respectively, compared to 2020.
10 Non-GHG emissions including nitrogen oxide (NOx), sulfur dioxide (SO2) and carbon monoxide (CO).
Energy Management
In 2023 and 2022 approximately 97% of fuel consumption was related to ACT, our efficient natural gas asset. In 2023, ACT had lower production, resulting in lower fuel consumption. This is the main reason for the decrease in Atlantica’s energy consumption in 2023 compared to 2022.
Energy Consumption and Generation in 2023, 2022 and 2021
| In GWh | 2023 | 2022 | 2021 |
| Consumption of fuel | 7,073 | 7,436 | 7,591 |
| Consumption of Purchased Electricity for own use | 564 | 569 | 537 |
| Consumption of Self-Generated Renewable Energy | 482 | 474 | 296 |
| Total Energy Consumption | 8,118 | 8,479 | 8,424 |
| Electricity generation | 7,106 | 6,874 | 6,444 |
| Thermal energy generated | 4,516 | 4,616 | 4,092 |
| Total Net Energy Generated1 | 11,622 | 11,490 | 10,536 |
| Total net energy consumption within the organisation2 | (3,504) | (3,012) | (2,112) |
| 1 | Does not include curtailment in wind assets for which we receive compensation. |
| 2 | If negative, energy generation is higher than energy consumption. |
Note: We have revised 2022 and 2021 figures following the new perimeter of consolidation.
Following U.K. energy consumption regulation disclosure, energy consumption in the U.K. was less than 0.001% in both 2023 and 2022.
Reporting our activities under the European Union Taxonomy
| Key facts: | ||
| ✓ | 100% of our activities are EU taxonomy eligible | |
| ✓ | 97% of CapEx invested in sustainable activities according to EU Taxonomy | |
The EU taxonomy regulation describes a framework to classify “green” or “sustainable” economic activities. The EU taxonomy regulation creates a clear framework for the concept of sustainability, exactly defining when a company or enterprise is operating sustainably or environmentally friendly. Compared to their competitors, these companies stand out positively and thus should benefit from higher investments. Thereby, the legislation aims to reward and promote environmentally friendly business practices and technologies. The focus lays on the following six environmental objectives:
| 1. | Climate change mitigation |
| 2. | Climate change adaptation |
| 3. | Sustainable use and protection of water and marine resources |
| 4. | Transition to a circular economy |
| 5. | Pollution prevention and control |
| 6. | Protection and restoration of biodiversity and ecosystems |
To be classified as a sustainable economic activity according to the EU taxonomy regulation, a company must not only contribute to at least one environmental objective but also must not violate the remaining ones. For example, an activity aiming to mitigate the climate but at the same time also negatively affecting biodiversity cannot be classified as sustainable. The classification of an economic activity in terms of sustainability is based on the following four criteria, which are based on the previously mentioned environmental objectives:
| 1. | The economic activity contributes to one of the six environmental objectives. |
| 2. | The economic activity does ‘no significant harm’ (DNSH) to any of the six environmental objectives. |
| 3. | The economic activity meets ‘minimum safeguards’ such as the UN Guiding Principles on Business and Human Rights to not have a negative social impact. |
| 4. | The economic activity complies with the technical screening criteria developed by the EU Technical Expert Group. |
Reporting is not mandatory for Atlantica, but the company voluntarily discloses Revenue, Adjusted EBITDA and CapEx information from our business activities. All our assets are eligible following the EU Taxonomy principles. Activities related to our renewable energy assets (wind and solar), storage assets and transmission lines, representing 78% of our revenue and 97% of our CapEx, are aligned with the EU Taxonomy objectives.
The following assets do not meet the EU Taxonomy thresholds to be considered as aligned activities:
| - | Coso: our geothermal asset lifecycle GHG emissions were not proven to be below the threshold established by the Taxonomy (100 gCO2e per kWh generated). The area where our asset is located releases GHG emissions to the atmosphere, mostly in the form of CO2 that already exists and is released progressively in a natural process. With our activity, we are accelerating this process of release of already existing CO2. |
| - | Calgary district heating: although district heating is recognized as a key measure for cities to reduce emissions according to UN Environment Program, our asset in Canada does not comply with the EU Taxonomy criterion since its emissions are above 100 gCO2e per kWh of heat generated. We are analysing potential initiatives to reduce emissions. |
| - | ACT: its GHG emissions are over the life-cycle emissions threshold established by the EU Taxonomy (100 gCO2e per kWh of heat generated). |
| - | Water assets: these assets do not comply with the GHG emissions threshold established by the Taxonomy for this activity (1,080 gCO2e/m3 of freshwater produced) due to the electricity consumption, which generates Scope 2 emissions. The assets are located in Algeria, a country where most of the electricity is generated with fossil fuels, which implies a high factor for the calculation of Scope 2 emissions. |
As described above, 100% of our Revenue, Adjusted EBITDA and CapEx as of December 31, 2023, 2022 and 2021 is eligible following the EU Taxonomy. The table below summarises the amount of U.S. Dollars that are considered Eligible and Aligned to the European Union Taxonomy and the % of aligned activities:
|
Eligible Activities $ in Millions |
Aligned Activities $ in Millions |
Aligned Activities % |
||
| 2023 | Revenue | 1,099.9 | 856.4 | 78% |
| Adjusted EBITDA | 794.3 | 643.1 | 81% | |
| CapEx2 | 113.5 | 110.5 | 97% | |
| 20221 | Revenue | 1,102.0 | 862.0 | 78% |
| Adjusted EBITDA | 797.1 | 645.0 | 81% | |
| CapEx2 | 126.4 | 122.8 | 97% | |
| 20211 | Revenue | 1,211.8 | 976.8 | 81% |
| Adjusted EBITDA | 824.4 | 659.1 | 80% | |
| CapEx2 | 409.2 | 262.7 | 64% |
| 1 | We have revised 2022 and 2021 figures following the updated 2023 classification. |
| 2 | We are considering investing activities as per disclosed in the Cash Flow statement for years ended December 31, 2023, 2022 and 2021, respectively. We refer to our Annual Report on form 20-F filed with the SEC on March 1, 2024 (Notes 5, 6 and 7 from the Financial Statements). |
Water Management
| Water Consumption Target: |
| Reduce our water consumption per kWh of energy generated by 50% by 2035 from a 2020 base year. |
| Key facts: | ||
|
|
✓ |
5th consecutive year withdrawing less than 60% of water available under existing permits
|
|
|
✓ |
Reduced our water consumption by 4% at our assets in operation in 2023 vs. 2022
|
Atlantica is committed to using water efficiently in its operations. This covers two main types of water use:
| 1. | Power generation in the assets that use cycled water in the turbine circuit and in refrigeration processes. |
| 2. | Generation of drinking water for local communities and industries through the desalination of sea water. |
We are also committed to: (i) calculating and monitoring our water usage and promoting rational and sustainable use of water in compliance with our Environmental Policy, (ii) limiting water consumption as much as possible and operating our assets using an amount of water well below legal limits, and (iii) continuing to improve our water management beyond compliance. We aim to reduce the water consumption of our plants over time.
We generally have water permits at our assets that limit total water withdrawals. We operate our assets well below these limits.
Risk Assessment
Atlantica’s risk assessment includes management of water risks. These water-associated risks could be potentially material to many of our generation and water desalination assets. We refer to the TCFD section for additional details on water-related risks.
Our local asset management teams systematically track and monitor water availability as a key KPI. Our internal operations team performs annual audits of our assets aimed at reviewing compliance with our best practices, identifying and mitigating risks, and promoting constant improvement. These audits cover a broad range of areas, including water management.
Regarding regulatory changes, we have local legal teams in each geography who work generally with the support of local external lawyers. Our local internal and external lawyers are in close contact with the regulation and potential regulation changes in each geography. These, together with the asset managers, monitor any potential regulatory change.
We participate in integrated watershed management initiatives in certain key asset locations. For example, in Spain, we (i) participate in the Drainage Commission meetings and in the Watershed Governing Board, (ii) have regular or as-needed meetings with the Hydrographic Confederations to address specific water matters. In addition, we test water samples at reservoirs to verify the quality of the water discharged and to comply with total water withdrawal requirements permitted under the existing regulatory limits.
Water Used in Power Generation Assets
Renewable Energy Assets
Some of our renewable assets use water in their power generation process. These plants use water for cooling condensers during power generation. We withdraw fresh water primarily from rivers and aquifers. The Company holds permits to withdraw water from these sources and adheres to regulations on water quality. The difference between water withdrawn from and returned to its source is our water consumption which occurs because of evaporation.
We measure the water we withdraw and return using the installed water metres on the plants’ pumping equipment. The reported volumes represent the total readings measured by the water metres at all our assets without adjusting for our economic interest in the assets.
The water metres are sealed and are normally subject to audit by the inspector representing the local water authorities. We comply with the requirements and regulations of the applicable local regulatory authorities in the areas in which we operate. We regularly report the results of our water statistics to the local water agencies.
We have implemented initiatives to reduce our water consumption. For example, we have installed an air-dry cooling system, instead of cooling towers, to refrigerate the condensers at one of our plants.
Efficient Natural Gas Plant
ACT is an efficient natural gas cogeneration facility which produces electricity and steam, with a rated capacity of approximately 300 MW and between 550 and 800 metric tonnes per hour of steam.
The water necessary to operate the plant is withdrawn and supplied by our client. The water received is transformed to high pressure steam through heat recovery steam generators and delivered back to the client.
The following charts set out water management KPIs for power generation assets for 2021, 2022 and 2023:
| Power Generation assets water management |

Note: We have revised 2022 and 2021 figures following the new perimeter of consolidation.
Water Consumption per MWh

Water Withdrawal and Discharges in millions of m3

In 2023 we had seven power generation assets located in extremely high or high baseline water stress areas as classified by the World Resources Institute’s (WRI) Aqueduct Water Risk Atlas Tool. Mojave and Coso, our solar and geothermal plants located in California, were also located in high baseline water stress areas in 2022 and 2021. In 2023, following the World Resources Institute’s (WRI) Aqueduct Water Risk Atlas Tool, these assets’ locations were classified as “arid and low water use”, therefore, they are no longer classified as assets located in high or extremely high baseline water stress areas.
Extremely High or High Baseline Water Stress Areas of our Generating Assets
| Generating Asset | Technology | Geography | Baseline Water Stress Areas |
| Helioenergy | Solar | EMEA | Extremely High |
| Helios | Solar | EMEA | Extremely High |
| PS | Solar | EMEA | Extremely High |
| Solacor | Solar | EMEA | Extremely High |
| Solnova | Solar | EMEA | Extremely High |
| Solaben | Solar | EMEA | High |
| Solana | Solar | North America | High |
| Note: we have excluded solar PV assets as these consume minimum amounts of water. | |||
Withdrawal by Water Source in 2023, 2022 and 2021- Power generation assets
| 2023 | 2022 | 2021 | ||||
| Water | Water | Water | ||||
| In millions of m3 | All areas | stress | All areas | stress | All areas | stress |
| areas1 | areas | areas | ||||
| Surface water | 6.1 | 6.0 | 6.3 | 6.2 | 6.9 | 6.8 |
| Fresh water | 4.8 | 4.7 | 5.1 | 5.0 | 5.7 | 5.6 |
| Other water | 1.3 | 1.3 | 1.2 | 1.2 | 1.2 | 1.2 |
| Groundwater | 5.5 | 3.6 | 5.8 | 5.8 | 5.5 | 5.5 |
| Fresh water | 0.2 | 0.2 | 0.2 | 0.2 | - | - |
| Other water | 5.3 | 3.4 | 5.6 | 5.6 | 5.5 | 5.5 |
| Third-party water2 | 5.4 | - | 5.6 | - | 4.9 | - |
| Fresh water | 5.4 | - | 5.6 | - | 4.9 | - |
| Other water | - | - | - | - | - | - |
| Produced Water | - | - | - | - | - | - |
| Fresh water | - | - | - | - | - | - |
| Other water | - | - | - | - | - | - |
| Total power generation |
17.0 | 9.6 | 17.7 | 12.0 | 17.3 | 12.3 |
| 1 | High or extremely high water stress areas according to the 2023 Aqueduct Water Risk Atlas classification. |
| 2 | Third-party water corresponds to surface water withdrawn and supplied by our client. |
All water withdrawals intended for use in power generation are generally strictly regulated by government authorities, which issue the permits and determine the maximum permitted withdrawal volumes.
After use in cooling and other auxiliary processes, approximately 29% of the water withdrawn at our solar facilities is returned. At ACT, the water we receive from our offtaker is transformed into high pressure steam through heat recovery steam generators and delivered back to the client.
Discharge by Water Source in 2023, 2022 and 2021- Power generation assets
| 2023 | 2022 | 2021 | ||||
| Water | Water | Water | ||||
| In millions of m3 | All areas | stress | All areas | stress | All areas | stress |
| areas1 | areas | areas | ||||
| Surface water | 1.8 | 1.8 | 1.9 | 1.8 | 2.1 | 2.1 |
| Fresh water | 1.1 | 1.1 | 1.5 | 1.4 | 1.7 | 1.7 |
| Other water | 0.7 | 0.7 | 0.4 | 0.4 | 0.4 | 0.4 |
| Groundwater | 0.2 | 0.2 | 0.2 | 0.2 | 0.2 | 0.2 |
| Fresh water | - | - | - | - | - | - |
| Other water | 0.2 | 0.2 | 0.2 | 0.2 | 0.2 | 0.2 |
| Third-party water | - | - | - | - | - | - |
| Fresh water | - | - | - | - | - | - |
| Other water | - | - | - | - | - | - |
| Produced Water | - | - | - | - | - | - |
| Fresh water | - | - | - | - | - | - |
| Other water | - | - | - | - | - | - |
| Total power generation |
2.0 | 2.0 | 2.1 | 2.0 | 2.3 | 2.3 |
| 1 | High or extremely high water stress areas according to the 2023 Aqueduct Water Risk Atlas classification. |
The water is treated in accordance with our water permits and then returned to its original source without.
The following table details total water consumption at generating assets, considered as the difference between total water withdrawal and water discharged.
Consumption by Water Source in 2023, 2022 and 2021 - Power generation assets
| 2023 | 2022 | 2021 | ||||
| Water | Water | Water | ||||
| In millions of m3 | All areas | stress | All areas | stress | All areas | stress |
| areas1 | areas | areas | ||||
| Surface water | 4.3 | 4.2 | 4.4 | 4.4 | 4.7 | 4.7 |
| Fresh water | 3.7 | 3.6 | 3.6 | 3.6 | 4.0 | 4.0 |
| Other water | 0.6 | 0.6 | 0.8 | 0.8 | 0.7 | 0.7 |
| Groundwater | 5.3 | 3.4 | 5.6 | 5.6 | 5.4 | 5.4 |
| Fresh water | 0.2 | 0.2 | 0.2 | 0.2 | 0.1 | 0.1 |
| Other water | 5.1 | 3.2 | 5.4 | 5.4 | 5.3 | 5.3 |
| Third-party water | 5.4 | - | 5.6 | - | 4.9 | - |
| Fresh water | 5.4 | - | 5.6 | - | 4.9 | - |
| Other water | - | - | - | - | - | - |
| Produced water | - | - | - | - | - | - |
| Fresh water | - | - | - | - | - | - |
| Other water | - | - | - | - | - | - |
| Total power generation |
15.0 | 7.6 | 15.6 | 10.0 | 15.0 | 10.1 |
1 High or extremely high water stress areas according to the 2023 Aqueduct Water Risk Atlas classification.
Water used in Water Desalination
Some parts of the world are suffering from ongoing drought which, combined with a water supply that is unfit for human consumption, can foster disease and death. Water scarcity also affects food production. The desalination of sea water provides a climate-independent source of drinking water.
We withdraw sea water for desalination as specified in the agreements for our investments in our desalination plants.
In 2023, we withdrew 234.8 million cubic metres of sea water, from which we removed salt and minerals during the desalination process at our water treatment facilities to prepare it for human consumption. The difference between water withdrawn from and returned to the sea is the desalinated potable water delivered to the water utility, as specified by our take-or-pay agreements for the consumption needs of approximately 3 million people. In 2023, we produced 102.3 million cubic metres of desalinated water and returned 132.5 million cubic metres (56%) back to the sea.
Extremely High or High Baseline Water Stress1 Areas of our Water Desalination Assets
| Water Desalination Asset |
Technology | Geography | Baseline Water Stress Areas |
| Tenes | Water desalination | EMEA | Extremely high |
| Skikda | Water desalination | EMEA | Medium-High |
1 Water stress areas classification according to 2023 Aqueduct Water Risk Atlas.
Water Withdrawal, Desalinated Potable Water Production and Discharges in 2023, 2022 and 2021
| In millions of cubic metres | 2023 | 2022 | 2021 |
| Water (seawater) withdrawal | 234.8 | 240.4 | 244.5 |
| Desalinated potable water production | 102.3 | 105.2 | 98.0 |
| Water discharges (returned to the sea) | 132.5 | 135.2 | 146.5 |
Note: We have revised 2022 and 2021 figures following the new perimeter of consolidation.
100% of the water withdrawn in 2023, 2022 and 2021 is seawater that does not affect water stress areas.
Waste Management
| Waste management Target: |
| Reduce our hazardous and non-hazardous waste per unit of energy generated by 30% and 40%, respectively, by 2035 from a 2023 base year |
| Key facts: | ||
|
|
✓ |
Hazardous Waste reduction: we reduced 27% our Hazardous Waste in 2023 vs. 2022
|
The Company’s assets produce two main types of waste, hazardous and non-hazardous. Our processes generate hazardous waste through the use of chemical products. Waste that does not contain substances that are potentially harmful to human health or the environment is defined as non-hazardous waste.
Atlantica is committed to reducing waste and has a comprehensive waste management system with controls in place. In 2023, 95% of the waste generated was non-hazardous. Hazardous waste decreased from to 5% from 8% compared to 2022. We continue analysing and implementing new initiatives to reduce our waste.
% of type of waste as of December 31, 2023, 2022 and 2021
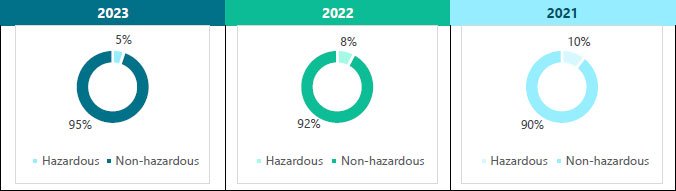
Hazardous Waste
Hazardous Waste Reused, Recycled or Disposed in 2021, 2022 and 2023

Note 1: Diverted from disposal refers to reused or recycled waste, and directed to disposal refers to waste disposed.
Note 2: We have revised 2022 and 2021 figures following the new perimeter of consolidation.
In 2023 we reduced our total hazardous waste by 27% compared to 2022. This reduction was mainly driven by an innovative water treatment system installed at one of our solar assets in Spain. The system uses cutting-edge technology to continuously measure water pollutants. Once a predetermined threshold is reached, it filters the water through activated carbon, separating the contaminated fraction from the water. The remaining water is then treated in accordance with our water permits and returned to its source.
The increase in hazardous waste directed to disposal in 2023 is mainly explained by the removal of the remaining contaminated soil related to an environmental accident that occurred in 2019 at one of our solar assets in Spain. The removal was carried out by a specialised company in accordance with local environmental regulations.
Non-Hazardous Waste
Non-hazardous waste corresponds primarily to the wastewater11 from treatment plants and the reuse of wastewater before discharge. This type of waste does not contain substances that are potentially harmful to human health or the environment. The increase in non-hazardous waste in 2023 is mainly due to higher production at our solar assets in Spain, which resulted in higher wastewater volumes.
Non-Hazardous Waste Reused, Recycled or Disposed in 2021, 2022 and 2023

Note 1: Diverted from disposal refers to reused or recycled waste, and directed to disposal refers to waste disposed.
Note 2: We have revised 2022 and 2021 figures following the new perimeter of consolidation.
Environmental Compliance
We promote the highest environmental standards and a culture of continuous improvement to minimise our environmental risks. Among others, we: (i) have certified our environmental management system (EMS) under ISO 14001, (ii) regularly monitor environmental KPIs, (iii) perform annual environmental audits on our assets to ensure compliance with our best practices, identifying and mitigating risks, and sharing lessons learnt to promote continuous improvement, (iv) have an ERP-software that enables us to have strict control over our assets, (v) have in-house legal and compliance teams supervising compliance with contractual and existing and/or new regulation requirements, and (vi) provide regular environmental training to our employees and contractors working at our plants.
11 Wastewater treatment is the process of improving the quality of wastewater and converting it into an effluent that can be either returned to the nature or incorporated to the water cycle with minimum environmental issues or that can be reused.
In 2023, we had two instances of non-compliance that were resolved with a non-material sanction ($6 thousand). In 2022, we had one instance of non-compliance that was resolved with a non-material sanction ($800). In 2021, we had one instance of non-compliance that was resolved without sanction and two that were resolved with non-immaterial sanction ($7 thousand).
| Number of Accidents by | Total Volume of Spills | Fines and Penalties | |||||||||
| Category | |||||||||||
| Severity | 2023 | 2022 | 2021 | Litres | 2023 | 2022 | 2021 | USD ‘000s | 2023 | 2022 | 2021 |
| Moderate | 7 | 8 | 9 | Volume of spills |
2,829 | 4,146 | 2,829 | Fines and penalties2 |
6 | 1 | 7 |
| High | 0 | 0 | 11 | ||||||||
| 1 | In 2021, the high severity accident corresponds to Monterrey, an associate where we do not have control. |
| 2 | The fines and penalties paid vary from year-to-year depending on the nature of the violation and the timing of its resolution. |
In 2023, we had 7 moderate accidents related to one paint spill at one of Rioglass factories, four spills at one of our solar plants in the U.S. and two spills at our solar plant in South Africa. All spills were managed as hazardous waste by certified third parties and are included in our waste KPIs.
We consider all environmental fines and penalties over the period 2021-2023 to be non-material.
Biodiversity
| Key facts: | ||
|
|
✓ |
Proactive approach to protect flora and fauna in proximity to our assets
|
|
|
✓ |
339 hectares reforested with native tree and shrub species
|
The protection of the ecosystem is a critical issue for global sustainability; we intend to promote its conservation as an essential means for environmental, economic and social progress.
We are aware that our assets interact with various ecosystems, landscapes and species. The Company therefore commits to promoting biodiversity, allowing balanced co-existence, and conserving, protecting and promoting the natural ecosystem.
Atlantica’s strategy for biodiversity conservation aligns with the Kunming-Montreal global biodiversity framework, embracing the mission of taking urgent action to halt and reverse biodiversity loss by 2030.
In particular12, we are committed to:
| ● | Achieving “no net loss” of biodiversity and “no net deforestation” in the areas where we operate in all project phases through the application of the Mitigation Hierarchy13. |
| ● | Seeking to avoid operational activities in close proximity to World Heritage areas and IUCN Category I-IV protected areas. |
| ● | Including biodiversity in the analysis, management and reporting of risks. |
| ● | Minimising potential indirect impacts throughout our supply chain by including biodiversity-related risks in the sustainability assessment of our suppliers. |
| ● | Respecting the rights of Indigenous peoples and local communities and acknowledging their contribution to biodiversity conservation. |
In addition, we also have various tools to help manage our biodiversity matters:
| ● | Strict control of GHG and non-GHG emissions, water, and hazardous and non-hazardous waste. We expect our measures to reduce emissions, water consumption and waste, to minimise biodiversity impacts. |
| ● | Quality and environmental management systems certified under ISO 9001 and 14001, respectively. |
| ● | Existing consultation guidelines with local communities that enable us to identify and manage local stakeholders and communities of interest, including potential biodiversity matters. |
| ● | Asset managers and the compliance, internal audit and legal corporate teams who regularly supervise asset contractual obligations, including biodiversity covenants. |
| ● | Atlantica’s Geographic Committees are held once a month between Geographic VPs and heads of several corporate functions to update and discuss key asset matters. |
12 For more information, please refer to our Biodiversity Policy, available at https://www.atlantica.com/.
13 The mitigation hierarchy is comprised of a sequence of four steps: (a) Avoidance, (b) Minimisation, (c) Restoration, and (d) Offsets.
| a) | Avoidance: Measures taken to anticipate and prevent the creation of impacts. For avoidance to be effective, biodiversity risks need to be identified early in the project planning stages. It is the most important step of the mitigation hierarchy. |
| b) | Minimisation: Measures taken to reduce the duration, intensity and/or extent of impacts that cannot be completely avoided, as far as is practically feasible. Typically undertaken either in the construction or operational stages. |
| c) | Restoration: Measures aimed at repairing specific biodiversity features or ecosystem services damaged by project impacts that could not be completely avoided or minimised. Typically undertaken during construction or decommissioning. |
| d) | Offset: Measures taken to compensate for significant adverse residual impacts. |
Assets under construction
In our sector, environmental impact assessments are typically prepared in the design and construction stages, where opportunities for impact avoidance are far greater as siting and design may be influenced. During 2023 most of our assets were in operation and as of December 31, 2023 we had seven projects under construction. In these projects, in addition of complying with permitting, laws and regulations in-place, we have implemented several measures to minimise potential impacts on biodiversity. These include:
| ✓ | Perform thorough biodiversity impact assessments to ensure all potential risks and impacts are adequately evaluated. |
| ✓ | Analyse alternatives to avoid placing new infrastructure in protected areas or areas with a high biodiversity value. |
| ✓ | Minimise potential impacts on biodiversity. |
| ✓ | In the case of biodiversity residual impacts, implement compensatory works according to the commitment of “No Net Loss” of biodiversity and “No Net Deforestation”. |
| ✓ | Respect the rights of Indigenous peoples and local communities and acknowledge their contribution to biodiversity conservation. |
Assets in operation
Some of our solar plants are close to protected areas, while two of our transmission lines cross some areas that are also considered protected. These assets comply with all applicable regulations and are managed in accordance with our commitment to protecting biodiversity and respecting the rights of Indigenous peoples and local communities. Our strategy includes:
| ✓ | Working to meet or exceed laws and regulations related to biodiversity. |
| ✓ | Applying a preventive approach to minimize impacts. |
| ✓ | Performing environmental risk audits to identify and evaluate potential environmental risks that may arise from our activities. |
| ✓ | Identifying and implementing best practices appropriately. |
| ✓ | Collaborating with governments, local communities, civil organizations and other biodiversity stakeholders in biodiversity conservation, awareness and research, when appropriate. |
| ✓ | Transparently disclosing potential impacts and reporting key measures taken on biodiversity. |
| Asset | Location | Technology | Size |
Type of Biodiversity |
Protection Status | |||||||||
| Helios 1 & 2 | Near a protected area: “Tablas de Daimiel” | Solar Generation | 2x50MW | Wetland | National Park | |||||||||
|
Solnovas 1 & 3 & 4 and Solaben 2 & 3, 1 & 6 |
Near zones of special protection for birds | Solar Generation |
3x50MW 4x50MW
|
Birds | Zones of Special Protection of birds as per Spanish Administration | |||||||||
| ATN |
Our transmission lines cross three zones: (1) National Reserve Junin, (2) National Park Huascaran, (3) Hunt reserve Sunchubamba |
Transmission Line | 379 miles in total | Terrestrial | (1) National Reserve (2) National Park (3) Hunt reserve |
|||||||||
| Palmucho | Our transmission line crosses the National Reserve Altos de Pemehue | Transmission Line | 2 miles | Terrestrial | National Reserve | |||||||||
Typical potential biodiversity impacts caused by operational renewable energy assets include: (1) solar assets (i) barrier effects (assets occupying large landscapes and/or fences acting as a barrier), (ii) pollution (dust, light, noise and vibration, solid/liquid waste), (iii) habitat degradation due to changes in hydrology and water availability and quality, (iv) wildlife mortality due to attraction to evaporation ponds, (v) bird collisions (with solar panels), and bird mortality, (2) wind assets (i) barrier effects (assets occupying large landscapes and/or fences acting as a barrier), (ii) pollution (dust, light, noise and vibration, solid/liquid waste), and (iii) bird and bat collisions with turbine blades, (3) geothermal assets (i) noise and sight pollution, (ii) gas emissions.
We have implemented controls aligned with the mitigation hierarchy approach to minimise our potential biodiversity impacts.
|
Project Phase |
Mitigation Hierarchy | Controls | ||
| Construction and operational phase | Minimisation |
- Abatement controls: steps taken to reduce levels of pollutants (e.g., light, noise, gases or liquids) that could have negative biodiversity impacts. - Operational controls: measures taken to manage and regulate the actions of people, including project employees and contractors. - Physical controls: adapting the physical design of project infrastructure to reduce potential
impacts. |
Some specific examples during the operational phase include:
|
Technology
|
Control | Measure | Receptor | Description | ||||
| Solar | Physical | Modify security fencing to minimise barrier effects | Small- and medium-sized animals |
Modifications to fencing to facilitate animal movement | ||||
| Solar | Abatement | Reduce water use | General | Employ dry instead of wet cooling and cleaning technologies at some solar assets, such as air cooling (dry cooling and cleaning) | ||||
| Solar | Physical | Prevent drowning or poisoning of wildlife | All wildlife | Fencing to keep wildlife away from ponds | ||||
| Wind | Physical | Reduce collision risk | Birds | Shut down wind turbines on demand |
At Atlantica, we also consider reforestation as a measure to improve flora and fauna in those geographies where we operate.
Our summarised biodiversity strategy by geography is:
| Strategic Areas | ||||||
| Protection of Fauna |
Protection and Management of Vegetation |
Protection of Impacts to Water |
||||
| U.S. | ✓ | ✓ | ✓ | |||
| Colombia | ✓ | ✓ | - | |||
| Uruguay | ✓ | - | - | |||
| Spain | ✓ | ✓ | ✓ | |||
| Italy | ✓ | ✓ | - | |||
| Algeria | - | ✓ | - | |||
2023 key biodiversity initiatives by technology and geography were:
Solar Assets
United States
At Mojave, we continue to monitor and survey the protected Mojave Desert tortoise, gopherus agassizii, golden eagle, burrowing owl, American badger, desert fox and Mojave ground squirrel. For example, the plant has a desert tortoise exclusion fence clearance survey and translocation plan. These conditions were established by the California Energy Commission (CEC) for the approval of the Mojave solar plant. In 2022, we invested $34 thousand to repair one of the tortoise guards on Harper Lake Road to assure safety of the tortoises.
We have also set up measures to protect birds and animals from potential damage caused by our evaporation ponds, if they drank evaporated pond water, which is high in salt minerals. We hired third party biologists and environmental specialists to continuously study the behaviour of local and migrating birds and animals to protect them by actively deterring them from the evaporation ponds. We use various avian deterrents approved by the CEC. Among these deterrents are the emissions of noises resembling their predators, water spraying, and “eagle eyes”. We also installed two nets at the cooling tower at our facility in Mojave. These nets follow recommendations of and have been approved by the California Energy Commission (CEC) and are part of our commitment to avoid bird fatalities at the plant. Our specialists continue to identify ways to protect birds and animals, and always do so in coordination with the CEC. According to our approved Bird Monitoring Study that complies with condition BIO-17, we continuously monitor bird life at and around the Mojave project, survey collected dead birds and transfer bird carcasses found to local authorities within the surrounding area of the plant for further autopsies to determine cause of death. We have not had any violations or non-compliance in this respect in the past three years.
Two evaporation ponds are currently netted and the netting of the remaining two ponds is underway and scheduled for completion in April 2024. In addition, we continue to support the “Wetland and Wildlife Care Centre” programme, a non-profit organisation that takes care of the rehabilitation and release of native wildlife. We consider this sponsorship very important as they treat any injured wildlife we might bring to them, which in some cases are species considered to be endangered.
At our Solana plant in Arizona, we continue to control the flora and fauna of the natural wash area located north of our solar plant. We annually send approximately 477-acre feet of water to the Bull Durham Wash as a minimisation action after the nearby farmland changed to industrial use. By doing so, many birds are now stopping in this wash as opposed to our evaporation ponds while minimizing the impact of industrial farmland located nearby.

At our Coso geothermal facility, we perform quadrennial studies on the endangered Mojave Ground Squirrel. This includes trapping and tagging the local population for monitoring purposes, and production of reports to document findings. Also, although the Coso area has not been designated as a desert tortoise habitat, all personnel are trained to address tortoise encounters in the unlikely event they occur. Additionally, studies are performed to monitor any potential impact due to the cooling tower drift on the vegetation or wildlife near the facility.
Spain
In 2023, we continued to deliver on our reforestation programme in Spain. The main initiatives include:
| ● | Reforestation of approximately 48 hectares with 8,800 holm oaks, 4,500 quercus coccifera and small plants. Total investment amounted to $238 thousand. |
| ● | We invested $207 thousand in the maintenance of all the areas reforested in previous years, covering a total surface of 339 hectares. Maintenance includes irrigation, straightening, cleaning of tree pits and replacement of damaged trees. |

Furthermore, we continued to collaborate with local administrations in Spain to protect species, including vultures (aegypius monachus), eagles (aquila adalberti) and other steppe birds settled close to our plants. We donated approximately $89 thousand to provide food and participated in the census and monitoring of these birds aimed at locating the birds’ nesting areas on private agricultural land.
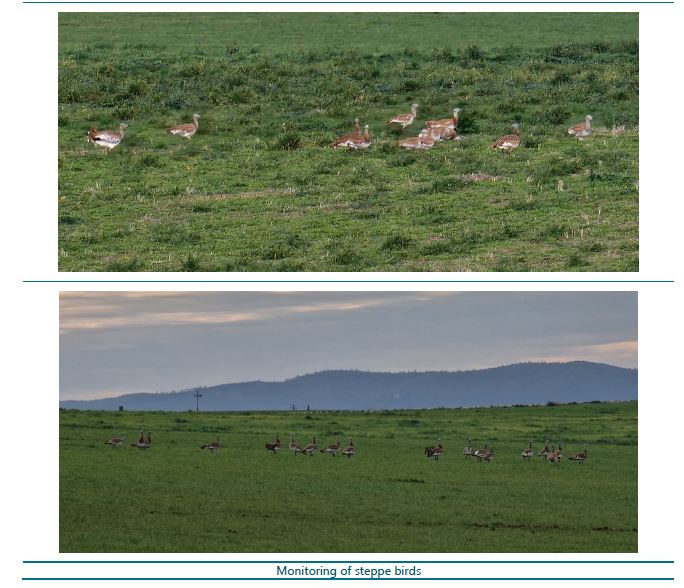
Italy
None of our solar PV assets in Italy are close to protected areas. We have put voluntary biodiversity initiatives in-place including: (i) vegetation control activities without using pesticides, and (ii) security fences that facilitate animal movement, thus minimizing barrier effects.

Wind Assets
Uruguay
We constantly monitor and report on the impact of spinning blades on local species of birds at our three wind farms in Uruguay. The scientific monitoring studies are performed by independent biodiversity consultants contracted by our projects. Studies cover a census of birds to analyse bird mortality and monitor the protected birds, including the black-chested buzzard-eagle (Geranoaetus melanoleucus), the loica pampeana, the black-and-white monjita (xolmis dominicanus), and the straight-billed reedhaunter (limnoctites rectirostris).
At Cadonal and Palmatir, we have implemented an enhanced monitoring system to manage and mitigate the mortality of endangered species. In particular, we have an alarm protocol to shutdown selective turbines on demand to minimise the black-chested buzzard-eagle’s risk of collision with spinning blades.
Summarised Protocol
| Alarm level | Black-chested buzzard-eagle at risk | Procedure |
| Red | Black-chested buzzard-eagle flying <300 metres from wind turbines. | Immediate turbine(s) shutdown. |
| Orange | Black-chested buzzard-eagle flying between 300 and 500 metres from wind turbines. | Prepare turbine(s) shutdown. |
| Yellow | Black-chested buzzard-eagle flying >500 metres from wind turbines and within the wind farm perimeter. | On-hold. |
| Green | Black-chested buzzard-eagle is no longer at risk. It is >500 metres from wind turbines and outside the wind farm perimeter. | No further action required. |
Note 1: Different alarm levels can be triggered consecutively.
Note 2: Employees receive specific training to correctly identify black-chested buzzard-eagle vs. other similar birds.
In 2023, 2022 and 2021, we did not record any black-chested buzzard-eagle mortal event caused by collisions with wind turbines.
On a yearly basis, Atlantica’s wind assets in Uruguay develop an Environmental Operation Management Plan (PGAO) that identifies all potential impacts and mitigation measures related to biodiversity protection.
In addition, each asset prepares monthly and annual reports on the measures taken and the progress made to protect animals living in and around the facilities. The report is then sent to the National Department of Quality and Environmental Assessment (DINACEA), which verifies that all procedures have been carried out in accordance with applicable environmental regulations.

Water Desalination Assets
In August 2023, together with local associations and authorities, we organised the clean-up of a beach located approximately 20 miles from one of our assets. The beach is close to a Ramsar site. Many volunteers participated in the initiative, including families with children of different ages, and we took advantage of the event to raise awareness about the importance of clean coasts for the conservation of marine species.
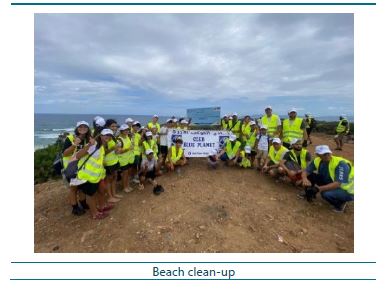
Social Sustainability
Human Rights
At Atlantica, we respect internationally recognised human rights, as set out in the International Bill of Human Rights and the International Labour Organisation´s (ILO) Declaration on Fundamental Principles and Rights at Work, and the OECD Due Diligence Guidance for Multinational Enterprises.
We seek to identify or mitigate any type of violations of human rights that are directly or indirectly linked to our operations, products or services. Labour practices at Atlantica, including our employees and directors, are governed by our Human Rights Policy. This Policy aims to ensure respect for human rights in all our day-to-day activities – regardless of local practices – implementing the commitments defined by our policies and international reference standards, directives and conventions, and establishing the procedures to ensure compliance with them. In our Human Rights Policy, we state that Atlantica’s principles are:
| ✓ | Rejecting forced labour and child labour, |
| ✓ | Rejecting discrimination, |
| ✓ | Providing just, favourable and safe working conditions |
| ✓ | Freedom of association and right to collective bargaining |
| ✓ | Equal remuneration |
| ✓ | Respecting rights of local communities |
| ✓ | Rejecting human trafficking |
We also have a Code of Conduct, Supplier Code of Conduct, Corporate Governance Guidelines and an Anti-Bribery and Anti-Corruption Policy to identify and mitigate any type of violations of human rights that might be linked to our operations, products or services and by our business relationships.
In addition, we have a Diversity and Inclusion Policy to formalise our zero tolerance to discrimination against anyone based on any personal characteristic, such as ethnic background, culture, religion, age, disability, gender, marital status, sexual orientation, union membership, political affiliation, health, disability, pregnancy, or any other characteristic protected by law. We seek to provide a climate of confidence where employees can raise issues. Any behaviour which is not acceptable must be reported through the Ethic Channels that Atlantica has established to report any kind of abuse.
Furthermore, we acknowledge the rights of workers to collectively bargain the terms and conditions of work as defined by international reference standards, directives and conventions. Collective bargaining refers to all negotiations which take place between the employer on the one hand, and one or more workers’ organisations (trade unions), on the other, for determining working conditions and terms of employment or for regulating relations between employers and workers. Additional information on collective bargaining is disclosed in the People and Culture section.
Measures to prevent human rights misconduct
Atlantica’s management has implemented different measures to identify, assess and mitigate potential human rights-related risks. These include:
Human Rights due diligence:
| - | The Internal Compliance team reviews human rights-related matters as part of their annual due diligence activities. The compliance team is responsible for monitoring that human rights are internally respected, providing human rights related training to our employees, and assessing the supply chain across the jurisdictions in which we operate to identify any potential breach. Additional information on compliance training is disclosed in the Business Ethics section. Information on our supply chain is disclosed in the Anti Modern Slavery & Human Trafficking Statement available on our website and in the Supply Chain Management Section, part of the Strategic Report. |
| - | The Investment Committee reviews, as part of its due diligence when acquiring new assets, that the asset and/or the potential investment partner have not had any human rights incidents or sanctions. |
In addition , we perform the following activities across different areas of the Company to prevent any misconduct related with human rights:
| - | Risk management: The Head of Risk Management reviews risk management processes, procedures and tools implemented by the Company, including human rights-related risks affecting our operating portfolio as well as assets under development or under construction. Atlantica’s Risk Map is reviewed by the Risk Management Committee and presented to the Board on a quarterly basis. Additional information on our risk management function is disclosed in the Sustainability Governance section. |
| - | Health and Safety: The Corporate Operations team audits health and safety procedures at the asset level, as well as operational and environmental performance to implement insights gained and best practices. Additional information is provided on the Health and Safety Asset Management sections. |
| - | Rights of local communities: Our Geographic VPs and local asset managers lead community relations, including monitoring community matters and their development. Additional information on local communities is disclosed in the Local Communities section. |
| - | Supply Chain: An internal and/or external evaluation of our vendors before being hired and a regular review thereafter. Additional information is disclosed in the Supply Chain Management section. |
| - | Data Protection: Regular internal and external audits to review compliance with data protection rules and regulations. Additional information is disclosed in the Cybersecurity and Data Privacy section. |
We have also established communication pathways with our stakeholders. The Ethic Channels include the whistleblower channel and the compliance channel and we encourage their use. Additional information on our communication channels is disclosed in the Business Ethics section.
Additional Information
| − | Partners - We have partners at some of our assets. In the assets where we do not have control, to the extent possible, considering Atlantica’s ownership interest, we try to introduce our business ethics practices, including our human rights-related practices. |
| − | Incidents - We confirm that no human rights incidents were reported or identified during 2023, 2022 or 2021. Atlantica has zero tolerance for modern slavery, and we confirm that no incidents of modern slavery were reported or identified during 2023, 2022 or 2021. |
| − | Training - Training was provided in 2023, 2022 and 2021 to our employees about our Code of Conduct and corporate policies through our online training platform, in-person training, and/or real-time video conferencing. This includes the Anti-Corruption Policy, Anti-Money Laundering Policy, Equality, Harassment Prevention and specific content related to human and labour rights, in order to promote the Human Rights Policy throughout our organisation and FCPA We refer to the Governance Section, Business Ethics, for more detail of the trainings provided to our employees in 2023. |
| − | Policies acknowledgement by employees - All our employees must annually read, understand, and commit to following our Code of Conduct and all our policies. |
We plan to continue analysing, implementing and reporting initiatives to improve our human rights procedures going forward.
In May 2023, our Board of Directors amended and approved our “U.K. Anti-Modern Slavery and Human Trafficking Statement” under the Modern Slavery Act, 2015. The statement, available on www.atlantica.com, outlines the steps taken by the Company to address the risk of slavery and human trafficking occurring within our operations and supply chains.
Supply Chain Management
Supplier Code of Conduct
Atlantica’s Suppliers Code of Conduct, which is part of the corporate governance documents, was approved by the Board of Directors in 2017 and was last amended in February 2022. The Supplier Code of Conduct is publicly available at our website, and we expect that all suppliers meet the requirements herein included. Atlantica’s Board is responsible for the effective oversight of the Company’s strategy and performance, including ESG and climate-related risks and opportunities. Therefore, the Board is the highest accountable decision-making body for the oversight and implementation of the supplier ESG program.
In 2023 and 2022 ~100% of our suppliers adhered to our Supplier Code of Conduct.
Our Supply Chain Strategy
Atlantica has a Purchasing and General and Administrative Expenses Policy that was last amended in 2023. This policy applies to the management and operation of assets as well as to general expenses of Atlantica. It contains the guidelines to ensure that the purchase of all goods, supplies, external professional services and works are handled according to international purchasing best practices.
| Supply Chain Management Strategy | |
| 1. | Maintaining a resilient and agile supply chain that complies with all rules and regulations, including best practices set out in our Supplier Code of Conduct. |
| 2. | Ensuring that the purchase of all goods, supplies, external professional services and works required to perform our day-to-day activities are performed in a timely, efficient and effective manner. As such, our internal general purchasing policy and standardised procedures are maintained and regularly updated in all our geographies. |
| 3. | Maintaining a comprehensive risk management approach. We seek to reduce purchasing costs over time through new or existing suppliers, while minimizing the potential supply chain risks on our businesses while maintaining ESG standards. As such, vendors are evaluated (internally and/or externally) before being hired and are regularly reviewed thereafter. |
| 4. | Maintaining a robust information system that enables the Purchasing Department to identify business needs, in advance, while being supported by a comprehensive vendor database that includes a multiple-level approval system. |
| 5. | Identifying and implementing international purchasing best practices. |
We provide annual compliance-trainings to all employees who are involved in purchasing, including anti-corruption and anti-bribery practices. We refer to the Business Ethics sections for further details on compliance-related training.
Supplier screening and assessment:
Atlantica has implemented a procedure to screen and assess new suppliers. The procedure describes the “Supplier Qualification Process”, a five-step process that has to be applied to all new suppliers. The Requesting, Risk, Purchasing and Compliance departments participate in this process.

Our initial evaluation is intended to determine the eligibility of a potential new supplier. We analyze the suppliers’ potential risks such as: country, sector, commodity, spending, business relevance, financial situation and solvency or any reputational issues that could potentially affect Atlantica (negative ESG perceptions or risks). The process consists of the following steps:
| 1. | Initial Supplier Evaluation Form: In the first step the supplier has to explicitly agree to adhere to Atlantica’s supplier code of conduct. |
| 2. | The supplier’s technical evaluation is a qualitative assessment in aspects such as the position of the company in the market, management systems in place ISO 9001, 14001, commercial references in the last 5 years as well as other relevant and specific questions from the requesting departments (Operations, Asset Manager, IT etc.). |
| 3. | This step incorporates analysis that are performed simultaneously: (i) the compliance department conducts the compliance due diligence assessment following the terms of the Compliance Due Diligence Protocol, (ii) the Risk Department perform the financial solvency check and (iii) suppliers are assessed based on their ESG performance. |
The assessment of their ESG performance is usually made by an external consultant via desk assessment. We invite the supplier to join Achilles, a third party management tool to evaluate suppliers based on ESG criteria. In certain cases, this evaluation can be replaced by a publicly available rating from international recognized ESG rating agencies, such as S&P Corporate Sustainability Assessment or Ecovadis.
Achilles is a global platform that allows us to evaluate and monitor suppliers based on environment, labor and human rights, ethics and supply chain. This methodology is built on ESG Standards, including GRI, UNGC, ISO 2600. This assessment will provide Atlantica with a rating in each of the four areas.
| a. | Environment (energy consumption, water, pollution, etc.) |
| b. | Labor and human rights (employee health & safety, working conditions, child labor, discrimination and harassment, etc.) |
| c. | Ethics (corruption, anticompetitive practices, responsible information management) |
| d. | Supply Chain (sub-supplier environmental and social practices) |
Ratings range from A+ “Platinum” to D “Low”. Suppliers with a D rating will be monitored annually and the evolution of their ESG rating will be checked every year. If the rating “D” is maintained for 3 consecutive years, the purchasing department will search for an alternative supplier as long as this does not jeopardize the operations of the company.
| 4. | SAP Registration: Atlantica uses SAP, an ERP system, to track suppliers’ general information, purchase orders and payments. As of December 31, 2023, SAP is used at all our assets, with the exception of Italy, some assets in Chile and in our water assets. In 2023 and 2022, companies without SAP represented less than 7% of our total revenue. We believe having one single database of suppliers and a single process for the entire organisation helps to prevent supply chain risk. |
This supplier qualification process is performed for every new potential supplier. In 2023, 2022 and 2021 a 100% of our new Tier 1 suppliers were assessed through the supplier qualification process. In addition, every three years we reassess all our suppliers.
Our suppliers:
| 2023 | 2022 | 2021 | |
| Total Number of suppliers | 3,197 | 2,860 | 2,570 |
| Total Number of critical Tier 1 Suppliers | 231 | 120 | 117 |
| % total spend on critical Tier 1 suppliers | 80% | 70% | 60% |
| Total number of suppliers assessed via desk assessment in ESG | 346 | 168 | 117 |
| % of total spend of assessed suppliers in ESG | ~60% | ~45% | ~51% |
| % of critical Tier 1 suppliers assessed in ESG | 53% | 36% | 43% |
| % of total spend of critical Tier 1 suppliers assessed in ESG | ~68% | ~65% | ~89% |
Our Tier 1 suppliers are those who directly supply goods, materials or services to the Company. Within Tier 1 suppliers, we consider critical Tier 1 suppliers those with a total annual expense equal to or higher than $250 thousand.
The increase in the number of suppliers in 2023 compared to 2022 was mainly due to the: (i) the internalisation of the operation and maintenance services at our solar assets in Spain and at Kaxu, in 2023 and in 2022 and (ii) the increase of the construction activity.
During 2023 we had forty-four assets in operation and eight projects under construction. As we continue to increase our development and construction activities, we have updated our purchasing policies, processes and procedures, and hired additional purchasing personnel to manage a higher number of suppliers in different geographies. Our purchasing team is also preparing a pool of prequalified construction subcontractors in different geographies based on, among others, their experience, costs and health and safety records.
Supply Chain Targets
Following our commitment to supply chain management we have updated our targets:
| Target | Status |
| Internal pre-screening evaluation of new suppliers (i.e., Tier 1 suppliers) | ✓ |
| External supplier evaluation: review 70% of total annual operating expenses (i.e., Tier 1 suppliers) by 2024 year-end1 | On-track |
| Supplier evaluation every three years: internally review 100% of all suppliers every three years (first full year applying this process was in 2023) | On-track |
Spending on Local Suppliers
We acknowledge that our day-to-day activities have impacts on local communities. We foster communities’ economic prosperity through local purchasing and hiring of local employees. We have stakeholder and community development and involvement policies in-place to generate a stable and predictable business environment that enables us to promote local communities environmental, economic and social progress, reduce risks and identify opportunities. The policies are available on our website.
We buy local whenever purchases are made to suppliers from the same country where the service or the material is used. In 2023 and 2022, more than 90% of our total purchases in the geographies where we have assets were made from local suppliers.
Customer Management
We derive our revenue from selling electricity, electric transmission capacity, heat and water desalination capacity. Our customers are mainly comprised of electric utilities and corporations, with which we typically have entered into PPAs. We also have electric systems and government owned electricity and transmission companies as customers. We do not have individuals or retail clients as customers in any of our assets.
Our Geographic VPs and local managers are responsible for managing customers relations. Considering that most of our clients are large electric utilities and corporations in different countries, each geography has implemented its own procedures and consultation guidelines to communicate with customers to manage their needs efficiently and effectively. This usually involves physical meetings or phone calls between our local employees and customers. We have learnt from our “boots-on-the-ground” approach that, in addition to complying with contract obligations, we need to adapt to the local culture.
We have an in-house system that enables us to measure the success of our customer relations. We generally have a very fluid and good rapport with all our clients. We do not have a direct relationship with state-owned electric systems (for example, solar assets in Europe and wind assets in South America), but in those cases, we have relationship with regulators, administrators and the transmission and distribution systems to which we are connected. Considering the limited number of offtakers within our portfolio, we do not have a formal customer survey in place as some integrated electric utilities may have.
We also perform annual reviews with some of our clients to check that we comply with certain key areas. In addition, we have communication channels to report any misconduct, irregularities or instances of non-compliance, including a whistleblower and a compliance channel, as detailed in the Business Ethics section. Furthermore, we leverage on this Integrated Annual Report, social media, press releases and website content to provide additional information to our customers.
Customer-related topics are discussed, on an as-needed basis, in the Business and Geographic Committees, allowing senior corporate management to better assess customer-related matters.
Customer Satisfaction
As of December 31, 2023, we have a small number of customers. As explained above, in some cases, our customer is the national electricity system. We evaluate internally our customer relationships based on a rating scale from 0-10, where 0 is ‘very poor’ and 10 is ‘excellent’.
| Summary internal results by geography | |
| Geography | 2023 |
| North America | 9 |
| South America | 8 |
| EMEA | 9 |
| Average | 8.6 |
Occupational Health and Safety
| Key facts: | ||
|
|
✓ |
Improved all our health and safety indicators vs. 2022
|
|
|
✓ |
LTFI decreased ~40% in 2023 vs. 2022
|
| ✓ |
Maintained health and safety KPIs below sector average
|
|
Atlantica, its Board and its management are committed to prioritising and actively promoting health and safety as a tool to protect the integrity and health of all of our employees and those of our subcontractors at our assets or work centres. We promote a safe operating culture across Atlantica and encourage our subcontractors to adopt a preventive culture across our operation and maintenance activities as reflected in our corporate health and safety policy available on our website.
Health and Safety Management System
Our Health and Safety Management System is ISO 45001 compliant. An external third party (DNV) audits our management system annually. Our ISO 45001 certification is valid until May 2024.
In addition, we perform periodic health and safety audits of our operation and maintenance suppliers to monitor compliance with legal regulations, contractual requirements, and our safety best practices.
Best Practices Implementation
| - | Health and Safety Best Practices The Company’s health and safety best practices programme is a key management tool to standardize safety at all of our assets. It has been in place since 2017 and we regularly update it to include insights gained from our peers, contractors and suppliers. During 2023, we continued to implement new best practices as well as incorporate our best practices at newly acquired assets. |
| - | Stop Work Policy: This policy was approved in June 2023 by the Health and Safety, ESG and Operations Committee. Under this Policy, our employees and subcontractors have the responsibility and the authority to stop works whenever there is a hazardous condition or behaviour that may cause potential harm to the integrity of people, properties and/or the environment, without any retaliation. Following this policy, if the safety of the employees and/ or subcontractors’ employees is determined to be at risk, no work will be carried out until the hazardous event has been resolved. |
| - | Hard hat stickers: In 2023, we launched a program to reinforce our safety programs, trainings and our employees and contractors’ commitment to safety using stickers with safety messages on their hard hats. |

Hazard identification and risk assessment
We have established different mechanisms to identify occupational health and safety hazards, which include the evaluation and prevention of occupational risks, at all our assets. Atlantica has implemented a zero-accident culture and is firmly committed to maintaining it. To do so, Atlantica has integrated health and safety management across all hierarchical levels of the company. Below we detail Atlantica’s initiatives to ensure a safe and healthy work environment:
| - | Stop and Scan: In 2023 we implemented a new procedure to improve hazard identification and injury prevention at all our assets. By putting this new procedure in place, we encourage our employees and subcontractors to proactively participate in their own safety and we promote mutual care between our employees. We aim to expand on the philosophy of stopping and reviewing safety risks that the employee may encounter before engaging in any activity. |
| - | Accident awareness sign boards: We have identified specific locations at our assets where hazards are more likely to occur. In those specific places we have installed accident prevention sign boards indicating the identified hazard. The aim is to warn employees and subcontractors of hazards that have occurred in the past, increase risk perception and prevent complacency. |
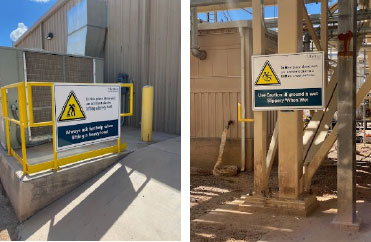
| - | SafeStart programme: In 2023 we continued to implement of the “SafeStart” initiative at our assets in the U.S. and Spain. SafeStart promotes a 24/7 approach. It leverages employees’ natural motivation and provides techniques to reduce injuries at work, at home and on the road. The result is a positive shift in safety attitudes, it increases participation in workplace training and fosters a more robust safety culture. SafeStart is an add-on to our existing health and safety policy, process, and procedures. |
We plan to continue its implementation during 2024 and 2025.
Integration of actions to prepare for and respond to emergency situations:
Emergency procedures are implemented at all our assets. These procedures guarantee a rapid and coordinated response to prevent any harmful situation for our employees and subcontractors. We regularly perform emergency drills at our assets and work centres. In 2023 we also approved and implemented the Stop Work Policy.
| - | Emergency Drills: In 2023 we performed several emergency drills at our work centres across the different geographies where we operate in and 145 emergency drills at our assets and projects under construction. |
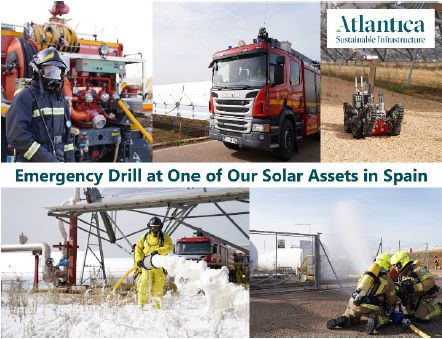
Emergency drill performed at one of our solar assets in Spain, Solaben
Health and Safety Culture and Engagement with our employees
We have also implemented different initiatives to promote health and safety among our employees and subcontractors:
| - | Moving forward in safety culture (Dupont-Bradley): In 2023 we started a new program to assess and improve the safety culture in our Company. By following the Dupont-Bradley Curve we aim to create a culture amongst our employees and subcontractors that encourages them to take care of themselves and their colleagues. |
This Curve defines four stages in safety culture, the starting point is a Reactive phase where organizations do not have a safety system in place, and they act on instinct. The Curve moves to higher levels in organizations that believe that Safety is an important value for the Company.
Our goal is to reach the fourth stage of curve the coming years. This is called the Interdependent Stage which occurs when employees collaborate and support one another, fostering a strong safety culture. This stage is characterized by teamwork and mutual care among employees which leads to the highest level of safety culture within the organization. There is a shared vision, trust, and collaboration when it comes to safety.
| - | Safety awards: We continue to provide (i) quarterly awards to our employees and subcontractors for the best safety observation reported, and (ii) annual award to the best improvement opportunities. |
| - | Safety Day: This is event is organised annually at all of our assets. In 2023 over 900 Atlantica’s employees and subcontractor employees took part. We honoured 80 Atlantica and subcontractor employees with awards for their commitment to safety. |
| - | Why do I work Safe?: In May 2023 we launched an activity at all our assets to increase employees’ commitment for their own safety and their co-worker’s safety. We encouraged our employees to explain the reason why they needed to work safely and prevent them from getting injured. Reasons could be either professional or personal reasons. Answers were shared with colleagues during the Safety Days. It was a good experience that helped our employees understand why employees need to establish safety as their main priority at work. |
We requested their collaboration to answer the question “Why do I work safe?”, using a specific template that was posted on boards in their work centre. This activity was completed during our annual Safety Days, with all the answers being shared between the attendees, which demonstrated the personal reasonings of each person that lead them to make Safety a priority.

2023 Safety Day Pictures
| - | Safety App: We have a mobile safety app for our employees and subcontractor employees to raise safety awareness at all our assets. The app provides valuable information on safety rules, information on the use of personal protective equipment (“PPE”) when carried out hazardous activities, emergency instructions and first aid procedures. It also serves as an important communication channel with internal and external employees working at our assets to improve safety through lessons learned. |
The app also serves as a tool to promote risk awareness and improve safety knowledge. Every month, we use a quiz module to ask questions related to related to “how much do you know about safety?” Atlantica provides monthly awards to quiz winners.
Health and Safety Performance Indicators
During 2023 we had forty-four assets in operation and eight projects under construction or ready to start construction. We intend to increase our construction activities in the upcoming years. Accordingly, and following international best practices, we disclosed our Lost Time Frequency Index (LTFI) and Total Recordable Frequency Index (TRFI) for both assets in operation and assets under-construction. We have revised 2022 and 2021 figures following the new perimeter of consolidation for Health and Safety indicators. (see section “About this report”).
LTFI represents the total number of lost-time accidents recorded, including major injuries (defined as death or serious accidents1), in the last 12 months per 1,000,000 hours worked.
Lost Time Frequency Index (LTFI) in 2021, 2022 and 20231

(1) Lost Time Frequency Index (LTFI) represents the total number of lost-time accidents recorded in the last 12 months per 1,000,000 hours worked. Differs from the KPI generally used in the U.S. which is 200,000 hours worked.
The decrease in LTFI in 2023 was mainly due to a decrease in the number of accidents with lost-time at our assets under construction. Following the increase in 2022, we increased our efforts at our assets under construction by implementing new construction policies, processes, procedures and best practices, as well as performing internal audits to ensure compliance with our existing best practices, promoting continuous improvement and sharing lessons learned between assets. This increase was mainly due to the operation and maintenance employees becoming in-house employees at our assets in Spain and at Kaxu. This move implied switching safety KPIs from the subcontractors to the employee category. The increase is offset by the decrease in the number of accidents by our subcontractors.
1 Serious accidents include severe burns, amputation, paraplegia, tetraplegia, major surgery and state of coma.
Atlantica’s LTFI for the last three years remains below the sector average.
LTFI Below Sector Average2 in 2023, 2022 and 2021

In addition, TRFI represents the total number of recordable accidents with and without lost-time recorded in the last 12 months per 1,000,000 hours worked.
Total Recordable Frequency Index (TRFI) in 2021, 2022 and 2023

Note: Total Recordable Frequency Index (TRFI) represents the total number of accidents, with our without lost time, recorded in the last 12 months per 1,000,000 hours worked. Differs from the KPI generally used in the U.S. which is 200,000 hours worked.
2 Note: The Sector Average is calculated based on the Public National Indices weighted by Atlantica’s actual working hours in each geography. Sources: U.S. and Canada: Bureau of Labour Statistics (2022) and Canada Government (2020); Mexico: Secretaria del Trabajo y Prevision Social (2021); Spain: Instituto Nacional de Estadisticas (2022); Peru, Chile and Colombia: Superintendencia Seguridad Social Chile (2022), Oficina General de Estadística y Tecnologías de la Información y Comunicaciones (2022) and Ministerio de Salud y Protección Social (2022); Uruguay: Banco del Seguros del Estado (2021). For each year, we have taken into consideration the most recent available public information.
The decrease in the TRFI in 2023 was mainly due to the same reasons that explain the decrease in the LTFI previously described.
Atlantica’s TRFI also remained below the sector average.
TRFI Below Sector Average3 in 2021, 2022 and 2023

In 2023 we continued to work on the integration of acquired assets and assets that entered in operation recently in order to implement our safety culture in all locations. We undertook all necessary measures to minimise potential safety impacts, performed specific external and internal audits, issued new safety campaigns and bulletins, improved safety inspections, procedures and training, and granted health and safety bonuses to certain employees to improve supervision.
The fatality performance indicator at our sites or facilities has been zero.
We also monitor near-misses and unsafe acts and unsafe conditions through our Total Recordable Deviation Index (TRDI). This index represents the number of near-misses, unsafe acts and unsafe conditions and first aids recorded over the last 12 months per million hours worked. The goal of this Key Performance Indicator (KPI) is to encourage the identification and communication of near misses and unsafe acts and conditions by our employees and our contractors’ employees. Given the fact that this helps identify risks and implement adequate preventive measures, the higher the performance indicator is, the better.
Total Recordable Deviations Index in 2021, 2022 and 2023
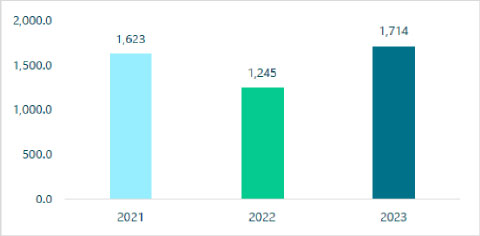
Note: We have revised 2021 and 2022 figures to account for the final
number of near-misses and unsafe acts and conditions, and first aids.
In 2023 our TRDI improved, increasing compared to the previous year. Although identifying near misses and acts and unsafe conditions becomes more difficult year-over-year, in 2023 we were able to increase risk identification thanks to enhanced risk identification processes and communication initiatives at our assets. Our preventive reporting programme, mainly through Walk and Talk, has progressed alongside our other measures to manage and mitigate risks. We believe in the health and safety processes and procedures we have put in place; hence we expect Total Recordable Deviations to remain relatively stable in the future.
3 Note: The Sector Average is calculated based on the Public National Indices weighted by Atlantica’s actual working hours in each geography. Sources: U.S. and Canada: Bureau of Labour Statistics (2022) and Canada Government (2020); Mexico: Secretaria del Trabajo y Prevision Social (2021); Spain, South Africa and Algeria: Instituto Nacional de Estadisticas (2022); Peru, Chile and Colombia: Superintendencia Seguridad Social Chile (2022), Oficina General de Estadística y Tecnologías de la Información y Comunicaciones (2022) and Ministerio de Salud y Protección Social (2022); Uruguay: Banco del Seguros del Estado (2021). For each year, we have taken into consideration the most recent available public information.
We also have a Health and Safety Committee with employee representatives at those assets where the operation and maintenance activities are performed in-house, which represent 74% of our consolidated revenue for the year ended December 31, 2023. At the rest of our assets, our operation and maintenance subcontractors have a Health and Safety Committee run in collaboration with their employees’ representatives. As asset owners, we are regularly informed of the results and findings of these committees.
in the line with GRI requirements, the Occupational Disease Performance indicator, caused by occupational activities that have a high incidence or high risk of specific diseases, stands at zero both for our employees and for our subcontractors’ employees.
People and Culture
| Key facts: | ||
|
|
✓ |
 41% total workforce in 2023 compared to 2022 41% total workforce in 2023 compared to 2022 |
| ✓ |
14% total hours of training per employee in 2023 compared to 2022 |
|
We believe that by providing a healthy working environment for our employees, and by enhancing social and professional development, we will attract and retain valuable employees. Employees are a core component of our present and future success.
Our values and Code of Conduct set out what we expect of all our people. The honesty, integrity and sound judgement of our employees and directors is essential to Atlantica’s reputation and success. We seek employees who have the right skills and who understand and embody the values and expected behaviours that guide our business activity.
Initiatives and Recognitions
| ● | Atlantica is a signatory to the Women’s Empowerment Principles since 2020, a set of good business practices that promote equality between men and women across all areas of the organisation. |
| ● | In compliance with South Africa’s Broad-Based Black Economic Empowerment Program, we targeted our recruitment to local Black citizens. For instance, in 2023 and 2022 over 70% of the employees hired by the O&M supplier of Kaxu were Black citizens, thus exceeding the requirements defined by the Program. We refer to section “Local Communities” for more details. |
| ● | We aim to perform a human capital analysis every 4 years at certain locations. The objective of this analysis is to guarantee equal opportunities to our employees and to promote a culture of diversity and inclusion: |
| - | Preventing any kind of gender discrimination, either direct or indirect. |
| - | Reinforcing Atlantica’s commitment to its employees to ensure equal opportunities and to eradicate any potential conduct that may discriminate any employee due to their gender or family situation. |
| - | Promoting effective equality measures among men and women and guaranteeing the same opportunities when hiring candidates, internal professional development and working conditions for all employees. |
| - | Promoting work-life conciliation and ensuring that such balanced work-life conciliation does not negatively impact employees. |
Atlantica’s Human Capital
Number of Employees per Geography as of December 31, 2021, 2022 and 2023

Our corporate employees support our assets in roles including Operations, Health and Safety, Environment and other certain corporate areas including Corporate Development, Finance, Accounting and Consolidation, Administration, Tax, Internal Audit, People and Culture, Business transformation, Insurance and Legal.
Employees from companies where we do not have financial control are not considered in our total workforce.
Number of Employees by Category as of December 31, 2021, 2022 and 2023

| (1) | Asset Operations mainly consists of employees who perform directly the operation and maintenance activities of our assets in operation and under construction. This category does not include O&M managers. |
| (2) | Assistant and professional employees mainly consist of qualified workers that do not have a university degree and that provide support to different departments such as: purchasing, accounting or IT. |
| (3) | Engineers and graduate employees mainly consist of workers with a university degree. These employees work in different areas such as people and culture, research and development, finance or health and safety. |
| (4) | Middle Management mainly consists of employees who manage a specific area, supervise a group of employees, or are considered key personnel within the organisation. |
In 2023, the number of employees in Atlantica increased by 41% with respect to the previous year. The increase was mostly due to the internalisation of the operation and maintenance services at part of our solar assets in Spain.
| Average Number of Employees by Geography | 2023 | 2022 | 2021 |
| North America | 320 | 306 | 296 |
| South America | 91 | 87 | 61 |
| EMEA | 752 | 360 | 61 |
| Corporate | 141 | 121 | 109 |
| Total | 1,304 | 874 | 527 |
| Average Number of Employees by Category | 2023 | 2022 | 2021 |
| Management | 12 | 13 | 13 |
| Middle Management1 | 125 | 132 | 85 |
| Engineers and Graduates | 287 | 234 | 162 |
| Assistants and Professionals | 65 | 46 | 27 |
| Asset Operations Employees | 815 | 449 | 240 |
| Total | 1,304 | 874 | 527 |
| Average Number of Employees by Gender | 2023 | 2022 | 2021 |
| Male | 1,081 | 696 | 396 |
| Female | 223 | 178 | 131 |
| Total | 1,304 | 874 | 527 |
Communication and engagement with our employees
We use several platforms for people and culture management. These platforms are accessible to all Atlantica employees and allow employees to access and manage their development, performance reviews, benefits, compensation, work-time planning, etc. In 2023 we started the process to implement a single platform globally. In addition:
| - | Our CEO updates Atlantica’s employees on key priorities in open sessions with Q&A at least twice a year. |
| - | We intend to hold Strategic Sessions every two or three years. In these sessions our CEO, CFO and key senior management present Atlantica’s milestones at the corporate and geographic level, key priorities going forward, and highlight the importance of our values, compliance, risk and purchasing process and procedures. The last Strategic Session was held in 2022. |
| - | In 2023, we held a specific Strategic Session where our U.S. and Canadian senior managers analysed key priorities in the geographies under their responsibility. |
| - | Our senior management takes part in our “Atlantica’s Management Model” training to discuss with our employees, excluding those performing operation and maintenance activities, the Company’s long-term strategy and business model, recent milestones, growth strategy, as well as values, policies and procedures. We promote an informal and open environment to foster discussions with employees in groups of less than 20 people. Employees can express their ideas and concerns without evaluation or retaliation. The feedback is analysed and shared with Atlantica’s management in monthly management meetings. Where appropriate, we devise action plans and assign one or several managers responsibility for their implementation. We refer to the Governance section for more details on the management model trainings. |
| - | We periodically publish Atlantica-related news via our internal intranet and LinkedIn. |
| - | We perform an employee climate survey at least every three years to assess employees’ satisfaction. The goal is to receive feedback, as well as engage with our employees. The survey is confidential, managed by a third party, and results are aggregated, shared and discussed with supervisors. The last climate survey was carried out in October 2022. Approximately 78% of employees took part and the general engagement with the Company was 68%. In 2022, Atlantica scored highly in several areas, including employees’ satisfaction with their immediate manager/supervisor. This survey also helped us to identify certain areas for improvement. Management prepared action plans for those areas. The Board was informed of the results of the survey and of the action plans taken by management. |
Employee’s remuneration and Support Programs
We offer a remuneration package that includes monetary and non-monetary compensation. In 2023, 2022 and 2021 we based our compensation policy on these four pillars:
| - | Pre-defined remuneration bands based on market surveys provided by several external consultants for certain positions. |
| - | Annual performance appraisal for most of our employees. Asset operations employees who joined the Company recently as a result of the internalization of the O&M activities in some of our assets have not been included in the annual performance process yet, we plan to include them in 2024. |
| - | Variable compensation based on Company objectives, department and individual objectives. |
| - | Long-term incentive plan for certain employees. |
As of December 31, 2023 and 2022 mean and median compensation for our employees excluding the CEO and the ratio total annual compensation of the CEO to employee’s remuneration was:
| 2023 | 2022 | |||
| Mean | Median | Mean | Median | |
| Employees Remuneration (U.S. Dollars) |
54,781 | 35,882 | 62,869 | 40,959 |
| Ratio total annual | ||||
| compensation CEO to | 32.4 | 49.4 | 26.4 | 40.5 |
| employee’s remuneration | ||||
The ratio of the total annual compensation CEO to employee’s remuneration increased in 2023 compared to 2022 mainly due to the internalisation of the operation and maintenance services at some of our solar assets in Spain. The new employees are mainly asset operation employees who have lower salaries than Atlantica’s average.
We believe that operating our assets with our own employees allows us to have a closer relationship and direct dialogue with these employees, ensuring that their working and health and safety conditions meet Atlantica’s standard and best practices.
In 2023, approximately 61% of our employees with variable remuneration had targets linked to ESG performance, compared to 59% in 2022 and 58% in 2021.
Our People and Culture Department receives remuneration data from two separate external consultants for certain positions based on position and location.
The package offered by Atlantica includes monetary compensation and remuneration in-kind, depending on the employee’s position, and on local practices in the countries where we operate. In addition, we offer:
| - | flexible compensation in certain locations, which sometimes represents tax advantages for some employees; |
| - | under current local regulations, we offer 401(k) retirement plans in the U.S; |
| - | financing a portion of our employees’ health insurance costs and their immediate family in most of the countries where we are based; |
| - | financing of our employees’ sport and wellbeing activities; |
| - | some family benefits such as childcare contributions, lactations facilities and breastfeeding leaves in certain locations. As of December 31, 2023 more than 60% of our workforce can benefit from a breastfeeding leave of approximately 3 weeks; |
| - | paid parental leave for the primary and secondary caregiver in most of the locations where we are based. As of December 31, 2023, approximately 60% of our workforce benefits from 16 weeks of paternity leave for both caregivers; |
In addition, Atlantica has implemented a “Work-life balance management policy” to achieve an effective balance between work and life outside the workplace. Atlantica’s management believes that employees are most productive when they have a certain flexibility to fulfil their professional and personal responsibilities. Under this policy Atlantica’s employees have the opportunity to request remote work for one business day per week under certain terms and conditions. We also offer part-time working options for employees who request this option.
The table below shows the number of employees that took parental leave in 2023, 2022 and 2021 by gender.
Parental Leave in 2023, 2022 and 2021
| 2023 | 2022 | 2021 | |||||||
| Male | Female | Total | Male | Female | Total | Male | Female | Total | |
| Parental
leave |
57 | 8 | 65 | 28 | 8 | 36 | 19 | 11 | 30 |
All employees returned to work in 2023, 2022 and 2021 after parental leave. 95% of those employees were still employed 12 months after returning to work in 2023. The remaining 5% voluntarily left the Company due to personal reasons. In addition to what is included in the law, management encourages employees to take parental leave.
Diversity and Inclusion Policy
We believe that the diversity of our workforce is an asset that enriches the Company with fresh ideas, perspectives and experiences. We acknowledge the contribution of people of different genders, nationalities, cultures, races, professional backgrounds, abilities, socio-economic backgrounds and age. Our belief is that employees with diverse skills represent an important resource identifying innovative solutions and improving our business performance, which ultimately benefits all our stakeholders.
We provide a work environment free of discrimination, intimidation and sexual and non-sexual harassment, where everyone can participate in the success of the business and where all employees are valued for the distinctive skills and experiences they bring to the Company.
Atlantica’s Diversity and Inclusion Policy was approved by the Board of Directors in May 2020 and was last amended in December 2021. In 2023, 2022 and 2021, we were not notified of any incidents relating to potential situations of discrimination. Corrective or disciplinary action would be taken in case of discriminatory behaviour or harassment.
We refer to section “Environmental, Social and other key performance indicators” for more detail on Atlantica’s employee’s breakdown per gender, nationality, ethnic self-identification and age.
As of December 31, 2023, approximately 14% of the executives at Atlantica have compensations linked to diversity, equity and inclusion.
Freedom of Association
The percentage of employees that are covered by company specific collective bargaining agreements was 9% in 2023, 11% in 2022 and 8% in 2021.
If we include sector collective bargaining agreements, the percentage of employees that are covered by collective bargaining agreements is 69% in 2023, 60% in 2022, and 40% in 2021.
Development and Training
Part of our supervisors’ mission is to collaborate with each of their team members to evaluate performance through the Annual Performance Appraisal (APA). As part of the individual appraisal process, the supervisor evaluates the performance during the period in nine standardised areas. Atlantica’s employee APA integrates our code of conduct. The manager also identifies individual targets for the coming period and sets training actions in the Annual Training Plan (ATP). Supervisors set individual meetings with their teams once the assessment is completed to share results and explain the action plan defined in depth. Employees can provide feedback about their own performance, improvement opportunities, etc. It is an ongoing process, normally spread over a year to ensure its effectiveness.
Once the APA is completed by supervisors, we conduct a calibration process to ensure that evaluations are consistent and as fair as possible across the entire organisation.
In addition, we plan to perform a 360º feedback process for certain management profiles, including senior and middle management, where managers receive feedback from their supervisor, peers and direct reports. Full confidentiality is guaranteed as the data is gathered, processed and summarised by external consultants.
Considering that we are a flat and lean organisation, it can be challenging for us to provide development opportunities to talented employees. We have a programme in-place to identify key members of our team. The goal is to consider employees for internal transfers to other positions, functions or geographies within the organisation. In 2023, we continued to strengthen our organisational structure. We bolstered our employees’ capabilities by designating new plant managers and other key management positions in some of our geographies. Most of these positions were filled with internal promotions.
We also have an internal job site on our intranet where we inform employees of job vacancies in order to promote internal mobility between different departments.
Employees Promoted by Gender in 2023, 2022 and 2021
| 2023 | 2022 | 2021 | |||||||
| Male | Female | Total | Male | Female | Total | Male | Female | Total | |
| Number
of promotions |
62 | 14 | 76 | 27 | 7 | 34 | 44 | 6 | 50 |
Regarding our training programme, we identify training categories to improve distinct sets of skills, integrate them into Atlantica’s team and culture, and as a measure to retain talented employees:
| - | Introduction to Atlantica. All new employees must attend our “Introduction to Atlantica” course during their induction period. In addition, all employees receive training on our compliance and management policies. |
| - | Management skills. We offer soft management-skills courses to improve negotiation, team-working, team-building, decision-making, leadership and communication, among other skills. |
| - | Technical knowledge courses. Our training plans also include technical knowledge courses specific to different technical fields. |
| - | Languages. We offer several language courses to our employees to allow them to operate effectively in an international setting. |
| - | Health and Safety. This is part of our core values. We offer several training courses to both our employees and operation and maintenance personnel to reinforce it. We refer to the “Occupation Health and Safety” section detailed below. |
Each employee agrees on the definitive training programme with their manager and, the People and Culture Department.
Training Hours in 2023, 2022 and 2021
| Total Hours of Training | Total Average Hours of Training per Employee |
||||||
| 2023 | 2022 | 2021 | 2023 | 2022 | 2021 | ||
| Management | 168 | 321 | 170 | Management | 13 | 27 | 13 |
| Middle Management | 5,163 | 3,724 | 2,689 | Middle Management | 42 | 31 | 32 |
| Engineers and Graduates | 13,701 | 10,740 | 9,281 | Engineers and Graduates | 48 | 40 | 57 |
| Assistants and Professionals | 2,049 | 1,189 | 413 | Assistants and Professionals | 31 | 26 | 15 |
| Asset Operations Employees | 21,883 | 11,548 | 6,846 | Asset Operations Employees | 27 | 23 | 29 |
| Total | 42,964 | 27,521 | 19,399 | Total Average | 33 | 29 | 37 |
In 2023, the employees completed 33 hours of training on average compared to 29 in 2022. The increase was mainly due to: (i) an increase in the number of trainings performed by our asset operation employees and engineers and graduates in 2023 compared to 2022. In 2022, asset operation employees who had recently joined Atlantica following the internalisation of the O&M received trainings only for part of the year (since they joined the Company). In 2023 all these employees performed all the trainings corresponding to a complete year; and (ii) in 2023 engineers and graduates and middle management performed a specific training on soft skills that they had not been performed in previous years.
Workforce Breakdown
Employees by Gender as of December 31, 2023, 2022 and 2021

| 2023 | 2022 | 2021 | |
| Women on the Board of Directors | 22% | 22% | 25% |
| Women at Management Level | 17% | 23% | 23% |
| Women in non-managerial positions | 17% | 20% | 25% |
| Women at Atlantica | 17% | 20% | 25% |
We operate in a sector that has historically employed a majority of men, especially in operation and maintenance activities. We seek to remove any barriers we might have, including unconscious bias, and to empower women and ensure that they progress with the same opportunities as men.
As of December 31, 2023, 236 out of 1,366 employees were women, representing 17% of the Company’s personnel. In 2022, 193 out of 978 employees were women, or 20% of the total headcount. The decrease of women at Atlantica during 2023 as a percentage of total employees was mostly due to the internalisation of the operation and maintenance services at our solar assets in Spain. These activities added 340 new employees to our workforce in EMEA, of which approximately 92% were men. Without considering Asset Operation Employees 187 out of 505 employees were women, representing 37% of the Company’s personnel compared to 35% in 2022 (160 out of 459 employees were women in 2022).
Employees by gender excl. asset operation employees as of Dec. 31, 2023, 2022 and 2021

Women by Geography and by Category as of December 31, 2021, 2022 and 2023

The relative decrease of women in the EMEA region during 2023 was mostly due to the internalisation of the operation and maintenance services as explained above. Most of the new employees are asset operation employees, who in this sector are generally men.
Employees by age as of December 31, 2021, 2022 and 2023
| 2023 | 2022 | 2021 | |||||||
| Age | Male | Female | Total | Male | Female | Total | Male | Female | Total |
| < 30 | 145 | 48 | 193 | 117 | 35 | 152 | 64 | 26 | 90 |
| 31-40 | 408 | 87 | 495 | 321 | 82 | 403 | 158 | 59 | 217 |
| 41-50 | 369 | 82 | 451 | 217 | 60 | 277 | 111 | 43 | 154 |
| >51 | 208 | 19 | 227 | 130 | 16 | 146 | 84 | 13 | 97 |
| Total Employees | 1,130 | 236 | 1,366 | 785 | 193 | 978 | 417 | 141 | 558 |
The average age of our workforce in 2023, 2022 and 2021 was 41 years old.
Employees by type of employment Category as of December 31, 2021, 2022 and 2023
| 2023 | 2022 | 2021 | ||||||||
| Male | Female | Total | Male | Female | Total | Male | Female | Total | ||
| By employment type | Full-time1 | 1,130 | 236 | 1,366 | 785 | 193 | 978 | 417 | 141 | 558 |
| Part-time | - | - | - | - | - | - | - | - | - | |
| Total | 1,130 | 236 | 1,366 | 785 | 193 | 978 | 417 | 141 | 558 | |
| By type of contract | Indefinite | 1,066 | 215 | 1,281 | 743 | 182 | 925 | 399 | 132 | 531 |
| Temporary | 64 | 21 | 85 | 42 | 11 | 53 | 18 | 9 | 27 | |
| Total | 1,130 | 236 | 1,366 | 785 | 193 | 978 | 417 | 141 | 558 | |
| 1 | Voluntary working time reductions have been included under full-time employment contracts. |
Employees in 2023, 2022 and 2021 year-end by contract type and by geography were:
| 2023 | 2022 | 2021 | |||||||||||||
| North America | South America | EMEA | Corporate | Total | North America | South America | EMEA | Corporate | Total | North America | South America | EMEA | Corporate | Total | |
| Indefinite | 331 | 48 | 761 | 141 | 1,281 | 311 | 60 | 429 | 125 | 925 | 308 | 51 | 63 | 109 | 531 |
| Temporary | 0 | 49 | 35 | 1 | 85 | 1 | 33 | 14 | 5 | 53 | - | 17 | 4 | 6 | 27 |
| Total | 331 | 97 | 796 | 142 | 1,366 | 312 | 93 | 443 | 130 | 978 | 308 | 68 | 67 | 115 | 558 |
Employees Hired and Turnover Rates
Employees Hired in 2023, 2022 and 2021 by Age and Gender
| 2023 | 2022 | 2021 | |||||||
| Male | Female | Total | Male | Female | Total | Male | Female | Total | |
| < 30 | 75 | 24 | 99 | 57 | 19 | 76 | 21 | 9 | 30 |
| 31-40 | 78 | 14 | 92 | 63 | 14 | 77 | 36 | 12 | 48 |
| 41-50 | 51 | 12 | 63 | 34 | 5 | 39 | 14 | 6 | 20 |
| >51 | 18 | 2 | 20 | 12 | 0 | 12 | 7 | 1 | 8 |
| Total Employees | 222 | 52 | 274 | 166 | 38 | 204 | 78 | 28 | 106 |
Employees Hired in 2023, 2022 and 2021 by Geography and Gender
| 2023 | 2022 | 2021 | |||||||
| Male | Female | Total | Male | Female | Total | Male | Female | Total | |
| North America | 47 | 14 | 61 | 64 | 8 | 72 | 44 | 9 | 53 |
| South America | 30 | 9 | 39 | 33 | 11 | 44 | 15 | 4 | 19 |
| EMEA | 137 | 21 | 158 | 52 | 11 | 63 | 10 | 4 | 14 |
| Corporate | 8 | 8 | 16 | 17 | 8 | 25 | 9 | 11 | 20 |
| Total Employees | 222 | 52 | 274 | 166 | 38 | 204 | 78 | 28 | 106 |
In 2023, we hired 274 employees. These hires do not include the internalisation of the asset operations activities. The number of employees hired in 2023 increased by 34% compared to 2022, mainly driven by an increase in the number of employees hired in EMEA. Approximately 50% of total employees hired in EMEA in 2023 corresponded to temporary employees and employees hired to replace sick or maternity leaves.
Average Employee Turnover Rate in 2023, 2022 and 2021
| 2023 | 2022 | 2021 | |
| Employee voluntary turnover rate | 7.6% | 12.8% | 11.0% |
| Employee voluntary turnover rate without U.S. activities | 6.8% | 9.7% | 5.9% |
| Employee involuntary turnover rate | 3.5% | 3.8% | 5.6% |
| Employee total turnover rate | 10.7% | 16.8% | 15.9% |
Note 1: Turnover rates calculated based on the average number of employees during the year excluding temporary employees and employees hired to replace sick or leaves.
Note 2: Employee turnover rate includes dismissals, retirement and others.
Note 3: We have revised 2022 and 2021 employee involuntary and total turnover rate to exclude the temporary employees and employees hired to replace sick or leaves.
Employee Turnover in 2023, 2022 and 2021 by Age and Gender
| 2023 | 2022 | 2021 | |||||||
| Male | Female | Total | Male | Female | Total | Male | Female | Total | |
| < 30 | 34 | 4 | 38 | 38 | 10 | 48 | 13 | 2 | 15 |
| 31-40 | 67 | 8 | 75 | 58 | 14 | 72 | 25 | 7 | 32 |
| 41-50 | 52 | 9 | 61 | 44 | 3 | 47 | 13 | 6 | 19 |
| >51 | 24 | 4 | 28 | 25 | 2 | 27 | 18 | 5 | 23 |
| Total Employees | 177 | 25 | 202 | 165 | 29 | 194 | 69 | 20 | 89 |
Employee Turnover in 2023, 2022 and 2021 by Geography and Gender
| 2023 | 2022 | 2021 | |||||||
| Male | Female | Total | Male | Female | Total | Male | Female | Total | |
| North America | 41 | 4 | 45 | 62 | 8 | 70 | 54 | 13 | 67 |
| South America | 11 | 2 | 13 | 11 | 8 | 19 | 6 | 2 | 8 |
| EMEA | 115 | 16 | 131 | 86 | 7 | 93 | 2 | - | 2 |
| Corporate | 10 | 3 | 13 | 6 | 6 | 12 | 7 | 5 | 12 |
| Total Employees | 177 | 25 | 202 | 165 | 29 | 194 | 69 | 20 | 89 |
Total employee turnover in 2023 increased by 4% compared to previous year. The increase was mainly driven by an increase in the number of turnovers in the employees from EMEA. Approximately 50% of total employees turnover in EMEA corresponded to the finalisation of temporary contracts.
We perform exit surveys with all our employees who voluntarily decide to resign. Our aim is to identify weaknesses and improvement opportunities that can help reduce voluntary turnover.
Gender Pay Gap Analysis
Atlantica guarantees respect for salary equality rights. Monitoring pay equality is one of the key factors to ensure the creation of an inclusive and respectful culture without differentiation based on gender, age, race or any other personal factor.
The Company is determined to ensure that there is no gender-based inequality in its activities by offering equal pay for equal work in all the businesses and countries where it does business.
We believe it is important to understand the difference between the concepts of salary gap and salary equality:
| - | The pay gap shows the difference between the average salary received by men and women. |
| - | Pay equality is the right of men and women to receive the same salary for the same work. |
At Atlantica, there is no salary discrimination for any reason, including gender. Different employees, including men and women in a similar position, can have different salaries based on the results of their performance evaluations.
The Pay Gap is measured subtracting the average female compensation from the average male compensation and dividing the result by the average of the higher earning gender (male or female) compensation.
2023, 2022 and 2021 Pay Gap by Category
| 2023 | 2022 | 2021 | |
| Management | 2% | 18% | 18% |
| Middle management | 6% | 16% | 29% |
| Senior engineers and graduates | 6% | 7% | 15% |
| Engineers and graduates | 0% | 10% | 8% |
| Assistants and professionals | (9%) | (14%) | (8%) |
| Asset operation employees | 24% | 29% | 10% |
| Average Salary by Gender | 5% | 13% | 26% |
Note 1: Data includes fixed salary, short-term bonus and long-term incentive plans without adjusting for factors such as job function, level, education, performance, location, or exchange rate differences. Overtime has not been included.
Note 2: Management consists of the members of the Management Committee.
Note 3: Middle management consists of certain employees who manage a specific area, supervise a group of employees, or are considered key personnel within the organisation.
Below you may find 2023 Gender Pay Gap by Category including the CEO.
2023, 2022 and 2021 Pay Gap by Category including CEO
| 2023 | 2022 | 2021 | |
| Management | 35% | 47% | 48% |
| Middle management | 6% | 16% | 29% |
| Senior engineers and graduates | 6% | 7% | 15% |
| Engineers and graduates | 0% | 10% | 8% |
| Assistants and professionals | (9%) | (14%) | (8%) |
| Asset operation employees | 24% | 29% | 10% |
| Average Salary by Gender | 9% | 20% | 33% |
The overall pay gap decreased in 2023 compared to 2022 mainly due to the internalisation of the operation and maintenance services at our solar assets in Spain. Most of these new employees are asset operation employees, who are approximately 92% men and, on average, have lower remuneration than Atlantica’s average salary.
The pay gap also decreased in the middle management and engineers categories due to the internalization of O&M activities. 11% of the employees who joined the Company in this process in 2023 are engineers and middle management. These employees are based in Spain and have lower remuneration than the average.
In spite of the reduction, we continue to have an overall gap in the Company. The main reason is a lower presence of females in management and engineering positions, which is common in the energy sector. In addition, female representation is significantly lower in age groups above 40, where salaries are usually higher.
To mitigate this situation and accelerate the progressive reduction of gender pay-gap, Atlantica continues to analyse several initiatives:
| - | Ensuring that we progressively build a pool of females employees to fulfil future management positions. |
| - | Promote STEM careers among female students. |
| - | Always consider female candidates when hiring new employees. |
Key Management for 2023
We have a key management team with extensive experience in developing, financing, managing and operating contracted sustainable infrastructure assets. Our key management in 2023, 2022 and 2021 includes:
| Name | Position | Year of Birth |
| Javier Albarracín | Head of Development and Investment and CIO | 1971 |
| David Esteban | VP EMEA | 1979 |
| Emiliano Garcia | VP North America | 1968 |
| Irene M. Hernandez | General Counsel and Chief of Compliance | 1980 |
| Francisco Martinez-Davis | Chief Financial Officer | 1963 |
| Antonio Merino | VP South America | 1967 |
| Santiago Seage | Chief Executive Officer and Director | 1969 |
Note: Stevens C. Moore resigned from his position as VP Corporate Development on June 29, 2023.
There are no potential conflicts of interest between the private interests or other duties of the key management members listed above and their duties to Atlantica. There are no family ties among any of our senior management and Board of Directors.
As of December 31, 2023, the average age of our key management team was 52 years old.
The biographies of the key management team are:
Javier Albarracin,
Head of Development and Investment and CIO
Mr. Albarracin has more than 20 years of experience in the development and financing of infrastructure projects in North and South America, Europe, and Africa. He previously served as Head of Finance for Atlantica since 2016. He holds a Business Administration Degree and a Master in Finance and Financial Markets.
David Esteban,
Vice President EMEA
Mr. Esteban has served as Vice President of our operations in EMEA since July 2014. He had previously served in Abengoa’s Corporate Development department for two years. Before that, Mr. Esteban worked for the management consulting firm Arthur D. Little for seven years in the industries of Telecoms & Energy and then moved to a private equity firm specialised in renewable energy investments in Europe for three years.
Emiliano Garcia,
Vice President North America
Mr. Garcia serves as Vice President of our North American business. Mr. Garcia was previously the General Manager of Abengoa Solar in the United States and of the Solana Power Plant. Before that, he held a number of managerial positions in various Abengoa companies over two decades. Mr. Garcia holds a Bachelor’s degree in Engineering from Madrid Technical University.
Irene M. Hernandez,
General Counsel and Chief Compliance Officer
Ms. Hernandez has served as our General Counsel since June 2014 and also serves as Chief Compliance Officer and Head of People and Culture. Prior to that, she served as head of our legal department since the date of our formation. Before joining Abengoa, she worked for several law firms. Ms. Hernandez holds a law degree from Complutense Madrid University and a Master’s degree in law from the Madrid Bar Association (Colegio de Abogados de Madrid (ICAM)).
Francisco Martinez-Davis,
Chief Financial Officer
Mr. Martinez-Davis was appointed as our Chief Financial Officer on January 11, 2016. Mr. Martinez-Davis has more than 30 years of experience in senior finance positions both in the United States and Spain. He has served as Chief Financial Officer of several large industrial companies. Most recently, he was Chief Financial Officer for the company responsible for the management and operation of metropolitan rail service of the city of Madrid where he was also member of the Executive Committee. He has also worked as CFO for a retailer and as Deputy General Manager in Finance and Treasury for Telefonica Moviles. Prior to that, he worked for different investment banks in New York City and London for more than 10 years, including J.P. Morgan Chase & Co. and BNP Paribas. Mr. Martinez-Davis holds a Bachelor of Science, cum laude, in Business Administration from Villanova University in Philadelphia and an MBA from The Wharton School at the University of Pennsylvania.
Antonio Merino,
Vice President South America
Mr. Merino serves as Vice President of our South American business. Previously, he was the Vice President of Abengoa’s Brazilian business, as well as the head of Abengoa’s commercial activities and partnerships in South America. Mr. Merino holds an MBA from San Telmo International Institute.
Key management compensation, excluding the Chief Executive Officer, in 2023, 2022 and 2021:
| In USD thousands | 2023 | 2022 | 2021 |
| Short-Term Employee Benefits | 2,568 | 2,294 | 2,365 |
| - Fixed and variable remuneration1 | 2,568 | 2,294 | 2,365 |
| LTIP Awards | 845 | 2,176 | 839 |
| - Options vested under LTIP2 | - | 733 | 839 |
| - Restricted Stock Units vested under the LTIP | 845 | 1,443 | |
| One-offs | - | 684 | 653 |
| - One-off plan3 | - | 684 | 653 |
| Post-employment benefits | - | - | - |
| Other long-term benefits | - | - | |
| Termination benefits | - | - | - |
| Total | 3,413 | 5,154 | 3,857 |
Note: The table includes compensation for 6 key executives, excluding the Chief Executive Officer. Detailed information on the Board of Directors remuneration, including the Chief Executive Officer’s remuneration, is disclosed in the Directors’ Remuneration Report.
| (1) | Stevens C. Moore and Javier Albarracin ‘s 2023 fees were prorated for the year 2023. Stevens C. Moore resigned from his position as VP Corporate Development on June 29, 2023 and Javier Albarracin was appointed as Head of Investments and Finance and CIO in in June, 2023. |
| (2) | Options under the LTIP 2020 and 2021 vested in 2023 but were not exercised because they were underwater at the vesting date. |
| (3) | The One-off plan RSUs were fully vested as of December 2022. |
Short-term employee benefits to management are paid in Euros and have been converted to US$ using the average foreign exchange rate for each period.
“LTIP Awards” include share units vested in 2023. In addition, “One-off Awards” included share units that were fully vested in 2022. The vested options and share units have been included in the remuneration table above using the share price at the vesting date.
Fixed remuneration for the Key Management excluding the CEO for the year 2023 was $1,815.4 thousand. As of December 31, 2023, these executives excluding the CEO owned 202,674 shares of Atlantica, including unvested shares units as of that date (100,031 shares and 101,454 restricted share units, convertible into shares in the future). Considering a share price of $21.50 as of December 31, 2023, Key Management excluding the CEO owned shares representing 2.4 times their base salary. Excluding restricted share units and considering a share price of $21.50 as of December 31, 2023, Key Management excluding the CEO owned shares representing 1.2 times their base salary.
Risks Linked with Human Capital
General key risks associated with human capital include attracting and retaining qualified personnel as well as maintaining a diversified workforce to enrich the Company with fresh ideas, perspectives and experiences. In addition, digital transformation requires cultural and organisational changes and continuous training to avoid company human capital risks.
As detailed in different sections of this Integrated Annual Report, Atlantica has put different measures in place to mitigate human capital risks, including: (i) providing equal opportunities to all employees, (ii) implementing an effective diversity and inclusion policy throughout the Company, (iii) promoting in-house professional opportunities, providing training programmes to improve skills and technical knowledge, establishing fixed and variable remuneration considering data from external consultants (for key personnel), financing a high percentage of health insurance costs, and subsidizing fitness as measures to attract and retain employees; and (iv) auditing processes to ensure compliance with all human capital legal requirements, process and procedures.
Local Communities
| Key facts: | ||
|
|
✓ |
Community investments focused on improving infrastructure and supporting education
|
We acknowledge that our day-to-day activities have impacts on nearby communities. We recognise that the communities where we operate are where some of our employees and other stakeholders live and raise their families, and where part of our future workforce will be educated and trained. We foster communities’ economic prosperity through local purchases and by hiring local employees. As such, it is key for us to be both proactive and a valued member of our communities.
We have a Stakeholder Policy and a Local Community Investment and Development Policy in place that set the basis to support local communities, collaborate with them and promote their environmental, economic and social progress. Both policies are available on our website.
Our Geographic VPs and local managers are responsible for community relations and monitoring community development programmes. Monitoring KPIs include quantitative, qualitative, remote and physical analysis.
Each geography has its own procedures and consultation guidelines in place to speak with community leaders and to identify local needs. This usually involves physical meetings or phone calls between our local employees and local communities. We have learnt from our “boots-on-the-ground” approach that we need to adapt to local requirements and that communities located close-by may have very different needs, which evolve over time. A proactive approach and scheduled activities undertaken by our local employees to efficiently identify and manage local stakeholders and communities of interest is key to the success of our relationship with local communities.
We engage and work collaboratively with local communities from the development phase. We also comply with permitting, local law and regulation in-place, and have purchased locally where possible and hired local employees during the construction phase. During 2023 we had forty-four assets in operation and eight projects under construction. We expect our development and construction activities to continue increasing in the upcoming years.
In addition, ex-post controls are usually performed. Once an investment is completed, Atlantica’s employees visit the site to review the investment’s outcome and speak with local stakeholders. The agreement reached with the community along with the local stakeholders’ feedback, provides sufficient information to conclude on our investment positively or negatively. Lessons learnt are then internally shared within Atlantica if deemed appropriate.
We have a grievance mechanism for local stakeholders to directly contact our local managers. We also have corporate communication channels to report any misconduct, irregularities or instances of non-compliance, as detailed in the Business Ethics section.
We also take a proactive approach to preventing, detecting and acting on local community conflict risks concerning water resources. Any potential risk or grievances concerning water resources will be addressed and followed-up in our regular communications with them. In 2023, 2022 and 2021 we did not receive any negative feedback from local communities regarding our management of water resources, including at those assets located on water-stressed areas, nor have we been subject to water-related incidents with substantial impact on cost or revenues.
To emphasise the importance of local community engagement, some local managers have social objectives as part of their variable remuneration.
Considering that Atlantica is present in different geographies, our local communities long and short-term strategy varies depending on the community’s needs:
| Medium / Long-Term | Short-Term2 | ||
| Infrastructure1 | Education / Skill Development | Basic Needs3 | |
| U.S. | - | ✔ | - |
| Peru | ✔ | - | ✔ |
| Chile | ✔ | ✔ | - |
| Colombia | ✔ | - | ✔ |
| Uruguay | ✔ | - | ✔ |
| Spain | - | ✔ | - |
| South Africa | ✔ | ✔ | ✔ |
| Algeria | - | ✔ | ✔ |
|
1 |
Infrastructure usually involves building, maintaining or upgrading roads, cleaning irrigation canals, etc. |
| 2 | One-year period. |
| 3 | Basic needs include food and clothes donations. |
In 2023, we invested approximately $1.5 million in local communities, compared to $1.5 million and $1.3 million in 2022 and 2021, respectively.
In Peru, Colombia, Chile, South Africa and Algeria we have several employees who visit the areas close to our assets. Among others, they review that: (i) we comply with all our obligations including Health and Safety, environmental conditions, permits, etc., (ii) we listen to the communities’ needs and, (iii) we jointly agree to develop, execute and monitor development programmes with those communities. These employees report to the Country Manager. Local needs are discussed in Atlantica’s Geographic Committee if deemed necessary.
Peru
Local communities near our assets in Peru generally require road maintenance support. We have an annual plan in place to execute road maintenance.
In 2023, we invested approximately $515 thousand in different initiatives that benefited local communities located near our transmission lines and our mini-hydroelectric power plant. In 2022 and 2021 we invested approximately $294 thousand and $289 thousand, respectively.
2023 investments mainly relate to:
| ü | Improving infrastructures (i.e., road construction and maintenance, cleaning irrigation canals, providing irrigation maintenance supplies, etc.) |
| ü | Supporting Indigenous people through agriculture and livestock development projects. |

Chile
In 2023, we invested approximately $150 thousand in initiatives that benefited (i) 6 Indigenous communities representing more than 1,000 people of different ethnicities. The funds were invested in house improvements, small businesses, cultural activities and sustainable agriculture initiatives, and (ii) 64 students who received support to pay education tuition fees and purchase school supplies.
Colombia
In 2023, we invested approximately $59 thousand in initiatives that benefited local communities, mostly Indigenous people, close to our solar PV plants, including among others, Christmas presents and school kits for children, and furniture for local schools.

Uruguay
In 2023, we donated furniture, air conditioning systems and educational materials worth approximately $6 thousand to a local school near one of our wind assets.
Algeria
During 2022, we donated approximately $35 thousand to the local communities near the water desalination plants. We also donated approximately $30 thousand in 2022 and 2021.
Skikda
Donations benefited needy families in the Skikda community. These included school supplies kits and bags for 367 schoolchildren and 200 food baskets.

Honaine
Donations benefited needy families in the Honaine community. These included school supplies kits and bags for 400 schoolchildren and 300 food baskets.

Tenes
Donations benefited needy families in the Tenes community. These included school supplies kits and bags for 116 schoolchildren and 90 food baskets.
South Africa
We participate in substantial social and economic development activities in South Africa as part of a collaborative effort with the Department of Energy of South Africa. Kaxu is located in the Khai Ma Local Municipality of Northern Cape Province. Kaxu’s social and economic development activities are governed by an Implementation Agreement with the South African Department of Energy. This agreement sets out key economic development obligations to positively benefit local communities. Kaxu contributes 1.1% of its yearly collections to be reinvested in the local communities that lie within an approximately 50km (31 miles) radius of the site, as well as a very remote community beyond this distance.
In 2023, Kaxu invested approximately $592 thousand in community activities:
| ● | We continued supporting two of our flagship programmes, Kindergarten and Soup Kitchens project, which give meals to children and people in need from communities near our facilities. Investment: $125 thousand. |
| ● | Education and skills development is one of the key elements to promote economic community development. Kaxu addresses this need by means of an internship and bursary programme. The bursary programme grants the youth within nearby local communities the opportunity to study at any tertiary institution of their choice in the country. The programme includes tuition fees, accommodation and a monthly allowance to help with the living expenses of each student. Our Internship programme allows young individuals to gain valuable experience to prepare them for the South African Labour market. Investment: $141 thousand. |
| ● | Teachers Support Programme: We provided local schools with additional teachers to assist with overcrowded classrooms. Investment: $68 thousand. |
| ● | Schools Infrastructure Support: solar PV systems for administration buildings at all six schools in the municipality area. Investment: $65 thousand. |
As part of our obligations, we also help create jobs to empower Black citizens from local communities. During 2023 and 2022, 79% and 72%, respectively, of the employees hired by the subsidiary performing the O&M at Kaxu were Black citizens, exceeding the requirements defined by the project. Furthermore, approximately 30% of employees working at the plant in 2023 and 2022, came from local communities, also exceeding the requirements defined by the project. Due to its remote location and technical skill requirements, the Kaxu plant provides job opportunities to persons from various different regions in South Africa. As of December 31, 2023 approximately 94% of the employees were South African citizens, and the remaining 6% were support staff from different countries.
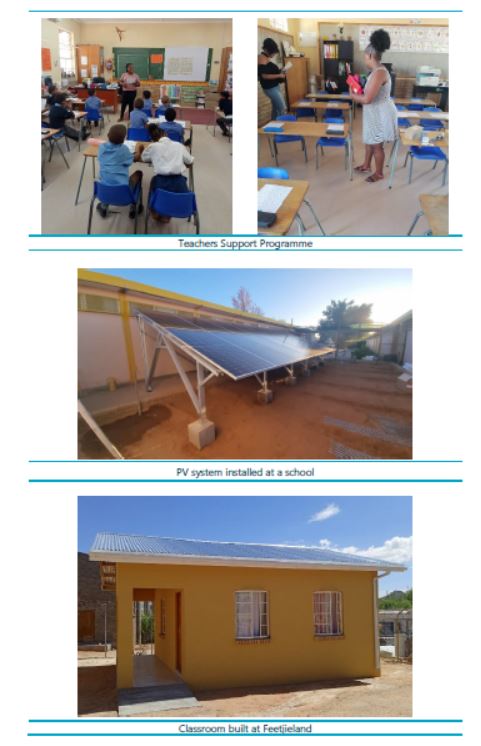
Spain
In Spain, we signed collaboration agreements with six universities as part of an internship programme for recently graduated students.
Canada
In 2023, we donated $5 thousand to the Calgary Alpha House Society. This organization was established in 1981 to support a marginalized population of men and women addicted to alcohol or drugs and living on the streets of Calgary. The scope of their work is at the direct intersection of homelessness, addictions and mental and physical health issues, with programmes designed to help improve the lives of vulnerable individuals, while having a positive impact on the wider community through dedicated responses to social issues.
United States
Solana
In 2023, Solana donated $8 thousand to the town of Gila Bend Recreation department for the 2023 “Santa in the Park” event and $5 thousand to the town of Gila Bend Unified School District West-MEC Program.

Mojave
In 2023, Mojave donated $5 thousand to the Mojave Environmental Education Consortium (MEEC) to provide training and resources to local students in projects such as energy, air quality, water quality and sustainability, as well as enrolment in a field trip programme. In addition, we also donated $500 to the Transition Habitat Conservancy, a non-profit organisation that protects transition zone and wildlife corridor ecosystems and their scenic, agricultural, and cultural resource values in the West Mojave Desert.
Coso
In 2023, we provided cash donations of $98 thousand to support college scholarships, local youth sports, schools, and various local organisations and charities. We also provided support for the building of a new pavilion at one of the local parks. In addition, we sponsored fishing derbies, concerts, fairs, parades and other events that generated revenues for the local communities.

Asset Management
Asset management refers to the systematic process of developing, operating, maintaining and improving the assets in the most cost-effective manner, while considering costs, risks, opportunities and performance factors. Asset management also involves the management of health and safety, environmental matters, compliance, financial, economic and other practices.
Excellence and efficiency are part of our core values. We believe in the outstanding and disciplined operation of our assets, while seeking operational excellence in a cost-efficient manner. Atlantica’ asset management policy is publicly available on our website.
Asset managers supervise day-to-day activities of each of our assets and report to three Geographic VPs, who have full responsibility and accountability for the assets they manage. In addition, the corporate operations team supports asset managers by auditing the assets’ health and safety procedures, operational and environmental performance by implementing best practices and improvements, and by developing asset management tools, while the internal audit team audits asset records, processes and procedures.
Summarised Asset Management and Corporate Department Functions
| Asset Management Functions | Corporate Department1 Supporting Functions | |
| Manage operation and maintenance activities. Implement best practices and audit recommendations, and share lessons learned | Operations, health and safety, environment and quality | |
| ESG management2, including implementing a zero-accident culture, minimizing environmental impacts, and overall asset risk identification and mitigation | Accounting, financing, budget control, administration, tax, insurance and information technology3 | |
| Cash management, budget-tracking, preparing financial statements | Internal audit and risks management | |
| Manage relationships with all asset stakeholders | Legal, compliance, and people and culture | |
| Measure, monitor and report asset KPIs | Purchasing |
| 1 | Corporate departments focused on supporting and controlling geographies. |
| 2 | We encourage you to read section Sustainability Governance for further details on ESG-related functions. |
| 3 | We encourage you to read section Innovation Management for further details on enhanced machine learning capabilities aimed at improving asset performance. |
Asset Management Approach
Atlantica’s asset management objectives and targets are set on an annual basis. These are discussed and agreed at Atlantica’s Health and Safety, ESG and Operations Committee. The Board of Directors approves the consolidated key performance indicators.
We believe in a disciplined and efficient asset management approach. To achieve this, we monitor the performance of our assets in real time. We identify deviations, analyse them, learn from potential errors and apply corrective actions whenever needed.
We believe that by investing in our monitoring and predictive capabilities, we will improve our asset performance over time. We refer to the Innovation Management section for detailed information on our data analytics and machine learning initiatives.
We have monthly KPIs on health and safety, operation and maintenance, environmental metrics, equipment availability and overall plant performance. We also have an ERP-software that enables us to have strict control over our inventory, spare parts, work orders, work permits, accounting, and maintenance records among other things.
Atlantica’s Health and Safety, Environmental and Quality Management System are ISO 45001, 14001, and 9001 compliant, respectively, for the activities of acquisition and management of contracted assets. An external third party (DNV) audits our Health and Safety, Environmental and Quality Management System annually. Our certifications, obtained for the first time in 2015, were renewed in May 2021 and are valid until May 20244. In addition, our Information Security Management System (ISMS) is ISO 27001 compliant. This certification was obtained in September 2022 and is valid until September 2025.
The Company’s management system gives us a high degree of confidence that we comply with our own policies and with the regulations in force in each of the countries we operate in. In particular, we measure and monitor the environmental impact of our activities (including among others how these impact our local communities close to our assets as well as other stakeholders), and we analyse initiatives to reduce our GHG and non-GHG emissions, water consumption, and hazardous and non-hazardous waste.
We perform annual internal audits on our assets to ensure compliance with our best practices and to promote continuous improvement. The Operations Department audits all our assets at least once every two years. The purpose of these audits is to perform an in-depth operational, maintenance, engineering, health and safety and environmental indicators assessment, as well as to assess compliance with internal corporate reporting requirements. The internal audit team reviews the internal controls and financial information of all our assets on an annual basis. Specific internal audits may be carried out on certain assets on an as-needed basis.
Audit findings are discussed between the Geographic VPs, Asset Managers and the Operations Director or the Head of Internal Audit. Key audit findings are discussed in the Geographic Committees, allowing senior corporate management to better assess our business activities, identify improvement areas and implement corrective action plans when necessary. In 2023, we had 13 of our assets audited by the Operations team, which resulted in recommendations for 225 improvement actions (vs. 273 in 2022). A high percentage of these improvement actions relate to non-material findings corresponding to operation and maintenance, health and safety, and environmental internal standards.
4 The renewal process will start before the certifications expire.
Number of Assets Audited and Improvement Actions in 2023, 2022 and 2021
| 2023 | 2022 | 2021 | |
| Number of assets audited | 13 | 13 | 7 |
| Number of identified improvement actions | 225 | 273 | 91 |
Note 1: Approximately 51% of the identified improvement actions in 2023 have been implemented. The rest (improvement actions mainly identified in Q3 and Q4 2022 audits) are expected to be implemented during 2024.
Note 2: All improvement actions identified in 2022 were implemented during 2022 and 2023.
Geographic VPs, Asset Managers and the Corporate Operations team dedicate time and effort to implement improvement actions. The progress on implemented improvement actions are reviewed at different management committees.
To meet Atlantica’s asset management objectives, the Company provides specific training to its employees. In 2023, training received by our asset employees included health and safety, enhanced technical skills on electric systems, heat exchangers, and hydraulic pumps among others, and compliance-related programmes. Atlantica’s senior management is convinced that well-trained employees will foster continuous day-to-day improvement, hence improving asset performance.
Our asset management functions include ESG factors. On the environmental side, asset managers are generally requested to share lessons learnt, implement best practices, measure, monitor and report KPIs, and implement internal audit recommendations and actions to reduce our environmental footprint. Regarding the social dimension, asset managers are requested to implement measures to promote and maintain a zero-accident culture. On the governance dimension, asset managers are requested to proactively manage asset risks and ensure asset compliance with internal and external rules and regulations.
Summarised Key Asset Management ESG-Related Responsibilities
| Environment | Social | Compliance |
|
- Identify environmental risks, improve efficiency and reduce overall costs. - Implement environmental audit findings recommendations. - Share lessons-learnt and implement operational, environmental, and quality best practices. - Maintain environmental and quality management system certifications. - Measure, monitor, and report key GHG and non-GHG emissions, waste and water indicators. Implement actions to reduce their impact. - Implement biodiversity initiatives. |
- Implement a zero-accident culture at all assets. - Identify health and safety risks, perform walk & talks. - Implement health and safety audit findings recommendations. - Share lessons-learnt and implement health and safety best practices. - Maintain health and safety management system certifications. - Measure, monitor, and report key social indicators, including health and safety, and people and culture key metrics. - Propose suppliers considering the environmental and biodiversity impacts of their product/service. - Support long-term development of local communities close to our assets. |
- Compliance with all internal and external rules, regulations, processes, and procedures. - Proactively manage and report asset risks. - Promote reporting of any complaints and concerns, as well as any breaches of the Code of Conduct or any conduct contrary to ethics, law, or the company’s standards. |
Asset Closure
We are committed to rehabilitating land to its “before-use” state, minimizing negative impacts. As of December 31, 2023, our assets had a weighted average remaining contract life of approximately 13 years5. Our first Power Purchase Agreements (PPA) or regulated contract where we have operational control ends in 2031 and in many cases the useful life of the asset goes beyond the duration of the PPA. For example, the PPA of Lone Star II, one of the assets in our Vento II portfolio where we own a 49% stake, ended in January 2023 and the asset continues operating, selling electricity at market prices. No asset has been dismantled since our incorporation. We believe that we can continue operating some of our assets beyond their contract or regulatory life. The ATN and ATS transmission lines will be transferred to the government at the end of the concession period. For the rest of the assets, if or when we decide to stop operations after the contracted period, we are committed to dismantling the asset and returning the land to its original condition. In most of the assets, the process would consist of taking equipment apart. We do not expect any environmental or landscaping impact after dismantling.
On a yearly basis, we update our dismantling provision. The estimated total amount of dismantling costs include health and safety and environmental measures to avoid significant environmental or landscape impacts. We plan to involve local communities in the dismantling activities. Our Chief Executive Officer and Geographic VPs hold responsibility and accountability for future land closure and rehabilitation. For more information on dismantling provisions, please read our 2023 financial statements available in this report.
5Calculated as weighted average years remaining as of December 31, 2023 based on CAFD estimates for the 2024-2027 period, including assets that have reached COD before March 1, 2024.
| In USD million | 2023 | 2022 | 2021 |
| Dismantling provision | 155 | 141 | 125 |
The dismantling provision increased mainly due to dismantling obligations from our transmission line ATN 2. Following requirements from an environmental impact assessment performed at ATN 2, we have increased the provision corresponding to this asset. The provision also increased due to dismantling obligation from assets recently incorporated in our portfolio.
Innovation Management
Within the energy sector, innovation contributes to the fight against climate change through new or enhanced technologies that enable more sustainable, reliable and efficient solutions, including storage and green hydrogen solutions. Innovation is also key in the development of new tools and systems to more efficiently operate and manage sustainable infrastructure assets.
As of December 31, 2023, we own 22 patents and technology licenses related to key components of our assets, to processes and to solutions to monitor, operate and maintain our assets in a sustainable and cost-effective manner, as well as 3 patents currently in process. We also have an Operations Department that dedicates time and effort to identifying potential measures to improve asset performance, reducing operating costs and developing tools to manage our assets more efficiently.
In addition, we have an in-house advanced analytics team to improve the performance of our existing technologies. The advanced analytics team focuses on data analytics, visual analytics and machine learning technologies to provide accurate energy production forecasts, predict equipment breakdowns or malfunctions, and reduce the risk of major outages as well as health and safety and environmental risks, among others.
We have joint-collaboration agreements in place with universities and innovation institutions as well as with certain suppliers and service providers across the regions where we operate to develop intelligent solutions to improve asset performance.
In 2023, we continued (1) strengthening our capabilities related to visual analytics, data analytics, modelling and artificial intelligence, and (2) moving forward on our digitalisation roadmap to cover a broader scope of key components and the range of failure mechanisms. Specifically, we have performed periodic aerial inspections with drones at our assets to collect both high-resolution images and thermal images and we are developing image-driven diagnosis capabilities. In addition, we have (i) continued to deploy sensors and tools on key equipment at our assets (ii) expanded our portfolio of machine learning models, physical models and data-driven diagnosis capabilities (iii) signed new and increased the scope of existing collaboration agreements with equipment manufacturers and (iv) integrated new data driven digital solutions. All these innovations initiatives have allowed us to improve our capabilities to:
| - | Detect anomalies and operational deviations of key equipment, |
| - | Diagnose faults or failure and assessing their root causes, |
| - | Predict expected fault progression, and |
| - | Recommend the most suitable maintenance actions, among other actions. |
Furthermore, in 2023 we have developed intelligent controllers of key components in our assets that have allowed us to improve energy efficiency and we continued improving the remote monitoring capabilities of our assets from our centralised monitoring centre, including the development of new operational tools and the automatisation of reports and alarms.
We have already benefited from our innovation initiatives. For example, thanks to deployed sensors on key equipment and our data analytics capabilities, we have been able to prevent failures in: (1) transformers (2) turbines, (3) generators (4) power electronics (5) solar trackers(6) pumps and (7) motors.
We expect that our efforts in innovation will continue, over time, to reduce costs, to improve asset performance, maximizing energy production and minimizing risks, and to extend the useful life of our assets.
Cybersecurity and Data Privacy
Our information security policies, procedures and processes apply to all our activities in all the geographies where we operate.
Cybersecurity
Atlantica has a digitalised, cloud-based collaborative work environment in-place that promotes a strong cybersecurity culture.
Atlantica relies on both a physical and a digital technological infrastructure to support its processes and operations. These systems are subject to disruption, damage or failure from a variety of sources, including, without limitation, computer viruses, security breaches, cyber-attacks, ransomware attacks, malicious or destructive code and phishing attacks. Cybersecurity incidents, in particular, are constantly evolving and include malicious software, attempts to gain unauthorised access to data and other electronic security breaches that could lead to disruptions in systems, unauthorised release of confidential or otherwise protected information and to the corruption of data. We have preventive, detective and reactive controls in-place to avoid and/or mitigate damage or failure to our plants that could lead to business disruption (i.e., being unable to operate our plants or to access our Enterprise Resource Planning (ERP) systems). These controls are based on international standards, frameworks, best practices, internal and external audit recommendations, and insights gained from other companies.
Details on our cybersecurity risks are addressed in the Principal Risks and Uncertainties section of the Strategic Report.
To prevent cybersecurity risks, we regularly review our capabilities, reassess our IT policy, incident response procedure and, cybersecurity practices, as well as review our communication and cybersecurity related training across the Company to support resilience across our assets. In 2023, we continued investing time and effort in strengthening prevention, monitoring and threat-detection measures in line with international standards. We engage an external security firm as advisors and certify our information security management system (ISMS) through a recognized audit firm in accordance with is ISO 27001. Our certification was obtained in September 2022 and is valid until September 2025. We also increased our on-site and cybersecurity measures to ensure that our systems remain functional to serve the operational needs of on-site and remote workforce, keeping them in operation to ensure uninterrupted service to our customers. These measures range from software improvements, tailored communications to raise security awareness among our workforce, and implementing mandatory IT security training aimed at detecting, monitoring and preventing threats. In addition, we perform annual red team exercise conducted by experienced cybersecurity specialists from a third party. Our employees received training on identifying phishing in its different forms (e.g., email, phone calls, SMS, etc.), its potential consequences (e.g., data breaches, plant operation disruption, economic loss, reputational damage, etc.) and implementing sophisticated corporate and personal password maintenance.
We also regularly conduct internal and external audits to ensure that our cybersecurity controls are updated and effective, including simulated and targeted cyberattacks to our servers and employees’ accounts. The results of this ethical hacking exercise are published quarterly in a “Wall of shame” that is accessible to every employee in the IT Security Hub. We regularly update our risk map on identifying, evaluating and mitigating information security risks. High-level areas of focus are IT policies, human resources security, access control, physical security, operational and communication security, cryptography, incident management, supplier relationships, business continuity and compliance.
To protect Atlantica’s information systems from cybersecurity threats, the Company uses various security tools that help the Company identify, escalate, investigate, resolve and recover from security incidents in a timely manner. We have preventive, detective, and reactive controls in-place to avoid and/or mitigate damage or failure to our plants that could lead to business disruption.
Incidents are unwanted or unexpected malicious security events, or a series of such events, impacting an information system or the information residing in the system, which have a significant probability of compromising business operations. An incident always affects the security of the system and requires an immediate response as it directly impacts the availability, integrity, or confidentiality of system data. Incidents may result in service disruption or data theft among other consequences.
Cybersecurity-Related Incidents in 2023, 2022 and 2021
| 2023 | 2022 | 2021 | |
| Number of cybersecurity incidents | 0 | 0 | 0 |
Cybersecurity governance
The Board is responsible for the effective oversight of the Company’s strategy and performance, financial reporting, corporate governance process, and internal control and risk management framework, including cybersecurity risks . The Audit Committee of the Board oversees the Company’s risk management program, which focuses on the most significant risks the Company faces in the short-, intermediate-, and long-term timeframes. Audit Committee meetings include discussions of specific risk areas throughout the year, including, among others, those relating to cybersecurity, and reports from the Head of Risk Management on the Company’s enterprise risk profile on an annual basis. The Board of Directors is informed at least twice a year on the cybersecurity strategy, measures and systems to securely protect and safeguard Atlantica’s information.
The design and implementation of Atlantica’s company-wide cybersecurity strategic, policy, standards, architecture, and processes are the responsibility of our IT team, which includes our Head of IT, with approximately 25 years of experience in information security, and a dedicated IT Security Manager with more than 10 years of experience in information security. The Head of IT reports to the Chief Financial Officer (CFO) and is a member of both the Management Committee and the Compliance Management Committee. The Chief Executive Officer, the CFO and the Head of IT review Atlantica’s information security at least on a monthly basis.
Our IT Security Committee is chaired by the Head of IT and also includes our IT Security Manager, and other IT managers relevant for this purpose. This committee meets weekly to review and update potential threats, the most recent trends in cyber-attacks, the progress in implementing action plans, and the evaluation of possible opportunities for further improvement.
Atlantica has business continuity, contingency plans and incident response procedures in place. We intend to test these plans and procedures on a yearly basis.
Data Privacy
All Atlantica’s activities, including those of our directors and employees, as well as everyone we have a relationship with, are required to comply with our Compliance Policy on privacy and personal data protection. This policy is based on the European General Data Protection Regulation (GDPR), the U.K. Data Protection Act (DPA) and applies to all Atlantica companies. In particular, the Policy sets a framework that enables compliance with local data protection and privacy laws and defines a baseline for those countries where there are no equivalent legal requirements.
We have several mechanisms in-place to ensure effective implementation of our Privacy Policy:
| ● | Our Code of Conduct addresses privacy and personal data protection. All employees receive annual training on our code. Atlantica’s employees approve the Code of Conduct on a yearly basis. |
| ● | Clear and direct data protection and privacy responsibilities. |
| - | The Compliance Management Committee is responsible for coordinating and managing personal data protection activities. It is also responsible for reassessing, on an annual or as-needed basis, the compliance and efficacy of our data protection and privacy policies. To do so, regular internal and biannual external audits are conducted to identify and mitigate potential privacy and personal data risks and their compliance with rules and regulations. For example, as part of these audits, we review that all our activities comply with data protection and privacy regulations, including the GDPR requirements. We are committed to protecting all stakeholder information, including that of employees, suppliers (including subcontractors working at our assets), investors and other stakeholders’ confidential data. In particular: |
| - | The Head of IT and Administration leads day-to-day data protection activities and is responsible for implementing the control measures and developments needed to ensure compliance with rules and regulations on data protection in Atlantica’s information security management systems. |
| - | The Head of Risk Management oversees risk management processes, procedures and tools implemented by the Company, including the risk map. Data protection and privacy is included in the risk map. The Board of Directors monitors risks on a quarterly basis as part of the Company’s risk management assessment. |
| - | Personal data and privacy issues can be addressed to the Compliance Management Committee through face-to-face meetings, video or phone calls, or via email (dataprotection@atlantica.com, or compliance@atlantica.com). |
| ● | We provide data protection training to acquaint employees on the rights of individuals to control their personal information and data confidentiality, integrity and availability. |
| ● | Data protection documentation is available to all Atlantica employees on the Company’s intranet. In addition, we publicly inform stakeholders about our privacy data measures on our website (https://www.atlantica.com/web/en/privacy-policy/index.html) providing details on: |
| (i) | the nature of the information captured, |
| (ii) | the use of the collected information, |
| (iii) | the possibility for stakeholders to decide how private data is collected, used, retained and processed, |
| (iv) | how long the information is kept on corporate files, and |
| (v) | how the information is protected. |
We do not use stakeholder’s data collection outside of the primary purpose for which the data was collected, including, but not limited to, selling targeted ads or transferring data or information to a third-party through either sale, rental, or sharing.
We have a zero-tolerance approach to privacy and data breaches. In 2023, 2022 and 2021 we did not identify any substantiated complaints regarding leaks, thefts, or losses of stakeholder data.
Incidents Relating to Data Protection and Privacy in 2023, 2022 and 2021
| Number of substantiated complaints | 2023 | 2022 | 2021 |
| -From regulatory entities | 0 | 0 | 0 |
| -From other sources | 0 | 0 | 0 |
| Total substantiated complaints | 0 | 0 | 0 |
Tax Management
Tax Strategy
Atlantica has a tax strategy in place that serves as a set of principles and guidelines for all our geographies. This strategy is based on values of integrity, compliance, and excellence, complies with Schedule 19 of the U.K. Finance Act 2016, and is publicly available on our website.
Our tax policy, procedures and processes apply to our tax operations, reporting and compliance of Atlantica and its subsidiaries.
The Tax Strategy applies to directors, officers, finance and administration personnel, tax professionals employed by Atlantica, as well as other stakeholders, including tax advisors and service providers.
General Principles
Atlantica is committed to complying with all tax obligations and providing disclosure to tax authorities. Compliance for Atlantica means paying the right amount of tax in the right place at the right time.
We are also committed to applying the Organisation for Economic Co-operation and Development (OECD) tax guidelines for multinational companies - including the adoption of the arm’s length principle in intra-group related party transactions following OECD guidelines - and complying with the tax legislation in force in those countries where we operate.
Atlantica’s Tax Strategy is governed by the following tax practices:
| - | Attitude towards tax planning |
Our business activities are conducted in compliance with tax obligations in the countries where we are present. We do not engage in aggressive tax planning and do not participate in artificial tax avoidance schemes to reduce our tax liability. Our tax planning is supported by economic arguments. In addition, we engage with external tax advisors where there is need for tax guidance and support.
| - | Tax risk management and tax governance |
We have implemented risk management tools to identify, monitor and mitigate any potential tax risk.
The management and control of tax risk begins with the identification and classification of the risks to which we are subject. We regularly assess our tax risks and uncertainties. The effectiveness of our tax procedures is ensured through different workflows of approval, periodic monitoring of tax affairs with corporate departments and local employees, external advisory, and periodic internal and external audits.
Atlantica’s Corporate Tax Department trains, educates and supports corporate and local departments that manage or process tax data.
| - | Appropriate relationship with tax authorities |
We seek to have a relationship with tax authorities based on integrity, transparency and good faith, aiming to resolve any potential dispute in a timely manner by working collaboratively with them.
We engage with tax advisors where a particular tax law or regulation is unclear or subject to interpretation to be fully compliant or to help the administration team in those geographies where we do not have a local tax team.
Tax governance bodies and organisation
Atlantica has integrated the Tax Strategy into its businesses. The tax strategy is applied through different governance bodies at Board and management level.
| Board of Directors |
- Responsible for the effective oversight of among others, Atlantica’s tax affairs. - The Board reviews potential tax risks when evaluating investments and receives tax updates on an as-needed basis. |
| Audit Committee (at Board level) |
- The Audit Committee assists the Board in fulfilling its oversight responsibilities concerning the risks, including the tax function. - The Audit Committee receives tax updates on an as-needed basis. |
| Business Committee |
- Analyse short and medium-term key decisions and define appropriate action plans to implement these decisions, including tax implications. |
| Investment Committee |
- Analyse potential growth opportunities considering tax implications. |
| Accounting and Disclosure Committee |
- Responsible for analysing and implementing the Company’s most significant accounting policies, including those related to tax accounting and decide on the appropriate disclosure of tax effects. |
Key tax-related departments and responsibilities include:
| Corporate tax Department |
- Under the CFO´s supervision, is responsible for the design, development, implementation and coordination of the tax function following our Tax Strategy. - Meetings with Geographic VPs, country managers and tax advisors among others, are held to evaluate tax risks. |
| Local tax and administration departments |
- Responsible for the execution of the tax functions. They are responsible for the tax compliance functions in the countries under their responsibility in coordination with the Corporate Tax Department. |
| Geographic VPs and country managers |
- Overall responsible for the assets they manage, including tax compliance in the countries under their responsibility. |
| Consolidation Department |
- Responsible for the accounting policies, including the tax accounting and deferred taxes. |
| Internal audit Department |
- Oversee internal controls, evaluate policies, procedures and tools implemented by the Company, including those related to the tax function. |
Tax stakeholder engagement, management of stakeholder concerns, and mechanisms for reporting unethical or unlawful tax behaviour
We have different communication channels in place to
report any misconduct or instances of non-compliance with our compliance policy framework, including tax irregularities, or unethical or unlawful tax behaviour. These are the whistleblower and the compliance channels. Additional information is
provided in the Ethics section of this Strategic Report.
Section 172 Statement
The Board is ultimately responsible for the long-term success of the Company. Our Directors are aware of their responsibility to promote the success of the Company in accordance with Section 172 of the Companies Act 2006 and have acted in accordance with these responsibilities during the year.
The Board’s Approach to Section 172 and Decision-Making
The Board acknowledges that Atlantica’s purpose is to support the transition towards a more sustainable world by investing in and managing sustainable infrastructure assets, while creating long-term value for its shareholders, employees, suppliers, customers, business partners, local communities and debt investors. As such, the Board has considered their interests and the impact of its decisions on these stakeholders as part of its decision-making process. When making such decisions, each Director has acted in the way they consider, in good faith, would most likely promote the success of the Company for the benefit of its stakeholders.
The Board believes governance of the Company is best achieved by delegation of its authority for the executive management to the Chief Executive Officer, subject to a set of defined limits and monitoring by the Board. The Board routinely monitors the delegation of authority, ensuring that it is regularly updated, while retaining ultimate responsibility.
Stakeholder Identification and Engagement
At Atlantica, we acknowledge that our stakeholders have a broad range of interests and viewpoints. We believe that collaboration with them is key to our success. As such, we listen and do our best to gain stakeholders’ trust, thus leading to a more stable and long-term relationship. Across the Company, we engage with our stakeholders to obtain input that can be helpful as we execute on our strategy.
We believe that systematic stakeholder engagement, executed properly, is likely to result in ongoing learning within the Company, as well as increased accountability to a range of stakeholders.
We have made a two-way engagement channel available for our stakeholders to build trusting long-term relationships. We refer to the ESG materiality analysis for further information on stakeholder inclusiveness.
The Board ensures that stakeholder considerations are considered in strategic decision-making by requiring that strategic proposals include an analysis of key stakeholder impacts, which form part of the decision-making process.
Our Employees
Our people are fundamental for the long-term success of the Company. Atlantica, its Board and its management are committed to prioritising and actively promoting health and safety. In addition, we provide a work environment free of discrimination, intimidation and sexual and non-sexual harassment where everyone can participate in the success of the business. We refer to sections Health and Safety, Business Ethics, Human Rights, and People Management.
We perform an employee climate survey at least every three years to assess employees’ satisfaction. The goal is to receive feedback, as well as to engage with our employees. The survey includes questions about job satisfaction and purpose, happiness and potential stress levels. The process is confidential, managed by a third-party, and results are aggregated, shared and discussed with supervisors. In October 2022 we carried out an employee climate survey. Approximately 78% of employees took part and the general engagement with the Company was 68%. Atlantica scored highly in several areas, including employees’ satisfaction with their immediate manager/supervisor. This survey helped us to identify certain areas for improvement. Management prepared action plans for those areas. The Board was informed of the results of the survey and of the action plans taken by management.
We refer to the Employees, Diversity and Inclusion, Business Ethics, Our People and Culture, Health and Safety and Data Privacy sections for further employee-related details and initiatives.
Key employee-related metrics followed by the Board include:
| 2023 | 2022 | ||
| Health and Safety | Total Recordable Frequency Index (TRFI)6 | 4.3 | 5.2 |
| Lost Time Frequency Index (LTFI)7 | 1.9 | 3.1 | |
| Near Misses Unsafe Acts and Unsafe Conditions Frequency Performance Indicator | 1,714 | 1,246 | |
| Human Rights | Number of human rights incidents | 0 | 0 |
| Employee | Voluntary Turnover by year-end | 7.6% | 12.8% |
| Total turnover by year-end | 10.7% | 16.8% | |
|
Average Annual Training per employee (in hours) |
33 | 29 | |
| Percentage of Women | At Management Level | 17% | 23% |
| Over Total Number of Employees | 17% | 20% | |
| Data Protection and Privacy | Number of data protection and privacy incidents | 0 | 0 |
Note 1: Turnover rates calculated based on the average number of employees in each year.
Note 2: Health and safety industry benchmarks provided in the Health and Safety section.
Our Shareholders and Debt Investors
The support and engagement of our shareholders, potential shareholders, debt investors and capital markets are key for the future success of our business. Continued access to capital is of vital importance to the long-term success of our business, especially considering that our strategy includes distributing a high portion of the cash we generate as dividend and growing that dividend through acquisitions and investments.
We strive to effectively communicate our strategic objectives and operating and financial performance through our engagement activities, including:
| - | Dialogue with shareholders, prospective shareholders and analysts, led by the Chief Executive Officer, Chief Financial Officer and Head of Investor Relations. Our Chair of the Board and Independent Directors are also available to meet institutional shareholders. |
| - | Quarterly earnings presentations with Q&A. |
Major investor relations engagement activities carried out in 2023 include:
| - | 144 meetings with existing and potential investors. |
| - | Attendance at 19 investor conferences and roadshows. |
Investors can contact our Head of Investor Relations or access all public information on our website (www.atlantica.com).
The Board periodically receives feedback on the views of our shareholders, including their main issues and concerns. The Board also reviews reports from sector analysts on the Company.
| 1 | Total Recordable Frequency Index (TRFI) represents the total number of recordable accidents with and without lost-time recorded in the last 12 months per million hours worked. |
| 2 | Lost Time Frequency Index (LTFI) represents the total number of lost-time accidents recorded in the last 12 months per million hours worked. |
The Annual General Meeting is also an important part of effective engagement and communication with shareholders. All shareholders have the opportunity to ask questions at our AGM meetings. The Chair of the Board and the Chairs of all the Committees at Board level are available to answer questions at that meeting.
We also maintain a dialogue with the two proxy advisory agencies covering Atlantica to explain the main resolutions included in the notice to our AGM and answer any questions they may have.
The Environment and Local Communities
Our Board of Directors believes climate change can lead to significant risks and opportunities for the Company and its stakeholders. Our strategy is focused on climate change solutions in the power and water sectors, and we therefore see sustainability and climate change as a growth opportunity for us.
Following our long-term commitment to sustainability, we have set targets to reduce our:
| 1. | GHG emissions. We target to: |
| (i) | reduce Scope 1 and 2 GHG emissions per kWh of energy generated by 70% by 2035 from a 2020 base year8. This target has been approved by the Science Based Targets initiative (SBTi) |
| (ii) | reduce our Scope 3 GHG emissions per kWh of energy generated by 70% by 2035 from a 2020 base year, and |
| (iii) | achieve Net Zero GHG emissions by 2040. |
| 2. | Non-GHG emissions. We target to reduce our non-GHG emissions9 per kWh of energy generated by 50% by 2035 from a 2020 base year. |
| 3. | Water consumption. We target to reduce our water consumption per kWh of energy generated by 50% by 2035 from a 2020 base year. |
In addition, we have a goal to maintain over 85% of our adjusted EBITDA generated from low carbon footprint assets including renewable energy, storage, transmission infrastructure and water assets.
Our Board takes sustainability targets into consideration while making decisions, including capital allocation. Our Board also monitors the main impacts that our assets may have on the environment through waste.
Furthermore, we acknowledge that our day-to-day activities have impacts on nearby communities.
The key metrics followed by the Board are:
| 2023 | 2022 | |||
| At least 85% of Adjusted EBITDA coming from low carbon footprint assets | 89% | 89% | ||
| GHG Emissions | Scope 1 | thousand tonnes of CO2 | 1,775 | 1,844 |
| Scope 2 | thousand tonnes of CO2 | 250 | 249 | |
| Scope 3 | thousand tonnes of CO2 | 799 | 814 | |
| Total | thousand tonnes of CO2 | 2,824 | 2,907 | |
| Scopes 1 and 2 GHG Emission Rate per Unit of Energy Generated | tonnes of gCO2/kWh | 162 | 168 | |
| Offsets | thousand tonnes of CO2 | 380 | 320 | |
8 The target boundary includes steam generation.
9 Non-GHG emissions including nitrogen oxide (NOx), sulfur dioxide (SO2) and carbon monoxide (CO).
|
Scopes 1 and 2 GHG Emission Rate per Unit of Energy Generated |
tonnes of gCO2/kWh | 162 | 168 | |
| Offsets | thousand tonnes of CO2 | 380 | 320 | |
| Water Management | Withdrawal | m3 per MWh | 1.46 | 1.54 |
| in Power Generation | Discharges | m3 per MWh | 0.17 | 0.18 |
| Waste | Hazardous waste | tonnes of waste | 1,402 | 1,908 |
| Management | Non-hazardous waste | tonnes of waste | 25,993 | 23,142 |
| Community Investment and Development | Investments focused on improving infrastructure and supporting education | |||
We refer to the Key Performance Indicators, Environmental Sustainability and Local Communities sections for further environment and local communities-related details and initiatives.
Our Suppliers and Business Partners
We have a Supplier Code of Conduct and expect our suppliers to adhere to it. We include our requirements in our contractual arrangements with suppliers. The Board reviews our Code of Conduct and Supplier Code of Conduct on an ongoing basis, at least once per year. In addition, we have a Modern Slavery and Human Trafficking Statement which sets out the steps taken to prevent modern slavery in our business and supply chains.
In 2023 we continued the environmental certification of our suppliers described in the Supply Chain Management section.
In addition, we have partners in some of our assets. In some cases, we have control over the asset. In other cases, we do not manage the projects’ day-to-day operations. To the extent possible, considering Atlantica’s ownership interest, we try to apply our Code of Conduct and business ethics practices in affiliates where we do not have control.
Among others, the key metrics followed by the Board are:
| 2023 | 2022 | |
| Adherence of suppliers to Atlantica’s Supplier Code of Conduct | ~100% | ~100% |
| Internal pre-screen evaluation of new suppliers | 100% | 100% |
| External supplier evaluation1 | ~60% | ~45% |
1 Percentage of total annual operating expenses
We refer to the Supply Chain Management section for further supply chain-related details.
Our Customers
Our customers are mainly comprised of electric utilities and corporations. We also have electric systems and government owned electricity and transmission companies as customers.
Engagement with clients is achieved through dialogue led by Geographic VPs, country managers and/or asset managers. This generally enables us to identify and react in advance to our customers’ needs. We listen and do our best to gain our customers’ trust, thus leading to a more stable and long-term relationship.
We refer to the Customer Management section for further customer-related details.
Strategic Decisions
In 2023, the main decisions relate to our strategy going forward, the development and construction of new projects and the investment in new assets.
Investments
Our Board analyses and approves, if deemed appropriate, investment and acquisition opportunities and development and construction projects proposed by our Investment Committee. We refer to section “Events during the Period” under the “Strategic Report” section for more information.
When approving these investments, the Board continued to promote the transition towards a low-carbon energy industry and a business model based on sustainable development. The Board considered our long-term growth plan, expected returns for each investment, impact on GHG emissions and environmental targets, synergies with existing assets, risks involved in each asset investment (operational, country and off-taker credit risk, etc.), and potential impacts to communities and the environment. The Board also considered resources available to finance these investments in the context of our broader growth plan. While deciding investments, the Board took into consideration the interest of all our stakeholders.
We refer to the Events During the Period section (Strategic Report) for further details on our 2023 investments approved by the Board.
Dividends
In 2023, the Board decided to pay total dividends of $1.78 per share to our shareholders in quarterly dividends. Details of the dividend policy are included in Directors’ Report, where we explain our long-term approach to dividends. The Board decides the dividend on a quarterly basis. The Directors considered the performance of our assets, cash available for distribution generated in the period, available liquidity under our financing arrangements and investment plans of the Company. The Directors also considered the net corporate debt position of the Company.
The Board deliberated on and concluded that the level of dividends approved would promote the long-term success of the Company.
We refer to the Events During the Period and Financial Review sections for further details on our 2023 dividends.
Strategic Review Process
On February 21, 2023, Atlantica’s board of directors commenced a process to explore and evaluate potential strategic alternatives that may be available to Atlantica to maximize shareholder value. The Board believes the Company has attractive growth and other opportunities in front of it and is committed to ensuring it is best positioned to take advantage of those opportunities. The decision has the support of the Company’s largest shareholder, Algonquin. During the year 2023, the Board discussed different strategic alternatives. As of December 31, 2023, the strategic review was ongoing.
Non-Financial and Sustainability Information Statement
The table below sets out where the information required by sections 414CA and 414CB of the Companies Act 2006 (as applicable to Atlantica) can be found in this Annual Report.
| Climate Related Financial Disclosures | Reference in the IAR |
| Atlantica’s governance arrangements in relation to assessing and managing climate-related risks and opportunities | TCFD “Governance” section |
| Identification, assessment, and management of climate-related risks and opportunities | TCFD “Strategy” section |
| Integration of climate-related risk management processes into Atlantica’s overall risk management process | TCFD “Risk Management” section |
| Principal climate-related risks and opportunities arising in connection with Atlantica’s operations | TCFD “Strategy” section |
| Time periods by reference to which those risks and opportunities are assessed | TCFD “Metrics and Targets” section |
We also voluntarily disclose additional information required by sections 414CA and 414CB of the Companies Act 2006. The table below shows where this information can be found in this Annual Report and the corresponding policies Atlantica has in place.
| Requirement | Reference in the IAR | Policy |
| Environmental Matters | We refer to the “Environment” section |
- Environmental Policy - Biodiversity Policy - Water Policy |
| Employees |
We refer to the “Social Sustainability” section: - Occupational Health and Safety - People and Culture |
- Code of Conduct - Health and Safety Policy - Diversity and Inclusion Policy |
| Social Matters |
We refer to the “Social Sustainability” section: - Local Communities - Supply Chain management |
- Community development and Involvement Policy - Stakeholder Policy - Supplier Code of Conduct |
| Human Rights |
We refer to the “Social Sustainability” section: - Human Rights - Section 172 Statement We refer to “Governance” section: - Business Ethics |
- Human Rights Policy - UK Modern Slavery Act |
| Anti-Bribery and Corruption |
We refer to the “Social Sustainability” section: - Human Rights - Section 172 Statement We refer to “Governance” section: - Business Ethics |
- Anti-Bribery and Corruption Policy - Code of Conduct - Supplier Code of Conduct |
Going Concern Basis
The Group has prepared the consolidated financial statements on a going concern basis. The Directors have considered a number of factors in concluding in their going concern assessment covering the period to March 31, 2025. The Directors have a reasonable expectation that the Group and Company will meet its commitments as they fall due over the going concern period. Accordingly, the Directors continue to adopt the going concern basis in preparing the Group’s consolidated financial statements and Company’s standalone financial statements. For further information, please refer to Note 2.1 of the consolidated financial statements for the going concern basis.
Approval
This Strategic Report was approved by the Board of Directors on February 29, 2024 and signed on its behalf by Santiago Seage, Director and Chief Executive Officer.
Director and Chief Executive Officer
Santiago Seage
February 29, 2024
Governance
Business Ethics
“Integrity, Compliance and Safety” is our first value and prevails over the rest. We are committed to promoting ethical business practices and complying with all relevant laws and regulations. Atlantica has a Code of Conduct to ensure consistent and effective commitment to Integrity and Compliance.
The Company also has policies, processes, and procedures in-place to prevent and mitigate actions improper or contrary to law and to ensure ethical principles are applied in all our activities. We hve measures in place to prevent and combat corruption effectively and efficiently. Our Anti-Bribery and Corruption Policy applies to all Atlantica businesses.
Atlantica business activities are governed by laws that prohibit bribery supporting global efforts to fight corruption. Specifically, the U.S. Foreign Corrupt Practices Act (FCPA) and the U.K. Bribery Act 2010 make it a criminal offense for companies, as well as their officers, directors, employees, and agents, (or any other person) to give, request, promise, offer or authorise the payment of anything of value (such as money, any advantage, benefits in kind, or other benefits) to a foreign official, foreign political party, officials of foreign political parties, candidates for foreign political office or officials of public international organisations to obtain or retain business. Similar laws have been or are being adopted by other countries. Private bribery is also illegal under U.S. laws, the U.K. Bribery Act, and the laws of other jurisdictions in which Atlantica operates.
Atlantica is a member of the United Nations Global Compact (UNGC) initiative. The UNGC and its principles are an integral part of Atlantica’s strategy and our objective is to also make it part of our suppliers’ strategy. Please read further details in the UNGC section of this Integrated Annual Report.
We have zero tolerance for modern slavery and we confirm that no incidents of modern slavery were reported or identified during 2023, 2022 and 2021. Please see additional details on modern slavery in the Anti-Slavery and Human Trafficking Statement of this Report and Accounts.
All our employees must annually read, understand, and commit to following our corporate governance policies. In addition, all our officers and employees working with confidential information sign a formal commitment annually acknowledging our Insider Trading Policy.
We regularly provide training to all our employees on our corporate policies to promote our compliance culture and to ensure that all our employees understand and apply all our compliance policies.
We encourage our employees and other stakeholders to address any questions or comments they may have to our Compliance team. We have different communication channels available to report any misconduct or instances of non-compliance with our compliance policy framework. These are:
| - | Whistleblower channel: Either through our website or via email. Additional information is provided in the Whistleblower section. |
| - | Compliance channel: Email to (i) communicate any potential irregularities or (ii) request advice. Additional information is provided in the Compliance Management Committee section. |
In 2023 and 2022 we did not identify any breach to our Anti-Money Laundering policy or our Insider Trading policy. In addition, we did not identify any potential breach regarding our policies on Conflicts of Interest.
Code of Conduct
Atlantica has in place a Code of Conduct to ensure commitment to Integrity and Compliance. The Code applies to all directors, officers, and employees of Atlantica Sustainable Infrastructure plc and each of its subsidiaries under its control. In those, non-controlled companies in which Atlantica has interest, we encourage to our partners to apply similar principles and values. We also seek to work or partner with third parties that adhere to principles that are similar to those set out in this Code. As an example, when we evaluate potential co-investments with business partners, the Investment Committee and more specifically, the Head of Risk Management, reviews the business partner’s code of conduct as part of the due diligence process. If the business partner does not have its own code of conduct, they must adhere to Atlantica’s Code of Conduct or adopt one.
In 2023 and 2022, two Code of Conduct incidents were identified respectively. All incidents were investigated following our internal process and procedures. Investigations have been carried out by local teams with the collaboration and supervision of Compliance, Risks and Internal Audit Teams to clarify the facts. As a result, among other actions, the employment of those employees involved did not continue and comprehensive anti-bribery and corruption training was provided to local employees. In 2021 we did not identify, nor did we receive, any notification of non-compliances or breaches in relation to the Code of Conduct.
Atlantica’s Code of Conduct, in line with the Donations, Social Contributions and Sponsorships Policy, prohibits political involvement of any kind on behalf or as a representative of the Company. Donations, Social Contributions and Sponsorships are subject to internal review and approval.
All Atlantica employees must annually read, understand, and commit to following our Code of Conduct.
Compliance Management Committee
Atlantica’s Compliance Management Committee is comprised of the General Counsel, the Head of Risk Management, and the Head of IT and Administration. The Committee is supervised by the General Counsel - who is also the Compliance Officer, the Secretary of the Board of Directors and the Head of People and Culture - and reports its activities to the Business Committee (at Management level), the Nominating and Corporate Governance Committee (at Board level) and the Board, as applicable. The Compliance Management Committee’s main objective is to support the Compliance Officer and assist all our employees and the Board in formulating, reviewing, monitoring and implementing the Company’s Compliance Program, policies and procedures. The Compliance Management Committee receives regular reports from local managers in each of our geographies where we are present on compliance-related matters.
We have a compliance mailbox (compliance@atlantica.com) where our employees and other stakeholders can send any questions and/or comments they may have. We encourage our stakeholders to report any irregular behaviour through any of the available communication channels in place. We have incorporated the communication channels in many public documents as well as in internal training to encourage its use.
Anti-Bribery and Corruption Policy
We have an anti-bribery and corruption policy and procedures to forestall and prevent operations related to corruption, bribery, and fraud. The Policy establishes that:
| - | Any type of bribery is prohibited. |
| - | Political Contributions on behalf or as a representative of the Company are forbidden. Donations, Social Contributions and Sponsorships are subject to internal review and approval. |
| - | Travel, entertainment, and gifts may never be accepted for the purpose of improperly obtaining, retaining business, or securing any improper advantage from public officials or private persons. An internal approval is needed to give or receive any donations, gifts, sponsorships or similar activities with an economic value equal or above $90 considered in a calendar year. |
| - | Using an independent contractor, agent, consultant, intermediary, reseller, distributor or any other third party to pay or give a bribe is strictly prohibited. |
Additionally, accounting procedures and internal control over financial reporting prohibit cash payments other than well documented petty cash disbursements which have to follow very strict procedures.
A summarised version of our Anti-Bribery and Corruption Policy is available on our website.
Criminal Risk Assessment Policy
Atlantica has a Criminal Risk Assessment Policy that was approved by the Board of Directors in 2018 and was last amended in December 2023. The main purpose of this Policy is to identify and mitigate the criminal risks towards Atlantica arising from its business activities.
Criminal offences for which legal entities may be liable vary across the different jurisdictions where Atlantica is present. Therefore, each geography has a specific criminal risk map that includes: (i) Type of offense, (ii) an internal assessment of the risk level (low, medium and high), (iii) prevention mechanisms, (iv) control mechanisms and (v) action plans.
In 2023, local external lawyers reviewed our criminal risk map of each geography and made the correspondent updates were deemed necessary. Some of the risks identified were: financial offences, money laundering, corruption, bribery, and illicit trade crimes.
All risks identified in the risk map were assessed by Atlantica. Most of the criminal risks were classified as low risks for Atlantica. For those risks identified as medium or high level risk, Atlantica has stablished prevention mechanisms and control procedures that mitigate the identified risk.
Whistleblowing Channel
The Whistleblowing Channel is an essential part of Atlantica’s commitment to preventing fraud, irregularities, and corruption. It is available on our website to all employees and stakeholders in two languages. It is managed by the Audit Committee and serves as a tool to report any complaints and concerns about management, as well as any breaches of the Code of Conduct or any conduct contrary to ethics, law, or Company policies and standards. Confidentiality and no retaliation are the essential operating principles of the channel. We may suspend these principles only where the claimant did not act in good faith.
In 2023, no communications were received through the Whistleblower Channel. In 2022, we received one communication. The matter was analysed following our internal process and procedures. We concluded that the communication was unrelated to the Company and its businesses. In 2021 no communications were received through the Whistleblower Channel in relation to any irregularities.
We have implemented initiatives to encourage its use, including descriptive and user-friendly instructions on how to use it, providing two languages to report misconducts. We provided these explanations through our internal online compliance training and in-person training. Our ethics mailboxes are included in many of our publicly available reports.
Training and Communication about anti-corruption policies and procedures
Atlantica has a training programme on the Code of Conduct and related-policies. This includes the Anti-Corruption Policy, Anti-Money Laundering Policy, Equality, Harassment Prevention and Human Rights and FCPA. Training is provided to all employees on an annual basis. In addition, Directors generally receive training addressing topics such as Sarbanes-Oxley regulation, directors’ duties and governance requirements under the Nasdaq rules, the U.S. Securities and Exchange Commission and the U.K. Companies Act 2006.
In 2023, 2022 and 2021, we provided training to our employees on our corporate policies to promote our compliance culture and to ensure that all our employees understand and apply all our compliance policies. We believe the training helps employees to: (i) identify “red flags” corruption warning signs, (ii) mitigate corruption risks, (iii) report a breach and understand the steps the Company takes to address whistleblower complaints, including protection from retaliation, and (iv) understand potential sanctions driven by compliance breaches.
In 2023, compliance-related training was provided to employees through our online training platform, in-person training, and real-time video conferencing. Below we disclose the trainings provided and the number of participants that took part in each training during 2023.
Summarised Compliance Training
| Training | Goals | Type | Minutes per Employee | Participants |
| Code of Conduct awareness1 | Acquaint employees with the importance of the Code of Conduct through real-life cases. | Online platform | 8 | 603 |
| Anti-Bribery and Corruption1 | Acquaint employees with the importance of identifying and avoiding situations that could involve corruption or conflicts of interest through real-life cases. | Online platform | 8 | 503 |
| Anti-Money Laundering2 | Acquaint employees with the mechanisms or procedures aimed at giving the appearance of legitimacy or legality to goods or assets of criminal origin. | Online platform | 8 | 154 |
| Environment, Social and Governance (ESG), Human Rights, Unconscious Bias, Gender Equality and Sexual Harassment3 | Acquaint employees with key ESG, human rights unconscious bias, diversity and inclusion principles, gender equality and sexual harassment measures, regulations and policies. | Online platform | 8 | 332 |
| Equality, Harassment Prevention and Human Rights2 | Acquaint employees with understanding gender equality, diversity and inclusion principles, unconscious bias, inclusive language, harassment prevention and Human Rights principles. | Online platform | 29 | 50 |
|
Sexual Harassment and Discrimination4
|
Acquaint employees with sexual harassment and discrimination prevention | Online platform | 68 | 292 |
| Compliance Training on Labour Regulation | Acquaint managers and supervisors on managing requests submitted by employees under the Family and Medical Leave Act, which is a United States labor law requiring covered employers to provide employees with job-protected, unpaid leave for qualified medical and family reasons. | Online platform | 483 | 40 |
| Atlantica Management Model5 | Acquaint office employees on Atlantica’s (1) long-term strategy, business model, recent milestones, and growth strategy, and (2) Compliance. Average training time: 3.5 hours (50% on Compliance matters). | In-person and real-time video conferencing | 165 | 37 |
| 1. | All Atlantica employees receive compliance training. The difference between our total workforce as of December 31, 2023, and the Participants to the compliance-related training is mainly due to: (i) new hirings and (ii) internalisation of the operation and maintenance employees at our solar assets in Spain and at Kaxu. We are still in the process of fully integrating these employees to our policies, processes and procedures. The employees who were not part of our workforce at the time of the training will receive compliance-related training in the sessions scheduled for 2024. |
| 2. | These trainings were launched in December 2023 and ended at the beginning of 2024, we report employees who did the training in 2023. |
| 3. | This training was launched in December 2022 and ended at the beginning of 2023, we report employees who did the training in 2023. |
| 4. | Specific local training following local requirements and US regulation. |
| 5. | Participants of this training were only office employees of certain geographies and employees hired in 2023 in some of the geographies where we operate. |
In 2023, Atlantica employees received a total of ~994 hours of compliance-related training, compared to ~1,025 hours in 2022. On average, each Atlantica employee received ~0.76 hours (~46 minutes) compliance training in 2023, compared to 1.15 hours (~70 minutes) in 2022.
Trade Associations
In 2023, Atlantica contributed $271.6 thousand to associations or organisations related to power generation, transmission, clean energy, and sustainability.
Trade Associations Costs in 2023, 2022 and 2021
| In thousands of U.S. dollars | 2023 | 2022 | 2021 |
| Trade associations contributions1 | 246.2 | 180.7 | 109.5 |
| (1) | None of these contributions relate to trade associations with political impact (i.e., political campaigns, ballots measures, referendums, political organisations, lobbyists or lobbying organisations, nor other tax-exempt groups). |
We aim to create transparency around our engagement with trade associations to report on how they align with the Paris Agreement.
In 2023, Atlantica signed the Action Declaration on climate policy engagement. Following this declaration we assessed the trade associations with whom we collaborate to assess their alignment with the Paris Agreement. Industry and trade associations play a formative role in the development of public policy, and their constructive support is an important enabling condition for sound climate policy.
Categories of assessment:
Explicitly aligned: Alignment with the Paris Agreement is explicitly stated.
Implicitly aligned: Alignment with the Paris Agreement is not explicitly stated but implied through explicit alignment with other relevant climate change categories.
Not aligned: While the association may work to advance climate change and/or renewable energy goals, it is not explicitly or implicitly aligned with the Paris Agreement and may maintain policy positions that are not consistent with these goals.
Not relevant: No assessment is conducted as the category is not relevant for the association assessed. This does not mean the association is ‘not aligned’.
No position: No assessment is conducted as the category could not be assessed. The association does not have a position on the category. This does not mean the association is ‘not aligned’.
| In thousands of USD | ||||||
| Trade Associations | Country | 2023 | 2022 | 2021 | Alignment with Paris Agreement | |
| Geothermal Rising | U.S. | 3.3 | 3.3 | 3.3 | Implicitly aligned | |
| American Council on Renewable Energy | U.S. | 17.5 | 12.5 | 12.5 | Implicitly aligned | |
| Independent Energy Producers Association | U.S. | 75.0 | 30.0 | - | Implicitly aligned | |
| Canadian Renewable Energy Association | Canada | 2.2 | - | - | Implicitly aligned | |
| Mexican Electricity Association (AME) | Mexico | 18.7 | 17.4 | 17.3 | Not aligned | |
| Association for Cogeneration (COGENERA) | Mexico | - | 2.5 | 2.0 | No position | |
| Spanish Chamber of Commerce | Mexico | 1.7 | - | 1.0 | No position | |
| Association for Transmission Lines (ATX) | Chile | 46.7 | 44.5 | - | Explicitly aligned | |
| Association for Renewable Energy (ACERA) | Chile | 2.3 | 1.7 | 2.2 | Implicitly aligned | |
| Association for Desalination | Chile | 0.9 | - | - | Implicitly aligned | |
| Association for Renewable Energy (SPR) | Peru | 9.0 | 7.9 | 7.7 | Implicitly aligned | |
| Energy Association (SNMPE) | Peru | 15.4 | 16.3 | 17.7 | Not aligned | |
| Association for Electric Energy Generation (AUGPEE) | Uruguay | 4.0 | 3.4 | 2.9 | Implicitly aligned | |
| Export Union of Uruguay | Uruguay | 0.8 | - | - | No position | |
| Spanish Association of Energy Storage (ASEALEN) | Spain | 4.4 | 3.7 | 5.3 | Implicitly aligned | |
| Association for the CSP sector (Protermosolar) | Spain | 24.1 | 24.9 | 25.7 | Implicitly aligned | |
| Andalusian Hydrogen Association | Spain | 3.0 | - | - | Implicitly aligned | |
| Spanish Hydrogen Association | Spain | 3.6 | - | - | Implicitly aligned | |
| Spanish Confederation of Business Organisations (CEOE) | Spain | 13.1 | 12.6 | 11.9 | Implicitly aligned | |
| Total | 246.2 | 180.7 | 109.5 | |||
Note: We have revised 2022 and 2021 numbers to account for our contributions to trade associations, excluding contributions already accounted for as donations to local communities, such as Bishop, Lone Pine and Ridgecrest Chamber of Commerce
| Conclusion | % of total spent in 2023 |
| Implicitly or Explicitly Aligned | 85% |
| No position | 1% |
| Not aligned | 14% |
Atlantica engages with trade associations or organizations that have the same goals as Atlantica in terms of power generation, transmission, clean energy, and sustainability. After conducting our assessment, we concluded that the only associations that may not be aligned with the Paris Agreement are those that support investments in gas generation plants, mining and fossil fuels. Our contribution to these associations represents less than 15% of the total amount contributed to trade associations. While a significant part of our business consists of renewable energy assets, we also own a 300 MW efficient natural gas plant and a non-controlling stake in a gas-fired engine facility which uses natural gas (Monterrey). In 2023, our partner in Monterrey initiated a process to sell its 70% stake in the asset. Such process is well advanced and, as part of it, we intend to sell our interest as well under the same terms. The transaction is subject to certain conditions precedent and final transaction closing.
Sustainability Governance
Given that it is the ultimate decision-making body, the Board of Directors is the highest level of responsibility for ESG and climate change-related matters. The CEO, in his executive role and as Director of the Board, holds the leading position and responsibility in relation to ESG and climate change-related matters.
ESG and climate change encompass many of Atlantica’s key daily and long-term activities. It is a cross-functional activity that involves Geographic VPs, country and asset managers, as well as multiple corporate departments, including among others, the Operations, Health and Safety, Environment, Compliance, People and Culture, and Corporate Development Departments.
Sustainability Governance Structure
| Board of Directors |
| Nominating and Corporate Governance Committee |
Audit Committee |
| Compensation Committee | Related Party Transactions Committee |
| Management Committees |
| Business Committee | Management Committee | Geographic Committees | |
| Compliance Management Committee | Health and Safety, ESG and Operations Committee | Internal Audit Committee | |
| Risk Management Committee | Accounting and Disclosure Committee | Investment Committee |
Finance Committee |
| Corporate and Business Areas |
Board of Directors: ESG and Climate Change Related Responsibilities and Functions
| ü | The Board is responsible for the effective oversight of the Company’s strategy and performance, financial reporting, corporate governance process, and internal control and risk management framework, including ESG and climate-related risks and opportunities. It is also ultimately accountable to shareholders for the long-term performance of the Company and value creation for shareholders and other stakeholders in a sustainable manner. |
| ü | The Board oversees the implementation of ESG and climate change initiatives and prioritises internal resources committed to the advancement of objectives. The CEO, in his executive role and as Director of the Board, manages, supervises and has a leading position and responsibility over ESG and climate change-related matters, including informing on and/or submitting the following actions for Board approval: |
| Topic | Frequency |
| Potential ESG and climate-related risks and mitigation plans |
Quarterly or on an as-needed basis.
For example, in 2023 the Board was informed (i) on the conclusions of the climate scenario analysis performed in 2022 and beginning of 2023 and (ii) quarterly on our risk map (including climate-related risks)
|
| New and/or updated ESG and climate change policies and targets | Annual |
| Environment, climate change and social key performance indicators and their status against established objectives (if applicable) |
Health and safety: always
Other social KPIs: annual
Environment and climate change KPIs (GHG emissions, water, and waste): semi-annual
|
| Best practices to improve ESG and climate change performance over time | Annual or an as-needed basis |
| Process to offset Atlantica’s GHG emissions | Annual |
| Integrated Annual Report with comprehensive ESG disclosures | Annual |
| Results of ESG-related rating evaluation assessments | Annual and on as-needed basis |
| Investment proposals in non-renewable generating assets consider Atlantica’s long-term ESG and climate change targets | Always |
| ü | The Audit Committee assists the Board in fulfilling its oversight responsibilities concerning the management of risks, controls and processes, including potential ESG factors that could be risk drivers, as well as compliance with ESG and climate-change reporting requirements. |
| ü | The Nominating and Corporate Governance Committee assists the Board in fulfilling its oversight responsibilities concerning compliance topics, including ESG-related policy approvals. |
At Atlantica, we believe that our comprehensive approach to ESG, as well as the level of engagement on ESG-related topics at the Board and Management level, enables us to deliver on heightened ESG demands from our stakeholders.
Management: ESG and Climate Change Related Responsibilities and Functions
Atlantica has integrated ESG and climate change into its businesses via policy making, ESG planning, risk management, and KPI setting and tracking. At the management level, we have assembled committees with different responsibilities based on Atlantica’s priorities. These committees are led by senior management members with diverse perspectives and experiences to efficiently and effectively address ESG related matters, risks and opportunities.
| Business Committee | ||
| Frequency | Weekly | |
| Key ESG-related functions |
- Implement short and medium-term key strategic decisions (based on the business strategy approved by the Board), including, but not limited to, health and safety, environment, people and culture, compliance, and risk matters. - Analyse and implement ESG-related best practices. - Approve (at Management level) climate change-related targets. |
|
| Key committee member* responsibilities | CEO | Leads Business Committee. |
| CFO | Responsible for among others, ESG and IT matters across our businesses. | |
| Geographic VPs | Responsible for the assets they manage, including ESG and climate change-related matters. | |
| General Counsel | The General Counsel - who is also the Compliance Officer, the Secretary of the Board of Directors and the Head of People and Culture - is responsible among others, for Atlantica’s legal, people and culture and compliance activities and reports to the Nominating and Corporate Governance Committee (at Board level) and the Board, as applicable. | |
| Head of Development and Investment and CIO | Responsible investments, including how they affect to our long-term targets on emissions. | |
(*) Other employees attend meetings by invitation.
| Health and Safety, ESG and Operations Committee | ||
| Frequency | Monthly | |
| Key functions |
- Set health and safety targets. - Set environmental protection measures. - Review key health and safety and environmental KPIs as well as best practices, lessons learned and implementation progress in relation to audit recommendations. |
|
| Key committee member responsibilities | CEO | Leads Health and Safety, ESG and Operations Committees. |
| Geographic VPs and country managers | Responsible for the assets they manage, including ESG and climate change-related matters. | |
| Head of Business Transformation | Leads the implementation of improvement programs to enhance operational processes and ways of working, optimize electricity production and avoid CO2 emissions across all assets | |
| Head of Operations | Responsible for all health and safety, environmental and operations aspects across all assets, KPI monitoring, regular environmental and operational audits, analysing measures to reduce health and safety and environmental impacts, and implementing best practices. | |
| Head of IR & ESG | Identifies sustainability best practices, proposes actions to the CEO and Geographic VPs and monitors the implementation of approved proposals. | |
| Compliance Management Committee | ||
| Frequency | Quarterly, and on an as-needed basis | |
| Key ESG-related functions | - Support the Compliance Officer and assist all our employees and the Board in implementing the compliance programmes, policies and procedures required by laws and regulations, as well as by best corporate practices. | |
| Committee member responsibilities | General Counsel | The General Counsel - who is also the Compliance Officer, the Secretary of the Board of Directors and the Head of People and Culture - is responsible among others, for Atlantica’s legal, people and culture and compliance activities and reports to the Business Committee (at Management level), the Nominating and Corporate Governance Committee (at Board level) and the Board, as applicable. |
| Head of Risk Management | Oversees risk management processes, procedures and tools implemented by the Company, including the risk map. | |
| Head of IT and Administration | Oversees IT (including cybersecurity matters), and personal data protection processes and procedures. | |
| Investment Committee | ||
| Frequency | Generally, once a week and on an as-needed basis | |
| Key ESG-related functions | Analyse potential growth opportunities considering: (1) impacts on Atlantica’s climate change-related commitments and targets, (2) ESG and climate change risks in due diligence analysis, and (3) carbon pricing to evaluate investment opportunities. | |
| Key committee member* responsibilities | Head of Development and Investment and CIO | Responsible for identifying, analysing, and presenting potential growth opportunities to the Investment Committee. Oversees all due diligence processes. |
| Head of Risk Management | Responsible for identifying and evaluating risks for potential investments, including ESG and climate change risks. | |
| Head of IR & ESG | Responsible for ensuring that investment opportunities are aligned with our long-term emissions and environmental goals and aligned with our policies. | |
(*) The Head of Finance and CIO leads the Investment Committee. The CEO, the CFO and the General Counsel are also permanent committee members. Other employees attend meetings by invitation.
Other ESG-related committees include:
| - | Risk Management Committee: Held once a month between the CEO, the CFO and the Head of Risk Management. This committee addresses all Company risks, including those related to our operating portfolio as well as assets under development or under construction. Atlantica’s risk map is reviewed and presented to the Board on a quarterly basis. ESG and climate change risks are always considered in the risk analysis process. |
| - | Internal Audit Committee: Held once a month between the CEO, CFO and Head of Internal Audit. This committee addresses corporate and business impacts driven by internal audit day-to-day activities, including, but not limited to, effectiveness of internal controls, anti-fraud procedures, policy evaluation, implementation progress of audit recommendations, and external auditor reviews on Atlantica and its affiliates. The Head of Internal Audit reports to the Audit Committee (at Board level). |
| - | Accounting and Disclosure Committee: Reviews the Form 20-F, the Integrated Annual Report and quarterly reports including quarterly financial statements prior to their publication. The Accounting and Disclosure Committee is comprised by the Chief Financial Officer, the Head of Investor Relations, Reporting & ESG, the Head of Accounting and Consolidation and the Head of Financial Control. The Head of Internal Audit attends meetings by invitation. The Accounting and Disclosure Committee approves the accounting criteria to be applied by the Company, discusses new reporting requirements and approves quarterly financial statements and disclosure. |
| - | Financing Committee: The financing committee is comprised by the Chief Financial Officer, the Head of Development and Investment and CIO and the Head of Investor Relations, Reporting & ESG. The financing committee helps to maintain the “green finance framework” used to issue green finance instruments, to finance or refinance renewable energy infrastructure, as well as transmission lines. The financing committee also helps to maintain and update the green finance report. Both documents are available at Atlantica’s webpage. The committee also decides on whether to issue green financings. |
Directors’ Report
The directors are pleased to present their Integrated Annual Report on the affairs of the Company and its subsidiaries, together with the Consolidated Financial Statements and Auditor’s Report, for the year ending December 31, 2023.
Strategic Report
The Strategic Report was prepared in accordance with the Companies Act 2006 which requires the Company to set out a fair review of our business during the financial year, including a financial analysis at year-end and the trends and factors likely to affect the future development, performance and position of the business.
Review of Business and Future Developments
The Strategic Report includes an indication of likely future developments in our business.
Dividends
We intend to distribute a significant portion of our cash available for distribution as dividend, after considering the cash available for distribution that we expect our assets will be able to generate, less reserves for the prudent conduct of our business, on an annual basis. We intend to distribute a quarterly dividend to shareholders. We intend to grow our business via organic growth through the optimisation of the existing portfolio and through investments, development and construction of new assets and acquisitions. We believe this will facilitate the growth of our cash available for distribution and enable us to increase our dividend per share over time. However, the determination of the amount of cash dividends to be paid to holders of our shares will be made by our Board of Directors and will depend upon our financial condition, results of operations, cash flow, long-term prospects and any other matters that our Board of Directors deem relevant. Our Board of Directors may, by resolution, amend the cash dividend policy at any time.
Our cash available for distribution is likely to fluctuate from quarter to quarter, in some cases significantly, as a result of the seasonality of our assets, the terms of our financing arrangements and maintenance and outage schedules, among other factors. Accordingly, during quarters in which our assets generate cash available for distribution in excess of the amount necessary for us to pay our stated quarterly dividend, we may reserve a portion of the excess to fund cash distributions in future quarters. In quarters in which we do not generate sufficient cash available for distribution to fund our stated quarterly cash dividend, if our Board of Directors so determines, we may use retained cash flow from other quarters, as well as other sources of cash, to pay dividends to our shareholders.
We refer to section “Financial Review - Use of Liquidity and Capital Requirements – C. Cash dividends to investors.”
Risks Regarding Our Cash Dividend Policy
There is no guarantee that we will pay quarterly cash dividends to our shareholders. We do not have a legal obligation to pay any dividend. While we currently intend to grow our business and increase our dividend per share over time, our cash dividend policy is subject to all the risks inherent in our business and may be changed at any time as a result of certain restrictions and uncertainties, including the following:
| - | The amount of our quarterly cash available for distribution could be impacted by restrictions on cash distributions contained in our project-level financing arrangements, which require that our project-level subsidiaries comply with certain financial tests and covenants in order to make such cash distributions. Generally, these restrictions limit the frequency of permitted cash distributions to semi-annual or annual payments, and prohibit distributions unless specified debt service coverage ratios, historical and/or projected, are met. When forecasting cash available for distribution and dividend payments we have aimed to take these restrictions into consideration, but we cannot guarantee future dividends. In addition, restrictions or delays on cash distributions could also happen if our project finance arrangements are under an event of default. |
| - | Additionally, indebtedness we have incurred under the Green Senior Notes, the Note Issuance Facility 2020, the 2020 Green Private Placement and the Revolving Credit Facility contain, among other covenants, certain financial incurrence and maintenance covenants, as applicable. |
| - | We and our Board of Directors have the authority to establish cash reserves for the prudent conduct of our business and for future cash dividends to our shareholders, and the establishment of or increase in those reserves could result in a reduction in cash dividends from levels we currently anticipate pursuant to our stated cash dividend policy. These reserves may account for the fact that our project-level cash flows may vary from year to year based on, among other things, changes in the operating performance of our assets, operational costs, capital expenditures required in the assets, collections from our off-takers, electricity market prices, compliance with the terms of project debt including debt repayment schedules and cash reserve accounts requirements, compliance with the terms of corporate debt, compliance with all the applicable laws and regulations and working capital requirements. Our Board of Directors may increase the reserves to account for the seasonality that has historically existed in our assets’ cash flows and the variances in the pattern and frequency of distributions to us from our assets during the year. |
| - | We may lack sufficient cash to pay dividends to our shareholders due to cash flow shortfalls attributable to a number of operational, commercial or other factors, including low availability, low production, low electricity prices in our assets with exposure to merchant revenues, unexpected operating interruptions, legal liabilities, costs associated with governmental regulation, changes in governmental subsidies, delays in collections from our off-takers, changes in regulation, as well as increases in our operating and/or general and administrative expenses, maintenance capital expenditures, principal and interest payments on our and our subsidiaries’ outstanding debt, income tax expenses, inability to upstream cash from subsidiaries or to do it in an efficient manner, working capital requirements or anticipated cash needs at our project-level subsidiaries. |
| - | We may pay cash to our shareholders via capital reduction in lieu of dividends in some years. |
| - | Our project companies’ cash distributions to us (in the form of dividends or other forms of cash distributions such as shareholder loan repayments) and, as a result, our ability to pay or grow our dividends, are dependent upon the performance of our subsidiaries and their ability to distribute cash to us. The ability of our project-level subsidiaries to make cash distributions to us may be restricted by, among other things, the provisions of existing and future indebtedness, applicable corporation laws and other laws and regulations. |
| - | Our Board of Directors may, by resolution, amend the cash dividend policy at any time. Our Board of Directors may elect to change the amount of dividends, suspend any dividend or decide to pay no dividends even if there is ample cash available for distribution. |
Our Ability to Grow our Business and Dividend
We intend to grow our business through the development and construction of projects including expansion and repowering opportunities, as well as greenfield development, third-party acquisitions and the optimisation of the existing portfolio. We believe this will facilitate the growth of our cash available for distribution and enable us to increase our dividend per share over time.
Our policy is to distribute a significant portion of our cash available for distribution as a dividend. We expect we will rely primarily upon external financing sources, including commercial bank borrowings and issuances of debt and equity securities in capital markets, to fund any future growth capital expenditures. To the extent we are unable to finance growth externally, our cash dividend policy could significantly impair our ability to grow because we do not currently intend to reserve a substantial amount of cash generated from operations to fund growth opportunities. If external financing is not available to us on acceptable terms, our Board of Directors may decide to finance investments with cash from operations, which would reduce or impair our ability to pay dividends to our shareholders. Our Board of Directors may also decide to finance our investments with cash generated from operations to increase the capital dedicated to finance development, construction and acquisition of new assets and foster our growth.
To the extent we issue additional shares to fund our business, our growth or for any other reason, the payment of dividends on those additional shares may increase the risk that we will be unable to maintain or increase our per share dividend level. Additionally, the incurrence of additional commercial bank borrowings or other debt to finance our growth would result in increased interest expense, which in turn may impact our cash available for distribution and, in turn, our ability to pay dividends to our shareholders.
Capital Structure
Details of the share capital, together with details of the movements in the Company’s issued share capital during the year are shown in note 13 to the Consolidated Financial Statements. The Company has one class of ordinary shares which are listed on the NASDAQ Global Select Market under the symbol “AY.” Our shares carry no right to fixed income and each share provides the owner the right to one vote at General Meetings of the Company.
When Algonquin acquired a 25% stake in our equity, Atlantica signed a Shareholders Agreement with Algonquin, which set forth that, if and to the extent provided in our articles of association, Algonquin had the right to appoint to our Board the maximum number of directors that corresponds to Algonquin’s holding of voting rights as per articles of association but in no event more than (i) such number of directors as corresponds to 41.5% of our voting securities; and (ii) 50% of our Board less one, and if the resulting number is not a whole number, it shall be rounded up to the next whole number. In 2019, Algonquin completed the purchase of 3,384,402 ordinary shares and increased its equity interest in Atlantica to 44.2%.
On December 11, 2020, Atlantica closed an underwritten public offering of 5,069,200 ordinary shares (including those sold pursuant to the underwriters’ over-allotment option) at a price of $33 per new share. Algonquin purchased 4,020,860 ordinary shares of the Company in a private placement, which closed on January 7, 2021, which represents the pro rata number of shares required to maintain their previous equity ownership in the Company. As a result, as of January 7, 2021, Algonquin was the beneficial owner of 48,962,925 ordinary shares, representing 44.2% of the issued and outstanding ordinary shares.
On August 3, 2021, we established an “at-the-market programme” and entered into the Distribution Agreement with J.P. Morgan Securities LLC, as sales agent, under which we may offer and sell from time to time up to $150 million of our ordinary shares, including in “at-the-market” offerings under our universal shelf registration statement on Form F-3 and a prospectus supplement that we filed on August 3, 2021. On the same date we entered into the ATM Plan Letter Agreement with Algonquin, pursuant to which we will offer Algonquin the right but not the obligation, on a quarterly basis, to purchase a number of ordinary shares to maintain its percentage interest in Atlantica. For the year ended December 31, 2022, we issued and sold 3,423,593 ordinary shares under such programme at an average market price of $33.57 per share pursuant to our Distribution Agreement, representing gross proceeds of $114.9 million and net proceeds of $113.8 million. Pursuant to the ATM Plan Letter Agreement, we delivered a notice to Algonquin quarterly in order for them to exercise their rights thereunder.
As of December 31, 2023, Algonquin owned 48,962,925 ordinary shares, representing a 42.2% of the issued and outstanding ordinary shares.
In addition, as of December 31, 2023, there was no treasury stock and there have been no transactions with treasury stock during the period then ended.
With regard to the appointment and replacement of directors, the Company is governed by its Articles of Association, the SEC listing rules, the U.K. Companies Act 2006 and related legislation. The Articles of Association may be amended by special resolution of the shareholders.
Substantial Shareholdings
| Name |
Ordinary Shares
Beneficially Owned
|
Percentage |
| 5% Beneficial Owners | ||
| Algonquin (AY Holdco) B.V.” (1) | 48,962,925 | 42.2% |
Notes:
| (1) | This information is based solely on the Schedule 13D filed on May 10, 2022, by Algonquin Power & Utilities Corp., a corporation incorporated under the laws of Canada. The direct beneficial owner of the shares is Algonquin (AY Holdco) B.V. |
To the best of our knowledge and based on public information, the majority of other shareholders are mainly United States-based institutional investors.
Change of Control
If any investor acquires over 50.0% of our shares or if our ordinary shares cease to be listed on the NASDAQ or a similar stock exchange, we may be required to refinance all or part of our corporate debt or obtain waivers from the related noteholders or lenders, as applicable, due to the fact that all of our corporate financing agreements contain customary change of control provisions and delisting restrictions. The project debt of two assets, with a principal amount of approximately $42 million, would also require a waiver in the event of a change of control. If we fail to obtain such waivers and the related noteholders or lenders, as applicable, elect to accelerate the relevant corporate debt, we may not be able to repay or refinance such debt (on favourable terms or at all), which may have a material adverse effect on our business, financial condition results of operations and cash flows. In addition, the PPAs of our assets in Uruguay would require a waiver in the event of a change of control and some of our PPAs and project financing agreements would require a notification. Additionally, in the event of a change of control we could see an increase in the yearly state property tax payment in Mojave, which would be reassessed by the tax authority at the time the change of control potentially occurred. Our best estimate with current information available and subject to further analysis is that we could have an incremental annual payment of property tax of approximately $9 million to $11 million, which could potentially decrease progressively over time as the asset depreciates. There could also be other tax impacts and other impacts that we have not yet identified. Furthermore, a change of control could trigger an ownership change under Section 382 of the IRC, which could have a negative impact on the Company.
In addition, if there is a change of control, all awards granted under the Long Term Incentive Plans after the approval of the amendments to the Remuneration Policy in 2023 and all past awards granted under the LTIP to executives participating in the strategic review bonus shall vest based on the satisfaction of performance conditions as at the time of the change in control. All awards granted to other employees prior to this shall vest in full on the date of the change in control. The participants must exercise their share options within a period of 30 days following receipt of a change of control notice from the Company without which, the options will lapse. Furthermore, in order to protect the Company’s know-how and to ensure continuity in terms of attainment of business objectives, the policy approved by our shareholders at the 2017 Annual General Meeting, introduced certain termination payments to key executives, including the Chief Executive Officer in the case of a change of control. This is addressed in the Policy on Payments for Loss of Office section of this report.
A change of control means that a third party or coordinated parties: (i) acquire directly or indirectly by any means a number of shares in the Company which (together with the shares that such party may already hold in the Company) amount to more than 50% of the share capital of the Company or, (ii) appoint or have the right to appoint at least half of the members of the Board of Directors of the Company.
Directors
Our Board is comprised of nine directors.
All the directors meet the U.S. securities or NASDAQ’s qualifications for independence except our CEO. Atlantica’s Board has determined that Mr. Banskota and Mr. Farquhar are not independent based on their relationship with Algonquin, which is currently Atlantica’s largest shareholder with a 42.2% ownership. Mr. Banskota was the Chief Executive Officer of Algonquin until August 2023, while Mr. Farquhar is the current Senior Vice President, Corporate and Business Development at Algonquin. Mr. Farquhar has been a director of Atlantica since he was appointed on August 30, 2023, by Algonquin. Mr. Farquhar replaced Mr. George Trisic, who was appointed by Algonquin on October 9, 2020, and who resigned from his position as director of the Company on August 30, 2023. The Board has also determined that the rest of the non-executive directors, Mr. Aziz, Ms. Del Favero, Ms. Eprile, Mr. Forsayeth, Mr. Hall and Mr. Woollcombe are independent.
| Committee Memberships(*) |
|||||||
| Name, Primary Occupation | Independent | Other Public
Company Boards |
A | N&CG | C | RPT | |
|
William Aziz President and Chief Executive Officer of BlueTree Advisors Inc. |
Yes | 1 | ✓ | ★ | ✓ | ||
|
Arun Banskota Former President and Chief Executive Officer of Algonquin |
No | - | |||||
|
Debora Del Favero Co-Founder of CMC Capital Limited |
Yes | - | ★ | ✓ | |||
|
Brenda Eprile Director and Chair of the HR Committee of Westport Fuel Systems Inc. |
Yes | 1 | ★ | ✓ | |||
|
Ryan Farquhar1 Senior Vice President, Corporate and Business Development at Algonquin |
No | - | |||||
|
Michael Forsayeth Former Chief Executive Officer and Director of Granite Real Estate Investment Trust |
Yes | - | ✓ | ✓ | ★ | ||
|
Edward C. Hall Chairman of Cypress Creek Renewables, and Vice Chairman of Japan Wind Development |
Yes | - | ✓ | ||||
|
Santiago Seage Chief Executive Officer of the Company |
No | 1 | |||||
|
Michael Woollcombe Partner of Voorheis & Co. LLP and Executive Vice-President of VC & Co. Inc. |
Yes | - | |||||
(*) A = Audit Committee; N&CG = Nominating and Corporate Governance Committee C = Compensation Committee;
RPT = Related Parties Transactions Committee
| (1) | Ryan Farquhar was appointed in 2023 |
★ Chair ✓ Member
The Board decided to limit to 4 the number of other external directorships in publicly listed companies held by board members.
The Board is committed to promoting the success of the Company. The Board is responsible to shareholders for its performance and for the strategy and management of the Company, its values, its governance and its business.
The Board’s responsibilities include setting our strategy and policies, overseeing risk and corporate governance, and monitoring progress towards meeting our objectives and annual plans. It is accountable to our shareholders for the proper conduct of the business and our long-term success, and seeks to represent the interests of all stakeholders.
Directors are obliged, among other duties, to act in the way they consider, in good faith, would be most likely to promote the success of the Company for the benefit of its members as a whole. All directors are expected to spend the time and effort necessary to properly discharge their responsibilities.
The Board intends to carry out annual self-assessments beginning in 2024.
Under English law, the Board of Directors is responsible for management, administration and representation of all matters concerning the relevant business, subject to the provisions of relevant constitutional documents, applicable laws and regulations, and resolutions duly adopted at annual general meetings.
In addition, the Board of Directors is entitled to delegate its powers to an executive committee or other delegated committee or to one or more persons.
The Board has established four Board Committees. Membership, roles, duties and authority of these committees are described in their Terms of Reference, available in Atlantica’s website (www.atlantica.com). These Terms of Reference are reviewed and updated by the Board regularly. The Board Committees are:
| - | Audit Committee. Responsible for monitoring the effectiveness of Atlantica’s financial reporting, internal control and risk management systems, as well as the integrity of the Company’s external and internal audit processes. We refer to the Audit Committee Report for additional information on its responsibilities and activities, membership, attendance, external audit assessments, internal audit plan, and whistle-blower management. |
| - | Compensation Committee. Responsible for setting the remuneration for directors and recommending and monitoring remuneration for the Company’s senior management. We refer to the Directors’ Remuneration Report for additional information on its role, membership, attendance and activities. |
| - | Nominating and Corporate Governance Committee. Responsible for reviewing the structure, size and composition of the Board as well as updating and/or issuing governance-related documents following corporate governance rules and policies, developments and best practices. |
| - | Related Parties Transactions Committee. Responsible for overseeing the implementation of a system for identifying, monitoring and reporting related-parties’ transactions. |
The directors who served throughout 2023 and to the date of this report were as follows:
| Name | Role | Term |
| William Aziz | Director, Independent | Appointed on May 5, 2020. |
| Arun Banskota | Director | Appointed on April 28, 2020. |
| Debora Del Favero | Director, Independent | Appointed on May 5, 2020. |
| Brenda Eprile | Director, Independent | Appointed on May 5, 2020. |
| Ryan Farquhar | Director | Appointed on August 30, 2023. |
| Michael Forsayeth | Director, Independent | Appointed on May 5, 2020. |
| Edward C. Hall | Director, Independent | Appointed on August 2, 2022. |
| Santiago Seage | Director and Chief Executive Officer | Appointed on December 17, 2013, resigned March 9, 2018, re-appointed on December 19, 2018. |
| George Trisic | Director | Appointed on October 9, 2020. Resigned on August 30, 2023. |
| Michael Woollcombe | Director, Independent and Chair of the Board | Appointed on May 5, 2020. |
There are no family relationships among any of our executive officers or directors. There are no potential conflicts of interest between the private interests or other duties of the members of the current Board of Directors listed above and their duties to Atlantica, except in the case of Mr. Banskota, who served as President and Chief Executive Officer at Algonquin until August 2023, and Mr. Farquhar who is the current Senior Vice President, Corporate and Business Development at Algonquin.
Detailed biographical information on Atlantica’s Board of Directors is available on our website. The Company’s Board of Directors represents a balanced structure in terms of diverse professional and industry backgrounds (i.e., financial, legal and regulatory, governance, diversity and social responsibility, energy sector, etc.), gender and geographical experience (i.e., experience in international business environments), enabling making good use of complementary views, insights and opinions to assess problems from a broader point of view, and making it more likely that the Board will take into account the best interests of all stakeholders. In August 2023, Mr. Trisic resigned as director and the Board of Directors approved the appointment of Mr. Farquhar replacing Mr. Trisic as a non-executive director, according to the terms of the Shareholders’ Agreement
As of December 31, 2023, the Board of Directors’ average tenure is less than 4 years, and the Board members average age is 61 years old.
Board member profiles:


| Total | William Aziz | Arun Banskota | Debora Del Favero | Brenda Eprile | Ryan Farquhar | Michael Forsayeth |
Edward Hall |
Santiago Seage | George Trisic | Michael Woollcombe | |
| Independent (in accordance with the Board of Directors’ determination1) | 6 | ✓ | ✓ | ✓ | ✓ | ✓ | ✓ | ||||
|
CEO/Senior Executive: CEO or senior executive experience with a large publicly traded organisation |
5 | ✓ | ✓ | ✓ | ✓ | ✓ | ✓ | ||||
|
Governance/ Other Directorships: Director of public company and/or significant governance role |
8 | ✓ | ✓ | ✓ | ✓ | ✓ | ✓ | ✓ | ✓ | ||
|
Stakeholder: Experience in managing stakeholders or represents stakeholder group |
8 | ✓ | ✓ | ✓ | ✓ | ✓ | ✓ | ✓ | ✓ | ✓ | |
|
Energy Sector: Senior executive experience in the energy sector |
5 | ✓ | ✓ | ✓ | ✓ | ✓ | ✓ | ||||
|
Mergers & Acquisitions /Growth Strategy: Senior executive experience with mergers, acquisitions and/or business growth strategy |
8 | ✓ | ✓ | ✓ | ✓ | ✓ | ✓ | ✓ | ✓ | ✓ | |
|
Compensation and Human Resources: Understanding and experience with human resources issues and compensation policies |
9 | ✓ | ✓ | ✓ | ✓ | ✓ | ✓ | ✓ | ✓ | ✓ | ✓ |
|
Financial: Senior financial executive experience / Corporate or project finance/ Capital allocation |
9 | ✓ | ✓ | ✓ | ✓ | ✓ | ✓ | ✓ | ✓ | ✓ | |
|
Legal and Regulatory: Legal and regulatory experience |
9 | ✓ | ✓ | ✓ | ✓ | ✓ | ✓ | ✓ | ✓ | ✓ | ✓ |
|
International: Experience in international business environments |
9 | ✓ | ✓ | ✓ | ✓ | ✓ | ✓ | ✓ | ✓ | ✓ | ✓ |
|
Enterprise Risk Management |
9 | ✓ | ✓ | ✓ | ✓ | ✓ | ✓ | ✓ | ✓ | ✓ | ✓ |
| Health and Safety, Climate Change, Environment | 5 | ✓ | ✓ | ✓ | ✓ | ✓ | ✓ | ||||
| Governance, Diversity and Social Responsibility | 7 | ✓ | ✓ | ✓ | ✓ | ✓ | ✓ | ✓ | ✓ |
| Board Diversity Matrix as of December 31, 2023 and 2022 | |||||||||
| 2023 | 2022 | ||||||||
| Total Number of Directors | 9 | 9 | |||||||
| Female | Male | Non-Binary |
Did Not Disclose Gender |
||||||
| 2023 | 2022 | 2023 | 2022 | 2023 | 2022 | 2023 | 2022 | ||
| Part I: Gender Identity | |||||||||
| Directors | 2 | 2 | 7 | 7 | - | - | - | - | |
| Part II: Demographic Background | |||||||||
| African American or Black | - | - | - | - | - | - | - | - | |
| Alaskan Native or Native American | - | - | - | - | - | - | - | - | |
| Asian1 | - | - | 1 | 1 | - | - | - | - | |
| Hispanic or Latinx2 | - | - | 1 | 1 | - | - | - | - | |
| Native Hawaiian or Pacific Islander | - | - | - | - | - | - | - | - | |
| White3 | 2 | 2 | 5 | 5 | - | - | - | - | |
| Two or More Races or Ethnicities | - | - | - | - | - | - | - | - | |
| LGBTQ+ | - | - | - | - | - | - | - | - | |
| Did Not Disclose Demographic Background | - | - | - | - | - | - | - | - | |
The information provided above is based on the voluntary self-identification of each member of the Company’s Board of Directors.
Note: demographic background definitions include:
(1) Asian – A person having origins in any of the original peoples of the Far East, Southeast Asia, or the Indian subcontinent, including, for example, Cambodia, China, India, Japan, Korea, Malaysia, Pakistan, the Philippine Islands, Thailand, and Vietnam.
(2) Hispanic or Latinx – A person of Cuban, Mexican, Puerto Rican, South or Central American, or other Spanish culture or origin, regardless of race. The term Latinx applies broadly to all gendered and gender-neutral forms that may be used by individuals of Latin American heritage, including individuals who self-identify as Latino/a/e.
(3) White (not of Hispanic or Latinx origin) – A person having origins in any of the original peoples of Europe, the Middle East, or North Africa.
1 Atlantica’s Board has determined that Mr. Banskota, Mr. Farquhar and Mr. Trisic are not independent based on their relationship with Algonquin, which is currently Atlantica’s largest shareholder with a 42.2% ownership. The Board has also determined that the rest of the non-executive directors, Mr. Aziz, Ms. Del Favero, Ms. Eprile, Mr. Forsayeth, Mr. Hall and Mr. Woollcombe are independent.
Membership and Attendance
A total of 15 Board of Directors meetings were convened in 2023 with an average attendance of 99.3%. In addition, the Board passed five written resolutions.
| Director | Membership | Role |
Attendance / Eligible to attend |
|
| From | To | |||
| William Aziz | May 2020 | n/a | Director, Independent | 14/15 |
| Arun Banskota | April 2020 | n/a | Director | 15/15 |
| Debora Del Favero | May 2020 | n/a | Director, Independent | 15/15 |
| Brenda Eprile | May 2020 | n/a | Director, Independent | 15/15 |
| Ryan Farquhar | August 2023 | n/a | Director | 6/61 |
| Michael Forsayeth | May 2020 | n/a | Director, Independent | 15/15 |
| Edward C. Hall | Aug’ 2022 | n/a | Director, Independent | 15/15 |
| Santiago Seage | Dec’ 2018 | n/a | Director and Chief Executive Officer | 15/15 |
| George Trisic | Oct’ 2020 | August 2023 | Director | 9/92 |
| Michael Woollcombe | May 2020 | n/a | Director, Independent and Chair of the Board | 15/15 |
|
1. |
Mr. Farquhar was appointed as Director of the Company on August 30, 2023. |
| 2. | Mr. Trisic resigned from his position as Director of the Company on August 30, 2023. |
Senior management attend meetings by invitation of the Board.
2023 Key Activities
Major areas of focus of the Board during 2023 have been as follows:
| - | Review of health and safety issues; |
| - | Review environmental, social and governance (ESG) matters; |
| - | Review and approval of corporate policies and internal regulations; |
| - | Review and approval of the strategy of the Company: growth plan, key priorities and risks; |
| - | Review of assets’ performance and main technical issues; |
| - | Review and approval of the budget of the Company; |
| - | Review and approval of quarterly and annual accounts; |
| - | Approval of significant transactions (acquisitions, partnerships, etc.); |
| - | Review of capital markets updates; and |
| - | Approval of dividends. |
Prior to the meetings, the Secretary of the Board of Directors sent the agenda and materials to the directors provided sufficient notes and time for review.
Nominating and Corporate Governance Committee
Membership and Attendance
A total of three Nominating and Corporate Governance Committee meetings were convened in 2023, with an average attendance of 100%.
| Director | Membership | Role |
Attendance / Eligible to Attend |
|
| From | To | |||
| Debora Del Favero | May 2020 | n/a |
Director, Independent and Chair of the Nominating and Corporate Governance Committee |
3/3 |
| Michael Forsayeth | May 2020 | n/a | Director, Independent | 3/3 |
2023 Key Activities
Major areas of focus of the Nominating and Corporate Governance Committee during 2023 have been as follows:
| - | Review the structure, size and composition of the board. |
| - | Update and review key corporate governance documents and policies including amongst others, the Document Management and Retention, Criminal Risk Assessment, Conflict of Interests, Donations, Social Contributions and Sponsorship, Personal Data Protection and Water Policy |
| - | Review of governance principles, procedures and practices. |
Related Parties Transactions Committee
The Related Parties Transaction Committee is responsible for overseeing the implementation of a system for identifying, monitoring and reporting related-parties’ transactions.
As part of its duties and responsibilities, the Related Parties Transaction Committee evaluates all related parties transactions to ensure that: (1) these are not undertaken on more favourable economic terms (e.g., price, commissions, interest rates, fees, tenor, collateral requirement) to such related parties than similar transactions with non-related parties under similar circumstances, (2) no corporate or business resources of the Company are misappropriated or misapplied, and (3) any potential reputational risk issues arises as a result of or in connection with the transactions.
The Related Parties Transactions Committee shall meet as many times as required. Prior to entering into a Related Parties Transaction, the transaction shall be either approved or rejected by the non-conflicted Directors at a Board of Director’s meeting upon recommendation of the Related Parties Transactions Committee.
Membership and Attendance
In 2023, the Related Parties Transactions Committee held one meeting with an average attendance of 100%.
| Director | Membership | Role |
Attendance / Eligible to attend |
|
| From | To | |||
| Michael Forsayeth | May 2020 | n/a | Director, Independent and Chair of the Related Parties Transactions Committee | 1/1 |
| William Aziz | May 2020 | n/a | Director, Independent | 1/1 |
| Brenda Eprile | May 2020 | n/a | Director, Independent | 1/1 |
Under the principles of good corporate governance, the Code of Conduct and applicable law, any director or executive officer of Atlantica has a duty to declare any actual or potential conflict of interest in any proposed or existing transaction or arrangement. In accordance with our Policy, all transactions with related parties over $50,000 are subject to approval or ratification by the Board.
Directors’ Indemnities
The Company has made qualifying third-party indemnity provisions for the benefit of its directors which were made during the year and are in force at the date of this report.
Financial Instruments
Information about the use of financial instruments by the Company is given in note 8 to the Consolidated Financial Statements. In addition, a detailed analysis of risk, including liquidity, interest rate, foreign exchange and credit risks is provided in sections “Principal risks and uncertainties” of our Strategic report.
Environmental Reporting
Environmental information such as our (i) GHG emissions and, (ii) quantity of energy consumed from activities for which the Company is responsible for and from the purchase of electricity, heat, steam or cooling by the Company for its own use is disclosed in the Strategic Report.
Employees
As part of our commitment to diversity and inclusion, we tolerate no discrimination in employment, including discrimination based on nationality, ethnicity, religion, caste, age, disability, gender, marital status, sexual orientation, union membership, political affiliation, health, disability, pregnancy, smoking habits, or any other characteristic protected by law. In particular, we are committed to create a supportive and understanding workplace environment in which all employees feel welcome, respected and listened to, and where they can realise their full potential regardless of their race, colour, sex, age, religion, ethnicity, nationality, or disability.
Atlantica’s Diversity and Inclusion Policy was approved by the Board of Directors in May 2020 and was last amended in December 2021.
Additional information on Atlantica’s employees and its policies can be found in the Strategic Report.
Stakeholders
Details on the methods the Board has used to engage and build strong business relationships with our suppliers, customers and other key stakeholders are given on the Strategic Report (Supply Chain Management, Customer Management and Data Privacy). Further information on how the Board considered stakeholders in its decision making can be found in the Governance Section (Business Ethics and Sustainability Governance). The section 172 statement is available in the Strategic Report.
Anti-Slavery and Human Trafficking Statement
Atlantica has published its anti-slavery and human trafficking statement in accordance with the Modern Slavery Act, 2015, which can be found on www.atlantica.com. Additional information is provided in the Strategic Report.
Political Contributions
It is the Company’s policy that neither the Company nor any of its subsidiaries may, under any circumstances, make donations or contributions to political organisations, political campaigns, ballots measures, referendums, lobbyists or lobbying organisations nor other tax-exempt groups. Thus, no political donations or contributions were made during 2023, 2022 nor 2021.
Research and Development
As of December 31, 2023, we own 22 patents and technology licences related to key components of our assets, to processes and to solutions to monitor, operate and maintain our assets in a sustainable and cost-effective manner, as well as 4 patents currently in process. We also have an Operations Department that dedicates time and effort to identifying potential measures to improve asset performance, reducing operating costs and developing tools to manage our assets more efficiently. In addition, we have an in-house advanced analytics team to improve the performance of our existing technologies. Additional information on our patents and our operations and in-house advanced analytics teams is disclosed in the Strategic Report.
Corporate Governance Statement
Atlantica, as a non-premium listed company, is not required to implement the provisions of the UK Corporate Governance Code (the “Code”) and has chosen to follow the requirements of the NASDAQ Listing Rules in terms of corporate governance.
Our Board is responsible collectively for providing leadership within a framework of appropriate and effective controls that enable us to assess the risk and then manage it promoting the success of the Company. The Board is also responsible for the effective oversight of the Company’s strategy and performance, financial reporting, internal control and risk management framework, and corporate governance processes. It is also ultimately accountable to shareholders for the long-term performance of the Company and the delivery of sustainable shareholder and stakeholder value.
The Board has put in place a clear and robust corporate governance framework in order to facilitate the oversight role that it provides in these areas. This includes a schedule of matters reserved for the approval of the Board, such as the approval of acquisitions, the Company strategy and budgets, major capital expenditure, the Company’s financial statements and its dividend policy. With the aim of allowing the Board appropriate time to focus on these key matters within the constraints of its annual programme, a number of its other responsibilities have been delegated to four principal committees. Such responsibilities are set out within the Terms of Reference for each Committee, which can be found on our website at www.atlantica.com.
Auditors
Each person who is a director at the date of approval of this Consolidated Annual Report confirms that:
| - | So far as the director is aware, there is no relevant audit information of which the Company’s auditor is unaware; and |
| - | The director has taken all the steps that he/she ought to have taken as a director in order to make himself/herself aware of any relevant audit information and to establish that the Company’s auditor is aware of that information. |
This confirmation is given and should be interpreted in accordance with the provisions of Section 418 of the U.K. Companies Act 2006.
Ernst & Young S.L. and Ernst & Young LLP are our auditors providing the audit services to the Company during 2021. Ernst & Young S.L. and other member firms of EY were appointed as external auditor of the Group in February 2019 for the period 2019 – 2022.
The Annual General Meeting held in May 2022 approved the re-appointment of Ernst & Young LLP and Ernst & Young S.L. as the Company’s auditors until December 31, 2023 and the Annual General Meeting held in April 2023 approved the re-appointment of Ernst & Young LLP and Ernst & Young S.L. as the Company’s auditors until December 31, 2024.
Events After the Balance Sheet Date
Details of significant events since the balance sheet date are contained in note 25 to the Consolidated Financial Statements.
On February 29, 2024, our Board of Directors approved a dividend of $0.445 per share which is expected to be paid on March 22, 2024, to shareholders of record on March 12, 2024.
This report was approved by the Board of Directors on February 29, 2024, and signed on its behalf by Santiago Seage, Director and Chief Executive Officer.
Director and Chief Executive Officer
Santiago Seage
February 29, 2024
Audit Committee Report
Chair’s Introduction
I am pleased to introduce this report on the Audit Committee’s activities during the year. The committee has continued to assist the Board in fulfilling its oversight responsibilities by monitoring the integrity of the company’s financial reporting and risk management systems and challenging management and the external auditors on key issues including accounting judgements and control issues.
Brenda Eprile
Committee Chair
Committee Overview
Role of the Committee
The committee monitors the effectiveness of Atlantica’s financial and non-financial reporting, systems of internal control and risk management, as well as the integrity of the Company’s external and internal audit processes.
Key Responsibilities during 2023
| - | Monitoring and obtaining assurance that the processes to identify, manage, and mitigate significant and emerging financial risks are appropriately addressed by senior management and that the system of internal control is designed and implemented effectively in accordance with Board authorised limits. |
| - | Overseeing the appointment, remuneration, independence and performance of the external auditor and the integrity of the audit process overall, including the engagement of the external auditor to provide non-audit services to Atlantica. |
| - | Reviewing the effectiveness of the internal audit function, Atlantica’s internal financial controls and systems of internal control and risk management. |
| - | Reviewing financial statements and other financial disclosures along with disclosures related to ESG, climate-change matters, cybersecurity and other non-financial information for clarity and monitoring compliance with relevant legal and listing requirements, and applicable financial reporting standards. |
| - | Reviewing the systems in place to enable those who work for Atlantica to raise concerns about possible improprieties in financial and non-financial reporting or other issues and for those matters to be investigated. |
Meetings and attendance
There were 4 committee meetings in 2023. All members attended each meeting. Regular attendees at the meetings from management include the Chief Financial Officer, Head of Accounting and Consolidation Department, Head of Investor Relations, Head of Internal Audit, Corporate Secretary, and the external auditor.
| Director | Membership | Role |
Attendance / Eligible to Attend |
|
| From | To | |||
| Brenda Eprile | May 2020 | n/a | Director, Independent and Chair of the Audit Committee. Financial Expert | 4/4 |
| William Aziz | May 2020 | n/a | Director, Independent. Financial Expert | 4/4 |
| Michael Forsayeth | May 2020 | n/a | Director, Independent. Financial Expert | 4/4 |
The Directors who serve on the committee have the necessary qualifications and bring a wide range and depth of financial experience across various industries. The Board is satisfied that all three members meet the requirements to qualify as “audit committee financial experts” under applicable SEC rules. The collective knowledge, skills, experience and objectivity of the committee members enables the committee to work effectively and to have robust discussions with management on significant issues.
2023 Key Activities
Reviewing Financial Disclosure
During the year, the committee reviewed the quarterly and annual financial statements with management, focusing on the:
| ● | Integrity of the Company’s financial reporting process. |
| ● | Clarity of the disclosures. |
| ● | Compliance with relevant legal and listing requirements, and applicable financial reporting standards. |
| ● | Application of accounting policies and judgements. |
In its review of financial reporting, the committee received regular updates from management and the external auditor in relation to accounting judgements and estimates, including those related to asset impairment and recoverability.
In considering Atlantica’s 2023 Integrated Annual Report and Form 20-F, the committee assessed whether the reports were fair, balanced and understandable and whether they provided shareholders with the information necessary to assess Atlantica’s position and performance. In making this assessment, the committee examined disclosures during the year, discussed the requirements with senior management, confirmed that representations to the external auditors had been evidenced and reviewed reports relating to internal control over financial reporting. The committee made a recommendation to the Board, who in turn reviewed these reports, confirmed the assessment and approved the reports’ publication and filing.
Accounting Judgements and Estimates
The committee was briefed on a quarterly basis on the company’s key accounting judgements and estimates. The primary areas of judgement and estimation considered by the committee are laid out below. These areas were discussed with management and the external auditor throughout the year and during the review of the financial statements. The committee is satisfied that the financial statements appropriately address the key accounting judgements and estimates in the reported amounts and related disclosures.
Particular attention was paid to the following significant judgements and estimates in the 2023 financial reporting.
Estimates:
| ● | Recoverability of contracted concessional, PP&E and other intangible assets. |
| ● | Recoverability of deferred tax assets. |
| ● | Fair value of derivative financial instruments. |
| ● | Fair value of identifiable assets and liabilities arising from a business combination. |
Judgements:
| ● | Assessment of assets agreements. |
| ● | Assessment of control. |
Non-Financial Reporting
The principal risks allocated to the Audit Committee for monitoring in 2023 included those associated with:
| ● | Counterparty risk. |
| ● | Compliance with policies and regulation. |
| ● | Financial liquidity. |
| ● | Tax risk. |
| ● | Climate change, cybersecurity and other ESG related risks and reporting requirements. |
We discussed management’s ongoing approach to these risk areas during our quarterly committee meetings.
In addition, during the year, the committee reviewed the non-financial information included in the 2022 Integrated Annual Report, focusing on the clarity and consistency of the disclosure, prior to Board approval.
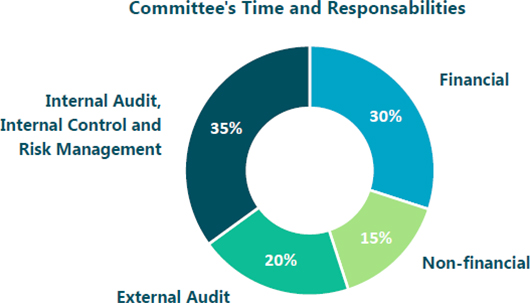
The committee performed an annual self-assessment in 2023. We discussed the findings and areas for improvement. Climate risk was an area identified as increasing in importance.
External Audit
| Ø | Assessing Audit Risk |
The external auditor prepared an audit plan for 2023 which identified key audit risks to be addressed during the audit including:
| - | Management override of controls related to relevant management estimates. |
| - | Improper revenue recognition. |
| - | Credit risk of certain significant power off-takers or customers. |
| - | Recoverability assessment of contractual concessional assets. |
| - | Risks related to material acquisitions or transactions. |
| - | Significant unusual transactions. |
| - | Financial covenants in relation to the risk of incorrect classification of current assets and liabilities. |
The committee received updates during the year on the audit process, including how the external auditor challenged management’s assumptions on key issues.
| Ø | Assessing Audit Fees |
The Audit Committee reviews the fee structure, resourcing and terms of engagement for the external auditor annually. In addition, we review the non-audit services that the auditor provides on a quarterly basis.
Fees paid to the auditor for the year were $2.4 million (2022 $2.6 million). Non-audit fees were $0.3 million (2022 $0.5 million), which was 17% of the audit and audit-related fees (see financial statements – Note 23). Non-audit or non-audit related services consisted of tax compliance in US subsidiaries and transfer pricing services. The Audit Committee is satisfied that this level of fee is appropriate in respect of the audit services provided and that an effective audit can be conducted for this fee.
| Ø | Assessing Audit Effectiveness |
Management undertook a survey which compromised questions in the following areas:
| - | Communication and availability. |
| - | Technical knowledge. |
| - | Quality of the service. |
| - | Deadline achievements. |
| - | Added value. |
| - | Objectivity. |
The results of the survey indicated that most geographic regions were satisfied with the performance of the external auditors. There were some areas for improvement, however none of them impacted the effectiveness of the audit. The results of the survey were discussed with EY for consideration in their 2023 audit approach. EY’s proposed action plan to address these areas for improvement was reviewed with the committee. Progress on addressing these matters was discussed with management at the quarterly audit committee meetings.
The committee also held in camera meetings with the external auditors during the year and the committee chair met separately with the external auditor and Head of Internal Audit at least quarterly.
The effectiveness of the external auditor is evaluated by the committee. In this regard, the committee along with management and the external auditors, responded to a survey in relation to the following areas:
| - | Auditor independence, objectivity, and professional scepticism. |
| - | Quality of the engagement team. |
| - | Communication and interaction. |
| - | Quality of service. |
The committee assessed the auditor’s approach to providing audit services and concluded that the audit team was providing the appropriate quality in relation to the services provided. The audit team has the requisite expertise, depth of knowledge, appreciation of complex issues, dedication, as well as the independence and objectivity necessary to fulfil their responsibilities to shareholders. They are able and willing to appropriately challenge management.
| Ø | Assessing Auditor Reappointment and Independence |
The committee considers the reappointment of the external auditor each year before making a recommendation to the Board. The committee assesses the independence of the external auditor on an ongoing basis. The external auditor is required to rotate the lead audit partner every five years and we have discussed and agreed succession plans with EY during the year.
| Ø | Oversight of Non-Audit Services |
The Audit Committee is responsible for Atlantica’s policy on non-audit services and the approval of non-audit services. Audit objectivity and independence is safeguarded through the prohibition of certain non-audit services and audit-related services which fall within certain defined categories. Atlantica’s policy on non-audit services states that the auditor may not perform non-audit services that are prohibited by the SEC and the Public Company Accounting Oversight Board (PCAOB).
The Audit Committee approves the terms of all audit services as well as permitted audit-related and non-audit related services.
Approvals for individual engagements of pre-approved permitted services below certain thresholds are delegated to the Head of Internal Audit. Any proposed service not included in the permitted services categories must be approved in advance either by the Audit Committee Chair or the Audit Committee before the engagement commences. The Audit Committee, Chief Financial Officer and Head of Internal Audit monitor overall compliance with Atlantica’s policy on audit-related and non-audit services, including whether the necessary pre-approvals have been obtained. The categories of permitted and pre-approved services are outlined in Note 23 of the Consolidated Financial Statements included in this Annual Report. The external auditor is considered for permitted non-audit services only when its expertise and experience with Atlantica is important.
For non-audit services, the accumulated annual fees threshold is 50% of the annual audit services fees as stated in the policy.
All services performed by EY have been approved by the committee. All fees received by EY in 2023 have been approved by the committee.
| EY | Other Auditors | Total | |
| In thousand USD | |||
| Audit Fees | 1,954 | 105 | 2,059 |
| Audit-Related Fees | 70 | - | 70 |
| Tax Fees | 344 | - | 344 |
| Total | 2,368 | 105 | 2,473 |
“Audit Fees” are the aggregate fees billed for professional services in connection with the audit of our Annual Consolidated Financial Statements, quarterly reviews of our interim financial statements and statutory audits of our subsidiaries’ financial statements under the rules of England and Wales and the countries in which our subsidiaries are organised. The increase in audit fees is mainly due to inflation increase partially counterbalanced by exchange rates variations.
“Audit-Related Fees” include fees charged for services that can only be provided by our auditor, such as consents and comfort letters of non-recurring transactions, assurance and related services that are reasonably related to the performance of the audit or review of our financial statements. Fees paid during 2023 and 2022 related to comfort letters and consents required for capital market transactions of our major shareholder are also included in this category ($25 thousand and $204 thousand in 2023 and 2022 respectively). These fees were re-invoiced and paid by our major shareholder.
“Tax Fees” include mainly fees charged for transfer pricing services and tax compliance services in our US subsidiaries.
Internal Audit
The committee reviewed and approved the 2023 Internal Audit Plan. Throughout the year the committee received quarterly reports on the findings of internal audit and actions taken to address those findings, as well as their reviews of cash distributions from its operating entities and the Group’s various financial covenants. The committee also received a report from internal audit on their annual review of the system of internal control. The committee met privately with the Head of Internal Audit each quarter. The committee continued to monitor and review the effectiveness of internal audit during the year.
Whistleblowing
The committee is responsible for monitoring the management of the Whistleblower Channel. According to the Code of Conduct, any allegation received through the Whistleblower Channel will be sent to the Chair of the Audit Committee, the General Counsel and the Head of Internal Audit.
All main procedures performed, conclusions and proposed corrective measures are communicated to the committee.
The Company’s whistle-blower policy encourages employees of the Company, its subsidiaries and all external stakeholders to raise concerns about suspected wrongdoing within the Group in complete confidence.
Atlantica’s Whistleblower Channel is available at the Company’s website www.atlantica.com.
Remuneration Report
Directors’ Remuneration Report
Introduction
This report (the “Directors’ Remuneration Report”) relates to the remuneration of the directors of Atlantica for the year ending December 31, 2023. It sets out the Remuneration Policy and remuneration details for the executive and non-executive directors of the Company. It has been prepared in accordance with Schedule 8 of The Large and Medium-sized Companies and Groups (Accounts and Reports) Regulations 2008, as amended (the “Regulations”).
The Directors’ Remuneration Report is split into three main areas:
| - | The statement by the Chair of the Compensation Committee; |
| - | The annual report on remuneration; and |
| - | The Remuneration Policy. |
The Directors’ Remuneration Report and the Remuneration Policy will be submitted to a vote by shareholders at the Annual General Meeting in April 2024. The Remuneration Policy was last approved by shareholders at the Annual General Meeting in 2021 (and amendments were approved at the Annual General Meeting in 2023). Shareholders will be asked to approve a new remuneration policy at the Annual General Meeting to be held in April 2024.
The Companies Act 2006 requires the auditors to report to the shareholders on certain parts of the Directors’ Remuneration Report and to state whether, in their opinion, those parts of the report have been properly prepared in accordance with the Regulations. The statement by the Chair of the Compensation Committee and the remuneration policy are not subject to audit.
Statement by the Chair of the Compensation Committee
I am pleased to present the Directors’ Remuneration Report for 2023. The regular and transparent dialogue with shareholders, investors and other stakeholders is a vital element in our way of operating and, through this remuneration report, we aim to increase the awareness of our shareholders of the principles of our Remuneration Policy.
The Company´s Remuneration Policy is set in accordance with applicable law, with the aim of attracting and retaining highly skilled professional and managerial resources and aligning the interests of management with the primary objective of value creation for shareholders, for the Company, its stakeholders and the members of the Company as a whole, in the medium to long term.
For the year 2024, shareholders will be asked to approve the new Remuneration Policy. The Company has received advice from Hugessen Consulting (our remuneration consultants) in relation to the Remuneration of Directors including the CEO. The changes to the current Remuneration Policy consist of (1) amending the Clawback Policy to comply with the requirements of Section 954 of the Dodd-Frank Wall Street Reform and Consumer Protection Act and the relevant Nasdaq Stock Market rules, (2) amending the maximum value of awards granted to the CEO under the Long Term Incentive Plan (“the LTIP”) from 70% to up to 105% of the CEO’s target annual remuneration (including fixed salary + target annual bonus) for the year closed before the date upon which the LTIP award is granted, (3) introducing new conditions for LTIP awards, as we describe in more detail below and (4) establishing additional fees for all non-executive directors who are chair of a board committee, eliminating the exception for the chair of the related-party committee.
In 2023, the Compensation Committee re-evaluated the operation of the Long-Term Incentive Plan for the Chief Executive Officer (the “CEO”) and for the rest of the Executives to include new conditions for the long-term compensation. We believe the new targets better align senior management objectives with shareholders by focusing on sustained delivery of high-performance results over the long-term. We have maintained Total Shareholder Return (“TSR”) as one of the conditions, as we believe this is an important measure for shareholders. We have complemented it with financial objectives (for example Adjusted EBITDA and CAFD), which we believe are key to measure the Company’s performance. We have also included strategic objectives including ESG objectives (for example, growth in renewables and storage) as well as other strategic objectives in line with the Company’s long-term strategy, such as emissions reduction targets. These are main areas of focus for the Board of Directors and are fully aligned with the long-term strategy of the Company.
Regarding the activity of the Committee during the year 2023, a total of three Compensation Committee meetings were convened in 2023. All Committee members attended each meeting that they were eligible to attend.
The Compensation Committee focused its activities on the following objectives:
| ✓ | Periodically reviewing the CEO’s annual compensation package and performance objectives; |
| ✓ | Periodically reviewing the Remuneration Policy and overall levels of remuneration for the Chief Executive Officer and senior management team, including the long-term incentive plans, in accordance with the following criteria: |
| - | Seeking an alignment between incentives, business performance and creation of value for shareholders, and |
| - | Retention in the medium to long term of high-quality personnel who can achieve ambitious targets and face the challenges that the Company will have to face in the current and future market context. |
| ✓ | Periodically reviewing the remuneration levels of non-executive Directors; and |
| ✓ | Reviewing the Company’s compensation for Directors, the CEO and management in comparison with its direct peers and best practices. |
In 2023, most of the objectives defined for the Chief Executive Officer’s variable bonus were met or exceeded and the Compensation Committee decided to approve a bonus corresponding to 104.0% of the target variable compensation, which will be payable in 2024.
To finalise, I would like to thank our shareholders for their strong vote in favour of approving the 2022 Directors’ Remuneration Report and amendments to the 2021 Remuneration Policy last year, demonstrating their support of Atlantica’s remuneration arrangements.
I look forward to welcoming you and receiving your support again at the Annual General Meeting this year.
Annual Report on Remuneration
| 1. | Single Total Figure of Remuneration for Each Director (Audited) |
In 2023, each independent non-executive Director was entitled to receive an annual fee of $150.0 thousand. The Chair of the Board and Chairs of the committees of the Board were entitled to receive additional compensation as detailed in the table below.
Non-independent non-executive directors were entitled to be compensated on the same terms as independent non-executive directors. From April 2020 until August 2023, Mr. Banskota declined compensation. Since August 2023 (when he resigned as CEO of Algonquin) Mr. Banskota has received compensation from the Company for his role as non-executive director. In 2023, Mr. Farquhar declined compensation. From April 2022 (when he retired from a senior executive role at Algonquin Power Utilities Corp) until August 30, 2023 (when he resigned from his position of Director of the Company) Mr. Trisic received compensation as a non-independent non-executive director.
The following table sets out the fee schedule for 2023 and 2022:
| In thousands of U.S. Dollars | 2023 | 2022 |
| Annual Director Retainer | ||
| Non-Executive Director | 150.0 | 150.0 |
| Annual Committee Chair Retainer | ||
| Chair of the Board | 75.0 | 75.0 |
| Chair of the Audit Committee | 15.0 | 15.0 |
| Chair of the Nominating and Corporate Governance Committee | 10.0 | 10.0 |
| Chair of the Compensation Committee | 10.0 | 10.0 |
The table below summarises the total annual compensation of the executive and non-executive directors who received remuneration during 2023 and 2022.
| In thousands of U.S. Dollars | Salary and Fees in Cash | Salary and Fees in DRSUs2 | Annual Bonuses | Long-Term Incentive Awards3 (Vested) |
Deferred Restricted Share Units Dividend Equivalents4 |
Total Fixed Remuneration | Total Variable Remuneration | Total | ||||||||
| Name1 | 2023 | 2022 | 2023 | 2022 | 2023 | 2022 | 2023 | 2022 | 2023 | 2022 | 2023 | 2022 | 2023 | 2022 | 2023 | 2022 |
| William Aziz | 160.0 | 160.0 | - | - | - | - | - | - | - | - | 160.0 | 160.0 | - | 160.0 | 160.0 | |
| Arun Banskota8 | 58.8 | - | - | - | - | - | - | - | - | - | 58.8 | - | - | - | 58.8 | - |
| Debora Del Favero | 112.0 | 112.0 | 48.0 | 48.0 | - | - | - | - | 5.7 | 2.5 | 165.7 | 162.5 | - | 165.7 | 162.5 | |
| Brenda Eprile | 165.0 | 165.0 | - | - | - | - | - | - | - | - | 165.0 | 165.0 | - | 165.0 | 165.0 | |
| Michael Forsayeth | 75.0 | 75.0 | 75.0 | 75.0 | - | - | - | - | 9.0 | 4.0 | 159.0 | 154.0 | - | 159.0 | 154.0 | |
| Edward C Hall5 | 150.0 | 62.5 | - | - | - | - | - | - | - | - | 150.0 | 62.5 | - | 150.0 | 62.5 | |
| Santiago Seage6 | 798.6 | 727.2 | - | - | 975.6 | 931.3 | 1,023.2 | 2,992.4 | - | - | 798.6 | 727.2 | 1,998.8 | 3,923.7 | 2,797.4 | 4,651.0 |
| George Trisic7 | - | - | 100.0 | 110.0 | - | - | - | - | 10.6 | 1.6 | 110.6 | 111.6 | - | - | 110.6 | 111.6 |
| Michael Woollcombe | - | - | 225.0 | 225.0 | - | - | - | - | 26.9 | 11.9 | 251.9 | 236.9 | - | - | 251.9 | 236.9 |
| Total | 1,519.4 | 1,301.7 | 448.0 | 458.0 | 975.6 | 931.3 | 1,023.2 | 2,992.4 | 52.2 | 20.0 | 2,019.5 | 1,779.7 | 1,998.8 | 3,923.7 | 4,018.3 | 5,703.5 |
| 1 | None of the Directors received any pension entitlement and/or taxable benefits in 2023 or 2022. |
| 2 | Non-executive directors receive fees via a mix of cash and Deferred Restricted Share Units (DRSUs). Following the Annual General Meeting held in May 2021, the Company determined, and Ms. Del Favero, Mr. Forsayeth, and Mr. Woollcombe agreed that 30%, 50% and 100% respectively of the annual fees payable to them by the Company from May 31, 2021, would be irrevocably substituted for the grant of DRSUs. The Company also determined and Mr. Trisic agreed that 100% of the annual fees payable to him by the Company would be irrevocably substituted for the grant of DRSUs for the period when he received remuneration. |
| 3 | In 2022 Long-term Incentive Awards vested under both the (LTIP) and the One-Off Plan calculating amounts using the share price at vesting date. In 2022, from the $2,992.4 thousand worth of awards that vested, $1,490.1 corresponded to share price appreciation. In 2023 Long-term Incentive Awards vested under the LTIP calculating amounts using the share price at vesting date. There was no share price appreciation between the grant date and the vesting date for the LTIP awards that vested in 2023. |
| 4 | Dividend equivalent rights accumulated on the DRSUs corresponding to the dividends paid for one share in the period between the DRSU grant date and December 31, 2023, and 2022, respectively, multiplied by the number of DRSUs held on that date. Such rights were payable on vesting of the DRSUs. |
| 5 | Mr. Hall was appointed to the Board on August 2, 2022, as an independent non-executive Director. Mr. Hall’s 2022 fee was prorated for the year based on the annual directors’ retainer. |
| 6 | The CEO’s compensation is approved in Euros. Salary and Fees have been converted to U.S. dollars for reporting purposes, at the average exchange rate of each year, which was 1.08€/$ in 2023 and 1.05 €/$ in 2022. Annual bonus amounts have been converted to U.S. dollars for reporting purposes, at the exchange rate of December 31, 2023, which was 1.10€/$ and at the exchange rate of December 31, 2022, which was 1.07 €/$ in 2022. |
| - | In 2023, the CEO’s total pay amounted to €2,594.4 thousand ($2,797.4 thousand). Fixed salary amounted to €738.3 thousand ($798.6 thousand), annual bonus to €883.8 thousand ($975.6 thousand) and long-term incentive awards to €972.3 thousand ($1,023.2 thousand). |
| - | In 2022, the CEO’s total pay amounted to €4,401.7 thousand ($4,651.0 thousand). Fixed salary amounted to €690.0 thousand ($727.2 thousand), annual bonus to €870.0 thousand ($931.3 thousand) and long-term incentive awards to €2,841.7 thousand ($2,992.4 thousand). |
| 7 | Mr. Trisic, non-independent non-executive director, has received compensation since April 6, 2022, until August 30, 2023 when he resigned from his position of Director of the Company. Mr. Trisic’s 2022 and 2023 fees were prorated for each year based on the annual directors’ retainer. The Company determined and Mr. Trisic agreed that 100% of his fees were irrevocably substituted for the grant of DRSUs. |
| 8 | Mr. Banskota, non-independent, non-executive director, has received compensation since August 2023, (when he resigned as CEO of Algonquin). |
The Directors’ Remuneration Report is presented in U.S. dollars since remuneration of all directors except the CEO is defined in U.S. dollars and the functional currency of the Company is also the U.S. dollar. None of the directors received any pension entitlement and/or taxable benefits in 2023 or 2022. Each member of our Board of Directors will be indemnified for his or her actions associated with being a director to the extent permitted by law.
The decrease in the remuneration of the CEO in 2023 was mainly due to a decrease in the amount of share options exercised in 2023 compared to 2022. Share options awarded in 2020 and 2021 under the LTIP that vested in 2023 were underwater and were not exercised. In addition, the number of share units that vested in 2023 under the 2020 LTIP was lower than the number share units that vested in 2022 and the price and the stock price on the vesting date of 2023 was also lower than in 2022. Finally, the One-off plan had fully vested in 2022, as explained below.
Chief Executive Officer Long Term Incentives awards vested
| 1) | Restricted Stock Units vested under the LTIP |
In January 2023 and June 2022 RSUs awarded in 2020 and 2019 respectively under the LTIP vested and shares were transferred to the CEO in accordance with the terms of the plan. The value of the vested RSUs have been included in the Single Total Figure of Remuneration table above in their vesting period.
| RSU Grant Date |
RSU Vesting Date |
Number of Restricted Stock Units Vesting |
Share Price on Vesting Date (USD) |
RSUs Value at Vesting Date (000’s USD)1, 2 |
| 2020 | 2023 | 33,641 | 25.27 | 1,023.2 |
| 2019 | 2022 | 46,987 | 31.10 | 1,708.7 |
| 1 | 33,641 RSUs (granted in under the 2020 LTIP) vested in 2023 plus dividend equivalent rights corresponding to the dividends paid on one share between the 2020 LTIP grant date and the date on which the RSU vested ($5.15 per share). 46,987 RSUs (granted under the 2019 LTIP) vested in 2022 plus dividend equivalent rights corresponding to dividends paid on one share between the 2019 LTIP grant date and the date on which the RSU vested ($5.07 per share). |
| 2 | The RSUs that vested in 2023 were subject to (i) the CEO remaining employed with the Group and (ii) a minimum average 5% average annual TSR (both of which were achieved). |
| 2) | Options vested under the LTIP |
One-third of each of the CEO’s share options awarded in 2020 and 2021 under the LTIP vested during 2023. These were underwater on the vesting date and were not exercised.
The share options value has been included in the Single Total Figure of Remuneration table above in their vesting period.
| LTIP Share Option Grant Date1 |
Share Option Vesting Date |
Number of Share Options Vesting |
Share Price on Vesting Date (USD) |
Exercise Price per Share Option (USD) |
Share Options Value at Vesting Date (000’s USD)2 |
| 2021 | 2023 | 24,948 | 28.17 | 37.98 | - |
| 2022 | 24,948 | 32.53 | 37.98 | - | |
| 2020 | 2023 | 34,494 | 25.27 | 26.39 | - |
| 2022 | 34,494 | 34.48 | 26.39 | 279.1 | |
| 2019 | 2022 | 40,693 | 31.30 | 19.60 | 476.1 |
| 1 | Additional information on the LTIP is disclosed in the Remuneration Policy section. |
| 2 | The value of the share options on the vesting date is calculated using the number of share options multiplied by (the share price on the vesting date minus the exercise price per share option). |
| 3 | There were no performance measures related to these options. |
3) One off-plan
An award in the form of restricted stock units (RSUs) was granted under the One-off plan to the CEO in 2019. In June 2022 the third and final tranche vested, and shares were transferred to the CEO in accordance with the terms of the plan. The One-off plan RSUs were fully vested in 2022, and therefore no One-Off Plan RSUs vested in 2023.
The value of the shares transferred have been included in the Single Total Figure of Remuneration table above in their vesting period.
| One-Off Plan | One-Off
Plan Vesting |
Number of Restricted Stock Units |
Share Price on Vesting Date (USD) |
RSUs Value at Vesting Date (000’s USD)1 |
| 2019 | June 2023 | - | - | - |
| June 20222 | 14,535 | 31.30 | 528.6 |
| 1 | On each vesting date, one third of the RSUs vested (14,535 RSUs) plus dividend equivalent rights corresponding to the dividends paid on one share in the period between the One-off plan grant date and the date on which the RSU vest ($5.07 per share for 2022), multiplied by the number of RSUs vesting on that date. |
| 2 | In June 2022, the final tranche of RSUs vested. As a result, since then there have been no other awards outstanding under this plan. |
In 2023, most of the objectives defined for the Chief Executive Officer’s variable bonus were met or exceeded and the Compensation Committee decided to approve a bonus corresponding to 104.0% of the target variable compensation, which will be payable in 2024.
| Percentage Weight |
Achievement | |
| CAFD – Equal or higher than the CAFD budgeted in the 2023 budget | 35% | 97.5% |
| Adjusted EBITDA – Equal or higher than the Adjusted EBITDA budgeted in the 2023 budget | 15% | 99% |
| Capital allocation management on a value accretive basis | 20% | 110% |
| Achievement of ESG metrics including health and safety targets – (Frequency with Leave / Lost Time Index below 3.7 and General Frequency Index below 9.5) | 10% | 120% |
| Management of relationships with key shareholders and partners | 10% | 120% |
| Continued executive talent development | 10% | 90% |
1 Cash Available for Distribution (CAFD) refers to the cash distributions received by the Company from its subsidiaries, minus cash expenses of the Company, including debt service and general and administrative expenses.
In 2023, Mr. Seage was awarded $975.6 thousand as a bonus payment in accordance with his service agreement, payable in 2024. In 2022, Mr. Seage was awarded $931.3 as thousand as a bonus payment in accordance with his service agreement, which was paid in 2023. The CEO’s bonus is approved in Euros and converted to U.S. dollars for reporting purposes at the average exchange rate of each year.
The Chief Executive Officer’s maximum potential bonus is 120% of such bonus, which is approximately $1,126 thousand (approximately €1,020 thousand).
No element of the Chief Executive Officer’s annual bonus is deferred.
Deferred Restricted Shares Units (DRSU) Plan
The following table sets out the total compensation received by non-executive directors via a mix of cash and DRSUs in 2023:
| Name | Total Remuneration (000’s USD) |
Total Remuneration in Cash and/or Deferred Restricted Stock Units (DRSU) |
||||||
| Remuneration in Cash (000’s USD) |
Remuneration in DRSUs | |||||||
| DRSUs (000’s USD) | Number of DRSUs (#)4 | |||||||
| 2023 | 2022 | 2023 | 2022 | 2023 | 2022 | 2023 | 2022 | |
| William Aziz | 160.0 | 160.0 | 160.0 | 160.0 | - | - | - | - |
| Arun Banskota5 | 58.8 | - | 58.8 | - | - | - | - | - |
| Debora Del Favero1 | 160.0 | 160.0 | 112.0 | 112.0 | 48.0 | 48.0 | 2,102 | 1,619 |
| Brenda Eprile | 165.0 | 165.0 | 165.0 | 165.0 | - | - | - | - |
| Michael Forsayeth1 | 150.0 | 150.0 | 75.0 | 75.0 | 75.0 | 75.0 | 3,284 | 2,530 |
| Edward C. Hall2 | 150.0 | 62.5 | 150.0 | 62.5 | - | - | - | - |
| George Trisic3 | 100.0 | 110.0 | - | - | 100.0 | 110.0 | 4,003 | 3,901 |
| Michael Woollcombe1 | 225.0 | 225.0 | - | - | 225.0 | 225.0 | 9,852 |
7,589 |
| Total | 1,168.8 | 1,032.5 | 720.8 | 574.5 | 448.0 | 458.0 | 19,240 | 15,638 |
| 1 | Following the Annual General Meeting held in May 2021, the Company determined, and Ms. Del Favero, Mr. Forsayeth, and Mr. Woollcombe agreed that 30%, 50% and 100% respectively of the annual fees payable to them by the Company from May 31, 2021, would be irrevocably substituted for the grant of DRSUs. |
| 2 | Mr. Hall was appointed to the Board on August 2, 2022, as an independent non-executive Director. Mr. Hall’s 2022 fee was prorated based on the annual director’s retainer. |
| 3 | Mr. Trisic, non-independent non-executive director, received compensation from April 6, 2022, until August 30, 2023. Mr. Trisic’s 2022 and 2023 fees were prorated based on the annual directors’ retainer. The Company determined and Mr. Trisic agreed that 100% of his fee would be irrevocably substituted for the grant of DRSUs. |
| 4 | The number of DRSUs granted is determined by dividing the amount of the annual compensation to be substituted for DRSUs by the market value of an ordinary share at the time of grant. |
| 5 | Mr. Banskota resigned as Chief Executive Officer of Algonquin on August 11, 2023. Since then, he has received compensation from the Company. His fees for 2023 were prorated. |
Remuneration of the Chief Executive Officer
The information provided in this part of the report is subject to audit.
Details for Mr. Seage, who serves in the role of the Chief Executive Officer, are set out in the “Single Total Figure of Remuneration for Each Director” section above.
Scheme Interests Awarded During 2023
|
LTIP |
Number of Restricted Stock Units |
Price per RSU at the grant date (USD) |
Restricted Stock Units Face Value1 (000’s USD) |
Performance Criteria |
| - Continuing employment (or other service relationship) for 33% of the award and | ||||
| 2023 | 44,9502 | 25.77 | 1,158.5 | - Continuing employment and achievement of a minimum 5% average annual TSR for 67% of the award. |
| 1 | Face Value means the maximum number of shares that would vest if performance measures are met using the share price at the grant date (January 6th, 2023). The face value for the restricted stock units (RSUs) is calculated using the share price at the grant date. |
| 2 | RSUs will vest on the third anniversary of the grant date, subject to the satisfaction of the performance criteria. |
For 67% of the award, if the total shareholder return (“TSR”) performance condition has not been met during the vesting period, the participant’s Restricted Stock Units will lapse on the vesting date.
The value of the RSUs granted to the CEO was equal to 70% of the previous year target annual remuneration (fixed + target annual bonus) at the grant date. Further information including a description of each type of interest awarded and the basis on which the award is made is provided in the Remuneration Policy section below.
The following information provided in this part of the report is not subject to audit (unless otherwise indicated).
Total Shareholder Return and Chief Executive Officer Pay
The chart below shows the Company’s TSR since June 2014, the date of our Initial Public Offering (“IPO”), until the end of 2023 compared with the TSR of the companies in the Russell 2000 Index. The chart represents the progression of the return, including investment, starting from the time of the IPO at a 100%-point. In addition, dividends are assumed to have been re-invested at the closing price of each dividend payment date.
We believe the Russell 2000 Index is an adequate benchmark as it represents a broad range of companies of similar size.
TSR is calculated in U.S. dollars.

The table below shows the total remuneration of the Chief Executive Officer, his bonus and his long-term incentive awards expressed as a percentage of the maximum he is likely to be awarded.
| Bonus | Long-Term Incentive Awards3 | ||||
| Year | Total Pay1 (000’s USD) |
Percentage of Target |
Amount of Bonus2 (000’s USD) |
Percentage of Maximum |
Value (000’s USD) |
| 2023 | 2,797.4 | 104.0% | 975.6 | 100.0% | 1,023.2 |
| 2022 | 4,651.0 | 102.4% | 931.3 | 100.0% | 2,992.4 |
| 2021 | 3,752.7 | 105.0% | 1,056.3 | 100.0% | 1,879.8 |
| 2020 | 2,524.1 | 102.7% | 996.4 | 100.0% | 770.9 |
| 2019 | 1,685.4 | 100.7% | 957.7 | - | - |
| 2018 | 2,511.1 | 101.8% | 992.2 | 22.0% | 751.1 |
| 2017 | 1,602.0 | 96.3% | 924.2 | - | - |
| 2016 | 1,499.4 | 100.0% | 940.5 | - | - |
| 2015 | 1,597.64 | - | - | - | - |
| 2014 | 174.1 | - | - | - | - |
| 1 | The CEO’s compensation is approved in Euros. It has been converted to U.S. dollars for reporting purposes at the average exchange rate each year. The total pay received by the CEO in thousands of Euros was € 2,594.4 in 2023, €4,401.7 in 2022, €3,148.6 in 2021, €2,222.2 in 2020, €1,505.5 in 2019, €2,170.3 in 2018, €1,418.1 in 2017, €1,329.1 in 2016, €1,440.9 in 2015, and €130.9 in 2014. |
| 2 | Amount of bonus earned by the CEO at year-end and paid the next year. For example: In 2021, the CEO earned a bonus of $1,056.3 thousand, which was paid to the Chief Executive Officer in 2022. |
| 3 | Long-Term Incentive Awards includes awards granted under both the LTIP and One-Off Plan which vested in the year. |
| 4 | Includes a €1,189.5 thousand (approximately $1,319.6 thousand) termination payment received by Mr. Garoz after his leaving the Company on November 25, 2015. |
The Chief Executive Officer did not receive any variable remuneration for services provided to the Company for the years ended December 31, 2015, and 2014. Mr. Seage occupied that office between January and May 2015, and again from late November 2015. Mr. Garoz held that position between May and November 2015, when Santiago Seage left the Company.
Directors’, Chief Executive Officer’s and Employee’s Pay
The table below sets out the percentage change between 2023 and 2022 in salary and, bonus for executive and non-executive directors who received remuneration and the average per capita change for employees of the Company’s group as a whole, excluding the Chief Executive Officer.
| 2023 (% Change from 2022 to 2023) |
2022 (% Change from 2021 to 2022) |
2021 (% Change from 2020 to 2021) |
||||
| Fixed | Bonus | Fixed Salary | Bonus | Fixed Salary | Bonus | |
| Salary and | and Fees | and Fees | ||||
| Fees (Cash | (Cash and | (Cash and | ||||
| and DRSU) | DRSU)1 | DRSU) | ||||
| Non-executive directors | ||||||
| William Aziz | - | - | - | - | - | - |
| Arun Banskota4 | - | - | - | - | - | - |
| Debora Del Favero | - | - | - | - | - | - |
| Brenda Eprile | - | - | - | - | - | - |
| Michael Forsayeth | - | - | - | - | - | - |
| Edward C. Hall2 | - | - | - | - | - | - |
| George Trisic3 | - | - | - | - | - | - |
| Michael Woollcombe | - | - | - | - | - | - |
| Executive director | ||||||
| Santiago Seage (CEO) | 7%6 | 2%6 | 0%6 | -3%6 | 4%6 | 2%6 |
| Employees (excluding CEO)5 | 6% | 6% | 4% | 9% | 4% | 8% |
Notes:
None of the non-executive directors received any bonus, and/or taxable benefits in 2023, 2022 or 2021.
| 1 | Following the Annual General Meeting held in May 2021, the Company determined, and Ms. Del Favero, Mr. Forsayeth, and Mr. Woollcombe agreed that 30%, 50% and 100% respectively of the annual Fees payable to them by the Company from May 31, 2021, would be irrevocably substituted for the grant of DRSUs. |
| 2 | Mr. Hall was appointed to the Board on August 2, 2022, as an independent non-executive Director. |
| 3 | Mr. Trisic, non-independent non-executive director, has received compensation from April 6, 2022, until August 30, 2023, when he resigned from his position as Director of the Company. The Company determined and Mr. Trisic agreed that 100% of his fee would be irrevocably substituted for the grant of DRSUs. |
| 4 | Mr. Banskota, non-independent non-executive director, has received compensation since August 12, 2023, when he resigned as CEO of Algonquin. |
| 5 | The salary and bonus percentage change for employees (excluding the CEO) has been calculated considering the same average number of employees and the same average exchange rate in 2023, 2022 and 2021. This is the most appropriate methodology to reflect how much the salary and potential bonus changed on a year-to-year basis as it excludes the effect of employee hires and turnover. |
| 6 | For 2023, the Compensation Committee approved (i) fixed remuneration of €738.3 thousand for the Chief Executive Officer (in 2022, the CEO’s fixed remuneration was €690 thousand), representing a 7% increase in Euros on a year-to-year basis, and (ii) variable remuneration of €883.8 thousand compared to €870.0 thousand for 2022, representing a 2% increase in Euros on a year-to-year basis. For 2022, the Compensation Committee approved (i) fixed remuneration of €690 thousand for the Chief Executive Officer (in 2021, the CEO’s fixed remuneration was also €690 thousand), and (ii) variable remuneration of €870.0 thousand compared to €893 thousand for 2021, representing a 3% decrease in Euros on a year-to-year basis. |
Pay Ratio Information
The average number of employees in the U.K. is below 250 employees. Following the U.K. pay ratio disclosure requirements, Atlantica is exempt from disclosing U.K. pay ratio-related information.
Relative Importance of Spend on Pay
The following table sets out the change in overall employee costs, directors’ compensation and dividends.
| $ in Millions | 2023 | 2022 | Difference |
| Spend on Pay for All Employees | 104.1 | 80.2 | 23.9 |
| Total Remuneration of Directors | 4.0 | 5.6 | -1.6 |
| Total Remuneration of employees and directors | 108.1 | 85.9 | 22.3 |
| Dividends Paid | 206.8 | 203.1 | 3.7 |
The Company has not made any share repurchases during 2023 or 2022.
The average number of employees in 2023 in Atlantica was 1,304 employees, compared to 874 employees in 2022. The $23.9 million increase in spend on pay and the increase in the average number of employees is mostly due to the internalisation of the operation and maintenance activities. We refer to section “People and Culture” under “Social Sustainability.”
The decrease in the remuneration of the CEO in 2023 was mainly due to a decrease in the amount of share options exercised in 2023 compared to 2022. Share options awarded in 2020 and 2021 under the LTIP that vested in 2023 were underwater and were not exercised. In addition, the number of share units that vested in 2023 under the 2020 LTIP was lower than the number share units that vested in 2022 and the price and the stock price on the vesting date of 2023 was also lower than in 2022. Finally, the One-off plan had fully vested in 2022, as explained below.
| 2. | Directors’ Shareholdings (Audited) |
The following table includes information with respect to beneficial ownership of our ordinary shares as of December 31, 2023, by each of our current directors and executive officers, as well as their connected persons, in relation to any compensation paid and/or benefits granted by the Company.
Directors who do not receive remuneration from the Company are not required to comply with minimum share ownership requirements.
| Name1 | Number of Shares | Number of Deferred Restricted Share Units2 | Number of Share Units3 subject to performance measures | Investment Value ($000’s)4 | Minimum Share Ownership Requirement | Compliance With Policy5 | Number of Share Options Vested Unexercised6 | Number of Share Options Not Vested7 |
| William Aziz | 2,500 | - | - | 54 | 3 times annual compensation | On track | - | - |
| Arun Banskota | - | - | - | - | 3 times annual compensation | On track | - | - |
| Debora Del Favero | - | 4,973 | - | 107 | 3 times annual compensation | On track | - | - |
| Brenda Eprile | 13,000 | - | - | 280 | 3 times annual compensation | On track | - | - |
| Michael Forsayeth | 2,500 | 7,770 | - | 221 | 3 times annual compensation | On track | - | - |
| Edward Hall | 1,500 | - | - | 32 | 3 times annual compensation | On track | - | - |
| Santiago Seage | 117,491 | - | 105,868 | 4,802 | 6 times fixed compensation | ✓ | 84,389 | 24,948 |
| Michael Woollcombe | 5,000 | 23,311 | - | 609 | 3 times annual compensation | ✓ | - | - |
| 1 | Mr. Farquhar, non-independent, non-executive director, does not receive remuneration from the Company. Thus, he is not required to comply with minimum share ownership requirements. |
| 2 | The number of DRSUs includes accumulated cash dividend equivalent rights, corresponding to the dividends paid for one share in the period between the DRSU grant date and December 31, 2023, multiplied by the number of DRSU on that date and divided by the share price of $21.50 as of December 31, 2023. The director shall not have any rights of a shareholder unless and until the DRSUs vest and are settled by the issuance of shares and dividend equivalent rights will not be payable until the DRSUs vest. |
| 3 | Unvested share units as of December 31, 2023. LTIP share units subject to performance conditions. |
| 4 | Assuming a share price of $21.50 as of December 31, 2023. |
| 5 | Mr. Aziz, Ms. Del Favero, Ms. Eprile, Mr. Forsayeth, Mr. Seage and Mr. Woollcombe have a 5-year window starting in May 2021 to comply with this policy. Mr. Hall has a 5-year window starting in August 2022 and Mr. Banskota has a 5-year window starting in August 2023. |
| 6 | Share options granted in 2021 (49,895) and share options granted in 2020 (34,494) were underwater as of December 31, 2023. |
| 7 | Share options awarded in 2021 under the LTIP (24,948). These share options have not vested as of December 31, 2023. |
Between the year end and the date of issuance of this report there have been no changes to directors’ share ownership except in the case of the CEO, due to the grant of 2024 awards under the LTIP.
Under the LTIP, the CEO holds as of December 31, 2023, 105,868 restricted share units, convertible into shares in the future subject to certain vesting periods and conditions, 84,389 unexercised vested share options which were underwater at 2023 year-end and 24,948 unvested share options. As of December 31, 2022, the CEO held 94,559 restricted share units, convertible into shares in the future, 24,948 unexercised vested share options which were underwater at 2022 year-end and 84,389 unvested share options.
Minimum Share Ownership Requirements
The Board of Directors has minimum share ownership guidelines for directors receiving remuneration from the Company and for the executives participating in the LTIP to further align executive and shareholder interests. Directors and executives subject to these guidelines shall achieve, within a period of five years from May 2021, a minimum share ownership in the Company. The value of shares owned includes shares that are issuable pursuant to the LTIP and the DRSU Plans (both vested and non-vested). Directors receiving remuneration and executives participating in the LTIP shall achieve a minimum share ownership in the Company equal in value to:
| - | Non-executive directors receiving remuneration from the Company: 3 times their annual compensation, |
| - | CEO: 6 times his fixed compensation, |
| - | CFO: 3 times his fixed compensation, |
| - | Other executives: 2 times their fixed compensation. |
The directors receiving remuneration from the Company and executives have a 2-year window to amend non-compliances with minimum share ownership requirements derived from a stock price decrease.
The directors not receiving remuneration from the Company are not required to comply with minimum share ownership requirements.
Payments for Loss of Office (Audited)
Mr. Trisic resigned as non-executive Director of the Company on August 30, 2023.
DRSUs granted to Mr. Trisic, (in lieu of fees), together with the dividend equivalents accumulated with respect to these DRSUs from April 6, 2022 until vesting were fully settled on August 30, 2023. The settlement of the dividend equivalents was made on the basis of a price per share of $22.87 corresponding to the average price of the 5 days prior to August 30, 2023, the date of resignment. In total (for his DRSUs and dividend equivalent rights), Mr. Trisic received 8,435 shares from the Company before taxes ($192,903.7).
Apart from this, no other termination payments were made to the Chief Executive Officer or any other director in 2023 nor 2022. The policy for termination payments is detailed under the section “Policy on payments for loss of office” of this report.
| 3. | Statement of Implementation of Policy in 2024 |
The current Remuneration Policy was approved at our 2021 Annual General Meeting, and amendments were approved at the 2023 Annual General Meeting held in April 2023. A new Remuneration Policy is being put to shareholder vote at the 2024 Annual General Meeting- the only key changes (compared to the current Remuneration Policy) relate to (i) the clawback policy, (ii) the maximum value of LTIP awards granted to executive directors, (iii) the conditions for the LTIP and (iv) establishing additional fees for all non-executive directors who are chair of a board committee, eliminating the exception for chair of the related party committee.
Non-independent non-executive directors are entitled to be compensated on the same terms as independent non-executive directors.
The main terms of the LTIP included in the Remuneration Policy proposed for approval in 2024 that would apply to awards granted to the CEO and Executives are as follows:
| Main terms of the LTIP for awards granted to all Executives as – Restricted Stock Units | |
| Value at grant date |
The value of the RSUs granted to the CEO is up to 105% of the previous year target annual remuneration (fixed + target annual bonus) at the grant date.
The value of the RSUs granted to an executive other than the CEO is equal to between 50% and 70% (with the exact percentage to be determined by the Compensation Committee at grant) of the previous year target annual remuneration (fixed + target annual bonus) at the grant date. |
| Exercisability and Vesting Period |
33% of the RSUs will vest on the third anniversary of the grant date (provided the participant remains employed with the Group) and 67% of the RSUs will vest on the third anniversary of the grant date only if the conditions described below are met over such 3-year period. Each of the below conditions must be considered individually and each of the conditions weigh individually in considering the two thirds of the RSU. It is not necessary that all of them together are met for the vesting of the two-thirds of the total number of RSUs.
The Company will decide at vesting if vested RSUs will be settled in cash or shares. |
| Ownership and Dividends | The participant will be entitled to receive, for each RSU held, a payment equivalent in value to any dividend or distribution paid on each share between the grant date and the date on which the RSU vests. |

| 1. | Includes storage. |
| 2. | Includes floors and caps when measuring compliance (i.e. floor of 70% and cap of 130% when measuring performance versus financial objectives) |
| 3. | Percentage weights are calculated as a fraction of the percentage weight assigned to each section or subsection, based on a 100% basis. The values are rounded to the nearest tenth. |
For 2024, the bonus measures for the remuneration of the Chief Executive Officer, will focus on four areas: financial targets, capital allocation management, ESG including health and safety and continued executive talent development.
This approach is intended to provide a balanced assessment on how the business has performed over the course of the year against stated objectives. Targets are aligned with the annual plan and strategic and operational priorities for the year.
For 2024 the bonus objectives are:
| Percentage Weight |
|
| CAFD – Equal or higher than the CAFD budgeted in the 2024 budget | 35%x |
| Adjusted EBITDA – Equal or higher than the Adjusted EBITDA budgeted in the 2024 budget | 15% |
| Capital allocation management | 30% |
| Achievement of ESG metrics including health and safety targets – (Frequency with Leave / Lost Time Index below 3.0 and General Frequency Index below 6.8) | 10% |
| Continued executive talent development | 10% |
| 4. | Compensation Committee |
The Compensation Committee is responsible for determining the remuneration policies of directors and the remuneration of the Chief Executive Officer and other senior members of management.
In 2023, the Compensation Committee focused its activities on the following key remuneration topics:
| - | Reviewing the Chief Executive Officer’s annual compensation package and performance objectives, |
| - | Reviewing Long Term Incentive Plans, |
| - | Reviewing non-executive director’s remuneration, and |
| - | Analysing peers and comparable remuneration structures. |
Membership and Attendance
As of December 31, 2023, all members of the Compensation Committee were independent, non-executive directors. A total of three Compensation Committee meetings were convened in 2023, with an average attendance of 100%.
| Director | Membership | Role | Attendance / Eligible to Attend | |
| From | To | |||
| William Aziz | May 2020 | n/a | Director, Independent and Chair of the Compensation Committee | 3/3 |
| Debora Del Favero | May 2020 | n/a | Director, Independent | 3/3 |
No director or senior manager shall be involved in any decision as to their own remuneration. The Chief Executive Officer and members of senior management, such as the Head of People and Culture, may attend the meetings by invitation.
During 2023, no third party provided material advice or services to the Compensation Committee. In 2024 the Board of Directors engaged Hugessen Consulting, a consultancy company to review the remuneration of directors, including the CEO. The consultants were appointed by the Compensation Committee, their advice was independent, and the fees paid for these services were approximately $28.0 thousand Canadian dollar ($21 thousand U.S. dollar).
The Chair of the Compensation Committee provides regular updates to the Board of Directors on the key issues discussed at the Compensation Committee’s meetings.
2023 Key Activities
In 2023, the Compensation Committee proposed to the Board of Directors, and the Board approved, the Chief Executive Officer’s 2022 bonus achievement and his 2023 target variable compensation. In addition, the Compensation Committee continued its work on reviewing our remuneration structure to ensure that the Company has in place an effective Remuneration Policy which:
| - | Allows the Company to attract and retain top quality talent; and |
| - | Rewards and compensates sustainable performance to the benefit of shareholders and other stakeholders. |
Remuneration Analysis
The Compensation Committee keeps the Remuneration Policy implemented by the Board of Directors under review, amendments to which were approved in the 2023 Annual General Meeting under review. At least once a year, the Compensation Committee reviews compensation practices for non-executive directors in similar companies.
The Compensation Committee has been particularly focused on reviewing remuneration for directors and the Chief Executive Officer, based on the information collected from external consultants that provided independent advice on remuneration best practices and market practice on directors´ minimum ownership requirements.
The Compensation Committee is responsible for proposing the remuneration of the Chief Executive Officer and the overall remuneration of the senior management to the Board of Directors, including any kind of compensation.
The Compensation Committee has the following duties regarding performance-related bonuses or variable remuneration:
| - | Definition of specific targets for the Chief Executive Officer and overall structure for senior management. |
| - | Evaluation of the accomplishment of those objectives in the case of the Chief Executive Officer. |
Long-Term Incentive Awards
Since May 2021, LTIP awards have been granted as RSUs. Approximately 13 executives and the Chief Executive Officer are eligible to participate in the LTIP.
The Company is seeking approval of a new Remuneration Policy The new proposed Remuneration Policy will include some changes compared to the existing Remuneration Policy, including (i) amending the clawback policy to comply with recent regulatory changes, (ii) amending the maximum value of LTIP awards granted to executive directors, (iii) introducing new performance measures in the LTIP, as we describe in further detail in the Remuneration Policy section below and (iv) establishing additional fees for all non-executive directors who are chair of a board committee, eliminating the exception for chair of the related party committee. Shareholders will be asked to approve amendments to the remuneration policy at our 2024 Annual General Meeting to be held in April 2024.
Voting at the 2023 Annual General Meeting
The Company takes an active interest in voting outcomes. In the event of a substantial vote against a resolution in relation to director´s remuneration, the Company would seek to understand the reasons for any such vote and would set out in the following Annual Report any actions in response to it.
At the 2023 Annual General Meeting, the remuneration-related votes were as follows:
Directors’ Remuneration Report:
| Number of votes | % | |
| For | 84,261,484 | 95.8% |
| Against | 3,632,565 | 4.1% |
| Withheld* | 99,872 | - |
* A vote “withheld” is not a vote in law and is not counted in the calculation of the proportion of votes for and against the resolution
Remuneration Policy:
| Number of votes | % | |
| For | 68,193,080 | 77.5% |
| Against | 19,669,827 | 22.4% |
| Withheld* | 131,014 | - |
Please refer to the Shareholder Engagement section for additional resolutions voted at the Annual General Meeting.
Remuneration Policy
The current Remuneration Policy was approved at our 2021 Annual General Meeting, and amendments were approved at our 2023 Annual General Meeting. Shareholders will be asked to approve a new Remuneration Policy at our 2024 Annual General Meeting to be held in April 2024. The new Remuneration Policy is intended to take effect immediately following the 2024 Annual General Meeting (subject to shareholder approval).
The only changes that will apply to the new proposed Remuneration Policy (compared to the current policy) consist of (1) amending the Clawback Policy to comply with the requirements of Section 954 of the Dodd-Frank Wall Street Reform and Consumer Protection Act and the relevant Nasdaq Stock Market rules, (2) amending the maximum value of LTIP awards granted to executive directors, (3) introducing new conditions for LTIP awards, as we describe in more detail below. and (4) establishing additional fees for all non-executive directors who are chair of a board committee, eliminating the exception for chair of the related-party committee.
Executive Directors:
The policy for executive directors, only applicable to the Chief Executive Officer as the only executive director, is as follows:
| Name of component | Description of component | How does this component support the company’s (or Group’s) short and long-term objectives? | What is the maximum that may be paid in respect of the component? | Framework used to assess performance |
| Salary/fees | Fixed remuneration payable monthly. | Helps to recruit and retain executive directors and forms the basis of a competitive remuneration package. |
Maximum amount €800 thousand (approximately $850 thousand), may be increased by 5% per year. Salary levels for peers are considered. |
Not applicable.
No retention or clawback.
|
| Benefits | Opportunity to join existing plans for employees but without any increase in remuneration. | |||
| Annual Bonus | Annual bonus is paid following the end of the financial year for performance over the year. There are no retention or forfeiture provisions. | Helps to offer a competitive remuneration package and align it with the Company’s objectives. | 200% of base salary. |
25%-50% of CAFD. 10-15% of Adjusted EBITDA. 40%-50% of other operational or qualitative objectives. No retention. Clawback policy. |
| Strategic Review Bonus | One-time bonus related to the strategic review process and payable upon closing of a potential strategic transaction. | Helps retain executive directors who are relevant for the success of the strategic review process. | 110% of 2023 target annual remuneration (including fixed salary + target annual bonus). | Closing of a strategic transaction as such term is defined by the Board of Directors. |
| Long Term Incentive Awards | RSUs subject to certain vesting periods and conditions. | Align executive directors and shareholders interests. |
Up to 105% of target annual remuneration (including fixed salary + target annual bonus).
|
RSUs will be subject to - Continuing employment for 33% of the award and - Continuing employment and achievement of three year objectives for 67% of the award. Out of this 67%, the objectives consist of: ● One third based on the Company reaching a minimum 5% average annual TSR target. ● One third based on the Company reaching appropriate financial targets (for example Adjusted EBITDA and CAFD) ● One third based on strategic objectives: for example ESG targets, (for example growth in renewables and storage) and other strategic objectives in line with the Company’s long term strategy. Granted in the form of RSUs. Subject to the Company’s Clawback policy. |
TSR, CAFD, Adjusted EBITDA are considered standard indicators of financial performance in our sector. In addition, the LTIP is subject to strategic objectives that the Board believes are aligned with the Company’s strategy and long-term targets.
Restricted Stock Units granted prior to the approval of the new 2024 Remuneration Policy and after the approval to the amendments to the Remuneration Policy in 2023 are subject to:
| - | Continuing employment for 33% of the award and |
| - | Continuing employment and achievement of a minimum 5% average annual TSR for 67% of the award. If the TSR performance condition has not been met during the vesting period, the participant’s Restricted Stock Units subject to minimum annual TSR condition will lapse on the vesting date, save that the 2024 grant of Restricted Stock Units may be subject to the vesting conditions set out in the table above, if the Board so decides, provided the new Remuneration Policy is approved by shareholders at the 2024 Annual General Meeting. |
Restricted Stock Units granted prior to the approval of the amendments to the Remuneration Policy in 2023 are subject to continuing employment and achievement of a minimum 5% average annual TSR for 100% of the award.
Clawback Policy
The Company has operated an incentive compensation recoupment or clawback policy since 2021 and in 2023 has adopted provisions to comply with the requirements of Section 954 of the Dodd-Frank Wall Street Reform and Consumer Protection Act and the relevant Nasdaq Stock Market rules.
The policy is aimed at allowing the Company to recover performance-based compensation during the lookback period, which is generally three years after short-term variable compensation and/or long-term compensation awards are granted. In the case of a restatement, the lookback period is three completed fiscal years immediately preceding the date on which the Company is required to prepare a restatement for a given reporting period.
The policy is applicable to all executives who participate in long term incentive arrangements including current and former executive officers (as defined in Nasdaq Rule 5608(d)).
The policy is applicable in the event of the occurrence of either of the following triggering events: (1) a restatement, whether or not as a result of misconduct, as described in subsection 1 below or (2) fraud, embezzlement or other serious misconduct that is materially detrimental to the Company, as described in subsection 2 below.
| 1. | In the event that the Company is required to prepare a restatement (as defined in Nasdaq Rule 5608(b)(1)), executives covered by the policy shall be required to repay to the Company the amount of any covered compensation (as defined below) granted, vested or paid to such executive during the lookback period that exceeds the amount of the covered compensation that otherwise would have been granted, vested or paid to such executive had such amount been determined based on the restatement, computed on a pre-tax basis. |
For the purposes of this subsection 1, “covered compensation” means any incentive-based compensation (as defined in Nasdaq Rule 5608(d)) granted, vested or paid to a person who served as an executive officer at any time during the performance period for the incentive-based compensation and that was received (within the meaning of Nasdaq Rule 5608(d)): (i) on or after October 2, 2023, (ii) after the person became an executive officer and (iii) at a time that the Company had a class of securities listed on a national securities exchange or a national securities association.
For covered compensation based on the Company’s stock price or total shareholder return, where the amount of the erroneously-awarded covered compensation is not subject to mathematical recalculation directly from the information in the restatement, the Compensation Committee shall determine the amount to be repaid, if any, based on a reasonable estimate of the effect of the restatement on the stock price or total shareholder return.
The Compensation Committee must reasonably promptly pursue (and shall not have the discretion to waive) the repayment of any erroneously-awarded covered compensation, except where a determination has been made in accordance with Nasdaq Rule 5608(b)(1)(iv) that recovery would be impracticable. The Company is prohibited from indemnifying any current or former executive officer against the repayment of any erroneously-awarded covered compensation under the policy.
This subsection 1 is intended to satisfy the requirements of Section 954 of the Dodd-Frank Wall Street Reform and Consumer Protection Act and any related rules or regulations promulgated by the U.S. Securities and Exchange Commission or the Nasdaq, including the Nasdaq rules and any additional or new requirements that become effective after the adoption of the policy, which upon effectiveness shall be deemed to automatically amend this subsection 1 to the extent necessary to comply with such requirements.
| 2. | If the Company is required to prepare a material restatement as a result of misconduct and the Compensation Committee determines that the executive knowingly engaged in the misconduct or acted knowingly or with gross negligence in failing to prevent the misconduct, or if the Compensation Committee concludes that the participant engaged in fraud, embezzlement or other similar activity (including acts of omission) that the Compensation Committee concludes was materially detrimental to the Company, then, in addition to any remedies set forth in subsection 1 above, the Company may require the executive (or the executive’s beneficiary) to reimburse the Company for, or forfeit, all or any portion of any short or long term variable compensation awards. |
The Compensation Committee shall retain discretion regarding application of this subsection 2.
The clawback policy is incremental to other remedies that are available to the Company.
Compensation Committee Discretions
The Compensation Committee has discretion, consistent with market practice, in respect of, but not limited to, participants, timing of payments, size of the award subject to policy, performance measures and when dealing with special situations, such as change of control or restructuring.
The annual bonus is a variable cash bonus, based on the objectives described above. Those objectives include Cash Available for Distribution (CAFD) and Adjusted EBITDA, as these are key financial metrics for our industry sector. Additionally, the annual bonus includes 3-4 objectives that reflect some of the key projects, initiatives or key objectives.
Annual bonus performance targets include annual CAFD and Adjusted EBITDA performance thresholds for payment and also thresholds for the operational/qualitative targets defined by the Compensation Committee. These could vary on a year-to-year basis, hence assessment performance thresholds are analysed and updated by the Compensation Committee on an annual basis.
For the management team and key personnel, our policy is to use two external consultants to estimate market conditions for similar positions in terms of fixed and variable remuneration and, based on a performance appraisal, set a target remuneration, as a general rule, within that market practice. Variable payments are based on a number of specific measurable targets in relation to the measures described herein, which are defined by the Compensation Committee at the beginning of the year. For the rest of its employees, the Company establishes predefined remuneration ranges for different positions and reviews each individual remuneration depending on performance appraisal and within two ranges without employee consultation.
In addition, the Compensation Committee shall retain discretion regarding application of the clawback policy described in the Remuneration Policy section.
Long-Term Incentive Awards
The purpose of the LTIP is to attract and retain the best talent for positions of substantial responsibility in the Company, to encourage ownership in the Company by the executive team whose long-term service the Company considers essential to its continued progress and, thereby, encourage recipients to act in the shareholders’ interest and to promote the success of the Company.
The long-term incentive plan permits the granting of Restricted Stock Units (“RSUs”) to the executive team of the Company (the “Executives”). The LTIP currently applies to approximately 13 Executives and the Chief Executive Officer.
The aggregate number of shares which may be reserved for issuance under the LTIP must not exceed 2% of the number of the shares outstanding at the time of the Awards are granted but is expected to be significantly less. In addition, total equity-based awards will be limited to 10% of the Company’s issued share capital over a 10-year rolling period, in order to assure shareholders that dilution will remain within a reasonable range. In any case, the Compensation Committee may decide that, instead of issuing or transferring shares, the Executives may be paid in cash.
The value of the RSUs will be equal to between 50% and 70% of the Executives’ (other than the CEO) target annual remuneration (including fixed salary + target annual bonus) for the year closed before the date upon which an RSU is granted and, in the case of the Chief Executive Officer, it will be up to105% of the previous year target annual remuneration (including fixed salary + target annual bonus) at the grant date. The award will be granted in Restricted Stock Units.
Main terms of the LTIP included in the Remuneration Policy proposed for approval in 2024:
| Main terms of the LTIP for awards granted to all Executives – Restricted Stock Units | |
| Nature |
Restricted Stock Units will be subject to:
- Continuing employment for 33% of the award) and - Continuing employment and achievement of three year objectives for 67% of the award. Out of this 67%, the objectives consist of: ● One third based on the Company meeting a minimum 5% average annual TSR. ● One third based on the Company meeting appropriate financial targets (for example Adjusted EBITDA and CAFD) ● One third based on strategic objectives: for example ESG, including growth in renewables and storage and other strategic objectives in line with the Company’s long term strategy Appropriate targets for each measure will be considered and set by the Compensation Committee at the start of each financial year and disclosed in the annual report of the relevant financial year accordingly, in accordance with the Regulations. |
| Exercisability and Vesting Period |
33% of the shares will vest on the third anniversary of the grant date(subject to continued employment) and 67% of the shares will vest on the third anniversary of the grant date only if the conditions described above are met over such 3-year period. Each of the above conditions must be considered individually and each of the conditions weigh individually in considering the two thirds of the RSU. It is not necessary that all of them together are met for the vesting of the two-thirds of the total number of RSUs. The Company will decide at vesting if vested RSUs will be settled in cash or shares.
|
| Ownership and Dividends | The participant will be entitled to receive, for each Restricted Stock Unit held, a payment equivalent in value to any dividend or distribution paid on each share between the grant date and the date on which the Restricted Stock Unit vests. |
Effect on Termination of Employment
If a participant’s employment terminates by reason of involuntary termination (death, disability, redundancy, constructive dismissal or retirement dismissal rendered unfair), any portion of his/her Award shall thereafter continue to vest and become exercisable according to the terms of the LTIP but such participant shall no longer be entitled to be granted Awards under the LTIP.
If a participant incurs a termination of employment for cause or voluntary resignation or withdrawal, share options that have vested at the termination date will be exercisable within the period of 30 days from such termination date (after which they will lapse) but any unvested Awards (options or Restricted Stock Units) shall lapse.
Change of Control
If there is a change of control, all Awards granted under the LTIP after the approval of the amendments to the Remuneration Policy in 2023 and all past awards granted under the LTIP to executives participating in the strategic review bonus shall vest based on the satisfaction of performance conditions as at the time of the change in control. All Awards granted to other employees prior to this shall vest in full on the date of the change in control. The participants must exercise their share options within a period of 30 days following receipt of a change of control notice from the Company without which, the options will lapse.
Delisting
If the Company is delisted, all outstanding Awards granted under the LTIP after the approval of the amendments to the Remuneration Policy in 2023 and all past awards granted under the LTIP to executives participating in the strategic review bonus shall vest based on the satisfaction of performance conditions as at the time of delisting and will be settled in cash. All Awards granted to other employees prior to this shall vest in full on the date of delisting and will be settled in cash. The cash payment for Restricted Stock Units will be the last quoted share price of the Company and the cash payment for any outstanding share options will be the difference between the last quoted share price and the exercise price for the applicable option. Such cash payments will be made after applicable tax deductions within 30 days of the delisting.
Strategic Review Bonus
On February 21, 2023, Atlantica announced the initiation of a process to explore and evaluate potential strategic alternatives that may be available to Atlantica to maximize shareholder value. In connection with this process, the purpose of the strategic review bonus is to retain talent for certain positions in the organization which are relevant for the success of this process. The strategic review bonus applies to ten executives and the CEO. The value of the bonus is defined as 75% of the target annual remuneration for 2023 (including fixed salary + target annual bonus for 2023) (110% in the case of the CEO) and will become payable upon closing of a potential strategic transaction, as such term is defined by the Board of Directors. In the case of the CEO, the strategic review bonus was approved at the Shareholders Annual General Meeting held in April 2023.
Pension
The CEO (being the only executive director) does not receive any pension contributions.
None of the non-executive directors receive bonuses, long-term incentive awards, pension contributions or other benefits in respect of their services to the Company.
There are no provisions for the recovery of sums paid or the withholding of any sum, except for those potentially derived from the application of the clawback provision.
Chief Executive Officer Remuneration Policy
The Compensation Committee approved a fixed remuneration of €738.3 thousand ($815.0 thousand converted to U.S. dollars at the December 31, 2023 exchange rate, which is 1.10 $/€) and a variable target remuneration of €850.0 thousand for the Chief Executive Officer for 2024 ($935.0 thousand converted to U.S. dollars at the December 31, 2023 exchange rate, which is 1.10 $/€). In 2023, the CEO’s fixed remuneration also was €738.3 thousand.
Total remuneration of the only executive director for a minimum, target and maximum performance in 2024 is presented in the chart below.

Assumptions made for each scenario are as follows:
| Minimum: | Fixed remuneration only, assuming performance targets are not met for the annual bonus nor for the RSU and assuming no value for the options vesting in the year. |
| Target: | Fixed remuneration, plus half of target annual bonus and the LTIP vesting in 2024 at face value, using share price at grant date for units and option value at grant date for options, not including dividends, and assuming that the minimum annual TSR of at least a 5% yearly average over the 3-year period is met for the units. |
| Maximum: | Fixed remuneration, plus maximum annual bonus and LTIP vesting in 2024 at face value, using share price at grant date for units and option value at grant date for options not including dividends, and assuming that the minimum annual TSR of at least a 5% yearly average over the 3-year period is met for the units |
In addition, if we assume a 50% appreciation of the share price with respect to the grant date, maximum remuneration for 2024 including vesting long-term awards would be approximately $3,880 thousand. If we assume a 50% appreciation of the share price with respect to the December 31, 2023 share price, maximum remuneration for 2024 including vesting long-term awards would be approximately $2,215 thousand. In this scenario, the minimum annual TSR of at least a 5% yearly average over the 3-year period would not be met and share options awarded in 2021 under the LTIP would be underwater, therefore share options vesting in 2024 would not be exercised. Only 33% of the RSU’s would vest under the LTIP.
For 2024, the bonus measures for the remuneration of the Chief Executive Officer, will focus on four areas: financial targets, capital allocation management , ESG including health and safety, and continued executive talent development.
This approach is intended to provide a balanced assessment of how the business has performed over the course of the year against stated objectives. Targets are aligned with the annual plan and strategic and operational priorities for the year.
The CEO’s 2024 bonus objectives are disclosed under the section Annual Report on Remuneration.
Approach to Recruitment
The Remuneration Policy reflects the composition of the remuneration package for the appointment of new executive and non-executive directors. We expect to offer a competitive fixed remuneration, an annual bonus (for executive directors) not exceeding 200% of the fixed remuneration and participation in the LTIP. Whenever needed, the Company can contract an external advisor to hire key personnel.
Policy on Payments for Loss of Office
The Company has an agreement in-place with certain executives with strategic and key responsibilities in the Company (“Key Managers”), including the Chief Executive Officer, to protect the Company’s know-how and to ensure continuity in terms of attainment of business objectives, the policy approved by our shareholders at the 2019 Annual General Meeting, introduced certain termination payments to key executives, including the Chief Executive Officer.
No payments would be made to Key Managers for dismissal for breach of contract, breach of fiduciary duties or gross misconduct, determined (in the event of a dispute) by a court of competent jurisdiction to reach a final determination.
The Company agreed with Key Managers, including the CEO, the Company would make payments for loss of office or employment in addition to the severance payment under the prevailing labour and legal conditions in their contracts or countries where they are employed if they should leave (by loss of office or employment) the Company within 2 years of a change in control. The payment would represent six months of remuneration and will be adjusted to ensure that total payment including severance payment required under prevailing laws represent at least 12 months of remuneration (including salary, benefits, long term incentive plans and variable pay), but never more than 24 months of remuneration, unless required by local law.
A change of control means that a third party or coordinated parties (i) acquire directly or indirectly by any means a number of shares in the Company which (together with the shares that such party may already hold in the Company) amount to more than 50% of the share capital of the Company; or (ii) appoint or have the right to appoint at least half of the members of the Board of Directors of the Company.
Consideration of Employee Conditions Elsewhere
Our policy is to use external consultants to estimate market conditions for specific roles of a similar level in terms of fixed and variable remuneration and, as a general rule, based on a performance appraisal, set target remuneration within that market practice.
The annual variable remuneration payment is calculated with reference to the achievement of a number of specific measurable targets defined in the previous year. Each specific target is measured on a performance scale of 0%-120%.
For the rest of its employees, the Company establishes predefined remuneration ranges for different positions and reviews each individual remuneration depending on performance appraisal within two ranges without employee consultation.
The remuneration of all employees, including the members of the management team, may be adjusted periodically in the framework of the annual salary review process which is carried out for all employees.
Overall, we expect that, following the implementation of our policies, remunerations of the Company’s employees will increase in line with the market with the exception of individuals that have recently been promoted or whose remuneration is above market conditions.
Statement of Consideration of Shareholder Views
There are no comments in respect of directors’ remuneration expressed to the Company by shareholders. The last Annual General Meeting was held in April 2023.
Summary of Policy for Non-Executive Directors
The Company’s policy is to compensate non-executive directors via cash or Deferred Restricted Share Units (“DRSUs”) for the time dedicated to promoting greater alignment of interests between directors and shareholders subject to a maximum total annual compensation for non-executive directors in aggregate of two million dollars. Once a year, the Compensation Committee reviews compensation practices for non-executive directors in similar companies and the skills and experience required and may propose an adjustment in the current compensation.
The DRSU Plan provides a means for directors to accumulate a financial interest in the Company and to enhance Atlantica’s ability to attract and retain qualified individuals with the experience and ability to serve as directors. Pursuant to the DRSU Plan, the Company determines, and the directors shall agreed, that a percentage of their fees, starting on May 31, 2021, that would be irrevocably substituted for the grant of Deferred Restricted Stock Units.
The number of DRSUs credited to a participant’s account is determined by dividing the amount of the annual compensation to be received in DRSUs by the market value of an ordinary share at the time of the grant. Upon a participant ceasing to be a member of the Board, for any reason whether voluntary or involuntary, the DRSUs will vest. The Company shall transfer to the director a number of shares equal to the number of vested DRSUs and a number of shares equal in value to any dividends which would have been paid or payable, on such number of ordinary shares equal to the vested DRSUs, from the grant date until the vesting date. The director shall not have any shareholders’ rights other than the dividend equivalent rights until the DRSUs vest and are settled by the issuance of shares.
None of the non-executive directors receive bonuses, long-term incentive awards, pension contributions or other benefits in respect of their services to the Company.
|
Name of component |
How does the component support the company’s objective? |
Operation | Maximum |
| Fees and/or Deferred Restricted Share Units (DRSU) |
Attract and retain high-performing non-executive directors.
Align interests of non-executive directors with interests of shareholders.
|
Reviewed annually by the Compensation Committee and Board.
The chair of the Board and the chair of each committee receive additional fees.
DRSUs: the Company and the Directors shall agree the percentage of their fees that shall be paid in DRSUs. The number of DRSUs credited is determined using the market value of an ordinary share at the time of the grant. Upon a participant ceasing to be a member of the Board the DRSUs will vest. The Company shall transfer to the director a number of shares equal to the number of vested DRSUs and a number of shares equal in value to any dividends which would have been paid or payable, or such number of ordinary shares equal to the vested DRSUs, from the grant date until the vesting date.
Minimum share ownership: within a period of five years, directors receiving remuneration from the Company should have a minimum share ownership in the Company of 3 times their annual compensation. |
Annual total compensation for non-executive directors, in any case, the fees or DRSUs will not exceed two million dollars. |
| Benefits | Reasonable travel expenses to the Company’s registered office or venues for meetings. | Customary control procedures. | Real costs of travel with a maximum of one million dollars for all directors. |
Non-independent, non-executive directors are entitled to the same compensation as independent non-executive directors.
In 2021, the Board of Directors adopted minimum share ownership guidelines for directors receiving remuneration from the Company (see the Directors’ Shareholdings section). Within a period of five years, non-executive directors receiving remuneration from the Company should have a minimum share ownership in the Company of 3 times their annual compensation.
In addition, the directors may elect to receive compensation via a mix of cash and DRSUs. The DRSUs shall vest upon the date on which the director ceases to be a member of the Board due to a voluntary or involuntary separation from service. The director shall not have any rights of a shareholder unless and until the DRSUs vest and are settled by the issuance of shares (see further detail in the current Remuneration Policy section above).
Service Contracts
Mr. Seage has a service contract with Atlantica that includes a 6-month notice period.
Non-executive directors do not have a service contract. All directors will be submitted for re-election by shareholders annually at the Annual General Meeting.
Employee Benefit Trusts
The Company has not established employee trusts for share plans.
Statement of Voting at General Meetings
The Directors’ Remuneration Report will be submitted to a vote of shareholders at the Annual General Meeting in April 2024.
Approval
This Directors’ Remuneration Report was approved by the Board of Directors on February 29, 2024 and signed on its behalf by William Aziz, Director and Chair of the Compensation Committee.
Director and Chair of the Compensation Committee The directors are responsible for preparing the Integrated Annual Report and the Consolidated Financial Statements in accordance with applicable U.K. law and regulations.
William Aziz
February 29, 2024
Directors’ Responsibilities Statement
Company law requires the directors to prepare financial statements for each financial year. Under that law the directors are required to prepare the group financial statements in accordance with International Financial Reporting Standards as issued by the International Accounting Standards Board (“IASB”) and UK adopted International Accounting Standards (collectively as “IFRS”). The parent Company financial statements have been prepared in accordance with Financial Reporting Standard 101 Reduced Disclosure Framework (FRS 101). Under Company law the directors must not approve the accounts unless they are satisfied that they give a true and fair view of the state of affairs of the Company and the Group and of the profit or loss of the Company and the Group for that period.
In preparing these financial statements the directors are required to:
| - | Select suitable accounting policies in accordance with IAS 8 Accounting Policies, Changes in Accounting Estimates and Errors and then apply them consistently; |
| - | Make judgements and accounting estimates that are reasonable and prudent; |
| - | Present information, including accounting policies, in a manner that provides relevant, reliable, comparable and understandable information; |
| - | Provide additional disclosures when compliance with the specific requirements in IFRSs and in respect of the parent Company financial statements, FRS 101 is insufficient to enable users to understand the impact of particular transactions, other events and conditions on the Group and Company financial position and financial performance; |
| - | In respect of the Group financial statements, state whether International Accounting Standards in conformity with the requirements of the Companies Act 2006 have been followed, subject to any material departures disclosed and explained in the financial statements; |
| - | In respect of the parent company financial statements, state whether the applicable FRS 101 have been followed, subject to any material departures disclosed and explained in the financial statements; and |
| - | Prepare the financial statements on the going concern basis unless it is appropriate to presume that the Company and the Group will not continue in business. |
The directors are responsible for keeping adequate accounting records that are sufficient to show and explain the Company’s and the Group’s transactions and disclose with reasonable accuracy at any time the financial position of the Company and the Group and enable them to ensure that the financial statements comply with the Companies Act 2006. They are also responsible for safeguarding the assets of the Company and the Group and hence for taking reasonable steps for the prevention and detection of fraud and other irregularities.
Responsibility Statement
Under applicable law and regulations, the directors are also responsible for preparing a strategic report, directors’ report and directors’ remuneration report that comply with that law and those regulations. The directors are responsible for the maintenance and integrity of the corporate and financial information included on the Company’s website.
We confirm that to the best of our knowledge:
The Consolidated Financial Statements, prepared in accordance with the International Accounting Standards in conformity with the requirements of the Companies Act 2006, give a true and fair view of the assets, liabilities, financial position and profit or loss of the company and the undertakings included in the consolidation taken as a whole,
The Strategic Report includes a fair review of the development and performance of the business and the position of the Company and the undertakings included in the consolidation taken as a whole, together with a description of the principal risks and uncertainties that they face, and
The Integrated Annual Report and Financial Statements, taken as a whole, are fair, balanced and understandable and provide the information necessary for shareholders to assess the Company’s performance, business model and strategy.
This responsibility statement was approved by the Board of Directors on February 29, 2024 and is signed on its behalf by:
By order of the Board
| Director and Chief Executive Officer | Chief Financial Officer |
| Santiago Seage | Francisco Martinez-Davis |
| February 29, 2024 | February 29, 2024 |
Shareholder Engagement
Atlantica’s Board is accountable to its shareholders. Each year, at the Annual General Meeting, shareholders have the opportunity to elect each member of our Board of Directors and to vote on the Directors’ remuneration report and policy.
The proposals are published in our Annual Proxy Statement and voted on by shareholders in conjunction with the Annual General Meeting.
| Proxy Item | 2023 | 2022 | 2021 | |
| % shares present | 75.8% | 75.1% | 74.6% | |
| Percentage Vote “For”2 | ||||
| Proxy Item | 2023 | 2022 | 2021 | |
| - | Integrated Annual Report | 100.0% | 100.0% | 100.0% |
| - | Directors’ remuneration report | 95.9% | 98.8% | 96.7% |
| - | Directors’ remuneration policy | - | - | 96.6% |
| - | Amendment to the Directors’ remuneration policy | 77.6% | - | - |
| - | Election of directors (average) | 97.9% | 99.3% | 99.8% |
| - | Appointment of independent auditor | 99.9% | 99.9% | 99.9% |
| - | Redemption of share premium account | - | - | 99.8% |
| - | Audit committee to determine auditors’ remuneration | 99.9% | 99.8% | 99.9% |
| - | Authorise the Board of Directors to issue shares | 98.1% | 98.8% | 98.1% |
| - | Disapplication of pre-emptive rights up to an additional amount of approximately a 10% of the aggregate nominal value of the issued share capital of the Company | - | 78.7% | 80.1% |
| - | Authorise the Board of Directors to issue equity securities without pre-emptive rights up to approximately a 10% of the aggregate nominal value of the issued share capital of the Company | - | 97.4% | 99.8% |
| - | Authorise the Board of Directors to issue equity securities without pre-emptive rights up to approximately a 12% of the aggregate nominal value of the issued share capital of the Company for general purposes | 98.1% | - | - |
| - | Authorise the Board of Directors to issue equity securities without pre-emptive rights up to approximately a 12% of the aggregate nominal value of the issued share capital of the Company in connection with an acquisition or specified capital investment | 97.5% | - | - |
| - | Reduction of the Company’s share premium account by U.S.$250,000,000, | 99.8% | - | - |
| - | Purchase of the Company’s own shares | 98.4% | - | - |
2 Defined as For/(For+Against), expressed as a percentage. Non-voters are not included in the calculation The following table provides an overview of our current assets as of December 31, 2023:
| Other Information |
Other Information
Asset Portfolio
| Assets | Type | Ownership | Location | Currency (9) |
Capacity (Gross) |
Counterparty Credit Ratings(10) |
COD* |
Contract Years Remaining(17) |
| Solana | Renewable (Solar) | 100% | Arizona (USA) | USD | 280 MW | BBB+/A3/ BBB+ | 2013 | 20 |
| Mojave | Renewable (Solar) | 100% | California (USA) | USD | 280 MW | BB/Ba1/BB+ | 2014 | 16 |
| Coso | Renewable (Geothermal) | 100% | California (USA) | USD | 135 MW | Investment grade (11) |
1987/ 1989 |
18 |
| Elkhorn Valley(16) | Renewable (Wind) | 49% | Oregon (USA) | USD | 101 MW | BBB/Baa1/-- | 2007 | 4 |
| Prairie Star(16) | Renewable (Wind) | 49% | Minnesota (USA) | USD | 101 MW | --/A3/A- | 2007 | 4 |
| Twin Groves II(16) | Renewable (Wind) | 49% | Illinois (USA) | USD | 198 MW | BBB+/Baa2/-- | 2008 | 2 |
| Lone Star II(16) | Renewable (Wind) | 49% | Texas (USA) | USD | 196 MW | N/A | 2008 | N/A |
| Chile PV 1 | Renewable (Solar) | 35%(1) | Chile | USD | 55 MW | N/A | 2016 | N/A |
| Chile PV 2 | Renewable (Solar) | 35%(1) | Chile | USD | 40 MW | Not rated | 2017 | 7 |
| Chile PV 3 | Renewable (Solar) | 35%(1) | Chile | USD | 73 MW | N/A | 2014 | N/A |
| La Sierpe | Renewable (Solar) | 100% | Colombia | COP | 20 MW | Not rated | 2021 | 12 |
| La Tolua |
Renewable (Solar) |
100% | Colombia | COP | 20MW | Not rated | 2023 | 9 |
| Tierra Linda |
Renewable (Solar) |
100% | Colombia | COP | 10MW | Not rated | 2023 | 9 |
| Honda 1 |
Renewable (Solar) |
50% | Colombia | COP | 10MW | BBB-/--/BBB | 2023 | 7 |
| Albisu |
Renewable (Solar) |
100% | Uruguay | UYU | 10MW | Not rated | 2023 | 15 |
| Palmatir | Renewable (Wind) | 100% | Uruguay | USD | 50 MW | BBB+/Baa2/ BBB(12) | 2014 | 10 |
| Cadonal | Renewable (Wind) | 100% | Uruguay | USD | 50 MW | BBB+/Baa2/ BBB(12) | 2015 | 11 |
| Melowind | Renewable (Wind) | 100% | Uruguay | USD | 50 MW | BBB+/Baa2/ BBB(12) | 2015 | 12 |
| Mini-Hydro | Renewable (Hydraulic) | 100% | Peru | USD | 4 MW | BBB/ Baa1/BBB | 2012 | 9 |
| Solaben 2 & 3 | Renewable (Solar) | 70%(2) | Spain | Euro | 2x50 MW | A/Baa1/A- | 2012 | 14/14 |
| Solacor 1 & 2 | Renewable (Solar) | 87%(3) | Spain | Euro | 2x50 MW | A/Baa1/A- | 2012 | 13/13 |
| PS10/PS20 | Renewable (Solar) | 100% | Spain | Euro | 31 MW | A/Baa1/A- |
2007& 2009 |
8/10 |
| Helioenergy 1 & 2 | Renewable (Solar) | 100% | Spain | Euro | 2x50 MW | A/Baa1/A- | 2011 | 13/13 |
| Helios 1 & 2 | Renewable (Solar) | 100% | Spain | Euro | 2x50 MW | A/Baa1/A- | 2012 | 13/14 |
| Solnova 1, 3 & 4 | Renewable (Solar) | 100% | Spain | Euro | 3x50 MW | A/Baa1/A- | 2010 | 11/11/12 |
| Solaben 1 & 6 | Renewable (Solar) | 100% | Spain | Euro | 2x50 MW | A/Baa1/A- | 2013 | 15/15 |
| Seville PV | Renewable (Solar) | 80%(4) | Spain | Euro | 1 MW | A/Baa1/A- | 2006 | 12 |
| Italy PV 1 | Renewable (Solar) | 100% | Italy | Euro | 1.6 MW | BBB/Baa3/BBB | 2010 | 8 |
| Assets | Type | Ownership | Location | Currency (9) |
Capacity (Gross) |
Counterparty Credit Ratings(10) |
COD* |
Contract |
| Italy PV 2 | Renewable (Solar) | 100% | Italy | Euro | 2.1 MW | BBB/Baa3/BBB | 2011 | 8 |
| Italy PV 3 | Renewable (Solar) | 100% | Italy | Euro | 2.5 MW | BBB/Baa3/BBB | 2012 | 8 |
| Italy PV 4 | Renewable (Solar) | 100% | Italy | Euro | 3.6 MW | BBB/Baa3/BBB | 2011 | 8 |
| Kaxu | Renewable (Solar) | 51%(5) |
South Africa |
Rand | 100 MW |
BB-/Ba2/ BB-(13) |
2015 | 11 |
| Calgary | Efficient natural gas & Heat | 100% | Canada | CAD | 55 MWt | ~60% AA- or higher(14) | 2010 | 12 |
| ACT | Efficient natural gas & Heat | 100% | Mexico | USD | 300 MW |
BBB/ B1/ BB- |
2013 | 9 |
| Monterrey(18) | Efficient natural gas & Heat | 30% | Mexico | USD | 142 MW | Not rated | 2018 | 22 |
| ATN (15) | Transmission line | 100% | Peru | USD | 379 miles | BBB/ Baa1/BBB | 2011 | 17 |
| ATS | Transmission line | 100% | Peru | USD | 569 miles | BBB/ Baa1/BBB | 2014 | 20 |
| ATN 2 | Transmission line | 100% | Peru | USD | 81 miles | Not rated | 2015 | 9 |
| Quadra 1 & 2 | Transmission line | 100% | Chile | USD |
49 miles/ 32 miles |
Not rated | 2013 & 2014 | 11/11 |
| Palmucho |
Transmission line |
100% | Chile | USD | 6 miles |
BBB/-/ BBB+ |
2007 | 14 |
| Chile TL3 |
Transmission line |
100% | Chile | USD | 50 miles | A/A2/A- | 1993 | N/A |
| Chile TL4 |
Transmission line |
100% | Chile | USD | 63 miles | Not rated | 2016 | 48 |
| Skikda | Water | 34.2%(6) | Algeria | USD | 3.5 M ft3/day | Not rated | 2009 | 10 |
| Honaine | Water | 25.5%(7) | Algeria | USD | 7 M ft3/ day | Not rated | 2012 | 14 |
| Tenes | Water | 51%(8) | Algeria | USD | 7 M ft3/day | Not rated | 2015 | 16 |
Notes:
| (1) | 65% of the shares in Chile PV 1, Chile PV 2 and Chile PV 3 are indirectly held by financial partners through the renewable energy platform of the Company in Chile. Atlantica has control over these entities under IFRS 10, Consolidated Financial Statements. | |
| (2) | Itochu Corporation holds 30% of the shares in each of Solaben 2 and Solaben 3. | |
| (3) | JGC holds 13% of the shares in each of Solacor 1 and Solacor 2. | |
| (4) | Instituto para la Diversificación y Ahorro de la Energía (“Idae”) holds 20% of the shares in Seville PV. | |
| (5) | Kaxu is owned by the Company (51%), Industrial Development Corporation of South Africa (“IDC”, 29%) and Kaxu Community Trust (20%). | |
| (6) | Algerian Energy Company, SPA owns 49% of Skikda and Sacyr Agua, S.L. owns the remaining 16.8%. Atlantica has control over it under IFRS 10, Consolidated Financial Statements. | |
| (7) | Algerian Energy Company, SPA owns 49% of Honaine and Sacyr Agua, S.L. owns the remaining 25.5%. | |
| (8) | Algerian Energy Company, SPA owns 49% of Tenes. The Company has an investment in Tenes through a secured loan to Befesa Agua Tenes (the holding company of Tenes) and the right to appoint a majority at the board of directors of the project company. Therefore, the Company controls Tenes since May 31, 2020, and fully consolidates the asset from that date. | |
| (9) | Certain contracts denominated in U.S. dollars are payable in local currency. | |
| (10) | Reflects the counterparty’s credit ratings issued by S&P, Moody’s, and Fitch. Not applicable (“N/A”) when the asset has no PPA. | |
| (11) | Refers to the credit rating of two Community Choice Aggregators: Silicon Valley Clean Energy and Monterrey Bar Community Power, both with A Rating from S&P. The third off-taker Southern California Public Power Authority is not rated. | |
| (12) | Refers to the credit rating of Uruguay, as UTE (Administración Nacional de Usinas y Transmisoras Eléctricas) is unrated. | |
| (13) | Refers to the credit rating of the Republic of South Africa. The off-taker is Eskom, which is a state-owned utility company in South Africa. | |
| (14) | Refers to the credit rating of a diversified mix of 22 high credit quality clients (~60% AA- rating or higher). | |
| (15) | Including ATN Expansion 1 & 2. | |
| (16) | Part of Vento II portfolio. | |
| (17) | As of December 31, 2023. | |
| (18) | Accounted for as held for sale as of December 31, 2023. | |
| (*) | Commercial Operation Date. |
Definitions
Unless otherwise specified or the context requires otherwise in this annual report:
| - | references to “2020 Green Private Placement” refer to the €290 million (approximately $320 million) senior secured notes maturing on June 20, 2026 which were issued under a senior secured note purchase agreement entered with a group of institutional investors as purchasers of the notes issued thereunder; |
| - | references to “Abengoa” refer to Abengoa, S.A., together with its subsidiaries, unless the context otherwise requires; |
| - | references to “ACT” refer to the gas-fired cogeneration facility located inside the Nuevo Pemex Gas Processing Facility near the city of Villahermosa in the State of Tabasco, Mexico; |
| - | references to “ADEQ” refer to Arizona’s Departments of Environmental Quality; |
| - | references to “Adjusted EBITDA” have the meaning set forth in the Section entitled “Non-GAAP Financial Measures” in the section “Financial review.”; |
| - | References to “Albisu” refer to the 10 MW solar PV plant located in Uruguay; |
| - | references to “Algonquin” refer to, as the context requires, either Algonquin Power & Utilities Corp., a North American diversified generation, transmission and distribution utility, or Algonquin Power & Utilities Corp. together with its subsidiaries; |
| - | references to “Algonquin ROFO Agreement and Liberty GES ROFO Agreement” refer to the agreements we entered into with Algonquin and with Liberty GES, respectively, on March 5, 2018, under which Algonquin and Liberty GES granted us a right of first offer to purchase any of the assets offered for sale located outside of the United States or Canada as amended from time to time; |
| - | references to “Amherst Island Partnership” or “AIP” refer to the holding company of Windlectric Inc; |
| - | references to “Annual Consolidated Financial Statements” refer to the audited annual consolidated financial statements as of December 31, 2023 and 2022, including the related notes thereto, prepared in accordance with IFRS as issued by the IASB (as such terms are defined herein), included in this annual report; |
| - | references to “ASI Operations” refer to ASI Operations LLC; |
| - | references to “Atlantica” refer to Atlantica Sustainable Infrastructure plc and, where the context requires, Atlantica Sustainable Infrastructure plc together with its consolidated subsidiaries; |
| - | references to “Atlantica Jersey” refer to Atlantica Sustainable Infrastructure Jersey Limited, a wholly-owned subsidiary of Atlantica; |
| - | references to “ATM Plan Letter Agreement” refer to the agreement by and among the Company and Algonquin dated August 3, 2021, pursuant to which the Company offers Algonquin the right but not the obligation, on a quarterly basis, to purchase a number of ordinary shares to maintain its percentage interest in Atlantica at the average price of the shares sold under the Distribution Agreement in the previous quarter, as adjusted; |
| - | references to “ATN” refer to ATN S.A., the operational electric transmission asset in Peru, which is part of the Guaranteed Transmission System; |
| - | references to “ATS” refer to Atlantica Transmision Sur S.A.; |
| - | references to “AVERT” refer to Avoided Emissions and Generation Tool a U.S. national weighted average CO2 marginal emission rate, to convert reductions of kilowatt-hours into avoided units of CO2 emissions; |
| - | references to “AYES Canada” refer to Atlantica Sustainable Infrastructure Energy Solutions Canada Inc., a vehicle formed by Atlantica and Algonquin to channel co-investment opportunities; |
| - | references to “Befesa Agua Tenes” refer to Befesa Agua Tenes, S.L.U; |
| - | references to “cash available for distribution” or CAFD refer to the cash distributions received by the Company from its subsidiaries minus cash expenses of the Company, (including third party debt service and general and administrative expenses), including proceeds from the sale of assets; |
| - | references to “CAISO” refer to the California Independent System Operator; |
| - | references to “Calgary District Heating” or “Calgary” refer to the 55 MWt thermal capacity district heating asset in the city of Calgary which we acquired in May 2021; |
| - | references to “CDP” refer to Carbon Disclosure Project a leading provider of environmental management and transparency and rates more than 9,600 companies with assets of US$106 trillion and representing over 50% of global market capitalisation; |
| - | references to “Chile PV 1” refer to the solar PV plant of 55 MW located in Chile; |
| - | references to “Chile PV 2” refer to the solar PV plant of 40 MW located in Chile; |
| - | references to “Chile PV 3” refer to the solar PV plant of 73 MW located in Chile; |
| - | references to “Chile TL 3” refer to the 50-mile transmission line located in Chile; |
| - | references to “Chile TL 4” refer to the 63-mile transmission line located in Chile; |
| - | references to “CNMC” refer to Comision Nacional de los Mercados y de la Competencia, the Spanish state-owned regulator; |
| - | references to “Corruption” consists of the abuse of power with the goal of private gain and can be initiated by individuals in the public or private sector. Corrupt practices include, but are not limited to, bribes, extortion, collusion, conflicts of interest and money laundering; |
| - | references to “COD” refer to the commercial operation date of the applicable facility; |
| - | references to “Coso” refer to the 135 MW geothermal plant located in California; |
| - | references to the “Distribution Agreement” refer to the agreement entered into with BofA Securities, Inc., MUFG Securities Americas Inc. and RBC Capital Markets LLC, as sales agents, dated February 28, 2022 as amended on May 9, 2022, under which we may offer and sell from time to time up to $150 million of our ordinary shares and pursuant to which such sales agents may sell our ordinary shares by any method permitted by law deemed to be an “at the market offering” as defined by Rule 415(a)(4) promulgated under the U.S. Securities Act of 1933, as amended; |
| - | references to “DOE” refer to the U.S. Department of Energy; |
| - | references to “DTC” refer to The Depository Trust Company; |
| - | references to “EMEA” refer to Europe, Middle East and Africa; |
| - | references to “EPA” refer to United States Environmental Protection Agency; |
| - | references to “EPC” refer to engineering, procurement and construction; |
| - | references to “ESG” refer to environmental, social and corporate governance; |
| - | references to “Eskom” refer to Eskom Holdings SOC Limited, together with its subsidiaries, unless the context otherwise requires; |
| - | references to “ETF” refer to passively managed funds; |
| - | references to “EURIBOR” refer to Euro Interbank Offered Rate, a daily reference rate published by the European Money Markets Institute, based on the average interest rates at which Eurozone banks offer to lend unsecured funds to other banks in the euro wholesale money market; |
| - | references to “EU” refer to the European Union; |
| - | references to “Federal Financing Bank” refer to a U.S. government corporation by that name; |
| - | references to “Fitch” refer to Fitch Ratings Inc.; |
| - | references to “FCPA” refer to U.S. Foreign Corrupt Practices Act; |
| - | references to “Green Exchangeable Notes” refer to the $115 million green exchangeable senior notes due in 2025 issued by Atlantica Jersey on July 17, 2020, and fully and unconditionally guaranteed on a senior, unsecured basis, by Atlantica; |
| - | references to “Green Project Finance” refer to the green project financing agreement entered into between Logrosan, the sub-holding company of Solaben 1 & 6 and Solaben 2 & 3, as borrower, and ING Bank, B.V. and Banco Santander S.A., as lenders; |
| - | references to “Green Senior Notes” refer to the $400 million green senior notes due in 2028; |
| - | references to “GRI” refers to Global Reporting Initiative standards, an internationally recognised standardised framework for disclosing economic, environmental and social performance; |
| - | references to “Gross capacity” refers to the maximum, or rated, power generation capacity, in MW, of a facility or group of facilities, without adjusting for the facility’s power parasitic consumption, or by our percentage of ownership interest in such facility as of the date of this annual report; |
| - | references to “GWh” refer to gigawatt hour; |
| - | references to “IAS” refer to International Accounting Standards issued by the IASB; |
| - | references to “IASB” refer to the International Accounting Standards Board; |
| - | references to “IFRIC 12” refer to International Financial Reporting Interpretations Committee’s Interpretation 12—Service Concessions Arrangements; |
| - | references to “IFRS as issued by the IASB” refer to International Financial Reporting Standards as issued by the International Accounting Standards Board; |
| - | references to “ILO” refer to International Labour Rights; |
| - | references to “Independent Director” refers to, following Nasdaq rules, a person other than an officer or employee of a company or its subsidiaries or a person who, in the opinion of the board of directors, has a relationship that would interfere with the exercise of independent judgment in carrying out the responsibilities of a director. Atlantica has chosen to follow the requirements of the NASDAQ Listing Rules in terms of corporate governance. As of December 31, 2023, Atlantica has determined that the non-executive directors Mr. Aziz, Ms. Del Favero, Ms. Eprile, Mr. Hall, Mr. Forsayeth and Mr. Woollcombe are independent directors as they do not have a relationship that would interfere with the exercise of independent judgment in carrying out the responsibilities of a director. Mr. Banskota and Mr. Farquhar were considered non-independent based on their relationship with Algonquin, which is currently Atlantica’s largest shareholder. Mr. Banskota was the Chief Executive Officer of Algonquin until August 2023 when he resigned from his position, while Mr. Farquhar is the current Senior Vice President, International Development at Algonquin; |
| - | references to “IPO” refer to our initial public offering of ordinary shares in June 2014; |
| - | references to “IRA” refer to the U.S. Inflation Reduction Act; |
| - | references to “Italy PV” refer to the six solar PV plants located in Italy with combined capacity of 9.8 MW; |
| - | references to “IPCC” refer to the Intergovernmental Panel on Climate Change; |
| - | references to “ITC” refer to investment tax credits; |
| - | references to “Kaxu” refer to the 100 MW solar plant located in South Africa; |
| - | references to “La Sierpe” refer to the 20MW solar asset in Colombia; |
| - | references to “La Tolua” refer to the 20 MW solar PV plant located in Colombia; |
| - | references to “LDR” refer to Lost Day Rate calculated as “(Lost Days in a Year / Total Worked-Hours) * 200,000 worked-hours; |
| - | references to “Liberty GES” refer to Liberty Global Energy Solutions B.V., a subsidiary of Algonquin formerly known as Abengoa- Algonquin Global Energy Solutions B.V. (AAGES) which invests in the development and construction of contracted clean energy and water infrastructure contracted assets; |
| - | references to “LIBOR” refer to London Interbank Offered Rate; |
| - | references to “Logrosan” refer to Logrosan Solar Inversiones, S.A.; |
| - | references to “Lost Time Frequency Index” (LTFI) refer to the total number of recordable accidents with leave (lost time injury) recorded in the last 12 months per million of worked hours; |
| - | references to “Lost time injury rate” refer to the total number of recordable accidents with leave (lost time injury) recorded in the last 12 months per two hundred thousand worked hours; |
| - | references to “LTIP” refer to the long-term incentive plans approved by the Board of Directors; |
| - | references to “Mft3” refer to million standard cubic feet; |
| - | references to “Monterrey” refer to the 142 MW gas-fired engine facility including 130 MW installed capacity and 12 MW battery capacity, located in, Monterrey, Mexico; |
| - | references to “Multinational Investment Guarantee Agency” refer to Multinational Investment Guarantee Agency, a financial institution member of the World Bank Group which offers political insurance and credit enhancement guarantees; |
| - | references to “MW” refer to megawatts; |
| - | references to “MWh” refer to megawatt hour; |
| - | references to “MWt” refer to thermal megawatts; |
| - | references to “Moody’s” refer to Moody’s Investor Service Inc.; |
| - | references to “NMFR” refer to Near Miss Frequency Rate described by Sustainable Accounting Standards as near misses, unsafe acts and unsafe conditions frequency rate; |
| - | references to “NOL” refer to net operating loss; |
| - | references to “NEPA” refer to the National Environment Policy Act; |
| - | references to “NOL” refer to net operating loss; |
| - | references to “Note Issuance Facility 2020” refer to the senior unsecured note facility dated July 8, 2020, as amended on March 30, 2021, of €140 million (approximately $155 million), with Lucid Agency Services Limited, as facility agent and a group of funds managed by Westbourne Capital as purchasers of the notes issued thereunder; |
| - | references to “OECD” refer to the Organization for economic Co-operation and Development; |
| - | references to “O&M” refer to operation and maintenance services provided at our various facilities; |
| - | references to “operation” refer to the status of projects that have reached COD (as defined above); |
| - | references to “Pemex” refer to Petroleos Mexicanos; |
| - | references to “PG&E” refer to PG&E Corporation and its regulated utility subsidiary, Pacific Gas and Electric Company collectively; |
| - | references to “PPE” refer to personal protective equipment. |
| - | references to “PPA” refer to the power purchase agreements through which our power generating assets have contracted to sell energy to various off-takers; |
| - | references to “PTS” refer to Pemex Transportation System; |
| - | references to “PV” refer to photovoltaic power; |
| - | references to “Revolving Credit Facility” refers to the credit and guaranty agreement with a syndicate of banks entered into on May 10, 2018 as amended on January 24, 2019, August 2, 2019, December 17, 2019 and August 28, 2020, March 1, 2021, May 5, 2022 and May 30, 2023, providing for a senior secured revolving credit facility in an aggregate principal amount of $450 million; |
| - | references to “Rioglass” refer to Rioglass Solar Holding, S.A.; |
| - | references to “ROFO” refer to a right of first offer; |
| - | references to “ROFO agreements” refer to the AAGES ROFO Agreement and Algonquin ROFO Agreement; |
| - | references to “RRRE” refer to the Specific Remuneration System Register in Spain; |
| - | references to “SASB” refer to Sustainability Accounting Standards Board a guidance intended for use in communications to investors regarding sustainability issues that are likely to impact corporate ability to create value over the long term; |
| - | references to “SEC” refer to the U.S. Securities and Exchange Commission; |
| - | references to the “Shareholders’ Agreement” refer to the agreement by and among Algonquin Power & Utilities Corp., Abengoa-Algonquin Global Energy Solutions and Atlantica Sustainable Infrastructure plc, dated March 5, 2018, as amended; |
| - | references to “Skikda” refer to the seawater desalination plant in Algeria, which is 34% owned by Atlantica; |
| - | references to “SOFR” refer to Secured Overnight Financing Rate; |
| - | references to “Solaben Luxembourg” refer to Solaben Luxembourg S.A; |
| - | references to “Solnova 1, 3 & 4” refer to three solar plants with capacity of 50 MW wholly owned by Atlantica, located in the municipality of Sanlucar la Mayor, Spain; |
| - | references to “S&P” refer to S&P Global Rating; |
| - | references to “SDG” refer to Sustainable Development Goals a total of 17 goals defined by the UNG; |
| - | references to “Tenes” refer to the water desalination plant in Algeria, which is 51% owned by Befesa Agua Tenes; |
| - | references to “Tierra Linda” refer to the 10 MW solar PV plant located in Colombia; |
| - | references to “Total-Record Incident” refer to the total number of recordable accidents with and without leave (lost time injury) recorded in the last 12 months per two hundred thousand worked hours; |
| - | references to “Total Recordable Incident Rate” (TRIR) refer to the total number of recordable accidents with leave (lost time injury) recorded in the last twelve months per million of worked hours; |
| - | references to “TFCD” refer to Task Force on Climate related Financial Disclosures, a set of recommendations focused on four thematic areas that represent core operational elements, including: Governance, Strategy, Risk Management and Metrics and Targets; |
| - | references to “U.K.” refer to the United Kingdom; |
| - | references to “UNGC” refer to United Nations Global Compact, world’s largest corporate sustainability initiative; |
| - | reference to “U.S.” or “United States” refer to the United States of America; |
| - | references to “Vento II” refer to the wind portfolio in the U.S. in which we acquired a 49% interest in June 2021; |
| - | references to “WRI” refer to World Resources Institute; |
| - | references to “WTT DEFRA” refer to Well to Tank from the Department for Environment, Food and Rural Affairs; |
references to “we,” “us,” “our,” “Atlantica” and the “Company” refer to Atlantica Sustainable Infrastructure plc and its subsidiaries, unless the context otherwise requires.
Reconciliations
| - | Reconciliation of Adjusted EBITDA and Cash Available For Distribution to Profit for the period attributable to the Company |
| (in thousands of U.S. dollars) | For the year ended December 31, | |||||||
| 2023 | 2022 | |||||||
| Profit/(loss) for the period attributable to the Company | $ 43,380 | $ (5,443 | ) | |||||
| Profit/(loss) attributable to non-controlling interest | (6,932 | ) | 3,356 | |||||
| Income tax | 790 | (9,689 | ) | |||||
| Depreciation and amortisation, financial expense and income tax expense of unconsolidated affiliates (pro rata of our equity ownership) | 20,789 | 24,304 | ||||||
| Financial expense, net | 317,974 | 310,934 | ||||||
| Depreciation, amortisation, and impairment charges | 418,271 | 473,638 | ||||||
| Adjusted EBITDA | $ 794,922 | $ 797,100 | ||||||
| Atlantica’s pro-rata share of EBITDA from unconsolidated affiliates | (34,647 | ) | (45,769 | ) | ||||
| Non-monetary Items | (3,119 | ) | 27,996 | |||||
| Accounting provision for electricity market prices in Spain | (3,494 | ) | 25,253 | |||||
| Difference between billings and revenue in assets accounted for as concessional financial assets | 58,892 | 61,631 | ||||||
| Income from cash grants in the US | (58,516 | ) | (58,888 | ) | ||||
| Other non-monetary items | - | - | ||||||
| Maintenance Capex | (27,929 | ) | (18,588 | ) | ||||
| Dividends from equity method investments | 34,329 | 67,695 | ||||||
| Net interest and income tax paid | (272,709 | ) | (277,284 | ) | ||||
| Changes in other assets and liabilities | (92,738 | ) | 102,896 | |||||
| Deposits into/ withdrawals from restricted accounts1 | 47,617 | 33,018 | ||||||
| Change in non-restricted cash at project level54 | 126,324 | (61,672 | ) | |||||
| Dividends paid to non-controlling interests | (31,433 | ) | (39,209 | ) | ||||
| Debt principal repayment | (304,880 | ) | (348,311 | ) | ||||
| Cash Available For Distribution | $ 235,740 | $ 237,872 | ||||||
1 “Deposits into/ withdrawals from restricted accounts” and “Change in non-restricted cash at project level” are calculated on a constant currency basis to reflect actual cash movements isolated from the impact of variations generated by foreign exchange changes during the period.
| - | Reconciliation of Adjusted EBITDA to Net Cash Provided by Operating Activities |
| (in thousands of U.S. dollars) | For the year ended December 31 | |||||||
| 2023 | 2022 | |||||||
| Net cash provided by operating activities | $ 388,048 | $ 586,322 | ||||||
| Net interest and income tax paid | 272,709 | 277,284 | ||||||
| Changes in working capital | 95,843 | (78,805 | ) | |||||
| Non-monetary items and other | 3,674 | (33,470 | ) | |||||
| Atlantica’s pro-rata share of EBITDA from unconsolidated affiliates | 34,648 | 45,769 | ||||||
| Adjusted EBITDA | $ 794,922 | $ 797,100 | ||||||
| - | Reconciliation of CAFD to CAFD per share |
| For the year ended December 31 | ||||||||
| 2023 | 2022 | |||||||
| CAFD (in thousands of U.S. dollars) | $ 235,740 | $ 237,872 | ||||||
| Weighted Number of Shares (basic) for the period (in thousands) | 116,152 | 114,695 | ||||||
| CAFD per share (in U.S. dollars) | $ 2.0296 | $ 2.0740 | ||||||
Global Reporting Initiative (GRI) Content Index
Atlantica Sustainable Infrastructure Plc has reported in accordance with the GRI Standards for the period January 1, 2023 and December 31, 2023.
| GRI Standard | Description, section(s) and/or URL(s) |
| GRI 1: Foundation 2021 | |
| Reporting principles |
This report adheres to the following principles: • Stakeholder inclusiveness • Sustainability context • Materiality • Completeness • Accuracy • Balance • Clarity • Comparability • Reliability • Timeliness |
| GRI 2: General Disclosures 2021 | |
| 1. The organisation and its reporting practices | |
| 2-1 Organisational details |
Atlantica Sustainable Infrastructure Plc Great West Road, Brentford TW8 9DF, Greater London (United Kingdom) Atlantica Sustainable Infrastructure plc common shares trade on the Nasdaq Stock Exchange under the symbol “AY” Our sustainable business model and strategy (Strategic Report) Detailed asset portfolio: Asset Portfolio (Other Information) |
| 2-2 Entities included in the organisation’s sustainability reporting |
Entities included in the consolidated financial statements are entities in which Atlantica has control and its associates. Report Information (About this report) Detailed asset portfolio: Asset Portfolio (Other Information) |
| 2-3 Reporting period, frequency and contact point |
Reporting period: January 1, 2023 to December 31, 2023. Frequency of reporting: Annual Contact points: Leire Perez; Irene Rodriguez Email addresses: ESG@atlantica.com, or ir@atlantica.com Integrated Annual Report Information (About this report) |
| 2-4 Restatements of information |
2022 and 2021 ESG-related disclosure restatements have been performed to ensure consistency and enable comparability of information between reporting periods. We have revised 2022 and 2021 figures following the new perimeter of consolidation. According to the new perimeter, ESG data reported corresponds to all consolidated subsidiaries. For Companies where Atlantica has joint financial control, we are consolidating the percentage of equity ownership for each of the ESG KPIs reported. Green House Gas emissions are accounted for following the financial control approach from the GHG Protocol. Emissions from joint ventures where partners have joint financial control are accounted for based on the equity share approach. We are accounting for proportional scope 1 and scope 2 emissions of equity investments in scope 3, category 15 (Investments). The revised KPIs are mainly related to the environmental and health and safety dimensions: - GHG emissions, non-GHG emissions, energy management, water management and waste management (Strategic Report; Environmental Sustainability). - Health and Safety KPIs (Strategic Report; Occupational Health and Safety). In addition, we have also restated 2022 and 2021 turnover rates (Strategic Report, Social Sustainability) to show the new measurement methodology. |
| 2-5 External assurance |
Data Review (About this report) - GHG emissions Scope 1, 2 and 3: 100% externally reviewed - Non-GHG emissions, water and waste KPIs 100% externally reviewed Asset management (Strategic Report; Social Sustainability): ISO 9001, 14001 and 45,001 compliant, environmental and quality management system reviewed by DNV. Data security (Strategic Report) ISO 27001 compliant All reviews were performed by independent third parties. |
| 2. Activities and workers | |
| 2-6 Activities, value chain and other business relationships |
Atlantica in Two Minutes Our sustainable business model and strategy; Key performance indicators; A fair review of the business; and ESG materiality analysis (Strategic Report) Supply chain management and customer management (Strategic Report; Social Sustainability) Detailed asset portfolio (Other information) |
| 2-7 Employees |
Key Performance Indicators (Strategic Report) People and Culture; Section 172 Statement (Strategic Report; Social Sustainability) Atlantica does not have non-guaranteed hours employees. |
| 2-8 Workers who are not employees |
People and Culture (Strategic Report; Social Sustainability) Atlantica does not have workers who are not employees. |
| 3. Governance | |
| 2-9 Governance structure and composition |
Sustainability governance and Directors’ Report (Governance Section) Key Management (Strategic Report; Social Sustainability; People and Culture) |
| 2-10 Nomination and selection of the highest governance body |
Sustainability Governance (Governance Section) Directors’ Report (Governance Section) Committee Charters (at Board level) https://www.atlantica.com/web/en/company-overview/corporate-governance/corporate-governance-documents/ Corporate Governance Guidelines (https://www.atlantica.com/wp-content/uploads/documents/Corporate-Governance-Guidelines_2021.pdf) |
| 2-11 Chair of the highest governance body | Sustainability Governance and Directors’ Report (Governance Section) |
|
2-12 Role of the highest governance body in overseeing the management of impacts |
Sustainability governance and directors’ report (Governance Section) Stakeholder engagement (About this report; ESG Materiality assessment) Stakeholder policy (https://www.atlantica.com/web/en/sustainability/stakeholder-policy/) Environmental compliance, principal risks and uncertainties and section 172 statement (Strategic Report) Human rights (Strategic Report; Social Sustainability) |
| 2-13 Delegation of responsibility for managing impacts |
Sustainability governance and directors’ report (Governance Section) Principal risks and uncertainties (Strategic Report) |
| 2-14 Role of the highest governance body in sustainability reporting |
Data review (About this report) Atlantica’s Board of Directors approved this Integrated Annual Report prior to its publication Directors’ responsibilities statement (Strategic Report) Sustainability governance (Governance Section) |
| 2-15 Conflicts of interest | Business ethics and directors’ report (Governance Section) |
| 2-16 Communication of critical concerns |
Business ethics, sustainability governance, directors’ report and audit committee report (Governance Section) Human rights (Strategic Report; Social Sustainability) Cybersecurity and data Privacy (Strategic Report) |
| 2-17 Collective knowledge of the highest governance body | Sustainability governance and directors’ report (Governance Section) |
| 2-18 Evaluation of the performance of the highest governance body |
Sustainability governance and directors’ report (Governance Section) |
| 2-19 Remuneration policies |
Directors’ remuneration report (Governance Section) Key management (Strategic Report; Social Sustainability; People and Culture) |
| 2-20 Process to determine remuneration |
Directors’ report and directors’ remuneration report (Governance Section) People and Culture (Strategic Report; Social Sustainability) |
| 2-21 Annual total compensation ratio |
Directors’ remuneration report (Governance Section) |
| 4. Strategy, policies and practices | |
| 2-22 Statement on sustainable development strategy |
Our sustainable business model and strategy (Strategic Report) Sustainability governance (Governance Section) |
| 2-23 Policy commitments |
Our Purpose and Values Business ethics (Governance Section) |
|
Our Sustainable Business Model and Strategy (Strategic Report) Human rights (Strategic Report; Social Sustainability) Corporate governance policies and documents available at: https://www.atlantica.com/web/en/company-overview/corporate-governance/corporate-governance-documents/ ESG-related policies available at: https://www.atlantica.com/web/en/policies/ We apply the Precautionary Principle consistently when we assess risks related to the Environment in all our activities. |
|
| 2-24 Embedding policy commitments |
Sustainability governance and directors’ report (Governance Section) Corporate Governance policies and documents available on our website ESG-related policies available on our website |
| 2-25 Processes to remediate negative impacts |
Business ethics and directors’ report (Governance Section) Human rights (Strategic Report; Social Sustainability) Principal risks and uncertainties and environmental sustainability (Strategic Report) |
| 2-26 Mechanisms for seeking advice and raising concerns |
Business ethics and directors’ report (Governance Section) People and Culture and human rights (Social Sustainability) |
| 2-27 Compliance with laws and regulations |
Business ethics and directors’ report (Governance Section) Environmental compliance and cybersecurity and Data Privacy (Strategic Report) Human rights (Strategic Report; Social Sustainability) No significant fines or non-monetary sanctions for non-compliance with laws and/or regulations in the environmental, social and economic areas were received in 2023, 2022 and 2021. |
| 2-28 Membership associations | Business ethics (Governance Section) |
| 5. Stakeholder Engagement | |
| 2-29 Approach to stakeholder engagement |
ESG materiality assessment (Strategic Report) Stakeholder engagement policy and other Compliance and ESG-related policies available on our website
People and Culture, supply chain management, customer management and local communities (Strategic Report; Social Sustainability) |
| 2-30 Collective bargaining agreements |
Collective bargaining agreements (Strategic Report; Social Sustainability; People and Culture) Atlantica’s remuneration package includes monetary compensation and remuneration in-kind, depending on the employee’s position, and on local practices in the countries where we operate. In all cases, Atlantica’s remuneration package complies with all local rules and regulations. |
| Material Topics | |
| GRI 3: Material Topics 2021 | |
| 3-1 Process to determine material topics |
ESG materiality analysis (Strategic Report) |
| 3-2 List of material topics |
ESG materiality analysis (Strategic Report) In 2023, no significant changes were made to the list of material topics compared to the previous reporting period. |
| 3-3 Management of material topics |
ESG materiality analysis (Strategic Report) Sustainability governance and directors’ directors (Governance Section) Principal risks and uncertainties and section 172 statement (Strategic Report) TCFD reporting, GHG emissions, water and waste management, and biodiversity (Strategic Report; Environmental Sustainability) Human rights, health and safety, People and Culture, supply chain management and local communities (Strategic Report; Environmental Sustainability) Asset management (Strategic Report) Independent Auditor’s Report (Other information) Atlantica periodically performs internal analysis comparing current practices with benchmarks in different areas. In addition, the Compliance Management Committee periodically analyses best practices and benchmarks to improve our compliance practices over time. The Board of Directors reviews annually Atlantica’s board practices and compares them to best practices following recommendations from the U.K. Institute of Directors and the main proxy advisors incorporating recommendations whenever possible. |
|
CDP (Climate Change and Water questionnaires), S&P CSA and Sustainalytics ESG assessments provide valuable information and have been used internally to improve certain areas following best practices. Asset management functions are a core part of our business and are also periodically evaluated against best practices. |
|
| Economic performance | |
| GRI 201: Economic Performance 2016 | |
| 3-3 Management of material topics | Key Performance Indicators, A Fair Review of the Business, and ESG Materiality Analysis (Strategic Report) |
| 201-1 Direct economic value generated and distributed | Direct economic value generated, distributed and retained for the year ended December 31, 2023, 2022 and 2021: |
| $ in Millions | 2023 | 2022 | 2021 | |
| Economic Value Generated | 1,226 | 1,193 | 1,290 | |
| Revenue | 1,100 | 1,102 | 1,212 | |
| Other Operating Income | 101 | 81 | 75 | |
| Financial Income | 25 | 10 | 3 | |
| Economic Value Distributed | (944) | (925) | (1,030) | |
| Operating costs, including wages and benefits | (441) | (433) | (493) | |
| Payments to providers of capital1 | (475) | (475) | (484) | |
| Payments to Government2 | (26) | (15) | (52) | |
| Community Investments3 | (1.5) | (1.5) | (1.3) | |
| Economic Value Retained | 282 | 268 | 260 |
|
Note: Figures were determined according to GRI 201 guidelines 1 Interest paid and Dividends paid to Company’s shareholders 2 Income tax paid 3 Community investments in the U.S., Chile, Colombia, Peru, South Africa and Algeria Key Performance Indicators and A Fair Review of the Business (Strategic Report) Local Communities (Strategic Report; Social Sustainability) Detailed financial information provided in our 2023 annual report: U.S. Securities Exchange Commission Form 20-F available on our website |
|
|
201-2 Financial implications and other risks and opportunities due to climate change |
Task Force on Climate-Related Financial Disclosures (Strategic Report; Environmental Sustainability) Principal risks and uncertainties (Strategic Report) 2023 CDP’s Climate Change questionnaire at www.atlantica.com Sustainability governance (Governance section) |
| 201-3 Defined benefit plan obligations and other retirement plans | The Company does not have any defined benefit compensation plans. The only retirement obligations are related to 401(k) plans in the U.S. in accordance with the regulation in place and in the U.K. also in accordance with the regulation in place. |
| 201-4 Financial assistance received from government | 2023 Consolidated Financial Statements (Other Information) |
| GRI 204: Procurement Practices | |
| 3-3 Management of material topics |
ESG materiality analysis (Strategic Report) |
| 204-1 Proportion of spending on local suppliers |
Supply chain management (Strategic Report; Social Sustainability) Local supplier is an organisation or person that provides a product or service in the country where we perform our business activities. |
| GRI 205: Anti-Corruption 2016 | |
| 3-3 Management of material topics |
ESG Materiality Analysis (Strategic Report) Atlantica’s webpage corporate Governance Section |
| 205-1 Operations assessed for risks related to corruption |
Business ethics (Governance Section) United Nations Global Compact, Principal Risks and Uncertainties, Supply Chain Management, Cybersecurity and Data Privacy, (Strategic Report; Social Sustainability) |
|
205-2 Communication and training about anti-corruption policies and procedures |
Business ethics (Governance Section) People and Culture (Strategic Report; Social Sustainability) |
| 205-3 Confirmed incidents of corruption and actions taken |
Business ethics (Governance Section) In 2023, no Code of Conduct incidents were identified. |
| GRI 206: Anti-Competitive Behaviour 2016 | |
| 3-3 Management of material topics |
ESG materiality analysis (Strategic Report) Atlantica’s Webpage: Corporate Governance Section |
|
206-1 Legal actions for anti-competitive behaviour, anti-trust, and monopoly practices |
No legal actions or anti-competitive behaviour, anti-trust, or monopoly practices have been taken in 2023, 2022 and 2021. Business ethics (Governance Section) |
| GRI 207: Tax 2019 | |
| 3-3 Management of material topics |
ESG Materiality Analysis (Strategic Report) Atlantica’s Webpage: Corporate Governance Section We have decided to voluntarily apply GRI 207 requirements |
| 207-1 Approach to tax |
Tax Strategy: Tax Management Atlantica’s tax strategy is available on our website (Corporate Governance section) |
| 207-2 Tax governance, control, and risk management |
Tax Management (Strategic Report) |
| 207-3 Stakeholder engagement and management of concerns related to tax |
Tax Management (Strategic Report) |
| 207-4 Country-by-country reporting | Confidentiality constraints |
| Category: Environmental | |
| GRI 302: Energy 2016 | |
| 3-3 Management of material topics |
ESG Materiality Analysis (Strategic Report) Environmental Sustainability (Strategic Report) We have decided to voluntarily apply GRI 302 requirements |
| 302-1 Energy consumption within the organisation |
Energy Management (Strategic Report; Environmental Sustainability) 2023 CDP Climate Change questionnaire (available at www.atlantica.com) |
| 302-2 Energy consumption outside of the organisation | Partially disclosed. Energy consumption outside of the organisation is included in our scope 3 GHG emissions. |
| 302-3 Energy Intensity |
Energy Management Strategic Report; Environmental Sustainability. 2023 CDP Climate Change questionnaire (available at www.atlantica.com) |
| 302-4 Reduction of energy consumption |
Greenhouse Gas Emissions (Strategic Report; Environmental Sustainability) |
| 302-5 Reductions in energy requirements of products and services |
Greenhouse Gas Emissions (Strategic Report; Environmental Sustainability) Our Operations Department dedicates time and efforts to identify potential measures to improve efficiency at our assets. This could result in reduction of energy consumption over time. Asset Management (Strategic Report) |
| GRI 303: Water and Effluents 2018 | |
| 3-3 Management of material topics |
ESG Materiality Analysis (Strategic Report) Key Performance Indicators (Strategic Report) Task Force on Climate-Related Financial Disclosures (Strategic Report; Environmental Sustainability) Water Management (Strategic Report; Environmental Sustainability) |
|
Environmental Policy available on our website |
|
| 303 -1 Interactions with water as a shared resource | Water Management (Strategic Report; Environmental Sustainability) |
| 303-2 Management of water discharge-related impacts |
Water Management (Strategic Report; Environmental Sustainability) 2023 CDP Climate Change questionnaire (available at www.atlantica.com) |
| 303-3 Water withdrawal |
Water Management (Strategic Report; Environmental Sustainability) We have reported the data in million cubic metres Our Municipality Water withdrawals are immaterial |
| 303-4 Water discharge |
Water Management (Strategic Report; Environmental Sustainability) We have reported the data in million cubic metres Our Municipality Water discharges are immaterial |
| 303-5 Water consumption |
Water Management (Strategic Report; Environmental Sustainability) We have reported the data in million cubic metres Our Municipality Water consumption is immaterial |
| GRI 304: Biodiversity 2016 | |
| 103-1 Explanation of the material topic and its Boundary |
ESG Materiality Analysis (Strategic Report) Biodiversity (Strategic Report; Environmental Sustainability) Biodiversity Policy available on our website |
| 304-1: Operational sites owned, leased, managed in, or adjacent to, protected areas and areas of high biodiversity value outside protected areas |
Biodiversity (Strategic Report; Environmental Sustainability) Partially disclosed: Information unavailable |
| 304-2 Significant impacts of activities, products, and services on biodiversity |
Biodiversity (Strategic Report; Environmental Sustainability) |
| 304-3 Habitats protected or restored |
Biodiversity (Strategic Report; Environmental Sustainability) |
| 304-4 IUCN Red List species and national conservation list species with habitats in areas affected by operations |
Omission: Information incomplete |
| GRI 305: Emissions 2016 | |
| 3-3 Management of material topics |
ESG Materiality Analysis (Strategic Report) Greenhouse Gas Emissions (Strategic Report; Environmental Sustainability) Environmental Policy available on our website |
| 305-1 Direct (Scope 1) GHG emissions |
Greenhouse Gas Emissions (Strategic Report; Environmental Sustainability) 2023 CDP Climate Change questionnaire (available at www.atlantica.com) |
| 305-2 Energy indirect (Scope 2) GHG emissions |
Greenhouse Gas Emissions (Strategic Report; Environmental Sustainability) 2023 CDP Climate Change questionnaire (available at www.atlantica.com) |
| 305-3 Other indirect (Scope 3) GHG emissions |
Greenhouse Gas Emissions (Strategic Report; Environmental Sustainability) 2023 CDP Climate Change questionnaire (available at www.atlantica.com) |
| 305-4 GHG emissions intensity |
Greenhouse Gas Emissions (Strategic Report; Environmental Sustainability): GHG Emission Rate per Unit of Energy Generated 2023 CDP Climate Change questionnaire (available at www.atlantica.com) |
| 305-5 Reduction of GHG emissions |
Greenhouse Gas Emissions (Strategic Report; Environmental Sustainability) 2023 CDP Climate Change questionnaire (available at www.atlantica.com) |
| 305-6 Emissions of ozone-depleting substances (ODS) | Omission: Information unavailable |
| 305-7 Nitrogen oxides (NOX), sulphur oxides (SOX), and other significant air emissions |
Non-GHG emissions (Strategic Report; Environmental Sustainability) |
| GRI 306: Waste 2020 | |
| 306-1 Waste generation and significant waste-related impacts |
Waste management (Strategic Report; Environmental Sustainability) Environmental Policy available on our website |
| 306-2 Management of significant waste-related impacts | Waste management (Strategic Report; Environmental Sustainability) |
| 306-3 Waste generated |
Waste management (Strategic Report; Environmental Sustainability) All the waste is managed off-site |
| 306-4 Waste diverted from disposal |
Waste management (Strategic Report; Environmental Sustainability) |
| Category: Social | |
| GRI 401: Employment 2016 | |
| 3-3 Management of material topics |
ESG materiality analysis (Strategic Report) People and Culture (Strategic Report; Social Sustainability) |
| 401-1 New employee hires and employee turnover |
People and Culture (Strategic Report; Social Sustainability) |
|
401-2 Benefits provided to full-time employees that are not provided to temporary or part-time employees |
All benefits provided to full-time employees are the same to those provided to temporary or part-time employees. |
| 401-3 Parental leave | People and Culture (Strategic Report; Social Sustainability) |
| GRI 402: Labour/Management Relationship 2016 | |
| 3-3 Management of material topics |
ESG Materiality Analysis (Strategic Report) People and Culture (Strategic Report; Social Sustainability) |
|
402-1 Minimum notice periods regarding operational changes |
At Atlantica we generally provide a minimum of a two week notice prior to the implementation of significant operational changes that could substantially affect our employees. Where applicable, minimum number of weeks’ notice is specified in the collective bargaining agreements. Unexpected events may require different notice periods. |
| GRI 403: Occupational Health and Safety 2018 | |
| 3-3 Management of material topics |
ESG Materiality Analysis (Strategic Report) Occupational Health and Safety (Strategic Report; Social Sustainability) Health and Safety Policy available on our website |
| 403-1 Occupational health and safety management system | Occupational Health and Safety (Strategic Report; Social Sustainability) |
|
403-2 Hazard identification, risk assessment, and incident investigation |
Occupational Health and Safety (Strategic Report; Social Sustainability) |
| 403-3 Occupational health services | Occupational Health and Safety (Strategic Report; Social Sustainability) |
|
403-4 Worker participation, consultation, and communication on occupational health and safety |
Occupational Health and Safety (Strategic Report; Social Sustainability): Health and safety committees held with asset employee representatives cover all the necessary topics to promote a positive health and safety culture in our assets. |
| 403-5 Worker training on occupational health and safety | Occupational Health and Safety (Strategic Report; Social Sustainability) |
| 403-6 Promotion of worker health |
Occupational Health and Safety (Strategic Report; Social Sustainability) |
|
403-7 Prevention and mitigation of occupational health and safety impacts directly linked by business relationships |
Occupational Health and Safety (Strategic Report; Social Sustainability) |
| 403-8 Workers covered by an occupational health and safety management system | Occupational Health and Safety (Strategic Report; Social Sustainability) |
| 403-9 Work-related injuries | Occupational Health and Safety (Strategic Report; Social Sustainability) |
| 403-10 Work-related ill health | Atlantica does not have any workplaces with high-risk incidence of diseases |
| GRI 404: Training and Education 2016 | |
| 3-3 Management of material topics |
ESG Materiality Analysis (Strategic Report) People and Culture (Strategic Report; Social Sustainability) Occupational Health and Safety (Strategic Report; Social Sustainability) |
| 404-1 Average hours of training per year per employee |
People and Culture (Strategic Report; Social Sustainability) |
| 404-2 Programmes for upgrading employee skills and transition assistance programmes |
People and Culture and Occupational health and safety (Strategic Report; Social Sustainability) Asset Management (Strategic Report) Atlantica has upgrading skills training programmes for its employees. We do not have transition assistance programmes resulting from retirement or termination of employment |
| 404-3 Percentage of employees receiving regular performance and career development reviews |
People and Culture (Strategic Report; Social Sustainability) Annual performance appraisal for 100% of our employees. |
| GRI 405: Diversity and Equal Opportunity 2016 | |
| 3-3 Management of material topics |
ESG Materiality Analysis (Strategic Report) People and Culture (Strategic Report; Social Sustainability) Diversity and Inclusion Policy available on our website |
| 405-1 Diversity of governance bodies and employees |
People and Culture (Strategic Report; Social Sustainability) |
| 405-2 Ratio of basic salary and remuneration of women to men |
People and Culture (Strategic Report; Social Sustainability) |
| GRI 406: Non-discrimination 2016 | |
| 3-3 Management of material topics |
ESG Materiality Analysis (Strategic Report) People and Culture (Strategic Report; Social Sustainability) Business ethics (Governance Section) Code of Conduct available on our website |
| 406-1 Incidents of discrimination and corrective actions taken |
People and Culture (Strategic Report; Social Sustainability) In 2023, we did not receive any communication with respect to incidents relating to potential situations of discrimination |
| GRI 407: Freedom of Association and Collective Bargaining 2016 | |
| 3-3 Management of material topics |
ESG Materiality Analysis (Strategic Report) Human Rights and People and Culture (Strategic Report; Social Sustainability) Business ethics (Governance Section) Code of conduct and supplier code of conduct available on our website |
| 407-1 Operations and suppliers in which the right to freedom of association and collective bargaining may be at risk |
Human Rights and Anti-Slavery and Human Trafficking Statement (Strategic Report; Social Sustainability) Section 172 Statement (Strategic Report) Business ethics (Governance Section) |
| GRI 408: Child Labour 2016 | |
| 3-3 Management of material topics |
ESG Materiality Analysis (Strategic Report) Business ethics (Governance Section) Code of Conduct and Supplier Code of Conduct available on our website |
| 408-1 Operations and suppliers at significant risk for incidents of child labour |
Human Rights and Anti-Slavery and Human Trafficking Statement (Strategic Report; Social Sustainability) Section 172 Statement (Strategic Report) Business ethics (Governance Section) |
| GRI 409: Forced or Compulsory Labour 2016 | |
| 3-3 Management of material topics |
ESG Materiality Analysis (Strategic Report) Business ethics (Governance Section), Code of Conduct and Supplier Code of Conduct available on our website. |
|
409-1 Operations and suppliers at significant risk for incidents of forced or compulsory labour |
Human Rights and Anti-Slavery and Human Trafficking Statement (Strategic Report; Social Sustainability) Section 172 Statement (Strategic Report) Business ethics (Governance Section) |
| GRI 411 Rights Of Indigenous People 2016 | |
| 3-3 Management of material topics |
ESG Materiality Analysis (Strategic Report) Local Communities (Strategic Report; Social Sustainability) |
| 411- 1 Incidents of violations involving rights of Indigenous peoples | No incidents of violations involving the rights of Indigenous people have been registered in 2023, 2022 and 2021. |
| GRI 413: Local Communities 2016 | |
| 3-3 Management of material topics |
ESG Materiality Analysis (Strategic Report) Local Communities (Strategic Report; Social Sustainability) |
|
413-1 Operations with local community engagement, impact assessments, and development programmes |
Local Communities (Strategic Report; Social Sustainability) Partially disclosed: Information unavailable |
| 413-2 Operations with significant actual and potential negative impacts on local communities |
Given the nature of our business, we do not believe that our operations trigger significant damage to local communities. |
| GRI 415: Public Policy 2016 | |
| 3-3 Management of material topics |
ESG Materiality Analysis (Strategic Report) Business ethics (Governance Section) |
| 415-1 Political contributions | In 2023, 2022 and 2021 Atlantica nor any of its subsidiaries made any financial or in-kind political contributions to political campaigns, political organisations, lobbyists or lobbying organisations, trade associations with political impact nor other tax-exempt groups, whether directly or indirectly. |
| GRI 416: Customer Health and Safety 2016 | |
| 3-3 Management of material topics |
ESG Materiality Analysis (Strategic Report) Occupational health and safety (Strategic Report; Social Sustainability) |
| 416-1 Assessment of the health and safety impacts of product and service categories | Occupational health and safety (Strategic Report; Social Sustainability) |
| 416-2 Incidents of non-compliance concerning the health and safety impacts of products and services | We have not identified any non-compliance with regulations and/or voluntary codes concerning the health and safety impacts of products and services in 2023, 2022 nor 2021. |
| GRI 418 Customer Privacy 2016 | |
| 3-3 Management of material topics |
ESG Materiality Analysis (Strategic Report) Business ethics (Governance Section) |
|
418-1 Substantiated complaints concerning breaches of customer privacy and losses of customer data |
Cybersecurity and Data Privacy (Strategic Report) |
Sustainability Accounting Standards Board (SASB) Index
We are a sustainable infrastructure company with a majority of our business in renewable energy assets. We complement our portfolio of renewable assets with storage, efficient natural gas and transmission infrastructure assets, as enablers of the transition towards a clean energy mix. We are also present in water infrastructure assets, a sector at the core of sustainable development.
We provide the Electric Utilities and Power Generation SASB. In addition, given that Atlantica’s activity does not correspond exactly to the activity of an electric utility, we have included certain references to the Solar Technology Developers SASB, which are applicable to Atlantica.
1) Sustainability Disclosure Topics and Accounting Metrics Electric Utilities and Power Generation (Version 2018 – 10)
| Topic | SASB code | Accounting metric | Section |
| Greenhouse emissions and energy resource planning | IF-EU-110a.1 | (1) Gross global Scope 1 emissions, percentage covered under (2) emissions-limiting regulations, and (3) emissions-reporting regulations | Greenhouse Gas Emissions (Strategic Report; Environmental Sustainability) |
| IF-EU-110a.2 | Greenhouse gas (GHG) emissions associated with power deliveries | Not applicable. Atlantica does not deliver power to retail customers | |
| IF-EU-110a.3 | Discussion of long-term and short-term strategy or plan to manage Scope 1 emissions, emissions reduction targets, and an analysis of performance against those targets | Greenhouse Gas Emissions (Strategic Report; Environmental Sustainability) | |
| IF-EU-110a.4 | (1) Number of customers served in markets subject to renewable portfolio standards (RPS) and (2) percentage fulfilment of RPS target by market | Not applicable. Atlantica is not a utility company, and our customers are not subject to renewable portfolio standards. | |
| Air quality | IF-EU-120a.1 | Air emissions of the following pollutants: (1) NOx (excluding N2O), (2) SOx, (3) particulate matter (PM10), (4) lead (Pb), and (5) mercury (Hg); percentage of each in or near areas of dense population | Greenhouse Gas Emissions (Strategic Report; Environmental Sustainability): Non-GHG emissions |
| Water management | IF-EU-140a.1 | (1) Total water withdrawn, (2) total water consumed, percentage of each in regions with High or Extremely High Baseline Water Stress | Water Management (Strategic Report; Environmental Sustainability) |
| IF-EU-140a.2 | Number of incidents of non-compliance associated with water quantity and/or quality permits, standards, and regulations | No significant incidents or non-compliances were registered during the reporting period | |
| IF-EU-140a.3 | Description of water management risks and discussion of strategies and practices to mitigate those risks | Water Management (Strategic Report; Environmental Sustainability): Risk assessment | |
| Coal ash management | IF-EU-150a.1 | Amount of coal combustion residuals (CCR) generated, percentage recycled | Not applicable. Atlantica does not use coal in its operations |
| Topic | SASB code | Accounting metric | Section |
| IF-EU-150a.2 | Total number of coal combustion residual (CCR) impoundments, broken down by hazard potential classification and structural integrity assessment | Not applicable. Atlantica does not use coal in its operations | |
| Energy affordability | IF-EU-240a.1 | Average retail electric rate for (1) residential, (2) commercial, and (3) industrial customers | Not applicable. Atlantica does not sell energy to retail customers |
| IF-EU-240a.2 | Typical monthly electric bill for residential customers for (1) 500 kWh and (2) 1,000 kWh of electricity delivered per month | Not applicable. Atlantica does not sell energy to retail customers | |
| IF-EU-240a.3 | Number of residential customer electric disconnections for non-payment, percentage reconnected within 30 days | Not applicable. Atlantica does not sell energy to retail customers | |
| IF-EU-240a.4 | Discussion of impact of external factors on customer affordability of electricity, including the economic conditions of the service territory | Not applicable. Atlantica does not sell energy to retail customers | |
| Workforce health and safety | IF-EU-320a.1 | (1) Total recordable injury rate (TRIR), (2) fatality rate, and (3) Near Misses, Unsafe Acts and Unsafe Conditions Frequency Rate (NMFR) | Occupational health and safety (Strategic Report; Social Sustainability) |
| End-use efficiency and demand | IF-EU-420a.1 | Percentage of electric utility revenue from rate structures that (1) are decoupled and (2) contain a lost revenue adjustment mechanism (LRAM) | Not Applicable. Atlantica does not sell electricity to retail customers. Atlantica does not sell electricity under rate base note. Atlantica does not do distribution, it does not use smart grid technology |
| IF-EU-420a.2 | Percentage of electric load served by smart grid technology | Not Applicable. Atlantica does not sell electricity to retail customers. Atlantica does not sell electricity under rate base note. Atlantica does not do distribution, it does not use smart grid technology | |
| IF-EU-420a.3 | Customer electricity savings from efficiency measures, by market | Not Applicable. Atlantica does not sell electricity to retail customers. Atlantica does not sell electricity under rate base note. Atlantica does not do distribution, it does not use smart grid technology | |
| Nuclear safety and emergency management | IF-EU-540a.1 | Total number of nuclear power units, broken down by U.S. Nuclear Regulatory Commission (NRC) Action Matrix Column | Not applicable. Atlantica does not have any nuclear asset |
| IF-EU-520a.2 | Description of efforts to manage nuclear safety and emergency preparedness | Not applicable. Atlantica does not have any nuclear asset | |
| Grid Resiliency | IF-EU-550a.1 | Number of incidents of non-compliance with physical and/or cybersecurity standards or regulations | Not applicable |
| Topic | SASB code | Accounting metric | Section |
| IF-EU-550a.2 | (1) System Average Interruption Duration Index (SAIDI), (2) System Average Interruption Frequency Index (SAIFI), and (3) Customer Average Interruption Duration Index (CAIDI), inclusive of major event days | Not applicable |
2) Activity Metrics of the Electric Utilities and Power Generation.
| Activity metric | SASB code | Section |
| Number of: (1) residential, (2) commercial, and (3) industrial customers served | IF-EU-000.A | We have a total of 51 offtakers |
| Total electricity delivered to: (1) residential, (2) commercial, (3) industrial, (4) all other retail customers, and (5) wholesale customers | IF-EU-000.B |
The electricity we produce is not delivered to final customers. We deliver electricity to utilities (for example APS and PG&E) and to the grid in Spain, where payments are regulated. For additional information we refer to: Our Sustainable Business Model and Strategy (Strategic Report) A Fair Review of the Business (Strategic Report) Greenhouse Gas Emissions (Strategic Report; Environmental Sustainability): Energy management |
| Length of transmission and distribution lines | IF-EU-000.C |
Atlantica in Two Minutes (Strategic Report) A Fair Review of the Business (Strategic Report) |
| Total electricity generated, percentage by major energy source, percentage in regulated markets | IF-EU-000.D |
A Fair Review of the Business (Strategic Report) Greenhouse Gas Emissions (Strategic Report; Environmental Sustainability): Energy Management Form 20-F submitted to the U.S. Securities Exchange Commission |
| Total wholesale electricity purchased | IF-EU-000.E | Not Applicable |
3) Applicable Sustainability Disclosure Topics and Accounting Metrics from Solar Technology Developers (Version 2018-10).
| Topic | SASB code | Accounting metric | Section |
|
Water Management in Manufacturing |
RR-ST-140a.1 |
(1) Total water withdrawn, (2) total water consumed, percentage of each in regions with High or Extremely High Baseline Water Stress |
Water Management (Strategic Report; Environmental Sustainability) |
| RR-ST-140a.2 |
Description of water management risks and discussion of strategies and practices to mitigate those risks |
Water Management (Strategic Report; Environmental Sustainability) | |
| Hazardous Waste Management | RR-ST-150a.1 | Amount of hazardous waste generated percentage recycled | Waste Management (Strategic Report; Environmental Sustainability) |
| RR-ST-150a.2 | Number and aggregate quantity of reportable spills, quantity recovered | Waste Management (Strategic Report; Environmental Sustainability) |
Environmental, Social and Other Key Performance Indicators
| Units | 2023 | 2022 | 2021 | ||
|
Portfolio |
Renewable Energy | MW | 2,171 | 2,121 | 2,044 |
| Efficient natural gas | MW | 343 | 343 | 343 | |
| District heating | MWt | 55 | 55 | 55 | |
| Transmission lines | miles | 1,229 | 1,229 | 1,166 | |
| Water desalination | M ft3 | 17.5 | 17.5 | 17.5 | |
| Number of assets | # | 45 | 41 | 38 | |
|
Targets |
GHG reduction objective approved by the Science Based Target (SBTi)(1) | ✓ | ✓ | ✓ | |
|
Maintain over 85% of Adjusted EBITDA generated from low-carbon footprint assets |
✓ | ✓ | ✓ | ||
|
Key Performance Indicators |
Revenue | $ in millions | 1,100 | 1,102 | 1,212 |
| Adjusted EBITDA | $ in millions | 795 | 797 | 824 | |
| Cash Available for Distribution (CAFD) | $ in millions | 236 | 238 | 226 | |
| Dividends per share paid | amount in dollars | 1.78 | 1.77 | 1.72 | |
|
Environmental Dimension |
|||||
|
Installed Capacity in Generation Assets, MW |
Renewable Energy | MW | 85% | 84% | 84% |
| Efficient Natural Gas and Heat | MW | 15% | 16% | 16% | |
|
GHG Emissions Avoided |
Total Atlantica | Million Tonnes of CO2 | 7.0 | 6.9 | 5.9 |
|
Atlantica’s GHG emission rate per unit of energy generated vs. Fossil Fuel-Based Generation GHG emission rate per unit of energy generated Ratio |
Scopes 1 and 2 GHG Emissions Rate per Unit of Energy Generated | gCO2/kWh | 162 | 168 | 185 |
| Electricity-related emissions factor (AVERT) | gCO2/kWh | 709 | 709 | 709 | |
|
GHG Emissions Generated by Source |
Efficient natural gas | % | 70% | 71% | 75% |
| Others | % | 30% | 29% | 25% | |
|
GHG Emissions by Scope Including Offset GHG emissions |
Scope 1 | 000´s tonnes of CO2e | 1,395 | 1,524 | 1,535 |
| Scope 2 | 000´s tonnes of CO2e | 250 | 249 | 237 | |
| Scope 3 | 000´s tonnes of CO2e | 799 | 814 | 798 | |
| Total | 000´s tonnes of CO2e | 2,444 | 2,587 | 2,569 | |
|
GHG Emissions Breakdown by Scope |
Scope 1 | 000´s tonnes of CO2e | 1,775 | 1,844 | 1,795 |
| Scope 2 | 000´s tonnes of CO2e | 250 | 249 | 237 | |
| Scope 3 | 000´s tonnes of CO2e | 799 | 814 | 798 | |
| Total | 000´s tonnes of CO2e | 2,824 | 2,907 | 2,829 | |
| Scope 3 - Category 1 | Purchased goods and services | 000´s tonnes of CO2e | 161 | 71 | 61 |
| Scope 3 - Category 2 | Capital goods | 000´s tonnes of CO2e | - | 2 | 2 |
| Units | 2023 | 2022 | 2021 | ||
| Scope 3 - Category 3 |
Fuel- and energy-related activities not included in Scope 1 or Scope 2 |
000´s tonnes of CO2e | 526 | 634 | 635 |
| Scope 3 - Category 4 |
Upstream transportation and distribution |
000´s tonnes of CO2e | - | - | - |
| Scope 3 - Category 5 | Waste generated in operations | 000´s tonnes of CO2e | 5 | 1 | 1 |
| Scope 3 - Category 6 | Business travel | 000´s tonnes of CO2e | 2 | 1 | 1 |
| Scope 3 - Category 7 | Employee commuting | 000´s tonnes of CO2e | 1 | - | - |
| Scope 3 - Category 8 | Upstream leased assets | 000´s tonnes of CO2e | 1 | 6 | 6 |
| Scope 3 - Category 9 |
Downstream transportation and distribution |
000´s tonnes of CO2e | 2 | Not relevant | Not relevant |
| Scope 3 - Category 10 | Processing of sold products | 000´s tonnes of CO2e | Not relevant | Not relevant | Not relevant |
| Scope 3 - Category 11 | Use of sold products | 000´s tonnes of CO2e | Not relevant | Not relevant | Not relevant |
| Scope 3 - Category 12 |
End of life treatment of sold products |
000´s tonnes of CO2e | - | Not relevant | Not relevant |
| Scope 3 - Category 13 | Downstream leased assets | 000´s tonnes of CO2e | Not relevant | Not relevant | Not relevant |
| Scope 3 - Category 14 | Franchises | 000´s tonnes of CO2e | Not relevant | Not relevant | Not relevant |
| Scope 3 - Category 15 | Investments | 000´s tonnes of CO2e | 100 | 99 | 93 |
| Total | 000´s tonnes of CO2e | 799 | 814 | 798 | |
|
ISO 14064-1 Category 3 GHG Protocol Category 3, 4, 6, 7 and 9 |
Indirect GHG Emissions from transportation |
000´s tonnes of CO2e |
532 | 636 | 636 |
|
ISO 14064-1 Category 4 GHG Protocol Category 1, 2, 5, 8 and 12 |
Indirect GHG Emissions from products used by the organisation | 000´s tonnes of CO2e | 167 | 79 | 69 |
|
ISO 14064-1 Category 5 GHG Protocol Category 15 |
Indirect GHG Emissions associated with the use of products from the organisation | 000´s tonnes of CO2e | 100 | 99 | 93 |
| Total | 000´s tonnes of CO2e | 799 | 814 | 798 | |
|
GHG Scope 1 Emissions by Gas: |
|||||
|
Fuel Consumption (Stationary) |
CO2 | Tonnes | 1,426,854 | 1,500,873 | 1,532,246 |
| CH4 | Tonnes | 26 | 27 | 27 | |
| N2O | Tonnes | 3 | 3 | 3 | |
| CO2e | Tonnes | 1,428,243 | 1,502,347 | 1,533,739 | |
| Fuel Consumption (Mobile) | CO2 | Tonnes | 2,851 | 2,351 | 1,692 |
| CH4 | Tonnes | - | 0.1 | 0.1 | |
| N2O | Tonnes | - | 0.2 | 0.1 | |
| CO2e | Tonnes | 2,928 | 2,407 | 1,725 | |
| Fugitive Emissions | CO2 | Tonnes | - | - | - |
| CH4 | Tonnes | 312 | 308 | 312 | |
| N2O | Tonnes | - | - | - | |
| CO2e | Tonnes | 8,724 | 8,637 | 8,742 | |
| Geothermal | CO2 | Tonnes | 335,114 | 330,779 | 250,530 |
| CH4 | Tonnes | - | - | - | |
| N2O | Tonnes | - | - | - | |
| CO2e | Tonnes | 335,114 | 330,779 | 250,530 | |
| Units | 2023 | 2022 | 2021 | ||
| GHG Emissions Scope 1 (Tonnes) CO2e) | CO2 | Tonnes | 1,764,819 | 1,834,003 | 1,784,467 |
| CH4 | Tonnes | 337 | 335 | 9,512 | |
| N2O | Tonnes | 3 | 3 | 758 | |
| CO2e | Tonnes | 1,775,010 | 1,844,170 | 1,794,737 | |
|
GHG Scope 2 Emissions by Gas Electricity Consumption |
CO2 | Tonnes | 249,733 | 249,228 | 236,711 |
| CH4 | Tonnes | - | - | - | |
| N2O | Tonnes | - | - | - | |
| CO2e | Tonnes | 249,733 | 249,228 | 236,711 | |
|
Volatile Organic Compounds (VOC), Hazardous Air Pollutants (HAP), Particulate Matter (PM) |
VOC | Tonnes | 192.0 | 192.0 | 192.0 |
| HAP | Tonnes | 52.0 | 50.3 | 50.4 | |
| PM | Tonnes | 3.8 | 4.1 | 3.4 | |
| NOx, SO2 and CO Emissions | Mexico NOx | Tonnes | 430.4 | 485.5 | 438.9 |
| Spain NOx | Tonnes | 15.0 | 15.1 | 15.4 | |
| Algeria NOx | Tonnes | 6.8 | 6.5 | 8.4 | |
| Canada NOx | Tonnes | 1.8 | 1.6 | 1.2 | |
| Total NOx | Tonnes | 454.0 | 508.7 | 464.0 | |
| Mexico SO2 | Tonnes | - | - | - | |
| Spain SO2 | Tonnes | 0.6 | 0.6 | 0.6 | |
| Algeria NOx | Tonnes | 0.3 | 0.3 | 0.4 | |
| Canada SO2 | Tonnes | - | - | - | |
| Total SO2 | Tonnes | 0.9 | 0.9 | 1.0 | |
| Mexico CO | Tonnes | 317.6 | 319.1 | 315.5 | |
| Spain CO | Tonnes | 5.8 | 5.9 | 6.0 | |
| Algeria NOx | Tonnes | 2.7 | 2.5 | 3.3 | |
| Canada CO | Tonnes | 7.5 | 9.5 | 7.3 | |
| Total CO | Tonnes | 333.6 | 337.0 | 332.0 | |
|
Energy Consumption and Generation |
Consumption of fuel | GWh | 7,073 | 7,436 | 7,591 |
| Consumption of purchased electricity for own use | GWh | 564 | 569 | 537 | |
| Consumption of self-generated renewable energy | GWh | 482 | 474 | 296 | |
| Total Energy Consumption | GWh | 8,118 | 8,479 | 8,424 | |
| Electricity generation | GWh | 7,106 | 6,874 | 6,444 | |
| Thermal energy generated | GWh | 4,516 | 4,616 | 4,092 | |
| Total Energy Generated | GWh | 11,622 | 11,490 | 10,536 | |
| Total energy consumption within the organisation | GWh | (3,504) | (3,012) | (2,112) | |
| Consumption of fuel | GJ | 25,461,919 | 26,768,797 | 27,327,284 | |
| Consumption of purchased electricity for own use | GJ | 2,029,259 | 2,047,646 | 1,934,588 | |
| Consumption of self-generated renewable energy | GJ | 1,733,979 | 1,706,458 | 1,065,636 | |
| Total Energy Consumption | GJ | 29,225,158 | 30,522,901 | 30,327,507 | |
| Electricity generation | GJ | 25,582,192 | 24,747,366 | 23,197,112 | |
| Thermal energy generated | GJ | 16,256,192 | 16,617,490 | 14,732,304 | |
| Total Net Energy Generated | GJ | 41,838,384 | 41,364,856 | 37,929,415 | |
| Total energy consumption within the organisation | GJ | (12,613,226) | (10,841,956) | (7,601,908) | |
| Energy Intensity Ratio | Energy Intensity Ratio | 0.3 | 0.3 | 0.2 | |
| Withdrawal by Water Source | Surface water | million m3 | 6.1 | 6.3 | 6.9 |
| Groundwater | million m3 | 5.5 | 5.8 | 5.5 | |
| Third-party water | million m3 | 5.4 | 5.6 | 4.9 | |
| Produced water | million m3 | - | - | - | |
| Total | million m3 | 17.0 | 17.7 | 17.3 | |
| Discharge by Water Source (power Generation Assets) | Surface water | million m3 | 1.8 | 1.9 | 2.1 |
| Groundwater | million m3 | 0.2 | 0.2 | 0.2 | |
| Third-party water | million m3 | - | - | - | |
| Produced water | million m3 | - | - | - | |
| Total | million m3 | 2.0 | 2.1 | 2.3 | |
| Surface water | million m3 | 4.3 | 4.4 | 4.7 |
| Units | 2023 | 2022 | 2021 | ||
| Consumption by Water Source (Power Generation Assets) | Groundwater | million m3 | 5.3 | 5.6 | 5.4 |
| Third-party water | million m3 | 5.4 | 5.6 | 4.9 | |
| Produced water | million m3 | - | - | - | |
| Total | million m3 | 15.0 | 15.6 | 15.0 | |
| Available Water Not Used | % | 46% | 44% | 43% | |
| Water Withdrawal, Discharge and Consumption per MWh | Withdrawal | m3 / MWh | 1.46 | 1.54 | 1.64 |
| Discharge | m3 / MWh | 0.17 | 0.18 | 0.22 | |
| Consumption | m3 / MWh | 1.29 | 1.36 | 1.42 | |
| Water Withdrawal, Desalinated | Water (seawater) withdrawal | million m3 | 234.8 | 240.4 | 244.5 |
| Production and Discharges | Desalinated potable water production | million m3 | 102.3 | 105.2 | 98.0 |
| Water discharges (returned to the sea) | million m3 | 132.5 | 135.2 | 146.5 | |
|
Tonnes of Hazardous and Non-Hazardous Waste |
Non-Hazardous Waste | Tonnes | 25,993 | 23,142 | 22,212 |
| Hazardous Waste | Tonnes | 1,402 | 1,908 | 2,576 | |
|
Hazardous Waste |
Reused or recycled | % | 40% | 62% | 70% |
| Disposed of | % | 60% | 38% | 30% | |
| Hazardous Waste Diverted from Disposal | Preparation for reuse | Tonnes | 111 | 101 | 47 |
| Recycling | Tonnes | 133 | 131 | 36 | |
| Other Recovery Operations | Tonnes | 314 | 935 | 718 | |
| Total | Tonnes | 558 | 1,189 | 1,803 | |
| Hazardous Waste Directed to Disposal | Incineration | Tonnes | 17 | 11 | 1 |
| Landfill | Tonnes | 234 | 251 | 349 | |
| Other Disposal Operations | Tonnes | 593 | 479 | 1,515 | |
| Total | Tonnes | 843 | 719 | 7733 | |
| Breakdown of Hazardous Waste by Composition | Waste linked to solar assets | Tonnes | 1,185 | 1,647 | 2,156 |
| Other waste | Tonnes | 217 | 261 | 508 | |
| Total | Tonnes | 1,402 | 1,908 | 2,664 | |
| Non-Hazardous Waste | Reused or recycled | % | 61% | 64% | 72% |
| Disposed of in Landfills | % | 39% | 36% | 28% | |
| Non-hazardous Waste Diverted from Disposal | Preparation for reuse | Tonnes | 431 | 2,678 | 2,769 |
| Recycling | Tonnes | 1,906 | 1,475 | 2,266 | |
| Other Recovery Operations | Tonnes | 13,521 | 10,721 | 11,005 | |
| Total | Tonnes | 15,858 | 14,811 | 15,993 | |
| Non-hazardous Waste Directed to Disposal | Incineration | Tonnes | - | - | - |
| Landfill | Tonnes | 9,951 | 7,837 | 6,124 | |
| Other Disposal Operations | Tonnes | 184 | 431 | 74 | |
| Total | Tonnes | 10,135 | 8,331 | 6,219 | |
| Breakdown of Non-hazardous Waste by Composition | Waste linked to solar assets | Tonnes | 24,816 | 22,306 | 20,469 |
| Other waste | Tonnes | 1,177 | 836 | 1,768 | |
| Total | Tonnes | 25,993 | 23,142 | 22,237 | |
|
Number of accidents by category, severity |
Moderate | # | 7 | 8 | 9 |
| High | # | 0 | 0 | 1 | |
| Number of Spills | Litres | 2,829 | 4,146 | 2,829 | |
| Fines and Penalties | USD ‘000S | 6 | 1 | 7 | |
|
Supply Chain Management |
|||||
| Suppliers Assessments | Internal pre-screening evaluation of new suppliers | % | 100 | 100 | 100 |
| External supplier evaluation as a percentage of total annual operating expenses | % | ~60 | ~45 | ~51 | |
|
People And Culture |
|||||
|
Number of Employees per Geography |
North America | # | 331 | 312 | 308 |
| South America | # | 97 | 93 | 68 | |
| EMEA | # | 796 | 446 | 67 | |
| Corporate | # | 142 | 127 | 115 | |
| Total | # | 1,366 | 978 | 558 | |
| Units | 2023 | 2022 | 2021 | ||
|
Full-Time |
Male | 1,130 | 785 | 417 | |
|
Employees by Employment Type and by Contract Type2 |
Female | 236 | 193 | 141 | |
| Total | 1,366 | 978 | 558 | ||
|
Part-time |
Male | - | - | - | |
| Female | - | - | - | ||
| Total | - | - | - | ||
|
Indefinite |
Male | 1,066 | 743 | 399 | |
| Female | 215 | 182 | 132 | ||
| Total | 1,281 | 925 | 531 | ||
|
Temporary |
Male | 64 | 42 | 18 | |
| Female | 21 | 11 | 9 | ||
| Total | 85 | 53 | 27 | ||
|
Indefinite |
North America | 331 | 311 | 308 | |
| South America | 48 | 60 | 51 | ||
| EMEA | 761 | 429 | 63 | ||
| Corporate | 141 | 125 | 109 | ||
| Total | 1,281 | 925 | 531 | ||
| Temporary | North America | - | 1 | - | |
| South America | 49 | 33 | 17 | ||
| EMEA | 35 | 14 | 4 | ||
| Corporate | 1 | 5 | 6 | ||
| Total | 85 | 53 | 27 | ||
| Number of Employees by Level | Management | # | 12 | 13 | 13 |
| Middle Management | # | 121 | 133 | 88 | |
| Engineers and Graduates | # | 298 | 264 | 178 | |
| Assistants and professionals | # | 74 | 49 | 34 | |
| Asset Operations Employees | # | 861 | 519 | 245 | |
| Total | # | 1,366 | 978 | 558 | |
|
Number of Employees by Age |
Less than 30 | Male | 145 | 117 | 64 |
| Female | 48 | 35 | 26 | ||
|
31-40 |
Male | 408 | 321 | 158 | |
| Female | 87 | 82 | 59 | ||
|
41-50 |
Male | 369 | 217 | 111 | |
| Female | 82 | 60 | 43 | ||
|
Over 51 |
Male | 208 | 130 | 84 | |
| Female | 19 | 16 | 13 | ||
| Total | # | 1,366 | 978 | 558 | |
| % in total workforce |
Asian |
% |
2% |
4% |
N/A |
| Black or African American | % | 4% | 4% | N/A | |
|
Hispanic or Latino |
% | 17% | 21% | N/A | |
| White | % | 73% | 66% | N/A | |
|
Indigenous or Native |
% | 0% | 1% | N/A | |
|
Other |
% | 2% | 4% | N/A | |
|
Total |
% | 100% |
100% |
N/A | |
| % in total management positions |
Asian |
% | 3% | 4% | N/A |
|
Black or African American |
% |
2% | 1% | N/A | |
|
Hispanic or Latino |
% | 14% | 12% | N/A | |
| White | % | 74% | 73% | N/A | |
|
Indigenous or Native |
% | 1% | 1% | N/A | |
|
Other |
% | 7% | 9% | N/A | |
| Total | % | 100% | 100% | N/A | |
|
Average number of employees by geography |
North America | # | 320 | 306 | 296 |
| South America | # | 91 | 87 | 61 | |
| EMEA | # | 752 | 360 | 61 | |
| Corporate | # | 141 | 121 | 109 | |
| Total | # | 1,304 | 874 | 527 | |
|
Average number of employees by category |
Management | # | 12 | 13 | 13 |
| Middle Management | # | 125 | 132 | 85 |
2 Corporate employees included in EMEA in 2020.
| Units | 2023 | 2022 | 2021 | ||
| Engineers and Graduates | # | 287 | 234 | 162 | |
| Assistants and professionals | # | 65 | 46 | 27 | |
| Asset Operations Employees | # | 815 | 449 | 240 | |
| Total | # | 1,304 | 874 | 527 | |
| Average Number of employees by gender | Average number of employees by gender | Male | 1081 | 696 | 396 |
| Female | 223 | 178 | 131 | ||
| Total | # | 1,304 | 874 | 527 | |
| Women at Atlantica | % | 17% | 20% | 25% | |
|
Promoted employees by gender |
Male | 62 | 27 | 44 | |
| Female | 14 | 7 | 6 | ||
| Total | # | 76 | 34 | 50 | |
|
Parental leave |
Male | 57 | 28 | 19 | |
| Female | 8 | 8 | 11 | ||
| Total | # | 65 | 36 | 30 | |
|
Share of women by geography |
North America | % | 16% | 13% | 14% |
| South America | % | 22% | 25% | 31% | |
| EMEA | % | 13% | 17% | 40% | |
| Corporate | % | 43% | 41% | 44% | |
|
Share of women by level |
Asset operation employees | % | 6% | 6% | 5% |
| Assistants and professionals | % | 69% | 71% | 76% | |
| Engineers and graduates | % | 38% | 37% | 43% | |
| Middle management | % | 17% | 18% | 26% | |
| Management | % | 17% | 23% | 23% | |
|
Share of women in all management positions, including junior, middle and top management |
As % of total management positions | % | 17% | 23% | 23% |
|
Share of women in junior and middle management positions |
As % of total junior and middle management positions | % | 17% | 18% | 26% |
| Share of women in management positions in revenue-generating functions | % | 15% | 17% | 29% | |
| Share of women in STEM-related positions | % | 8% | 8% | 24% | |
| Share of entry level positions held by women | % | 48% | 44% | 58% | |
| Share of information technology workforce held by women | % | 6% | 7% | 8% | |
| Share of engineering workforce held by women | % | 8% | 8% | 26% | |
| Estimated people with disability considering available information | % | 0.6% | 0.3% | 0.4% | |
| Employee Turnover Rate | Employee voluntary turnover rate | % | 7.6% | 12.8% | 11.0% |
| Employee turnover rate without U.S. | % | 6.8% | 9.7% | 5.9% | |
| Employee involuntary turnover rate | % | 3.5% | 3.8% | 5.6% | |
| Employee total turnover rate | % | 10.7% | 16.8% | 15.9% | |
|
Employee Turnover |
<30 |
Male | 34 | 19 | 13 |
| Female | 4 | 9 | 2 | ||
|
31-40 |
Male | 67 | 40 | 25 | |
| Female | 8 | 13 | 7 | ||
|
41-50 |
Male | 52 | 37 | 13 | |
| Female | 9 | 2 | 6 | ||
|
>51 |
Male | 24 | 23 | 18 | |
| Female | 4 | 2 | 5 | ||
|
Total |
Male | 177 | 119 | 69 | |
| Female | 25 | 26 | 20 | ||
|
North America |
Male | 41 | 62 | 54 | |
| Female | 4 | 8 | 13 | ||
|
South America |
Male | 11 | 10 | 6 |
| Units | 2023 | 2022 | 2021 | ||
| Female | 2 | 7 | 2 | ||
|
EMEA |
Male | 115 | 42 | 2 | |
| Female | 16 | 5 | - | ||
|
Corporate |
Male | 10 | 5 | 7 | |
| Female | 3 | 6 | 5 | ||
|
Total |
Male | 177 | 119 | 69 | |
| Female | 25 | 26 | 20 | ||
| % Turnover rate |
Asset operation employees |
% | 71% | 68% | N/A |
| Assistant and professionals | % | 1% | 6% | N/A | |
| Engineers and graduates | % | 17% | 18% | N/A | |
| Middle management | % | 9% | 9% | N/A | |
| Management | % | 1% | 0% | N/A | |
| Total | % | 100% | 100% | N/A | |
| Asian | % | 5% | 0% | N/A | |
| Black or African American | % | 4% | 1% | N/A | |
| Hispanic or Latino | % | 0% | 19% | N/A | |
| White | % | 62% | 27% | N/A | |
| Indigenous or Native | % | 1% | 1% | N/A | |
| Other | % | 27% | 53% | N/A | |
| Total | % | 100% | 100% | N/A | |
|
Employees hired |
<30 |
Male | 75 | 57 | 21 |
| Female | 24 | 19 | 9 | ||
|
31-40 |
Male | 78 | 63 | 36 | |
| Female | 14 | 14 | 12 | ||
|
41-50 |
Male | 51 | 34 | 14 | |
| Female | 12 | 5 | 6 | ||
|
>51 |
Male | 18 | 12 | 7 | |
| Female | 2 | - | 1 | ||
|
Total |
Male | 222 | 166 | 78 | |
| Female | 52 | 38 | 28 | ||
|
North America |
Male | 47 | 64 | 44 | |
| Female | 14 | 8 | 9 | ||
|
South America |
Male | 30 | 33 | 15 | |
| Female | 9 | 11 | 4 | ||
|
EMEA |
Male | 137 | 52 | 10 | |
| Female | 21 | 11 | 4 | ||
|
Corporate |
Male | 8 | 17 | 9 | |
| Female | 8 | 8 | 11 | ||
|
Total |
Male | 222 | 166 | 78 | |
| Female | 52 | 38 | 28 | ||
| % of employees hired | Asset operation employees | # | 183 | 117 | N/A |
| Assistant and professionals | # | 19 | 11 | N/A | |
| Engineers and graduates | # | 61 | 69 | N/A | |
| Middle management | # | 11 | 7 | N/A | |
| Total | 274 | 204 | N/A | ||
| Asian | % | 1% | 3% | N/A | |
| Black or African American | % | 10% | 3% | N/A | |
| Hispanic or Latino | % | 35% | 29% | N/A | |
| White | % | 35% | 46% | N/A | |
| Indigenous or Latino | % | 0% | 1% | N/A | |
| Other | % | 0% | 19% | N/A | |
| Total | % | 100% | 100% | N/A | |
| Percentage of open positions filled by internal candidates | % | 25% | 28% | 25% | |
| Total Training hours | Management | Hours | 168 | 321 | 170 |
| Middle Management | Hours | 5,163 | 3,724 | 2,689 | |
| Engineers and Graduates | Hours | 13,701 | 10,740 | 9,281 | |
| Assistants and Professionals | Hours | 2,049 | 1,189 | 413 | |
| Asset Operations Employees | Hours | 21,883 | 11,548 | 6,846 | |
| Total | Hours | 42,964 | 27,521 | 19,399 | |
| Total Average Hours of Training per Employee | Management | Hours | 13 | 27 | 13 |
| Middle Management | Hours |
42 |
31 | 32 | |
| Engineers and Graduates | Hours | 48 | 40 | 57 | |
| Assistants and Professionals | Hours | 31 | 26 | 15 | |
| Units | 2023 | 2022 | 2021 | ||
| Asset Operations Employees | Hours | 27 | 23 | 29 | |
| Total | Hours | 33 | 29 | 37 | |
| Average amount spent per employee on training and development | In thousands of USD | 0.6 | 0.4 | 0.9 | |
| % Hours of training | >30 | % | 18% | 14% | N/A |
| 31-40 | % | 71% | 76% | N/A | |
| >51 | % | 11% | 10% | N/A | |
| Total | % | 100% | 100% | N/A | |
| Asian | % | 3% | 3% | N/A | |
| Black or African American | % | 3% | 2% | N/A | |
| Hispanic or Latino | % | 26% | 25% | N/A | |
| White | % | 66% | 68% | N/A | |
| Indigenous or Native | % | 0% | 0% | N/A | |
| Other | % | 2% | 2% | N/A | |
| Total | % | 100% | 100% | N/A | |
| Male | % | 81% | 77% | N/A | |
| Female | % | 19% | 23% | N/A | |
| Total | % | 100% | 100% | N/A | |
| Gender Pay Gap | Management | % | 2% | 18% | 18% |
| Middle Management | % | 6% | 16% | 29% | |
| Senior Engineers and Graduates | % | 6% | 7% | 15% | |
| Engineers and Graduates | % | 0% | 10% | 8% | |
| Assistants and Professionals | % | (9%) | (14%) | (8%) | |
| Asset Operation Employees | % | 24% | 29% | 10% | |
| Total | % | 5% | 13% | 26% | |
| Type of Philanthropic Activities | Charitable donations | % of total cost | 11% | 3% | 2% |
| Community Investments | % of total cost | 89% | 97% | 98% | |
| Commercial Initiatives | % of total cost | - | - | - | |
| Total | % | 100% | 100% | 100% | |
| Philanthropic Contributions | Cash contributions | In millions of USD | 0.6 | 1.1 | 1.0 |
| Time: employee volunteering during paid working hours | In millions of USD | - | - | - | |
| In-kind giving: product or services donations, projects/partnerships or similar | In millions of USD | 0.9 | 0.4 | 0.3 | |
| Total | In millions of USD | 1.5 | 1.5 | 1.3 | |
|
Health and Safety |
|||||
|
Total Lost Time Frequency Index (LTFI) |
Employees | per million of hours worked | 1.7 | 1.0 | 1.9 |
| Units | 2023 | 2022 | 2021 | ||
| Subcontractors | per million of hours worked | 2.2 | 4.7 | 2.6 | |
| Total | per million of hours worked | 1.9 | 3.1 | 2.4 | |
|
Lost Time Frequency Index (LTFI) from our Assets in Operation |
Employees | per million of hours worked | 1.8 | 0.5 | 1.9 |
| Subcontractors | per million of hours worked | 1.5 | 2.4 | 2.6 | |
| Total | per million of hours worked | 1.7 | 1.5 | 2.4 | |
|
Lost Time Frequency Index (LTFI) from our Assets under Construction |
Employees | per million of hours worked | 0.0 | 8.0 | 0.0 |
| Subcontractors | per million of hours worked | 5.2 | 14.5 | 0.0 | |
| Total | per million of hours worked | 3.9 | 13.1 | 0.0 | |
| Total Lost Time Injury Rate (LTIR) | Employees | per 200k hours worked | 0.3 | 0.2 | 0.4 |
| Subcontractors | per 200k hours worked | 0.4 | 0.9 | 0.5 | |
| Total | per 200k hours worked | 0.4 | 0.6 | 0.5 | |
| Lost Time Injury Rate (LTIR) from our Assets in Operation | Employees | per 200k hours worked | 0.4 | 0.1 | 0.4 |
| Subcontractors | per 200k hours worked | 0.3 | 0.5 | 0.5 | |
| Total | per 200k hours worked | 0.3 | 0.3 | 0.5 | |
| Lost Time Injury Rate (LTIR) from our Assets under Construction | Employees | per 200k hours worked | 0.0 | 1.6 | 0.0 |
| Subcontractors | per 200k hours worked | 1.0 | 2.9 | 0.0 | |
| Total | per 200k hours worked | 0.8 | 2.6 | 0.0 | |
|
Lost Time Frequency Index (LTIR) sector average vs. Atlantica |
Sector Average | per million of hours worked | 6.7 | 4.3 | 3.3 |
| Atlantica | per million of hours worked | 1.9 | 3.1 | 2.4 | |
| Total Recordable Frequency Index (TRFI) | Employees | per million of hours worked | 5.0 | 3.0 | 5.6 |
| Subcontractors | per million of hours worked | 3.4 | 7.0 | 6.7 | |
| Total | per million of hours worked | 4.3 | 5.2 | 6.4 |
| Units | 2023 | 2022 | 2021 | ||
| Total Recordable Frequency Index (TRFI) from our assets in operation | Employees | per million of hours worked | 5.3 | 2.7 | 5.6 |
| Subcontractors | per million of hours worked | 3.1 | 5.3 | 6.7 | |
| Total | per million of hours worked | 4.3 | 4.0 | 6.4 | |
| Total Recordable Frequency Index (TRFI) from our assets under construction | Employees | per million of hours worked | 0.0 | 8.0 | 0.0 |
| Subcontractors | per million of hours worked | 5.2 | 14.5 | 0.0 | |
| Total | per million of hours worked | 3.9 | 13.1 | 0.0 | |
| Total Recordable Incident Rate (TRIR) | Employees | per 200k hours worked | 1.0 | 0.6 | 1.1 |
| Subcontractors | per 200k hours worked | 0.7 | 1.4 | 1.3 | |
| Total | per 200k hours worked | 0.9 | 1.0 | 1.3 | |
| Total Recordable Incident Rate (TRIR) from our assets in operation | Employees | per 200k hours worked | 1.0 | 0.5 | 1.1 |
| Subcontractors | per 200k hours worked | 0.6 | 1.1 | 1.3 | |
| Total | per 200k hours worked | 0.9 | 0.8 | 1.3 | |
| Total Recordable Incident Rate (TRIR) from our assets under construction | Employees | per 200k hours worked | 0.0 | 1.6 | 0.0 |
| Subcontractors | per 200k hours worked | 1.0 | 2.9 | 0.0 | |
| Total | per 200k hours worked | 0.8 | 2.6 | 0.0 | |
|
Total Recordable Frequency Index (TRFI) sector average vs. Atlantica |
Sector Average | per million of hours worked | 10.9 | 10.7 | 7.5 |
| Atlantica | per million of hours worked | 4.3 | 5.2 | 6.4 | |
| Total Recordable Deviations Index (TRDI) | per million of hours worked | 1,714.0 | 1,245.7 | 1,623.3 | |
| Lost-day rate (LDR) | Employees | per 200k hours worked | 9.2 | 14.1 | 4.1 |
| Subcontractors | per 200k hours worked | 6.6 | 25.7 | 21.0 | |
| Total | per 200k hours worked | 7.9 | 20.6 | 16.2 | |
|
Lost-day rate (LDR) From our assets in operations |
Employees | per 200k hours worked | 9.7 | 14.6 | 4.1 |
| Subcontractors | per 200k hours worked | 7.3 | 23.7 | 21.0 |
| Units | 2023 | 2022 | 2021 | ||
| Total | per 200k hours worked | 8.6 | 19.4 | 16.2 | |
|
Lost-day rate (LDR) From our assets under construction |
Employees | per 200k hours worked | 0.0 | 8.0 | 0.0 |
| Subcontractors | per 200k hours worked | 3.1 | 34.3 | 0.0 | |
| Total | per 200k hours worked | 2.4 | 28.9 | 0.0 | |
|
Fatality Rate |
Employees | # | 0 | 0 | 0 |
| Subcontractors | # | 0 | 0 | 0 | |
| Total | # | 0 | 0 | 0 | |
| Serious Accidents | Employees | # | 0 | 0 | 0 |
| Subcontractors | # | 0 | 0 | 0 | |
| Total | # | 0 | 0 | 0 | |
| Governance | Only one class of shares. No Special rights | ✓ | ✓ | ✓ | |
| % of independent directors | % | 66 | 66 | 63 | |
| Board committees only comprised of independent members | ✓ | ✓ | ✓ | ||
| Ethnic minorities at Board level | % | 22 | 25 | 25 | |
| Women at Board level | % | 22 | 22 | 25 | |
| Board committees chaired by women | % | 50 | 50 | 50 | |
| ESG Reporting | Global Reporting Initiative (GRI) | ✓ | ✓ | ✓ | ✓ |
| Sustainability Accounting Standards Board (SASB) (utilities + solar) | ✓ | ✓ | ✓ | ✓ | |
| Task Force on Climate Change Financial Disclosure (TCFD) | ✓ | ✓ | ✓ | ✓ | |
Forward-Looking Statements
This annual report includes forward-looking statements within the meaning of the Private Securities Litigation Reform Act of 1995. Any statements that express, or involve discussions as to, expectations, beliefs, plans, objectives, assumptions, strategies, future events or performance (often, but not always, through the use of words or phrases such as may result, are expected to, will continue, is anticipated, likely to, believe, will, could, should, would, estimated, may, plan, potential, future, projection, goals, target, outlook, predict, aim and intend or words of similar meaning) are not statements of historical facts and may be forward looking. Such statements occur throughout this annual report and include statements with respect to our strategy, including the development and construction of new assets, expected trends and outlook, electricity prices, potential market and currency fluctuations, occurrence and effects of certain trigger and conversion events, our capital requirements, changes in market price of our shares, future regulatory requirements, the ability to identify and/or make future investments and acquisitions on favorable terms, ability to capture growth opportunities, organic growth, reputational risks, divergence of interests between our company and that of our largest shareholder, tax and insurance implications, and more. Forward-looking statements involve estimates, assumptions and uncertainties. Accordingly, any such statements are qualified in their entirety by reference to, and are accompanied by, important factors included in Part I, of Item 3.D. Risk Factors in our Annual Report on form 20-F filed with the SEC on March 1, 2024 (in addition to any assumptions and other factors referred to specifically in connection with such forward-looking statements) that could have a significant impact on our operations and financial results, and could cause our actual results, performance or achievements, to differ materially from the future results, performance or achievements expressed or implied in forward-looking statements made by us or on our behalf in this annual report, in presentations, on our website, in response to questions or otherwise. These forward-looking statements include, but are not limited to, statements relating to:
| ● | the condition of, and changes in, the debt and equity capital markets and other traditional liquidity sources and our ability to borrow additional funds, refinance existing debt and access capital markets, as well as our substantial indebtedness and the possibility that we may incur additional indebtedness going forward; |
| ● | our plans relating to our financings, including refinancing plans; |
| ● | the ability of our assets to serve our project debt and comply with financial or other covenants on their terms, including but not limited to our projects debts in Chile, and our ability to serve our corporate debt; |
| ● | the ability of our counterparties, including Pemex, to satisfy their financial commitments or business obligations and our ability to seek new counterparties in a competitive market; |
| ● | government regulation, including compliance with regulatory and permit requirements and changes in market rules, rates, tariffs, environmental laws and policies affecting renewable energy, including the IRA and recent changes in regulation defining the remuneration of our solar assets in Spain; |
| ● | changes in tax laws and regulations, including the new legislation on restrictions to tax deductibility in Spain; |
| ● | risks relating to our activities in areas subject to economic, social and political uncertainties; |
| ● | global recession risks, volatility in the financial markets, an inflationary environment, increases in interest rates and supply chain issues, and the related increases in prices of materials, labor, services and other costs and expenses required to operate our business; |
| ● | risks related to our ability to capture growth opportunities, develop, build and complete projects in time and within budget, including construction risks and risks associated with the arrangements with our joint venture partners; |
| ● | our ability to grow organically and inorganically, which depends on our ability to identify attractive development opportunities, attractive potential acquisitions, finance such opportunities and make new investments and acquisitions on favorable terms; |
| ● | our ability to distribute a significant percentage of our cash for distribution as cash dividends, intention to increase such dividends over time; |
| ● | risks relating to new assets and businesses which have a higher risk profile and our ability to transition these successfully; |
| ● | potential environmental liabilities and the cost and conditions of compliance with applicable environmental laws and regulations; |
| ● | risks related to our reliance on suppliers, including financial or technical uncertainties of original equipment manufacturer (OEM) suppliers, among others; |
| ● | risks related to disagreements and disputes with our employees, unions and employees represented by unions; |
| ● | risks related to our ability to maintain appropriate insurance over our assets; |
| ● | risks related to our facilities not performing as expected, unplanned outages, higher than expected operating costs and/ or capital expenditures, including as a result of interruptions or disruptions caused by supply chain issues and trade restrictions; |
| ● | risks related to our exposure in the labor market; |
| ● | risks related to extreme and chronic weather events related to climate change could damage our assets or result in significant liabilities and cause an increase in our operation and maintenance costs; |
| ● | the effects of litigation and other legal proceedings (including bankruptcy) against us our subsidiaries, our assets and our employees; |
| ● | price fluctuations, revocation and termination provisions in our off-take agreements and PPAs; |
| ● | risks related to information technology systems and cyber-attacks could significantly impact our operations and business; |
| ● | our electricity generation, our projections thereof and factors affecting production; |
| ● | risks related to our current or previous relationship with Abengoa, our former largest shareholder, including litigation risk; |
| ● | performing the O&M services directly and the successful integration of the O&M employees where the services thereunder have been recently replaced and internalized; |
| ● | our guidance targets or expectations with respect to Adjusted EBITDA derived from low-carbon footprint assets; |
| ● | risks related to our relationship with our shareholders, including Algonquin, our major shareholder; |
| ● | the process to explore and evaluate potential strategic alternatives, including the risk that this process may not lead to the approval or completion of any transaction or other strategic change; |
| ● | potential impact of potential pandemics on our business and our off-takers’ financial condition, results of operations and cash flows; |
| ● | reputational and financial damage caused by our off-takers PG&E, Pemex and Eskom; |
| ● | our plans relating to the sale or disposition of assets, including the sale of our equity interest in Monterrey; |
| ● | risks related to Russian military actions in Ukraine, to military actions in the Middle East, or to the potential escalation of any of the foregoing global geopolitical tensions; and |
| ● | other factors discussed in “Risk Factors”. |
Any forward-looking statement speaks only as of the date on which such statement is made, and we undertake no obligation to update any forward-looking statement to reflect events or circumstances, including, but not limited to, unanticipated events, after the date on which such statement is made, unless otherwise required by law. New factors emerge from time to time and it is not possible for management to predict all of these factors, nor can it assess the impact of each of these factors on the business or the extent to which any factor, or combination of factors, may cause actual results to differ materially from those contained or implied in any forward-looking statement.
Independent Auditor’s Report
INDEPENDENT AUDITOR’S REPORT TO THE MEMBERS OF ATLANTICA SUSTAINABLE INFRASTRUCTURE PLC
Opinion
In our opinion:
| ● | Atlantica Sustainable Infrastructure plc’s Group financial statements and Parent company financial statements (the “financial statements”) give a true and fair view of the state of the Group’s and of the Parent company’s affairs as at 31 December 2023 and of the Group’s profit for the year then ended; |
| ● | the Group financial statements have been properly prepared in accordance with UK adopted international accounting standards; |
| ● | the Parent company financial statements have been properly prepared in accordance with United Kingdom Generally Accepted Accounting Practice; and |
| ● | the financial statements have been prepared in accordance with the requirements of the Companies Act 2006. |
We have audited the financial statements of Atlantica Sustainable Infrastructure plc (the ‘Parent company’) and its subsidiaries (the ‘Group’) for the year ended 31 December 2023 which comprise:
| Group | Parent company |
| Consolidated statements of financial position balance sheet as of 31 December 2023 | Company Balance sheet as of 31 December 2023 |
| Consolidated Statement of profit or loss for the year then ended | Company Statement of Changes in Equity for the year then ended |
| Consolidated Statement of Other Comprehensive Income for the year then ended | |
| Consolidated Statement of Changes in Equity for the year then ended | |
| Consolidated Cash Flows Statement for the year then ended | |
| Related notes 1 to 28 to the financial statements, including material accounting policy information. | Related notes 1 to 10 to the financial statements including material accounting policy information. |
The financial reporting framework that has been applied in the preparation of the Group financial statements is applicable law and UK adopted international accounting standards. The financial reporting framework that has been applied in the preparation of the Parent company financial statements is applicable law and United Kingdom Accounting Standards, including FRS 101 “Reduced Disclosure Framework” (United Kingdom Generally Accepted Accounting Practice).
Basis for opinion
We conducted our audit in accordance with International Standards on Auditing (UK) (ISAs (UK)) and applicable law. Our responsibilities under those standards are further described in the Auditor’s responsibilities for the audit of the financial statements section of our report. We are independent of the group and parent company in accordance with the ethical requirements that are relevant to our audit of the financial statements in the UK, including the FRC’s Ethical Standard as applied to listed entities, and we have fulfilled our other ethical responsibilities in accordance with these requirements.
We believe that the audit evidence we have obtained is sufficient and appropriate to provide a basis for our opinion.
Conclusions relating to going concern
In auditing the financial statements, we have concluded that the managements’ use of the going concern basis of accounting in the preparation of the financial statements is appropriate. Our evaluation of the managements’ assessment of the group and parent company’s ability to continue to adopt the going concern basis of accounting included:
| ● | We performed a walkthrough of the Group’s financial close process to confirm our understanding of management’s going concern assessment process. From this walkthrough, we obtained an understanding of management’s financing structure that splits the group into corporate level financing and project level financing. The finance secured by the projects is non-recourse to the Group. |
| ○ | The corporate level forecast incorporates the cash flows from the Parent and all holding and investment entities within the Group, as well as cash forecast to be received from the operating subsidiaries. |
| ○ | At the project level cash available for distribution is forecast after the servicing of project level debt and the maintenance of restricted cash required under these facilities. |
| ● | We performed an independent risk assessment on going concern to identify potential risks to the liquidity of the Group in order to determine whether management’s process had identified all the appropriate risks. |
| ● | We obtained management’s going concern assessment, which includes the forecast of corporate level cashflows, including the servicing of corporate level debt, and forecast cash available for distribution from the projects over the going concern period which covers the 13 month period to 31 March 2025. |
| ● | We assessed the adequacy of the going concern assessment period to 31 March 2025, considering whether any events or conditions foreseeable after the period indicated a longer review period would be appropriate. |
| ● | We confirmed the appropriateness of the method used in management’s forecasts supporting the going concern assessment and checked its clerical accuracy. |
| ● | We have reviewed the procedures performed by the component teams over the forecasts at a project level. |
| ● | We have performed the following procedures over the corporate level forecast: |
| ○ | We agreed the debt maturity profiles for corporate debt, including the upcoming repayment profiles, to the terms of signed agreements and we also obtained confirmation from debtholders on the amounts due. |
| ○ | We recalculated the forecasted covenant ratios of the corporate debt in the going concern period to ensure that covenant testing had been performed correctly in accordance with the relevant agreements with debtholders. |
| ○ | We assessed the corporate cash flow forecast and considered the appropriateness of the key assumptions used to calculate it, including the forecast distributions from the Group’s projects, as above. |
| ● | We assessed the Board’s conclusion that the Company’s downside scenario was highly unlikely. We considered this in the context of the predictability and stability of project level cash flow generation, the amount of restricted cash held by the projects to satisfy the customary requirements under related debt, and the ringfenced nature of the project level debt facilities. |
| ● | We performed reverse stress testing to determine the minimum level of EBITDA required to allow the level of cash distribution required to meet the corporate debt covenants, whilst fulfilling the Group’s financial commitments during the going concern period. We assessed whether the probability of the Group being unable to achieve such minimum level of EBITDA was remote considering the nature of the Group’s cash flow generation, historical performance and diversification of the Group’s assets. |
| ● | We considered the nature and extent of mitigating actions within the Board’s control that could be implemented to prevent or mitigate any cash shortfall during the going concern period. |
| ● | We read the Group’s going concern disclosures included in the annual report to assess whether the disclosures were appropriate and in conformity with the reporting standards. |
Based on the work we have performed, we have not identified any material uncertainties relating to events or conditions that, individually or collectively, may cast significant doubt on the Group and parent company’s ability to continue as a going concern for a period of 13 months from when the financial statements are authorised for issue. In forming our conclusion, we noted the significant nature of the Group’s cashflows as being substantially stable and regulated, the diversification by geography and business sector of the Group’s projects and the non-recourse nature of project level financing.
Our responsibilities and the responsibilities of the directors with respect to going concern are described in the relevant sections of this report. However, because not all future events or conditions can be predicted, this statement is not a guarantee as to the group’s ability to continue as a going concern.
Overview of our audit approach
| Audit scope |
● We performed an audit of the complete financial information of 22 components and audit procedures on specific balances for a further 17 components (8 specific scope components and 9 components to perform specified procedures).
● The components where we performed full or specific audit procedures accounted for 89% of the Group’s Earnings before interest, taxes, depreciation and amortisation (EBITDA), 85% of the Group’s Revenue and 83% of the Group’s Total assets |
| Key audit matters |
● Recoverability assessment of contracted concessional, property, plant and equipment (“PP&E”) and other intangible assets. |
| Materiality |
● Group materiality of $21 million which represents 2.75% of the Group’s EBITDA. |
An overview of the scope of the parent and group audits
Tailoring the scope
Our assessment of audit risk, our evaluation of materiality and our allocation of performance materiality determine our audit scope for each company within the Group. Taken together, this enables us to form an opinion on the consolidated financial statements. We take into account size, risk profile, the organisation of the group and effectiveness of group-wide controls, the potential impact of climate change and changes in the business environment and other factors such as recent Internal audit results when assessing the level of work to be performed.
In assessing the risk of material misstatement to the Group financial statements, and to ensure we had adequate quantitative coverage of significant accounts in the financial statements, of the 119 reporting components of the Group, we selected 30 components covering entities within Spain, Mexico, USA, Peru, South Africa, Chile, Colombia, UK, and Luxembourg, which represent the principal business units within the Group.
Of the 39 components selected, we performed an audit of the complete financial information of 22 component (“full scope components”) which were selected based on their size or risk characteristics. For the remaining 8 components (“specific scope components”), we performed audit procedures on specific accounts within that component that we considered had the potential for the greatest impact on the significant accounts in the financial statements either because of the size of these accounts or their risk profile.
The reporting components where we performed audit procedures accounted for 89% (2022: 89%) of the Group’s EBITDA, 85% (2022: 85%) of the Group’s Revenue and 87% (2022: 84%) of the Group’s Total assets. For the current year, the full scope components contributed 97% (2022: 97%) of the Group’s EBITDA, 84% (2022: 85%) of the Group’s Revenue and 81% (2022: 82%) of the Group’s Total assets. The specific scope components contributed to -8% (2022: -8%) of the Group’s EBITDA, 1% (2022: 0%) of the Group’s Revenue and 2% (2022: 2%) of the Group’s Total assets. The audit scope of these components may not have included testing of all significant accounts of the component but will have contributed to the coverage of significant accounts tested for the Group. We also instructed 9 other components to perform specified procedures designed by the Group audit team in response to specific risk factors and in order to ensure that, at the overall Group level, we reduced and appropriately covered the residual risk of error.
Of the remaining 80 components that together represent 11% of the Group’s EBITDA, none are individually greater than 2.75% of the Group’s EBITDA. For these components, we performed other procedures, including analytical review, testing of cash balances, testing of consolidation journals and intercompany eliminations and foreign currency translation recalculations to respond to any potential risks of material misstatement to the Group financial statements.
The charts below illustrate the coverage obtained from the work performed by our audit teams.

Changes from the prior year
In the current year audit, no changes in the full scope components, added 2 specific scopes, and removed 1 component and added 3 components for the specified scope procedures.
Involvement with component teams
In establishing our overall approach to the Group audit, we determined the type of work that needed to be undertaken at each of the components by us, EY Ireland, as the primary audit engagement team, or by component auditor from other EY global network firms operating under our instruction. For all components we determined the appropriate level of involvement to enable us to determine that sufficient audit evidence had been obtained as a basis for our opinion on the group as a whole.
The Group audit team continued to follow a programme of planned visits that has been designed to ensure that the Senior Statutory Auditor visits key locations. During the current year’s audit cycle, physical visits were undertaken by the primary audit team to the component team in Spain. These visits involved discussing the audit approach with the component team and any issues arising from their work, meeting with local and group management, visiting key assets, attending planning and closing meetings and reviewing relevant audit working papers on risk areas. The primary team interacted regularly with the component teams where appropriate during various stages of the audit, reviewed relevant working papers and were responsible for the scope and direction of the audit process. Additionally, the primary team attended component closing meetings for the US, Mexico, South Africa and Peru. This, together with the additional procedures performed at Group level, gave us appropriate evidence for our opinion on the Group financial statements.
Climate change
Stakeholders are increasingly interested in how climate change will impact entities similar to the group. The Group has determined that the most significant future impacts from climate change on their strategy and operations will be from changes in weather patterns and consequential damage to physical assets as a result of failing to respond to these risks. These are explained on pages 80 to 90 in the Task Force for Climate related Financial Disclosures (TCFD) and on page 56 to 74 in the principal risks and uncertainties. All of these disclosures form part of the “Other information,” rather than the audited financial statements. Our procedures on these unaudited disclosures therefore consisted solely of considering whether they are materially inconsistent with the financial statements or our knowledge obtained in the course of the audit or otherwise appear to be materially misstated, in line with our responsibilities on “Other information”.
In planning and performing our audit we assessed the potential impacts of climate change on the Group’s business and any consequential material impact on its financial statements.
As explained in Note 2 to the Consolidated Financial Statements and the TCFD, the operational responses to climate change risks are still developing, and consequently financial statements cannot capture all possible future outcomes as these are not yet known. The degree of certainty of these changes may also mean that they cannot be taken into account when determining asset and liability valuations and the timing of future cash flows under the requirements of UK adopted international accounting standards.
Our audit effort in considering the impact of climate change on the financial statements was focused on evaluating management’s assessment of the impact of climate risk, physical and transition, their climate commitments, and on ensuring that the effects of material climate risks disclosed on page 56 to 74 have been appropriately considered when assessing whether assets and liabilities were susceptible to material changes in measurement as a result of climate risks and opportunities.
Based on our work we have not identified the impact of climate change on the financial statements to be a key audit matter or to impact a key audit matter.
Key audit matters
Key audit matters are those matters that, in our professional judgment, were of most significance in our audit of the financial statements of the current period and include the most significant assessed risks of material misstatement (whether or not due to fraud) that we identified. These matters included those which had the greatest effect on: the overall audit strategy, the allocation of resources in the audit; and directing the efforts of the engagement team. These matters were addressed in the context of our audit of the financial statements as a whole, and in our opinion thereon, and we do not provide a separate opinion on these matters.
| Risk | Our response to the risk |
Key observations communicated to the
Audit Committee |
|
Recoverability assessment of contracted concessional, PP&E and other intangible assets ($7,204 million value of risk, PY comparative $7,483 million)
Refer to the Audit Committee Report (page 198); Accounting policies (Note 2 of the Consolidated Financial Statements page 293); and Note 6 of the Consolidated Financial Statements (page 321).
As described in Note 6 to the consolidated financial statements, the Group has recorded “contracted concessional, PP&E and other intangible assets” of $7,204 million at December 31, 2023. Revenue derived from the Group’s contracted concessional, PP&E and other intangible assets are primarily governed by power purchase agreements (“PPAs”) with the Group’s customers or by the applicable energy regulations of each country, mainly in Spain and Chile.
As described in Note 2 to the consolidated financial statements, the Group reviews its contracted concessional assets, PP&E and other intangible assets for impairment indicators whenever events or changes in circumstances indicate that the carrying amounts of the assets or group of assets may not be recoverable, or previous impairment losses are no longer adequate. As discussed in Note 6, management identified triggering events at the two Chilean assets (Chile PV1 and Chile PV2) and as a result, a $16 million impairment charge was recorded in 2023 (2022: $61 million, which includes impairment loss recognized in Solana).
Auditing the Group’s recoverability assessment of contracted concessional, PP&E and other intangible assets involves significant judgment in determining whether impairment indicator existed and, if an indicator exists, in the assumptions used by management in the determination of whether an impairment should be recorded or reversed. The main inputs considered when evaluating for impairment indicators include the performance of the assets versus budget, changes in applicable regulations and estimates of future electricity prices. The significant assumptions which required substantial judgement or estimation used in management’s impairment calculation are discount rates and projections considering real data based on contract terms and projected changes in both selling prices and costs. |
We obtained an understanding, evaluated the design, and tested the operating effectiveness of controls over the Group’s contracted concessional, PP&E and other intangible assets recoverability assessment process. Among others, we tested controls over management’s identification of potential impairment indicators, as well as controls over the determination of significant assumptions used in the impairment calculation, including, the discount rates and underlying projections used in the Group’s impairment assessment.
To test the Group’s impairment indicators assessment for contracted concessional, PP&E and other intangible assets, our audit procedures included, among others, comparing actual energy production versus budget for each asset, assessing the estimated future electricity prices versus prior year future estimates and determining whether identified changes in applicable regulation would negatively impact the Group’s assets’ future cash flows.
As part of our impairment test audit procedures, we assessed the appropriateness of the main inputs including estimated performance of the assets, prices and costs used in the cash flow projections, by, for example, comparing future price estimates versus prior year future estimates. For the discount rate, we involved our valuation specialists to assist us in calculating and developing a range of discount rates, which we compared to those used by the Group.
We assessed the adequacy of the related disclosures in the Group financial statements, including the sensitivity analyses on electricity prices and discount rate assumptions.
The above audit procedures over this risk area, covering 100% of the amount at risk, were performed by the group audit team. |
Based on the audit procedures performed, we conclude that the review of the impairment indicators assessment performed by management is appropriate.
For the two Chilean assets, impairment charges of $16 million were identified by management and recorded . Based on the evidence obtained and the audit procedures performed, we consider that the impairment charge is fairly stated.
We conclude that the related disclosures as per IAS 36 and IAS 1 are appropriately presented in the financial statements.
|
Our application of materiality
We apply the concept of materiality in planning and performing the audit, in evaluating the effect of identified misstatements on the audit and in forming our audit opinion.
Materiality
The magnitude of an omission or misstatement that, individually or in the aggregate, could reasonably be expected to influence the economic decisions of the users of the financial statements. Materiality provides a basis for determining the nature and extent of our audit procedures.
We determined materiality for the group to be $21 million (2022: $21 million), which is 2.75% (2022: 2.75%) of EBITDA. We believe that EBITDA provides us with measurement of materiality as EBITDA is an earnings-based measure that is significant to users of the financial statements. This is considered to be a critical measure for users of the financial statements, given the focus on this metric by the Group’s shareholders, investors and external lenders.

We determined materiality for the Parent Company to be $21 million (2022: $20 million), which is 0.80% (2022: 1.75% of equity) of the total assets. We consider total assets to be an appropriate basis for materiality for a holding company, as the users of the financial statements focus on the entity’s financial position measure. We have determined that the total assets would provide a comprehensive measure of the company’s resources both financed by equity holders and lenders.
Performance materiality
The application of materiality at the individual account or balance level. It is set at an amount to reduce to an appropriately low level the probability that the aggregate of uncorrected and undetected misstatements exceeds materiality.
On the basis of our risk assessments, together with our assessment of the Group’s overall control environment, our judgement was that performance materiality was 75% (2022: 75%) of our planning materiality, namely $16m (2022: $16m). We have set performance materiality at this percentage due to the nature, the number and the impact of audit differences communicated during the 2022 audit as well as the overall control environment.
Audit work at component locations for the purpose of obtaining audit coverage over significant financial statement accounts is undertaken based on a percentage of total performance materiality. The performance materiality set for each component is based on the relative scale and risk of the component to the Group as a whole and our assessment of the risk of misstatement at that component. In the current year, the range of performance materiality allocated to components was $2m to $6m (2022: $2m to $6m).
Reporting threshold
An amount below which identified misstatements are considered as being clearly trivial.
We agreed with the Audit Committee that we would report to them all uncorrected audit differences in excess of $1m (2022: $1m), which is set at 5% of planning materiality, as well as differences below that threshold that, in our view, warranted reporting on qualitative grounds.
We evaluate any uncorrected misstatements against both the quantitative measures of materiality discussed above and in light of other relevant qualitative considerations in forming our opinion.
Other information
The other information comprises the information included in the annual report, other than the financial statements and our auditor’s report thereon. The directors are responsible for the other information contained within the annual report.
Our opinion on the financial statements does not cover the other information and, except to the extent otherwise explicitly stated in this report, we do not express any form of assurance conclusion thereon.
Our responsibility is to read the other information and, in doing so, consider whether the other information is materially inconsistent with the financial statements or our knowledge obtained in the course of the audit or otherwise appears to be materially misstated. If we identify such material inconsistencies or apparent material misstatements, we are required to determine whether this gives rise to a material misstatement in the financial statements themselves. If, based on the work we have performed, we conclude that there is a material misstatement of the other information, we are required to report that fact.
We have nothing to report in this regard.
Opinions on other matters prescribed by the Companies Act 2006
In our opinion, the part of the directors’ remuneration report to be audited has been properly prepared in accordance with the Companies Act 2006.
In our opinion, based on the work undertaken in the course of the audit:
| ● | the information given in the strategic report and the directors’ report for the financial year for which the financial statements are prepared is consistent with the financial statements; and |
| ● | the strategic report and directors’ report have been prepared in accordance with applicable legal requirements. |
Matters on which we are required to report by exception
In the light of the knowledge and understanding of the group and the parent company and its environment obtained in the course of the audit, we have not identified material misstatements in the strategic report or the directors’ report.
We have nothing to report in respect of the following matters in relation to which the Companies Act 2006 requires us to report to you if, in our opinion:
| ● | adequate accounting records have not been kept by the parent company, or returns adequate for our audit have not been received from branches not visited by us; or |
| ● | the parent company financial statements and the part of the directors’ remuneration report to be audited are not in agreement with the accounting records and returns; or |
| ● | certain disclosures of directors’ remuneration specified by law are not made; or |
| ● | we have not received all the information and explanations we require for our audit |
Responsibilities of directors
As explained more fully in the directors’ responsibilities statement set out on page 230, the directors are responsible for the preparation of the financial statements and for being satisfied that they give a true and fair view, and for such internal control as the directors determine is necessary to enable the preparation of financial statements that are free from material misstatement, whether due to fraud or error.
In preparing the financial statements, the directors are responsible for assessing the group and parent company’s ability to continue as a going concern, disclosing, as applicable, matters related to going concern and using the going concern basis of accounting unless the directors either intend to liquidate the group or the parent company or to cease operations, or have no realistic alternative but to do so.
Auditor’s responsibilities for the audit of the financial statements
Our objectives are to obtain reasonable assurance about whether the financial statements as a whole are free from material misstatement, whether due to fraud or error, and to issue an auditor’s report that includes our opinion. Reasonable assurance is a high level of assurance, but is not a guarantee that an audit conducted in accordance with ISAs (UK) will always detect a material misstatement when it exists. Misstatements can arise from fraud or error and are considered material if, individually or in the aggregate, they could reasonably be expected to influence the economic decisions of users taken on the basis of these financial statements.
Explanation as to what extent the audit was considered capable of detecting irregularities, including fraud
Irregularities, including fraud, are instances of non-compliance with laws and regulations. We design procedures in line with our responsibilities, outlined above, to detect irregularities, including fraud. The risk of not detecting a material misstatement due to fraud is higher than the risk of not detecting one resulting from error, as fraud may involve deliberate concealment by, for example, forgery or intentional misrepresentations, or through collusion. The extent to which our procedures are capable of detecting irregularities, including fraud is detailed below. However, the primary responsibility for the prevention and detection of fraud rests with both those charged with governance of the company and management.
Our approach was as follows:
| ● | We obtained an understanding of the legal and regulatory frameworks that are applicable to the group and determined that the most significant are those that relate to the reporting framework (UK adopted international accounting standards, FRS 101 and the Companies Act 2006), the relevant tax compliance regulations in the jurisdictions in which the Group operates, Anti-Money Laundering Regulation and General Data Protection Regulation. In addition, the Group is subject to the laws and regulations set forth by both the Securities and Exchange Commission (“SEC”) and the National Association of Securities Automated Quotations (“NASDAQ”). Also, the Group operates in a number of regulated markets; it is subject to extensive regulations from the national regulatory authorities in the jurisdictions it operates in, as well as additional regulations at a state, regional and local level in certain countries, including Spain, Mexico, USA, Peru, South Africa, Uruguay and Luxembourg. |
| ● | We understood how Atlantica Sustainable Infrastructure plc is complying with those frameworks by making enquiries of management, internal audit and those responsible for legal and compliance procedures. We corroborated our enquiries through our review of Board minutes, papers provided to the Audit Committee and correspondence received from regulatory or licensing authorities. We noted that there was no contradictory evidence. |
| ● | We assessed the susceptibility of the group’s financial statements to material misstatement, including how fraud might occur by meeting with management within various parts of the business to understand where they considered there was susceptibility to fraud. We also considered performance targets and their influence on efforts made by management to manage earnings or influence the perceptions of analysts. Where the risk was considered to be higher, we performed audit procedures to address each identified as a fraud risk. These procedures included performing substantive testing procedures over revenue recognition, testing manual journals and involving our internal specialists to review key management estimates (such as the recoverability assessment of contracted concessional, PP&E and other intangible assets and fair value estimates). These procedures were designed to provide reasonable assurance that the financial statements were free from fraud or error. |
| ● | Based on this understanding we designed our audit procedures to identify non-compliance with such laws and regulations. Our procedures involved a review of board minutes to identify any non-compliance, a review of reporting to the Audit Committee on compliance with regulations and enquiries with management, internal audit and the legal and compliance department. |
| ● | The Group owns and manages renewable energy, efficient natural gas, transmission and transportation infrastructure and water assets which operate in a regulated environment. We have obtained an understanding of the regulations and the potential impact of these on the Group. In assessing the control environment, we have considered the compliance of the Group with these regulations as part of our audit procedures, which included a review of correspondence received from the regulators where this was received. In addition, revenues derived from the Group’s contracted concessional assets are governed by power purchase agreements (“PPAs”) with the Group’s customers or with regulators. We have agreed the conditions and prices applied per the contracts to the revenues. |
A further description of our responsibilities for the audit of the financial statements is located on the
Financial Reporting Council’s website at https://www.frc.org.uk/auditorsresponsibilities. This description forms part of our auditor’s report.
Use of our report
This report is made solely to the company’s members, as a body, in accordance with Chapter 3 of Part 16 of the Companies Act 2006. Our audit work has been undertaken so that we might state to the company’s members those matters we are required to state to them in an auditor’s report and for no other purpose. To the fullest extent permitted by law, we do not accept or assume responsibility to anyone other than the company and the company’s members as a body, for our audit work, for this report, or for the opinions we have formed.
Ian Venner (Senior statutory auditor)
for and on behalf of Ernst & Young Chartered Accountants, Statutory Auditor
Cork, Ireland
4 March 2024
Consolidated Financial Statements
Consolidated Statement of profit or loss
| Amounts in thousands of U.S. dollars | For the year ended December 31, | |||||||||||
| Note (1) | ||||||||||||
| 2023 | 2022 | |||||||||||
| Revenue | 4 | 1,099,894 | 1,102,029 | |||||||||
| Other operating income | 22 | 101,087 | 80,782 | |||||||||
| Employee benefit expenses | 21 | (104,083) | (80,232) | |||||||||
| Depreciation, amortization, and impairment charges | 6 | (418,271) | (473,638) | |||||||||
| Other operating expenses | 22 | (336,622) | (351,248) | |||||||||
| Operating profit | 342,005 | 277,693 | ||||||||||
| Financial income | 23 | 25,007 | 10,149 | |||||||||
| Financial expense | 23 | (323,749) | (330,445) | |||||||||
| Net exchange differences | 23 | (2,549) | 10,257 | |||||||||
| Other financial loss, net | 23 | (16,683) | (895) | |||||||||
| Financial expense, net | (317,974) | (310,934) | ||||||||||
| Share of profit of entities carried under the equity method | 7 | 13,207 | 21,465 | |||||||||
| Profit/(loss) before income tax | 37,238 | (11,776) | ||||||||||
| Income tax (expense)/income | 19 | (790) | 9,689 | |||||||||
| Profit/(loss) for the year | 36,448 | (2,087) | ||||||||||
| (Profit)/loss attributable to non-controlling interest | 6,932 | (3,356) | ||||||||||
|
Profit/(loss) for the year attributable to owners of the Company |
43,380 | (5,443) | ||||||||||
|
Weighted average number of ordinary shares outstanding (thousands) basic |
24 | 116,152 | 114,695 | |||||||||
|
Weighted average number of ordinary shares outstanding (thousands) diluted |
24 | 119,720 | 118,865 | |||||||||
| Basic earnings per share (U.S. dollar per share) | 24 | 0.37 | (0.05) | |||||||||
| Diluted earnings per share (U.S. dollar per share) (*) | 24 | 0.37 | (0.09) | |||||||||
| (*) | Antidilutive effect applied, where applicable (see Note 24) |
| (1) | Notes 1 to 28 are an integral part of the Consolidated Financial Statements |
Consolidated Statement of Other Comprehensive Income
|
Note (1) |
Year | Year | ||||||||||
| Amounts in thousands of U.S. dollars | Ended December 31, 2023 | Ended December 31, 2022 | ||||||||||
| Profit/(loss) for the year | 36,448 | (2,087) | ||||||||||
| Items that may be reclassified subsequently to profit or loss: | ||||||||||||
| Change in fair value of cash flow hedges | (22,437) | 218,737 | ||||||||||
|
Less: reclassification adjustments for (gains)/losses transferred to profit or loss |
10 | (27,115) | 38,187 | |||||||||
| Exchange differences on translation of foreign operations | 24,584 | (33,704) | ||||||||||
| Income tax relating to items that may be reclassified subsequently to profit or loss | 8,037 | (63,952) | ||||||||||
|
Other comprehensive income/(loss) for the year net of tax |
(16,931) | 159,268 | ||||||||||
| Total comprehensive income for the year | 19,517 | 157,181 | ||||||||||
| Total comprehensive income attributable to: | ||||||||||||
| Owners of the Company | 27,688 | 142,568 | ||||||||||
| Non-controlling interest | (8,171) | 14,613 | ||||||||||
(1) Notes 1 to 28 are an integral part of the Consolidated Financial Statements
Consolidated statements of financial position
|
Amounts in thousands of U.S. dollars
|
Note (1)
|
As of December 31, 2023 |
As of December 31, 2022 |
|||||||||
| Assets | ||||||||||||
| Non-current assets | ||||||||||||
| Contracted concessional, PP&E and other intangible assets | 6 | 7,204,267 | 7,483,259 | |||||||||
| Investments carried under the equity method | 7 | 230,307 | 260,031 | |||||||||
| Other accounts receivable | 9 | 79,875 | 86,431 | |||||||||
| Derivative assets | 10 | 56,707 | 89,806 | |||||||||
| Other financial assets | 9 | 136,582 | 176,237 | |||||||||
| Deferred tax assets | 19 | 160,995 | 149,656 | |||||||||
| Total non-current assets | 7,732,151 | 8,069,183 | ||||||||||
| Current assets | ||||||||||||
| Inventories | 29,870 | 34,511 | ||||||||||
| Trade and other receivables | 12 | 286,483 | 200,334 | |||||||||
| Other financial assets | 9 | 188,886 | 195,893 | |||||||||
| Cash and cash equivalents | 13 | 448,301 | 600,990 | |||||||||
| 953,540 | 1,031,728 | |||||||||||
| Assets held for sale | 8 | 28,642 | - | |||||||||
| Total current assets | 982,182 | 1,031,728 | ||||||||||
| Total assets | 8,714,333 | 9,100,911 | ||||||||||
|
Equity |
||||||||||||
| Share capital | 14 | 11,616 | 11,606 | |||||||||
| Share premium | 14 | 736,594 | 986,594 | |||||||||
| Capital reserves | 14 | 858,220 | 814,951 | |||||||||
| Other reserves | 10 | 308,002 | 345,567 | |||||||||
| Accumulated currency translation reserve | 14 | (139,434 | ) | (161,307 | ) | |||||||
| Accumulated deficit | 14 | (351,521 | ) | (397,540 | ) | |||||||
| Equity attributable to the Company | 14 | 1,423,477 | 1,599,871 | |||||||||
| Non-controlling interest | 14 | 165,332 | 189,176 | |||||||||
| Total equity | 1,588,809 | 1,789,047 | ||||||||||
| Non-current liabilities | ||||||||||||
| Long-term corporate debt | 15 | 1,050,816 | 1,000,503 | |||||||||
| Long-term project debt | 16 | 3,931,873 | 4,226,518 | |||||||||
| Grants and other liabilities | 17 | 1,233,808 | 1,252,513 | |||||||||
| Derivative liabilities | 10 | 29,957 | 16,847 | |||||||||
| Deferred tax liabilities | 19 | 271,288 | 296,481 | |||||||||
| Total non-current liabilities | 6,517,742 | 6,792,862 | ||||||||||
| Current liabilities | ||||||||||||
| Short-term corporate debt | 15 | 34,022 | 16,697 | |||||||||
| Short-term project debt | 16 | 387,387 | 326,534 | |||||||||
| Trade payables and other current liabilities | 18 | 141,713 | 140,230 | |||||||||
| Income and other tax payables | 44,660 | 35,541 | ||||||||||
| Total current liabilities | 607,782 | 519,002 | ||||||||||
| Total equity and liabilities | 8,714,333 | 9,100,911 | ||||||||||
| (1) | Notes 1 to 28 are an integral part of the Consolidated Financial Statement |
The Consolidated Financial Statements of Atlantica Sustainable Infrastructure plc, company registration no. 08818211, were approved by the board of directors and authorized for issue on 29 February 2024.
They were signed on its behalf by:
| Director and Chief Executive Officer | Chief Financial Officer |
| Santiago Seage | Francisco Martinez-Davis |
| February 29, 2024 | February 29, 2024 |
Consolidated Statement of Changes in Equity
|
Amounts in thousands of U.S. dollars
|
Share Capital |
Share Premium |
Capital Reserves |
Other reserves |
Accumulated currency translation differences |
Accumulated deficit |
Total equity attributable to the Company |
Non- controlling interest |
Total equity |
| Balance as of January 1, 2022 | 11,240 | 872,011 | 1,020,027 | 171,272 | (133,450) | (398,701) | 1,542,399 | 206,206 | 1,748,605 |
| Profit/(Loss) for the year after taxes | - | - | - | - | - | (5,443) | (5,443) | 3,356 | (2,087) |
| Change in fair value of cash flow hedges net of transfer to profit and loss statement | - | - | - | 235,732 | - | 1,573 | 237,305 | 19,619 | 256,924 |
| Currency translation differences | - | - | - | - | (27,857) | - | (27,857) | (5,847) |
(33,704)
|
| Tax effect | - | - | - | (61,437) | - | - | (61,437) | (2,515) | (63,952) |
| Other comprehensive income | 174,295 | (27,857) | 1,573 | 148,011 | 11,257 | 159,268 | |||
| Total comprehensive income | - | - | - | 174,295 | (27,857) | (3,870) | 142,568 | 14,613 | 157,181 |
| Capital contribution (Note 14) | 366 | 114,583 | (1,970) | - | - | - | 112,979 | 112,979 | |
| Business Combinations (Note 5) | - | - | - | - | - | - | - | 14,300 | 14,300 |
| Share-based compensation (Note 14) | - | - | - | - | - | 5,031 | 5,031 | - | 5,031 |
| Distributions (Note 14) | (203,106) | (203,106) | (45,943) | (249,049) | |||||
| Balance as of December 31, 2022 |
11,606 |
986,594 |
814,951 |
345,567 |
(161,307) |
(397,540) |
1,599,871 |
189,176 |
1,789,047 |
Notes 1 to 28 are an integral part of the Consolidated Financial Statements
Consolidated Statement of Changes in Equity
|
Amounts in thousands of U.S. dollars
|
Share Capital |
Share Premium |
Capital Reserves |
Other reserves |
Accumulated currency translation differences |
Accumulated deficit |
Total equity attributable to the Company |
Non- controlling interest |
Total equity |
| Balance as of January 1, 2023 | 11,606 | 986,594 | 814,951 | 345,567 | (161,307) | (397,540) | 1,599,871 | 189,176 | 1,789,047 |
| Profit/(Loss) for the year after taxes | - | - | - | - | - | 43,380 | 43,380 | (6,932) | 36,448 |
| Change in fair value of cash flow hedges net of transfer to profit and loss statement | - | - | - | (44,335) | - | - | (44,335) | (5,217) | (49,552) |
| Currency translation differences | - | - | - | - | 21,873 | - | 21,873 | 2,711 |
24,584 |
| Tax effect | - | - | - | 6,770 | - | - | 6,770 | 1,267 | 8,037 |
| Other comprehensive income | (37,565) | 21,873 | - | (15,692) | (1,239) | (16,931) | |||
| Total comprehensive income | - | - | - | (37,565) | 21,873 | 43,380 | 27,688 | (8,171) | 19,517 |
| Divestments (Note 7) | - | - | - | - | - | - | - | (2,817) | (2,817) |
| Reduction of share premium (Note 14) | - | (250,000) | 250,000 | - | - | - | - | - | - |
| Share-based compensation (Note 14) | - | - | - | - | - | 2,639 | 2,639 | - | 2,639 |
| Capital contribution (Note 14) | 10 | - | 25 | - | - | - | 35 | 19,467 | 19,502 |
| Distributions (Note 14) | (206,756) | (206,756) | (32,323) | (239,079) | |||||
| Balance as of December 31, 2023 |
11,616 |
736,594 |
858,220 |
308,002 |
(139,434) |
(351,521) |
1,423,477 |
165,332 |
1,588,809 |
Notes 1 to 28 are an integral part of the Consolidated Financial Statements
|
Consolidated Cash Flow Statement |
For the year ended | |||
| Amounts in thousands of U.S. dollars | Note (1) | 2023 | 2022 | |
| Profit/(loss) for the year | 36,448 | (2,087) | ||
| Non-monetary adjustments | ||||
| Depreciation, amortization and impairment charges | 6 | 418,271 | 473,638 | |
| Financial expense | 23 | 319,286 | 335,546 | |
| Fair value gains on derivative financial instruments | 23 | (1,869) | (19,138) | |
| Shares of profits from entities carried under the equity method | 7 | (13,207) | (21,465) | |
| Income tax | 19 | 790 | (9,689) | |
| Other non-monetary items | (3,119) | 27,996 | ||
| Profit/(loss) for the year adjusted by non-monetary items | 756,600 | 784,801 | ||
| Changes in working capital | ||||
| Inventories | (6,285) | (6,955) | ||
| Trade and other receivables | 12 | (107,201) | 99,249 | |
| Trade payables and other current liabilities | 18 | (415) | (6,158) | |
| Other current assets/liabilities | 18,057 | (7,331) | ||
| Changes in working capital | (95,844) | 78,805 | ||
| Income tax paid | (26,020) | (14,730) | ||
| Interest received | 21,668 | 9,178 | ||
| Interest paid | (268,356) | (271,732) | ||
| Net cash provided by operating activities | 388,048 | 586,322 | ||
| Business combinations and investments in entities under the equity method | 5&7 | (29,259) | (50,507) | |
| Investments in operating concessional assets | 6 | (27,929) | (39,107) | |
| Investments in assets under development or construction | 6 | (56,280) | (36,784) | |
| Distribution from entities under the equity method | 7 | 34,329 | 67,695 | |
| Net divestment in other non-current financial assets | 27,505 | 1,265 | ||
| Net cash used in investing activities | (51,634) | (57,438) | ||
| Proceeds from project debt | 16 | 213,232 | - | |
| Proceeds from corporate debt | 15 | 161,498 | 101,140 | |
| Repayment of project debt | 16 | (531,837) | (426,396) | |
| Repayment of corporate debt | 15 | (115,891) | (80,519) | |
| Dividends paid to Company´s shareholders | 14 | (206,755) | (203,106) | |
| Dividends paid to non-controlling interest | 14 | (31,433) | (39,209) | |
| Non-controlling interest capital contribution | 14 | 19,823 | - | |
| Capital contribution | 14 | - | 113,072 | |
| Net cash used in financing activities | (491,363) | (535,018) | ||
| Net decrease in cash and cash equivalents | (154,949) | (6,134) | ||
| Cash and cash equivalents at beginning of the year | 13 | 600,990 | 622,689 | |
| Translation differences cash and cash equivalents | 2,260 | (15,565) | ||
| Cash and cash equivalents at the end of the year | 13 | 448,301 | 600,990 | |
(1) Notes 1 to 28 are an integral part of the Consolidated Financial Statements. Reference to such notes is indicated here to provide with additional information on the nature of some of the lines of the Consolidated cash flow statement.
Notes to the Consolidated Financial Statements
| 1. | General information |
Atlantica Sustainable Infrastructure plc (“Atlantica” or the “Company”), a Company registered in England and Wales and incorporated in the United Kingdom (Company registration no. 08818211), is a sustainable infrastructure company with a majority of its business in renewable energy assets. Atlantica currently owns, manages and invests in renewable energy, storage, efficient natural gas and heat, electric transmission lines and water assets focused on North America (the United States, Canada and Mexico), South America (Peru, Chile, Colombia and Uruguay) and EMEA (Spain, Italy, Algeria and South Africa). Its registered address is Great West House, GW1 Great West Road Brentford TW8 9DF, London (United Kingdom).
Atlantica’s shares trade on the NASDAQ Global Select Market under the symbol “AY”.
In March 2023, the Company completed the process of transitioning O&M services for the assets in Spain where Abengoa was still the supplier to an Atlantica’ subsidiary (Note 5). Currently, Atlantica performs the O&M services with its own personnel for assets representing approximately 74% of the consolidated revenue for the year ended December 31, 2023.
The following four assets that the Company had under construction during 2022, finished construction and reached Commercial Operation Date (“COD”) in 2023:
| - | Albisu, a 10 MW solar PV asset wholly owned by the Company. Albisu is located in the city of Salto (Uruguay). The asset has a 15-year PPA with Montevideo Refrescos, S.R.L, a subsidiary of Coca-Cola Femsa., S.A.B. de C.V. The PPA is denominated in local currency with a maximum and minimum price in U.S. dollars and is adjusted monthly based on a formula referring to U.S. Producer Price Index (PPI), Uruguay’s Consumer Price Index (CPI) and the applicable UYU/U.S. dollar exchange rate. |
| - | La Tolua and Tierra Linda, two wholly owned solar PV assets in Colombia with a combined capacity of 30 MW both of which reached COD in the first quarter of 2023. Each plant has a 10-year PPA in local currency indexed to local inflation with Coenersa, the largest independent electricity wholesaler in Colombia. Each PPA provides for the sale of electricity at fixed base price indexed to local CPI. |
| - | Honda 1, a 10 MW solar PV asset in Colombia where the Company has a 50% ownership, and which reached COD in December 2023. The asset has a 7-year PPA with Enel Colombia, a major electricity company in the country. The PPA is denominated in local currency, with fixed base price, indexed to the local CPI. |
During the year 2022, the Company completed the following investments:
| - | On January 17, 2022, the Company closed the acquisition of Chile TL4, a 63-mile transmission line and 2 substations in Chile for a total equity investment of $38.4 million (Note 5). The Company expects to expand the transmission line in 2024, which would represent an additional investment of approximately $8 million. The asset has fully contracted revenues in U.S. dollars, with inflation escalation and a 50-year remaining contract life. The off-takers are several mini-hydro plants that receive contracted or regulated payments. |
| - | On April 4, 2022, the Company closed the acquisition of Italy PV 4, a 3.6 MW solar portfolio in Italy for a total equity investment of $3.7 million (Note 5). The asset has regulated revenues under a feed in tariff until 2031. |
| - | On September 2, 2022, the Company completed its third investment through its Chilean renewable energy platform in a 73 MW solar PV plant, Chile PV 3, located in Chile, for $7.7 million corresponding to a 35% of equity interest (Note 5). The Company expects to install batteries with a capacity of approximately 100 MWh in 2024. Total investment including batteries is expected to be in the range of $15 million to $25 million depending on the capital structure. Part of the asset’s revenue is currently based on capacity payments. Adding storage would increase the portion of capacity payments. |
| - | On November 16, 2022, the Company closed the acquisition of a 49% interest, with joint control, in an 80 MW portfolio of solar PV projects in Chile, Chile PMGD, which is currently under construction. Atlantica´s economic rights are expected to be approximately 70%. Total investment in equity and preferred equity is expected to be approximately $30 million and Commercial Operation Date is expected to be progressive in 2024. Revenue for these assets is regulated under the Small Distributed Generation Means Regulation Regime (“PMGD”) for projects with a capacity equal or lower than 9MW, which allows to sell electricity through a stabilized price. |
The following table provides an overview of the main operating assets the Company owned or had an interest in as of December 31, 2023:
| Assets | Type | Ownership | Location | Currency(9) |
Capacity (Gross) |
Counterparty Credit Ratings(10) |
COD* |
Contract Years Remaining(17) |
| Solana | Renewable (Solar) | 100% | Arizona (USA) | USD | 280 MW | BBB+/A3/BBB+ | 2013 | 20 |
| Mojave | Renewable (Solar) | 100% | California (USA) | USD | 280 MW | BB/ Ba1/BB+ | 2014 | 16 |
| Coso | Renewable (Geothermal) | 100% | California (USA) | USD | 135 MW | Investment Grade(11) | 1987-1989 | 18 |
| Elkhorn Valley(16) | Renewable (Wind) | 49% | Oregon (USA) | USD | 101 MW | BBB/Baa1/-- | 2007 | 4 |
| Prairie Star(16) | Renewable (Wind) | 49% | Minnesota (USA) | USD | 101 MW | --/A3/A- | 2007 | 4 |
| Twin Groves II(16) | Renewable (Wind) | 49% | Illinois (USA) | USD | 198 MW | BB+/Baa2/-- | 2008 | 2 |
| Lone Star II(16) | Renewable (Wind) | 49% | Texas (USA) | USD | 196 MW | N/A | 2008 | N/A |
| Chile PV 1 | Renewable (Solar) | 35%(1) | Chile | USD | 55 MW | N/A | 2016 | N/A |
| Chile PV 2 | Renewable (Solar) | 35%(1) | Chile | USD | 40 MW | Not rated | 2017 | 7 |
| Chile PV 3 | Renewable (Solar) | 35%(1) | Chile | USD | 73 MW | N/A | 2014 | N/A |
| La Sierpe | Renewable (Solar) | 100% | Colombia | COP | 20 MW | Not rated | 2021 | 12 |
| Assets | Type | Ownership | Location | Currency(9) |
Capacity (Gross) |
Counterparty Credit Ratings(10) |
COD* |
Contract Years Remaining(17) |
| La Tolua | Renewable (Solar) | 100% | Colombia | COP | 20 MW | Not rated | 2023 | 9 |
| Tierra Linda | Renewable (Solar) | 100% | Colombia | COP | 10 MW | Not rated | 2023 | 9 |
| Honda 1 | Renewable (Solar) | 50% | Colombia | COP | 10 MW | BBB-/-/BBB | 2023 | 7 |
| Albisu | Renewable (Solar) | 100% | Uruguay | UYU | 10 MW | Not rated | 2023 | 15 |
| Palmatir | Renewable (Wind) | 100% | Uruguay | USD | 50 MW | BBB+/Baa2/BBB(12) | 2014 | 10 |
| Cadonal | Renewable (Wind) | 100% | Uruguay | USD | 50 MW | BBB+/Baa2/BBB(12) | 2014 | 11 |
| Melowind | Renewable (Wind) | 100% | Uruguay | USD | 50 MW | BBB+/Baa2/BBB(12) | 2015 | 12 |
| Mini-Hydro | Renewable (Hydraulic) | 100% | Peru | USD | 4 MW | BBB/Baa1/BBB | 2012 | 9 |
| Solaben 2 & 3 | Renewable (Solar) | 70%(2) | Spain | Euro | 2x50 MW | A/Baa1/A- | 2012 | 14/14 |
| Solacor 1 & 2 | Renewable (Solar) | 87%(3) | Spain | Euro | 2x50 MW | A/Baa1/A- | 2012 | 13/13 |
| PS10 & PS20 | Renewable (Solar) | 100% | Spain | Euro | 31 MW | A/Baa1/A- | 2007&2009 | 8/10 |
| Helioenergy 1 & 2 | Renewable (Solar) | 100% | Spain | Euro | 2x50 MW | A/Baa1/A- | 2011 | 13/13 |
| Helios 1 & 2 | Renewable (Solar) | 100% | Spain | Euro | 2x50 MW | A/Baa1/A- | 2012 | 13/14 |
| Solnova 1, 3 & 4 | Renewable (Solar) | 100% | Spain | Euro | 3x50 MW | A/Baa1/A- | 2010 | 11/11/12 |
| Solaben 1 & 6 | Renewable (Solar) |
100% |
Spain |
Euro |
2x50 MW |
A/Baa1/A- |
2013 |
15/15 |
| Seville PV | Renewable (Solar) | 80%(4) | Spain | Euro | 1 MW | A/Baa1/A- | 2006 | 12 |
| Italy PV 1 | Renewable (Solar) | 100% | Italy | Euro | 1.6 MW | BBB/Baa3/BBB | 2010 | 8 |
| Italy PV 2 | Renewable (Solar) | 100% | Italy | Euro | 2.1 MW | BBB/Baa3/BBB | 2011 | 8 |
| Italy PV 3 | Renewable (Solar) | 100% | Italy | Euro | 2.5 MW | BBB/Baa3/BBB | 2012 | 8 |
| Italy PV 4 | Renewable (Solar) | 100% | Italy | Euro | 3.6 MW | BBB/Baa3/BBB | 2011 | 8 |
| Kaxu | Renewable (Solar) | 51%(5) | South Africa | Rand | 100 MW | BB-/Ba2/BB-(13) | 2015 | 11 |
| Cargary | Efficient natural gas &heat | 100% | Canada | CAD | 55 MWt | ~60% AA- or higher(14) | 2010 | 12 |
| ACT | Efficient natural gas & heat | 100% | Mexico | USD | 300 MW | BBB/B3/B+ | 2013 | 9 |
| Monterrey (18) | Efficient natural gas &heat | 30% | Mexico | USD | 142 MW | Not rated | 2018 | 22 |
| ATN (15) | Transmission line | 100% | Peru | USD | 379 miles | BBB/Baa1/BBB | 2011 | 17 |
| Assets | Type | Ownership | Location | Currency(9) |
Capacity (Gross) |
Counterparty Credit Ratings(10) |
COD* |
Contract Years Remaining(17) |
| ATS | Transmission line | 100% | Peru | USD | 569 miles | BBB/Baa1/BBB | 2014 | 20 |
| ATN 2 | Transmission line | 100% | Peru | USD | 81 miles | Not rated | 2015 | 9 |
| Quadra 1 & 2 | Transmission line | 100% | Chile | USD | 49 miles/32 miles | Not rated | 2014 | 11/11 |
| Palmucho | Transmission line | 100% | Chile | USD | 6 miles | BBB/ -- /BBB+ | 2007 | 14 |
| Chile TL3 | Transmission line | 100% | Chile | USD | 50 miles | A/A2/A- | 1993 | N/A |
| Chile TL4 | Transmission line | 100% | Chile | USD | 63 miles | Not rated | 2016 | 48 |
| Skikda | Water | 34.20%(6) | Algeria | USD | 3.5 M ft3/day | Not rated | 2009 | 10 |
| Honaine | Water | 25.50%(7) | Algeria | USD | 7 M ft3/day | Not rated | 2012 | 14 |
| Tenes | Water | 51%(8) | Algeria | USD | 7 M ft3/day | Not rated | 2015 | 16 |
|
(1) |
65% of the shares in Chile PV 1, Chile PV 2 and Chile PV 3 are indirectly held by financial partners through the renewable energy platform of the Company in Chile. |
| (2) | Itochu Corporation holds 30% of the shares in each of Solaben 2 and Solaben 3. |
| (3) | JGC holds 13% of the shares in each of Solacor 1 and Solacor 2. |
| (4) | Instituto para la Diversificación y Ahorro de la Energía (“Idae”) holds 20% of the shares in Seville PV. |
| (5) | Kaxu is owned by the Company (51%), Industrial Development Corporation of South Africa (“IDC”, 29%) and Kaxu Community Trust (20%). |
| (6) | Algerian Energy Company, SPA owns 49% of Skikda and Sacyr Agua, S.L. owns the remaining 16.8%. |
| (7) | Algerian Energy Company, SPA owns 49% of Honaine and Sacyr Agua, S.L. owns the remaining 25.5%. |
| (8) | Algerian Energy Company, SPA owns 49% of Tenes. The Company has an investment in Tenes through a secured loan to Befesa Agua Tenes (the holding company of Tenes) and the right to appoint a majority at the board of directors of the project company. Therefore, the Company controls Tenes since May 31, 2020, and fully consolidates the asset from that date. |
| (9) | Certain contracts denominated in U.S. dollars are payable in local currency. |
| (10) | Reflects the counterparty’s credit ratings issued by Standard & Poor’s Ratings Services, or S&P, Moody’s Investors Service Inc., or Moody’s, and Fitch Ratings Ltd, or Fitch. Not applicable (“N/A”) when the asset has no PPA. |
| (11) | Refers to the credit rating of two Community Choice Aggregators: Silicon Valley Clean Energy and Monterrey Bar Community Power, both with A Rating from S&P and Southern California Public Power Authority. The third off-taker is not rated. |
| (12) | Refers to the credit rating of Uruguay, as UTE (Administración Nacional de Usinas y Transmisoras Eléctricas) is unrated. |
| (13) | Refers to the credit rating of the Republic of South Africa. The off-taker is Eskom, which is a state-owned utility company in South Africa. |
| (14) | Refers to the credit rating of a diversified mix of 22 high credit quality clients (~60% AA- rating or higher, the rest is unrated). |
| (15) | Including ATN Expansion 1 & 2. |
| (16) | Part of Vento II Portfolio. |
| (17) | As of December 31, 2023. |
| (18) | Accounted for as held for sale as of December 31, 2023 |
| (*) | Commercial Operation Date. |
Additionally, Atlantica currently has the following assets under construction or ready to start construction in the short term:
| Asset | Type | Location | Capacity (gross) 1 |
Expected COD |
Expected ($ million) |
Off-taker |
| Coso Batteries 1 | Battery Storage | California, US | 100 MWh | 2025 | 40-50 | Investment grade utility |
| Coso Batteries 2 | Battery Storage | California, US | 80 MWh | 2025 | 35-45 | Investment grade utility |
| Chile PMGD | Solar PV | Chile | 80 MW | 2024-2025 | 30 | Regulated |
| ATN Expansion 3 | Transmission Line | Peru | 2.4miles 220kV | 2024 | 12 | Conelsur |
| ATS Expansion 1 | Transmission Line | Peru | n.a. (substation) | 2025 | 30 | Republic of Peru |
| Honda 23 | Solar PV | Colombia | 10 MW | 2024 | 5.5 | Enel Colombia |
| Apulo 13 | Solar PV | Colombia | 10 MW | 2024 | 5.5 | - |
| (1) | Includes nominal capacity on a 100% basis, not considering Atlantica’s ownership |
| (2) | Corresponds to the expected investment by Atlantica |
| (3) | Atlantica owns 50% of the shares in Honda 2 and Apulo 1 |
In October 2023, the Company entered into two 15-year tolling agreements (PPAs) with an investment grade utility for Coso Batteries 1 and Coso Batteries 2. Under each of the tolling agreements, Coso Batteries 1 and 2 will receive fixed monthly payments adjusted by the financial settlement of CAISO’s (California Independent System Operator) Day-Ahead market. In addition, the Company expects to obtain revenue from ancillary services in each of the assets.
Coso Batteries 1 is a standalone battery storage project of 100 MWh (4 hours) capacity, located inside Coso, its geothermal asset in California. Additionally, Coso Batteries 2 is a standalone battery storage project with 80 MWh (4 hours) capacity also located inside Coso. The investment is expected to be in the range of $40 million to $50 million for Coso Batteries 1, and in the range of $35 to $45 million for Coso Batteries 2. Both projects were fully developed in-house and are now under construction. Atlantica has closed a contract with Tesla for the procurement of the batteries. COD is expected in 2025 for both projects.
In July 2022 the Company closed a 17-year transmission service agreement denominated in U.S. dollars that allows to build a substation and a 2.4-miles transmission line connected to ATN transmission line serving a new mine in Peru (ATN Expansion 3). The substation is expected to enter in operation in 2024 and the investment is expected to be approximately $12 million.
In July 2023, as part of the New Transmission Plan Update in Peru, the Ministry of Energy and Mines published the Ministerial Resolution that enables to start construction of ATS Expansion 1 project, consisting in the reinforcement of two existing substations with new equipment. The expansion will be part of the existing concession contract, a 30-year contract with a fixed-price tariff base denominated in U.S. dollars adjusted annually in accordance with the U.S. Finished Goods Less Foods and Energy Index as published by the U.S. Department of Labor. Given that the concession ends in 2044, Atlantica will be compensated with a one-time payment for the remaining 9 years of concession. The expansion is expected to enter in operation in 2025 and the investment is expected to be approximately $30 million.
In May 2022, the Company agreed to develop and construct Honda 1 and 2, two PV assets in Colombia with a combined capacity of 20 MW, where it has a 50% ownership. Each plant has a 7-year PPA with Enel Colombia. Honda 1, as it is stated above, reached COD in December 2023. Honda 2 is expected to enter into operation in the second quarter of 2024. The investment is expected to be $5.5 million for each plant.
Chile PV 1 and PV2 events of default
Due to low electricity prices in Chile, the project debts of Chile PV 1 and PV2, where the Company owns a 35% equity interest, are under an event of default as of December 31, 2023. Chile PV 1 was not able to maintain the minimum required cash in its debt service reserve account as of December 31, 2023 and did not make its debt service payment in January 2024. In addition, in October 2023, Chile PV 2 did not make its debt service payment. This asset obtained additional financing from the banks and made the debt service payment in December 2023, although it was not able to fund its debts service reserve account. As a result, although the Company does not expect an acceleration of the debts to be declared by the credit entities, Chile PV 1 and Chile PV2, did not have an unconditional right to defer the settlement of the debts for at least twelve months and the project debts, which amount to $71 million as of December 31, 2023 (Note 16), were classified as current in these Consolidated Financial Statements in accordance with International Accounting Standards 1 (“IAS 1”), “Presentation of Financial Statements”. The Company is, together with the partner, in conversations with the banks regarding a potential waiver.
| 2. | Material Accounting Policies |
| 2.1. | Basis of Preparation |
These Consolidated Financial Statements are presented in accordance with the International Financial Reporting Standards (“IFRS”) as issued by the International Accounting Standards Board (“IASB”) and with UK adopted International Accounting Standards, on a basis consistent with the prior year.
The Consolidated Financial Statements are presented in U.S. dollars, which is the Company’s functional and presentation currency. Amounts included in these Consolidated Financial Statements are all expressed in thousands of U.S. dollars, unless otherwise indicated.
The Company presents assets and liabilities in the statement of financial position based on current/non-current classification. An asset or liability is current when it is expected or due to be realized within twelve months after the reporting period.
The Company recognises that there may be potential financial implications in the future from changes in legislation and regulation implemented to address climate change risk. Over time these changes may have an impact across a number of areas of accounting. However, as at the reporting date, the Company believes there is no material impact on the carrying values of assets or liabilities.
Application of new accounting standards
| a) | Standards, interpretations and amendments effective from January 1, 2023 under IFRS-IASB, applied by the Company in the preparation of these Consolidated Financial Statements: |
The applications of these amendments have not had any material impact on these financial statements.
In addition, the IASB published in May 2023 an amendment to IAS 12, “Income taxes”, to clarify the application of this standard arising from tax legislation enacted or substantively enacted in each country to implement the Pillar Two model rules in which it provides:
| - | a temporary exception to the accounting for deferred taxes in connection with the implementation of Pillar Two. |
| - | qualitative and quantitative disclosures to enable users to understand the entities’ exposure to taxes that may arise from the Pillar Two model rules and/or the entity’s progress in its implementation. |
Global minimum taxation (Pillar Two OECD/G20 BEPS 2.0 top-up taxes as agreed by the Inclusive Framework) legislation has been enacted or substantially enacted in certain jurisdictions in which the Atlantica operates. The new legislation will be effective for the Company´s financial years beginning January 1, 2024. Atlantica is in scope of the enacted or substantially enacted legislation and has performed an assessment of the Company´s potential exposure to Pillar Two top-up taxes.
The assessment is based on the country-by-country reporting and financial statements for the constituent entities of Atlantica. Based on the assessment performed, the Pillar Two effective tax rates in most of the jurisdictions in which Atlantica operates are above 15% and in all of them meet the requirements to apply the relevant transitional safe harbors, with the exception of one jurisdiction, whose impact is not material. Therefore, Atlantica does not expect a material exposure to Pillar Two income taxes for accounting periods commencing on or after December 31, 2023.
| b) | Standards, interpretations and amendments published by the IASB that will be effective for periods beginning on or after January 1, 2024: |
The Company does not anticipate any significant impact on the Consolidated Financial Statements derived from the application of the new standards and amendments that will be effective for annual periods beginning on or after January 1, 2024, although it is currently still in the process of evaluating such application.
The Company has not early adopted any standard, interpretation or amendment that has been issued but is not yet effective.
Going concern
In assessing going concern for the Group and Company, the Directors have considered the period up to March 31, 2025. Management’s going concern assessment, including sensitivity analysis and key assumptions used, was presented to, and discussed with, the Audit Committee.
The Group has a formal process of budgeting, reporting, measuring asset performance, identifying and mitigating risks. This information is provided to the directors, which is used to ensure the adequacy of resources available for the Group to meet its business objectives. The Company’s business activities, together with the factors likely to affect its future development, performance and position are set out within this report.
During the period, the Group generated $388.0 million of cash from operating activities, used $51.6 million in investing activities and $491.4 million in financing activities. All of these resulted in a $155.0 million net decrease on its cash position by year-end, with a closing cash position of $448.3 million (Note 13). The Group´s cash includes $415.3 million held at the project level, of which $177.0 million are held to satisfy the customary requirements of certain non-recourse debt agreements (Note 16). The remaining $33.0 million is held at the corporate level.
As at 31 December 2023 total debt was $5,404.1 million, of which $421.4 million was short-term. Related facilities are at both the corporate level and project level, with this structure being reflected in the assessment of going concern below.
At the corporate level, total debt was $1,084.8 million as at 31 December 2023, of which $34.0 million is current (Note 15). In addition, it had $378.1 million undrawn and available under its revolving credit facility, which, in aggregate with cash of $33.0 million, results in total available liquidity at this level of $411.1 million. At the corporate level, the principal source of liquidity are dividends from the Group’s projects. The aggregate level of these distributions is also the principal metric for the corporate level debt covenants.
Aggregate project level debt was $4,319.3 million as at 31 December 2023, of which $387.4 million is current. These facilities are subject to covenants including debt service coverage ratios at the respective project level. These facilities are non-recourse to the entities of the Group outside of the relevant project (Note 16).
In assessing going concern, the Directors have considered the forecast cash flows of the Group’s projects and the expected level of cash available to distribute from these. Cash available for distribution is forecast after the servicing of project level debt and the maintenance of restricted cash required under the facilities. The repayment profile of each project is established based on the projected cash flow generation of the business. This ensures that sufficient financing is available to meet deadlines and maturities, which mitigates liquidity risk. Distributions are generally subject to the compliance with covenants and other conditions under the project finance agreements of the Company which are regularly monitored, including assessing forecast compliance with project level debt covenants.
The Directors believe that the off-take agreements or regulation in place at the Company’s portfolio of projects provide a predictable and stable cash flow generation. The exposure to market electricity prices represents less than 2% of the Company’s portfolio in terms of Adjusted EBITDA. In addition, approximately 54% of the Group’s revenue in 2023 is not subject to the volatility that natural resource may have, especially solar and wind resources. This includes transmission lines, efficient natural gas plant, water assets and approximately 76% of the revenue received from the solar assets of the Company in Spain with most of their revenues based on capacity in accordance with the regulation in place. The diversification by geography and business sector also strengthens the stability of the cash flow generation of the remaining balance.
For the purposes of the corporate level element of the assessment, the directors have considered sensitivities on the cash forecast to be received from projects as distributions to enable the Company to meet its payment’s obligation and its covenants and obligations under its corporate financing arrangements. In the downside scenario, though considered highly unlikely, in which management has reduced the aggregate receipts of dividends throughout the going concern period by approximately 10 percent, the Company would have the level of cash needed to operate the business and none of the corporate level debt covenants would be breached. The Directors consider that such a reduction is highly unlikely given the absolute number of the Group’s projects, their geographical diversity and their cashflow stability.
From a liquidity and debt covenants perspective, the Directors have identified mitigations that are within the Board’s control including but not limited to further use of the undrawn element of the corporate facilities, increase in non-recourse financing for new projects under construction, divestments, and reductions in discretionary investments.
Following this assessment at both the project and corporate levels the Directors have concluded it is appropriate to prepare the Consolidated Financial Statements on a going concern basis and have not identified material uncertainties that may cast significant doubt on the Group and Company’s ability to continue as a going concern.
| 2.2. | Principles to include and record companies in the Consolidated Financial Statements |
Companies included in these Consolidated Financial Statements are accounted for as subsidiaries as long as Atlantica has control over them and are accounted for as investments under the equity method as long as Atlantica has significant influence over them, in the periods presented.
| a) | Controlled entities |
Control is achieved when the Company:
| ● | Has power over the investee; |
| ● | Is exposed, or has rights, to variable returns from its involvement with the investee; and |
| ● | Has the ability to use its power to affect its returns. |
The Company reassesses whether or not it controls an investee when facts and circumstances indicate that there are changes to one or more of the three elements of control listed above.
The Company uses the acquisition method to account for business combinations of companies previously controlled by a third party. According to this method, identifiable assets acquired and liabilities and contingent liabilities assumed in a business combination are measured initially at their fair values at the acquisition date. Any contingent consideration is recognized at fair value at the acquisition date and subsequent changes in its fair value are recognized in accordance with IFRS 9 in profit or loss. Acquisition related costs are expensed as incurred. The Company recognizes any non-controlling interest in the acquiree either at fair value or at the non-controlling interest’s proportionate share of the acquirer’s net assets on an acquisition by acquisition basis.
All assets and liabilities between entities of the Company, equity, income, expenses, and cash flows relating to transactions between entities of the Company are eliminated in full.
| b) | Investments accounted for under the equity method |
An associate is an entity over which the Company has significant influence. Significant influence is the power to participate in the financial and operating policy decisions of the investee but is not control or joint control over those policies.
A joint venture is a type of joint arrangement whereby the parties that have joint control of the arrangement have rights to the net assets of the joint venture. Joint control is the contractually agreed sharing of control of an arrangement, which exists only when decisions about the relevant activities require the unanimous consent of the parties sharing control.
The results and assets and liabilities of associates and joint ventures are incorporated in these financial statements using the equity method of accounting. Under the equity method, an investment in an associate or joint venture is initially recognized in the statement of financial position at fair value and adjusted thereafter to recognize changes in Atlantica´s share of net assets of the associate or joint venture since the acquisition date. Any goodwill relating to the associate is included in the carrying amount of the investment and is not tested for impairment separately.
| 2.3. | Contracted concessional, Property, Plant and Equipment (PP&E) and other intangible assets |
The assets accounted for by the Company as contracted concessional assets under IFRIC 12 (either intangible model or financial model), as PP&E under IAS 16 or as other intangible assets under IAS 38 or under IFRS 16 (as “Lessee” or “Lessor”), include renewable energy assets, storage assets, transmission lines, efficient natural gas and heat assets and water plants.
| a) | Contracted concessional assets under IFRIC 12 |
The infrastructure used in a concession accounted for under IFRIC 12 can be classified as an intangible asset or a financial asset, depending on the nature of the payment entitlements established in the agreement. The application of IFRIC 12 requires extensive judgement in relation to, among other factors, (i) the identification of certain infrastructures and contractual agreements in the scope of IFRIC 12, (ii) an understanding of the nature of the payments in order to determine the classification of the infrastructure as a financial asset or as an intangible asset and (iii) the timing and recognition of revenue from construction and concessionary activity.
Under the terms of contractual arrangements within the scope of this interpretation, the operator shall recognize and measure revenue in accordance with IFRS 15 for the services it performs. If the operator performs more than one service (i.e. construction or upgrade services and operation services) under a single contract or arrangement, consideration received or receivable shall be allocated by reference to the relative fair values of the services delivered, when the amounts are separately identifiable.
Consequently, even though construction is subcontracted and it is not performed by Atlantica, in accordance with the provisions of IFRIC 12, the Company recognizes and measures revenue and costs for providing construction services during the period of construction of the infrastructure in accordance with IFRS 15. Construction revenue is recorded within “Other operating income” and Construction cost, which is fully contracted, is recorded within “Other operating expenses”. This applies in the same way to the two models.
The useful life of these assets is approximately the same as the length of the concession arrangement.
Intangible assets
The Company recognizes an intangible asset to the extent that it receives a right to charge final customers for the use of the infrastructure. This intangible asset is subject to the provisions of IAS 38 and is amortized linearly, taking into account the estimated period of commercial operation of the infrastructure which coincides with the concession period.
Once the infrastructure is in operation, the treatment of income and expense is as follows:
| - | Revenues from the updated annual revenue for the contracted concession, as well as revenues from operations and maintenance services are recognized in each period according to IFRS 15 “Revenue from contracts with Customers”. |
| - | Operating and maintenance costs and general overheads and administrative costs are recorded in accordance with the nature of the cost incurred (amount due) in each period. |
Financial asset
The Company recognizes a financial asset when demand risk is assumed by the grantor, to the extent that the concession holder has an unconditional right to receive payments for the asset. This asset is recognized at the fair value of the construction services provided, considering upgrade services in accordance with IFRS 15, if any.
The financial asset is subsequently recorded at amortized cost calculated according to the effective interest method, using a theoretical internal return rate specific to the asset. Revenue from operations and maintenance services is recognized in each period according to IFRS 15 “Revenue from contracts with Customers”.
Allowance for expected credit losses (financial assets)
According to IFRS 9, Atlantica recognises an allowance for expected credit losses (ECLs) for all debt instruments not held at fair value through profit or loss. ECLs are based on the difference between the contractual cash flows due in accordance with the contract and all the cash flows that the Company expects to receive.
There are two main approaches to applying the ECL model according to IFRS 9: the general approach which involves a three stage approach, and the simplified approach, which can be applied to trade receivables, contract assets and lease receivables. Atlantica applies the simplified approach. Under this approach, there is no need to monitor for significant increases in credit risk and entities will be required to measure lifetime expected credit losses at the end of each reporting period.
The key elements of the ECL calculations, based on external sources of information, are the following:
| - | the Probability of Default (“PD”) is an estimate of the likelihood of default over a given time horizon. Atlantica calculates PD based on Credit Default Swaps spreads (“CDS”); |
| - | the Exposure at Default (“EAD”) is an estimate of the exposure at a future default date; |
| - | the Loss Given Default (“LGD”) is an estimate of the loss arising in the case where a default occurs at a given time. It is based on the difference between the contractual cash flows due and those that the Company would expect to receive. It is expressed as a percentage of the EAD. |
| b) | Property, plant and equipment under IAS 16 |
Property, plant and equipment is measured at historical cost, including all expenses directly attributable to the acquisition, less depreciation and impairment losses, with the exception of land, which is presented net of any impairment losses. Such cost includes the cost of replacing part of the plant and equipment and borrowing costs for long-term installation projects if the recognition criteria are met. Repair and maintenance costs are recognized in profit or loss as incurred.
Depreciation is calculated on a straight-line basis over the estimated useful lives of the assets.
The Company reviews the estimated residual values and expected useful lives of assets at least annually. In particular, the Company considers the impact of health, safety and environmental legislation in its assessment of expected useful lives and estimated residual values.
An item of property, plant and equipment and any significant part initially recognized is derecognized upon disposal (i.e., at the date the recipient obtains control) or when no future economic benefits are expected from its use or disposal. Any gain or loss arising on derecognition of the asset (calculated as the difference between the net disposal proceeds and the carrying amount of the asset) is included in the statement of profit or loss when the asset is derecognized.
| c) | Rights of use under IFRS 16 |
The Company assesses at contract inception whether a contract is, or contains, a lease. That is, if the contract conveys the right to control the use of an identified asset for a period of time in exchange for consideration.
Company as a lessee:
The Company applies a single recognition and measurement approach for all leases, except for short-term leases and leases of low-value assets. The Company recognizes lease liabilities to make lease payments and right-of-use assets representing the right to use the underlying assets.
Main right of use agreements correspond to land rights. The Company recognizes right-of-use assets at the commencement date of the lease (i.e. the date the underlying asset is available for use). Right-of-use assets are measured at cost, less any accumulated depreciation and impairment losses, and adjusted for any remeasurement of lease liabilities (Note 2.12). The cost of right-of-use assets includes the amount of lease liabilities recognised, initial direct costs incurred, and lease payments made at or before the commencement date less any lease incentives received. Right-of-use assets are depreciated on a straight-line basis over the shorter of the lease term and the estimated useful lives of the assets.
| d) | Other intangible assets |
Other intangible assets acquired separately are measured on initial recognition at cost. The cost of intangible assets acquired in a business combination is their fair value at the date of acquisition. Following initial recognition, intangible assets are carried at cost less any accumulated amortization and accumulated impairment losses. Intangible assets are amortized over the useful economic life and assessed for impairment whenever there is an indication that the intangible asset may be impaired.
An intangible asset is derecognised upon disposal (i.e., at the date the recipient obtains control) or when no future economic benefits are expected from its use or disposal. Any gain or loss arising upon derecognition of the asset (calculated as the difference between the net disposal proceeds and the carrying amount of the asset) is included in the statement of profit or loss.
Research and development costs:
Research costs are expensed as incurred. Development expenditures on an individual project are recognised as an intangible asset when the Company can demonstrate:
| - | the technical feasibility of completing the intangible asset so that the asset will be available for use or sale |
| - | its intention to complete and its ability and intention to use or sell the asset |
| - | how the asset will generate future economic benefits |
| - | the availability of resources to complete the asset |
| - | the ability to measure reliably the expenditure during development. |
Following initial recognition of the development expenditure as an asset, the asset is carried at cost less any accumulated amortization and accumulated impairment losses. Amortization of the asset begins when development is complete, and the asset is available for use. It is amortized over the period of expected future benefit. During the period of development, the asset is tested for impairment annually.
| e) | Asset impairment |
Atlantica reviews its contracted concessional, PP&E and other intangible assets to identify any indicators of impairment at least annually, except for ECL assessment for financial assets which is discussed above. When impairment indicators exist, the Company calculates the recoverable amount of the asset.
The recoverable amount of an asset is the higher of its fair value less costs to sell and its value in use, defined as the present value of the estimated future cash flows to be generated by the asset. In the event that the asset does not generate cash flows independently of other assets, the Company calculates the recoverable amount of the Cash Generating Unit (‘CGU’) to which the asset belongs.
When the carrying amount of the CGU to which these assets belong is higher than its recoverable amount, the assets are impaired.
Assumptions used to calculate value in use include a discount rate and projections considering real data based in the contracts terms and projected changes in both selling prices and costs. The discount rate is estimated by Management, to reflect both changes in the value of money over time and the risks associated with the specific CGU.
For contracted concessional assets, with a defined useful life and with a specific financial structure, cash flow projections until the end of the project are considered and no relevant terminal value is assumed.
Contracted concessional assets have a contractual structure that permits the Company to estimate quite accurately the costs of the project and revenue during the life of the project.
Projections take into account real data based on the contract terms and fundamental assumptions based on specific reports prepared internally and third-party reports, assumptions on demand and assumptions on production. Additionally, assumptions on macro-economic conditions are taken into account, such as inflation rates, future interest rates, etc. and sensitivity analyses are performed over all major assumptions which can have a significant impact in the value of the asset.
Cash flow projections of CGUs are calculated in the functional currency of those CGUs and are discounted using rates that take into consideration the risk corresponding to each specific country and currency.
Taking into account that in most CGUs the specific financial structure is linked to the financial structure of the projects that are part of those CGUs, the discount rate used to calculate the present value of cash-flow projections is based on the weighted average cost of capital (WACC) for the type of asset, adjusted, if necessary, in accordance with the business of the specific activity and with the risk associated with the country where the project is located.
In any case, sensitivity analyses are performed, especially in relation to the discount rate used and fair value changes in the main business variables, in order to ensure that possible changes in the estimates of these items do not impact the recovery of recognized assets.
In the event that the recoverable amount of an asset is lower than its carrying amount, an impairment charge for the difference would be recorded in the profit and loss statement under the item “Depreciation, amortization and impairment charges”.
An assessment is made at each reporting date to determine whether there is an indication that previously recognized impairment losses no longer exist or have decreased. If such indication exists, the Company estimates the CGU’s recoverable amount. A previously recognized impairment loss is reversed only if there has been a change in the assumptions used to determine the asset’s recoverable amount since the last impairment loss was recognized. The reversal is limited so that the carrying amount of the asset does not exceed its recoverable amount, nor exceed the carrying amount that would have been determined, net of depreciation, had no impairment loss been recognized for the asset in prior years. Such reversal is recognized in the profit and loss statement.
| 2.4. | Revenue recognition |
According to IFRS 15, Revenue from Contracts with Customers, the Company assesses the goods and services promised in the contracts with the customers and identifies as a performance obligation each promise to transfer to the customer a good or service (or a bundle of goods or services).
In the case of contracts related to intangible or financial assets under IFRIC 12, the performance obligation of the Company is the operation of the asset. The contracts between the parties set the price of the service in an orderly transaction and therefore corresponds to the fair value of the service provided. The services is satisfied over time. The same conclusion applies to concessional assets that are classified as tangible assets under IAS 16 or leases under IFRS 16. All of the transaction prices of assets under IFRIC 12 are fixed and included as part of the long-term PPAs of the Company as disclosed in Note 27.
In the case of financial asset under IFRIC 12, the financial asset accounts for the payments to be received from the client over the residual life of the contract, discounted at a theoretical internal rate of return for the project. In each period, the financial asset is reduced by the amounts received from the client and increased by any capital expenditure that the project may incur and by the effect of unwinding the discount of the financial asset at the theoretical internal rate of return. The increase of the financial asset deriving from the unwinding of the discount of the financial asset is recorded as revenue in each period. Revenue will therefore differ from the actual billings made to the client in each period.
In the case of Spain, according to Royal Decree 413/2014, solar electricity producers receive: (i) the market price for the power they produce, (ii) a payment based on the standard investment cost for each type of plant (without any relation whatsoever to the amount of power they generate) and (iii) an “operating payment” (in €/MWh produced). The principle driving this economic regime is that the payments received by a renewable energy producer should be equivalent to the costs that they are unable to recover on the electricity pool market where they compete with non-renewable technologies. This economic regime seeks to allow a “well-run and efficient enterprise” to recover the costs of building and running a plant, plus a reasonable return on investment (project investment rate of return). Some of the Company´s assets in Spain are receiving a remuneration based on a 7.09% reasonable rate of return until December 31, 2025 while others are receiving a remuneration based on a 7.398% reasonable rate of return until December 31, 2031.
| 2.5. | Loans and Accounts Receivable |
Loans and accounts receivable are non-derivative financial assets with fixed or determinable payments, not listed on an active market.
In accordance with IFRIC 12, certain assets under concessions qualify as financial assets and are recorded as is described in Note 2.3. Pursuant to IFRS 9, an impairment loss is recognized if the carrying amount of these assets exceeds the present value of future cash flows discounted at the initial effective interest rate.
Loans and accounts receivable are initially recognized at fair value plus transaction costs and are subsequently measured at amortized cost in accordance with the effective interest rate method. Interest calculated using the effective interest rate method is recognized as financial income within the consolidated statement of profit or loss
| 2.6. | Derivative Financial Instruments and Hedging Activities |
Derivatives are recognized at fair value in the statement of financial position. The Company maintains both derivatives designated as hedging instruments in hedging relationships, and derivatives to which hedge accounting is not applied.
When hedge accounting is applied, hedging strategy and risk management objectives are documented at inception, as well as the relationship between hedging instruments and hedged items. Effectiveness of the hedging relationship needs to be assessed on an ongoing basis. Effectiveness tests are performed prospectively at inception and at each reporting date. The Company analyses on each date if all these requirements are met:
| - | there is an economic relationship between the hedged item and the hedging instrument; |
| - | the effect of credit risk does not dominate the value changes that result from that economic relationship; and |
| - | the hedge ratio of the hedging relationship is the same as that resulting from the quantity of the hedged item that the Company actually hedges and the quantity of the hedging instrument that the Company uses to hedge that quantity of hedged item. |
Ineffectiveness is measured following the accumulated dollar offset method.
In all cases, current Company´s hedging relationships are considered cash flow hedges. Under this model, the effective portion of changes in fair value of derivatives designated as cash flow hedges are recorded temporarily in equity and are subsequently reclassified from equity to profit or loss in the same period or periods during which the hedged item affects profit or loss. Any ineffective portion of the hedged transaction is recorded in the consolidated profit and loss statement as it occurs.
When interest rate options are designated as hedging instruments, the time value is excluded from the hedging instrument as permitted by IFRS 9. Changes in the effective portion of the intrinsic are recorded in equity and subsequently reclassified from equity to profit or loss in the same period or periods during which the hedged item affects profit or loss. Any ineffectiveness is recorded as financial income or expense as it occurs. Changes in options time value is recorded as cost of hedging. More precisely, considering that the hedged items are, in all cases, time period hedged item, changes in time value is recognized in other comprehensive income to the extent that it relates to the hedged item. The time value at the date of designation of the option as a hedging instrument, to the extent that it relates to the hedged item, is amortized on a systematic and rational basis over the period during which the hedge adjustment for the option’s intrinsic value could affect profit or loss.
When the hedging instrument matures or is sold, or when it no longer meets the requirements to apply hedge accounting, accumulated gains and losses recorded in equity remain as such until the forecast transaction is ultimately recognized in the profit and loss statement. However, if it becomes unlikely that the forecast transaction will actually take place, the accumulated gains and losses in equity are recognized immediately in the profit and loss statement.
Any change in fair value of derivatives instruments to which hedge accounting is not applied is directly recorded in the profit and loss statement.
| 2.7. | Fair Value Estimates |
Financial instruments measured at fair value are presented in accordance with the following level classification based on the nature of the inputs used for the calculation of fair value:
| - | Level 1: Inputs are quoted prices in active markets for identical assets or liabilities. |
| - | Level 2: Fair value is measured based on inputs other than quoted prices included within Level 1 that are observable for the asset or liability, either directly (i.e. as prices) or indirectly (i.e. derived from prices). |
| - | Level 3: Fair value is measured based on unobservable inputs for the asset or liability. |
In the event that prices cannot be observed, management shall make its best estimate of the price that the market would otherwise establish based on proprietary internal models which, in the majority of cases, use data based on observable market parameters as significant inputs (Level 2) but occasionally use market data that is not observed as significant inputs (Level 3). Different techniques can be used to make this estimate, including extrapolation of observable market data. The best indication of the initial fair value of a financial instrument is the price of the transaction, except when the value of the instrument can be obtained from other transactions carried out in the market with the same or similar instruments, or valued using a valuation technique in which the variables used only include observable market data, mainly interest rates. Differences between the transaction price and the fair value based on valuation techniques that use data that is not observed in the market, are not initially recognized in the profit and loss statement.
Atlantica derivatives correspond primarily to the interest rate swaps designated as cash flow hedges, which are classified as Level 2.
Description of the valuation method
Interest rate swap valuations consist in valuing separately the swap part of the contract and the credit risk. The methodology used by the market and applied by Atlantica to value interest rate swaps is to discount the expected future cash flows according to the parameters of the contract. Variable interest rates, which are needed to estimate future cash flows, are calculated using the curve for the corresponding currency and extracting the implicit rates for each of the reference dates in the contract. These estimated flows are discounted with the swap zero curve for the reference period of the contract.
The effect of the credit risk on the valuation of the interest rate swaps depends on the future settlement. If the settlement is favorable for the Company, the counterparty credit spread will be incorporated to quantify the probability of default at maturity. If the expected settlement is negative for the Company, its own credit risk will be applied to the final settlement.
Classic models for valuing interest rate swaps use deterministic valuation of the future of variable rates, based on future outlooks. When quantifying credit risk, this model is limited by considering only the risk for the current paying party, ignoring the fact that the derivative could change sign at maturity. A payer and receiver swaption model is proposed for these cases. This enables the associated risk in each swap position to be reflected. Thus, the model shows each agent’s exposure, on each payment date, as the value of entering into the ‘tail’ of the swap, i.e. the live part of the swap.
Variables (Inputs)
Interest rate derivative valuation models use the corresponding interest rate curves for the relevant currency and underlying reference in order to estimate the future cash flows and to discount them. Market prices for deposits, futures contracts and interest rate swaps are used to construct these curves. Interest rate options (caps and floors) also use the volatility of the reference interest rate curve.
To estimate the credit risk of the counterparty, the credit default swap (CDS) spreads curve is obtained in the market for important individual issuers. For less liquid issuers, the spreads curve is estimated using comparable CDSs or based on the country curve. To estimate proprietary credit risk, prices of debt issues in the market and CDSs for the sector and geographic location are used.
The fair value of the financial instruments that results from the aforementioned internal models takes into account, among other factors, the terms and conditions of the contracts and observable market data, such as interest rates, credit risk and volatility. The valuation models do not include significant levels of subjectivity, since these methodologies can be adjusted and calibrated, as appropriate, using the internal calculation of fair value and subsequently compared to the corresponding actively traded price. However, valuation adjustments may be necessary when the listed market prices are not available for comparison purposes.
| 2.8. | Trade and Other Receivables |
Trade and other receivables are amounts due from customers for sales in the normal course of business. They are recognized initially at fair value and subsequently measured at amortized cost using the effective interest rate method, less allowance for doubtful accounts. Trade receivables due in less than one year are carried at their face value at both initial recognition and subsequent measurement, provided that the effect of not discounting cash flows is not significant.
An allowance for doubtful accounts is recorded when there is objective evidence that the Company will not be able to recover all amounts due as per the original terms of the receivables. The Company has established a provision matrix that is based on its historical credit loss experience, adjusted for forward-looking factors specific to the debtors and the economic environment.
| 2.9. | Cash and Cash Equivalents |
Cash and cash equivalents include cash in hand, cash in bank and other highly-liquid current investments with an original maturity of three months or less which are held for the purpose of meeting short-term cash commitments.
| 2.10. | Assets held for sale |
The Company classifies non-current assets and disposal groups as held for sale if their carrying amounts will be recovered principally through a sale transaction rather than through continuing use. Non-current assets and disposal groups classified as held for sale are measured at the lower of their carrying amount and fair value less costs to sell. Costs to sell are the incremental costs directly attributable to the disposal of an asset (disposal group), excluding finance costs and income tax expense.
The criteria for held for sale classification is regarded as met only when the sale is highly probable, and the asset or disposal group is available for immediate sale in its present condition. Actions required to complete the sale should indicate that it is unlikely that significant changes to the sale will be made or that the decision to sell will be withdrawn. Management must be committed to the plan to sell the asset and the sale expected to be completed within one year from the date of the classification.
Property, plant and equipment and intangible assets are not depreciated or amortised once classified as held for sale.
Assets and liabilities classified as held for sale are presented separately as current items in the statement of financial position.
| 2.11. | Grants |
Grants are recognized at fair value when it is considered that there is a reasonable assurance that the grant will be received and that the necessary qualifying conditions, as agreed with the entity assigning the grant, will be adequately complied with.
Grants are recorded as liabilities in the consolidated statement of financial position and are recognized in “Other operating income” in the consolidated profit and loss statement based on the period necessary to match them with the costs they intend to compensate.
In addition, as described in Note 2.12 below, grants correspond also to loans with interest rates below market rates, for the initial difference between the fair value of the loan and the proceeds received.
| 2.12. | Loans and Borrowings |
Loans and borrowings are initially recognized at fair value, net of transaction costs incurred. Borrowings are subsequently measured at amortized cost and any difference between the proceeds initially received (net of transaction costs incurred in obtaining such proceeds) and the repayment value is recognized in the consolidated profit and loss statement over the duration of the borrowing using the effective interest rate method.
In the case of modification of terms of loans and borrowings, the Company determines whether the modification constitutes an exchange or an extinguishment of the debt instrument. In determining whether there is an exchange, the Company evaluates whether the redemption of the old debt and the issuance of new debt were negotiated in contemplation of one another (qualitative assessment) and performs the 10 per cent test to determine if the terms of the modified debt are substantially different (the net present value of the modified cash flows, including any fees paid to net of any fees received from the lenders, is higher than 10% different from the net present value of the remaining cash flows of the liability prior to the modification, both discounted at the original effective interest rate). When the terms of the modified liability are substantially different, the modification is accounted for as an extinguishment of the original liability and recognition of a new liability.
Loans with interest rates below market rates are initially recognized at fair value in liabilities and the difference between proceeds received from the loan and its fair value is initially recorded within “Grants and Other liabilities” in the consolidated statement of financial position, and subsequently recorded in “Other operating income” in the consolidated profit and loss statement when the costs financed with the loan are expensed.
Lease liabilities are recognized by the Company at the commencement date of the lease at the present value of lease payments to be made over the lease term. The lease payments include the exercise price of a purchase option reasonably certain to be exercised by the Company and payments of penalties for terminating the lease, if the lease term reflects the Company exercising the option to terminate. In calculating the present value of lease payments, the Company uses its incremental borrowing rate at the lease commencement date considering that the interest rate implicit in the lease is not readily determinable.
| 2.13. | Bonds and notes |
The Company initially recognizes ordinary notes at fair value, net of issuance costs incurred. Subsequently, notes are measured at amortized cost until settlement upon maturity. Any other difference between the proceeds obtained (net of transaction costs) and the redemption value is recognized in the consolidated profit and loss statement over the term of the debt using the effective interest rate method.
Convertible bonds or notes or debt issued with conversion features must be separated into liability and equity components if the feature meets the equity classification conditions in IAS 32. The issuer separates the instrument into its components by determining the fair value of the liability component and then deducting that amount from the fair value of the instrument as a whole; the residual amount is allocated to the equity component. If the equity conversion feature does not satisfy the equity classification conditions in IAS 32, it is bifurcated as an embedded derivative unless the issuer elects to apply the fair value option to the convertible debt. The embedded derivative is initially recognized at fair value and classified as derivatives in the statement of financial position. Changes in the fair value of the embedded derivatives are subsequently accounted for directly through the profit and loss statement. The debt element of the bond or note (the host contract), will be initially valued as the difference between the consideration received from the holders for the instrument and the value of the embedded derivative, and thereafter at amortized cost using the effective interest method.
| 2.14. | Income Taxes |
Current income tax expense is calculated on the basis of the tax laws in force as of the date of the consolidated statement of financial position in the countries in which the subsidiaries and associates operate and generate taxable income.
Deferred income tax is calculated in accordance with the liability method, based upon the temporary differences arising between the carrying amount of assets and liabilities and their tax base. Deferred tax assets and liabilities are measured at the tax rates that are expected to apply in the year when the asset is realized or the liability is settled, based on tax rates (and tax laws) that have been enacted or substantively enacted at the reporting date.
Deferred tax assets are recognized to the extent that it is probable that taxable profit will be available against which the deductible temporary differences, and the carry forward of unused tax credits and unused tax losses can be utilized.
| 2.15. | Trade Payables and Other Liabilities |
Trade payables are obligations arising from purchases of goods and services in the ordinary course of business and are recognized initially at fair value and are subsequently measured at their amortized cost using the effective interest method. Other liabilities are obligations not arising in the normal course of business and which are not treated as financing transactions. Advances received from customers are recognized as “Trade payables and other current liabilities”.
| 2.16. | Foreign Currency Transactions |
The Consolidated Financial Statements are presented in U.S. dollars, which is Atlantica’s functional and presentation currency. Financial statements of each subsidiary within the Company are measured in the currency of the principal economic environment in which the subsidiary operates, which is the subsidiary’s functional currency.
Transactions denominated in a currency different from the entity’s functional currency are translated into the entity’s functional currency applying the exchange rates in force at the time of the transactions. Foreign currency gains and losses that result from the settlement of these transactions and the translation of monetary assets and liabilities denominated in foreign currency at the year-end rates are recognized in the consolidated profit and loss statement, unless they are deferred in equity, as occurs with cash flow hedges and net investment in foreign operations hedges.
Assets and liabilities of subsidiaries with a functional currency different from the Company’s reporting currency are translated to U.S. dollars at the exchange rate in force at the closing date of the financial statements. Income and expenses are translated into U.S. dollars using the average annual exchange rate, which does not differ significantly from using the exchange rates of the dates of each transaction. The difference between equity translated at the historical exchange rate and the net financial position that results from translating the assets and liabilities at the closing rate is recorded in equity under the heading “Accumulated currency translation differences”.
Results of companies carried under the equity method are translated at the average annual exchange rate.
| 2.17. | Equity |
The Company has recyclable balances in its equity, corresponding mainly to hedge reserves and translation differences arising from currency conversion in the preparation of these Consolidated Financial Statements. These balances have been presented separately in equity.
Ordinary shares are classified as equity. Any excess above the par value of shares received upon issuance of those shares is classified as share premium in accordance with the UK Companies Act 2006.
Capital reserves is mainly the result of reductions of the share premium account which have increased distributable reserves upon confirmation from the High Court in the UK, pursuant to the Companies Act 2006.
Non-controlling interest represents interest of other partners in subsidiaries included in these Consolidated Financial Statements which are not fully owned by Atlantica as of the dates presented.
The costs of issuing equity instruments are accounted for as a deduction from equity.
| 2.18. | Provisions and Contingencies |
Provisions are recognized when:
| - | there is a present obligation, either legal or constructive, as a result of past events; |
| - | it is more likely than not that there will be a future outflow of resources to settle the obligation; and the amount has been reliably estimated. |
Provisions are measured at the present value of the expected outflows required to settle the obligation. The discount rate used is a current pre-tax rate that reflects, when appropriate, the risks specific to the liability. The increase in the provision due to the passage of time is then recognized as a financial expense. The balance of provisions disclosed in the Notes reflects management’s best estimate of the potential exposure as of the date of preparation of the Consolidated Financial Statements.
Contingent liabilities are possible obligations, existing obligations with low probability of a future outflow of economic resources and existing obligations where the future outflow cannot be reliably estimated. Contingences are not recognized in the consolidated statements of financial position unless they have been acquired in a business combination.
Some companies of Atlantica have dismantling provisions, which are intended to cover future expenditure related to the dismantlement of the plants in situations where it is likely to be settled with an outflow of resources in the long term (over 5 years).
Such provisions are recognized when the obligation for dismantling, removing and restoring the site on which the plant is located, is incurred, which is usually during the construction period. The provision is measured in accordance with IAS 37, “Provisions, Contingent Liabilities and Contingent Assets” and is recorded as a liability under the heading “Grants and other liabilities” of the Financial Statements, and the corresponding entry as part of the cost of the plant under the heading “Contracted concessional assets.” The estimated future costs of dismantling are reviewed annually if conditions have changed and adjusted appropriately. The impact of changes in the estimate of future costs or in the timing of when such costs will be incurred, on the dismantling provision, is recorded against an increase or decrease of the cost of the plant.
| 2.19. | Earnings per share |
Basic earnings per share is calculated by dividing the profit for the period attributable to ordinary equity holders of the parent by the weighted average number of ordinary shares outstanding during the period.
Diluted earnings per share is calculated by dividing the profit for the period attributable to ordinary equity holders of the parent by the weighted average number of ordinary shares outstanding during the period plus the weighted average number of ordinary shares that would be issued on conversion of all the dilutive potential ordinary shares into ordinary shares.
| 2.20. | Significant judgements and estimates |
Some of the accounting policies applied require the application of significant judgement by management to select the appropriate assumptions to determine these estimates. These assumptions and estimates are based on the historical experience, advice from experienced consultants, forecasts and other circumstances and expectations as of the close of the financial period. The assessment is considered in relation to the global economic situation of the industries and regions where the Company operates, taking into account future development of the businesses of the Company. By their nature, these judgements are subject to an inherent degree of uncertainty; therefore, actual results could materially differ from the estimates and assumptions used. In such cases, the carrying values of assets and liabilities are adjusted.
The most critical accounting policies, which reflects significant management estimates and judgement to determine amounts in these Consolidated Financial Statements, are as follows:
Estimates:
| - | Impairment of contracted concessional, PP&E and other intangible assets. |
Impairment exists when the carrying value of an asset or cash generating unit exceeds its recoverable amount, which is the higher of its fair value less costs of disposal and its value in use. The value in use calculation is based on a discounted cash flow model, which is sensitive to the discount rate used as well as projected cash-flows (Note 6).
The significant assumptions which required substantial estimates used in management’s impairment calculation are discount rates and projections considering real data based on contract terms and projected changes in selling prices, energy generation and costs.
| - | Recoverability of deferred tax assets. |
Deferred tax assets are recognised for unused tax losses to the extent that it is probable that taxable profit will be available against which the losses can be utilised. Significant management estimates are required to determine the amount of deferred tax assets that can be recognised, based upon the likely timing and the level of future taxable profits together with future tax planning strategies (Note 19).
| - | Fair value of derivative financial instruments |
When the fair values of financial assets and financial liabilities recorded in the statement of financial position cannot be measured based on quoted prices in active markets, their fair value is measured using valuation techniques including the discounted cash flow model. The inputs to these models are taken from observable markets where possible, but where this is not feasible, a degree of estimate is required in establishing fair values. Estimates include considerations of inputs such as liquidity risk, credit risk and volatility. Changes in assumptions relating to these factors could affect the reported fair value of financial instruments (Note 10).
| - | Fair value of identifiable assets and liabilities arising from a business combination |
The assets acquired and liabilities assumed on a business combination are recognised at the fair values of the underlying items. The estimates that have a significant risk of causing a material adjustment to the carrying amounts of the assets and liabilities are the ones considered when performing impairment review of operating assets (see above).
Judgements:
| - | Assessment of assets agreements. |
By evaluating the terms and conditions of each assets agreement, the Company determines the accounting category to which the asset belongs, e.g. IAS 16, IFRIC 12 or IFRS 16 (Note 2.3.).
| - | Assessment of control. |
Judgement is required in determining the nature of Atlantica´s interest in another entity and in determining if it has control, joint control or significant influence over it (Note 2.2.).
As of the date of preparation of these Consolidated Financial Statements, no relevant changes in the estimates made are anticipated and, therefore, no significant changes in the value of the assets and liabilities recognized at December 31, 2023, are expected.
Although these estimates and assumptions are being made using all available facts and circumstances, it is possible that future events may require management to amend such estimates and assumptions in future periods. Changes in accounting estimates are recognized prospectively, in accordance with IAS 8, in the consolidated profit and loss statement of the year in which the change occurs.
| 3. | Financial Risk Management |
Atlantica’s activities are exposed to various financial risks: market risk (including currency risk and interest rate risk), credit risk and liquidity risk. Risk is managed by the Company’s Risk Management and Finance Departments, which are responsible for identifying and evaluating financial risks quantifying them by project, region and company, in accordance with mandatory internal management rules. The internal management rules provide written policies for the management of overall risk, as well as for specific areas. The internal management policies of the Company also define the use of hedging instruments and derivatives and the investment of excess cash.
| a) | Market risk |
The Company is exposed to market risk, such as movement in foreign exchange rates and interest rates. All of these market risks arise in the normal course of business and the Company does not carry out speculative operations. For the purpose of managing these risks, the Company uses a series of interest rate swaps and options, and currency options. None of the derivative contracts signed has an unlimited loss exposure.
| - | Interest rate risk |
Interest rate risk arises when the Company’s activities are exposed to changes in interest rates, which arises from financial liabilities at variable interest rates. The main interest rate exposure for the Company relates to the variable interest rate with reference to the Euribor and SOFR. To minimize the interest rate risk, the Company primarily uses interest rate swaps and interest rate options (caps), which, in exchange for a fee, offer protection against an increase in interest rates. The Company does not use derivatives for speculative purposes.
As of December 31, 2023, approximately 92% of the Project debt of the Company and approximately 94% of the Corporate debt either has fixed interest rates or has been hedged with swaps or caps. The Revolving Credit Facility of the Company has variable interest rates and is not hedged (Note 15).
In connection with the interest rate derivative positions of the Company, the most significant impacts on these Consolidated Financial Statements are derived from the changes in EURIBOR and SOFR, which represent the reference interest rate for most of the debt of the Company. In the event that EURIBOR and SOFR had risen by 25 basis points as of December 31, 2023, with the rest of the variables remaining constant, the effect in the consolidated profit and loss statement would have been a loss of $0.7 million (a loss of $1.3 million in 2022) and a gain in hedging reserves of $17.6 million ($18.4 million in 2022). The gain in hedging reserves would be mainly due to an increase in the fair value of interest rate swaps designated as hedges.
A breakdown of the interest rates derivatives as of December 31, 2023 and 2022, is provided in Note 10.
| - | Currency risk |
The main cash flows in the entities included in these Consolidated Financial Statements are cash collections arising from long-term contracts with clients and debt payments arising from project finance repayment. Given that financing of the projects is typically closed in the same currency in which the contract with client is signed, a natural hedge exists for the main operations of the Company.
In addition, to further mitigate this exposure, the Company policy is to contract currency options with leading financial institutions, which guarantee a minimum Euro-U.S. dollar exchange rate on the net distributions expected from solar assets in Europe. The net Euro exposure is 100% hedged for the coming 12 months and 75% for the following 12 months on a rolling basis.
Although the Company hedges cash-flows in euros, fluctuations in the value of the euro in relation to the U.S. dollar may affect its operating results. For example, revenue in euro-denominated companies could decrease when translated to U.S. dollars at the average foreign exchange rate solely due to a decrease in the average foreign exchange rate, in spite of revenue in the original currency being stable. Fluctuations in the value of the South African rand, the Colombian peso and the Uruguayan peso with respect to the U.S. dollar may also affect the operating results of the Company. Apart from the impact of these translation differences, the exposure of the profit and loss statement of the Company to fluctuations of foreign currencies is limited, as the financing of projects is typically denominated in the same currency as that of the contracted revenue agreement.
| b) | Credit risk |
The Company considers that it has a limited credit risk with clients as revenues primarily derive from power purchase agreements with electric utilities and state-owned entities. In addition, the diversification by geography and business sector helps to diversify credit risk exposure by diluting the exposure of the Company to a single client.
| c) | Liquidity risk |
Atlantica’s liquidity and financing policy is intended to ensure that the Company maintains sufficient funds to meet its financial obligations as they fall due.
Project finance borrowing permits the Company to finance the project through project debt and thereby insulate the rest of its assets from such credit exposure. The Company incurs in project-finance debt on a project-by-project basis.
The repayment profile of each project is established on the basis of the projected cash flow generation of the business. This ensures that sufficient financing is available to meet deadlines and maturities, which mitigates the liquidity risk significantly. In addition, the Company maintains a periodic communication with its lenders and regular monitoring of debt covenants and minimum ratios.
Corporate and Project debt repayment schedules are disclosed in Note 15 and 16, respectively.
| d) | Capital risk management |
The Company manages its capital to ensure that entities in the Company will be able to continue as a going concern while maximising the return to shareholders through the optimisation of the debt and equity balance. The capital structure of the Company consists of net debt (borrowings disclosed in Notes 15 and 16 after deducting cash and bank balances disclosed in Note 13) and equity of the Company (comprising issued capital, reserves and accumulated deficit). The board of directors review the capital structure on a regular basis. As part of this review, the Company considers the cost of capital and the risks associated with each class of capital.
| e) | Gearing ratio |
The gearing ratio at the year-end is as follows:
|
Balance as of $’000 |
Balance as of $’000 |
|||||||
| Debt | 5,404,098 | 5,570,252 | ||||||
| Cash and cash equivalents | 448,301 | 600,990 | ||||||
| Net Debt | 4,955,797 | 4,969,262 | ||||||
| Equity | 1,588,809 | 1,789,047 | ||||||
| Net debt to equity ratio | 312% | 278% | ||||||
Corporate and Project debt repayment schedules are disclosed in Note 15 and 16, respectively.
| 4. | Financial information by segment |
Atlantica’s segment structure reflects how management currently makes financial decisions and allocates resources. Its operating and reportable segments are based on the following geographies where the contracted concessional assets are located: North America, South America and EMEA. In addition, based on the type of business, as of December 31, 2023, the Company had the following business sectors: Renewable energy, Efficient natural gas and heat, Transmission lines and Water.
Atlantica’s Chief Operating Decision Maker (CODM), which is the CEO, assesses the performance and assignment of resources according to the identified operating segments. The CODM considers the revenue as a measure of the business activity and the Adjusted EBITDA as a measure of the performance of each segment. Adjusted EBITDA is calculated as profit/(loss) for the year attributable to the parent company, after adding back loss/(profit) attributable to non-controlling interest, income tax expense, financial expense (net), depreciation, amortization and impairment charges of entities included in these Consolidated Financial Statements and depreciation and amortization, financial expense and income tax of unconsolidated affiliates (pro rata of Atlantica´s equity ownership).
In order to assess performance of the business, the CODM receives reports of each reportable segment using revenue and Adjusted EBITDA. Net interest expense evolution is assessed on a consolidated basis. Financial expense and amortization are not taken into consideration by the CODM for the allocation of resources.
In the year ended December 31, 2023, Atlantica had four customers with revenues representing more than 10% of total revenue, three in the renewable energy and one in the efficient natural gas and heat business sectors. In the year ended December 31, 2022, Atlantica had three customers with revenues representing more than 10% of the total revenue, two in the renewable energy and one in the efficient natural gas and heat business sectors.
| a) | The following tables show Revenues and Adjusted EBITDA by operating segments and business sectors for the years 2023 and 2022: |
|
Revenue $’000 |
Adjusted EBITDA $’000 |
||||||
| For the year ended December 31, | For the year ended December 31, | ||||||
| Geography | 2023 | 2022 | 2023 | 2022 | |||
| North America | 424,888 | 405,047 | 319,264 | 309,988 | |||
| South America | 188,127 | 166,441 | 146,722 | 126,551 | |||
| EMEA | 486,879 | 530,541 | 328,936 | 360,561 | |||
| Total | 1,099,894 | 1,102,029 | 794,922 | 797,100 | |||
|
Revenue $’000 |
Adjusted EBITDA $’000 |
||||||||||||
| For the year ended December 31, | For the year ended December 31, | ||||||||||||
| Business sector | 2023 | 2022 | 2023 | 2022 | |||||||||
| Renewable energy | 802,756 | 821,377 | 575,704 | 588,016 | |||||||||
| Efficient natural gas & heat | 118,417 | 113,591 | 87,393 | 84,560 | |||||||||
| Transmission lines | 123,476 | 113,273 | 96,043 | 88,010 | |||||||||
| Water | 55,245 | 53,788 | 35,782 | 36,514 | |||||||||
| Total | 1,099,894 | 1,102,029 | 794,922 | 797,100 | |||||||||
The reconciliation of segment Adjusted EBITDA with the loss attributable to the parent company is as follows:
| For the year ended December 31, | ||||||||
|
2023 $’000 |
2022 $’000 |
|||||||
| Profit/(loss) attributable to the Company | 43,380 | (5,443) | ||||||
| Profit/(loss) attributable to non-controlling interest | (6,932) | 3,356 | ||||||
| Income tax expense/(income) | 790 | (9,689) | ||||||
| Financial expense, net | 317,974 | 310,934 | ||||||
| Depreciation, amortization, and impairment charges | 418,271 | 473,638 | ||||||
| Depreciation and amortization, financial expense and income tax expense of unconsolidated affiliates (pro rata of Atlantica´s equity ownership) | 21,439 | 24,304 | ||||||
| Total segment Adjusted EBITDA | 794,922 | 797,100 | ||||||
| b) | The assets and liabilities by geography and business sector at the end of 2023 and 2022 are as follows: |
Assets and liabilities by geography as of December 31, 2023:
| North America | South America | EMEA | Balance as of December 31, 2023 | ||||
| $’000 | $’000 | $’000 | $’000 | ||||
| Assets allocated | |||||||
| Contracted concessional, PP&E and other intangible assets | 3,063,019 | 1,184,599 | 2,956,649 | 7,204,267 | |||
| Investments carried under the equity method | 177,260 | 9,178 | 43,869 | 230,307 | |||
| Other current financial assets | 110,016 | 30,803 | 48,067 | 188,886 | |||
| Cash and cash equivalents (project companies) | 137,480 | 121,945 | 155,551 | 414,976 | |||
| Assets held for sale | 28,642 | - | - | 28,642 | |||
| Subtotal allocated | 3,516,417 | 1,346,525 | 3,204,136 | 8,067,078 | |||
| Unallocated assets | |||||||
| Other non-current assets | 297,577 | ||||||
| Other current assets (including cash and cash equivalents at holding company level) | 349,678 | ||||||
| Subtotal unallocated | 647,255 | ||||||
| Total assets | 8,714,333 |
| North America | South America | EMEA | Balance as of December 31, 2023 | ||||
| $’000 | $’000 | $’000 | $’000 | ||||
| Liabilities allocated | |||||||
| Long-term and short-term project debt | 1,629,278 | 808,481 | 1,881,501 | 4,319,260 | |||
| Grants and other liabilities | 945,888 | 36,307 | 251,613 | 1,233,808 | |||
| Subtotal allocated | 2,575,166 | 844,788 | 2,133,114 | 5,553,068 | |||
| Unallocated liabilities | |||||||
| Long-term and short-term corporate debt | 1,084,838 | ||||||
| Other non-current liabilities | 301,245 | ||||||
| Other current liabilities | 186,373 | ||||||
| Subtotal unallocated | 1,572,456 | ||||||
| Total liabilities | 7,125,524 | ||||||
| Equity unallocated | 1,588,809 | ||||||
| Total liabilities and equity unallocated | 3,161,265 | ||||||
| Total liabilities and equity | 8,714,333 |
Assets and liabilities by geography as of December 31, 2022:
| North America | South America | EMEA |
Balance as of
December 31, 2022
|
||||
| $’000 | $’000 | $’000 | $’000 | ||||
| Assets allocated | |||||||
| Contracted concessional, PP&E and other intangible assets | 3,167,490 | 1,241,879 | 3,073,889 | 7,483,259 | |||
| Investments carried under the equity method | 210,704 | 4,450 | 44,878 | 260,031 | |||
| Other current financial assets | 118,385 | 31,136 | 46,373 | 195,893 | |||
| Cash and cash equivalents (project companies) | 187,568 | 85,697 | 266,557 | 539,822 | |||
| Subtotal allocated | 3,684,147 | 1,363,162 | 3,431,697 | 8,479,005 | |||
| Unallocated assets | |||||||
| Other non-current assets | 325,893 | ||||||
| Other current assets (including cash and cash equivalents at holding company level) | 296,013 | ||||||
| Subtotal unallocated | 621,906 | ||||||
| Total assets | 9,100,911 |
| North America | South America | EMEA |
Balance as of
December 31, 2022
|
||||
| $’000 | $’000 | $’000 | $’000 | ||||
| Liabilities allocated | |||||||
| Long-term and short-term project debt | 1,713,125 | 841,906 | 1,998,021 | 4,553,052 | |||
| Grants and other liabilities | 994,874 | 25,031 | 232,608 | 1,252,513 | |||
| Subtotal allocated | 2,707,999 | 866,937 | 2,230,629 | 5,805,565 | |||
| Unallocated liabilities | |||||||
| Long-term and short-term corporate debt | 1,017,200 | ||||||
| Other non-current liabilities | 313,328 | ||||||
| Other current liabilities | 175,771 | ||||||
| Subtotal unallocated | 1,506,299 | ||||||
| Total liabilities | 7,311,864 | ||||||
| Equity unallocated | 1,789,047 | ||||||
| Total liabilities and equity unallocated | 3,295,346 | ||||||
| Total liabilities and equity | 9,100,911 |
Assets and liabilities by business sectors as of December 31, 2023:
| Renewable energy | Efficient natural gas & heat | Transmission lines | Water | Balance as of December 31, 2023 | |||||
| $’000 | $’000 | $’000 | $’000 | $’000 | |||||
| Assets allocated | |||||||||
| Contracted concessional, PP&E and other intangible assets | 5,798,818 | 460,766 | 777,360 | 167,323 | 7,204,267 | ||||
| Investments carried under the equity method | 189,672 | - | - | 40,635 | 230,307 | ||||
| Other current financial assets | 10,866 | 103,907 | 30,746 | 43,367 | 188,886 | ||||
| Cash and cash equivalents (project companies) | 299,987 | 35,098 | 58,004 | 21,887 | 414,976 | ||||
| Assets held for sale | - | 28,642 | - | - | 28,642 | ||||
| Subtotal allocated | 6,299,343 | 628,413 | 866,110 | 273,212 | 8,067,078 | ||||
| Unallocated assets | |||||||||
| Other non-current assets | 297,577 | ||||||||
| Other current assets (including cash and cash equivalents at holding company level) | 349,678 | ||||||||
| Subtotal unallocated | 647,255 | ||||||||
| Total assets | 8,714,333 |
| Renewable energy |
Efficient
natural gas
& heat
|
Transmission lines | Water | Balance as of December 31, 2023 | |||||
| $’000 | $’000 | $’000 | $’000 | $’000 | |||||
| Liabilities allocated | |||||||||
| Long-term and short-term project debt | 3,280,618 | 401,460 | 560,906 | 76,276 | 4,319,260 | ||||
| Grants and other liabilities | 1,185,487 | 32,916 | 12,884 | 2,521 | 1,233,808 | ||||
| Subtotal allocated | 4,466,105 | 434,376 | 573,790 | 78,797 | 5,553,068 | ||||
| Unallocated liabilities | |||||||||
| Long-term and short-term corporate debt | 1,084,838 | ||||||||
| Other non-current liabilities | 301,245 | ||||||||
| Other current liabilities | 186,373 | ||||||||
| Subtotal unallocated | 1,572,456 | ||||||||
| Total liabilities | 7,125,524 | ||||||||
| Equity unallocated | 1,588,809 | ||||||||
| Total liabilities and equity unallocated | 3,161,265 | ||||||||
| Total liabilities and equity | 8,714,333 |
Assets and liabilities by business sectors as of December 31, 2022:
| Renewable energy |
Efficient
natural gas
& heat
|
Transmission lines | Water | Balance as of December 31, 2022 | |||||
| $’000 | $’000 | $’000 | $’000 | $’000 | |||||
| Assets allocated | |||||||||
| Contracted concessional, PP&E and other intangible assets | 6,035,091 | 485,431 | 800,067 | 162,670 | 7,483,259 | ||||
| Investments carried under the equity method | 207,870 | 10,034 | - | 42,128 | 260,031 | ||||
| Other current financial assets | 6,706 | 116,366 | 30,582 | 42,240 | 195,893 | ||||
| Cash and cash equivalents (project companies) | 392,577 | 73,673 | 48,073 | 25,498 | 539,822 | ||||
| Subtotal allocated | 6,642,244 | 685,504 | 878,722 | 272,536 | 8,479,005 | ||||
| Unallocated assets | |||||||||
| Other non-current assets | 325,893 | ||||||||
| Other current assets (including cash and cash equivalents at holding company level) | 296,013 | ||||||||
| Subtotal unallocated | 621,906 | ||||||||
| Total assets | 9,100,911 |
| Renewable energy |
Efficient natural gas
& heat
|
Transmission lines | Water |
Balance as of
December 31,
2022
|
|||||
| $’000 | $’000 | $’000 | $’000 | $’000 | |||||
| Liabilities allocated | |||||||||
| Long-term and short-term project debt | 3,442,625 | 440,999 | 582,689 | 86,739 | 4,553,052 | ||||
| Grants and other liabilities | 1,211,878 | 32,138 | 6,040 | 2,457 | 1,252,513 | ||||
| Subtotal allocated | 4,654,503 | 473,137 | 588,729 | 89,196 | 5,805,565 | ||||
| Unallocated liabilities | |||||||||
| Long-term and short-term corporate debt | 1,017,200 | ||||||||
| Other non-current liabilities | 313,328 | ||||||||
| Other current liabilities | 175,771 | ||||||||
| Subtotal unallocated | 1,506,299 | ||||||||
| Total liabilities | 7,311,864 | ||||||||
| Equity unallocated | 1,789,047 | ||||||||
| Total liabilities and equity unallocated | 3,295,346 | ||||||||
| Total liabilities and equity | 9,100,911 |
| c) | The amount of depreciation, amortization and impairment charges recognized for the years ended December 31, 2023 and 2022 are as follows: |
| For the year ended December 31, | |||
| $’000 | |||
| Depreciation, amortization and impairment by geography | 2023 | 2022 | |
| North America | (125,725) | (182,159) | |
| South America | (77,855) | (80,039) | |
| EMEA | (214,691) | (211,440) | |
| Total | (418,271) | (473,638) | |
|
|
For the year ended December 31, | ||
| $’000 | |||
| Depreciation, amortization and impairment by business sectors |
2023 |
2022 |
|
| Renewable energy | (398,394) | (434,042) | |
| Efficient natural gas & heat | 9,365 | (5,430) | |
| Transmission lines | (29,331) | (32,466) | |
| Water | 89 | (1,700) | |
| Total | (418,271) | (473,638) | |
| 5. | Business Combinations |
For the year ended December 31, 2023
On March 1, 2023, the Company completed the process of transitioning the O&M services for the assets in Spain where Abengoa was still the supplier to an Atlantica’ subsidiary. This acquisition has been accounted for in these Consolidated Financial Statements in accordance with IFRS 3, Business Combinations. The O&M services are included within the Renewable energy sector and the EMEA geography.
The fair value of assets and liabilities consolidated at the effective acquisition date is shown in the following table:
|
Business combinations for the year ended December 31, 2023 $’000 |
||||
| Property, plant and equipment under IAS 16 (Note 6) | 1,565 | |||
| Intangible assets under IAS 38 (Note 6) | 4,486 | |||
| Inventories | 1,646 | |||
| Other current and non-current liabilities | (5,494 | ) | ||
| Total net assets acquired at fair value | 2,203 | |||
| Asset acquisition – purchase price | (2,203 | ) | ||
| Net result of business combinations | - | |||
The purchase price equals the fair value of the net assets acquired.
The allocation of the purchase price is provisional as of December 31, 2023, and amounts indicated above may be adjusted during the measurement period to reflect new information obtained about facts and circumstances that existed at the acquisition date that, if known, would have affected the amounts recognized as of December 31, 2023. The measurement period will not exceed one year from the acquisition date.
The amount of revenue contributed by the acquisitions during 2023 to the Consolidated Financial Statements of the Company is nil, and the amount of loss after tax is $0.8 million. Had the acquisitions been consolidated from January 1, 2023, the consolidated statement of comprehensive income would not have included any additional revenue and additional loss after tax of $0.2 million.
For the year ended December 31, 2022
On January 17, 2022, the Company closed the acquisition of Chile TL4, a 63-mile transmission line and 2 substations in Chile for a total equity investment of $38.4 million. Atlantica has control over Chile TL4 under IFRS 10, Consolidated Financial Statements. The acquisition of Chile TL4 had been accounted for in these Consolidated Financial Statements in accordance with IFRS 3, Business Combinations. Chile TL4 is included within the Transmission Lines sector and the South America geography.
On April 4, 2022, the Company closed the acquisition of Italy PV 4, a 3.6 MW solar portfolio in Italy for a total equity investment of $3.7 million. Atlantica has control over Italy PV 4 under IFRS 10, Consolidated Financial Statements. The acquisition of Italy PV 4 had been accounted for in these Consolidated Financial Statements in accordance with IFRS 3, Business Combinations. Italy PV4 is included within the Renewable energy sector and the EMEA geography.
On September 2, 2022 the Company closed the acquisition of Chile PV 3, a 73 MW solar PV plant through its renewable energy platform in Chile for a total equity investment of $7.7 million. Atlantica has control over Chile PV 3 under IFRS 10, Consolidated Financial Statements. The acquisition of Chile PV 3 had been accounted for in these Consolidated Financial Statements in accordance with IFRS 3, Business Combinations, showing 65% of non-controlling interests. Chile PV 3 is included within the Renewable energy sector and the South America geography.
The fair value of assets and liabilities consolidated at the effective acquisition date is shown in aggregate on the basis that they are individually not significant in the following table:
|
Business combinations for the year ended December 31, 2023 $’000 |
||||
| Property, plant and equipment under IAS 16 (Note 6) | 58,002 | |||
| Rights of use under IFRS 16 (Lessee) or intangible assets under IAS 38 (Note 6) | 16,993 | |||
| Cash & cash equivalents | 1,057 | |||
| Other current assets | 8,283 | |||
| Non-current Project debt (Note 16) | (1,301) | |||
| Current Project debt (Note 16) | (148) | |||
| Other current and non-current liabilities | (18,919) | |||
| Non-controlling interests | (14,300) | |||
| Total net assets acquired at fair value | 49,667 | |||
| Asset acquisition – purchase price | (49,667) | |||
| Net result of business combinations | - | |||
The purchase price equals the fair value of the net assets acquired.
The amount of revenue contributed by the acquisitions performed during 2022 to the Consolidated Financial Statements of the Company for the year 2022 was $6.2 million, and the amount of profit after tax was $1.7 million. Had the acquisitions been consolidated from January 1, 2022, the consolidated statement of comprehensive income would have included additional revenue of $4.8 million and additional profit after tax of $1.7 million.
In January, April and September 2023, the provisional period for the purchase price allocation of Chile TL 4, Italy PV 4 and Chile PV 3, respectively, closed, and did not result in significant adjustments to the initial amounts recognized.
| 6. | Contracted Concessional, PP&E and Other Intangible Assets |
The Company has assets recorded as intangible or financial assets in accordance with IFRIC 12, property plant and equipment in accordance with IAS 16 and right of use assets under IFRS 16 or intangible assets under IAS 38.
For further details on the application of IFRIC 12 to assets of the Company, see Note 27.
| a) | The following table shows the movements of assets included in the heading “Contracted Concessional, PP&E and other intangible assets” for 2023: |
|
Financial assets |
Financial assets under |
Intangible assets |
Right of use assets under IFRS |
Property, plant and equipment under IAS 16 |
|||
| Cost |
under IFRIC 12 |
IFRS 16 (Lessor) |
under IFRIC 12 |
intangible assets under IAS 38 |
Land |
Technical installations |
Total assets |
| Total as of January 1, 2023 |
818,170 | 2,787 | 8,845,151 | 120,308 | 137,767 | 938,799 | 10,862,982 |
| Additions | - | - | 27,531 | 4,409 | 62 | 50,805 | 82,807 |
| Subtractions | - | - | - | (644) | - | (5,487) | (6,131) |
| Business combinations (Note 5) |
- | - | - | 4,486 | - | 1,565 | 6,051 |
| Currency translation differences | 5,025 | (132) | 84,060 | 4,756 | 1,515 | 19,847 | 115,071 |
| Reclassification and other movements | (38,016) | - | 348 | 17,632 | - | (11,537) | (31,573) |
| Total Cost as of December 31, 2023 | 785,179 | 2,655 | 8,957,090 | 150,947 | 139,344 | 993,992 | 11,029,207 |
| Depreciation, |
Financial assets |
Financial assets under |
Intangible assets |
Right of use assets under |
Property, plant and equipment under IAS 16 |
||
|
amortization and impairment |
under IFRIC 12 |
IFRS 16 (Lessor) |
under IFRIC 12 |
intangible assets under IAS 38 |
Land |
Technical installations |
Total assets |
| Total as of January 1, 2023 |
(69,557) | - | (3,088,778) | (26,783) | - | (194,605) | (3,379,723) |
| Additions | - | - | (358,602) | (11,869) | - | (41,924) | (412,395) |
| Impairment charges | - | - | - | - | - | (16,079) | (16,079) |
| Reversal of impairment | 13,378 | - | - | - | - | - | 13,378 |
| Currency translation differences | (199) | - | (32,084) | (533) | - | (4,511) | (37,327) |
| Reclassifications and other movements | - | - | - | 372 | - | 6,834 | 7,206 |
| Total depreciation, amortization and impairment as of December 31, 2023 | (56,378) | - | (3,479,464) | (38,813) | - | (250,285) | (3,824,940) |
| Total net book value as of December 31, 2023 | 728,801 | 2,655 | 5,477,626 | 112,134 | 139,344 | 743,707 | 7,204,267 |
The increase in the contracted concessional assets cost is primarily due to the higher value of the Euro denominated assets since the exchange rate of the Euro increased against the U.S. dollar since December 31, 2022 and to the investments for the year in operating concessional assets and assets under development and construction. The increase in accumulated depreciation, amortization and impairment is primarily due to the amortization charge for the year and the impairment registered in Chile PV1 (see further explanation below).
The decrease included in “Reclassification and other movement” is mainly due to the reclassification from the long to the short term of the current portion of the contracted concessional financial assets.
| b) | The following table shows the movements of assets included in the heading “Contracted Concessional, PP&E and other intangible assets” for 2022: |
|
Financial assets |
Financial assets under |
Intangible assets |
Right of use assets under IFRS |
Property, plant and equipment under IAS 16 |
|||
| Cost |
under IFRIC 12 |
IFRS 16 (Lessor) |
under IFRIC 12 |
intangible assets under IAS 38 |
Land |
Technical installations |
Total assets |
| Total as of January 1, 2022 |
874,525 | 2,843 | 9,068,646 | 100,109 | 137,037 | 835,975 | 11,019,135 |
| Additions | - | - | 32,941 | 5,637 | 3,532 | 75,182 | 117,292 |
| Subtractions | - | (57) | (499) | (1,510) | - | (8,495) | (10,561) |
| Business combinations (Note 5) |
- | - | - | 16,993 | - | 58,002 | 74,995 |
| Currency translation differences | 1,760 | 1 | (258,735) | (4,446) | (2,802) | (21,090) | (285,312) |
| Reclassification and other movements | (58,115) | - | 2,798 | 3,525 | - | (775) | (52,567) |
| Total Cost as of December 31, 2022 | 818,170 | 2,787 | 8,845,151 | 120,308 | 137,767 | 938,799 | 10,862,982 |
| Depreciation, |
Financial |
Financial assets |
Intangible |
Right of use assets under |
Property, plant and equipment under IAS 16 |
||
|
amortization and impairment |
assets under IFRIC 12 |
under IFRS 16 (Lessor) |
assets under IFRIC 12 |
IFRS 16 (Lessee) and intangible assets under IAS 38 |
Land |
Technical installations |
Total assets |
| Total as of January 1, 2022 |
(62,889) | - | (2,769,345) | (21,578) | - | (143,755) | (2,997,567) |
| Additions | (6,560) | - | (357,401) | (6,865) | - | (43,414) | (414,240) |
| Impairment charges | - | - | (41,238) | - | - | (20,446) | (61,684) |
| Reversal of impairment | - | - | - | 859 | - | 7,643 | 8,502 |
| Currency translation differences | (108) | - | 79,206 | 801 | - | 5,367 | 85,266 |
| Total depreciation, amortization and impairment as of December 31, 2022 | (69,557) | - | (3,088,778) | (26,783) | - | (194,605) | (3,379,723) |
| Total net book value as of December 31, 2022 | 748,613 | 2,787 | 5,756,373 | 93,525 | 137,767 | 744,194 | 7,483,259 |
The decrease in the contracted concessional assets cost was primarily due to the lower value of the Euro denominated assets since the exchange rate of the Euro decreased against the U.S. dollar since December 31, 2021, that more than offset the increase resulting from business combinations and the additions for the year that primarily corresponded to investments in operating concessional assets and assets under development or construction. The increase in accumulated depreciation, amortization and impairment was primarily due to the amortization charge for the year and the impairment registered in Solana, Chile PV1 and Chile PV2 (see further explanation below).
The decrease included in “Reclassification and other movement” was mainly due to the reclassification from the long to the short term of the current portion of the contracted concessional financial assets.
Solana triggering event of impairment
Considering the continued delays in the works and replacements that the Company was carrying out in the storage system at Solana and their impact on production in 2022, as well as an increase in the discount rate, the Company identified an impairment triggering event as of December 31, 2022, in accordance with IAS 36, Impairment of assets. As a result, an impairment test was performed using historical level of output (generation), which resulted in the recording of an impairment loss of $41 million in 2022.
The impairment was recorded within the line “Depreciation, amortization and impairment charges” of the consolidated profit and loss statement, decreasing the amount of Intangible assets under IFRIC 12 pertaining to the Renewable energy sector and the North America geography. The recoverable amount considered was the value in use and amounted to $881 million for Solana, as of December 31, 2022.
No triggering event of impairment was identified in Solana as of December 31, 2023.
Chile PV1 and Chile PV2 triggering event of impairment
Considering that expected electricity prices in Chile over the remaining useful life of Chile PV1 and Chile PV2 further decreased in 2023, the Company identified an impairment triggering event as of December 31, 2023, in accordance with IAS 36, Impairment of assets. As a result, an impairment test has been performed which resulted in the recording of an impairment loss of $16 million for Chile PV1 ($8 million in 2022) and no impairment for Chile PV2 ($12 million in 2022).
The impairment has been recorded within the line “Depreciation, amortization and impairment charges” of the consolidated profit and loss statement, decreasing the amount of Property, plant and equipment under IAS 16 pertaining to the Renewable energy sector and the South America geography. The recoverable amount considered is the value in use and amounts to $40 million for Chile PV1 and $22 million for Chile PV2, as of December 31, 2023 ($58 million and $22 million respectively as of December 31,2022). A specific discount rate has been used in each year considering changes in the debt/equity leverage ratio over the useful life of these projects, resulting in the use of a range of pre-tax discount rates between 7.7% and 8.7% for Chile PV1 and 7.7% and 9.8% for Chile PV2 (between 7.5% and 8.4% for Chile PV1 and 7.5% and 8.3% for Chile PV2).
The value of the net assets contributed by Chile PV1 and PV2 to these Consolidated Financial Statements, excluding non-controlling interest, is close to nil as of December 31, 2023
An adverse change in the key assumptions which are individually used for the valuation could lead to future impairment recognition; specifically, a 5% decrease in electricity prices over the entire remaining useful life of these projects would generate an additional total impairment of approximately $3 million. An increase of 50 basis points in the discount rate would lead to an additional total impairment of approximately $2 million.
The Company did not identify any other triggering event of impairment of its contracted concessional assets as of December 31, 2023 and 2022.
Expected credit losses
The impairment provision based on the expected credit losses on contracted concessional financial assets, calculated in accordance with IFRS 9, Financial instruments, decreased by $13 million in the year ended December 31, 2023, primarily in ACT following an improvement of its client’s credit risk metrics (increased by $7 million in the year ended December 31, 2022, primarily in ACT).
| 7. | Investments Carried Under the Equity Method |
The table below shows the breakdown and the movement of the investments held in associates and joint ventures for 2023 and 2022:
| Investments in associates and joint ventures |
2023 $’000 |
2022 $’000 |
||||||
| Initial balance | 260,031 | 294,581 | ||||||
| Share of profit | 13,207 | 21,465 | ||||||
| Distributions | (38,780 | ) | (57,537) | |||||
| New entities carried under the equity method | 4,439 | 4,901 | ||||||
| Investment in associates classified as held for sale during the year (Note 8) | (10,194) | - | ||||||
| Others (incl. currency translation differences) | 1,604 | (3,379) | ||||||
| Final balance | 230,307 | 260,031 | ||||||
On October 30, 2023, the conditions to classify the investment in Pemcorp as held for sale were met. As a consequence, the book value of the equity investment held by Atlantica in Pemcorp of US$ 10.2 million is classified as held for sale in these Consolidated Financial Statements from that date (Note 8).
Other variations in investments carried under the equity method in 2023 are primarily due to:
- Distributions:
In 2023, the Company received distributions from Amherst Island Partnership for $17.3 million ($20.9 million in 2022), distributions from Vento II for $16.1 million ($32.6 million in 2022) and distributions from Honaine for $5.4 million ($4.0 million in 2022). A significant portion of the distributions received from Amherst Island Partnership are distributed by the Company to Algonquin Power Co. (Note 14).
- New entities carried under the equity method
On March 1, 2023, Atlantica sold part of its equity interest in the Colombian portfolio of renewable energy entities to a partner, which now holds a 50% equity interest. The Colombian portfolio of renewable energy entities includes the following entities: Atlantica – HIC Renovables S.A.S., SJ Renovables Sun 1 S.A.S., AC Renovables Sol 1 S.A.S., SJ Renovables Wind 1 S.A.S., PA Renovables Sol 1 S.A.S. and Atlantica Hidro Colombia S.A.S. Atlantica and the partner hold 50% of the shares each and have joint control over these entities in accordance with IFRS 11, Joint arrangements. As a result, the subsidiaries, which were previously fully consolidated showing 30% of non-controlling interest, are now recorded as an investment in joint ventures under the equity method in these Consolidated Financial Statements in accordance with IAS 28, Investments in Associates and Joint Ventures. The carrying amount of the non-controlling interests in these entities were derecognized at the date control was lost by Atlantica. Further to the sale of part of its equity interest, Atlantica recorded a gain of $4.6 million as Other operating income in the year 2023 (Note 22).
- Share of profit
The profit decreases in 2023 compared to 2022 primarily due to a lower profit at Vento II resulting from lower production and a lower price at Lone Star II after its PPA expired in January 2023.
In November 2022, Atlantica closed the acquisition of a 49% interest, with joint control, in Chile PMGD, an 80 MW portfolio of solar PV assets in Chile, which is currently under construction (Note 1). Chile PMGD is accounted for in these Consolidated Financial Statements using the equity method as per IAS 28 – Investments in Associates and Joint ventures.
The tables below show a breakdown of stand-alone amounts of assets, revenues and profit and loss as well as other information of interest for the years 2023 and 2022 for the entities carried under the equity method:
|
Company |
% Shares of the Company |
Non- current assets |
Current assets |
Project debt |
Other non- current liabilities |
Other current liabilities |
Revenue |
Operating profit/ (loss) |
Net profit/ (loss) |
Investment under the equity method |
||||||||||
| 2007 Vento II, LLC (1) | 49.00 | 411,099 | 25,777 | - | 56,508 | 11,285 | 82,849 | 21,024 | 19,752 | 175,351 | ||||||||||
| Windlectric Inc (2) | 30.00 | 284,618 | 30,884 | - | 159,406 | 77,389 | 21,514 | 8,515 | (2,157) | 1,910 | ||||||||||
| Myah Bahr Honaine, S.P.A.(3) | 25.50 | 155,338 | 63,451 | 35,569 | 20,240 | 4,653 | 56,172 | 34,576 | 27,084 | 40,635 | ||||||||||
| Akuo Atlantica PMGD Holding S.P.A. (4) | 49.00 | 56,214 | 7,210 | 24,214 | 18,090 | 13,739 | 192 | (75) | (83) | 4,409 | ||||||||||
| Colombian portfolio of renewable energy entities | 50.00 | 9,092 | 4,970 | - | 9,872 | 956 | - | (587) | 1,920 | 4,754 | ||||||||||
| Pectonex, R.F. Proprietary Limited | 50.00 | 1,749 | - | - | 1 | - | - | (149) | (149) | 1,337 | ||||||||||
| Evacuación Valdecaballeros, S.L. | 57.16 | 15,839 | 1,005 | - | 13,538 | 159 | 878 | (59) | (91) | 807 | ||||||||||
| Atlantica SailH2, S.L. | 50.00 | 499 | 333 | - | - | 165 | - | - | - | 653 | ||||||||||
| Evacuación Villanueva del Rey, S.L. | 40.02 | 2,218 | 83 | - | 1,308 | 181 | - | 63 | - | - | ||||||||||
| Liberty Infraestructuras S.L. | 20.00 | 81 | 357 | - | - | - | 4 | (46) | (68) | - | ||||||||||
| Fontanil Solar, S.L.U. | 25.00 | 328 | 13 | - | 354 | 7 | - | (1) | (18) | 229 | ||||||||||
| Murum Solar, S.L.U. | 25.00 | 266 | 35 | - | 314 | - | - | (1) | (15) | 222 | ||||||||||
| As of December 31, 2023 | 230,307 |
|
Company |
% Shares of the Company |
Non- current assets |
Current assets |
Project debt |
Other non- current liabilities |
Other current liabilities |
Revenue |
Operating profit/ (loss) |
Net profit/ (loss) |
Investment under the equity method |
||||||||||
| 2007 Vento II, LLC (1) | 49.00 | 435,029 | 14,198 | - | 57,596 | 11,515 | 103,362 | 42,662 | 40,992 | 181,735 | ||||||||||
| Windlectric Inc (2) | 30.00 | 278,504 | 3,338 | - | 167,519 | 43,227 | 24,996 | 10,560 | (15) | 18,935 | ||||||||||
| Myah Bahr Honaine, S.P.A.(3) | 25.50 | 150,623 | 66,246 | 43,579 | 18,902 | 4,257 | 55,267 | 33,374 | 26,768 | 42,128 | ||||||||||
| Akuo Atlantica PMGD Holding S.P.A. (4) | 49.00 | 14,814 | 2,828 | - | 8,755 | 326 | - | - | (348) | 4,450 | ||||||||||
| Pemcorp SAPI de CV (5) | 30.00 | 138,931 | 112,352 | 159,382 | 90,474 | 4,328 | 45,625 | 1,680 | (17,747) | 10,034 | ||||||||||
| Pectonex, R.F. Proprietary Limited | 50.00 | 2,045 | - | - | - | 1 | - | (168) | (168) | 1,411 | ||||||||||
| Evacuacion Valdecaballeros, S.L. | 57.16 | 15,551 | 1,020 | - | 13,635 | 232 | 860 | (60) | (89) | 858 | ||||||||||
| Evacuacion Villanueva del Rey, S.L | 40.02 | 2,317 | 12 | - | 1,386 | 111 | - | 57 | - | - | ||||||||||
| Liberty Infraestructuras S.L. | 20.00 | 93 | 283 | - | - | 37 | - | - | (22) | 29 | ||||||||||
| Fontanil Solar, S.L.U. | 25.00 | 117 | 7 | - | 99 | 24 | - | (1) | (2) | 229 | ||||||||||
| Murum Solar, S.L.U. | 25.00 | 228 | 8 | - | 180 | 59 | - | (1) | (5) | 222 | ||||||||||
| As of December 31, 2022 | 260,031 |
The Company has no control over Evacuacion Valdecaballeros, S.L. as all relevant decisions of this company require the approval of a minimum of shareholders accounting for more than 75% of the shares.
None of the associated companies referred to above is a listed company.
(1) 2007 Vento II, LLC, is the holding company of a 596 MW portfolio of wind assets in the U.S., 49% owned by Atlantica since June 16, 2021, and accounted for under the equity method in these Consolidated Financial Statements. Share of profit of 2007 Vento II, LLC. included in these Consolidated Financial Statements amounts to $9.7 million in 2023 and $20.1 million in 2022.
(2) Windlectric Inc., the project entity, is 100% owned by Amherst Island Partnership which is accounted for under the equity method in these Consolidated Financial Statements.
(3) Myah Bahr Honaine, S.P.A., the project entity, is 51% owned by Geida Tlemcen, S.L. which is accounted for using the equity method in these Consolidated Financial Statements. Geida Tlemcen, S.L. is 50% owned by Atlantica. Share of profit of Myah Bahr Honaine S.P.A. included in these Consolidated Financial Statements amounts to $6.9 million in 2023 and $6.8 million in 2022.
(4) Akuo Atlantica PMGD Holding S.P.A. is the holding company of a 80 MW portfolio of solar PV assets in Chile, which is currently under construction, 49% owned by Atlantica, with joint control since November 2022 and accounted for under the equity method in these Consolidated Financial Statements.
(5) Pemcorp SAPI de CV, Monterrey´s project entity, is 100% owned by Arroyo Netherlands II B.V., which was accounted for under the equity method in the Consolidated Financial Statements as of December 31, 2022. Arroyo Netherlands II B.V. is 30% owned by Atlantica. The investment held by Atlantica in Pemcorp has been classified as held for sale in these Consolidated Financial (Note 8). Share of profit of Pemcorp SAPI de CV included in these Consolidated Financial Statements amounts to a $0.2 million profit in 2023 and a $5.3 million loss in 2022.
| 8. | Assets held for sale |
In 2023, the Atlantica´s partner in Monterrey initiated a process to sell its 70% stake in the asset. Such process is well advanced and, as part of it, Atlantica intends to sell its interest as well under the same terms. The net proceeds to Atlantica are expected to be in the range of $45 to $52 million, after tax. The transaction is subject to certain conditions precedent and final transaction closing and is expected to be completed in 2024. On October 30, 2023, the conditions to classify the loan granted by Atlantica to Arroyo II and the investment in Pemcorp as held for sale were met. As a consequence, the book value of the equity investment held by Atlantica in Pemcorp of $10.2 million (Note 7) and the loan granted by Atlantica to Arroyo II of $18.5 million (Note 11) as of December 31, 2023, were classified as held for sale in these Consolidated Financial Statements since that date.
Share of profit in Pemcorp is not reflected since October 30, 2023, in these Consolidated Financial Statements according to IFRS 5 Non-current Assets Held for Sale and Discontinued Operations. The loan granted by Atlantica to Arroyo II, shall continue to be measured in accordance with IFRS 9, at amortized cost, and the interests accrued classified as financial income in the profit and loss statement until closing of the sale occurs.
| 9. | Financial instruments by Category |
Financial instruments, in addition to financial assets included within Contracted concessional, PP&E and other intangible assets disclosed in Note 6, are primarily deposits, derivatives, trade and other receivables and loans. Financial instruments by category (current and non-current), reconciled with the statement of financial position as of December 31, 2023 and 2022 are as follows:
| Category | Notes |
Amortized Cost $’000 |
Fair value through Other Comprehensive Income $´000 |
Fair value through profit or loss $’000 |
Balance as of 12.31.23 $’000 |
|||||
| Derivative assets | 10 | - | - | 61,697 | 61,697 | |||||
| Investment in Ten West Link | - | 11,719 | - | 11,719 | ||||||
| Financial assets under IFRIC 12 (short-term portion) (*) | 177,407 | - | - | 177,407 | ||||||
| Trade and other receivables | 12 | 286,483 | - | - | 286,483 | |||||
| Cash and other equivalents | 13 | 448,301 | - | - | 448,301 | |||||
| Other financial assets | 74,645 | - | - | 74,645 | ||||||
| Total financial assets | 986,836 | 11,719 | 61,697 | 1,060,252 | ||||||
| Corporate debt (**) | 15 | 1,084,838 | - | - | 1,084,838 | |||||
| Project debt (**) | 16 | 4,319,260 | - | - | 4,319,260 | |||||
| Lease liabilities (non-current portion) | 17 | 82,366 | - | - | 82,366 | |||||
| Trade and other current liabilities | 18 | 141,713 | - | - | 141,713 | |||||
| Derivative liabilities | 10 | - | - | 29,957 | 29,957 | |||||
| Total financial liabilities | 5,628,177 | - | 29,957 | 5,658,134 |
| Category | Notes |
Amortized Cost $’000 |
Fair value through Other Comprehensive Income $´000 |
Fair value through profit or loss $’000 |
Balance as of 12.31.22 $’000 |
|||||
| Derivative assets | 10 | - | - | 97,381 | 97,381 | |||||
| Investment in Ten West Link | - | 15,959 | - | 15,959 | ||||||
| Financial assets under IFRIC 12 (short-term portion) (*) | 186,841 | - | - | 186,841 | ||||||
| Trade and other receivables | 12 | 200,334 | - | - | 200,334 | |||||
| Cash and other equivalents | 13 | 600,990 | - | - | 600,990 | |||||
| Other financial assets | 71,949 | - | - | 71,949 | ||||||
| Total financial assets | 1,060,114 | 15,959 | 97,381 | 1,173,454 | ||||||
| Corporate debt (**) | 15 | 1,017,200 | - | - | 1,017,200 | |||||
| Project debt (**) | 16 | 4,553,052 | - | - | 4,553,052 | |||||
| Lease liabilities (non-current portion) | 17 | 63,076 | - | - | 63,076 | |||||
| Trade and other current liabilities | 18 | 140,230 | - | - | 140,230 | |||||
| Derivative liabilities | 10 | - | - | 16,847 | 16,847 | |||||
| Total financial liabilities | 5,773,558 | - | 16,847 | 5,790,405 |
(*) The long-term portion of Financial assets under IFRIC 12 is included within the line Contracted concessional, PP&E and other intangible assets (Note 6).
(**) The percentage of Corporate and Project debt at fixed interest or hedged is 94% and 92% respectively as of December 31, 2023 (96% and 92% respectively as of December 31, 2022).
Other financial assets as of December 31, 2023 and December 31, 2022, include, among others, loans to entities accounted for under the equity method in these Consolidated Financial Statements (Note 11) and restricted cash for repairs or scheduled major maintenance work.
Investment in Ten West Link is a 12.5% interest in a 114-mile transmission line in the U.S., currently under construction.
10. Derivative Financial Instruments
The breakdowns of the fair value amount of the derivative financial instruments as of December 31, 2023 and 2022 are as follows:
| Balance as of 12.31.23 | Balance as of 12.31.22 | |||||||
|
Assets $’000 |
Liabilities $’000 |
Assets $’000 |
Liabilities $’000 |
|||||
| Interest rate cash flow hedge | 60,102 | 29,163 | 94,192 | 12,159 | ||||
| Foreign exchange derivatives instruments | 1,595 | - | 3,189 | - | ||||
| Notes conversion option (Note 15) | - | 794 | - | 4,688 | ||||
| Total | 61,697 | 29,957 | 97,381 | 16,847 | ||||
The derivatives are primarily interest rate cash-flow hedges. Almost all of them are classified as non-current assets or non-current liabilities, as they hedge long-term financing agreements.
As stated in Note 3 to these Consolidated Financial Statements, the general policy is to hedge variable interest rates of financing agreements using two types of hedging derivatives:
| - | Interest rate swaps under which the Company receives the floating leg and pays the fixed leg; and |
| - | Purchased call options (cap), in exchange of a premium to fix the maximum interest rate cost. |
The notional amounts hedged, strikes contracted and maturities, depending on the characteristics of the debt on which the interest rate risk is being hedged, can be diverse. As of December 31, 2023, approximately 92% of the Project debt and 94% of the Corporate debt of the Company either has fixed interest rates or has been hedged with swaps or caps (92% and 96%, respectively, as of December 31, 2022).
The table below shows a breakdown of the maturities of notional amounts of interest rate cash flow hedge derivatives as of December 31, 2023 and 2022.
| Notionals |
Balance as of 12.31.23 $’000 |
Balance as of 12.31.22 $’000 |
||||||
| Assets | Liabilities | Assets | Liabilities | |||||
| Up to 1 year | 248,898 | 43,013 | 245,147 | 47,029 | ||||
| Between 1 and 2 years | 279,215 | 95,701 | 310,393 | 102,476 | ||||
| Between 2 and 3 years | 314,644 | 104,848 | 217,498 | 112,855 | ||||
| Subsequent years | 523,564 | 264,563 | 659,186 | 280,016 | ||||
| Total | 1,366,321 | 508,125 | 1,432,224 | 542,376 | ||||
The table below shows a breakdown of the maturity of the fair values of interest rate cash flow hedge derivative as of December 31, 2023 and 2022.
| Fair value |
Balance as of 12.31.23 $’000 |
Balance as of 12.31.22 $’000 |
||||||
| Assets | Liabilities | Assets | Liabilities | |||||
| Up to 1 year | 3,957 | (1,740) | 10,868 | (991) | ||||
| Between 1 and 2 years | 10,124 | (5,347) | 17,860 | (2,189) | ||||
| Between 2 and 3 years | 12,070 | (5,848) | 12,257 | (2,851) | ||||
| Subsequent years | 33,951 | (16,228) | 53,207 | (6,128) | ||||
| Total | 60,102 | (29,163) | 94,192 | (12,159) | ||||
The net amount of the fair value of interest rate derivatives designated as cash flow hedges transferred to the consolidated profit and loss statement in 2023 is a profit of $27.1 million (loss of $38.2 million in 2022).
The after-tax result accumulated in equity in connection with derivatives designated as cash flow hedges at the years ended December 31, 2023 and 2022, amounts to a $308.0 million gain and a $345.6 million gain, respectively.
Additionally, the Company has currency options with leading international financial institutions, which guarantee minimum Euro-U.S. dollar exchange rates. The strategy of the Company is to hedge the exchange rate for the net distributions from its European assets after deducting euro-denominated interest payments and euro-denominated general and administrative expenses. Through currency options, the strategy of the Company is to hedge 100% of its euro-denominated net exposure for the next 12 months and 75% of its euro denominated net exposure for the following 12 months, on a rolling basis. Change in fair value of these foreign exchange derivatives instruments are directly recorded in the consolidated profit and loss statement.
Finally, the conversion option of the Green Exchangeable Notes issued in July 2020 (Note 15) is recorded as a derivative with a fair value (liability) of $0.8 million as of December 31, 2023 ($4.7 million as of December 31, 2022).
11. Related Party Transactions
The related parties of the Company are primarily Algonquin and its subsidiaries, non-controlling interests (Note 14), entities accounted for under the equity method (Note 7) as well as the Directors and the Senior Management of the Company.
Details of balances with related parties as of December 31, 2023 and 2022 are as follows:
|
As of December 31, |
Receivables (current) |
Receivables (non- current) |
Payables (current) |
Payables (non- current) |
|||||||
| Investments carried under the equity method: | |||||||||||
| Arroyo Netherland II B.V (Note 8) | 2023 | 18,448 | - | - | - | ||||||
| 2022 | 1,097 | 17,006 | - | - | |||||||
| Amherst Island Partnership | 2023 | 5,817 | - | - | - | ||||||
| 2022 | - | - | - | - | |||||||
| 2023 | - | 16,677 | - | - | |||||||
| Akuo Atlantica PMGD Holding | 2022 | - | 504 | - | - | ||||||
| 2023 | - | 13,578 | - | - | |||||||
| Colombian assets portfolio | 2022 | - | - | - | - | ||||||
| Other | 2023 | 21 | 148 | - | - | ||||||
| 2022 | 127 | - | - | - | |||||||
| Non controlling interest: | |||||||||||
| Algonquin | 2023 | - | - | 5,683 | - | ||||||
| 2022 | - | - | 4,762 | - | |||||||
| JGC Corporation | 2023 | - | - | - | 4,612 | ||||||
| 2022 | - | - | - | 6,088 | |||||||
| Other | 2023 | - | - | 2,314 | 27 | ||||||
| 2022 | - | - | 1,311 | - | |||||||
| Other related parties: | |||||||||||
| 2023 | 918 | - | - | - | |||||||
| Atlantica´s partner in Colombia | 2022 | - | - | - | - | ||||||
| Total | 2023 | 25,204 | 30,403 | 8,031 | 4,639 | ||||||
| 2022 | 1,224 | 17,510 | 6,073 | 6,088 | |||||||
Receivables with Arroyo Netherland II B.V, the holding company of Pemcorp SAPI de CV, Monterrey´s project entity, correspond to the loan that was granted at acquisition date of the project and accrues an interest of SOFR plus 6.31% with maturity date on November 25, 2027. As of December 31, 2023, the loan is classified as current receivable as it is accounted for as assets held for sale in these Consolidated Financial Statements (Note 8).
Current receivables with Amherst Island Partnership as of December 31, 2023 include a dividend to be collected by AYES Canada for $5.8 million.
Non-current receivables include a loan that accrues a fixed interest of 8.75% with Akuo Atlantica PMGD Holding S.P.A and a loan with the Colombian portfolio of renewable energy entities in which the Company has a 50% equity interest, which accrues a fixed interest of 8%.
Current payables primarily include the dividend to be paid by AYES Canada to Algonquin.
Non-current payables with JGC Corporation include a subordinated debt with Solacor 1 and Solacor 2 that accrues an interest of Euribor plus 2.5% and with maturity date in 2037.
Current receivables with the partner of the Company in Colombia include Atlantica´s pending purchase price payment to be received for the partial sale of its investment in the Colombian portfolio of renewable energy entities (Note 7).
The transactions carried out by entities included in these Consolidated Financial Statements with related parties for the years ended December 31, 2023 and 2022 have been as follows:
| Financial income |
Financial expense |
Operating income |
|||||||
| Investments carried under the equity method: | |||||||||
| Arroyo Netherland II B.V | 2023 | 1,845 | - | - | |||||
| 2022 | 1,275 | - | - | ||||||
| 2023 | 607 | - | 316 | ||||||
| Akuo Atlantica PMGD Holding | 2022 | - | - | - | |||||
| 2023 | 588 | - | - | ||||||
| Colombian assets portfolio | 2022 | - | - | - | |||||
| 2023 | - | - | 9 | ||||||
| Other | 2022 | - | - | - | |||||
| Non controlling interests: | |||||||||
| Other | 2023 | - | (471) | - | |||||
| 2022 | 23 | (153) | - | ||||||
| Total | 2023 | 3,040 | (471) | 325 | |||||
| 2022 | 1,298 | (153) | - | ||||||
The total amount of the remuneration received by the Board of Directors of the Company, including the CEO, amounts to $4.0 million in 2023 ($5.7 million in 2022), including $0.9 million of annual bonus ($0.9 million in 2022) and $1.0 million of long-term award vested in 2023 ($3.0 million in 2022). The decrease of the total remuneration in 2023 is mainly due to a decrease in the amount of share options exercised in 2023 compared to 2022, and to the decrease of Atlantica’s share price from the date of such awards being granted. Share options awarded in 2020 and 2021 under the incentive plans that vested in 2023 were underwater and thus not exercised. None of the directors received any pension remuneration in 2023 nor 2022.
12. Trade and Other Receivables
Trade and other receivables as of December 31, 2023 and 2022, consist of the following:
|
Balance as of December 31, 2023 $’000 |
Balance as of December 31, 2022 $’000 |
|||
| Trade receivables | 213,345 | 125,437 | ||
| Tax receivables | 37,134 | 45,680 | ||
| Prepayments | 12,717 | 11,827 | ||
| Other accounts receivable | 23,287 | 17,390 | ||
| Total | 286,483 | 200,334 |
The increase in trade receivables is primarily due to collections pending from the Spanish state-owner regulator, Comision Nacional de los Mercados y de la Competencia or “CNMC” in the solar assets of the Company in Spain and from Pemex in ACT. The Company experienced delays in collections from Pemex, especially since the second half of 2019, which have been significant in certain quarters, including in the fourth quarter of 2023.
During the year 2022, in the assets in Spain, the Company collected revenue in line with the parameters corresponding to the regulation in place at the beginning of the year 2022, as the new parameters, reflecting lower revenue, became final on December 14, 2022. As a result, as of December 31, 2022, trade receivables in the assets in Spain were lower than usual. During the year 2023, collections at these assets in Spain were regularized.
As of December 31, 2023, and December 31, 2022, the fair value of trade and other receivables accounts does not differ significantly from its carrying amount.
Trade receivables in foreign currency as of December 31, 2023 and 2022, are as follows:
|
Balance as of December 31, 2023 $’000 |
Balance as of December 31, 2022 $’000 |
|||
| Euro | 53,012 | 4,088 | ||
| South African Rand | - | 23,416 | ||
| Chilean Peso | 4,431 | 5,037 | ||
| Mexican peso | 4,557 | 1,298 | ||
| Other | 4,376 | 2,676 | ||
| Total | 66,376 | 36,515 |
The increase in trade receivables in Euro is primarily due to collections pending from the CNMC. Trade receivables in South African Rand decreased due to the unscheduled outage in Kaxu since the end of September 2023 (Note 22).
13. Cash and Cash Equivalents
The following table shows the detail of Cash and cash equivalents as of December 31, 2023 and 2022:
|
2023 $’000 |
2022 $’000 |
|||
| Cash at bank and on hand - non-restricted | 271,329 | 393,430 | ||
| Cash at bank and on hand - restricted | 176,972 | 207,560 | ||
| Total | 448,301 | 600,990 | ||
Cash includes funds held to satisfy the customary requirements of certain non-recourse debt agreements within the Company´s projects (Note 16) amounting to $177 million as of December 31, 2023 ($208 million as of December 31, 2022).
The following breakdown shows the main currencies in which cash and cash equivalent balances are denominated:
|
2023 $’000 |
2022 $’000 |
|||
| US Dollar | 266,200 | 309,756 | ||
| Euro | 102,820 | 217,675 | ||
| South African Rand | 30,908 | 36,137 | ||
| Mexican Peso | 13,455 | 4,010 | ||
| Algerian Dinar | 21,168 | 24,727 | ||
| Others | 13,750 | 8,685 | ||
| 448,301 | 600,990 | |||
14. Equity
As of December 31, 2023, the share capital of the Company amounts to $11,615,905 ($11,605,513 as of December 31, 2022) represented by 116,159,054 ordinary shares (116,055,126 shares as of December 31, 2022) fully subscribed and disbursed with a nominal value of $0.10 each, all in the same class and series. Each share grants one voting right.
Algonquin owns 42.2% of the shares of the Company and is its largest shareholder as of December 31, 2023. Algonquin’s voting rights and rights to appoint directors are limited to 41.5% and the difference between Algonquin´s ownership and 41.5% will vote replicating non-Algonquin’s shareholders’ vote.
The Company accounts for its existing long-term incentive plans granted to employees as equity-settled in accordance with IFRS 2, Share-based Payment when incentives are being settled in shares. During the year 2023, the Company issued 103,928 new shares (228,560 new shares during the year 2022) to its employees to settle a portion of these plans.
On February 28, 2022, the Company established a new “at-the-market program” which replaced its previous program, and entered into a distribution agreement with BofA Securities, MUFG and RBC Capital Markets, as its sales agents, under which the Company may offer and sell from time to time up to $150 million of its ordinary shares. During the year 2023, the Company did not sell any shares under this program. During the year 2022, the Company sold 3,423,593 shares at an average market price of $33.57 pursuant to its distribution agreement, representing net proceeds of $114 million.
Atlantica´s reserves as of December 31, 2023 are made up of share premium account and capital reserves. The share premium account reduction by $250 million during the year 2023, increasing capital reserves by the same amount, was made effective upon the confirmation received on June 26, 2023 from the High Court in the UK, pursuant to the Companies Act 2006.
Other reserves primarily include the change in fair value of cash flow hedges and its tax effect.
Accumulated currency translation differences primarily include the result of translating the financial statements of subsidiaries prepared in a foreign currency into the presentation currency of the Company, the U.S. dollar.
Accumulated deficit primarily includes results attributable to Atlantica.
Non-controlling interest fully relate to interest held by JGC in Solacor 1 and Solacor 2, by Idae in Seville PV, by Itochu Corporation in Solaben 2 and Solaben 3, by Algerian Energy Company, SPA and Sacyr Agua S.L. in Skikda, by Algerian Energy Company, SPA in Tenes, by Industrial Development Corporation of South Africa (IDC) and Kaxu Community Trust in Kaxu, by Algonquin Power Co. in AYES Canada, and by partners of the Company in the Chilean renewable energy platform in Chile PV 1, Chile PV 2 and Chile PV 3.
Additional information of subsidiaries including material non-controlling interest as of December 31, 2023, and 2022, is disclosed in Appendix IV.
Dividends declared during the year 2023 and the first quarter of 2024 by the Board of Directors of the Company were as follows:
| Declared | Payable |
Amount ($) per share |
| February 29, 2024 | March 22, 2024 | 0.445 |
| November 7, 2023 | December 15, 2023 | 0.445 |
| July 31, 2023 | September 15, 2023 | 0.445 |
| May 4, 2023 | June 15, 2023 | 0.445 |
| February 28, 2023 | March 25, 2023 | 0.445 |
Dividends declared during the year 2022 by the Board of Directors of the Company were as follows:
| Declared | Payable |
Amount ($) per share |
| November 8, 2022 | December 15, 2022 | 0.445 |
| August 2, 2022 | September 15, 2022 | 0.445 |
| May 5, 2022 | June 15, 2022 | 0.44 |
| February 25, 2022 | March 25, 2022 | 0.44 |
In addition, the Company declared dividends and distributions in 2023 to non-controlling interest primarily to Algonquin (interest in Amherst through AYES Canada, see Note 7) for $16.6 million ($20.4 million in 2022), Itochu Corporation for $6.9 million ($3.5 million in 2022), Algerian Energy Company for $6.7 million ($5.4 million in 2022) and IDC and Kaxu Community Trust for $1.2 million ($5.8 million in 2022).
In 2023, Chile PV 3 received a capital contribution of $19.5 million from the financial partners (Non-controlling interest) through the renewable energy platform of the Company in Chile to install batteries in the asset (Note 1).
As of December 31, 2023 and December 31, 2022, there was no treasury stock and there have been no transactions with treasury stock during the years then ended.
15. Corporate Debt
The breakdown of the corporate debt as of December 31, 2023 and 2022 is as follows:
|
Balance as of December 31, 2023 $’000 |
Balance as of December 31, 2022 $’000 |
|||
| Non-current | 1,050,816 | 1,000,503 | ||
| Current | 34,022 | 16,697 | ||
| Total Non-current | 1,084,838 | 1,017,200 |
On July 20, 2017, the Company signed a credit facility (the “2017 Credit Facility”) for up to €10.0 million ($11.0 million), which is available in euros or U.S. dollars. Amounts drawn down accrue interest at a rate per year equal to EURIBOR plus 2% or SOFR plus 2%, depending on the currency, with a floor of 0% on the EURIBOR and SOFR. As of December 31, 2023, $9.9 million has been drawn down ($6.4 million as of December 31, 2022). As of December 31, 2022, the credit facility maturity was July 1, 2024. On August 7, 2023, the available amount under the 2017 Credit Facility has been increased to €15.0 million ($16.6 million) and the maturity extended to July 1, 2025.
On May 10, 2018, the Company entered into the Revolving Credit Facility for $215 million with a syndicate of banks. Amounts drawn down accrue interest at a rate per year equal to (A) for Eurodollar rate loans, Term SOFR, plus a Term SOFR Adjustment equal to 0.10% per annum, plus a percentage determined by reference to the leverage ratio of the Company, ranging between 1.60% and 2.25% and (B) for base rate loans, the highest of (i) the rate per annum equal to the weighted average of the rates on overnight U.S. Federal funds transactions with members of the U.S. Federal Reserve System arranged by U.S. Federal funds brokers on such day plus ½ of 1.00%, (ii) the U.S. prime rate and (iii) Term SOFR plus 1.00%, in any case, plus a percentage determined by reference to the leverage ratio of the Company, ranging between 0.60% and 1.00%. Letters of credit may be issued using up to $100 million of the Revolving Credit Facility. Since then, the amount of the Revolving Credit Facility increased to $450 million. On May 30, 2023, the maturity was extended to December 31, 2025. On December 31, 2023, $55 million were drawn down ($30 million as of December 31, 2022). On December 31, 2023, the Company issued letters of credit for $17 million ($35 million as of December 31, 2022). As of December 31, 2023, therefore, $378 million of the Revolving Credit Facility were available ($385 million as of December 31, 2022).
On October 8, 2019, the Company filed a euro commercial paper program (the “Commercial Paper”) with the Alternative Fixed Income Market (MARF) in Spain. The program had an original maturity of twelve months and was extended for annual periods until October 2023. The program allowed Atlantica to issue short term notes over the next twelve months for up to €50 million ($55 million), with such notes having a tenor of up to two years. On November 21, 2023, the Company filed a new program that allows Atlantica to issue short term notes for up to €100 million, with such notes having a tenor of up to two years and the program maturity has been extended twelve months. As of December 31, 2023, the Company had €23.3 million ($25.7 million) issued and outstanding under the program at an average cost of 5.23% (€9.3 million, or $10.1 million, as of December 31, 2022).
On April 1, 2020, the Company closed the secured 2020 Green Private Placement for €290 million ($320 million). The private placement accrues interest at an annual 1.96% interest rate, payable quarterly and has a June 2026 maturity.
On July 8, 2020, the Company entered into the Note Issuance Facility 2020, a senior unsecured financing with a group of funds managed by Westbourne Capital as purchasers of the notes issued thereunder for a total amount of $155 million which is denominated in euros (€140 million). The Note Issuance Facility 2020 was issued on August 12, 2020, interest accrues at a rate per annum equal to the sum of the 3-month EURIBOR plus a margin of 5.25% with a floor of 0% for the EURIBOR, payable quarterly and has a maturity of seven years from the closing date. The Company initially entered into a cap at 0% for the EURIBOR with 3.5 years maturity and in December 2023, into a cap at 4% to hedge the variable interest rate risk with maturity on December 31, 2024.
On July 17, 2020, ASI Jersey Ltd, a subsidiary of the Company issued the Green Exchangeable Notes for $100 million in aggregate principal amount of 4.00% convertible bonds due in 2025. On July 29, 2020, the Company closed an additional $15 million aggregate principal amount of the Green Exchangeable Notes. The notes mature on July 15, 2025, and bear interest at a rate of 4.00% per annum. The initial exchange rate of the notes is 29.1070 ordinary shares per $1,000 principal amount of notes, which is equivalent to an initial exchange price of $34.36 per ordinary share. Noteholders may exchange their notes at their option at any time prior to the close of business on the scheduled trading day immediately preceding April 15, 2025, only during certain periods and upon satisfaction of certain conditions. On or after April 15, 2025, noteholders may exchange their notes at any time. Upon exchange, the notes may be settled, at the election of the Company, into Atlantica ordinary shares, cash or a combination thereof. The exchange rate is subject to adjustment upon the occurrence of certain events.
As per IAS 32, “Financial Instruments: Presentation”, the conversion option of the Green Exchangeable Notes is an embedded derivative classified within the line “Derivative liabilities” of these Consolidated Financial Statements (Note 10). It was initially valued at the transaction date for $10 million, and prospective changes to its fair value are accounted for directly through the profit and loss statement. This instrument is classified as Level 2 in the fair value hierarchy (Note 2.7) based on the observable inputs used for the calculation of its fair value. The valuation technique used is a Monte Carlo which uses regressions to estimate, given a stock price level, the continuation value of the instrument. The principal element of the Green Exchangeable Notes, classified within the line “Corporate debt” of these Consolidated Financial Statements, is initially valued as the difference between the consideration received from the holders of the instrument and the value of the embedded derivative, and thereafter, at amortized cost using the effective interest method as per IFRS 9, Financial Instruments.
On May 18, 2021, the Company issued the Green Senior Notes due in 2028 in an aggregate principal amount of $400 million. The notes mature on May 15, 2028 and bear interest at a rate of 4.125% per annum payable on June 15 and December 15 of each year, commencing December 15, 2021.
On May 10, 2023, the Company entered into a senior unsecured $50 million line of credit with Export Development Canada with a 3-year maturity. Loan under the credit line accrues interest at a rate per annum equal to Term SOFR plus a percentage determined by reference to the leverage ratio of the Company, ranging between 2.46% and 3.11%, with a floor of 0.00% for the Term SOFR. The facility matures on May 25, 2026, and was fully available as of December 31, 2023.
Since 2020, the Company entered into loans with different banks as follows:
- a €5 million ($5.5 million) loan on December 4, 2020, which accrues interest at a rate per year equal to 2.50%. The maturity date is December 4, 2025.
- a €5 million ($5.5 million) loan on January 31, 2022, which accrues interest at a rate per year equal to 1.90%. The maturity date is January 31, 2026.
- a €7 million ($7.7 million) loan on February 24, 2023, which accrues interest at a rate per year equal to 4.21%. The maturity date is February 24, 2028.
The repayment schedule for the Corporate debt at the end of 2023 is as follows:
| 2024 | 2025 | 2026 | 2027 | 2028 | Total | |||||||
| 2017 Credit Facility | 13 | 9,876 | - | - | - | 9,889 | ||||||
| Revolving Credit Facility | 261 | 54,427 | - | - | - | 54,688 | ||||||
| Commercial paper | 25,691 | - | - | - | - | 25,691 | ||||||
| 2020 Green Private Placement | 174 | - | 318,668 | - | - | 318,842 | ||||||
| 2020 Note Issuance Facility | - | - | - | 152,356 | - | 152,356 | ||||||
| Green Exchangeable Notes | 2,108 | 110,020 | - | - | - | 112,128 | ||||||
| Green Senior Note | 963 | - | - | - | 395,964 | 396,927 | ||||||
| Other bank Loans | 4,812 | 4,736 | 2,288 | 1,642 | 839 | 14,317 | ||||||
| Total | 34,022 | 179,059 | 320,956 | 153,998 | 396,803 | 1,084,838 |
The repayment schedule for the Corporate debt at the end of 2022 was as follows:
| 2023 | 2024 | 2025 | 2026 | 2027 | Subsequent years | Total | ||||||||
| 2017 Credit Facility | 8 | 6,423 | - | - | - | - | 6,431 | |||||||
| Revolving Credit Facility | 112 | 29,387 | - | - | - | - | 29,499 | |||||||
| Commercial paper | 9,937 | - | - | - | - | - | 9,937 | |||||||
| 2020 Green Private Placement | 423 | - | - | 308,389 | - | - | 308,812 | |||||||
| 2020 Note Issuance Facility | - | - | - | - | 147,257 | - | 147,257 | |||||||
| Green Exchangeable Notes | 2,107 | - | 107,055 | - | - | - | 109,162 | |||||||
| Green Senior Note | 964 | - | - | - | - | 395,060 | 396,024 | |||||||
| Other bank Loans | 3,146 | 3,122 | 3,124 | 686 | - | - | 10,078 | |||||||
| Total | 16,697 | 38,932 | 110,179 | 309,075 | 147,257 | 395,060 | 1,017,200 |
The following table details the movement in corporate debt for the year 2023:
|
Corporate debt - long term $’000 |
Corporate debt - short term $’000 |
Total $’000 |
||||
| Balance as of December 31, 2022 | 1,000,503 | 16,697 | 1,017,200 | |||
| Nominal increase | 35,648 | 126,537 | 162,185 | |||
| Nominal repayment | - | (115,891) | (115,891) | |||
| Interest payment | - | (40,573) | (40,573) | |||
| Total cash changes | 35,648 | (29,927) | 5,721 | |||
| Interest accrued | - | 40,570 | 40,570 | |||
| Currency translation differences | 15,037 | 1,255 | 16,292 | |||
| Other non-cash changes | 5,055 | - | 5,055 | |||
| Reclassifications | (5,427) | 5,427 | - | |||
| Total non-cash changes | 14,665 | 47,252 | 61,917 | |||
| Balance as of December 31, 2023 | 1,050,816 | 34,022 | 1,084,838 |
The following table details the movement in corporate debt for the year 2022:
|
Corporate debt - long term $’000 |
Corporate debt - short term $’000 |
Total $’000 |
||||
| Balance as of December 31, 2021 | 995,190 | 27,881 | 1,023,071 | |||
| Nominal increase | 35,574 | 65,566 | 101,140 | |||
| Nominal repayment | (1,323) | (79,196) | (80,519) | |||
| Interest payment | - | (38,117) | (38,117) | |||
| Total cash changes | 34,251 | (51,747) | (17,496) | |||
| Interest accrued | - | 38,321 | 38,321 | |||
| Currency translation differences | (29,419) | (1,423) | (30,842) | |||
| Other non-cash changes | 4,146 | - | 4,146 | |||
| Reclassifications | (3,665) | 3,665 | - | |||
| Total non-cash changes | (28,938) | 40,563 | 11,625 | |||
| Balance as of December 31, 2022 | 1,000,503 | 16,697 | 1,017,200 |
16. Project debt
This note shows the project debt linked to the assets included in Note 6 of these Consolidated Financial Statements.
Project debt is generally used to finance contracted assets, exclusively using as a guarantee the assets and cash flows of the company or group of companies carrying out the activities financed. In most of the cases, the assets and/or contracts are set up as a guarantee to ensure the repayment of the related financing. In addition, the cash of the Company´s projects includes funds held to satisfy the customary requirements of certain non-recourse debt agreements and other restricted cash (Note 13) for an amount of $177 million as of December 31, 2023 ($208 million as of December 31, 2022).
The variations in 2023 of project debt have been the following:
|
Project debt - long term $’000 |
Project debt - short term $’000 |
Total $’000 |
||||
| Balance as of December 31, 2022 | 4,226,518 | 326,534 | 4,553,052 | |||
| Nominal increase | 213,232 | - | 213,232 | |||
| Nominal repayment | (4,768) | (513,576) | (518,344) | |||
| Interest payment | - | (227,145) | (227,145) | |||
| Total cash changes | 208,464 | (740,721) | (532,257) | |||
| Interest accrued | - | 227,418 | 227,418 | |||
| Currency translation differences | 28,808 | 7,150 | 35,958 | |||
| Other non-cash changes | 35,024 | 65 | 35,089 | |||
| Reclassifications | (566,941) | 566,941 | - | |||
| Total non-cash changes | (503,109) | 801,574 | 298,465 | |||
| Balance as of December 31, 2023 | 3,931,873 | 387,387 | 4,319,260 |
The decrease in total project debt as of December 31, 2023, is primarily due to the repayment of project debt for the period in accordance with the financing arrangements.
The Company refinanced the Solaben 2&3 assets in March 2023, entering into two green senior euro-denominated loan agreements for the two assets with a syndicate of banks for a total amount of €198.0 million. The new project debt replaced the previous project loans for a similar amount and maturity was extended from December 2030 to June 2037.
Chile PV 1 and Chile PV 2, where the Company owns a 35% equity interest, were not able to maintain the minimum required cash in its debt service reserve account during the year 2023 due to low electricity prices, which represents an event of default as of December 31, 2023. As a result, although the Companies do not expect an acceleration of the debts to be declared by the credit entities, Chile PV 1 and Chile PV 2 did not have an unconditional right to defer the settlement of the debt for at least twelve months and the project debts, which amount to $50 million and $21 million as of December 31, 2023, respectively, were classified as current in these Consolidated Financial Statements in accordance with International Accounting Standards 1 (“IAS 1”), “Presentation of Financial Statements”.
The variations in 2022 of project debt have been the following:
|
Project debt - long term $’000 |
Project debt - short term $’000 |
Total $’000 |
||||
| Balance as of December 31, 2021 | 4,387,674 | 648,519 | 5,036,193 | |||
| Nominal repayment | (73,478) | (310,629) | (384,107) | |||
| Interest payment | - | (232,855) | (232,855) | |||
| Total cash changes | (73,478) | (543,484) | (616,962) | |||
| Interest accrued | - | 230,237 | 230,237 | |||
| Business combination (Note 5) | 1,301 | 148 | 1,449 | |||
| Currency translation differences | (119,068) | (18,040) | (137,108) | |||
| Other non-cash changes | 39,161 | 82 | 39,243 | |||
| Reclassifications | (9,072) | 9,072 | - | |||
| Total non-cash changes | (87,678) | 221,499 | 133,821 | |||
| Balance as of December 31, 2022 | 4,226,518 | 326,534 | 4,553,052 |
The decrease in total project debt as of December 31, 2022 were primarily due to:
| - | the repayment of project debt for the period in accordance with the financing arrangements; and |
| - | the lower value of debt denominated in Euros given the depreciation of the Euro against the U.S. dollar since December 31, 2021. |
As of December 31, 2021, Kaxu total debt was presented as current in the Consolidated Financial Statements of the Company, for an amount of $314 million, in accordance with International Accounting Standards 1 (“IAS 1”), “Presentation of Financial Statements”, as a result of the existence of a theoretical event of default under the Kaxu project finance agreement. Since March 31, 2022, the Company has again an unconditional right to defer the settlement of the debt for at least more than twelve months, and therefore the debt previously presented as current in these Consolidated Financial Statements was reclassified as non-current in accordance with the financing agreements.
The repayment schedule for project debt in accordance with the financing arrangements as of December 31, 2023, and assuming there would be no acceleration at the Chile PV 1 and Chile PV 2 debts as of December 31, 2023, is as follows and is consistent with the projected cash flows of the related projects:
| 2024 | 2025 | 2026 | 2027 | 2028 | Subsequent | Total | |||||||||||||||||||||||
|
Interest Payment |
Nominal repayment |
years | |||||||||||||||||||||||||||
| 15,215 | 305,087 | 325,303 | 352,495 | 499,968 | 464,648 | 2,356,544 | 4,319,260 | ||||||||||||||||||||||
The repayment schedule for project debt in accordance with the financing arrangements was as follows and was consistent with the projected cash flows of the related projects:
| 2023 | 2024 | 2025 | 2026 | 2027 | Subsequent | Total | |||||||||||||||||||||||
|
Interest Payment |
Nominal repayment |
years | |||||||||||||||||||||||||||
| 15,053 | 311,481 | 323,731 | 442,920 | 358,444 | 504,954 | 2,596,469 | 4,553,052 | ||||||||||||||||||||||
The equivalent in U.S. dollars of the most significant foreign-currency-denominated project debts held by the Company is as follows:
| Currency | Balance as of December 31, 2023 $’000 |
Balance as of December 31, 2022 $’000 |
||||||
| Euro | 1,571,369 | 1,633,790 | ||||||
| South African Rand | 233,854 | 277,492 | ||||||
| Algerian Dinar | 76,277 | 86,739 | ||||||
| Total | 1,881,500 | 1,998,021 | ||||||
All of the Company’s financing agreements have a carrying amount close to its fair value.
17. Grants and Other Liabilities
|
Balances as of December 31, 2023 $’000 |
Balances as of December 31, 2022 $’000 |
|||||||
| Grants | 852,854 | 911,593 | ||||||
| Other liabilities and provisions | 380,954 | 340,920 | ||||||
| Dismantling provision | 155,279 | 140,595 | ||||||
| Lease liabilities | 82,366 | 63,076 | ||||||
| Accruals on Spanish market prices differences | 98,820 | 91,884 | ||||||
| Other | 44,489 | 45,365 | ||||||
| Grant and other non-current liabilities | 1,233,808 | 1,252,513 | ||||||
As of December 31, 2023, the amount recorded in Grants corresponds primarily to the ITC Grant awarded by the U.S. Department of the Treasury to Solana and Mojave for a total amount of $578 million ($610 million as of December 31, 2022), which was primarily used to fully repay the Solana and Mojave short-term tranche of the loan with the Federal Financing Bank. The amount recorded in Grants as a liability is progressively recorded as other income over the useful life of the asset.
The remaining balance of the “Grants” account corresponds to loans with interest rates below market rates for Solana and Mojave for a total amount of $273 million ($299 million as of December 31, 2022). Loans with the Federal Financing Bank guaranteed by the Department of Energy for these projects bear interest at a rate below market rates for these types of projects and terms. The difference between proceeds received from these loans and its fair value, is initially recorded as “Grants” in the consolidated statement of financial position, and subsequently recorded progressively in “Other operating income” starting at the entry into operation of the plants.
Total amount of income for these two types of grants for Solana and Mojave is $58.5 million and $58.6 million for the years ended December 31, 2023 and 2022, respectively (Note 22).
The increase in Other liabilities and provisions in 2023 is primarily due to the accretion expense recognized in the year when updating the present value of these liabilities.
The “Accruals on Spanish market prices differences” corresponds to the differences that occur in each financial year between revenue from the sale of energy at the estimated price determined by the Administration in Spain in accordance with the reasonable profitability scheme determined by law, and the revenue from the sale of energy at the actual average market price in the year. These market price differences are regularized through the compensation and adjustment of the parameters which serve as a basis for calculating the regulated revenue compensation to be received from the Administration in Spain over the remaining regulatory life of the solar assets of the Company to obtain the guaranteed profitability for each solar asset. Current portion amounts to $12.5 million as of December 31, 2023 and $11.9 million as of December 31, 2022 (Note 18).
The maturity of Other liabilities and provisions as of December 31, 2023 and 2022 is as follows:
|
As of December 31, 2023 |
Total | 2024 | 2025 | 2026 | 2027 | 2028 | Subsequent | |||||||||||||||||||||
| Other liabilities and provisions | 380,954 | - | 26,503 | 21,714 | 22,975 | 22,367 | 287,395 | |||||||||||||||||||||
| Total | 380,954 | - | 26,503 | 21,714 | 22,975 | 22,367 | 287,395 | |||||||||||||||||||||
|
As of December 31, 2022 |
Total | 2023 | 2024 | 2025 | 2026 | 2027 |
Subsequent
|
|||||||||||||||||||||
| Other liabilities and provisions | 340,920 | - | 26,393 | 20,096 | 20,561 | 20,867 | 253,003 | |||||||||||||||||||||
| Total | 340,920 | - | 26,393 | 20,096 | 20,561 | 20,867 | 253,003 | |||||||||||||||||||||
| 18. | Trade Payables and Other Current Liabilities |
|
Item |
Balance as of December 31, 2023 $’000 |
Balance as of December 31, 2022 $’000 |
||||||
| Trade accounts payables | 77,266 | 84,465 | ||||||
| Accruals on Spanish market prices differences (Note 17) | 12,475 | 11,936 | ||||||
| Down payments from clients and other deferred income | 16,905 | 11,169 | ||||||
| Other accounts payables | 35,067 | 32,660 | ||||||
| Total | 141,713 | 140,230 | ||||||
Trade accounts payables mainly relate to the operation and maintenance of the plants owned by the Company.
Nominal values of trade payables and other current liabilities are considered to approximately equal fair values and the effect of discounting them is not significant.
| 19. | Income Tax |
All the companies of Atlantica file income taxes according to the tax regulations in force in each country on an individual basis or under consolidation tax regulations.
The ent tax has been calculated as an aggregation of income tax expenses/income of each individual company. In order to calculate the taxable income of the consolidated entities individually, the accounting result is adjusted for temporary and permanent differences, recording the corresponding deferred tax assets and liabilities. At each consolidated profit and loss statement date, a current tax asset or liability is recorded, representing income taxes currently refundable or payable. Deferred income taxes reflect the net tax effects of temporary differences between the carrying amount of assets and liabilities for financial statement and income tax purposes, as determined under enacted tax laws and rates.
Income tax payable is the result of applying the applicable tax rate in force to each tax-paying entity, in accordance with the tax laws in force in the country in which the entity is registered. Additionally, tax deductions and credits are available to certain entities, primarily relating to inter-company trades and tax treaties between various countries to prevent double taxation.
The Company offsets deferred tax assets and deferred tax liabilities in each entity where the latter has a legally enforceable right to set off current tax assets against current tax liabilities, and the deferred tax assets and liabilities relate to income taxes levied by the same taxation authority.
As of December 31, 2023, and 2023, the analysis of deferred tax assets and deferred tax liabilities is as follows:
| Deferred tax assets |
Balance as of December 31, $’000 |
|||||||
| From | 2023 | 2022 | ||||||
| Net operating loss carryforwards (“NOL´s”) | 478,179 | 442,415 | ||||||
| Temporary tax non-deductible expenses | 158,201 | 134,328 | ||||||
| Derivatives financial instruments | 6,855 | 3,461 | ||||||
| Other | 20,800 | 5,895 | ||||||
| Total deferred tax assets | 664,035 | 586,099 | ||||||
| Deferred tax liabilities |
Balance as of December 31, $’000 |
|||||||
| From | 2023 | 2022 | ||||||
| Accelerated tax amortization | 589,111 | 524,363 | ||||||
| Other difference between tax and book value of assets | 154,875 | 186,536 | ||||||
| Derivatives financial instruments | 12,989 | 19,034 | ||||||
| Other | 17,353 | 2,991 | ||||||
| Total deferred tax liabilities | 774,328 | 732,924 | ||||||
After offsetting deferred tax assets and deferred tax liabilities, where applicable, the resulting net amounts presented on the consolidated statement of financial position are as follows:
|
Consolidated statement of financial position classifications |
Balance as of December 31, $’000 |
|||||||
| 2023 | 2022 | |||||||
| Deferred tax assets | 160,995 | 149,656 | ||||||
| Deferred tax liabilities | 271,288 | 296,481 | ||||||
| Net deferred tax liabilities | 110,293 | 146,825 | ||||||
Most of the NOL´s recognized as deferred tax assets correspond to the entities in the U.S. for $310 million, South Africa for $46 million, Peru for $46 million, Chile for $38 million and Spain for $33 million as of December 31, 2023 ($278 million, $53 million, $46 million, $35 million and $28 million as of December 31, 2022, respectively).
As of December 31, 2023, deferred tax assets for non-deductible expenses are primarily due to the temporary limitation of financial expenses deductibles for tax purposes in the solar plants in Spain for $93 million and in the U.S. assets for $49 million ($94 million and $25 million as of December 31, 2022, respectively).
As of December 31, 2023, deferred tax liabilities for accelerated tax amortization are primarily in the U.S. assets for $339 million, the solar plants in Spain for $173 million and Kaxu for $55 million ($274 million, $173 million and $63 million as of December 31, 2022, respectively).
Deferred tax liabilities for other temporary differences between the tax and book value of contracted concessional assets relate primarily to the U.S. entities for $43 million, the Peruvian entities for $39 million, ACT for $34 million and the Chilean entities for $27 million as of December 31, 2023 ($51 million, $37 million, $56 million, and $27 million as of December 31, 2022, respectively).
In relation to tax losses carryforwards and deductions pending to be used recorded as deferred tax assets, the entities evaluate their recoverability projecting forecasted taxable result for the upcoming years and taking into account their tax planning strategy. Deferred tax liabilities reversals are also considered in these projections, as well as any limitation established by tax regulations in force in each tax jurisdiction. Therefore, the carrying amount of deferred tax assets is reviewed at each annual closing date and reduced to the extent that it is no longer probable that sufficient taxable profit will be available to allow all or part of the deferred tax asset to be utilized. Unrecognized deferred tax assets are re-assessed at each annual closing date and are recognized to the extent that it has become probable that future taxable profits will allow the deferred tax asset to be recovered. In assessing the recoverability of deferred tax assets, Atlantica relies on projections of results over the useful life of the contracted concessional assets.
In addition, the Company has $448 million of unrecognized net operating loss carryforwards as of December 31, 2023 ($477 million as of December 31, 2022), as it considers it is not probable that future taxable profits will be available against which these unused tax losses can be utilized.
The movements in deferred tax assets and liabilities during the years ended December 31, 2023 and 2022 were as follows:
| Deferred tax assets | Amount | |||
| As of December 31, 2021 | 172,268 | |||
| Increase/(decrease) through the consolidated profit and loss statement | 29,197 | |||
| Increase/(decrease) through other consolidated comprehensive income (equity) | (46,344) | |||
| Currency translation differences and other | (5,465) | |||
| As of December 31, 2022 | 149,656 | |||
| Increase/(decrease) through the consolidated profit and loss statement | 7,327 | |||
| Increase/(decrease) through other consolidated comprehensive income (equity) | 2,207 | |||
| Currency translation differences and other | 1,805 | |||
| As of December 31, 2023 | 160,995 |
| Deferred tax liabilities | Amount | |||
| As of December 31, 2021 | 308,859 | |||
| Increase/(decrease) through the consolidated profit and loss statement | (19,864) | |||
| Business combinations (Note 5) | 17,608 | |||
| Currency translation differences and other | (10,122) | |||
| As of December 31, 2022 | 296,481 | |||
| Increase/(decrease) through the consolidated profit and loss statement | (27,055) | |||
| Increase/(decrease) through other consolidated comprehensive income (equity) | (5,830) | |||
| Currency translation differences and other | 7,692 | |||
| As of December 31, 2023 | 271,288 | |||
Details of income tax for the years ended December 31, 2023 and 2023 are as follows:
|
Year ended 2023 $’000 |
Year ended 2022 $’000 |
|||||||
| Current tax | (35,172) | (39,372) | ||||||
| Deferred tax | 34,382 | 49,061 | ||||||
| - relating to the origination and reversal of temporary differences | 34,382 | 49,061 | ||||||
| Total income tax (expense)/income | (790) | 9,689 | ||||||
The reconciliations between the theoretical income tax resulting from applying an average statutory tax rate to profit before income tax and the actual income tax expense recognized in the consolidated profit and loss statements for the years ended December 31, 2023 and 2023, are as follows:
|
Year ended 2023 $’000 |
Year ended 2022 $’000 |
||
| Consolidated profit/(loss) before taxes | 37,238 | (11,776) | |
| Average statutory tax rate | 25% | 25% | |
| Corporate income tax at average statutory tax rate | (9,310) | 2,944 | |
| Income tax of associates, net | 3,302 | 5,366 | |
| Differences in statutory tax rates | (4,270) | (4,296) | |
| Unrecognized NOLs and deferred tax assets | (11,070) | (10,944) | |
| Permanent differences | 17,493 | 3,957 | |
| Other adjustments to taxable income and expense | 3,065 | 12,662 | |
| Corporate income tax | (790) | 9,689 | |
Uncertain tax positions as of December 31, 2023 and 2022 have been analyzed by the Company in accordance with IFRIC 23 (uncertainty over income tax treatments). As a result of this analysis, the Company concluded that the risk of the uncertainties is remote and accordingly, the expectation is that these uncertainties would have an insignificant effect on the Consolidated Financial Statements.
| 20. | Commitments, third-party guarantees, contingent assets and liabilities |
Contractual obligations
The following table shows the breakdown of the third-party commitments and contractual obligations as of December 31, 2023 and 2022:
|
2023 $’000 |
Total | 2024 | 2025 | 2026 | 2027 | 2028 | Subsequent |
| Corporate debt (Note 15) | 1,084,838 | 34,022 | 179,059 | 320,956 | 153,998 | 396,803 | - |
| Loans with credit institutions (project debt) (Note 16) | 3,393,767 | 265,649 | 273,015 | 298,527 | 443,503 | 406,282 | 1,706,791 |
| Notes and bonds (project debt) (Note 16) | 925,493 | 54,653 | 52,288 | 53,968 | 56,465 | 58,366 | 649,753 |
| Purchase commitments (*) | 713,509 | 81,868 | 52,814 | 47,164 | 51,768 | 45,243 | 434,652 |
| Accrued interest estimate during the useful life of loans | 1,717,831 | 264,223 | 257,379 | 224,032 | 198,073 | 161,346 | 612,778 |
|
2022 $’000 |
Total | 2023 | 2024 | 2025 | 2026 | 2027 | Subsequent |
| Corporate debt (Note 15) | 1,017,200 | 16,697 | 38,932 | 110,179 | 309,075 | 147,257 | 395,060 |
| Loans with credit institutions (project debt) (Note 16) | 3,595,671 | 273,556 | 275,105 | 391,770 | 305,616 | 449,653 | 1,899,971 |
| Notes and bonds (project debt) (Note 16) | 957,381 | 52,978 | 48,626 | 51,150 | 52,828 | 55,301 | 696,498 |
| Purchase commitments (*) | 823,856 | 96,847 | 99,597 | 54,747 | 51,058 | 56,852 | 464,755 |
| Accrued interest estimate during the useful life of loans | 1,821,915 | 264,626 | 248,794 | 229,142 | 203,961 | 179,386 | 696,006 |
* Purchase commitments include lease commitments for lease arrangements accounted for under IFRS 16 for $135.1 million as of December 31, 2023 ($112.0 million as of December 31, 2022), of which $9.4 million is due within one year and $125.7 million thereafter as of December 31, 2023 ($7.9 million due within one year and $104.1 million thereafter as of December 31, 2022).
Third-party guarantees
As of December 31, 2023, the sum of bank guarantees and surety bonds deposited by the subsidiaries of the Company as a guarantee to third parties (clients, financial entities and other third parties) amounted to $83.2 million ($88.0 million as of December 31, 2022). In addition, Atlantica Sustainable Infrastructure plc or other holding entities on its behalf, had outstanding guarantees amounting to $239.8 million as of December 31, 2022 ($216.9 million as of December 31, 2022), which correspond mainly to guarantees provided to off-takers in PPAs, guarantees for debt service reserve accounts and guarantees for points of access for renewable energy projects.
Corporate debt guarantees
The payment obligations under the Green Senior Notes, the Revolving Credit Facility, the Note Issuance Facility 2020 and the 2020 Green Private Placement are guaranteed on a senior unsecured basis by following subsidiaries of the Company: Atlantica Infraestructura Sostenible, S.L.U., Atlantica Peru, S.A., ACT Holding, S.A. de C.V., Atlantica Investments Limited, Atlantica Newco Limited and Atlantica North America LLC. The Revolving Credit Facility and the 2020 Green Private Placement are also secured with a pledge over the shares of the subsidiary guarantors.
Legal Proceedings
In 2018, an insurance company covering certain Abengoa obligations in Mexico claimed certain amounts related to a potential loss. Atlantica reached an agreement under which Atlantica´s maximum theoretical exposure would in any case be limited to approximately $35 million, including $2.5 million to be held in an escrow account. In January 2019, the insurance company called on this $2.5 million from the escrow account and Abengoa reimbursed this amount. The insurance company could claim additional amounts if they faced new losses after following a process agreed between the parties and, in any case, Atlantica would only make payments if and when the actual loss has been confirmed and after arbitration if the Company initiates it. The Company used to have indemnities from Abengoa for certain potential losses, but such indemnities are no longer valid following the insolvency filing by Abengoa S.A. in February 2021.
In addition, during 2021 and 2022, several lawsuits were filed related to the February 2021 winter storm in Texas against among others Electric Reliability Council of Texas (ERCOT), two utilities in Texas and more than 230 individual power generators, including Post Oak Wind, LLC, the project company owner of Lone Star 2, one of the wind assets in Vento II where the Company currently has a 49% equity interest. The basis for the lawsuit is that the defendants failed to properly prepare for cold weather, including failure to implement measures and equipment to protect against cold weather, and failed to properly conduct their operations before and during the storm.
Atlantica is not a party to any other significant legal proceedings other than legal proceedings arising in the ordinary course of its business. Atlantica is party to various administrative and regulatory proceedings that have arisen in the ordinary course of business.
While Atlantica does not expect these proceedings, either individually or in combination, to have a material adverse effect on its financial position or results of operations, because of the nature of these proceedings Atlantica is not able to predict their ultimate outcomes, some of which may be unfavorable to Atlantica.
| 21. | Staff Costs |
The average number of employees (including executive directors) was:
| 2023 Number |
2022 Number |
|
| Executives | 13 | 13 |
| Middle Managers | 123 | 132 |
| Engineers and Graduates | 287 | 234 |
| Assistants and Professionals | 65 | 46 |
| Plant technicians | 815 | 449 |
| 1,304 | 874 |
Their aggregate remuneration comprised:
|
Year ended 2023 $000 |
Year ended 2022 $000 |
|
| Wages and salaries | (84,150) | (67,453) |
| Social security costs | (13,453) | (7,841) |
| Other staff costs | (6,480) | (4,938) |
| (104,083) | (80,232) |
The increase in employee benefit expenses in 2023 and 2022 is primarily due to the internalization of operation and maintenance services in the solar assets in Spain during 2022 and 2023, and of Kaxu since February 2022.
Total compensation received by the key management of the Company, which includes the CEO, the CFO and 5 key executives, and by the directors of the board of the Company, amounts to $7.3 million in 2023 ($10.8 million in 2022), including $1.9 million (2022: $5.8 million) of long-term awards received. Furthermore, information about the remuneration of individual directors’ is provided in the audited part of the Directors’ Remuneration Report.
| 22. | Other Operating Income and Expenses |
The table below shows the detail of Other operating income and expenses for the years ended December 31, 2023, and 2022:
|
Other Operating income |
For the year ended December 31, 2023 $’000 |
For the year ended December 31, 2022 $’000 |
||
| Grants | 58,742 | 59,056 | ||
| Income from various services and insurance proceeds | 35,731 | 21,726 | ||
| Income from construction services for contracted concessional assets of the Company accounted for under IFRIC 12 | 6,614 | - | ||
| Total | 101,087 | 80,782 |
|
Other Operating Expenses |
For the year ended December 31, 2023 $’000 |
For the year ended December 31, 2022 $’000 |
||
| Raw materials and consumables used | (35,380) | (19,639) | ||
| Leases and fees | (14,403) | (11,512) | ||
| Operation and maintenance | (130,442) | (140,382) | ||
| Independent professional services | (30,656) | (38,894) | ||
| Supplies | (37,822) | (59,336) | ||
| Insurance | (41,087) | (45,756) | ||
| Levies and duties | (15,031) | (19,764) | ||
| Other expenses | (25,187) | (15,965) | ||
| Construction costs from construction services for contracted concessional assets of the Company accounted for under IFRIC 12 | (6,614) | - | ||
| Total | (336,622) | (351,248) | ||
Grants income mainly relate to ITC cash grants and implicit grants recorded for accounting purposes in relation to the FFB loans with interest rates below market rates in Solana and Mojave projects (Note 17).
Insurance proceeds and other includes $15.3 million of insurance income in 2023 related to an unscheduled outage in Kaxu further to a problem found in the turbine. The Company expects to receive compensation from the insurance company to cover part of the damage and business interruption of the plant. In addition, it includes a gain of $4.6 million related to the sale of part of Atlantica´s equity interest in the Colombian portfolio of renewable energy entities (Note 7).
Income and costs from construction services correspond to the projects ATN Expansion 3 and ATS Expansion 1, which are currently under construction. Given that these projects are included within the scope of IFRIC 12 (intangible assets), the Company has recorded the income and the cost of construction in the consolidated statement of profit or loss (Note 2.3).
The decrease in other operating expenses in 2023 is primarily due to:
| - | the internalization of the O&M services in the solar assets in Spain during 2022 and 2023. These services are now provided by employees of Atlantica, whose cost is classified within the line “Employee benefit expenses” of the profit and loss statement; and |
| - | the lower cost of supplies due to lower prices of electricity in the solar assets in Spain in 2023. |
| 23. | Financial Expense, net |
The following table sets forth financial income and expenses for the years ended December 31, 2023 and 2022:
|
For the year ended December 31, 2023 $’000 |
For the year ended December 31, 2022 $’000 |
||
| Financial income | |||
| Interest income on deposits and current accounts | 21,715 | 7,740 | |
| Interest income from loans and credits | 2,942 | 1,299 | |
| Interest rates gains on derivatives: cash flow hedges | 350 | 1,110 | |
| TOTAL | 25,007 | 10,149 |
|
For the year ended December 31, 2023 $’000 |
For the year ended December 31, 2022 $’000 |
||
| Financial expense | |||
| Interest on loans and notes | (350,347) | (292,043) | |
| Interest rates gains/(losses) on derivatives: cash flow hedges | 26,598 | (38,402) | |
| TOTAL | (323,749) | (330,445) |
Interest income on deposits and current accounts increased in 2023 mostly due to higher remuneration of deposits resulting from higher interest rates.
Interest expense on loans and notes primarily include interest on corporate and project debt which increase in 2023 is primarily due to the increase in variable spot interest rates. Considering interest gains on hedge instruments of such loans and notes, total interest decreased in 2023, which is primarily due to the repayment of project and corporate debt in accordance with the financing arrangements.
Gains and losses from interest rate derivatives designated as cash flow hedges primarily correspond to transfers from equity to financial income or expense when the hedged item impacts the consolidated profit and loss statement. The decrease on losses and increase of gains in 2023 compared to 2022 is due to an increase in the spot interest rates in 2023 compared to 2022, which implies lower interest payments or higher payments received from the derivatives instruments contracted.
Net exchange differences
Net exchange differences primarily correspond to realized and unrealized exchange gains and losses on transactions in foreign currencies as part of the normal course of the business of the Company and to the change in fair value of caps hedging the net cash flows in Euros of the Company, which was largely stable in 2023 while it accounted for an income in 2022.
Other financial income/(expenses), net
The following table sets out Other financial income/(expenses), net for the years 2023 and 2022:
|
For the year ended December 31, 2023 $’000 |
For the year ended December 31, 2022 $’000 |
||
| Other financial income / (expense), net | |||
| Other financial income | 8,863 | 20,539 | |
| Other financial losses | (25,546) | (21,434) | |
| TOTAL | (16,683) | (895) |
Other financial income in 2023 primarily include $3.9 million of income further to the change in the fair value of the conversion option of the Green Exchangeable Notes (Note 15) since December 2022, and $0.1 million of income for non-monetary change to the fair value of derivatives of Kaxu for which hedge accounting is not applied ($12.0 million and $6.2 million of income in 2022, respectively).
Other financial losses primarily include guarantees and letters of credit, other bank fees and non-monetary interest expenses for updating the present value of provisions and other long-term liabilities reflecting the passage of time.
| 24. | Earnings Per Share |
Basic earnings per share have been calculated by dividing the profit/(loss) attributable to equity holders of the Company by the average number of outstanding shares.
Average number of outstanding diluted shares for the year 2023 have been calculated considering the potential issuance of 3,347,305 shares (3,347,305 shares as of December 31, 2022) on the settlement of the Green Exchangeable Notes (Note 15) and the potential issuance of 217,418 shares (226,032 as of December 31, 2022) under the long-term incentive plans granted to employees. It also included the potential issuance of 596,681 shares to Algonquin for the year 2022 under the agreement signed on August 3, 2021, according to which Algonquin has the option, on a quarterly basis, to subscribe such number of shares to maintain its percentage in Atlantica in relation to the use of the ATM program (Note 14).
| Item | For the year ended December 31, 2023 |
For the year ended December 31, 2022 |
|||||||
| Profit/(loss) attributable to Atlantica | 43,380 | (5,443) | |||||||
| Average number of ordinary shares outstanding (thousands) - basic | 116,152 | 114,695 | |||||||
| Average number of ordinary shares outstanding (thousands) - diluted | 119,720 | 118,865 | |||||||
| Earnings per share for the year (US dollar per share) - basic | 0.37 | (0.05) | |||||||
| Earnings per share for the year (US dollar per share) – diluted (*) | 0.37 | (0.09) | |||||||
(*) The potential ordinary shares related to the Green Exchangeable Notes and the long-term incentive plans granted to employees have not been considered in the calculation of diluted earnings per share for the year ended December 31, 2023, as they have an antidilutive effect. For the year ended December 31, 2022, the potential ordinary shares related to the long-term incentive plans granted to employees and the ATM program have not been considered in the calculation of diluted earnings per share as they have an antidilutive effect.
| 25. | Auditor’s Remuneration |
The analysis of the auditor’s remuneration is as follows:
|
Year ended 2023 $000 |
Year ended 2022 $000 |
|||
| Fees payable to the Company’s auditor and their associates for the audit of the company’s annual accounts | 738 | 611 | ||
| Fees payable to the Company’s auditor and their associates for other services to the Group | ||||
| –The audit of the Company’s subsidiaries | 1,216 | 1,032 | ||
| Total audit fees | 1,954 | 1,643 | ||
| - Audit-related services | 70 | 422 | ||
|
- Tax services
|
344 | 502 | ||
| Total non-audit fees | 414 | 924 | ||
| 2,368 | 2,567 | |||
“Audit Fees” are the aggregate fees billed for professional services in connection with the audit of the Annual Consolidated Financial Statements, quarterly reviews of the Company financial statements and statutory audits of the subsidiaries’ financial statements under the rules of England and Wales and the countries in which subsidiaries are organized. The increase in audit fees is mainly due to inflation increase partially counterbalanced by exchange rates variations.
“Audit-Related Services” include fees charged for services that can only be provided by the auditor of the Company, such as consents and comfort letters of non-recurring transactions, assurance and related services that are reasonably related to the performance of the audit or review of the Company financial statements. Fees paid during 2023 and 2022 related to comfort letters and consents required for capital market transactions of the major shareholder are also included in this category ($25 thousand and $204 thousand in 2023 and 2022 respectively). These fees were re-invoiced and paid by this shareholder.
“Tax Services” include mainly fees charged for transfer pricing services and tax compliance services in the Company US subsidiaries.
The Audit Committee approved all of the services provided by Ernst & Young S.L and by other member firms of EY.
| 26. | Subsequent Events |
On February 29, 2024, the Board of Directors of the Company approved a dividend of 0.445 per share, which is expected to be paid on March 22, 2024.
| 27. | Service Concessional Arrangements |
Below is a description of the concessional arrangements of the Company.
Solana
Solana is a 250 MW net (280 MW gross) solar electric generation facility located in Maricopa County, Arizona, approximately 70 miles southwest of Phoenix. Arizona Solar One LLC, or Arizona Solar, owns the Solana project. Solana includes a 22-mile 230kV transmission line and a molten salt thermal energy storage system. Solana reached COD on October 9, 2013.
Solana has a 30-year, PPA with Arizona Public Service, or APS, approved by the Arizona Corporation Commission (ACC). The PPA provides for the sale of electricity at a fixed price per MWh with annual increases of 1.84% per year. The PPA includes limitations on the amount and condition of the energy that is received by APS with minimum and maximum thresholds for delivery capacity that must not be breached.
Mojave
Mojave is a 250 MW net (280 MW gross) solar electric generation facility located in San Bernardino County, California, approximately 100 miles northeast of Los Angeles. Mojave reached COD on December 1, 2014.
Mojave has a 25-year, PPA with Pacific Gas & Electric Company, or PG&E, approved by the California Public Utilities Commission (CPUC). The PPA provides for the sale of electricity at a fixed base price per MWh without any indexation mechanism, including limitations on the amount and condition of the energy that is received by PG&E with minimum and maximum thresholds for delivery capacity that must not be breached.
Palmatir
Palmatir is an on-shore wind farm facility in Uruguay with nominal installed capacity of 50 MW. Palmatir has 25 wind turbines and each turbine has a nominal capacity of 2 MW. UTE, Uruguay’s state-owned electricity company, has agreed to purchase all energy produced by Palmatir pursuant to a 20-year PPA. UTE pays a fixed-price tariff per MWh under the PPA, which is denominated in U.S. dollars and is partially adjusted in January of each year according to a formula based on inflation.
Palmatir reached COD in May 2014.
Cadonal
Cadonal is an on-shore wind farm facility in Uruguay with nominal installed capacity of 50 MW. Cadonal has 25 wind turbines and each turbine has a nominal capacity of 2 MW each. UTE, Uruguay´s state-owned electricity company, has agreed to purchase all energy produced by Cadonal pursuant to a 20-year PPA.
Cadonal reached COD in December 2014.
Melowind
Melowind is an on-shore wind farm facility wholly owned by the Company, located in Uruguay with a capacity of 50 MW. Melowind has 20 wind turbines of 2.5 MW each. The asset reached COD in November 2015.
Melowind signed a 20-year PPA with UTE in 2015, for 100% of the electricity produced. UTE pays a fixed tariff under the PPA, which is denominated in U.S. dollars and is partially adjusted every year based on a formula referring to U.S. CPI, Uruguay’s CPI and the applicable UYU/U.S. dollars exchange rate.
Solaben 2 & Solaben 3
The Solaben 2 and Solaben 3 are two 50 MW Solar Power facilities and reached COD in 2012. Itochu Corporation holds 30% of Solaben 2 & Solaben 3.
Renewable energy plants in Spain, like Solaben 2 and Solaben 3, are regulated through a series of laws and rulings which guarantee the owners of the plants a reasonable return for their investments. Solaben 2 and Solaben 3 sell the power they produce into the wholesale electricity market, where offer and demand are matched and the pool price is determined, and also receive additional payments from the CNMC, the Spanish state-owned regulator.
Solacor 1 & Solacor 2
The Solacor 1 and Solacor 2 are two 50 MW Solar Power facilities and reached COD in 2012. JGC Corporation holds 13% of Solacor 1 & Solacor 2.
Solnova 1, 3 & 4
The Solnova 1, 3 and 4 solar plants are located in the municipality of Sanlucar la Mayor, Spain. The plants have 50 MW each and reached COD in 2010.
Helios 1 & 2
The Helios 1 and 2 solar plants are located in Ciudad Real, Spain, and reached COD in 2012. The plants have 50 MW each.
Helioenergy 1 & 2
The Helioenergy 1 and 2 solar plants are located in Ecija, Spain, and reached COD in 2011. The plants have 50 MW each.
Solaben 1 & 6
The Solaben 1&6 are two 50 MW solar plants located in the municipality of Logrosán, Spain and reached COD in 2013.
Kaxu
Kaxu Solar One, or Kaxu, is a 100 MW solar Conventional Parabolic Trough Project located in Paulputs in the Northern Cape Province of South Africa. Atlantica owns 51% of the Kaxu Project, while Industrial Development Corporation of South Africa owns 29% and Kaxu Community Trust owns 20%.
The project reached COD in February 2015.
Kaxu has a 20-year PPA with Eskom SOC Ltd., or Eskom, under a take or pay contract for the purchase of electricity up to the contracted capacity from the facility. Eskom purchases all the output of the Kaxu plant under a fixed price formula in local currency subject to indexation to local inflation. The PPA expires in February 2035.
ACT
The ACT plant is a gas-fired cogeneration facility with a rated capacity of approximately 300 MW and between 550 and 800 metric tons per hour of steam. The plant includes a substation and an approximately 52 mile and 115-kilowatt transmission line.
On September 18, 2009, ACT entered into the Pemex Conversion Services Agreement, or the Pemex CSA, with Pemex. Pemex is a state-owned oil and gas company supervised by the (CRE), the Mexican state agency that regulates the energy industry. The Pemex CSA has a term of 20 years from the in-service date and will expire on March 31, 2033.
According to the Pemex CSA, ACT must provide, in exchange for a fixed price with escalation adjustments, services including the supply and transformation of natural gas and water into thermal energy and electricity. Part of the electricity is to be supplied directly to a Pemex facility nearby, allowing the (CFE) to supply less electricity to that facility. Approximately 90% of the electricity must be injected into the Mexican electricity network to be used by retail and industrial end customers of CFE in the region. Pemex is then entitled to receive an equivalent amount of energy in more than 1,000 of their facilities in other parts of the country from CFE, following an adjustment mechanism under the supervision of CFE.
The Pemex CSA is denominated in U.S. dollars. The price is a fixed tariff and is adjusted annually, part of it according to inflation and part according to a mechanism agreed in the contract that on average over the life of the contract reflects expected inflation. The components of the price structure and yearly adjustment mechanisms were prepared by Pemex and provided to bidders as part of the request for proposal documents.
ATS
ATS is a 569 miles transmission line located in Peru wholly owned by the Company. ATS is part of the Guaranteed Transmission System and comprises several sections of transmission lines and substations. ATS reached COD in 2014. In July 2023, the Company started construction of ATS Expansion 1 project, consisting in the reinforcement of two existing substation with new equipment. The expansion will be part of the existing concession contract and is expected to enter in operation in 2025.
Pursuant to the initial concession agreement, the Ministry of Energy, on behalf of the Peruvian Government, granted ATS a concession to construct, develop, own, operate and maintain the ATS Project. The initial concession agreement became effective on July 22, 2010 and will expire 30 years after COD, which took place in January 2014. ATS is obliged to provide the service of transmission of electric energy through the operation and maintenance of the electric transmission line, according to the terms of the contract and the applicable law.
The laws and regulations of Peru establish the key parameters of the concession contract, the price indexation mechanism, the rights and obligations of the operator and the procedure that have to be followed in order to fix the applicable tariff, which occurs through a regulated bidding process. Once the bidding process is complete and the operator is granted the concession, the pricing of the power transmission service is established in the concession agreement. ATS has a 30-year concession agreement with fixed-price tariff base denominated in U.S. dollars that is adjusted annually after COD of each line, in accordance with the U.S. Finished Goods Less Food and Energy Index published by the U.S. Department of Labor.
ATN
ATN is a 365 miles transmission line located in Peru wholly owned by the Company, which is part of the Guaranteed Transmission System and comprises several sections of transmission lines and substations. ATN reached COD in 2011. On December 28, 2018, ATN S.A. completed the acquisition of a power substation and two small transmission lines to connect its line to the Shahuindo (ATN expansion 1) mine located nearby. In October 2019, the Company also closed the acquisition of ATN Expansion 2. In July 2022 the Company closed a transmission service agreement that allows to build a substation and a 2.4-miles transmission line connected to ATN transmission line serving a new mine in Peru (ATN Expansion 3), which is expected to enter in operation in 2024.
Pursuant to the initial concession agreement, the Ministry of Energy, on behalf of the Peruvian Government, granted ATN a concession to construct, develop, own, operate and maintain the ATN Project. The initial concession agreement became effective on May 22, 2008 and will expire 30 years after COD of the first tranche of the line, which took place in January 2011. ATN is obliged to provide the service of transmission of electric energy through the operation and maintenance of the electric transmission line, according to the terms of the contract and the applicable law.
The laws and regulations of Peru establish the key parameters of the concession contract, the price indexation mechanism, the rights and obligations of the operator and the procedures that have to be followed in order to fix the applicable tariff, which occurs through a regulated bidding process. Once the bidding process is complete and the operator is granted the concession, the pricing of the power transmission service is established in the concession agreement. ATN has a 30-year concession agreement with a fixed-price tariff base denominated in U.S. dollars that is adjusted annually after COD of each line, in accordance with the U.S. Finished Goods Less Food and Energy Index published by the U.S. Department of Labor. In addition, both ATN Expansion 1 and ATN Expansion 2 have 20-year PPAs denominated in U.S. dollars. ATN Expansion 3 has a 17-year transmission service agreement denominated in U.S. dollars.
ATN 2
ATN 2, is an 81 miles transmission line located in Peru wholly owned by the Company, which is part of the Complementary Transmission System. ATN 2 reached COD in June 2015.
The Client is Las Bambas Mining Company.
The ATN 2 Project has a 18-year contract period, after that, ATN 2 assets will remain as property of the SPV allowing ATN 2 to potentially sign a new contract. The ATN 2 Project has a fixed-price tariff base denominated in U.S. dollars, partially adjusted annually in accordance with the U.S. Finished Goods Less Food and Energy Index as published by the U.S. Department of Labor. The receipt of the tariff base is independent from the effective utilization of the transmission lines and substations related to the ATN 2 Project. The tariff base is intended to provide the ATN 2 Project with consistent and predictable monthly revenues sufficient to cover the ATN 2 Project’s operating costs and debt service and to earn an equity return. Peruvian law requires the existence of a definitive concession agreement to perform electricity transmission activities where the transmission facilities cross public land or land owned by third parties. On May 31, 2014, the Ministry of Energy granted the project a definitive concession agreement to the transmission lines of the ATN 2 Project.
Quadra 1 & Quadra 2
Quadra 1 is a 49-miles transmission line project and Quadra 2 is a 32-miles transmission line project, each connected to the Sierra Gorda substations.
Both projects have concession agreements with Sierra Gorda SCM. The agreements are denominated in U.S. dollars and are indexed mainly to CPI. The concession agreements each have a 21-year term that began on COD, which took place in April 2014 and March 2014 for Quadra 1 and Quadra 2, respectively.
Quadra 1 and Quadra 2 belong to the Northern Interconnected System (SING), one of the two interconnected systems into which the Chilean electricity market is divided and structured for both technical and regulatory purposes.
As part of the SING, Quadra 1 and Quadra 2 and the service they provide are regulated by several regulatory bodies, in particular: the Superintendent’s office of Electricity and Fuels (SEC), the Economic Local Dispatch Center (CDEC), the National Board of Energy (CNE) and the National Environmental Board (CONAMA) and other environmental regulatory bodies.
In all these concession arrangements, the operator has all the rights necessary to manage, operate and maintain the assets and the obligation to provide the services defined above, which are clearly defined in each concession contract and in the applicable regulations in each country.
Skikda
The Skikda project is a water desalination plant located in Skikda, Algeria. AEC owns 49% and Sacyr Agua S.L. owns indirectly the remaining 16.83% of the Skikda project.
Skikda has a capacity of 3.5 M ft3 per day of desalinated water and is in operation since February 2009. The project serves a population of 0.5 million.
The water purchase agreement is a 25-year take-or-pay contract with Sonatrach / Algerienne des Eaux (“ADE”). The tariff structure is based upon plant capacity and water production, covering variable cost (water cost plus electricity cost). Tariffs are adjusted monthly based on the indexation mechanisms that include local inflation, U.S. inflation and the exchange rate between the U.S. dollar and local currency.
Honaine
The Honaine project is a water desalination plant located in Taffsout, Algeria. Myah Bahr Honaine Spa, or MBH, is the vehicle incorporated in Algeria for the purposes of owning the Honaine project. Algerian Energy Company, SPA, or AEC, owns 49% and Sacyr Agua S.L., a subsidiary of Sacyr, S.A., owns indirectly the remaining 25.5% of the Honaine project.
Honaine has a capacity of seven M ft3 per day of desalinated water and it is under operation since July 2012.
The water purchase agreement is a 25-year take-or-pay contract with Sonatrach / ADE. The tariff structure is based upon plant capacity and water production, covering variable cost (water cost plus electricity cost). Tariffs are adjusted monthly based on the indexation mechanisms that include local inflation, U.S. inflation and the exchange rate between the U.S. dollar and local currency.
Tenes
Tenes is a water desalination plant located in Algeria. Befesa Agua Tenes has a 51.0% stake in Ténès Lilmiyah SpA. The remaining 49% is owned by AEC.
The water purchase agreement is a 25-year take-or-pay contract with Sonatrach/ADE. The tariff structure is based upon plant capacity and water production, covering variable cost (water cost plus electricity cost). Tariffs are adjusted monthly based on the exchange rate between the U.S. dollar and local currency and yearly based on indexation mechanisms that include local inflation and U.S. inflation.
Assets subject to the application of IFRIC 12 interpretation based on the concession of services as of December 31, 2023:
| Project name | Country | Status(1) | % of nominal Share(2) | Period of Concession (4)(5) | Off-taker(7) | Financial/ Intangible (3) | Assets/ Investment | Accumulated Amortization | Operating Profit/ (Loss)(8) | Arrangement Terms (price) | Description of the Arrangement |
| Renewable energy: | |||||||||||
| Solana | USA | (O) | 100.0 | 30 Years | APS | (I) | 1,904,464 | (718,410) | 32,723 | Fixed price per MWh with annual increases of 1.84% per year | 30-year PPA with APS regulated by ACC |
| Mojave | USA | (O) | 100.0 | 25 Years | PG&E | (I) | 1,581,518 | (559,300) | 50,164 | Fixed price per MWh without any indexation mechanism | 25-year PPA with PG&E regulated by CPUC and CAEC |
| Palmatir | Uruguay | (O) | 100.0 | 20 Years | UTE, Uruguay Administration | (I) | 147,934 | (71,074) | 5,454 | Fixed price per MWh in USD with annual increases based on inflation | 20-year PPA with UTE, Uruguay state-owned utility |
| Cadonal | Uruguay | (O) | 100.0 | 20 Years | UTE, Uruguay Administration | (I) | 122,013 | (55,724) | 3,272 | Fixed price per MWh in USD with annual increases based on inflation | 20-year PPA with UTE, Uruguay state-owned utility |
| Melowind | Uruguay | (O) | 100.0 | 20 Years | UTE, Uruguay Administration | (I) | 136,089 | (51,197) | 5,141 | Fixed price per MWh in USD with annual increases based on inflation | 20-year PPA with UTE, Uruguay state-owned utility |
| Solaben 2 | Spain | (O) | 70.0 | 25 Years | Kingdom of Spain | (I) | 307,766 | (114,598) | 5,534 | Regulated revenue base(6) | Regulated revenue established by different laws and rulings in Spain |
| Solaben 3 | Spain | (O) | 70.0 | 25 Years | Kingdom of Spain | (I) | 306,228 | (115,252) | 5,555 | Regulated revenue base(6) | Regulated revenue established by different laws and rulings in Spain |
| Solacor 1 | Spain | (O) | 87.0 | 25 Years | Kingdom of Spain | (I) | 310,841 | (122,549) | 3,970 | Regulated revenue base(6) | Regulated revenue established by different laws and rulings in Spain |
| Solacor 2 | Spain | (O) | 87.0 | 25 Years | Kingdom of Spain | (I) | 324,096 | (126,518) | 3,028 | Regulated revenue base(6) | Regulated revenue established by different laws and rulings in Spain |
| Solnova 1 | Spain | (O) | 100.0 | 25 Years | Kingdom of Spain | (I) | 310,660 | (142,585) | 6,267 | Regulated revenue base(6) | Regulated revenue established by different laws and rulings in Spain |
| Solnova 3 | Spain | (O) | 100.0 | 25 Years | Kingdom of Spain | (I) | 290,380 | (129,102) | 7,914 | Regulated revenue base(6) | Regulated revenue established by different laws and rulings in Spain |
| Solnova 4 | Spain | (O) | 100.0 | 25 Years | Kingdom of Spain | (I) | 271,494 | (120,218) | 8,141 | Regulated revenue base(6) | Regulated revenue established by different laws and rulings in Spain |
| Helios 1 | Spain | (O) | 100.0 | 25 Years | Kingdom of Spain | (I) | 315,215 | (118,604) | 3,645 | Regulated revenue base(6) | Regulated revenue established by different laws and rulings in Spain |
| Helios 2 | Spain | (O) | 100.0 | 25 Years | Kingdom of Spain | (I) | 307,195 | (113,976) | 3,417 | Regulated revenue base(6) | Regulated revenue established by different laws and rulings in Spain |
| Helioenergy 1 | Spain | (O) | 100.0 | 25 Years | Kingdom of Spain | (I) | 300,569 | (117,465) | 7,826 | Regulated revenue base(6) | Regulated revenue established by different laws and rulings in Spain |
| Helioenergy 2 | Spain | (O) | 100.0 | 25 Years | Kingdom of Spain | (I) | 301,317 | (115,295) | 7,556 | Regulated revenue base(6) | Regulated revenue established by different laws and rulings in Spain |
| Solaben 1 | Spain | (O) | 100.0 | 25 Years | Kingdom of Spain | (I) | 305,396 | (104,265) | 6,581 | Regulated revenue base(6) | Regulated revenue established by different laws and rulings in Spain |
| Solaben 6 | Spain | (O) | 100.0 | 25 Years | Kingdom of Spain | (I) | 302,681 | (103,057) | 6,984 | Regulated revenue base(6) | Regulated revenue established by different laws and rulings in Spain |
| Kaxu | South Africa | (O) | 51.0 | 20 Years | Eskom | (I) | 464,692 | (188,089) | 23,414 | Take or pay contract for the purchase of electricity up to the contracted capacity from the facility. | 20-year PPA with Eskom SOC Ltd. With a fixed price formula in local currency subject to indexation to local inflation |
| Project name | Country | Status(1) | % of nominal Share(2) | Period of Concession (4)(5) | Off-taker(7) | Financial/ Intangible (3) | Assets/ Investment | Accumulated Amortization | Operating Profit/ (Loss)(8) | Arrangement Terms (price) | Description of the Arrangement |
| Efficient Natural Gas: | |||||||||||
| ACT | Mexico | (O) | 100.0 | 20 Years | Pemex | (F) | 477,650 | - | 98,468 | Fixed price to compensate both investment and O&M costs, established in USD and adjusted annually partially according to inflation and partially according to a mechanism agreed in contract | 20-year Services Agreement with Pemex, Mexican oil & gas state-owned company |
| Project name | Country | Status(1) | % of nominal Share(2) | Period of Concession (4)(5) | Off-taker(7) | Financial/ Intangible (3) | Assets/ Investment | Accumulated Amortization | Operating Profit/ (Loss)(8) | Arrangement Terms (price) | Description of the Arrangement |
| Transmission lines: | |||||||||||
| ATS | Peru | (O) | 100.0 | 30 Years | Republic of Peru | (I) | 534,332 | (175,380) | 34,602 | Tariff fixed by contract and adjusted annually in accordance with the US Finished Goods Less Food and Energy inflation index | 30-year Concession Agreement with the Peruvian Government |
| ATN | Peru | (O) | 100.0 | 30 Years | Republic of Peru | (I) | 366,654 | (142,906) | 13,186 | Tariff fixed by contract and adjusted annually in accordance with the US Finished Goods Less Food and Energy inflation index | 30-year Concession Agreement with the Peruvian Government |
| ATN 2 | Peru | (O) | 100.0 | 18 Years | Las Bambas Mining | (F) | 74,423 | - | 11,957 | Fixed-price tariff base denominated in U.S. dollars with Las Bambas | 18 years purchase agreement |
| Quadra I | Chile | (O) | 100.0 | 21 Years | Sierra Gorda | (F) | 35,852 | - | 7,255 | Fixed price in USD with annual adjustments indexed mainly to US CPI | 21-year Concession Contract with Sierra Gorda regulated by CDEC and the Superintendencia de Electricidad, among others |
| Quadra II | Chile | (O) | 100.0 | 21 Years | Sierra Gorda | (F) | 49,483 | - | 6,258 | Fixed price in USD with annual adjustments indexed mainly to US CPI | 21-year Concession Contract with Sierra Gorda regulated by CDEC and the Superintendencia de Electricidad, among others |
| Project name | Country | Status(1) | % of nominal Share(2) | Period of Concession (4)(5) | Off-taker(7) | Financial/ Intangible (3) | Assets/ Investment | Accumulated Amortization | Operating Profit/ (Loss)(8) | Arrangement Terms (price) | Description of the Arrangement |
| Water: | |||||||||||
| Skikda | Algeria | (O) | 34.2 | 25 Years | Sonatrach & ADE | (F) | 73,581 | - | 11,533 | U.S. dollar indexed take-or-pay contract with Sonatrach / ADE | 25 years purchase agreement |
| Honaine | Algeria | (O) | 25.5 | 25 Years | Sonatrach & ADE | (F) | N/A(9) | N/A(9) | N/A(9) | U.S. dollar indexed take- or-pay contract with Sonatrach / ADE | 25 years purchase agreement |
| Tenes | Algeria | (O) | 51.0 | 25 Years | Sonatrach & ADE | (F) | 101,144 | - | 17,462 | U.S. dollar indexed take- or-pay contract with Sonatrach / ADE | 25 years purchase agreement |
| (1) | In operation (O), Construction (C) as of December 31, 2023. |
| (2) | Itochu Corporation holds 30% of the economic rights to each of Solaben 2 and Solaben 3. JGC Corporation holds 13% of the economic rights to each Solacor 1 and Solacor 2. Algerian Energy Company, SPA, or AEC, owns 49% and Sacyr Agua, S.L., a subsidiary of Sacyr, S.A., owns the remaining 25.5% of the Honaine project. AEC owns 49% and Sacyr Agua S.L. owns the remaining 16.83% of the Skikda project. Industrial Development Corporation of South Africa (29%) & Kaxu Community Trust (20%) for the Kaxu Project. AEC owns 49% of the Tenes project. |
| (3) | Classified as concessional financial asset (F) or as intangible assets (I). |
| (4) | The infrastructure is used for its entire useful life. There are no obligations to deliver assets at the end of the concession periods, except for ATN and ATS. |
| (5) | Generally, there are no termination provisions other than customary clauses for situations such as bankruptcy or fraud from the operator, for example. |
| (6) | Sales to wholesale markets and additional fixed payments established by the Spanish government. |
| (7) | In each case the off-taker is the grantor. |
| (8) | Figures reflect the contribution to the Consolidated Financial Statements of Atlantica Sustainable Infrastructure plc. as of December 31, 2023. |
| (9) | Recorded under the equity method. |
Assets subject to the application of IFRIC 12 interpretation based on the concession of services as of December 31, 2022:
| Project name | Country | Status(1) | % of nominal Share(2) | Period of Concession (4)(5) | Off-taker(7) | Financial/ Intangible (3) | Assets/ Investment | Accumulated Amortization | Operating Profit/ (Loss)(8) | Arrangement Terms (price) | Description of the Arrangement |
| Renewable energy: | |||||||||||
| Solana | USA | (O) | 100.0 | 30 Years | APS | (I) | 1,887,669 | (664,681) | (25,082) | Fixed price per MWh with annual increases of 1.84% per year | 30-year PPA with APS regulated by ACC |
| Mojave | USA | (O) | 100.0 | 25 Years | PG&E | (I) | 1,573,621 | (497,072) | 45,193 | Fixed price per MWh without any indexation mechanism | 25-year PPA with PG&E regulated by CPUC and CAEC |
| Palmatir | Uruguay | (O) | 100.0 | 20 Years | UTE, Uruguay Administration | (I) | 147,937 | (63,692) | 4,021 | Fixed price per MWh in USD with annual increases based on inflation | 20-year PPA with UTE, Uruguay state-owned utility |
| Cadonal | Uruguay | (O) | 100.0 | 20 Years | UTE, Uruguay Administration | (I) | 122,012 | (49,616) | 3,680 | Fixed price per MWh in USD with annual increases based on inflation | 20-year PPA with UTE, Uruguay state-owned utility |
| Melowind | Uruguay | (O) | 100.0 | 20 Years | UTE, Uruguay Administration | (I) | 136,053 | (43,988) | 3,567 | Fixed price per MWh in USD with annual increases based on inflation | 20-year PPA with UTE, Uruguay state-owned utility |
| Solaben 2 | Spain | (O) | 70.0 | 25 Years | Kingdom of Spain | (I) | 298,791 | (97,618) | 6,163 | Regulated revenue base(6) | Regulated revenue established by different laws and rulings in Spain |
| Solaben 3 | Spain | (O) | 70.0 | 25 Years | Kingdom of Spain | (I) | 297,865 | (98,526) | 6,319 | Regulated revenue base(6) | Regulated revenue established by different laws and rulings in Spain |
| Solacor 1 | Spain | (O) | 87.0 | 25 Years | Kingdom of Spain | (I) | 299,306 | (105,031) | 5,275 | Regulated revenue base(6) | Regulated revenue established by different laws and rulings in Spain |
| Solacor 2 | Spain | (O) | 87.0 | 25 Years | Kingdom of Spain | (I) | 311,671 | (108,306) | 5,698 | Regulated revenue base(6) | Regulated revenue established by different laws and rulings in Spain |
| Solnova 1 | Spain | (O) | 100.0 | 25 Years | Kingdom of Spain | (I) | 301,041 | (123,894) | 7,509 | Regulated revenue base(6) | Regulated revenue established by different laws and rulings in Spain |
| Solnova 3 | Spain | (O) | 100.0 | 25 Years | Kingdom of Spain | (I) | 281,557 | 112,213 | 7,027 | Regulated revenue base(6) | Regulated revenue established by different laws and rulings in Spain |
| Solnova 4 | Spain | (O) | 100.0 | 25 Years | Kingdom of Spain | (I) | 263,079 | (104,282) | 7,694 | Regulated revenue base(6) | Regulated revenue established by different laws and rulings in Spain |
| Helios 1 | Spain | (O) | 100.0 | 25 Years | Kingdom of Spain | (I) | 304,015 | 101,255) | 5,201 | Regulated revenue base(6) | Regulated revenue established by different laws and rulings in Spain |
| Helios 2 | Spain | (O) | 100.0 | 25 Years | Kingdom of Spain | (I) | 296,267 | (97,167) | 4,508 | Regulated revenue base(6) | Regulated revenue established by different laws and rulings in Spain |
| Helioenergy 1 | Spain | (O) | 100.0 | 25 Years | Kingdom of Spain | (I) | 291,454 | (101,428) | 8,032 | Regulated revenue base(6) | Regulated revenue established by different laws and rulings in Spain |
| Helioenergy 2 | Spain | (O) | 100.0 | 25 Years | Kingdom of Spain | (I) | 292,225 | (99,126) | 8,149 | Regulated revenue base(6) | Regulated revenue established by different laws and rulings in Spain |
| Solaben 1 | Spain | (O) | 100.0 | 25 Years | Kingdom of Spain | (I) | 293,721 | 87,873) | 6,453 | Regulated revenue base(6) | Regulated revenue established by different laws and rulings in Spain |
| Solaben 6 | Spain | (O) | 100.0 | 25 Years | Kingdom of Spain | (I) | 290,745 | (86,822) | 7,110 | Regulated revenue base(6) | Regulated revenue established by different laws and rulings in Spain |
| Kaxu | South Africa | (O) | 51.0 | 20 Years | Eskom | (I) | 455,517 | (179,417) | 44,487 | Take or pay contract for the purchase of electricity up to the contracted capacity from the facility. | 20-year PPA with Eskom SOC Ltd. With a fixed price formula in local currency subject to indexation to local inflation |
| Project name | Country | Status(1) | % of nominal Share(2) | Period of Concession (4)(5) | Off-taker(7) | Financial/ Intangible (3) | Assets/ Investment | Accumulated Amortization | Operating Profit/ (Loss)(8) | Arrangement Terms (price) | Description of the Arrangement |
| Efficient Natural Gas: | |||||||||||
| ACT | Mexico | (O) | 100.0 | 20 Years | Pemex | (F) | 512,796 | - | 80,731 | Fixed price to compensate both investment and O&M costs, established in USD and adjusted annually partially according to inflation and partially according to a mechanism agreed in contract | 20-year Services Agreement with Pemex, Mexican oil & gas state-owned company |
| Project name | Country | Status(1) | % of nominal Share(2) | Period of Concession (4)(5) | Off-taker(7) | Financial/ Intangible (3) | Assets/ Investment | Accumulated Amortization | Operating Profit/ (Loss)(8) | Arrangement Terms (price) | Description of the Arrangement |
| Transmission lines: | |||||||||||
| ATS | Peru | (O) | 100.0 | 30 Years | Republic of Peru | (I) | 532,859 | (157,573) | 31,351 | Tariff fixed by contract and adjusted annually in accordance with the US Finished Goods Less Food and Energy inflation index | 30-year Concession Agreement with the Peruvian Government |
| ATN | Peru | (O) | 100.0 | 30 Years | Republic of Peru | (I) | 360,412 | (130,364) | 10,988 | Tariff fixed by contract and adjusted annually in accordance with the US Finished Goods Less Food and Energy inflation index | 30-year Concession Agreement with the Peruvian Government |
| ATN 2 | Peru | (O) | 100.0 | 18 Years | Las Bambas Mining | (F) | 71,966 | - | 10,673 | Fixed-price tariff base denominated in U.S. dollars with Las Bambas | 18 years purchase agreement |
| Quadra I | Chile | (O) | 100.0 | 21 Years | Sierra Gorda | (F) | 37,423 | - | 5,847 | Fixed price in USD with annual adjustments indexed mainly to US CPI | 21-year Concession Contract with Sierra Gorda regulated by CDEC and the Superentendencia de Electricidad, among others |
| Quadra II | Chile | (O) | 100.0 | 21 Years | Sierra Gorda | (F) | 51,552 | - | 4,845 | Fixed price in USD with annual adjustments indexed mainly to US CPI | 21-year Concession Contract with Sierra Gorda regulated by CDEC and the Superentendencia de Electricidad, among others |
| Project name | Country | Status(1) | % of nominal Share(2) | Period of Concession (4)(5) | Off-taker(7) | Financial/ Intangible (3) | Assets/ Investment | Accumulated Amortization | Operating Profit/ (Loss)(8) | Arrangement Terms (price) | Description of the Arrangement |
| Water: | |||||||||||
| Skikda | Algeria | (O) | 34.2 | 25 Years | Sonatrach & ADE | (F) | 71,007 |
-
|
13,121 | U.S. dollar indexed take-or-pay contract with Sonatrach / ADE | 25 years purchase agreement |
| Honaine | Algeria | (O) | 25.5 | 25 Years | Sonatrach & ADE | (F) | N/A(9) | N/A(9) | N/A(9) | U.S. dollar indexed take- or-pay contract with Sonatrach / ADE | 25 years purchase agreement |
| Tenes | Algeria | (O) | 51.0 | 25 Years | Sonatrach & ADE | (F) | 98,962 | - | 14,637 | U.S. dollar indexed take- or-pay contract with Sonatrach / ADE | 25 years purchase agreement |
| (1) | In operation (O), Construction (C) as of December 31, 2022. |
| (2) | Itochu Corporation holds 30% of the economic rights to each of Solaben 2 and Solaben 3. JGC Corporation holds 13% of the economic rights to each Solacor 1 and Solacor 2. Algerian Energy Company, SPA, or AEC, owns 49% and Sacyr Agua, S.L., a subsidiary of Sacyr, S.A., owns the remaining 25.5% of the Honaine project. AEC owns 49% and Sacyr Agua S.L. owns the remaining 16.83% of the Skikda project. Industrial Development Corporation of South Africa (29%) & Kaxu Community Trust (20%) for the Kaxu Project. AEC owns 49% of the Tenes project. |
| (3) | Classified as concessional financial asset (F) or as intangible assets (I). |
| (4) | The infrastructure is used for its entire useful life. There are no obligations to deliver assets at the end of the concession periods, except for ATN and ATS. |
| (5) | Generally, there are no termination provisions other than customary clauses for situations such as bankruptcy or fraud from the operator, for example. |
| (6) | Sales to wholesale markets and additional fixed payments established by the Spanish government. |
| (7) | In each case the off-taker is the grantor. |
| (8) | Figures reflect the contribution to the Consolidated Financial Statements of Atlantica Sustainable Infrastructure plc. as of December 31, 2022. |
| (9) | Recorded under the equity method. |
| 28. | Additional information of subsidiaries including material non-controlling interest |
As of December 31, 2023:
|
Subsidiary name |
Non- controlling interest name |
% of non- controlling interest held |
Distributions paid to non- controlling interest |
Profit/(Loss) of non- controlling interest in Atlantica consolidated net result 2023 |
Non- controlling interest in Atlantica consolidated equity as of December 31, 2023 |
Non- current assets* |
Current Assets* |
Non- current liabilities* |
Current liabilities* |
Net Profit /(Loss)* |
Total Comprehensive income* |
|||||||||||||||||||||||||||||||
| Aguas de Skikda S.P.A. | Algerian Energy Company S.P.A. | 49 | %** | 3,072 | 6,164 | 51,145 | 71,400 | 27,290 | 10,151 | 4,325 | 9,363 | - | ||||||||||||||||||||||||||||||
| Chile PV 3 | Financial partners | 65 | % | - | (2,189) | 30,526 | 31,371 | 30,374 | 11,791 | 1,273 | (3,368) | - | ||||||||||||||||||||||||||||||
| Solaben Electricidad Dos S.A. | Itochu Europe Plc | 30 | % | 3,684 | (202) | 20,580 | 192,089 | 9,989 | 125,455 | 8,957 | (992) | (6,412) | ||||||||||||||||||||||||||||||
| Solaben Electricidad Tres S.A. | Itochu Europe Plc | 30 | % | 3,259 | (245) | 20,261 | 191,585 | 10,059 | 125,165 | 9,679 | (1,133) | (6,378) | ||||||||||||||||||||||||||||||
| Ténès Lilmiyah SPA | Algerian Energy Company S.P.A. | 49 | % | 3,581 | 7,123 | 29,963 | 97,105 | 41,208 | 66,175 | 10,989 | 14,701 | - | ||||||||||||||||||||||||||||||
* Stand-alone figures as of December 31, 2023.
** Atlantica Sustainable Infrastructure plc. owns 67% of the shares in Geida Skikda, S.L., which in its turn owns 51% of Aguas de Skikda S.P.A., so that indirectly Atlantica Sustainable Infrastructure plc. owns 34.17% of Aguas de Skikda S.P.A. The table only shows information related to the non-controlling interest of the SPV, Aguas de Skikda S.P.A.
As of December 31, 2022:
|
Subsidiary name |
Non- controlling interest name |
% of non- controlling interest held |
Distributions paid to non- controlling interest |
Profit/(Loss) of non- controlling interest in Atlantica consolidated net result 2022 |
Non- controlling interest in Atlantica consolidated equity as of December 31, 2022 |
Non- current assets* |
Current Assets* |
Non- current liabilities* |
Current liabilities* |
Net profit/ (loss)* |
Total Comprehensive income* |
|||||||||
| Aguas de Skikda S.P.A. | Algerian Energy Company S.P.A. | 49%** | 2,849 | 7,060 | 47,509 | 68,655 | 29,293 | 12,470 | 6,788 |
10,725 |
- | |||||||||
| Solaben Electricidad Dos S.A. | Itochu Europe Plc | 30% | 1,913 | 402 | 25,271 | 201,060 | 12,730 | 115,109 | 14,857 | 1,158 | (1,428) | |||||||||
| Solaben Electricidad Tres S.A. | Itochu Europe Plc | 30% | 1,397 | 370 | 24,522 | 201,088 | 13,814 | 117,948 | 15,495 | 1,051 | (1,642) | |||||||||
| Ténès Lilmiyah SPA | Algerian Energy Company S.P.A. | 49% | 2,260 | 5,675 | 25,592 | 94,989 | 40,884 | 72,279 | 11,365 | 11,581 | - | |||||||||
* Stand-alone figures as of December 31, 2022.
** Atlantica Sustainable Infrastructure plc. owns 67% of the shares in Geida Skikda, S.L., which in its turn owns 51% of Aguas de Skikda S.P.A., so that indirectly Atlantica Sustainable Infrastructure plc. owns 34.17% of Aguas de Skikda S.P.A. The table only shows information related to the non-controlling interest of the SPV, Aguas de Skikda S.P.A.
Company Financial Statements
Company Balance Sheet
Amounts in thousands of U.S. dollars
| Notes (1) |
As of December 31, 2023 |
As of December 31, 2022 |
||||||||||
| Non Current assets | ||||||||||||
| Intangible and tangible assets | 51 | 114 | ||||||||||
| Investments in subsidiaries | 3 | 1,572,733 | 1,661,909 | |||||||||
| Amounts owed by group undertakings | 4 | 991,391 | 930,188 | |||||||||
| Derivative assets | 6 | 781 | 279 | |||||||||
| Other financial assets | 599 | - | ||||||||||
| 2,565,555 | 2,592,490 | |||||||||||
| Current assets | ||||||||||||
| Trade and other receivables | 1,085 | 628 | ||||||||||
| Amounts owed by group undertakings | 4 | 20,471 | 34,495 | |||||||||
| Derivative assets | 6 | 837 | 7,558 | |||||||||
| Cash and cash equivalents | 9 | 32,982 | 60,833 | |||||||||
| 55,375 | 103,514 | |||||||||||
| Total assets | 2,620,930 | 2,696,004 | ||||||||||
| Creditors: Amounts falling due within one year | ||||||||||||
| Trade and other payables | 7 | 3,178 | 6,377 | |||||||||
| Amounts owed to group undertakings | 4 | 9,170 | 3,792 | |||||||||
| Borrowings | 5 | 27,102 | 11,442 | |||||||||
| 39,450 | 21,611 | |||||||||||
| Net current assets | 15,925 | 81,903 | ||||||||||
| Total assets less current liabilities | 2,581,480 | 2,674,393 | ||||||||||
| Creditors: Amounts falling due after more than one year | ||||||||||||
| Borrowings | 5 | 931,290 | 886,515 | |||||||||
| Amounts owed to group undertakings | 4 | 461,498 | 379,892 | |||||||||
| Derivative liabilities | 6 | 794 | 4,688 | |||||||||
| Other liabilities | 17,849 | 16,684 | ||||||||||
| 1,411,431 | 1,287,779 | |||||||||||
| Total liabilities | 1,450,881 | 1,309,390 | ||||||||||
| Net assets | 1,170,049 | 1,386,614 | ||||||||||
| Capital and Reserves | ||||||||||||
| Share capital | 8 | 11,616 | 11,606 | |||||||||
| Share premium account | 8 | 736,594 | 986,594 | |||||||||
| Capital reserves | 8 | 858,220 | 814,951 | |||||||||
| Other reserves | 8 | 30 | 4,638 | |||||||||
| Accumulated deficit | 8 | (436,411) | (431,175) | |||||||||
| Shareholders’ funds | 1,170,049 | 1,386,614 | ||||||||||
| (1) | Notes 1 to 10 are an integral part of the financial statements |
The Company has taken the exemption under Companies Act 2006 section 408 not to publish the parent company profit and loss account. The Company recorded a loss after tax of 7.9 million for the period ended 31 December 2023 (2022: loss after tax of $43.1 million).
The financial statements of Atlantica Sustainable Infrastructure plc, company registration no. 08818211, were approved by the board of directors and authorised for issue on 29 February 2024. They were signed on its behalf by:
| Director and Chief Executive Officer | Chief Financial Officer | ||
| Santiago Seage | Francisco Martinez-Davis | ||
| February 29, 2024 | February 29, 2024 | ||
Company Statement of Changes in Equity
Amounts in thousands of U.S. dollars
|
Share capital |
Share premium account |
Capital reserves |
Other reserves |
Accumulated deficit | Total Shareholder´s funds | |||||||||||||||||||
|
Balance at 1 January 2022 |
11,240 | 872,011 | 1,020,027 | 224 | (392,810) | 1,510,692 | ||||||||||||||||||
| Capital increase | 366 | 114,583 | (1,969) | - | - | 112,980 | ||||||||||||||||||
| Loss for the year | - | - | - | - | (43,092) | (43,092) | ||||||||||||||||||
| Dividends | - | - | (203,107) | - | - | (203,107) | ||||||||||||||||||
| Change in fair value of cash flow hedges (net of deferred taxation) | - | - | - | 4,414 | - | 4,414 | ||||||||||||||||||
| Share-based compensation | - | - | - | - | 4,727 | 4,727 | ||||||||||||||||||
| Balance at 31 December 2022 | 11,606 | 986,594 | 814,951 | 4,638 | (431,175) | 1,386,614 | ||||||||||||||||||
| Capital increase | 10 | - | 25 | - | - | 35 | ||||||||||||||||||
| Loss for the year | - | - | - | - | (7,875) | (7,875) | ||||||||||||||||||
| Dividends | - | - | (206,756) | - | - | (206,756) | ||||||||||||||||||
|
Change in fair value of cash flow hedges (net of deferred taxation) |
- | - | - | (4,608) | - | (4,608) | ||||||||||||||||||
| Share-based compensation | - | - | - | - | 2,639 | 2,639 | ||||||||||||||||||
|
Reduction of Share Premium |
- | (250,000) | 250,000 | - | - | - | ||||||||||||||||||
|
Balance at 31 December 2023 |
11,616 | 736,594 | 858,220 | 30 | (436,411) | 1,170,049 |
|
|||||||||||||||||
Notes to the Company Financial Statements
| 1. | Material Accounting Policies |
The separate financial statements of the Company are presented as required by the Companies Act 2006. The Company meets the definition of a qualifying entity under FRS 100 (Financial Reporting Standard 100) issued by the Financial Reporting Council. These financial statements were prepared in accordance with Financial Reporting Standard 101 “Reduced Disclosure Framework (“FRS 101”)”.
As permitted by FRS 101, the Company has taken advantage of the disclosure exemptions available under that standard in relation to share-based payment, financial instruments, capital management, presentation of comparative information in respect of certain assets, presentation of a cash-flow statement and certain related party transactions.
Where required, equivalent disclosures are given in the consolidated financial statements. General information about the Company is disclosed in note 1 of the consolidated financial statements. Amounts included in these separate financial statements are all expressed in thousands of U.S. dollars, unless otherwise indicated. The financial statements have been prepared on the historical cost basis except for the remeasurement of certain financial instruments to fair value.
The Company has prepared these financial statements on a going concern basis. For further information, please refer to the “going concern basis” in note 2.1 of the consolidated financial statements.
Disclosures of the impact of Global minimum taxation legislation (Pillar Two) is included in note 2.1 of the consolidated financial statements.
The principal accounting policies adopted are the same as those set out in note 2 to the consolidated financial statements except as noted below.
Investments in subsidiaries and impairment
Investments in subsidiaries are stated at cost less, where appropriate, provisions for impairment.
At each balance sheet date, the Company reviews the carrying amounts of its investments to determine whether there is any indication that those assets have suffered an impairment loss. If any such indication exists, the recoverable amount of the asset is estimated to determine the extent of the impairment loss.
Recoverable amount is the higher of fair value less costs to sell and value in use. In assessing value in use, the estimated future cash flows are discounted to their present value using a pre-tax discount rate that reflects current market assessments of the time value of money and the risks specific to the asset for which the estimates of future cash flows have not been adjusted.
If the recoverable amount of an asset is estimated to be less than its carrying amount, the carrying amount of the asset is reduced to its recoverable amount. An impairment loss is recognised immediately in the profit and loss.
Where an impairment loss subsequently reverses, the carrying amount of the asset is increased to the revised estimate of its recoverable amount, but so that the increased carrying amount does not exceed the carrying amount that would have been determined had no impairment loss been recognised for the asset in prior years. A reversal of an impairment loss is recognised immediately in the profit and loss.
Receivables arising from interest-free intercompany loans are recognised when the Company becomes party to the related contracts and are measured initially at the fair value represented by the present value of future cash flows discounted at market interest rate. The difference between the fair value and the consideration advanced is recognised as an increase in the cost of investment in subsidiary.
After initial recognition, interest-free intercompany loans are subsequently measured at amortised cost using the effective interest method. The finance income is recognised in the statement of comprehensive income.
Significant judgements and estimates
The most critical accounting policies, which reflect significant management estimates and judgement to determine amounts in the Company’s financial statements, are as follows:
Estimates:
| o | Impairment of investments (see Note 3) |
Impairment exists when the carrying value of an investment exceeds its recoverable amount, which is the higher of its fair value less costs of disposal and its value in use. The value in use calculation is based on a discounted cash flow model, which is sensitive to the discount rate used as well as projected cash-flows.
The significant assumptions which required substantial estimates used in management’s impairment calculation are discount rates and projections considering real data based on contract terms and projected changes in selling prices, energy generation and costs.
| o | Fair value of derivative financial instruments (see Note 6) |
When the fair values of financial assets and financial liabilities recorded in the statement of financial position cannot be measured based on quoted prices in active markets, their fair value is measured using valuation techniques including the discounted cash flow model. The inputs to these models are taken from observable markets where possible, but where this is not feasible, a degree of estimate is required in establishing fair values. Estimates include considerations of inputs such as liquidity risk, credit risk and volatility. Changes in assumptions relating to these factors could affect the reported fair value of financial instruments.
| 2. | Profit/(loss) for the year |
As permitted by section 408 of the Companies Act 2006, the Company has elected not to present its own profit and loss account for the year. The Company reported a loss for the financial year ended 31 December 2023 of $7.9 million (2022: loss of $43.1 million).
The employee cost recorded in
the profit and loss account of the Company for the year 2023 amounts to $7.4 million (2022: $10.4 million).
The average number of employees was:
|
2023 Number |
2022 Number |
||||
| Executives | 7 | 10 | |||
| Engineers and Graduates | 4 | - | |||
| Assistants and Professionals | 1 | 1 | |||
| 12 | 11 |
Their aggregate remuneration comprised:
|
Year ended 2023 $000 |
Year ended 2022 $000 |
|||||||
| Wages and salaries | (7,393 | ) | (10,403 | ) | ||||
| Social security costs | (13 | ) | (8 | ) | ||||
| Other staff costs | (2 | ) | (2 | ) | ||||
| (7,408 | ) | (10,413 | ) | |||||
The auditor’s remuneration for audit and other services is disclosed in note 25 to the consolidated financial statements.
| 3. | Investments in Subsidiaries |
Details of the Company’s subsidiaries at 31 December 2023 are as follows:
| Name |
Place of incorporation and principal place of business |
Proportion of ownership interest |
Proportion of voting power held |
Registered office | ||||||||
| % | % | |||||||||||
| A&F PV Solar SAPI de C.V. | Mexico | 70.00 | % | 70.00 | % | Avda. Jaime Balmes, 11, Piso 10, Torre C, Fraccion C, Oficina 1001, Col. Los Morales Polanco, 11510, Ciudad de Mexico | ||||||
| ACT Energy Mexico, S. de R.L. de C.V. | Mexico | 99.99 | % | 99.99 | % | Avda. Jaime Balmes, 11, Piso 10, Torre C, Fraccion C, Oficina 1001, Col. Los Morales Polanco, 11510, Ciudad de Mexico | ||||||
| ACT Holdings, S.A. de C.V. | Mexico | 99.99 | % | 99.99 | % | Avda. Jaime Balmes, 11, Piso 10, Torre C, Fraccion C, Oficina 1001, Col. Los Morales Polanco, 11510, Ciudad de Mexico | ||||||
| Agrisun, S.R.L. | Italy | 100.00 | % | 100.00 | % | Via de la Mercede, 11, 00187, Roma (Italy) | ||||||
| Aguas de Skikda, S.P.A. | Algeria | 51.00 | % | 51.00 | % | 162 Bois des Cars III DelyIbrahim — Alger - Algerie | ||||||
| Alcalá Sviluppo Solare S.r.l. | Italy | 100.00 | % | 100.00 | % | Vicolo del Messaggero 11 – 38068 Rovereto (TN) | ||||||
| Arizona Solar One, LLC (USA) | USA | 100.00 | % | 100.00 | % | 1553 West Todd Dr., Suite 204 Tempe, AZ 85283 (USA) | ||||||
| ASHUSA Inc | USA | 100.00 | % | 100.00 | % | 1553 West Todd Dr., Suite 204 Tempe, AZ 85283 (USA) | ||||||
| ASI Operations, LLC | USA | 100.00 | % | 100.00 | % | 1553 West Todd Dr., Suite 204 Tempe, AZ 85283 (USA) | ||||||
| ASO Holdings Company, LLC | USA | 100.00 | % | 100.00 | % | 1553 West Todd Dr., Suite 204 Tempe, AZ 85283 (USA) | ||||||
| ASUSHI Inc. | USA | 100.00 | % | 100.00 | % | 1553 West Todd Dr., Suite 204 Tempe, AZ 85283 (USA) | ||||||
| Atlantica Canada, Inc | Canada | 100.00 | % | 100.00 | % | 435 9 Ave Se, T2G 2J6, Calgary, Canada. | ||||||
| Atlantica Chile, S.P.A. | Chile | 100.00 | % | 100.00 | % | Avda. Apoquindo, 3600, Piso 5, Oficina 517, Las Condes, Santiago de Chile | ||||||
| Atlantica Colombia S.A.S. E.S.P. | Colombia | 100.00 | % | 100.00 | % | Carrera 7, 71 – 21 Torre B, piso 15,Bogota | ||||||
| Atlantica Corporate Resources, S.L. | Spain | 100.00 | % | 100.00 | % | C/ Albert Einstein, s/n 41092, Sevilla (Spain) | ||||||
| Atlantica DCR, LLC. | USA | 100.00 | % | 100.00 | % | 1553 West Todd Dr., Suite 204 Tempe, AZ 85283 (USA) | ||||||
| Atlantica Energía Sostenible España S.L. | Spain | 100.00 | % | 100.00 | % | C/ Albert Einstein, s/n 41092, Sevilla (Spain) | ||||||
| Atlantica Energia Sostenible Italia, S.r.l | Italy | 100.00 | % | 100.00 | % | Via de la Mercede, 11, 00187, Roma (Italy) | ||||||
| Atlantica Holdings USA, LLC | USA | 100.00 | % | 100.00 | % | 1553 West Todd Dr., Suite 204 Tempe, AZ 85283 (USA) | ||||||
| Atlantica Hystone, S.L. U. | Spain | 100.00 | % | 100.00 | % | C/ Albert Einstein, s/n 41092, Sevilla (Spain) | ||||||
| Atlantica Infraestructura Sostenible, S.L.U. | Spain | 100.00 | % | 100.00 | % | C/ Albert Einstein, s/n 41092, Sevilla (Spain) | ||||||
| Atlantica Investments Ltd | UK | 100.00 | % | 100.00 | % | Great West House, GW1 Great West Road Brentford TW8 9DF London UK | ||||||
| Atlantica Newco, Ltd | UK | 100.00 | % | 100.00 | % | Great West House, GW1 Great West Road Brentford TW8 9DF London UK | ||||||
| Atlantica North America, LLC. | USA | 100.00 | % | 100.00 | % | 1553 West Todd Dr., Suite 204 Tempe, AZ 85283 (USA) | ||||||
| Atlantica Peru, S.A. | Peru | 100.00 | % | 100.00 | % | Av. El Derby 55, Edificio Cronos, Torre 3, Piso 6; oficina 608 Santiago de Sucro Lima (Peru). | ||||||
| Atlantica Renewable Power Mexico de R.L. de C.V | Mexico | 100.00 | % | 100.00 | % | Avda. Jaime Balmes, 11, Piso 10, Torre C, Fraccion C, Oficina 1001, Col. Los Morales Polanco, 11510, Ciudad de Mexico | ||||||
| Atlantica Solutions LLC | USA | 100.00 | % | 100.00 | % | 1553 West Todd Dr., Suite 204 Tempe, AZ 85283 (USA) | ||||||
| Atlantica South Africa (Pty) Ltd | South Africa | 100.00 | % | 100.00 | % | Office 103 Ancorley Building; 45 Scott Street Upington 8801 (South Africa) | ||||||
| Atlantica South Africa Operations Proprietary Limited Ltd | South Africa | 92.00 | % | 92.00 | % | Office 103 Ancorley Building; 45 Scott Street Upington 8801 (South Africa) | ||||||
| Atlantica Sustainable Infrastructure Jersey Ltd. | Jersey | 100.00 | % | 100.00 | % | 47 Esplanade, St Helier, Jersey JE1 0BD UK | ||||||
| Atlantica Transmision Sur, S.A. | Peru | 100.00 | % | 100.00 | % | Av. El Derby 55, Edificio Cronos, Torre 3, Piso 6; oficina 608 Santiago de Sucro Lima (Peru). | ||||||
| Atlantica y Quartux Almacenamiento de Energía S.A.P.I. de C.V. | Mexico | 88.00 | % | 60.00 | % | Avda. Jaime Balmes, 11, Piso 10, Torre C, Fraccion C, Oficina 1001, Col. Los Morales Polanco, 11510, Ciudad de Mexico | ||||||
| Atlantica Yield Energy Solutions Canada Inc. | Canada | 10.00 | % | 66.66 | % | 354 Davis Road Suite 100 Oakville On L5J 2X1 | ||||||
| ATN 2, S.A. | Peru | 100.00 | % | 100.00 | % | Av. El Derby 55, Edificio Cronos, Torre 3, Piso 6; oficina 608 Santiago de Sucro Lima (Peru). |
| ATN 4, S.A. | Peru | 100.00 | % | 100.00 | % | Av. El Derby 55, Edificio Cronos, Torre 3, Piso 6; oficina 608 Santiago de Sucro Lima (Peru). | ||||||
| ATN, S.A. | Peru | 99.99 | % | 99.99 | % | Av. El Derby 55, Edificio Cronos, Torre 3, Piso 6; oficina 608 Santiago de Sucro Lima (Peru). | ||||||
| AY Holding Uruguay S.A. | Uruguay | 100.00 | % | 100.00 | % | Avda. Luis Alberto de Herrera, 1248, World Trade Center, Torre II, Piso 1. Oficina 1505, Montevideo, Uruguay. | ||||||
| AYES International UK Ltd. | UK | 100.00 | % | 100.00 | % | Great West House, GW1 Great West Road Brentford TW8 9DF London UK | ||||||
| Banitod, S.A. | Uruguay | 100.00 | % | 100.00 | % | Avda. Luis Alberto de Herrera, 1248, World Trade Center, Torre II, Piso 1. Oficina 1505, Montevideo, Uruguay. | ||||||
| Befesa Agua Tenes, S.L.U. | Spain | 100.00 | % | 100.00 | % | C/ Energia Solar 1 41014, Sevilla (Spain) | ||||||
| BPC US Wind Corporation, Inc. | USA | 100.00 | % | 100.00 | % | 1553 West Todd Dr., Suite 204 Tempe, AZ 85283 (USA) | ||||||
| Cadonal, S.A. | Uruguay | 100.00 | % | 100.00 | % | Avda. Luis Alberto de Herrera, 1248, World Trade Center, Torre II, Piso 1. Oficina 1505, Montevideo, Uruguay. | ||||||
| Calgary District Heating Inc. | Canada | 100.00 | % | 100.00 | % | Suite 2500 Park Place 666 Burrard Street Vancouver BC V6C 2X8 | ||||||
| Carpio Solar Inversiones, S.A. | Spain | 100.00 | % | 100.00 | % | C/ Albert Einstein, s/n 41092, Sevilla (Spain) | ||||||
| CGP Holding Finance, LLC | USA | 100.00 | % | 100.00 | % | 251 Little Falls Drive, Wilmington, New Castle, Delaware, 19808 (USA) | ||||||
| Chile PV I | Chile | 35.00 | % | 66.66 | % | Avenida Los Militares 5885, piso 7, departamento 701, Las Condes, Santiago de Chile. | ||||||
| Chile PV II | Chile | 35.00 | % | 66.66 | % | Avenida Los Militares 5885, piso 7, departamento 701, Las Condes, Santiago de Chile. | ||||||
| Chile PV III | Chile | 35.00 | % | 66.66 | % | Avenida Los Militares 5885, piso 7, departamento 701, Las Condes, Santiago de Chile. | ||||||
| Coropuna Transmisión, S.A | Peru | 100.00 | % | 100.00 | % | Av. El Derby 55, Edificio Cronos, Torre 3, Piso 6; oficina 608 Santiago de Sucro Lima (Peru). | ||||||
| Day Ahead Solar LLC | USA | 100.00 | % | 100.00 | % | 1553 West Todd Dr., Suite 204 Tempe, AZ 85283 (USA) | ||||||
| Diamond FV, S.r.l. | Italy | 100.00 | % | 100.00 | % | Via Maurizio Bufalini, 8 Roma 00161, Italy | ||||||
| Ecija Solar Inversiones, S.A. | Spain | 100.00 | % | 100.00 | % | C/ Albert Einstein, s/n 41092, Sevilla (Spain) |
| Energía Renovable Dalia 1 SA de CV | Mexico | 51.00 | % | 51.00 | % | Avda. Jaime Balmes, 11, Piso 10, Torre C, Fraccion C, Oficina 1001, Col. Los Morales Polanco, 11510, Ciudad de Mexico | ||||||
| Energía Renovable Dalia 2 SA de CV | Mexico | 51.00 | % | 51.00 | % | Avda. Jaime Balmes, 11, Piso 10, Torre C, Fraccion C, Oficina 1001, Col. Los Morales Polanco, 11510, Ciudad de Mexico | ||||||
| Energía Renovable Dalia 3 SA de CV | Mexico | 51.00 | % | 51.00 | % | Avda. Jaime Balmes, 11, Piso 10, Torre C, Fraccion C, Oficina 1001, Col. Los Morales Polanco, 11510, Ciudad de Mexico | ||||||
| Estrellada S.A. | Uruguay | 100.00 | % | 100.00 | % | Avda. Luis Alberto de Herrera, 1248, World Trade Center, Torre II, Piso 1. Oficina 1505, Montevideo, Uruguay. | ||||||
| Extremadura Equity Investment S.a.r.l. | Luxembourg | 100.00 | % | 100.00 | % | 6, rue Eugène RuppertL-2453 Luxembourg | ||||||
| Fabroen Seconda, Srl. | Italy | 85.00 | % | 85.00 | % | Via Maurizio Bufalini, 8 Roma 00161, Italy | ||||||
| Fotovoltaica Solar Sevilla, S.A. | Spain | 80.00 | % | 80.00 | % | C/ Albert Einstein, s/n 41092, Sevilla (Spain) | ||||||
| Geida Skikda, S.L. | Spain | 67.00 | % | 67.00 | % | Paseo de la Castellana 83-85, 28046 Madrid (Spain) | ||||||
| Global Solar Participations Sarl | Luxembourg | 100.00 | % | 100.00 | % | 6, rue Eugène RuppertL-2453 Luxembourg | ||||||
| Gold FV S.r.l. | Italy | 100.00 | % | 100.00 | % | Via Maurizio Bufalini, 8 Roma 00161, Italy. | ||||||
| Helioenergy Electricidad Uno, S.A. | Spain | 100.00 | % | 100.00 | % | C/ Albert Einstein, s/n 41092, Sevilla (Spain) | ||||||
| Helioenergy Electricidad, Dos, S.A. | Spain | 100.00 | % | 100.00 | % | C/ Albert Einstein, s/n 41092, Sevilla (Spain) | ||||||
| Helios 2, S.R.L. | Italy | 100.00 | % | 100.00 | % | Melissano (LE) Via Monte Rosa 19 Roma (Italy) | ||||||
| Helios I Hyperion Energy Investments, S.L. | Spain | 100.00 | % | 100.00 | % | C/ Albert Einstein, s/n 41092, Sevilla (Spain) | ||||||
| Helios II Hyperion Energy Investments, S.L. | Spain | 100.00 | % | 100.00 | % | C/ Albert Einstein, s/n 41092, Sevilla (Spain) | ||||||
| Hidrocañete, S.A. | Peru | 100.00 | % | 100.00 | % | Av. El Derby 55, Edificio Cronos, Torre 3, Piso 6; oficina 608 Santiago de Sucro Lima (Peru). | ||||||
| Hornero ST Dos, S.L. | Spain | 100.00 | % | 100.00 | % | C/ Albert Einstein, s/n 41092, Sevilla (Spain) | ||||||
| Hornero ST, S.L. | Spain | 100.00 | % | 100.00 | % | C/ Albert Einstein, s/n 41092, Sevilla (Spain) | ||||||
| Hypesol Energy Holding, S.L. | Spain | 100.00 | % | 100.00 | % | C/ Albert Einstein, s/n 41092, Sevilla (Spain) | ||||||
| Hypesol Solar Inversiones S.A.U | Spain | 100.00 | % | 100.00 | % |
C/ Albert Einstein, s/n 41092, Sevilla (Spain) Office 103 Ancorley Building; 45 |
| Kaxu Solar One (Pty) Ltd | South Africa | 51.00 | % | 51.00 | % | Scott Street Upington 8801 (South Africa) | ||||||
| Logrosan Equity Investment S.a.r.l. | Luxembourg | 100.00 | % | 100.00 | % | 6, rue Eugène RuppertL-2453 Luxembourg | ||||||
| Logrosan Solar Inversiones Dos, S.L. | Spain | 100.00 | % | 100.00 | % | C/ Albert Einstein, s/n 41092, Sevilla (Spain) |
| Logrosan Solar Inversiones, S.A. | Spain | 100.00 | % | 100.00 | % | C/ Albert Einstein, s/n 41092, Sevilla (Spain) | ||||||
| Menhir Solar, S.L.U. | Spain | 100.00 | % | 100.00 | % | C/ Albert Einstein, s/n 41092, Sevilla (Spain) | ||||||
| Mojave Solar Holdings, Llc | USA | 100.00 | % | 100.00 | % | 1553 West Todd Dr., Suite 204 Tempe, AZ 85283 (USA) | ||||||
| Mojave Solar, Llc | USA | 100.00 | % | 100.00 | % | 1553 West Todd Dr., Suite 204 Tempe, AZ 85283 (USA) | ||||||
| Montesejo Carda, S.r.l. | Italy | 100.00 | % | 100.00 | % | Via Maurizio Bufalini, 8 Roma 00161, Italy. | ||||||
| Montesejo Pggio, S.r.l. | Italy | 100.00 | % | 100.00 | % | Via Maurizio Bufalini, 8 Roma 00161, Italy. | ||||||
| Montesejo Piano, S.r.l. | Italy | 100.00 | % | 100.00 | % | Via XX Settembre 1 cap 00187, Roma. | ||||||
| Mordor ES1 LLC | USA | 100.00 | % | 100.00 | % | 1553 West Todd Dr., Suite 204 Tempe, AZ 85283 (USA) | ||||||
| Mordor ES2 LLC | USA | 100.00 | % | 100.00 | % | 1553 West Todd Dr., Suite 204 Tempe, AZ 85283 (USA) | ||||||
| Nesyla, S.A. | Uruguay | 100.00 | % | 100.00 | % | Avda. Luis Alberto de Herrera, 1248, World Trade Center, Torre II, Piso 1. Oficina 1505, Montevideo, Uruguay. | ||||||
| Overnight Solar LLC | USA | 100.00 | % | 100.00 | % | 1553 West Todd Dr., Suite 204 Tempe, AZ 85283 (USA) | ||||||
| Palmatir, S.A | Uruguay | 100.00 | % | 100.00 | % | Avda. Luis Alberto de Herrera, 1248, World Trade Center, Torre II, Piso 1. Oficina 1505, Montevideo, Uruguay. | ||||||
| Palmucho, S.A. | Chile | 100.00 | % | 100.00 | % | Avda. Apoquindo, 3600, Piso 5, Oficina 517, Las Condes, Santiago de Chile | ||||||
| Parque Fotovoltaico La Tolua S.A.S | Colombia | 100.00 | % | 100.00 | % | MZ D CA 23 Urb. Bosques de Varsovia, Ibague, Tolima, Colombia. | ||||||
| Parque Solar Tierra Linda, S.A.S | Colombia | 100.00 | % | 100.00 | % | CC Arkacentro Mod T OF A 07 Sec. Arkacentro, Ibague, Tolima, Colombia. | ||||||
| Raitan ST1, S.,L. | Spain | 100.00 | % | 100.00 | % | C/ Albert Einstein, s/n 41092, Sevilla (Spain) | ||||||
| Re Sole, S.R.L. | Italy | 100.00 | % | 100.00 | % | Via de la Mercede, 11, 00187, Roma (Italy) | ||||||
| Rilados, S.A. | Uruguay | 100.00 | % | 100.00 | % | Luis Alberto de Herrera 1248, WTC, Torre 2, Piso 15, Oficina 1505, Montevideo, Uruguay |
| Rioglass Services North America, LLC | United States | 100.00 | % | 100.00 | % | 1209 Orange Street, City of Wilmington, County of New Castle, State of Delaware (USA) | ||||||
| Rioglass Servicios, S.L.U. | Spain | 100.00 | % | 100.00 | % | Ctra. Aznalcollar-Gerena, Km 1, Aznalcollar, Sevilla, Spain. | ||||||
| Rioglass Solar Chile, Spa | Chile | 100.00 | % | 100.00 | % | C/ Baquedano 239 oficina 322, Antofagasta, Chile. | ||||||
| Rioglass Solar Holding, S.A. | Spain | 100.00 | % | 100.00 | % | Poligono Industrial de Sevilla, Santa Cruz de Mieres, Mieres, Asturias, Spain. | ||||||
| Rioglass Solar Internacional, S.A. | Luxembourg | 100.00 | % | 100.00 | % | Avenue Grandchamp, 148. 1150. Woluwe-Saint-Pierre, Belgique | ||||||
| Rioglass Solar, S.A.U. | Spain | 100.00 | % | 100.00 | % | Poligono Industrial de Sevilla, Santa Cruz de Mieres, Mieres, Asturias, Spain. | ||||||
| Rioglass Solar SCH, S.L. | Spain | 100.00 | % | 100.00 | % | Ctra. Aznalcollar-Gerena, Km 1, Aznalcollar, Sevilla, Spain. | ||||||
| Rioglass Solar Systems | Israel | 100.00 | % | 100.00 | % | Adi Braunstain at “Gil Hirschman law office” Berkovitch st 4 Tel Aviv, Israel. | ||||||
| Rioglass South Africa Pty Ltd | South Africa | 100.00 | % | 100.00 | % | 20 Van Coppenhagen Street, Uppinton, Northern Cape, 8801, South Africa | ||||||
| Rio-Huan (Inner Mongolia) Solar Co., Ltd | Inner Mongolia (China) | 55.00 | % | 55.00 | % | Baolir Street, Jinqiao Economic Development Zone, Hohhot, Inner Mongolia. | ||||||
| Rising Solar, Inc | Canada | 100.00 | % | 100.00 | % | 435 9 Ave Se, T2G 2J6, Calgary, Canada. | ||||||
| RRHH Servicios Corporativos S. de R.L. de C.V. | Mexico | 100.00 | % | 100.00 | % | Avda. Jaime Balmes, 11, Piso 10, Torre C, Fraccion C, Oficina 1001, Col. Los Morales Polanco, 11510, Ciudad de Mexico | ||||||
| Sanlucar Solar, S.A. | Spain | 100.00 | % | 100.00 | % | C/ Albert Einstein, s/n 41092, Sevilla (Spain) | ||||||
| Solaben Electricidad Dos, S.A. | Spain | 70.00 | % | 70.00 | % | Plataforma Solar Extremadura, Carretera EX-116 PK 17,560, 10120 Logrosan (Caceres, Spain) | ||||||
| Solaben Electricidad Seis, S.A. | Spain | 100.00 | % | 100.00 | % | Plataforma Solar Extremadura, Carretera EX-116 PK 17,560, 10120 Logrosan (Caceres, Spain) | ||||||
| Solaben Electricidad Tres, S.A. | Spain | 70.00 | % | 70.00 | % | Plataforma Solar Extremadura, Carretera EX-116 PK 17,560, 10120 Logrosan (Caceres, Spain) | ||||||
| Solaben Electricidad Uno, S.A. | Spain | 100.00 | % | 100.00 | % | Plataforma Solar Extremadura, Carretera EX-116 PK 17,560, 10120 Logrosan (Caceres, Spain) | ||||||
| Solaben Luxembourg S.A. | Luxembourg | 100.00 | % | 100.00 | % | 6, rue Eugène RuppertL-2453 Luxembourg | ||||||
| Solacor Electricidad Dos, S.A. | Spain | 87.00 | % | 87.00 | % | C/ Albert Einstein, s/n 41092, Sevilla (Spain) |
| Solacor Electricidad Uno, S.A. | Spain | 87.00 | % | 87.00 | % | C/ Albert Einstein, s/n 41092, Sevilla (Spain) | ||||||
| Solar Processes, S.A. | Spain | 100.00 | % | 100.00 | % | C/ Albert Einstein, s/n 41092, Sevilla (Spain) | ||||||
| Solnova Electricidad Cuatro, S.A. | Spain | 100.00 | % | 100.00 | % | C/ Albert Einstein, s/n 41092, Sevilla (Spain) | ||||||
| Solnova Electricidad Tres, S.A. | Spain | 100.00 | % | 100.00 | % | C/ Albert Einstein, s/n 41092, Sevilla (Spain) | ||||||
| Solnova Electricidad Uno, S.A. | Spain | 100.00 | % | 100.00 | % | C/ Albert Einstein, s/n 41092, Sevilla (Spain) | ||||||
| Solnova Solar Inversiones, S.A. | Spain | 100.00 | % | 100.00 | % | C/ Albert Einstein, s/n 41092, Sevilla (Spain) | ||||||
| Tenes Lilmiyah SPA | Algeria | 51.00 | % | 51.00 | % | 19 Lot Bois des Cars III. Dely Ibrahim, Alger. | ||||||
| Transmisora Baquedano, S.A. | Chile | 100.00 | % | 100.00 | % | Avda. Apoquindo, 3600, Piso 5, Oficina 517, Las Condes, Santiago de Chile | ||||||
| Transmisora Mejillones, S.A. | Chile | 100.00 | % | 100.00 | % | Avda. Apoquindo, 3600, Piso 5, Oficina 517, Las Condes, Santiago de Chile | ||||||
| Transmisora Melipeuco, S.A. | Chile | 100.00 | % | 100.00 | % | Avda. Apoquindo, 3600, Piso 5, Oficina 517, Las Condes, Santiago de Chile | ||||||
| Vernay, S.A. | Uruguay | 100.00 | % | 100.00 | % | World Trade Center 1248 Torre 1 Of. 1001, Montevideo, Uruguay | ||||||
| White Rock Insurance (Europe) PPC Limited | Malta | 100.00 | % | 100.00 | % | Central Business District. CBD1070, Birkirkara (Malta) |
The investments in subsidiaries are all stated at cost. Information on the investments made in the year is disclosed in Note 5 of the consolidated financial statements. As of 31 December 2023 and 2022, the carrying amount of the investments held directly by the Company were as follows:
|
Cost 2023 $’000 |
Accumulated Impairment 2023 $’000 |
Net 2023 $’000 |
|||||||||||
| ACT Holdings, S.A. de C.V. | 98,543 | - | 98,543 | ||||||||||
| Atlantica Corporate Resources, S.L. | 11,358 | (2,404 | ) | 8,954 | |||||||||
| Atlantica Infraestructura Sostenible, S.L.U. | 889,539 | 889,539 | |||||||||||
| Atlantica Investments Ltd. | 56,998 | - | 56,998 | ||||||||||
| Atlantica Newco, Ltd. | - | - | - | ||||||||||
| Atlantica North America, LLC. | 736,484 | (528,698 | ) | 207,786 | |||||||||
| Atlantica Peru, S.A. | 261,920 | - | 261,920 | ||||||||||
| Atlantica Renewable Power Mexico, S. de R.L. de C.V. | 1,800 | (7 | ) | 1,793 | |||||||||
| Atlantica Sustainable Infrastructure Jersey Ltd. | - | - | - | ||||||||||
| Atlantica Transmision Sur, S.A. (*) | 11,882 | - | 11,882 | ||||||||||
| ATN 2, S.A. | 15,896 | - | 15,896 | ||||||||||
| ATN, S.A. (*) | 14,470 | - | 14,470 | ||||||||||
| AYES International UK Ltd. | 4,854 | - | 4,854 | ||||||||||
| Palmucho, S.A. | - | - | - | ||||||||||
| Transmisora Baquedano, S.A. | - | - | - | ||||||||||
| Transmisora Mejillones, S.A. | - | - | - | ||||||||||
| Transmisora Melipeuco, S.A. | 98 | - | 98 | ||||||||||
| White Rock Insurance (Europe) PCC Limited | 1,036 | (1,036 | ) | - | |||||||||
| Total investments in subsidiaries | 2,104,878 | (532,145 | ) | 1,572,733 | |||||||||
|
Cost 2022 $’000 |
Accumulated $’000 |
Net 2022 $’000 |
|||||||||||
| ACT Holdings, S.A. de C.V. | 98,543 | - | 98,543 | ||||||||||
| Atlantica Corporate Resources, S.L. | 11,358 | (2,404 | ) | 8,954 | |||||||||
| Atlantica Infraestructura Sostenible, S.L.U. | 889,236 | - | 889,236 | ||||||||||
| Atlantica Investments Ltd. | 56,998 | - | 56,998 | ||||||||||
| Atlantica Newco, Ltd. | - | - | - | ||||||||||
| Atlantica North America, LLC. | 730,200 | (428,449 | ) | 301,751 | |||||||||
| Atlantica Peru, S.A. | 261,920 | - | 261,920 | ||||||||||
| Atlantica Sustainable Infrastructure Jersey Ltd. | - | - | - | ||||||||||
| Atlantica Transmision Sur, S.A. (*) | 11,847 | - | 11,847 | ||||||||||
| ATN 2, S.A. | 15,896 | (2,176 | ) | 13,720 | |||||||||
| ATN, S.A. (*) | 13,988 | - | 13,988 | ||||||||||
| AYES International UK Ltd. | 4,854 | - | 4,854 | ||||||||||
| CKA1 Holding S. de R.L. de C.V. | 7 | (7 | ) | - | |||||||||
| Palmucho, S.A. | - | - | - | ||||||||||
| Transmisora Baquedano, S.A. | - | - | - | ||||||||||
| Transmisora Mejillones, S.A. | - | - | - | ||||||||||
| Transmisora Melipeuco, S.A. | 98 | - | 98 | ||||||||||
| Total investments in subsidiaries | 2,094,945 | (433,036 | ) | 1,661,909 | |||||||||
| (*) Corresponds to the initial difference between the amortized cost and nominal amount of interest free loans (classified as amounts owed by group undertakings, see note 4), classified as capital contribution in accordance with IFRS 9. |
Movements in the carrying value of investments during the years 2023 and 2022 were as follows:
| $ ´000 | |||||
| As at 1 January 2023 | 1,661,909 | ||||
| Increase | 9,933 | ||||
| Impairment | (99,109 | ) | |||
| As at 31 December 2023 | 1,572,733 | ||||
|
$ ´000 |
|||||
| As at 1 January 2022 | 1,779,817 | ||||
| Increase | 635 | ||||
| Impairment | (118,543 | ) | |||
| As at 31 December 2022 | 1,661,909 | ||||
The increase in 2023 mainly relates to capital increase in the U.S. entities.
The impairment for $99.1 million in 2023 and for $118.5 million in 2022 correspond mainly to the investment held in Atlantica North America LLC, which is the holding company of all the U.S. entities of Atlantica. The impairment is primarily due to an increase in the discount rate used to discount future cash flow projections to obtain the recoverable amount of the investment, dividends received recorded as income in the profit or loss of the Company reducing equity value of the subsidiaries and to the impairment recorded in Solana in 2022 (see Note 6 to the consolidated financial statements). The impairment loss was obtained by comparing the recoverable amount of the investment against its carrying amount. The recoverable amount of the investment was assessed based on a value in use method.
| 4. | Amounts Owed by/to Group Undertakings |
|
2023 $’000 |
2022 $’000 |
|||||
| Non-current receivables from group companies | 991,391 | 930,188 | ||||
| Current receivables from group undertakings | 20,471 | 34,495 | ||||
| Total amounts owed by group undertakings | 1,011,862 | 964,683 | ||||
| Current amounts owed to group undertakings | 9,170 | 3,792 | ||||
| Non-Current amounts owed to group undertakings | 461,498 | 379,892 | ||||
| Total amounts owed to group undertakings | 470,668 | 383,684 |
As of 31 December 2023 and 2022, the details of non-current amounts owed by group undertakings were as follows:
|
2023 $’000 |
2022 $’000 |
|||||
| ATN, S.A. | 3,937 | 10,548 | ||||
| Atlantica South Africa (Pty), Ltd. | 4,884 | 1,321 | ||||
| ASUSHI, Inc | 65,465 | 62,847 | ||||
| Atlantica Investments, Ltd. | 178,089 | 142,657 | ||||
| Helios I Hyperion Energy Investments, S.A. | 1,647 | 4,187 | ||||
| Helios II Hyperion Energy Investments, S.A. | 3,103 | 4,443 | ||||
| Atlantica North America, LLC | 465,709 | 438,695 | ||||
| Sanlucar Solar, S.A. | 14,572 | 14,723 | ||||
| Atlantica Newco, Ltd. | 101,648 | 99,248 | ||||
| ASHUSA, Inc | 76,451 | 70,788 | ||||
| Solar Process, S.A. | 34,924 | 31,327 | ||||
| Solnova Electricidad, S.A. | 5,119 | 14,714 | ||||
| Solnova Electricidad Tres, S.A. | 5,400 | 14,170 | ||||
| Solnova Electricidad Cuatro, S.A. | 9,731 | 12,955 | ||||
| Atlantica y Quartux Almacenamiento de Energía, S.A.P.I. | 9,528 | - | ||||
| Atlantica Renewable Power Mexico de R.L. de C.V | 3,245 | - | ||||
| Other | 7,939 | 7,565 | ||||
| Amounts owed by group undertakings | 991,391 | 930,188 | ||||
The principal features of the most significant loans to subsidiary undertakings are as follows:
| Interest Rate | Maturity | ||||
| ATN, S.A. | 0%(**) | Not applicable | |||
| Atlantica South Africa (Pty) Ltd. | Not applicable | Not applicable | |||
| ASUSHI, Inc | 8.0%(*) | 31 December 2030 | |||
| ASHUSA, Inc. | 8.0%(*) | 31 December 2030 | |||
| Atlantica Investments Ltd. | 8.0%(*) | 31 December 2030 | |||
| Atlantica North America LLC | 8.0%(*) | 31 December 2030 | |||
| Atlantica Newco Limited | 8.0%(*) | 31 December 2030 | |||
| Sanlucar Solar, S.A. | 8.0%(*) | 31 December 2030 | |||
| Solar Process, S.A. | 8.0%(*) | 31 December 2030 | |||
| Atlantica y Quartux Almacenamiento de Energía, S.A.P.I. | 9.0% | 31 December 2032 | |||
| Solnova Electricidad, S.A. | 2.5% plus Euribor 12 months | 20 July 2035 | |||
| Solnova Electricidad Tres, S.A. | 2.5% plus Euribor 12 months | 20 July 2035 | |||
| Solnova Electricidad Cuatro, S.A. | 2.5% plus Euribor 12 months | 20 July 2035 | |||
(*) Fixed interest rate has been increased with effective date January 1, 2023 as a result of increased market interest rates
(**) Loan accounted for at amortized cost using an effective interest rate of 5% As at 31 December 2023, the amounts owed to group undertakings primarily relate to ACT Energy Mexico, S.A. de C.V. for $163.0 million ($162.8 million as of 31 December 2022), to Atlantica Sustainable Infrastructure Jersey Ltd for $110.5 million ($107.9 million as of 31 December 2022) and to Atlantica Infraestructura Sostenible, S.L.U. for $180.3 million ($98.9 million as of 31 December 2022).
| 5. | Borrowings |
As of 31 December 2023 and 2022, the details of borrowings were as follows:
|
2023 $’000 |
2022 $’000 |
|||||
| Secured borrowing at amortised cost | ||||||
| Bonds | 25,692 | 9,937 | ||||
| Borrowings | 932,700 | 888,020 | ||||
| Total borrowings | 958,392 | 897,957 | ||||
| Amount due for settlement within 12 months | 27,102 | 11,442 | ||||
| Amount due for settlement after 12 months | 931,290 | 886,515 | ||||
The main features of the borrowings and bonds are as follows:
On July 20, 2017, the Company signed a credit facility (the “2017 Credit Facility”) for up to €10.0 million ($11.0 million), which is available in euros or U.S. dollars. Amounts drawn down accrue interest at a rate per year equal to EURIBOR plus 2% or SOFR plus 2%, depending on the currency, with a floor of 0% on the EURIBOR and SOFR. As of December 31, 2023, $9.9 million has been drawn down ($6.4 million as of December 31, 2022). As of December 31, 2022, the credit facility maturity was July 1, 2024. On August 7, 2023, the available amount under the 2017 Credit Facility has been increased to €15.0 million ($16.6 million) and the maturity extended to July 1, 2025.
On May 10, 2018, the Company entered into the Revolving Credit Facility for $215 million with a syndicate of banks. Amounts drawn down accrue interest at a rate per year equal to (A) for Eurodollar rate loans, Term SOFR, plus a Term SOFR Adjustment equal to 0.10% per annum, plus a percentage determined by reference to the leverage ratio of the Company, ranging between 1.60% and 2.25% and (B) for base rate loans, the highest of (i) the rate per annum equal to the weighted average of the rates on overnight U.S. Federal funds transactions with members of the U.S. Federal Reserve System arranged by U.S. Federal funds brokers on such day plus ½ of 1.00%, (ii) the U.S. prime rate and (iii) Term SOFR plus 1.00%, in any case, plus a percentage determined by reference to the leverage ratio of the Company, ranging between 0.60% and 1.00%. Letters of credit may be issued using up to $100 million of the Revolving Credit Facility. Since then, the amount of the Revolving Credit Facility increased to $450 million. On May 30, 2023, the maturity was extended to December 31, 2025. On December 31, 2023, $55 million were drawn down ($30 million as of December 31, 2022). On December 31, 2023, the Company issued letters of credit for $17 million ($35 million as of December 31, 2022). As of December 31, 2023, therefore, $378 million of the Revolving Credit Facility were available ($385 million as of December 31, 2022).
On October 8, 2019, the Company filed a euro commercial paper program (the “Commercial Paper”) with the Alternative Fixed Income Market (MARF) in Spain. The program had an original maturity of twelve months and was extended for annual periods until October 2023. The program allowed Atlantica to issue short term notes over the next twelve months for up to €50 million ($55 million), with such notes having a tenor of up to two years. On November 21, 2023, the Company filed a new program that allows Atlantica to issue short term notes for up to €100 million, with such notes having a tenor of up to two years and the program maturity has been extended twelve months. As of December 31, 2023, the Company had €23.3 million ($25.7 million) issued and outstanding under the program at an average cost of 5.27% (€9.3 million, or $10.1 million, as of December 31, 2022).
On April 1, 2020, the Company closed the secured 2020 Green Private Placement for €290 million ($320 million). The private placement accrues interest at an annual 1.96% interest rate, payable quarterly and has a June 2026 maturity.
On July 8, 2020, the Company entered into the Note Issuance Facility 2020, a senior unsecured financing with a group of funds managed by Westbourne Capital as purchasers of the notes issued thereunder for a total amount of $155 million which is denominated in euros (€140 million). The Note Issuance Facility 2020 was issued on August 12, 2020, interest accrues at a rate per annum equal to the sum of the 3-month EURIBOR plus a margin of 5.25% with a floor of 0% for the EURIBOR, payable quarterly and has a maturity of seven years from the closing date. The Company has entered into a cap at 0% for the EURIBOR with 3.5 years maturity to hedge the variable interest rate risk.
On May 18, 2021, the Company issued the Green Senior Notes due in 2028 in an aggregate principal amount of $400 million. The notes mature on May 15, 2028 and bear interest at a rate of 4.125% per annum payable on June 15 and December 15 of each year, commencing December 15, 2021.
On May 10, 2023, the Company entered into a senior unsecured $50 million line of credit with Export Development Canada with a 3-year maturity. Loan under the credit line accrues interest at a rate per annum equal to Term SOFR plus a percentage determined by reference to the leverage ratio of the Company, ranging between 2.46% and 3.11%, with a floor of 0.00% for the Term SOFR. The facility matures on May 25, 2026, and was fully available as of December 31, 2023.
| 6. | Derivative assets and liabilities |
The breakdowns of the fair value amount of the derivative financial instruments as of December 31, 2023 and 2022 are as follows:
| Balance as of December 31, 2023 | Balance as of December 31, 2022 | |||||||||||||||
| Assets | Liabilities | Assets | Liabilities | |||||||||||||
| Foreign exchange derivatives instruments | 1,594 | - | 3,189 | - | ||||||||||||
| Notes conversion option | - | 794 | - | 4,688 | ||||||||||||
| Interest rate cash flow hedge | 24 | - | 4,648 | - | ||||||||||||
| Total | 1,618 | 794 | 7,837 | 4,688 | ||||||||||||
The Company owns the following derivatives instruments:
| - | Interest rate cash flow hedge classified as current assets relate to an interest rate cap hedging the Note Issuance Facility 2020 interest with a strike of 0%. |
| - | Currency options with leading international financial institutions, which guarantee minimum Euro-U.S. dollar exchange rates. The strategy of the Company is to hedge the exchange rate for the distributions from its European assets after deducting euro-denominated interest payments and euro-denominated general and administrative expenses. Through currency options, the Company hedges 100% of its euro-denominated net exposure for the next 12 months and 75% of its euro denominated net exposure for the following 12 months, on a rolling basis. Hedge accounting is not applied to these options. |
On July 17, 2020, Atlantica Sustainable Infrastructure Jersey Limited, a subsidiary of the Company issued $100 million aggregate principal amount of 4.00% convertible bonds (the “Green Exchangeable Notes”) due 2025. On July 29, 2020, Atlantica Sustainable Infrastructure Jersey Limited closed an additional $15 million aggregate principal amount of the Green Exchangeable Notes. The notes mature on July 15, 2025 and bear interest at a rate of 4.00% per annum. The initial exchange rate of the notes is 29.1070 ordinary shares of the Company per $1,000 principal amount of notes, which is equivalent to an initial exchange price of $34.36 per ordinary share. Noteholders may exchange their notes at their option at any time prior to the close of business on the scheduled trading day immediately preceding April 15, 2025, only during certain periods and upon satisfaction of certain conditions. On or after April 15, 2025, noteholders may exchange their notes at any time. Upon exchange, the notes may be settled, at the election of the Company, into its ordinary shares, cash or a combination thereof. The exchange rate is subject to adjustment upon the occurrence of certain events.
The conversion option of the Green Exchangeable Notes is an embedded derivative associated to the option to convert into the Company´s shares, with no obligation for Atlantica Sustainable Infrastructure Jersey Limited to deliver itself these shares to the Noteholders. It is therefore classified within the line “Derivative liabilities” of these financial statements. As of December 31, 2023, the fair value is a liability of $0.8 million (a liability of $4.7 million as of December 31, 2022). The prospective changes to its fair value are accounted for directly through the income statement. This instrument is classified as Level 2 in the fair value hierarchy (see Note 2.7 of the consolidated financial statements) based on the observable inputs used for the calculation of its fair value. The valuation technique used is a Monte Carlo which uses regressions to estimate, given a stock price level, the continuation value of the instrument.
| 7. | Trade and Other Payables |
As of 31 December 2023, and 2022, Trade and other payables primarily relate to independent professional services.
| 8. | Equity |
As of December 31, 2023, the share capital of the Company amounts to $11,615,905 ($11,605,513 as of December 31, 2022) represented by 116,159,054 ordinary shares (116,055,126 shares as of December 31, 2022) fully subscribed and disbursed with a nominal value of $0.10 each, all in the same class and series. Each share grants one voting right.
Algonquin owns 42.2% of the shares of the Company and is its largest shareholder as of December 31, 2023. Algonquin’s voting rights and rights to appoint directors are limited to 41.5% and the difference between Algonquin´s ownership and 41.5% will vote replicating non-Algonquin’s shareholders’ vote.
The Company accounts for its existing long-term incentive plans granted to employees as equity-settled in accordance with IFRS 2, Share-based Payment when incentives are being settled in shares. During the year 2023, the Company issued 103,928 new shares (228,560 new shares during the year 2022) to its employees to settle a portion of these plans.
On February 28, 2022, the Company established a new “at-the-market program” which replaced its previous program, and entered into a distribution agreement with BofA Securities, MUFG and RBC Capital Markets, as its sales agents, under which the Company may offer and sell from time to time up to $150 million of its ordinary shares. During the year 2023, the Company did not sell any shares under this program. During the year 2022, the Company sold 3,423,593 shares at an average market price of $33.57 pursuant to its distribution agreement, representing net proceeds of $114 million.
Atlantica´s reserves as of December 31, 2023 are made up of share premium account and capital reserves. The share premium account reduction by $250 million during the year 2023, increasing capital reserves by the same amount, was made effective upon the confirmation received on June 26, 2023 from the High Court in the UK, pursuant to the Companies Act 2006.
Other reserves primarily include the change in fair value of cash flow hedges instruments, net of tax.
Accumulated deficit primarily includes the results of the Company.
Dividends declared by the Company in 2023 and 2022 are disclosed in note 14 to the consolidated financial statements of the Company.
| 9. | Cash and cash equivalents |
Cash and cash equivalents as of December 31, 2023, include $33.0 million of cash at bank and on hand ($60.8 million as of December 31, 2022).
| 10. | Third-party guarantees |
The Company, or other holding entities on its behalf, issued guarantees on behalf of subsidiaries amounting to $238.3 million as of December 31, 2023 ($216.9 million as of December 31, 2022), which correspond mainly to guarantees provided to off-takers in PPAs, guarantees for debt service reserve accounts and guarantees for points of access for renewable energy projects.
387
