|
Oklahoma
|
001-38656
|
20-0764349
|
|
(State or other jurisdiction of incorporation)
|
(Commission File Number)
|
(IRS Employer Identification No.)
|
| ☐ |
Written communications pursuant to Rule 425 under the Securities Act (17 CFR 230.425)
|
| ☐ |
Soliciting material pursuant to Rule 14a-12 under the Exchange Act (17 CFR 240.14a-12)
|
| ☐ |
Pre-commencement communications pursuant to Rule 14d-2(b) under the Exchange Act (17 CFR 240.14d-2(b))
|
| ☐ |
Pre-commencement communications pursuant to Rule 13e-4(c) under the Exchange Act (17 CFR 240.13e-4(c))
|
|
Title of each class
|
Trading
Symbol(s)
|
Name of each exchange on which
registered
|
|
Common Stock, $0.01 par value
|
BSVN
|
The NASDAQ Global Select Market
|
|
|
Emerging growth company ☑
|
| Item 2.02. |
Results of Operations and Financial Condition
|
| Item 7.01 |
Regulation FD Disclosure
|
| Item 9.01 |
Financial Statements and Exhibits
|
|
|
(d) | Exhibits. |
|
Item
|
Description
|
|
|
Press Release dated October 26, 2023
|
||
|
Third Quarter 2023 Investor Presentation
|
||
|
BANK7 CORP.
|
||
|
Date: October 26, 2023
|
By:
|
/s/ Kelly J. Harris
|
|
Kelly J. Harris
|
||
|
Executive Vice President and Chief Financial Officer
|
||
|
|
- |
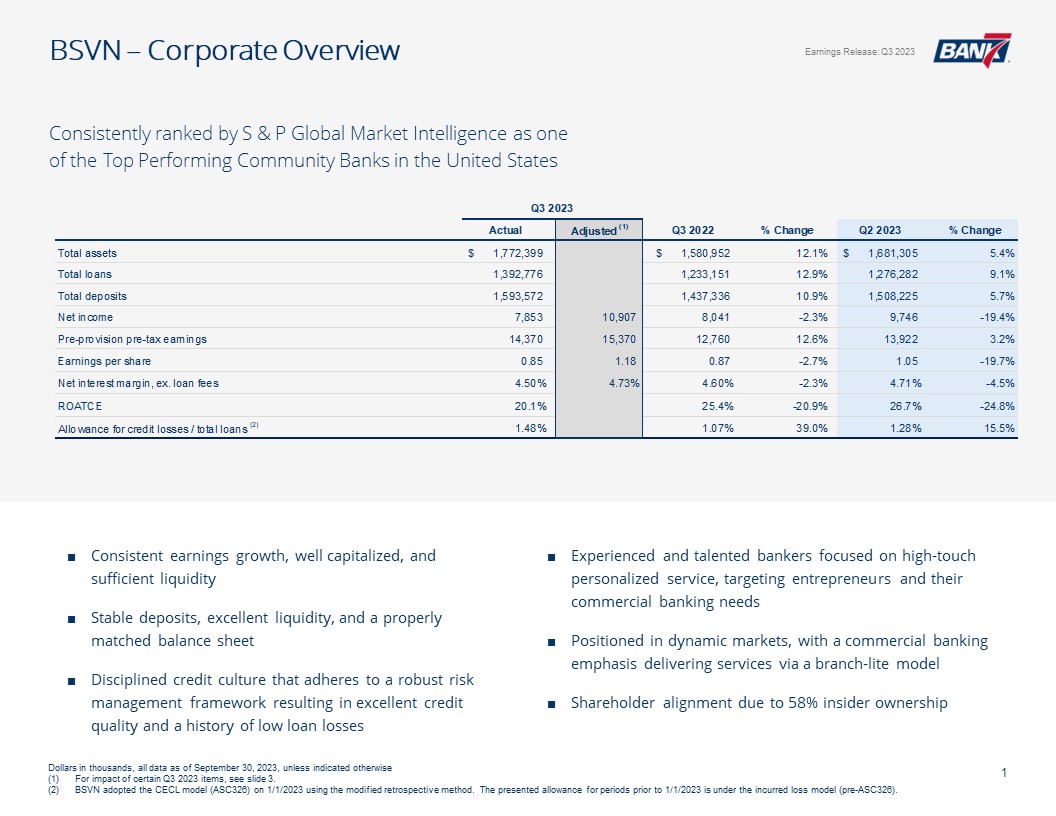
Net Income of $7.9 million compared to $8.0 million, a decrease of 2.3%
|
|
|
- |
Earnings per share of $0.85 compared to $0.87, a decrease of 2.7%
|
|
|
- |
Total assets of $1.8 billion compared to $1.6 billion, an increase of 12.11%
|
|
|
- |
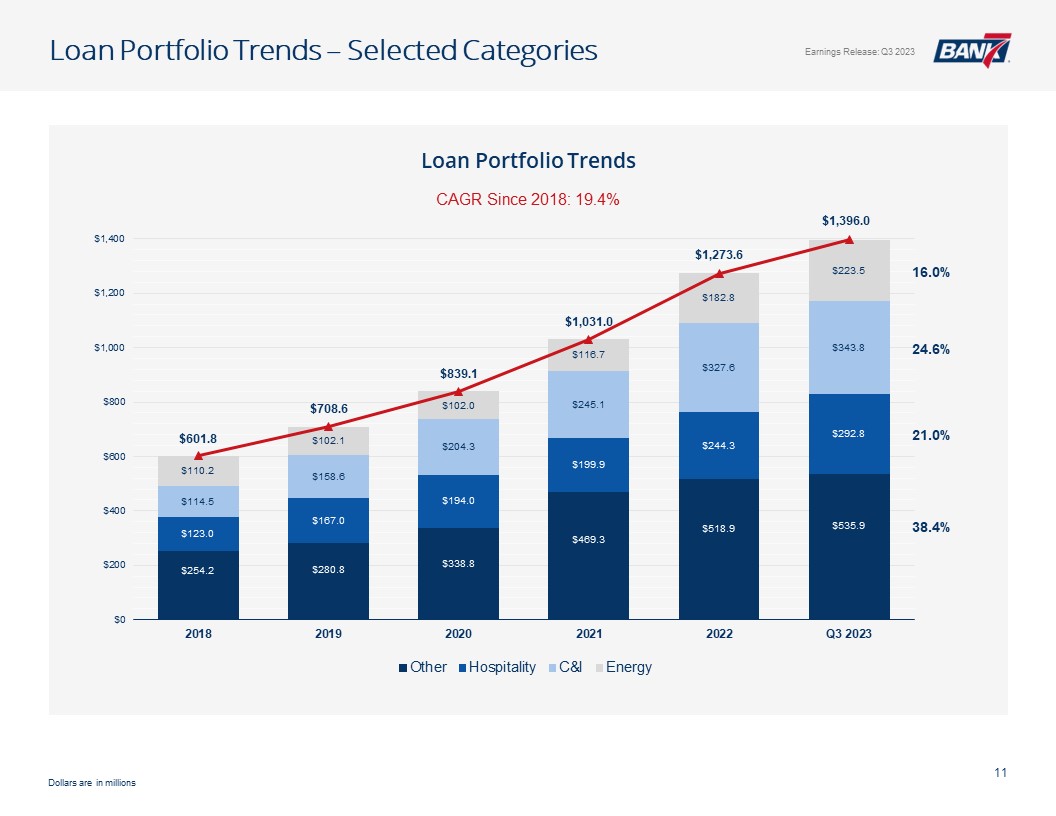
Total loans of $1.4 billion compared to $1.2 billion, an increase of 12.94%
|
|
|
- |
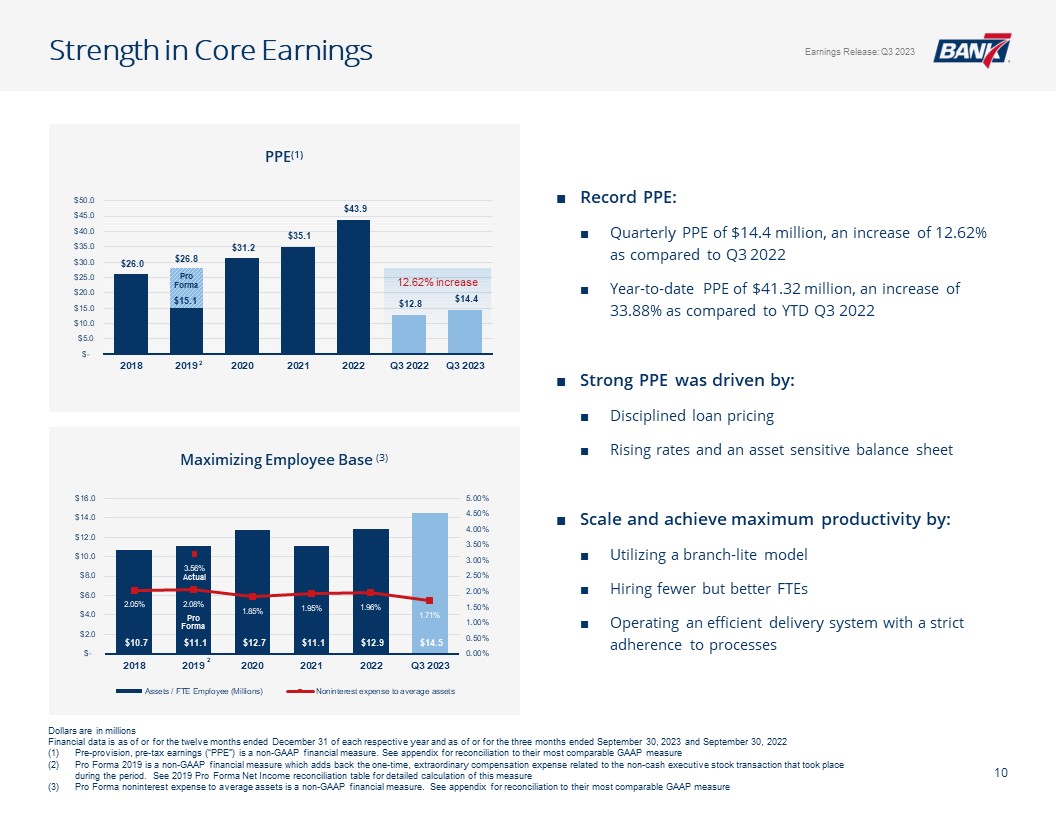
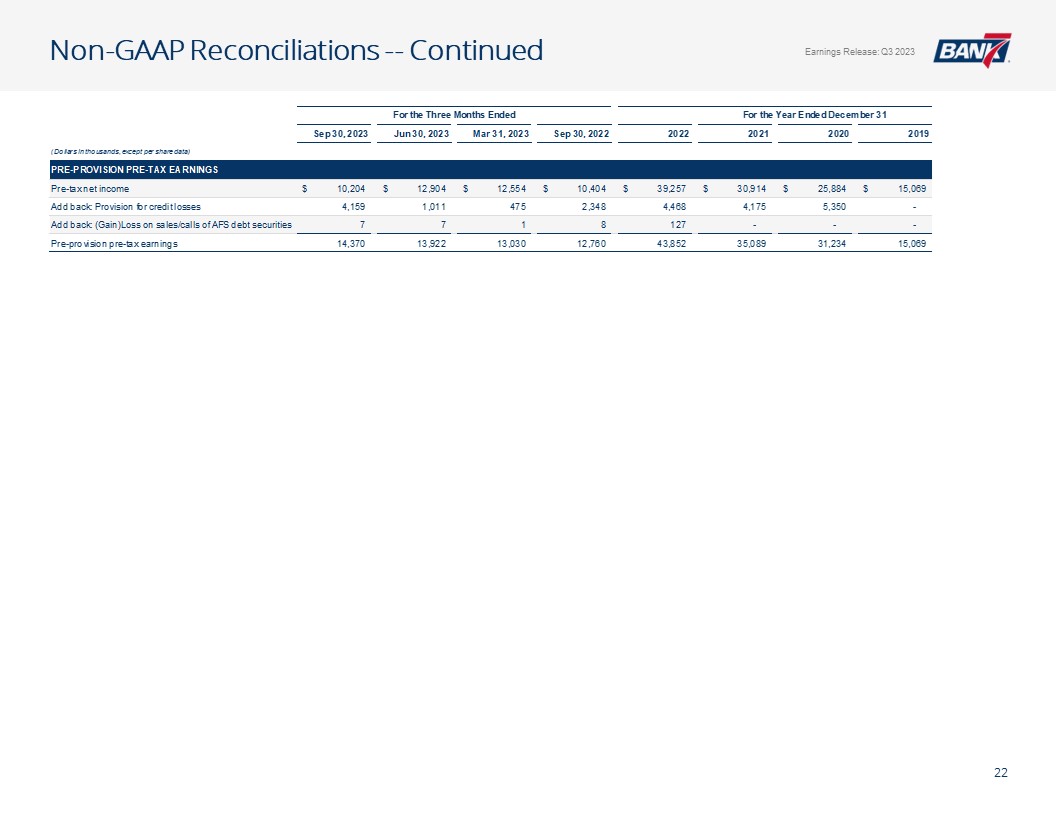
PPE of $14.4 million compared to $12.8 million, an increase of 12.62%
|
|
|
- |
Total interest income of $31.7 million compared to $21.7 million, an increase of 46.24%
|
|
|
- |
Net Income of $27.2 million compared to $21.2 million, an increase of 28.03%
|
|
|
- |
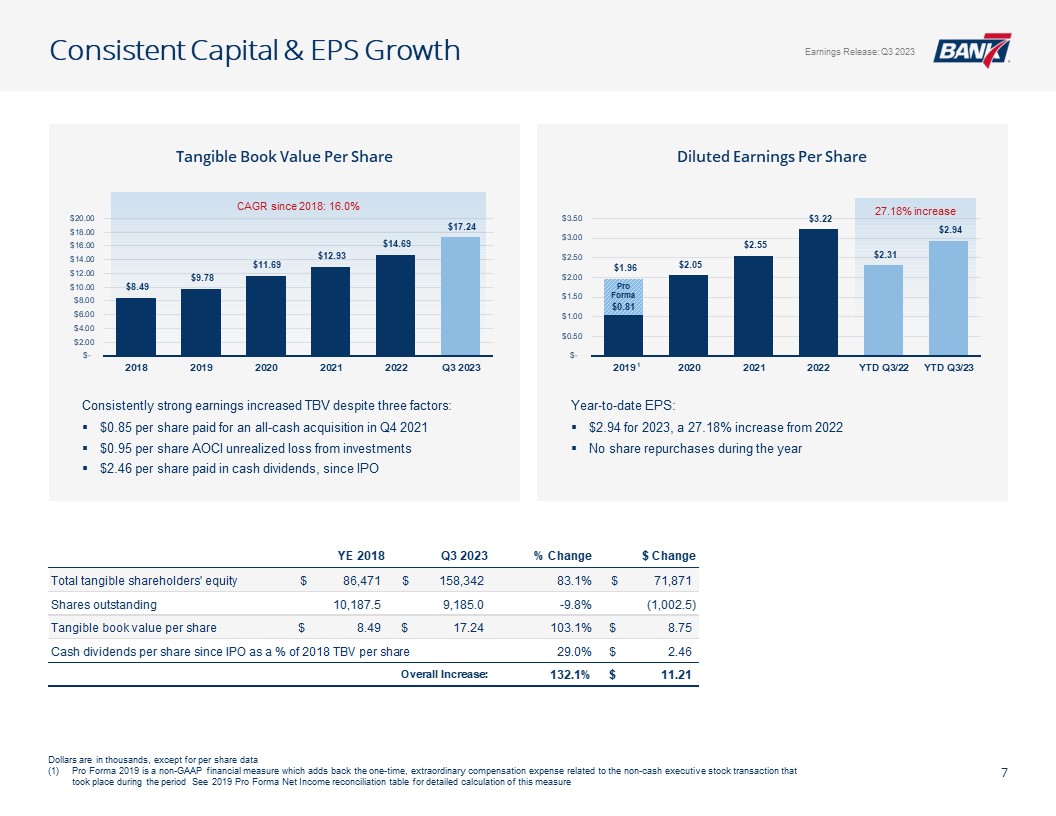
Earnings per share of $2.94 compared to $2.31, an increase of 27.11%
|
|
|
- |
Total assets of $1.8 billion compared to $1.6 billion, an increase of 12.11%
|
|
|
- |
Total loans of $1.4 billion compared to $1.2 billion, an increase of 12.94%
|
|
|
- |
PPE of $41.3 million compared to $30.9 million, an increase of 33.88%
|
|
|
- |
Total interest income of $89.1 million compared to $53.3 million, an increase of 67.29%
|
|
Assets
|
September 30,
2023
|
December 31,
|
||||||
|
(unaudited)
|
2022
|
|||||||
|
Cash and due from banks
|
$
|
169,490
|
$
|
109,115
|
||||
|
Interest-bearing time deposits in other banks
|
17,182
|
5,474
|
||||||
|
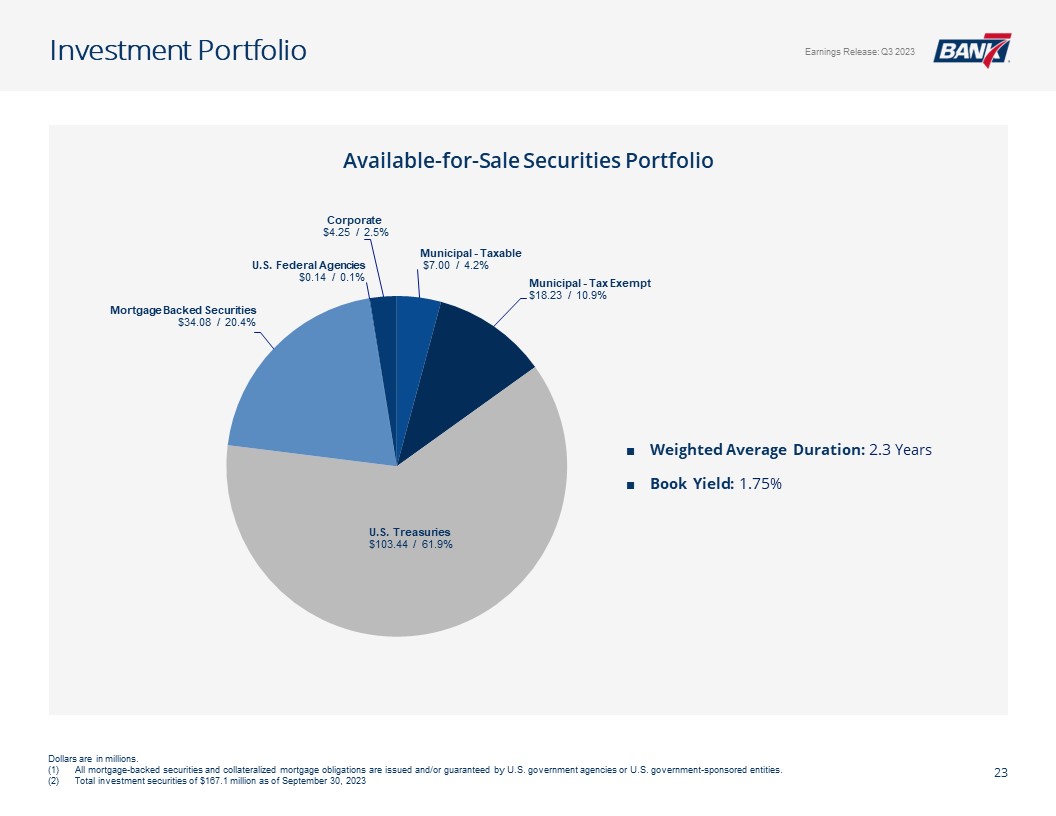
Available-for-sale debt securities
|
167,138
|
173,165
|
||||||
|
Loans, net of allowance for credit losses of $20,649 and $14,734
at September 30, 2023 and December 31, 2022, respectively
|
1,372,128
|
1,255,722
|
||||||
|
Loans held for sale, at fair value
|
1,143
|
-
|
||||||
|
Premises and equipment, net
|
14,963
|
13,106
|
||||||
|
Nonmarketable equity securities
|
1,251
|
1,209
|
||||||
|
Core deposit intangibles
|
1,107
|
1,336
|
||||||
|
Goodwill
|
8,458
|
8,603
|
||||||
|
Interest receivable and other assets
|
19,539
|
16,439
|
||||||
|
Total assets
|
$
|
1,772,399
|
$
|
1,584,169
|
||||
|
Liabilities and Shareholders’ Equity
|
||||||||
|
Deposits
|
||||||||
|
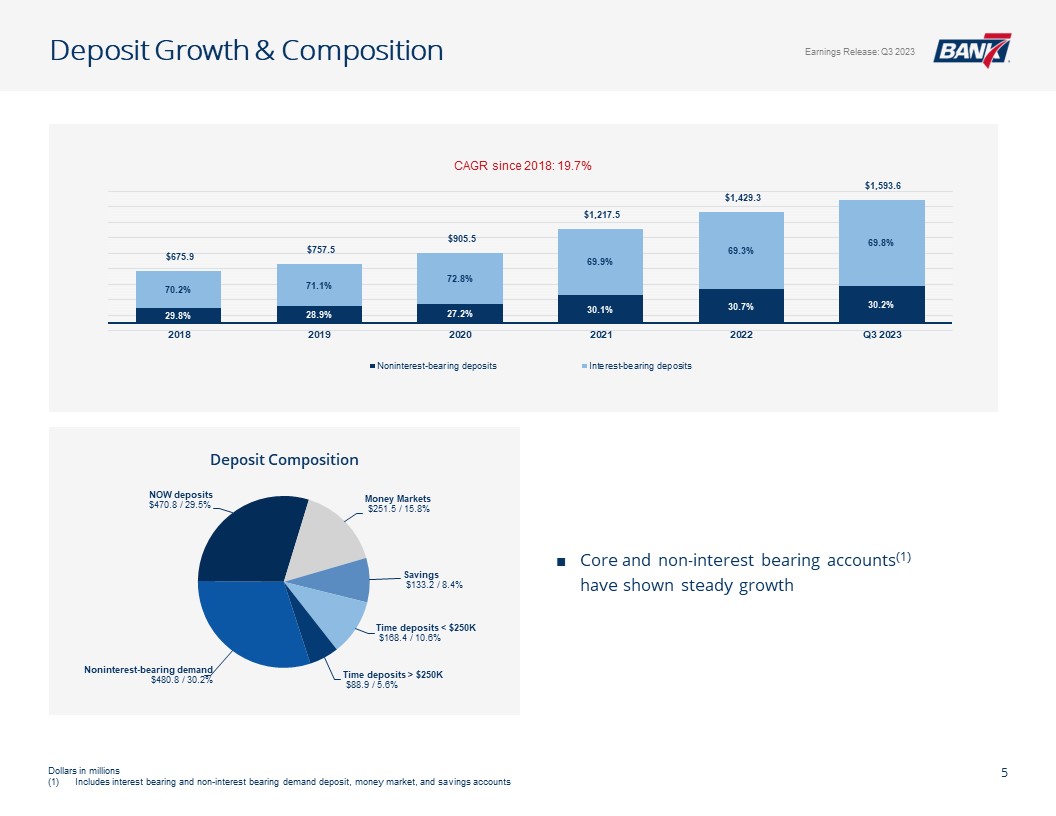
Noninterest-bearing
|
$
|
480,827
|
$
|
439,409
|
||||
|
Interest-bearing
|
1,112,745
|
989,891
|
||||||
|
Total deposits
|
1,593,572
|
1,429,300
|
||||||
|
Income taxes payable
|
419
|
1,054
|
||||||
|
Interest payable and other liabilities
|
10,501
|
9,715
|
||||||
|
Total liabilities
|
1,604,492
|
1,440,069
|
||||||
|
Shareholders’ equity
|
||||||||
|
Common stock, $0.01 par value; 50,000,000 shares authorized; shares
issued and outstanding: 9,184,975 and 9,131,973 at
September 30, 2023 and December 31, 2022 respectively
|
92 |
91 |
||||||
|
Additional paid-in capital
|
97,068
|
95,263
|
||||||
|
Retained earnings
|
79,825
|
58,049
|
||||||
|
Accumulated other comprehensive income (loss)
|
(9,078
|
)
|
(9,303
|
)
|
||||
|
Total shareholders’ equity
|
167,907
|
144,100
|
||||||
|
|
||||||||
|
Total liabilities and shareholders’ equity
|
$
|
1,772,399
|
$
|
1,584,169
|
||||
|
|
Unaudited as of
|
|||||||||||||||
|
|
Three Months Ended
|
Nine Months Ended
|
||||||||||||||
|
|
September 30,
|
September 30,
|
||||||||||||||
|
|
2023
|
2022
|
2023
|
2022
|
||||||||||||
|
Interest Income
|
||||||||||||||||
|
Loans, including fees
|
$
|
28,880
|
$
|
20,466
|
$
|
81,117
|
$
|
50,597
|
||||||||
|
Interest-bearing time deposits in other banks
|
159
|
10
|
270
|
39
|
||||||||||||
|
Debt securities, taxable
|
699
|
690
|
2,106
|
1,625
|
||||||||||||
|
Debt securities, tax-exempt
|
81
|
90
|
253
|
273
|
||||||||||||
|
Other interest and dividend income
|
1,903
|
435
|
5,398
|
754
|
||||||||||||
|
|
||||||||||||||||
|
Total interest income
|
31,722
|
21,691
|
89,144
|
53,288
|
||||||||||||
|
|
||||||||||||||||
|
Interest Expense
|
||||||||||||||||
|
Deposits
|
10,976
|
2,646
|
27,894
|
4,241
|
||||||||||||
|
|
||||||||||||||||
|
Total interest expense
|
10,976
|
2,646
|
27,894
|
4,241
|
||||||||||||
|
|
||||||||||||||||
|
Net Interest Income
|
20,746
|
19,045
|
61,250
|
49,047
|
||||||||||||
|
|
||||||||||||||||
|
Provision for Credit Losses
|
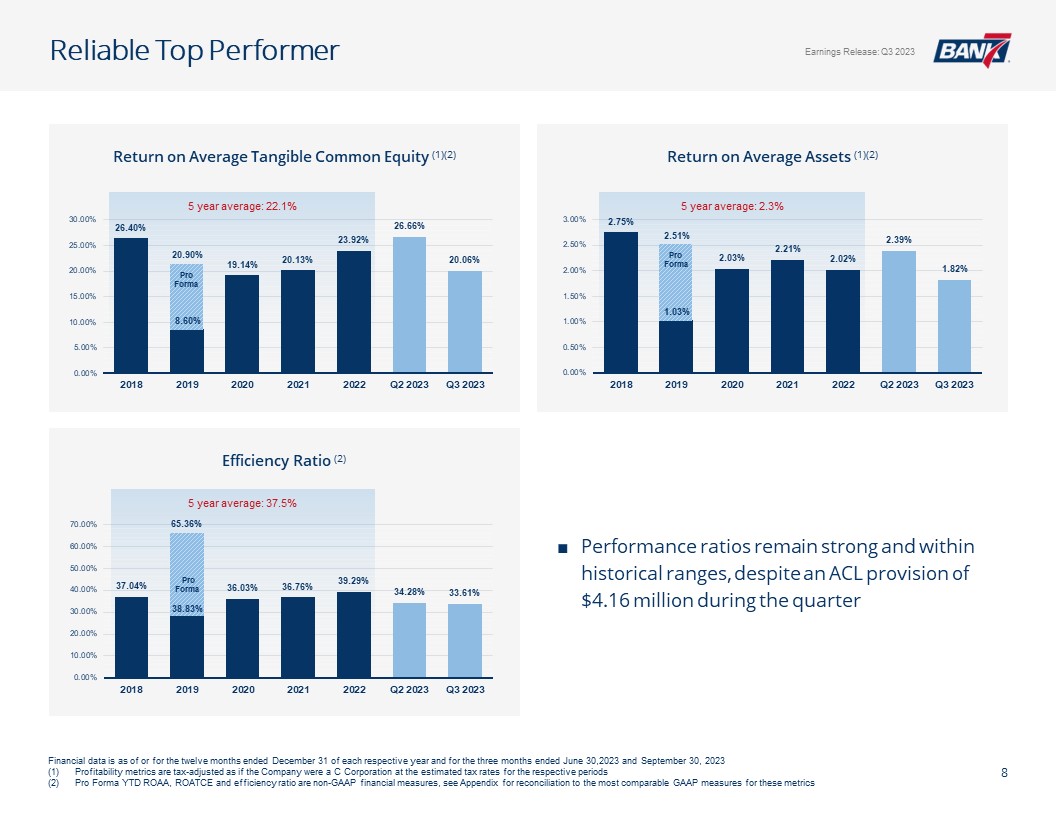
4,159
|
2,348
|
5,645
|
2,843
|
||||||||||||
|
|
||||||||||||||||
|
Net Interest Income After Provision for Credit Losses
|
16,587
|
16,697
|
55,605
|
46,204
|
||||||||||||
|
|
||||||||||||||||
|
Noninterest Income
|
||||||||||||||||
|
Secondary market income
|
6
|
134
|
172
|
395
|
||||||||||||
|
Total noninterest income
|
(7
|
)
|
(10
|
)
|
(15
|
)
|
(127
|
)
|
||||||||
|
Service charges on deposit accounts
|
213
|
210
|
647
|
678
|
||||||||||||
|
Other
|
795
|
506
|
1,668
|
1,261
|
||||||||||||
|
|
||||||||||||||||
|
Total noninterest income
|
1,007
|
840
|
2,472
|
2,207
|
||||||||||||
|
|
||||||||||||||||
|
Noninterest Expense
|
||||||||||||||||
|
Salaries and employee benefits
|
4,910
|
3,996
|
14,299
|
12,148
|
||||||||||||
|
Furniture and equipment
|
254
|
390
|
755
|
1,134
|
||||||||||||
|
Occupancy
|
662
|
614
|
1,980
|
1,736
|
||||||||||||
|
Data and item processing
|
424
|
522
|
1,280
|
1,468
|
||||||||||||
|
Accounting, marketing and legal fees
|
14
|
340
|
491
|
782
|
||||||||||||
|
Regulatory assessments
|
279
|
551
|
1,013
|
973
|
||||||||||||
|
Advertsing and public relations
|
74
|
83
|
273
|
314
|
||||||||||||
|
Travel, lodging and entertainment
|
85
|
94
|
255
|
216
|
||||||||||||
|
Other
|
688
|
543
|
2,068
|
1,745
|
||||||||||||
|
|
||||||||||||||||
|
Total noninterest expense
|
7,390
|
7,133
|
22,414
|
20,516
|
||||||||||||
|
|
||||||||||||||||
|
Income Before Taxes
|
10,204
|
10,404
|
35,663
|
27,895
|
||||||||||||
|
Income tax expense
|
2,351
|
2,363
|
8,457
|
6,646
|
||||||||||||
|
Net Income
|
$
|
7,853
|
$
|
8,041
|
$
|
27,206
|
$
|
21,249
|
||||||||
|
|
||||||||||||||||
|
Earnings per common share - basic
|
$
|
0.86
|
$
|
0.88
|
$
|
2.97
|
$
|
2.34
|
||||||||
|
Earnings per common share - diluted
|
0.85
|
0.87
|
2.94
|
2.31
|
||||||||||||
|
Weighted average common shares outstanding - basic
|
9,158,027
|
9,100,789
|
9,152,788
|
9,095,724
|
||||||||||||
|
Weighted average common shares outstanding - diluted
|
9,273,595
|
9,209,754
|
9,262,003
|
9,194,928
|
||||||||||||
|
|
||||||||||||||||
|
Other Comprehensive Income (Loss)
|
||||||||||||||||
|
Unrealized gains(losses) on securities, net of (tax)tax benefit of $485 and $1.7 million
for the three months ended September 30, 2023 and 2022, respectively; ($69) and
$3.2 million for the nine months ended September 30, 2023 and 2022, respectively
|
$
|
(372
|
)
|
$
|
(2,674
|
)
|
$
|
214
|
$
|
(10,691
|
)
|
|||||
|
Reclassification adjustment for realized loss included in net income
net of tax of $2 and $2 for the three months ended September 30, 2023 and
2022, respectively; $4 and $29 for the nine months ended
September 30, 2023 and 2022, respectively
|
5
|
8
|
11
|
98
|
||||||||||||
|
Other comprehensive income(loss)
|
$
|
(367
|
)
|
$
|
(2,666
|
)
|
$
|
225
|
$
|
(10,593
|
)
|
|||||
|
Comprehensive Income
|
$
|
7,486
|
$
|
5,375
|
$
|
27,431
|
$
|
10,656
|
||||||||
|
Net Interest Margin
|
||||||||||||||||||||||||
|
For the Nine Months Ended September 30,
|
||||||||||||||||||||||||
|
2023
(unaudited) |
2022
|
|||||||||||||||||||||||
|
Average
Balance |
Interest
Income/ Expense |
Average
Yield/ Rate |
Average
Balance |
Interest
Income/ Expense |
Average
Yield/ Rate |
|||||||||||||||||||
|
(Dollars in thousands)
|
||||||||||||||||||||||||
|
Interest-Earning Assets:
|
||||||||||||||||||||||||
|
Short-term investments
|
$
|
162,432
|
$
|
5,668
|
4.67
|
%
|
$
|
139,133
|
$
|
793
|
0.76
|
%
|
||||||||||||
|
Debt securities, taxable-equivalent
|
152,702
|
2,106
|
1.84
|
142,913
|
1,625
|
1.52
|
||||||||||||||||||
|
Debt securities, tax exempt
|
19,828
|
253
|
1.71
|
22,087
|
273
|
1.65
|
||||||||||||||||||
|
Loans held for sale
|
115
|
-
|
-
|
686
|
-
|
-
|
||||||||||||||||||
|
Total loans(1)
|
1,299,754
|
81,117
|
8.34
|
1,103,114
|
50,597
|
6.13
|
||||||||||||||||||
|
Total interest-earning assets
|
1,634,831
|
89,144
|
7.29
|
1,407,933
|
53,288
|
5.06
|
||||||||||||||||||
|
Noninterest-earning assets
|
22,560
|
24,069
|
||||||||||||||||||||||
|
Total assets
|
$
|
1,657,391
|
$
|
1,432,002
|
||||||||||||||||||||
|
Funding sources:
|
||||||||||||||||||||||||
|
Interest-bearing liabilities:
|
||||||||||||||||||||||||
|
Deposits:
|
||||||||||||||||||||||||
|
Transaction accounts
|
$
|
823,331
|
20,346
|
3.35
|
%
|
$
|
699,670
|
3,351
|
0.64
|
%
|
||||||||||||||
|
Time deposits
|
292,235
|
7,548
|
3.92
|
168,608
|
890
|
0.71
|
||||||||||||||||||
|
Total interest-bearing deposits
|
1,115,566
|
27,894
|
3.48
|
868,278
|
4,241
|
0.65
|
||||||||||||||||||
|
Total interest-bearing liabilities
|
1,115,566
|
27,894
|
3.48
|
868,278
|
4,241
|
0.65
|
||||||||||||||||||
|
Noninterest-bearing liabilities:
|
||||||||||||||||||||||||
|
Noninterest-bearing deposits
|
422,691
|
424,720
|
||||||||||||||||||||||
|
Other noninterest-bearing liabilities
|
11,649
|
7,128
|
||||||||||||||||||||||
|
Total noninterest-bearing liabilities
|
434,340
|
431,848
|
||||||||||||||||||||||
|
Shareholders' equity
|
107,485
|
131,876
|
||||||||||||||||||||||
|
Total liabilities and shareholders' equity
|
$
|
1,657,391
|
$
|
1,432,002
|
||||||||||||||||||||
|
Net interest income
|
$
|
61,250
|
$
|
49,047
|
||||||||||||||||||||
|
Net interest spread
|
3.81
|
%
|
4.41
|
%
|
||||||||||||||||||||
|
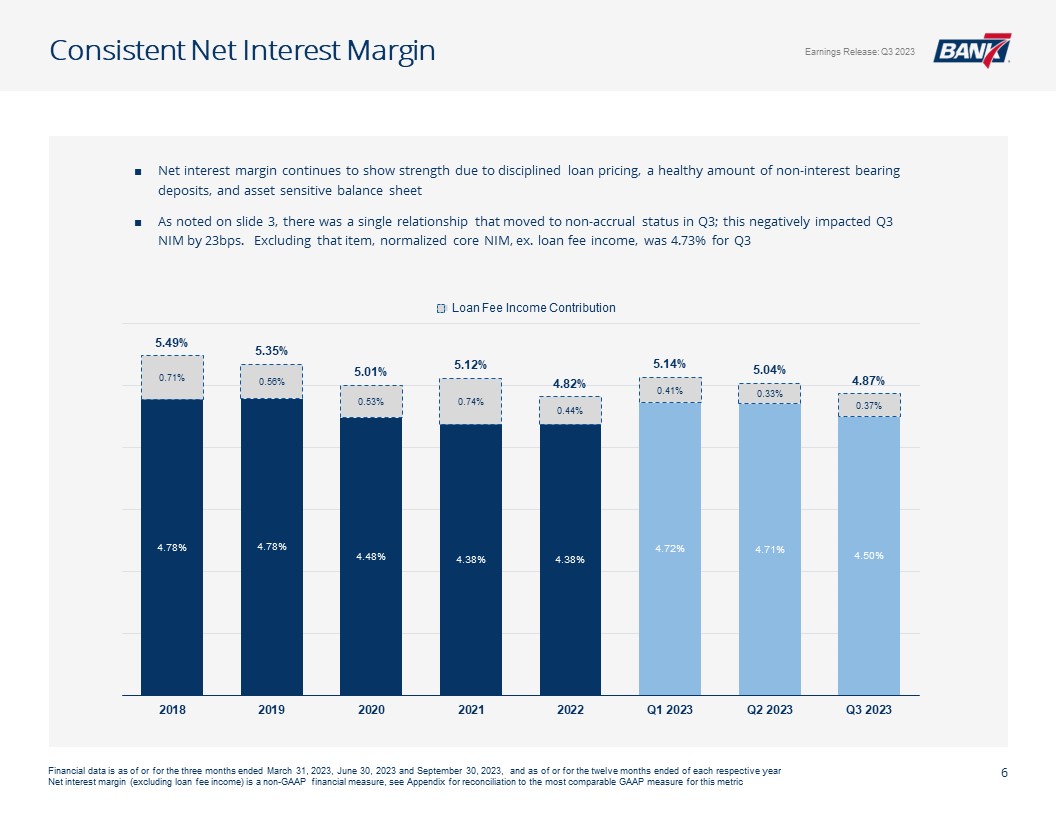
Net interest margin
|
5.01
|
%
|
4.66
|
%
|
||||||||||||||||||||
|
Net Interest Margin
|
||||||||||||||||||||||||
|
For the Three Months Ended September 30,
|
||||||||||||||||||||||||
|
2023
(unaudited) |
2022
|
|||||||||||||||||||||||
|
Average
Balance |
Interest
Income/ Expense |
Average
Yield/ Rate |
Average
Balance |
Interest
Income/ Expense |
Average
Yield/ Rate |
|||||||||||||||||||
|
(Dollars in thousands)
|
||||||||||||||||||||||||
|
Interest-Earning Assets:
|
||||||||||||||||||||||||
|
Short-term investments
|
$
|
176,589
|
$
|
2,062
|
4.63
|
%
|
$
|
99,751
|
$
|
445
|
1.77
|
%
|
||||||||||||
|
Debt securities, taxable-equivalent
|
151,174
|
699
|
1.83
|
163,699
|
690
|
1.67
|
||||||||||||||||||
|
Debt securities, tax exempt
|
19,430
|
81
|
1.65
|
21,811
|
90
|
1.64
|
||||||||||||||||||
|
Loans held for sale
|
232
|
-
|
-
|
1,281
|
-
|
-
|
||||||||||||||||||
|
Total loans(1)
|
1,344,038
|
28,880
|
8.52
|
1,213,080
|
20,466
|
6.69
|
||||||||||||||||||
|
Total interest-earning assets
|
1,691,463
|
31,722
|
7.44
|
1,499,622
|
21,691
|
5.74
|
||||||||||||||||||
|
Noninterest-earning assets
|
23,407
|
23,197
|
||||||||||||||||||||||
|
Total assets
|
$
|
1,714,870
|
$
|
1,522,819
|
||||||||||||||||||||
|
Funding sources:
|
||||||||||||||||||||||||
|
Interest-bearing liabilities:
|
||||||||||||||||||||||||
|
Deposits:
|
||||||||||||||||||||||||
|
Transaction accounts
|
$
|
823,331
|
7,733
|
3.73
|
%
|
$
|
761,927
|
2,338
|
1.22
|
%
|
||||||||||||||
|
Time deposits
|
292,235
|
3,243
|
4.40
|
152,910
|
308
|
0.80
|
||||||||||||||||||
|
Total interest-bearing deposits
|
1,115,566
|
10,976
|
3.90
|
914,837
|
2,646
|
1.15
|
||||||||||||||||||
|
Total interest-bearing liabilities
|
$
|
1,115,566
|
10,976
|
3.90
|
$
|
914,837
|
2,646
|
1.15
|
||||||||||||||||
|
Noninterest-bearing liabilities:
|
||||||||||||||||||||||||
|
Noninterest-bearing deposits
|
$
|
422,691
|
$
|
463,882
|
||||||||||||||||||||
|
Other noninterest-bearing liabilities
|
11,649
|
8,132
|
||||||||||||||||||||||
|
Total noninterest-bearing liabilities
|
434,340
|
472,014
|
||||||||||||||||||||||
|
Shareholders' equity
|
164,964
|
135,968
|
||||||||||||||||||||||
|
Total liabilities and shareholders' equity
|
$
|
1,714,870
|
$
|
1,522,819
|
||||||||||||||||||||
|
Net interest income
|
$
|
20,746
|
$
|
19,045
|
||||||||||||||||||||
|
Net interest spread
|
3.54
|
%
|
4.60
|
%
|
||||||||||||||||||||
|
Net interest margin
|
4.87
|
%
|
5.04
|
%
|
||||||||||||||||||||