株探米国株
英語
エドガーで原本を確認する

UNITED STATES
SECURITIES AND EXCHANGE COMMISSION
Washington, D.C.  20549

FORM 8-K

CURRENT REPORT
Pursuant to Section 13 or 15(d) of the
Securities Exchange Act of 1934

Date of Report (Date of earliest event reported): June 27, 2023

CASEY'S GENERAL STORES, INC.
(Exact name of registrant as specified in its charter)

Iowa
(State or other jurisdiction of incorporation)
 
001-34700
 
42-0935283
(Commission File Number)
 
(I.R.S. Employer Identification Number)
 
One SE Convenience Blvd.., Ankeny, Iowa
(Address of principal executive offices)

50021
(Zip Code)

515/965-6100
(Registrant's telephone number, including area code)

NONE
(Former name or former address, if changed since last report)

Check the appropriate box below if the Form 8-K filing is intended to simultaneously satisfy the filing obligation of the registrant under any of the following provisions (see General Instruction A.2. below):


Written communications pursuant to Rule 425 under the Securities Act (17 CFR 230.425)

Soliciting material pursuant to Rule 14a-12 under the Exchange Act (17 CFR 240.14a-12)

Pre-commencement communications pursuant to Rule 14d-2(b) under the Exchange Act (17 CFR 240.14d-2(b))

Pre-commencement communications pursuant to Rule 13e-4(c) under the Exchange Act (17 CFR 240.13e-4(c))

Securities registered pursuant to Section 12(b) of the Exchange Act:
 
Title of each class
Trading Symbol(s)
Name of each exchange on which registered
Common Stock, no par value per share
CASY
The NASDAQ Global Select Market
 
Indicate by check mark whether the registrant is an emerging growth company as defined in Rule 405 of the Securities Act of 1933 (230.405 of this chapter) or Rule 12b-2 of the Securities Exchange Act of 1934 (§240.12b-2 of this chapter). ☐

If an emerging growth company, indicate by check mark if the registrant has elected not to use the extended transition period for complying with any new or revised financial accounting standards provided pursuant to Section 13(a) of the Exchange Act   ☐


Item 7.01.
Regulation FD Disclosure

As previously announced, on June 27, 2023, Casey's General Stores, Inc. will host its 2023 Investor Day in New York City. A copy of the presentation that will be utilized during the event is attached as Exhibit 99.1 and is incorporated herein by reference.

The information contained in this Item, including the presentation attached as Exhibit 99.1, is being furnished and shall not be deemed “filed” for purposes of Section 18 of the Securities Exchange Act of 1934, as amended, or otherwise subject to the liabilities of that Section, and shall not be incorporated by reference into any registration statement or other document filed under the Securities Act of 1933, as amended, or the Exchange Act, except as shall be expressly set forth by specific reference in such filing.

Item 9.01.
Financial Statements and Exhibits

(d)
Exhibits.

Exhibit No.
Description
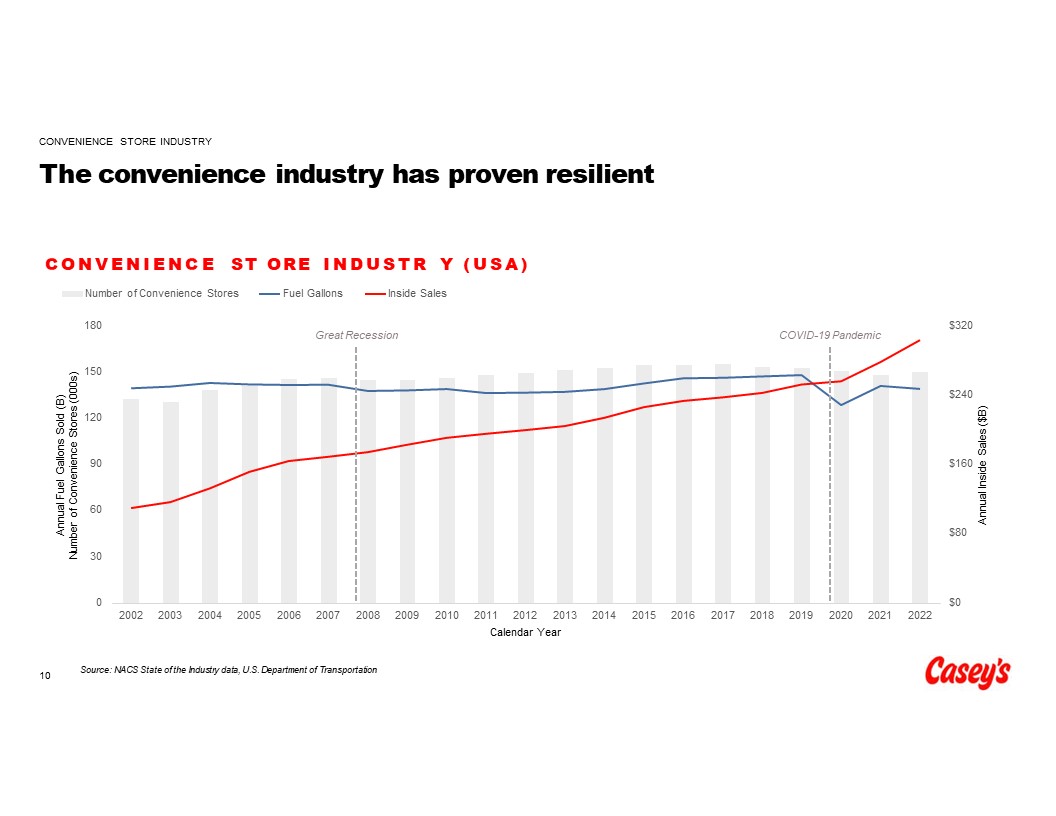
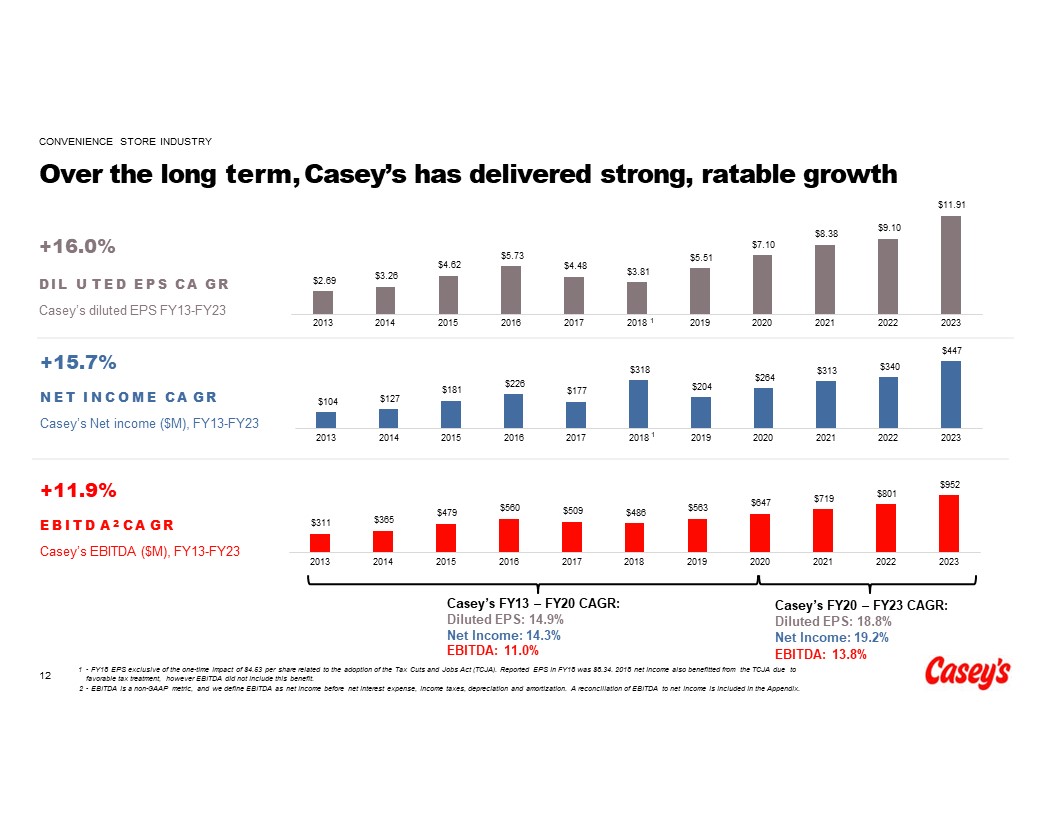
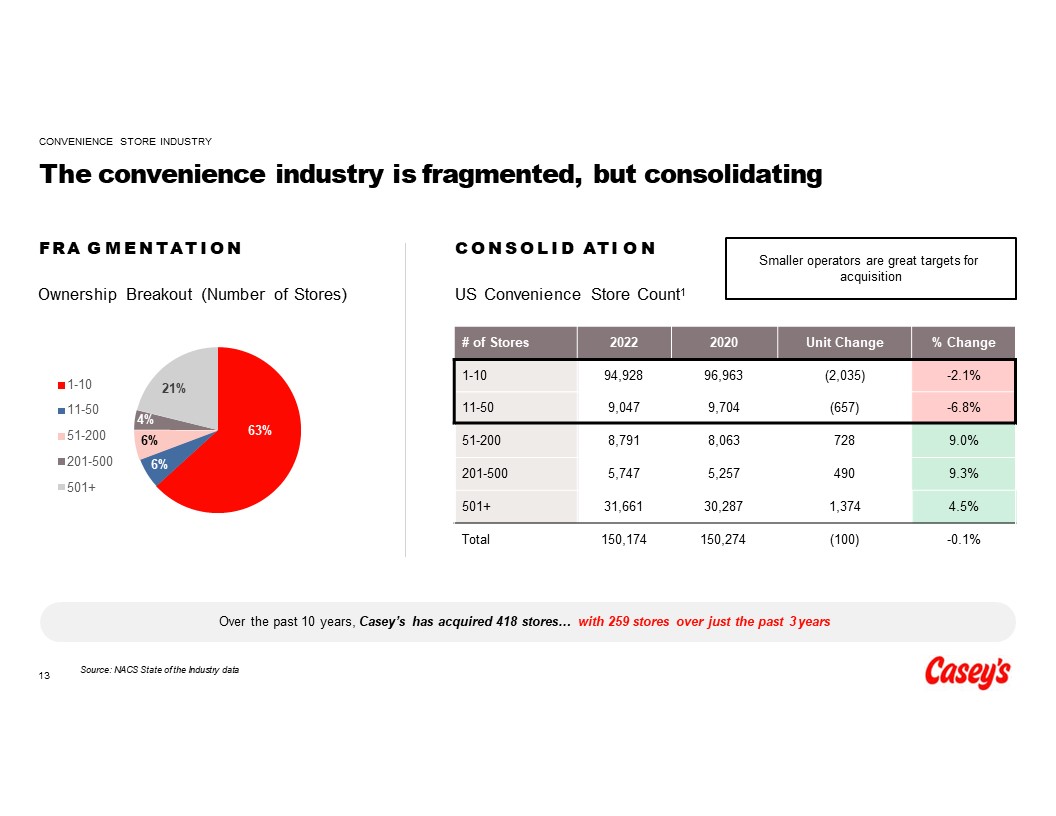
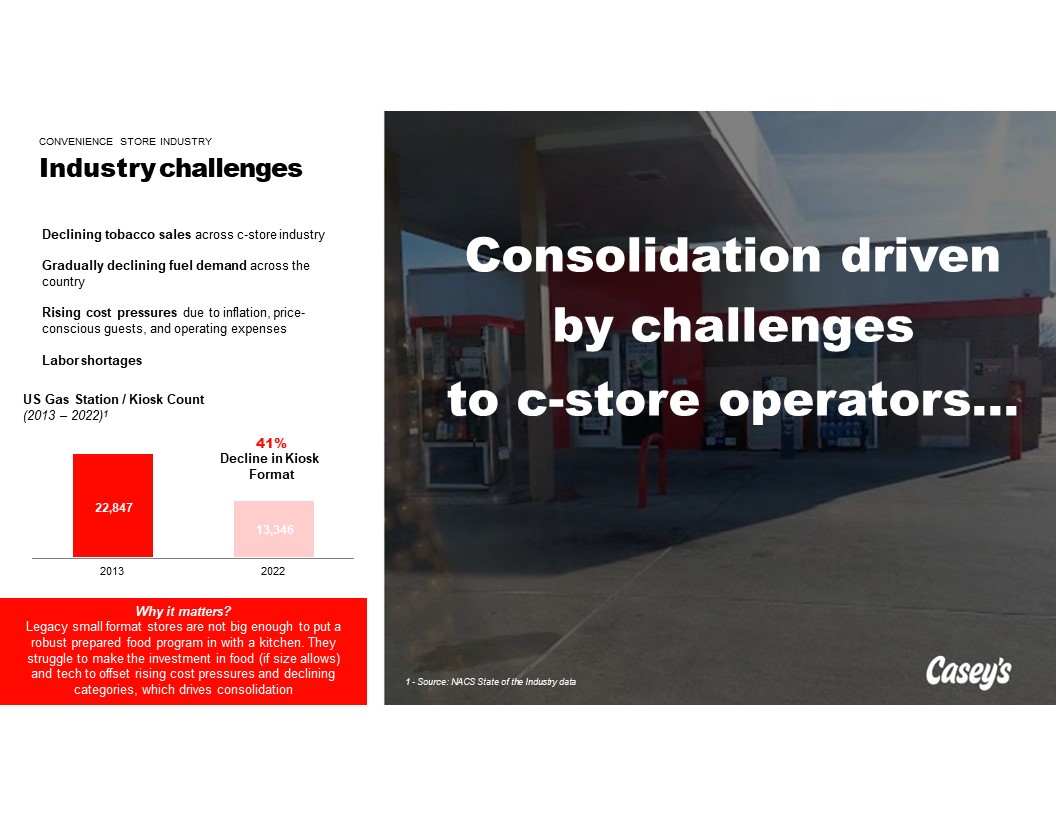
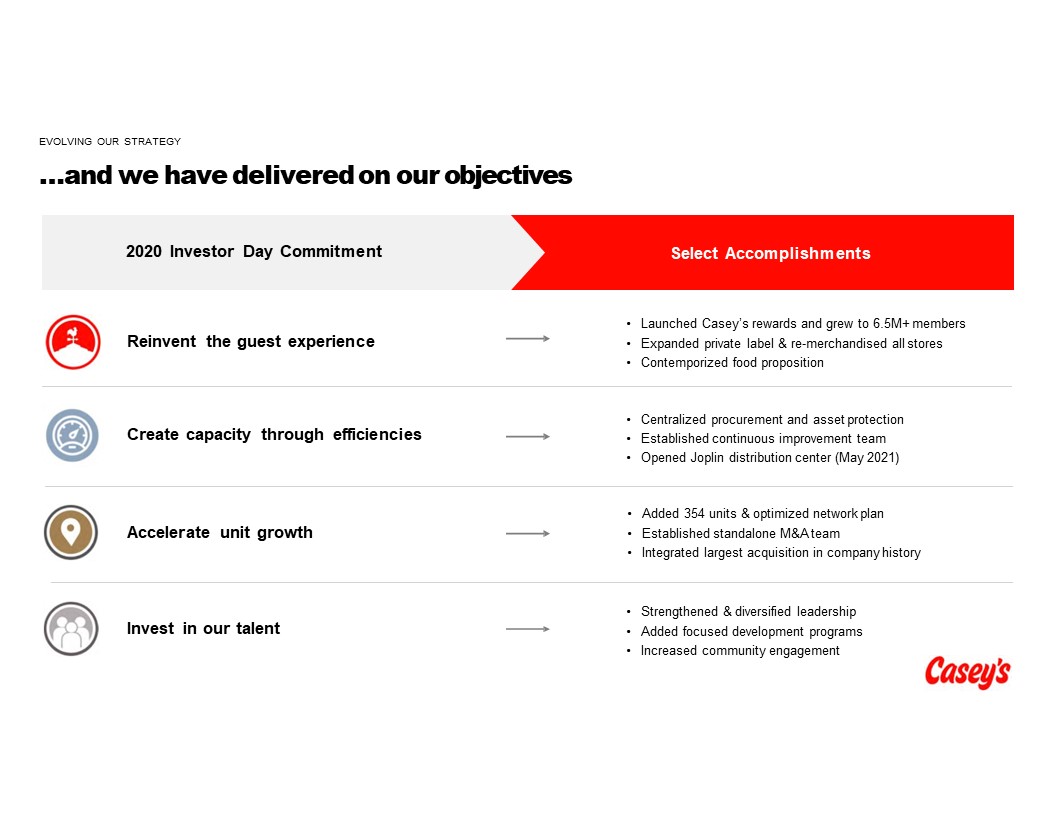
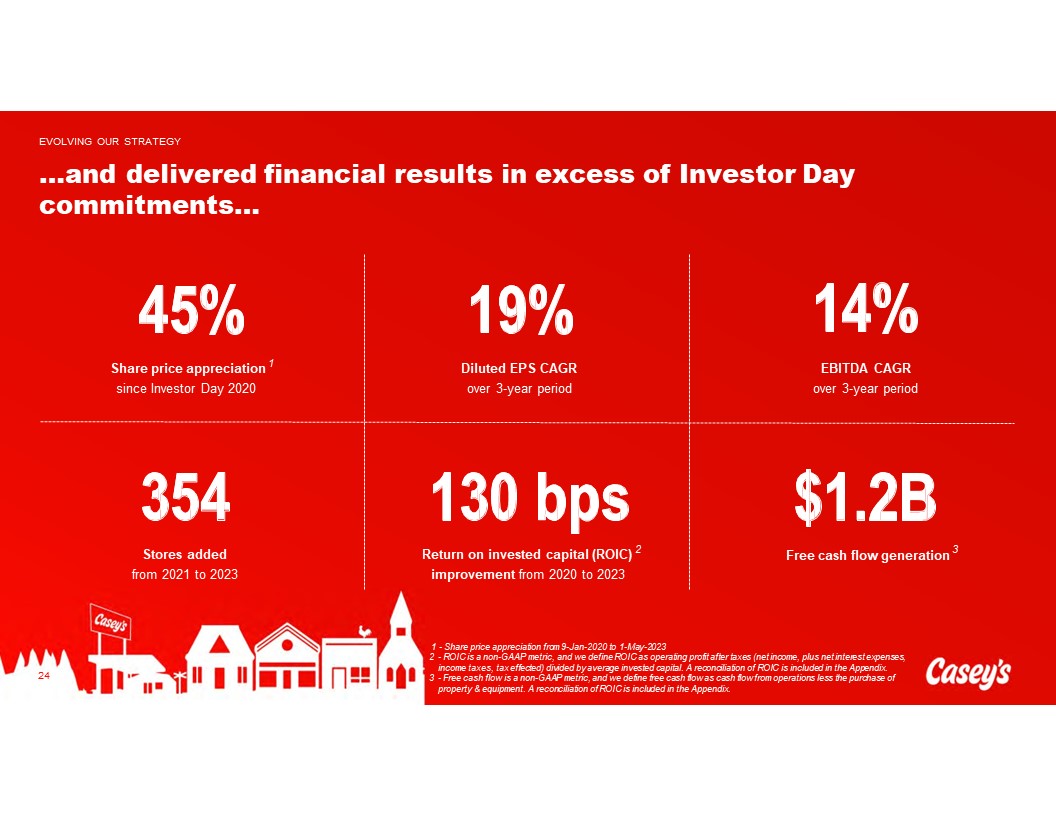
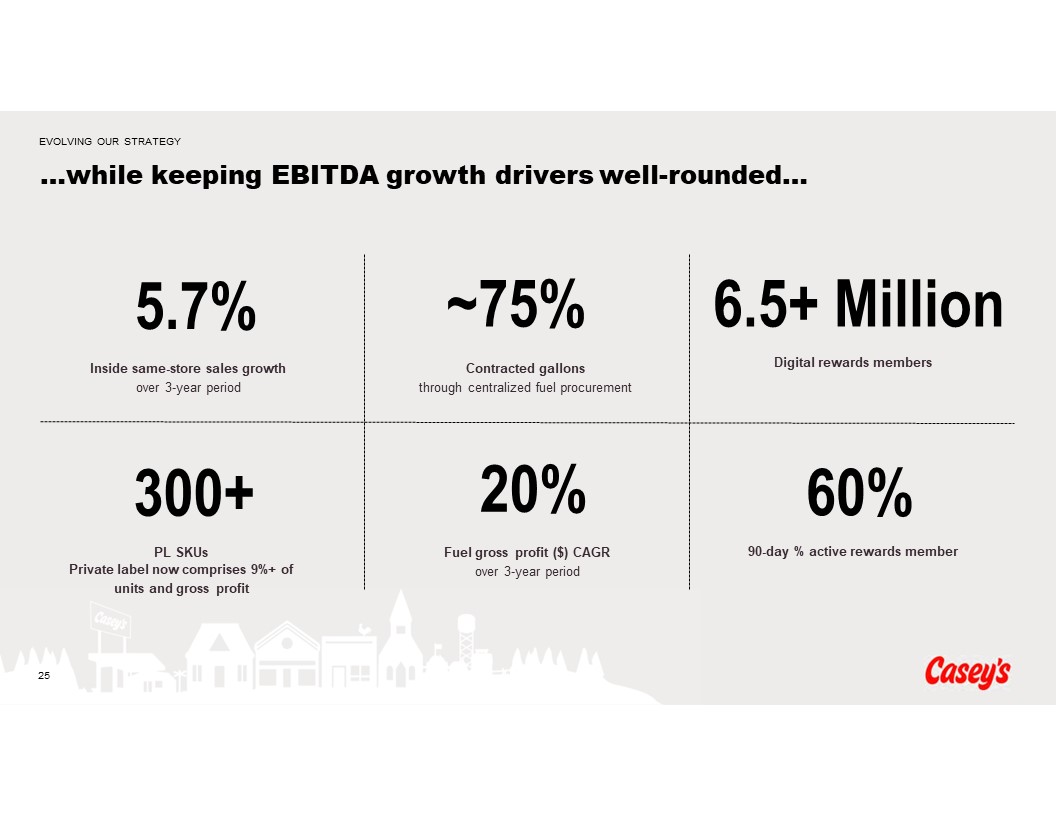
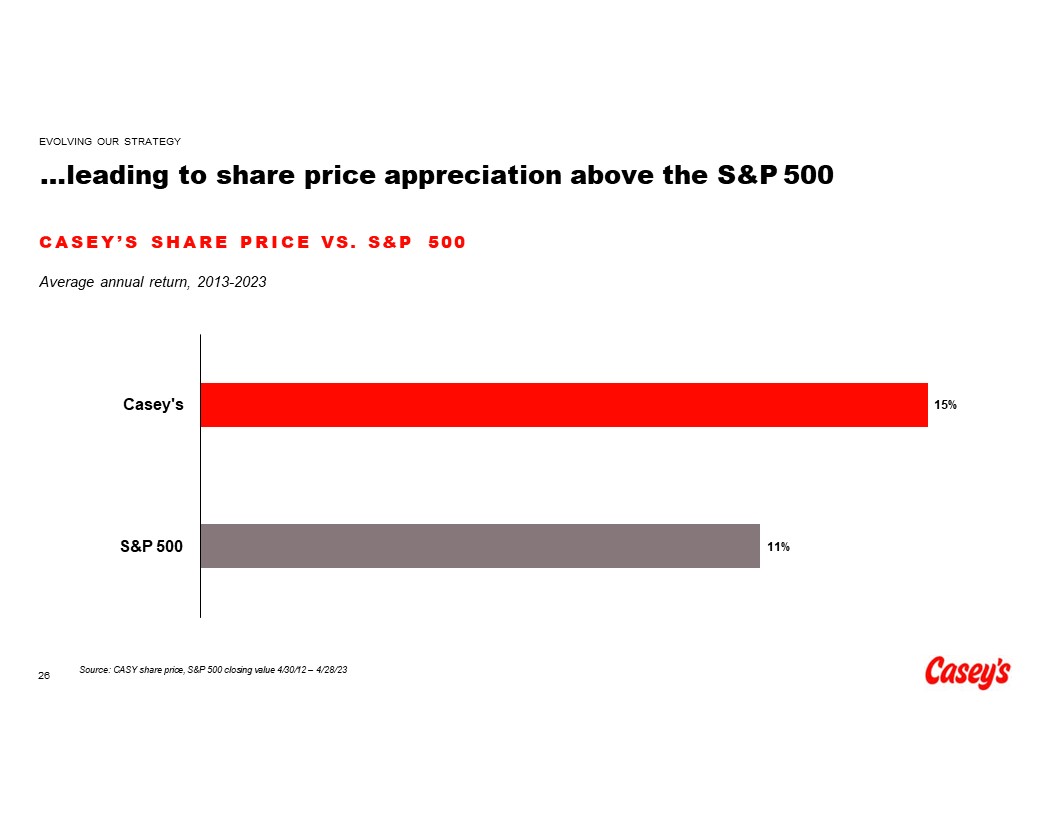
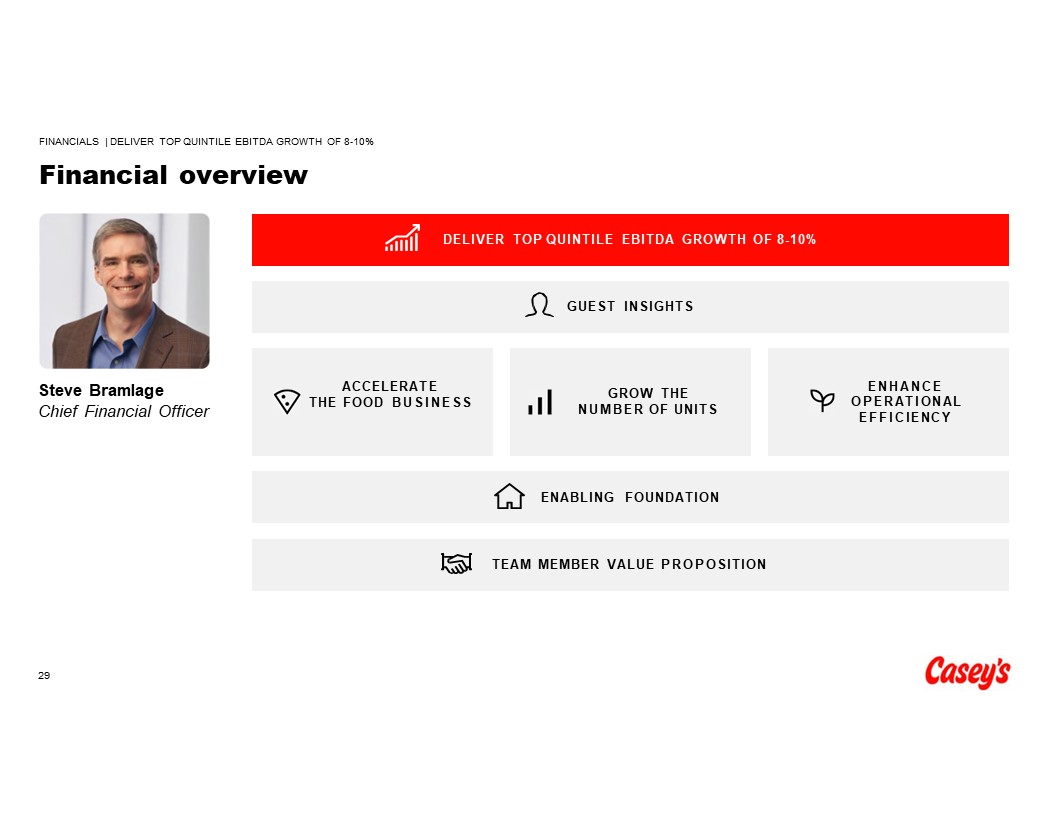
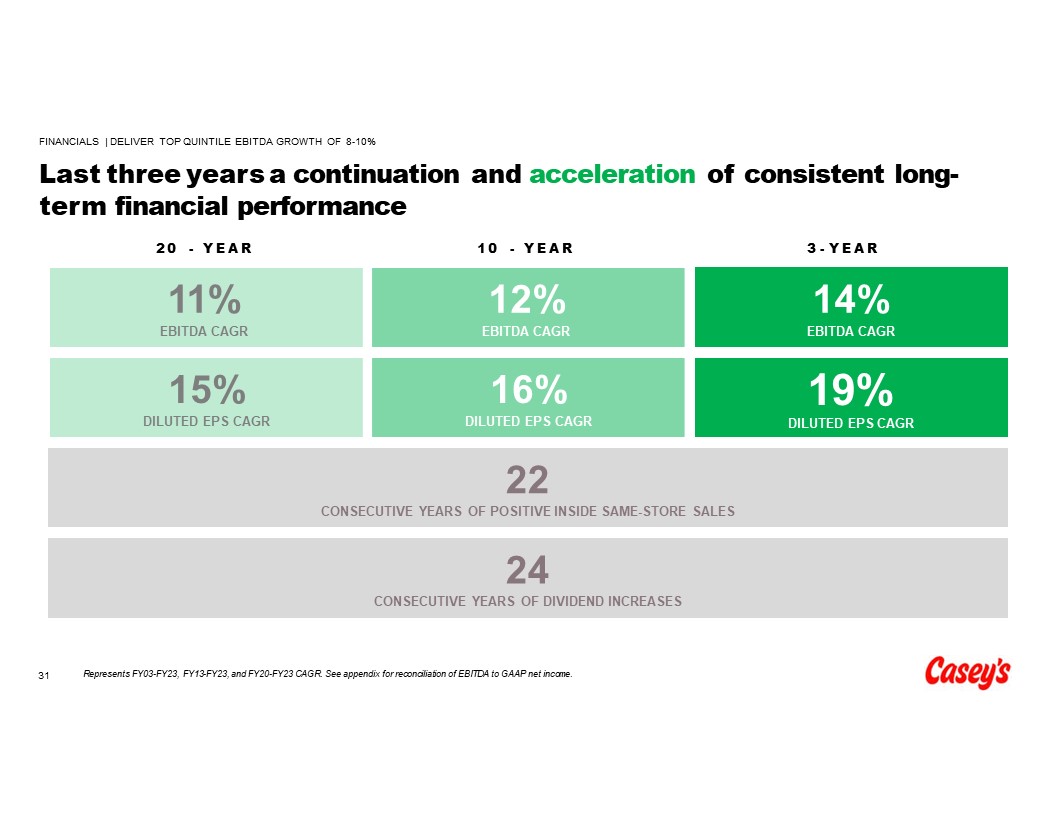
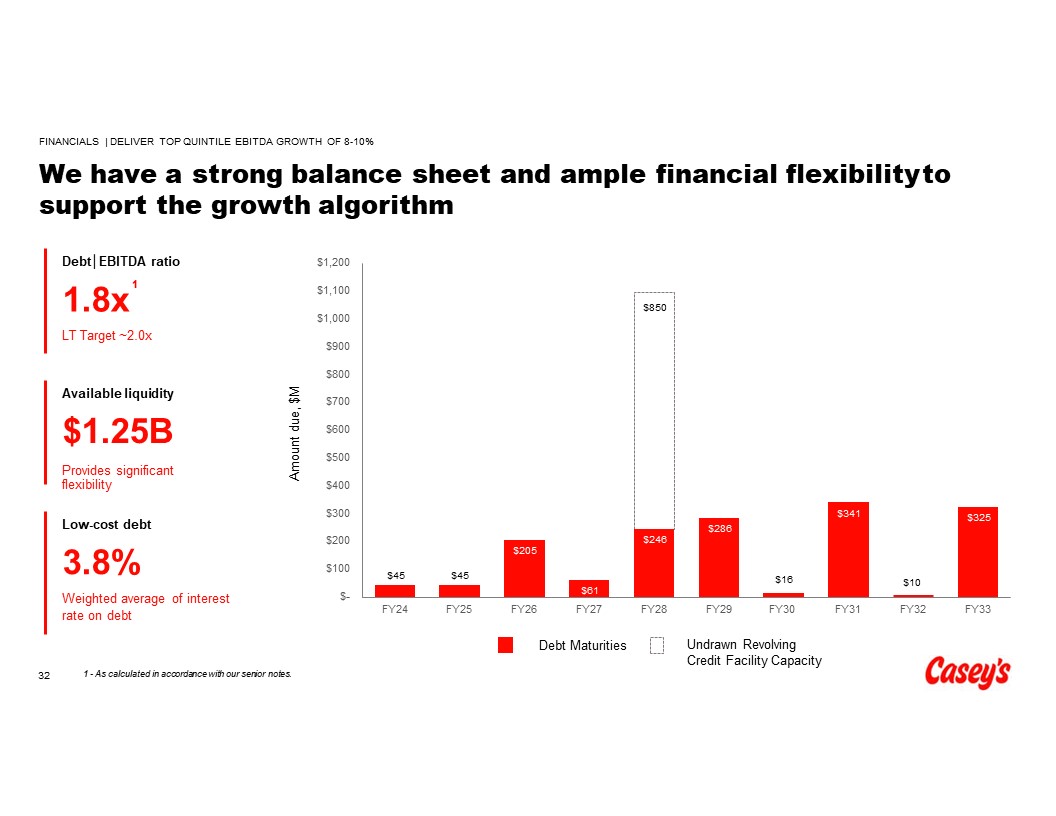
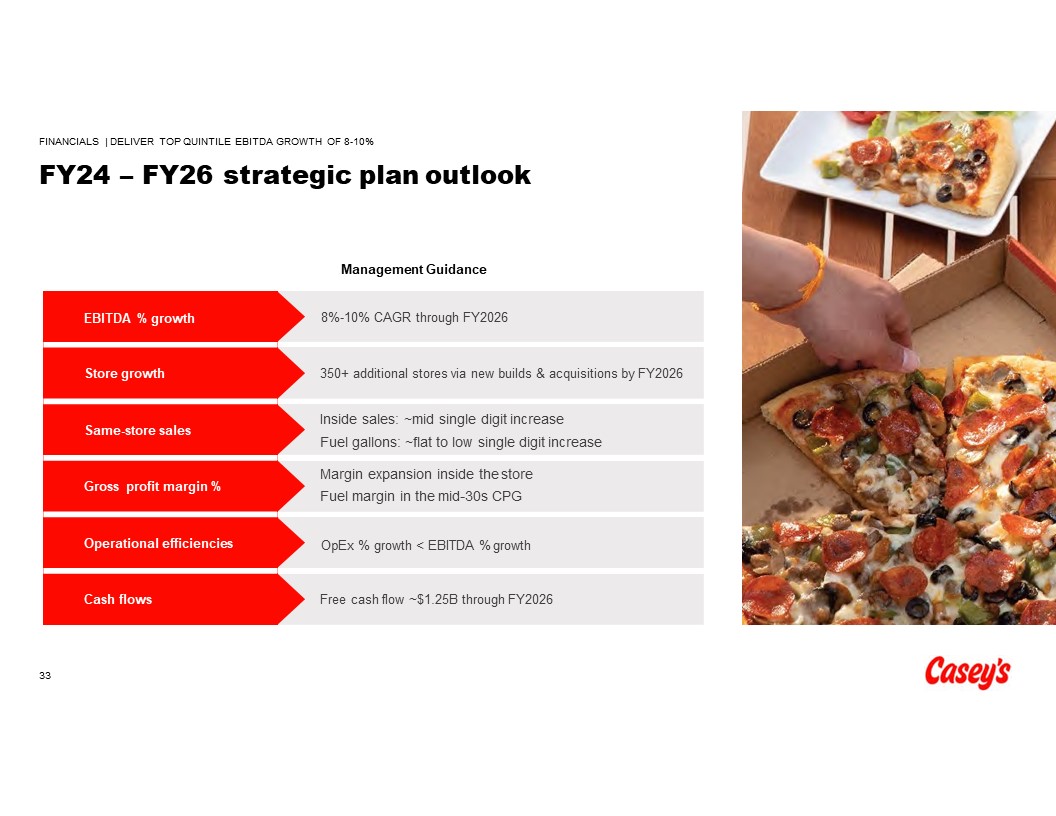
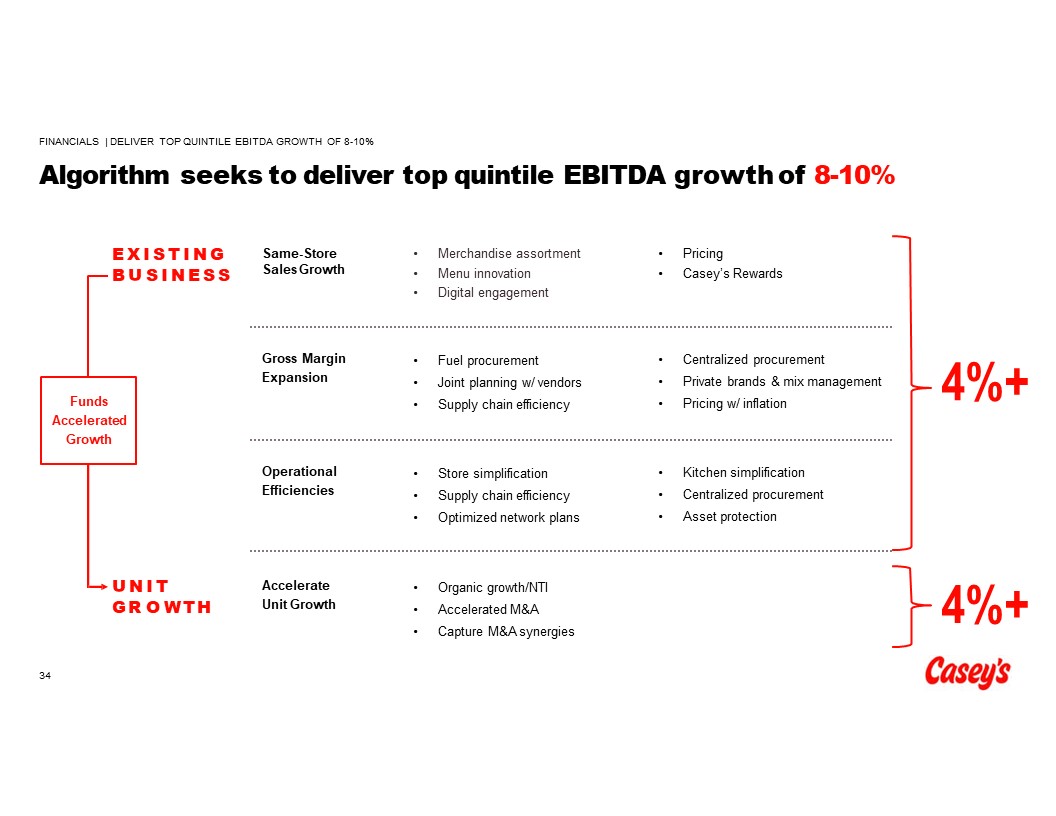
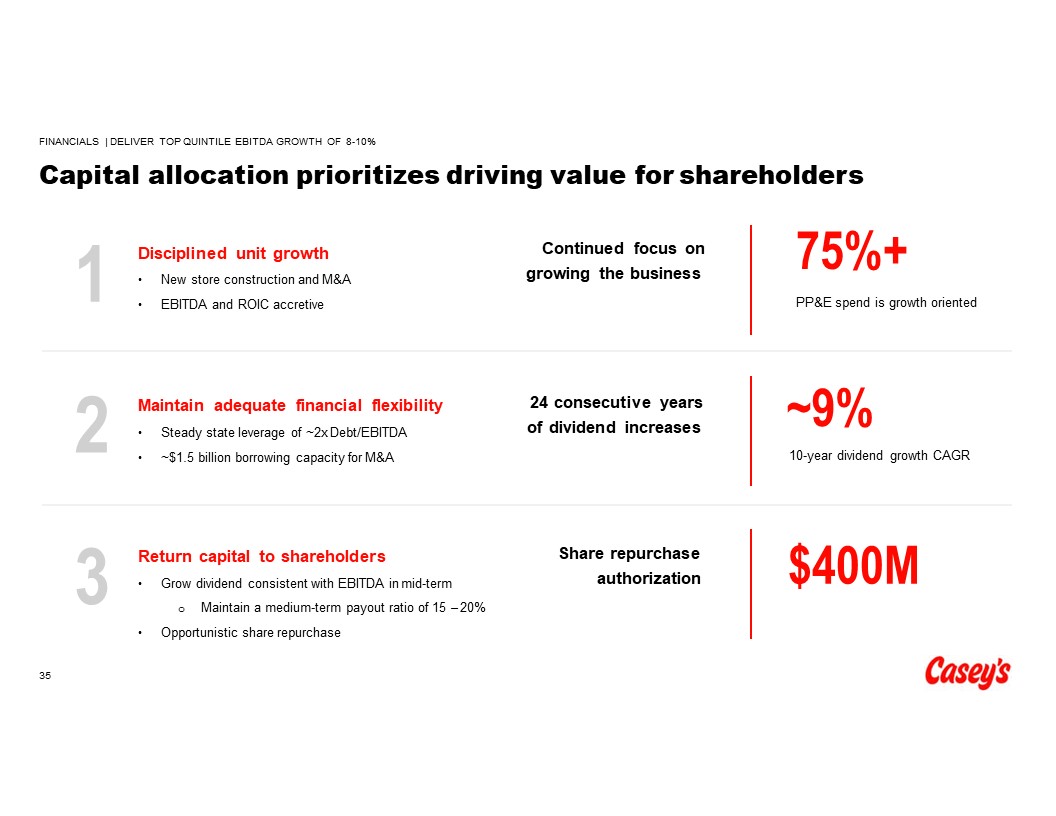
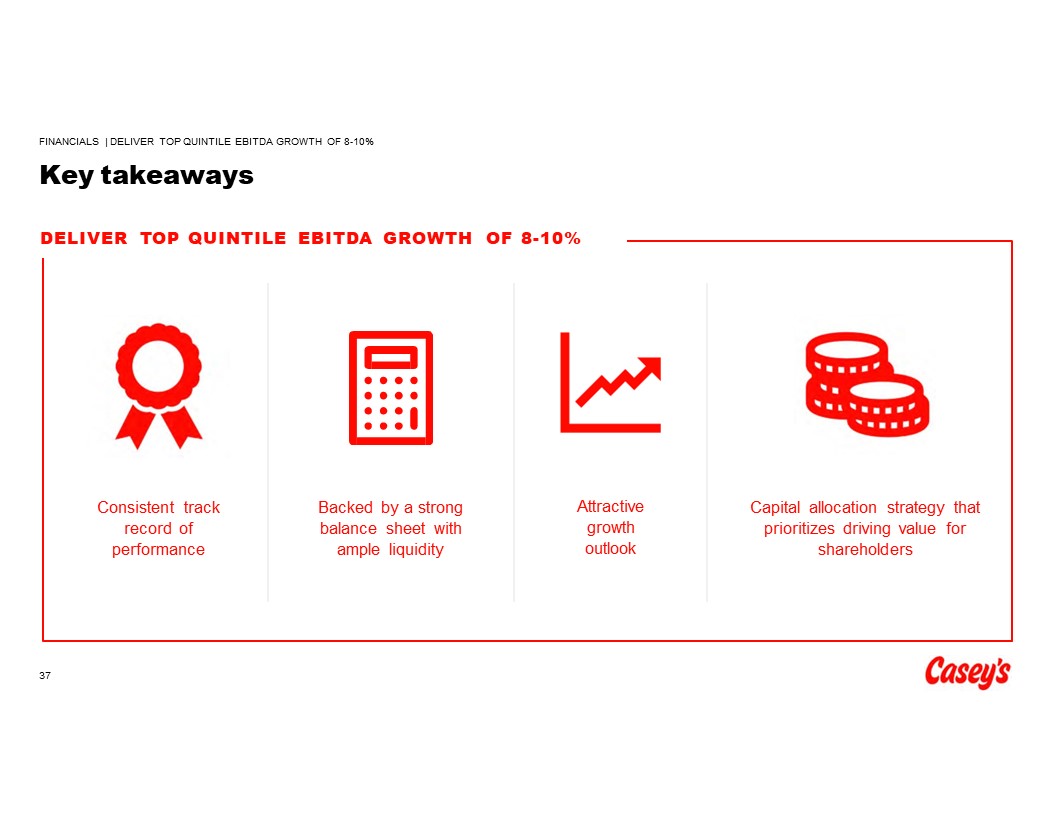
2023 Investor Day Presentation dated June 27, 2023
104
Cover Page Interactive Data File (embedded within the Inline XBRL document)


SIGNATURE

Pursuant to the requirements of the Securities Exchange Act of 1934, the registrant has duly caused this report to be signed on its behalf by the undersigned, hereunto duly authorized.
 
   
CASEY'S GENERAL STORES, INC.
     
Dated: June 27, 2023
By:
/s/ Stephen P. Bramlage, Jr.
   
Stephen P. Bramlage Jr.
   
Chief Financial Officer


EX-99.1 2 brhc20054965_ex99-1.htm EXHIBIT 99.1
Exhibit 99.1

 Casey’s 2023 Investor Day 
 

 The presentation is dated as of June 27, 2023 and speaks as of the date unless otherwise specified.  Forward-Looking Statements  This presentation contains statements that may constitute forward-looking statements within the meaning of the Private Securities Litigation Reform Act of 1995, including those related to expectations for future periods, possible or assumed future results of operations, financial conditions, liquidity and related sources or needs, business and/or integration strategies, plans and synergies, supply chain, growth opportunities, and performance at our stores. There are a number of known and unknown risks, uncertainties, and other factors that may cause our actual results to differ materially from any results expressed or implied by these forward-looking statements, including but not limited to the execution of our strategic plan, the integration and financial performance of acquired stores, wholesale fuel, inventory and ingredient costs, distribution challenges and disruptions, the impact and duration of the conflict in Ukraine or other geopolitical disruptions, as well as other risks, uncertainties and factors which are described in the Company’s most recent annual report on Form 10-K and quarterly reports on Form 10-Q, as filed with the Securities and Exchange Commission and available on our website. Any forward-looking statements contained in this presentation represent our current views as of the date of this presentation with respect to future events, and Casey’s disclaims any intention or obligation to update or revise any forward-looking statements in the presentation whether as a result of new information, future events, or otherwise.  Use of Non-GAAP Measures  This presentation includes references to "EBITDA," which we define as net income before net interest expense, depreciation and amortization, and income taxes. EBITDA is not presented in accordance with accounting principles generally accepted in the United States ("GAAP"). We believe EBITDA is useful to investors in evaluating our operating performance because securities analysts and other interested parties use such calculations as a measure of financial performance and debt service capabilities, and it is regularly used by management for internal purposes including our capital budgeting process, evaluating acquisition targets, and assessing store performance. EBITDA is not a recognized term under GAAP and should not be considered a substitute for net income, cash flows from operating activities or other income or cash flow statement data. This presentation also includes references to “free cash flow," which we define as net cash generated by operating activities less purchases of property and equipment. Free cash flow is not presented in accordance with GAAP. We believe free cash flow is useful to investors in evaluating our cash generation because securities analysts and other interested parties use such calculations as a measure of financial performance, liquidity, and debt service capabilities, and it is regularly used by management for internal purposes including our capital budgeting process, evaluating acquisition targets, and evaluating debt service. This presentation also includes references to “ROIC,” which we define as operating profit after taxes (net income, plus net interest expenses, income taxes, tax effected) divided by average invested capital. ROIC is not presented in accordance with GAAP. We believe ROIC is useful to investors as a measure of financial performance and prudent capital allocation, and is regularly used by management for internal purposes including our capital budgeting process, evaluating acquisition targets, and assessing company performance. Neither EBITDA, free cash flow, nor ROIC are recognized terms under GAAP and should not be considered a substitute for net income, net cash generated by operating activities or other income or cash flow statement data. EBITDA, free cash flow, and ROIC have limitations as an analytical tool, and should not be considered in isolation or as a substitute for analysis of our results as reported under GAAP. We strongly encourage investors to review our financial statements and publicly filed reports in their entirety and not to rely on any single financial measure. Because non- GAAP financial measures are not standardized, EBITDA, free cash flow, and ROIC, as defined by us, may not be comparable to similarly titled measures reported by other companies. It therefore may not be possible to compare our use of this non-GAAP financial measure with those used by other companies. For reconciliations of EBITDA, free cash flow, and ROIC to GAAP net income and net cash generated by operating activities, for the completed applicable period shown, see the appendix attached hereto.  2  Safe Harbor Statements  CASEY’S 2023 INVESTOR DAY 
 

 Stephen Bramlage  Chief Financial Officer  Tom Brennan  Chief Merchandising Officer  Ena Williams  Chief Operating Officer  Chad Frazell  Chief Human Resources Officer  Sanjeev Satturu  SVP Chief Information Officer  Nathaniel Doddridge  VP Fuels  Doug Means  SVP Supply Chain & Efficiency  Kendra Meyer  VP Real Estate  Carrie Stojack  VP Guest Insights  Brian Johnson  SVP Investor Relations & Business Development  Jay Soupene SVP Operational Excellence  Brad Haga  SVP Prepared Food & Dispensed Beverage  Chris Boling  SVP Store Operations  Today’s Speakers  CASEY’S 2023 INVESTOR DAY  Darren Rebelez  Chief Executive Officer  2 
 

 CASEY’ S INVESTOR DAY 2023   An Introduction  to Casey’s  Darren Rebelez 
 

 ND  SD  WI  MN  IA  NE  IN  OH  IL  KY  KS  MO  OK  TN  AR  MI  ~$10.0B  Total Enterprise Value  2,500+  Locations in 16 States  ~710M  Guest Transactions per Year  ~43,000  Total Team Members  Note: Market data, number of locations, transactions, team members as of April 30, 2023 and the FYE April 30, 2023. Average daily volume defined as average of last 30 trading days as of April 28, 2023. 1 - By number of stores in the U.S., source Convenience Store News & Petroleum Top 202 Convenience Stores 2022  2 - ~1,500 liquor license locations ranks Casey’s 4th behind CVS, Walmart, and Walgreens 3 - 5th largest pizza chain business by number of kitchens in United States  NASDAQ: CASY  Common Shares:  ~37 million  Avg. Daily Volume:  ~230,000 shares  Stock Information  Casey’s Footprint  3rd  4  th  largest convenience store chain in the United States1  in liquor licenses  among US retailers2  5th  largest pizza chain  in the United States3  AN INTRODUCTION TO CASEY'S  Casey’s is a staple for millions of Americans  5 
 

 Unique Footprint  ~50% of stores in towns of 5K people or fewer  Prepared Food  Prepared food is a larger % of inside sales mix 5th largest US pizza chain  Food sales across all dayparts, with high quality differentiated products and best-in- class margins  Advanced Technology  Best-in-class Rewards platform with 6.5M+ (and growing) highly active members  Investment in tech: effectiveness and efficiency  Higher transaction value, more frequent visits, and personalized marketing to influence guest behavior  Vertical Integration  Products inside the store from three owned distribution centers  ~60% of fuel delivered from owned tanker fleet  Positive control over value chain that enables service to rural areas and distribution efficiencies  Consolidated Scale  Casey’s leverages its scale across the business  Stronger negotiating position for vendor contracts, centralized fuel, merchandising, and operations support to optimize margin and volume  Casey’s has unique competitive advantages in the convenience store landscape  6  AN INTRODUCTION TO CASEY'S  DIFFERENTIA T O R  B ENEFIT   Stronger market position in rural areas; less expensive to build, buy, and operate units 
 

 Casey’s 50+ year history of success  AN INTRODUCTION TO CASEY’S  92% top  of mind aided awareness  Strong and recognizable brand  6  902 units built or acquired in the past 10 years  Long-standing track record of unit growth  ~$15M donated over the past 3 years  Rooted in the communities we serve  6.5M+ reward members  Modernization for growth & engagement 
 

 CASEY’ S INVESTOR DAY 2023   Convenience  Store Industry 
 

 Features of the evolving convenience store industry  CONVENIENCE STORE INDUSTRY  RESILIENT   The C-store industry has shown resiliency throughout economic cycles  FRA G MENTED & CONSOLID ATI N G  Smaller, single-store operators are challenged – further strengthening opportunities for Casey’s to drive scale via acquisition  SHIFTING   The industry is shifting in response to declining categories (tobacco and fuel) and rising operating costs  INVESTMENT IN TECH & FOOD   Investments in food and technology have positioned Casey’s to thrive in this environment  Scale matters now more than ever  9 
 

 $0  $80  $160  $240  $320  0  30  60  90  120  150  180  Annual Inside Sales ($B)  Annual Fuel Gallons Sold (B) Number of Convenience Stores (000s)  2002 2003 2004 2005 2006 2007 2008 2009 2010 2011 2012 2013 2014 2015 2016 2017 2018 2019 2020 2021 2022  Calendar Year  CONVENIENCE ST ORE INDUSTR Y (USA)   Number of Convenience Stores Fuel Gallons Inside Sales  The convenience industry has proven resilient  CONVENIENCE STORE INDUSTRY  10  Source: NACS State of the Industry data, U.S. Department of Transportation  COVID-19 Pandemic  Great Recession 
 

 $0  $1,000  $2,000  $3,000  $4,000  $5,000  $6,000  0  500  1,000  1,500  2,000  2,500  3,000  Annual Inside Sales ($M)  Annual Fuel Gallons Sold (M) Number of Convenience Stores  2001 2002 2003 2004 2005 2006 2007 2008 2009 2010 2011 2012 2013 2014 2015 2016 2017 2018 2019 2020 2021 2022 2023  Fiscal Year  Casey’s has proven ratable growth under the backdrop of the  convenience industry’s resilience  CASEY’S (USA)   Number of Convenience Stores Fuel Gallons Inside Sales  CONVENIENCE STORE INDUSTRY  11  Source: Casey’s publicly available financial statements  COVID-19 Pandemic  Great Recession  FY13-23 10 YR CA GR   +3.7% Store Growth +5.7% Fuel Gallons +9.2% Inside Sales 
 

 $311  $365  $479  $560  $509  $486  $563  $647  $719  $801  $952  2013  2014  2015  2016  2017  2018  2019  2020  2021  2022  2023  12  +11.9%  EBITD A 2 CA GR   Casey’s EBITDA ($M), FY13-FY23  +16.0%  DIL U TED EPS CA GR   Casey’s diluted EPS FY13-FY23  $2.69  $3.26  $4.62  $5.73  $4.48  $3.81  $5.51  $7.10  $8.38  $9.10  $11.91  2013  2014  2015  2016  2017  2019  2020  2021  2022  2023  Over the long term, Casey’s has delivered strong, ratable growth  CONVENIENCE STORE INDUSTRY  - FY18 EPS exclusive of the one-time impact of $4.53 per share related to the adoption of the Tax Cuts and Jobs Act (TCJA). Reported EPS in FY18 was $8.34. 2018 net income also benefitted from the TCJA due to favorable tax treatment, however EBITDA did not include this benefit.  - EBITDA is a non-GAAP metric, and we define EBITDA as net income before net interest expense, income taxes, depreciation and amortization. A reconciliation of EBITDA to net income is included in the Appendix.  2018 1  $104  $127  $181  $226  $177  $318  $204  $264  $313  $340  $447  2013  2014  2015  2016  2017  2019  2020  2021  2022  2023  +15.7%  NET INCOME CA GR   Casey’s Net income ($M), FY13-FY23  Casey’s FY13 – FY20 CAGR:  Diluted EPS: 14.9%  Net Income: 14.3%  EBITDA: 11.0%  Casey’s FY20 – FY23 CAGR:  Diluted EPS: 18.8%  Net Income: 19.2%  EBITDA: 13.8%  2018 1 
 

 13  The convenience industry is fragmented, but consolidating  CONVENIENCE STORE INDUSTRY  FRA G MENTATION   CONSOLID ATI O N  63%  4%  6%  6%  21%  1-10  11-50  51-200  201-500  501+  Ownership Breakout (Number of Stores)  US Convenience Store Count1  # of Stores  2022  2020  Unit Change  % Change  1-10  94,928  96,963  (2,035)  -2.1%  11-50  9,047  9,704  (657)  -6.8%  51-200  8,791  8,063  728  9.0%  201-500  5,747  5,257  490  9.3%  501+  31,661  30,287  1,374  4.5%  Total  150,174  150,274  (100)  -0.1%  Over the past 10 years, Casey’s has acquired 418 stores… with 259 stores over just the past 3 years  Smaller operators are great targets for acquisition  Source: NACS State of the Industry data 
 

 CONVENIENCE STORE INDUSTRY  Industry challenges  Why it matters?  Legacy small format stores are not big enough to put a robust prepared food program in with a kitchen. They struggle to make the investment in food (if size allows) and tech to offset rising cost pressures and declining categories, which drives consolidation  22,847  13,346  2013  2022  US Gas Station / Kiosk Count  (2013 – 2022)1  41%  Decline in Kiosk Format  Declining tobacco sales across c-store industry  Gradually declining fuel demand across the country  Rising cost pressures due to inflation, price- conscious guests, and operating expenses  Labor shortages  Consolidation driven by challenges  to c-store operators…  1 - Source: NACS State of the Industry data 
 

 ...and Casey’s is positioned to thrive  Casey’s competitive advantages  ~75% of Casey’s inside transactions do not include fuel  Casey’s private label as a value alternative for guests  300 SKUs that are margin accretive  ~120 SKUs that are unique to Casey’s  Data-driven insights enable Casey’s to meet guest expectations  ~80% of guests agree “Casey’s is a good value for the money”  Resilient financial position with strong balance sheet and low debt  Positioned to absorb headwinds and be an active M&A player  Over 75% of our stores have been built, acquired, replaced or remodeled since FY2010  CONVENIENCE STORE INDUSTRY | CASEY’S DIFFERENTIATORS 
 

 Strategic investments made in digital and food…  …and less reliance on tobacco results in higher inside margin rates.  Sources: NACS State of the Industry data (calendar year ended 12/31/2022) and Casey’s 2023 fiscal year ended 4/30/23 results for inside gross margin. Food lift and tobacco mix are sourced from Casey’s acquired store’s seller’s financials vs. Casey’s performance after acquisition.  Inside Gross Margin  Food % Lift  Tobacco Mix Reduction  % Active Rewards  16  Casey’s strategic differentiators offer competitive advantages and contribute to industry-leading profit margins  CONVENIENCE STORE INDUSTRY | CASEY’S DIFFERENTIATORS  60%  40%  Casey’s  Industry Average  40%  36%  Casey’s  Industry Average  +750  bps  Casey’s historically lifts PF&DB as a % of inside sales on acquired stores by 750 bps  -450  bps  Casey’s has reduced the sales mix of tobacco category on acquired stores by 450 bps 
 

 35.7%  13.9%  14.8%  3-year % Change  7.3%  7.9%  2-year % Change  11.0%  3.4%  3.3%  1-year % Change  SALES REVENUE % CHANGE   Casey's  Remaining Midwest Convenience Total US Convenience  Source: Circana Retail Advantage  17  Casey’s is taking share, as sales growth outperforms US and Midwest convenience  24.2%  CONVENIENCE STORE INDUSTRY | CASEY’S DIFFERENTIATORS 
 

 Smaller & single-store operators face higher, more rigid overhead costs per store  Casey’s scale protects against macroeconomic risks that affect smaller operators  Difficulty absorbing cost pressures on inside store items  Centralized procurement and positive supplier relationships to achieve savings at scale  Higher capital threshold for investment, limiting growth and expansion potential  Multiple sources of capital to fund growth and technology investments  Less protection against OpEx increases during volatile economic conditions  Ability to leverage corporate support functions and distribution centers to operate stores efficiently  Limited ability to invest in consumer acquisition and brand without scale benefits  Investments in advertising, rewards, & e-commerce to attract and engage guests  Scale is a bigger advantage than in the past, and the industry continues to consolidate  18  CONVENIENCE STORE INDUSTRY | CASEY’S DIFFERENTIATORS 
 

 INDUSTR Y  CASEY’S DIFFERENTIA T O RS   Resilient  Consistent Growth  Strong inside sales CAGR during economic downturns  Fragmented & Consolidating  Scale to Invest  We continue to invest in infrastructure and technology at scale to grow efficiently and effectively  Ability to Acquire  We have demonstrated a strong, disciplined acquisition approach with realized synergies  Shifting  Favorable Product Mix  Our diverse product mix and affordable private label makes us less susceptible to headwinds  Investment In Food & Tech  Strong Food Heritage & Innovation  We are known for our innovative food offerings, which is a strategic differentiator for our guests  Best-in-Class Rewards Platform  Our mobile app and digital platform boost our convenience and leads to stickier guests  Casey’s is well positioned for success in the c-store industry  Casey’s scale unlocks its differentiators to thrive in the convenience store space  RESUL T S  CONVENIENCE STORE INDUSTRY | CASEY’S DIFFERENTIATORS  18 
 

 CASEY’ S INVESTOR DAY 2023   Evolving  Our Strategy 
 

 During our 2020 Investor Day, we said we were going to…  Reinvent the guest experience  Contemporize our food proposition, optimize & localize assortment, and deliver compelling experiences  Create capacity through efficiencies  Drive efficiencies to improve the shape of the business and fund future growth  Accelerate unit growth  Accelerate our new store builds and acquisitions, including market and store format expansion  Deliver top quintile EBITDA growth (8-10% 3-year EBITDA CAGR)  Invest in our talent Create a culture that drives performance and exceeds guests’ expectations  EVOLVING OUR STRATEGY  21 
 

 Select Accomplishments  Invest in our talent  Create capacity through efficiencies  Added 354 units & optimized network plan  Established standalone M&A team  Integrated largest acquisition in company history  Strengthened & diversified leadership  Added focused development programs  Increased community engagement  Accelerate unit growth  Launched Casey’s rewards and grew to 6.5M+ members  Expanded private label & re-merchandised all stores  Contemporized food proposition  Centralized procurement and asset protection  Established continuous improvement team  Opened Joplin distribution center (May 2021)  Reinvent the guest experience  2020 Investor Day Commitment  …and we have delivered on our objectives  21  EVOLVING OUR STRATEGY 
 

 Certified Great Place To Work (2023)  21  America’s Best Loyalty Programs (2022)  Food Service Innovator (2022)  Casey’s recognized for a gender-balanced board (2021)  America’s Most Innovative Companies (2023)  Top Women in Convenience Corporate Empowerment Award (2023)  Casey’s accomplishments are being recognized  EVOLVING OUR STRATEGY 
 

 - Share price appreciation from 9-Jan-2020 to 1-May-2023  - ROIC is a non-GAAP metric, and we define ROIC as operating profit after taxes (net income, plus net interest expenses, income taxes, tax effected) divided by average invested capital. A reconciliation of ROIC is included in the Appendix.  - Free cash flow is a non-GAAP metric, and we define free cash flow as cash flow from operations less the purchase of property & equipment. A reconciliation of ROIC is included in the Appendix.  Diluted EPS CAGR  over 3-year period  EBITDA CAGR  over 3-year period  Stores added  from 2021 to 2023  …and delivered financial results in excess of Investor Day commitments…  EVOLVING OUR STRATEGY  24  Return on invested capital (ROIC) 2  improvement from 2020 to 2023  Share price appreciation 1  since Investor Day 2020  Free cash flow generation 3 
 

 5.7%  Inside same-store sales growth  over 3-year period  300+  PL SKUs  Private label now comprises 9%+ of units and gross profit  20%  Fuel gross profit ($) CAGR  over 3-year period  6.5+ Million  Digital rewards members  ~75%  Contracted gallons  through centralized fuel procurement  …while keeping EBITDA growth drivers well-rounded…  EVOLVING OUR STRATEGY  25  60%  90-day % active rewards member 
 

 Source: CASY share price, S&P 500 closing value 4/30/12 – 4/28/23  11%  15%  S&P 500  Casey's  CASEY’S SHARE PRICE VS. S&P 500   Average annual return, 2013-2023  …leading to share price appreciation above the S&P 500  EVOLVING OUR STRATEGY  26 
 

 E V O L V I N G O U R S T R A T E G Y  
 

 Casey’s FY24 – FY26 growth strategy is rooted in 3 enterprise objectives, enabled by a strong foundation and team member experience  EVOLVING OUR STRATEGY  28  DELIVER TOP QUINTILE 1 EBITDA GROWTH OF 8-10%   TEAM MEMBER VALUE PROPOSITION  ENABLING FOUNDATION   ACCELERATE   THE FOOD BUSINESS   GROW   THE NUMBER OF UNITS   ENHANCE  OPERATIONAL EFFICIENCY  GUEST INSIGHTS   1 - Source: Factset as of May 15, 2023, S&P 500 ǀ S&P 400 composite retail peers with market cap > $5B plus public c-store peers. Excludes Amazon.com, Inc., Etsy, Inc., eBay Inc., and Walgreens Boots Alliances, Inc.  Note: Growth rates represent forward-looking next 3 years growth calendarized to Casey’s FYE April 30. 
 

 Financial overview  FINANCIALS | DELIVER TOP QUINTILE EBITDA GROWTH OF 8-10%  29  DELIVER TOP QUINTILE EBITDA GROWTH OF 8-10%   TEAM MEMBER VALUE PROPOSITION  ENABLING FOUNDATION   ACCELERATE   THE FOOD BUSINESS   GROW THE   NUMBER OF UNITS   ENHANCE  OPERATIONAL EFFICIENCY  GUEST INSIGHTS   Steve Bramlage  Chief Financial Officer 
 

 Source: Casey’s January 9, 2020 Investor Day Presentation  Management Guidance  Results  EBITDA % growth  Store growth  Same-store sales  Gross profit margin %  Operational efficiencies  Cash flows  14% EBITDA CAGR  354 new units  (1.5%) SS gallons 5.7% SS inside sales  (90) bps inside margin  +13 CPG  OpEx CAGR < EBITDA CAGR  CF from operating activities > cap ex  8% to 10% CAGR through FY2023  345 additional new and acquired stores by FY2023  Margin expansion inside and outside the store  Operational expense % growth < EBITDA % growth  Cash flows from operating activities > cap ex  We delivered on Investor Day 2020 targets despite COVID-19 pandemic  FINANCIALS | DELIVER TOP QUINTILE EBITDA GROWTH OF 8-10%  Fuel gallons: flat-to-low single digit Inside sales: low-to-mid single digit  30 
 

 Represents FY03-FY23, FY13-FY23, and FY20-FY23 CAGR. See appendix for reconciliation of EBITDA to GAAP net income.  14%  EBITDA CAGR  12%  EBITDA CAGR  11%  EBITDA CAGR  19%  DILUTED EPS CAGR  16%  DILUTED EPS CAGR  15%  DILUTED EPS CAGR  22  CONSECUTIVE YEARS OF POSITIVE INSIDE SAME-STORE SALES  24  CONSECUTIVE YEARS OF DIVIDEND INCREASES  FINANCIALS | DELIVER TOP QUINTILE EBITDA GROWTH OF 8-10%  Last three years a continuation and acceleration of consistent long- term financial performance  20 - Y EAR 10 - Y EAR 3 - Y EAR   31 
 

 $45  $45  $205  $61  $246  $286  $16  $341  $10  $325  $-  $100  $200  $300  $400  $500  $600  $700  $900  $800  $1,000  $1,100  $1,200  FY24  FY25  FY26  FY27  FY28  FY29  FY30  FY31  FY32  FY33  $850  Amount due, $M  Debt Maturities  Debt│EBITDA ratio  1.8x  LT Target ~2.0x  Available liquidity  $1.25B  Provides significant flexibility  Low-cost debt  3.8%  Weighted average of interest rate on debt  FINANCIALS | DELIVER TOP QUINTILE EBITDA GROWTH OF 8-10%  We have a strong balance sheet and ample financial flexibility to support the growth algorithm  32  1 - As calculated in accordance with our senior notes.  Undrawn Revolving Credit Facility Capacity  1 
 

 FINANCIALS | DELIVER TOP QUINTILE EBITDA GROWTH OF 8-10%  FY24 – FY26 strategic plan outlook  EBITDA % growth  Store growth  Same-store sales  Gross profit margin %  Operational efficiencies  Cash flows  Management Guidance  8%-10% CAGR through FY2026  Free cash flow ~$1.25B through FY2026  350+ additional stores via new builds & acquisitions by FY2026  Inside sales: ~mid single digit increase  Fuel gallons: ~flat to low single digit increase  Margin expansion inside the store Fuel margin in the mid-30s CPG  OpEx % growth < EBITDA % growth  33 
 

 EXISTING B U SINESS   UNIT   GR O WTH   Funds Accelerated Growth  Accelerate Unit Growth  Organic growth/NTI  Accelerated M&A  Capture M&A synergies  Operational Efficiencies  Store simplification  Supply chain efficiency  Optimized network plans  Kitchen simplification  Centralized procurement  Asset protection  Gross Margin Expansion  Fuel procurement  Joint planning w/ vendors  Supply chain efficiency  Centralized procurement  Private brands & mix management  Pricing w/ inflation  Same-Store Sales Growth  Merchandise assortment  Menu innovation  Digital engagement  Pricing  Casey’s Rewards  FINANCIALS | DELIVER TOP QUINTILE EBITDA GROWTH OF 8-10%  Algorithm seeks to deliver top quintile EBITDA growth of 8-10%  4%+  4%+  33 
 

 $400M  ~9%  10-year dividend growth CAGR  Continued focus on growing the business  24 consecutive years of dividend increases  Share repurchase authorization  75%+  PP&E spend is growth oriented  Disciplined unit growth  New store construction and M&A  EBITDA and ROIC accretive  Maintain adequate financial flexibility  Steady state leverage of ~2x Debt/EBITDA  ~$1.5 billion borrowing capacity for M&A  Return capital to shareholders  Grow dividend consistent with EBITDA in mid-term  o Maintain a medium-term payout ratio of 15 – 20%  Opportunistic share repurchase  1  2  3  FINANCIALS | DELIVER TOP QUINTILE EBITDA GROWTH OF 8-10%  Capital allocation prioritizes driving value for shareholders  33 
 

 FY23 CASEY’S WEIGHTED AVERAGE COST OF CAPITAL  ~7.5%  FY23 CASY ROIC   11.8%  Double-digit ROIC expectation  PROJECT RETURN REQUIREMENTS   ~15%  Expectation of 15% return by steady state in year 5-6  FINANCIALS | DELIVER TOP QUINTILE EBITDA GROWTH OF 8-10%  Capital acquisition and return  33 
 

 DELIVER TOP QUINTILE EBITDA GROWTH OF 8-10%  Consistent track record of performance  Capital allocation strategy that prioritizes driving value for shareholders  Attractive growth outlook  Backed by a strong balance sheet with ample liquidity  FINANCIALS | DELIVER TOP QUINTILE EBITDA GROWTH OF 8-10%  Key takeaways  33 
 

 Guest insights  GUEST INSIGHTS  DELIVER TOP QUINTILE EBITDA GROWTH OF 8-10%   TEAM MEMBER VALUE PROPOSITION  ENABLING FOUNDATION   ACCELERATE   THE FOOD BUSINESS   GROW THE   NUMBER OF UNITS   ENHANCE  OPERATIONAL EFFICIENCY  GUEST INSIGHTS   Carrie Stojack  VP Guest Insights  33 
 

 Enable growth through insights  GUEST INSIGHTS  Business Case  Pipeline & Innovation  Brand Insight  Culture  Make sense of broader world view  Understand 360 view of consumer  + brand relationship  Discover, validate & optimize new concepts and products  Bridge consumer opportunities with business insight  33 
 

 Beer cheese pizza case study  GUEST INSIGHTS  Business Case  Brand Insight  Pipeline & Innovation  Culture  33 
 

 GUEST INSIGHTS  R U RAL B U T WITH STR ONG WALLET SHARE   ~70% of Casey’s rewards guests earn > $50k per year  LOYA L  Casey’s rewards guests frequent the store more often than retail/QSR competitors  SATISFIED   Overall satisfaction up over 10% in the past year  The Casey’s Guest  33 
 

 GUEST INSIGHTS  Guests want…  The guests’ view  of people in Casey’s footprint have an aided awareness of Casey’s, higher than any competitor  92%  of people aware of Casey’s believe it has brand momentum and things going for it  72%  of guests agree Casey’s is a good value for the money  80%  + Consistent, convenient experience  + Craveable food & beverage  + The right assortment  + Affordable & rewarding  33 
 

 ACCELERATE   THE FOOD BUSINESS   Accelerate the food business  ACCELERATE THE FOOD BUSINESS  DELIVER TOP QUINTILE EBITDA GROWTH OF 8-10%   TEAM MEMBER VALUE PROPOSITION  ENABLING FOUNDATION   GROW THE   NUMBER OF UNITS   ENHANCE  OPERATIONAL EFFICIENCY  GUEST INSIGHTS   Tom Brennan  Chief Merchandising Officer  Brad Haga  SVP Prepared Food & Dispensed Beverage  33 
 

 Success with Grocery & General Merchandise  The Right Assets  1  2  Store infrastructure  Optimize store layouts  Category space allocation  The Right Products  Differentiated and exclusive products  Private label expansion  Assortment optimization  3  44  The Right Processes & Systems  Robust joint business planning  Sustainable merchandising excellence  Gather  Joint Business Planning: Driver of Sustainable Success  Share & Develop  Align  Activate  Review the data  Share strategy  Marketing plan  Digital & loyalty  Partner big bets  Finalize plan  Big bets  Innovation  Digital & marketing activation  Guest insights  Industry data  Market visits  Mid-yr review  Roles & intents  Category Data  Assortment  Summer  Fall  Winter  New program  Enable POGs  Summer prep  AQ/new store  Supply chain  Verification  Spring  ACCELERATE THE FOOD BUSINESS 
 

 Key accomplishments over the past year  ACCELERATE THE FOOD BUSINESS  Pizza Revamp  Innovation Process Limited Time Offers Crust Innovation  45 
 

 A closer look at accelerating food  BRAND   MAN A GEMEMT   BU I L D  NEW CA PABILITY   OMNI CHANNEL MARKETING   Using Casey’s food service and technology strength to accelerate food  Define what’s important, resource and drive it while optimizing the business through merchandising basics  45  Develop and implement new competencies both in store and upstream to drive outsized value  New creative briefing process to drive seamless guest experience and drive traffic  ACCELERATE THE FOOD BUSINESS 
 

 Execute the basics  Category Roles & Intents  1  2  Leverage business insights to determine the purpose of each category  Dedicate our resources and energy towards fewer things bigger  Segmented Assortment & Pricing  Tier, regionalize and rationalize product assortment  Opportunity exists to get more local with our pricing and promotion  3  45  Joint  Business Planning  From tactical to strategic relationships  Leverage large partners to help Casey’s drive PF&DB  ACCELERATE THE FOOD BUSINESS 
 

 Drive efficiency and innovation  Upstream Capability  1  2  Use our scale to take non-value add tasks out of the store  Keep high quality food available without the strain on the kitchen  New Platforms  Drive & develop new sales layers  Optimize dispensed beverages  3  Product Innovation  Daypart optimization  Pizza crust innovation and traffic driving LTOs  ACCELERATE THE FOOD BUSINESS  45 
 

 Innovation focus  4949  Significant opportunities remain for future growth  49  ACCELERATE THE FOOD BUSINESS  + Continued crust innovation  + New dayparts  + Expanded fried foods assortment  + Made-to-Order dispensed beverages 
 

 Thin crust commercial  ACCELERATE THE FOOD BUSINESS  50 
 

 We are approaching marketing differently  SEAMLESS GUEST   EXPERIENCE   NEW CREA T IVE BRIEF   PR OCESS   MARKETING T O DRIVE TRAFFIC   Start with a human truth and consumer insight  Find the right tension to make our marketing idea interesting  Zero in on our brand and our guest  Omni-channel marketing campaigns  Culturally relevant guest engagement  Newsworthy activations  CASEY’S A CCESS: RET AIL   MARKETING   On-site  Off-site  On-prem  ACCELERATE THE FOOD BUSINESS  50 
 

 Saving More  Easier to Use  Earning Faster  The refreshed Rewards enhancements benefit guests by…  Driving results because Rewards members:  ...include more features to keep our guests highly engaged  …while clearly communicating the value proposition  …resulting in more members, more active participation, more sales  With new capabilities that…  Rewards refresh,  enhancements focus on choice and ease  Members visit 15% more than non-members  With Casey’s most active guests visiting 4.7 times a week  Members spend 13% more per transaction…  … driving 50% more annual profit  ACCELERATE THE FOOD BUSINESS  50 
 

 We will resume in 15 minutes  CASEY’ S INVESTOR DAY 2023   Break 
 

 Grow the number of units  GROW THE NUMBER OF UNITS  DELIVER TOP QUINTILE EBITDA GROWTH OF 8-10%   TEAM MEMBER VALUE PROPOSITION  ENABLING FOUNDATION   GROW THE   NUMBER OF UNITS   ACCELERATE   THE FOOD BUSINESS   ENHANCE  OPERATIONAL EFFICIENCY  GUEST INSIGHTS   Brian Johnson  SVP Investor Relations & Business Development  Kendra Meyer  VP Real Estate  54 
 

 A closer look at growing store units  TRACK RECORD OF SUCCESS   TWO-PRONGED APPROACH TO UNIT GROWTH   SPACE TO GROW   Casey’s has a long history of ratable unit growth  New build and acquisitions drive growth across markets  Casey’s has ample opportunity to expand within its footprint  Casey’s boasts a history of strong growth, with differentiated concepts for store formats  54  GROW THE NUMBER OF UNITS 
 

 1,531  1,637  1,699  1,749  1,808  1,878  1,931  1,978  2,073  2,146  2,207  2,243  2,452  2,521  44  45  51  48  85  56  60  40  37  89  35  26  28  36  5  22  26  24  18  5  207  47  +354 in 3 years  exceeding stated 345 goal  18  20  30  31  21  34  2010  2011  2012  2013  2014  2015  2016  2017  2018  2019  2020  2021  2022  2023  54  Actual Growth  Last 3 Years  Track record of ratable growth   +779 over 10 years   From 2011 to 2020  GROW THE NUMBER OF UNITS  # OF UNITS BY FISCAL YEAR   New builds Acquisitions Ending store count 
 

 Flexible, two-pronged approach allowed target to be met  What we committed to…  Grow by 345 units  Create dedicated M&A team  Implement predictive analytics to drive expansion  Target mid-sized markets  Focus on cost efficiencies  …despite unforeseen challenges  Global pandemic weeks after commitment  o Created challenges with zoning and permitting  Catalyst for M&A  Rising construction costs  …adapted and delivered results  Grew by 354 units  Stood up dedicated M&A team  Established a network plan for growth  Implemented predictive analytics  Targeted mid-sized markets  Deployed a more cost-effective prototype  65  80  90  30  40  40  FY21  FY22  FY23  New Store Builds  Acquisitions  40  34  5  207  21  47  FY21  FY22  New Store Builds  FY23  Acquisitions  Total Unit Growth  Estimated annual unit growth, fiscal year end  Total Unit Growth  Actual annual unit growth, fiscal year end  GROW THE NUMBER OF UNITS  54 
 

 IDENTIFYING & V A L U ING A C QUISITION TA R G ETS   INTEGRATING INT O THE CASEY’S BRAND   1 - Seller’s trailing 12-month EBITDA based on seller provided financials prior to transaction; pre-Casey’s synergies  How M&A adds value to Casey’s  58  Key characteristics of acquisition targets  Over-indexed to tobacco with little food service  Deferred maintenance and capital improvements  Lack of scale with branded fuel  Lack of loyalty and engagement program  Casey’s synergies  Best-in-class food service  Centralized support & self-distribution  Scaled merchandise & fuel contracts  Digital guest engagement & private label  PRE-SYNERGY MULTIPLES  Seller’s trailing EBITDA1  6x-9x  CASEY’S TRADING MULTIPLE  EV / EBITDA Trading Multiple  ~10-11x  GROW THE NUMBER OF UNITS 
 

 New store  Acquisition  PERFORMANCE   INVESTMENT   Strong results are driven by substantial EBITDA lift resulting from both inside and outside improvement  Full synergy potential typically realized by YR4  All-in investment below new store costs  Disciplined approach to EBITDA multiples results in favorable purchase price v. EBITDA  RETURNS   Mature ROI average mid-to-high teens  ROI ramp to maturity shortened vs. new store  Accretive YR1 ROI (+10%)  ~15%  ROI% Steady-state  M&A value proposition  59  EBITDA  Fuel Gallons  Post-Remodel  Pre-Change in Control  Inside Sales  ~+7%  ~+20%  ~+70%  <$1M  GROW THE NUMBER OF UNITS 
 

 - Based on 36 store remodels completed before FY23  - Represents seller-provided CY19 provided financials; pre-Casey’s synergies 3 - Represents Casey’s FY23 results  Acquired Buchanan Energy (92 retail locations and a dealer network of 81 stores) in May, 2021  Captured ~$23M pre-tax synergies one year ahead schedule  Fully integrated into Casey’s self-distribution and leveraging Casey’s scale  Re-merchandised all retail stores, including introduction of Casey’s private label products  40 remodels and 3 raze/rebuilds completed, including full Casey’s kitchen installations  De-levered from 2.4x debt/EBITDA post-transaction to 1.8x by FYE23  Synergy capture  Debt paydown  Financed store upgrades through free cash flow  Acquisition Highlights  Inside sales up 22% | Inside margin expansion >850bps  Before Remodel2 After Remodel3  Inside Gross Profit $1  Revisiting the Buchanan Energy acquisition  60  Bucky’s Limited Kitchen  Casey’s Remodeled Kitchen  10%  90%  27%  73%  Grocery & general merchandise  Prepared food & dispensed beverage  GROW THE NUMBER OF UNITS 
 

 Market attractiveness  Historical + market outlook  Competitive landscape  Market economics  Regulatory  Predictive analytics  Machine learning AI software  Sales predictions  Market optimization  Continuously evolving  New tools and capabilities for new unit growth  61  GROW THE NUMBER OF UNITS 
 

 Comparison of average per store per month financial results on new stores opened from June 2017-April 2020 versus May 2020-January 2023 (excluding 4 truck stop locations)  New store builds deliver even stronger performance  Enhancing our offer + data driven decisions  Average double digit returns within 1-3 years and continue to ramp  Significant growth in all topline categories  62  PF&DB Sales  Fuel Gallons  G&GM Sales  ~+64% ~+51% ~+22%  Recent new builds improved year 1 performance  Comparison of stores opened before and after new tools implemented  Year 1 Performance  Pre-FY21  FY21 and beyond  GROW THE NUMBER OF UNITS 
 

 Well positioned for future growth  63  Casey’s was built on rural communities and there is substantial white space to grow within and outside of the existing footprint  Boundaries represent 500 truck driving miles from our three distribution centers. Red dots represent existing Casey’s locations.  GROW THE NUMBER OF UNITS 
 

 64  Well positioned for future growth  Casey’s was built on rural communities and there is substantial white space to grow within and outside of the existing footprint  ~75% of towns between 500 and 20,000  in our DC footprint do NOT have Casey’s  Boundaries represent 500 truck driving miles from our three distribution centers. Blue dots represent towns between 500 and 20,000 people that do not have an existing Casey’s location.  GROW THE NUMBER OF UNITS 
 

 T r a v el center style   ~7,800 square foot prototype  Offers showers & interior seating  Interstate and highway locations with separate diesel island  Standar d  ~5,000 square foot prototype  Suburban areas  Increased sales floor space for additional offerings  Smaller f o r m a t  ~3,200 square foot prototype  Ideal for rural communities  Less expensive than standard  Flexible formats to meet guests needs and maximize return  Flippin, AR  New Lenox, IL  Ankeny, IA  65  GROW THE NUMBER OF UNITS 
 

 350+  in 3 years  FY 24 – FY26 Goal  18  20  30  31  21  34  2010  2011  2012  2013  2014  2015  2016  2017  2018  2019  2020  2021  2022  2023  2024  2025  2026  44  45  51  48  85  56  60  40  37  89  35  26  28  36  5  22  26  24  18  5  207  47  Actual Growth  Last 3 Years  Projected Growth  Next 3 Years  Projected unit growth     1,531  1,637  1,699  1,749  1,808  1,878  1,931  1,978  2,073  2,146  2,207  2,243  2,452  2,521  +779 over 10 years Projected 700+ over 6 years   From 2011 to 2020 From 2021 to 2026  350+  Units  GROW THE NUMBER OF UNITS  65  # OF UNITS BY FISCAL YEAR   New builds Acquisitions Ending store count 
 

 Enhance operational efficiency  ENHANCE OPERATIONAL EFFICIENCY  DELIVER TOP QUINTILE EBITDA GROWTH OF 8-10%   TEAM MEMBER VALUE PROPOSITION  ENABLING FOUNDATION   ACCELERATE   THE FOOD BUSINESS   GROW THE   NUMBER OF UNITS   ENHANCE  OPERATIONAL EFFICIENCY  GUEST INSIGHTS   Ena Williams  Chief Operating Officer  Jay Soupene  SVP Operational Excellence  65 
 

 A closer look at enhancing operational efficiency  ENHANCE OPERATIONAL EFFICIENCY  STORE   SIMPLIFICATION   STREAMLINE THE KITCHEN   FASTER SERVICE   INVENTOR Y  OPTIMIZATION   Foundational Elem ents   STORE   MODERNIZATI O N  CULTURE OF   CONTINUOUS IMPROVEMENT  
 

 Store simplification  ENHANCE OPERATIONAL EFFICIENCY  Voice of our Stores  1  2  3  Store level feedback and input on key initiatives and recommendations  Eliminate Complexity  Streamline Communications  Remove store operations complexity and labor with evolved processes, more contemporary services and technology  Right information at the right time to focus execution and drive the business as the store level  4  Labor Management  Sharp labor forecasting, allocation and execution with a contemporary workforce management platform  69 
 

 Streamline the kitchen  ENHANCE OPERATIONAL EFFICIENCY  Efficient Processes  & Equipment Conversions  1  2  3  Advance and standardize kitchen processes  Evolve kitchen assets to build capacity and enhance food quality  Optimize carryout and delivery  69  Explore New  Kitchen Technologies  Define the Kitchen of the Future  Explore new kitchen solutions with a focus on revenue and margin expansion  Automate and contemporize production planning  Efficient, guest focused processes  Prototypes and layouts to drive efficiency, quality, and scalability 
 

 Faster service  ENHANCE OPERATIONAL EFFICIENCY  Self Checkout  1  2  3  Improves speed of service and efficiency  69  Point of Sales Capabilities  Integration of AI Systems  New Asset Protection software to monitor and grow team member performance  Assesses transactions by type and the potential for cash losses  AI-enabled voice ordering system for our kitchens  Significantly improves the ordering process during high volume time windows 
 

 Inventory optimization  ENHANCE OPERATIONAL EFFICIENCY  Order Simplification  1  2  3  Improved merchandise hierarchy and visibility to category and item level information  Evolve to a more robust inventory process that simplifies the store ordering process.  Right Products  in the Right Place  Inventory Management  Optimal inventory levels throughout the supply chain, ensuring freshness and reducing waste  Integrated space planning tech to optimize store  Sharper Kitchen Inventory Processes and Technology  Establish more consistent rigor on store level inventories  Align to industry best practices.  Implement lean practices  69 
 

 SUCCESSES   Continue making the store more efficient by simplifying operations at scale to drive significant cost savings  Continuous improvement at work  ENHANCE OPERATIONAL EFFICIENCY  3rd Party Laundry Services  Smart Safe Implementation  Order Fulfillment  Kitchen Operations Improvements  Inventory Management  Reduced Turnover  RESUL T S  2.3%  Reduced same-store labor hours FY23  Next 3  69  Y ears: Simple &  Easy  
 

 Store modernization  ENHANCE OPERATIONAL EFFICIENCY  Smart Systems  Store Edge Computing  Team Member Enablement  Simplified access  Data to drive decisions  Collaboration  Communication  Team member development  Reduces complexity and increases system availability  Faster software deployments  Smart Safes  Digital kitchen optimization  Digital media network  Smart environmental systems  Guest Experience  Self Checkout  Increased convenience  Shorter lines  AI Voice Ordering  Consistent ordering experience  Personalized offers  Faster store deployments (acquisitions and NTI)  Enables future store tech  Foundational   69 
 

 R   ESUL TS   Culture of continuous improvement  ENHANCE OPERATIONAL EFFICIENCY  PR OCESSES   Organized to win - culture of evolution enabled by enterprise-wide problem solvers  Operational approach to kitchen and inventory processes – simplified layout, prep shifts, food scheduling, lean management processes  Enhanced operational controls and standards –  national contracts for easier centralized services  Equipped with new tools and processes  Centralized Communication platform  Drives simplification of processes  Enables scalability to support business growth  Reduces risk of operations  Increases team member engagement, productivity and satisfaction  …to unlock value and achieve measurable results  69 
 

 Enabling foundation: moderated panel  ENABLING FOUNDATION  DELIVER TOP QUINTILE EBITDA GROWTH OF 8-10%   TEAM MEMBER VALUE PROPOSITION  ENABLING FOUNDATION   ACCELERATE   THE FOOD BUSINESS   GROW   THE NUMBER OF UNITS   ENHANCE  OPERATIONAL EFFICIENCY  GUEST INSIGHTS   69 
 

 Today’s Panelists  ENABLING FOUNDATION  Ena Williams  Chief Operating Officer  Moderator  Doug Means  SVP Supply Chain & Efficiency  Sanjeev Satturu  SVP Chief Information Officer  Nathaniel Doddridge  VP Fuels  Chris Boling  SVP Store Operations  69 
 

 Boost fuel contribution via evolving supply strategies and retail price optimization  ENABLING FOUNDATION  Strategize for Outsized Success  1  2  3  Distributing majority of fuel through proprietary transportation  Leveraging fuel volume to manage down supply costs with advantaged regional refiners  Moving lockstep with the energy transition through expanded renewable fuel offers and building out an EV charging network  69  Win with Recent Strategies  Go-Forward Strategy  Focusing fuel strategy on centralized pricing and procurement  to maximize profitability (through FY23)  Modernize supply chain software to provide scalability  Investing in additional capabilities to move deeper into the fuel supply value chain  Robust data and analytics capabilities to unlock incremental margin 
 

 Leveraging self-distribution to maximize service and minimize cost  ENABLING FOUNDATION  Inventory Visibility and Management across Entire Supply Chain  1  2  3  Optimize Supply and Delivery Network  Intelligently implement Automation at DC’s  Enhancing DC resiliency through automation  Reducing costs with scalable automation efforts  Optimizing supply chain with capacity to absorb growth  Leveraging supply chain costs efficiently with scale  Executing on detailed asset growth plan without “out of plan” expenses  Forecasting and creating visibility across entire supply chain  Reducing spend through accurate and timely deployment of inventory  69 
 

 Technology and insights that make our stores smart and convenient  ENABLING FOUNDATION  Achieve Consistent and Scalable Technology  1  2  3  Digitize Store Experiences  69  Leverage Insights Driven Decision- Making  Implementing a cloud-based enterprise data platform to provide a one-stop shop for quality data with governance at the core  Establishing a Center of Excellence, fostering collaboration among data scientists, analysts, and decision-makers to access responsibly democratized data and insights that unlocks value across the organization  Delivering digital store tools that benefit guests, team members, and Casey’s bottom line  Strategically investing in digital to enable growth agenda  Optimizing technology foundation to maximize reliability, simplify, and rationalize  Reducing complexity and lower operating costs 
 

 Store level execution  ENABLING FOUNDATION  Business Acumen Development of Field Leaders  1  2  3  Simplification of Store Execution  Tools to Measure Execution  Structured field business review cadence  Development forums for financial and business learning  Store level action planning  69  Process for prioritizing initiatives that go to stores  Resources to support initiatives  Leveraging technology to drive execution  Scorecards that measure execution performance 
 

 Team member value proposition  TEAM MEMBER VALUE PROPOSITION  DELIVER TOP QUINTILE EBITDA GROWTH OF 8-10%   TEAM MEMBER VALUE PROPOSITION  ENABLING FOUNDATION   ACCELERATE   THE FOOD BUSINESS   GROW THE   NUMBER OF UNITS   ENHANCE  OPERATIONAL EFFICIENCY  GUEST INSIGHTS   Chad Frazell Chief Human Resources Officer  69 
 

 Key components of team member value proposition  Provide career growth  through career pathways, mentoring and development, and coaching and feedback  Support total well-being  through compensation and benefits, and recognition  Live Casey’s CARES  through CARES values and diversity, equity and inclusion  Grow team member engagement  with communication and simplification  COMPONENTS   Provide Career Growth  69  Live Casey’s CARES  Support Total Well-being  Grow Team Member Engagement  TEAM MEMBER VALUE PROPOSITION 
 

 What team members value:  Flexibility  Career Development  Health and Well-being  Compensation  Meaningful Work  Casey’s workforce strategy:  Build a Team Member Value Proposition that focuses on what matters to our frontline labor pools  Innovate on flexible options  Invest in building strong managers and a development culture  Simplify the jobs and make them more engaging  Investment in People  Operational Choices  Sources: Zeynep Ton – The Good Jobs Strategy  David Fuller, Bryan Logan, and Aneliya Valkova – June 29,2022: The Great Attrition in frontline retail—and what retailers can do about it, McKinsey & Company  Require motivated, capable people  Need return on people investment  80% engagement score led to a 7% reduction in store team member turnover  TEAM MEMBER VALUE PROPOSITION  Frontline retail attrition  84 
 

 42%  33%  23%  72%  56%  54%  Total Workforce  Hourly Staff Professional Staff Extended Leadership Team Senior Leadership Team  Board  Total Workforce  16%  Hourly Staff  16%  Professional Staff  11%  Extended Leadership Team  27%  Senior Leadership Team  50%  Board  25%  % Racial / Ethnic Minority  Representation of Our Diversity   % Women   NEW  NEW  Our team composition  TEAM MEMBER VALUE PROPOSITION  85 
 

 Closing  Thoughts  Darren Rebelez  85 
 

 The convenience store industry is shifting in favor of large-scale players  Casey’s is differentiated and positioned to thrive beyond industry peers  Casey’s has a proven growth algorithm, with clear strategic initiatives to execute  Resilient industry protected from key macroeconomic factors  Increasing consolidation in a highly fragmented industry  Winners offer vertical integration, digital tech, and food offerings  Proven track record of expansion through both organic / inorganic unit growth  Unique competitive advantages within the industry: 5th largest pizza chain, ~50% of stores in populations of 5k or fewer, rural footprint  Proven algorithm for EBITDA growth with ability to execute effectively  Strong balance sheet positioned to capitalize on investment opportunities  Consistent shareholder value via dividend growth and stock price appreciation  CASY goal deliver top quintile EBITDA growth of 8-10%  Why invest in Casey’s  Consistent track record of performance  Capital allocation strategy that prioritizes driving value for shareholders  Attractive growth outlook  Backed by a strong balance sheet  CLOSING THOUGHTS  85 
 

 Casey’s private label  Casey’s has strict private label (PL) requirements to beat national brand offerings on quality, retail price, and penny profits  QUALITY  LOWER PRICE  LARGER MARGINS  Casey’s PL quality is as good or better than national brand competitors  More profitable to Casey’s than national brand competitor, with more margin dollars per unit  Casey’s PL retail price is less than national brand, offering affordability for cost conscious guests  Casey’s has over 300 private label products, with more to come  The presentation will resume with Q&A in 30 minutes  85  CLOSING THOUGHTS 
 

 Casey’s Management Team  CASEY’ S INVESTOR DAY 2023   Q&A 
 

 Appendix  CASEY’ S INVESTOR DAY 2023  
 

 91  Reconciliation of Non-GAAP Financial Measures – EBITDA  APPENDIX  Note: figures in thousands  FY03  FY04  FY05  FY06  FY07  FY08  FY09  Net income  $ 37,355  $ 34,797  $ 35,688  $ 59,787  $ 61,211  $ 84,891  $ 85,690  Interest, net  13,030  12,398  10,739  8,896  11,184  9,792  10,626  Federal and state income taxes  24,294  17,098  23,215  35,176  34,205  49,051  53,425  Depreciation and amortization  46,132  48,357  52,123  57,185  63,895  67,607  69,406  Loss on discontinued operations, net of tax benefit  1,206  1,431  5,779  1,389  1,651  113  54  Cumulative effect of accounting change, net of tax benefit   -    -    -    1,083   -    -    -   EBITDA  $ 122,017  $ 114,081  $ 127,544  $ 163,516  $ 172,146  $ 211,454  $ 219,201  FY10  FY11  FY12  FY13  FY14  FY15  FY16  Net income  $ 116,962  $ 105,973  $ 114,694  $ 103,814  $ 126,820  $ 180,628  $ 225,982  Interest, net  10,933  28,497  35,192  35,265  39,915  41,225  40,173  Federal and state income taxes  64,620  56,614  65,276  59,802  66,824  101,397  122,724  Depreciation and amortization   73,546   82,355   96,552   111,823   131,160   156,111   170,937  EBITDA  $ 266,061  $ 273,439  $ 311,714  $ 310,704  $ 364,719  $ 479,361  $ 559,816  FY17  FY18  FY19  FY20  FY21  FY22  FY23  Net income  $ 177,485  $ 317,903  $ 203,886  $ 263,846  $ 312,900  $ 339,790  $ 446,691  Interest, net  41,536  50,940  55,656  53,419  46,679  56,972  51,815  Federal and state income taxes  92,183  (103,466)  59,516  78,202  94,470  100,938  140,827  Depreciation and amortization   197,629   220,970   244,387   251,174   265,195   303,541   313,131  EBITDA  $ 508,833  $ 486,347  $ 563,445  $ 646,641  $ 719,244  $ 801,241  $ 952,464 
 

 92  Reconciliation of Non-GAAP Financial Measures – ROIC  APPENDIX  FY19  FY20  FY21  FY22  FY23  Net income  $ 263,846  $ 312,900  $ 339,790  $ 446,691  Federal and state income taxes  78,202  94,470  100,938  140,827  Interest, net  53,419  46,679  56,972  51,815  EBIT  395,467  454,049  497,700  639,333  Tax effect1  90,415  105,295  113,986  153,247  Operating profit after depreciation and taxes (a)  $ 305,052  $ 348,754  $ 383,714  $ 486,086  Lines of credit  $ 75,000  $ 120,000  $ -  $ -  $ -  Current maturities of long-term debt  17,205  570,280  2,354  24,466  52,861  Long-term debt, net of current maturities  1,283,275  714,502  1,361,395  1,663,403  1,620,513  Total shareholders' equity  1,408,769  1,643,205  1,932,679  2,240,838  2,660,666  Total invested capital  $ 2,784,249  $ 3,047,987  $ 3,296,428  $ 3,928,707  $ 4,334,040  Average invested capital (b)  $ 2,916,118  $ 3,172,208  $ 3,612,568  $ 4,131,374  Return on invested capital (ROIC) (a) / (b)  10.5%  11.0%  10.6%  11.8%  Note: figures in thousands  1 - EBIT is tax effected using the effective tax rate for the reported period. Effective tax rate is Federal and state income taxes divided by Income before income taxes. 
 

 93  Reconciliation of Non-GAAP Financial Measures – Free Cash Flow  APPENDIX  Note: figures in thousands  FY21  FY22  FY23  Operating cash flows  $ 804,088 $ 788,741 $ 881,951  Purchase of property and equipment   (441,252)   (326,475)   (476,568)  Free cash flow  362,836  462,266  405,383