|
Oklahoma
|
001-38656
|
20-0764349
|
|
(State or other jurisdiction of incorporation)
|
(Commission File Number)
|
(IRS Employer Identification No.)
|
| ☐ |
Written communications pursuant to Rule 425 under the Securities Act (17 CFR 230.425)
|
| ☐ |
Soliciting material pursuant to Rule 14a-12 under the Exchange Act (17 CFR 240.14a-12)
|
| ☐ |
Pre-commencement communications pursuant to Rule 14d-2(b) under the Exchange Act (17 CFR 240.14d-2(b))
|
| ☐ |
Pre-commencement communications pursuant to Rule 13e-4(c) under the Exchange Act (17 CFR 240.13e-4(c))
|
|
Title of each class
|
Trading
Symbol(s)
|
Name of each exchange on which
registered
|
|
Common Stock, $0.01 par value
|
BSVN
|
The NASDAQ Global Select Market
|
| Item 2.02. |
Results of Operations and Financial Condition
|
| Item 7.01 |
Regulation FD Disclosure
|
|
Item 9.01
|
Financial Statements and Exhibits
|
|
(d)
|
Exhibits.
|
|
Item
|
Description
|
|
|
Press Release dated January 26, 2023
|
||
|
Fourth Quarter and Full Year 2022 Investor Presentation
|
||
|
BANK7 CORP.
|
||
|
Date: January 26, 2023
|
By:
|
/s/ Kelly J. Harris
|
|
Kelly J. Harris
|
||
|
Executive Vice President and Chief Financial Officer
|
||
|
|
- |
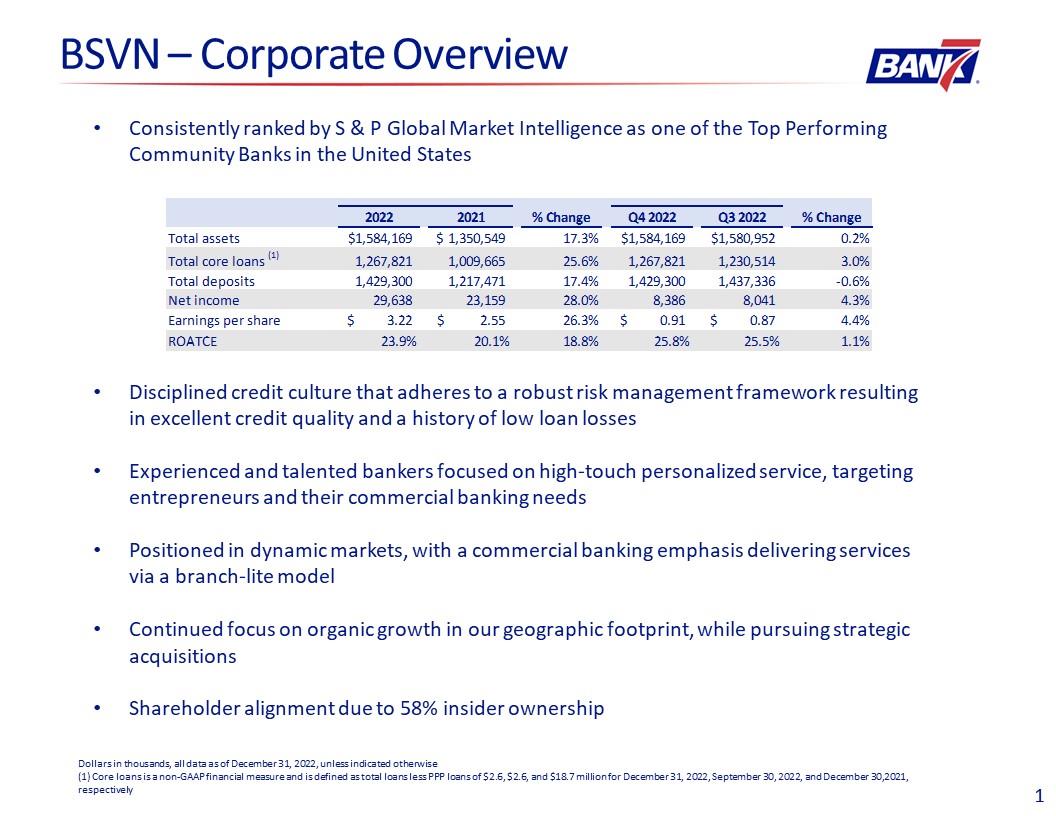
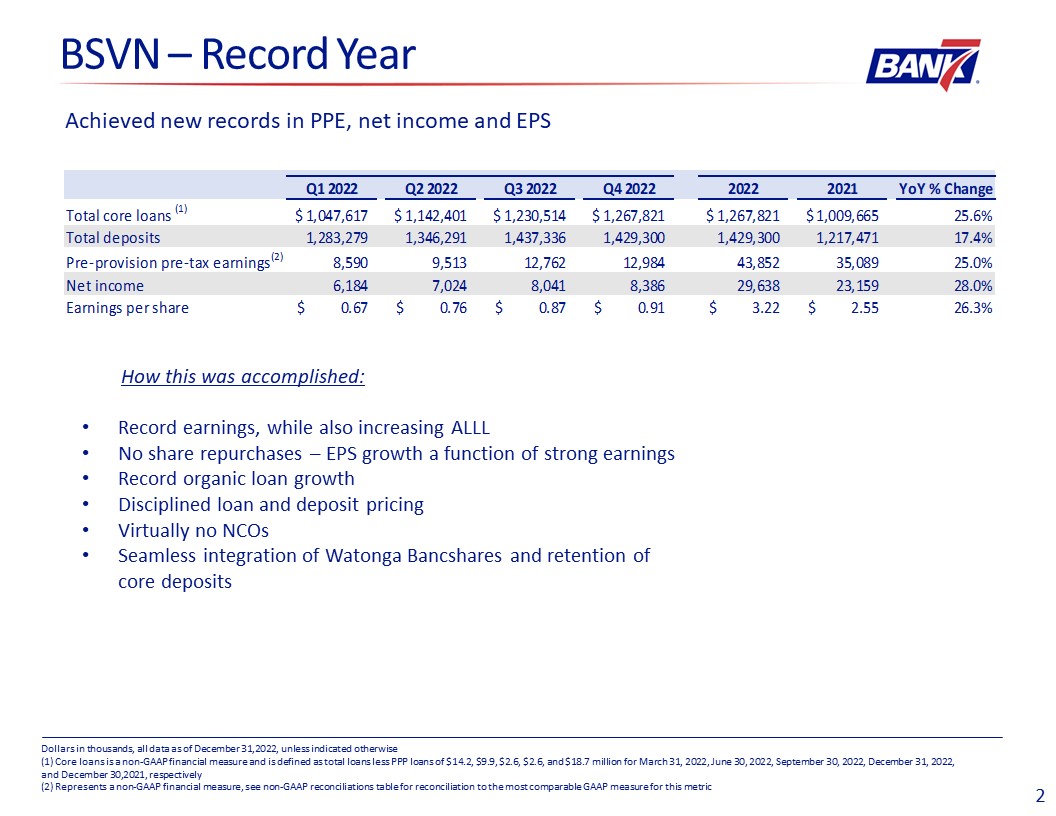
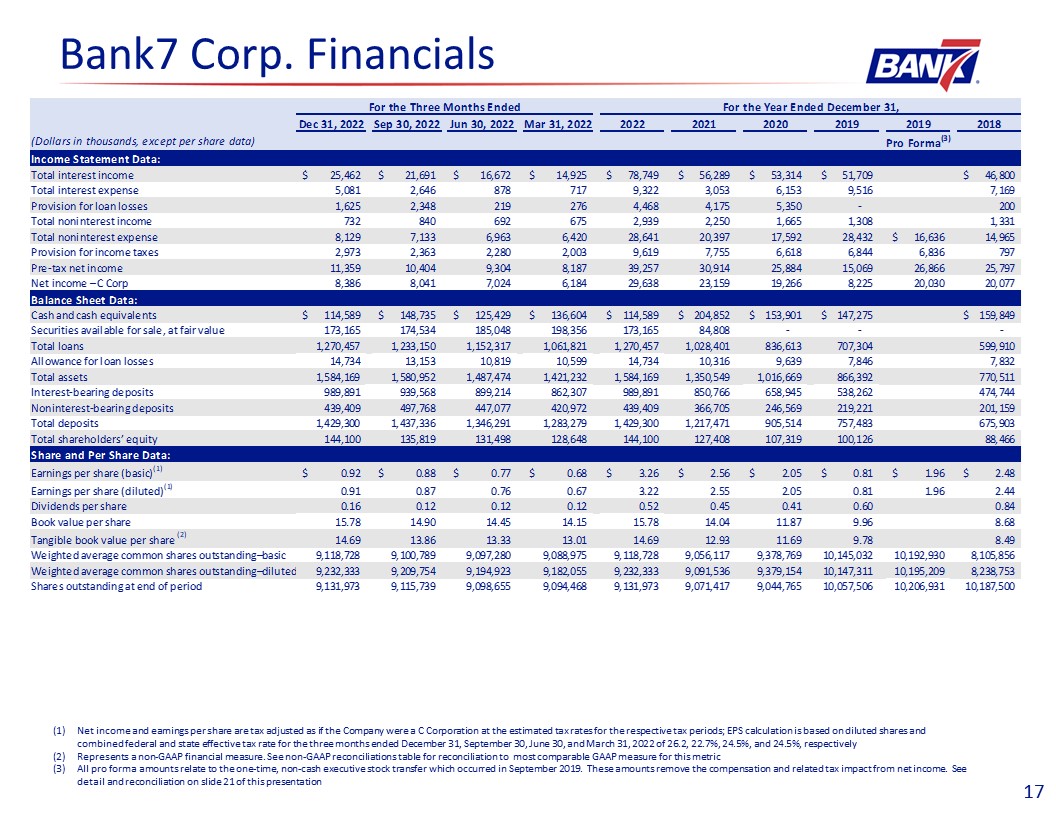
Net income of $29.6 million compared to $23.2 million, an increase of 27.98%
|
|
|
- |
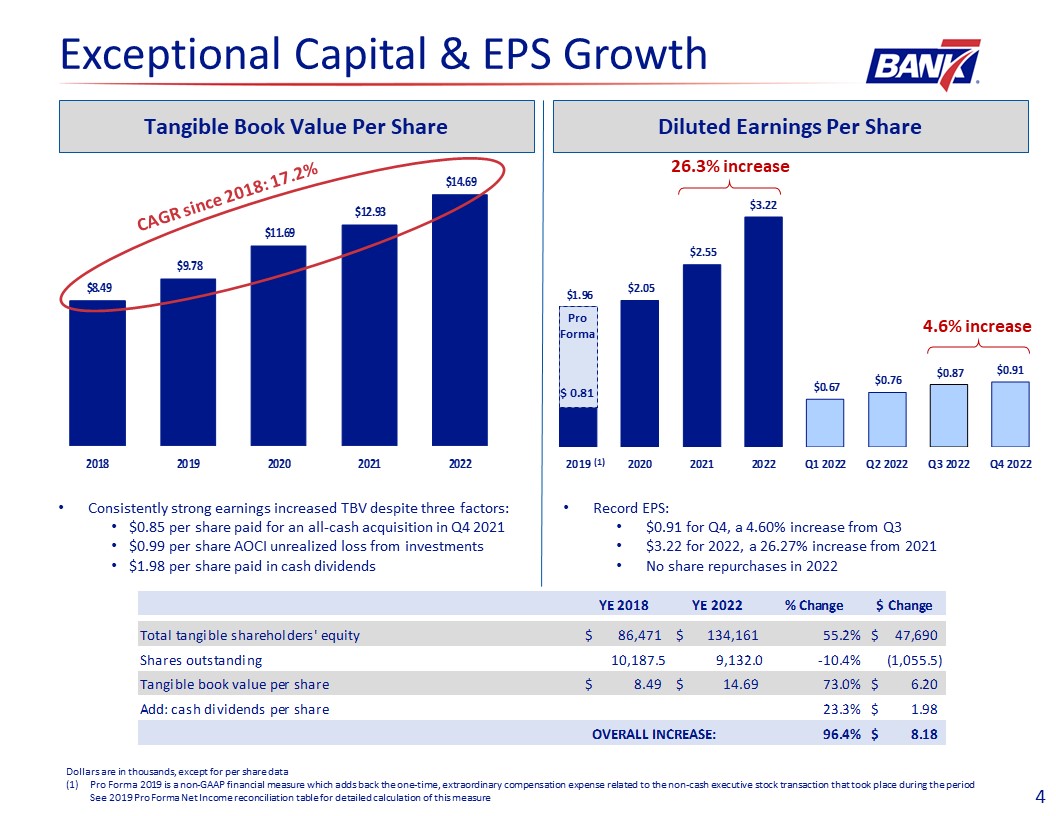
Earnings per share of $3.22 compared to $2.55, an increase of 26.27%
|
|
|
- |
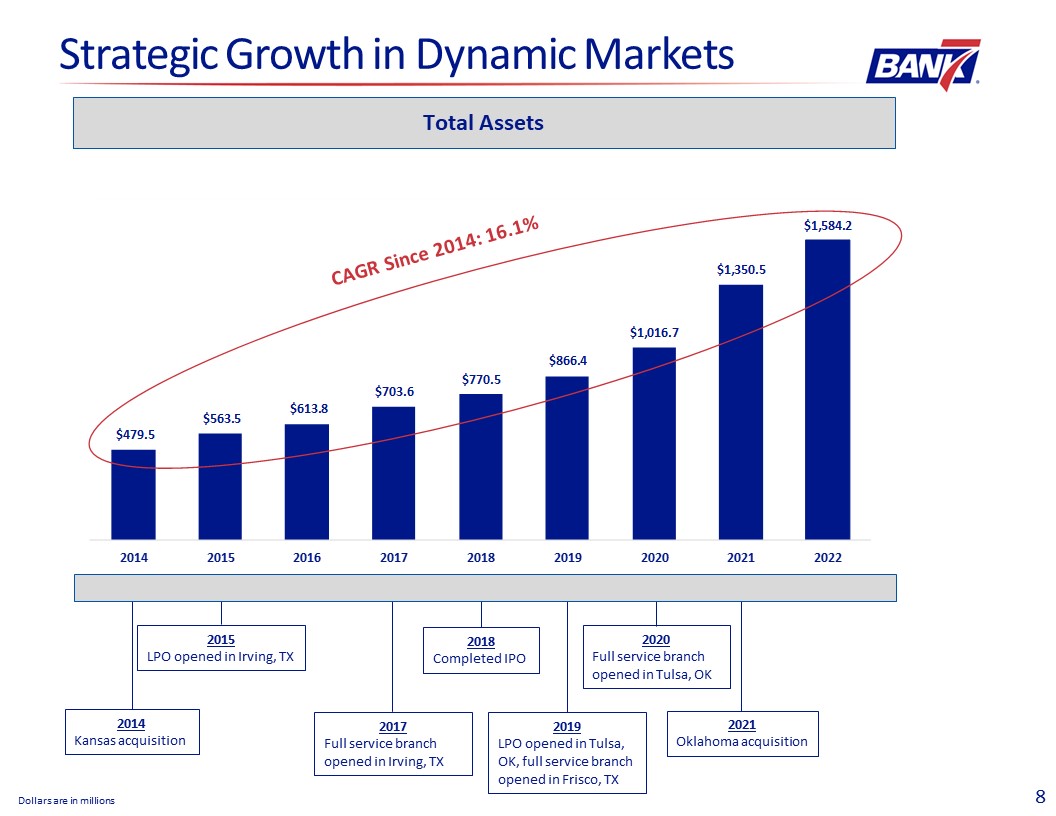
Total assets of $1.6 billion compared to $1.4 billion, an increase of 17.30%
|
|
|
- |
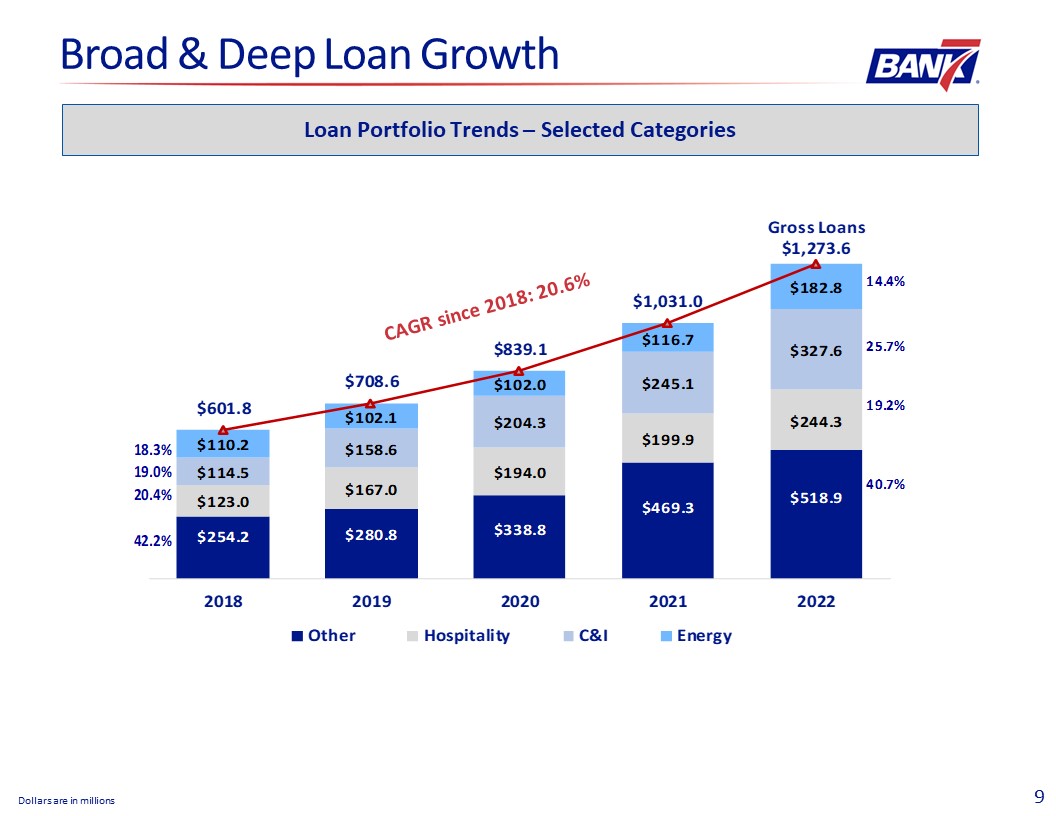
Total loans of $1.3 billion compared to $1.0 billion, an increase of 23.54%
|
|
|
- |
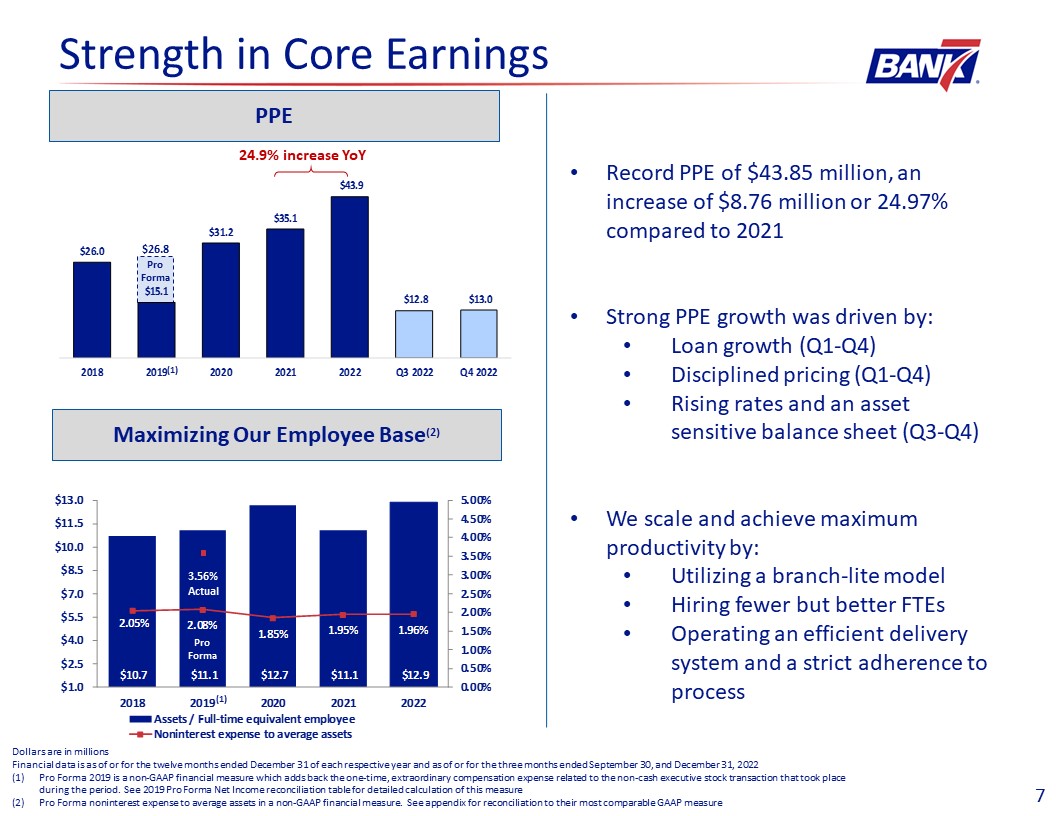
PPE of $43.9 million compared to $35.1 million, an increase of 24.97%
|
|
|
- |
Total interest income of $78.7 million compared to $56.3 million, an increase of 39.90%
|
|
|
- |
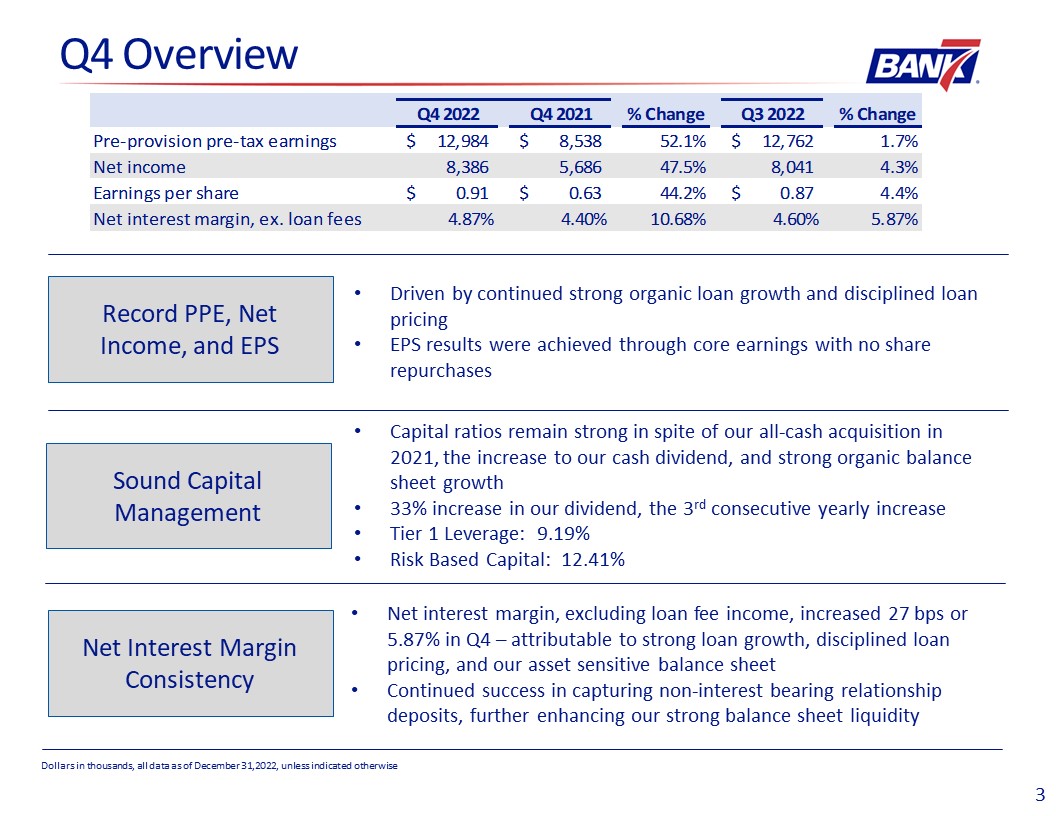
Net income of $8.4 million compared to $8.0 million, an increase of 4.29%
|
|
|
- |
Earnings per share of $0.91 compared to $0.87, an increase of 4.60%
|
|
|
- |
PPE of $13.0 million compared to $12.8 million, an increase of 1.74%
|
|
|
- |
Total interest income of $25.5 million compared to $21.7 million, an increase of 17.39%
|
|
Assets
|
December 31,
2022
(unaudited)
|
December 31,
2021
|
||||||
|
|
||||||||
|
Cash and due from banks
|
$
|
109,115
|
$
|
195,359
|
||||
|
Federal funds sold
|
-
|
9,493
|
||||||
|
Cash and cash equivalents
|
109,115
|
204,852
|
||||||
|
Interest-bearing time deposits in other banks
|
5,474
|
3,237
|
||||||
|
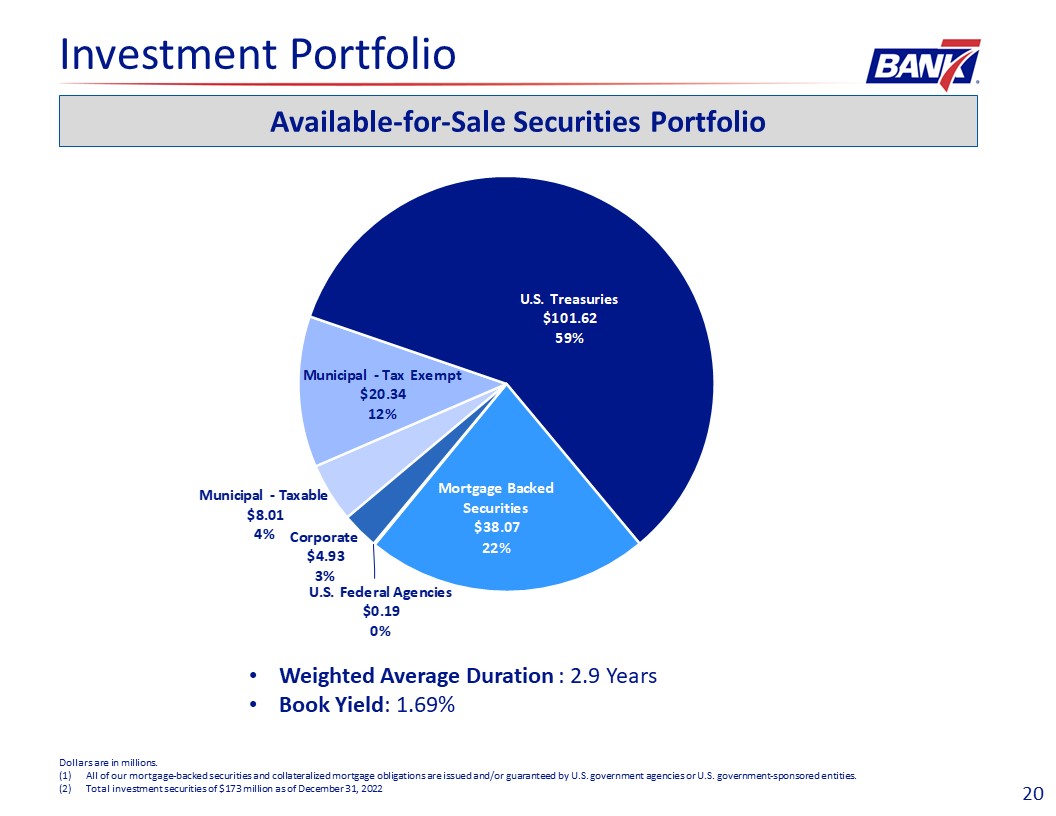
Available-for-sale debt securities
|
173,165
|
84,808
|
||||||
|
Loans, net of allowance for loan losses of $14,734 and $10,316 at December 31, 2022
and December 31, 2021, respectively
|
1,255,722
|
1,018,085
|
||||||
|
Loans held for sale, at fair value
|
-
|
464
|
||||||
|
Premises and equipment, net
|
13,106
|
17,257
|
||||||
|
Nonmarketable equity securities
|
1,209
|
1,202
|
||||||
|
Core deposit intangibles
|
1,336
|
1,643
|
||||||
|
Goodwill
|
8,603
|
8,479
|
||||||
|
Interest receivable and other assets
|
16,439
|
10,522
|
||||||
|
|
||||||||
|
Total assets
|
$
|
1,584,169
|
$
|
1,350,549
|
||||
|
Liabilities and Shareholders’ Equity
|
||||||||
|
Deposits
|
||||||||
|
Noninterest-bearing
|
$
|
439,409
|
$
|
366,705
|
||||
|
Interest-bearing
|
989,891
|
850,766
|
||||||
|
Total deposits
|
1,429,300
|
1,217,471
|
||||||
|
|
||||||||
|
Income taxes payable
|
1,054
|
-
|
||||||
|
Interest payable and other liabilities
|
9,715
|
5,670
|
||||||
|
Total liabilities
|
1,440,069
|
1,223,141
|
||||||
|
Shareholders’ equity
|
||||||||
|
|
||||||||
|
Common stock, $0.01 par value; 50,000,000 shares authorized; shares issued and outstanding:
9,131,973 and 9,071,417 at December 31, 2022 and December 31, 2021 respectively |
91
|
91
|
||||||
|
|
||||||||
|
Additional paid-in capital
|
95,263
|
94,024
|
||||||
|
Retained earnings
|
58,049
|
33,149
|
||||||
|
Accumulated other comprehensive income (loss)
|
(9,303
|
)
|
144
|
|||||
|
Total shareholders’ equity
|
144,100
|
127,408
|
||||||
|
|
||||||||
|
Total liabilities and shareholders’ equity
|
$
|
1,584,169
|
$
|
1,350,549
|
||||
|
Three months ended
December 31,
|
Twelve months ended
December 31,
|
|||||||||||||||
|
2022
(unaudited)
|
2021
|
2022
(unaudited)
|
2021
|
|||||||||||||
|
Interest Income
|
||||||||||||||||
|
Loans, including fees
|
$
|
23,806
|
$
|
14,391
|
$
|
74,403
|
$
|
55,768
|
||||||||
|
Interest-bearing time deposits in other banks
|
7
|
28
|
46
|
169
|
||||||||||||
|
Debt securities, taxable
|
688
|
143
|
2,313
|
143
|
||||||||||||
|
Debt securities, tax-exempt
|
87
|
31
|
360
|
31
|
||||||||||||
|
Other interest and dividend income
|
874
|
63
|
1,627
|
178
|
||||||||||||
|
Total interest income
|
25,462
|
14,656
|
78,749
|
56,289
|
||||||||||||
|
Interest Expense
|
||||||||||||||||
|
Deposits
|
5,081
|
677
|
9,322
|
3,053
|
||||||||||||
|
Total interest expense
|
5,081
|
677
|
9,322
|
3,053
|
||||||||||||
|
Net Interest Income
|
20,381
|
13,979
|
69,427
|
53,236
|
||||||||||||
|
Provision for Loan Losses
|
1,625
|
850
|
4,468
|
4,175
|
||||||||||||
|
Net Interest Income After Provision for Loan Losses
|
18,756
|
13,129
|
64,959
|
49,061
|
||||||||||||
|
Noninterest Income
|
||||||||||||||||
|
Secondary market income
|
91
|
182
|
486
|
435
|
||||||||||||
|
Loss on sales and calls of available-for-sale debt securities
|
-
|
-
|
(127
|
)
|
-
|
|||||||||||
|
Service charges on deposit accounts
|
222
|
170
|
900
|
550
|
||||||||||||
|
Other
|
419
|
405
|
1,680
|
1,265
|
||||||||||||
|
Total noninterest income
|
732
|
757
|
2,939
|
2,250
|
||||||||||||
|
Noninterest Expense
|
||||||||||||||||
|
Salaries and employee benefits
|
4,892
|
3,298
|
17,040
|
11,983
|
||||||||||||
|
Furniture and equipment
|
334
|
232
|
1,468
|
883
|
||||||||||||
|
Occupancy
|
593
|
508
|
2,329
|
1,899
|
||||||||||||
|
Data and item processing
|
600
|
380
|
2,068
|
1,237
|
||||||||||||
|
Accounting, marketing and legal fees
|
203
|
353
|
984
|
800
|
||||||||||||
|
Regulatory assessments
|
371
|
140
|
1,344
|
604
|
||||||||||||
|
Advertsing and public relations
|
164
|
101
|
477
|
282
|
||||||||||||
|
Travel, lodging and entertainment
|
147
|
100
|
363
|
409
|
||||||||||||
|
Other
|
825
|
1,086
|
2,568
|
2,300
|
||||||||||||
|
Total noninterest expense
|
8,129
|
6,198
|
28,641
|
20,397
|
||||||||||||
|
Income Before Taxes
|
11,359
|
7,688
|
39,257
|
30,914
|
||||||||||||
|
Income tax expense
|
2,973
|
2,002
|
9,619
|
7,755
|
||||||||||||
|
Net Income
|
$
|
8,386
|
$
|
5,686
|
$
|
29,638
|
$
|
23,159
|
||||||||
|
Earnings per common share - basic
|
$
|
0.92
|
$
|
0.64
|
$
|
3.26
|
$
|
2.56
|
||||||||
|
Earnings per common share - diluted
|
0.91
|
0.63
|
3.22
|
2.55
|
||||||||||||
|
Weighted average common shares outstanding - basic
|
9,118,728
|
9,070,967
|
9,101,523
|
9,056,117
|
||||||||||||
|
Weighted average common shares outstanding - diluted
|
9,232,333
|
9,162,124
|
9,204,716
|
9,091,536
|
||||||||||||
|
Other Comprehensive Income (Loss)
|
||||||||||||||||
|
|
||||||||||||||||
|
Unrealized losses on securities, net of tax benefit of $0 and $0 for the three months ended
December 31, 2022 and 2021, respectively; $2.8 million and $0 for the twelve months ended
December 31, 2022 and 2021, respectively
|
$
|
1,146
|
$
|
144
|
$
|
(9,543
|
)
|
$
|
144
|
|||||||
|
|
||||||||||||||||
|
Reclassification adjustment for realized (gain)loss included in net income, net of tax of $0 and
$0 for the three months ended December 31, 2022 and 2021, respectively; $31 and $0 for the
twelve months ended December 30, 2022 and 2021, respectively
|
-
|
-
|
96
|
-
|
||||||||||||
|
Other comprehensive loss
|
$
|
1,146
|
$
|
144
|
$
|
(9,447
|
)
|
$
|
144
|
|||||||
|
Comprehensive Income (Loss)
|
$
|
9,532
|
$
|
5,830
|
$
|
20,191
|
$
|
23,303
|
||||||||
|
Net Interest Margin
|
||||||||||||||||||||||||
|
For the Twelve Months Ended December 31,
|
||||||||||||||||||||||||
|
2022
(unaudited)
|
2021
|
|||||||||||||||||||||||
|
Average
Balance
|
Interest
Income/
Expense
|
Average
Yield/
Rate
|
Average
Balance
|
Interest
Income/
Expense
|
Average
Yield/
Rate
|
|||||||||||||||||||
|
(Dollars in thousands)
|
||||||||||||||||||||||||
|
Interest-Earning Assets:
|
||||||||||||||||||||||||
|
Short-term investments
|
$
|
129,624
|
$
|
1,673
|
1.29
|
%
|
$
|
126,136
|
$
|
347
|
0.28
|
%
|
||||||||||||
|
Investment securities, taxable
|
145,915
|
2,313
|
1.59
|
4,663
|
143
|
3.07
|
||||||||||||||||||
|
Debt securities, tax exempt
|
21,635
|
360
|
1.66
|
1,852
|
31
|
1.67
|
||||||||||||||||||
|
Loans held for sale
|
586
|
-
|
-
|
318
|
-
|
-
|
||||||||||||||||||
|
Total loans(1)
|
1,143,380
|
74,403
|
6.51
|
905,804
|
55,768
|
6.16
|
||||||||||||||||||
|
Total interest-earning assets
|
1,441,140
|
78,749
|
5.46
|
1,038,773
|
56,289
|
5.42
|
||||||||||||||||||
|
Noninterest-earning assets
|
23,532
|
7,361
|
||||||||||||||||||||||
|
Total assets
|
$
|
1,464,672
|
$
|
1,046,134
|
||||||||||||||||||||
|
Funding sources:
|
||||||||||||||||||||||||
|
Interest-bearing liabilities:
|
||||||||||||||||||||||||
|
Deposits:
|
||||||||||||||||||||||||
|
Transaction accounts
|
$
|
724,617
|
7,842
|
1.08
|
%
|
$
|
430,268
|
1,396
|
0.32
|
%
|
||||||||||||||
|
Time deposits
|
165,735
|
1,480
|
0.89
|
205,437
|
1,657
|
0.81
|
||||||||||||||||||
|
Total interest-bearing deposits
|
890,352
|
9,322
|
1.05
|
635,705
|
3,053
|
0.48
|
||||||||||||||||||
|
Total interest-bearing liabilities
|
890,352
|
9,322
|
1.05
|
635,705
|
3,053
|
0.48
|
||||||||||||||||||
|
Noninterest-bearing liabilities:
|
||||||||||||||||||||||||
|
Noninterest-bearing deposits
|
432,901
|
288,446
|
||||||||||||||||||||||
|
Other noninterest-bearing liabilities
|
7,520
|
4,930
|
||||||||||||||||||||||
|
Total noninterest-bearing liabilities
|
440,421
|
293,376
|
||||||||||||||||||||||
|
Shareholders' equity
|
133,899
|
117,053
|
||||||||||||||||||||||
|
Total liabilities and shareholders' equity
|
$
|
1,464,672
|
$
|
1,046,134
|
||||||||||||||||||||
|
Net interest income
|
$
|
69,427
|
$
|
53,236
|
||||||||||||||||||||
|
Net interest spread
|
4.42
|
%
|
4.94
|
%
|
||||||||||||||||||||
|
Net interest margin
|
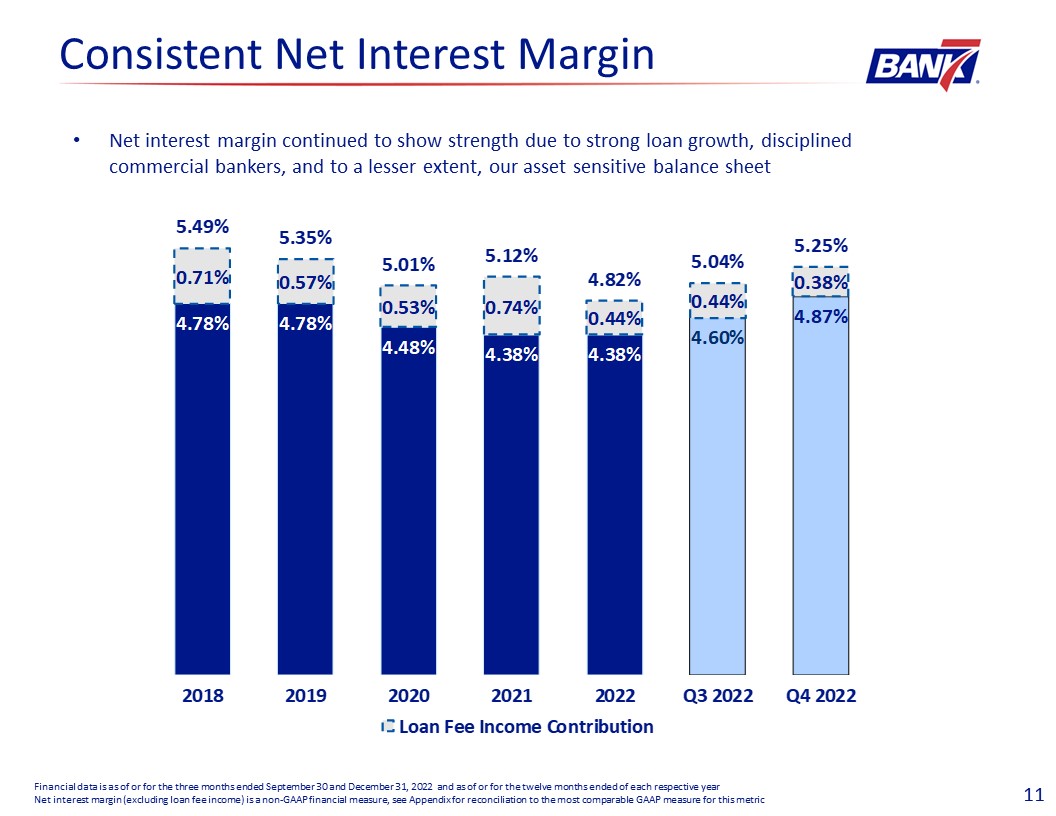
4.82
|
%
|
5.12
|
%
|
||||||||||||||||||||
|
(1)
|
Nonaccrual loans are included in total loans
|
|
|
For the Three Months Ended December 31,
|
|
||||||||||||||||||||||
|
|
2022
(unaudited)
|
|
|
2021
|
|
|||||||||||||||||||
|
|
Average
Balance
|
Interest
Income/
Expense
|
Average
Yield/
Rate
|
|
|
Average
Balance
|
Interest
Income/
Expense
|
Average
Yield/
Rate
|
|
|||||||||||||||
|
(Dollars in thousands)
|
||||||||||||||||||||||||
|
Interest-Earning Assets:
|
||||||||||||||||||||||||
|
Short-term investments
|
$
|
101,427
|
$
|
881
|
3.45
|
%
|
$
|
130,106
|
$
|
91
|
0.23
|
%
|
||||||||||||
|
Debt securities, taxable-equivalent
|
154,869
|
688
|
1.76
|
14,992
|
143
|
3.78
|
||||||||||||||||||
|
Debt securities, tax exempt
|
20,247
|
87
|
1.70
|
7,349
|
31
|
16.67
|
||||||||||||||||||
|
Loans held for sale
|
291
|
-
|
-
|
1,090
|
-
|
-
|
||||||||||||||||||
|
Total loans(1)
|
1,262,864
|
23,806
|
7.48
|
959,243
|
14,391
|
5.95
|
||||||||||||||||||
|
Total interest-earning assets
|
1,539,698
|
25,462
|
6.56
|
1,112,780
|
14,656
|
5.23
|
||||||||||||||||||
|
Noninterest-earning assets
|
21,937
|
11,613
|
||||||||||||||||||||||
|
Total assets
|
$
|
1,561,635
|
$
|
1,124,393
|
||||||||||||||||||||
|
Funding sources:
|
||||||||||||||||||||||||
|
Interest-bearing liabilities:
|
||||||||||||||||||||||||
|
Deposits:
|
||||||||||||||||||||||||
|
Transaction accounts
|
$
|
798,073
|
4,491
|
2.23
|
%
|
$
|
490,739
|
373
|
0.30
|
%
|
||||||||||||||
|
Time deposits
|
157,211
|
590
|
1.49
|
183,867
|
304
|
0.66
|
||||||||||||||||||
|
Total interest-bearing deposits
|
955,284
|
5,081
|
2.11
|
674,606
|
677
|
0.40
|
||||||||||||||||||
|
Total interest-bearing liabilities
|
$
|
955,284
|
5,081
|
2.11
|
$
|
674,606
|
677
|
0.40
|
||||||||||||||||
|
Noninterest-bearing liabilities:
|
||||||||||||||||||||||||
|
Noninterest-bearing deposits
|
$
|
457,753
|
$
|
320,290
|
||||||||||||||||||||
|
Other noninterest-bearing liabilities
|
8,683
|
5,181
|
||||||||||||||||||||||
|
Total noninterest-bearing liabilities
|
466,436
|
325,471
|
||||||||||||||||||||||
|
Shareholders' equity
|
139,915
|
124,316
|
||||||||||||||||||||||
|
Total liabilities and shareholders' equity
|
$
|
1,561,635
|
$
|
1,124,393
|
||||||||||||||||||||
|
Net interest income
|
$
|
20,381
|
$
|
13,979
|
||||||||||||||||||||
|
Net interest spread
|
4.46
|
%
|
4.83
|
%
|
||||||||||||||||||||
|
Net interest margin
|
5.25
|
%
|
4.98
|
%
|
||||||||||||||||||||
|
(1)
|
Nonaccrual loans are included in total loans
|