|
001-11001
|
86-2359749
|
|
|
(Commission File Number)
|
(IRS Employer Identification No.)
|
|
|
401 Merritt 7, Norwalk, Connecticut
|
06851
|
|
|
(Address of principal executive offices)
|
(Zip Code)
|
| ☐ |
Written communications pursuant to Rule 425 under the Securities Act (17 CFR 230.425)
|
| ☐ |
Soliciting material pursuant to Rule 14a-12 under the Exchange Act (17 CFR 240.14a-12)
|
| ☐ |
Pre-commencement communications pursuant to Rule 14d-2(b) under the Exchange Act (17 CFR 240.14d-2(b))
|
| ☐ |
Pre-commencement communications pursuant to Rule 13e-4(c) under the Exchange Act (17 CFR 240.13e-4(c))
|
|
Title of each class
|
Trading Symbol(s)
|
Name of each exchange on which registered
|
||
|
Common Stock, par value $0.01 per share
|
FYBR
|
The NASDAQ Stock Market LLC
|
| Item 2.02 |
Results of Operations and Financial Condition
|
| Item 9.01 |
Financial Statements and Exhibits
|
| (d) |
Exhibits
|
|
Exhibit
Number
|
Description
|
|
|
Press Release
|
||
|
Presentation Regarding Financial Results
|
||
|
104
|
Cover Page Interactive Data File (embedded within the Inline XBRL document)
|
|
FRONTIER COMMUNICATIONS PARENT, INC.
|
||
|
Date: November 2, 2022
|
By:
|
/s/ Scott Beasley
|
|
Scott Beasley
|
||
|
Executive Vice President, Chief Financial Officer
|

|
|
• |
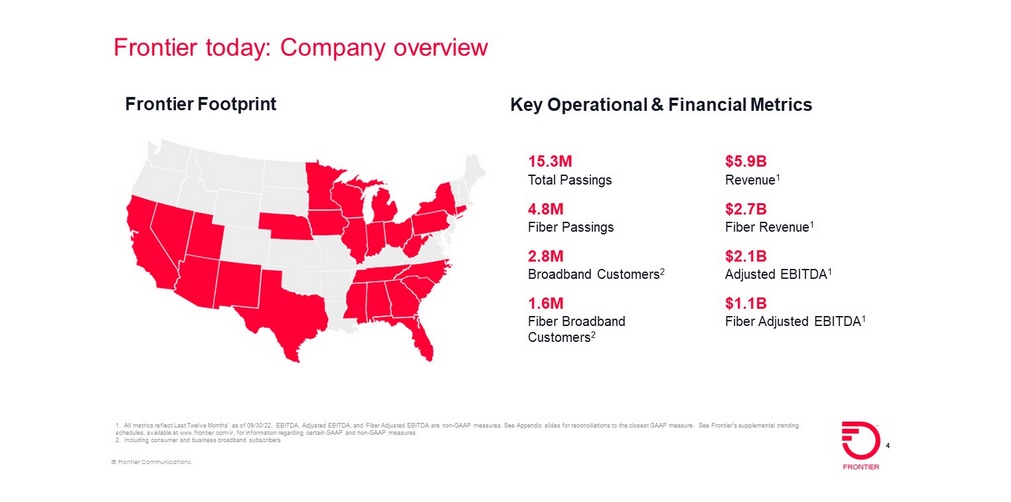
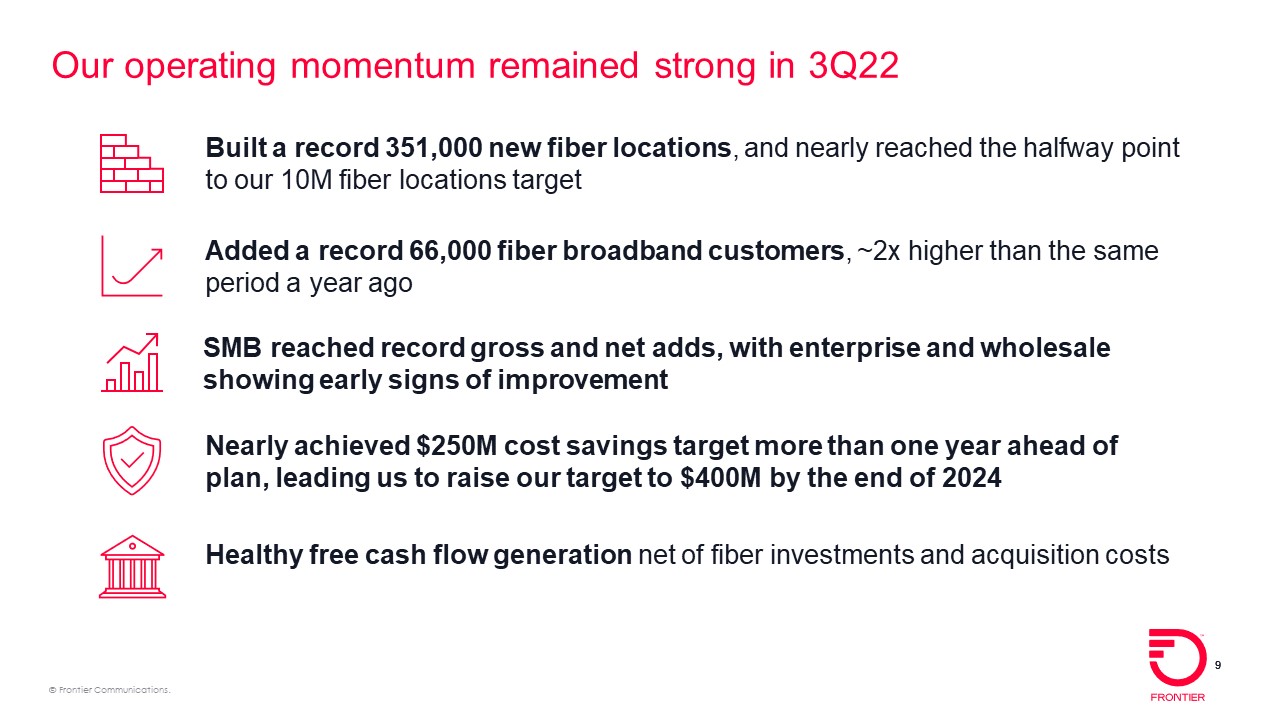
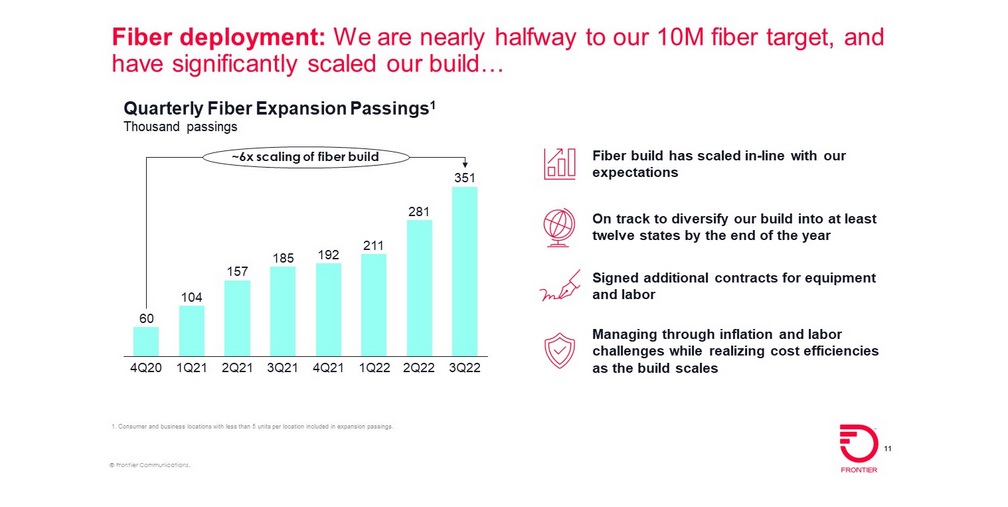
Built fiber to a record 351,000 locations to reach a total of 4.8 million fiber locations, nearly halfway to our target of 10 million fiber locations
|
|
|
• |
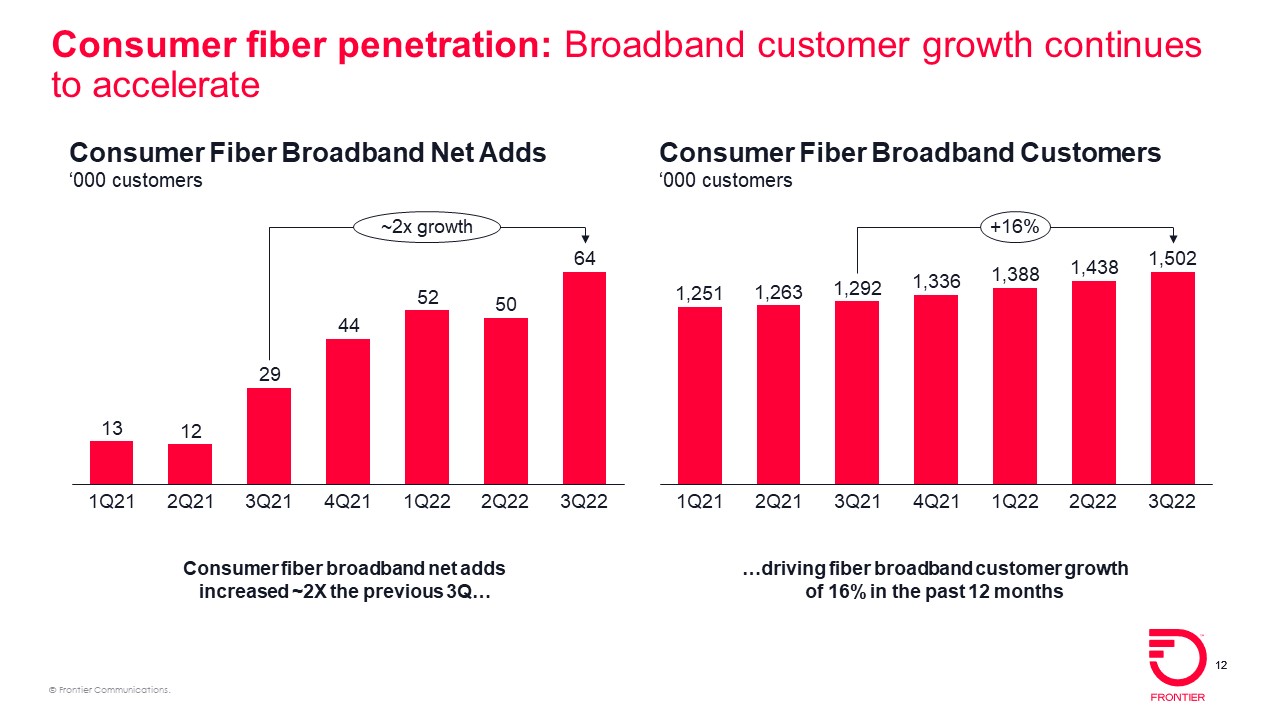
Added a record 66,000 fiber broadband customers, resulting in fiber broadband customer growth of 15.8% compared with the third quarter of 2021
|
|
|
• |
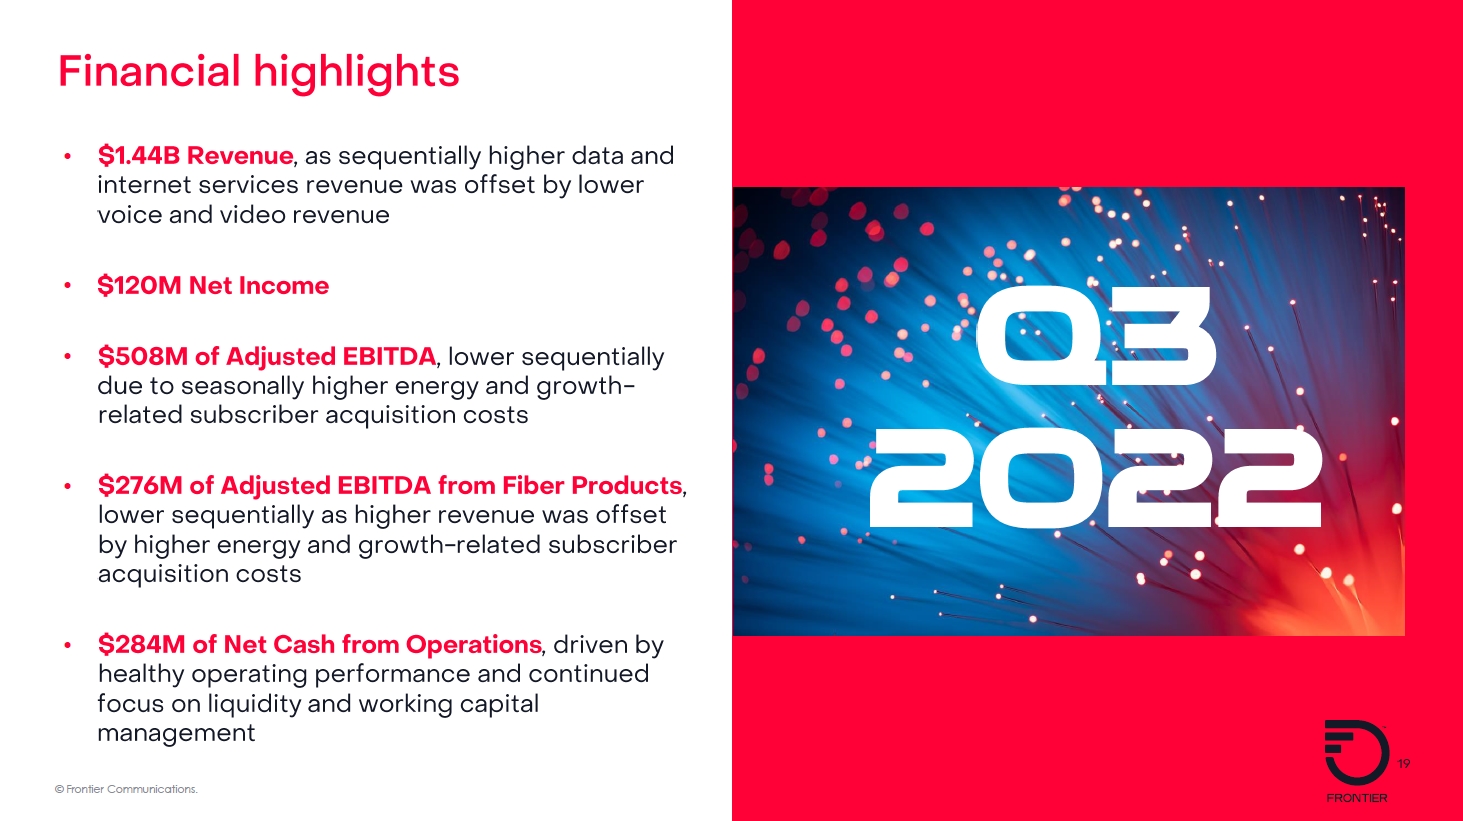
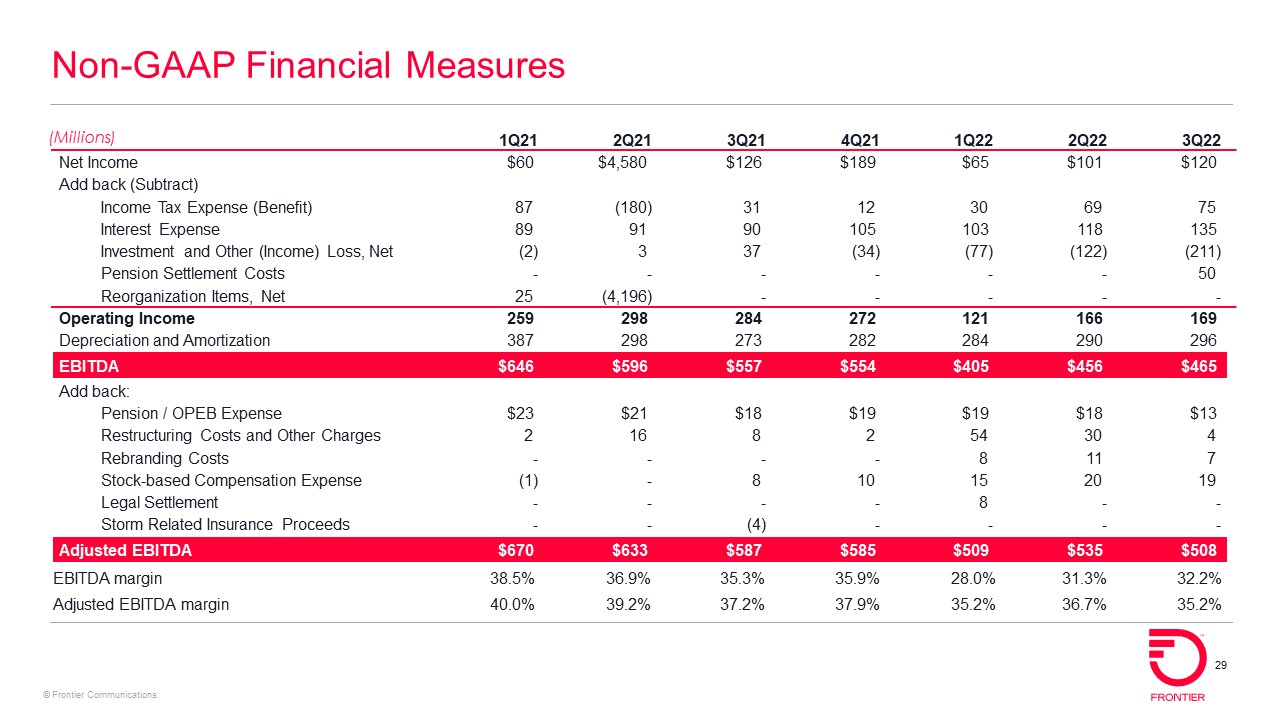
Revenue of $1.44 billion, net income of $120 million, and Adjusted EBITDA of $508 million
|
|
|
• |
Capital expenditures of $772 million, including $18 million of subsidy-related build capital expenditures, $442 million of non-subsidy-related build capital expenditures, and $170 million of
customer-acquisition capital expenditures.
|
|
|
• |
Net cash from operations of $284 million, driven by healthy operating performance and increased focus on working capital management
|
|
|
• |
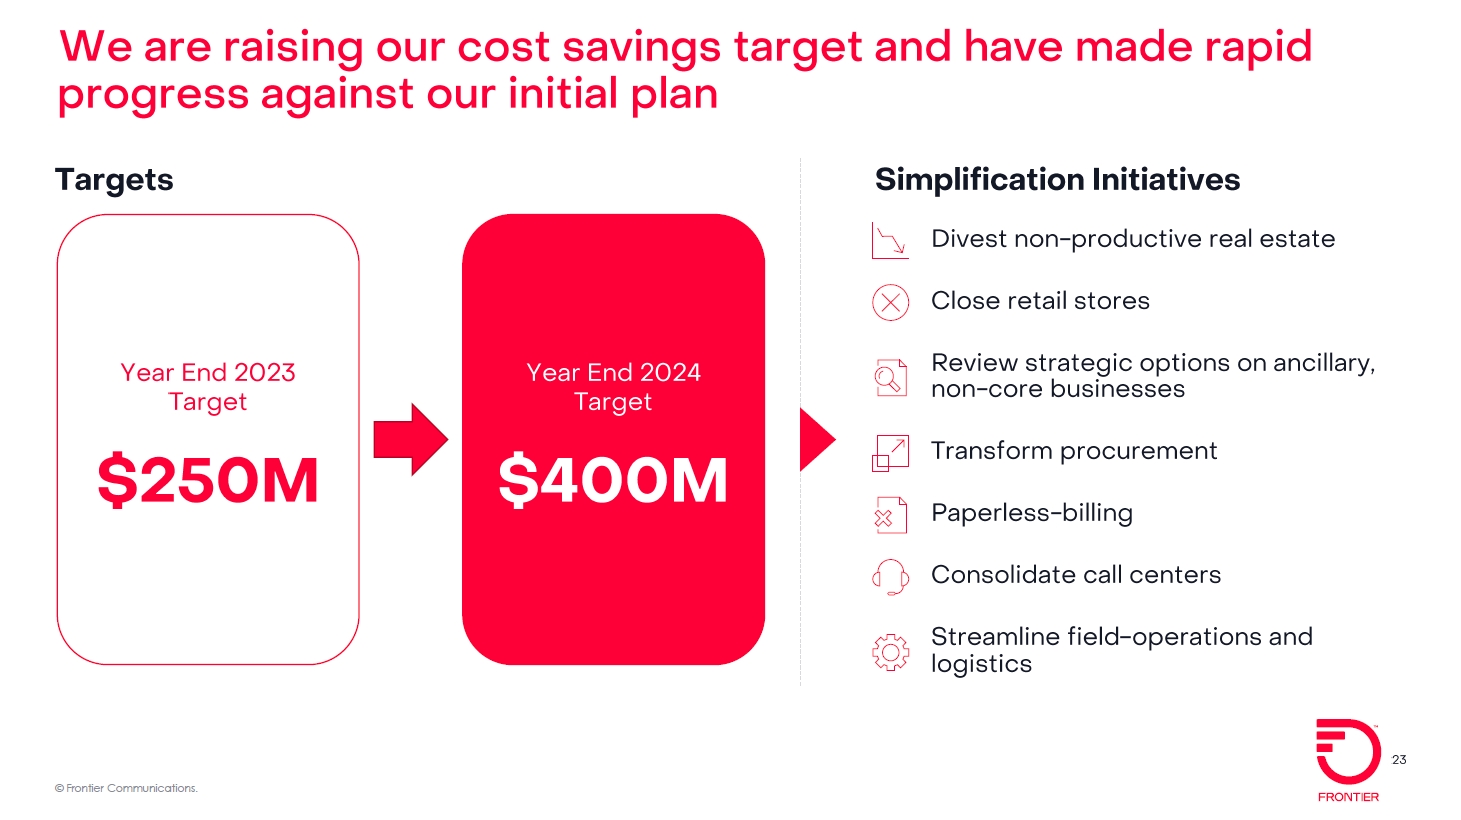
Nearly achieved our $250 million gross annual cost savings target more than one year ahead of plan, enabling us to raise our target to $400 million by the end of 2024
|
|
|
• |
Consolidated revenue growth was particularly impacted by the expiration of CAF II funding at the end of the fourth quarter of 2021
|
|
|
• |
Excluding subsidy-related revenue, consolidated revenue for the quarter ended September 30, 2022, declined 4.5% compared with the quarter ended September 30, 2021, an improvement in the year-over-year rate
of decline reported for the quarter ended June 30, 2022
|
|
|
• |
Consumer revenue of $785 million declined 1.9% from the third quarter of 2021, as strong growth in fiber broadband was offset by declines in legacy video, voice, and other
|
|
|
• |
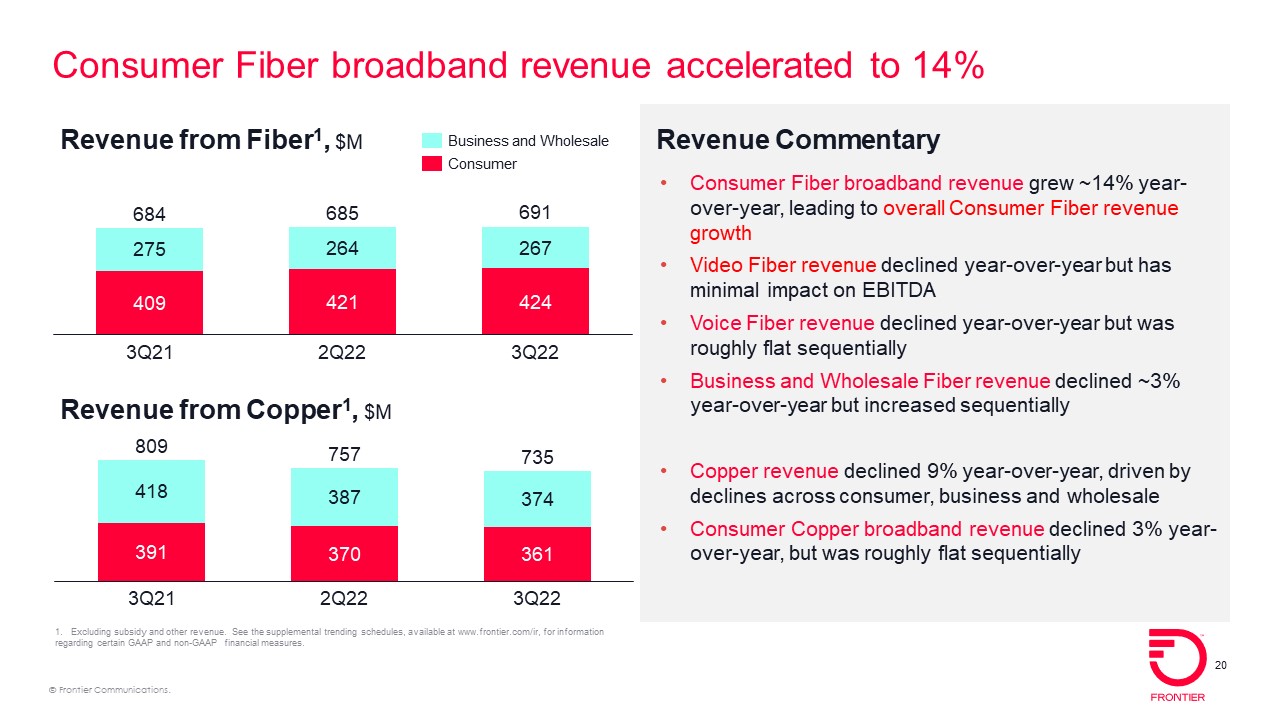
Consumer fiber revenue of $424 million increased 3.6% over the third quarter of 2021, as growth in consumer broadband revenue offset declines in voice, video, and other
|
|
|
• |
Consumer fiber broadband revenue of $278 million increased 14.4% over the third quarter of 2021, driven by growth in fiber broadband customers
|
|
|
• |
Consumer fiber broadband customer net additions of 64,000, a two-fold increase from the third quarter of 2021, resulted in consumer fiber broadband customer growth of 16.3% from the third quarter of 2021
|
|
|
• |
Consumer fiber broadband customer churn of 1.60% increased from 1.56% in the third quarter of 2021, primarily due to higher involuntary disconnects
|
|
|
• |
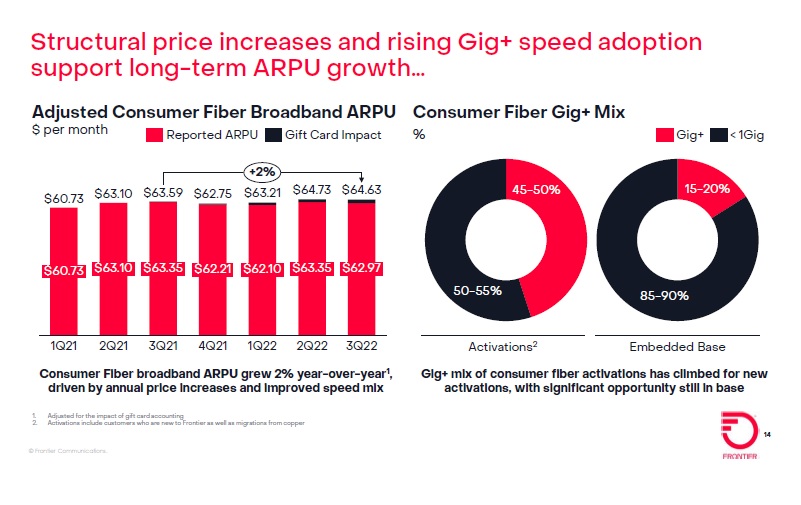
Consumer fiber broadband ARPU of $62.97 declined 0.6% from the third quarter of 2021, as price increases and speed upgrades were offset by the introduction of autopay and gift-card incentives in the
third quarter of 2021. Excluding the impact of gift-card accounting, consumer fiber broadband ARPU increased 1.6% over the third quarter of 2021
|
|
|
• |
Business and wholesale revenue of $641 million declined 7.5% from the third quarter of 2021, primarily due to declines in our copper footprint
|
|
|
• |
Business and wholesale fiber revenue of $267 million increased 1.1% sequentially, but declined 2.9% from the third quarter of 2021
|
|
|
• |
Business fiber broadband customer churn of 1.36% increased from 1.26% in the third quarter of 2021
|
|
|
• |
Business fiber broadband ARPU of $107.28 increased 2.4% from the third quarter of 2021
|
|
|
• |
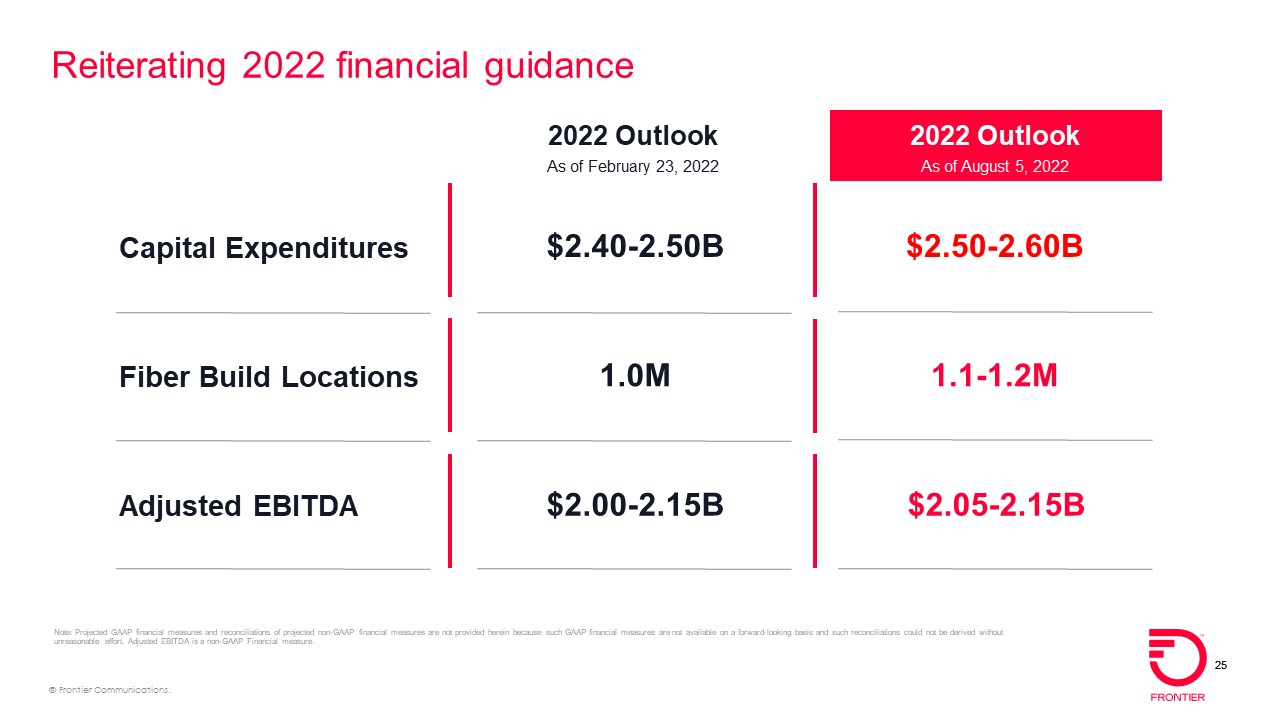
Adjusted EBITDA of $2.05 - $2.15 billion
|
|
|
• |
Fiber build of 1.1 - 1.2 million new locations
|
|
|
• |
Cash capital expenditures of $2.50 - $2.60 billion
|
|
|
• |
Cash taxes of
approximately $20 million
|
|
|
• |
Net cash interest payments of approximately $485 million
|
|
|
• |
Cash pension and OPEB expense of approximately $75 million (net of capitalization)
|
|
|
• |
Cash pension and OPEB contributions, including a catch-up from contribution waivers during bankruptcy, of approximately $135 million
|
|
Investor Contact
|
Media Contact
|
|
Spencer Kurn
|
Chrissy Murray
|
|
SVP, Investor Relations
|
VP, Corporate Communications
|
|
+1 401 225 0475
|
+1 504-952-4225
|
|
spencer.kurn@ftr.com
|
chrissy.murray@ftr.com
|
|
For the
|
For the
|
For the
|
||||||||||
|
three months ended
|
three months ended
|
three months ended
|
||||||||||
|
September 30,
|
June 30,
|
September 30,
|
||||||||||
|
($ in millions and shares in thousands, except per share amounts)
|
2022
|
2022
|
2021
|
|||||||||
|
(Successor)
|
(Successor)
|
(Successor)
|
||||||||||
|
Statements of Income Data
|
||||||||||||
|
Revenue
|
$
|
1,444
|
$
|
1,459
|
$
|
1,576
|
||||||
|
Operating expenses:
|
||||||||||||
|
Cost of service
|
544
|
546
|
590
|
|||||||||
|
Selling, general, and administrative expenses
|
431
|
427
|
421
|
|||||||||
|
Depreciation and amortization
|
296
|
290
|
273
|
|||||||||
|
Restructuring costs and other charges
|
4
|
30
|
8
|
|||||||||
|
Total operating expenses
|
1,275
|
1,293
|
1,292
|
|||||||||
|
Operating income
|
169
|
166
|
284
|
|||||||||
|
Investment and other income (loss), net
|
211
|
122
|
(37
|
)
|
||||||||
|
Pension settlement costs
|
(50
|
)
|
-
|
-
|
||||||||
|
Interest expense
|
(135
|
)
|
(118
|
)
|
(90
|
)
|
||||||
|
Income before income taxes
|
195
|
170
|
157
|
|||||||||
|
Income tax expense
|
75
|
69
|
31
|
|||||||||
|
Net income
|
$
|
120
|
$
|
101
|
$
|
126
|
||||||
|
Weighted average shares outstanding - basic
|
244,984
|
244,723
|
244,403
|
|||||||||
|
Weighted average shares outstanding - diluted
|
245,212
|
244,723
|
245,667
|
|||||||||
|
Basic net earnings per common share
|
$
|
0.49
|
$
|
0.41
|
$
|
0.52
|
||||||
|
Diluted net earnings per common share
|
$
|
0.49
|
$
|
0.41
|
$
|
0.51
|
||||||
|
Other Financial Data:
|
||||||||||||
|
Capital expenditures
|
$
|
772
|
$
|
641
|
$
|
377
|
||||||
|
|
For the nine
|
For the five
|
For the four
|
For the nine
|
||||||||||||
|
|
months ended
|
months ended
|
months ended
|
months ended
|
||||||||||||
|
|
September 30,
|
September 30,
|
April 30,
|
September 30,
|
||||||||||||
|
($ in millions and shares in thousands, except per share amounts)
|
2022
|
2021
|
2021
|
2021
|
||||||||||||
|
|
(Successor)
|
(Successor)
|
(Predecessor)
|
(Non-GAAP Combined)
|
||||||||||||
|
Statement of Operations Data
|
||||||||||||||||
|
Revenue
|
$
|
4,350
|
$
|
2,637
|
$
|
2,231
|
$
|
4,868
|
||||||||
|
|
||||||||||||||||
|
Operating expenses:
|
||||||||||||||||
|
Cost of service
|
1,643
|
986
|
830
|
1,816
|
||||||||||||
|
Selling, general and administrative expenses
|
1,293
|
690
|
537
|
1,227
|
||||||||||||
|
Depreciation and amortization
|
870
|
452
|
506
|
958
|
||||||||||||
|
Restructuring costs and other charges
|
88
|
19
|
7
|
26
|
||||||||||||
|
Total operating expenses
|
3,894
|
2,147
|
1,880
|
4,027
|
||||||||||||
|
|
||||||||||||||||
|
Operating income
|
456
|
490
|
351
|
841
|
||||||||||||
|
|
||||||||||||||||
|
Investment and other income (loss), net
|
410
|
(39
|
)
|
1
|
(38
|
)
|
||||||||||
|
Pension settlement costs
|
(50
|
)
|
-
|
-
|
-
|
|||||||||||
|
Reorganization items, net
|
-
|
-
|
4,171
|
4,171
|
||||||||||||
|
Interest expense
|
(356
|
)
|
(152
|
)
|
(118
|
)
|
(270
|
)
|
||||||||
|
|
||||||||||||||||
|
Income before income taxes
|
460
|
299
|
4,405
|
4,704
|
||||||||||||
|
Income tax expense (benefit)
|
174
|
74
|
(136
|
)
|
(62
|
)
|
||||||||||
|
Net income
|
$
|
286
|
$
|
225
|
$
|
4,541
|
$
|
4,766
|
||||||||
|
|
||||||||||||||||
|
Weighted average shares outstanding - basic
|
244,711
|
244,402
|
104,584
|
NM
|
||||||||||||
|
Weighted average shares outstanding - diluted
|
245,080
|
245,600
|
104,924
|
NM
|
||||||||||||
|
|
||||||||||||||||
|
Basic net earnings per common share
|
$
|
1.17
|
$
|
0.92
|
$
|
43.42
|
NM
|
|||||||||
|
Diluted net earnings per common share
|
$
|
1.17
|
$
|
0.92
|
$
|
43.28
|
NM
|
|||||||||
|
|
||||||||||||||||
|
Other Financial Data:
|
||||||||||||||||
|
Capital expenditures
|
$
|
1,860
|
$
|
646
|
$
|
500
|
$
|
1,146
|
||||||||
|
NM - Not meaningful
|
|
For the three
months ended
|
For the three
months ended
|
For the three
months ended
|
||||||||||
|
September 30,
|
June 30,
|
September 30,
|
||||||||||
|
($ in millions)
|
2022
|
2022
|
2021
|
|||||||||
|
(Successor)
|
(Successor)
|
(Successor)
|
||||||||||
|
Selected Statement of Operations Data
|
||||||||||||
|
Revenue:
|
||||||||||||
|
Data and Internet services
|
$
|
848
|
$
|
847
|
$
|
834
|
||||||
|
Voice services
|
369
|
381
|
411
|
|||||||||
|
Video services
|
127
|
134
|
149
|
|||||||||
|
Other
|
82
|
80
|
99
|
|||||||||
|
Revenue from contracts with customers
|
1,426
|
1,442
|
1,493
|
|||||||||
|
Subsidy and other revenue
|
18
|
17
|
83
|
|||||||||
|
Total revenue
|
$
|
1,444
|
$
|
1,459
|
$
|
1,576
|
||||||
|
Other Financial Data
|
||||||||||||
|
Revenue:
|
||||||||||||
|
Consumer
|
$
|
785
|
$
|
791
|
$
|
800
|
||||||
|
Business and Wholesale
|
641
|
651
|
693
|
|||||||||
|
Revenue from contracts with customers
|
$
|
1,426
|
$
|
1,442
|
$
|
1,493
|
||||||
|
Fiber
|
$
|
691
|
$
|
685
|
$
|
684
|
||||||
|
Copper
|
735
|
757
|
809
|
|||||||||
|
Revenue from contracts with customers
|
$
|
1,426
|
$
|
1,442
|
$
|
1,493
|
||||||
|
For the nine
months ended
|
For the five
months ended
|
For the four
months ended
|
For the nine
months ended
|
|||||||||||||
|
September 30,
|
September 30,
|
April 30,
|
September 30,
|
|||||||||||||
|
($ in millions)
|
2022
|
2021
|
2021
|
2021
|
||||||||||||
|
(Successor)
|
(Successor)
|
(Predecessor)
|
(Non-GAAP Combined)
|
|||||||||||||
|
Selected Statement of Operations Data
|
||||||||||||||||
|
Revenue:
|
||||||||||||||||
|
Data and Internet services
|
$
|
2,531
|
$
|
1,390
|
$
|
1,125
|
$
|
2,515
|
||||||||
|
Voice services
|
1,136
|
694
|
647
|
1,341
|
||||||||||||
|
Video services
|
398
|
254
|
223
|
477
|
||||||||||||
|
Other
|
245
|
161
|
125
|
286
|
||||||||||||
|
Revenue from contracts with customers
|
4,310
|
2,499
|
2,120
|
4,619
|
||||||||||||
|
Subsidy and other revenue
|
40
|
138
|
111
|
249
|
||||||||||||
|
Total revenue
|
$
|
4,350
|
$
|
2,637
|
$
|
2,231
|
$
|
4,868
|
||||||||
|
Other Financial Data
|
||||||||||||||||
|
Revenue:
|
||||||||||||||||
|
Consumer
|
$
|
2,352
|
$
|
1,343
|
$
|
1,133
|
$
|
2,476
|
||||||||
|
Business and Wholesale
|
1,958
|
1,156
|
987
|
2,143
|
||||||||||||
|
Revenue from contracts with customers
|
$
|
4,310
|
$
|
2,499
|
$
|
2,120
|
$
|
4,619
|
||||||||
|
Fiber
|
$
|
2,048
|
$
|
1,139
|
$
|
903
|
$
|
2,042
|
||||||||
|
Copper
|
2,262
|
1,360
|
1,140
|
2,500
|
||||||||||||
|
Other
|
-
|
-
|
77
|
77
|
||||||||||||
|
Revenue from contracts with customers
|
$
|
4,310
|
$
|
2,499
|
$
|
2,120
|
$
|
4,619
|
||||||||
|
As of and for the three months ended
|
For the nine months ended
|
|||||||||||||||||||
|
September 30, 2022
|
June 30, 2022
|
September 30, 2021
|
September 30, 2022
|
September 30, 2021
|
||||||||||||||||
|
Consumer customer metrics
|
||||||||||||||||||||
|
Customers (in thousands)
|
3,142
|
3,159
|
3,173
|
3,142
|
3,173
|
|||||||||||||||
|
Net customer losses
|
(17
|
)
|
(10
|
)
|
(23
|
)
|
(23
|
)
|
(92
|
)
|
||||||||||
|
Average monthly consumer
|
||||||||||||||||||||
|
revenue per customer
|
$
|
83.05
|
$
|
83.35
|
$
|
83.77
|
$
|
82.68
|
$
|
85.49
|
||||||||||
|
Customer monthly churn
|
1.76
|
%
|
1.53
|
%
|
1.64
|
%
|
1.55
|
%
|
1.54
|
%
|
||||||||||
|
Broadband customer metrics
|
||||||||||||||||||||
|
Broadband customers (in thousands)
|
2,831
|
2,827
|
2,789
|
2,831
|
2,789
|
|||||||||||||||
|
Net customer additions (losses)
|
4
|
8
|
(9
|
)
|
32
|
(44
|
)
|
|||||||||||||
|
Employees
|
14,746
|
15,074
|
15,803
|
14,746
|
15,803
|
|||||||||||||||
|
(Unaudited)
|
||||||||
|
($ in millions)
|
September 30, 2022
|
December 31, 2021
|
||||||
|
ASSETS
|
||||||||
|
Current assets:
|
||||||||
|
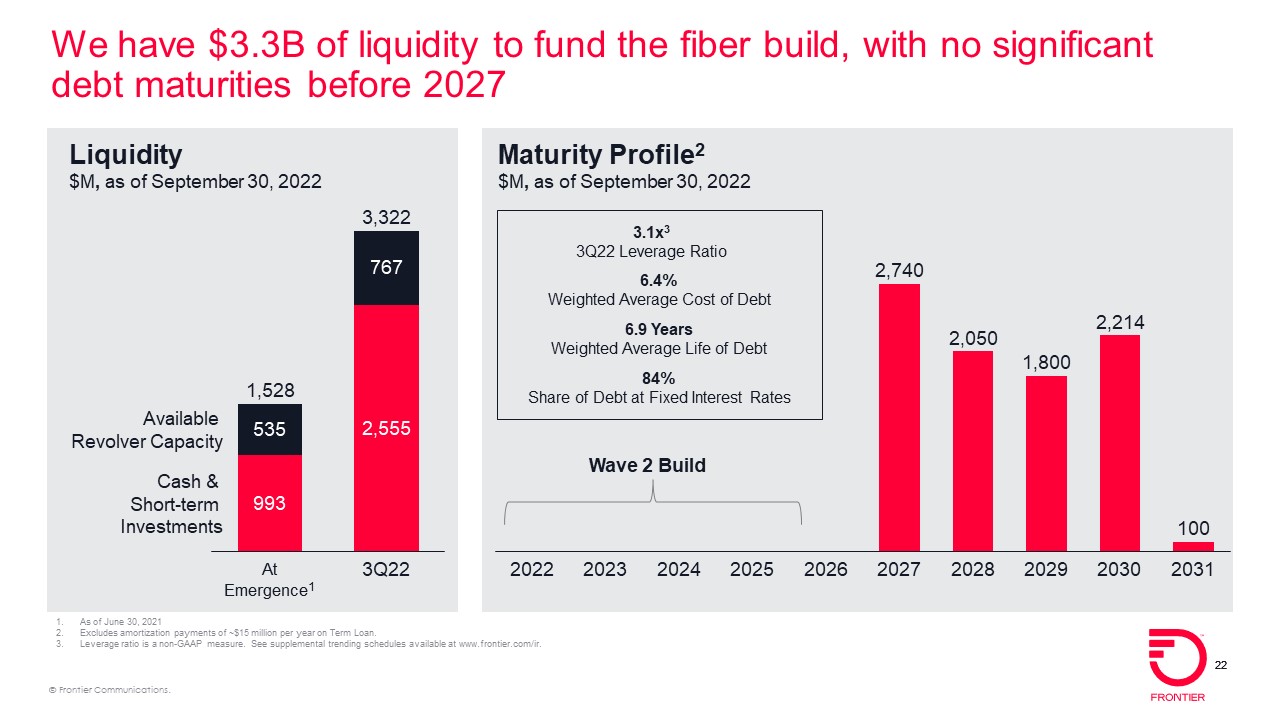
Cash and cash equivalents
|
$
|
230
|
$
|
2,127
|
||||
|
Short-term investments
|
2,325
|
-
|
||||||
|
Accounts receivable, net
|
422
|
458
|
||||||
|
Other current assets
|
101
|
103
|
||||||
|
Total current assets
|
3,078
|
2,688
|
||||||
|
Property, plant and equipment, net
|
10,847
|
9,199
|
||||||
|
Other assets
|
4,348
|
4,594
|
||||||
|
Total assets
|
$
|
18,273
|
$
|
16,481
|
||||
|
LIABILITIES AND EQUITY
|
||||||||
|
Current liabilities:
|
||||||||
|
Long-term debt due within one year
|
$
|
15
|
$
|
15
|
||||
|
Accounts payable and other current liabilities
|
1,962
|
1,436
|
||||||
|
Total current liabilities
|
1,977
|
1,451
|
||||||
|
Deferred income taxes and other liabilities
|
2,243
|
2,462
|
||||||
|
Long-term debt
|
9,120
|
7,968
|
||||||
|
Equity
|
4,933
|
4,600
|
||||||
|
Total liabilities and equity
|
$
|
18,273
|
$
|
16,481
|
||||
|
As of
|
||||
|
September 30, 2022
|
||||
|
Leverage Ratio
|
||||
|
Numerator:
|
||||
|
Long-term debt due within one year
|
$
|
15
|
||
|
Long-term debt
|
9,120
|
|||
|
Total debt
|
$
|
9,135
|
||
|
Less: Cash and cash equivalents
|
(230
|
)
|
||
|
Short-term investments
|
(2,325
|
)
|
||
|
Net debt
|
$
|
6,580
|
||
|
Denominator:
|
||||
|
Adjusted EBITDA - last 4 quarters
|
$
|
2,137
|
||
|
Net Leverage Ratio
|
3.1
|
x
|
||
|
For the three
|
For the three
|
|||||||
|
months ended
|
months ended
|
|||||||
|
September 30, 2022
|
September 30, 2021
|
|||||||
|
($ in millions)
|
(Successor)
|
(Successor)
|
||||||
|
Cash flows provided from (used by) operating activities:
|
||||||||
|
Net income
|
$
|
120
|
$
|
126
|
||||
|
Adjustments to reconcile net loss to net cash provided from
|
||||||||
|
(used by) operating activities:
|
||||||||
|
Depreciation and amortization
|
296
|
273
|
||||||
|
Pension settlement costs
|
50
|
-
|
||||||
|
Stock-based compensation
|
19
|
8
|
||||||
|
Other adjustments
|
(7
|
)
|
(6
|
)
|
||||
|
Bad debt expense
|
5
|
10
|
||||||
|
Deferred income taxes
|
74
|
31
|
||||||
|
Change in accounts receivable
|
(8
|
)
|
43
|
|||||
|
Change in pension and other postretirement liabilities
|
(285
|
)
|
60
|
|||||
|
Change in accounts payable and other liabilities
|
17
|
38
|
||||||
|
Change in prepaid expenses, income taxes, and other assets
|
3
|
20
|
||||||
|
Net cash provided from operating activities
|
284
|
603
|
||||||
|
Cash flows used by investing activities:
|
||||||||
|
Capital expenditures
|
(772
|
)
|
(377
|
)
|
||||
|
Proceeds on sale of assets
|
3
|
-
|
||||||
|
Purchases of short-term investments (1)
|
(625
|
)
|
-
|
|||||
|
Sale of short-term investments (1)
|
600
|
-
|
||||||
|
Other
|
1
|
1
|
||||||
|
Net cash used by investing activities
|
(793
|
)
|
(376
|
)
|
||||
|
Cash flows provided from (used by) financing activities:
|
||||||||
|
Long-term debt payments
|
(4
|
)
|
(4
|
)
|
||||
|
Finance lease obligation payments
|
(5
|
)
|
(5
|
)
|
||||
|
Proceeds from sale and lease-back transactions
|
70
|
-
|
||||||
|
Other
|
-
|
(1
|
)
|
|||||
|
Net cash provided from (used by) financing activities
|
61
|
(10
|
)
|
|||||
|
Increase (Decrease) in cash, cash equivalents, and restricted cash
|
(448
|
)
|
217
|
|||||
|
Cash, cash equivalents, and restricted cash at the beginning of the period
|
708
|
1,044
|
||||||
|
Cash, cash equivalents, and restricted cash at the end of the period
|
$
|
260
|
$
|
1,261
|
||||
|
Supplemental cash flow information:
|
||||||||
|
Cash paid during the period for:
|
||||||||
|
Interest
|
$
|
88
|
$
|
37
|
||||
|
Income tax payments (refunds), net
|
$
|
(2
|
)
|
$
|
3
|
|||
|
Reorganization items, net
|
$
|
-
|
$
|
-
|
||||
| (1) |
Amounts represent cash movement to/from short-term investments. Given the long-term nature of the fiber build, we have invested cash in short-term investments to improve interest
income while preserving funding flexibility.
|
|
For the nine
|
For the five
|
For the four
|
For the nine
|
|||||||||||||
|
months ended
|
months ended
|
months ended
|
months ended
|
|||||||||||||
|
September 30, 2022
|
September 30, 2021
|
April 30, 2021
|
September 30, 2021
|
|||||||||||||
|
($ in millions)
|
(Successor)
|
(Successor)
|
(Predecessor) (1)
|
(Non-GAAP
Combined)
|
||||||||||||
|
Cash flows provided from (used by) operating activities:
|
||||||||||||||||
|
Net income
|
$
|
286
|
$
|
225
|
$
|
4,541
|
$
|
4,766
|
||||||||
|
Adjustments to reconcile net loss to net cash provided from
|
||||||||||||||||
|
(used by) operating activities:
|
||||||||||||||||
|
Depreciation and amortization
|
870
|
452
|
506
|
958
|
||||||||||||
|
Pension settlement costs
|
50
|
-
|
-
|
-
|
||||||||||||
|
Stock-based compensation
|
54
|
8
|
(1
|
)
|
7
|
|||||||||||
|
Non-cash reorganization items, net
|
-
|
-
|
(5,467
|
)
|
(5,467
|
)
|
||||||||||
|
Lease impairment
|
44
|
-
|
-
|
-
|
||||||||||||
|
Bad debt expense
|
19
|
16
|
-
|
16
|
||||||||||||
|
Other adjustments
|
(20
|
)
|
(11
|
)
|
1
|
(10
|
)
|
|||||||||
|
Deferred income taxes
|
167
|
68
|
(148
|
)
|
(80
|
)
|
||||||||||
|
Change in accounts receivable
|
16
|
49
|
36
|
85
|
||||||||||||
|
Change in pension and other postretirement liabilities
|
(527
|
)
|
60
|
(12
|
)
|
48
|
||||||||||
|
Change in accounts payable and other liabilities
|
94
|
89
|
(156
|
)
|
(67
|
)
|
||||||||||
|
Change in prepaid expenses, income taxes, and other assets
|
(12
|
)
|
27
|
46
|
73
|
|||||||||||
|
Net cash provided from (used by) operating activities
|
1,041
|
983
|
(654
|
)
|
329
|
|||||||||||
|
Cash flows provided from (used by) investing activities:
|
||||||||||||||||
|
Capital expenditures
|
(1,860
|
)
|
(646
|
)
|
(500
|
)
|
(1,146
|
)
|
||||||||
|
Purchases of short-term investments (2)
|
(3,225
|
)
|
-
|
-
|
-
|
|||||||||||
|
Sale of short-term investments (2)
|
900
|
-
|
-
|
-
|
||||||||||||
|
Proceeds on sale of assets
|
4
|
-
|
9
|
9
|
||||||||||||
|
Other
|
3
|
1
|
1
|
2
|
||||||||||||
|
Net cash used by investing activities
|
(4,178
|
)
|
(645
|
)
|
(490
|
)
|
(1,135
|
)
|
||||||||
|
Cash flows provided from (used by) financing activities:
|
||||||||||||||||
|
Long-term debt payments
|
(11
|
)
|
(8
|
)
|
(1
|
)
|
(9
|
)
|
||||||||
|
Proceeds from long-term debt borrowings
|
1,200
|
-
|
225
|
225
|
||||||||||||
|
Financing costs paid
|
(17
|
)
|
-
|
(4
|
)
|
(4
|
)
|
|||||||||
|
Finance lease obligation payments
|
(15
|
)
|
(9
|
)
|
(7
|
)
|
(16
|
)
|
||||||||
|
Proceeds from sale and lease-back transactions
|
70
|
-
|
-
|
-
|
||||||||||||
|
Taxes paid on behalf of employees for shares withheld
|
(7
|
)
|
-
|
-
|
-
|
|||||||||||
|
Other
|
(1
|
)
|
-
|
(16
|
)
|
(16
|
)
|
|||||||||
|
Net cash provided from (used by) financing activities
|
1,219
|
(17
|
)
|
197
|
180
|
|||||||||||
|
Increase (Decrease) in cash, cash equivalents, and restricted cash
|
(1,918
|
)
|
321
|
(947
|
)
|
(626
|
)
|
|||||||||
|
Cash, cash equivalents, and restricted cash at the beginning of the period
|
2,178
|
940
|
1,887
|
1,887
|
||||||||||||
|
Cash, cash equivalents, and restricted cash at the end of the period
|
$
|
260
|
$
|
1,261
|
$
|
940
|
$
|
1,261
|
||||||||
|
Supplemental cash flow information:
|
||||||||||||||||
|
Cash paid during the period for:
|
||||||||||||||||
|
Interest
|
$
|
286
|
$
|
121
|
$
|
84
|
$
|
205
|
||||||||
|
Income tax payments, net
|
$
|
7
|
$
|
27
|
$
|
9
|
$
|
36
|
||||||||
|
Reorganization items, net
|
$
|
-
|
$
|
-
|
$
|
1,397
|
$
|
1,397
|
||||||||
| (1) |
Due to change in policy subsequent to bankruptcy, Bad debt expense and other numbers in the Successor and Predecessor periods are not comparable.
|
| (2) |
Amounts represent cash movement to/from short-term investments. Given the long-term nature of the fiber build, we have invested cash in short-term investments to improve interest
income while preserving funding flexibility.
|
|
For the three months ended
|
For the nine months ended
|
|||||||||||||||||||
|
September 30,
|
June 30,
|
September 30,
|
September 30,
|
September 30,
|
||||||||||||||||
|
($ in millions)
|
2022
|
2022
|
2021
|
2022
|
2021
|
|||||||||||||||
|
(Successor)
|
(Successor)
|
(Successor)
|
(Successor)
|
(Non-GAAP Combined)
|
||||||||||||||||
|
Net income
|
$
|
120
|
$
|
101
|
$
|
126
|
$
|
286
|
$
|
4,766
|
||||||||||
|
Add back (subtract):
|
||||||||||||||||||||
|
Income tax expense (benefit)
|
75
|
69
|
31
|
174
|
(62
|
)
|
||||||||||||||
|
Interest expense
|
135
|
118
|
90
|
356
|
270
|
|||||||||||||||
|
Investment and other (income) loss, net
|
(211
|
)
|
(122
|
)
|
37
|
(410
|
)
|
38
|
||||||||||||
|
Pension settlement costs
|
50
|
-
|
-
|
50
|
-
|
|||||||||||||||
|
Reorganization items, net
|
-
|
-
|
-
|
-
|
(4,171
|
)
|
||||||||||||||
|
Operating income
|
169
|
166
|
284
|
456
|
841
|
|||||||||||||||
|
Depreciation and amortization
|
296
|
290
|
273
|
870
|
958
|
|||||||||||||||
|
EBITDA
|
$
|
465
|
$
|
456
|
$
|
557
|
$
|
1,326
|
$
|
1,799
|
||||||||||
|
Add back:
|
||||||||||||||||||||
|
Pension/OPEB expense
|
$
|
13
|
$
|
18
|
$
|
18
|
$
|
50
|
$
|
62
|
||||||||||
|
Restructuring costs and other charges (1)
|
4
|
30
|
8
|
88
|
26
|
|||||||||||||||
|
Rebranding costs
|
7
|
11
|
-
|
26
|
-
|
|||||||||||||||
|
Stock-based compensation
|
19
|
20
|
8
|
54
|
7
|
|||||||||||||||
|
Storm-related insurance proceeds
|
-
|
-
|
(4
|
)
|
-
|
(4
|
)
|
|||||||||||||
|
Legal settlement
|
-
|
-
|
-
|
8
|
-
|
|||||||||||||||
|
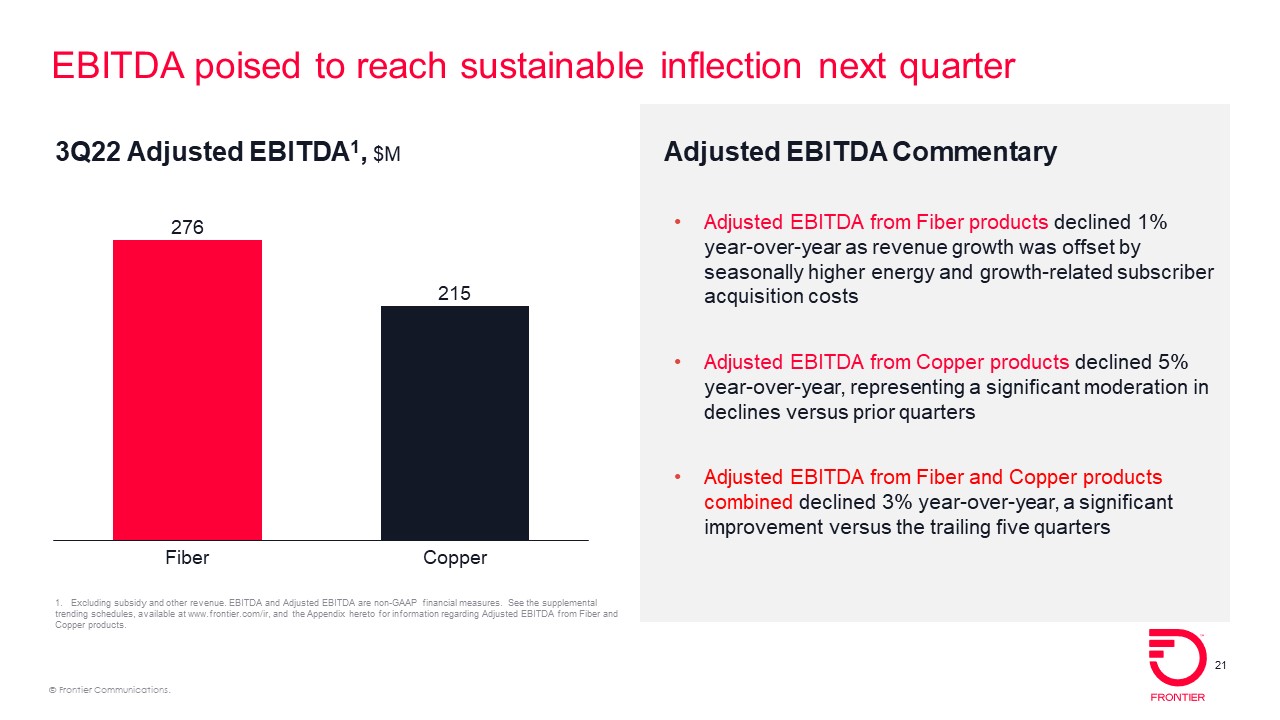
Adjusted EBITDA
|
$
|
508
|
$
|
535
|
$
|
587
|
$
|
1,552
|
$
|
1,890
|
||||||||||
|
EBITDA margin
|
32.2
|
%
|
31.3
|
%
|
35.3
|
%
|
30.5
|
%
|
37.0
|
%
|
||||||||||
|
Adjusted EBITDA margin
|
35.2
|
%
|
36.7
|
%
|
37.2
|
%
|
35.7
|
%
|
38.8
|
%
|
||||||||||
|
Free Cash Flow
|
||||||||||||||||||||
|
Net cash provided from operating activities
|
$
|
284
|
$
|
229
|
$
|
603
|
$
|
1,041
|
$
|
329
|
||||||||||
|
Capital expenditures
|
(772
|
)
|
(641
|
)
|
(377
|
)
|
(1,860
|
)
|
(1,146
|
)
|
||||||||||
|
Operating free cash flow
|
$
|
(488
|
)
|
$
|
(412
|
)
|
$
|
226
|
$
|
(819
|
)
|
$
|
(817
|
)
|
||||||
| (1) |
Includes $44 million of lease impairment charges for the nine months ended September 30, 2022.
|
|
For the three months ended
|
For the nine months ended
|
|||||||||||||||||||
|
September 30,
|
June 30,
|
September 30,
|
September 30,
|
September 30,
|
||||||||||||||||
|
($ in millions)
|
2022
|
2022
|
2021
|
2022
|
2021
|
|||||||||||||||
|
(Successor)
|
(Successor)
|
(Successor)
|
(Successor)
|
(Non-GAAP Combined)
|
||||||||||||||||
|
Adjusted Operating Expenses
|
||||||||||||||||||||
|
Total operating expenses
|
$
|
1,275
|
$
|
1,293
|
$
|
1,292
|
$
|
3,894
|
$
|
4,027
|
||||||||||
|
Subtract:
|
||||||||||||||||||||
|
Depreciation and amortization
|
296
|
290
|
273
|
870
|
958
|
|||||||||||||||
|
Pension/OPEB expense
|
13
|
18
|
18
|
50
|
62
|
|||||||||||||||
|
Restructuring costs and other charges (1)
|
4
|
30
|
8
|
88
|
26
|
|||||||||||||||
|
Rebranding costs
|
7
|
11
|
-
|
26
|
-
|
|||||||||||||||
|
Stock-based compensation
|
19
|
20
|
8
|
54
|
7
|
|||||||||||||||
|
Storm-related insurance proceeds
|
-
|
-
|
(4
|
)
|
-
|
(4
|
)
|
|||||||||||||
|
Legal settlement
|
-
|
-
|
-
|
8
|
-
|
|||||||||||||||
|
Adjusted operating expenses
|
$
|
936
|
$
|
924
|
$
|
989
|
$
|
2,798
|
$
|
2,978
|
||||||||||
| (1) |
Includes $44 million of lease impairment charges for the nine months ended September 30, 2022.
|
|
|
As of or for the quarter ended
|
For the nine months ended
|
|||||||||||||||||||
|
|
September 30, 2022
|
June 30, 2022
|
September 30, 2021
|
September 30, 2022
|
September 30, 2021
|
||||||||||||||||
|
|
(Successor)
|
(Successor)
|
(Successor)
|
(Successor)
|
(Non-GAAP Combined)
|
||||||||||||||||
|
Broadband Revenue ($ in millions)
|
|||||||||||||||||||||
|
Total Company
|
Fiber
|
$
|
312
|
$
|
302
|
$
|
274
|
$
|
900
|
$
|
798
|
||||||||||
|
|
Copper |
195
|
197
|
204
|
587
|
618
|
|||||||||||||||
|
|
Total
|
$
|
507
|
$
|
499
|
$
|
478
|
$
|
1,487
|
$
|
1,416
|
||||||||||
|
|
|||||||||||||||||||||
|
Estimated Fiber
Passings (in millions)
|
|||||||||||||||||||||
|
Base Fiber Passings
|
3.2
|
3.2
|
3.2
|
||||||||||||||||||
|
Total Fiber Passings
|
4.8
|
4.4
|
3.8
|
||||||||||||||||||
|
Estimated Broadband Fiber % Penetration
|
|||||||||||||||||||||
|
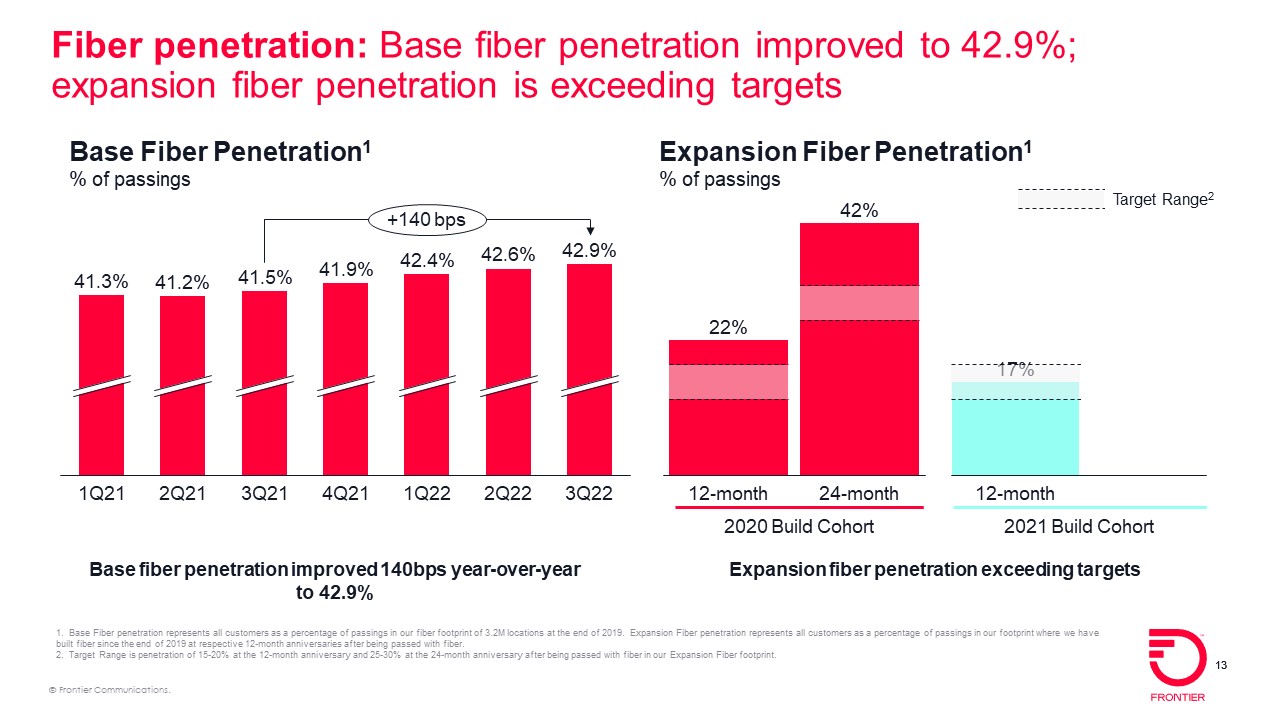
Base Fiber Penetration
|
42.9
|
%
|
42.6
|
%
|
41.5
|
%
|
|||||||||||||||
|
Total Fiber Penetration
|
33.6
|
%
|
34.8
|
%
|
37.0
|
%
|
|||||||||||||||
|
|
|||||||||||||||||||||
|
Broadband Customers,
end of period (in thousands)
|
|||||||||||||||||||||
|
Consumer
|
Fiber
|
1,502
|
1,438
|
1,292
|
|||||||||||||||||
|
|
Copper |
1,105
|
1,163
|
1,264
|
|||||||||||||||||
|
|
Total |
2,607
|
2,601
|
2,556
|
|||||||||||||||||
|
|
|||||||||||||||||||||
|
Business (1)
|
Fiber
|
104
|
102
|
95
|
|||||||||||||||||
|
|
Copper |
120
|
124
|
138
|
|||||||||||||||||
|
|
Total
|
224
|
226
|
233
|
|||||||||||||||||
|
|
|||||||||||||||||||||
|
Broadband Net Adds (in thousands)
|
|||||||||||||||||||||
|
Consumer
|
Fiber
|
64
|
50
|
29
|
|||||||||||||||||
|
|
Copper |
(58
|
)
|
(41
|
)
|
(33
|
)
|
||||||||||||||
|
|
Total |
6
|
9
|
(4
|
)
|
||||||||||||||||
|
|
|||||||||||||||||||||
|
Business (1)
|
Fiber
|
2
|
4
|
-
|
|||||||||||||||||
|
|
Copper |
(4
|
)
|
(5
|
)
|
(4
|
)
|
||||||||||||||
|
|
Total |
(2
|
)
|
(1
|
)
|
(4
|
)
|
||||||||||||||
|
|
|||||||||||||||||||||
|
Broadband Churn
|
|||||||||||||||||||||
|
Consumer
|
Fiber
|
1.60
|
%
|
1.43
|
%
|
1.56
|
%
|
1.41
|
%
|
1.50
|
%
|
||||||||||
|
|
Copper |
2.02
|
%
|
1.73
|
%
|
1.89
|
%
|
1.76
|
%
|
1.73
|
%
|
||||||||||
|
|
Total |
1.79
|
%
|
1.57
|
%
|
1.73
|
%
|
1.57
|
%
|
1.62
|
%
|
||||||||||
|
|
|||||||||||||||||||||
|
Business (1)
|
Fiber
|
1.36
|
%
|
1.28
|
%
|
1.26
|
%
|
1.29
|
%
|
1.27
|
%
|
||||||||||
|
|
Copper |
1.82
|
%
|
1.63
|
%
|
1.62
|
%
|
1.68
|
%
|
1.68
|
%
|
||||||||||
|
|
Total |
1.61
|
%
|
1.48
|
%
|
1.48
|
%
|
1.51
|
%
|
1.52
|
%
|
||||||||||
|
Broadband ARPU
|
|||||||||||||||||||||
|
Consumer
|
Fiber
|
$
|
62.97
|
$
|
63.35
|
$
|
63.35
|
$
|
62.84
|
$
|
62.38
|
||||||||||
|
|
Copper
|
49.65
|
48.47
|
45.44
|
47.93
|
44.47
|
|||||||||||||||
|
|
Total |
$
|
57.17
|
$
|
56.57
|
$
|
54.38
|
$
|
56.04
|
$
|
53.25
|
||||||||||
|
Business (1)
|
Fiber
|
$
|
107.28
|
$
|
107.19
|
$
|
104.76
|
$
|
106.84
|
$
|
103.55
|
||||||||||
|
|
Copper
|
65.26
|
63.00
|
64.03
|
64.41
|
64.65
|
|||||||||||||||
|
|
Total |
$
|
84.49
|
$
|
82.53
|
$
|
80.47
|
$
|
83.16
|
$
|
80.05
|
||||||||||
|
Reconciliation: Broadband ARPU
|
|||||||||||||||||||||
|
Consumer
|
Consumer Fiber Broadband ARPU
|
$
|
62.97
|
$
|
63.35
|
$
|
63.35
|
$
|
62.84
|
$
|
62.38
|
||||||||||
|
|
Gift card impact
|
1.66
|
1.38
|
0.24
|
1.38
|
0.08
|
|||||||||||||||
|
|
Adjusted Consumer Fiber Broadband ARPU
|
$
|
64.63
|
$
|
64.73
|
$
|
63.59
|
$
|
64.22
|
$
|
62.46
|
||||||||||
| (1) |
Business customers include our small, medium business and larger enterprise (SME) customers. Wholesale customers are excluded.
|