| Wisconsin |
001-07626
|
39-0561070 |
|
(State or other jurisdiction of incorporation)
|
(Commission File Number)
|
(IRS Employer Identification No.)
|
| ☐ |
Written communications pursuant to Rule 425 under the Securities Act (17 CFR 230.425)
|
| ☐ |
Soliciting material pursuant to Rule 14a-12 under the Exchange Act (17 CFR 240.14a-12)
|
| ☐ |
Pre-commencement communications pursuant to Rule 14d-2(b) under the Exchange Act (17 CFR 240.14d-2(b))
|
| ☐ |
Pre-commencement communications pursuant to Rule 13e-4(c) under the Exchange Act (17 CFR 240.13e-4(c))
|
|
Title of each class
|
Trading Symbol(s)
|
Name of each exchange on which registered
|
| Common stock, par value $0.10 per share |
SXT |
New York Stock Exchange |
| Item 2.02 |
Results of Operations and Financial Condition.
|
| Item 7.01 |
Regulation FD Disclosure.
|
| Item 9.01 |
Financial Statements and Exhibits.
|
|
(d)
|
Exhibits. The following exhibits are furnished with this Current Report
on Form 8-K:
|
|
Exhibit
Number
|
Description
|
|
Sensient Technologies Corporation Earnings Press Release for the Quarter Ended September 30, 2022.
|
|
|
Sensient Technologies Corporation Investor Presentation – Q3 2022.
|
|
|
104
|
Cover Page Interactive Data File (embedded within the Inline XBRL document).
|
|
|
SENSIENT TECHNOLOGIES CORPORATION
|
||
|
By:
|
/s/ John J. Manning
|
||
|
Name:
|
John J. Manning
|
||
|
Title:
|
Senior Vice President, General Counsel, and Secretary
|
||
|
Date:
|
October 21, 2022
|
||
|
Contact:
|
Amy Agallar
|
|
(414) 347-3706
|
|
Sensient Technologies Corporation
|
Page 2 |
|
Earnings Release – Quarter Ended September 30, 2022
October 21, 2022
|
|
|
Reported
|
||||||||
|
Revenue
|
Quarter
|
Year-to-Date
|
||||||
|
Flavors & Extracts
|
3.0
|
%
|
-0.5
|
%
|
||||
|
Color
|
8.8
|
%
|
11.8
|
%
|
||||
|
Asia Pacific
|
5.3
|
%
|
9.5
|
%
|
||||
|
Total Revenue
|
4.9
|
%
|
4.7
|
%
|
||||
|
Adjusted
Local Currency(1)
|
||||||||
|
Revenue
|
Quarter
|
Year-to-Date
|
||||||
|
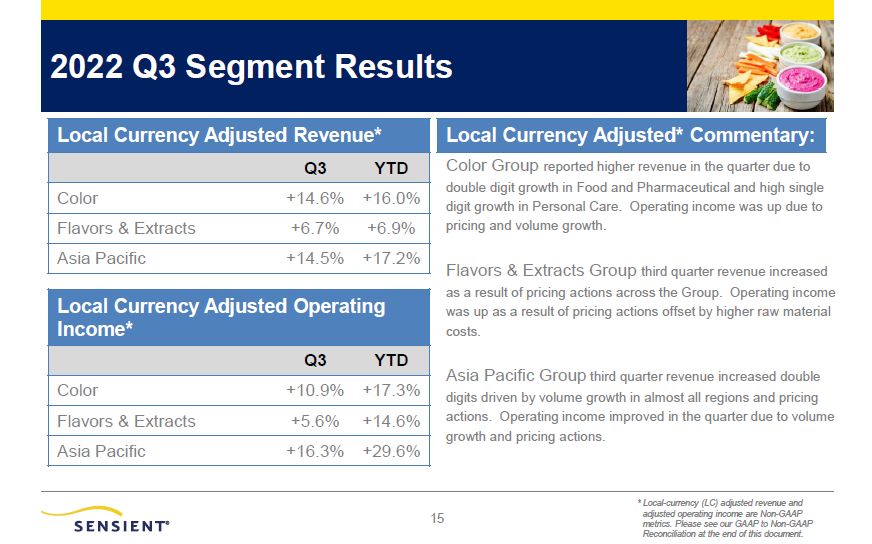
Flavors & Extracts
|
6.7
|
%
|
6.9
|
%
|
||||
|
Color
|
14.6
|
%
|
16.0
|
%
|
||||
|
Asia Pacific
|
14.5
|
%
|
17.2
|
%
|
||||
|
Total Revenue
|
9.9
|
%
|
11.0
|
%
|
||||
|
(1) Adjusted local currency percentage changes are described in more detail in the "Reconciliation of Non-GAAP Amounts" at the end of this release.
|
||||||||
|
Sensient Technologies Corporation
|
Page 3 |
|
Earnings Release – Quarter Ended September 30, 2022
October 21, 2022
|
|
|
Sensient Technologies Corporation
|
Page 4 |
|
Earnings Release – Quarter Ended September 30, 2022
October 21, 2022
|
|
| (2) |
See “Reconciliation of Non-GAAP Amounts” at the end of this release for more information.
|
|
Sensient Technologies Corporation
|
Page 5 |
|
Earnings Release – Quarter Ended September 30, 2022
October 21, 2022
|
|
|
Sensient Technologies Corporation
|
Page 6 |
|
Earnings Release – Quarter Ended September 30, 2022
October 21, 2022
|
|
|
Sensient Technologies Corporation
|
Page 7
|
|
(In thousands, except percentages and per share amounts)
(Unaudited)
|
|
Consolidated Statements of Earnings
|
Three Months Ended September 30,
|
Nine Months Ended September 30,
|
||||||||||||||||||||||
|
2022
|
2021
|
% Change
|
2022
|
2021
|
% Change
|
|||||||||||||||||||
|
Revenue
|
$
|
361,076
|
$
|
344,287
|
4.9
|
%
|
$
|
1,088,303
|
$
|
1,039,816
|
4.7
|
%
|
||||||||||||
|
Cost of products sold
|
239,318
|
229,216
|
4.4
|
%
|
710,696
|
697,538
|
1.9
|
%
|
||||||||||||||||
|
Selling and administrative expenses
|
74,265
|
68,113
|
9.0
|
%
|
222,081
|
212,670
|
4.4
|
%
|
||||||||||||||||
|
Operating income
|
47,493
|
46,958
|
1.1
|
%
|
155,526
|
129,608
|
20.0
|
%
|
||||||||||||||||
|
Interest expense
|
3,672
|
3,037
|
9,748
|
9,792
|
||||||||||||||||||||
|
Earnings before income taxes
|
43,821
|
43,921
|
145,778
|
119,816
|
||||||||||||||||||||
|
Income taxes
|
7,773
|
10,009
|
34,012
|
28,300
|
||||||||||||||||||||
|
Net earnings
|
$
|
36,048
|
$
|
33,912
|
6.3
|
%
|
$
|
111,766
|
$
|
91,516
|
22.1
|
%
|
||||||||||||
|
Earnings per share of common stock:
|
||||||||||||||||||||||||
|
Basic
|
$
|
0.86
|
$
|
0.81
|
$
|
2.67
|
$
|
2.17
|
||||||||||||||||
|
|
||||||||||||||||||||||||
|
Diluted
|
$
|
0.85
|
$
|
0.80
|
$
|
2.65
|
$
|
2.16
|
||||||||||||||||
|
Average common shares outstanding:
|
||||||||||||||||||||||||
|
Basic
|
41,896
|
42,024
|
41,885
|
42,140
|
||||||||||||||||||||
|
|
||||||||||||||||||||||||
|
Diluted
|
42,242
|
42,206
|
42,199
|
42,287
|
||||||||||||||||||||
|
Results by Segment
|
Three Months Ended September 30,
|
Nine Months Ended September 30,
|
||||||||||||||||||||||
|
Revenue
|
2022
|
2021
|
% Change
|
2022
|
2021
|
% Change
|
||||||||||||||||||
|
Flavors & Extracts
|
$
|
187,046
|
$
|
181,667
|
3.0
|
%
|
$
|
559,110
|
$
|
561,979
|
(0.5
|
%)
|
||||||||||||
|
Color
|
151,469
|
139,239
|
8.8
|
%
|
456,175
|
408,166
|
11.8
|
%
|
||||||||||||||||
|
Asia Pacific
|
35,221
|
33,442
|
5.3
|
%
|
109,014
|
99,599
|
9.5
|
%
|
||||||||||||||||
|
Intersegment elimination
|
(12,660
|
)
|
(10,061
|
)
|
(35,996
|
)
|
(29,928
|
)
|
||||||||||||||||
|
Consolidated
|
$
|
361,076
|
$
|
344,287
|
4.9
|
%
|
$
|
1,088,303
|
$
|
1,039,816
|
4.7
|
%
|
||||||||||||
|
Operating Income
|
||||||||||||||||||||||||
|
Flavors & Extracts
|
$
|
26,337
|
$
|
25,164
|
4.7
|
%
|
$
|
83,929
|
$
|
76,718
|
9.4
|
%
|
||||||||||||
|
Color
|
28,200
|
27,253
|
3.5
|
%
|
90,035
|
79,462
|
13.3
|
%
|
||||||||||||||||
|
Asia Pacific
|
6,952
|
6,601
|
5.3
|
%
|
22,877
|
19,146
|
19.5
|
%
|
||||||||||||||||
|
Corporate & Other
|
(13,996
|
)
|
(12,060
|
)
|
(41,315
|
)
|
(45,718
|
)
|
||||||||||||||||
|
Consolidated
|
$
|
47,493
|
$
|
46,958
|
1.1
|
%
|
$
|
155,526
|
$
|
129,608
|
20.0
|
%
|
||||||||||||
|
Sensient Technologies Corporation
|
Page 8
|
|
(In thousands)
(Unaudited)
|
|
Consolidated Condensed Balance Sheets
|
September 30,
2022
|
December 31,
2021
|
||||||
|
Cash and cash equivalents
|
$
|
46,579
|
$
|
25,740
|
||||
|
Trade accounts receivable
|
287,197
|
261,121
|
||||||
|
Inventories
|
501,382
|
411,635
|
||||||
|
Prepaid expenses and other current assets
|
45,582
|
42,657
|
||||||
|
Total Current Assets
|
880,740
|
741,153
|
||||||
|
Goodwill & intangible assets (net)
|
404,840
|
435,009
|
||||||
|
Property, plant, and equipment (net)
|
440,439
|
446,478
|
||||||
|
Other assets
|
113,189
|
122,853
|
||||||
|
Total Assets
|
$
|
1,839,208
|
$
|
1,745,493
|
||||
|
Trade accounts payable
|
$
|
132,904
|
$
|
125,519
|
||||
|
Short-term borrowings
|
21,947
|
8,539
|
||||||
|
Other current liabilities
|
100,574
|
98,247
|
||||||
|
Total Current Liabilities
|
255,425
|
232,305
|
||||||
|
Long-term debt
|
547,190
|
503,006
|
||||||
|
Accrued employee and retiree benefits
|
27,854
|
28,579
|
||||||
|
Other liabilities
|
54,225
|
43,178
|
||||||
|
Shareholders' Equity
|
954,514
|
938,425
|
||||||
|
Total Liabilities and Shareholders' Equity
|
$
|
1,839,208
|
$
|
1,745,493
|
||||
|
Sensient Technologies Corporation
|
Page 9 |
|
(In thousands, except per share amounts)
|
|
|
(Unaudited)
|
|
Consolidated Statements of Cash Flows
|
||||||||
|
Nine Months Ended September 30,
|
||||||||
|
2022
|
2021
|
|||||||
|
Cash flows from operating activities:
|
||||||||
|
Net earnings
|
$
|
111,766
|
$
|
91,516
|
||||
|
Adjustments to arrive at net cash provided by operating activities:
|
||||||||
|
Depreciation and amortization
|
39,262
|
38,828
|
||||||
|
Share-based compensation expense
|
12,476
|
6,431
|
||||||
|
Net loss on assets
|
283
|
203
|
||||||
|
Loss on divestitures and other charges
|
-
|
13,774
|
||||||
|
Deferred income taxes
|
20,465
|
3,793
|
||||||
|
Changes in operating assets and liabilities:
|
||||||||
|
Trade accounts receivable
|
(39,520
|
)
|
(35,290
|
)
|
||||
|
Inventories
|
(112,021
|
)
|
(15,898
|
)
|
||||
|
Prepaid expenses and other assets
|
(39,598
|
)
|
(15,016
|
)
|
||||
|
Trade accounts payable and other accrued expenses
|
24,110
|
24,007
|
||||||
|
Accrued salaries, wages, and withholdings
|
1,819
|
1,763
|
||||||
|
Income taxes
|
(4,342
|
)
|
(1,155
|
)
|
||||
|
Other liabilities
|
198
|
3,192
|
||||||
|
Net cash provided by operating activities
|
14,898
|
116,148
|
||||||
|
Cash flows from investing activities:
|
||||||||
|
Acquisition of property, plant, and equipment
|
(51,703
|
)
|
(37,608
|
)
|
||||
|
Proceeds from sale of assets
|
94
|
201
|
||||||
|
Proceeds from divestiture of businesses
|
-
|
36,790
|
||||||
|
Acquisition of new businesses
|
(1,048
|
)
|
(13,875
|
)
|
||||
|
Other investing activities
|
947
|
1,348
|
||||||
|
Net cash used in investing activities
|
(51,710
|
)
|
(13,144
|
)
|
||||
|
Cash flows from financing activities:
|
||||||||
|
Proceeds from additional borrowings
|
187,715
|
55,589
|
||||||
|
Debt payments
|
(87,657
|
)
|
(67,534
|
)
|
||||
|
Purchase of treasury stock
|
-
|
(31,467
|
)
|
|||||
|
Dividends paid
|
(51,681
|
)
|
(49,468
|
)
|
||||
|
Other financing activities
|
(2,056
|
)
|
(582
|
)
|
||||
|
Net cash provided by (used in) financing activities
|
46,321
|
(93,462
|
)
|
|||||
|
Effect of exchange rate changes on cash and cash equivalents
|
11,330
|
(1,373
|
)
|
|||||
|
Net increase in cash and cash equivalents
|
20,839
|
8,169
|
||||||
|
Cash and cash equivalents at beginning of period
|
25,740
|
24,770
|
||||||
|
Cash and cash equivalents at end of period
|
$
|
46,579
|
$
|
32,939
|
||||
|
Supplemental Information
|
||||||||
|
Nine Months Ended September 30,
|
2022
|
2021
|
||||||
|
Dividends paid per share
|
$
|
1.23
|
$
|
1.17
|
||||
|
Sensient Technologies Corporation
|
Page 10
|
|
(In thousands, except percentages and per share amounts)
|
|
|
(Unaudited)
|
|
|
Three Months Ended September 30,
|
Nine Months Ended September 30,
|
|||||||||||||||||||||||
|
2022
|
2021
|
% Change
|
2022
|
2021
|
% Change
|
|||||||||||||||||||
|
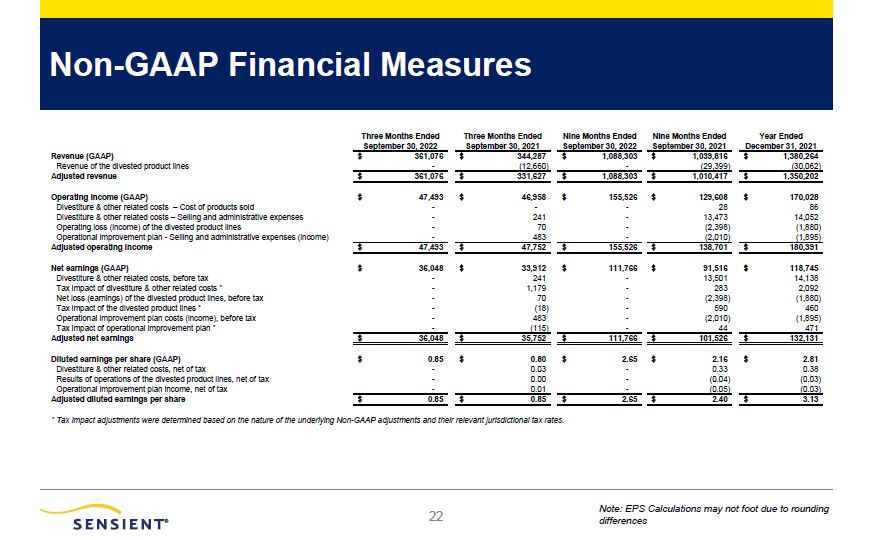
Revenue (GAAP)
|
$
|
361,076
|
$
|
344,287
|
4.9
|
%
|
$
|
1,088,303
|
$
|
1,039,816
|
4.7
|
%
|
||||||||||||
|
Revenue of the divested product lines
|
-
|
(1,622
|
)
|
-
|
(29,399
|
)
|
||||||||||||||||||
|
Adjusted revenue
|
$
|
361,076
|
$
|
342,665
|
5.4
|
%
|
$
|
1,088,303
|
$
|
1,010,417
|
7.7
|
%
|
||||||||||||
|
Operating income (GAAP)
|
$
|
47,493
|
$
|
46,958
|
1.1
|
%
|
$
|
155,526
|
$
|
129,608
|
20.0
|
%
|
||||||||||||
|
Divestiture & other related costs – Cost of products sold
|
-
|
-
|
-
|
28
|
||||||||||||||||||||
|
Divestiture & other related costs – Selling and
administrative expenses
|
-
|
241
|
-
|
13,473
|
||||||||||||||||||||
|
Operating loss (income) of the divested product lines
|
-
|
70
|
-
|
(2,398
|
)
|
|||||||||||||||||||
|
Operational improvement plan - Selling and administrative
expenses (income)
|
-
|
483
|
-
|
(2,010
|
)
|
|||||||||||||||||||
|
Adjusted operating income
|
$
|
47,493
|
$
|
47,752
|
(0.5
|
%)
|
$
|
155,526
|
$
|
138,701
|
12.1
|
%
|
||||||||||||
|
Net earnings (GAAP)
|
$
|
36,048
|
$
|
33,912
|
6.3
|
%
|
$
|
111,766
|
$
|
91,516
|
22.1
|
%
|
||||||||||||
|
Divestiture & other related costs, before tax
|
-
|
241
|
-
|
13,501
|
||||||||||||||||||||
|
Tax impact of divestiture & other related costs(1)
|
-
|
1,179
|
-
|
283
|
||||||||||||||||||||
|
Net loss (earnings) of the divested product lines, before tax
|
-
|
70
|
-
|
(2,398
|
)
|
|||||||||||||||||||
|
Tax impact of the divested product lines(1)
|
-
|
(18
|
)
|
-
|
590
|
|||||||||||||||||||
|
Operational improvement plan costs (income), before tax
|
-
|
483
|
-
|
(2,010
|
)
|
|||||||||||||||||||
|
Tax impact of operational improvement plan(1)
|
-
|
(115
|
)
|
-
|
44
|
|||||||||||||||||||
|
Adjusted net earnings
|
$
|
36,048
|
$
|
35,752
|
0.8
|
%
|
$
|
111,766
|
$
|
101,526
|
10.1
|
%
|
||||||||||||
|
Diluted earnings per share (GAAP)
|
$
|
0.85
|
$
|
0.80
|
6.3
|
%
|
$
|
2.65
|
$
|
2.16
|
22.7
|
%
|
||||||||||||
|
Divestiture & other related costs, net of tax
|
-
|
0.03
|
-
|
0.33
|
||||||||||||||||||||
|
Results of operations of the divested product lines, net of tax
|
-
|
-
|
-
|
(0.04
|
)
|
|||||||||||||||||||
|
Operational improvement plan costs (income), net of tax
|
-
|
0.01
|
-
|
(0.05
|
)
|
|||||||||||||||||||
|
Adjusted diluted earnings per share
|
$
|
0.85
|
$
|
0.85
|
0.0
|
%
|
$
|
2.65
|
$
|
2.40
|
10.4
|
%
|
||||||||||||
|
Sensient Technologies Corporation
|
Page 11
|
|
(In thousands)
|
|
|
(Unaudited)
|
|
|
Results by Segment
|
Three Months Ended September 30,
|
|||||||||||||||||||||||
|
Revenue
|
2022
|
Adjustments(2)
|
Adjusted
2022
|
2021
|
Adjustments(2)
|
Adjusted
2021 |
||||||||||||||||||
|
Flavors & Extracts
|
$
|
187,046
|
$
|
-
|
$
|
187,046
|
$
|
181,667
|
$
|
(1,312
|
)
|
$
|
180,355
|
|||||||||||
|
Color
|
151,469
|
-
|
151,469
|
139,239
|
(310
|
)
|
138,929
|
|||||||||||||||||
|
Asia Pacific
|
35,221
|
-
|
35,221
|
33,442
|
-
|
33,442
|
||||||||||||||||||
|
Intersegment elimination
|
(12,660
|
)
|
-
|
(12,660
|
)
|
(10,061
|
)
|
-
|
(10,061
|
)
|
||||||||||||||
|
Consolidated
|
$
|
361,076
|
$
|
-
|
$
|
361,076
|
$
|
344,287
|
$
|
(1,622
|
)
|
$
|
342,665
|
|||||||||||
|
Operating Income
|
||||||||||||||||||||||||
|
Flavors & Extracts
|
$
|
26,337
|
$
|
-
|
$
|
26,337
|
$
|
25,164
|
$
|
66
|
$
|
25,230
|
||||||||||||
|
Color
|
28,200
|
-
|
28,200
|
27,253
|
4
|
27,257
|
||||||||||||||||||
|
Asia Pacific
|
6,952
|
-
|
6,952
|
6,601
|
-
|
6,601
|
||||||||||||||||||
|
Corporate & Other
|
(13,996
|
)
|
-
|
(13,996
|
)
|
(12,060
|
)
|
724
|
(11,336
|
)
|
||||||||||||||
|
Consolidated
|
$
|
47,493
|
$
|
-
|
$
|
47,493
|
$
|
46,958
|
$
|
794
|
$
|
47,752
|
||||||||||||
|
Results by Segment
|
Nine Months Ended September 30,
|
|||||||||||||||||||||||
|
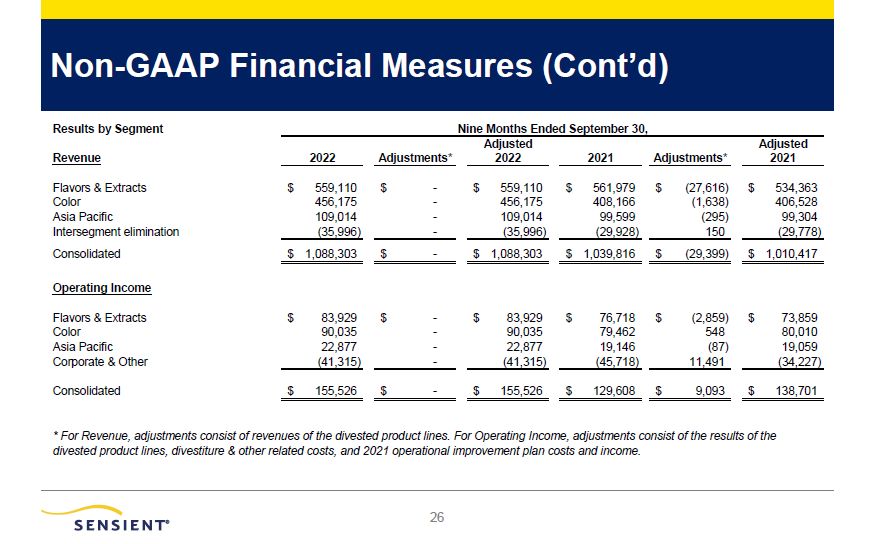
Revenue
|
2022
|
Adjustments(2)
|
Adjusted
2022 |
2021
|
Adjustments(2)
|
Adjusted
2021 |
||||||||||||||||||
|
Flavors & Extracts
|
$
|
559,110
|
$
|
-
|
$
|
559,110
|
$
|
561,979
|
$
|
(27,616
|
)
|
$
|
534,363
|
|||||||||||
|
Color
|
456,175
|
-
|
456,175
|
408,166
|
(1,638
|
)
|
406,528
|
|||||||||||||||||
|
Asia Pacific
|
109,014
|
-
|
109,014
|
99,599
|
(295
|
)
|
99,304
|
|||||||||||||||||
|
Intersegment elimination
|
(35,996
|
)
|
-
|
(35,996
|
)
|
(29,928
|
)
|
150
|
(29,778
|
)
|
||||||||||||||
|
Consolidated
|
$
|
1,088,303
|
$
|
-
|
$
|
1,088,303
|
$
|
1,039,816
|
$
|
(29,399
|
)
|
$
|
1,010,417
|
|||||||||||
|
Operating Income
|
||||||||||||||||||||||||
|
Flavors & Extracts
|
$
|
83,929
|
$
|
-
|
$
|
83,929
|
$
|
76,718
|
$
|
(2,859
|
)
|
$
|
73,859
|
|||||||||||
|
Color
|
90,035
|
-
|
90,035
|
79,462
|
548
|
80,010
|
||||||||||||||||||
|
Asia Pacific
|
22,877
|
-
|
22,877
|
19,146
|
(87
|
)
|
19,059
|
|||||||||||||||||
|
Corporate & Other
|
(41,315
|
)
|
-
|
(41,315
|
)
|
(45,718
|
)
|
11,491
|
(34,227
|
)
|
||||||||||||||
|
Consolidated
|
$
|
155,526
|
$
|
-
|
$
|
155,526
|
$
|
129,608
|
$
|
9,093
|
$
|
138,701
|
||||||||||||
|
Sensient Technologies Corporation
|
Page 12
|
|
(In thousands, except percentages)
|
|
|
(Unaudited)
|
|
|
Three Months Ended September 30,
|
||||||||||||||||
|
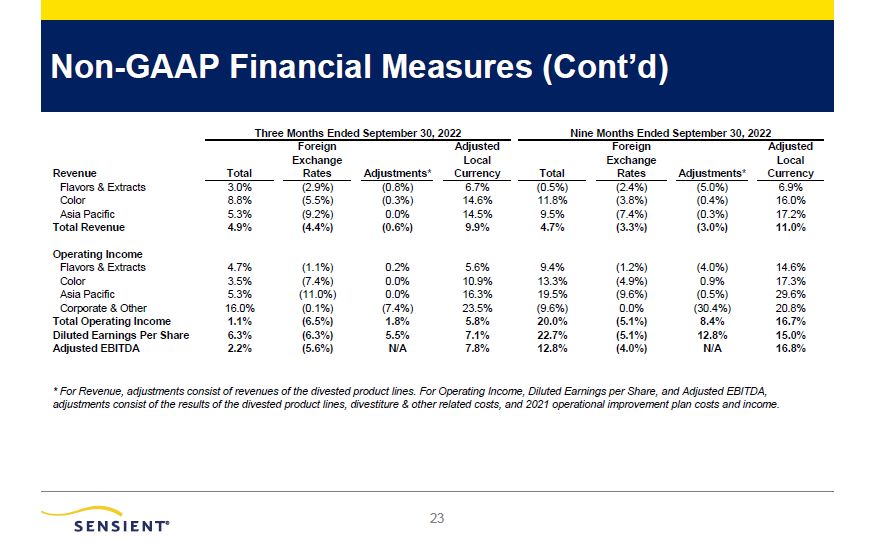
Revenue
|
Total
|
Foreign Exchange Rates
|
Adjustments(3)
|
Adjusted Local Currency
|
||||||||||||
|
Flavors & Extracts
|
3.0
|
%
|
(2.9
|
%)
|
(0.8
|
%)
|
6.7
|
%
|
||||||||
|
Color
|
8.8
|
%
|
(5.5
|
%)
|
(0.3
|
%)
|
14.6
|
%
|
||||||||
|
Asia Pacific
|
5.3
|
%
|
(9.2
|
%)
|
0.0
|
%
|
14.5
|
%
|
||||||||
|
Total Revenue
|
4.9
|
%
|
(4.4
|
%)
|
(0.6
|
%)
|
9.9
|
%
|
||||||||
|
Operating Income
|
||||||||||||||||
|
Flavors & Extracts
|
4.7
|
%
|
(1.1
|
%)
|
0.2
|
%
|
5.6
|
%
|
||||||||
|
Color
|
3.5
|
%
|
(7.4
|
%)
|
0.0
|
%
|
10.9
|
%
|
||||||||
|
Asia Pacific
|
5.3
|
%
|
(11.0
|
%)
|
0.0
|
%
|
16.3
|
%
|
||||||||
|
Corporate & Other
|
16.0
|
%
|
(0.1
|
%)
|
(7.4
|
%)
|
23.5
|
%
|
||||||||
|
Total Operating Income
|
1.1
|
%
|
(6.5
|
%)
|
1.8
|
%
|
5.8
|
%
|
||||||||
|
Diluted Earnings Per Share
|
6.3
|
%
|
(6.3
|
%)
|
5.5
|
%
|
7.1
|
%
|
||||||||
|
Adjusted EBITDA
|
2.2
|
%
|
(5.6
|
%)
|
N/A
|
7.8
|
%
|
|||||||||
|
Nine Months Ended September 30,
|
||||||||||||||||
|
Revenue
|
Total
|
Foreign Exchange Rates
|
Adjustments(3)
|
Adjusted Local Currency
|
||||||||||||
|
Flavors & Extracts
|
(0.5
|
%)
|
(2.4
|
%)
|
(5.0
|
%)
|
6.9
|
%
|
||||||||
|
Color
|
11.8
|
%
|
(3.8
|
%)
|
(0.4
|
%)
|
16.0
|
%
|
||||||||
|
Asia Pacific
|
9.5
|
%
|
(7.4
|
%)
|
(0.3
|
%)
|
17.2
|
%
|
||||||||
|
Total Revenue
|
4.7
|
%
|
(3.3
|
%)
|
(3.0
|
%)
|
11.0
|
%
|
||||||||
|
Operating Income
|
||||||||||||||||
|
Flavors & Extracts
|
9.4
|
%
|
(1.2
|
%)
|
(4.0
|
%)
|
14.6
|
%
|
||||||||
|
Color
|
13.3
|
%
|
(4.9
|
%)
|
0.9
|
%
|
17.3
|
%
|
||||||||
|
Asia Pacific
|
19.5
|
%
|
(9.6
|
%)
|
(0.5
|
%)
|
29.6
|
%
|
||||||||
|
Corporate & Other
|
(9.6
|
%)
|
0.0
|
%
|
(30.4
|
%)
|
20.8
|
%
|
||||||||
|
Total Operating Income
|
20.0
|
%
|
(5.1
|
%)
|
8.4
|
%
|
16.7
|
%
|
||||||||
|
Diluted Earnings Per Share
|
22.7
|
%
|
(5.1
|
%)
|
12.8
|
%
|
15.0
|
%
|
||||||||
|
Adjusted EBITDA
|
12.8
|
%
|
(4.0
|
%)
|
N/A
|
16.8
|
%
|
|||||||||
|
Three Months Ended September 30,
|
Nine Months Ended September 30,
|
|||||||||||||||||||||||
|
2022
|
2021
|
% Change
|
2022
|
2021
|
% Change
|
|||||||||||||||||||
|
Operating income (GAAP)
|
$
|
47,493
|
$
|
46,958
|
1.1
|
%
|
$
|
155,526
|
$
|
129,608
|
20.0
|
%
|
||||||||||||
|
Depreciation and amortization
|
13,082
|
13,011
|
39,262
|
38,828
|
||||||||||||||||||||
|
Depreciation and amortization, divested product lines
|
-
|
(49
|
)
|
-
|
(146
|
)
|
||||||||||||||||||
|
Share-based compensation expense
|
3,785
|
2,243
|
12,476
|
6,431
|
||||||||||||||||||||
|
Divestiture & other related costs, before tax
|
-
|
241
|
-
|
13,501
|
||||||||||||||||||||
|
Results of operations of the divested product lines, before tax
|
-
|
70
|
-
|
(2,398
|
)
|
|||||||||||||||||||
|
Operational improvement plan costs (income), before tax
|
-
|
483
|
-
|
(2,010
|
)
|
|||||||||||||||||||
|
Adjusted EBITDA
|
$
|
64,360
|
$
|
62,957
|
2.2
|
%
|
$
|
207,264
|
$
|
183,814
|
12.8
|
%
|
||||||||||||