株探米国株
英語
エドガーで原本を確認する

UNITED STATES
SECURITIES AND EXCHANGE COMMISSION
Washington, D.C. 20549

FORM 8-K

CURRENT REPORT

PURSUANT TO SECTION 13 OR 15(d) OF THE
SECURITIES EXCHANGE ACT OF 1934

Date of Report (Date of earliest event reported):  September 23, 2022


LEE ENTERPRISES, INCORPORATED
 (Exact name of Registrant as specified in its charter)


Delaware
1-6227
42-0823980
(State of Incorporation)
(Commission File Number)
(I.R.S. Employer Identification No.)

4600 E. 53rd Street, Davenport, IA 52807
(Address of Principal Executive Offices)

(563) 383-2100
Registrant’s telephone number, including area code

Check the appropriate box below if the Form 8-K filing is intended to simultaneously satisfy the filing obligation of the registrant under any of the following provisions:

Written communications pursuant to Rule 425 under the Securities Act (17 CFR 230.425)

Soliciting material pursuant to Rule 14a-12 under the Exchange Act (17 CFR 240.14a-12)

Pre-commencement communications pursuant to Rule 14d-2(b) under the Exchange Act (17 CFR 240.14d-2(b))


Pre-commencement communications pursuant to Rule 13e-4(c) under the Exchange Act (17 CFR 240.13e-4(c))

Securities registered pursuant to Section 12(b) of the Act:

Title of each class
 
Trading Symbol(s)
 
Name of each exchange on which registered
Common Stock, $.01 par value per share
  LEE
 
The Nasdaq Global Select Market
Preferred Stock Purchase Rights
  LEE
 
The Nasdaq Global Select Market

Indicate by check mark whether the Registrant is an emerging growth company as defined in Rule 405 of the Securities Act of 1933 (§230.405 of this chapter) or Rule 12b-2 of the Securities Exchange Act of 1934 (§240.12b-2 of this chapter).
 
Emerging growth company     ☐
 
If an emerging growth company, indicate by check mark if the Registrant has elected not to use the extended transition period for complying with any new or revised financial accounting standards provided pursuant to Section 13(a) of the Exchange Act.   ☐


Item 7.01
Regulation FD Disclosure.

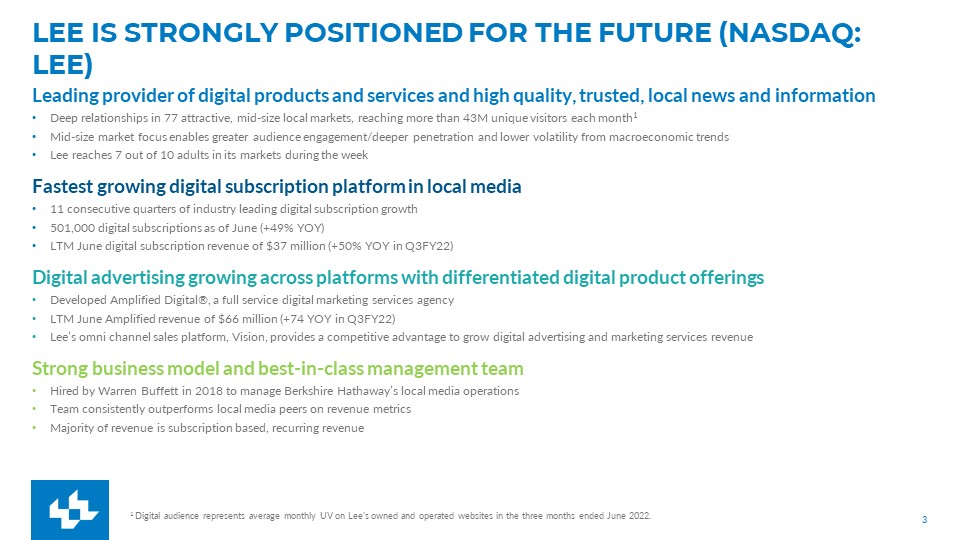
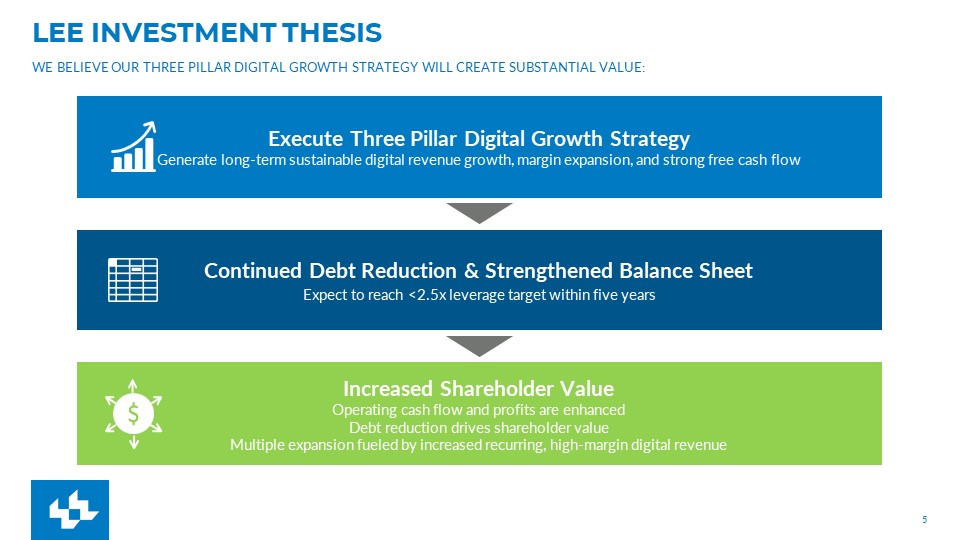
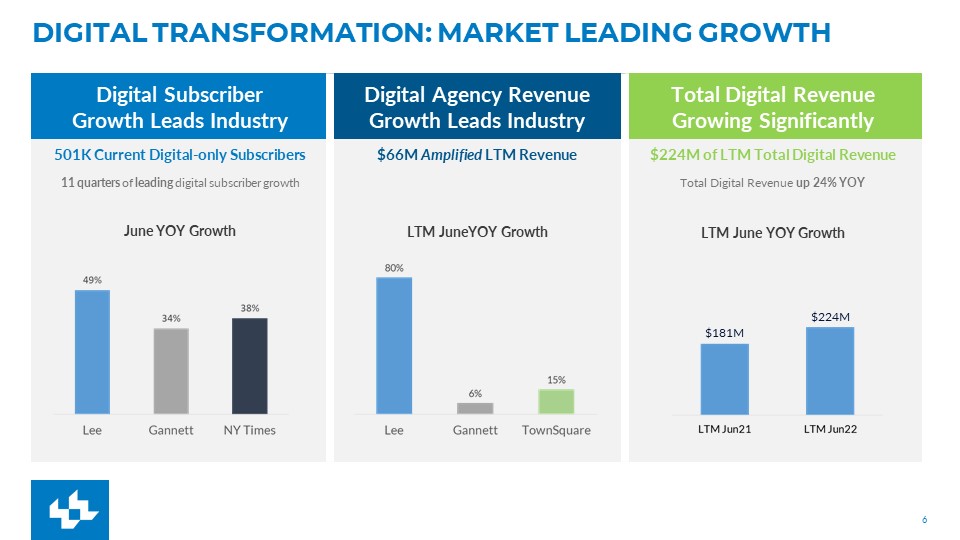
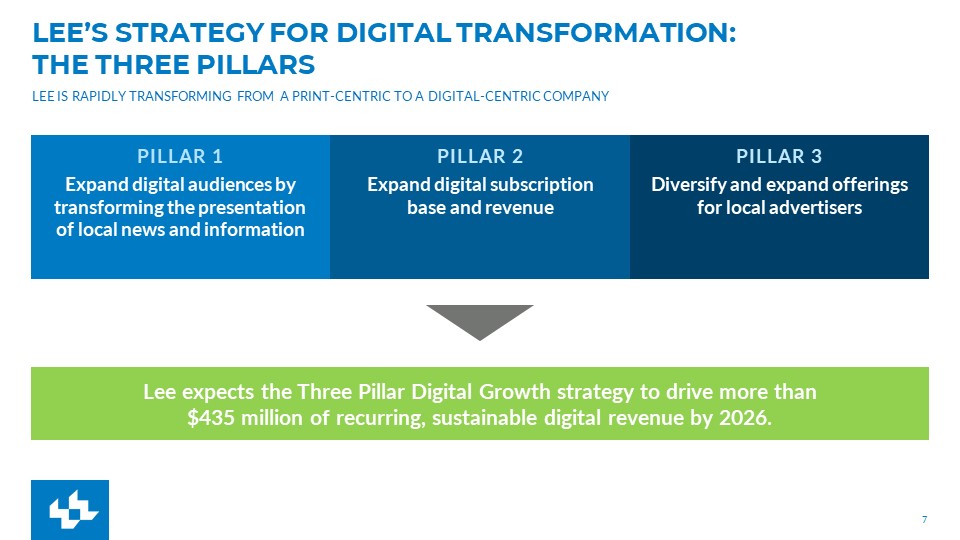
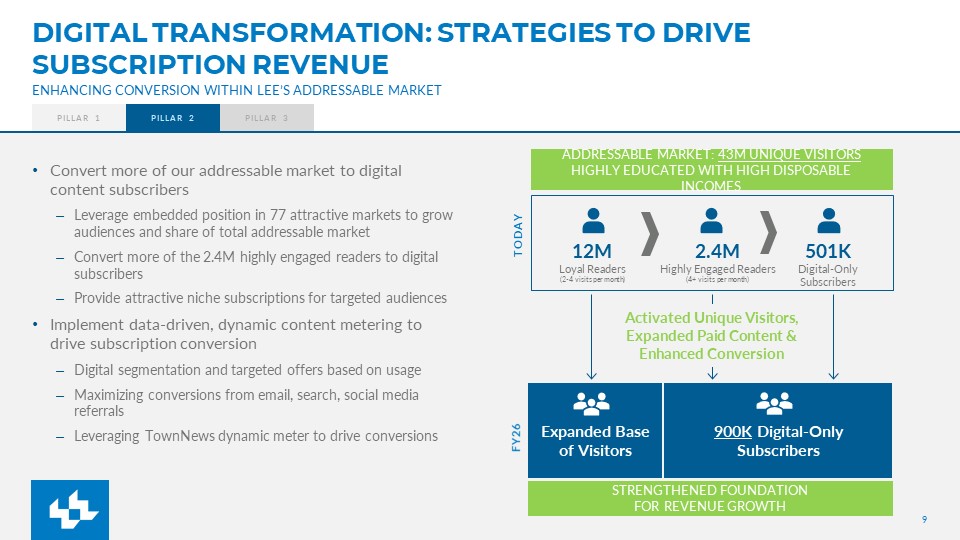
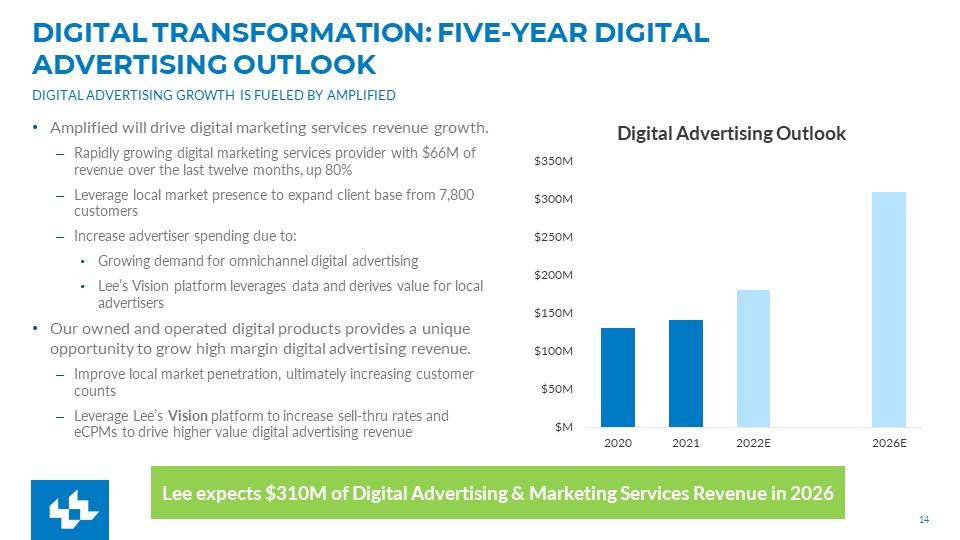
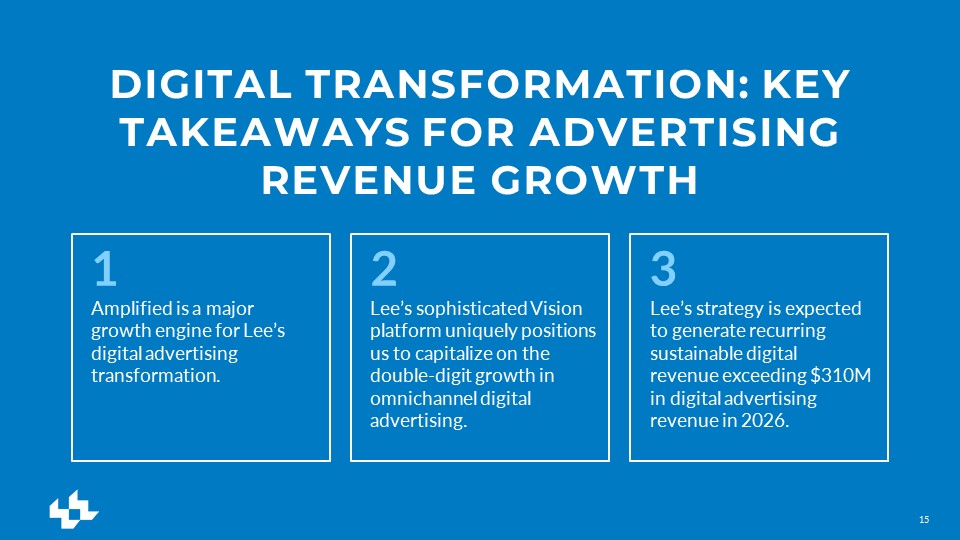
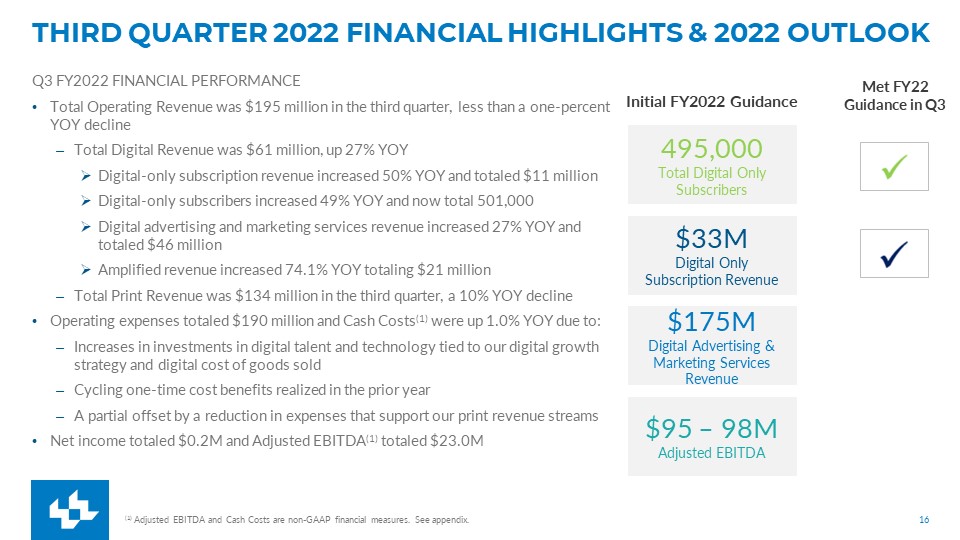
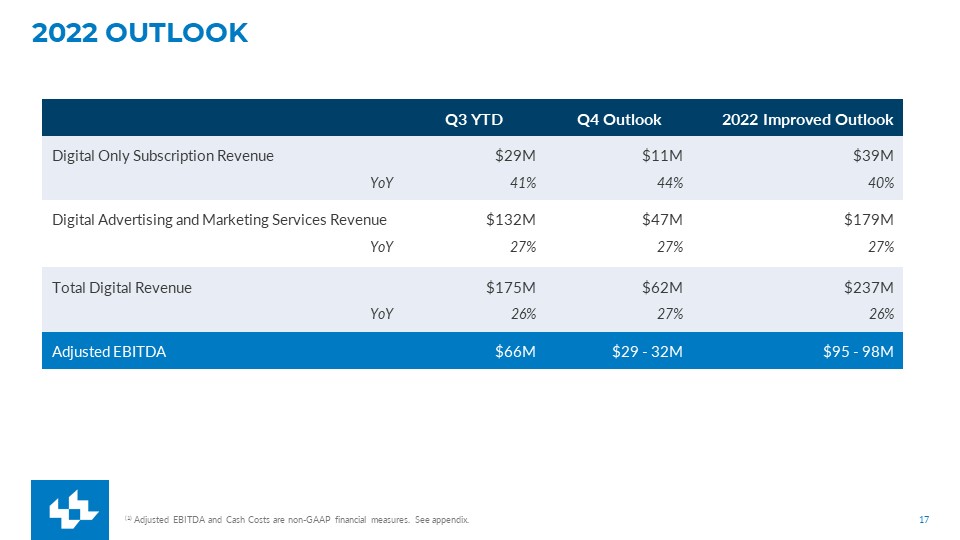
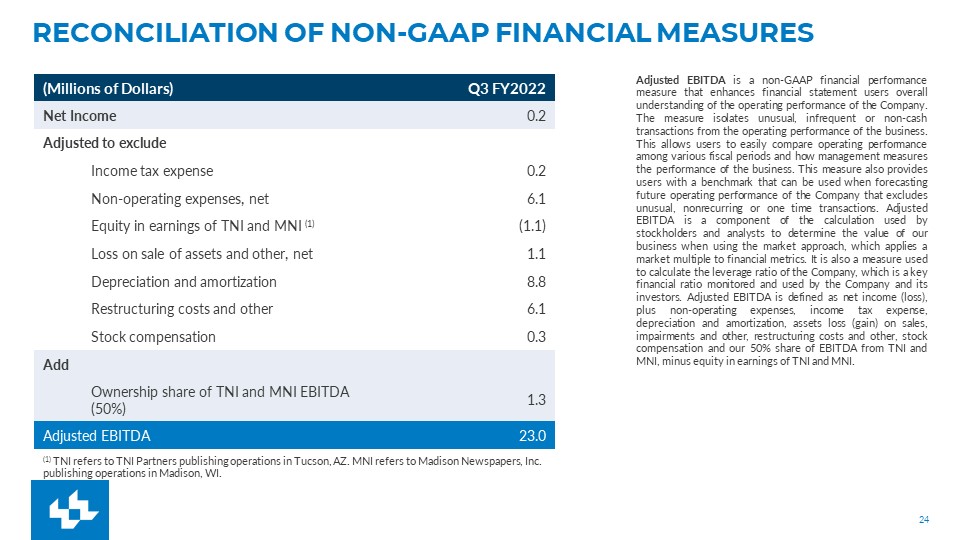
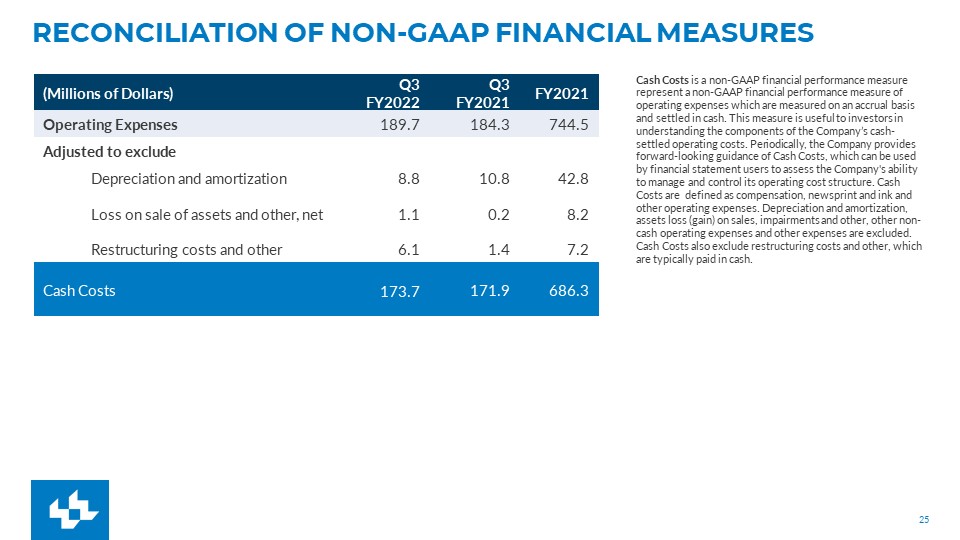
Lee Enterprises, Incorporated (“Company”) prepared an investor presentation (“Investor Presentation”) management intends to use from time to time for presentations to investors about the Company’s operations and performance, including information related to the Company’s strategic plans, goals, growth initiatives and outlook, and forecasts for future performance and industry development.  The Investor Presentation is furnished as Exhibit 99.1 to this Current Report on Form 8-K.

The information contained in the Investor Presentation is summary information that should be considered within the context of the Company’s filings with the Securities and Exchange Commission and other public announcements the Company may make by press release or otherwise from time to time.  While the Company may elect to update the Investor Presentation or reflect events and circumstances occurring or existing after the date of this Current Report on Form 8-K, the Company specifically disclaims any obligation to do so.

By furnishing this Current Report on Form 8-K and furnishing the Investor Presentation, the Company makes no admission as to the materiality of any information in this 
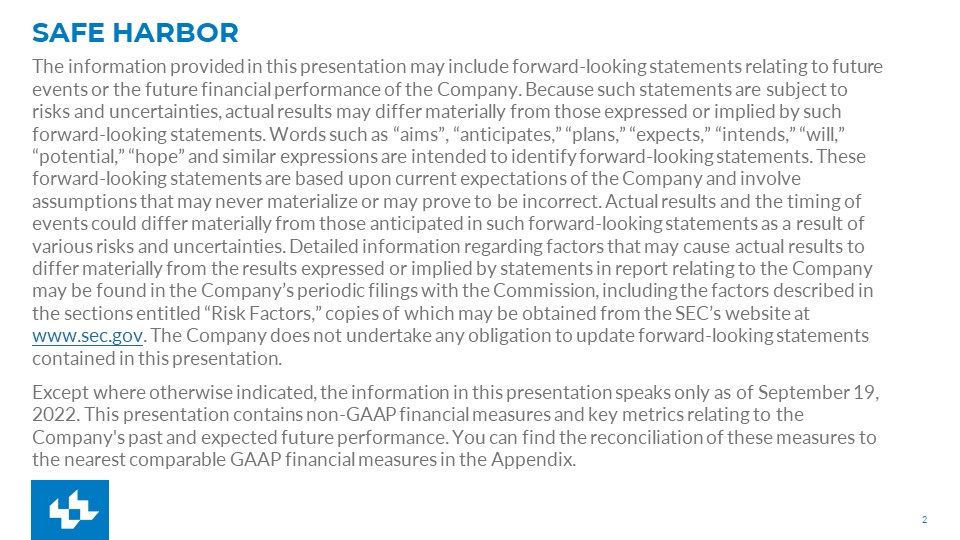
Report, including without limitation the Investor Presentation.  The Investor Presentation contains forward-looking statements.  See Page 2 of the Investor Presentation for a discussion of certain forward-looking statements included therein and the risks and uncertainties related thereto.

The information in this Report, including without limitation the Investor Presentation, shall not be treated as filed for purposes of the Securities Exchange Act of 1934, as amended.

Item 9.01.
Financial Statements and Exhibits.

(d)
Exhibits


September 2022 Investor Presentation


SIGNATURES

Pursuant to the requirements of the Securities Exchange Act of 1934, the Registrant has duly caused this report to be signed on its behalf by the undersigned thereunto duly authorized.

   
LEE ENTERPRISES, INCORPORATED
     
Date:  September 23, 2022
By:
/s/Timothy R. Millage
 
   
Timothy R. Millage
   
Vice President, Chief Financial Officer
and Treasurer


2

EX-99.1 2 brhc10042183_ex99-1.htm EXHIBIT 99.1
Exhibit 99.1

 BUILDING LONG-TERM VALUE  INVESTOR PRESENTATION | SEPTEMBER 2022  Exhibit 99.1 
 

 SAFE HARBOR  The information provided in this presentation may include forward-looking statements relating to future events or the future financial performance of the Company. Because such statements are subject to risks and uncertainties, actual results may differ materially from those expressed or implied by such forward-looking statements. Words such as “aims”, “anticipates,” “plans,” “expects,” “intends,” “will,” “potential,” “hope” and similar expressions are intended to identify forward-looking statements. These forward-looking statements are based upon current expectations of the Company and involve assumptions that may never materialize or may prove to be incorrect. Actual results and the timing of events could differ materially from those anticipated in such forward-looking statements as a result of various risks and uncertainties. Detailed information regarding factors that may cause actual results to differ materially from the results expressed or implied by statements in report relating to the Company may be found in the Company’s periodic filings with the Commission, including the factors described in the sections entitled “Risk Factors,” copies of which may be obtained from the SEC’s website at www.sec.gov. The Company does not undertake any obligation to update forward-looking statements contained in this presentation.  Except where otherwise indicated, the information in this presentation speaks only as of September 19, 2022. This presentation contains non-GAAP financial measures and key metrics relating to the Company's past and expected future performance. You can find the reconciliation of these measures to the nearest comparable GAAP financial measures in the Appendix. 
 

 Lee is strongly positioned for the future (NASDAQ: lEE)  1 Digital audience represents average monthly UV on Lee’s owned and operated websites in the three months ended June 2022.  Leading provider of digital products and services and high quality, trusted, local news and information  Deep relationships in 77 attractive, mid-size local markets, reaching more than 43M unique visitors each month1  Mid-size market focus enables greater audience engagement/deeper penetration and lower volatility from macroeconomic trends  Lee reaches 7 out of 10 adults in its markets during the week  Fastest growing digital subscription platform in local media  11 consecutive quarters of industry leading digital subscription growth  501,000 digital subscriptions as of June (+49% YOY)  LTM June digital subscription revenue of $37 million (+50% YOY in Q3FY22)  Digital advertising growing across platforms with differentiated digital product offerings  Developed Amplified Digital®, a full service digital marketing services agency  LTM June Amplified revenue of $66 million (+74 YOY in Q3FY22)  Lee’s omni channel sales platform, Vision, provides a competitive advantage to grow digital advertising and marketing services revenue  Strong business model and best-in-class management team  Hired by Warren Buffett in 2018 to manage Berkshire Hathaway’s local media operations  Team consistently outperforms local media peers on revenue metrics  Majority of revenue is subscription based, recurring revenue 
 

 WARREN BUFFETT BELIEVES THAT WE ARE WELL-POSITIONED TO EXECUTE ON OUR TRANSFORMATION  My partner Charlie Munger and I have known and admired the Lee organization for over 40 years. They have delivered exceptional performance managing BH Media’s newspapers and continue to outpace the industry in digital market share and revenue. We had zero interest in selling the group to anyone else for one simple reason: We believe that Lee is best positioned to manage through the industry’s challenges.   No organization is more committed to serving the vital role of high-quality local news, however delivered, as Lee. I am confident that our newspapers will be in the right hands going forward and I also am pleased to be deepening our long-term relationship with Lee through the financing agreement.”  Warren Buffett, January 29, 2020  As Lee’s sole lender, Berkshire Hathaway remains highly confident in Lee’s Board and management as they continue to navigate the ever-evolving newspaper industry.”  Warren Buffett, February 14, 2022  Source: Lee Enterprises press release, January 29, 2020  Note: Permission obtained to use quotation. 
 

 Lee investment thesis  We believe our three pillar digital growth strategy will create substantial value:  Increased Shareholder Value   Operating cash flow and profits are enhanced  Debt reduction drives shareholder value  Multiple expansion fueled by increased recurring, high-margin digital revenue  Continued Debt Reduction & Strengthened Balance Sheet  Expect to reach <2.5x leverage target within five years  Execute Three Pillar Digital Growth Strategy  Generate long-term sustainable digital revenue growth, margin expansion, and strong free cash flow 
 

 Digital Subscriber   Growth Leads Industry  Digital Agency Revenue Growth Leads Industry  Total Digital Revenue Growing Significantly  501K Current Digital-only Subscribers  $66M Amplified LTM Revenue  $224M of LTM Total Digital Revenue   11 quarters of leading digital subscriber growth  June YOY Growth  LTM JuneYOY Growth  Total Digital Revenue up 24% YOY  LTM June YOY Growth  Digital Transformation: market leading growth  $181M  $224M 
 

 Lee’s Strategy for Digital Transformation:the Three Pillars  Lee is rapidly transforming from a print-centric to a digital-Centric company  PILLAR 1  Expand digital audiences by transforming the presentation of local news and information  PILLAR 2  Expand digital subscription base and revenue  PILLAR 3  Diversify and expand offerings for local advertisers  Lee expects the Three Pillar Digital Growth strategy to drive more than   $435 million of recurring, sustainable digital revenue by 2026. 
 

 Digital Transformation: Expand Digital audiences   Enhancing digital presentations to provide best-in-class user experience of local news, with multiformat, rich content  Creating cohesive digital experience across all platforms by investing in user-experience design talent  Improving multimedia presentation   Emphasis on video and audio to drive engagement and monetization  Expand regional and statewide collaboration to enhance video and audio content  Enabling cross-platform integration to track usage  Creating new channels (apps, podcasts) to utilize our unique content and expertise (e.g. local sports)  PILLAR 1  PILLAR 2  PILLAR 3 
 

 Digital Transformation: Strategies to Drive Subscription Revenue   Enhancing conversion within Lee’s addressable market   Convert more of our addressable market to digital content subscribers  Leverage embedded position in 77 attractive markets to grow audiences and share of total addressable market  Convert more of the 2.4M highly engaged readers to digital subscribers  Provide attractive niche subscriptions for targeted audiences  Implement data-driven, dynamic content metering to drive subscription conversion  Digital segmentation and targeted offers based on usage   Maximizing conversions from email, search, social media referrals  Leveraging TownNews dynamic meter to drive conversions  PILLAR 1  PILLAR 2  PILLAR 3  TODAY  Expanded Base of Visitors   900K Digital-Only Subscribers  2.4M  Highly Engaged Readers(4+ visits per month)  501K  Digital-Only Subscribers  FY26  Activated Unique Visitors, Expanded Paid Content & Enhanced Conversion  Strengthened Foundationfor Revenue Growth  Addressable market: 43M Unique visitors  highly educated with high disposable incomes   12M  Loyal Readers(2-4 visits per month) 
 

 Digital Transformation: industry leading digital subscription growth  Digital subscriber growth has outpaced industry peers for 11 quarters 
 

 Digital Transformation: Five-Year Subscription growth Outlook  We expect significant growth in digital subscribers:  Convert more visitors to our core digital products  Launch new digital niche subscription products  Continued conversion of audiences to digital subscribers  Expect 900,000 digital subscribers by 2026, assuming modest penetration of the current addressable market  We expect to drive digital subscription revenue even faster:  Expect ARPU expansion as introductory pricing becomes a smaller piece of the subscriber base  Maximizing ARPU through data and sophisticated analytics  Niche digital products expected to carry higher ARPU  Lee is confident in its plan to grow digital subscriptions and arpu  Lee expects $100M of digital subscription revenue in 2026 
 

 1  Lee is the fastest growing digital subscription platform with a strong track record of digital subscription growth.  2  Lee is more than halfway to the goal of reaching 900,000 paid digital only subscribers assuming a modest penetration of the total addressable market.  3  Lee’s digital transformation strategy is expected to generate recurring sustainable digital subscription revenue, expecting $100M in 2026.  DIGITAL TRANSFORMATION: KEY TAKEAWAYS FOR SUBSCRIPTION REVENUE 
 

 Digital Transformation: Amplified is growing rapidly  Amplified – Lee’s full-service digital agency is expected to continue to grow significantly  Overview of Amplified:  Provides full suite of digital services such as omnichannel marketing solutions, audience targeted display, SEM, social audience targeting, social media management, email marketing, banner, video streaming, and much more  Creates sophisticated websites for local, regional, and national customers – 2,000 websites developed  Supports ecommerce solutions and leverages first party data to drive premium eCPMs  Delivers key analytics to customers via Amplified Insights  Develops custom video content through Brand Avenue Studios  Amplified in Numbers:  Over 7,800 customers, up 85% over the last twelve months  Amplified customers in 49 states  Amplified generated $66 million in revenue (LTM) and is expected to reach $100 million in 2024  $66M  $29M 
 

 Digital Transformation: Five-Year digital advertising Outlook  Digital advertising growth is fueled by amplified  Amplified will drive digital marketing services revenue growth.  Rapidly growing digital marketing services provider with $66M of revenue over the last twelve months, up 80%  Leverage local market presence to expand client base from 7,800 customers  Increase advertiser spending due to:  Growing demand for omnichannel digital advertising   Lee’s Vision platform leverages data and derives value for local advertisers   Our owned and operated digital products provides a unique opportunity to grow high margin digital advertising revenue.  Improve local market penetration, ultimately increasing customer counts   Leverage Lee’s Vision platform to increase sell-thru rates and eCPMs to drive higher value digital advertising revenue   Lee expects $310M of Digital Advertising & Marketing Services Revenue in 2026 
 

 1  Amplified is a majorgrowth engine for Lee’s digital advertising transformation.  2  Lee’s sophisticated Vision platform uniquely positions us to capitalize on the double-digit growth in omnichannel digital advertising.  3  Lee’s strategy is expectedto generate recurring sustainable digitalrevenue exceeding $310M in digital advertising revenue in 2026.  DIGITAL TRANSFORMATION: KEY TAKEAWAYS FOR ADVERTISING REVENUE GROWTH  
 

 Third quarter 2022 Financial Highlights & 2022 outlook  Q3 FY2022 FINANCIAL PERFORMANCE  Total Operating Revenue was $195 million in the third quarter, less than a one-percent YOY decline  Total Digital Revenue was $61 million, up 27% YOY  Digital-only subscription revenue increased 50% YOY and totaled $11 million  Digital-only subscribers increased 49% YOY and now total 501,000  Digital advertising and marketing services revenue increased 27% YOY and totaled $46 million  Amplified revenue increased 74.1% YOY totaling $21 million  Total Print Revenue was $134 million in the third quarter, a 10% YOY decline   Operating expenses totaled $190 million and Cash Costs(1) were up 1.0% YOY due to:   Increases in investments in digital talent and technology tied to our digital growth strategy and digital cost of goods sold  Cycling one-time cost benefits realized in the prior year  A partial offset by a reduction in expenses that support our print revenue streams   Net income totaled $0.2M and Adjusted EBITDA(1) totaled $23.0M  Initial FY2022 Guidance  495,000  Total Digital Only Subscribers  $33M  Digital Only Subscription Revenue  $175M  Digital Advertising & Marketing Services Revenue  $95 – 98M  Adjusted EBITDA  (1) Adjusted EBITDA and Cash Costs are non-GAAP financial measures. See appendix.  Met FY22 Guidance in Q3 
 

 2022 outlook  (1) Adjusted EBITDA and Cash Costs are non-GAAP financial measures. See appendix.  Q3 YTD  Q4 Outlook  2022 Improved Outlook  Digital Only Subscription Revenue  $29M  $11M  $39M  YoY  41%  44%  40%  Digital Advertising and Marketing Services Revenue   $132M   $47M   $179M   YoY  27%  27%  27%  Total Digital Revenue   $175M   $62M   $237M   YoY  26%  27%  26%  Adjusted EBITDA   $66M   $29 - 32M  $95 - 98M  
 

 Strong TRACK RECORD OF SUSTAINABLE COST MANAGEMENT  Proficient in driving efficiencies  Current base of +$300M of direct costs associated with our legacy revenue streams that will be managed with associated revenue trends   Executed $45M in annualized cash cost reductions early in Q3 FY22; FY22 impact $20M  Ongoing initiatives aimed at optimizing manufacturing, distribution, and corporate services  Thoughtful investments in digital future   Significant investments made in talent and technology to fund successful execution of three pillar strategy   Acquisition and retention of top talent focused on digital subscriber growth and expanding reach of Amplified Digital®  Increase in digital COGS driven by rapid growth in digital revenue  Optimizing operating structure by investing in the digital future &   managing the legacy business  (1) Adjusted EBITDA and Cash Costs are non-GAAP financial measures. See appendix.  $685-695M  $11M  $36M  $40-50M  $686M 
 

 Digital Transformation: required investments   $15M of incremental investments expected in FY22  Lee is making value-added investments to drive its digital transformation  TALENT AND TEAM  Data and technology team with AI expertise  Brand development and strategic marketing experts  User experience experts  Digital product development talent  Acquisition and retention of top talent focused on digital subscriber acquisition and retention  Executive producers to curate custom video content  Digital advertising agency talent  Digital advertising vertical category management experts  SYSTEMS AND INFRASTRUCTURE  Data lake technology to store customer data  Demographic and propensity scoring software  Consolidated ID technology for subscription access, ad targeting, frequency capping & content recommendations  Data visualization tools for our newsrooms to drive reader engagement  Machine learning technology to personalize experiences for our readers  Business intelligence & visualization tools  Marketing insight technology  Front end ad tech that drives efficiencies and improves ARPU 
 

 Digital Transformation Five Year Outlook: Strengthened Balance Sheet  $20M in debt reduction in first nine months of 2022 and $113M since refinancing in March 2020  Favorable credit agreement with Berkshire Hathaway  25-year runway w/ no breakage costs or prepayment penalties   Fixed annual interest rate, no financial performance covenants and no fixed amortization  Pension plans now frozen and fully funded in the aggregate and not expecting any material pension contributions in 2022. Executed a risk transfer agreement in September 2022 buying annuity contracts for $86M of our pension obligation.  Asset sales of $25M over the last two years. $14M already closed in first nine months of 2022  Achieve long-term leverage target of under 2.5x in five years  $576M  $463M  Significant Gross Debt Reduction 
 

 Lee investment thesis  We believe our three pillar digital growth strategy will create substantial value:  Increased Shareholder Value   Operating cash flow and profits are enhanced  Debt reduction drives shareholder value  Multiple expansion fueled by increased recurring, high-margin digital revenue  Continued Debt Reduction & Strengthened Balance Sheet  Expect to reach <2.5x leverage target within five years  Execute Three Pillar Digital Growth Strategy  Generate long-term sustainable digital revenue growth, margin expansion and strong free cash flow 
 

 Appendix 
 

 Quarterly Revenue Composition  Total Digital Revenue – Total Digital Revenue in the prior year was reclassified to conform to the current year presentation. Total Digital Revenue is defined as digital advertising and marketing services revenue (including Amplified), digital-only subscription revenue and digital services revenue. Previously other digital subscription revenue was included. The reclassification was made to conform with a similar metric of the Company’s peers. All periods have been restated for the reclassification. 
 

 RECONCILIATION OF NON-GAAP FINANCIAL MEASURES  Adjusted EBITDA is a non-GAAP financial performance measure that enhances financial statement users overall understanding of the operating performance of the Company. The measure isolates unusual, infrequent or non-cash transactions from the operating performance of the business. This allows users to easily compare operating performance among various fiscal periods and how management measures the performance of the business. This measure also provides users with a benchmark that can be used when forecasting future operating performance of the Company that excludes unusual, nonrecurring or one time transactions. Adjusted EBITDA is a component of the calculation used by stockholders and analysts to determine the value of our business when using the market approach, which applies a market multiple to financial metrics. It is also a measure used to calculate the leverage ratio of the Company, which is a key financial ratio monitored and used by the Company and its investors. Adjusted EBITDA is defined as net income (loss), plus non-operating expenses, income tax expense, depreciation and amortization, assets loss (gain) on sales, impairments and other, restructuring costs and other, stock compensation and our 50% share of EBITDA from TNI and MNI, minus equity in earnings of TNI and MNI.  (Millions of Dollars)  Q3 FY2022  Net Income  0.2  Adjusted to exclude  Income tax expense  0.2  Non-operating expenses, net  6.1  Equity in earnings of TNI and MNI (1)   (1.1)  Loss on sale of assets and other, net  1.1  Depreciation and amortization  8.8  Restructuring costs and other  6.1  Stock compensation  0.3  Add  Ownership share of TNI and MNI EBITDA (50%)  1.3  Adjusted EBITDA   23.0  (1) TNI refers to TNI Partners publishing operations in Tucson, AZ. MNI refers to Madison Newspapers, Inc. publishing operations in Madison, WI. 
 

 RECONCILIATION OF NON-GAAP FINANCIAL MEASURES   Cash Costs is a non-GAAP financial performance measure represent a non-GAAP financial performance measure of operating expenses which are measured on an accrual basis and settled in cash. This measure is useful to investors in understanding the components of the Company’s cash-settled operating costs. Periodically, the Company provides forward-looking guidance of Cash Costs, which can be used by financial statement users to assess the Company's ability to manage and control its operating cost structure. Cash Costs are defined as compensation, newsprint and ink and other operating expenses. Depreciation and amortization, assets loss (gain) on sales, impairments and other, other non-cash operating expenses and other expenses are excluded. Cash Costs also exclude restructuring costs and other, which are typically paid in cash.  (Millions of Dollars)  Q3 FY2022  Q3 FY2021  FY2021  Operating Expenses  189.7  184.3  744.5  Adjusted to exclude  Depreciation and amortization  8.8  10.8  42.8  Loss on sale of assets and other, net  1.1  0.2  8.2  Restructuring costs and other  6.1  1.4  7.2  Cash Costs   173.7  171.9  686.3