Document
News Release
HOPE BANCORP REPORTS 2024 FIRST QUARTER FINANCIAL RESULTS;
SIGNS DEFINITIVE MERGER WITH TERRITORIAL BANCORP
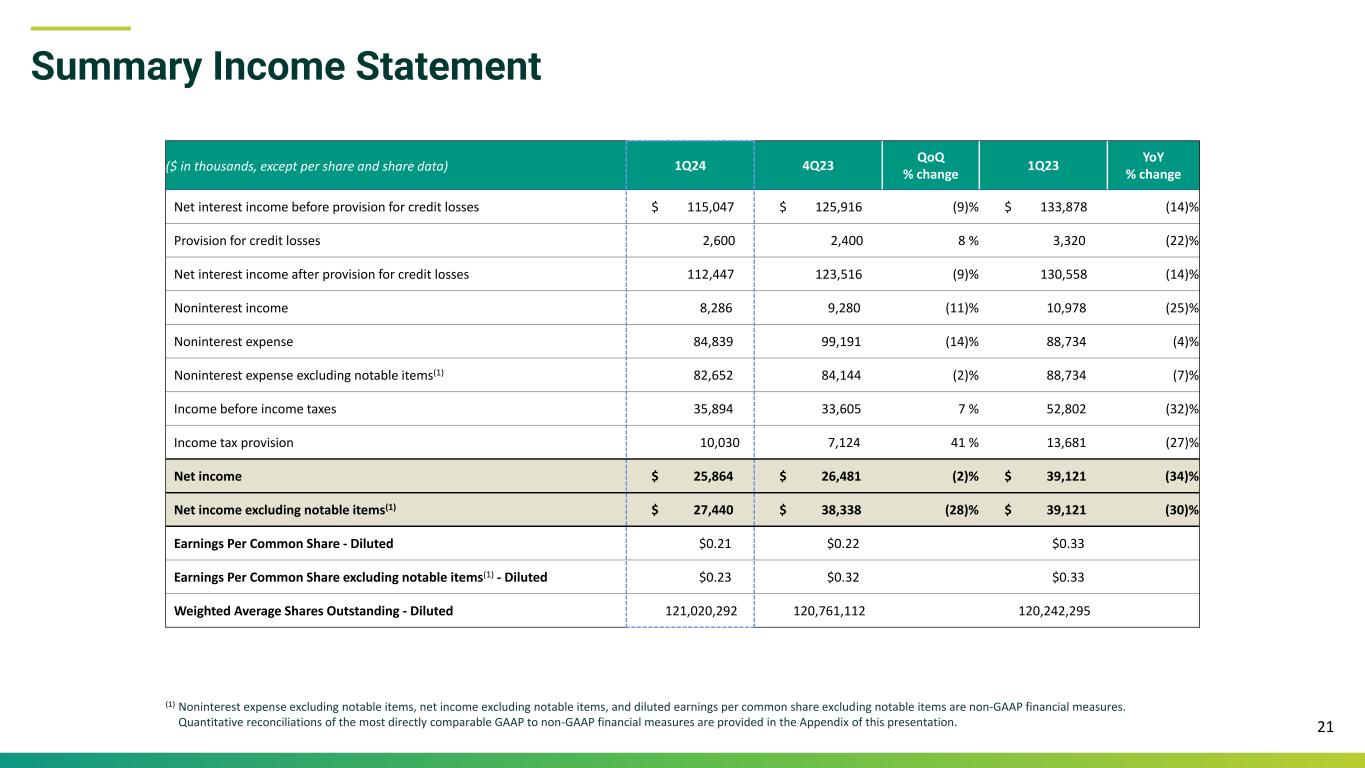
LOS ANGELES - April 29, 2024 - Hope Bancorp, Inc. (“Company”) (NASDAQ: HOPE), the holding company of Bank of Hope (“Bank”), today reported unaudited financial results for its first quarter ended March 31, 2024. For the three months ended March 31, 2024, net income totaled $25.9 million, or $0.21 per diluted common share. This compares with net income of $26.5 million, or $0.22 per diluted common share, in the fourth quarter of 2023.
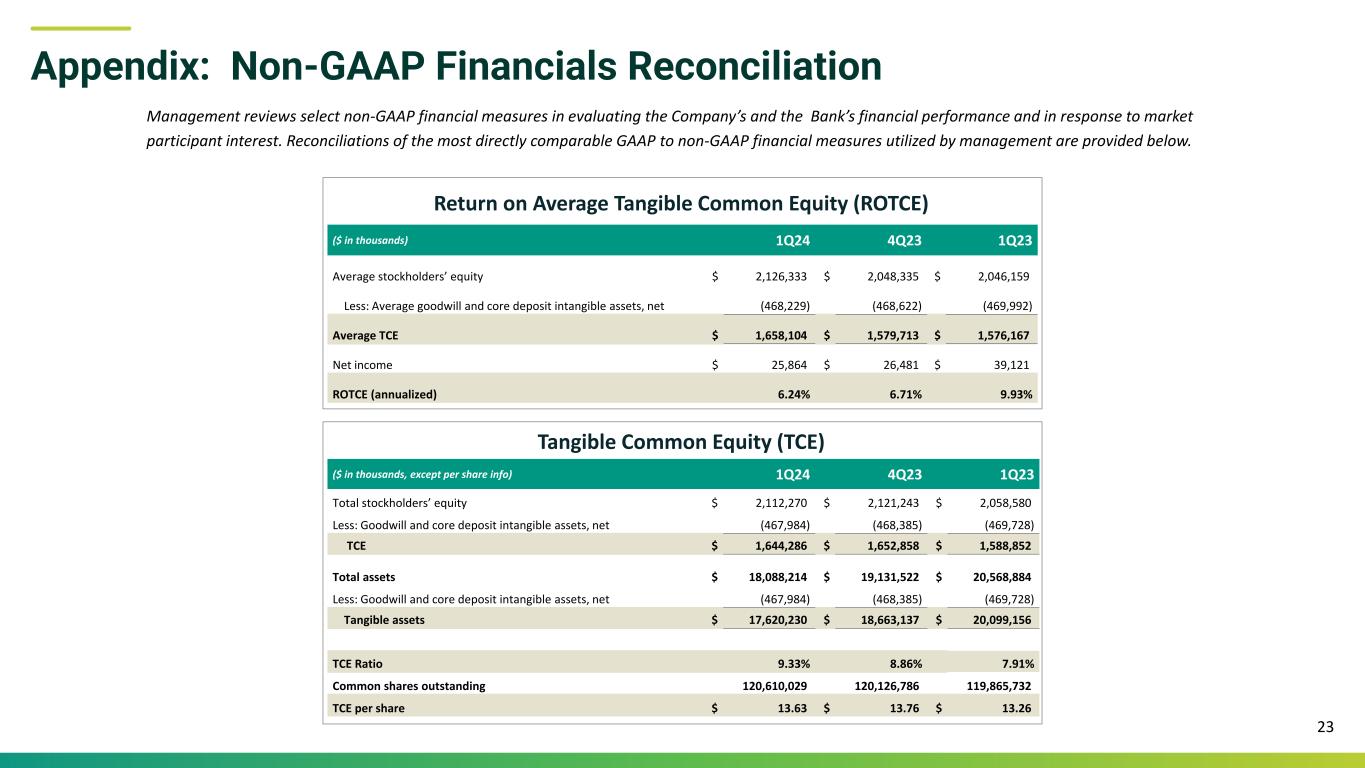
“We are pleased with the progress we are making in our strategic transformation, realigning our structure around lines of business and products,” stated Kevin S. Kim, Chairman, President and Chief Executive Officer. “All our business lines exceeded their deposit goals for the first quarter of 2024; growth in customer deposits offset a planned reduction of brokered time deposits, resulting in stable balances quarter-over-quarter. Our first quarter financial results demonstrated the benefits of our more efficient structure with noninterest expenses, excluding notable items(1), decreasing 2% from the preceding fourth quarter of 2023. All our capital ratios increased quarter-over-quarter, with our tangible common equity ratio(2) rising to 9.33% and our total capital ratio rising to 14.19%, both as of March 31, 2024.
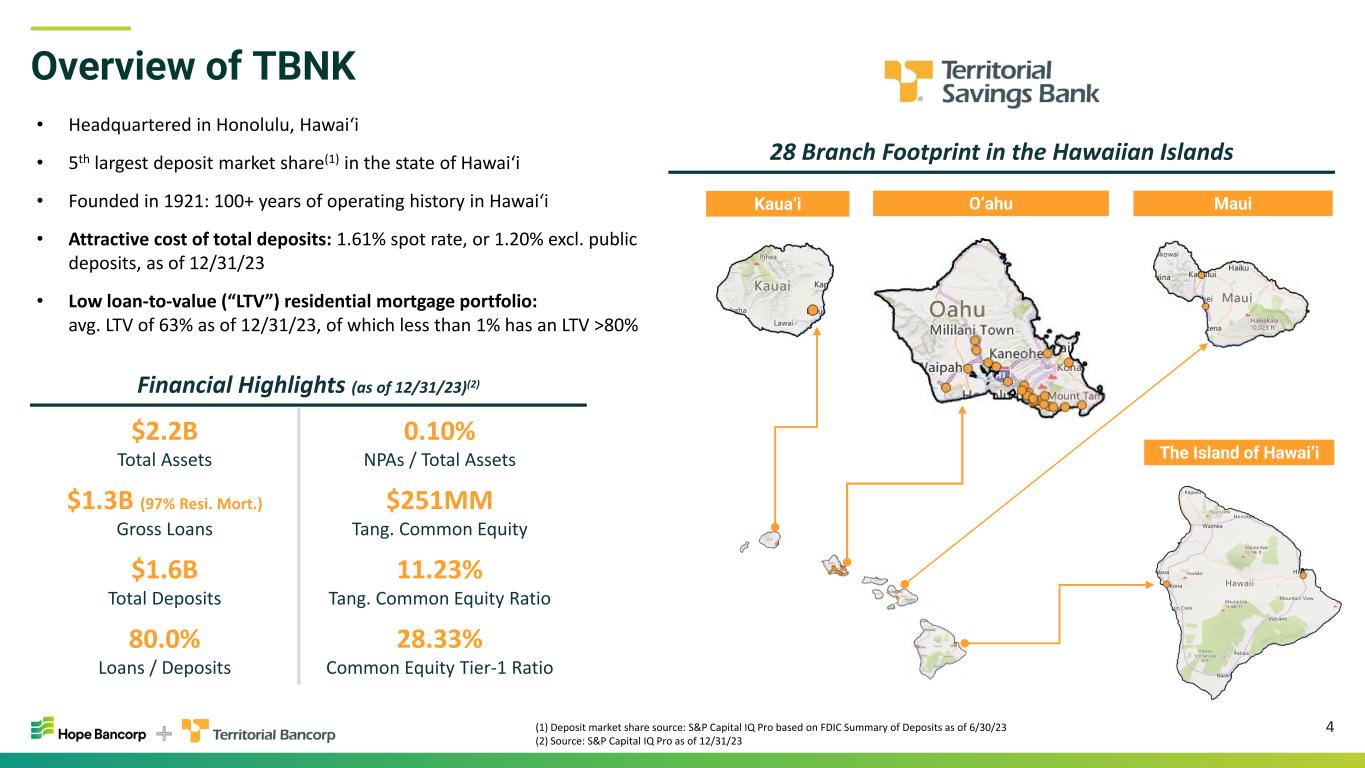
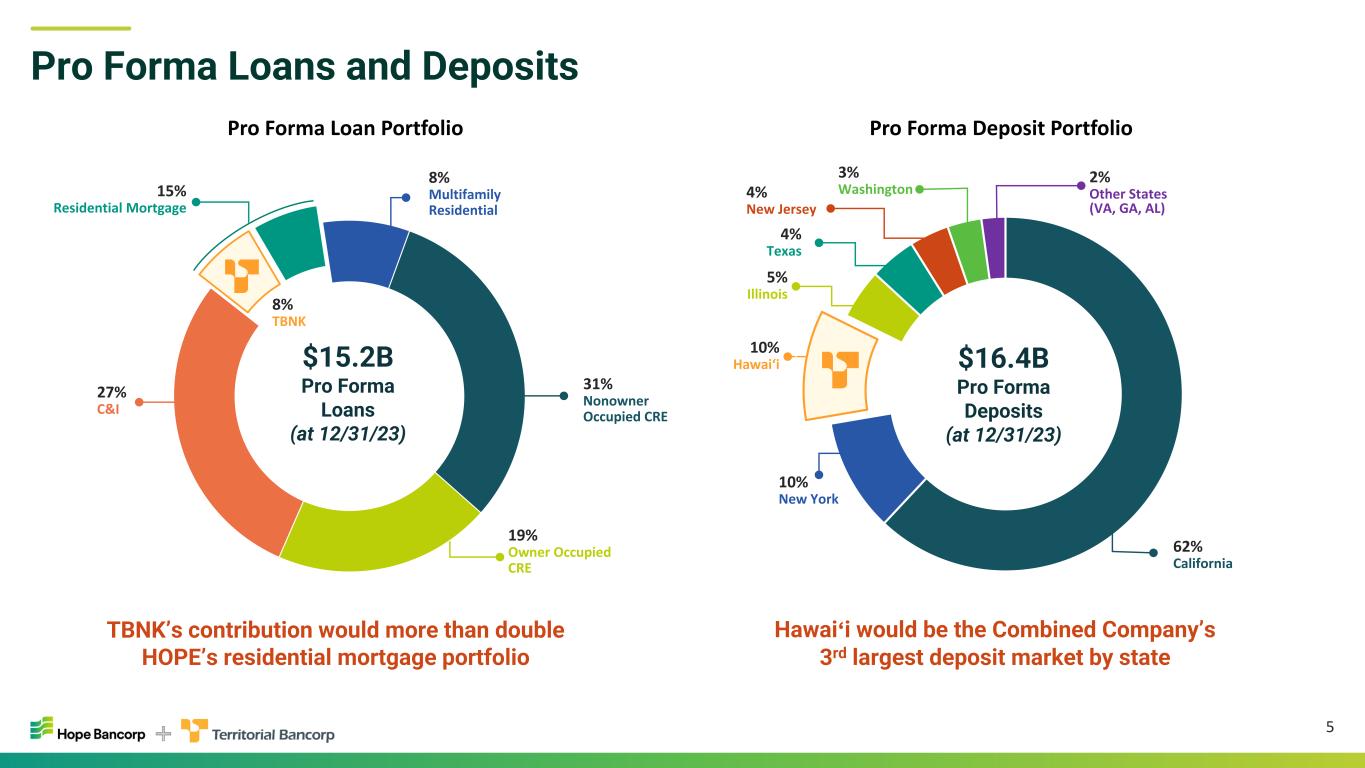
“The strength of our balance sheet positioned us well to capitalize on strategic opportunities in the market. This morning, we announced the signing of a definitive merger agreement with Territorial Bancorp, the stock holding company of Territorial Savings Bank, a $2.2 billion savings bank headquartered in Hawai‘i,” continued Kim. “Territorial has a stable, low-cost core deposit base, excellent asset quality, and provides us an entry point to the attractive Hawai‘i market, which has a large Asian American and Pacific Islander population. Moreover, the combination with Territorial would more than double the size of Hope’s residential mortgage portfolio. We expect this transaction, upon completion, to be immediately accretive to earnings, sustainably strengthening our profitability while further diversifying our franchise.”
Territorial Bancorp Merger Agreement
As concurrently announced in a joint news release issued today, the Company and Territorial Bancorp Inc. (Nasdaq: TBNK) (“Territorial”) signed a definitive merger agreement, which is expected to create the largest regional bank catering to multi-ethnic customers with full-service branches across the continental United States and Hawai‘i.
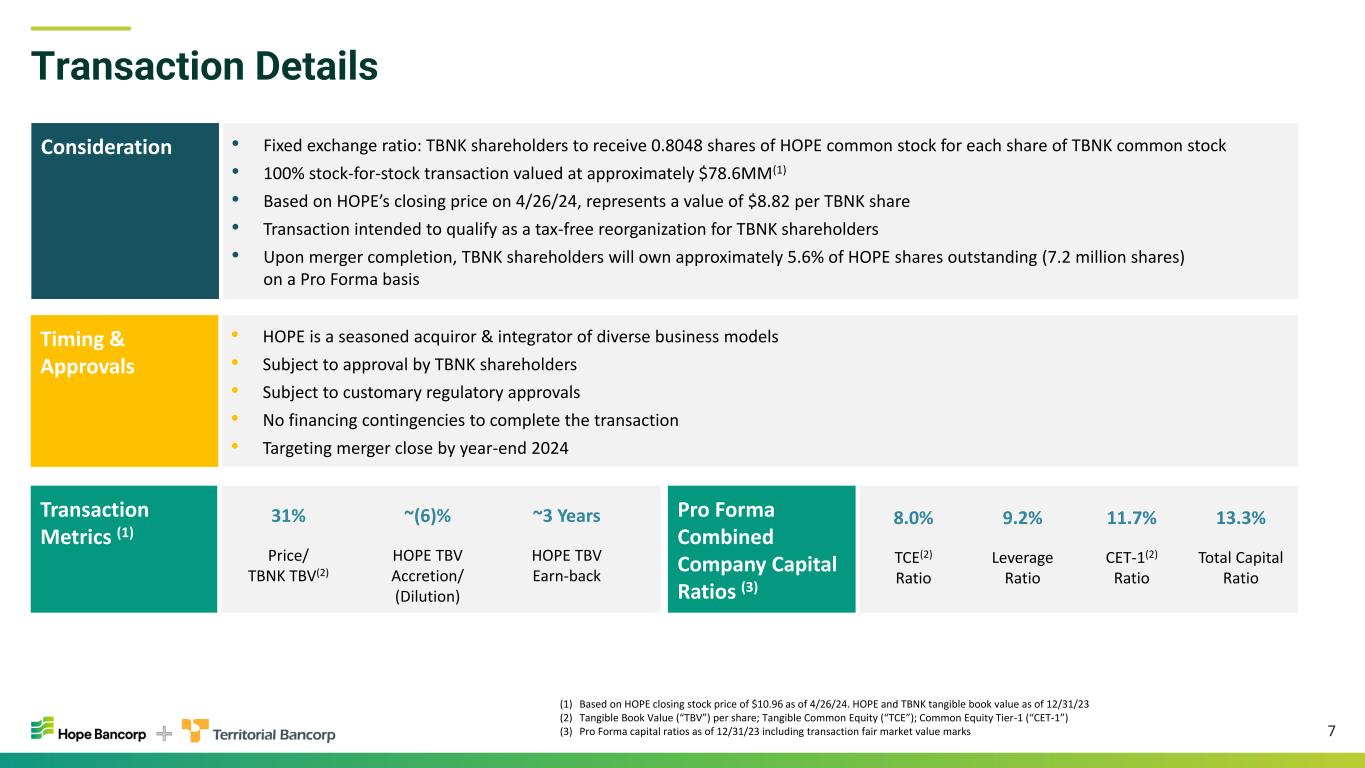
Under the terms of the merger agreement, following the completion of the transaction, Territorial shareholders will receive a fixed exchange ratio of 0.8048 shares of the Company’s common stock in exchange for each share of Territorial common stock they own, in a 100% stock-for-stock transaction valued at approximately $78.6 million. Based on the closing price of the Company’s common stock on April 26, 2024, this represents a value of $8.82 per share of Territorial common stock, although the actual value will be determined upon transaction closing. Upon completion of the transaction, it is expected that the Company’s shareholders will own approximately 94.4% of the combined entity, and Territorial’s shareholders will own approximately 5.6%, with the actual percentages being determined as of the transaction closing date. The transaction is intended to qualify as a tax-free reorganization for Territorial shareholders.
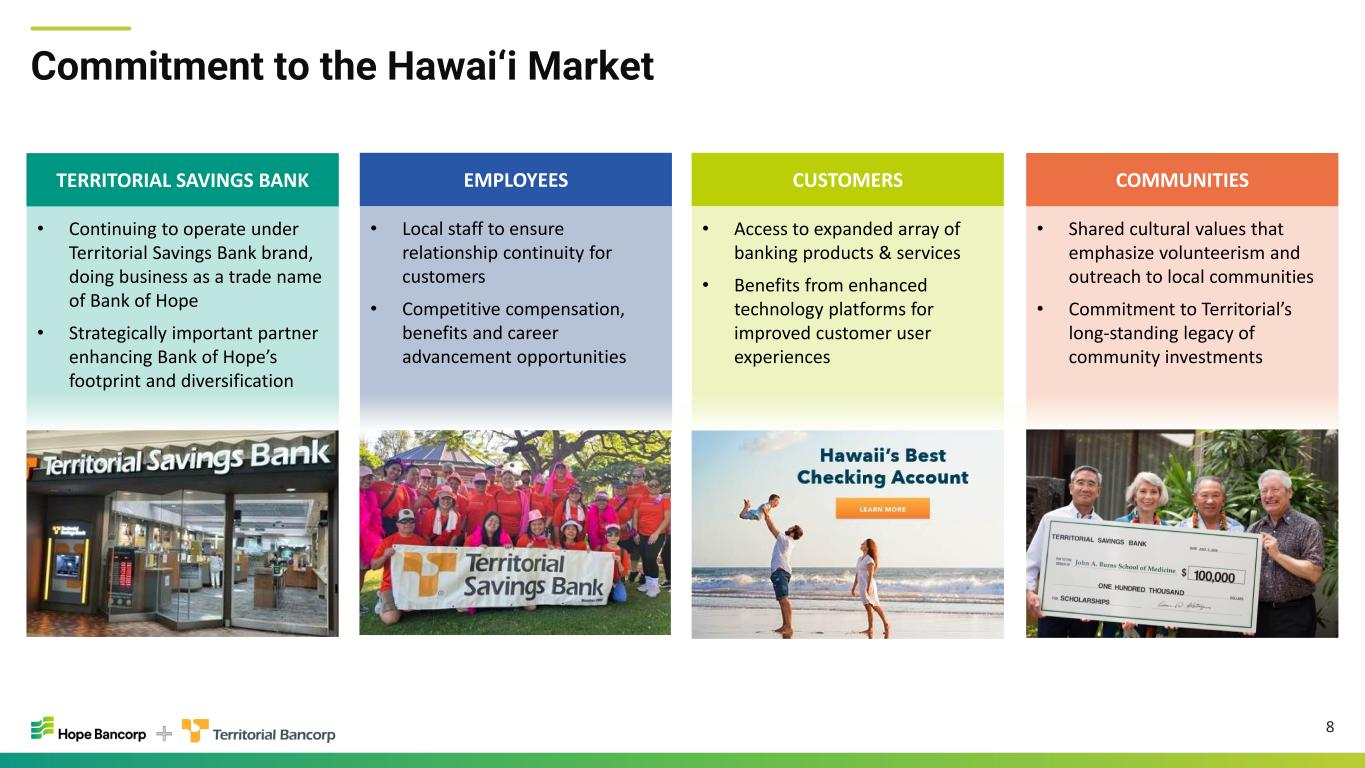
Upon completion of the merger, the Company intends to preserve and build upon the 100-plus year legacy of the Territorial Savings Bank brand name, culture and commitment to its local communities. Accordingly, the legacy Territorial franchise in Hawai‘i will continue to do business under the Territorial Savings Bank brand, as a trade name of Bank of Hope.
(1) Noninterest expense, excluding the FDIC special assessment, restructuring charges and merger-related expenses (also referred to collectively as the “notable items”), is a non-GAAP financial measure. Quantitative reconciliations of the most directly comparable GAAP to non-GAAP financial measures are provided in the accompanying financial information on Table Pages 9 and 10.
(2) Tangible common equity (“TCE”) ratio is a non-GAAP financial measure. Quantitative reconciliations of the most directly comparable GAAP to non-GAAP financial measures are provided in the accompanying financial information on Table Pages 9 and 10.
The Boards of Directors of both companies have approved the transaction. The transaction is expected to close by year-end 2024, subject to regulatory approvals, the approval of Territorial shareholders, and the satisfaction of other customary closing conditions.
Operating Results for the 2024 First Quarter
Net income and earnings per share. Net income for the 2024 first quarter was $25.9 million, or $0.21 per diluted common share, compared with $26.5 million, or $0.22 per diluted common share, for the immediately preceding fourth quarter. Notable items impacting net income for the 2024 first quarter included $752,000 of merger-related expenses, after tax, related to the Company’s proposed acquisition of Territorial announced today; an accrual of $721,000, after tax, for an incremental Federal Deposit Insurance Corporation (“FDIC”) special assessment; and restructuring costs of $103,000, after tax, related to the Company’s strategic reorganization announced in the 2023 fourth quarter. In the immediately preceding fourth quarter, notable items impacting net income were $8.7 million of restructuring costs, after tax, and $3.1 million, after tax, accrued for an FDIC special assessment. Excluding these notable items, net income(3) for the 2024 first quarter was $27.4 million, compared with $38.3 million for the fourth quarter of 2023. Earnings per diluted common share excluding notable items(3) amounted to $0.23 for the three months ended March 31, 2024, compared with $0.32 for the three months ended December 31, 2023.
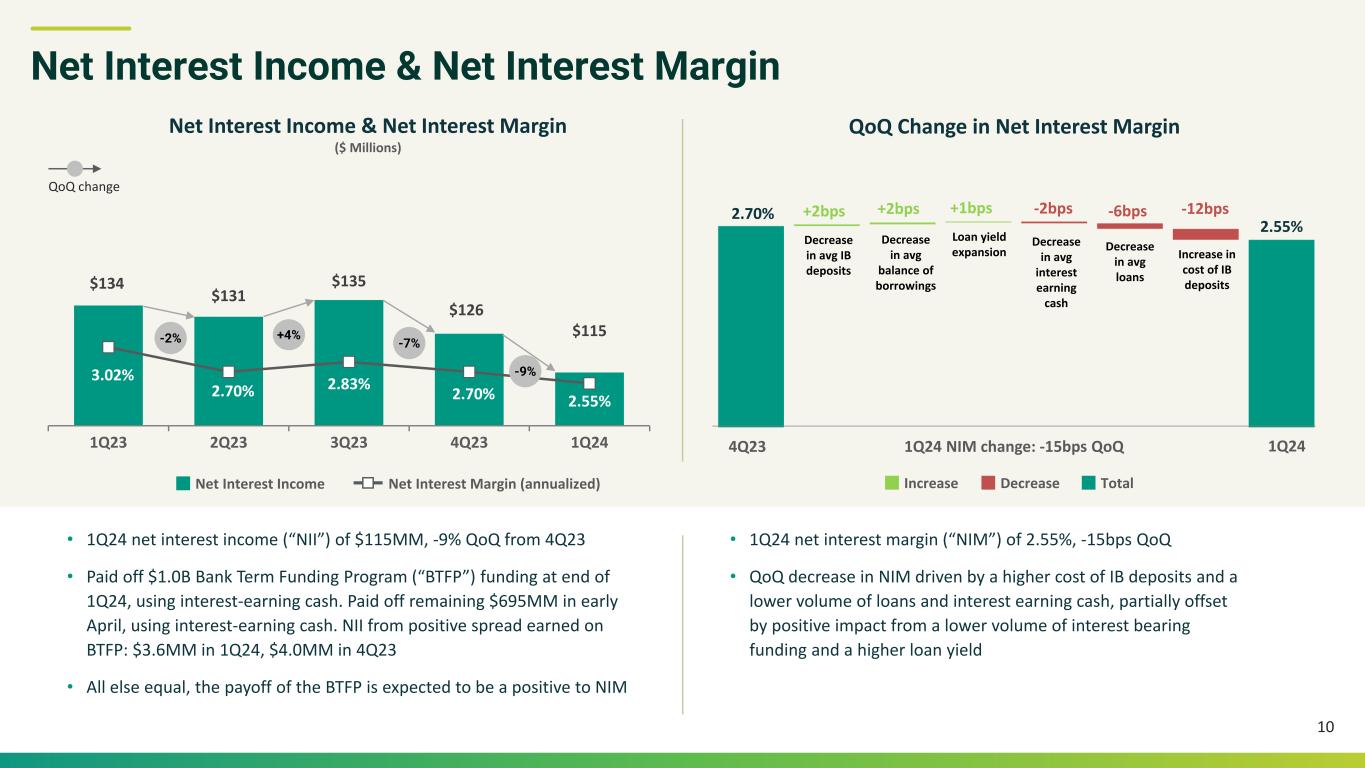
Net interest income and net interest margin. Net interest income before provision for credit losses for the 2024 first quarter totaled $115.0 million, compared with $125.9 million in the immediately preceding fourth quarter, a decrease of 9% quarter-over-quarter. First quarter 2024 net interest margin contracted 15 basis points to 2.55% from 2.70% in the 2023 fourth quarter. The linked-quarter change in net interest income and net interest margin largely reflected a decline in the average balance of loans and a higher cost of interest bearing deposits, partially offset by a decrease in the average balance of time deposits and wholesale borrowings.
Noninterest income. Noninterest income for the 2024 first quarter totaled $8.3 million, compared with $9.3 million in the immediately preceding fourth quarter. Growth in deposit account service fees was offset by reductions in other income and fees. The Company continued to retain SBA 7(a)loan production on its balance sheet and did not sell any loans in the 2024 first quarter.
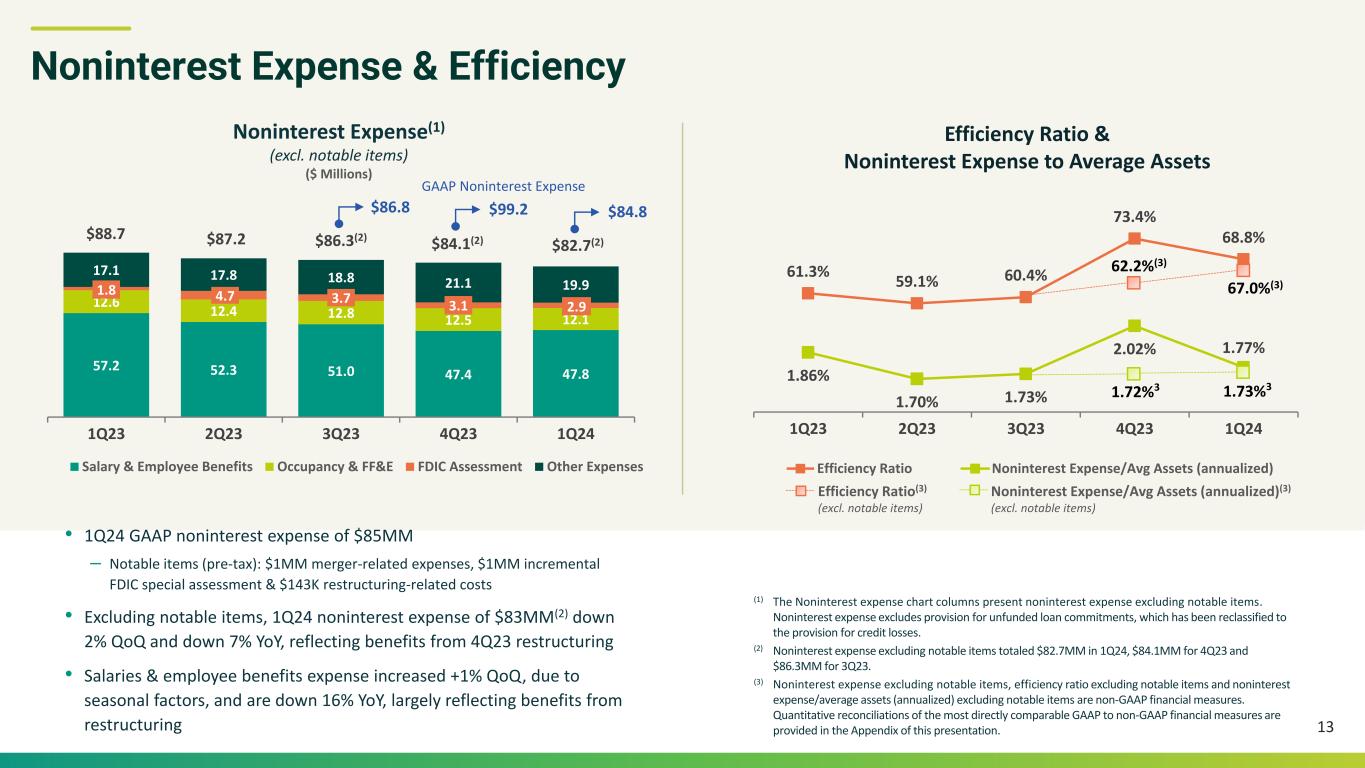
Noninterest expense. Noninterest expense for the 2024 first quarter was $84.8 million, including $1.0 million of merger-related expenses, an incremental accrual of $1.0 million for the FDIC special assessment, and $143,000 of restructuring-related costs, all on a pre-tax basis. For the immediately preceding fourth quarter, noninterest expense was $99.2 million, including $11.1 million of pre-tax restructuring costs and $4.0 million (pre-tax) accrued for the FDIC special assessment.
Excluding notable items, noninterest expense for the 2024 first quarter was $82.7 million, down 2% compared with $84.1 million for the 2023 fourth quarter, and down 7% compared with $88.7 million for the 2023 first quarter. First quarter 2024 salaries and employee benefits expense increased 1% quarter-over-quarter to $47.8 million, up from $47.4 million in the 2023 fourth quarter, reflecting seasonal increases in payroll taxes and vacation accruals, partially offset by reduced salary and benefits costs following the restructuring in the fourth quarter of 2023. Year-over-year, salaries and employee benefits expense decreased 16% from $57.2 million in the 2023 first quarter. Occupancy expenses decreased 6% quarter-over-quarter and 10% year-over-year, reflecting branch rationalization.
Tax rate. The effective tax rate for the 2024 first quarter was 27.9%, compared with 24.9% for the full year 2023. The provision for income taxes in the 2024 first quarter was $10.0 million and included $1.1 million of true-up adjustments, which are not expected to recur. For the full year 2024, the Company expects the effective tax rate to be approximately 26%.
(3) Net income excluding notable items and earnings per diluted common share excluding notable items are non-GAAP financial measures. Quantitative reconciliations of the most directly comparable GAAP to non-GAAP financial measures are provided in the accompanying financial information on Table Pages 9 and 10.
Balance Sheet Summary
Cash and investment securities. At March 31, 2024, cash and cash equivalents totaled $1.19 billion, compared with $1.93 billion at December 31, 2023. The decrease primarily reflected the payoff of $1.00 billion of the Company’s Bank Term Funding Program (“BTFP”) borrowings with existing cash on March 19, 2024. At March 31, 2023, cash and equivalents were $2.21 billion. Investment securities totaled $2.28 billion at March 31, 2024, $2.41 billion at December 31, 2023, and $2.23 billion at March 31, 2023.
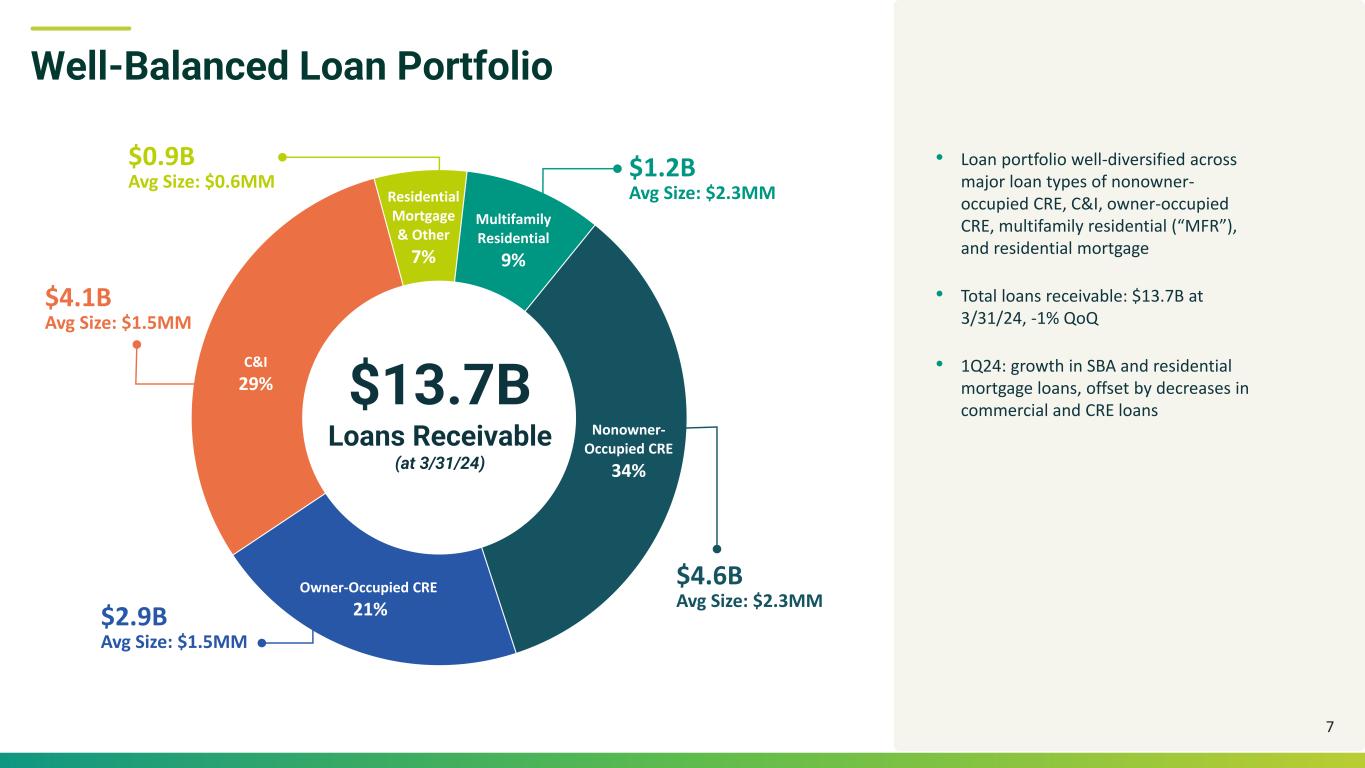
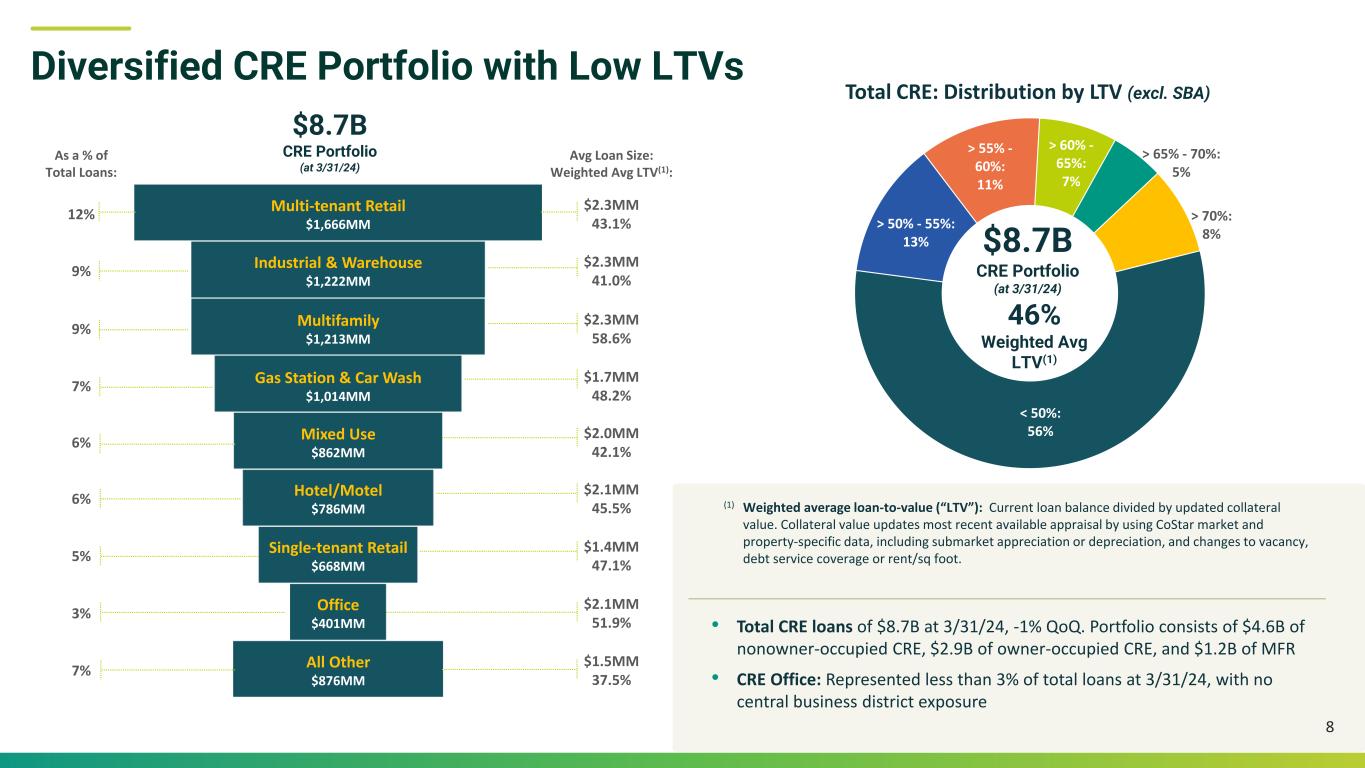
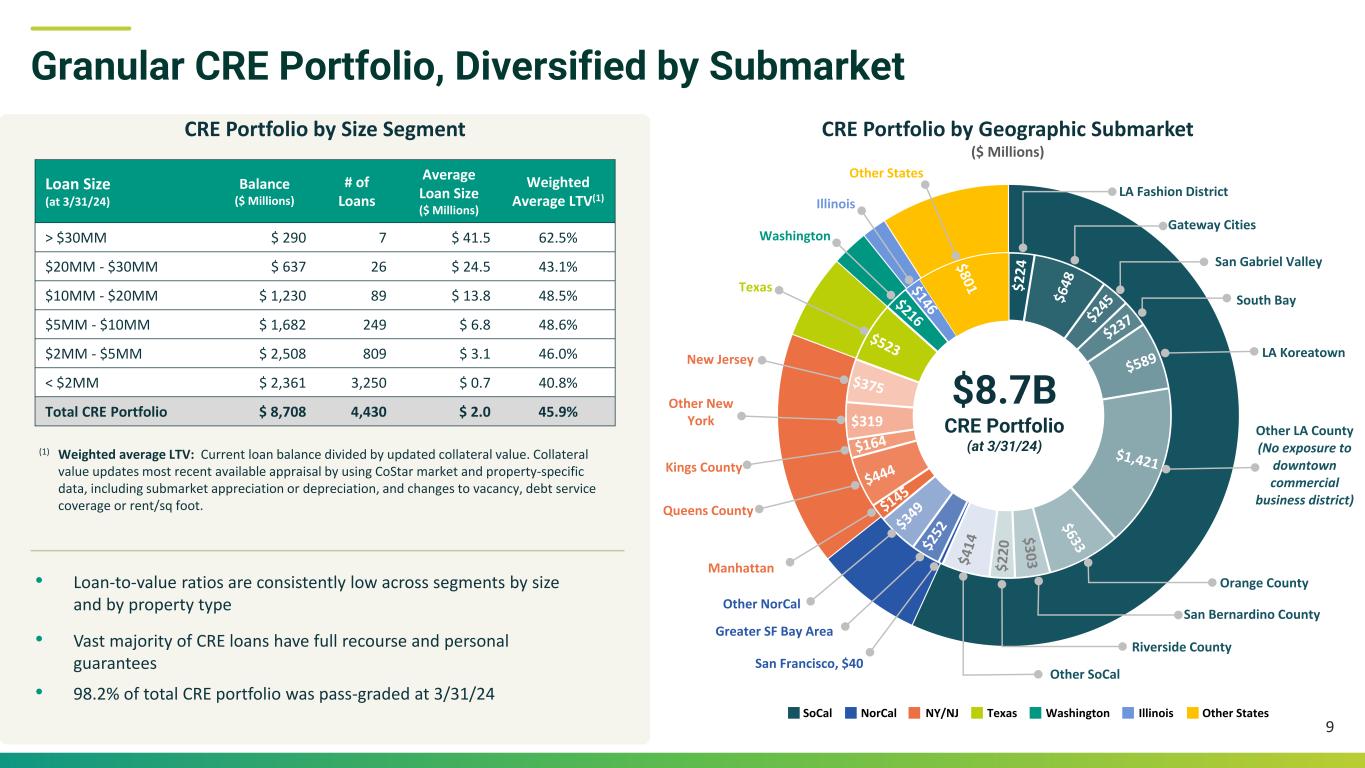
Loans. Loans receivable of $13.72 billion at March 31, 2024, decreased 1% from $13.85 billion at December 31, 2023, reflecting declines in commercial and commercial real estate loans, partially offset by strong growth in residential mortgage loans.
The following table sets forth the loan portfolio composition at March 31, 2024, December 31, 2023, and March 31, 2023:
|
|
|
|
|
|
|
|
|
|
|
|
|
|
|
|
|
|
|
|
|
|
|
|
|
|
|
|
|
|
|
|
|
|
|
|
| (dollars in thousands) (unaudited) |
3/31/2024 |
|
12/31/2023 |
|
3/31/2023 |
|
Balance |
|
Percentage |
|
Balance |
|
Percentage |
|
Balance |
|
Percentage |
| Commercial real estate (“CRE”) loans |
$ |
8,707,673 |
|
|
63.5 |
% |
|
$ |
8,797,884 |
|
|
63.6 |
% |
|
$ |
9,373,529 |
|
|
62.2 |
% |
| Commercial and industrial (“C&I”) loans |
4,041,063 |
|
|
29.5 |
% |
|
4,135,044 |
|
|
29.8 |
% |
|
4,821,270 |
|
|
32.0 |
% |
| Residential mortgage and other loans |
970,442 |
|
|
7.0 |
% |
|
920,691 |
|
|
6.6 |
% |
|
870,050 |
|
|
5.8 |
% |
| Loans receivable |
$ |
13,719,178 |
|
|
100.0 |
% |
|
$ |
13,853,619 |
|
|
100.0 |
% |
|
$ |
15,064,849 |
|
|
100.0 |
% |
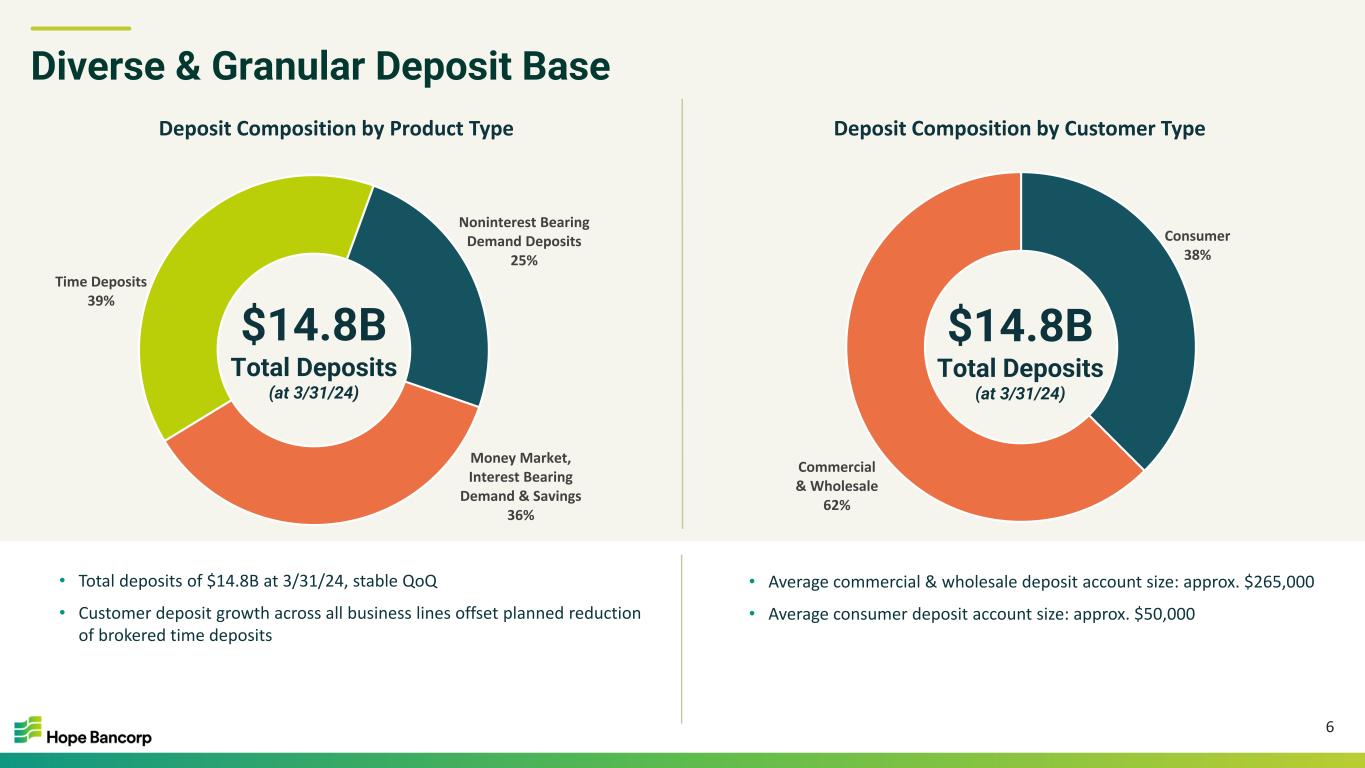
Deposits. Total deposits were stable quarter-over-quarter with total deposits of $14.75 billion at March 31, 2024 and December 31, 2023, reflecting growth in customer deposits that offset a planned reduction of brokered deposits. During the first quarter of 2024, the Company reduced brokered time deposits by $182.7 million, or 13% from December 31, 2023.
The following table sets forth the deposit composition at March 31, 2024, December 31, 2023, and March 31, 2023:
|
|
|
|
|
|
|
|
|
|
|
|
|
|
|
|
|
|
|
|
|
|
|
|
|
|
|
|
|
|
|
|
|
|
|
|
| (dollars in thousands) (unaudited) |
3/31/2024 |
|
12/31/2023 |
|
3/31/2023 |
|
Balance |
|
Percentage |
|
Balance |
|
Percentage |
|
Balance |
|
Percentage |
| Noninterest bearing demand deposits |
$ |
3,652,592 |
|
|
24.7 |
% |
|
$ |
3,914,967 |
|
|
26.5 |
% |
|
$ |
4,504,621 |
|
|
28.4 |
% |
| Money market, interest bearing demand, and savings deposits |
5,313,064 |
|
|
36.0 |
% |
|
4,872,029 |
|
|
33.0 |
% |
|
4,563,702 |
|
|
28.9 |
% |
| Time deposits |
5,787,761 |
|
|
39.3 |
% |
|
5,966,757 |
|
|
40.5 |
% |
|
6,759,886 |
|
|
42.7 |
% |
| Total deposits |
$ |
14,753,417 |
|
|
100.0 |
% |
|
$ |
14,753,753 |
|
|
100.0 |
% |
|
$ |
15,828,209 |
|
|
100.0 |
% |
|
|
|
|
|
|
|
|
|
|
|
|
| Gross loan-to-deposit ratio |
|
|
93.0 |
% |
|
|
|
93.9 |
% |
|
|
|
96.0 |
% |
Borrowings. Federal Home Loan Bank and Federal Reserve Bank borrowings totaled $795.6 million at March 31, 2024, $1.80 billion at December 31, 2023, and $2.13 billion at March 31, 2023. The quarter-over-quarter reduction reflects the payoff of $1.00 billion of the Company’s BTFP borrowings during the 2024 first quarter.
Credit Quality and Allowance for Credit Losses
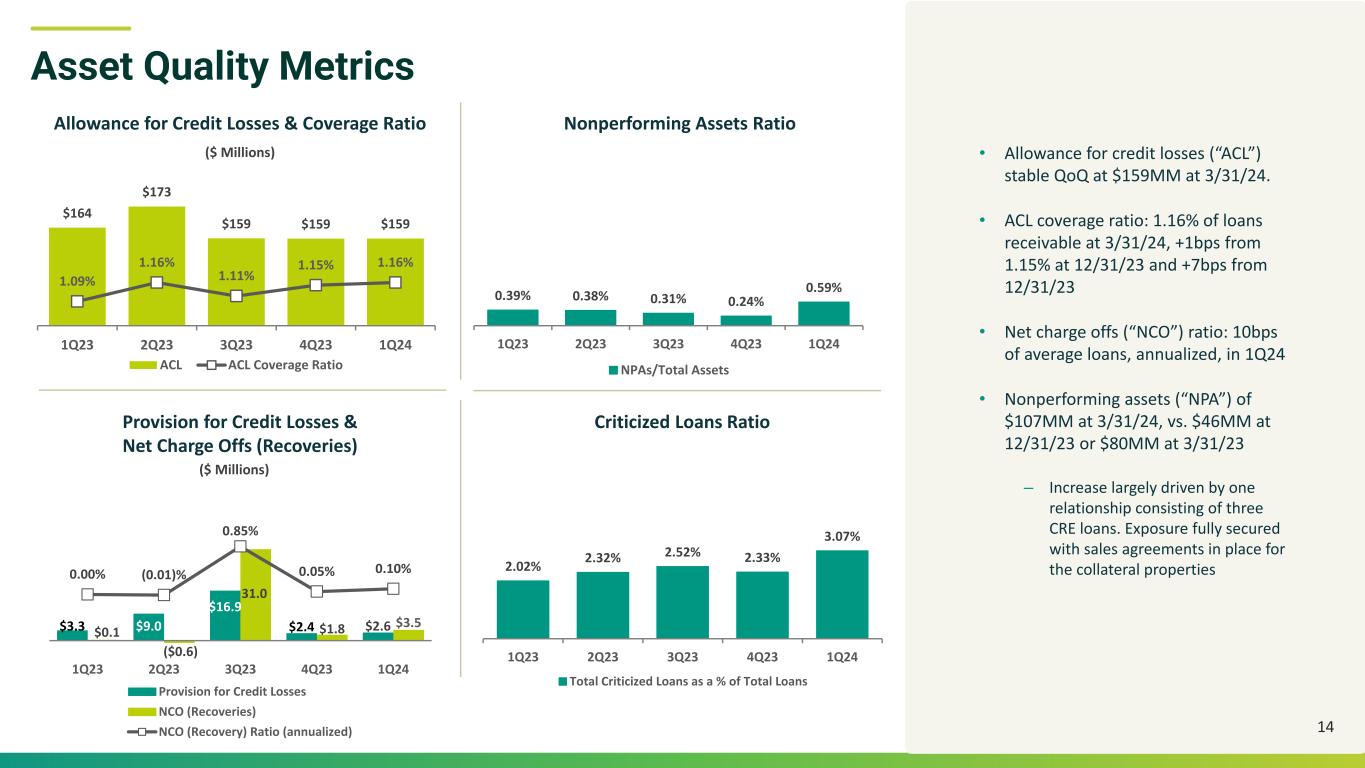
Nonperforming assets. Nonperforming assets totaled $106.8 million, or 0.59% of total assets, at March 31, 2024. This compares with nonperforming assets of $45.5 million, or 0.24% of total assets, at December 31, 2023, and $80.2 million, or 0.39% of total assets, at March 31, 2023. The quarter-over-quarter increase in nonperforming assets largely reflects one relationship consisting of three commercial real estate loans that were accruing delinquent loans past due 90 days or more at March 31, 2024. These loans are fully secured and sales agreements are in place for the collateral properties.
The following table sets forth the components of nonperforming assets at March 31, 2024, December 31, 2023, and March 31, 2023:
|
|
|
|
|
|
|
|
|
|
|
|
|
|
|
|
|
|
|
|
|
|
|
|
|
|
|
| (dollars in thousands) (unaudited) |
3/31/2024 |
|
12/31/2023 |
|
3/31/2023 |
Loans on nonaccrual status (1) |
$ |
59,526 |
|
|
$ |
45,204 |
|
|
$ |
78,861 |
|
Accruing delinquent loans past due 90 days or more |
|
47,290 |
|
|
|
261 |
|
|
|
364 |
|
|
|
|
|
|
|
|
|
|
| Total nonperforming loans |
|
106,816 |
|
|
|
45,465 |
|
|
|
79,225 |
|
| Other real estate owned |
|
— |
|
|
|
63 |
|
|
|
938 |
|
| Total nonperforming assets |
$ |
106,816 |
|
|
$ |
45,528 |
|
|
$ |
80,163 |
|
|
|
|
|
|
|
|
|
|
| Nonperforming assets/total assets |
|
0.59 |
% |
|
|
0.24 |
% |
|
|
0.39 |
% |
_____________________________________
(1) Excludes delinquent SBA loans that are guaranteed and currently in liquidation totaling $10.9 million, $11.4 million and $7.6 million at March 31, 2024, December 31, 2023, and March 31, 2023, respectively.
Net charge offs and provision for credit losses. The Company recorded net charge offs of $3.5 million in the 2024 first quarter, equivalent to 0.10%, annualized, of average loans. This compares with net charge offs of $1.8 million, or 0.05%, annualized, of average loans in the immediately preceding fourth quarter.
The following table sets forth net charge offs and annualized net charge off ratios for the three months ended March 31, 2024, December 31, 2023, and March 31, 2023:
|
|
|
|
|
|
|
|
|
|
|
|
|
|
|
|
|
|
|
|
|
|
|
|
|
|
|
|
|
|
|
|
|
|
For the Three Months Ended |
|
|
|
| (dollars in thousands) (unaudited) |
3/31/2024 |
|
12/31/2023 |
|
3/31/2023 |
|
|
|
|
|
|
| Net charge offs |
$ |
3,536 |
|
|
$ |
1,815 |
|
|
$ |
108 |
|
|
|
|
|
|
|
| Net charge offs/average loans receivable (annualized) |
|
0.10 |
% |
|
|
0.05 |
% |
|
|
— |
% |
|
|
|
|
|
|
For the 2024 first quarter, the Company recorded a provision for credit losses of $2.6 million. This compares with a provision for credit losses of $2.4 million in the immediately preceding fourth quarter.
Allowance for credit losses. The allowance for credit losses totaled $158.8 million at March 31, 2024, compared with $158.7 million at December 31, 2023. The allowance coverage ratio was 1.16% of loans receivable at March 31, 2024, up one basis point from 1.15% at December 31, 2023. Year-over-year, allowance coverage of loans receivable increased from 1.09% at March 31, 2023.
The following table sets forth the allowance for credit losses and the coverage ratios at March 31, 2024, December 31, 2023, and March 31, 2023:
|
|
|
|
|
|
|
|
|
|
|
|
|
|
|
|
|
|
|
|
|
|
|
|
|
|
|
| (dollars in thousands) (unaudited) |
3/31/2024 |
|
12/31/2023 |
|
3/31/2023 |
| Allowance for credit losses |
$ |
158,758 |
|
|
$ |
158,694 |
|
|
$ |
163,544 |
|
| Allowance for credit losses/loans receivable |
|
1.16 |
% |
|
|
1.15 |
% |
|
|
1.09 |
% |
Capital
The Company’s capital ratios are strong and all regulatory risk-based capital ratios expanded quarter-over-quarter and year-over-year. At March 31, 2024, the Company and the Bank continued to exceed all regulatory capital requirements generally required to meet the definition of a “well-capitalized” financial institution. The following table sets forth the capital ratios for the Company at March 31, 2024, December 31, 2023, and March 31, 2023:
|
|
|
|
|
|
|
|
|
|
|
|
|
|
|
|
|
|
|
|
|
|
|
|
(unaudited) |
3/31/2024 |
|
12/31/2023 |
|
3/31/2023 |
|
Minimum Guideline for “Well-Capitalized” |
| Common Equity Tier 1 Capital Ratio |
12.47% |
|
12.28% |
|
10.75% |
|
6.50% |
| Tier 1 Capital Ratio |
13.17% |
|
12.96% |
|
11.36% |
|
8.00% |
| Total Capital Ratio |
14.19% |
|
13.92% |
|
12.25% |
|
10.00% |
| Leverage Ratio |
10.42% |
|
10.11% |
|
10.13% |
|
5.00% |
At March 31, 2024, total stockholders’ equity was $2.11 billion, or $17.51 per common share. Quarter-over-quarter, stockholders’ equity decreased slightly by $9.0 million, primarily reflecting an adverse change in accumulated other comprehensive income (“AOCI”), partially offset by growth in retained earnings. Tangible common equity (“TCE”) per share(1) was $13.63 at March 31, 2024, compared with $13.76 at December 31, 2023, and the TCE ratio(1) was 9.33%, up 47 basis points quarter-over-quarter.
The following table sets forth the TCE per share and the TCE ratio at March 31, 2024, December 31, 2023, and March 31, 2023:
|
|
|
|
|
|
|
|
|
|
|
|
|
|
|
|
|
|
| (unaudited) |
3/31/2024 |
|
12/31/2023 |
|
3/31/2023 |
TCE per share (1) |
$13.63 |
|
$13.76 |
|
$13.26 |
TCE ratio (1) |
9.33% |
|
8.86% |
|
7.91% |
__________________
(1) TCE per share and TCE ratio are non-GAAP financial measures. Quantitative reconciliations of the most directly comparable GAAP to non-GAAP financial measures are provided in the accompanying financial information on Table Pages 9 and 10.
Investor Conference Call
The Company previously announced that it will host an investor conference call on Monday, April 29, 2024, at 9:30 a.m. Pacific Time / 12:30 p.m. Eastern Time to review unaudited financial results for its first quarter ended March 31, 2024. Investors and analysts are invited to access the conference call by dialing 866-235-9917 (domestic) or 412-902-4103 (international) and asking for the “Hope Bancorp Call.” A presentation to accompany the earnings call, along with a presentation regarding the proposed Territorial merger, will be available at the Investor Relations section of Hope Bancorp’s website at www.ir-hopebancorp.com. Other interested parties are invited to listen to a live webcast of the call available at the Investor Relations section of Hope Bancorp’s website. After the live webcast, a replay will remain available at the Investor Relations section of Hope Bancorp’s website for at least one year. A telephonic replay of the call will be available at 877-344-7529 (domestic) or 412-317-0088 (international) for one week through May 6, 2024, replay access code 4889007.
Non-GAAP Financial Metrics
This news release and accompanying financial tables contain certain non-GAAP financial measure disclosures, including net income excluding notable items, earnings per share excluding notable items, noninterest expense excluding notable items, TCE per share, TCE ratio, ROA excluding notable items, ROE excluding notable items, ROTCE, ROTCE excluding notable items, efficiency ratio excluding notable items and noninterest expense / average assets excluding notable items. Management believes these non-GAAP financial measures provide meaningful supplemental information regarding the Company’s operational performance and the Company’s capital levels and has included these figures in response to market participant interest in these financial metrics. Quantitative reconciliations of the most directly comparable GAAP to non-GAAP financial measures are provided in the accompanying financial information on Table Pages 9 and 10.
About Hope Bancorp, Inc.
Hope Bancorp, Inc. (NASDAQ: HOPE) is the holding company of Bank of Hope, the first and only super regional Korean American bank in the United States with $18.09 billion in total assets as of March 31, 2024. Headquartered in Los Angeles and serving a multi-ethnic population of customers across the nation, the Bank provides a full suite of commercial, corporate and consumer loans, including commercial and commercial real estate lending, SBA lending, residential mortgage and other consumer lending; deposit and fee-based products and services; international trade financing; cash management services, foreign currency exchange solutions, and interest rate derivative products, among others. Bank of Hope operates 48 full-service branches in California, Washington, Texas, Illinois, New York, New Jersey, Virginia, Alabama, and Georgia. The Bank also operates SBA loan production offices, commercial loan production offices, and residential mortgage loan production offices in the United States; and a representative office in Seoul, Korea. Bank of Hope is a California-chartered bank, and its deposits are insured by the FDIC to the extent provided by law. Bank of Hope is an Equal Opportunity Lender. For additional information, please go to www.bankofhope.com. By including the foregoing website address link, the Company does not intend to and shall not be deemed to incorporate by reference any material contained or accessible therein.
About Territorial Bancorp Inc.
Territorial Bancorp Inc. (NASDAQ: TBNK), headquartered in Honolulu, Hawai‘i, is the stock holding company for Territorial Savings Bank. Territorial Savings Bank is a state-chartered savings bank which was originally chartered in 1921 by the Territory of Hawai‘i. Territorial Savings Bank conducts business from its headquarters in Honolulu, Hawai‘i and has 28 branch offices in the state of Hawai‘i. For additional information, please visit Territorial’s website at: https://www.tsbhawaii.bank. By including the foregoing website address link, Territorial does not intend to and shall not be deemed to incorporate by reference any material contained or accessible therein.
Additional Information and Where to Find It
In connection with the proposed merger, Hope Bancorp, Inc. will file with the Securities and Exchange Commission (“SEC”) a Registration Statement on Form S-4, which will include a Proxy Statement of Territorial Bancorp Inc., that also constitutes a prospectus of Hope Bancorp, Inc. Territorial Bancorp shareholders are encouraged to read the Registration Statement and the Proxy Statement/Prospectus regarding the merger when it becomes available and any other relevant documents filed with the SEC, as well as any amendments or supplements to those documents, because they will contain important information about the proposed merger. Territorial Bancorp shareholders will be able to obtain a free copy of the Proxy Statement/Prospectus, as well as other filings containing information about Hope Bancorp and Territorial Bancorp at the SEC’s Internet site (www.sec.gov). Territorial Bancorp shareholders will also be able to obtain these documents, free of charge, from Territorial Bancorp at https://www.tsbhawaii.bank/tsb/investor-relations/.
Participants in Solicitation
Territorial Bancorp and its directors, executive officers, management and employees may be deemed to be participants in the solicitation of proxies in respect of the merger. Information concerning Territorial Bancorp’s participants is set forth in the Proxy Statement, dated April 16, 2024, for Territorial Bancorp’s 2024 annual meeting of stockholders as filed with the SEC on Schedule 14A. Additional information regarding the interests of participants of Territorial Bancorp in the solicitation of proxies in respect of the merger will be included in the Registration Statement and Proxy Statement/Prospectus to be filed with the SEC.
Forward-Looking Statements
Some statements in this news release may constitute forward-looking statements within the meaning of Section 27A of the Securities Act of 1933, as amended, and Section 21E of the Securities Exchange Act of 1934, as amended. These forward-looking statements relate to, among other things, expectations regarding Territorial Bancorp’s low-cost core deposit base, strengthening of profitability, diversification of franchise, and statements about the proposed transaction being immediately accretive. Forward-looking statements include, but are not limited to, statements preceded by, followed by or that include the words “will,” “believes,” “expects,” “anticipates,” “intends,” “plans,” “estimates” or similar expressions. With respect to any such forward-looking statements, Hope Bancorp and Territorial Bancorp each claims the protection provided for in the Private Securities Litigation Reform Act of 1995. These statements involve risks and uncertainties. Hope Bancorp’s actual results, performance or achievements may differ significantly from the results, performance or achievements expressed or implied in any forward-looking statements. The closing of the proposed transaction is subject to regulatory approvals, the approval of Territorial Bancorp shareholders, and other customary closing conditions. There is no assurance that such conditions will be met or that the proposed merger will be consummated within the expected time frame, or at all. If the transaction is consummated, factors that may cause actual outcomes to differ from what is expressed or forecasted in these forward-looking statements include, among things: difficulties and delays in integrating Hope Bancorp and Territorial Bancorp and achieving anticipated synergies, cost savings and other benefits from the transaction; higher than anticipated transaction costs; deposit attrition, operating costs, customer loss and business disruption following the merger, including difficulties in maintaining relationships with employees and customers, may be greater than expected; and required governmental approvals of the merger may not be obtained on its proposed terms and schedule, or without regulatory constraints that may limit growth. Other risks and uncertainties include, but are not limited to: possible further deterioration in economic conditions in Hope Bancorp’s areas of operation or elsewhere; interest rate risk associated with volatile interest rates and related asset-liability matching risk; liquidity risks; risk of significant non-earning assets, and net credit losses that could occur, particularly in times of weak economic conditions or times of rising interest rates; the failure of or changes to assumptions and estimates underlying Hope Bancorp’s allowances for credit losses; potential increases in deposit insurance assessments and regulatory risks associated with current and future regulations; the outcome of any legal proceedings that may be instituted against Hope Bancorp; the risk that any announcements relating to the proposed transaction could have adverse effects on the market price of the common stock of Hope Bancorp; and diversion of management’s attention from ongoing business operations and opportunities. For additional information concerning these and other risk factors, see Hope Bancorp’s most recent Annual Report on Form 10-K. Hope Bancorp does not undertake, and specifically disclaims any obligation, to update any forward-looking statements to reflect the occurrence of events or circumstances after the date of such statements except as required by law.
Contacts:
|
|
|
|
|
|
|
|
|
Julianna Balicka |
|
Angie Yang |
| EVP & Chief Financial Officer |
|
SVP, Director of Investor Relations & Corporate Communications |
213-235-3235 |
|
213-251-2219 |
julianna.balicka@bankofhope.com |
|
angie.yang@bankofhope.com |
# # #
(tables follow)
Hope Bancorp, Inc.
Selected Financial Data
Unaudited (dollars in thousands, except share data)
|
|
|
|
|
|
|
|
|
|
|
|
|
|
|
|
|
|
|
|
|
|
|
|
|
|
|
|
|
|
|
|
|
|
| Assets: |
3/31/2024 |
|
12/31/2023 |
|
% change |
|
|
|
|
|
3/31/2023 |
|
% change |
| Cash and due from banks |
$ |
1,185,296 |
|
|
$ |
1,928,967 |
|
|
(39) |
% |
|
|
|
|
|
$ |
2,212,637 |
|
|
(46) |
% |
| Investment securities |
2,277,990 |
|
|
2,408,971 |
|
|
(5) |
% |
|
|
|
|
|
2,231,989 |
|
|
2 |
% |
|
|
|
|
|
|
|
|
|
|
|
|
|
|
| Federal Home Loan Bank (“FHLB”) stock and other investments |
61,175 |
|
|
61,000 |
|
|
— |
% |
|
|
|
|
|
59,962 |
|
|
2 |
% |
| Loans held for sale, at the lower of cost or fair value |
2,763 |
|
|
3,408 |
|
|
(19) |
% |
|
|
|
|
|
125,268 |
|
|
(98) |
% |
| Loans receivable |
13,719,178 |
|
|
13,853,619 |
|
|
(1) |
% |
|
|
|
|
|
15,064,849 |
|
|
(9) |
% |
| Allowance for credit losses |
(158,758) |
|
|
(158,694) |
|
|
— |
% |
|
|
|
|
|
(163,544) |
|
|
(3) |
% |
| Net loans receivable |
13,560,420 |
|
|
13,694,925 |
|
|
(1) |
% |
|
|
|
|
|
14,901,305 |
|
|
(9) |
% |
| Accrued interest receivable |
60,316 |
|
|
61,720 |
|
|
(2) |
% |
|
|
|
|
|
57,021 |
|
|
6 |
% |
| Premises and equipment, net |
50,541 |
|
|
50,611 |
|
|
— |
% |
|
|
|
|
|
47,887 |
|
|
6 |
% |
|
|
|
|
|
|
|
|
|
|
|
|
|
|
| Goodwill and intangible assets |
467,984 |
|
|
468,385 |
|
|
— |
% |
|
|
|
|
|
469,728 |
|
|
— |
% |
|
|
|
|
|
|
|
|
|
|
|
|
|
|
|
|
|
|
|
|
|
|
|
|
|
|
|
|
| Other assets |
421,729 |
|
|
453,535 |
|
|
(7) |
% |
|
|
|
|
|
463,087 |
|
|
(9) |
% |
| Total assets |
$ |
18,088,214 |
|
|
$ |
19,131,522 |
|
|
(5) |
% |
|
|
|
|
|
$ |
20,568,884 |
|
|
(12) |
% |
|
|
|
|
|
|
|
|
|
|
|
|
|
|
| Liabilities: |
|
|
|
|
|
|
|
|
|
|
|
|
|
| Deposits |
$ |
14,753,417 |
|
|
$ |
14,753,753 |
|
|
— |
% |
|
|
|
|
|
$ |
15,828,209 |
|
|
(7) |
% |
| FHLB and Federal Reserve Bank (“FRB”) borrowings |
795,634 |
|
|
1,795,726 |
|
|
(56) |
% |
|
|
|
|
|
2,130,000 |
|
|
(63) |
% |
|
|
|
|
|
|
|
|
|
|
|
|
|
|
| Subordinated debentures and convertible notes, net |
108,592 |
|
|
108,269 |
|
|
— |
% |
|
|
|
|
|
313,533 |
|
|
(65) |
% |
| Accrued interest payable |
122,467 |
|
|
168,174 |
|
|
(27) |
% |
|
|
|
|
|
53,818 |
|
|
128 |
% |
| Other liabilities |
195,834 |
|
|
184,357 |
|
|
6 |
% |
|
|
|
|
|
184,744 |
|
|
6 |
% |
| Total liabilities |
$ |
15,975,944 |
|
|
$ |
17,010,279 |
|
|
(6) |
% |
|
|
|
|
|
$ |
18,510,304 |
|
|
(14) |
% |
|
|
|
|
|
|
|
|
|
|
|
|
|
|
| Stockholders’ Equity: |
|
|
|
|
|
|
|
|
|
|
|
|
|
| Common stock, $0.001 par value |
$ |
138 |
|
|
$ |
138 |
|
|
— |
% |
|
|
|
|
|
$ |
137 |
|
|
1 |
% |
| Additional paid-in capital |
1,439,484 |
|
|
1,439,963 |
|
|
— |
% |
|
|
|
|
|
1,430,977 |
|
|
1 |
% |
| Retained earnings |
1,159,593 |
|
|
1,150,547 |
|
|
1 |
% |
|
|
|
|
|
1,106,390 |
|
|
5 |
% |
| Treasury stock, at cost |
(264,667) |
|
|
(264,667) |
|
|
— |
% |
|
|
|
|
|
(264,667) |
|
|
— |
% |
| Accumulated other comprehensive loss, net |
(222,278) |
|
|
(204,738) |
|
|
(9) |
% |
|
|
|
|
|
(214,257) |
|
|
(4) |
% |
| Total stockholders’ equity |
2,112,270 |
|
|
2,121,243 |
|
|
— |
% |
|
|
|
|
|
2,058,580 |
|
|
3 |
% |
| Total liabilities and stockholders’ equity |
$ |
18,088,214 |
|
|
$ |
19,131,522 |
|
|
(5) |
% |
|
|
|
|
|
$ |
20,568,884 |
|
|
(12) |
% |
|
|
|
|
|
|
|
|
|
|
|
|
|
|
| Common stock shares - authorized |
150,000,000 |
|
|
150,000,000 |
|
|
|
|
|
|
|
|
150,000,000 |
|
|
|
| Common stock shares - outstanding |
120,610,029 |
|
|
120,126,786 |
|
|
|
|
|
|
|
|
119,865,732 |
|
|
|
| Treasury stock shares |
17,382,835 |
|
|
17,382,835 |
|
|
|
|
|
|
|
|
17,382,835 |
|
|
|
Hope Bancorp, Inc.
Selected Financial Data
Unaudited (dollars in thousands, except share and per share data)
|
|
|
|
|
|
|
|
|
|
|
|
|
|
|
|
|
|
|
|
|
|
|
|
|
|
|
|
|
|
|
|
|
|
|
|
|
|
|
Three Months Ended |
|
|
|
|
|
3/31/2024 |
|
12/31/2023 |
|
% change |
|
3/31/2023 |
|
% change |
|
|
|
|
|
|
|
|
|
|
|
|
|
|
|
|
|
|
|
|
|
|
|
|
|
|
| Interest and fees on loans |
$ |
213,626 |
|
|
$ |
221,020 |
|
|
(3) |
% |
|
$ |
215,935 |
|
|
(1) |
% |
|
|
|
|
|
|
|
|
| Interest on investment securities |
18,049 |
|
|
18,398 |
|
|
(2) |
% |
|
15,125 |
|
|
19 |
% |
|
|
|
|
|
|
|
|
| Interest on cash and deposits at other banks |
27,183 |
|
|
29,029 |
|
|
(6) |
% |
|
4,922 |
|
|
452% |
|
|
|
|
|
|
|
|
| Interest on other investments and FHLB dividends |
816 |
|
|
777 |
|
|
5 |
% |
|
695 |
|
|
17 |
% |
|
|
|
|
|
|
|
|
| Total interest income |
259,674 |
|
|
269,224 |
|
|
(4) |
% |
|
236,677 |
|
|
10 |
% |
|
|
|
|
|
|
|
|
|
|
|
|
|
|
|
|
|
|
|
|
|
|
|
|
|
|
| Interest on deposits |
124,033 |
|
|
121,305 |
|
|
2 |
% |
|
92,348 |
|
|
34 |
% |
|
|
|
|
|
|
|
|
| Interest on borrowings |
20,594 |
|
|
22,003 |
|
|
(6) |
% |
|
10,451 |
|
|
97 |
% |
|
|
|
|
|
|
|
|
| Total interest expense |
144,627 |
|
|
143,308 |
|
|
1 |
% |
|
102,799 |
|
|
41 |
% |
|
|
|
|
|
|
|
|
|
|
|
|
|
|
|
|
|
|
|
|
|
|
|
|
|
|
| Net interest income before provision |
115,047 |
|
|
125,916 |
|
|
(9) |
% |
|
133,878 |
|
|
(14) |
% |
|
|
|
|
|
|
|
|
| Provision for credit losses |
2,600 |
|
|
2,400 |
|
|
8 |
% |
|
3,320 |
|
|
(22) |
% |
|
|
|
|
|
|
|
|
|
|
|
|
|
|
|
|
|
|
|
|
|
|
|
|
|
|
| Net interest income after provision |
112,447 |
|
|
123,516 |
|
|
(9) |
% |
|
130,558 |
|
|
(14) |
% |
|
|
|
|
|
|
|
|
|
|
|
|
|
|
|
|
|
|
|
|
|
|
|
|
|
|
| Service fees on deposit accounts |
2,587 |
|
|
2,505 |
|
|
3 |
% |
|
2,221 |
|
|
16 |
% |
|
|
|
|
|
|
|
|
|
|
|
|
|
|
|
|
|
|
|
|
|
|
|
|
|
|
|
|
|
|
|
|
|
|
|
|
|
|
|
|
|
|
|
|
|
|
|
|
|
|
|
|
|
|
|
|
|
|
|
|
|
|
| Net gains on sales of SBA loans |
— |
|
|
— |
|
|
— |
% |
|
2,225 |
|
|
(100) |
% |
|
|
|
|
|
|
|
|
|
|
|
|
|
|
|
|
|
|
|
|
|
|
|
|
|
|
|
|
|
|
|
|
|
|
|
|
|
|
|
|
|
|
|
|
|
|
|
|
|
|
|
|
|
|
|
|
|
|
|
|
|
|
| Other income and fees |
5,699 |
|
|
6,775 |
|
|
(16) |
% |
|
6,532 |
|
|
(13) |
% |
|
|
|
|
|
|
|
|
| Total noninterest income |
8,286 |
|
|
9,280 |
|
|
(11) |
% |
|
10,978 |
|
|
(25) |
% |
|
|
|
|
|
|
|
|
|
|
|
|
|
|
|
|
|
|
|
|
|
|
|
|
|
|
| Salaries and employee benefits |
47,836 |
|
|
47,364 |
|
|
1 |
% |
|
57,169 |
|
|
(16) |
% |
|
|
|
|
|
|
|
|
| Occupancy |
6,786 |
|
|
7,231 |
|
|
(6) |
% |
|
7,521 |
|
|
(10) |
% |
|
|
|
|
|
|
|
|
| Furniture and equipment |
5,340 |
|
|
5,302 |
|
|
1 |
% |
|
5,058 |
|
|
6 |
% |
|
|
|
|
|
|
|
|
|
|
|
|
|
|
|
|
|
|
|
|
|
|
|
|
|
|
| Data processing and communications |
2,990 |
|
|
2,976 |
|
|
— |
% |
|
2,822 |
|
|
6 |
% |
|
|
|
|
|
|
|
|
|
|
|
|
|
|
|
|
|
|
|
|
|
|
|
|
|
|
| FDIC assessment |
2,926 |
|
|
3,141 |
|
|
(7) |
% |
|
1,781 |
|
|
64 |
% |
|
|
|
|
|
|
|
|
| FDIC special assessment |
1,000 |
|
|
3,971 |
|
|
(75) |
% |
|
— |
|
|
100 |
% |
|
|
|
|
|
|
|
|
|
|
|
|
|
|
|
|
|
|
|
|
|
|
|
|
|
|
|
|
|
|
|
|
|
|
|
|
|
|
|
|
|
|
|
|
|
|
|
|
|
|
|
|
|
|
|
|
|
|
|
|
|
|
| Earned interest credit |
5,834 |
|
|
6,505 |
|
|
(10) |
% |
|
4,427 |
|
|
32 |
% |
|
|
|
|
|
|
|
|
| Restructuring costs |
143 |
|
|
11,076 |
|
|
(99) |
% |
|
— |
|
|
100 |
% |
|
|
|
|
|
|
|
|
| Merger related costs |
1,044 |
|
|
— |
|
|
100 |
% |
|
— |
|
|
100 |
% |
|
|
|
|
|
|
|
|
| Other noninterest expense |
10,940 |
|
|
11,625 |
|
|
(6) |
% |
|
9,956 |
|
|
10 |
% |
|
|
|
|
|
|
|
|
| Total noninterest expense |
84,839 |
|
|
99,191 |
|
|
(14) |
% |
|
88,734 |
|
|
(4) |
% |
|
|
|
|
|
|
|
|
| Income before income taxes |
35,894 |
|
|
33,605 |
|
|
7 |
% |
|
52,802 |
|
|
(32) |
% |
|
|
|
|
|
|
|
|
| Income tax provision |
10,030 |
|
|
7,124 |
|
|
41 |
% |
|
13,681 |
|
|
(27) |
% |
|
|
|
|
|
|
|
|
| Net income |
$ |
25,864 |
|
|
$ |
26,481 |
|
|
(2) |
% |
|
$ |
39,121 |
|
|
(34) |
% |
|
|
|
|
|
|
|
|
|
|
|
|
|
|
|
|
|
|
|
|
|
|
|
|
|
|
|
|
|
|
|
|
|
|
|
|
|
|
|
|
|
|
|
|
| Earnings Per Common Share - Diluted |
$ |
0.21 |
|
|
$ |
0.22 |
|
|
|
|
$ |
0.33 |
|
|
|
|
|
|
|
|
|
|
|
|
|
|
|
|
|
|
|
|
|
|
|
|
|
|
|
|
|
|
|
|
|
|
|
|
|
|
|
|
|
|
|
|
|
|
|
| Weighted Average Shares Outstanding - Diluted |
121,020,292 |
|
|
120,761,112 |
|
|
|
|
120,242,295 |
|
|
|
|
|
|
|
|
|
|
|
Hope Bancorp, Inc.
Selected Financial Data
Unaudited
|
|
|
|
|
|
|
|
|
|
|
|
|
|
|
|
|
|
|
|
|
|
|
|
|
|
|
|
|
|
|
|
|
|
|
|
|
|
|
|
|
|
|
|
|
|
|
|
|
|
|
|
|
|
|
|
|
|
|
|
|
|
|
|
|
|
|
|
|
|
|
|
|
|
|
|
|
|
|
|
|
|
|
|
|
|
|
|
|
|
|
|
|
|
|
|
|
|
|
|
|
|
|
|
|
|
|
|
|
|
|
|
|
|
For the Three Months Ended |
|
|
| Profitability measures (annualized): |
3/31/2024 |
|
12/31/2023 |
|
3/31/2023 |
|
|
|
|
| ROA |
0.54 |
% |
|
0.54 |
% |
|
0.82 |
% |
|
|
|
|
ROA excluding notable items (1) |
0.57 |
% |
|
0.78 |
% |
|
0.82 |
% |
|
|
|
|
| ROE |
4.87 |
% |
|
5.17 |
% |
|
7.65 |
% |
|
|
|
|
ROE excluding notable items (1) |
5.16 |
% |
|
7.49 |
% |
|
7.65 |
% |
|
|
|
|
ROTCE (1) |
6.24 |
% |
|
6.71 |
% |
|
9.93 |
% |
|
|
|
|
ROTCE excluding notable items (1) |
6.62 |
% |
|
9.71 |
% |
|
9.93 |
% |
|
|
|
|
| Net interest margin |
2.55 |
% |
|
2.70 |
% |
|
3.02 |
% |
|
|
|
|
| Efficiency ratio (not annualized) |
68.79 |
% |
|
73.37 |
% |
|
61.26 |
% |
|
|
|
|
Efficiency ratio excluding notable items (not annualized) (1) |
67.02 |
% |
|
62.24 |
% |
|
61.26 |
% |
|
|
|
|
| Noninterest expense / average assets |
1.77 |
% |
|
2.02 |
% |
|
1.86 |
% |
|
|
|
|
Noninterest expense / average assets, excluding notable items (1) |
1.73 |
% |
|
1.72 |
% |
|
1.86 |
% |
|
|
|
|
|
|
|
|
|
|
|
|
|
|
(1) ROA excluding notable items, ROE excluding notable items, ROTCE, ROTCE excluding notable items, efficiency ratio excluding notable items, and noninterest expense / average assets excluding notable items are non-GAAP financial measures. Quantitative reconciliations of the most directly comparable GAAP to non-GAAP financial measures are provided in the accompanying financial information on Table Pages 9 and 10. |
|
|
|
|
|
|
|
|
|
|
|
Hope Bancorp, Inc.
Selected Financial Data
Unaudited (dollars in thousands)
|
|
|
|
|
|
|
|
|
|
|
|
|
|
|
|
|
|
|
|
|
|
|
|
|
|
|
|
|
|
|
|
|
|
|
|
|
|
|
|
|
|
|
|
|
|
|
|
|
|
|
|
|
|
|
Three Months Ended |
|
3/31/2024 |
|
12/31/2023 |
|
3/31/2023 |
|
|
|
Interest |
|
Annualized |
|
|
|
Interest |
|
Annualized |
|
|
|
Interest |
|
Annualized |
|
Average |
|
Income/ |
|
Average |
|
Average |
|
Income/ |
|
Average |
|
Average |
|
Income/ |
|
Average |
|
Balance |
|
Expense |
|
Yield/Cost |
|
Balance |
|
Expense |
|
Yield/Cost |
|
Balance |
|
Expense |
|
Yield/Cost |
| INTEREST EARNING ASSETS: |
|
|
|
|
|
|
|
|
|
|
|
|
|
|
|
|
|
| Loans, including loans held for sale |
$ |
13,746,219 |
|
|
$ |
213,626 |
|
|
6.25 |
% |
|
$ |
14,052,953 |
|
|
$ |
221,020 |
|
|
6.24 |
% |
|
$ |
15,235,386 |
|
|
$ |
215,935 |
|
|
5.75 |
% |
| Investment securities |
2,317,154 |
|
|
18,049 |
|
|
3.13 |
% |
|
2,283,613 |
|
|
18,398 |
|
|
3.20 |
% |
|
2,248,479 |
|
|
15,125 |
|
|
2.73 |
% |
Interest earning cash and deposits at
other banks |
2,019,769 |
|
|
27,183 |
|
|
5.41 |
% |
|
2,142,147 |
|
|
29,029 |
|
|
5.38 |
% |
|
473,344 |
|
|
4,922 |
|
|
4.22 |
% |
| FHLB stock and other investments |
48,136 |
|
|
816 |
|
|
6.82 |
% |
|
47,587 |
|
|
777 |
|
|
6.48 |
% |
|
47,043 |
|
|
695 |
|
|
5.99 |
% |
| Total interest earning assets |
$ |
18,131,278 |
|
|
$ |
259,674 |
|
|
5.76 |
% |
|
$ |
18,526,300 |
|
|
$ |
269,224 |
|
|
5.77 |
% |
|
$ |
18,004,252 |
|
|
$ |
236,677 |
|
|
5.33 |
% |
|
|
|
|
|
|
|
|
|
|
|
|
|
|
|
|
|
|
| INTEREST BEARING LIABILITIES: |
|
|
|
|
|
|
|
|
|
|
|
|
|
|
|
|
|
| Deposits: |
|
|
|
|
|
|
|
|
|
|
|
|
|
|
|
|
|
Money market, interest bearing demand and
savings |
$ |
5,072,782 |
|
|
$ |
50,145 |
|
|
3.98 |
% |
|
$ |
4,821,222 |
|
|
$ |
45,662 |
|
|
3.76 |
% |
|
$ |
5,597,251 |
|
|
$ |
42,226 |
|
|
3.06 |
% |
|
|
|
|
|
|
|
|
|
|
|
|
|
|
|
|
|
|
| Time deposits |
5,985,501 |
|
|
73,888 |
|
|
4.96 |
% |
|
6,327,191 |
|
|
75,643 |
|
|
4.74 |
% |
|
5,543,369 |
|
|
50,122 |
|
|
3.67 |
% |
| Total interest bearing deposits |
11,058,283 |
|
|
124,033 |
|
|
4.51 |
% |
|
11,148,413 |
|
|
121,305 |
|
|
4.32 |
% |
|
11,140,620 |
|
|
92,348 |
|
|
3.36 |
% |
| FHLB and FRB borrowings |
1,683,334 |
|
|
17,853 |
|
|
4.27 |
% |
|
1,795,740 |
|
|
19,224 |
|
|
4.25 |
% |
|
676,444 |
|
|
6,698 |
|
|
4.02 |
% |
|
|
|
|
|
|
|
|
|
|
|
|
|
|
|
|
|
|
Subordinated debentures and convertible
notes |
104,493 |
|
|
2,741 |
|
|
10.38 |
% |
|
104,198 |
|
|
2,779 |
|
|
10.44 |
% |
|
319,905 |
|
|
3,753 |
|
|
4.69 |
% |
| Total interest bearing liabilities |
$ |
12,846,110 |
|
|
$ |
144,627 |
|
|
4.53 |
% |
|
$ |
13,048,351 |
|
|
$ |
143,308 |
|
|
4.36 |
% |
|
$ |
12,136,969 |
|
|
$ |
102,799 |
|
|
3.44 |
% |
| Noninterest bearing demand deposits |
3,803,870 |
|
|
|
|
|
|
4,113,680 |
|
|
|
|
|
|
4,662,081 |
|
|
|
|
|
| Total funding liabilities/cost of funds |
$ |
16,649,980 |
|
|
|
|
3.49 |
% |
|
$ |
17,162,031 |
|
|
|
|
3.31 |
% |
|
$ |
16,799,050 |
|
|
|
|
2.48 |
% |
| Net interest income/net interest spread |
|
|
$ |
115,047 |
|
|
1.23 |
% |
|
|
|
$ |
125,916 |
|
|
1.41 |
% |
|
|
|
$ |
133,878 |
|
|
1.89 |
% |
| Net interest margin |
|
|
|
|
2.55 |
% |
|
|
|
|
|
2.70 |
% |
|
|
|
|
|
3.02 |
% |
|
|
|
|
|
|
|
|
|
|
|
|
|
|
|
|
|
|
| Cost of deposits: |
|
|
|
|
|
|
|
|
|
|
|
|
|
|
|
|
|
| Noninterest bearing demand deposits |
$ |
3,803,870 |
|
|
$ |
— |
|
|
— |
% |
|
$ |
4,113,680 |
|
|
$ |
— |
|
|
— |
% |
|
$ |
4,662,081 |
|
|
$ |
— |
|
|
— |
% |
| Interest bearing deposits |
11,058,283 |
|
|
124,033 |
|
|
4.51 |
% |
|
11,148,413 |
|
|
121,305 |
|
|
4.32 |
% |
|
11,140,620 |
|
|
92,348 |
|
|
3.36 |
% |
| Total deposits |
$ |
14,862,153 |
|
|
$ |
124,033 |
|
|
3.36 |
% |
|
$ |
15,262,093 |
|
|
$ |
121,305 |
|
|
3.15 |
% |
|
$ |
15,802,701 |
|
|
$ |
92,348 |
|
|
2.37 |
% |
Hope Bancorp, Inc.
Selected Financial Data
Unaudited (dollars in thousands)
|
|
|
|
|
|
|
|
|
|
|
|
|
|
|
|
|
|
|
|
|
|
|
|
|
|
|
|
|
|
|
|
|
|
|
|
|
Three Months Ended |
|
|
| AVERAGE BALANCES: |
3/31/2024 |
|
12/31/2023 |
|
% change |
|
3/31/2023 |
|
% change |
|
|
|
|
|
|
| Loans, including loans held for sale |
$ |
13,746,219 |
|
|
$ |
14,052,953 |
|
|
(2) |
% |
|
$ |
15,235,386 |
|
|
(10) |
% |
|
|
|
|
|
|
| Investment securities |
2,317,154 |
|
|
2,283,613 |
|
|
1 |
% |
|
2,248,479 |
|
|
3 |
% |
|
|
|
|
|
|
| Interest earning cash and deposits at other banks |
2,019,769 |
|
|
2,142,147 |
|
|
(6) |
% |
|
473,344 |
|
|
327 |
% |
|
|
|
|
|
|
| Interest earning assets |
18,131,278 |
|
|
18,526,300 |
|
|
(2) |
% |
|
18,004,252 |
|
|
1 |
% |
|
|
|
|
|
|
| Goodwill and intangible assets |
468,229 |
|
|
468,622 |
|
|
— |
% |
|
469,992 |
|
|
— |
% |
|
|
|
|
|
|
| Total assets |
19,140,775 |
|
|
19,600,942 |
|
|
(2) |
% |
|
19,087,170 |
|
|
— |
% |
|
|
|
|
|
|
|
|
|
|
|
|
|
|
|
|
|
|
|
|
|
|
| Noninterest bearing demand deposits |
3,803,870 |
|
|
4,113,680 |
|
|
(8) |
% |
|
4,662,081 |
|
|
(18) |
% |
|
|
|
|
|
|
| Interest bearing deposits |
11,058,283 |
|
|
11,148,413 |
|
|
(1) |
% |
|
11,140,620 |
|
|
(1) |
% |
|
|
|
|
|
|
| Total deposits |
14,862,153 |
|
|
15,262,093 |
|
|
(3) |
% |
|
15,802,701 |
|
|
(6) |
% |
|
|
|
|
|
|
| Interest bearing liabilities |
12,846,110 |
|
|
13,048,351 |
|
|
(2) |
% |
|
12,136,969 |
|
|
6 |
% |
|
|
|
|
|
|
| Stockholders’ equity |
2,126,333 |
|
|
2,048,335 |
|
|
4 |
% |
|
2,046,159 |
|
|
4 |
% |
|
|
|
|
|
|
|
|
|
|
|
|
|
|
|
|
|
|
|
|
|
|
| LOAN PORTFOLIO COMPOSITION: |
3/31/2024 |
|
12/31/2023 |
|
% change |
|
3/31/2023 |
|
% change |
|
|
|
|
|
|
| Commercial real estate (“CRE”) loans |
$ |
8,707,673 |
|
|
$ |
8,797,884 |
|
|
(1) |
% |
|
$ |
9,373,529 |
|
|
(7) |
% |
|
|
|
|
|
|
| Commercial and industrial (“C&I”) loans |
4,041,063 |
|
|
4,135,044 |
|
|
(2) |
% |
|
4,821,270 |
|
|
(16) |
% |
|
|
|
|
|
|
| Residential mortgage and other loans |
970,442 |
|
|
920,691 |
|
|
5 |
% |
|
870,050 |
|
|
12 |
% |
|
|
|
|
|
|
| Loans receivable |
13,719,178 |
|
|
13,853,619 |
|
|
(1) |
% |
|
15,064,849 |
|
|
(9) |
% |
|
|
|
|
|
|
| Allowance for credit losses |
(158,758) |
|
|
(158,694) |
|
|
— |
% |
|
(163,544) |
|
|
(3) |
% |
|
|
|
|
|
|
| Loans receivable, net |
$ |
13,560,420 |
|
|
$ |
13,694,925 |
|
|
(1) |
% |
|
$ |
14,901,305 |
|
|
(9) |
% |
|
|
|
|
|
|
|
|
|
|
|
|
|
|
|
|
|
|
|
|
|
|
| CRE LOANS BY PROPERTY TYPE: |
3/31/2024 |
|
12/31/2023 |
|
% change |
|
3/31/2023 |
|
% change |
|
|
|
|
|
|
| Multi-tenant retail |
$ |
1,666,153 |
|
|
$ |
1,704,337 |
|
|
(2) |
% |
|
$ |
1,817,874 |
|
|
(8) |
% |
|
|
|
|
|
|
| Industrial warehouses |
1,221,852 |
|
|
1,226,780 |
|
|
— |
% |
|
1,309,763 |
|
|
(7) |
% |
|
|
|
|
|
|
| Multifamily |
1,212,941 |
|
|
1,226,384 |
|
|
(1) |
% |
|
1,302,597 |
|
|
(7) |
% |
|
|
|
|
|
|
| Gas stations and car washes |
1,013,708 |
|
|
1,030,888 |
|
|
(2) |
% |
|
1,046,528 |
|
|
(3) |
% |
|
|
|
|
|
|
| Mixed-use facilities |
861,613 |
|
|
870,664 |
|
|
(1) |
% |
|
818,227 |
|
|
5 |
% |
|
|
|
|
|
|
| Hotels/motels |
786,198 |
|
|
796,267 |
|
|
(1) |
% |
|
900,990 |
|
|
(13) |
% |
|
|
|
|
|
|
| Single-tenant retail |
667,898 |
|
|
662,705 |
|
|
1 |
% |
|
706,593 |
|
|
(5) |
% |
|
|
|
|
|
|
| Office |
401,392 |
|
|
401,821 |
|
|
— |
% |
|
464,703 |
|
|
(14) |
% |
|
|
|
|
|
|
| All other |
875,918 |
|
|
878,038 |
|
|
— |
% |
|
1,006,254 |
|
|
(13) |
% |
|
|
|
|
|
|
| Total CRE loans |
$ |
8,707,673 |
|
|
$ |
8,797,884 |
|
|
(1) |
% |
|
$ |
9,373,529 |
|
|
(7) |
% |
|
|
|
|
|
|
|
|
|
|
|
|
|
|
|
|
|
|
|
|
|
|
| DEPOSIT COMPOSITION: |
3/31/2024 |
|
12/31/2023 |
|
% change |
|
3/31/2023 |
|
% change |
|
|
|
|
|
|
| Noninterest bearing demand deposits |
$ |
3,652,592 |
|
|
$ |
3,914,967 |
|
|
(7) |
% |
|
$ |
4,504,621 |
|
|
(19) |
% |
|
|
|
|
|
|
| Money market, interest bearing demand, and savings |
5,313,064 |
|
|
4,872,029 |
|
|
9 |
% |
|
4,563,702 |
|
|
16 |
% |
|
|
|
|
|
|
|
|
|
|
|
|
|
|
|
|
|
|
|
|
|
|
| Time deposits |
5,787,761 |
|
|
5,966,757 |
|
|
(3) |
% |
|
6,759,886 |
|
|
(14) |
% |
|
|
|
|
|
|
| Total deposits |
$ |
14,753,417 |
|
|
$ |
14,753,753 |
|
|
— |
% |
|
$ |
15,828,209 |
|
|
(7) |
% |
|
|
|
|
|
|
|
|
|
|
|
|
|
|
|
|
|
|
|
|
|
|
|
|
|
|
|
|
|
|
|
|
|
|
|
|
|
|
|
|
|
|
|
|
|
|
|
|
|
|
|
|
|
|
|
|
|
|
|
|
|
|
|
|
|
|
|
|
|
|
|
|
|
|
|
|
|
|
|
|
|
|
|
|
|
|
|
|
|
|
|
|
|
|
|
|
|
|
|
|
|
|
|
|
|
|
|
|
|
|
|
|
|
|
|
|
|
|
Hope Bancorp, Inc.
Selected Financial Data
Unaudited (dollars in thousands, except per share data)
|
|
|
|
|
|
|
|
|
|
|
|
|
|
|
|
|
|
|
|
|
|
|
|
|
|
|
|
|
|
|
|
|
|
|
|
|
|
|
|
|
|
|
|
|
|
|
|
|
|
|
|
|
|
|
|
|
|
|
|
|
|
|
|
|
|
|
|
|
|
|
|
|
|
|
|
|
|
|
|
|
|
|
|
|
|
|
|
|
|
|
|
|
|
|
|
|
|
|
|
|
|
|
|
|
|
|
|
|
|
|
|
|
|
|
|
|
|
|
|
|
|
|
|
|
|
|
|
|
|
|
|
|
|
|
|
|
|
|
|
|
|
|
|
|
|
|
|
|
|
|
|
|
|
|
|
| CAPITAL & CAPITAL RATIOS: |
3/31/2024 |
|
12/31/2023 |
|
3/31/2023 |
|
|
|
|
|
|
|
|
| Total stockholders’ equity |
$ |
2,112,270 |
|
|
$ |
2,121,243 |
|
|
$ |
2,058,580 |
|
|
|
|
|
|
|
|
|
| Total capital |
$ |
2,130,033 |
|
|
$ |
2,120,157 |
|
|
$ |
2,068,433 |
|
|
|
|
|
|
|
|
|
| Common equity tier 1 ratio |
12.47 |
% |
|
12.28 |
% |
|
10.75 |
% |
|
|
|
|
|
|
|
|
| Tier 1 capital ratio |
13.17 |
% |
|
12.96 |
% |
|
11.36 |
% |
|
|
|
|
|
|
|
|
| Total capital ratio |
14.19 |
% |
|
13.92 |
% |
|
12.25 |
% |
|
|
|
|
|
|
|
|
| Leverage ratio |
10.42 |
% |
|
10.11 |
% |
|
10.13 |
% |
|
|
|
|
|
|
|
|
| Total risk weighted assets |
$ |
15,011,661 |
|
|
$ |
15,230,302 |
|
|
$ |
16,886,419 |
|
|
|
|
|
|
|
|
|
| Book value per common share |
$ |
17.51 |
|
|
$ |
17.66 |
|
|
$ |
17.17 |
|
|
|
|
|
|
|
|
|
TCE per share (1) |
$ |
13.63 |
|
|
$ |
13.76 |
|
|
$ |
13.26 |
|
|
|
|
|
|
|
|
|
TCE ratio (1) |
9.33 |
% |
|
8.86 |
% |
|
7.91 |
% |
|
|
|
|
|
|
|
|
|
|
|
|
|
|
|
|
|
|
|
|
|
|
(1) TCE per share and TCE ratio are non-GAAP financial measures. Quantitative reconciliations of the most directly comparable GAAP to non-GAAP financial measures are provided in the accompanying financial information on Table Page 9. |
|
|
|
|
|
|
|
|
|
|
|
|
|
|
|
Three Months Ended |
|
|
| ALLOWANCE FOR CREDIT LOSSES CHANGES: |
3/31/2024 |
|
12/31/2023 |
|
9/30/2023 |
|
6/30/2023 |
|
3/31/2023 |
|
|
|
|
| Balance at beginning of period |
$ |
158,694 |
|
|
$ |
158,809 |
|
|
$ |
172,996 |
|
|
$ |
163,544 |
|
|
$ |
162,359 |
|
|
|
|
|
| ASU 2022-02 day 1 adoption impact |
— |
|
|
— |
|
|
— |
|
|
— |
|
|
(407) |
|
|
|
|
|
| Provision for credit loss on loans |
3,600 |
|
|
1,700 |
|
|
16,800 |
|
|
8,900 |
|
|
1,700 |
|
|
|
|
|
| Recoveries |
1,184 |
|
|
306 |
|
|
2,938 |
|
|
1,531 |
|
|
387 |
|
|
|
|
|
| Charge offs |
(4,720) |
|
|
(2,121) |
|
|
(33,925) |
|
|
(979) |
|
|
(495) |
|
|
|
|
|
| Balance at end of period |
$ |
158,758 |
|
|
$ |
158,694 |
|
|
$ |
158,809 |
|
|
$ |
172,996 |
|
|
$ |
163,544 |
|
|
|
|
|
|
|
|
|
|
|
|
|
|
|
|
|
|
|
|
|
|
|
|
|
|
|
|
|
|
|
|
|
|
|
|
|
|
|
|
|
|
|
|
|
|
|
|
3/31/2024 |
|
12/31/2023 |
|
9/30/2023 |
|
6/30/2023 |
|
3/31/2023 |
|
|
|
|
| Allowance for unfunded loan commitments |
$ |
2,843 |
|
|
$ |
3,843 |
|
|
$ |
3,143 |
|
|
$ |
3,081 |
|
|
$ |
2,971 |
|
|
|
|
|
|
|
|
|
|
|
|
|
|
|
|
|
|
|
|
|
|
|
|
|
|
|
|
|
|
|
|
|
|
Three Months Ended |
|
|
|
3/31/2024 |
|
12/31/2023 |
|
9/30/2023 |
|
6/30/2023 |
|
3/31/2023 |
|
|
|
|
| Provision for credit loss on loans |
$ |
3,600 |
|
|
$ |
1,700 |
|
|
$ |
16,800 |
|
|
$ |
8,900 |
|
|
$ |
1,700 |
|
|
|
|
|
| Provision for unfunded loan commitments |
(1,000) |
|
|
700 |
|
|
62 |
|
|
110 |
|
|
1,620 |
|
|
|
|
|
| Provision for credit losses |
$ |
2,600 |
|
|
$ |
2,400 |
|
|
$ |
16,862 |
|
|
$ |
9,010 |
|
|
$ |
3,320 |
|
|
|
|
|
|
|
|
|
|
|
|
|
|
|
|
|
|
|
|
|
|
|
|
|
|
|
|
|
|
|
|
|
Hope Bancorp, Inc.
Selected Financial Data
Unaudited (dollars in thousands)
|
|
|
|
|
|
|
|
|
|
|
|
|
|
|
|
|
|
|
|
|
|
|
|
|
|
|
|
|
|
|
|
|
|
|
|
|
|
|
|
|
|
|
|
|
|
|
|
|
Three Months Ended |
|
|
| NET LOAN CHARGE OFFS (RECOVERIES): |
3/31/2024 |
|
12/31/2023 |
|
9/30/2023 |
|
6/30/2023 |
|
3/31/2023 |
|
|
|
|
| CRE loans |
$ |
(497) |
|
|
$ |
1,560 |
|
|
$ |
(2,227) |
|
|
$ |
438 |
|
|
$ |
(109) |
|
|
|
|
|
| C&I loans |
4,072 |
|
|
138 |
|
|
33,145 |
|
|
(1,091) |
|
|
196 |
|
|
|
|
|
| Residential mortgage and other loans |
(39) |
|
|
117 |
|
|
69 |
|
|
101 |
|
|
21 |
|
|
|
|
|
| Net loan charge offs (recoveries) |
$ |
3,536 |
|
|
$ |
1,815 |
|
|
$ |
30,987 |
|
|
$ |
(552) |
|
|
$ |
108 |
|
|
|
|
|
| Net charge offs (recoveries)/average loans receivable (annualized) |
0.10 |
% |
|
0.05 |
% |
|
0.85 |
% |
|
(0.01) |
% |
|
— |
% |
|
|
|
|
|
|
|
|
|
|
|
|
|
|
|
|
|
|
|
|
|
|
|
|
|
|
|
|
|
|
|
|
|
|
|
|
|
|
|
|
|
|
|
|
|
|
|
|
|
|
|
|
| NONPERFORMING ASSETS: |
3/31/2024 |
|
12/31/2023 |
|
9/30/2023 |
|
6/30/2023 |
|
3/31/2023 |
|
|
|
|
Loans on nonaccrual status (1) |
$ |
59,526 |
|
|
$ |
45,204 |
|
|
$ |
39,081 |
|
|
$ |
61,252 |
|
|
$ |
78,861 |
|
|
|
|
|
| Accruing delinquent loans past due 90 days or more |
47,290 |
|
|
261 |
|
|
21,579 |
|
|
15,182 |
|
|
364 |
|
|
|
|
|
|
|
|
|
|
|
|
|
|
|
|
|
|
|
| Total nonperforming loans |
106,816 |
|
|
45,465 |
|
|
60,660 |
|
|
76,434 |
|
|
79,225 |
|
|
|
|
|
| Other real estate owned (“OREO”) |
— |
|
|
63 |
|
|
1,043 |
|
|
938 |
|
|
938 |
|
|
|
|
|
| Total nonperforming assets |
$ |
106,816 |
|
|
$ |
45,528 |
|
|
$ |
61,703 |
|
|
$ |
77,372 |
|
|
$ |
80,163 |
|
|
|
|
|
|
|
|
|
|
|
|
|
|
|
|
|
|
|
| Nonperforming assets/total assets |
0.59 |
% |
|
0.24 |
% |
|
0.31 |
% |
|
0.38 |
% |
|
0.39 |
% |
|
|
|
|
| Nonperforming assets/loans receivable & OREO |
0.78 |
% |
|
0.33 |
% |
|
0.43 |
% |
|
0.52 |
% |
|
0.53 |
% |
|
|
|
|
| Nonperforming assets/total capital |
5.06 |
% |
|
2.15 |
% |
|
3.04 |
% |
|
3.74 |
% |
|
3.89 |
% |
|
|
|
|
| Nonperforming loans/loans receivable |
0.78 |
% |
|
0.33 |
% |
|
0.42 |
% |
|
0.51 |
% |
|
0.53 |
% |
|
|
|
|
| Nonaccrual loans/loans receivable |
0.43 |
% |
|
0.33 |
% |
|
0.27 |
% |
|
0.41 |
% |
|
0.52 |
% |
|
|
|
|
| Allowance for credit losses/loans receivable |
1.16 |
% |
|
1.15 |
% |
|
1.11 |
% |
|
1.16 |
% |
|
1.09 |
% |
|
|
|
|
| Allowance for credit losses/nonperforming loans |
148.63 |
% |
|
349.05 |
% |
|
261.80 |
% |
|
226.33 |
% |
|
206.43 |
% |
|
|
|
|
|
|
|
|
|
|
|
|
|
|
|
|
|
|
(1) Excludes delinquent SBA loans that are guaranteed and currently in liquidation totaling $10.9 million, $11.4 million, $12.1 million, $11.9 million, and $7.6 million, at March 31, 2024, December 31, 2023, September 30, 2023, June 30, 2023, and March 31, 2023, respectively. |
|
|
|
|
|
|
|
|
|
|
|
|
|
|
|
|
|
|
|
|
|
|
|
| NONACCRUAL LOANS BY TYPE: |
3/31/2024 |
|
12/31/2023 |
|
9/30/2023 |
|
6/30/2023 |
|
3/31/2023 |
|
|
|
|
| CRE loans |
$ |
37,835 |
|
|
$ |
33,932 |
|
|
$ |
26,687 |
|
|
$ |
29,270 |
|
|
$ |
44,376 |
|
|
|
|
|
| C&I loans |
15,071 |
|
|
5,013 |
|
|
4,234 |
|
|
23,042 |
|
|
26,191 |
|
|
|
|
|
| Residential mortgage and other loans |
6,620 |
|
|
6,259 |
|
|
8,160 |
|
|
8,940 |
|
|
8,294 |
|
|
|
|
|
| Total nonaccrual loans |
$ |
59,526 |
|
|
$ |
45,204 |
|
|
$ |
39,081 |
|
|
$ |
61,252 |
|
|
$ |
78,861 |
|
|
|
|
|
|
|
|
|
|
|
|
|
|
|
|
|
|
|
|
|
|
|
|
|
|
|
|
|
|
|
|
|
|
|
|
|
|
|
|
|
|
|
|
|
|
|
|
|
|
|
|
|
|
|
|
|
|
|
|
|
|
|
|
|
|
|
|
|
|
|
|
|
|
|
|
|
|
|
|
|
|
|
|
|
|
|
|
|
|
|
|
|
|
|
|
|
|
|
|
|
|
|
|
|
|
|
|
|
|
|
|
|
|
|
|
|
|
|
|
|
|
|
|
|
|
|
|
|
|
|
|
|
|
|
|
|
|
|
|
|
|
|
|
|
|
|
|
|
|
|
|
|
|
|
|
|
|
|
|
|
|
|
|
|
|
|
|
|
|
|
|
|
|
|
|
|
|
|
|
|
|
|
|
|
|
|
|
|
|
|
|
|
|
|
|
|
|
|
|
|
Hope Bancorp, Inc.
Selected Financial Data
Unaudited (dollars in thousands)
|
|
|
|
|
|
|
|
|
|
|
|
|
|
|
|
|
|
|
|
|
|
|
|
|
|
|
|
|
|
| ACCRUING DELINQUENT LOANS 30-89 DAYS PAST DUE: |
3/31/2024 |
|
12/31/2023 |
|
9/30/2023 |
|
6/30/2023 |
|
3/31/2023 |
| 30 - 59 days past due |
$ |
2,273 |
|
|
$ |
2,833 |
|
|
$ |
2,906 |
|
|
$ |
9,295 |
|
|
$ |
7,662 |
|
| 60 - 89 days past due |
313 |
|
|
1,289 |
|
|
506 |
|
|
178 |
|
|
249 |
|
| Total accruing delinquent loans 30-89 days past due |
$ |
2,586 |
|
|
$ |
4,122 |
|
|
$ |
3,412 |
|
|
$ |
9,473 |
|
|
$ |
7,911 |
|
|
|
|
|
|
|
|
|
|
|
|
|
|
|
|
|
|
|
|
|
| ACCRUING DELINQUENT LOANS 30-89 DAYS PAST DUE BY TYPE: |
3/31/2024 |
|
12/31/2023 |
|
9/30/2023 |
|
6/30/2023 |
|
3/31/2023 |
| CRE loans |
$ |
1,639 |
|
|
$ |
2,160 |
|
|
$ |
611 |
|
|
$ |
7,339 |
|
|
$ |
3,652 |
|
| C&I loans |
551 |
|
|
1,643 |
|
|
1,168 |
|
|
990 |
|
|
419 |
|
| Residential mortgage and other loans |
396 |
|
|
319 |
|
|
1,633 |
|
|
1,144 |
|
|
3,840 |
|
| Total accruing delinquent loans 30-89 days past due |
$ |
2,586 |
|
|
$ |
4,122 |
|
|
$ |
3,412 |
|
|
$ |
9,473 |
|
|
$ |
7,911 |
|
|
|
|
|
|
|
|
|
|
|
|
|
|
|
|
|
|
|
|
|
| CRITICIZED LOANS: |
3/31/2024 |
|
12/31/2023 |
|
9/30/2023 |
|
6/30/2023 |
|
3/31/2023 |
| Special mention loans |
$ |
215,183 |
|
|
$ |
178,992 |
|
|
$ |
186,600 |
|
|
$ |
210,806 |
|
|
$ |
166,472 |
|
| Substandard loans |
206,350 |
|
|
143,449 |
|
|
174,161 |
|
|
134,203 |
|
|
138,224 |
|
|
|
|
|
|
|
|
|
|
|
| Total criticized loans |
$ |
421,533 |
|
|
$ |
322,441 |
|
|
$ |
360,761 |
|
|
$ |
345,009 |
|
|
$ |
304,696 |
|
Hope Bancorp, Inc.
Selected Financial Data
Unaudited (dollars in thousands, except share and per share data)
|
|
|
|
|
|
|
|
|
|
|
|
|
|
|
|
|
|
|
|
|
|
| Reconciliation of GAAP financial measures to non-GAAP financial measures |
|
|
|
|
|
|
Management reviews select non-GAAP financial measures in evaluating the Company’s and the Bank’s financial performance and in response to market participant interest. Reconciliations of the most directly comparable GAAP to non-GAAP financial measures utilized by management are provided below. |
|
|
|
|
|
|
|
|
|
|
|
|
Three Months Ended |
|
|
| RETURN ON AVERAGE TANGIBLE COMMON EQUITY |
3/31/2024 |
|
12/31/2023 |
|
3/31/2023 |
|
|
|
|
| Average stockholders’ equity |
$ |
2,126,333 |
|
|
$ |
2,048,335 |
|
|
$ |
2,046,159 |
|
|
|
|
|
| Less: Average goodwill and core deposit intangible assets, net |
(468,229) |
|
|
(468,622) |
|
|
(469,992) |
|
|
|
|
|
| Average TCE |
$ |
1,658,104 |
|
|
$ |
1,579,713 |
|
|
$ |
1,576,167 |
|
|
|
|
|
|
|
|
|
|
|
|
|
|
|
| Net income |
$ |
25,864 |
|
|
$ |
26,481 |
|
|
$ |
39,121 |
|
|
|
|
|
| ROTCE (annualized) |
6.24 |
% |
|
6.71 |
% |
|
9.93 |
% |
|
|
|
|
|
|
|
|
|
|
|
|
|
|
|
|
|
|
|
|
|
|
|
|
| TANGIBLE COMMON EQUITY |
3/31/2024 |
|
12/31/2023 |
|
3/31/2023 |
|
|
|
|
| Total stockholders’ equity |
$ |
2,112,270 |
|
|
$ |
2,121,243 |
|
|
$ |
2,058,580 |
|
|
|
|
|
| Less: Goodwill and core deposit intangible assets, net |
(467,984) |
|
|
(468,385) |
|
|
(469,728) |
|
|
|
|
|
| TCE |
$ |
1,644,286 |
|
|
$ |
1,652,858 |
|
|
$ |
1,588,852 |
|
|
|
|
|
|
|
|
|
|
|
|
|
|
|
| Total assets |
$ |
18,088,214 |
|
|
$ |
19,131,522 |
|
|
$ |
20,568,884 |
|
|
|
|
|
| Less: Goodwill and core deposit intangible assets, net |
(467,984) |
|
|
(468,385) |
|
|
(469,728) |
|
|
|
|
|
| Tangible assets |
$ |
17,620,230 |
|
|
$ |
18,663,137 |
|
|
$ |
20,099,156 |
|
|
|
|
|
|
|
|
|
|
|
|
|
|
|
| TCE ratio |
9.33 |
% |
|
8.86 |
% |
|
7.91 |
% |
|
|
|
|
| Common shares outstanding |
120,610,029 |
|
|
120,126,786 |
|
|
119,865,732 |
|
|
|
|
|
| TCE per share |
$ |
13.63 |
|
|
$ |
13.76 |
|
|
$ |
13.26 |
|
|
|
|
|
|
|
|
|
|
|
|
|
|
|
|
|
|
|
|
|
|
|
|
|
|
|
|
|
|
|
|
|
|
|
|
|
|
|
|
|
|
|
|
|
|
|
|
|
|
|
|
|
|
|
|
|
|
|
|
|
|
|
|
|
|
|
|
|
|
|
|
|
|
|
|
|
|
|
|
|
|
|
|
|
|
|
|
|
|
|
|
|
|
|
|
|
|
|
|
|
|
|
|
|
|
|
|
|
|
|
|
|
|
|
|
|
|
|
|
|
|
|
|
|
|
|
|
|
|
|
|
|
|
|
|
|
|
|
|
|
|
|
|
|
|
|
|
|
|
|
|
|
|
|
|
|
|
|
|
|
|
|
|
|
|
|
|
|
Hope Bancorp, Inc.
Selected Financial Data
Unaudited (dollars in thousands, except share and per share data)
|
|
|
|
|
|
|
|
|
|
|
|
|
|
|
|
|
|
|
|
|
|
|
Three Months Ended |
|
|
| PROFITABILITY RATIOS EXCLUDING NOTABLE ITEMS |
3/31/2024 |
|
12/31/2023 |
|
3/31/2023 |
|
|
|
|
| Net income |
$ |
25,864 |
|
|
$ |
26,481 |
|
|
$ |
39,121 |
|
|
|
|
|
|
|
|
|
|
|
|
|
|
|
| Notable items: |
|
|
|
|
|
|
|
|
|
| FDIC special assessment expense |
1,000 |
|
|
3,971 |
|
|
— |
|
|
|
|
|
| Restructuring costs |
143 |
|
|
11,076 |
|
|
— |
|
|
|
|
|
| Merger related costs |
1,044 |
|
|
— |
|
|
— |
|
|
|
|
|
| Total notable items |
2,187 |
|
|
15,047 |
|
|
— |
|
|
|
|
|
| Tax provision |
611 |
|
|
3,190 |
|
|
— |
|
|
|
|
|
| Less: total notable items, net of tax provision |
$ |
1,576 |
|
|
$ |
11,857 |
|
|
$ |
— |
|
|
|
|
|
|
|
|
|
|
|
|
|
|
|
| Net income excluding notable items |
$ |
27,440 |
|
|
$ |
38,338 |
|
|
$ |
39,121 |
|
|
|
|
|
|
|
|
|
|
|
|
|
|
|
| Diluted common shares |
121,020,292 |
|
|
120,761,112 |
|
|
120,242,295 |
|
|
|
|
|
| EPS excluding notable items |
$ |
0.23 |
|
|
$ |
0.32 |
|
|
$ |
0.33 |
|
|
|
|
|
| Average Assets |
19,140,775 |
|
|
19,600,942 |
|
|
19,087,170 |
|
|
|
|
|
| ROA excluding notable items |
0.57 |
% |
|
0.78 |
% |
|
0.82 |
% |
|
|
|
|
| Average Equity |
2,126,333 |
|
|
2,048,335 |
|
|
2,046,159 |
|
|
|
|
|
| ROE excluding notable items |
5.16 |
% |
|
7.49 |
% |
|
7.65 |
% |
|
|
|
|
| Average TCE |
$ |
1,658,104 |
|
|
$ |
1,579,713 |
|
|
$ |
1,576,167 |
|
|
|
|
|
| ROTCE excluding notable items |
6.62 |
% |
|
9.71 |
% |
|
9.93 |
% |
|
|
|
|
|
|
|
|
|
|
|
|
|
|
|
Three Months Ended |
|
|
| EFFICIENCY RATIOS EXCLUDING NOTABLE ITEMS |
3/31/2024 |
|
12/31/2023 |
|
3/31/2023 |
|
|
|
|
| Noninterest expense |
$ |
84,839 |
|
|
$ |
99,191 |
|
|
$ |
88,734 |
|
|
|
|
|
|
|
|
|
|
|
|
|
|
|
| Less: notable items: |
|
|
|
|
|
|
|
|
|
| FDIC special assessment expense |
(1,000) |
|
|
(3,971) |
|
|
— |
|
|
|
|
|
| Restructuring costs |
(143) |
|
|
(11,076) |
|
|
— |
|
|
|
|
|
| Merger related costs |
(1,044) |
|
|
— |
|
|
— |
|
|
|
|
|
| Noninterest expense excluding notable items |
$ |
82,652 |
|
|
$ |
84,144 |
|
|
$ |
88,734 |
|
|
|
|
|
|
|
|
|
|
|
|
|
|
|
| Revenue |
$ |
123,333 |
|
|
$ |
135,196 |
|
|
$ |
144,856 |
|
|
|
|
|
| Efficiency ratio excluding notable items |
67.02 |
% |
|
62.24 |
% |
|
61.26 |
% |
|
|
|
|
|
|
|
|
|
|
|
|
|
|
| Average assets |
19,140,775 |
|
|
19,600,942 |
|
|
19,087,170 |
|
|
|
|
|
| Noninterest expense / average assets, excluding notable items |
1.73 |
% |
|
1.72 |
% |
|
1.86 |
% |
|
|
|
|
|
|
|
|
|
|
|
|
|
|

