Document
2025: strong sales and EPS growth.
Continued profitable growth expected in 2026
Paris, January 29, 2026
Q4 sales growth of 13.3% at CER1 and business earnings per share (EPS)2 of €1.53
•Pharma launches increased sales by 49.4%, reaching €1.1 billion, primarily driven by Ayvakit and ALTUVIIIO
•Dupixent sales increased by 32.2% to €4.2 billion, a strong end to the year
•Vaccines sales decreased by 2.5% to €2.0 billion, with influenza performing better than anticipated
•Research and Development expenses reached €2.3 billion, up by 6.6%
•Selling, general and administrative expenses reached €2.7 billion, up by 9.6%, supporting launches
•Business EPS was €1.53, up by 26.7% at CER; 16.8% at actual exchange rates, delivering profitable growth; IFRS EPS -€0.66
Pipeline progress
•Ten regulatory approvals across immunology, rare diseases, and other
•Positive phase 3 readouts: amlitelimab program in AD (COAST 2, SHORE) and Dupixent in AFRS
Tolebrutinib in PPMS did not meet the primary endpoint
•Four regulatory submission acceptances, five phase 3 study starts, three regulatory designations (orphan, priority reviews)
Capital allocation
Announcement of the Dynavax acquisition3 and completion of the Vicebio acquisition
•Completion of the €5 billion share buyback program
•Proposed dividend of €4.12; up by 5.1%
Other major developments
Sanofi reached agreement with the US government to lower medicine costs while strengthening innovation
•Sanofi leads an industry working group on biopharma life cycle assessment
Guidance
•In 2026, sales are expected to grow by a high single-digit percentage at CER. Business EPS at CER is expected to grow slightly faster than sales (before share buyback), delivering profitable growth.4 Sanofi intends to execute a share buyback program in 2026 of €1 billion.
Paul Hudson, Chief Executive Officer: “In the fourth quarter, sales growth accelerated to 13.3%, delivering another strong performance. Growth was supported by new medicines and Dupixent, reaching a new quarterly high. Business EPS was up by 26.7% with the benefit of cost discipline and growth leverage. We obtained ten regulatory approvals across immunology, rare diseases, and other, and had several positive phase 3 readouts.
In 2025, we achieved a strong year of profitable growth. Sales increased by 9.9% at constant exchange rates, while business EPS improved significantly faster by 15.0%. We launched three new medicines and vaccines: Qfitlia, Wayrilz, and Nuvaxovid, providing innovative options to patients with rare diseases and COVID-19 prevention. All this was made possible by the dedicated effort of all Sanofi colleagues worldwide.
In 2026, we expect sales to grow by a high single-digit percentage and business EPS to grow slightly faster than sales. We anticipate profitable growth to continue over at least five years.”
|
|
|
|
|
|
|
|
|
|
|
|
|
|
|
|
|
|
|
|
|
|
Q4 2025 |
Change |
Change
at CER |
FY 2025 |
Change |
Change
at CER |
| Net sales |
€11,303 |
m |
+7.0 |
% |
+13.3 |
% |
€43,626 |
m |
+6.2 |
% |
+9.9 |
% |
| IFRS net income |
€(801)m |
-260.5 |
% |
— |
|
€7,813 |
m |
+40.5 |
% |
— |
|
| IFRS EPS |
€(0.66) |
-265.0 |
% |
— |
|
€6.40 |
|
+44.1 |
% |
— |
|
| Free cash flow5 |
€2,637 |
m |
+12.7 |
% |
— |
|
€8,089 |
m |
+35.8 |
% |
— |
|
| Business operating income |
€2,341 |
m |
+12.7 |
% |
+21.7 |
% |
€12,149 |
m |
+7.1 |
% |
+11.9 |
% |
| Business net income |
€1,856 |
m |
+13.0 |
% |
+22.3 |
% |
€9,555 |
m |
+7.2 |
% |
+12.1 |
% |
| Business EPS |
€1.53 |
|
+16.8 |
% |
+26.7 |
% |
€7.83 |
|
+10.0 |
% |
+15.0 |
% |
1 Changes in net sales are at constant exchange rates (CER) unless stated otherwise (definition in Appendix 9).
2 To facilitate an understanding of operational performance, Sanofi comments on the business net income, a non-IFRS financial measure (definition in
Appendix 9). The income statement is in Appendix 3 and a reconciliation of IFRS net income to business net income is in Appendix 4.
3 The acquisition of Dynavax is currently pending; it is expected to close in Q1 2026 subject to the satisfaction of customary closing conditions.
4 Applying January 2026 average currency exchange rates, the currency impacts are estimated at c.-2% on sales and at c.-3% on business EPS.
5 Free cash flow is a non-IFRS financial measure (definition in Appendix 9).
|
|
|
|
|
|
SANOFI PRESS RELEASE Q4 2025 |
1 |
Q4 and FY 2025 summary
A conference call and webcast for investors and analysts will begin at 14:30 CET with details on sanofi.com, including slides.
The performance shown in this press release covers the three-month period to December 31, 2025 (the quarter or Q4 2025) and the 12-month period to December 31, 2025 (the year or FY 2025) compared to the three-month period to December 31, 2024 (Q4 2024) and the 12-month period to December 31, 2024 (FY 2024) respectively. All percentage changes in sales in this press release are at CER, unless otherwise mentioned.
In Q4 2025, sales were €11,303 million and increased by 13.3%. Exchange rate movements had a negative effect of 6.3 percentage points (pp); therefore, at actual exchange rates, sales increased by 7.0%. The divestments of medicines/portfolio streamlining had a negative impact of 0.7pp on sales growth. In FY 2025, sales were €43,626 million and increased by 9.9%. Exchange rate movements had a negative effect of 3.7pp; therefore, at actual exchange rates, sales increased by 6.2%. The divestments of medicines/portfolio streamlining had a negative impact of 0.5pp on sales growth.
Sales by geography
|
|
|
|
|
|
|
|
|
|
|
|
|
|
|
|
Net sales
(€ million)
|
Q4 2025 |
Change
at CER |
FY 2025 |
Change
at CER |
| United States |
5,803 |
|
+22.6 |
% |
22,176 |
|
+16.3 |
% |
| Europe |
2,436 |
|
+0.2 |
% |
9,169 |
|
+1.6 |
% |
| Rest of World |
3,064 |
|
+8.0 |
% |
12,281 |
|
+5.6 |
% |
| of which China |
544 |
|
+6.2 |
% |
2,621 |
|
+2.0 |
% |
US sales were €5,803 million and increased by 22.6%. The performance was primarily driven by Dupixent, pharma launches, and influenza vaccines, partly offset by other vaccines. ALTUVIIIO exceeded the $1 billion blockbuster mark in 2025.
Europe sales were €2,436 million and increased by 0.2%. Growth was primarily driven by Dupixent, pharma launches, and influenza vaccines offset by lower sales of Beyfortus and legacy medicines.
Rest of World sales were €3,064 million and increased by 8.0%. The performance was led by Dupixent, launches, including Beyfortus, influenza vaccines, and diabetes medicines while some legacy medicines declined. China sales were €544 million and increased by 6.2% in a relatively stable market, supported by diabetes medicines and partly offset by legacy medicines and impact from the renewed national reimbursement drug list and volume-based procurement.
Business operating income
In Q4 2025, business operating income (BOI) was €2,341 million and increased by 21.7% (12.7% at actual exchange rates) from €2,078 million in Q4 2024. The ratio of BOI to net sales was 21.1% and increased by 0.4pp (20.7% at actual exchange rates, up by 1.0pp). The increase was mainly driven by higher business gross profit (up by 15.6%), slower growth in R&D expenses (up by 6.6%), and SG&A expenses (up by 9.6%), partly offset by higher Regeneron profit sharing. In FY 2025, BOI was €12,149 million and increased by 11.9% (7.1% at actual exchange rates) from 11,343 million in FY 2024. The ratio of BOI to net sales was 28.1% and increased by 0.5pp (27.8% at actual exchange rates, up by 0.2pp).
Business development
Business development, including strategic investments in external innovation is an integral part of Sanofi’s efforts to access optionality for promising scientific developments to contribute to pipeline replenishment.
Sanofi announced the completion of the $1.2 billion acquisition of Vicebio Ltd. The acquisition brings an early-stage combination vaccine candidate for respiratory syncytial virus (RSV) and human metapneumovirus (HMPV) and complements Sanofi’s position in respiratory vaccines. Furthermore, it expands the capabilities in vaccine design and development with Vicebio’s ‘Molecular Clamp’ technology.
Sanofi announced in December that it had entered into an agreement to acquire Dynavax Technologies Corporation, a publicly traded vaccines company with a US-marketed adult hepatitis B vaccine (HEPLISAV-B®), a differentiated shingles vaccine candidate, and other pipeline vaccines. The acquisition augments Sanofi’s presence in adult immunisation by bringing together Dynavax’s vaccines with Sanofi’s global scale, development capabilities and commercial reach. Under the terms of the agreement, Sanofi, through a cash tender offer, will acquire all outstanding shares of Dynavax for $15.50 per share in cash, reflecting a total equity value of approximately $2.2 billion. The tender offer is subject to customary closing conditions. Subject to the satisfaction or waiver of the closing conditions, the acquisition is anticipated to close in the first quarter of 2026.
|
|
|
|
|
|
SANOFI PRESS RELEASE Q4 2025 |
2 |
Biopharma segment
Pharma
Launches
|
|
|
|
|
|
|
|
|
|
|
|
|
|
|
|
Net sales
(€ million)
|
Q4 2025 |
Change
at CER |
FY 2025 |
Change
at CER |
| ALTUVIIIO |
324 |
|
+53.0 |
% |
1,160 |
|
+77.6 |
% |
Nexviazyme/Nexviadyme |
203 |
|
+15.8 |
% |
790 |
|
+21.4 |
% |
| Ayvakit |
168 |
|
— |
% |
305 |
|
— |
% |
| Sarclisa |
157 |
|
+27.7 |
% |
588 |
|
+28.5 |
% |
| Rezurock |
113 |
|
-6.1 |
% |
490 |
|
+8.7 |
% |
| Cablivi |
69 |
|
+1.4 |
% |
271 |
|
+12.0 |
% |
| Xenpozyme |
61 |
|
+65.8 |
% |
228 |
|
+54.3 |
% |
| Tzield |
16 |
|
0.0 |
% |
63 |
|
+22.2 |
% |
| Wayrilz |
6 |
|
— |
% |
7 |
|
— |
% |
| Qfitlia |
4 |
|
— |
% |
9 |
|
— |
% |
| Total |
1,121 |
|
+49.4 |
% |
3,911 |
|
+47.9 |
% |
ALTUVIIIO (haemophilia A) sales were €324 million of which 85% was in the US. Growth was driven by patients switching from short half-life and older extended half-life factor medicines, including Eloctate, and from non-factor treatments. Rest of World sales of €48 million benefited from the launches in Japan and Taiwan. The haemophilia A factor medicine franchise (ALTUVIIIO and Eloctate combined) sales were €387 million and increased by 35.0%, primarily driven by ALTUVIIIO’s strong performance of €324 million, while Eloctate contributed €63 million. In the year, ALTUVIIIO exceeded the €1 billion blockbuster mark globally and also the $1 billion blockbuster mark in the US.
Nexviazyme/Nexviadyme (Pompe disease) sales were €203 million and increased by 15.8%, driven by Europe (+23.7%) where patients are still switching from Myozyme/Lumizyme. In the US (+12.4%), most patients already switched. The Pompe disease franchise (Nexviazyme/Nexviadyme and Myozyme/Lumizyme combined) sales were €325 million and increased by 7.0%.
Ayvakit (mastocytosis) sales were €168 million. Sales were split between the US (€148 million) and Europe (€20 million) with continued growth in the number of patients treated. Sales growth was partly offset by shipping patterns in the US, and an element of price adjustment. In the full year, pro-forma sales reached $725 million, slightly ahead of Blueprint expectations from earlier in the year ($700-720 million). Sanofi does not hold marketing rights in China but receives royalty on sales by CStone Pharmaceuticals.
Sarclisa (multiple myeloma) sales were €157 million and increased by 27.7%, supported by high growth in all regions mainly from increased use in the transplant-ineligible, front-line combination treatment setting based on results in the IMROZ phase 3 study.
Rezurock (chronic graft-versus-host disease) sales were €113 million and decreased by 6.1%. Sales in the US decreased by 4.2% due to mandatory public rebates. Sales in Europe were -€4 million, mainly from a one-time credit in the UK. In Rest of World, sales were €12 million, the overwhelming majority from the launch in China.
Cablivi (acquired thrombotic thrombocytopenic purpura) sales were €69 million and increased by 1.4%, driven by more patients being treated in the US and Europe offset by an element of price impact in the US.
Xenpozyme (acid sphingomyelinase deficiency) sales were €61 million and increased by 65.8%, driven by Europe (+187.5%) and Rest of World (+100.0%).
Tzield (delay onset of type 1 diabetes) sales were €16 million (of which €15 million in the US) and remained broadly stable. Patient screenings continued to increase driving slight growth in the number of patients treated.
Wayrilz (immune thrombocytopenia) sales were €6 million, all in the US, following approval in August 2025.
Qfitlia (haemophilia A and B) sales were €4 million, all in the US, following approval in March 2025.
Immunology
|
|
|
|
|
|
|
|
|
|
|
|
|
|
|
|
Net sales
(€ million)
|
Q4 2025 |
Change
at CER |
FY 2025 |
Change
at CER |
| Dupixent |
4,246 |
|
+32.2 |
% |
15,714 |
|
+25.2 |
% |
Dupixent sales were €4,246 million and increased by 32.2%. Global sales exceeded four billion euros in a quarter for the second time and were driven by strong volume growth across approved indications (atopic dermatitis (AD), asthma, chronic rhinosinusitis with nasal polyposis, eosinophilic esophagitis, prurigo nodularis, chronic spontaneous urticaria, chronic obstructive pulmonary disease (COPD), and bullous pemphigoid (BP)). In the US sales were €3,182 million and increased by 35.9% driven by volume growth across approved indications from a lower basis of comparison in Q4 2024 due to gross-to-net price adjustments. In Europe, sales were €509 million and increased by 17.9%, also reflecting volume growth across approved indications. In Rest of World, sales were €555 million and increased by 25.0%, mainly driven by Brazil, China, and Japan. In FY 2025, sales were €15,714 million and increased by 25.2%, driven by strong volume growth across all indications and geographies.
|
|
|
|
|
|
SANOFI PRESS RELEASE Q4 2025 |
3 |
Other main medicines
|
|
|
|
|
|
|
|
|
|
|
|
|
|
|
|
Net sales
(€ million)
|
Q4 2025 |
Change
at CER |
FY 2025 |
Change
at CER |
| Lantus |
419 |
|
+1.1 |
% |
1,733 |
|
+10.3 |
% |
| Toujeo |
332 |
|
+18.6 |
% |
1,345 |
|
+12.0 |
% |
| Fabrazyme |
252 |
|
-1.1 |
% |
1,019 |
|
+0.1 |
% |
| Plavix |
214 |
|
+7.6 |
% |
910 |
|
+3.1 |
% |
| Lovenox |
179 |
|
-21.6 |
% |
822 |
|
-14.4 |
% |
| Cerezyme |
171 |
|
+2.9 |
% |
695 |
|
-3.9 |
% |
| Alprolix |
149 |
|
-4.1 |
% |
603 |
|
+7.0 |
% |
| Praluent |
132 |
|
+20.0 |
% |
526 |
|
+9.3 |
% |
| Thymoglobulin |
124 |
|
+6.4 |
% |
490 |
|
+3.7 |
% |
| Myozyme/Lumizyme |
122 |
|
-5.3 |
% |
519 |
|
-21.0 |
% |
| Cerdelga |
83 |
|
-1.1 |
% |
335 |
|
+3.0 |
% |
| Eloctate |
63 |
|
-16.0 |
% |
275 |
|
-22.3 |
% |
| Aubagio |
51 |
|
-30.8 |
% |
238 |
|
-35.4 |
% |
Lantus sales were €419 million and increased by 1.1%. US sales were €199 million and increased by 12.4% from volume growth, partly offset by gross-to-net price adjustments. The benefit of windfall sales from the unavailability of competing medicines is anticipated to partly subside in 2026. In Europe and Rest of World, combined sales decreased by 7.7%, from growth in Toujeo.
Toujeo sales were €332 million and increased by 18.6%, driven by Rest of World (+21.8%), including China. Toujeo continued to see solid volume growth and an increase in market share. Sales in Europe (+6.7%) and US (+41.3%) both grew from volume gains.
Fabrazyme sales were €252 million and broadly stable (-1.1%) with slight growth in patient numbers offset by price adjustments.
Plavix sales were €214 million and increased by 7.6%, reflecting volume growth in Rest of World (majority of sales, €190 million).
Lovenox sales were €179 million and decreased by 21.6%, impacted by increasing competition in Europe and Rest of World.
Cerezyme sales were €171 million and broadly stable (+2.9%), with a slight growth in the number of patients partly offset by price. The Gaucher disease franchise (Cerezyme and Cerdelga) sales were €254 million and increased by 1.6%.
Alprolix sales were €149 million and decreased by 4.1%, driven by lower demand and gross-to-net price adjustments, partly offset by supply sales to the collaborator Sobi.
Praluent sales were €132 million and increased by 20.0% from higher sales in Europe offset by lower sales in Rest of World.
Thymoglobulin sales were €124 million and increased by 6.4%, mainly reflecting higher sales in the US.
Myozyme/Lumizyme sales were €122 million and decreased by 5.3% driven by patients switching to Nexviazyme/Nexviadyme.
Cerdelga sales were €83 million and decreased by 1.1% with growth in the number of patients offset by price.
Eloctate sales were €63 million and decreased by 16.0% as patients switched to ALTUVIIIO.
Aubagio sales were €51 million and decreased by 30.8% from loss of exclusivity in 2023. Aubagio sales will decrease further. Individual sales reporting for Aubagio is anticipated to discontinue in 2026 with any remaining sales to be included in ‘Others’.
Vaccines
|
|
|
|
|
|
|
|
|
|
|
|
|
|
|
|
Net sales
(€ million)
|
Q4 2025 |
Change
at CER |
FY 2025 |
Change
at CER |
| Beyfortus |
686 |
|
-14.9 |
% |
1,781 |
|
+9.5 |
% |
| Influenza, COVID-19 |
575 |
|
+31.5 |
% |
2,314 |
|
-5.8 |
% |
| Polio/Pertussis/Hib primary and booster vaccines |
551 |
|
-9.5 |
% |
2,554 |
|
-4.4 |
% |
| Meningitis, travel, and endemic |
227 |
|
-4.8 |
% |
1,287 |
|
+0.8 |
% |
| Total |
2,039 |
|
-2.5 |
% |
7,936 |
|
-1.2 |
% |
Vaccines sales were €2,039 million and decreased by 2.5% from lower sales of Beyfortus and PPH, partly offset by Influenza.
Beyfortus sales were €686 million and decreased by 14.9%. Sales in the US (-31.9%) and Europe (-24.5%) declined due to a high comparison from inventory increase in the comparable period and Q4/Q3 phasing. Sales in Rest of World (+105.8%) benefited from geographical roll-out of infant protection; Beyfortus now protects babies in >45 countries.
Influenza, COVID-19 vaccines sales were €575 million and increased by 31.5%, supporting a better full-year performance than anticipated. Sales in the US (€236 million), in Europe (€148 million), and in Rest of World (€191 million) benefited from more circulating virus and a higher vaccination rate than anticipated earlier. Sales growth in Europe (+13.1%) included competitive price pressure in Germany. Nuvaxovid realised sales from three countries, up from one in Q3 2025.
Polio/Pertussis/Hib (PPH) primary and booster vaccines sales were €551 million and decreased by 9.5%, mainly from fewer babies born in multiple countries, including China.
Meningitis, travel, and endemic vaccines sales were €227 million and decreased by 4.8% driven by tender fluctuation in competitive public markets.
|
|
|
|
|
|
SANOFI PRESS RELEASE Q4 2025 |
4 |
Business operating income
In Q4 2025, Biopharma BOI was €2,338 million and increased by 24.1% (14.7% at actual exchange rates) from €2,038 million in Q4 2024. The ratio of BOI to net sales was 21.1% and increased by 1.8pp (20.7% at actual exchange rates, up by 1.4pp). The increase was mainly driven by higher business gross profit (up by 15.0%), slower growth in R&D expenses (up by 6.6%), and SG&A expenses (up by 7.1%), partly offset by higher Regeneron profit sharing. In FY 2025, Biopharma BOI was €12,123 million and increased by 12.3% (7.4% at actual exchange rates) from €11,285 million in FY 2024. The ratio of BOI to net sales was 28.1% and increased by 0.6pp (27.8% at actual exchange rates, up by 0.3pp).
Pipeline update
Sanofi has 80 projects in a pipeline across four main disease areas (Immunology, Rare diseases, Neurology, and selectively in Oncology) and Vaccines, including 40 potential new medicines and vaccines. The following section highlights significant developments in the late- and mid-stage pipeline since the prior results press release.
Highlights
|
|
|
|
|
|
| Regulatory approvals |
Dupixent – CSU (EU)
Dupixent – asthma children (JP)
Teizeild – T1D, stage 2, delay onset of stage 3 (EU)
Cerezyme – GD3 (US)
Cablivi – aTTP (CN)
Cablivi – aTTP children (US)
Qfitlia – haemophilia (CN)
Wayrilz – ITP (EU)
Myqorzo – hypertrophic cardiomyopathy (CN)
Redemplo – familial chylomicronaemia syndrome (CN)
|
| Regulatory submission acceptances |
Dupixent – AFRS (US, priority review)
Dupixent – CSU children (JP)
Tzield – T1D, stage 2, delay onset of stage 3 children (US, priority review)
SP0087 – rabies (EU) |
| Phase 3 data readouts |
Dupixent –AFRS – primary endpoint met
amlitelimab – AD program (COAST 2, SHORE) – positive results
tolebrutinib – PPMS – primary endpoint not met |
| Phase 3 study starts |
duvakitug – CD (STARSCAPE-1, STARSCAPE-2)
duvakitug – UC (SUNSCAPE-1, SUNSCAPE-2)
Wayrilz – IgG4-related diseases (RILIEF) |
| Regulatory designations |
Dupixent – AFRS – priority review (US)
Tzield – T1D, stage 2, delay onset of stage 3 children – priority review (US)
efdoralprin alfa – AATD emphysema – orphan (EU)
|
Following a thorough pipeline review during the second half of 2025, including of all phase 2 projects, Sanofi implemented changes and early terminations to some ongoing phase 2 studies. The list of pipeline changes is available from the Q4 2025 results investor presentation, pipeline appendix.
Immunology
Dupixent (dupilumab)
•The Ministry of Health, Labour and Welfare in Japan granted marketing and manufacturing authorisation for Dupixent for the treatment of bronchial asthma in children aged 6 to 11 years with severe or refractory disease whose symptoms are inadequately controlled with existing therapy. This expands the previous approval in Japan in this indication for patients aged 12 years and older. The approval was based on data from the overall population and those with a type-2 inflammation phenotype in VOYAGE (clinical study identifier: NCT02948959), a global phase 3 study evaluating Dupixent in children aged 6 to 11 years with uncontrolled moderate-to-severe asthma. Additionally, data from EXCURSION (clinical study identifier: NCT03560466), an open-label extension of VOYAGE that included a sub-study of exclusively Japanese paediatric patients supported the approval.
•The European Commission (EC) approved Dupixent for the treatment of moderate-to-severe chronic spontaneous urticaria (CSU) in adult and adolescent patients 12 years and above with inadequate response to histamine-1 antihistamines and who are naive to anti-immunoglobulin-E (IgE) therapy for CSU. Eligible patients can use Dupixent as a first-line targeted treatment option. The approval is based on data from two phase 3 clinical studies in the LIBERTY-CUPID program (clinical study identifier: NCT04180488), Study A and Study C, with patients naïve to anti-IgE therapy. A third study, Study B, for patients who were inadequate responders or intolerant to anti-IgE therapy provided additional safety data. Beyond the EU, Dupixent is also approved for CSU in certain adults and adolescents in several countries including the US and Japan. In Japan, a supplemental new drug application was recently submitted to extend the CSU indication to children aged two to 12 years.
•Positive results from the pivotal LIBERTY-AFRS-AIMS phase 3 study (clinical study identifier: NCT04684524) evaluating Dupixent in adults and children aged six years and older with allergic fungal rhinosinusitis (AFRS), a chronic type-2 inflammatory disease of the sinuses caused by an intense allergic hypersensitivity to fungi, most usually aspergillus, demonstrated significant improvements in signs and symptoms of disease across all primary and secondary endpoints, including reductions in sinus opacification, nasal congestion, and nasal polyps compared to placebo. These are the first-ever positive phase 3 results specifically in AFRS. The US Food and Drug Administration (FDA) accepted for priority review the supplemental biologics license application (sBLA) for Dupixent in AFRS with a target action date of February 28, 2026. If approved, AFRS would represent the ninth FDA-approved indication for Dupixent.
|
|
|
|
|
|
SANOFI PRESS RELEASE Q4 2025 |
5 |
Tzield/Teizeild (teplizumab)
•The EC approved Teizeild to delay the onset of stage 3 type 1 diabetes (T1D) in adult and paediatric patients eight years of age and older with stage 2 T1D. This followed the positive opinion by the European Medicines Agency (EMA)'s Committee for Medicinal Products for Human Use (CHMP). Teizeild is the first T1D disease-modifying therapy approved in the EU, marking a significant milestone in the treatment of this progressive autoimmune disease. The approval is based on positive results from the TN-10 phase 2 study (clinical study identifier: NCT01030861) demonstrating that Teizeild delayed the onset of stage 3 T1D by a median of two years compared to placebo, in adults and children aged eight years and older with stage 2 T1D.
•The FDA accepted for priority review the sBLA for Tzield to expand the current age indication from eight years and above, to as young as one year old and above to delay the onset of stage 3 T1D in patients diagnosed with stage 2 T1D. The sBLA is supported by the positive interim one-year data from the ongoing PETITE-T1D phase 4 study (clinical study identifier: NCT05757713), evaluating the safety and pharmacokinetics of Tzield in young children. The target action date is April 29, 2026. Tzield is also under review in the US to delay the progression of stage 3 T1D in adults and children eight years of age and older recently diagnosed with stage 3 T1D. The FDA nominated Tzield for the Commissioner's National Priority Voucher pilot program based on its potential to address a large unmet medical need. A regulatory decision is anticipated in H1 2026.
amlitelimab (OX40L mAb)
Following the positive COAST 1 (clinical study identifier: NCT06130566) results in September 2025, two additional global phase 3 studies – SHORE (clinical study identifier: NCT06224348) and COAST 2 (clinical study identifier: NCT06181435) – of amlitelimab, a fully human non-T cell depleting monoclonal antibody that selectively targets OX40-ligand (OX40L), delivered a robust body of evidence that supports amlitelimab’s potential in the treatment of patients 12 years and older with moderate-to-severe AD. In these two phase 3 studies amlitelimab was well-tolerated and the safety profile was consistent with previously reported data.
Specifically, in the SHORE study, amlitelimab, dosed either Q4W or Q12W in conjunction with medium-potency background topical corticosteroids (TCS) with or without topical calcineurin inhibitors (TCI), met all primary and key secondary endpoints compared to placebo plus TCS with or without TCI at Week 24, across both US and EU estimands.
In the COAST 2 study, amlitelimab monotherapy dosed either Q4W or Q12W met the primary endpoint of the proportion of patients achieving vIGA-AD 0/1 and a reduction from baseline score of ≥2 points compared to placebo at Week 24, as assessed for the US and US reference countries. The key secondary endpoint of the proportion of patients who achieved vIGA-AD 0/1 with barely perceptible erythema, as assessed for the US and US reference countries, did not achieve statistical significance. For the EU and EU reference countries, amlitelimab dosed either Q4W or Q12W did not achieve statistical significance for the co-primary endpoints of proportion of patients achieving vIGA-AD 0/1 and EASI-75 compared to placebo.
In addition, a preliminary analysis of the ongoing, open-label ATLANTIS phase 2 study (clinical study identifier: NCT05769777) indicated that amlitelimab dosed Q4W progressively improved skin clearance and disease severity beyond Week 24 to Week 52 in 591 patients aged 12 years and older with moderate-to-severe AD. In this preliminary analysis, amlitelimab was well-tolerated through Week 52.
Results for COAST 1, COAST 2, SHORE, and this preliminary analysis of ATLANTIS will be presented at forthcoming medical congresses. Two additional phase 3 studies, AQUA (clinical study identifier: NCT06241118) and ESTUARY (clinical study identifier: NCT06407934) are anticipated to report results in H2 2026. Global regulatory submissions are planned for H2 2026, unchanged.
duvakitug (TL1A mAb)
Four phase 3 studies of two dose regimens of duvakitug compared with placebo commenced dosing the first patient in inflammatory bowel disease. Two studies will assess this potential new medicine in Crohn’s disease (CD), STARSCAPE-1 (clinical study identifier: NCT07184931) and STARSCAPE-2 (clinical study identifier: NCT07184944) and two new studies in ulcerative colitis (UC), SUNSCAPE-1 (clinical study identifier: NCT07184996 and SUNSCAPE-2 (clinical study identifier: NCT07185009).
Rare diseases
Cerezyme (imiglucerase)
The FDA approved the extension of indication for Cerezyme to include systemic manifestations of Gaucher disease type 3 (GD3), building on Cerezyme’s long-standing approval for GD1. This marked the first FDA supplemental label expansion based exclusively on real-world evidence, leveraging data from the International Collaborative Gaucher Group Gaucher registry.
Cablivi (caplacizumab)
•The National Medical Products Administration (NMPA) in China approved Cablivi for acquired thrombotic thrombocytopenic purpura, an ultra-rare blood disease. Cablivi is the first nanobody-targeted therapy designed to treat acquired/immune-mediated thrombotic thrombocytopenic purpura (aTTP/iTTP) in adults and adolescents aged 12 or older weighing at least 40 kg. This approval brings an innovative medicine specifically indicated for this rare and life-threatening blood clotting disorder to China, where approximately 2,700 patients are diagnosed annually. Despite standard treatments, aTTP/iTTP carries a mortality rate of up to 20%. Cablivi targets von Willebrand factor (vWF), a protein in the blood involved in haemostasis and is designed to inhibit the interaction between vWF and platelets. Used in conjunction with plasma exchange and immunosuppressive therapy, it helps by inhibiting the formation of microthrombi, which contribute to organ damage during the disease.
•The FDA approved under priority review the extension of indication for Cablivi in aTTP to include the treatment of children aged 12 years and older, in combination with plasma exchange and immunosuppressive therapy. The approval was based on real-world data collected as part of a retrospective, medical chart review of 30 children with aTTP, as well as a population pharmacokinetics/pharmacodynamics modelling and simulation study to support 11 mg paediatric dosing (same as adult dose).
|
|
|
|
|
|
SANOFI PRESS RELEASE Q4 2025 |
6 |
Qfitlia (fitusiran)
The NMPA in China approved Qfitlia for haemophilia. Qfitlia is the first antithrombin (AT)-lowering therapy for routine prophylaxis in people with haemophilia. Qfitlia is indicated for routine prophylaxis to prevent or reduce the frequency of bleeding episodes in paediatric patients 12 years of age and older, and adults with severe haemophilia A (coagulation factor VIII deficiency, FVIII<1%) with or without factor VIII inhibitors, or severe haemophilia B (coagulation factor IX deficiency, FIX<1%) with or without factor IX inhibitors. This approval was based on data from the ATLAS phase 3 studies that demonstrated clinically meaningful bleed protection as measured by annualized bleeding rates across haemophilia patients with or without inhibitors. By lowering AT, a protein that inhibits blood clotting, Qfitlia helps increase thrombin generation to restore haemostasis in people with haemophilia. Qfitlia uses small-interfering RNA technology, which enables low treatment frequency, subcutaneous injections, and low-volume dosing. Haemophilia affects more than 40,000 people in China.
Wayrilz (rilzabrutinib)
•The EC approved Wayrilz as a new treatment for immune thrombocytopenia (ITP) in adult patients who are refractory to other treatments. This follows the positive opinion by the EMA's CHMP. Wayrilz can help address the underlying causes of ITP through multi-immune modulation, targeting different pathways across the immune system. The approval was based on the pivotal LUNA 3 phase 3 study (clinical study identifier: NCT04562766), in which Wayrilz met the primary and secondary endpoints, demonstrating a positive impact on sustained platelet counts as well as other ITP symptoms. Wayrilz has already been approved in the US, and it is currently under regulatory review for ITP in Japan. It received fast track and orphan drug designations in the US for ITP, with similar orphan designations in the EU and Japan. In other indications, the FDA granted Wayrilz orphan designation for three additional rare diseases, including warm autoimmune haemolytic anaemia, IgG4-related disease (IgG4-RD), and sickle cell disease. Wayrilz also received FDA fast track designation and EU orphan designation in IgG4-RD.
A new phase 3 study of Wayrilz commenced dosing patients with IgG4-RD, RILIEF (clinical study identifier: NCT07190196).
SAR447537 (efdoralprin alfa)
The EMA granted orphan designation to efdoralprin alfa for the potential treatment of alpha-1 antitrypsin deficiency (AATD)-related emphysema, a rare respiratory condition with large unmet medical need. The EMA grants orphan designation to potential new medicines addressing rare, life-threatening, or debilitating medical diseases or conditions that affect no more than 5 in 10,000 individuals in the EU. Efdoralprin alfa demonstrated superiority to a standard of care plasma-derived therapy in adults with AATD when dosed every three weeks or every four weeks, meeting all primary and key secondary endpoints in the global phase 2 ElevAATe study (clinical study identifier: NCT05856331). Sanofi plans to present the data at a forthcoming medical meeting and engage with global regulatory authorities on the appropriate next steps. The FDA previously granted both fast track and orphan drug designation to efdoralprin alfa for the treatment of AATD-related emphysema.
Neurology
tolebrutinib (BTK inhibitor)
•Results from the PERSEUS phase 3 study (clinical study identifier: NCT04458051) showed that tolebrutinib did not meet its primary endpoint in delaying time to 6-month composite confirmed disability progression in participants with primary progressive multiple sclerosis (PPMS), which represents 10% of the overall multiple sclerosis patient population. Based on these results, Sanofi will not pursue regulatory submission for PPMS. Preliminary analysis showed the safety profile was consistent with previous tolebrutinib studies. As previously reported, drug-induced liver injury (DILI) is an identified risk of tolebrutinib. Strict adherence to liver monitoring requirements, and prompt management of liver enzyme elevations, are important to mitigate DILI risk. Full safety and efficacy results will be presented at a forthcoming medical meeting.
•In late December, the FDA issued a complete response letter for the new drug application of tolebrutinib to treat non-relapsing secondary progressive multiple sclerosis (nrSPMS). Earlier in December, based on the latest discussions with the FDA, Sanofi had provided an update on the review, including the decision to go beyond the revised target action date of December 28, 2025. Tolebrutinib was provisionally approved in the United Arab Emirates in July 2025 for the treatment of nrSPMS and is currently under regulatory review for SPMS in the EU.
Other
Myqorzo (aficamten)
The NMPA in China approved Myqorzo for the treatment of obstructive hypertrophic cardiomyopathy (oHCM). Myqorzo is a selective, small-molecule cardiac myosin inhibitor to improve exercise capacity and relieve symptoms in patients with oHCM, in which the myocardium, the heart muscle, becomes abnormally thick. It is the most common monogenic inherited cardiovascular disorder. The approval was based on the positive pivotal SEQUOIA-HCM phase 3 study (clinical study identifier: NCT05186818) in patients with symptomatic oHCM. Sanofi has exclusive rights to develop and commercialize Myqorzo in Greater China for treating both forms of HCM. These rights came through an agreement with Corxel Pharmaceuticals, who had acquired them from Cytokinetics.
Redemplo (plozasiran)
The NMPA in China approved Redemplo for the reduction of triglyceride levels, in adult patients with familial chylomicronaemia syndrome (FCS) based on dietary control. Redemplo is a small-interfering RNA medicine, suppressing the production of apoc-III, an important target for reducing triglycerides in patients with FCS. FCS is a severe and rare disease where extremely high triglyceride levels can lead to various serious signs and symptoms including acute and potentially fatal pancreatitis, chronic abdominal pain, diabetes, hepatic steatosis, and cognitive issues. The approval was based on the positive pivotal PALISADE phase 3 study (clinical study identifier: NCT05089084) in patients with genetically confirmed or clinically diagnosed FCS. Sanofi
|
|
|
|
|
|
SANOFI PRESS RELEASE Q4 2025 |
7 |
acquired the rights to develop and commercialize Redemplo in Greater China from Visirna Therapeutics, a majority-owned subsidiary of Arrowhead Pharmaceuticals.
Vaccines
Nuvaxovid (COVID-19)
Novavax completed the transfer of the US marketing authorisation for the COVID-19 vaccine, Nuvaxovid to Sanofi, enabling Sanofi to take full responsibility for commercial and regulatory activities. The transfer in the EU was completed in October 2025.
SP0087 (rabies)
In October 2025, the EMA accepted for review the regulatory submission of the new vero cell-based vaccine for the prevention of rabies. The next-generation rabies vaccine is intended for both pre- and post-exposure prevention of rabies.
SP0256 (RSV and RSV+HMPV older adults)
The SP0256 clinical development programme is divided in two: 1) testing the RSV mRNA vaccine alone and 2) testing the RSV+HMPV mRNA vaccine in combination. The phase 2b study (clinical study identifier: NCT06251024) of the RSV vaccine showed a high efficacy on several endpoints, including 75% vaccine efficacy against RSV-induced lower respiratory tract disease at a median follow-up of 5.5 months (and a predicted 100% efficacy using similar phase 3 endpoints as competitors), while the phase 1/2 studies of the RSV+HMPV vaccine (clinical study identifiers: NCT06134648, NCT06686654) induced very competitive HMPV antibody levels. Next steps are pending discussion with regulatory agencies.
Anticipated major upcoming pipeline milestones
|
|
|
|
|
|
|
|
|
|
|
|
|
Medicine/vaccine |
Indication |
Description |
| H1 2026 |
Dupixent |
AFRS |
regulatory decision (US) |
| BP |
regulatory decision (EU, JP) |
| CSU children |
regulatory decision (US, EU) |
| lunsekimig |
asthma |
phase 2 data |
| Tzield |
T1D, stage 2, delay onset of stage 3, children |
regulatory decision (US) |
| T1D, stage 3, delay progression |
regulatory decision (US) |
| Nexviazyme |
infantile-onset Pompe disease (IOPD) |
phase 3 data |
| venglustat |
Fabry disease |
phase 3 data |
| regulatory submission (US) |
| GD3 |
phase 3 data |
| regulatory submission |
| Sarclisa |
subcutaneous |
regulatory decision (US, EU, JP) |
| tolebrutinib |
SPMS |
regulatory decision (EU) |
| Fluzone HD |
influenza 50 years+ |
regulatory submission (US, EU) |
| SP0230 |
meningitis |
phase 2 data |
| H2 2026 |
Dupixent |
CSU children |
regulatory decision (JP) |
| lichen simplex chronicus |
phase 3 data |
| regulatory submission (US) |
| amlitelimab |
AD |
phase 3 data (remaining data) |
| regulatory submission |
| Wayrilz |
ITP |
regulatory decision (JP) |
| Nexviazyme |
IOPD |
regulatory submission (US) |
| efdoralprin alfa |
AATD emphysema |
regulatory submission (US) |
| SP0087 |
rabies |
regulatory decision (EU) |
| regulatory submission (US) |
| 2027 |
itepekimab |
chronic rhinosinusitis with nasal polyps |
phase 3 data |
| brivekimig |
hidradenitis suppurativa |
phase 2 data |
| fitusiran |
haemophilia A/B |
phase 3 data (ATLAS-NEO) |
| regulatory submission (EU, JP) |
| frexalimab |
RMS |
phase 3 data |
| regulatory submission (US, EU) |
| riliprubart |
chronic inflammatory demyelinating polyneuropathy |
phase 3 data |
| regulatory submission (US, EU) |
| SP0202 |
pneumococcal disease |
phase 3 data |
| SP0218 |
yellow fever |
phase 3 data |
| regulatory submission (US, EU) |
A status on the Sanofi pipeline as of December 31, 2025, is available at: https://www.sanofi.com/en/our-science/our-pipeline.
|
|
|
|
|
|
SANOFI PRESS RELEASE Q4 2025 |
8 |
Sustainability update
Driving sustainable healthcare standards across the industry
The first global life cycle assessment (LCA) standard, Publicly Available Specification (PAS) 2090 has been published recently, providing a harmonised framework to measure and communicate the environmental impact of medicines and vaccines across their entire lifecycle. The standard was developed through an independent, multi-stakeholder consensus process led by the British Standards Institution (BSI), involving leading industry players including Sanofi, and sponsored by NHS England, the Office for Life Sciences, and the Pharmaceutical LCA Consortium. Sanofi leads the Sustainable Markets Initiative’s Patient Care Pathways Working Group and the Pharmaceutical LCA Consortium, which both played important roles in the development of the PAS 2090 standard.
PAS 2090 supports eco-design efforts to reduce environmental footprint throughout the entire lifecycle – from manufacturing and distribution to use and end of life. The standard also seeks to improve the accuracy and consistency of environmental impact reporting for medicines and vaccines by pharmaceutical companies, enabling them to address inquiries from healthcare authorities, healthcare professionals, investors and other stakeholders while promoting transparency.
To accelerate the implementation of PAS 2090, the Pharmaceutical LCA Consortium has developed a technical guidance document and launched two key initiatives: a pharmaceutical-specific life cycle inventory database and a PAS 2090-compliant LCA tool.
In BSI’s press release announcing the publication of the standard, Sanofi CEO Paul Hudson commented: “PAS 2090 marks a defining moment for sustainable healthcare and is a testament to how collaboration across the healthcare ecosystem can drive meaningful progress. This new standard gives our industry a common framework to measure and reduce the environmental footprint of our medicines and vaccines. True patient care means protecting not just individual health, but the health of our planet – and this standard helps us to do both.”
Cancer and work: building a culture where work supports health
Cancer affects everyone – directly or indirectly, as patients, survivors, caregivers, or family members – with profound impacts on both professional and personal lives. In 2023, CEO Paul Hudson sponsored the "Cancer & Work – Acting Together" program, developed by, for, and with Sanofi employees. By the end of 2025, Sanofi completed the global rollout of this internal program, which now supports affected employees worldwide by maintaining their employment, salary, and benefits for up to 12 months, plus flexible working arrangements, while reducing the stigma of cancer in the workplace.
Throughout 2025, all Sanofi employees received comprehensive training, complementing the existing peer support network and psychological support helpline. Delivered as a mandatory e-learning module in 20 languages, the program creates a workplace culture where everyone understands the challenges and is ready to act, ensuring that empathy and practical support extend equally to all employees affected directly or indirectly by cancer or other critical life-threatening illnesses.
Sanofi’s vision is clear: to be a model company that transforms the balance between health and work by drawing on employees’ real-life experiences and fostering a culture where work actively supports health.
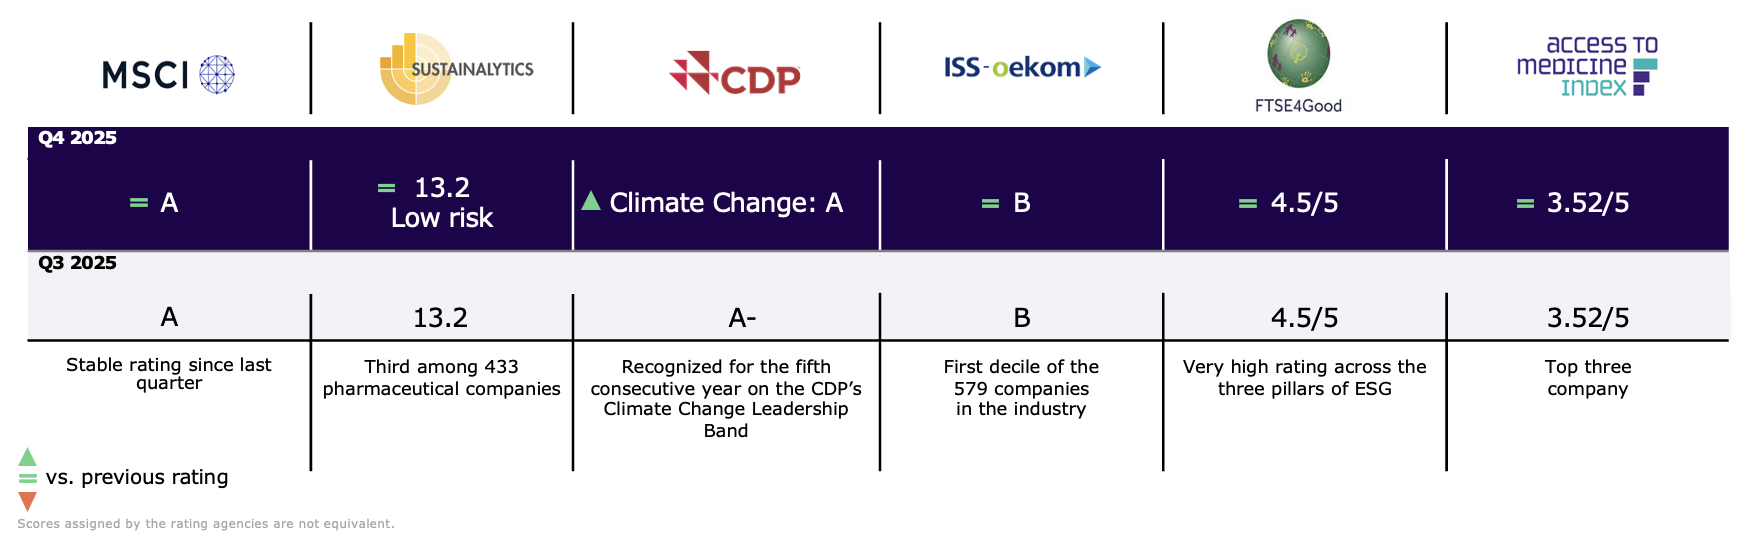
ESG ratings
Sanofi has been recognized on CDP’s A List as a global leader in transparency on climate change. This recognition reflects Sanofi’s leadership, transparency, and long-term commitment to climate action and places it among the top four percent of companies scored by CDP.
Sanofi’s latest ESG rankings:
|
|
|
|
|
|
SANOFI PRESS RELEASE Q4 2025 |
9 |
Q4 and FY 2025 financial results
Business net income1
Net sales were €11,303 million in Q4 2025 and increased by 7.0% (13.3% at CER) from €10,564 million in Q4 2024. In FY 2025, net sales were €43,626 million and increased by 6.2% (9.9% at CER) from €41,081 million in FY 2024.
Other revenues were €902 million in Q4 2025 and increased by 5.4% (10.4% at CER) from €856 million in Q4 2024. VaxServe sales of non-Sanofi products were €454 million and decreased by 18.9% (11.6% at CER). In addition, other revenues included manufacturing services and other (€215 million), sales of Opella products in certain markets (€156 million), royalties (€46 million), and supply sales to Opella (€31 million). In FY 2025, other revenues were €3,090 million and decreased by 3.6% (0.6% at CER) from €3,205 million in FY 2024. VaxServe sales of non-Sanofi products were €1,780 million and decreased by 9.1% (5.0% at CER. In addition, other revenues included manufacturing services and other (€557 million), sales of Opella products in certain markets (€487 million), royalties (€146 million), and supply sales to Opella, etc. (€120 million).
Business gross profit was €8,518 million in Q4 2025 and increased by 8.6% (15.6% at CER) from €7,844 million in Q4 2024. The business gross margin was 75.4% and increased by 1.1pp (75.7% at CER, up by 1.4pp). In FY 2025, business gross profit was €33,793 million and increased by 8.7% (12.7% at CER) from €31,091 million in FY 2024. The business gross margin was 77.5% and increased by 1.8pp (77.6% at CER, up by 1.9pp). Generally, the margin improvements in Q4 and FY 2025 were driven by portfolio shift towards specialty care medicines and enhanced product mix.
Research and Development expenses were €2,291 million in Q4 2025 and increased by 1.5% (6.6% at CER) from €2,257 million in Q4 2024, including nominal costs related to portfolio deprioritisations. The ratio of R&D to net sales was 20.3% and decreased by 1.1pp (20.1% at CER, down by 1.3pp). In FY 2025, R&D expenses were €7,842 million and increased by 6.1% (8.8% at CER) from €7,394 million in FY 2024. The higher increase in the FY period includes a c.€200 million one-time reimbursement of past ALTUVIIIO development expenses, received in Q2 2024, lowering the comparative period, as well as wind-down costs in Q1 2025 for the discontinued E. coli sepsis vaccine candidate. The ratio of R&D to net sales was 18.0% and stable (17.8% at CER, down by 0.2pp).
Selling, general and administrative expenses were €2,746 million in Q4 2025 and increased by 3.7% (9.6% at CER) from €2,648 million in Q4 2024. The ratio of SG&A to net sales was 24.3% and decreased by 0.8pp (24.3% at CER, down by 0.8pp). In FY 2025, SG&A expenses were €9,543 million and increased by 3.9% (7.3% at CER) from €9,183 million in FY 2024. The ratio of SG&A to net sales was 21.9% and decreased by 0.5pp (21.8% at CER, down by 0.6pp). Generally, the SG&A developments in Q4 and FY 2025 reflected continued support of launches and newer medicines.
Total operating expenses were €5,037 million in Q4 2025 and increased by 2.7% (8.2% at CER) from €4,905 million in Q4 2024. In FY 2025, total operating expenses were €17,385 million and increased by 4.9% (7.9% at CER) from €16,577 million in FY 2024.
Other operating income net of expenses was -€1,178 million in Q4 2025 and increased by 33.0% (43.0% at CER) from -€886 million in Q4 2024. Income included €214 million from license-out royalties, etc., including on Amvuttra® (€96 million in Q4 2024), and €64 million from divestments of medicines/portfolio streamlining (€179 million in Q4 2024). The income was more than offset by an expense of €1,369 million representing Regeneron’s share of profit from the monoclonal antibody alliance (-€1,044 million in Q4 2024), -€129 million relating to other pharmaceutical collaborators (-€132 million in Q4 2024), and an income of €42 million from other (€15 million in Q4 2024). In FY 2025, other operating income net of expenses was -€4,424 million and increased by 34.3% (40.2% at CER) from -€3,293 million in FY 2024. Income included €483 million from divestments (€394 million in FY 2024), and €495 million from license-out royalties, etc. (€275 million in FY 2024). Expenses included €5,065 million from Regeneron’s share of profit from the monoclonal antibody alliance (-€3,947 million in FY 2024), -€296 million from other pharmaceutical collaborations (-€137 million in FY 2024), and -€41 million from other (€122 million in FY 2024).
Share of profit from associates was €40 million in Q4 2025 compared to €32 million in Q4 2024 and mainly included the share of profit related to Vaxelis in the US. In FY 2025, share of profit from associates was €179 million compared to €136 million in FY 2024 and mainly included the share of profit related to Vaxelis.
Business operating income was €2,341 million in Q4 2025 and increased by 12.7% (21.7% at CER) from €2,078 million in Q4 2024. The ratio of BOI to net sales was 20.7% and increased by 1.0pp (21.1% at CER, up by 1.4pp). In FY 2025, BOI was €12,149 million and increased by 7.1% (11.9% at CER) from €11,343 million in FY 2024. The ratio of BOI to net sales was 27.8% and increased by 0.2pp (28.1% at CER, up by 0.5pp). Generally, BOI in Q4 and FY 2025 improved due to higher business gross profit, slower growth in operating expenses, partly offset by increased Regeneron profit sharing.
Net financial expenses were €71 million in Q4 2025 compared to €62 million in Q4 2024, reflecting higher net debt in the quarter. In FY 2025, net financial expenses were €262 million compared to €263 million in FY 2024, reflecting similar, but fluctuating net debt over the period.
The effective tax rate was 18.5% in Q4 2025 and decreased from 18.8% in Q4 2024. Generally, the effective tax rate will fluctuate from quarter to quarter. In FY 2025, the effective tax rate was 19.9% and increased slightly from 19.8% in FY 2024. Sanofi continues to anticipate a broadly stable tax rate in 2026.
Business net income was €1,856 million in Q4 2025 and increased by 13.0% (+22.3% at CER) from €1,642 million in Q4 2024. The ratio of business net income to net sales was 16.4% and increased by 0.9pp (16.8% at CER, up by 1.3pp). In FY 2025, business net income was €9,555 million and increased by 7.2% (12.1% at CER) from €8,912 million in FY 2024. The ratio of business net income to net sales was 21.9% and increased by 0.2pp (22.1% at CER, up by 0.4pp).
Business earnings per share (business EPS) was €1.53 in Q4 2025 and increased by 16.8% (26.7% at CER) from €1.31 in Q4 2024. The average number of shares outstanding was 1,212.7 million compared to 1,253.6 million in Q4 2024. In FY 2025, business EPS
1 See Appendix 3 for the Q4 and FY 2025 consolidated income statement; see Appendix 9 for definitions of financial indicators, and Appendix 4 for
reconciliation of IFRS net income to business net income.
|
|
|
|
|
|
SANOFI PRESS RELEASE Q4 2025 |
10 |
was €7.83 and increased by 10.0% (15.0% at CER) from €7.12 in FY 2024. The average number of shares outstanding was 1,220.4 million compared to 1,251.4 million in FY 2024.
Opella
On April 30, 2025, Sanofi and CD&R closed the Opella transaction, creating an independent global consumer healthcare leader. Sanofi retained a significant shareholding in Opella through a 48.2% equity interest in OPAL JV Co, which indirectly holds 100% of Opella. Bpifrance owns 1.8% and CD&R the remaining 50.0%. The transaction was completed on the terms previously disclosed, and Sanofi received net cash proceeds of €10.4 billion. To aid the ongoing assessment of the value of Sanofi’s Opella stake, Opella’s summary financials will be disclosed at Q2/H1 and Q4/FY financial results. Please see appendix 11 for details
Reconciliation of IFRS net income to business net income (see Appendix 4)
In FY 2025, the IFRS net income was €7,813 million. The main items excluded from the business net income were:
•Net income from the Opella discontinued operation amounted to €2,874 million, including €2,610 million related to an Opella divestment net gain following the loss of control.
•An amortisation charge of €1,776 million, of which €1,715 million related to intangible assets measured at their acquisition-date fair values (mainly Bioverativ €590 million, Blueprint €255 million, Provention Bio €205 million, Ablynx €168 million, Kadmon €157 million, Beyfortus €121 million, and Genzyme €51 million), and €61 million related to intangible assets from separate acquisitions, measured initially at acquisition cost (licenses/products). These items had no cash impact.
•A net impairment expense of €2,241 million which primarily comprises a €1,663 million impairment recorded on tolebrutinib, reflecting a reduced probability of regulatory approval as a result of the negative PERSEUS phase 3 study results in PPMS and the recent interactions with the FDA and EMA on SPMS.
•A €126 million step-up inventory amortisation from the Blueprint acquisition reported in the cost of sales line.
•Restructuring costs and similar items of €1,138 million, mainly related to redundancy plans during FY 2025.
•Other gains and losses, and litigation of €255 million.
•A financial income of €93 million mainly related to the remeasurement of anticipated future royalty due on Beyfortus US sales.
•A €1,311 million tax effect arising from the items listed above, mainly comprising €888 million of deferred taxes generated by amortisation and impairment of intangible assets, and €252 million associated with restructuring costs and similar items.
•Other items in 2025 include Sanofi share of loss of associate OPAL JV Co under equity method from May 1, 2025, for -€310 million including the effect of the allocation of the cost of the investment and related fair value adjustments on the identifiable assets and liabilities (mainly intangible assets and inventories).
Cash flow
In FY 2025, free cash flow before restructuring, acquisitions, and disposals amounted to €9,891 million after a change in net working capital of €2,095 million, and capital expenditures of -€1,858 million. After acquisitions1 of -€1,761 million, proceeds from disposals1 of €744 million, and payments related to restructuring and similar items of -€785 million, free cash flow2 was €8,089 million.
Net debt
After the acquisitions of Blueprint (-€8,393 million), of Vicebio (-€971 million), of Dren-0201 (-€539 million) and of Vigil (-€359 million), the impact of the share buyback of -€5,030 million, dividend paid of -€4,772 million, the cash provided by the discontinued Opella business of €136 million, and the net cash inflow from the Opella transaction of €10,443 million, the change in net debt was -€2,236 million. The net debt increased from €8,772 million on December 31, 2024, to €11,008 million on December 31, 2025 (amount net of €7,657 million in cash and cash equivalents).
On October 28, 2025, Sanofi successfully priced an offering of $3 billion of notes across five tranches: $400 million (3.75%, November 2027); $500 million (floating rate, November 2027); $400 million (3.80%, November 2028), $500 million (floating rate, November 2028), and $1,200 million (4.20%, November 2032). The notes were issued pursuant to Sanofi's shelf registration statement filed with the US Securities and Exchange Commission.
Shareholder return
Following shareholder approval at the annual general meeting in April 2025, shareholders received a dividend of €3.92 per share for 2024, marking 30 consecutive years of dividend increases. Additionally, Sanofi executed a €5 billion share buyback program in 2025, with the purpose of share cancellation. The Board of Directors has proposed a dividend for 2025 of €4.12, marking 31 consecutive years of dividend increases, subject to approval by shareholders at the 2026 annual general meeting on April 29, 2026. In addition, Sanofi intends to execute a share buyback program in 2026 of €1 billion.
1 Not exceeding €500 million per transaction (inclusive of all payments related to the transaction).
2 Non-IFRS financial measure (definition in Appendix 9).
|
|
|
|
|
|
SANOFI PRESS RELEASE Q4 2025 |
11 |
|
|
|
|
|
|
|
|
|
|
|
|
|
|
|
|
|
Media Relations |
|
|
Sandrine Guendoul |
+33 6 25 09 14 25 |
sandrine.guendoul@sanofi.com |
|
|
Evan Berland |
+1 215 432 0234 |
evan.berland@sanofi.com |
|
|
Léa Ubaldi |
+33 6 30 19 66 46 |
lea.ubaldi@sanofi.com |
|
|
Léo Le Bourhis |
+33 6 75 06 43 81 |
leo.lebourhis@sanofi.com |
|
|
Victor Rouault |
+33 6 70 93 71 40 |
victor.rouault@sanofi.com |
|
|
Timothy Gilbert |
+1 516 521 2929 |
timothy.gilbert@sanofi.com |
|
|
|
|
|
|
|
|
|
|
|
|
|
|
|
|
|
|
|
|
|
|
Investor Relations |
|
|
Thomas Kudsk Larsen |
+44 7545 513 693 |
thomas.larsen@sanofi.com |
|
|
Alizé Kaisserian |
+33 6 47 04 12 11 |
alize.kaisserian@sanofi.com |
|
|
Keita Browne |
+1 781 249 1766 |
keita.browne@sanofi.com |
|
|
Nathalie Pham |
+33 7 85 93 30 17 |
nathalie.pham@sanofi.com |
|
|
Thibaud Châtelet |
+33 6 80 80 89 90 |
thibaud.chatelet@sanofi.com |
|
|
Yun Li |
+33 6 84 00 90 72 |
yun.li3@sanofi.com |
|
|
|
|
|
|
|
|
|
|
|
SANOFI PRESS RELEASE Q4 2025 |
12 |
Appendices
|
|
|
|
|
|
|
|
|
|
|
|
|
|
|
|
|
|
|
|
|
|
Reconciliation of net income attributable to equity holders of Sanofi to business net income |
|
|
Change in net debt and summarized statements of cash flow |
|
|
|
|
|
|
|
|
Simplified consolidated balance sheet |
|
|
|
|
|
|
|
|
|
|
|
Sustainability dashboard |
|
|
Opella |
|
|
|
|
|
|
|
SANOFI PRESS RELEASE Q4 2025 |
13 |
Appendix 1: Q4 2025 net sales by medicine/vaccine and geography
|
|
|
|
|
|
|
|
|
|
|
|
|
|
|
|
|
|
|
|
|
|
|
|
|
|
|
|
|
|
|
|
|
|
|
|
|
|
|
|
Q4 2025
(€ million)
|
Total sales |
Change
at CER |
Change |
|
United States |
Change
at CER |
|
Europe |
Change
at CER |
|
Rest of World |
Change
at CER |
| Immunology |
|
|
|
|
|
|
|
|
|
|
|
|
| Dupixent |
4,246 |
|
+32.2 |
% |
+22.8 |
% |
|
3,182 |
|
+35.9 |
% |
|
509 |
|
+17.9 |
% |
|
555 |
|
+25.0 |
% |
| Kevzara |
131 |
|
+10.3 |
% |
+4.0 |
% |
|
83 |
|
+18.4 |
% |
|
31 |
|
0.0 |
% |
|
17 |
|
-5.6 |
% |
| Rare diseases |
|
|
|
|
|
|
|
|
|
|
|
|
| ALTUVIIIO (*) |
324 |
|
+53.0 |
% |
+40.9 |
% |
|
276 |
|
+52.5 |
% |
|
— |
|
— |
% |
|
48 |
|
+56.3 |
% |
| Fabrazyme |
252 |
|
-1.1 |
% |
-6.3 |
% |
|
123 |
|
-3.6 |
% |
|
67 |
|
+6.3 |
% |
|
62 |
|
-3.0 |
% |
| Nexviazyme/Nexviadyme (*) |
203 |
|
+15.8 |
% |
+10.3 |
% |
|
100 |
|
+12.4 |
% |
|
73 |
|
+23.7 |
% |
|
30 |
|
+10.7 |
% |
| Cerezyme |
171 |
|
+2.9 |
% |
0.0 |
% |
|
43 |
|
0.0 |
% |
|
57 |
|
-9.5 |
% |
|
71 |
|
+18.3 |
% |
| Ayvakit (*) |
168 |
|
— |
% |
— |
% |
|
148 |
|
— |
% |
|
20 |
|
— |
% |
|
— |
|
— |
% |
| Alprolix |
149 |
|
-4.1 |
% |
-11.8 |
% |
|
108 |
|
-8.5 |
% |
|
— |
|
— |
% |
|
41 |
|
+10.0 |
% |
| Myozyme |
122 |
|
-5.3 |
% |
-7.6 |
% |
|
41 |
|
-10.2 |
% |
|
36 |
|
-34.5 |
% |
|
45 |
|
+60.7 |
% |
| Cerdelga |
83 |
|
-1.1 |
% |
-4.6 |
% |
|
46 |
|
0.0 |
% |
|
32 |
|
0.0 |
% |
|
5 |
|
-20.0 |
% |
| Cablivi (*) |
69 |
|
+1.4 |
% |
-5.5 |
% |
|
37 |
|
-4.8 |
% |
|
27 |
|
+3.8 |
% |
|
5 |
|
+40.0 |
% |
| Aldurazyme |
63 |
|
-4.3 |
% |
-8.7 |
% |
|
21 |
|
+33.3 |
% |
|
21 |
|
0.0 |
% |
|
21 |
|
-30.0 |
% |
| Eloctate |
63 |
|
-16.0 |
% |
-22.2 |
% |
|
40 |
|
-18.9 |
% |
|
— |
|
— |
% |
|
23 |
|
-10.7 |
% |
| Xenpozyme (*) |
61 |
|
+65.8 |
% |
+60.5 |
% |
|
25 |
|
+16.7 |
% |
|
23 |
|
+187.5 |
% |
|
13 |
|
+100.0 |
% |
| Wayrilz (*) |
6 |
|
— |
% |
— |
% |
|
6 |
|
— |
% |
|
— |
|
— |
% |
|
— |
|
— |
% |
| Qfitlia (*) |
4 |
|
— |
% |
— |
% |
|
4 |
|
— |
% |
|
— |
|
— |
% |
|
— |
|
— |
% |
| Neurology |
|
|
|
|
|
|
|
|
|
|
|
|
| Aubagio |
51 |
|
-30.8 |
% |
-34.6 |
% |
|
34 |
|
-9.5 |
% |
|
12 |
|
-59.3 |
% |
|
5 |
|
-44.4 |
% |
|
|
|
|
|
|
|
|
|
|
|
|
|
| Oncology |
|
|
|
|
|
|
|
|
|
|
|
|
| Sarclisa (*) |
157 |
|
+27.7 |
% |
+20.8 |
% |
|
64 |
|
+29.6 |
% |
|
45 |
|
+25.0 |
% |
|
48 |
|
+27.5 |
% |
| Jevtana |
60 |
|
-14.3 |
% |
-22.1 |
% |
|
45 |
|
-15.5 |
% |
|
— |
|
-100.0 |
% |
|
15 |
|
0.0 |
% |
| Fasturtec |
44 |
|
-7.8 |
% |
-13.7 |
% |
|
28 |
|
-14.7 |
% |
|
13 |
|
+8.3 |
% |
|
3 |
|
0.0 |
% |
| Other main medicines |
|
|
|
|
|
|
|
|
|
|
|
|
| Lantus |
419 |
|
+1.1 |
% |
-4.6 |
% |
|
199 |
|
+12.4 |
% |
|
73 |
|
-7.5 |
% |
|
147 |
|
-7.8 |
% |
| Toujeo |
332 |
|
+18.6 |
% |
+14.5 |
% |
|
59 |
|
+41.3 |
% |
|
128 |
|
+6.7 |
% |
|
145 |
|
+21.8 |
% |
| Plavix |
214 |
|
+7.6 |
% |
+1.4 |
% |
|
2 |
|
0.0 |
% |
|
22 |
|
0.0 |
% |
|
190 |
|
+8.5 |
% |
| Lovenox |
179 |
|
-21.6 |
% |
-22.5 |
% |
|
1 |
|
-50.0 |
% |
|
101 |
|
-23.7 |
% |
|
77 |
|
-18.4 |
% |
| Praluent |
132 |
|
+20.0 |
% |
+20.0 |
% |
|
— |
|
— |
% |
|
111 |
|
+30.6 |
% |
|
21 |
|
-16.0 |
% |
| Thymoglobulin |
124 |
|
+6.4 |
% |
-0.8 |
% |
|
81 |
|
+7.3 |
% |
|
11 |
|
+10.0 |
% |
|
32 |
|
+3.0 |
% |
| Rezurock (*) |
113 |
|
-6.1 |
% |
-14.4 |
% |
|
105 |
|
-4.2 |
% |
|
(4) |
|
-150.0 |
% |
|
12 |
|
+180.0 |
% |
| Aprovel |
105 |
|
+4.8 |
% |
— |
% |
|
— |
|
— |
% |
|
18 |
|
0.0 |
% |
|
87 |
|
+5.8 |
% |
| Soliqua/iGlarLixi |
84 |
|
+51.7 |
% |
+44.8 |
% |
|
37 |
|
+105.0 |
% |
|
12 |
|
-7.7 |
% |
|
35 |
|
+40.0 |
% |
| Multaq |
76 |
|
+7.8 |
% |
-1.3 |
% |
|
69 |
|
+10.3 |
% |
|
3 |
|
0.0 |
% |
|
4 |
|
-16.7 |
% |
| Tzield (*) |
16 |
|
0.0 |
% |
-11.1 |
% |
|
15 |
|
0.0 |
% |
|
— |
|
— |
% |
|
1 |
|
0.0 |
% |
| Mozobil |
6 |
|
-33.3 |
% |
-50.0 |
% |
|
1 |
|
-33.3 |
% |
|
1 |
|
-75.0 |
% |
|
4 |
|
0.0 |
% |
| Others |
901 |
|
-10.0 |
% |
-12.7 |
% |
|
83 |
|
-9.4 |
% |
|
276 |
|
-11.9 |
% |
|
542 |
|
-9.1 |
% |
| Industrial Sales |
136 |
|
+13.7 |
% |
+9.7 |
% |
|
— |
|
— |
% |
|
136 |
|
+13.8 |
% |
|
— |
|
— |
% |
| Vaccines |
|
|
|
|
|
|
|
|
|
|
|
|
| Beyfortus (**) |
686 |
|
-14.9 |
% |
-18.4 |
% |
|
266 |
|
-31.9 |
% |
|
255 |
|
-24.5 |
% |
|
165 |
|
+105.8 |
% |
| Influenza, COVID-19 (**) |
575 |
|
+31.5 |
% |
+26.7 |
% |
|
236 |
|
+42.7 |
% |
|
148 |
|
+13.1 |
% |
|
191 |
|
+34.2 |
% |
| Polio/Pertussis/Hib primary vaccines and boosters |
551 |
|
-9.5 |
% |
-12.8 |
% |
|
107 |
|
-18.2 |
% |
|
121 |
|
+4.3 |
% |
|
323 |
|
-10.5 |
% |
| Meningitis, travel, and endemic |
227 |
|
-4.8 |
% |
-8.8 |
% |
|
87 |
|
-7.9 |
% |
|
59 |
|
+7.1 |
% |
|
81 |
|
-8.7 |
% |
| Biopharma |
11,303 |
|
+13.3 |
% |
+7.0 |
% |
|
5,803 |
|
+22.6 |
% |
|
2,436 |
|
+0.2 |
% |
|
3,064 |
|
+8.0 |
% |
| Pharma launches (*) |
1,121 |
|
+49.4 |
% |
+39.3 |
% |
|
780 |
|
+54.8 |
% |
|
184 |
|
+33.6 |
% |
|
157 |
|
+42.7 |
% |
| Launches (*), (**) |
1,816 |
+17.1 |
% |
+10.3 |
% |
|
1,043 |
|
+17.0 |
% |
|
439 |
|
-7.6 |
% |
|
334 |
|
+75.4 |
% |
|
|
|
|
|
|
SANOFI PRESS RELEASE Q4 2025 |
14 |
Appendix 1: FY 2025 net sales by medicine/vaccine and geography
|
|
|
|
|
|
|
|
|
|
|
|
|
|
|
|
|
|
|
|
|
|
|
|
|
|
|
|
|
|
|
|
|
|
|
|
|
|
|
|
FY 2025
(€ million)
|
Total sales |
Change
at CER |
Change |
|
United States |
Change
at CER |
|
Europe |
Change
at CER |
|
Rest of World |
Change
at CER |
| Immunology |
|
|
|
|
|
|
|
|
|
|
|
|
| Dupixent |
15,714 |
|
+25.2 |
% |
+20.2 |
% |
|
11,538 |
|
+26.7 |
% |
|
1,957 |
|
+20.8 |
% |
|
2,219 |
|
+21.3 |
% |
| Kevzara |
507 |
|
+23.6 |
% |
+19.6 |
% |
|
321 |
|
+36.6 |
% |
|
127 |
|
+5.0 |
% |
|
59 |
|
+7.0 |
% |
| Rare diseases |
|
|
|
|
|
|
|
|
|
|
|
|
| ALTUVIIIO (*) |
1,160 |
|
+77.6 |
% |
+70.1 |
% |
|
979 |
|
+66.5 |
% |
|
— |
|
— |
% |
|
181 |
|
+183.1 |
% |
| Fabrazyme |
1,019 |
|
+0.1 |
% |
-2.7 |
% |
|
508 |
|
-0.4 |
% |
|
263 |
|
+3.5 |
% |
|
248 |
|
-2.3 |
% |
| Nexviazyme/Nexviadyme (*) |
790 |
|
+21.4 |
% |
+18.4 |
% |
|
393 |
|
+13.6 |
% |
|
279 |
|
+38.8 |
% |
|
118 |
|
+15.2 |
% |
| Cerezyme |
695 |
|
-3.9 |
% |
-6.3 |
% |
|
178 |
|
-2.6 |
% |
|
232 |
|
-4.9 |
% |
|
285 |
|
-3.9 |
% |
| Alprolix |
603 |
|
+7.0 |
% |
+2.6 |
% |
|
454 |
|
+1.7 |
% |
|
— |
|
— |
% |
|
149 |
|
+26.6 |
% |
| Myozyme |
519 |
|
-21.0 |
% |
-22.7 |
% |
|
173 |
|
-23.1 |
% |
|
173 |
|
-33.5 |
% |
|
173 |
|
0.0 |
% |
| Cerdelga |
335 |
|
+3.0 |
% |
+0.6 |
% |
|
180 |
|
+1.1 |
% |
|
137 |
|
+7.0 |
% |
|
18 |
|
-5.3 |
% |
| Ayvakit (*) |
305 |
|
— |
% |
— |
% |
|
267 |
|
— |
% |
|
36 |
|
— |
% |
|
2 |
|
— |
% |
| Aldurazyme |
305 |
|
+5.1 |
% |
+2.7 |
% |
|
74 |
|
+8.3 |
% |
|
84 |
|
0.0 |
% |
|
147 |
|
+6.4 |
% |
| Eloctate |
275 |
|
-22.3 |
% |
-25.3 |
% |
|
178 |
|
-21.6 |
% |
|
— |
|
— |
% |
|
97 |
|
-23.5 |
% |
| Cablivi (*) |
271 |
|
+12.0 |
% |
+8.8 |
% |
|
143 |
|
+9.6 |
% |
|
107 |
|
+15.1 |
% |
|
21 |
|
+15.0 |
% |
| Xenpozyme (*) |
228 |
|
+54.3 |
% |
+51.0 |
% |
|
95 |
|
+23.5 |
% |
|
89 |
|
+93.5 |
% |
|
44 |
|
+83.3 |
% |
| Qfitlia (*) |
9 |
|
— |
% |
— |
% |
|
9 |
|
— |
% |
|
— |
|
— |
% |
|
— |
|
— |
% |
| Wayrilz (*) |
7 |
|
— |
% |
— |
% |
|
7 |
|
— |
% |
|
— |
|
— |
% |
|
— |
|
— |
% |
| Neurology |
|
|
|
|
|
|
|
|
|
|
|
|
| Aubagio |
238 |
|
-35.4 |
% |
-37.2 |
% |
|
135 |
|
-24.1 |
% |
|
67 |
|
-55.9 |
% |
|
36 |
|
-10.0 |
% |
|
|
|
|
|
|
|
|
|
|
|
|
|
| Oncology |
|
|
|
|
|
|
|
|
|
|
|
|
| Sarclisa (*) |
588 |
|
+28.5 |
% |
+24.8 |
% |
|
244 |
|
+27.5 |
% |
|
174 |
|
+29.9 |
% |
|
170 |
|
+28.5 |
% |
| Jevtana |
263 |
|
-5.9 |
% |
-9.3 |
% |
|
200 |
|
-3.3 |
% |
|
3 |
|
-57.1 |
% |
|
60 |
|
-8.7 |
% |
| Fasturtec |
175 |
|
-1.6 |
% |
-4.4 |
% |
|
111 |
|
-3.4 |
% |
|
50 |
|
+4.2 |
% |
|
14 |
|
-6.3 |
% |
| Other main medicines |
|
|
|
|
|
|
|
|
|
|
|
|
| Lantus |
1,733 |
|
+10.3 |
% |
+6.4 |
% |
|
808 |
|
+32.1 |
% |
|
297 |
|
-12.4 |
% |
|
628 |
|
+0.8 |
% |
| Toujeo |
1,345 |
|
+12.0 |
% |
+9.6 |
% |
|
240 |
|
+15.2 |
% |
|
500 |
|
+4.4 |
% |
|
605 |
|
+17.5 |
% |
| Plavix |
910 |
|
+3.1 |
% |
-0.4 |
% |
|
6 |
|
0.0 |
% |
|
88 |
|
-3.3 |
% |
|
816 |
|
+3.8 |
% |
| Lovenox |
822 |
|
-14.4 |
% |
-16.3 |
% |
|
11 |
|
+22.2 |
% |
|
455 |
|
-19.9 |
% |
|
356 |
|
-7.4 |
% |
| Praluent |
526 |
|
+9.3 |
% |
+8.9 |
% |
|
— |
|
— |
% |
|
426 |
|
+25.0 |
% |
|
100 |
|
-28.0 |
% |
| Rezurock (*) |
490 |
|
+8.7 |
% |
+4.3 |
% |
|
425 |
|
+4.2 |
% |
|
18 |
|
-35.7 |
% |
|
47 |
|
+194.1 |
% |
| Thymoglobulin |
490 |
|
+3.7 |
% |
-0.4 |
% |
|
307 |
|
+2.9 |
% |
|
41 |
|
+5.1 |
% |
|
142 |
|
+5.0 |
% |
| Aprovel |
417 |
|
+3.1 |
% |
+0.2 |
% |
|
4 |
|
+25.0 |
% |
|
71 |
|
-2.7 |
% |
|
342 |
|
+4.1 |
% |
| Multaq |
314 |
|
+5.1 |
% |
+1.0 |
% |
|
285 |
|
+6.8 |
% |
|
10 |
|
-9.1 |
% |
|
19 |
|
-9.1 |
% |
| Soliqua/iGlarLixi |
282 |
|
+28.2 |
% |
+24.2 |
% |
|
100 |
|
+40.0 |
% |
|
51 |
|
+6.3 |
% |
|
131 |
|
+29.8 |
% |
| Tzield (*) |
63 |
|
+22.2 |
% |
+16.7 |
% |
|
59 |
|
+19.2 |
% |
|
2 |
|
+100.0 |
% |
|
2 |
|
+100.0 |
% |
| Mozobil |
32 |
|
-54.1 |
% |
-56.8 |
% |
|
4 |
|
-58.3 |
% |
|
8 |
|
-79.5 |
% |
|
20 |
|
-8.7 |
% |
| Others |
3,777 |
|
-11.0 |
% |
-13.5 |
% |
|
336 |
|
-17.8 |
% |
|
1,133 |
|
-11.4 |
% |
|
2,308 |
|
-9.7 |
% |
| Industrial Sales |
483 |
|
-6.1 |
% |
-7.6 |
% |
|
1 |
|
0.0 |
% |
|
472 |
|
-7.7 |
% |
|
10 |
|
+400.0 |
% |
| Vaccines |
|
|
|
|
|
|
|
|
|
|
|
|
| Polio/Pertussis/Hib primary vaccines and boosters |
2,554 |
|
-4.4 |
% |
-6.8 |
% |
|
632 |
|
-3.1 |
% |
|
450 |
|
-9.5 |
% |
|
1,472 |
|
-3.3 |
% |
| Influenza, COVID-19 (**) |
2,314 |
|
-5.8 |
% |
-9.4 |
% |
|
1,328 |
|
-1.9 |
% |
|
556 |
|
-13.1 |
% |
|
430 |
|
-7.9 |
% |
| Beyfortus (**) |
1,781 |
|
+9.5 |
% |
+5.6 |
% |
|
723 |
|
-27.9 |
% |
|
601 |
|
+36.1 |
% |
|
457 |
|
+168.5 |
% |
| Meningitis, travel, and endemic |
1,287 |
|
+0.8 |
% |
-2.2 |
% |
|
720 |
|
+1.9 |
% |
|
212 |
|
+3.9 |
% |
|
355 |
|
-2.9 |
% |
| Biopharma |
43,626 |
|
+9.9 |
% |
+6.2 |
% |
|
22,176 |
|
+16.3 |
% |
|
9,169 |
|
+1.6 |
% |
|
12,281 |
|
+5.6 |
% |
| Pharma launches (*) |
3,911 |
+47.9 |
% |
+42.5 |
% |
|
2,621 |
+47.0 |
% |
|
705 |
+40.2 |
% |
|
585 |
+63.1 |
% |
| Launches (*), (**) |
5,721 |
|
+34.0 |
% |
+29.1 |
% |
|
3,361 |
|
+20.4 |
% |
|
1,306 |
|
+38.3 |
% |
|
1,054 |
|
+99.6 |
% |
|
|
|
|
|
|
SANOFI PRESS RELEASE Q4 2025 |
15 |
Appendix 2: Business net income
|
|
|
|
|
|
|
|
|
|
|
|
|
|
|
|
|
|
|
|
|
|
|
|
|
|
|
|
|
|
| Q4 2025 |
Biopharma |
Other |
Total group |
| (€ million) |
Q4 2025 |
Q4 2024 |
Change |
Q4 2025 |
Q4 2024 |
Change |
Q4 2025 |
Q4 2024 |
Change |
| Net sales |
11,303 |
|
10,564 |
|
7.0 |
% |
— |
|
— |
|
— |
% |
11,303 |
|
10,564 |
|
7.0 |
% |
| Other revenues |
746 |
|
774 |
|
-3.6 |
% |
156 |
|
82 |
|
90.2 |
% |
902 |
|
856 |
|
5.4 |
% |
| Cost of sales |
(3,611) |
|
(3,524) |
|
2.5 |
% |
(76) |
|
(52) |
|
46.2 |
% |
(3,687) |
|
(3,576) |
|
3.1 |
% |
| As % of net sales |
(31.9 |
%) |
(33.4 |
%) |
|
— |
% |
— |
% |
|
(32.6 |
%) |
(33.9 |
%) |
|
| Business gross profit |
8,438 |
|
7,814 |
|
8.0 |
% |
80 |
|
30 |
|
166.7 |
% |
8,518 |
|
7,844 |
|
8.6 |
% |
| As % of net sales |
74.7 |
% |
74.0 |
% |
|
— |
% |
— |
% |
|
75.4 |
% |
74.3 |
% |
|
| Research and development expenses |
(2,290) |
|
(2,257) |
|
1.5 |
% |
(1) |
|
— |
|
— |
% |
(2,291) |
|
(2,257) |
|
1.5 |
% |
| As % of net sales |
(20.3 |
%) |
(21.4 |
%) |
|
— |
% |
— |
% |
|
(20.3 |
%) |
(21.4 |
%) |
|
| Selling and general expenses |
(2,680) |
|
(2,647) |
|
1.2 |
% |
(66) |
|
(1) |
|
6500.0 |
% |
(2,746) |
|
(2,648) |
|
3.7 |
% |
| As % of net sales |
(23.7 |
%) |
(25.1 |
%) |
|
— |
% |
— |
% |
|
(24.3 |
%) |
(25.1 |
%) |
|
| Other operating income/expenses |
(1,168) |
|
(897) |
|
|
(10) |
|
11 |
|
|
(1,178) |
|
(886) |
|
|
| Share of profit/loss of associates and joint ventures1 |
40 |
|
32 |
|
|
— |
|
— |
|
|
40 |
|
32 |
|
|
| Net income attributable to non-controlling interests |
(2) |
|
(7) |
|
|
— |
|
— |
|
|
(2) |
|
(7) |
|
|
| Business operating income |
2,338 |
|
2,038 |
|
14.7 |
% |
3 |
|
40 |
|
-92.5 |
% |
2,341 |
|
2,078 |
|
12.7 |
% |
| As % of net sales |
20.7 |
% |
19.3 |
% |
|
— |
% |
— |
% |
|
20.7 |
% |
19.7 |
% |
|
|
|
|
|
|
|
|
|
|
|
|
|
|
Financial income and expenses |
(71) |
|
(62) |
|
|
|
|
|
Income tax expenses |
(414) |
|
(374) |
|
|
|
|
|
Tax rate2 |
(18.5 |
%) |
(18.8 |
%) |
|
|
|
|
Business net income |
1,856 |
|
1,642 |
|
13.0 |
% |
|
|
|
As % of net sales |
16.4 |
% |
15.5 |
% |
|
|
|
|
|
|
|
|
|
|
|
Business EPS (in euros)3 |
1.53 |
1.31 |
16.8 |
% |
1 Net of tax.
2 Determined based on business income before tax, associates, and non-controlling interests.
3 Based on an average number of shares outstanding of 1,212.7 million in Q4 2025 and 1,253.6 million in Q4 2024.
|
|
|
|
|
|
SANOFI PRESS RELEASE Q4 2025 |
16 |
|
|
|
|
|
|
|
|
|
|
|
|
|
|
|
|
|
|
|
|
|
|
|
|
|
|
|
|
|
|
|
|
|
|
| FY 2025 |
Biopharma |
Other |
Total group |
|
|
|
|
| (€ million) |
FY 2025 |
FY 2024 |
Change |
FY 2025 |
FY 2024 |
Change |
FY 2025 |
FY 2024 |
Change |
|
|
|
|
| Net sales |
43,626 |
|
41,081 |
|
6.2 |
% |
— |
|
— |
|
— |
% |
43,626 |
|
41,081 |
|
6.2 |
% |
|
|
|
|
| Other revenues |
2,603 |
|
2,866 |
|
-9.2 |
% |
487 |
|
339 |
|
43.7 |
% |
3,090 |
|
3,205 |
|
-3.6 |
% |
|
|
|
|
| Cost of sales |
(12,656) |
|
(12,973) |
|
-2.4 |
% |
(267) |
|
(222) |
|
20.3 |
% |
(12,923) |
|
(13,195) |
|
-2.1 |
% |
|
|
|
|
| As % of net sales |
(29.0 |
%) |
(31.6 |
%) |
|
— |
% |
— |
% |
|
(29.6 |
%) |
(32.1 |
%) |
|
|
|
|
|
| Business gross profit |
33,573 |
|
30,974 |
|
8.4 |
% |
220 |
|
117 |
|
88.0 |
% |
33,793 |
|
31,091 |
|
8.7 |
% |
|
|
|
|
| As % of net sales |
77.0 |
% |
75.4 |
% |
|
— |
% |
— |
% |
|
77.5 |
% |
75.7 |
% |
|
|
|
|
|
| Research and development expenses |
(7,840) |
|
(7,393) |
|
6.0 |
% |
(2) |
|
(1) |
|
100.0 |
% |
(7,842) |
|
(7,394) |
|
6.1 |
% |
|
|
|
|
| As % of net sales |
(18.0 |
%) |
(18.0 |
%) |
|
— |
% |
— |
% |
|
(18.0 |
%) |
(18.0 |
%) |
|
|
|
|
|
| Selling and general expenses |
(9,369) |
|
(9,113) |
|
2.8 |
% |
(174) |
|
(70) |
|
148.6 |
% |
(9,543) |
|
(9,183) |
|
3.9 |
% |
|
|
|
|
| As % of net sales |
(21.5 |
%) |
(22.2 |
%) |
|
— |
% |
— |
% |
|
(21.9 |
%) |
(22.4 |
%) |
|
|
|
|
|
| Other operating income/expenses |
(4,391) |
|
(3,305) |
|
|
(33) |
|
12 |
|
|
(4,424) |
|
(3,293) |
|
|
|
|
|
|
| Share of profit/loss of associates and joint ventures1 |
164 |
|
136 |
|
|
15 |
|
— |
|
|
179 |
|
136 |
|
|
|
|
|
|
| Net income attributable to non-controlling interests |
(14) |
|
(14) |
|
|
— |
|
— |
|
|
(14) |
|
(14) |
|
|
|
|
|
|
| Business operating income |
12,123 |
|
11,285 |
|
7.4 |
% |
26 |
|
58 |
|
-55.2 |
% |
12,149 |
|
11,343 |
|
7.1 |
% |
|
|
|
|
| As % of net sales |
27.8 |
% |
27.5 |
% |
|
— |
% |
— |
% |
|
27.8 |
% |
27.6 |
% |
|
|
|
|
|
|
|
|
|
|
|
|
|
|
|
|
|
|
|
|
|
|
Financial income and expenses |
(262) |
|
(263) |
|
|
|
|
|
|
|
|
|
Income tax expenses |
(2,332) |
|
(2,168) |
|
|
|
|
|
|
|
|
|
Tax rate2 |
(19.9 |
%) |
(19.8 |
%) |
|
|
|
|
|
|
|
|
Business net income |
9,555 |
|
8,912 |
|
7.2 |
% |
|
|
|
|
|
|
|
As % of net sales |
21.9 |
% |
21.7 |
% |
|
|
|
|
|
|
|
|
|
|
|
|
|
|
|
|
|
|
|
Business EPS (in euros)3 |
7.83 |
7.12 |
10.0 |
% |
|
|
|
|
1 Net of tax.
2 Determined based on business income before tax, associates, and non-controlling interests.
3 Based on an average number of shares outstanding of 1,220.4 million in FY 2025 and 1,251.4 million in FY 2024.
|
|
|
|
|
|
SANOFI PRESS RELEASE Q4 2025 |
17 |
Appendix 3: Consolidated income statement
|
|
|
|
|
|
|
|
|
|
|
|
|
|
|
| (€ million) |
Q4 2025 |
Q4 2024 |
FY 2025 |
FY 2024 |
| Net sales |
11,303 |
|
10,564 |
|
43,626 |
|
41,081 |
|
| Other revenues |
902 |
|
856 |
|
3,090 |
|
3,205 |
|
| Cost of sales |
(3,756) |
|
(3,576) |
|
(13,049) |
|
(13,205) |
|
| Gross profit |
8,449 |
|
7,844 |
|
33,667 |
|
31,081 |
|
| Research and development expenses |
(2,291) |
|
(2,257) |
|
(7,842) |
|
(7,394) |
|
| Selling and general expenses |
(2,746) |
|
(2,648) |
|
(9,543) |
|
(9,183) |
|
| Other operating income |
401 |
|
363 |
|
1,231 |
|
1,089 |
|
| Other operating expenses |
(1,579) |
|
(1,249) |
|
(5,655) |
|
(4,382) |
|
| Amortisation of intangible assets |
(538) |
|
(450) |
|
(1,776) |
|
(1,749) |
|
| Impairment of intangible assets |
(2,013) |
|
(439) |
|
(2,241) |
|
(248) |
|
| Fair value remeasurement of contingent consideration |
13 |
|
(22) |
|
(104) |
|
(96) |
|
| Restructuring costs and similar items |
(536) |
|
(192) |
|
(1,138) |
|
(1,396) |
|
| Other gains and losses, and litigation |
(198) |
|
(5) |
|
(255) |
|
(470) |
|
|
|
|
|
|
| Operating income |
(1,038) |
|
945 |
|
6,344 |
|
7,252 |
|
| Financial expenses |
25 |
|
(235) |
|
(563) |
|
(1,073) |
|
| Financial income |
96 |
|
111 |
|
394 |
|
519 |
|
| Income before tax and associates and joint ventures |
(917) |
|
821 |
|
6,175 |
|
6,698 |
|
| Income tax expense |
348 |
|
(141) |
|
(1,043) |
|
(1,204) |
|
| Share of profit/(loss) of associates and joint ventures |
(238) |
|
9 |
|
(155) |
|
60 |
|
| Net income from continuing operations |
(807) |
|
689 |
|
4,977 |
|
5,554 |
|
Net income from discontinued operations |
13 |
|
(178) |
|
2,874 |
|
64 |
|
| Net income |
(794) |
|
511 |
|
7,851 |
|
5,618 |
|
| Net income attributable to non-controlling interests |
7 |
|
12 |
|
38 |
|
58 |
|
| Net income attributable to equity holders of Sanofi |
(801) |
|
499 |
|
7,813 |
|
5,560 |
|
| Average number of shares outstanding (million) |
1,212.7 |
|
1,253.6 |
|
1,220.4 |
|
1,251.4 |
|
| Basic earnings per share from continuing operations (€) |
(0.67) |
|
0.54 |
|
4.05 |
|
4.40 |
|
| Basic earnings per share from discontinued operations (€) |
0.01 |
|
(0.14) |
|
2.35 |
|
0.05 |
|
| Basic earnings per share (€) |
(0.66) |
|
0.40 |
|
6.40 |
|
4.44 |
|
|
|
|
|
|
|
SANOFI PRESS RELEASE Q4 2025 |
18 |
Appendix 4: Reconciliation of net income attributable to equity holders of Sanofi to business net income
|
|
|
|
|
|
|
|
|
|
|
|
|
|
|
| (€ million) |
Q4 2025 |
Q4 2024 |
FY 2025 |
FY 2024 |
| Net income attributable to equity holders of Sanofi |
(801) |
|
499 |
|
7,813 |
|
5,560 |
|
| Net income from discontinued operations |
(13) |
|
178 |
|
(2,874) |
|
(64) |
|
| Amortisation of intangible assets1 |
538 |
|
450 |
|
1,776 |
|
1,749 |
|
| Impairment of intangible assets |
2,013 |
|
439 |
|
2,241 |
|
248 |
|
| Fair value remeasurement of contingent consideration |
(9) |
|
24 |
|
118 |
|
127 |
|
| Expenses arising from the impact of acquisitions on inventories |
69 |
|
— |
|
126 |
|
10 |
|
|
|
|
|
|
| Restructuring costs and similar items |
536 |
|
192 |
|
1,138 |
|
1,396 |
|
| Other gains and losses, and litigation |
198 |
|
5 |
|
255 |
|
470 |
|
| Financial (income) / expense related to liabilities carried at amortized cost other than net indebtedness |
(192) |
|
62 |
|
(93) |
|
291 |
|
|
|
|
|
|
| Tax effect of the items listed above: |
(768) |
|
(131) |
|
(1,311) |
|
(883) |
|
| Amortisation and impairment of intangible assets |
(631) |
|
(205) |
|
(888) |
|
(359) |
|
| Fair value remeasurement of contingent consideration |
1 |
|
(6) |
|
(27) |
|
(25) |
|
| Expenses arising from the impact of acquisitions on inventories |
(20) |
|
— |
|
(35) |
|
— |
|
| Restructuring costs and similar items |
(105) |
|
57 |
|
(252) |
|
(320) |
|
|
|
|
|
|
| Other items |
(13) |
|
23 |
|
(109) |
|
(179) |
|
| Other tax effects |
6 |
|
(102) |
|
22 |
|
(81) |
|
| Other items |
279 |
|
26 |
|
344 |
|
89 |
|
|
|
|
|
|
|
|
|
|
|
|
|
|
|
|
|
|
|
|
|
| Business net income |
1,856 |
|
1,642 |
|
9,555 |
|
8,912 |
|
Business earnings per share (€)2 |
1.53 |
|
1.31 |
|
7.83 |
|
7.12 |
|
Basic earnings per share (€)2 |
(0.66) |
|
0.40 |
|
6.40 |
|
4.44 |
|
1 Of which related to amortisation expense generated by the intangible assets measured at their acquisition-date fair values: €520 million in Q4 2025 and
€395 in million in Q4 2024.
2 Based on an average number of shares outstanding of 1,212.7 million in Q4 2025, 1,220.4 million in FY 2025, 1,253.6 million in Q4 2024 and 1,251.4 million
in FY 2024.
|
|
|
|
|
|
SANOFI PRESS RELEASE Q4 2025 |
19 |
Appendix 5: Change in net debt and summarized statements of cash flow
|
|
|
|
|
|
|
|
|
| (€ million) |
FY 2025 |
FY 2024 |
| Business net income |
9,555 |
|
8,912 |
|
| Depreciation, amortisation and impairment of property, plant and equipment and software |
1,434 |
|
1,546 |
|
| Other items |
(1,335) |
|
(627) |
|
| Operating cash flow |
9,654 |
|
9,831 |
|
| Changes in working capital |
2,095 |
|
(507) |
|
| Acquisitions of property, plant and equipment and software |
(1,858) |
|
(1,808) |
|
| Free cash flow before restructuring, acquisitions, and disposals |
9,891 |
|
7,516 |
|
| Acquisitions of intangibles assets, investments, and other long-term financial assets1 |
(1,761) |
|
(1,434) |
|
| Restructuring costs and similar items paid |
(785) |
|
(932) |
|
Proceeds from disposals of property, plant, and equipment, intangible assets, and other non-current assets net of taxes1 |
744 |
|
805 |
|
| Free cash flow |
8,089 |
|
5,955 |
|
| Acquisitions2 |
(10,986) |
|
(2,509) |
|
Proceeds net of taxes2 |
— |
|
609 |
|
| Issuance of Sanofi shares |
177 |
|
187 |
|
| Acquisition of treasury shares and related tax effect |
(5,030) |
|
(302) |
|
| Dividends paid to shareholders of Sanofi |
(4,772) |
|
(4,704) |
|
| Other items |
(391) |
|
(438) |
|
| Net cash inflow from the Opella transaction |
10,443 |
|
— |
|
| Net cash provided by/(used in) the discontinued Opella business |
136 |
|
321 |
|
| Change in net debt before Opella reclassification to “Assets held-for-sale” |
(2,334) |
|
(881) |
|
| Opella net debt reclassified to held for sale as of December 31, 2024 |
98 |
|
(98) |
|
| Change in net debt |
(2,236) |
|
(979) |
|
| Beginning of period |
8,772 |
|
7,793 |
|
| Closing of net debt |
11,008 |
|
8,772 |
|
|
|
|
|
|
|
|
|
|
(€ million) |
FY 2025 |
FY 2024 |
| Net cash provided by/(used in) continuing operating activities |
10,561 |
|
8,607 |
|
| Net cash provided by/(used in) operating activities of the discontinued Opella business |
189 |
|
474 |
|
| Net cash provided by/(used in) operating activities |
10,750 |
|
9,081 |
|
| Net cash provided by/(used in) continuing investing activities |
(12,849) |
|
(4,298) |
|
| Net cash provided by/(used in) investing activities of the discontinued Opella business |
(36) |
|
(109) |
|
| Net cash inflow from the Opella transaction |
10,438 |
|
— |
|
| Net cash provided by/(used in) investing activities |
(2,447) |
|
(4,407) |
|
| Net cash provided by/(used in) continuing financing activities |
(8,159) |
|
(5,751) |
|
| Net cash provided by/(used in) financing activities of the discontinued Opella business |
(48) |
|
(12) |
|
| Net cash provided by/(used in) financing activities |
(8,207) |
|
(5,763) |
|
| Impact of exchange rates on cash and cash equivalents |
(47) |
|
(13) |
|
| Cash and cash equivalents reported as held for sale as of December 31, 2024 |
167 |
|
(167) |
|
| Net change in cash and cash equivalents |
216 |
|
(1,269) |
|
| Cash and cash equivalents, beginning of period |
7,441 |
|
8,710 |
|
| Cash and cash equivalents, end of period |
7,657 |
|
7,441 |
|
|
|
|
1 Free cash flow includes investments and divestments not exceeding a cap of €500 million per transaction (inclusive of all payments related to the
transaction).
2 Includes transactions that are above a cap of €500 million per transaction (inclusive of all payments related to the transaction).
|
|
|
|
|
|
SANOFI PRESS RELEASE Q4 2025 |
20 |
Appendix 6: Simplified consolidated balance sheet
|
|
|
|
|
|
|
|
|
|
|
|
|
|
|
|
|
|
|
|
|
|
Assets
(€ million)
|
December 31, 2025 |
December 31, 2024 |
|
liabilities and equity
(€ million)
|
December 31, 2025 |
December 31, 2024 |
|
|
|
|
Equity attributable to equity holders of Sanofi |
71,376 |
77,507 |
|
|
|
|
Equity attributable to non-controlling interests |
334 |
350 |
|
|
|
|
Total equity |
71,710 |
77,857 |
|
|
|
|
Long-term debt |
14,248 |
11,791 |
| Property, plant, and equipment – owned assets |
10,052 |
10,091 |
|
Non-current lease liabilities |
1,467 |
1,645 |
| Right-of-use assets |
1,459 |
1,510 |
|
Non-current liabilities related to business combinations and to non-controlling interests |
585 |
569 |
|
|
|
|
|
|
|
|
|
|
|
|
|
|
| Intangible assets (including goodwill) |
67,561 |
66,013 |
|
Non-current provisions and other non-current liabilities |
6,703 |
8,096 |
| Non-current income tax assets |
550 |
560 |
|
Non-current income tax liabilities |
2,081 |
1,512 |
|
|
|
|
|
|
|
|
|
|
|
|
|
|
|
|
|
|
|
|
|
| Other non-current assets, investments in associates and joint-ventures and deferred tax assets |
16,231 |
12,036 |
|
Deferred tax liabilities |
1,666 |
2,166 |
| Non-current assets |
95,853 |
90,210 |
|
Non-current liabilities |
26,750 |
25,779 |
|
|
|
|
|
|
|
|
|
|
|
|
|
|
|
|
|
|
Accounts payable and other current liabilities |
22,926 |
21,792 |
|
|
|
|
Current liabilities related to business combinations and to non-controlling interests |
0 |
72 |
|
|
|
|
|
|
|
|
|
|
|
|
|
|
|
|
|
|
|
|
|
| Inventories, accounts receivable and other current assets |
22,690 |
20,934 |
|
Current income tax liabilities |
751 |
697 |
| Current income tax assets |
397 |
724 |
|
Current lease liabilities |
272 |
261 |
| Cash and cash equivalents |
7,657 |
7,441 |
|
Short-term debt and current portion of long-term debt |
4,342 |
4,209 |
| Assets held for sale |
208 |
13,489 |
|
Liabilities related to assets held for sale |
54 |
2,131 |
| Current assets |
30,952 |
42,588 |
|
Current liabilities |
28,345 |
29,162 |
| Total assets |
126,805 |
132,798 |
|
Total equity and liabilities |
126,805 |
132,798 |
|
|
|
|
|
|
SANOFI PRESS RELEASE Q4 2025 |
21 |
Appendix 7: Other operating income net of expenses related to Regeneron
|
|
|
|
|
|
|
|
|
| (€ million) |
FY 2025 |
FY 2024 |
| Monoclonal antibody alliance |
|
|
| Income and expense related to profit/loss sharing |
(5,455) |
(4,143) |
| Additional share of profit paid by Regeneron related to development costs |
1,089 |
833 |
| Regeneron commercial operating expenses reimbursement |
(699) |
(637) |
| Total: monoclonal antibody alliance |
(5,065) |
(3,947) |
|
|
|
|
|
|
| Other Regeneron |
|
|
Total others related to Regeneron (mainly Libtayo and Zaltrap) |
142 |
158 |
|
| Total related to Regeneron |
(4,923) |
(3,789) |
|
|
|
|
|
|
SANOFI PRESS RELEASE Q4 2025 |
22 |
Appendix 8: Currency sensitivity
2026 net sales and business EPS currency sensitivity
|
|
|
|
|
|
|
|
|
|
|
|
| Currency |
Variation |
Net sales sensitivity |
Business EPS sensitivity |
| US Dollar |
+0.05 USD/EUR |
-€1,069 |
m |
-EUR 0.23 |
| Japanese Yen |
+5 JPY/EUR |
-€46 |
m |
-EUR 0.02 |
| Chinese Yuan |
+0.2 CNY/EUR |
-€60 |
m |
-EUR 0.02 |
| Brazilian Real |
+0.4 BRL/EUR |
-€44 |
m |
-EUR 0.01 |
Currency exposure on Q4 2025 sales
|
|
|
|
|
|
| Currency |
Q4 2025 |
| US Dollar |
52.4 |
% |
| Euro |
19.2 |
% |
| Chinese Yuan |
4.8 |
% |
| Japanese Yen |
3.0 |
% |
| Mexican Peso |
1.9 |
% |
| Canadian Dollar |
1.8 |
% |
| Brazilian Real |
1.7 |
% |
| British Pound |
1.0 |
% |
| Saudi Arabian Riyal |
0.9 |
% |
| Taiwanese Dollar |
0.8 |
% |
| Others |
12.5 |
% |
Currency average rates
|
|
|
|
|
|
|
|
|
|
|
|
|
|
|
|
Q4 2024 |
Q4 2025 |
Change |
|
|
|
| €/$ |
1.067 |
|
1.164 |
|
+9.1% |
|
|
|
| €/Yen |
162.434 |
|
179.327 |
|
+10.4% |
|
|
|
| €/Yuan |
7.685 |
|
8.253 |
|
+7.4% |
|
|
|
| €/Real |
6.229 |
|
6.273 |
|
+0.7% |
|
|
|
| €/Ruble |
106.724 |
|
92.886 |
|
-13.0 |
% |
|
|
|
|
|
|
|
|
|
SANOFI PRESS RELEASE Q4 2025 |
23 |
Appendix 9: Definitions of non-IFRS financial indicators
Company sales at constant exchange rates
References to changes in net sales “at constant exchange rates” (CER) means that it excludes the effect of changes in exchange rates.
The effect of exchange rates is eliminated by recalculating net sales for the relevant period at the exchange rates used for the previous period.
Reconciliation of net sales to company sales at constant exchange rates for Q4 and FY 2025
|
|
|
|
|
|
|
|
|
| (€ million) |
Q4 2025 |
FY 2025 |
| Net sales |
11,303 |
|
43,626 |
|
| Effect of exchange rates |
(667) |
|
(1,531) |
|
| Company sales at constant exchange rates |
11,970 |
|
45,157 |
|
Business gross profit
Business gross profit is a non-IFRS indicator that fully excludes from gross profit under IFRS the effect of the release of the fair value step-up to inventory that is recognized upon acquisition which constitutes a business combination under IFRS 3 ‘Business combinations’ or which is part of a group of assets as per IFRS 3§2b.
Business net income
Sanofi publishes a key non-IFRS indicator. Business net income is defined as net income attributable to equity holders of Sanofi excluding:
•net income from discontinued operations,
•amortisation of intangible assets,
•impairment of intangible assets,
•fair value remeasurement of contingent consideration related to business combinations or to disposals,
•expenses arising from the impact of acquisitions on inventories,
•restructuring costs and similar items (comprising transaction, integration, and separation costs in relation to major acquisitions and disposals)1,
•other gains and losses (including gains and losses on disposals of non-current assets1),
•costs or provisions associated with litigation1,
•financial (income)/expense related to liabilities carried at amortized cost other than net indebtedness,
•tax effects related to the items listed above as well as effects of major tax disputes,
•the share of profits/losses from investments accounted for using the equity method, except for the share of profits/losses from investments accounted for using the equity method, to the extent that this relates (i) to joint ventures or (ii) to associates with which Sanofi has entered into R&D agreements and/or whose operations are managed as an integral part of Sanofi’s business activities; and,
•net income attributable to non-controlling interests related to the items listed above.
Free cash flow
Free cash flow is a non-IFRS financial indicator which is reviewed by management, and which management believes provides useful information to measure the net cash generated from Sanofi’s operations that is available for strategic investments2 (net of divestments2), for debt repayment, and for capital return to shareholders. Free cash flow is determined from the Business net income adjusted for depreciation, amortisation, and impairment, share of profit/loss in associates and joint ventures net of dividends received, gains and losses on disposals, net change in provisions including pensions and other post-employment benefits, deferred taxes, share-based expense, and other non-cash items. It comprises net changes in working capital, capital expenditures and other asset acquisitions3 net of disposal proceeds3, and payments related to restructuring and similar items. Free cash flow is not defined by IFRS, and it is not a substitute measure for the IFRS aggregate net cash flow in operating activities.
1 Reported in the line items Restructuring costs and similar items and Gains and losses on disposals, and litigation.
2 Amount of the transaction above a cap of €500 million per transaction (inclusive of all payments related to the transaction).
3 Not exceeding a cap of €500 million per transaction (inclusive of all payments related to the transaction).
|
|
|
|
|
|
SANOFI PRESS RELEASE Q4 2025 |
24 |
Reconciliation from net cash provided by/(used in) operating activities to free cash flow
|
|
|
|
|
|
|
|
|
| (€ million) |
FY 2025 |
FY 2024 |
Net cash provided by/(used in) operating activities (IFRS)4 |
10,750 |
|
9,081 |
|
| Net cash provided by/(used in) operating activities (IFRS) of the discontinued Opella business |
(189) |
|
(474) |
|
| Acquisition of property, plant, and equipment and software |
(1,858) |
|
(1,808) |
|
Acquisitions of intangibles assets, investments, and other long-term financial assets3 |
(1,761) |
|
(1,434) |
|
Proceeds from disposals of property, plant and equipment, intangible assets, and other non-current assets net of taxes3 |
744 |
|
805 |
|
| Repayment of lease liabilities |
(333) |
|
(282) |
|
Others6 |
736 |
|
67 |
|
| Free cash flow5 |
8,089 |
|
5,955 |
|
3 Not exceeding a cap of €500 million per transaction (inclusive of all payments related to the transaction).
4 Most directly comparable IFRS measure to free cash flow.
5 Non IFRS indicator (see definition in Appendix 9).
6 This line item includes cash outflows from major litigation not included in Free cash flow, notably Plavix Hawaii in 2025.
|
|
|
|
|
|
SANOFI PRESS RELEASE Q4 2025 |
25 |
Appendix 10: Sustainability dashboard
The KPIs below indicate progress on the new sustainability strategy.
|
|
|
|
|
|
|
|
|
|
|
|
|
| Topic |
Ambition |
Progress |
|
| Access to healthcare |
|
|
|
FY 2025 |
9M 2025 |
|
| Access diabetes |
Increase patient reach by expanding access to diabetes care programs |
Diabetes care programs in three countries (excl. GHU countries)
94,656 patients treated |
Diabetes care programs in three countries (excl. GHU countries)
52,143 patients treated |
|
Global Health Unit (GHU) |
Reach 1.5 million non-communicable diseases patients by 2026 (cumulative since 2022) and 2 million by 2030 |
396,960 patients treated in 34 countries
87 active healthcare partnerships in 32 countries
Eight investments signed through the Impact Fund |
316,095 patients treated in 31 countries
83 active healthcare partnerships in 29 countries
Eight investments signed through the Impact Fund |
|
|
|
|
|
|
| Global access plans |
Develop a global access plan for all new medicines/vaccines to make them available within two years after first launch |
13 global access plans initiated or developed covering more than 15 indications |
12 global access plans initiated or developed covering more than 15 indications |
|
|
|
|
|
|
|
|
|
|
|
|
|
|
|
|
|
|
|
|
|
|
|
|
|
|
|
|
|
|
|
|
|
|
|
| Environmental impact |
|
|
|
Q4 20251 |
Q3 20251 |
|
|
Climate change – carbon footprint Scope 1 and 2
(CO2 emissions)
|
55% reduction in scope 1 and 2 greenhouse gas emissions (GHG) (CO2 equivalent) by 2030 (cumulative vs 2019 baseline) to contribute to carbon neutrality by 2030 and net-zero emissions by 2045 (all scopes) |
49% GHG reduction vs 2019 |
47% GHG reduction vs 2019 |
|
|
Climate change – carbon footprint Scope 3
(CO2 emissions)
|
30% reduction in scope 3 greenhouse gas emissions (CO2 equivalent) by 2030 (cumulative vs 2019 baseline) to contribute to carbon neutrality by 2030 and net-zero emissions by 2045 (all scopes) |
14% GHG reduction vs 2019 |
14% GHG reduction vs 2019 |
|
| Renewable electricity |
100% of renewable electricity at all sites by 2030 |
86% |
85% |
|
|
|
|
|
|
| Eco-design |
20 top-selling medicines and vaccines following eco-design approach by 2030 |
60% |
50% |
|
|
|
FY 20252 |
FY 2024 |
|
| Blister-free syringe vaccines |
100% blister-free syringe vaccines by 2027 |
61% blister-free vaccines |
55% blister-free syringe vaccines |
|
|
|
|
|
|
| Resilience of healthcare systems |
|
|
|
Q4 2025 |
Q3 2025 |
|
| Patient care pathways |
Assess CO2 emissions for the patient care journey for launches across global business units |
3 patient care pathways analysed for new launches |
2 patient care pathways analysed for new launches |
|
|
|
|
|
|
| Fundamentals |
|
|
|
Q4 2025 |
Q3 2025 |
|
| Global gender representation |
Women in senior leadership roles |
47% |
47% |
|
| Women in executive roles |
44% |
44% |
|
|
|
|
|
|
|
|
|
|
|
End.
1 As of 2025, Sanofi’s environmental reporting excludes Opella data.
2 This indicator considers vaccines produced in Sanofi’s internal network only.
|
|
|
|
|
|
SANOFI PRESS RELEASE Q4 2025 |
26 |
Appendix 11: Opella
Key items from the Opella (OPAL JV Co) 2025 full-year consolidated financial statements, unaudited, and from the time of closing on April 30, 2025, are presented below:
|
|
|
|
|
|
| (€ million) |
2025 |
| Consolidated income statement |
|
| Net sales and other revenues1 |
3,346 |
|
Net income1 |
(622) |
|
| Consolidated statement of comprehensive income |
|
| Other comprehensive income |
47 |
|
| Comprehensive income |
(575) |
|
|
|
|
|
|
|
| (€ million) |
December 31, 2025 |
| Consolidated balance sheet |
|
| Non-current assets |
15,013 |
|
| Current assets |
2,859 |
|
| Total assets |
17,872 |
|
|
|
| Equity attributable to equity holders of OPAL JV Co |
5,380 |
|
| Equity attributable to non-controlling interests |
490 |
|
| Total equity of Opella |
5,870 |
|
| Non-current liabilities |
9,850 |
|
| Current liabilities |
2,152 |
|
| Total liabilities |
12,002 |
|
| Total liabilities and Shareholders’ equity |
17,872 |
|
End.
1 With effect from May 1, 2025, Opella (OPAL JV Co) is accounted for using the equity method following the loss of control of Opella by Sanofi on April 30,
2025.
|
|
|
|
|
|
SANOFI PRESS RELEASE Q4 2025 |
27 |
Forward-looking statements
This press release contains forward-looking statements as defined in the Private Securities Litigation Reform Act of 1995, as amended. Forward-looking statements are statements that are not historical facts. These statements include projections and estimates and their underlying assumptions, statements regarding plans, objectives, intentions, and expectations with respect to future financial results, events, operations, services, product development and potential, and statements regarding future performance. Forward-looking statements are generally identified by the words “expects”, “seeks”, “targets”, “goal”, “anticipates”, “believes”, “intends”, “estimates”, “plans” and similar expressions. Although Sanofi’s management believes that the expectations reflected in such forward-looking statements are reasonable, investors are cautioned that forward-looking information and statements are subject to various risks and uncertainties, many of which are difficult to predict and generally beyond the control of Sanofi, that could cause actual results and developments to differ materially from those expressed in, or implied or projected by, the forward-looking information and statements. These risks and uncertainties include among other things, the uncertainties inherent in research and development, future clinical data and analysis, including post marketing, decisions by regulatory authorities, such as the FDA or the EMA, regarding whether and when to approve any drug, device or biological application that may be filed for any such product candidates as well as their decisions regarding labelling and other matters that could affect the availability or commercial potential of such product candidates, the fact that product candidates if approved may not be commercially successful, the future approval and commercial success of therapeutic alternatives, political pressure to provide beneficial pricing in the United States including to State Medicaid programs of “most favored nation” drug prices and elsewhere, Sanofi’s ability to benefit from external growth opportunities, to complete related transactions and/or obtain regulatory clearances, risks associated with intellectual property and any related pending or future litigation and the ultimate outcome of such litigation, trends in exchange rates and prevailing interest rates, volatile economic and market conditions, cost containment initiatives and subsequent changes thereto, and the impact that global crises may have on us, our customers, suppliers, vendors, and other business partners, and the financial condition of any one of them, as well as on our employees and on the global economy as a whole. The risks and uncertainties also include the uncertainties discussed or identified in the public filings with the SEC and the AMF made by Sanofi, including those listed under “Risk Factors” and “Cautionary Statement Regarding Forward-Looking Statements” in Sanofi’s annual report on Form 20-F for the year ended December 31, 2024. Other than as required by applicable law, Sanofi does not undertake any obligation to update or revise any forward-looking information or statements.
With respect to any sustainability or environmental, social and governance (ESG)-related information contained herein, in light of the significant uncertainties inherent in such statements and other related information contained herein, investors should not regard these statements as a representation or warranty by Sanofi or any other person that Sanofi will achieve its goals, objectives, aspirations, metrics, plans or targets in any specified time frame or at all, including with respect to ESG and sustainability matters, and such statements and other information are dependent on future market factors, such as customer demand, continued technological progress, policy support and timely rule-making or continuation of government incentives and funding, and are forward-looking statements. Sanofi’s ability to achieve goals, objectives, aspirations, metrics, plans or targets in any specified time frame or at all, including with respect to ESG and sustainability matters, is subject to other conditions and considerations, both within and outside Sanofi’s control, that may affect its ability to meet such goals, objectives, aspirations, metrics, plans or targets, and/or put in place the initiatives required to meet them. Such conditions and considerations include but are not limited to the risk factors described above. In addition, historical, current, and forward-looking environmental and other ESG or sustainability-related statements may be based on standards for measuring progress that are still developing, internal controls and processes that continue to evolve, and assumptions that are subject to change in the future, including future laws and rulemaking. Sanofi plans to continue to evaluate its goals, objectives, aspirations, metrics, plans and targets and its approach to them and may make adjustments as it deems necessary in light of such considerations.
All Sanofi trademarks mentioned in this document are protected.
|
|
|
|
|
|
SANOFI PRESS RELEASE Q4 2025 |
28 |