| ☒ | QUARTERLY REPORT PURSUANT TO SECTION 13 OR 15(d) OF THE SECURITIES EXCHANGE ACT OF 1934 |
|||||||
For the quarterly period ended |
June 30, 2025 | |||||||
OR | ||||||||
| ☐ | TRANSITION REPORT PURSUANT TO SECTION 13 OR 15(d) OF THE SECURITIES EXCHANGE ACT OF 1934 |
|||||||
For the transition period |
from ________ to ________ |
|||||||
| Delaware | 52-1165937 | ||||||||||
| (State or Other Jurisdiction of Incorporation or Organization) | (I.R.S. Employer Identification No.) | ||||||||||
| 151 W. 42nd Street, | New York, | New York | 10036 | ||||||||
| (Address of Principal Executive Offices) | (Zip Code) | ||||||||||
| Title of each class | Trading Symbol(s) | Name of each exchange on which registered | ||||||||||||
| Common Stock, $0.01 par value per share | NDAQ | The Nasdaq Stock Market | ||||||||||||
| 4.500% Senior Notes due 2032 | NDAQ32 | The Nasdaq Stock Market | ||||||||||||
| 0.900% Senior Notes due 2033 | NDAQ33 | The Nasdaq Stock Market | ||||||||||||
| 0.875% Senior Notes due 2030 | NDAQ30 | The Nasdaq Stock Market | ||||||||||||
| 1.75% Senior Notes due 2029 | NDAQ29 | The Nasdaq Stock Market | ||||||||||||
| Large accelerated filer | ☒ | Accelerated filer | ☐ | ||||||||
| Non-accelerated filer | ☐ | Smaller reporting company | ☐ | ||||||||
| Emerging growth company | ☐ | ||||||||||
| Class | Outstanding at July 17, 2025 |
||||||||||
| Common Stock, $0.01 par value per share | 573,795,242 | shares | |||||||||
Page |
||||||||
Part I. FINANCIAL INFORMATION |
||||||||
| Item 1. | ||||||||
| Item 2. | ||||||||
| Item 3. | ||||||||
| Item 4. | ||||||||
Part II. OTHER INFORMATION |
||||||||
| Item 1. | ||||||||
Item 1A. |
||||||||
| Item 2. | ||||||||
| Item 3. | ||||||||
| Item 4. | ||||||||
| Item 5. | ||||||||
| Item 6. | ||||||||
| June 30, 2025 | December 31, 2024 | ||||||||||
| Assets | (unaudited) |
||||||||||
| Current assets: | |||||||||||
| Cash and cash equivalents | $ | 732 | $ | 592 | |||||||
| Restricted cash and cash equivalents | 195 | 31 | |||||||||
Default funds and margin deposits (including restricted cash and cash equivalents of $3,274 and $4,383, respectively) |
5,218 | 5,664 | |||||||||
| Financial investments | 84 | 184 | |||||||||
| Receivables, net | 896 | 1,022 | |||||||||
| Other current assets | 227 | 293 | |||||||||
| Total current assets | 7,352 | 7,786 | |||||||||
| Property and equipment, net | 656 | 593 | |||||||||
| Goodwill | 14,328 | 13,957 | |||||||||
| Intangible assets, net | 6,741 | 6,905 | |||||||||
| Operating lease assets | 441 | 375 | |||||||||
| Other non-current assets | 865 | 779 | |||||||||
| Total assets | $ | 30,383 | $ | 30,395 | |||||||
| Liabilities | |||||||||||
| Current liabilities: | |||||||||||
| Accounts payable and accrued expenses | $ | 246 | $ | 269 | |||||||
| Section 31 fees payable to SEC | 411 | 319 | |||||||||
| Accrued personnel costs | 280 | 325 | |||||||||
| Deferred revenue | 848 | 711 | |||||||||
| Other current liabilities | 154 | 215 | |||||||||
| Default funds and margin deposits | 5,218 | 5,664 | |||||||||
| Short-term debt | 500 | 399 | |||||||||
| Total current liabilities | 7,657 | 7,902 | |||||||||
| Long-term debt | 8,678 | 9,081 | |||||||||
| Deferred tax liabilities, net | 1,540 | 1,594 | |||||||||
| Operating lease liabilities | 453 | 388 | |||||||||
| Other non-current liabilities | 237 | 230 | |||||||||
| Total liabilities | 18,565 | 19,195 | |||||||||
| Commitments and contingencies | |||||||||||
| Equity | |||||||||||
| Nasdaq stockholders’ equity: | |||||||||||
Common stock, $0.01 par value, 900,000,000 shares authorized, shares issued: 598,528,276 at June 30, 2025 and 598,920,378 at December 31, 2024; shares outstanding: 573,914,395 at June 30, 2025 and 575,062,217 at December 31, 2024 |
6 | 6 | |||||||||
| Additional paid-in capital | 5,425 | 5,530 | |||||||||
Common stock in treasury, at cost: 24,613,881 shares at June 30, 2025 and 23,858,161 shares at December 31, 2024 |
(706) | (647) | |||||||||
| Accumulated other comprehensive loss | (1,869) | (2,099) | |||||||||
| Retained earnings | 8,955 | 8,401 | |||||||||
| Total Nasdaq stockholders’ equity | 11,811 | 11,191 | |||||||||
| Noncontrolling interests | 7 | 9 | |||||||||
| Total equity | 11,818 | 11,200 | |||||||||
| Total liabilities and equity | $ | 30,383 | $ | 30,395 | |||||||
| Three Months Ended June 30, | Six Months Ended June 30, | ||||||||||||||||||||||
| 2025 | 2024 | 2025 | 2024 | ||||||||||||||||||||
| Revenues: | |||||||||||||||||||||||
| Capital Access Platforms | $ | 527 | $ | 481 | $ | 1,042 | $ | 960 | |||||||||||||||
| Financial Technology | 464 | 420 | 896 | 813 | |||||||||||||||||||
| Market Services | 1,090 | 883 | 2,224 | 1,678 | |||||||||||||||||||
| Other revenues | 9 | 8 | 18 | 18 | |||||||||||||||||||
| Total revenues | 2,090 | 1,792 | 4,180 | 3,469 | |||||||||||||||||||
| Transaction-based expenses: | |||||||||||||||||||||||
| Transaction rebates | (629) | (483) | (1,208) | (965) | |||||||||||||||||||
| Brokerage, clearance and exchange fees | (155) | (150) | (429) | (227) | |||||||||||||||||||
| Revenues less transaction-based expenses | 1,306 | 1,159 | 2,543 | 2,277 | |||||||||||||||||||
| Operating expenses: | |||||||||||||||||||||||
| Compensation and benefits | 352 | 328 | 681 | 669 | |||||||||||||||||||
| Professional and contract services | 39 | 39 | 75 | 72 | |||||||||||||||||||
| Technology and communication infrastructure | 79 | 69 | 156 | 135 | |||||||||||||||||||
| Occupancy | 30 | 27 | 58 | 56 | |||||||||||||||||||
| General, administrative and other | 23 | 30 | 29 | 58 | |||||||||||||||||||
| Marketing and advertising | 14 | 12 | 28 | 23 | |||||||||||||||||||
| Depreciation and amortization | 158 | 153 | 313 | 308 | |||||||||||||||||||
| Regulatory | 14 | 18 | 29 | 28 | |||||||||||||||||||
| Merger and strategic initiatives | 20 | 4 | 44 | 13 | |||||||||||||||||||
| Restructuring charges | 9 | 56 | 15 | 82 | |||||||||||||||||||
| Total operating expenses | 738 | 736 | 1,428 | 1,444 | |||||||||||||||||||
| Operating income | 568 | 423 | 1,115 | 833 | |||||||||||||||||||
| Interest income | 12 | 6 | 24 | 12 | |||||||||||||||||||
| Interest expense | (95) | (102) | (192) | (211) | |||||||||||||||||||
Net gain on divestitures |
39 | — | 39 | — | |||||||||||||||||||
Other income |
1 | 12 | — | 13 | |||||||||||||||||||
Net income from unconsolidated investees |
23 | 2 | 50 | 6 | |||||||||||||||||||
| Income before income taxes | 548 | 341 | 1,036 | 653 | |||||||||||||||||||
| Income tax provision | 96 | 119 | 190 | 198 | |||||||||||||||||||
| Net income | 452 | 222 | 846 | 455 | |||||||||||||||||||
| Net loss attributable to noncontrolling interests | — | — | 1 | 1 | |||||||||||||||||||
| Net income attributable to Nasdaq | $ | 452 | $ | 222 | $ | 847 | $ | 456 | |||||||||||||||
| Per share information: | |||||||||||||||||||||||
| Basic earnings per share | $ | 0.79 | $ | 0.39 | $ | 1.47 | $ | 0.79 | |||||||||||||||
| Diluted earnings per share | $ | 0.78 | $ | 0.38 | $ | 1.46 | $ | 0.79 | |||||||||||||||
| Cash dividends declared per common share | $ | 0.27 | $ | 0.24 | $ | 0.51 | $ | 0.46 | |||||||||||||||
| Three Months Ended June 30, | Six Months Ended June 30, | ||||||||||||||||||||||
| 2025 | 2024 | 2025 | 2024 | ||||||||||||||||||||
| Net income | $ | 452 | $ | 222 | $ | 846 | $ | 455 | |||||||||||||||
| Other comprehensive income (loss): | |||||||||||||||||||||||
Foreign currency translation gains (losses) |
(45) | 38 | 130 | (79) | |||||||||||||||||||
Income tax benefit (expense)(1) |
67 | (5) | 98 | (20) | |||||||||||||||||||
| Foreign currency translation, net | 22 | 33 | 228 | (99) | |||||||||||||||||||
| Employee benefit plan adjustment | — | — | — | 19 | |||||||||||||||||||
Income tax expense |
— | — | — | (5) | |||||||||||||||||||
| Employee benefit plan, net | — | — | — | 14 | |||||||||||||||||||
Unrealized gain (loss) on derivatives instruments, net |
5 | — | 2 | (2) | |||||||||||||||||||
| Total other comprehensive income (loss), net of tax | 27 | 33 | 230 | (87) | |||||||||||||||||||
| Comprehensive income | 479 | 255 | 1,076 | 368 | |||||||||||||||||||
| Comprehensive loss attributable to noncontrolling interests | — | — | 1 | 1 | |||||||||||||||||||
| Comprehensive income attributable to Nasdaq | $ | 479 | $ | 255 | $ | 1,077 | $ | 369 | |||||||||||||||
| Three Months Ended June 30, | Six Months Ended June 30, | ||||||||||||||||||||||||||||||||||||||||||||||
2025 |
2024 |
2025 | 2024 | ||||||||||||||||||||||||||||||||||||||||||||
| Shares | $ | Shares | $ | Shares | $ | Shares | $ | ||||||||||||||||||||||||||||||||||||||||
| Common stock | 574 | 6 | 576 | 6 | 575 | 6 | 575 | 6 | |||||||||||||||||||||||||||||||||||||||
| Additional paid-in capital | |||||||||||||||||||||||||||||||||||||||||||||||
| Beginning balance | 5,450 | 5,526 | 5,530 | 5,496 | |||||||||||||||||||||||||||||||||||||||||||
| Share repurchase program | (1) | (100) | (1) | (58) | (3) | (215) | (1) | (58) | |||||||||||||||||||||||||||||||||||||||
| Share-based compensation | 1 | 46 | 1 | 39 | 2 | 81 | 3 | 69 | |||||||||||||||||||||||||||||||||||||||
| Other issuances of common stock, net | — | 29 | — | 21 | — | 29 | — | 21 | |||||||||||||||||||||||||||||||||||||||
| Ending balance | 5,425 | 5,528 | 5,425 | 5,528 | |||||||||||||||||||||||||||||||||||||||||||
| Common stock in treasury, at cost | |||||||||||||||||||||||||||||||||||||||||||||||
| Beginning balance | (672) | (611) | (647) | (587) | |||||||||||||||||||||||||||||||||||||||||||
| Other employee stock activity | — | (34) | — | (30) | — | (59) | (1) | (54) | |||||||||||||||||||||||||||||||||||||||
| Ending balance | (706) | (641) | (706) | (641) | |||||||||||||||||||||||||||||||||||||||||||
| Accumulated other comprehensive loss | |||||||||||||||||||||||||||||||||||||||||||||||
| Beginning balance | (1,896) | (2,044) | (2,099) | (1,924) | |||||||||||||||||||||||||||||||||||||||||||
| Other comprehensive income (loss) | 27 | 33 | 230 | (87) | |||||||||||||||||||||||||||||||||||||||||||
| Ending balance | (1,869) | (2,011) | (1,869) | (2,011) | |||||||||||||||||||||||||||||||||||||||||||
| Retained earnings | |||||||||||||||||||||||||||||||||||||||||||||||
| Beginning balance | 8,658 | 7,932 | 8,401 | 7,825 | |||||||||||||||||||||||||||||||||||||||||||
| Net income attributable to Nasdaq | 452 | 222 | 847 | 456 | |||||||||||||||||||||||||||||||||||||||||||
| Cash dividends declared and paid | (155) | (138) | (293) | (265) | |||||||||||||||||||||||||||||||||||||||||||
| Ending balance | 8,955 | 8,016 | 8,955 | 8,016 | |||||||||||||||||||||||||||||||||||||||||||
| Total Nasdaq stockholders’ equity | 11,811 | 10,898 | 11,811 | 10,898 | |||||||||||||||||||||||||||||||||||||||||||
| Noncontrolling interests | |||||||||||||||||||||||||||||||||||||||||||||||
| Beginning balance | 9 | 10 | 9 | 11 | |||||||||||||||||||||||||||||||||||||||||||
Net activity related to noncontrolling interests |
(2) | — | (2) | (1) | |||||||||||||||||||||||||||||||||||||||||||
| Ending balance | 7 | 10 | 7 | 10 | |||||||||||||||||||||||||||||||||||||||||||
| Total Equity | 574 | $ | 11,818 | 576 | $ | 10,908 | 574 | $ | 11,818 | 576 | $ | 10,908 | |||||||||||||||||||||||||||||||||||
| Six Months Ended June 30, | |||||||||||
| 2025 | 2024 | ||||||||||
| Cash flows from operating activities: | |||||||||||
| Net income | $ | 846 | $ | 455 | |||||||
| Adjustments to reconcile net income to net cash provided by operating activities: | |||||||||||
| Depreciation and amortization | 313 | 308 | |||||||||
| Share-based compensation | 81 | 69 | |||||||||
| Deferred income taxes | 12 | (40) | |||||||||
Net gain on divestitures |
(39) | — | |||||||||
| Non-cash restructuring charges | — | 28 | |||||||||
Net income from unconsolidated investees |
(50) | (6) | |||||||||
| Other reconciling items included in net income | (9) | 16 | |||||||||
Net change in operating assets and liabilities, excluding the effects of divestitures: |
|||||||||||
| Receivables, net | 145 | (56) | |||||||||
| Other assets | 84 | 2 | |||||||||
| Accounts payable and accrued expenses | (30) | (41) | |||||||||
| Section 31 fees payable to SEC | 92 | 130 | |||||||||
| Accrued personnel costs | (60) | (86) | |||||||||
| Deferred revenue | 118 | 144 | |||||||||
| Other liabilities | (94) | 67 | |||||||||
| Net cash provided by operating activities | 1,409 | 990 | |||||||||
| Cash flows from investing activities: | |||||||||||
| Purchases of securities | (200) | (114) | |||||||||
| Proceeds from sales and redemptions of securities | 325 | 119 | |||||||||
Proceeds from divestitures, net of cash divested |
52 | — | |||||||||
| Purchases of property and equipment | (108) | (91) | |||||||||
Investments related to default funds and margin deposits, net(1) |
(375) | 86 | |||||||||
| Other investing activities | (11) | (18) | |||||||||
Net cash used in investing activities |
(317) | (18) | |||||||||
| Cash flows from financing activities: | |||||||||||
Repayments of commercial paper, net |
— | (241) | |||||||||
| Repayments of debt and credit commitment | (657) | (340) | |||||||||
| Repurchases of common stock | (215) | (58) | |||||||||
| Dividends paid | (293) | (265) | |||||||||
| Proceeds received from employee stock activity and other issuances | 28 | 21 | |||||||||
| Payments related to employee shares withheld for taxes | (59) | (54) | |||||||||
| Default funds and margin deposits | (1,350) | (1,396) | |||||||||
| Other financing activities | 1 | — | |||||||||
Net cash used in financing activities |
(2,545) | (2,333) | |||||||||
| Effect of exchange rate changes on cash and cash equivalents and restricted cash and cash equivalents | 648 | (280) | |||||||||
Net decrease in cash and cash equivalents and restricted cash and cash equivalents |
(805) | (1,641) | |||||||||
Cash and cash equivalents, restricted cash and cash equivalents at beginning of period |
5,006 | 7,118 | |||||||||
| Cash and cash equivalents, restricted cash and cash equivalents at end of period | $ | 4,201 | $ | 5,477 | |||||||
| Reconciliation of Cash, Cash Equivalents and Restricted Cash and Cash Equivalents | |||||||||||
| Cash and cash equivalents | $ | 732 | $ | 416 | |||||||
| Restricted cash and cash equivalents | 195 | 24 | |||||||||
| Restricted cash and cash equivalents (default funds and margin deposits) | 3,274 | 5,037 | |||||||||
| Total | $ | 4,201 | $ | 5,477 | |||||||
| Supplemental Disclosure Cash Flow Information | |||||||||||
| Interest paid | $ | 209 | $ | 226 | |||||||
| Income taxes paid, net of refund | $ | 176 | $ | 102 | |||||||
| Three Months Ended June 30, | |||||||||||
2025 |
2024 |
||||||||||
| (in millions) | |||||||||||
Capital Access Platforms: |
|||||||||||
| Data & Listing Services | $ | 198 | $ | 187 | |||||||
| Index | 196 | 167 | |||||||||
| Workflow & Insights | 133 | 127 | |||||||||
Financial Technology: |
|||||||||||
| Financial Crime Management Technology | 81 | 67 | |||||||||
| Regulatory Technology | 104 | 95 | |||||||||
| Capital Markets Technology | 279 | 258 | |||||||||
| Market Services, net | 306 | 250 | |||||||||
| Other revenues | 9 | 8 | |||||||||
| Revenues less transaction-based expenses | $ | 1,306 | $ | 1,159 | |||||||
| Six Months Ended June 30, | |||||||||||
| 2025 | 2024 | ||||||||||
| (in millions) | |||||||||||
| Capital Access Platforms | |||||||||||
| Data & Listing Services | $ | 391 | $ | 372 | |||||||
| Index | 388 | 336 | |||||||||
| Workflow & Insights | 263 | 252 | |||||||||
| Financial Technology | |||||||||||
| Financial Crime Management Technology | 157 | 131 | |||||||||
| Regulatory Technology | 206 | 186 | |||||||||
| Capital Markets Technology | 533 | 496 | |||||||||
| Market Services, net | 587 | 486 | |||||||||
| Other revenues | 18 | 18 | |||||||||
| Revenues less transaction-based expenses | $ | 2,543 | $ | 2,277 | |||||||
| Financial Crime Management Technology | Regulatory Technology | Capital Markets Technology | Workflow & Insights | Total | |||||||||||||||||||||||||
| (in millions) | |||||||||||||||||||||||||||||
Remainder of 2025 |
$ | 157 | $ | 189 | $ | 189 | $ | 97 | $ | 632 | |||||||||||||||||||
| 2026 | 284 | 337 | 325 | 140 | 1,086 | ||||||||||||||||||||||||
| 2027 | 200 | 162 | 249 | 70 | 681 | ||||||||||||||||||||||||
| 2028 | 95 | 111 | 184 | 23 | 413 | ||||||||||||||||||||||||
| 2029 | 27 | 49 | 109 | 8 | 193 | ||||||||||||||||||||||||
| 2030+ | 7 | 50 | 251 | 8 | 316 | ||||||||||||||||||||||||
| Total | $ | 770 | $ | 898 | $ | 1,307 | $ | 346 | $ | 3,321 | |||||||||||||||||||
| (in millions) | |||||
| Capital Access Platforms | |||||
| Balance at December 31, 2024 | $ | 4,127 | |||
| Foreign currency translation adjustments | 153 | ||||
| Balance at June 30, 2025 | $ | 4,280 | |||
| Financial Technology | |||||
| Balance at December 31, 2024 | $ | 7,925 | |||
| Divestiture of business | (9) | ||||
| Foreign currency translation adjustments | 30 | ||||
| Balance at June 30, 2025 | $ | 7,946 | |||
| Market Services | |||||
| Balance at December 31, 2024 | $ | 1,905 | |||
| Foreign currency translation adjustments | 197 | ||||
| Balance at June 30, 2025 | $ | 2,102 | |||
| Total | |||||
| Balance at December 31, 2024 | $ | 13,957 | |||
| Divestiture of business | (9) | ||||
| Foreign currency translation adjustments | 380 | ||||
| Balance at June 30, 2025 | $ | 14,328 | |||
| June 30, 2025 | December 31, 2024 | ||||||||||
| Finite-Lived Intangible Assets | (in millions) | ||||||||||
Gross Amount: |
|||||||||||
| Technology | $ | 1,234 | $ | 1,234 | |||||||
| Customer relationships | 5,716 | 5,720 | |||||||||
| Trade names and other | 417 | 417 | |||||||||
| Foreign currency translation adjustment | (171) | (237) | |||||||||
| Total gross amount | $ | 7,196 | $ | 7,134 | |||||||
Accumulated Amortization: |
|||||||||||
| Technology | $ | (446) | $ | (348) | |||||||
| Customer relationships | (1,298) | (1,164) | |||||||||
| Trade names and other | (55) | (43) | |||||||||
| Foreign currency translation adjustment | 115 | 153 | |||||||||
| Total accumulated amortization | $ | (1,684) | $ | (1,402) | |||||||
Net Amount: |
|||||||||||
| Technology | $ | 788 | $ | 886 | |||||||
| Customer relationships | 4,418 | 4,556 | |||||||||
| Trade names and other | 362 | 374 | |||||||||
| Foreign currency translation adjustment | (56) | (84) | |||||||||
| Total finite-lived intangible assets | $ | 5,512 | $ | 5,732 | |||||||
| Indefinite-Lived Intangible Assets | |||||||||||
| Exchange and clearing registrations | $ | 1,257 | $ | 1,257 | |||||||
| Trade names | 121 | 121 | |||||||||
| Licenses | 52 | 52 | |||||||||
| Foreign currency translation adjustment | (201) | (257) | |||||||||
| Total indefinite-lived intangible assets | $ | 1,229 | $ | 1,173 | |||||||
| Total intangible assets, net | $ | 6,741 | $ | 6,905 | |||||||
| Three Months Ended June 30, | |||||||||||
| 2025 | 2024 | ||||||||||
| (in millions) | |||||||||||
| Amortization expense | $ | 122 | $ | 122 | |||||||
| Six Months Ended June 30, | |||||||||||
| 2025 | 2024 | ||||||||||
| (in millions) | |||||||||||
| Amortization expense | $ | 243 | $ | 244 | |||||||
| (in millions) | |||||
Remainder of 2025 |
$ | 246 | |||
| 2026 | 503 | ||||
| 2027 | 494 | ||||
| 2028 | 460 | ||||
| 2029 | 433 | ||||
| 2030+ | 3,432 | ||||
| Total | $ | 5,568 | |||
| June 30, 2025 | December 31, 2024 | ||||||||||
| (in millions) | |||||||||||
| Financial investments | $ | 84 | $ | 184 | |||||||
| Equity method investments | 467 | 417 | |||||||||
| Equity securities | 133 | 121 | |||||||||
Balance at December 31, 2024 |
Additions | Revenue Recognized | Foreign Currency Translation |
Balance at June 30, 2025 |
|||||||||||||
| (in millions) | |||||||||||||||||
| Capital Access Platforms: | |||||||||||||||||
| Initial Listings | $ | 89 | $ | 19 | $ | (18) | $ | 3 | $ | 93 | |||||||
| Annual Listings | 2 | 184 | (1) | 3 | 188 | ||||||||||||
| Workflow & Insights | 194 | 106 | (98) | 1 | 203 | ||||||||||||
| Other | 22 | 12 | (9) | 3 | 28 | ||||||||||||
| Financial Technology: | |||||||||||||||||
| Financial Crime Management Technology | 148 | 111 | (101) | — | 158 | ||||||||||||
| Regulatory Technology | 147 | 66 | (96) | 1 | 118 | ||||||||||||
| Capital Markets Technology | 186 | 65 | (115) | 5 | 141 | ||||||||||||
| Total | $ | 788 | $ | 563 | $ | (438) | $ | 16 | $ | 929 | |||||||
Fiscal year ended: |
2025 | 2026 | 2027 | 2028 | 2029 | 2030+ |
Total | ||||||||||||||||
| (in millions) | |||||||||||||||||||||||
| Capital Access Platforms: | |||||||||||||||||||||||
| Initial Listings | $ | 19 | $ | 33 | $ | 21 | $ | 9 | $ | 6 | $ | 5 | $ | 93 | |||||||||
| Annual Listings | 187 | 1 | — | — | — | — | 188 | ||||||||||||||||
| Workflow & Insights | 155 | 48 | — | — | — | — | 203 | ||||||||||||||||
| Other | 12 | 9 | 5 | 2 | — | — | 28 | ||||||||||||||||
| Financial Technology: | |||||||||||||||||||||||
| Financial Crime Management Technology | 119 | 37 | 2 | — | — | — | 158 | ||||||||||||||||
| Regulatory Technology | 90 | 28 | — | — | — | — | 118 | ||||||||||||||||
| Capital Markets Technology | 111 | 26 | 3 | 1 | — | — | 141 | ||||||||||||||||
| Total | $ | 693 | $ | 182 | $ | 31 | $ | 12 | $ | 6 | $ | 5 | $ | 929 | |||||||||
| December 31, 2024 |
Payments,
Foreign
Currency
Translation
and
Accretion
|
June 30, 2025 | |||||||||||||||
| Short-term debt: | (in millions) |
||||||||||||||||
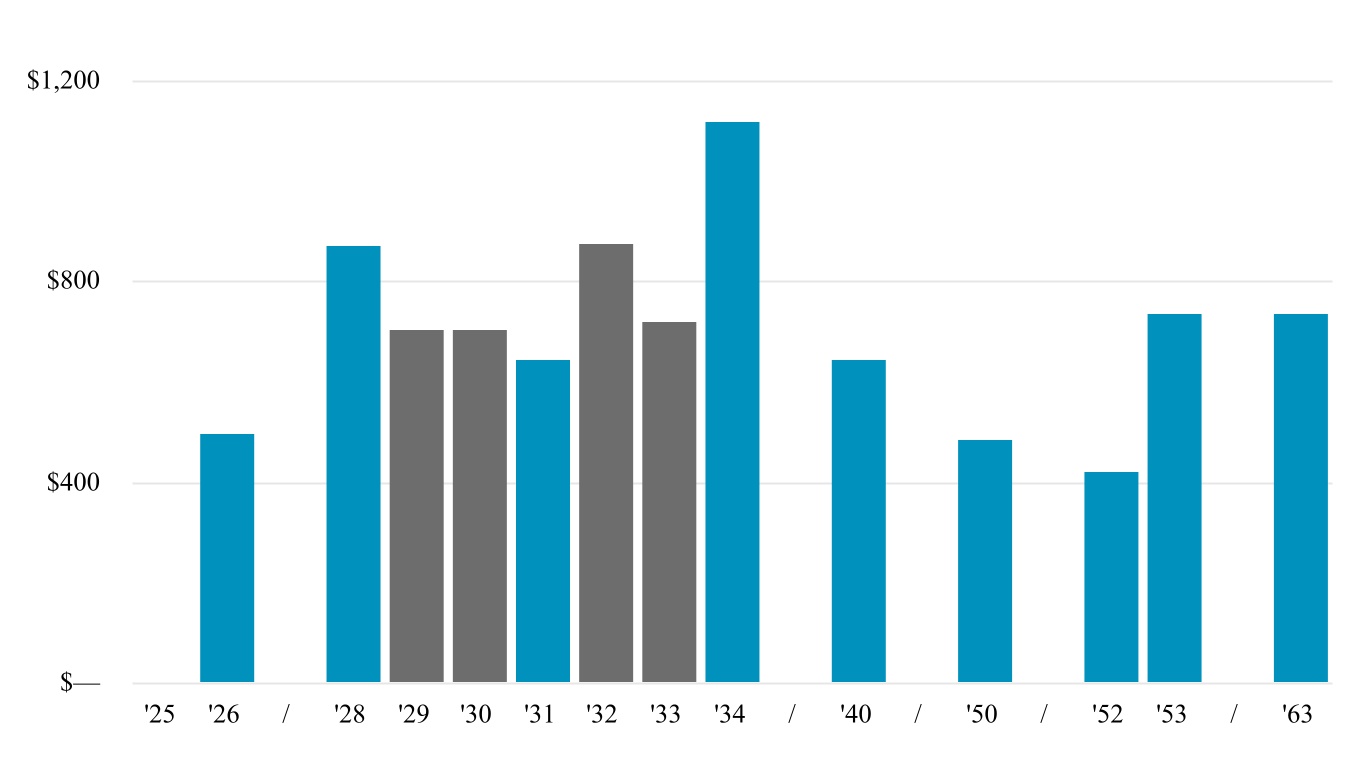
| 2025 Notes | $ | 399 | $ | (399) | $ | — | |||||||||||
2026 Notes |
499 | 1 | 500 | ||||||||||||||
| Total short-term debt | $ | 898 | $ | (398) | $ | 500 | |||||||||||
| Long-term debt - senior unsecured notes: | |||||||||||||||||
2028 Notes |
935 | (60) | 875 | ||||||||||||||
2029 Notes |
618 | 86 | 704 | ||||||||||||||
2030 Notes |
617 | 87 | 704 | ||||||||||||||
2031 Notes |
645 | 1 | 646 | ||||||||||||||
2032 Notes |
769 | 108 | 877 | ||||||||||||||
2033 Notes |
633 | 88 | 721 | ||||||||||||||
2034 Notes |
1,220 | (98) | 1,122 | ||||||||||||||
2040 Notes |
644 | 1 | 645 | ||||||||||||||
2050 Notes |
487 | 1 | 488 | ||||||||||||||
2052 Notes |
541 | (118) | 423 | ||||||||||||||
2053 Notes |
738 | — | 738 | ||||||||||||||
2063 Notes |
738 | — | 738 | ||||||||||||||
| 2022 Revolving Credit Facility | (3) | — | (3) | ||||||||||||||
| Total long-term debt | $ | 8,582 | $ | 96 | $ | 8,678 | |||||||||||
| Total debt obligations | $ | 9,480 | $ | (302) | $ | 9,178 | |||||||||||
| Three Months Ended June 30, | Six Months Ended June 30, | ||||||||||||||||||||||
| 2025 | 2024 | 2025 | 2024 | ||||||||||||||||||||
| (in millions) | |||||||||||||||||||||||
Savings Plan expense |
$ | 6 | $ | 5 | $ | 11 | $ | 10 | |||||||||||||||
| Three Months Ended June 30, | Six Months Ended June 30, | ||||||||||||||||||||||
| 2025 | 2024 | 2025 | 2024 | ||||||||||||||||||||
| (in millions) | |||||||||||||||||||||||
Retirement Plans expense |
$ | 10 | $ | 8 | $ | 17 | $ | 38 | |||||||||||||||
| Three Months Ended June 30, | Six Months Ended June 30, | ||||||||||||||||||||||
| 2025 | 2024 | 2025 | 2024 | ||||||||||||||||||||
| (in millions) | |||||||||||||||||||||||
| Share-based compensation expense before income taxes | $ | 46 | $ | 39 | $ | 81 | $ | 69 | |||||||||||||||
| Restricted Stock | |||||||||||
| Number of Awards | Weighted-Average Grant Date Fair Value | ||||||||||
Unvested at December 31, 2024 |
4,178,867 | 56.30 | |||||||||
| Granted | 1,560,530 | 74.08 | |||||||||
| Vested | (1,359,638) | 54.20 | |||||||||
| Forfeited | (101,046) | 59.30 | |||||||||
Unvested at June 30, 2025 |
4,278,713 | $ | 63.38 | ||||||||
| Grant date | April 1, 2025 | April 1, 2024 | |||||||||
| Weighted-average risk-free interest rate | 3.82 | % | 4.51 | % | |||||||
Expected volatility |
23.27 | % | 24.50 | % | |||||||
| Weighted-average grant date share price | $ | 76.04 | $ | 62.29 | |||||||
| Weighted-average fair value at grant date | $ | 92.43 | $ | 78.45 | |||||||
PSUs |
||||||||||||||
| Three-Year Program | ||||||||||||||
| Number of Awards | Weighted-Average Grant Date Fair Value | |||||||||||||
Unvested at December 31, 2024 |
2,174,151 | $ | 64.83 | |||||||||||
| Granted | 883,138 | 90.71 | ||||||||||||
| Vested | (620,515) | 62.89 | ||||||||||||
| Forfeited | (33,639) | 66.97 | ||||||||||||
Unvested at June 30, 2025 |
2,403,135 | $ | 74.81 | |||||||||||
Number of Stock Options |
Weighted-Average Exercise Price |
Weighted-
Average
Remaining
Contractual
Term (in
years)
|
Aggregate
Intrinsic
Value (in
millions)
|
|||||||||||
Outstanding at June 30, 2025 |
1,420,323 | $ | 41.79 | 3.7 | $ | 68 | ||||||||
Exercisable at June 30, 2025 |
806,451 | $ | 22.23 | 1.5 | $ | 54 | ||||||||
| Six Months Ended June 30, 2025 | |||||
| Number of shares of common stock repurchased | 2,789,445 | ||||
| Average price paid per share | $ | 77.07 | |||
Total purchase price (in millions) |
$ | 215 | |||
| Declaration Date | Dividend Per Common Share |
Record Date | Total Amount Paid | Payment Date | ||||||||||||||||||||||
| (in millions) | ||||||||||||||||||||||||||
| January 28, 2025 | $ | 0.24 | March 14, 2025 | $ | 138 | March 28, 2025 | ||||||||||||||||||||
| April 23, 2025 | 0.27 | June 13, 2025 | 155 | June 27, 2025 | ||||||||||||||||||||||
| $ | 293 | |||||||||||||||||||||||||
| Three Months Ended June 30, | |||||||||||
| 2025 | 2024 | ||||||||||
| Numerator: | (in millions, except share and per share amounts) | ||||||||||
| Net income attributable to common shareholders | $ | 452 | $ | 222 | |||||||
| Denominator: | |||||||||||
| Weighted-average common shares outstanding for basic earnings per share | 574,073,104 | 576,375,433 | |||||||||
| Weighted-average effect of dilutive securities: | |||||||||||
| Weighted-average effect of dilutive securities - Employee equity awards | 4,908,053 | 2,575,343 | |||||||||
| Weighted-average common shares outstanding for diluted earnings per share | 578,981,157 | 578,950,776 | |||||||||
| Basic and diluted earnings per share: | |||||||||||
| Basic earnings per share | $ | 0.79 | $ | 0.39 | |||||||
| Diluted earnings per share | $ | 0.78 | $ | 0.38 | |||||||
| Six Months Ended June 30, | |||||||||||
| 2025 | 2024 | ||||||||||
| Numerator: | (in millions, except share and per share amounts) | ||||||||||
| Net income attributable to common shareholders | $ | 847 | $ | 456 | |||||||
| Denominator: | |||||||||||
| Weighted-average common shares outstanding for basic earnings per share | 574,556,455 | 575,913,549 | |||||||||
| Weighted-average effect of dilutive securities - Employee equity awards | 4,922,867 | 3,027,384 | |||||||||
| Weighted-average common shares outstanding for diluted earnings per share | 579,479,322 | 578,940,933 | |||||||||
| Basic and diluted earnings per share: | |||||||||||
| Basic earnings per share | $ | 1.47 | $ | 0.79 | |||||||
| Diluted earnings per share | $ | 1.46 | $ | 0.79 | |||||||
| June 30, 2025 | |||||||||||||||||||||||
Total |
Level 1 |
Level 2 |
Level 3 |
||||||||||||||||||||
(in millions) |
|||||||||||||||||||||||
European government debt securities |
$ | 82 | $ | 82 | $ | — | $ | — | |||||||||||||||
| Time deposits | 2 | 2 | — | — | |||||||||||||||||||
| Total assets at fair value | $ | 84 | $ | 84 | $ | — | $ | — | |||||||||||||||
| December 31, 2024 | |||||||||||||||||||||||
Total |
Level 1 |
Level 2 |
Level 3 |
||||||||||||||||||||
(in millions) |
|||||||||||||||||||||||
European government debt securities |
$ | 166 | $ | 166 | $ | — | $ | — | |||||||||||||||
Swedish mortgage bonds |
13 | — | 13 | — | |||||||||||||||||||
| Time deposits | 5 | — | 5 | — | |||||||||||||||||||
| Total assets at fair value | $ | 184 | $ | 166 | $ | 18 | $ | — | |||||||||||||||
| June 30, 2025 | |||||||||||||||||
| Cash Contributions | Non-Cash Contributions | Total Contributions | |||||||||||||||
| (in millions) | |||||||||||||||||
| Default fund contributions | $ | 1,198 | $ | 149 | $ | 1,347 | |||||||||||
| Margin deposits | 4,020 | 6,771 | 10,791 | ||||||||||||||
| Total | $ | 5,218 | $ | 6,920 | $ | 12,138 | |||||||||||
| June 30, 2025 | December 31, 2024 | ||||||||||
| (in millions) | |||||||||||
| Demand deposits | $ | 2,576 | $ | 3,616 | |||||||
| Central bank certificates | 698 | 767 | |||||||||
| Restricted cash and cash equivalents | $ | 3,274 | $ | 4,383 | |||||||
| European government debt securities | 320 | 465 | |||||||||
| Reverse repurchase agreements | 1,394 | 610 | |||||||||
| Multilateral development bank debt securities | 230 | 206 | |||||||||
| Investments | $ | 1,944 | $ | 1,281 | |||||||
| Total | $ | 5,218 | $ | 5,664 | |||||||
| June 30, 2025 | |||||
| (in millions) | |||||
Commodity forwards |
$ | 14 | |||
Fixed-income swaps and forwards |
1,140 | ||||
Stock options and forwards |
352 | ||||
Index options and forwards |
57 | ||||
| Total | $ | 1,563 | |||
| Six Months Ended June 30, | |||||||||||
2025 |
2024 |
||||||||||
| Commodity and seafood options, futures and forwards | 137,217 | 114,432 | |||||||||
Fixed-income swaps, futures and forwards |
8,657,081 | 9,699,691 | |||||||||
Stock options, futures and forwards |
11,785,557 | 11,827,220 | |||||||||
Index options, futures and forwards |
17,290,381 | 18,480,430 | |||||||||
| Total | 37,870,236 | 40,121,773 | |||||||||
| Balance Sheet Classification | June 30, 2025 | December 31, 2024 | ||||||||||||||||||
| Assets: | (in millions) | |||||||||||||||||||
| Operating lease assets | Operating lease assets | $ | 441 | $ | 375 | |||||||||||||||
| Liabilities: | ||||||||||||||||||||
| Current lease liabilities | Other current liabilities | $ | 57 | $ | 55 | |||||||||||||||
| Non-current lease liabilities | Operating lease liabilities | 453 | 388 | |||||||||||||||||
| Total lease liabilities | $ | 510 | $ | 443 | ||||||||||||||||
| Three Months Ended June 30, | Six Months Ended June 30, | ||||||||||||||||||||||
| 2025 | 2024 | 2025 | 2024 | ||||||||||||||||||||
| (in millions) | |||||||||||||||||||||||
| Operating lease cost | $ | 21 | $ | 19 | $ | 39 | $ | 40 | |||||||||||||||
| Variable lease cost | 10 | 9 | 20 | 18 | |||||||||||||||||||
| Sublease income | (1) | (1) | (1) | (2) | |||||||||||||||||||
| Total lease cost | $ | 30 | $ | 27 | $ | 58 | $ | 56 | |||||||||||||||
| June 30, 2025 | ||||||||
| (in millions) | ||||||||
Remainder of 2025 |
$ | 36 | ||||||
| 2026 | 78 | |||||||
| 2027 | 73 | |||||||
| 2028 | 70 | |||||||
2029 |
67 | |||||||
2030+ |
287 | |||||||
| Total lease payments | $ | 611 | ||||||
| Less: interest | (101) | |||||||
| Present value of lease liabilities | $ | 510 | ||||||
| June 30, 2025 | ||||||||
| Weighted-average remaining lease term (in years) | 8.7 | |||||||
| Weighted-average discount rate | 4.2 | % | ||||||
| Six Months Ended June 30, | |||||||||||
2025 |
2024 | ||||||||||
| (in millions) | |||||||||||
| Cash paid for amounts included in the measurement of operating lease liabilities | $ | 39 | $ | 42 | |||||||
| Lease assets obtained in exchange for operating lease liabilities | $ | 91 | $ | 22 | |||||||
| Three Months Ended June 30, | |||||||||||
| 2025 | 2024 | ||||||||||
| (in millions) | |||||||||||
| Income tax provision | $ | 96 | $ | 119 | |||||||
| Effective tax rate | 17.5 | % | 34.9 | % | |||||||
| Six Months Ended June 30, | |||||||||||
| 2025 | 2024 | ||||||||||
| (in millions) | |||||||||||
| Income tax provision | $ | 190 | $ | 198 | |||||||
| Effective tax rate | 18.3 | % | 30.3 | % | |||||||
| Three Months Ended June 30, | |||||||||||
2025 |
2024 |
||||||||||
| (in millions) | |||||||||||
Capital Access Platforms: |
|||||||||||
| Total revenues | $ | 527 | $ | 481 | |||||||
| Direct and directly consumed expenses | 180 | 169 | |||||||||
| Other expenses | 41 | 41 | |||||||||
| Operating income | $ | 306 | $ | 271 | |||||||
| Depreciation and amortization | 12 | 11 | |||||||||
| Purchase of property and equipment | 15 | 12 | |||||||||
Financial Technology: |
|||||||||||
| Total revenues | $ | 464 | $ | 420 | |||||||
| Direct and directly consumed expenses | 220 | 199 | |||||||||
| Other expenses | 27 | 22 | |||||||||
| Operating income | $ | 217 | $ | 199 | |||||||
| Depreciation and amortization | 13 | 10 | |||||||||
| Purchase of property and equipment | 29 | 24 | |||||||||
Market Services: |
|||||||||||
| Total revenues | $ | 1,090 | $ | 883 | |||||||
| Transaction-based expenses | (784) | (633) | |||||||||
| Revenues less transaction-based expenses | 306 | 250 | |||||||||
| Direct and directly consumed expenses | 92 | 83 | |||||||||
| Other expenses | 20 | 21 | |||||||||
| Operating income | $ | 194 | $ | 146 | |||||||
| Depreciation and amortization | 11 | 10 | |||||||||
| Purchase of property and equipment | 15 | 16 | |||||||||
Corporate Items: |
|||||||||||
| Total revenues | $ | 9 | $ | 8 | |||||||
| Other expenses | 158 | 201 | |||||||||
| Operating loss | (149) | $ | (193) | ||||||||
Amortization of acquired intangible assets |
122 | 122 | |||||||||
Consolidated: |
|||||||||||
| Total revenues | $ | 2,090 | $ | 1,792 | |||||||
| Transaction-based expenses | (784) | (633) | |||||||||
| Revenues less transaction-based expenses | $ | 1,306 | $ | 1,159 | |||||||
| Direct and directly consumed expenses | 492 | 451 | |||||||||
| Other expenses | 246 | 285 | |||||||||
| Operating income | $ | 568 | $ | 423 | |||||||
| Depreciation and amortization | 158 | 153 | |||||||||
| Purchase of property and equipment | 59 | 52 | |||||||||
| Six Months Ended June 30, | |||||||||||
| 2025 | 2024 | ||||||||||
| (in millions) | |||||||||||
| Capital Access Platforms | |||||||||||
| Total revenues | $ | 1,042 | $ | 960 | |||||||
Direct and directly consumed expenses |
348 | 325 | |||||||||
Other expenses |
81 | 84 | |||||||||
| Operating income | $ | 613 | $ | 551 | |||||||
Depreciation and amortization |
23 | 21 | |||||||||
| Purchase of property and equipment | 28 | 21 | |||||||||
| Financial Technology | |||||||||||
| Total revenues | $ | 896 | $ | 813 | |||||||
| Direct and directly consumed expenses | 426 | 392 | |||||||||
Other expenses |
56 | 46 | |||||||||
| Operating income | $ | 414 | $ | 375 | |||||||
Depreciation and amortization |
25 | 22 | |||||||||
| Purchase of property and equipment | 51 | 45 | |||||||||
| Market Services | |||||||||||
| Total revenues | $ | 2,224 | $ | 1,678 | |||||||
Transaction-based expenses |
(1,637) | (1,192) | |||||||||
| Revenues less transaction-based expenses | $ | 587 | $ | 486 | |||||||
| Direct and directly consumed expenses | 180 | 166 | |||||||||
Other expenses |
40 | 43 | |||||||||
| Operating income | $ | 367 | $ | 277 | |||||||
Depreciation and amortization |
22 | 21 | |||||||||
Purchase of property and equipment |
29 | 25 | |||||||||
| Corporate | |||||||||||
| Total revenues | $ | 18 | $ | 18 | |||||||
Other expenses |
297 | 388 | |||||||||
| Operating loss | $ | (279) | $ | (370) | |||||||
Amortization of acquired intangible assets |
243 | 244 | |||||||||
| Consolidated | |||||||||||
| Total revenues | $ | 4,180 | $ | 3,469 | |||||||
| Transaction-based expenses | (1,637) | (1,192) | |||||||||
| Revenues less transaction-based expenses | $ | 2,543 | $ | 2,277 | |||||||
| Direct and directly consumed expenses | 954 | 883 | |||||||||
Other expenses |
474 | 561 | |||||||||
| Operating income | $ | 1,115 | $ | 833 | |||||||
| Depreciation and amortization | 313 | 308 | |||||||||
| Purchase of property and equipment | 108 | 91 | |||||||||
| Three Months Ended June 30, | |||||||||||
| 2025 | 2024 | ||||||||||
| (in millions) | |||||||||||
| Revenues: | |||||||||||
Divestiture |
$ | 9 | $ | 8 | |||||||
| Expenses: | |||||||||||
| Amortization expense of acquired intangible assets | 122 | 122 | |||||||||
| Merger and strategic initiatives expense | 20 | 4 | |||||||||
| Restructuring charges | 9 | 56 | |||||||||
| Legal and regulatory matters | 1 | 13 | |||||||||
Expenses - divestiture |
5 | 4 | |||||||||
| Other | 1 | 2 | |||||||||
| Total expenses | $ | 158 | $ | 201 | |||||||
| Operating loss | $ | (149) | $ | (193) | |||||||
| Six Months Ended June 30, | |||||||||||
| 2025 | 2024 | ||||||||||
| (in millions) | |||||||||||
| Revenues: | |||||||||||
Divestiture |
$ | 18 | $ | 18 | |||||||
| Expenses: | |||||||||||
| Amortization expense of acquired intangible assets | 243 | 244 | |||||||||
| Merger and strategic initiatives expense | 44 | 13 | |||||||||
| Restructuring charges | 15 | 82 | |||||||||
| Legal and regulatory matters | 4 | 16 | |||||||||
Gain on extinguishment of debt |
(19) | — | |||||||||
Pension settlement charge |
— | 23 | |||||||||
Expenses - divestiture |
9 | 8 | |||||||||
| Other | 1 | 2 | |||||||||
| Total expenses | $ | 297 | $ | 388 | |||||||
| Operating loss | $ | (279) | $ | (370) | |||||||
| Three Months Ended June 30, | |||||||||||
| 2025 | 2024 | ||||||||||
| (in millions) | |||||||||||
| United States | $ | 1,688 | $ | 1,421 | |||||||
All other countries |
402 | 371 | |||||||||
| Total | $ | 2,090 | $ | 1,792 | |||||||
| Six Months Ended June 30, | |||||||||||
2025 |
2024 |
||||||||||
| (in millions) | |||||||||||
| United States | $ | 3,385 | $ | 2,725 | |||||||
| All other countries | 795 | 744 | |||||||||
| Total | $ | 4,180 | $ | 3,469 | |||||||
(in millions) |
June 30, 2025 | December 31, 2024 | |||||||||
| United States | $ | 442 | $ | 425 | |||||||
| All other countries | 214 | 168 | |||||||||
| Total | $ | 656 | $ | 593 | |||||||
| Three Months Ended June 30, | Six Months Ended June 30, | ||||||||||||||||||||||
2025 |
2024 |
2025 |
2024 |
||||||||||||||||||||
| (in millions) | |||||||||||||||||||||||
| Asset impairment charges | |||||||||||||||||||||||
| Adenza restructuring | $ | — | $ | 24 | $ | — | $ | 24 | |||||||||||||||
| Divisional realignment | — | 4 | — | 4 | |||||||||||||||||||
| Consulting services | |||||||||||||||||||||||
| Adenza restructuring | 1 | 3 | 2 | 3 | |||||||||||||||||||
| Divisional realignment | — | 11 | — | 21 | |||||||||||||||||||
| Employee-related costs | |||||||||||||||||||||||
| Adenza restructuring | 7 | 8 | 11 | 12 | |||||||||||||||||||
| Divisional realignment | — | 3 | — | 6 | |||||||||||||||||||
| Other | |||||||||||||||||||||||
| Adenza restructuring | 1 | 2 | 1 | 5 | |||||||||||||||||||
| Divisional realignment | — | 1 | — | 7 | |||||||||||||||||||
| Total restructuring charges | $ | 9 | $ | 56 | $ | 14 | $ | 82 | |||||||||||||||
| Total Program Costs Incurred | |||||||||||||||||||||||
| Adenza restructuring | $ | 86 | |||||||||||||||||||||
Divisional realignment* |
$ | 139 | |||||||||||||||||||||
| Three Months Ended June 30, | Percentage Change | ||||||||||||||||
| 2025 | 2024 | ||||||||||||||||
| (in millions, except per share amounts) | |||||||||||||||||
| Revenues less transaction-based expenses | $ | 1,306 | $ | 1,159 | 12.7 | % | |||||||||||
| Operating expenses | 738 | 736 | 0.3 | % | |||||||||||||
| Operating income | $ | 568 | $ | 423 | 34.2 | % | |||||||||||
| Net income attributable to Nasdaq | $ | 452 | $ | 222 | 103.0 | % | |||||||||||
| Diluted earnings per share | $ | 0.78 | $ | 0.38 | 103.0 | % | |||||||||||
| Cash dividends declared per common share | $ | 0.27 | $ | 0.24 | 12.5 | % | |||||||||||
| Six Months Ended June 30, | Percentage Change | ||||||||||||||||
| 2025 | 2024 | ||||||||||||||||
| (in millions, except per share amounts) | |||||||||||||||||
| Revenues less transaction-based expenses | $ | 2,543 | $ | 2,277 | 11.7 | % | |||||||||||
| Operating expenses | 1,428 | 1,444 | (1.1) | % | |||||||||||||
| Operating income | $ | 1,115 | $ | 833 | 33.8 | % | |||||||||||
| Net income attributable to Nasdaq | $ | 847 | $ | 456 | 85.5 | % | |||||||||||
| Diluted earnings per share | $ | 1.46 | $ | 0.79 | 85.4 | % | |||||||||||
| Cash dividends declared per common share | $ | 0.51 | $ | 0.46 | 10.9 | % | |||||||||||
▪ |
Capital Access Platforms |
|||||||
◦ |
Proprietary market data subscriptions and annual listing fees within our Data & Listing Services business |
|||||||
◦ |
Index data subscriptions and guaranteed minimum on futures contracts within our Index business |
|||||||
◦ |
Subscription contracts under our Workflow & Insights business |
|||||||
▪ |
Financial Technology |
|||||||
◦ |
Financial Crime Management Technology SaaS subscription contracts excluding one-time service requests |
|||||||
◦ |
Regulatory Technology SaaS and subscription and support contracts excluding one-time service requests |
|||||||
◦ |
Capital Markets Technology SaaS and subscription and support contracts excluding one-time service requests |
|||||||
| Three Months Ended June 30, | Percentage Change | ||||||||||||||||
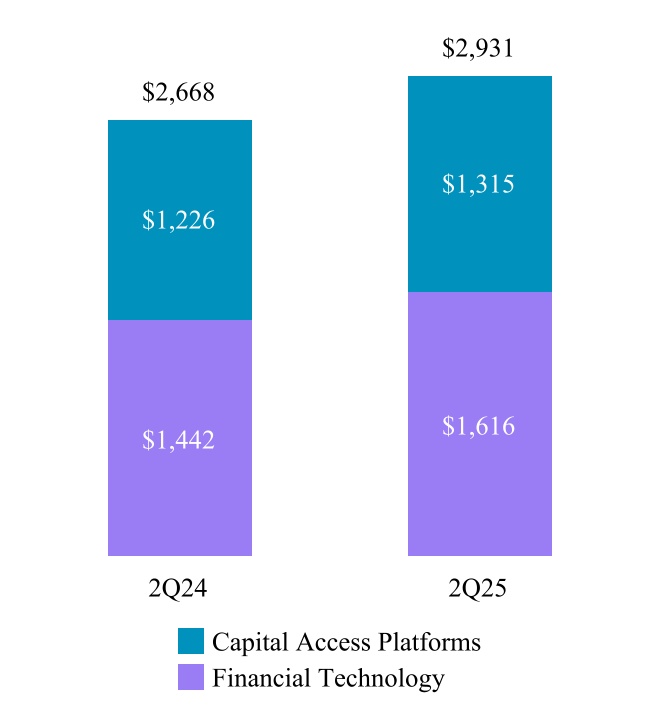
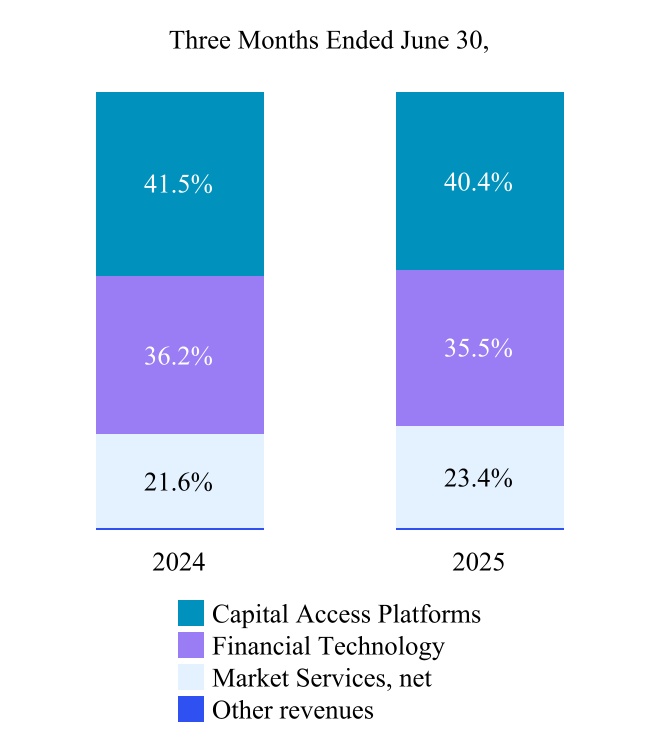
| 2025 | 2024 | ||||||||||||||||
| (in millions) | |||||||||||||||||
| Capital Access Platforms | $ | 527 | $ | 481 | 9.8 | % | |||||||||||
| Financial Technology | 464 | 420 | 10.3 | % | |||||||||||||
| Market Services | 1,090 | 883 | 23.3 | % | |||||||||||||
| Other revenues | 9 | 8 | 4.7 | % | |||||||||||||
| Total revenues | $ | 2,090 | $ | 1,792 | 16.5 | % | |||||||||||
| Transaction rebates | (629) | (483) | 30.2 | % | |||||||||||||
| Brokerage, clearance and exchange fees | (155) | (150) | 3.0 | % | |||||||||||||
| Total revenues less transaction-based expenses | $ | 1,306 | $ | 1,159 | 12.7 | % | |||||||||||
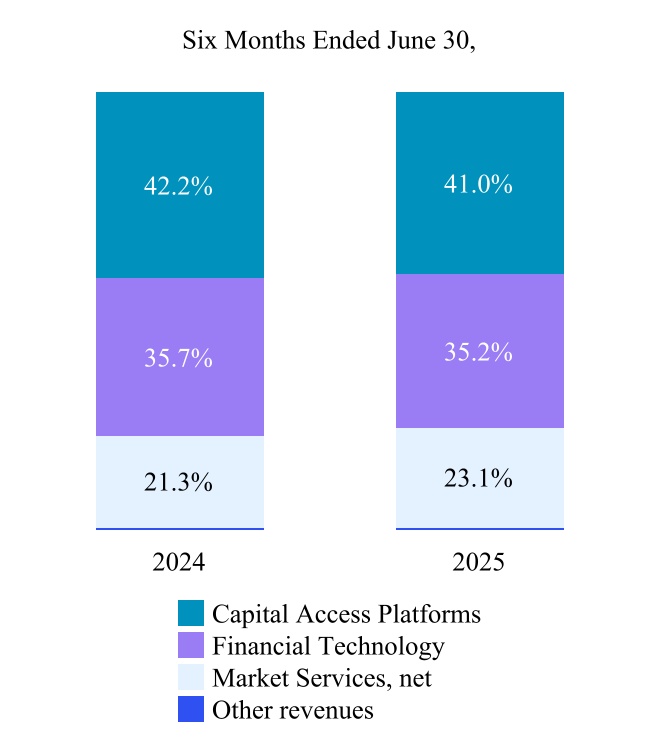
| Six Months Ended June 30, | Percentage Change | ||||||||||||||||
| 2025 | 2024 | ||||||||||||||||
| (in millions) | |||||||||||||||||
| Capital Access Platforms | $ | 1,042 | $ | 960 | 8.6 | % | |||||||||||
| Financial Technology | 896 | 813 | 10.3 | % | |||||||||||||
| Market Services | 2,224 | 1,678 | 32.5 | % | |||||||||||||
| Other revenues | 18 | 18 | (0.7) | % | |||||||||||||
| Total revenues | $ | 4,180 | $ | 3,469 | 20.5 | % | |||||||||||
| Transaction rebates | (1,208) | (965) | 25.2 | % | |||||||||||||
| Brokerage, clearance and exchange fees | (429) | (227) | 89.3 | % | |||||||||||||
| Total revenues less transaction-based expenses | $ | 2,543 | $ | 2,277 | 11.7 | % | |||||||||||
| Three Months Ended June 30, | Percentage Change | ||||||||||||||||
| 2025 | 2024 | ||||||||||||||||
| (in millions) | |||||||||||||||||
| Data & Listing Services | $ | 198 | $ | 187 | 6.3 | % | |||||||||||
| Index | 196 | 167 | 17.2 | % | |||||||||||||
| Workflow & Insights | 133 | 127 | 5.2 | % | |||||||||||||
| Total Capital Access Platforms | $ | 527 | $ | 481 | 9.8 | % | |||||||||||
| Six Months Ended June 30, | Percentage Change | ||||||||||||||||
| 2025 | 2024 | ||||||||||||||||
| (in millions) | |||||||||||||||||
| Data & Listing Services | $ | 391 | $ | 372 | 4.9 | % | |||||||||||
| Index | 388 | 336 | 15.7 | % | |||||||||||||
| Workflow & Insights | 263 | 252 | 4.5 | % | |||||||||||||
| Total Capital Access Platforms | $ | 1,042 | $ | 960 | 8.6 | % | |||||||||||
As of June 30, |
||||||||||||||
| 2025 | 2024 | |||||||||||||
| ARR (in millions) | $ | 1,315 | $ | 1,226 | ||||||||||
| Three Months Ended June 30, | ||||||||||||||
| 2025 | 2024 | |||||||||||||
| IPOs | ||||||||||||||
| The Nasdaq Stock Market | 79 | 39 | ||||||||||||
| The Nasdaq Stock Market - SPACs | 41 | 8 | ||||||||||||
| Exchanges that comprise Nasdaq Nordic and Nasdaq Baltic | 6 | 5 | ||||||||||||
| Total new listings | ||||||||||||||
| The Nasdaq Stock Market | 194 | 84 | ||||||||||||
| Exchanges that comprise Nasdaq Nordic and Nasdaq Baltic | 6 | 10 | ||||||||||||
| Six Months Ended June 30, | ||||||||||||||
| 2025 | 2024 | |||||||||||||
| IPOs | ||||||||||||||
| The Nasdaq Stock Market | 142 | 66 | ||||||||||||
| The Nasdaq Stock Market - SPACs | 59 | 13 | ||||||||||||
| Exchanges that comprise Nasdaq Nordic and Nasdaq Baltic | 10 | 6 | ||||||||||||
| Total new listings | ||||||||||||||
| The Nasdaq Stock Market | 364 | 163 | ||||||||||||
| Exchanges that comprise Nasdaq Nordic and Nasdaq Baltic | 15 | 12 | ||||||||||||
As of June 30, |
||||||||||||||
| 2025 | 2024 | |||||||||||||
| Number of listed companies | ||||||||||||||
| The Nasdaq Stock Market | 4,238 | 4,004 | ||||||||||||
| Exchanges that comprise Nasdaq Nordic and Nasdaq Baltic | 1,148 | 1,198 | ||||||||||||
| ARR (in millions) | 726 | 668 | ||||||||||||
|
As of or
Three Months Ended June 30,
|
||||||||||||||
| 2025 | 2024 | |||||||||||||
| Number of licensed ETPs | 422 | 373 | ||||||||||||
| TTM change in period end ETP AUM tracking Nasdaq indices (in billions) | ||||||||||||||
| Beginning balance | $ | 569 | $ | 418 | ||||||||||
Net appreciation (depreciation) |
88 | 115 | ||||||||||||
| Net impact of ETP sponsor switches | — | (17) | ||||||||||||
| Net inflows | 88 | 53 | ||||||||||||
| Ending balance | $ | 745 | $ | 569 | ||||||||||
Quarterly average ETP AUM tracking Nasdaq indices (in billions) |
$ | 663 | $ | 531 | ||||||||||
| ARR (in millions) | $ | 80 | $ | 74 | ||||||||||
|
As of or
Three Months Ended June 30,
|
|||||||||||
| 2025 | 2024 | ||||||||||
| (in millions) | |||||||||||
| ARR | $ | 509 | $ | 484 | |||||||
| Quarterly annualized SaaS revenues | 439 | 414 | |||||||||
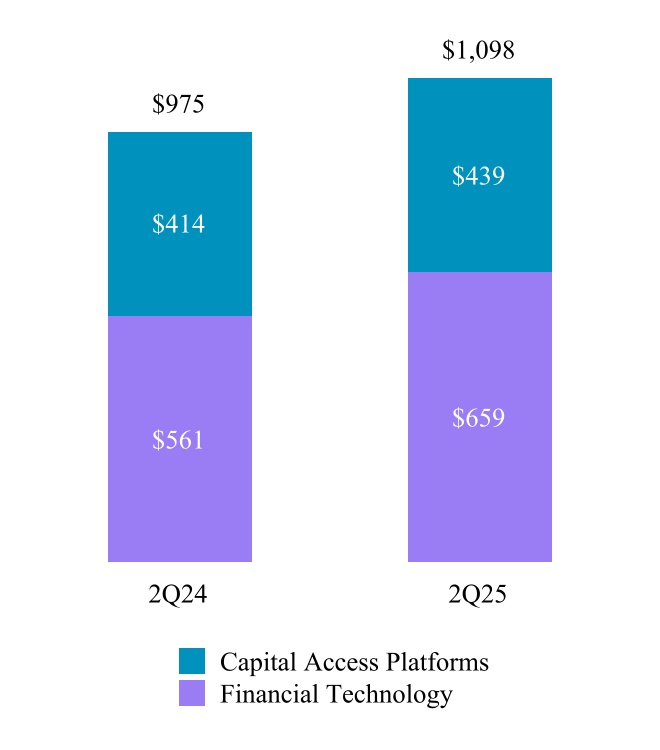
| Three Months Ended June 30, | Percentage Change | ||||||||||||||||
| 2025 | 2024 | ||||||||||||||||
| (in millions) | |||||||||||||||||
Financial Crime Management Technology |
$ | 81 | $ | 67 | 19.7 | % | |||||||||||
Regulatory Technology |
104 | 95 | 9.6 | % | |||||||||||||
Capital Markets Technology |
279 | 258 | 8.1 | % | |||||||||||||
| Total Financial Technology | $ | 464 | $ | 420 | 10.3 | % | |||||||||||
| Six Months Ended June 30, | Percentage Change | ||||||||||||||||
| 2025 | 2024 | ||||||||||||||||
| (in millions) | |||||||||||||||||
Financial Crime Management Technology |
$ | 157 | $ | 131 | 20.1 | % | |||||||||||
Regulatory Technology |
206 | 186 | 10.7 | % | |||||||||||||
Capital Markets Technology |
533 | 496 | 7.6 | % | |||||||||||||
| Total Financial Technology | $ | 896 | $ | 813 | 10.3 | % | |||||||||||
|
As of or
Three Months Ended June 30,
|
||||||||||||||
| 2025 | 2024 | |||||||||||||
| (in millions) | ||||||||||||||
| ARR and Quarterly annualized SaaS revenues | $ | 308 | $ | 258 | ||||||||||
|
As of or
Three Months Ended June 30,
|
||||||||||||||
| 2025 | 2024 | |||||||||||||
| (in millions) | ||||||||||||||
| ARR | $ | 376 | $ | 338 | ||||||||||
| Quarterly annualized SaaS revenues | 204 | 180 | ||||||||||||
|
As of or
Three Months Ended June 30,
|
||||||||||||||
| 2025 | 2024 | |||||||||||||
| (in millions) | ||||||||||||||
| ARR | $ | 932 | $ | 846 | ||||||||||
| Quarterly annualized SaaS revenues | 147 | 123 | ||||||||||||
| Three Months Ended June 30, | Percentage Change | ||||||||||||||||
| 2025 | 2024 | ||||||||||||||||
| (in millions) | |||||||||||||||||
| Market Services | $ | 1,090 | $ | 883 | 23.3 | % | |||||||||||
| Transaction-based expenses: | |||||||||||||||||
| Transaction rebates | (629) | (483) | 30.2 | % | |||||||||||||
Brokerage, clearance and exchange fees |
(155) | (150) | 3.0 | % | |||||||||||||
| Total Market Services, net | $ | 306 | $ | 250 | 22.4 | % | |||||||||||
| Six Months Ended June 30, | Percentage Change | ||||||||||||||||
| 2025 | 2024 | ||||||||||||||||
| (in millions) | |||||||||||||||||
| Market Services | $ | 2,224 | $ | 1,678 | 32.5 | % | |||||||||||
| Transaction-based expenses: | |||||||||||||||||
| Transaction rebates | (1,208) | (965) | 25.2 | % | |||||||||||||
Brokerage, clearance and exchange fees |
(429) | (227) | 89.3 | % | |||||||||||||
| Total Market Services, net | $ | 587 | $ | 486 | 20.6 | % | |||||||||||
| Three Months Ended June 30, | Percentage Change | ||||||||||||||||
| 2025 | 2024 | ||||||||||||||||
| (in millions) | |||||||||||||||||
| U.S. Equity Derivative Trading | $ | 114 | $ | 90 | 26.6 | % | |||||||||||
| Cash Equity Trading | 135 | 112 | 21.3 | % | |||||||||||||
| U.S. Tape plans | 37 | 31 | 18.6 | % | |||||||||||||
| Other | 20 | 17 | 14.4 | % | |||||||||||||
| Total Market Services, net | $ | 306 | $ | 250 | 22.4 | % | |||||||||||
| Six Months Ended June 30, | Percentage Change | ||||||||||||||||
| 2025 | 2024 | ||||||||||||||||
| (in millions) | |||||||||||||||||
| U.S. Equity Derivative Trading | $ | 222 | $ | 181 | 22.3 | % | |||||||||||
| Cash Equity Trading | 255 | 212 | 20.7 | % | |||||||||||||
| U.S. Tape plans | 70 | 59 | 18.2 | % | |||||||||||||
| Other | 40 | 34 | 14.5 | % | |||||||||||||
| Total Market Services, net | $ | 587 | $ | 486 | 20.6 | % | |||||||||||
| Three Months Ended June 30, | Percentage Change | ||||||||||||||||
| 2025 | 2024 | ||||||||||||||||
| (in millions) | |||||||||||||||||
| U.S. Equity Derivative Trading Revenues | $ | 415 | $ | 334 | 24.4 | % | |||||||||||
Section 31 fees |
15 | 19 | (22.0) | % | |||||||||||||
| Transaction-based expenses: | |||||||||||||||||
| Transaction rebates | (300) | (243) | 23.6 | % | |||||||||||||
Section 31 fees |
(15) | (19) | (22.0) | % | |||||||||||||
| Brokerage and clearance fees | (1) | (1) | 16.7 | % | |||||||||||||
U.S. Equity Derivative Trading Revenues, net |
$ | 114 | $ | 90 | 26.6 | % | |||||||||||
| Six Months Ended June 30, | Percentage Change | ||||||||||||||||
| 2025 | 2024 | ||||||||||||||||
| (in millions) | |||||||||||||||||
| U.S. Equity Derivative Trading Revenues | $ | 817 | $ | 657 | 24.4 | % | |||||||||||
Section 31 fees |
47 | 30 | 55.0 | % | |||||||||||||
| Transaction-based expenses: | |||||||||||||||||
| Transaction rebates | (593) | (474) | 25.1 | % | |||||||||||||
Section 31 fees |
(47) | (30) | 55.0 | % | |||||||||||||
| Brokerage and clearance fees | (2) | (2) | 49.9 | % | |||||||||||||
U.S. Equity Derivative Trading Revenues, net |
$ | 222 | $ | 181 | 22.3 | % | |||||||||||
| Three Months Ended June 30, | |||||||||||
| 2025 | 2024 | ||||||||||
| Total industry average daily volume (in millions) | 52.5 | 42.1 | |||||||||
| Nasdaq PHLX matched market share | 9.6 | % | 9.9 | % | |||||||
| The Nasdaq Options Market matched market share | 4.3 | % | 5.5 | % | |||||||
| Nasdaq BX Options matched market share | 1.7 | % | 2.3 | % | |||||||
| Nasdaq ISE Options matched market share | 6.6 | % | 6.9 | % | |||||||
| Nasdaq GEMX Options matched market share | 4.4 | % | 2.6 | % | |||||||
| Nasdaq MRX Options matched market share | 2.8 | % | 2.1 | % | |||||||
| Total matched market share executed on Nasdaq’s exchanges | 29.4 | % | 29.3 | % | |||||||
| Six Months Ended June 30, | |||||||||||
| 2025 | 2024 | ||||||||||
| U.S. equity options | |||||||||||
| Total industry average daily volume (in millions) | 53.0 | 42.7 | |||||||||
| Nasdaq PHLX matched market share | 9.4 | % | 10.1 | % | |||||||
| The Nasdaq Options Market matched market share | 4.7 | % | 5.4 | % | |||||||
| Nasdaq BX Options matched market share | 1.7 | % | 2.3 | % | |||||||
| Nasdaq ISE Options matched market share | 6.7 | % | 6.6 | % | |||||||
| Nasdaq GEMX Options matched market share | 4.0 | % | 2.6 | % | |||||||
| Nasdaq MRX Options matched market share | 2.8 | % | 2.3 | % | |||||||
| Total matched market share executed on Nasdaq’s exchanges | 29.3 | % | 29.3 | % | |||||||
| Three Months Ended June 30, | Percentage Change | ||||||||||||||||
| 2025 | 2024 | ||||||||||||||||
| (in millions) | |||||||||||||||||
| Cash Equity Trading Revenues | $ | 463 | $ | 353 | 31.5 | % | |||||||||||
Section 31 fees |
133 | 124 | 6.7 | % | |||||||||||||
| Transaction-based expenses: | |||||||||||||||||
| Transaction rebates | (322) | (235) | 37.0 | % | |||||||||||||
Section 31 fees |
(133) | (124) | 6.7 | % | |||||||||||||
| Brokerage and clearance fees | (6) | (6) | (8.9) | % | |||||||||||||
| Cash equity trading revenues, net | $ | 135 | $ | 112 | 21.3 | % | |||||||||||
| Six Months Ended June 30, | Percentage Change | ||||||||||||||||
| 2025 | 2024 | ||||||||||||||||
| (in millions) | |||||||||||||||||
| Cash Equity Trading Revenues | $ | 870 | $ | 703 | 23.9 | % | |||||||||||
Section 31 fees |
367 | 184 | 99.4 | % | |||||||||||||
| Transaction-based expenses: | |||||||||||||||||
| Transaction rebates | (602) | (480) | 25.4 | % | |||||||||||||
Section 31 fees |
(367) | (184) | 99.4 | % | |||||||||||||
| Brokerage and clearance fees | (13) | (11) | 11.6 | % | |||||||||||||
| Cash equity trading revenues, net | $ | 255 | $ | 212 | 20.7 | % | |||||||||||
| Three Months Ended June 30, | |||||||||||
| 2025 | 2024 | ||||||||||
| Total U.S.-listed securities | |||||||||||
| Total industry average daily share volume (in billions) | 18.4 | 11.8 | |||||||||
| Matched share volume (in billions) | 158.4 | 119.3 | |||||||||
| The Nasdaq Stock Market matched market share | 13.5 | % | 15.6 | % | |||||||
| Nasdaq BX matched market share | 0.3 | % | 0.3 | % | |||||||
| Nasdaq PSX matched market share | 0.1 | % | 0.2 | % | |||||||
| Total matched market share executed on Nasdaq’s exchanges | 13.9 | % | 16.1 | % | |||||||
| Market share reported to the FINRA/Nasdaq Trade Reporting Facility | 47.7 | % | 42.9 | % | |||||||
| Total market share | 61.6 | % | 59.0 | % | |||||||
| Nasdaq Nordic and Nasdaq Baltic securities | |||||||||||
| Average daily number of equity trades executed on Nasdaq’s exchanges | 804,121 | 663,897 | |||||||||
| Total average daily value of shares traded (in billions) | $ | 5.7 | $ | 4.7 | |||||||
| Total market share executed on Nasdaq’s exchanges | 71.9 | % | 74.1 | % | |||||||
| Six Months Ended June 30, | |||||||||||
| 2025 | 2024 | ||||||||||
| Total U.S.-listed securities | |||||||||||
| Total industry average daily share volume (in billions) | 17.1 | 11.8 | |||||||||
| Matched share volume (in billions) | 295.5 | 236.0 | |||||||||
| The Nasdaq Stock Market matched market share | 13.8 | % | 15.7 | % | |||||||
| Nasdaq BX matched market share | 0.3 | % | 0.3 | % | |||||||
| Nasdaq PSX matched market share | 0.1 | % | 0.2 | % | |||||||
| Total matched market share executed on Nasdaq’s exchanges | 14.2 | % | 16.2 | % | |||||||
| Market share reported to the FINRA/Nasdaq Trade Reporting Facility | 47.9 | % | 42.2 | % | |||||||
| Total market share | 62.1 | % | 58.4 | % | |||||||
| Nasdaq Nordic and Nasdaq Baltic securities | |||||||||||
| Average daily number of equity trades executed on Nasdaq’s exchanges | 796,426 | 665,183 | |||||||||
| Total average daily value of shares traded (in billions) | $ | 5.5 | $ | 4.7 | |||||||
| Total market share executed on Nasdaq’s exchanges | 71.2 | % | 73.3 | % | |||||||
| Three Months Ended June 30, | Percentage Change | ||||||||||||||||
| 2025 | 2024 | ||||||||||||||||
| (in millions) | |||||||||||||||||
| U.S. Tape plans | $ | 37 | $ | 31 | 18.6 | % | |||||||||||
| Six Months Ended June 30, | Percentage Change | ||||||||||||||||
| 2025 | 2024 | ||||||||||||||||
| (in millions) | |||||||||||||||||
| U.S. Tape plans | $ | 70 | $ | 59 | 18.2 | % | |||||||||||
| Three Months Ended June 30, | Percentage Change | ||||||||||||||||
| 2025 | 2024 | ||||||||||||||||
| (in millions) | |||||||||||||||||
| Other | $ | 20 | $ | 17 | 14.4 | % | |||||||||||
| Six Months Ended June 30, | Percentage Change | ||||||||||||||||
| 2025 | 2024 | ||||||||||||||||
| (in millions) | |||||||||||||||||
| Other | $ | 40 | $ | 34 | 14.5 | % | |||||||||||
| Three Months Ended June 30, | Percentage Change | ||||||||||||||||
| 2025 | 2024 | ||||||||||||||||
| (in millions) | |||||||||||||||||
| Compensation and benefits | $ | 352 | $ | 328 | 7.3 | % | |||||||||||
| Professional and contract services | 39 | 39 | (0.7) | % | |||||||||||||
| Technology and communication infrastructure | 79 | 69 | 14.9 | % | |||||||||||||
| Occupancy | 30 | 27 | 6.1 | % | |||||||||||||
| General, administrative and other | 23 | 30 | (20.4) | % | |||||||||||||
| Marketing and advertising | 14 | 12 | 17.0 | % | |||||||||||||
| Depreciation and amortization | 158 | 153 | 3.0 | % | |||||||||||||
| Regulatory | 14 | 18 | (23.3) | % | |||||||||||||
| Merger and strategic initiatives | 20 | 4 | 454.2 | % | |||||||||||||
| Restructuring charges | 9 | 56 | (83.6) | % | |||||||||||||
| Total operating expenses | $ | 738 | $ | 736 | 0.3 | % | |||||||||||
| Six Months Ended June 30, | Percentage Change | ||||||||||||||||
| 2025 | 2024 | ||||||||||||||||
| (in millions) | |||||||||||||||||
| Compensation and benefits | $ | 681 | $ | 669 | 1.8% | ||||||||||||
| Professional and contract services | 75 | 72 | 3.5% | ||||||||||||||
| Technology and communication infrastructure | 156 | 135 | 15.4% | ||||||||||||||
| Occupancy | 58 | 56 | 3.0% | ||||||||||||||
| General, administrative and other | 29 | 58 | (49.6)% | ||||||||||||||
| Marketing and advertising | 28 | 23 | 21.3% | ||||||||||||||
| Depreciation and amortization | 313 | 308 | 1.8% | ||||||||||||||
| Regulatory | 29 | 28 | 3.0% | ||||||||||||||
| Merger and strategic initiatives | 44 | 13 | 244.3% | ||||||||||||||
| Restructuring charges | 15 | 82 | (82.3)% | ||||||||||||||
| Total operating expenses | $ | 1,428 | $ | 1,444 | (1.1)% | ||||||||||||
| Three Months Ended June 30, | Percentage Change | ||||||||||||||||
| 2025 | 2024 | ||||||||||||||||
| (in millions) | |||||||||||||||||
| Interest income | $ | 12 | $ | 6 | 100.9% | ||||||||||||
| Interest expense | (95) | (102) | (7.4) | % | |||||||||||||
| Net interest expense | (83) | (96) | (14.3) | % | |||||||||||||
Net gain on divestitures |
39 | — | N/M | ||||||||||||||
Other income |
1 | 12 | (93.1) | % | |||||||||||||
Net income from unconsolidated investees |
23 | 2 | 1,092.5 | % | |||||||||||||
| Total non-operating expense | $ | (20) | $ | (82) | (28.3) | % | |||||||||||
| Six Months Ended June 30, | Percentage Change | ||||||||||||||||
| 2025 | 2024 | ||||||||||||||||
| (in millions) | |||||||||||||||||
| Interest income | $ | 24 | $ | 12 | 93.1 | % | |||||||||||
| Interest expense | (192) | (211) | (9.2) | % | |||||||||||||
| Net interest expense | (168) | (199) | (15.4) | % | |||||||||||||
| Net gain on divestitures | 39 | — | N/M | ||||||||||||||
Other income |
— | 13 | (96.7) | % | |||||||||||||
| Net income from unconsolidated investees | 50 | 6 | 779.7 | % | |||||||||||||
| Total non-operating expense | $ | (79) | $ | (180) | (34.5) | % | |||||||||||
| Three Months Ended June 30, | Percentage Change | ||||||||||||||||
| 2025 | 2024 | ||||||||||||||||
| (in millions) | |||||||||||||||||
| Interest expense on debt | $ | 92 | $ | 99 | (7.3) | % | |||||||||||
| Accretion of debt issuance costs and debt discount | 2 | 2 | (6.0) | % | |||||||||||||
| Other fees | 1 | 1 | (28.7) | % | |||||||||||||
| Interest expense | $ | 95 | $ | 102 | (7.4) | % | |||||||||||
| Six Months Ended June 30, | Percentage Change | ||||||||||||||||
| 2025 | 2024 | ||||||||||||||||
| (in millions) | |||||||||||||||||
| Interest expense on debt | $ | 185 | $ | 202 | (8.8) | % | |||||||||||
| Accretion of debt issuance costs and debt discount | 6 | 7 | (19.1) | % | |||||||||||||
| Other fees | 1 | 2 | (12.2) | % | |||||||||||||
| Interest expense | $ | 192 | $ | 211 | (9.2) | % | |||||||||||
| Three Months Ended June 30, | Percentage Change | ||||||||||||||||
| 2025 | 2024 | ||||||||||||||||
| ($ in millions) | |||||||||||||||||
| Income tax provision | $ | 96 | $ | 119 | (19.0) | % | |||||||||||
| Effective tax rate | 17.5 | % | 34.9 | % | |||||||||||||
| Six Months Ended June 30, | Percentage Change | ||||||||||||||||
| 2025 | 2024 | ||||||||||||||||
| (in millions) | |||||||||||||||||
| Income tax provision | $ | 190 | $ | 198 | (4.0) | % | |||||||||||
| Effective tax rate | 18.3 | % | 30.3 | % | |||||||||||||
Three Months Ended June 30, |
|||||||||||
2025 |
2024 | ||||||||||
| (in millions, except per share amounts) | |||||||||||
| U.S. GAAP net income attributable to Nasdaq | $ | 452 | $ | 222 | |||||||
| Non-GAAP adjustments: | |||||||||||
| Amortization expense of acquired intangible assets | 122 | 122 | |||||||||
| Merger and strategic initiatives expense | 20 | 4 | |||||||||
| Restructuring charges | 9 | 56 | |||||||||
| Net gain on divestitures | (39) | — | |||||||||
Net income from unconsolidated investees |
(23) | (2) | |||||||||
| Legal and regulatory matters | 1 | 13 | |||||||||
Other |
1 | (10) | |||||||||
| Total non-GAAP adjustments | $ | 91 | $ | 183 | |||||||
| Total non-GAAP tax adjustments | (24) | (41) | |||||||||
Other tax adjustments |
(27) | 33 | |||||||||
| Total non-GAAP adjustments, net of tax | $ | 40 | $ | 175 | |||||||
| Non-GAAP net income attributable to Nasdaq | $ | 492 | $ | 397 | |||||||
| U.S. GAAP effective tax rate | 17.5 | % | 34.9 | % | |||||||
| Total adjustments from non-GAAP tax rate | 5.5 | % | (10.7) | % | |||||||
| Non-GAAP effective tax rate | 23.0 | % | 24.2 | % | |||||||
| Weighted-average common shares outstanding for diluted earnings per share | 579.0 | 579.0 | |||||||||
| U.S. GAAP diluted earnings per share | $ | 0.78 | $ | 0.38 | |||||||
| Total adjustments from non-GAAP net income | 0.07 | 0.31 | |||||||||
| Non-GAAP diluted earnings per share | $ | 0.85 | $ | 0.69 | |||||||
Six Months Ended June 30, |
|||||||||||
2025 |
2024 | ||||||||||
| (in millions, except per share amounts) | |||||||||||
| U.S. GAAP net income attributable to Nasdaq | $ | 847 | $ | 456 | |||||||
| Non-GAAP adjustments: | |||||||||||
| Amortization expense of acquired intangible assets | 243 | 244 | |||||||||
| Merger and strategic initiatives expense | 44 | 13 | |||||||||
| Restructuring charges | 15 | 82 | |||||||||
Gain on extinguishment of debt |
(19) | — | |||||||||
| Net gain on divestitures | (39) | — | |||||||||
Net income from unconsolidated investees |
(50) | (6) | |||||||||
| Legal and regulatory matters | 4 | 16 | |||||||||
Pension settlement charge |
— | 23 | |||||||||
Other |
1 | (9) | |||||||||
| Total non-GAAP adjustments | $ | 199 | $ | 363 | |||||||
| Total non-GAAP tax adjustments | (70) | (88) | |||||||||
Other tax adjustments |
(27) | 33 | |||||||||
| Total non-GAAP adjustments, net of tax | $ | 102 | $ | 308 | |||||||
| Non-GAAP net income attributable to Nasdaq | $ | 949 | $ | 764 | |||||||
| U.S. GAAP effective tax rate | 18.3 | % | 30.3 | % | |||||||
| Total adjustments from non-GAAP tax rate | 4.9 | % | (5.4) | % | |||||||
| Non-GAAP effective tax rate | 23.2 | % | 24.9 | % | |||||||
| Weighted-average common shares outstanding for diluted earnings per share | 579.5 | 578.9 | |||||||||
| U.S. GAAP diluted earnings per share | $ | 1.46 | $ | 0.79 | |||||||
| Total adjustments from non-GAAP net income | 0.18 | 0.53 | |||||||||
| Non-GAAP diluted earnings per share | $ | 1.64 | $ | 1.32 | |||||||
| June 30, 2025 | December 31, 2024 | |||||||||||||
| (in millions) | ||||||||||||||
| Working capital | $ | (305) | $ | (116) | ||||||||||
| Cash and cash equivalents | 732 | 592 | ||||||||||||
| Financial investments | 84 | 184 | ||||||||||||
| Six Months Ended June 30, | |||||||||||
| 2025 | 2024 | ||||||||||
| Net cash provided by (used in): | (in millions) | ||||||||||
| Operating activities | $ | 1,409 | $ | 990 | |||||||
| Investing activities | (317) | (18) | |||||||||
| Financing activities | (2,545) | (2,333) | |||||||||
| 2025 | 2024 | ||||||||||
| First quarter | $ | 0.24 | $ | 0.22 | |||||||
| Second quarter | 0.27 | 0.24 | |||||||||
| Total | $ | 0.51 | $ | 0.46 | |||||||
| Payments Due by Period | |||||||||||||||||
| (in millions) | Total | <1 year | 1-3 years | 3-5 years | 5+ years | ||||||||||||
| Debt obligation by contractual maturity | $ | 14,596 | $ | 844 | $ | 1,530 | $ | 1,958 | $ | 10,264 | |||||||
| Operating lease obligations | 633 | 74 | 151 | 139 | 269 | ||||||||||||
| Purchase obligations | 1,489 | 141 | 217 | 247 | 884 | ||||||||||||
| Total | $ | 16,718 | $ | 1,059 | $ | 1,898 | $ | 2,344 | $ | 11,417 | |||||||
| Euro | Swedish Krona | Canadian Dollar | Other Foreign Currencies | U.S. Dollar | |||||||||||||
| (in millions, except currency rate) | |||||||||||||||||
Three Months Ended June 30, 2025 | |||||||||||||||||
| Average foreign currency rate to the U.S. dollar | 1.134 | 0.104 | 0.723 | # | N/A | ||||||||||||
| Percentage of revenues less transaction-based expenses | 7.4% | 3.4% | 0.6% | 3.6% | 85.0% | ||||||||||||
| Percentage of operating income | 10.6% | (3.7)% | (7.0)% | (7.7)% | 107.8% | ||||||||||||
| Impact of a 10% adverse currency fluctuation on revenues less transaction-based expenses | $(10) | $(4) | $(1) | $(5) | $— | ||||||||||||
| Impact of a 10% adverse currency fluctuation on operating income | $(6) | $(2) | $(4) | $(4) | $— | ||||||||||||
| Euro | Swedish Krona | Canadian Dollar | Other Foreign Currencies | U.S. Dollar | |||||||||||||
| (in millions, except currency rate) | |||||||||||||||||
Six Months Ended June 30, 2025 | |||||||||||||||||
| Average foreign currency rate to the U.S. dollar | 1.092 | 0.098 | 0.710 | # | N/A | ||||||||||||
| Percentage of revenues less transaction-based expenses | 7.3% | 3.4% | 0.6% | 3.5% | 85.2% | ||||||||||||
| Percentage of operating income | 10.8% | (2.7)% | (6.7)% | (8.0)% | 106.6% | ||||||||||||
| Impact of a 10% adverse currency fluctuation on revenues less transaction-based expenses | $(19) | $(9) | $(1) | $(9) | $— | ||||||||||||
| Impact of a 10% adverse currency fluctuation on operating income | $(12) | $(3) | $(8) | $(8) | $— | ||||||||||||
| Net Assets | Impact of a 10% Adverse Currency Fluctuation | |||||||||||||
| (in millions) | ||||||||||||||
| Swedish Krona | $ | 3,238 | $ | (324) | ||||||||||
| Canadian Dollar | 145 | (15) | ||||||||||||
| Norwegian Krone | 134 | (13) | ||||||||||||
| Australian Dollar | 97 | (10) | ||||||||||||
| British Pound | 93 | (9) | ||||||||||||
| Period |
Total Number of Shares Purchased
|
Average Price Paid Per Share |
Total Number of Shares Purchased as Part of Publicly Announced Plans or Programs
|
Maximum Dollar Value of Shares that May Yet Be Purchased Under the Plans or Programs (in millions) |
||||||||||||||||||||||
April 2025 |
||||||||||||||||||||||||||
| Share repurchase program | 542,471 | $ | 74.45 | 542,471 | $ | 1,590 | ||||||||||||||||||||
| Employee transactions | 427,922 | $ | 76.74 | N/A | N/A | |||||||||||||||||||||
May 2025 |
||||||||||||||||||||||||||
| Share repurchase program | — | $ | — | — | $ | 1,590 | ||||||||||||||||||||
| Employee transactions | 467 | $ | 76.46 | N/A | N/A | |||||||||||||||||||||
June 2025 |
||||||||||||||||||||||||||
| Share repurchase program | 689,445 | $ | 87.05 | 689,445 | $ | 1,530 | ||||||||||||||||||||
| Employee transactions | 6,897 | $ | 85.77 | N/A | N/A | |||||||||||||||||||||
Total Quarter Ended June 30, 2025 | ||||||||||||||||||||||||||
| Share repurchase program | 1,231,916 | $ | 81.50 | 1,231,916 | $ | 1,530 | ||||||||||||||||||||
| Employee transactions | 435,286 | $ | 76.88 | N/A | N/A | |||||||||||||||||||||
| Exhibit Number | ||||||||
| 101 | The following materials from the Nasdaq, Inc. Quarterly Report on Form 10-Q for the quarter ended June 30, 2025, formatted in iXBRL (Inline eXtensible Business Reporting Language): (i) Condensed Consolidated Balance Sheets as of June 30, 2025 and December 31, 2024; (ii) Condensed Consolidated Statements of Income for the three and six months ended June 30, 2025 and 2024; (iii) Condensed Consolidated Statements of Comprehensive Income for the three and six months ended June 30, 2025 and 2024; (iv) Condensed Consolidated Statements of Changes in Stockholders’ Equity for the three and six months ended June 30, 2025 and 2024; (v) Condensed Consolidated Statements of Cash Flows for the six months ended June 30, 2025 and 2024; and (vi) notes to condensed consolidated financial statements. |
|||||||
| 104 | Cover Page Interactive Data File, formatted in iXBRL and contained in Exhibit 101. | |||||||
| Nasdaq, Inc. | ||||||||
| (Registrant) | ||||||||
| By: | /s/ Adena T. Friedman | |||||||
| Name: | Adena T. Friedman | |||||||
| Title: | Chief Executive Officer | |||||||
| Date: | July 25, 2025 | |||||||
| By: | /s/ Sarah Youngwood |
|||||||
| Name: | Sarah Youngwood |
|||||||
| Title: |
Executive Vice President and
Chief Financial Officer
|
|||||||
| Date: | July 25, 2025 | |||||||
|
Award Date: June 11, 2025
|
Number of Restricted Stock Units: # GRANTED SHARES
|
||||
| Percentile Rank of the Company’s Three-Year TSR Versus the S&P 500 | Resulting Shares Earned (% of Half of Target) | ||||
≥85th Percentile |
200% | ||||
67.5th Percentile |
150% | ||||
50th Percentile |
100% | ||||
25th Percentile |
50% | ||||
15th Percentile |
30% | ||||
| 0 Percentile | 0% | ||||
| Percentile Rank of the Company’s Three-Year TSR Versus the Peer Group | Resulting Shares Earned (% of Half of Target) | ||||
≥85th Percentile |
200% | ||||
67.5th Percentile |
150% | ||||
50th Percentile |
100% | ||||
25th Percentile |
50% | ||||
15th Percentile |
30% | ||||
| 0 Percentile | 0% | ||||
| /s/ Adena T. Friedman | |||||||||||
| Name: | Adena T. Friedman | ||||||||||
| Title: | Chief Executive Officer | ||||||||||
/s/ Sarah Youngwood |
|||||||||||
| Name: | Sarah Youngwood |
||||||||||
| Title: | Executive Vice President and Chief Financial Officer | ||||||||||
| /s/ Adena T. Friedman | |||||||||||
| Name: | Adena T. Friedman | ||||||||||
| Title: | Chief Executive Officer | ||||||||||
| Date: | July 25, 2025 | ||||||||||
/s/ Sarah Youngwood |
|||||||||||
| Name: | Sarah Youngwood |
||||||||||
| Title: | Executive Vice President and Chief Financial Officer | ||||||||||
| Date: | July 25, 2025 | ||||||||||