| ☒ | QUARTERLY REPORT PURSUANT TO SECTION 13 OR 15(d) OF THE SECURITIES EXCHANGE ACT OF 1934 |
|||||||
For the quarterly period ended |
September 30, 2023 | |||||||
OR | ||||||||
| ☐ | TRANSITION REPORT PURSUANT TO SECTION 13 OR 15(d) OF THE SECURITIES EXCHANGE ACT OF 1934 |
|||||||
For the transition period |
from ________ to ________ |
|||||||
| Delaware | 52-1165937 | ||||||||||
| (State or Other Jurisdiction of Incorporation or Organization) | (I.R.S. Employer Identification No.) | ||||||||||
| 151 W. 42nd Street, | New York, | New York | 10036 | ||||||||
| (Address of Principal Executive Offices) | (Zip Code) | ||||||||||
| No Changes | |||||||||||
| (Former name, former address and former fiscal year, if changed since last report) | |||||||||||
| Title of each class | Trading Symbol(s) | Name of each exchange on which registered | ||||||||||||
| Common Stock, $0.01 par value per share | NDAQ | The Nasdaq Stock Market | ||||||||||||
| 4.500% Senior Notes due 2032 | NDAQ32 | The Nasdaq Stock Market | ||||||||||||
| 0.900% Senior Notes due 2033 | NDAQ33 | The Nasdaq Stock Market | ||||||||||||
| 0.875% Senior Notes due 2030 | NDAQ30 | The Nasdaq Stock Market | ||||||||||||
| 1.75% Senior Notes due 2029 | NDAQ29 | The Nasdaq Stock Market | ||||||||||||
| Large accelerated filer | ☒ | Accelerated filer | ☐ | ||||||||
| Non-accelerated filer | ☐ | Smaller reporting company | ☐ | ||||||||
| Emerging growth company | ☐ | ||||||||||
| Class | Outstanding at November 1, 2023 |
||||||||||
| Common Stock, $0.01 par value per share | 576,964,570 | shares | |||||||||
Page |
||||||||
Part I. FINANCIAL INFORMATION |
||||||||
| Item 1. | ||||||||
| Item 2. | ||||||||
| Item 3. | ||||||||
| Item 4. | ||||||||
Part II. OTHER INFORMATION |
||||||||
| Item 1. | ||||||||
| Item 1A. | ||||||||
| Item 2. | ||||||||
| Item 3. | ||||||||
| Item 4. | ||||||||
| Item 5. | ||||||||
| Item 6. | ||||||||
| September 30, 2023 | December 31, 2022 | ||||||||||
| (unaudited) | |||||||||||
| Assets | |||||||||||
| Current assets: | |||||||||||
| Cash and cash equivalents | $ | 5,340 | $ | 502 | |||||||
| Restricted cash and cash equivalents | 25 | 22 | |||||||||
Default funds and margin deposits (including restricted cash and cash equivalents of $5,469 and $6,470, respectively) |
5,935 | 7,021 | |||||||||
| Financial investments | 272 | 181 | |||||||||
| Receivables, net | 595 | 677 | |||||||||
| Other current assets | 184 | 201 | |||||||||
| Total current assets | 12,351 | 8,604 | |||||||||
| Property and equipment, net | 542 | 532 | |||||||||
| Goodwill | 7,988 | 8,099 | |||||||||
| Intangible assets, net | 2,446 | 2,581 | |||||||||
| Operating lease assets | 397 | 444 | |||||||||
| Other non-current assets | 626 | 608 | |||||||||
| Total assets | $ | 24,350 | $ | 20,868 | |||||||
| Liabilities | |||||||||||
| Current liabilities: | |||||||||||
| Accounts payable and accrued expenses | $ | 286 | $ | 185 | |||||||
| Section 31 fees payable to SEC | 19 | 243 | |||||||||
| Accrued personnel costs | 211 | 243 | |||||||||
| Deferred revenue | 451 | 357 | |||||||||
| Other current liabilities | 146 | 122 | |||||||||
| Default funds and margin deposits | 5,935 | 7,021 | |||||||||
| Short-term debt | — | 664 | |||||||||
| Total current liabilities | 7,048 | 8,835 | |||||||||
| Long-term debt | 9,703 | 4,735 | |||||||||
| Deferred tax liabilities, net | 509 | 456 | |||||||||
| Operating lease liabilities | 412 | 452 | |||||||||
| Other non-current liabilities | 199 | 226 | |||||||||
| Total liabilities | 17,871 | 14,704 | |||||||||
| Commitments and contingencies | |||||||||||
| Equity | |||||||||||
| Nasdaq stockholders’ equity: | |||||||||||
Common stock, $0.01 par value, 900,000,000 shares authorized, shares issued: 514,134,579 at September 30, 2023 and 513,157,630 at December 31, 2022; shares outstanding: 491,316,638 at September 30, 2023 and 491,592,491 at December 31, 2022 |
5 | 5 | |||||||||
| Additional paid-in capital | 1,394 | 1,445 | |||||||||
Common stock in treasury, at cost: 22,817,941 shares at September 30, 2023 and 21,565,139 shares at December 31, 2022 |
(585) | (515) | |||||||||
| Accumulated other comprehensive loss | (2,102) | (1,991) | |||||||||
| Retained earnings | 7,755 | 7,207 | |||||||||
| Total Nasdaq stockholders’ equity | 6,467 | 6,151 | |||||||||
| Noncontrolling interests | 12 | 13 | |||||||||
| Total equity | 6,479 | 6,164 | |||||||||
| Total liabilities and equity | $ | 24,350 | $ | 20,868 | |||||||
| Three Months Ended September 30, | Nine Months Ended September 30, | ||||||||||||||||||||||
| 2023 | 2022 | 2023 | 2022 | ||||||||||||||||||||
| Revenues: | |||||||||||||||||||||||
| Market Platforms | $ | 892 | $ | 1,046 | $ | 2,813 | $ | 3,121 | |||||||||||||||
| Capital Access Platforms | 456 | 422 | 1,309 | 1,262 | |||||||||||||||||||
| Anti-Financial Crime | 93 | 77 | 265 | 224 | |||||||||||||||||||
| Other revenues | 10 | 12 | 30 | 37 | |||||||||||||||||||
| Total revenues | 1,451 | 1,557 | 4,417 | 4,644 | |||||||||||||||||||
| Transaction-based expenses: | |||||||||||||||||||||||
| Transaction rebates | (447) | (494) | (1,377) | (1,605) | |||||||||||||||||||
| Brokerage, clearance and exchange fees | (64) | (173) | (262) | (364) | |||||||||||||||||||
| Revenues less transaction-based expenses | 940 | 890 | 2,778 | 2,675 | |||||||||||||||||||
| Operating expenses: | |||||||||||||||||||||||
| Compensation and benefits | 260 | 249 | 777 | 750 | |||||||||||||||||||
| Professional and contract services | 31 | 34 | 92 | 97 | |||||||||||||||||||
| Computer operations and data communications | 58 | 50 | 168 | 150 | |||||||||||||||||||
| Occupancy | 28 | 25 | 99 | 78 | |||||||||||||||||||
| General, administrative and other | 26 | 38 | 62 | 94 | |||||||||||||||||||
| Marketing and advertising | 12 | 10 | 30 | 31 | |||||||||||||||||||
| Depreciation and amortization | 64 | 63 | 198 | 195 | |||||||||||||||||||
| Regulatory | 9 | 9 | 27 | 24 | |||||||||||||||||||
| Merger and strategic initiatives | 4 | 14 | 51 | 41 | |||||||||||||||||||
| Restructuring charges | 17 | — | 49 | — | |||||||||||||||||||
| Total operating expenses | 509 | 492 | 1,553 | 1,460 | |||||||||||||||||||
| Operating income | 431 | 398 | 1,225 | 1,215 | |||||||||||||||||||
| Interest income | 72 | 2 | 86 | 3 | |||||||||||||||||||
| Interest expense | (101) | (32) | (174) | (96) | |||||||||||||||||||
| Other income (loss) | 1 | 6 | (6) | 8 | |||||||||||||||||||
| Net income (loss) from unconsolidated investees | (12) | 8 | (8) | 23 | |||||||||||||||||||
| Income before income taxes | 391 | 382 | 1,123 | 1,153 | |||||||||||||||||||
| Income tax provision | 97 | 88 | 262 | 270 | |||||||||||||||||||
| Net income | 294 | 294 | 861 | 883 | |||||||||||||||||||
| Net loss attributable to noncontrolling interests | — | — | 1 | 1 | |||||||||||||||||||
| Net income attributable to Nasdaq | $ | 294 | $ | 294 | $ | 862 | $ | 884 | |||||||||||||||
| Per share information: | |||||||||||||||||||||||
| Basic earnings per share | $ | 0.60 | $ | 0.60 | $ | 1.76 | $ | 1.79 | |||||||||||||||
| Diluted earnings per share | $ | 0.60 | $ | 0.59 | $ | 1.74 | $ | 1.77 | |||||||||||||||
| Cash dividends declared per common share | $ | 0.22 | $ | 0.20 | $ | 0.64 | $ | 0.58 | |||||||||||||||
| Three Months Ended September 30, | Nine Months Ended September 30, | ||||||||||||||||||||||
| 2023 | 2022 | 2023 | 2022 | ||||||||||||||||||||
| Net income | $ | 294 | $ | 294 | $ | 861 | $ | 883 | |||||||||||||||
Other comprehensive income (loss): |
|||||||||||||||||||||||
Foreign currency translation gains (losses) |
41 | (155) | (96) | (428) | |||||||||||||||||||
Income tax expense(1) |
(24) | (32) | (15) | (77) | |||||||||||||||||||
| Foreign currency translation, net | 17 | (187) | (111) | (505) | |||||||||||||||||||
| Comprehensive income | 311 | 107 | 750 | 378 | |||||||||||||||||||
| Comprehensive loss attributable to noncontrolling interests | — | — | 1 | 1 | |||||||||||||||||||
| Comprehensive income attributable to Nasdaq | $ | 311 | $ | 107 | $ | 751 | $ | 379 | |||||||||||||||
| Three Months Ended September 30, | Nine Months Ended September 30, | ||||||||||||||||||||||||||||||||||||||||||||||
| 2023 | 2022 | 2023 | 2022 | ||||||||||||||||||||||||||||||||||||||||||||
| Shares | $ | Shares | $ | Shares | $ | Shares | $ | ||||||||||||||||||||||||||||||||||||||||
| Common stock | 491 | 5 | 491 | 5 | 492 | 5 | 500 | 5 | |||||||||||||||||||||||||||||||||||||||
| Additional paid-in capital | |||||||||||||||||||||||||||||||||||||||||||||||
| Beginning balance | 1,363 | 1,382 | 1,445 | 1,949 | |||||||||||||||||||||||||||||||||||||||||||
| Share repurchase program | — | — | — | — | (3) | (159) | (11) | (308) | |||||||||||||||||||||||||||||||||||||||
ASR agreement |
— | — | — | — | — | — | — | (325) | |||||||||||||||||||||||||||||||||||||||
| Share-based compensation | — | 31 | — | 26 | 3 | 90 | 3 | 76 | |||||||||||||||||||||||||||||||||||||||
| Other issuances of common stock, net | — | — | — | — | — | 18 | — | 16 | |||||||||||||||||||||||||||||||||||||||
| Ending balance | 1,394 | 1,408 | 1,394 | 1,408 | |||||||||||||||||||||||||||||||||||||||||||
| Common stock in treasury, at cost | |||||||||||||||||||||||||||||||||||||||||||||||
| Beginning balance | (583) | (509) | (515) | (437) | |||||||||||||||||||||||||||||||||||||||||||
| Other employee stock activity | — | (2) | — | (1) | (1) | (70) | (1) | (73) | |||||||||||||||||||||||||||||||||||||||
| Ending balance | (585) | (510) | (585) | (510) | |||||||||||||||||||||||||||||||||||||||||||
| Accumulated other comprehensive loss | |||||||||||||||||||||||||||||||||||||||||||||||
| Beginning balance | (2,119) | (1,905) | (1,991) | (1,587) | |||||||||||||||||||||||||||||||||||||||||||
Other comprehensive income (loss) |
17 | (187) | (111) | (505) | |||||||||||||||||||||||||||||||||||||||||||
| Ending balance | (2,102) | (2,092) | (2,102) | (2,092) | |||||||||||||||||||||||||||||||||||||||||||
| Retained earnings | |||||||||||||||||||||||||||||||||||||||||||||||
| Beginning balance | 7,569 | 6,869 | 7,207 | 6,465 | |||||||||||||||||||||||||||||||||||||||||||
| Net income attributable to Nasdaq | 294 | 294 | 862 | 884 | |||||||||||||||||||||||||||||||||||||||||||
Cash dividends declared and paid |
(108) | (99) | (314) | (285) | |||||||||||||||||||||||||||||||||||||||||||
| Ending balance | 7,755 | 7,064 | 7,755 | 7,064 | |||||||||||||||||||||||||||||||||||||||||||
| Total Nasdaq stockholders’ equity | 6,467 | 5,875 | 6,467 | 5,875 | |||||||||||||||||||||||||||||||||||||||||||
| Noncontrolling interests | |||||||||||||||||||||||||||||||||||||||||||||||
| Beginning balance | 12 | 9 | 13 | 10 | |||||||||||||||||||||||||||||||||||||||||||
Net activity related to noncontrolling interests |
— | — | (1) | (1) | |||||||||||||||||||||||||||||||||||||||||||
| Ending balance | 12 | 9 | 12 | 9 | |||||||||||||||||||||||||||||||||||||||||||
| Total Equity | 491 | $ | 6,479 | 491 | $ | 5,884 | 491 | $ | 6,479 | 491 | $ | 5,884 | |||||||||||||||||||||||||||||||||||
| Nine Months Ended September 30, | |||||||||||
| 2023 | 2022 | ||||||||||
| Cash flows from operating activities: | |||||||||||
| Net income | $ | 861 | $ | 883 | |||||||
| Adjustments to reconcile net income to net cash provided by operating activities: | |||||||||||
| Depreciation and amortization | 198 | 195 | |||||||||
| Share-based compensation | 90 | 76 | |||||||||
| Deferred income taxes | 44 | 17 | |||||||||
| Extinguishment of debt and bridge fees | 25 | 16 | |||||||||
| Non-cash restructuring charges | 12 | — | |||||||||
Net income (loss) from unconsolidated investees |
8 | (23) | |||||||||
| Operating lease asset impairments | 13 | — | |||||||||
| Other reconciling items included in net income | 22 | 7 | |||||||||
| Net change in operating assets and liabilities, net of effects of acquisitions: | |||||||||||
| Receivables, net | 75 | (69) | |||||||||
| Other assets | 25 | 41 | |||||||||
| Accounts payable and accrued expenses | 110 | 27 | |||||||||
| Section 31 fees payable to SEC | (224) | — | |||||||||
| Accrued personnel costs | (28) | (33) | |||||||||
| Deferred revenue | 90 | 86 | |||||||||
| Other liabilities | (42) | (11) | |||||||||
| Net cash provided by operating activities | 1,279 | 1,212 | |||||||||
| Cash flows from investing activities: | |||||||||||
| Purchases of securities | (530) | (263) | |||||||||
| Proceeds from sales and redemptions of securities | 427 | 305 | |||||||||
| Acquisition of businesses, net of cash and cash equivalents acquired | — | (41) | |||||||||
| Purchases of property and equipment | (116) | (118) | |||||||||
Investments related to default funds and margin deposits, net(1) |
64 | 44 | |||||||||
| Other investing activities | (3) | 48 | |||||||||
| Net cash used in investing activities | (158) | (25) | |||||||||
| Cash flows from financing activities: | |||||||||||
| Repayments of commercial paper, net | (662) | (221) | |||||||||
| Repayments of debt and credit commitment | — | (499) | |||||||||
| Payment of debt extinguishment cost and bridge fees | (25) | (16) | |||||||||
| Proceeds from issuances of debt, net of issuance costs | 5,011 | 541 | |||||||||
| Repurchases of common stock | (159) | (308) | |||||||||
| ASR agreement | — | (325) | |||||||||
| Dividends paid | (314) | (285) | |||||||||
| Proceeds received from employee stock activity and other issuances | 18 | 16 | |||||||||
| Payments related to employee shares withheld for taxes | (70) | (73) | |||||||||
| Default funds and margin deposits | (779) | 5,446 | |||||||||
| Other financing activities | (1) | (1) | |||||||||
| Net cash provided by financing activities | 3,019 | 4,275 | |||||||||
| Effect of exchange rate changes on cash and cash equivalents and restricted cash and cash equivalents | (300) | (1,724) | |||||||||
| Net increase in cash and cash equivalents and restricted cash and cash equivalents | 3,840 | 3,738 | |||||||||
Cash and cash equivalents, restricted cash and cash equivalents at beginning of period |
6,994 | 5,496 | |||||||||
| Cash and cash equivalents, restricted cash and cash equivalents at end of period | $ | 10,834 | $ | 9,234 | |||||||
| Reconciliation of Cash, Cash Equivalents and Restricted Cash and Cash Equivalents | |||||||||||
| Cash and cash equivalents | $ | 5,340 | $ | 301 | |||||||
| Restricted cash and cash equivalents | 25 | 51 | |||||||||
| Restricted cash and cash equivalents (default funds and margin deposits) | 5,469 | 8,882 | |||||||||
| Total | $ | 10,834 | $ | 9,234 | |||||||
| Supplemental Disclosure Cash Flow Information | |||||||||||
| Interest paid | $ | 89 | $ | 83 | |||||||
| Income taxes paid, net of refund | $ | 198 | $ | 204 | |||||||
| Three Months Ended September 30, | |||||||||||
| 2023 | 2022 | ||||||||||
| (in millions) | |||||||||||
| Market Platforms | |||||||||||
| Trading Services, net | $ | 236 | $ | 239 | |||||||
| Marketplace Technology | 145 | 140 | |||||||||
| Capital Access Platforms | |||||||||||
| Data & Listing Services | 188 | 179 | |||||||||
| Index | 144 | 125 | |||||||||
| Workflow & Insights | 124 | 118 | |||||||||
| Anti-Financial Crime | 93 | 77 | |||||||||
| Other revenues | 10 | 12 | |||||||||
| Revenues less transaction-based expenses | $ | 940 | $ | 890 | |||||||
| Nine Months Ended September 30, | |||||||||||
| 2023 | 2022 | ||||||||||
| (in millions) | |||||||||||
| Market Platforms | |||||||||||
| Trading Services, net | $ | 739 | $ | 743 | |||||||
| Marketplace Technology | 435 | 409 | |||||||||
| Capital Access Platforms | |||||||||||
| Data & Listing Services | 559 | 545 | |||||||||
| Index | 383 | 370 | |||||||||
| Workflow & Insights | 367 | 347 | |||||||||
| Anti-Financial Crime | 265 | 224 | |||||||||
| Other revenues | 30 | 37 | |||||||||
| Revenues less transaction-based expenses | $ | 2,778 | $ | 2,675 | |||||||
| Market Technology | Anti-Financial Crime | Workflow & Insights | Total | ||||||||||||||||||||
| (in millions) | |||||||||||||||||||||||
| Remainder of 2023 | $ | 46 | $ | 105 | $ | 43 | $ | 194 | |||||||||||||||
| 2024 | 167 | 379 | 134 | 680 | |||||||||||||||||||
| 2025 | 139 | 180 | 76 | 395 | |||||||||||||||||||
| 2026 | 101 | 68 | 32 | 201 | |||||||||||||||||||
| 2027 | 70 | 17 | 22 | 109 | |||||||||||||||||||
| 2028+ | 110 | 8 | 11 | 129 | |||||||||||||||||||
| Total | $ | 633 | $ | 757 | $ | 318 | $ | 1,708 | |||||||||||||||
| (in millions) | |||||
| Market Platforms | |||||
| Balance at December 31, 2022 | $ | 2,912 | |||
| Foreign currency translation adjustments | (67) | ||||
| Balance at September 30, 2023 | $ | 2,845 | |||
| Capital Access Platforms | |||||
| Balance at December 31, 2022 | $ | 4,178 | |||
| Foreign currency translation adjustments | (40) | ||||
| Balance at September 30, 2023 | $ | 4,138 | |||
| Anti-Financial Crime | |||||
| Balance at December 31, 2022 | $ | 1,009 | |||
| Foreign currency translation adjustments | (4) | ||||
| Balance at September 30, 2023 | $ | 1,005 | |||
| Total | |||||
| Balance at December 31, 2022 | $ | 8,099 | |||
| Foreign currency translation adjustments | (111) | ||||
| Balance at September 30, 2023 | $ | 7,988 | |||
| September 30, 2023 | December 31, 2022 | ||||||||||
| Finite-Lived Intangible Assets | (in millions) | ||||||||||
| Gross Amount | |||||||||||
| Technology | $ | 304 | $ | 304 | |||||||
| Customer relationships | 2,005 | 2,005 | |||||||||
| Trade names and other | 57 | 60 | |||||||||
| Foreign currency translation adjustment | (227) | (209) | |||||||||
| Total gross amount | $ | 2,139 | $ | 2,160 | |||||||
| Accumulated Amortization | |||||||||||
| Technology | $ | (131) | $ | (97) | |||||||
| Customer relationships | (859) | (778) | |||||||||
| Trade names and other | (17) | (17) | |||||||||
| Foreign currency translation adjustment | 137 | 120 | |||||||||
| Total accumulated amortization | $ | (870) | $ | (772) | |||||||
| Net Amount | |||||||||||
| Technology | $ | 173 | $ | 207 | |||||||
| Customer relationships | 1,146 | 1,227 | |||||||||
| Trade names and other | 40 | 43 | |||||||||
| Foreign currency translation adjustment | (90) | (89) | |||||||||
| Total finite-lived intangible assets | $ | 1,269 | $ | 1,388 | |||||||
| Indefinite-Lived Intangible Assets | |||||||||||
| Exchange and clearing registrations | $ | 1,257 | $ | 1,257 | |||||||
| Trade names | 121 | 121 | |||||||||
| Licenses | 52 | 52 | |||||||||
| Foreign currency translation adjustment | (253) | (237) | |||||||||
| Total indefinite-lived intangible assets | $ | 1,177 | $ | 1,193 | |||||||
| Total intangible assets, net | $ | 2,446 | $ | 2,581 | |||||||
| Three Months Ended September 30, | |||||||||||
| 2023 | 2022 | ||||||||||
| (in millions) | |||||||||||
| Amortization expense | $ | 37 | $ | 38 | |||||||
| Nine Months Ended September 30, | |||||||||||
| 2023 | 2022 | ||||||||||
| (in millions) | |||||||||||
| Amortization expense | $ | 112 | $ | 116 | |||||||
| (in millions) | |||||
| Remainder of 2023 | $ | 41 | |||
| 2024 | 153 | ||||
| 2025 | 151 | ||||
| 2026 | 148 | ||||
| 2027 | 147 | ||||
| 2028+ | 719 | ||||
| Total | $ | 1,359 | |||
| September 30, 2023 | December 31, 2022 | ||||||||||
| (in millions) | |||||||||||
Financial investments |
$ | 272 | $ | 181 | |||||||
| Equity method investments | 378 | 390 | |||||||||
| Equity securities | 76 | 86 | |||||||||
Balance at December 31, 2022 |
Additions | Revenue Recognized | Adjustments | Balance at September 30, 2023 | |||||||||||||
| (in millions) | |||||||||||||||||
| Market Platforms: | |||||||||||||||||
| Market Technology | $ | 29 | $ | 25 | $ | (26) | $ | (1) | $ | 27 | |||||||
| Capital Access Platforms: | |||||||||||||||||
| Initial Listings | 116 | 15 | (30) | (1) | 100 | ||||||||||||
| Annual Listings | 2 | 92 | (1) | (1) | 92 | ||||||||||||
| Workflow & Insights | 172 | 162 | (152) | — | 182 | ||||||||||||
| Anti-Financial Crime | 108 | 102 | (100) | — | 110 | ||||||||||||
| Other | 21 | 11 | (9) | (1) | 22 | ||||||||||||
| Total | $ | 448 | $ | 407 | $ | (318) | $ | (4) | $ | 533 | |||||||
Fiscal year ended: |
2023 | 2024 | 2025 | 2026 | 2027 | 2028+ | Total | ||||||||||||||||
| (in millions) | |||||||||||||||||||||||
| Market Platforms: | |||||||||||||||||||||||
| Market Technology | $ | 12 | $ | 11 | $ | 2 | $ | 1 | $ | 1 | $ | — | $ | 27 | |||||||||
| Capital Access Platforms: | |||||||||||||||||||||||
| Initial Listings | 10 | 34 | 24 | 19 | 10 | 3 | 100 | ||||||||||||||||
| Annual Listings | 92 | — | — | — | — | — | 92 | ||||||||||||||||
| Workflow & Insights | 84 | 98 | — | — | — | — | 182 | ||||||||||||||||
| Anti-Financial Crime | 51 | 59 | — | — | — | — | 110 | ||||||||||||||||
| Other | 6 | 9 | 5 | 2 | — | — | 22 | ||||||||||||||||
| Total | $ | 255 | $ | 211 | $ | 31 | $ | 22 | $ | 11 | $ | 3 | $ | 533 | |||||||||
| September 30, 2023 | December 31, 2022 | ||||||||||
| (in millions) | |||||||||||
| Short-term debt: | |||||||||||
| Commercial paper | $ | — | $ | 664 | |||||||
| Long-term debt - senior unsecured notes: | |||||||||||
2025 Notes, $500 million, 5.650% notes due June 28, 2025 |
497 | — | |||||||||
2026 Notes, $500 million, 3.850% notes due June 30, 2026 |
499 | 498 | |||||||||
|
2028 Notes, $1 billion, 5.350% notes
due June 28, 2028
|
991 | — | |||||||||
2029 Notes, €600 million, 1.75% notes due March 28, 2029 |
630 | 637 | |||||||||
2030 Notes, €600 million, 0.875% notes due February 13, 2030 |
630 | 637 | |||||||||
2031 Notes, $650 million, 1.650% notes due January 15, 2031 |
644 | 644 | |||||||||
2032 Notes, €750 million, 4.500% notes due February 15, 2032 |
784 | — | |||||||||
2033 Notes, €615 million, 0.900% notes due July 30, 2033 |
645 | 653 | |||||||||
2034 Notes $1.25 billion, 5.550% notes due February 15, 2034 |
1,239 | — | |||||||||
2040 Notes, $650 million, 2.500% notes due December 21, 2040 |
644 | 644 | |||||||||
2050 Notes, $500 million, 3.250% notes due April 28, 2050 |
487 | 486 | |||||||||
2052 Notes, $550 million, 3.950% notes due March 7, 2052 |
541 | 541 | |||||||||
2053 Notes, $750 million, 5.950% notes due August 15, 2053 |
738 | — | |||||||||
2063 Notes, $750 million, 6.100% notes due June 28, 2063 |
738 | — | |||||||||
| 2022 Revolving Credit Agreement | (4) | (5) | |||||||||
| Total long-term debt | $ | 9,703 | $ | 4,735 | |||||||
| Total debt obligations | $ | 9,703 | $ | 5,399 | |||||||
| Three Months Ended September 30, | Nine Months Ended September 30, | ||||||||||||||||||||||
| 2023 | 2022 | 2023 | 2022 | ||||||||||||||||||||
| (in millions) | |||||||||||||||||||||||
Savings Plan expense |
$ | 4 | $ | 4 | $ | 14 | $ | 13 | |||||||||||||||
| Three Months Ended September 30, | Nine Months Ended September 30, | ||||||||||||||||||||||
| 2023 | 2022 | 2023 | 2022 | ||||||||||||||||||||
| (in millions) | |||||||||||||||||||||||
Retirement Plans expense |
$ | 6 | $ | 6 | $ | 19 | $ | 18 | |||||||||||||||
| Three Months Ended September 30, | Nine Months Ended September 30, | ||||||||||||||||||||||
| 2023 | 2022 | 2023 | 2022 | ||||||||||||||||||||
| (in millions) | |||||||||||||||||||||||
| Share-based compensation expense before income taxes | $ | 31 | $ | 26 | $ | 90 | $ | 76 | |||||||||||||||
| Restricted Stock | |||||||||||
| Number of Awards | Weighted-Average Grant Date Fair Value | ||||||||||
| Unvested at December 31, 2022 | 4,380,513 | $ | 45.48 | ||||||||
| Granted | 1,687,070 | 52.54 | |||||||||
| Vested | (1,621,991) | 37.07 | |||||||||
| Forfeited | (220,665) | 50.30 | |||||||||
| Unvested at September 30, 2023 | 4,224,927 | $ | 51.28 | ||||||||
| Grant date | April 3, 2023 | April 1, 2022 | |||||||||
| Weighted-average risk-free interest rate | 3.75 | % | 2.55 | % | |||||||
Expected volatility |
23.88 | % | 30.33 | % | |||||||
| Weighted-average grant date share price | $ | 54.40 | $ | 60.64 | |||||||
| Weighted-average fair value at grant date | $ | 52.56 | $ | 63.50 | |||||||
| PSUs | |||||||||||
| Number of Awards | Weighted-Average Grant Date Fair Value | ||||||||||
| Unvested at December 31, 2022 | 1,966,542 | $ | 56.44 | ||||||||
| Granted | 1,513,538 | 44.78 | |||||||||
| Vested | (1,529,496) | 37.17 | |||||||||
| Forfeited | (25,478) | 63.59 | |||||||||
| Unvested at September 30, 2023 | 1,925,106 | $ | 62.22 | ||||||||
Number of Stock Options |
Weighted-Average Exercise Price |
Weighted-
Average
Remaining
Contractual
Term (in
years)
|
Aggregate
Intrinsic
Value (in
millions)
|
|||||||||||
| Outstanding at September 30, 2023 | 1,420,323 | $ | 41.79 | 5.4 | $ | 21 | ||||||||
| Exercisable at September 30, 2023 | 806,451 | $ | 22.23 | 3.3 | $ | 21 | ||||||||
| Nine Months Ended September 30, 2023 | ||||||||
| Number of shares of common stock repurchased | 2,610,000 | |||||||
Average price paid per share |
$ | 61.08 | ||||||
Total purchase price (in millions) |
$ | 159 | ||||||
| Declaration Date | Dividend Per Common Share |
Record Date | Total Amount Paid | Payment Date | ||||||||||||||||||||||
| (in millions) | ||||||||||||||||||||||||||
| January 24, 2023 | $ | 0.20 | March 17, 2023 | $ | 97 | March 31, 2023 | ||||||||||||||||||||
| April 18, 2023 | 0.22 | June 16, 2023 | 109 | June 30, 2023 | ||||||||||||||||||||||
| July 18, 2023 | 0.22 | September 15, 2023 | 108 | September 29, 2023 | ||||||||||||||||||||||
| $ | 314 | |||||||||||||||||||||||||
| Three Months Ended September 30, | |||||||||||
| 2023 | 2022 | ||||||||||
| Numerator: | (in millions, except share and per share amounts) | ||||||||||
| Net income attributable to common shareholders | $ | 294 | $ | 294 | |||||||
| Denominator: | |||||||||||
| Weighted-average common shares outstanding for basic earnings per share | 491,315,824 | 491,228,889 | |||||||||
| Weighted-average effect of dilutive securities - Employee equity awards | 2,796,138 | 5,110,197 | |||||||||
| Weighted-average common shares outstanding for diluted earnings per share | 494,111,962 | 496,339,086 | |||||||||
| Basic and diluted earnings per share: | |||||||||||
| Basic earnings per share | $ | 0.60 | $ | 0.60 | |||||||
| Diluted earnings per share | $ | 0.60 | $ | 0.59 | |||||||
| Nine Months Ended September 30, | |||||||||||
| 2023 | 2022 | ||||||||||
| Numerator: | (in millions, except share and per share amounts) | ||||||||||
| Net income attributable to common shareholders | $ | 862 | $ | 884 | |||||||
| Denominator: | |||||||||||
| Weighted-average common shares outstanding for basic earnings per share | 490,680,174 | 492,803,274 | |||||||||
| Weighted-average effect of dilutive securities - Employee equity awards | 3,495,584 | 5,351,675 | |||||||||
| Weighted-average common shares outstanding for diluted earnings per share | 494,175,758 | 498,154,949 | |||||||||
| Basic and diluted earnings per share: | |||||||||||
| Basic earnings per share | $ | 1.76 | $ | 1.79 | |||||||
| Diluted earnings per share | $ | 1.74 | $ | 1.77 | |||||||
| September 30, 2023 | |||||||||||||||||||||||
Total |
Level 1 |
Level 2 |
Level 3 |
||||||||||||||||||||
(in millions) |
|||||||||||||||||||||||
European government debt securities |
$ | 150 | $ | 150 | $ | — | $ | — | |||||||||||||||
State-owned enterprises and municipal securities |
105 | — | 105 | — | |||||||||||||||||||
Swedish mortgage bonds |
12 | — | 12 | — | |||||||||||||||||||
Corporate debt securities |
5 | — | 5 | — | |||||||||||||||||||
| Total assets at fair value | $ | 272 | $ | 150 | $ | 122 | $ | — | |||||||||||||||
| December 31, 2022 | |||||||||||||||||||||||
Total |
Level 1 |
Level 2 |
Level 3 |
||||||||||||||||||||
(in millions) |
|||||||||||||||||||||||
European government debt securities |
$ | 147 | $ | 147 | $ | — | $ | — | |||||||||||||||
State-owned enterprises and municipal securities |
7 | — | 7 | — | |||||||||||||||||||
Swedish mortgage bonds |
20 | — | 20 | — | |||||||||||||||||||
Corporate debt securities |
7 | — | 7 | — | |||||||||||||||||||
| Total assets at fair value | $ | 181 | $ | 147 | $ | 34 | $ | — | |||||||||||||||
| September 30, 2023 | |||||||||||||||||
| Cash Contributions | Non-Cash Contributions | Total Contributions | |||||||||||||||
| (in millions) | |||||||||||||||||
| Default fund contributions | $ | 957 | $ | 151 | $ | 1,108 | |||||||||||
| Margin deposits | 4,978 | 5,069 | 10,047 | ||||||||||||||
| Total | $ | 5,935 | $ | 5,220 | $ | 11,155 | |||||||||||
| September 30, 2023 | December 31, 2022 | ||||||||||
| (in millions) | |||||||||||
| Demand deposits | $ | 4,477 | $ | 4,775 | |||||||
| Central bank certificates | 992 | 1,695 | |||||||||
| Restricted cash and cash equivalents | $ | 5,469 | $ | 6,470 | |||||||
| European government debt securities | 172 | 222 | |||||||||
| Reverse repurchase agreements | 234 | 192 | |||||||||
| Multilateral development bank debt securities | 60 | 137 | |||||||||
| Investments | $ | 466 | $ | 551 | |||||||
| Total | $ | 5,935 | $ | 7,021 | |||||||
| September 30, 2023 | |||||
| (in millions) | |||||
| Commodity and seafood options, futures and forwards | $ | 124 | |||
| Fixed-income options and futures | 2,324 | ||||
| Stock options and futures | 141 | ||||
| Index options and futures | 26 | ||||
| Total | $ | 2,615 | |||
| Nine Months Ended September 30, | |||||||||||
| 2023 | 2022 | ||||||||||
| Commodity and seafood options, futures and forwards | 172,222 | 249,227 | |||||||||
| Fixed-income options and futures | 14,437,712 | 17,233,036 | |||||||||
| Stock options and futures | 15,584,780 | 13,737,846 | |||||||||
| Index options and futures | 30,059,441 | 34,191,390 | |||||||||
| Total | 60,254,155 | 65,411,499 | |||||||||
| Leases | Balance Sheet Classification | September 30, 2023 | December 31, 2022 | |||||||||||||||||
| (in millions) | ||||||||||||||||||||
| Assets: | ||||||||||||||||||||
| Operating lease assets | Operating lease assets | $ | 397 | $ | 444 | |||||||||||||||
| Liabilities: | ||||||||||||||||||||
| Current lease liabilities | Other current liabilities | $ | 57 | $ | 54 | |||||||||||||||
| Non-current lease liabilities | Operating lease liabilities | 412 | 452 | |||||||||||||||||
| Total lease liabilities | $ | 469 | $ | 506 | ||||||||||||||||
| Three Months Ended September 30, | Nine Months Ended September 30, | |||||||||||||||||||||||||
| 2023 | 2022 | 2023 | 2022 | |||||||||||||||||||||||
| (in millions) | ||||||||||||||||||||||||||
| Operating lease cost | $ | 19 | $ | 18 | $ | 68 | $ | 56 | ||||||||||||||||||
| Variable lease cost | 10 | 8 | 32 | 25 | ||||||||||||||||||||||
| Sublease income | (1) | (1) | (1) | (3) | ||||||||||||||||||||||
| Total lease cost | $ | 28 | $ | 25 | $ | 99 | $ | 78 | ||||||||||||||||||
| September 30, 2023 | ||||||||
| (in millions) | ||||||||
| Remainder of 2023 | $ | 17 | ||||||
| 2024 | 71 | |||||||
| 2025 | 62 | |||||||
| 2026 | 51 | |||||||
| 2027 | 48 | |||||||
| 2028+ | 316 | |||||||
| Total lease payments | 565 | |||||||
| Less: interest | (96) | |||||||
| Present value of lease liabilities | $ | 469 | ||||||
| September 30, 2023 | ||||||||
| Weighted-average remaining lease term (in years) | 10.1 | |||||||
| Weighted-average discount rate | 3.7 | % | ||||||
| Nine Months Ended September 30, | |||||||||||
| 2023 | 2022 | ||||||||||
| (in millions) | |||||||||||
| Cash paid for amounts included in the measurement of operating lease liabilities | $ | 57 | $ | 47 | |||||||
| Lease assets obtained in exchange for operating lease liabilities | $ | 8 | $ | 130 | |||||||
| Three Months Ended September 30, | |||||||||||
| 2023 | 2022 | ||||||||||
| (in millions) | |||||||||||
| Income tax provision | $ | 97 | $ | 88 | |||||||
| Effective tax rate | 24.8 | % | 23.0 | % | |||||||
| Nine Months Ended September 30, | |||||||||||
| 2023 | 2022 | ||||||||||
| (in millions) | |||||||||||
| Income tax provision | $ | 262 | $ | 270 | |||||||
| Effective tax rate | 23.3 | % | 23.4 | % | |||||||
| Three Months Ended September 30, | |||||||||||
| 2023 | 2022 | ||||||||||
| Market Platforms | (in millions) | ||||||||||
| Total revenues | $ | 892 | $ | 1,046 | |||||||
| Transaction-based expenses | (511) | (667) | |||||||||
| Revenues less transaction-based expenses | 381 | 379 | |||||||||
| Operating income | 200 | 213 | |||||||||
| Capital Access Platforms | |||||||||||
| Total revenues | 456 | 422 | |||||||||
| Operating income | 254 | 233 | |||||||||
| Anti-Financial Crime | |||||||||||
| Total revenues | 93 | 77 | |||||||||
| Operating income | 31 | 21 | |||||||||
| Corporate Items | |||||||||||
| Total revenues | 10 | 12 | |||||||||
| Operating loss | (54) | (69) | |||||||||
| Consolidated | |||||||||||
| Total revenues | $ | 1,451 | $ | 1,557 | |||||||
| Transaction-based expenses | (511) | (667) | |||||||||
| Revenues less transaction-based expenses | $ | 940 | $ | 890 | |||||||
| Operating income | $ | 431 | $ | 398 | |||||||
| Nine Months Ended September 30, | |||||||||||
| 2023 | 2022 | ||||||||||
| Market Platforms | (in millions) | ||||||||||
| Total revenues | $ | 2,813 | $ | 3,121 | |||||||
| Transaction-based expenses | (1,639) | (1,969) | |||||||||
| Revenues less transaction-based expenses | 1,174 | 1,152 | |||||||||
| Operating income | 634 | 640 | |||||||||
| Capital Access Platforms | |||||||||||
| Total revenues | 1,309 | 1,262 | |||||||||
| Operating income | 720 | 703 | |||||||||
| Anti-Financial Crime | |||||||||||
| Total revenues | 265 | 224 | |||||||||
| Operating income | 85 | 56 | |||||||||
| Corporate Items | |||||||||||
| Total revenues | 30 | 37 | |||||||||
| Operating loss | (214) | (184) | |||||||||
| Consolidated | |||||||||||
| Total revenues | $ | 4,417 | $ | 4,644 | |||||||
| Transaction-based expenses | (1,639) | (1,969) | |||||||||
| Revenues less transaction-based expenses | $ | 2,778 | $ | 2,675 | |||||||
| Operating income | $ | 1,225 | $ | 1,215 | |||||||
| Three Months Ended September 30, | |||||||||||
| 2023 | 2022 | ||||||||||
| (in millions) | |||||||||||
| Revenues - divested businesses | $ | 10 | $ | 12 | |||||||
| Expenses: | |||||||||||
| Amortization expense of acquired intangible assets | $ | 37 | $ | 38 | |||||||
| Merger and strategic initiatives expense | 4 | 14 | |||||||||
| Restructuring charges | 17 | — | |||||||||
| Expenses - divested businesses | 4 | 6 | |||||||||
| Other | 2 | 23 | |||||||||
| Total expenses | 64 | 81 | |||||||||
| Operating loss | $ | (54) | $ | (69) | |||||||
| Nine Months Ended September 30, | |||||||||||
| 2023 | 2022 | ||||||||||
| (in millions) | |||||||||||
| Revenues - divested businesses | $ | 30 | $ | 37 | |||||||
| Expenses: | |||||||||||
| Amortization expense of acquired intangible assets | 112 | 116 | |||||||||
| Merger and strategic initiatives expense | 51 | 41 | |||||||||
| Restructuring charges | 49 | — | |||||||||
| Lease asset impairments | 24 | — | |||||||||
| Extinguishment of debt | — | 16 | |||||||||
| Expenses - divested businesses | 16 | 20 | |||||||||
| Other | (8) | 28 | |||||||||
| Total expenses | 244 | 221 | |||||||||
| Operating loss | $ | (214) | $ | (184) | |||||||
| Three Months Ended September 30, 2023 |
Nine Months Ended September 30, 2023 |
Total Program Costs Incurred | |||||||||||||||
| (in millions) | |||||||||||||||||
| Asset impairment charges | $ | — | $ | 12 | $ | 20 | |||||||||||
| Consulting services | 9 | 20 | 23 | ||||||||||||||
| Employee-related costs | 4 | 10 | 13 | ||||||||||||||
| Other | 4 | 7 | 8 | ||||||||||||||
| Total restructuring charges | $ | 17 | $ | 49 | $ | 64 | |||||||||||
| Three Months Ended September 30, | Percentage Change | ||||||||||||||||
| 2023 | 2022 | ||||||||||||||||
| (in millions, except per share amounts) | |||||||||||||||||
| Revenues less transaction-based expenses | $ | 940 | $ | 890 | 5.6 | % | |||||||||||
| Operating expenses | 509 | 492 | 3.5 | % | |||||||||||||
| Operating income | 431 | 398 | 8.3 | % | |||||||||||||
| Net income attributable to Nasdaq | $ | 294 | $ | 294 | — | % | |||||||||||
| Diluted earnings per share | $ | 0.60 | $ | 0.59 | 1.7 | % | |||||||||||
| Cash dividends declared per common share | $ | 0.22 | $ | 0.20 | 10.0 | % | |||||||||||
| Nine Months Ended September 30, | Percentage Change | ||||||||||||||||
| 2023 | 2022 | ||||||||||||||||
| (in millions, except per share amounts) | |||||||||||||||||
| Revenues less transaction-based expenses | $ | 2,778 | $ | 2,675 | 3.9 | % | |||||||||||
| Operating expenses | 1,553 | 1,460 | 6.4 | % | |||||||||||||
| Operating income | 1,225 | 1,215 | 0.8 | % | |||||||||||||
| Net income attributable to Nasdaq | $ | 862 | $ | 884 | (2.5) | % | |||||||||||
| Diluted earnings per share | $ | 1.74 | $ | 1.77 | (1.7) | % | |||||||||||
| Cash dividends declared per common share | $ | 0.64 | $ | 0.58 | 10.3 | % | |||||||||||
▪ |
Market technology support and SaaS subscription contracts as well as trade management services contracts, excluding one-time service requests. |
|||||||
▪ |
Proprietary market data subscriptions and annual listing fees within our Data & Listing Services business, index data subscriptions and guaranteed minimum on futures contracts within our Index business and subscription contracts under our Workflow & Insights business. |
|||||||
▪ |
Anti-Financial Crime support and SaaS subscription contracts. |
|||||||
| Three Months Ended September 30, | Percentage Change | |||||||||||||||||||
| 2023 | 2022 | |||||||||||||||||||
| (in millions) | ||||||||||||||||||||
| Market Platforms | $ | 892 | $ | 1,046 | (14.7) | % | ||||||||||||||
| Capital Access Platforms | 456 | 422 | 8.1 | % | ||||||||||||||||
| Anti-Financial Crime | 93 | 77 | 20.8 | % | ||||||||||||||||
| Other revenues | 10 | 12 | (16.7) | % | ||||||||||||||||
| Total revenues | $ | 1,451 | $ | 1,557 | (6.8) | % | ||||||||||||||
| Transaction rebates | (447) | (494) | (9.5) | % | ||||||||||||||||
| Brokerage, clearance and exchange fees | (64) | (173) | (63.0) | % | ||||||||||||||||
| Total revenues less transaction-based expenses | $ | 940 | $ | 890 | 5.6 | % | ||||||||||||||
| Nine Months Ended September 30, | Percentage Change | |||||||||||||||||||
| 2023 | 2022 | |||||||||||||||||||
| (in millions) | ||||||||||||||||||||
| Market Platforms | $ | 2,813 | $ | 3,121 | (9.9) | % | ||||||||||||||
| Capital Access Platforms | 1,309 | 1,262 | 3.7 | % | ||||||||||||||||
| Anti-Financial Crime | 265 | 224 | 18.3 | % | ||||||||||||||||
| Other revenues | 30 | 37 | (18.9) | % | ||||||||||||||||
| Total revenues | 4,417 | 4,644 | (4.9) | % | ||||||||||||||||
| Transaction rebates | (1,377) | (1,605) | (14.2) | % | ||||||||||||||||
| Brokerage, clearance and exchange fees | (262) | (364) | (28.0) | % | ||||||||||||||||
| Total revenues less transaction-based expenses | $ | 2,778 | $ | 2,675 | 3.9 | % | ||||||||||||||
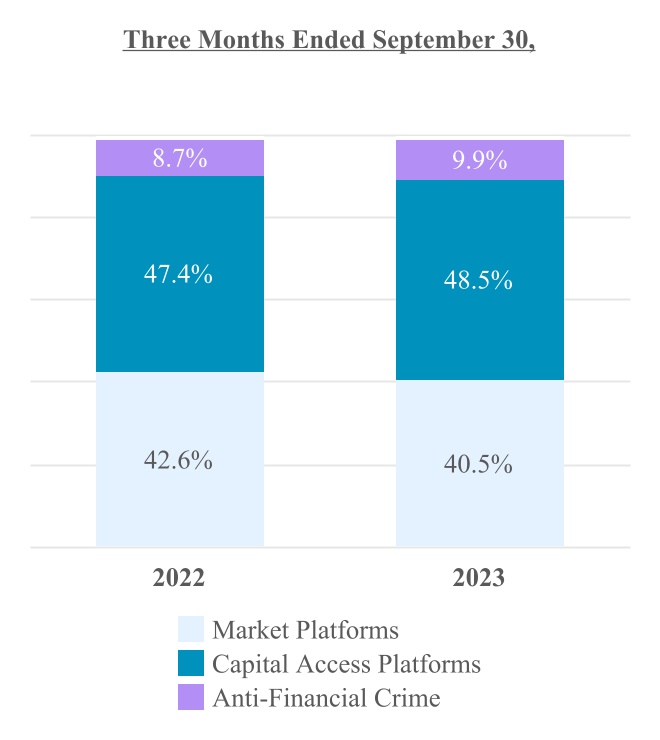
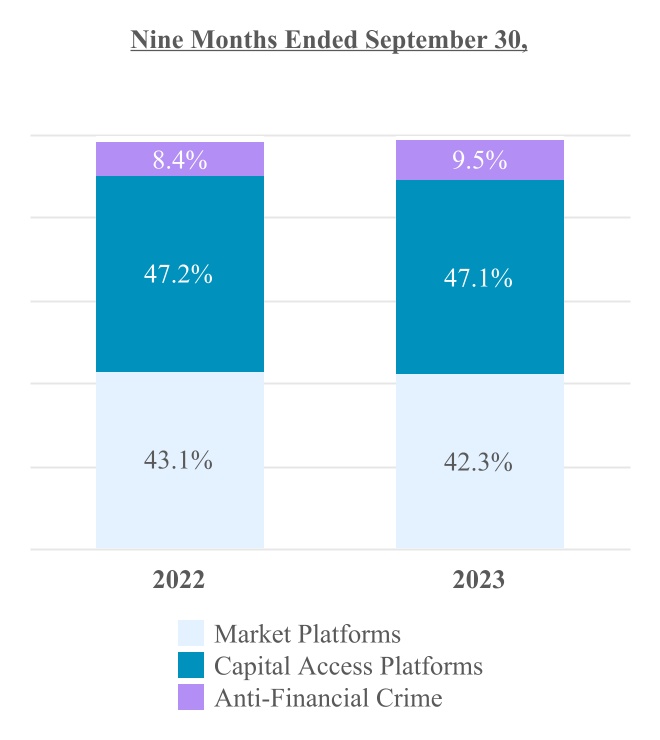 In the charts above, Other revenues, which make up approximately 1% for both periods presented, are not shown.
| Three Months Ended September 30, | Percentage Change | ||||||||||||||||
| 2023 | 2022 | ||||||||||||||||
| (in millions) | |||||||||||||||||
| Trading Services | $ | 747 | $ | 906 | (17.5) | % | |||||||||||
| Marketplace Technology | 145 | 140 | 3.6 | % | |||||||||||||
| Total Market Platforms | $ | 892 | $ | 1,046 | (14.7) | % | |||||||||||
| Transaction-based expenses: | |||||||||||||||||
| Transaction rebates | (447) | (494) | (9.5) | % | |||||||||||||
Brokerage, clearance and exchange fees |
(64) | (173) | (63.0) | % | |||||||||||||
| Total Market Platforms, net | $ | 381 | $ | 379 | 0.5 | % | |||||||||||
| Nine Months Ended September 30, | Percentage Change | ||||||||||||||||
| 2023 | 2022 | ||||||||||||||||
| (in millions) | |||||||||||||||||
| Trading Services | $ | 2,378 | $ | 2,712 | (12.3) | % | |||||||||||
| Marketplace Technology | 435 | 409 | 6.4 | % | |||||||||||||
| Total Market Platforms | $ | 2,813 | $ | 3,121 | (9.9) | % | |||||||||||
| Transaction-based expenses: | |||||||||||||||||
| Transaction rebates | (1,377) | (1,605) | (14.2) | % | |||||||||||||
Brokerage, clearance and exchange fees |
(262) | (364) | (28.0) | % | |||||||||||||
| Total Market Platforms, net | $ | 1,174 | $ | 1,152 | 1.9 | % | |||||||||||
| Three Months Ended September 30, | Percentage Change | ||||||||||||||||
| 2023 | 2022 | ||||||||||||||||
| (in millions) | |||||||||||||||||
| U.S. Equity Derivative Trading | $ | 92 | $ | 92 | — | % | |||||||||||
| Cash Equity Trading | 93 | 94 | (1.1) | % | |||||||||||||
| U.S. Tape plans | 35 | 36 | (2.8) | % | |||||||||||||
| Other | 16 | 17 | (5.9) | % | |||||||||||||
| Trading Services, net | $ | 236 | $ | 239 | (1.3) | % | |||||||||||
| Nine Months Ended September 30, | Percentage Change | ||||||||||||||||
| 2023 | 2022 | ||||||||||||||||
| (in millions) | |||||||||||||||||
| U.S. Equity Derivative Trading | $ | 283 | $ | 275 | 2.9 | % | |||||||||||
| Cash Equity Trading | 299 | 300 | (0.3) | % | |||||||||||||
| U.S. Tape plans | 107 | 113 | (5.3) | % | |||||||||||||
| Other | 50 | 55 | (9.1) | % | |||||||||||||
| Trading Services, net | $ | 739 | $ | 743 | (0.5) | % | |||||||||||
| Three Months Ended September 30, | Percentage Change | ||||||||||||||||
| 2023 | 2022 | ||||||||||||||||
| (in millions) | |||||||||||||||||
| U.S. Equity Derivative Trading Revenues | $ | 316 | $ | 316 | — | % | |||||||||||
Section 31 fees |
9 | 26 | (65.4) | % | |||||||||||||
| Transaction-based expenses: | |||||||||||||||||
| Transaction rebates | (223) | (222) | 0.5 | % | |||||||||||||
Section 31 fees |
(9) | (26) | (65.4) | % | |||||||||||||
| Brokerage and clearance fees | (1) | (2) | (50.0) | % | |||||||||||||
| U.S. Equity derivative trading revenues, net | $ | 92 | $ | 92 | — | % | |||||||||||
| Nine Months Ended September 30, | Percentage Change | ||||||||||||||||
| 2023 | 2022 | ||||||||||||||||
| (in millions) | |||||||||||||||||
| U.S. Equity Derivative Trading Revenues | $ | 940 | $ | 938 | 0.2 | % | |||||||||||
Section 31 fees |
43 | 46 | (6.5) | % | |||||||||||||
| Transaction-based expenses: | |||||||||||||||||
| Transaction rebates | (654) | (660) | (0.9) | % | |||||||||||||
Section 31 fees |
(43) | (46) | (6.5) | % | |||||||||||||
| Brokerage and clearance fees | (3) | (3) | — | % | |||||||||||||
| U.S. Equity derivative trading revenues, net | $ | 283 | $ | 275 | 2.9 | % | |||||||||||
| Three Months Ended September 30, | |||||||||||
| 2023 | 2022 | ||||||||||
| U.S. equity options | |||||||||||
| Total industry average daily volume (in millions) | 39.6 | 37.0 | |||||||||
| Nasdaq PHLX matched market share | 11.0 | % | 11.2 | % | |||||||
| The Nasdaq Options Market matched market share | 5.6 | % | 8.3 | % | |||||||
| Nasdaq BX Options matched market share | 4.4 | % | 3.9 | % | |||||||
| Nasdaq ISE Options matched market share | 5.7 | % | 5.5 | % | |||||||
| Nasdaq GEMX Options matched market share | 3.0 | % | 2.1 | % | |||||||
| Nasdaq MRX Options matched market share | 2.0 | % | 1.6 | % | |||||||
| Total matched market share executed on Nasdaq’s exchanges | 31.7 | % | 32.6 | % | |||||||
| Nine Months Ended September 30, | |||||||||||
| 2023 | 2022 | ||||||||||
| U.S. equity options | |||||||||||
| Total industry average daily volume (in millions) | 40.4 | 37.9 | |||||||||
| Nasdaq PHLX matched market share | 11.2 | % | 11.4 | % | |||||||
| The Nasdaq Options Market matched market share | 6.4 | % | 8.3 | % | |||||||
| Nasdaq BX Options matched market share | 3.6 | % | 2.7 | % | |||||||
| Nasdaq ISE Options matched market share | 5.8 | % | 5.6 | % | |||||||
| Nasdaq GEMX Options matched market share | 2.3 | % | 2.3 | % | |||||||
| Nasdaq MRX Options matched market share | 1.7 | % | 1.7 | % | |||||||
| Total matched market share executed on Nasdaq’s exchanges | 31.0 | % | 32.0 | % | |||||||
| Three Months Ended September 30, | Percentage Change | ||||||||||||||||
| 2023 | 2022 | ||||||||||||||||
| (in millions) | |||||||||||||||||
| Cash Equity Trading Revenues | $ | 316 | $ | 365 | (13.4) | % | |||||||||||
Section 31 fees |
50 | 140 | (64.3) | % | |||||||||||||
| Transaction-based expenses: | |||||||||||||||||
| Transaction rebates | (219) | (266) | (17.7) | % | |||||||||||||
Section 31 fees |
(50) | (140) | (64.3) | % | |||||||||||||
| Brokerage and clearance fees | (4) | (5) | (20.0) | % | |||||||||||||
| Cash equity trading revenues, net | $ | 93 | $ | 94 | (1.1) | % | |||||||||||
| Nine Months Ended September 30, | Percentage Change | ||||||||||||||||
| 2023 | 2022 | ||||||||||||||||
| (in millions) | |||||||||||||||||
| Cash Equity Trading Revenues | $ | 1,022 | $ | 1,240 | (17.6) | % | |||||||||||
Section 31 fees |
201 | 296 | (32.1) | % | |||||||||||||
| Transaction-based expenses: | |||||||||||||||||
| Transaction rebates | (708) | (921) | (23.1) | % | |||||||||||||
Section 31 fees |
(201) | (296) | (32.1) | % | |||||||||||||
| Brokerage and clearance fees | (15) | (19) | (21.1) | % | |||||||||||||
| Cash equity trading revenues, net | $ | 299 | $ | 300 | (0.3) | % | |||||||||||
| Three Months Ended September 30, | |||||||||||
| 2023 | 2022 | ||||||||||
| Total U.S.-listed securities | |||||||||||
| Total industry average daily share volume (in billions) | 10.4 | 10.9 | |||||||||
| Matched share volume (in billions) | 106.7 | 119.9 | |||||||||
| The Nasdaq Stock Market matched market share | 15.5 | % | 15.9 | % | |||||||
| Nasdaq BX matched market share | 0.4 | % | 0.5 | % | |||||||
| Nasdaq PSX matched market share | 0.3 | % | 0.8 | % | |||||||
| Total matched market share executed on Nasdaq’s exchanges | 16.2 | % | 17.2 | % | |||||||
| Market share reported to the FINRA/Nasdaq Trade Reporting Facility | 40.2 | % | 36.9 | % | |||||||
| Total market share | 56.4 | % | 54.1 | % | |||||||
| Nasdaq Nordic and Nasdaq Baltic securities | |||||||||||
| Average daily number of equity trades executed on Nasdaq’s exchanges | 556,257 | 784,672 | |||||||||
| Total average daily value of shares traded (in billions) | $ | 3.6 | $ | 4.3 | |||||||
| Total market share executed on Nasdaq’s exchanges | 71.6 | % | 71.1 | % | |||||||
| Nine Months Ended September 30, | |||||||||||
| 2023 | 2022 | ||||||||||
| Total U.S.-listed securities | |||||||||||
| Total industry average daily share volume (in billions) | 11.0 | 12.1 | |||||||||
| Matched share volume (in billions) | 342.2 | 401.2 | |||||||||
| The Nasdaq Stock Market matched market share | 15.9 | % | 16.3 | % | |||||||
| Nasdaq BX matched market share | 0.4 | % | 0.5 | % | |||||||
| Nasdaq PSX matched market share | 0.4 | % | 0.8 | % | |||||||
| Total matched market share executed on Nasdaq’s exchanges | 16.7 | % | 17.6 | % | |||||||
| Market share reported to the FINRA/Nasdaq Trade Reporting Facility | 35.2 | % | 34.8 | % | |||||||
| Total market share | 51.9 | % | 52.4 | % | |||||||
| Nasdaq Nordic and Nasdaq Baltic securities | |||||||||||
| Average daily number of equity trades executed on Nasdaq’s exchanges | 676,132 | 953,090 | |||||||||
| Total average daily value of shares traded (in billions) | $ | 4.5 | $ | 5.6 | |||||||
| Total market share executed on Nasdaq’s exchanges | 70.6 | % | 72.1 | % | |||||||
| Three Months Ended September 30, | Percentage Change | ||||||||||||||||
| 2023 | 2022 | ||||||||||||||||
| (in millions) | |||||||||||||||||
| U.S. Tape plans | $ | 35 | $ | 36 | (2.8) | % | |||||||||||
| Nine Months Ended September 30, | Percentage Change | ||||||||||||||||
| 2023 | 2022 | ||||||||||||||||
| (in millions) | |||||||||||||||||
| U.S. Tape plans | $ | 107 | $ | 113 | (5.3) | % | |||||||||||
| Three Months Ended September 30, | Percentage Change | ||||||||||||||||
| 2023 | 2022 | ||||||||||||||||
| (in millions) | |||||||||||||||||
| Other | $ | 16 | $ | 17 | (5.9) | % | |||||||||||
| Nine Months Ended September 30, | Percentage Change | ||||||||||||||||
| 2023 | 2022 | ||||||||||||||||
| (in millions) | |||||||||||||||||
| Other | $ | 50 | $ | 55 | (9.1) | % | |||||||||||
| Three Months Ended September 30, | |||||||||||
| 2023 | 2022 | ||||||||||
| Nasdaq Nordic and Nasdaq Baltic options and futures | |||||||||||
| Total average daily volume of options and futures contracts | 245,986 | 267,137 | |||||||||
| Nine Months Ended September 30, | |||||||||||
| 2023 | 2022 | ||||||||||
| Nasdaq Nordic and Nasdaq Baltic options and futures | |||||||||||
| Total average daily volume of options and futures contracts | 298,785 | 303,095 | |||||||||
| Three Months Ended September 30, | Percentage Change | ||||||||||||||||
| 2023 | 2022 | ||||||||||||||||
| (in millions) | |||||||||||||||||
| Marketplace Technology | $ | 145 | $ | 140 | 3.6 | % | |||||||||||
| Nine Months Ended September 30, | Percentage Change | ||||||||||||||||
| 2023 | 2022 | ||||||||||||||||
| (in millions) | |||||||||||||||||
| Marketplace Technology | $ | 435 | $ | 409 | 6.4 | % | |||||||||||
| As of or Three Months Ended September 30, |
||||||||||||||
| 2023 | 2022 | |||||||||||||
| (in millions) | ||||||||||||||
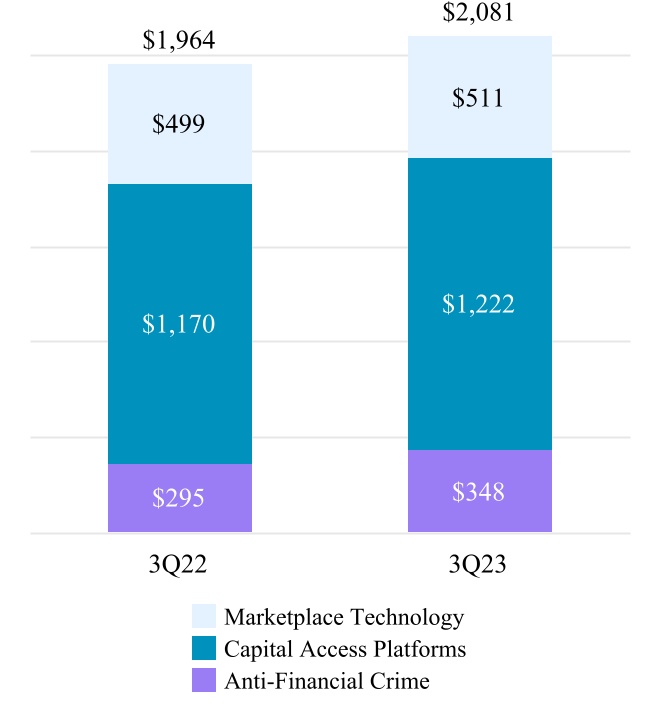
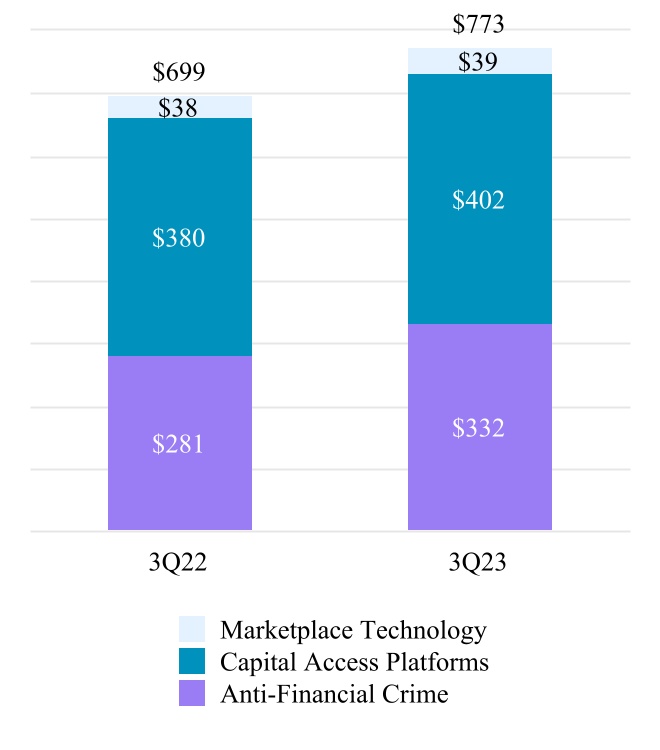
| ARR | $ | 511 | $ | 499 | ||||||||||
| Quarterly annualized SaaS revenues | 39 | 38 | ||||||||||||
| Order intake | 33 | 30 | ||||||||||||
| Nine Months Ended September 30, | ||||||||||||||
| 2023 | 2022 | |||||||||||||
| (in millions) | ||||||||||||||
| Order intake | 155 | 157 | ||||||||||||
| Three Months Ended September 30, | Percentage Change | ||||||||||||||||
| 2023 | 2022 | ||||||||||||||||
| (in millions) | |||||||||||||||||
| Data & Listing Services | $ | 188 | $ | 179 | 5.0 | % | |||||||||||
| Index | 144 | 125 | 15.2 | % | |||||||||||||
| Workflow & Insights | 124 | 118 | 5.1 | % | |||||||||||||
| Total Capital Access Platforms | $ | 456 | $ | 422 | 8.1 | % | |||||||||||
| Nine Months Ended September 30, | Percentage Change | ||||||||||||||||
| 2023 | 2022 | ||||||||||||||||
| (in millions) | |||||||||||||||||
| Data & Listing Services | $ | 559 | $ | 545 | 2.6 | % | |||||||||||
| Index | 383 | 370 | 3.5 | % | |||||||||||||
| Workflow & Insights | 367 | 347 | 5.8 | % | |||||||||||||
| Total Capital Access Platforms | $ | 1,309 | $ | 1,262 | 3.7 | % | |||||||||||
| As of or Nine Months Ended September 30, |
|||||||||||
| 2023 | 2022 | ||||||||||
| (in millions) | |||||||||||
| ARR | $ | 1,222 | $ | 1,170 | |||||||
| Quarterly annualized SaaS revenues | 402 | 380 | |||||||||
| Three Months Ended September 30, | ||||||||||||||
| 2023 | 2022 | |||||||||||||
| IPOs | ||||||||||||||
| The Nasdaq Stock Market | 39 | 35 | ||||||||||||
| Exchanges that comprise Nasdaq Nordic and Nasdaq Baltic | — | 3 | ||||||||||||
| Total new listings | ||||||||||||||
| The Nasdaq Stock Market | 87 | 98 | ||||||||||||
| Exchanges that comprise Nasdaq Nordic and Nasdaq Baltic | 3 | 9 | ||||||||||||
| Nine Months Ended September 30, | ||||||||||||||
| 2023 | 2022 | |||||||||||||
| IPOs | ||||||||||||||
| The Nasdaq Stock Market | 102 | 143 | ||||||||||||
| Exchanges that comprise Nasdaq Nordic and Nasdaq Baltic | 3 | 33 | ||||||||||||
| Total new listings | ||||||||||||||
| The Nasdaq Stock Market | 230 | 292 | ||||||||||||
| Exchanges that comprise Nasdaq Nordic and Nasdaq Baltic | 16 | 53 | ||||||||||||
| Number of listed companies | ||||||||||||||
| The Nasdaq Stock Market | 4,086 | 4,296 | ||||||||||||
| Exchanges that comprise Nasdaq Nordic and Nasdaq Baltic | 1,236 | 1,253 | ||||||||||||
| As of or Three Months Ended September 30, |
||||||||||||||
| 2023 | 2022 | |||||||||||||
| Number of licensed ETPs | 393 | 374 | ||||||||||||
| TTM change in period end ETP AUM tracking Nasdaq indexes (in billions) | ||||||||||||||
| Beginning balance | $ | 311 | $ | 361 | ||||||||||
| Net appreciation (depreciation) | 78 | (106) | ||||||||||||
| Net impact of ETP sponsor switches | (2) | — | ||||||||||||
| Net inflows | 24 | 56 | ||||||||||||
| Ending balance | $ | 411 | $ | 311 | ||||||||||
| Quarterly average ETP AUM tracking Nasdaq indexes (in billions) | $ | 423 | $ | 346 | ||||||||||
| Three Months Ended September 30, | Percentage Change | ||||||||||||||||
| 2023 | 2022 | ||||||||||||||||
| (in millions) | |||||||||||||||||
| Anti-Financial Crime | $ | 93 | $ | 77 | 20.8 | % | |||||||||||
| Nine Months Ended September 30, | Percentage Change | ||||||||||||||||
| 2023 | 2022 | ||||||||||||||||
| (in millions) | |||||||||||||||||
| Anti-Financial Crime | $ | 265 | $ | 224 | 18.3 | % | |||||||||||
| As of or Three Months Ended September 30, |
||||||||||||||
| 2023 | 2022 | |||||||||||||
| (in millions) | ||||||||||||||
| ARR | $ | 348 | $ | 295 | ||||||||||
| Total signed ARR | 381 | 320 | ||||||||||||
| Quarterly annualized SaaS revenues | 332 | 281 | ||||||||||||
| Three Months Ended September 30, | Percentage Change | ||||||||||||||||
| 2023 | 2022 | ||||||||||||||||
| (in millions) | |||||||||||||||||
| Compensation and benefits | $ | 260 | $ | 249 | 4.4 | % | |||||||||||
| Professional and contract services | 31 | 34 | (8.8) | % | |||||||||||||
| Computer operations and data communications | 58 | 50 | 16.0 | % | |||||||||||||
| Occupancy | 28 | 25 | 12.0 | % | |||||||||||||
| General, administrative and other | 26 | 38 | (31.6) | % | |||||||||||||
| Marketing and advertising | 12 | 10 | 20.0 | % | |||||||||||||
| Depreciation and amortization | 64 | 63 | 1.6 | % | |||||||||||||
| Regulatory | 9 | 9 | — | % | |||||||||||||
| Merger and strategic initiatives | 4 | 14 | (71.4) | % | |||||||||||||
| Restructuring charges | 17 | — | N/M | ||||||||||||||
| Total operating expenses | $ | 509 | $ | 492 | 3.5 | % | |||||||||||
| Nine Months Ended September 30, | Percentage Change | ||||||||||||||||
| 2023 | 2022 | ||||||||||||||||
| (in millions) | |||||||||||||||||
| Compensation and benefits | $ | 777 | $ | 750 | 3.6 | % | |||||||||||
| Professional and contract services | 92 | 97 | (5.2) | % | |||||||||||||
| Computer operations and data communications | 168 | 150 | 12.0 | % | |||||||||||||
| Occupancy | 99 | 78 | 26.9 | % | |||||||||||||
| General, administrative and other | 62 | 94 | (34.0) | % | |||||||||||||
| Marketing and advertising | 30 | 31 | (3.2) | % | |||||||||||||
| Depreciation and amortization | 198 | 195 | 1.5 | % | |||||||||||||
| Regulatory | 27 | 24 | 12.5 | % | |||||||||||||
| Merger and strategic initiatives | 51 | 41 | 24.4 | % | |||||||||||||
| Restructuring charges | 49 | — | N/M | ||||||||||||||
| Total operating expenses | $ | 1,553 | $ | 1,460 | 6.4 | % | |||||||||||
| Three Months Ended September 30, | Percentage Change | ||||||||||||||||
| 2023 | 2022 | ||||||||||||||||
| (in millions) | |||||||||||||||||
| Interest income | $ | 72 | $ | 2 | 3,500.0% | ||||||||||||
| Interest expense | (101) | (32) | 215.6 | % | |||||||||||||
| Net interest expense | (29) | (30) | (3.3) | % | |||||||||||||
Other income |
1 | 6 | (83.3) | % | |||||||||||||
| Net income (loss) from unconsolidated investees | (12) | 8 | (250.0) | % | |||||||||||||
| Total non-operating expense | $ | (40) | $ | (16) | 150.0 | % | |||||||||||
| Nine Months Ended September 30, | Percentage Change | ||||||||||||||||
| 2023 | 2022 | ||||||||||||||||
| (in millions) | |||||||||||||||||
| Interest income | $ | 86 | $ | 3 | 2,766.7 | % | |||||||||||
| Interest expense | (174) | (96) | 81.3 | % | |||||||||||||
| Net interest expense | (88) | (93) | (5.4) | % | |||||||||||||
| Other income (loss) | (6) | 8 | (175.0) | % | |||||||||||||
Net income (loss) from unconsolidated investees |
(8) | 23 | (134.8) | % | |||||||||||||
| Total non-operating expenses | $ | (102) | $ | (62) | 64.5 | % | |||||||||||
| Three Months Ended September 30, | Percentage Change | ||||||||||||||||
| 2023 | 2022 | ||||||||||||||||
| (in millions) | |||||||||||||||||
| Interest expense on debt | $ | 97 | $ | 30 | 223.3 | % | |||||||||||
| Accretion of debt issuance costs and debt discount | 3 | 1 | 200.0 | % | |||||||||||||
| Other fees | 1 | 1 | — | % | |||||||||||||
| Interest expense | $ | 101 | $ | 32 | 215.6 | % | |||||||||||
| Nine Months Ended September 30, | Percentage Change | ||||||||||||||||
| 2023 | 2022 | ||||||||||||||||
| (in millions) | |||||||||||||||||
| Interest expense on debt | $ | 166 | $ | 89 | 86.5 | % | |||||||||||
| Accretion of debt issuance costs and debt discount | 6 | 5 | 20.0 | % | |||||||||||||
| Other fees | 2 | 2 | — | % | |||||||||||||
| Interest expense | $ | 174 | $ | 96 | 81.3 | % | |||||||||||
| Three Months Ended September 30, | Percentage Change | ||||||||||||||||
| 2023 | 2022 | ||||||||||||||||
| ($ in millions) | |||||||||||||||||
Income tax provision |
$ | 97 | $ | 88 | 10.2 | % | |||||||||||
Effective tax rate |
24.8 | % | 23.0 | % | |||||||||||||
| Nine Months Ended September 30, | Percentage Change | ||||||||||||||||
| 2023 | 2022 | ||||||||||||||||
| (in millions) | |||||||||||||||||
| Income tax provision | $ | 262 | $ | 270 | (3.0) | % | |||||||||||
Effective tax rate |
23.3 | % | 23.4 | % | |||||||||||||
| Three Months Ended September 30, | |||||||||||
| 2023 | 2022 | ||||||||||
| (in millions, except per share amounts) | |||||||||||
| U.S. GAAP net income attributable to Nasdaq | $ | 294 | $ | 294 | |||||||
| Non-GAAP adjustments: | |||||||||||
| Amortization expense of acquired intangible assets | 37 | 38 | |||||||||
| Merger and strategic initiatives expense | 4 | 14 | |||||||||
| Restructuring charges | 17 | — | |||||||||
| Net loss (income) from unconsolidated investees | 12 | (8) | |||||||||
Other income |
9 | 17 | |||||||||
| Total non-GAAP adjustments | 79 | 61 | |||||||||
| Total non-GAAP tax adjustments | (24) | (20) | |||||||||
| Total non-GAAP adjustments, net of tax | 55 | 41 | |||||||||
| Non-GAAP net income attributable to Nasdaq | $ | 349 | $ | 335 | |||||||
| U.S. GAAP effective tax rate | 24.8 | % | 23.0 | % | |||||||
| Total adjustments from non-GAAP tax rate | 0.9 | % | 1.4 | % | |||||||
| Non-GAAP effective tax rate | 25.7 | % | 24.4 | % | |||||||
| Weighted-average common shares outstanding for diluted earnings per share | 494.1 | 496.3 | |||||||||
| U.S. GAAP diluted earnings per share | $ | 0.60 | $ | 0.59 | |||||||
| Total adjustments from non-GAAP net income | 0.11 | 0.09 | |||||||||
| Non-GAAP diluted earnings per share | $ | 0.71 | $ | 0.68 | |||||||
| Nine Months Ended September 30, | |||||||||||
| 2023 | 2022 | ||||||||||
| (in millions, except per share amounts) | |||||||||||
| U.S. GAAP net income attributable to Nasdaq | $ | 862 | $ | 884 | |||||||
| Non-GAAP adjustments: | |||||||||||
| Amortization expense of acquired intangible assets | 112 | 116 | |||||||||
| Merger and strategic initiatives expense | 51 | 41 | |||||||||
| Restructuring charges | 49 | — | |||||||||
| Lease asset impairments | 24 | — | |||||||||
| Extinguishment of debt | — | 16 | |||||||||
Net loss (income) from unconsolidated investees |
8 | (23) | |||||||||
Other income |
7 | 19 | |||||||||
| Total non-GAAP adjustments | 251 | 169 | |||||||||
| Total non-GAAP tax adjustments | (76) | (48) | |||||||||
| Total non-GAAP adjustments, net of tax | 175 | 121 | |||||||||
| Non-GAAP net income attributable to Nasdaq | $ | 1,037 | $ | 1,005 | |||||||
| U.S. GAAP effective tax rate | 23.3 | % | 23.4 | % | |||||||
| Total adjustments from non-GAAP tax rate | 1.3 | % | 0.7 | % | |||||||
| Non-GAAP effective tax rate | 24.6 | % | 24.1 | % | |||||||
| Weighted-average common shares outstanding for diluted earnings per share | 494.2 | 498.2 | |||||||||
| U.S. GAAP diluted earnings per share | $ | 1.74 | $ | 1.77 | |||||||
| Total adjustments from non-GAAP net income | 0.36 | 0.25 | |||||||||
| Non-GAAP diluted earnings per share | $ | 2.10 | $ | 2.02 | |||||||
| September 30, 2023 | December 31, 2022 | |||||||||||||
| (in millions) | ||||||||||||||
| Cash and cash equivalents | $ | 5,340 | $ | 502 | ||||||||||
| Financial investments | 272 | 181 | ||||||||||||
| Total financial assets | $ | 5,612 | $ | 683 | ||||||||||
| Nine Months Ended September 30, | |||||||||||
| 2023 | 2022 | ||||||||||
| Net cash provided by (used in): | (in millions) | ||||||||||
| Operating activities | $ | 1,279 | $ | 1,212 | |||||||
| Investing activities | (158) | (25) | |||||||||
| Financing activities | 3,019 | 4,275 | |||||||||
| Effect of exchange rate changes on cash and cash equivalents and restricted cash and cash equivalents | (300) | (1,724) | |||||||||
Net increase in cash and cash equivalents and restricted cash and cash equivalents |
3,840 | 3,738 | |||||||||
| Cash and cash equivalents, restricted cash and cash equivalents at beginning of period | 6,994 | 5,496 | |||||||||
| Cash and cash equivalents, restricted cash and cash equivalents at end of period | $ | 10,834 | $ | 9,234 | |||||||
| Reconciliation of Cash, Cash Equivalents and Restricted Cash and Cash Equivalents | |||||||||||
| Cash and cash equivalents | $ | 5,340 | $ | 301 | |||||||
| Restricted cash and cash equivalents | 25 | 51 | |||||||||
| Restricted cash and cash equivalents (default funds and margin deposits) | 5,469 | 8,882 | |||||||||
| Total | $ | 10,834 | $ | 9,234 | |||||||
| 2023 | 2022 | ||||||||||
| First quarter | $ | 0.20 | $ | 0.18 | |||||||
| Second quarter | 0.22 | 0.20 | |||||||||
| Third quarter | 0.22 | 0.20 | |||||||||
| Total | $ | 0.64 | $ | 0.58 | |||||||
| Maturity Date | September 30, 2023 | December 31, 2022 | ||||||||||||||||||
| (in millions) | ||||||||||||||||||||
| Short-term debt: | ||||||||||||||||||||
| Commercial paper | $ | — | $ | 664 | ||||||||||||||||
Total short-term debt |
$ | — | $ | 664 | ||||||||||||||||
Long-term debt - senior unsecured notes: |
||||||||||||||||||||
2025 Notes |
May 2025 | 497 | — | |||||||||||||||||
2026 Notes |
June 2026 | 499 | 498 | |||||||||||||||||
2028 Notes |
May 2028 | 991 | — | |||||||||||||||||
| 2029 Notes | March 2029 | 630 | 637 | |||||||||||||||||
| 2030 Notes | February 2030 | 630 | 637 | |||||||||||||||||
| 2031 Notes | January 2031 | 644 | 644 | |||||||||||||||||
2032 Notes |
February 2032 | 784 | — | |||||||||||||||||
| 2033 Notes | July 2033 | 645 | 653 | |||||||||||||||||
2034 Notes |
February 2034 | 1,239 | — | |||||||||||||||||
| 2040 Notes | December 2040 | 644 | 644 | |||||||||||||||||
| 2050 Notes | April 2050 | 487 | 486 | |||||||||||||||||
| 2052 Notes | March 2052 | 541 | 541 | |||||||||||||||||
| 2053 Notes | August 2053 | 738 | — | |||||||||||||||||
| 2063 Notes | June 2063 | 738 | — | |||||||||||||||||
2022 Revolving Credit Agreement |
December 2027 | (4) | (5) | |||||||||||||||||
Total long-term debt |
$ | 9,703 | $ | 4,735 | ||||||||||||||||
Total debt obligations |
$ | 9,703 | $ | 5,399 | ||||||||||||||||
| Payments Due by Period | |||||||||||||||||
| (in millions) | Total | <1 year | 1-3 years | 3-5 years | 5+ years | ||||||||||||
| Debt obligation by contractual maturity | $ | 16,001 | $ | 386 | $ | 1,740 | $ | 1,673 | $ | 12,202 | |||||||
| Operating lease obligations | 636 | 80 | 136 | 114 | 306 | ||||||||||||
| Purchase obligations | 421 | 86 | 107 | 89 | 139 | ||||||||||||
| Total | $ | 17,058 | $ | 552 | $ | 1,983 | $ | 1,876 | $ | 12,647 | |||||||
| Euro | Swedish Krona | Canadian Dollar | Other Foreign Currencies | U.S. Dollar | Total | |||||||||||||||||||||||||||||||||
| (in millions, except currency rate) | ||||||||||||||||||||||||||||||||||||||
| Three Months Ended September 30, 2023 | ||||||||||||||||||||||||||||||||||||||
| Average foreign currency rate to the U.S. dollar | 1.088 | 0.093 | 0.746 | # | N/A | N/A | ||||||||||||||||||||||||||||||||
| Percentage of revenues less transaction-based expenses | 6.1% | 3.8% | 0.9% | 3.1% | 86.1% | 100.0% | ||||||||||||||||||||||||||||||||
| Percentage of operating income | 8.5% | (3)% | (6.5)% | (4.9)% | 105.9% | 100.0% | ||||||||||||||||||||||||||||||||
| Impact of a 10% adverse currency fluctuation on revenues less transaction-based expenses | $(6) | $(4) | $(1) | $(2) | $— | $(13) | ||||||||||||||||||||||||||||||||
| Impact of a 10% adverse currency fluctuation on operating income | $(4) | $(1) | $(3) | $(2) | $— | $(10) | ||||||||||||||||||||||||||||||||
| Euro | Swedish Krona | Canadian Dollar | Other Foreign Currencies | U.S. Dollar | Total | |||||||||||||||||||||||||||||||||
| (in millions, except currency rate) | ||||||||||||||||||||||||||||||||||||||
| Nine Months Ended September 30, 2023 | ||||||||||||||||||||||||||||||||||||||
| Average foreign currency rate to the U.S. dollar | 1.083 | 0.094 | 0.743 | # | N/A | N/A | ||||||||||||||||||||||||||||||||
| Percentage of revenues less transaction-based expenses | 6.3% | 4.2% | 0.9% | 3.0% | 85.6% | 100.0% | ||||||||||||||||||||||||||||||||
| Percentage of operating income | 9.9% | (3.6)% | (6.9)% | (5.7)% | 106.3% | 100.0% | ||||||||||||||||||||||||||||||||
| Impact of a 10% adverse currency fluctuation on revenues less transaction-based expenses | $(18) | $(12) | $(3) | $(8) | $— | $(41) | ||||||||||||||||||||||||||||||||
| Impact of a 10% adverse currency fluctuation on operating income | $(12) | $(4) | $(8) | $(7) | $— | $(31) | ||||||||||||||||||||||||||||||||
| Net Assets | Impact of a 10% Adverse Currency Fluctuation | |||||||||||||
| (in millions) | ||||||||||||||
| Swedish Krona | $ | 2,976 | $ | 298 | ||||||||||
| British Pound | 144 | 14 | ||||||||||||
| Norwegian Krone | 137 | 14 | ||||||||||||
| Canadian Dollar | 104 | 10 | ||||||||||||
| Australian Dollar | 98 | 10 | ||||||||||||
| Euro | 48 | 5 | ||||||||||||
| Period | (a) Total Number of Shares Purchased |
(b) Average Price Paid Per Share | (c) Total Number of Shares Purchased as Part of Publicly Announced Plans or Programs |
(d) Maximum Dollar Value of Shares that May Yet Be Purchased Under the Plans or Programs (in millions) | ||||||||||||||||||||||
| July 2023 | ||||||||||||||||||||||||||
| Share repurchase program | — | $ | — | — | $ | 491 | ||||||||||||||||||||
| Employee transactions | 31,331 | $ | 49.72 | N/A | N/A | |||||||||||||||||||||
| August 2023 | ||||||||||||||||||||||||||
| Share repurchase program | — | $ | — | — | $ | 491 | ||||||||||||||||||||
| Employee transactions | — | $ | — | N/A | N/A | |||||||||||||||||||||
| September 2023 | ||||||||||||||||||||||||||
| Share repurchase program | — | $ | — | — | $ | 2,000 | ||||||||||||||||||||
| Employee transactions | 453 | $ | 51.94 | N/A | N/A | |||||||||||||||||||||
| Total Quarter Ended September 30, 2023 | ||||||||||||||||||||||||||
| Share repurchase program | — | $ | — | — | $ | 2,000 | ||||||||||||||||||||
| Employee transactions | 31,784 | $ | 49.75 | N/A | N/A | |||||||||||||||||||||
| Exhibit Number | ||||||||
| 101 | The following materials from the Nasdaq, Inc. Quarterly Report on Form 10-Q for the quarter ended September 30, 2023, formatted in iXBRL (Inline eXtensible Business Reporting Language): (i) Condensed Consolidated Balance Sheets as of September 30, 2023 and December 31, 2022; (ii) Condensed Consolidated Statements of Income for the three and nine months ended September 30, 2023 and 2022; (iii) Condensed Consolidated Statements of Comprehensive Income for the three and nine months ended September 30, 2023 and 2022; (iv) Condensed Consolidated Statements of Changes in Stockholders' Equity for the three and nine months ended September 30, 2023 and 2022; (v) Condensed Consolidated Statements of Cash Flows for the nine months ended September 30, 2023 and 2022; and (vi) notes to condensed consolidated financial statements. | |||||||
| 104 | Cover Page Interactive Data File, formatted in iXBRL and contained in Exhibit 101. | |||||||
| Nasdaq, Inc. | ||||||||
| (Registrant) | ||||||||
| By: | /s/ Adena T. Friedman | |||||||
| Name: | Adena T. Friedman | |||||||
| Title: | Chief Executive Officer | |||||||
| Date: | November 3, 2023 | |||||||
| By: | /s/ Ann M. Dennison | |||||||
| Name: | Ann M. Dennison | |||||||
| Title: | Executive Vice President and Chief Financial Officer | |||||||
| Date: | November 3, 2023 | |||||||
 154 West 42nd Street, NY, 10036 USA | Nasdaq.com

| /s/ Adena T. Friedman | |||||||||||
| Name: | Adena T. Friedman | ||||||||||
| Title: | Chief Executive Officer | ||||||||||
| /s/ Ann M. Dennison | |||||||||||
| Name: | Ann M. Dennison | ||||||||||
| Title: | Executive Vice President and Chief Financial Officer | ||||||||||
| /s/ Adena T. Friedman | |||||||||||
| Name: | Adena T. Friedman | ||||||||||
| Title: | Chief Executive Officer | ||||||||||
| Date: | November 3, 2023 | ||||||||||
| /s/ Ann M. Dennison | |||||||||||
| Name: | Ann M. Dennison | ||||||||||
| Title: | Executive Vice President and Chief Financial Officer | ||||||||||
| Date: | November 3, 2023 | ||||||||||