エドガーで原本を確認する
UNITED STATES
SECURITIES AND EXCHANGE COMMISSION
Washington, D.C. 20549
FORM
CURRENT REPORT
PURSUANT TO SECTION 13 OR 15(D) OF
THE SECURITIES EXCHANGE ACT OF 1934
Date of Report (Date of earliest event reported):
(Exact name of registrant as specified in its charter)
|
|
|||
(State or other jurisdiction of incorporation) |
(Commission File Number) |
(I.R.S. Employer Identification No.) |
(Address of principal executive offices)
(Registrant’s telephone number, including area code)
(Former name or former address, if changed since last report)
Check the appropriate box below if the Form 8-K filing is intended to simultaneously satisfy the filing obligation of the registrant under any of the following provisions:
Securities registered pursuant to Section 12(b) of the Exchange Act:
Title of each class |
|
Trading Symbol(s) |
|
Name of each exchange on which registered |
Indicate by check mark whether the registrant is an emerging growth company as defined in Rule 405 of the Securities Act of 1933 (§230.405 of this chapter) or Rule 12b-2 of the Securities Exchange Act of 1934 (§240.12b-2 of this chapter).
Emerging growth company
If an emerging growth company, indicate by check mark if the registrant has elected not to use the extended transition period for complying with any new or revised financial accounting standards provided pursuant to Section 13(a) of the Exchange Act. ☐
Item 2.02 - Results of Operations and Financial Condition.
On August 10, 2026, Riot Platforms, Inc. (together with its consolidated subsidiaries, the “Company”) issued a press release (the “Press Release”) announcing an update on the Company’s business and financial results and results of operations for the three months ended June 30, 2026. The Company also published on its website, www.riotplatforms.com, under the “Investor Relations” tab a presentation providing, among other things, an update on the Company’s business and financial results and results of operations for the three months ended June 30, 2026 (the “Q2 2026 Earnings Deck”) and that the Company has entered into a non-binding letter of intent with respect to a proposed lease for the Company’s Corsicana Facility. The full text of the Press Release and the Q2 2026 Earnings Deck are attached to this Current Report on Form 8-K (this “Report”) as Exhibit 99.1 and 99.2, respectively.
The information under this Item 2.02 of this Report, including Exhibits 99.1 and 99.2 attached hereto, is furnished and shall not be deemed “filed” for purposes of Section 18 of the Securities Exchange Act of 1934, as amended, (the “Exchange Act”) nor shall it be deemed incorporated by reference in any filing under the Securities Act of 1933, as amended, or the Exchange Act, except as shall be expressly set forth by specific reference.
Item 8.01 – Other Events.
The information included in Exhibit 99.1 under the heading “191 IT MW Data Center Lease with a Leading Frontier AI Lab at Rockdale” shall be incorporated by reference into this Item 8.01 of this Report.
Item 9.01 – Financial Statements and Exhibits.
(d)Exhibits.
EXHIBIT INDEX
Exhibit No. |
|
Description |
99.1 |
||
99.2 |
||
104 |
Cover Page Interactive Data File (embedded within the Inline XBRL document) |
S I G N A T U R E
Pursuant to the requirements of the Securities Exchange Act of 1934, as amended, the registrant has duly caused this report to be signed on its behalf by the undersigned hereunto duly authorized.
RIOT PLATFORMS, INC. |
|||
By: |
/s/ Jason Chung |
||
Name: |
Jason Chung |
||
Title: |
Chief Financial Officer |
||
Date: August 10, 2026
Exhibit 99.1
Riot Platforms Reports Second Quarter 2026 Financial Results and Strategic Highlights
Executed 20-year data center lease with a leading frontier AI lab for 191 MW of critical IT capacity at Riot’s Rockdale campus, expected to generate approximately $9.1 billion in total contract revenue over the initial term
Completed delivery of the initial 25 critical IT MW to AMD on time and on budget, with the second 25 critical IT MW expansion under construction
Together with the AMD lease, the Company has contracted 241 MW of critical IT capacity with two of the most significant companies in the AI ecosystem
Quarterly revenue of $174.2 million, a 14% increase year-over-year, including $23.2 million in Data Center revenue
CASTLE ROCK, Colo., August 10, 2026 (GLOBE NEWSWIRE) — Riot Platforms, Inc. (NASDAQ: RIOT) (“Riot” or “the Company”), a vertically-integrated industry leader in digital infrastructure, specializing in the development of large-scale data centers and bitcoin mining applications, reported financial results for the three-month period ended June 30, 2026. The accompanying presentation materials are available on Riot’s website.
“Today's announcement of a landmark 20-year, 191-megawatt data center lease with a leading frontier AI lab marks a defining moment in our evolution into a leading developer of large-scale data centers,” said Jason Les, CEO of Riot. “It builds directly on a strong second quarter, in which we completed delivery of the initial 25 megawatts to AMD on time and on budget. In just over six months, Riot has now executed leases totaling 241 megawatts of capacity, representing approximately $9.8 billion of long-term, contracted revenue with two of the most important companies in the AI ecosystem.
“Our platform stands apart through three elements working together: multi-gigawatt-scale power capacity that is already fully approved and energized, in-house data center development expertise, and the ability to engineer custom infrastructure for computing's most demanding workloads. With all three, and the financial resources to deploy them already secured, we are positioned to convert strong market demand from high-quality tenants into compounding shareholder value.”
191 IT MW Data Center Lease with a Leading Frontier AI Lab at Rockdale
Subsequent to quarter end, Riot announced the execution of a Data Center Lease and Services Agreement (the “Data Center Lease”) with one of the world’s leading frontier AI labs, for 191 MW of critical IT capacity at Riot’s Rockdale campus. The Data Center Lease carries an initial term of 20 years, running through June 2048, and is expected to generate approximately $9.1 billion in total initial contract revenue. The Data Center Lease also includes two five-year extension options at the tenant’s election, representing a total potential contract value of approximately $16.1 billion if both extensions are fully exercised.
This transaction secures the Company’s second tenant at the Rockdale campus, following the lease with Advanced Micro Devices, Inc. (“AMD”) announced on January 16, 2026. Together, the two agreements firmly establish Riot as a leading contracted AI data center developer.
Transaction highlights:
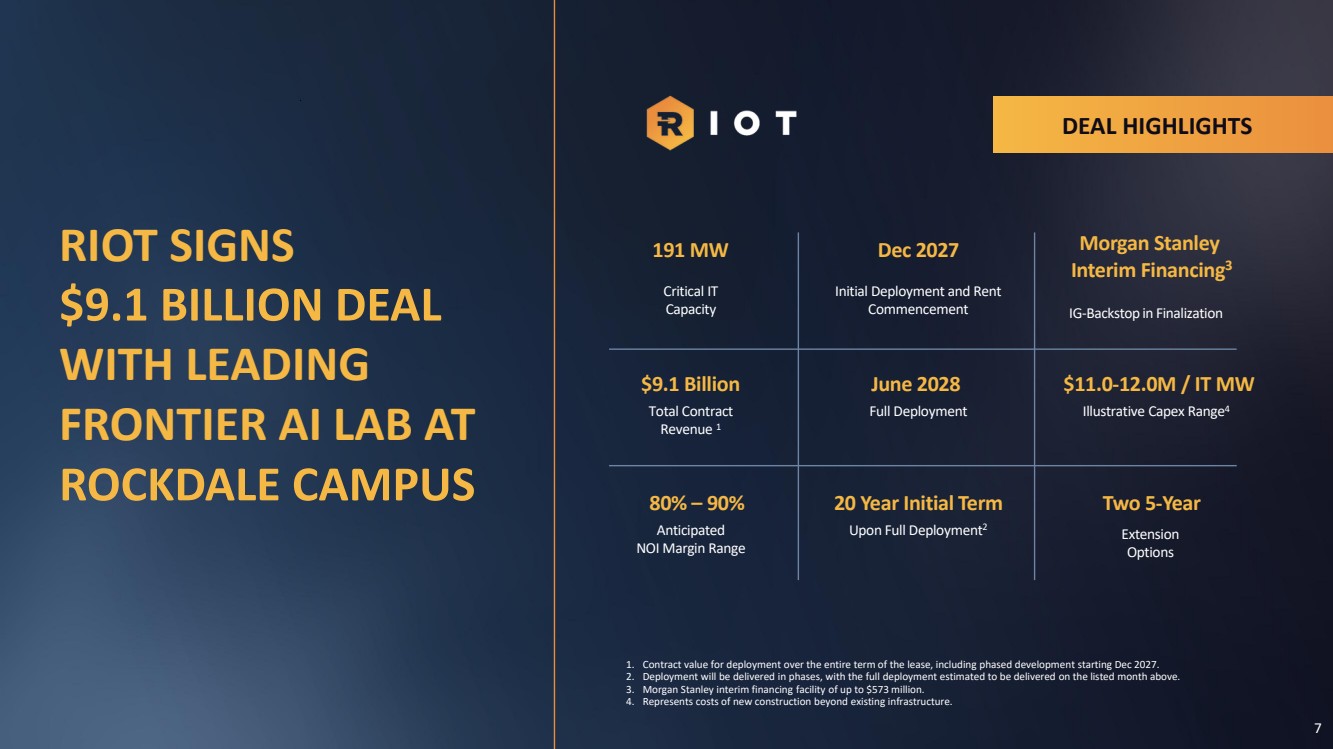
| • | Capacity Leased: 191 MW critical IT build-to-suit Tier 3 data center at Riot’s Rockdale campus. |
| • | Total Contract Value: $9.1 billion over the initial 20-year term, with a total potential contract value of approximately $16.1 billion if both five-year extension options are exercised. |
| • | NOI Contribution: Estimated cumulative NOI range of $7.3 to $8.2 billion over the base lease term, with an estimated average annual NOI contribution of $365 to $411 million. |
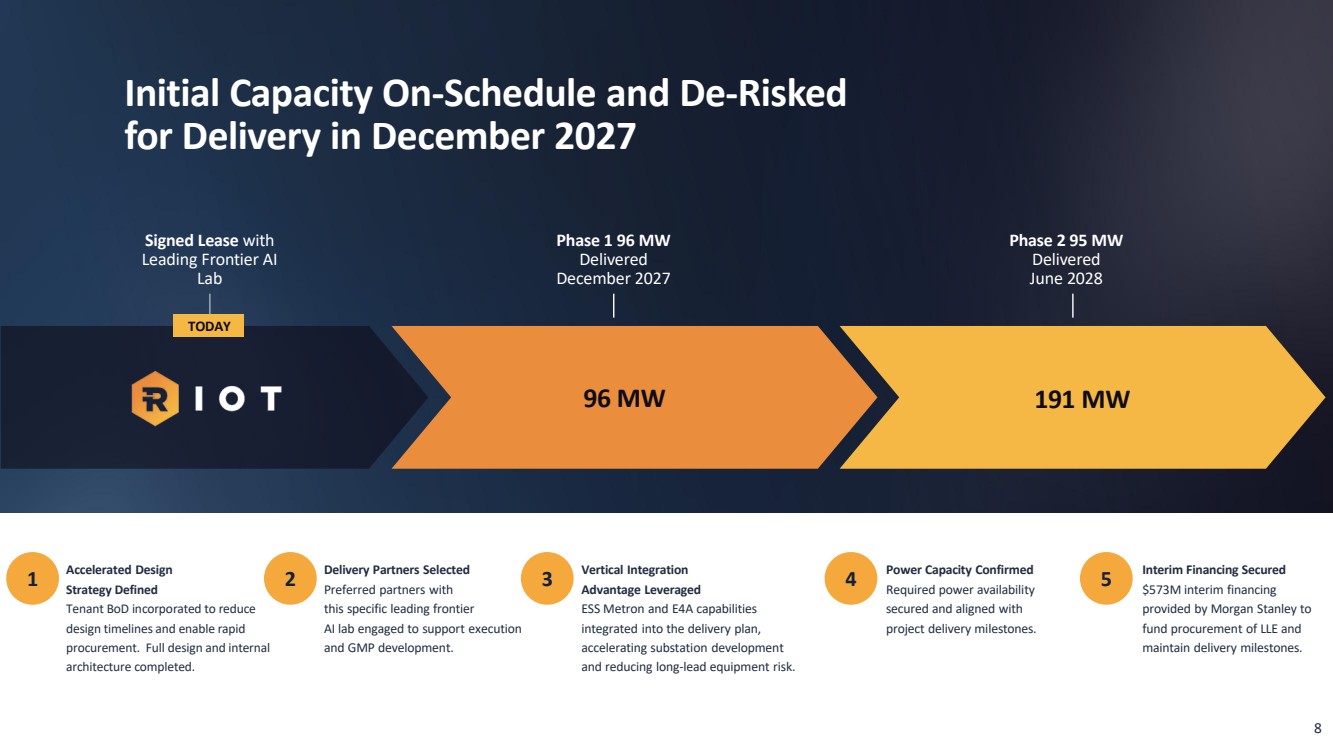
| • | Delivery Schedule: Phased delivery schedule, with the initial 96 IT MW expected in December 2027 and full 191 IT MW deployment expected by June 2028, leveraging Riot’s existing, fully approved interconnection at the Rockdale campus. |
| • | Financing: $573 million interim financing facility provided by Morgan Stanley to fund initial development costs while the investment-grade credit backstop is finalized. |
Second Quarter 2026 Financial and Operational Highlights
Key financial and operational highlights for the quarter include:
| • | Total revenue of $174.2 million, as compared to $153.0 million for the same three-month period in 2025, a 14% increase year-over-year. |
| • | Data Center revenue of $23.2 million for the quarter, comprised of $4.9 million in operating lease revenue and $18.3 million in tenant fit-out services revenue, reflecting the Company’s second quarter of Data Center segment revenue and the completed delivery of the initial 25 MW to AMD. |
| • | Produced 1,587 bitcoin, as compared to 1,426 during the same three-month period in 2025. |
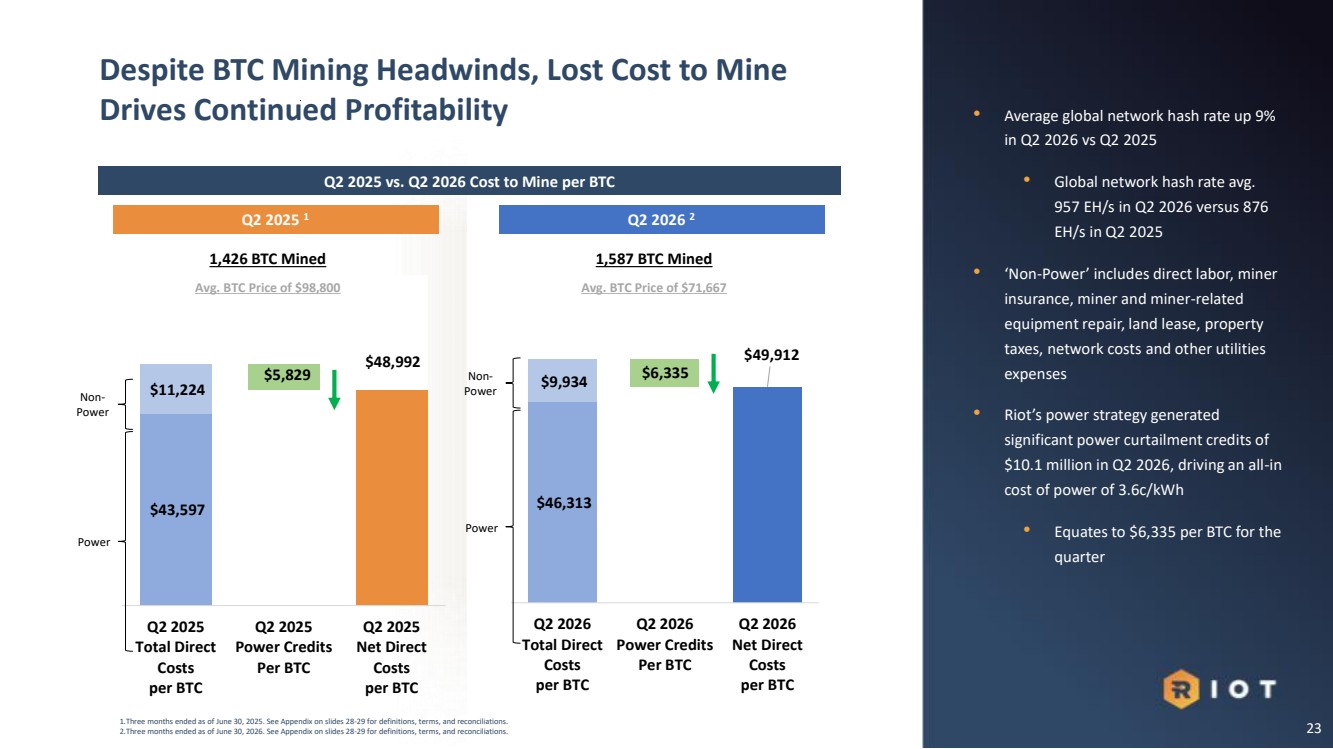
| • | The average cost to mine bitcoin, excluding depreciation, was $49,912 in the quarter, as compared to $48,992 per bitcoin in the same three-month period in 2025. The increase was primarily driven by higher power costs and the expansion at Riot’s Kentucky facilities. |
| • | Bitcoin Mining revenue of $113.7 million for the quarter, as compared to $140.9 million for the same three-month period in 2025, primarily driven by lower average bitcoin prices and an increase in global network hash rate, partially offset by an increase in Riot’s average operating hash rate. |
| • | Engineering revenue of $37.3 million for the quarter, as compared to $10.6 million for the same three-month period in 2025. |
| • | Ended the quarter with over $1.2 billion in liquid assets, including 11,380 bitcoin (of which 5,821 were held as collateral), equating to approximately $666.0 million based on the market price for one bitcoin on June 30, 2026 of $58,527, and $548.9 million in cash (of which $77.5 million is restricted). |
AMD Deployment Progress at Rockdale
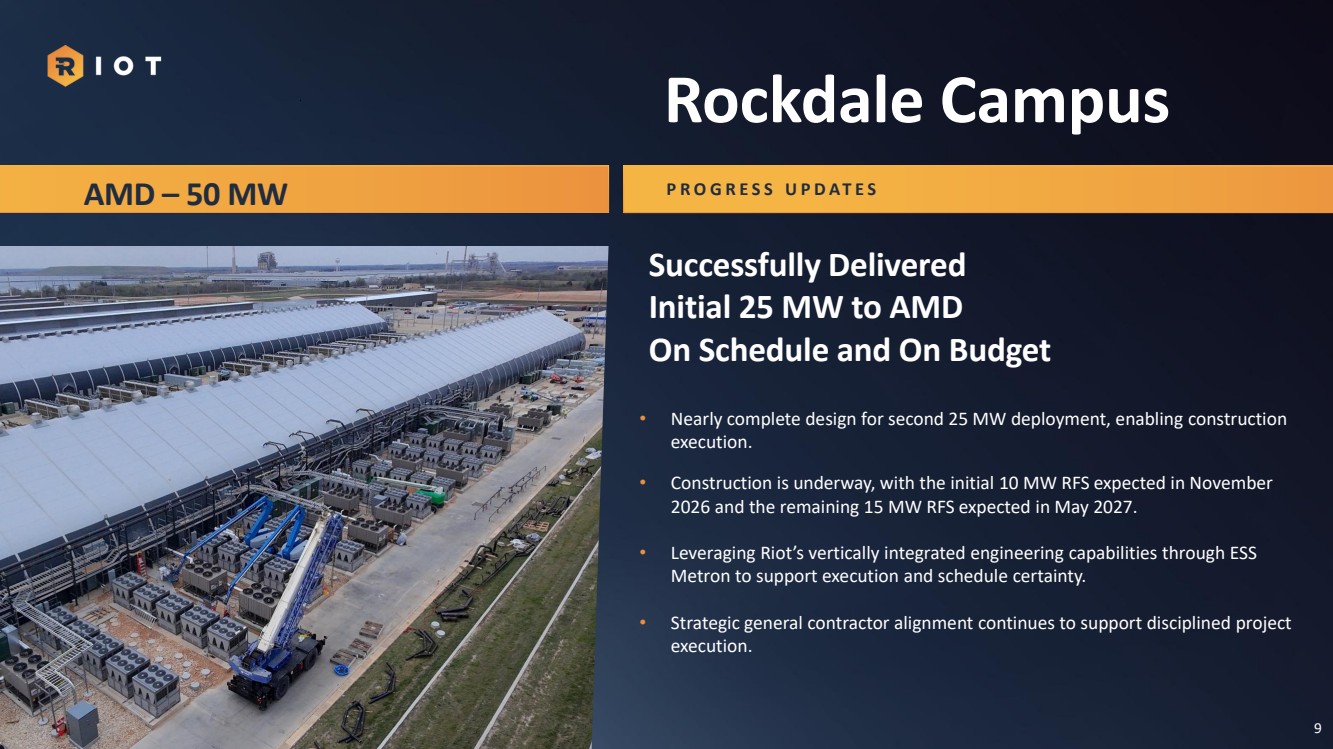
During the quarter, Riot completed delivery of the final 20 MW of AMD’s initial deployment, bringing the full 25 MW of commissioned capacity online, on time and on budget, and converting the lease to recurring revenue at full initial scale. Construction is now underway on the 25 MW expansion, with the 10 MW Phase 3 on track for delivery in November 2026 and the 15 MW Phase 4 to follow in May 2027, at which point AMD's total contracted capacity of 50 MW will be fully deployed. Riot’s in-house procurement, engineering and construction capabilities continue to underpin this delivery record.
Conference Call
Riot will host a conference call on August 10, 2026 at 4:30 p.m. ET to discuss its financial results.
This conference call will be available through audio-only webcast — please use this link to register: https://edge.media-server.com/mmc/p/xk5hszcg
Participants who choose to dial into the call in the United States or internationally to ask questions, please use this toll-free number: +1 (800) 715-9871 or toll number: +1 (646) 307-1963. For both dial in numbers, the audience passcode is 3868069.
About Riot Platforms, Inc.
Riot Platforms, Inc. (NASDAQ: RIOT) is a leading digital infrastructure company, specializing in the development of large-scale data centers and bitcoin mining applications. The Company operates digital infrastructure and Bitcoin mining facilities in central Texas and Kentucky, and engineering and fabrication facilities in Denver and Houston.
Riot’s vision is to be the world’s most trusted platform for powering and building the next digital world. Its mission is to empower the future of digital infrastructure by positively impacting the sectors, networks, and communities the Company touches.
For more information, visit Riot Platforms.
Safe Harbor
Statements in this press release that are not historical facts are forward-looking statements that reflect management’s current expectations, assumptions, and estimates of future performance and economic conditions. Such statements rely on the safe harbor provisions of Section 27A of the Securities Act of 1933, as amended, and Section 21E of the Securities Exchange Act of 1934, as amended. Because such statements are subject to risks and uncertainties, actual results may differ materially from those expressed or implied by such forward-looking statements. Words such as “anticipates,” “believes,” “plans,” “expects,” “intends,” “will,” “potential,” “hope,” similar expressions and their negatives are intended to identify forward-looking statements. These forward-looking statements may include, but are not limited to: plans to develop data centers, projections, objectives, expectations, and intentions about future events; short-term and long-term business operations and objectives and financial needs; the Company’s data center leases at the Rockdale Site; forecasted demand for energy at the sites; the Company’s expansion plans at the site; the Company’s anticipated financing plans, and the Company’s other plans, projections, objectives, expectations, and intentions more generally. These forward-looking statements are subject to a number of risks and uncertainties that may cause results, performance, or achievements to be materially different from those expressed or implied, including, without limitation: risks relating to the Company’s growth and developing the Company’s power capacity for data center purposes, including construction plans, delays, supply chain issues, permitting or regulatory hurdles, and unforeseen technical challenges; the anticipated demand for large data centers; changes in leasing arrangements; risks relating to the financing of new data centers; future economic conditions, performance, or outlooks; future political conditions; the outcome of contingencies; potential acquisitions or divestitures; our ability to maximize the value of our full power portfolio; the number and value of Bitcoin rewards and transaction fees we earn from our ongoing Bitcoin Mining operations; future self-mining hash rate capacity; expected cash flows or capital expenditures; our beliefs or expectations; activities, events or developments that we intend, expect, project, believe, or anticipate will or may occur in the future; unaudited estimates of bitcoin production; risks related to the success, schedule, cost and difficulty of integrating businesses we acquire; and our failure to realize anticipated efficiencies and strategic and financial benefits from our acquisitions. Detailed information regarding the factors identified by the Company’s management which they believe may cause actual results to differ materially from those expressed or implied by such forward-looking statements in this press release may be found in the Company’s filings with the U.S. Securities and Exchange Commission (the “SEC”), including the risks, uncertainties and other factors discussed under the sections entitled “Risk Factors” and “Cautionary Note Regarding Forward-Looking Statements” of the Company’s most recently filed periodic reports on Form 10-K and Form 10-Q, and the other filings the Company makes with the SEC, copies of which may be obtained from the SEC’s website, www.sec.gov. All forward- looking statements included in this press release are made only as of the date of this press release, and the Company disclaims any intention or obligation to update or revise any such forward-looking statements to reflect events or circumstances that subsequently occur, or of which the Company hereafter becomes aware, except as required by law. Persons reading this press release are cautioned not to place undue reliance on such forward-looking statements.
Additional Information and Communications
For important news and information regarding the Company, including presentations and other news and events, visit the Investor Relations section of the Company’s website, riotplatforms.com/investors, and the Company’s social media accounts, including on X and LinkedIn.
Contacts:
Investor Contact:
Joshua Kane
IR@Riotplatforms.com
Media Contact:
Becca Rincon
PR@Riotplatforms.com
Non-U.S. GAAP Measures of Financial Performance
In addition to financial measures presented under generally accepted accounting principles in the United States of America (“GAAP”), we consistently evaluate our use of and calculation of non-GAAP financial measures such as “Adjusted EBITDA.” EBITDA is computed as net income before interest, taxes, depreciation, and amortization. Adjusted EBITDA is a financial measure defined as EBITDA, adjusted to eliminate the effects of certain non-cash and/or non-recurring items that do not reflect our ongoing strategic business operations, which management believes results in a performance measurement that represents a key indicator of the Company’s core business operations of Bitcoin mining. The adjustments include fair value adjustments such as derivative power contract adjustments, equity securities fair value changes, and non-cash stock-based compensation expense, in addition to financing and legacy business income and expense items. We believe Adjusted EBITDA can be an important financial performance measure because it allows management, investors, and our board of directors to evaluate and compare our operating results, including our return on capital and operating efficiencies from period-to-period by making such adjustments. Additionally, Adjusted EBITDA is used as a performance metric for share-based compensation.
Adjusted EBITDA is provided in addition to, and should not be considered a substitute for, or superior to, net income, the most comparable measure under GAAP to Adjusted EBITDA. Further, Adjusted EBITDA should not be considered as an alternative to revenue growth, net income, diluted net income per share or any other performance measure derived in accordance with GAAP, or as an alternative to cash flow from operating activities as a measure of our liquidity. Adjusted EBITDA has limitations as an analytical tool, and you should not consider this financial measure either in isolation or as a substitute for analyzing our results as reported under GAAP.
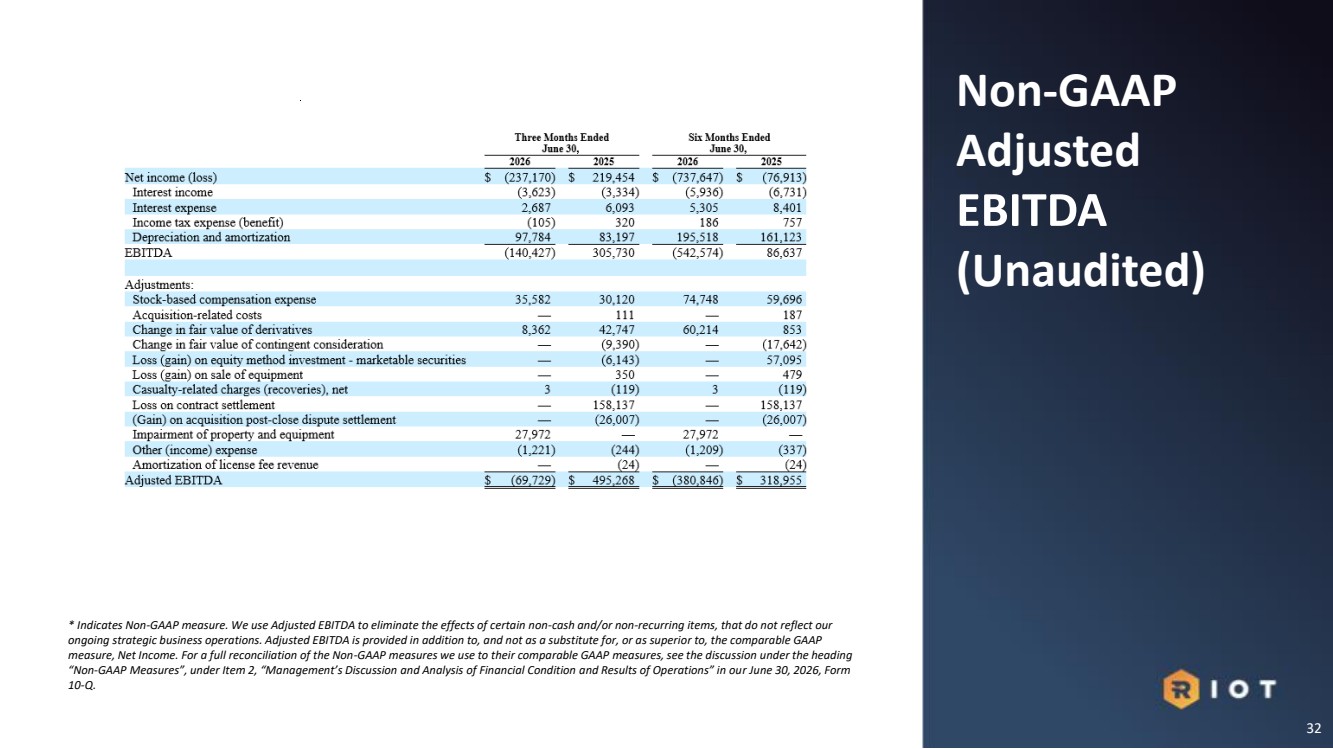
The following table reconciles Adjusted EBITDA to Net income (loss), the most comparable GAAP financial measure:
|
|
Three Months Ended |
|
Six Months Ended |
||||||||
|
|
June 30, |
|
June 30, |
||||||||
|
|
2026 |
|
2025 |
|
2026 |
|
2025 |
||||
Net income (loss) |
|
$ |
(237,170) |
|
$ |
219,454 |
|
$ |
(737,647) |
|
$ |
(76,913) |
Interest income |
|
|
(3,623) |
|
|
(3,334) |
|
|
(5,936) |
|
|
(6,731) |
Interest expense |
|
|
2,687 |
|
|
6,093 |
|
|
5,305 |
|
|
8,401 |
Income tax expense (benefit) |
|
|
(105) |
|
|
320 |
|
|
186 |
|
|
757 |
Depreciation and amortization |
|
|
97,784 |
|
|
83,197 |
|
|
195,518 |
|
|
161,123 |
EBITDA |
|
|
(140,427) |
|
|
305,730 |
|
|
(542,574) |
|
|
86,637 |
|
|
|
|
|
|
|
|
|
|
|
|
|
Adjustments: |
|
|
|
|
|
|
|
|
|
|
|
|
Stock-based compensation expense |
|
|
35,582 |
|
|
30,120 |
|
|
74,748 |
|
|
59,696 |
Acquisition-related costs |
|
|
— |
|
|
111 |
|
|
— |
|
|
187 |
Change in fair value of derivatives |
|
|
8,362 |
|
|
42,747 |
|
|
60,214 |
|
|
853 |
Change in fair value of contingent consideration |
|
|
— |
|
|
(9,390) |
|
|
— |
|
|
(17,642) |
Loss (gain) on equity method investment - marketable securities |
|
|
— |
|
|
(6,143) |
|
|
— |
|
|
57,095 |
Loss (gain) on sale of equipment |
|
|
— |
|
|
350 |
|
|
— |
|
|
479 |
Casualty-related charges (recoveries), net |
|
|
3 |
|
|
(119) |
|
|
3 |
|
|
(119) |
Loss on contract settlement |
|
|
— |
|
|
158,137 |
|
|
— |
|
|
158,137 |
Gain on acquisition post-close dispute settlement |
|
|
— |
|
|
(26,007) |
|
|
— |
|
|
(26,007) |
Impairment of property and equipment |
|
|
27,972 |
|
|
— |
|
|
27,972 |
|
|
— |
Other (income) expense |
|
|
(1,221) |
|
|
(244) |
|
|
(1,209) |
|
|
(337) |
Amortization of license fee revenue |
|
|
— |
|
|
(24) |
|
|
— |
|
|
(24) |
Adjusted EBITDA |
|
$ |
(69,729) |
|
$ |
495,268 |
|
$ |
(380,846) |
|
$ |
318,955 |
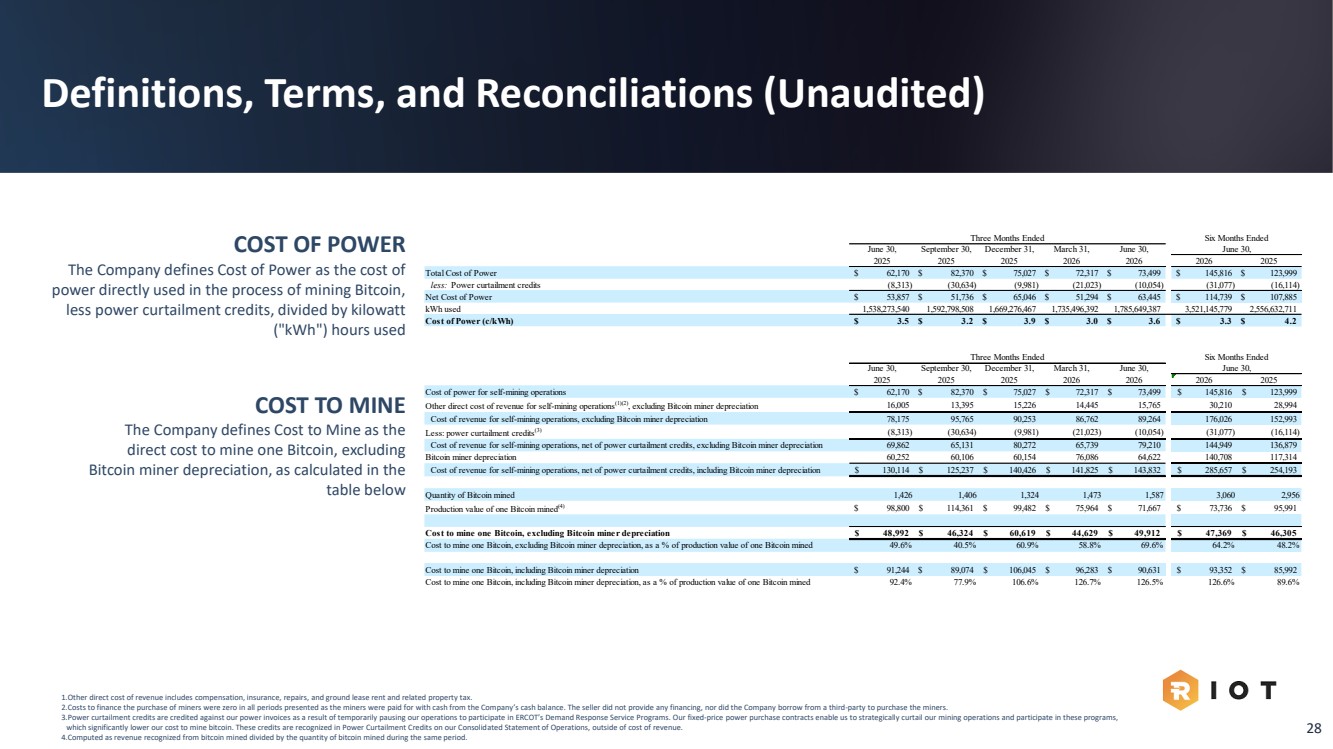
The Company defines Cost to Mine as the cost to mine one Bitcoin, excluding Bitcoin miner depreciation, as calculated in the table below.
|
|
Three Months Ended |
|
Six Months Ended |
||||||||||||
|
|
June 30, |
|
June 30, |
||||||||||||
|
|
2026 |
|
2025 |
|
2026 |
|
2025 |
||||||||
Cost of power for self-mining operations |
|
$ |
73,499 |
|
|
$ |
62,170 |
|
|
$ |
145,816 |
|
|
$ |
123,999 |
|
Other direct cost of revenue for self-mining operations(1)(2), excluding bitcoin miner depreciation |
|
|
15,765 |
|
|
|
16,005 |
|
|
|
30,210 |
|
|
|
28,994 |
|
Cost of revenue for self-mining operations, excluding bitcoin miner depreciation |
|
|
89,264 |
|
|
|
78,175 |
|
|
|
176,026 |
|
|
|
152,993 |
|
Less: power curtailment credits(3) |
|
|
(10,054) |
|
|
|
(8,313) |
|
|
|
(31,077) |
|
|
|
(16,114) |
|
Cost of revenue for self-mining operations, net of power curtailment credits, excluding bitcoin miner depreciation |
|
|
79,210 |
|
|
|
69,862 |
|
|
|
144,949 |
|
|
|
136,879 |
|
Bitcoin miner depreciation(4)(5) |
|
|
64,622 |
|
|
|
60,252 |
|
|
|
140,708 |
|
|
|
117,314 |
|
Cost of revenue for self-mining operations, net of power curtailment credits, including bitcoin miner depreciation |
|
$ |
143,832 |
|
|
$ |
130,114 |
|
|
$ |
285,657 |
|
|
$ |
254,193 |
|
|
|
|
|
|
|
|
|
|
|
|
|
|
|
|
|
|
Quantity of bitcoin mined |
|
|
1,587 |
|
|
|
1,426 |
|
|
|
3,060 |
|
|
|
2,956 |
|
Production value of one bitcoin mined(6) |
|
$ |
71,667 |
|
|
$ |
98,800 |
|
|
$ |
73,736 |
|
|
$ |
95,991 |
|
|
|
|
|
|
|
|
|
|
|
|
|
|
|
|
|
|
Cost to mine one bitcoin, excluding bitcoin miner depreciation |
|
$ |
49,912 |
|
|
$ |
48,992 |
|
|
$ |
47,369 |
|
|
$ |
46,305 |
|
Cost to mine one bitcoin, excluding bitcoin miner depreciation, as a % of production value of one bitcoin mined |
|
|
69.6 |
% |
|
|
49.6 |
% |
|
|
64.2 |
% |
|
|
48.2 |
% |
|
|
|
|
|
|
|
|
|
|
|
|
|
|
|
|
|
Cost to mine one bitcoin, including bitcoin miner depreciation |
|
$ |
90,631 |
|
|
$ |
91,244 |
|
|
$ |
93,352 |
|
|
$ |
85,992 |
|
Cost to mine one bitcoin, including bitcoin miner depreciation, as a % of production value of one bitcoin mined |
|
|
126.5 |
% |
|
|
92.4 |
% |
|
|
126.6 |
% |
|
|
89.6 |
% |
(1) |
Other direct cost of revenue includes compensation, insurance, repairs, and ground lease rent and related property tax. |
(2) |
For the three months ended June 30, 2026 and 2025, we paid cash of $25.2 million and $71.3 million, respectively, and for the six months ended June 30, 2026 and 2025, we paid cash of $48.7 million and $92.3 million, respectively, in total deposits and payments for the purchase of miners. Costs to finance the purchase of miners were zero in all periods presented as the miners were paid for with cash from the Company’s cash balance. The seller did not provide any financing, nor did the Company borrow from a third-party to purchase the miners. |
(3) |
Power curtailment credits are credited against our power invoices as a result of temporarily pausing our operations to participate in ERCOT’s Demand Response Service Programs. Our fixed-price power purchase contracts enable us to strategically curtail our mining operations and participate in these programs, which significantly lower our cost to mine bitcoin. These credits are recognized in Power curtailment credits on our Condensed Consolidated Statements of Operations, outside of cost of revenue, but significantly reduce our overall cost to mine bitcoin. |
(4) |
We capitalize the acquisition cost of our miners and include these costs in Property and equipment, net on our Condensed Consolidated Balance Sheets. The miners are depreciated over an estimated useful life of three years, during which time, they are expected to contribute to the generation of bitcoin revenue. We do not consider depreciation expense in determining whether it is economical to operate our miners because depreciation is a non-cash expense and is not a variable operating cost that can be avoided even if we curtail operations temporarily. Depreciation expense incurred is disclosed for each respective period in the table above. |
(5) |
The following table presents the future depreciation expense of all of our bitcoin miners: |
Remainder of 2026 |
|
$ |
133,593 |
2027 |
|
|
219,902 |
2028 |
|
|
99,312 |
2029 |
|
|
19,258 |
Total |
|
$ |
472,065 |
(6) |
Computed as revenue recognized from bitcoin mined divided by the quantity of bitcoin mined during the same period. |
Exhibit 99.2
|
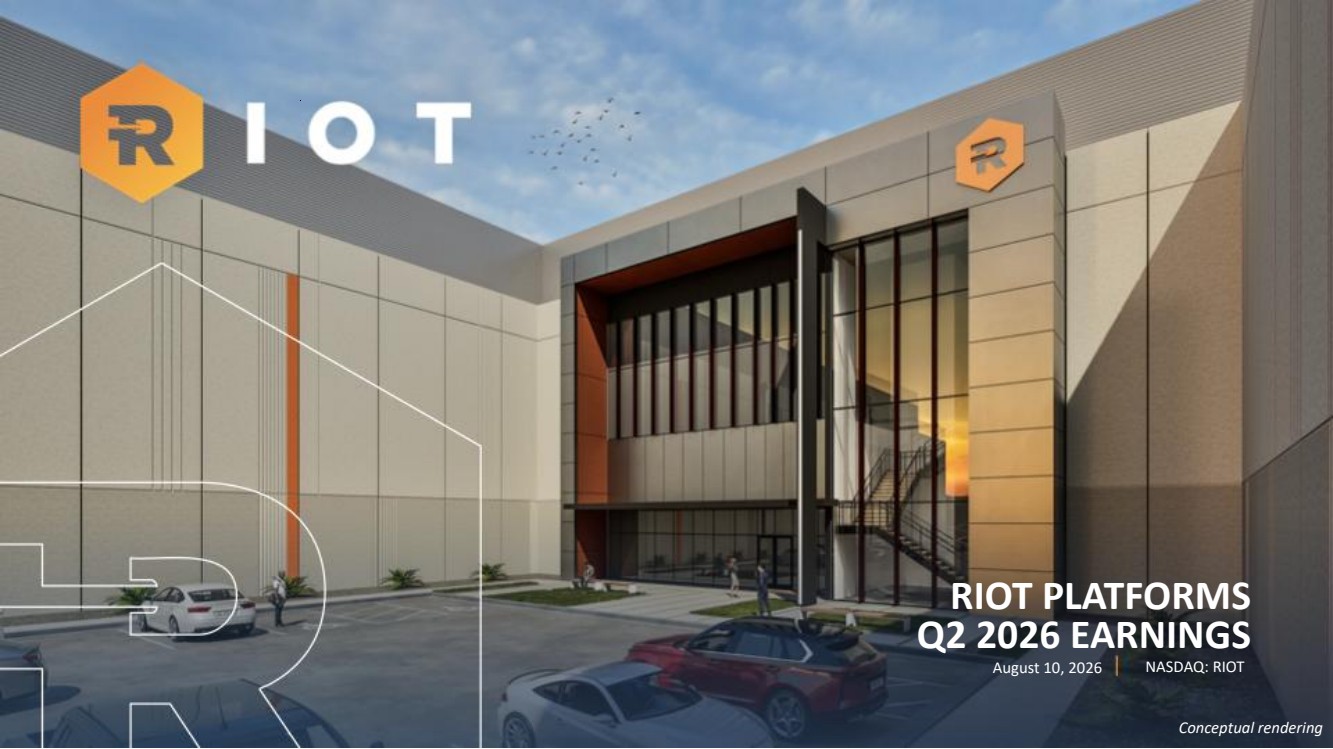
Conceptual rendering RIOT PLATFORMS Q2 2026 EARNINGS August 10, 2026 NASDAQ: RIOT |
|
|
TABLE OF CONTENTS S E C T I O N 2 : BUSINESS UPDATE DATA CENTERS S E C T I O N 1 : Q2 2026 KEY HIGHLIGHTS S E C T I O N 4 : Q2 2026 FINANCIAL UPDATE S E C T I O N 3 : FINANCING UPDATE 3 S E C T I O N 5 : CLOSING REMARKS |
|
Q2 2026 K E Y H I G H L I G H T S S E C T I O N 1 : 4 |
|
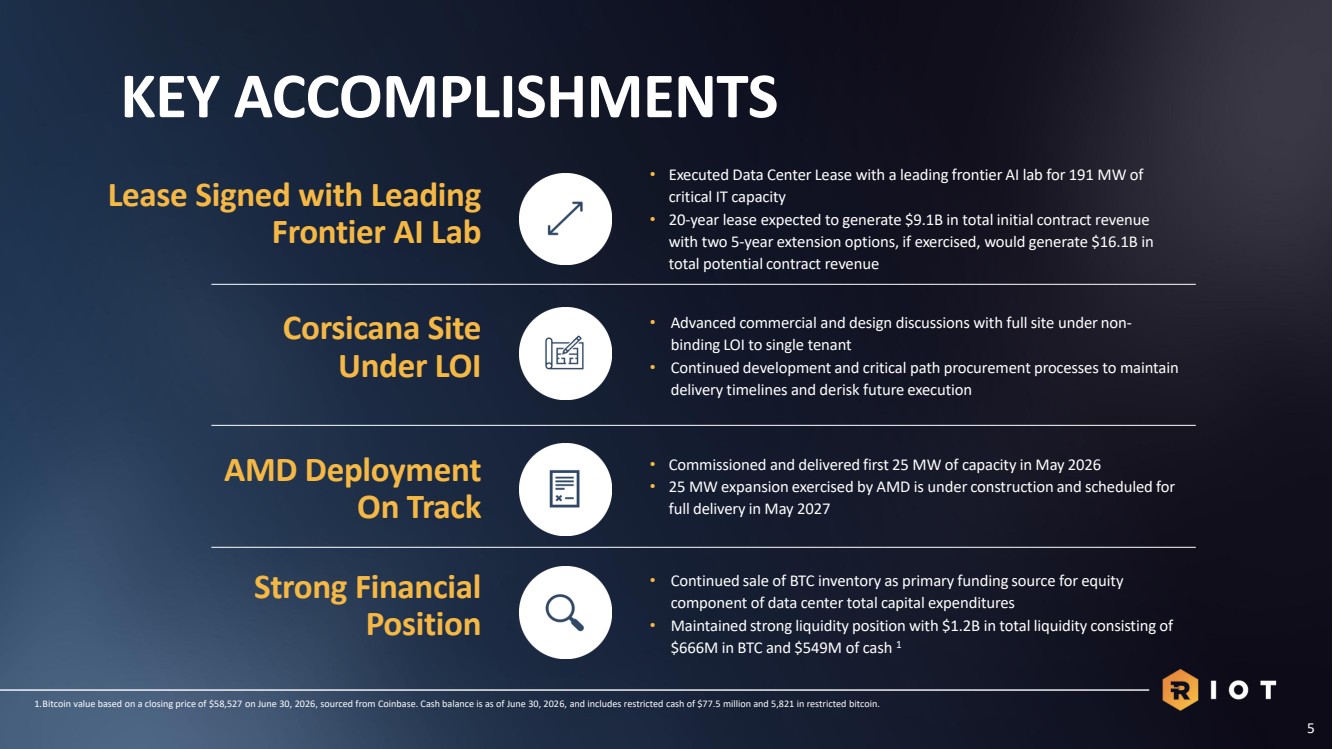
• Executed Data Center Lease with a leading frontier AI lab for 191 MW of critical IT capacity • 20-year lease expected to generate $9.1B in total initial contract revenue with two 5-year extension options, if exercised, would generate $16.1B in total potential contract revenue • Commissioned and delivered first 25 MW of capacity in May 2026 • 25 MW expansion exercised by AMD is under construction and scheduled for full delivery in May 2027 • Advanced commercial and design discussions with full site under non-binding LOI to single tenant • Continued development and critical path procurement processes to maintain delivery timelines and derisk future execution • Continued sale of BTC inventory as primary funding source for equity component of data center total capital expenditures • Maintained strong liquidity position with $1.2B in total liquidity consisting of $666M in BTC and $549M of cash 1 KEY ACCOMPLISHMENTS 5 1.Bitcoin value based on a closing price of $58,527 on June 30, 2026, sourced from Coinbase. Cash balance is as of June 30, 2026, and includes restricted cash of $77.5 million and 5,821 in restricted bitcoin. Lease Signed with Leading Frontier AI Lab Corsicana Site Under LOI AMD Deployment On Track Strong Financial Position |
|
BUSINESS UPDATE D A T A C E N T E R S S E C T I O N 2 : 6 |
|
191 MW Critical IT Capacity Dec 2027 Initial Deployment and Rent Commencement Two 5-Year Extension Options $9.1 Billion Total Contract Revenue 1 June 2028 Full Deployment $11.0-12.0M / IT MW Illustrative Capex Range4 80% – 90% Anticipated NOI Margin Range 20 Year Initial Term Upon Full Deployment2 1. Contract value for deployment over the entire term of the lease, including phased development starting Dec 2027. 2. Deployment will be delivered in phases, with the full deployment estimated to be delivered on the listed month above. 3. Morgan Stanley interim financing facility of up to $573 million. 4. Represents costs of new construction beyond existing infrastructure. DEAL HIGHLIGHTS Morgan Stanley Interim Financing3 IG-Backstop in Finalization RIOT SIGNS $9.1 BILLION DEAL WITH LEADING FRONTIER AI LAB AT ROCKDALE CAMPUS 7 |
|
Initial Capacity On-Schedule and De-Risked for Delivery in December 2027 Signed Lease with Leading Frontier AI Lab Phase 1 96 MW Delivered December 2027 Phase 2 95 MW Delivered June 2028 96 MW 191 MW TODAY Accelerated Design Strategy Defined Tenant BoD incorporated to reduce design timelines and enable rapid procurement. Full design and internal architecture completed. 1 Delivery Partners Selected Preferred partners with this specific leading frontier AI lab engaged to support execution and GMP development. 2 Vertical Integration Advantage Leveraged ESS Metron and E4A capabilities integrated into the delivery plan, accelerating substation development and reducing long-lead equipment risk. 3 Power Capacity Confirmed Required power availability secured and aligned with project delivery milestones. 4 Interim Financing Secured $573M interim financing provided by Morgan Stanley to fund procurement of LLE and maintain delivery milestones. 5 8 |
|
P R O G R E S S U P D A T E S 9 • Nearly complete design for second 25 MW deployment, enabling construction execution. • Construction is underway, with the initial 10 MW RFS expected in November 2026 and the remaining 15 MW RFS expected in May 2027. • Leveraging Riot’s vertically integrated engineering capabilities through ESS Metron to support execution and schedule certainty. • Strategic general contractor alignment continues to support disciplined project execution. Rockdale Campus Successfully Delivered Initial 25 MW to AMD On Schedule and On Budget AMD – 50 MW |
|
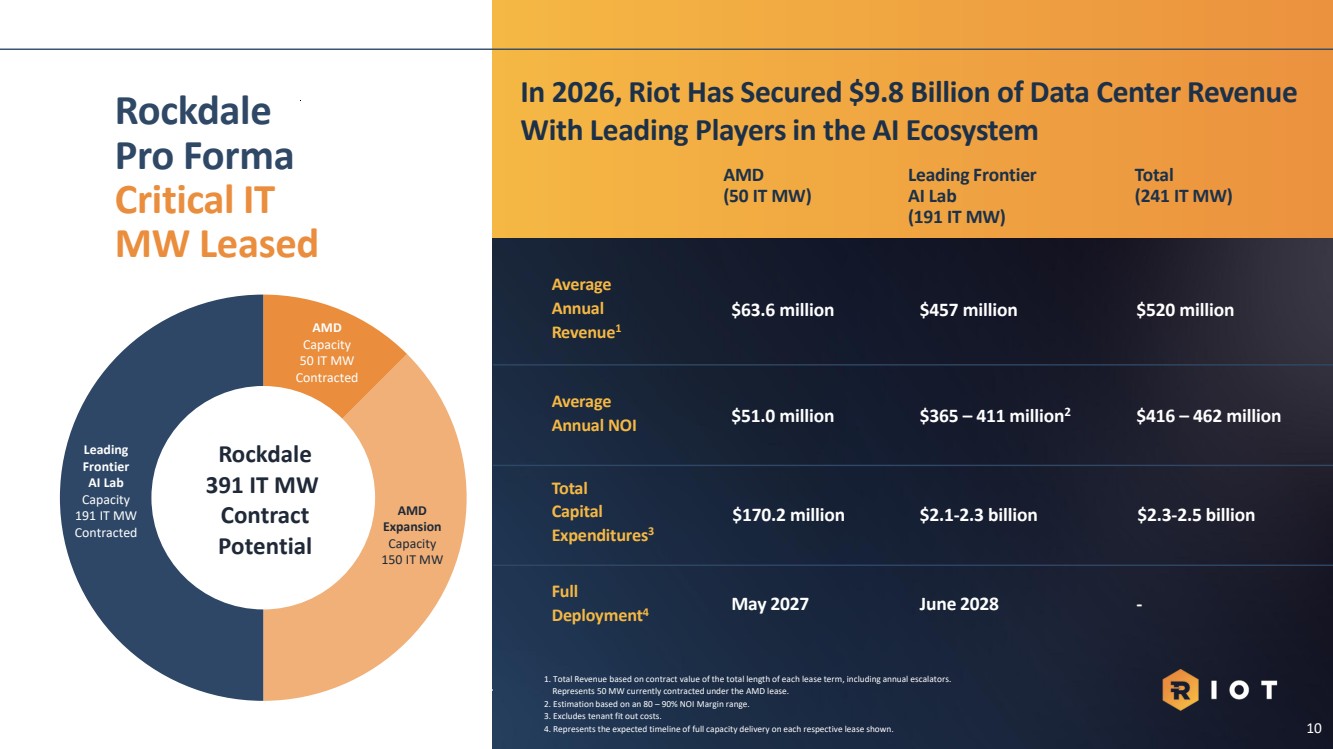
Average Annual Revenue1 $63.6 million $457 million $520 million Average Annual NOI Total Capital Expenditures3 1. Total Revenue based on contract value of the total length of each lease term, including annual escalators. Represents 50 MW currently contracted under the AMD lease. 2. Estimation based on an 80 – 90% NOI Margin range. 3. Excludes tenant fit out costs. 4. Represents the expected timeline of full capacity delivery on each respective lease shown. AMD (50 IT MW) Leading Frontier AI Lab (191 IT MW) Total (241 IT MW) Rockdale Pro Forma Critical IT MW Leased $51.0 million $365 – 411 million2 $416 – 462 million May 2027 June 2028 - Rockdale 391 IT MW Contract Potential Leading Frontier AI Lab Capacity 191 IT MW Contracted AMD Capacity 50 IT MW Contracted AMD Expansion Capacity 150 IT MW In 2026, Riot Has Secured $9.8 Billion of Data Center Revenue With Leading Players in the AI Ecosystem Full Deployment4 $170.2 million $2.1-2.3 billion $2.3-2.5 billion 10 |
|
S E C T I O N 3 : 11 FINANCING UPDATE Q 2 2 0 2 6 |
|
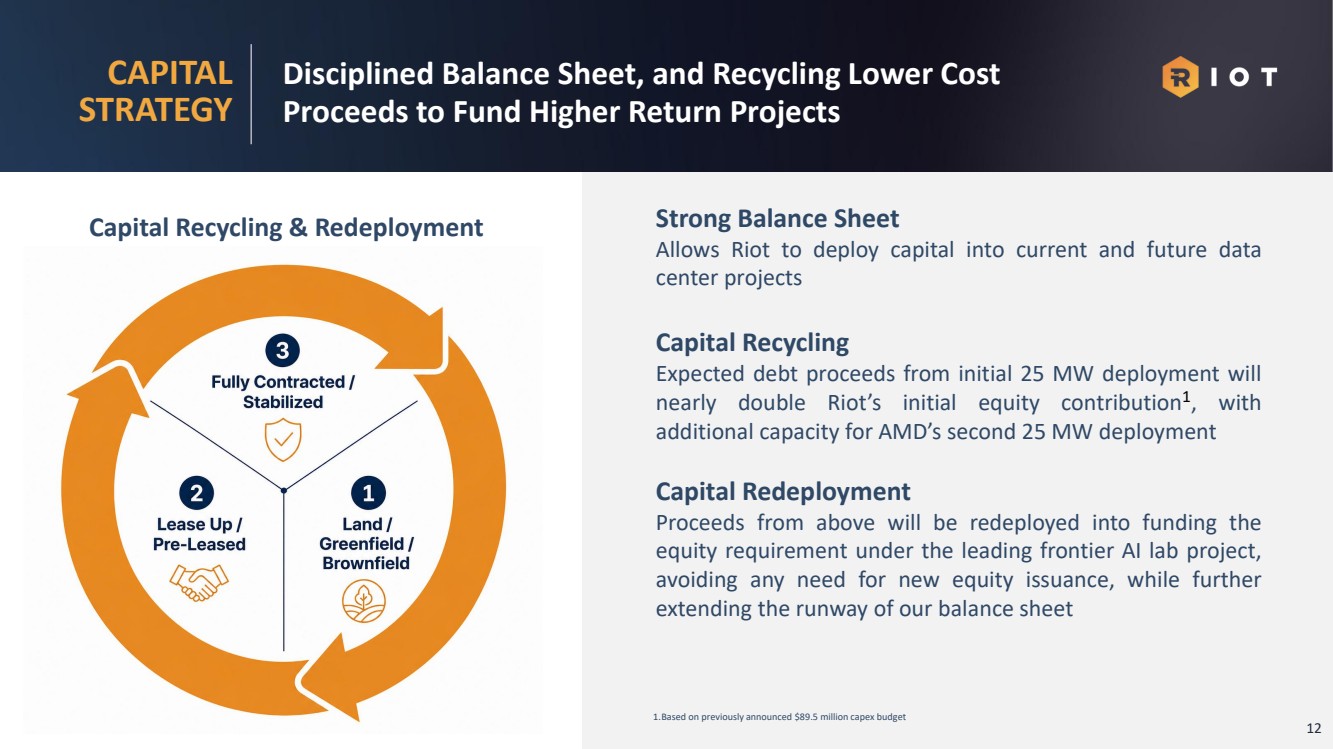
Strong Balance Sheet Allows Riot to deploy capital into current and future data center projects Capital Recycling Expected debt proceeds from initial 25 MW deployment will nearly double Riot’s initial equity contribution1 , with additional capacity for AMD’s second 25 MW deployment Capital Redeployment Proceeds from above will be redeployed into funding the equity requirement under the leading frontier AI lab project, avoiding any need for new equity issuance, while further extending the runway of our balance sheet Capital Recycling & Redeployment Disciplined Balance Sheet, and Recycling Lower Cost Proceeds to Fund Higher Return Projects 1.Based on previously announced $89.5 million capex budget 12 CAPITAL STRATEGY |
|
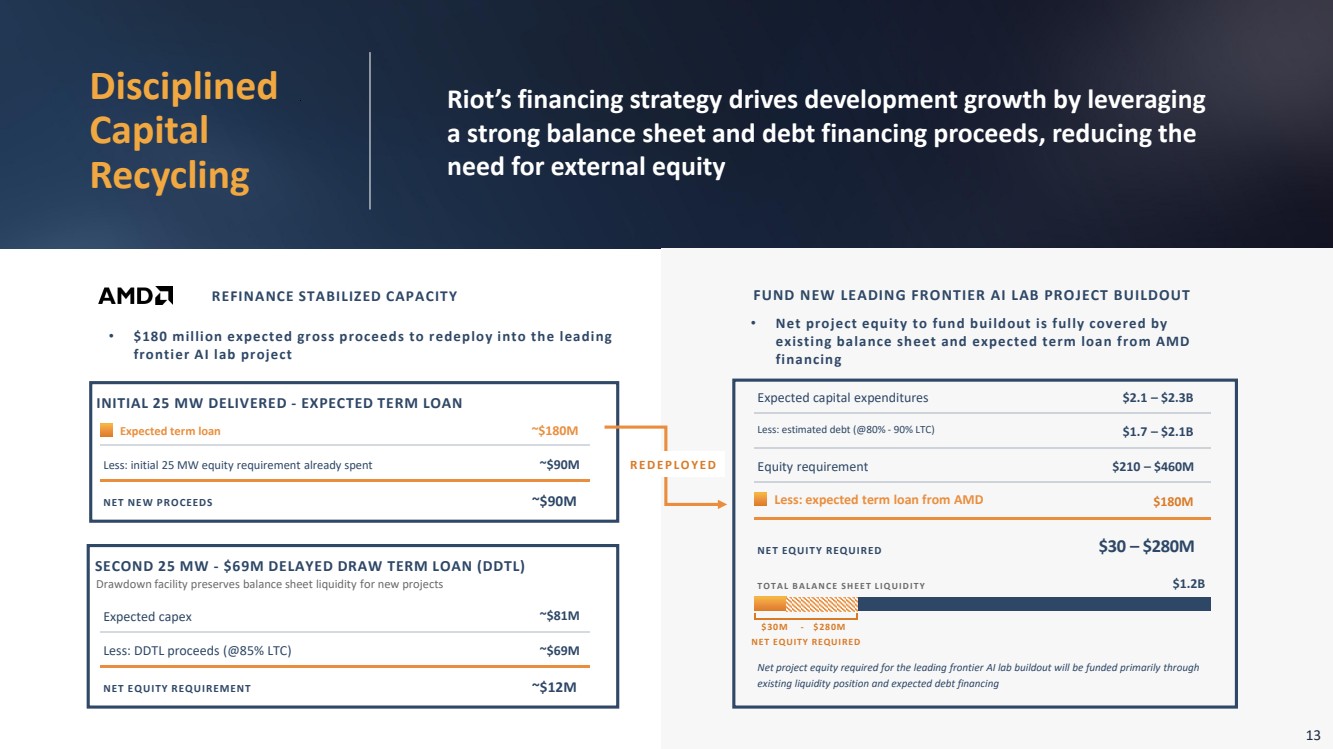
Riot’s financing strategy drives development growth by leveraging a strong balance sheet and debt financing proceeds, reducing the need for external equity 13 1 REFINANCE STABILIZED CAPACITY INITIAL 25 MW DELIVERED - EXPECTED TERM LOAN Expected term loan ~$180M Less: initial 25 MW equity requirement already spent ~$90M NET NEW PROCEEDS ~$90M SECOND 25 MW - $69M DELAYED DRAW TERM LOAN (DDTL) Drawdown facility preserves balance sheet liquidity for new projects Expected capex ~$81M Less: DDTL proceeds (@85% LTC) ~$69M NET EQUITY REQUIREMENT ~$12M 2 FUND NEW LEADING FRONTIER AI LAB PROJECT BUILDOUT Expected capital expenditures $2.1 – $2.3B Less: estimated debt (@80% - 90% LTC) $1.7 – $2.1B Equity requirement $210 – $460M Less: expected term loan from AMD $180M NET EQUITY REQUIRED $30 – $280M T O T A L B A L A N C E SH E E T L IQ U ID IT Y $1.2B NET EQUITY REQUIRED Net project equity required for the leading frontier AI lab buildout will be funded primarily through existing liquidity position and expected debt financing • $180 million expected gross proceeds to redeploy into the leading frontier AI lab project • Net project equity to fund buildout is fully covered by existing balance sheet and expected term loan from AMD financing R E D E P L O Y E D $30M - $280M Disciplined Capital Recycling 13 |
|
FINANCIAL UPDATE Q 2 2 0 2 6 S E C T I O N 4 : 14 |
|
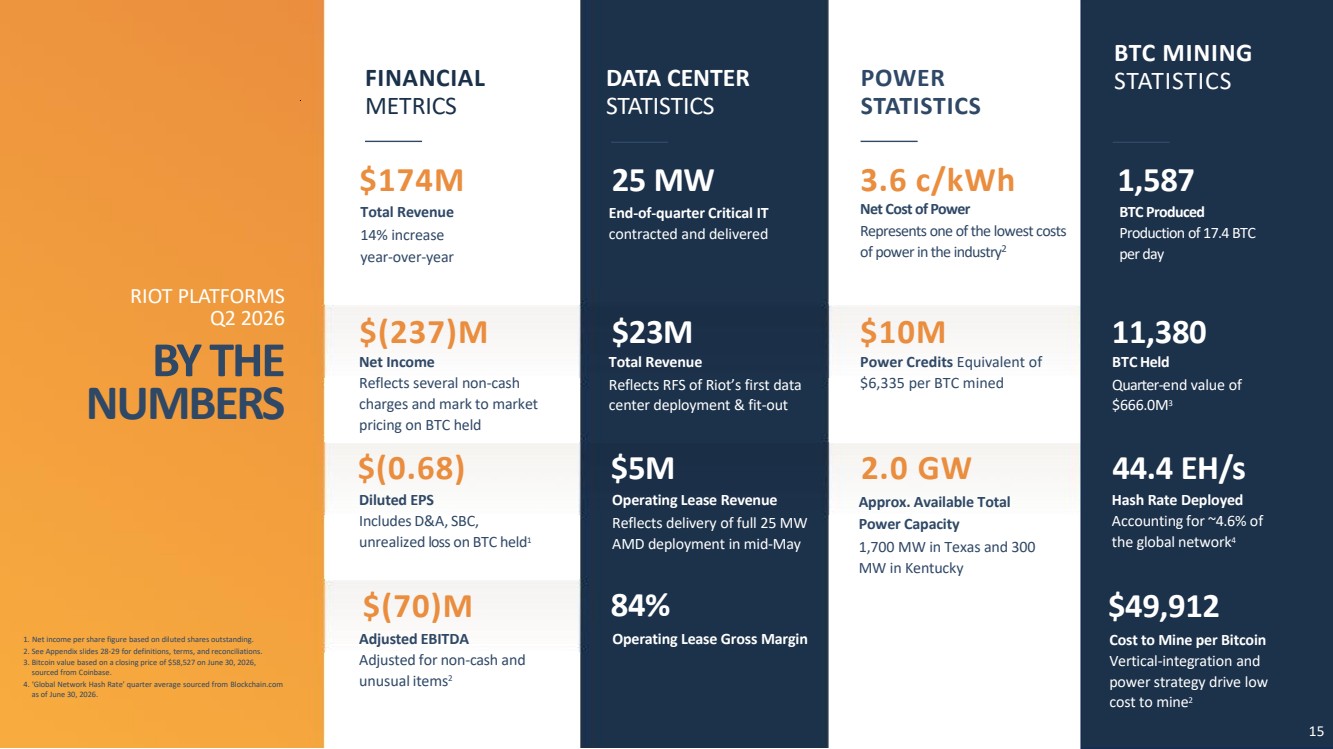
1. Net income per share figure based on diluted shares outstanding. 2. See Appendix slides 28-29 for definitions, terms, and reconciliations. 3. Bitcoin value based on a closing price of $58,527 on June 30, 2026, sourced from Coinbase. 4. ‘Global Network Hash Rate’ quarter average sourced from Blockchain.com as of June 30, 2026. FINANCIAL METRICS POWER STATISTICS Net Cost of Power Represents one of the lowest costs of power in the industry2 Power Credits Equivalent of $6,335 per BTC mined RIOT PLATFORMS Q2 2026 BY THE NUMBERS 3.6 c/kWh $10M Net Income Reflects several non-cash charges and mark to market pricing on BTC held Diluted EPS Includes D&A, SBC, unrealized loss on BTC held1 Adjusted EBITDA Adjusted for non-cash and unusual items2 Total Revenue 14% increase year-over-year Approx. Available Total Power Capacity 1,700 MW in Texas and 300 MW in Kentucky 15 DATA CENTER STATISTICS End-of-quarter Critical IT contracted and delivered Total Revenue Reflects RFS of Riot’s first data center deployment & fit-out 25 MW $23M Operating Lease Revenue Reflects delivery of full 25 MW AMD deployment in mid-May $5M 15 BTC MINING STATISTICS BTCHeld Quarter-end value of $666.0M3 BTC Produced Production of 17.4 BTC per day Hash Rate Deployed Accounting for ~4.6% of the global network4 Cost to Mine per Bitcoin Vertical-integration and power strategy drive low cost to mine2 Operating Lease Gross Margin 84% 1,587 11,380 44.4 EH/s $49,912 $174M $(237)M $(0.68) $(70)M 2.0 GW |
|
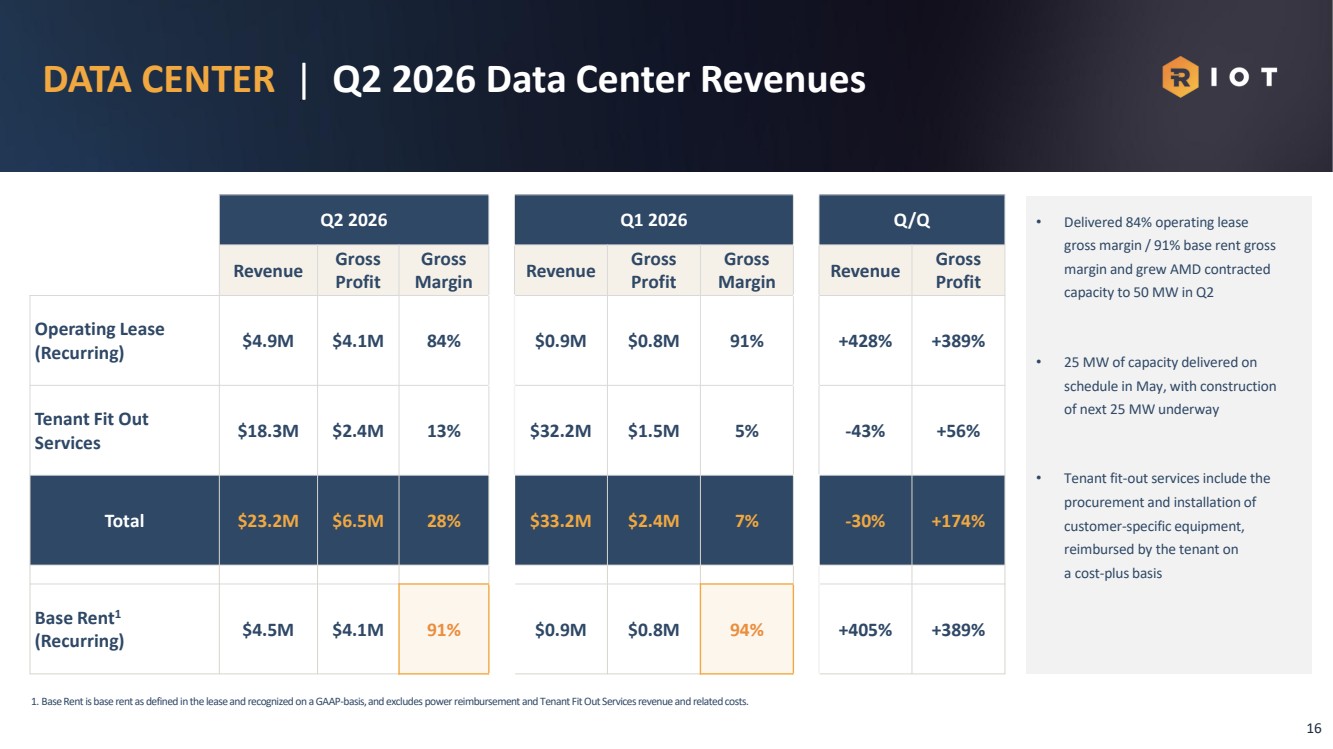
DATA CENTER | Q2 2026 Data Center Revenues 16 • Delivered 84% operating lease gross margin / 91% base rent gross margin and grew AMD contracted capacity to 50 MW in Q2 • 25 MW of capacity delivered on schedule in May, with construction of next 25 MW underway • Tenant fit-out services include the procurement and installation of customer-specific equipment, reimbursed by the tenant on a cost-plus basis Q2 2026 Q1 2026 Q/Q Revenue Gross Profit Gross Margin Revenue Gross Profit Gross Margin Revenue Gross Profit Operating Lease (Recurring) $4.9M $4.1M 84% $0.9M $0.8M 91% +428% +389% Tenant Fit Out Services $18.3M $2.4M 13% $32.2M $1.5M 5% -43% +56% Total $23.2M $6.5M 28% $33.2M $2.4M 7% -30% +174% Base Rent1 (Recurring) $4.5M $4.1M 91% $0.9M $0.8M 94% +405% +389% 1. Base Rent is base rent as defined in the lease and recognized on a GAAP-basis, and excludes power reimbursement and Tenant Fit Out Services revenue and related costs. |
|
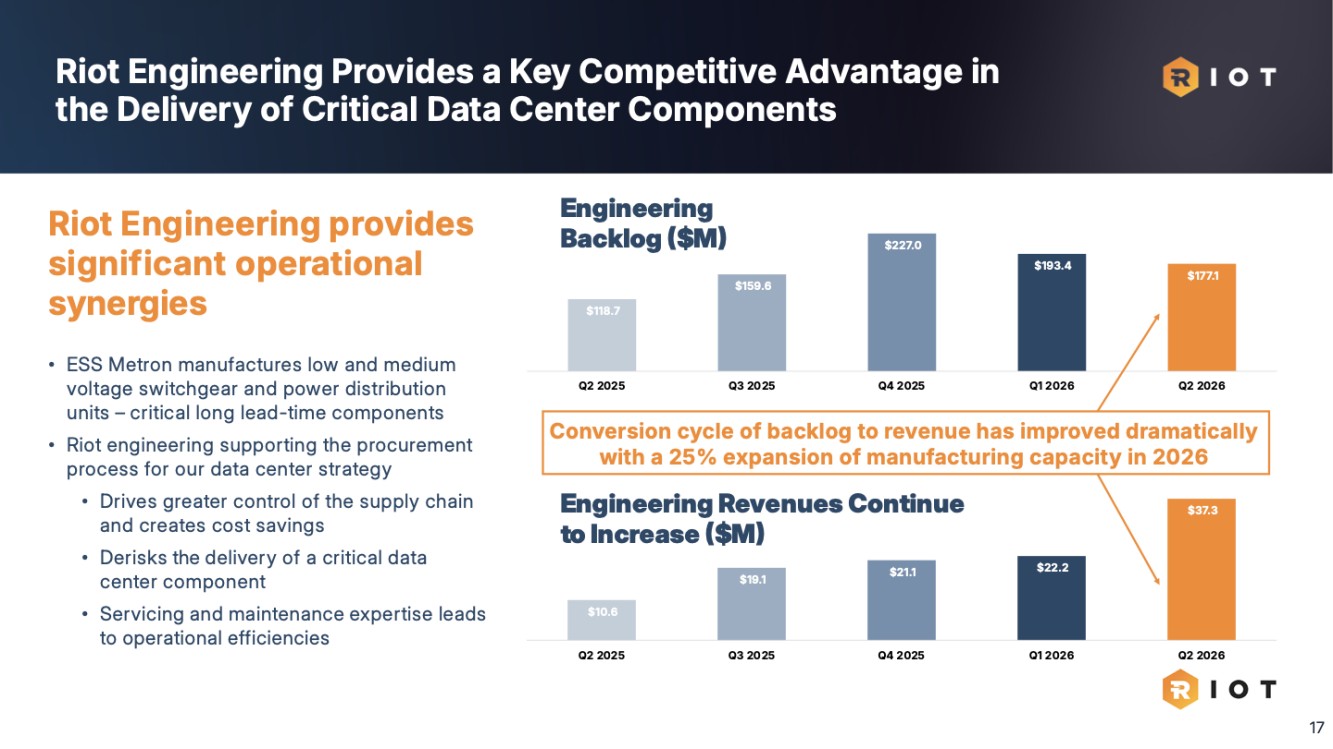
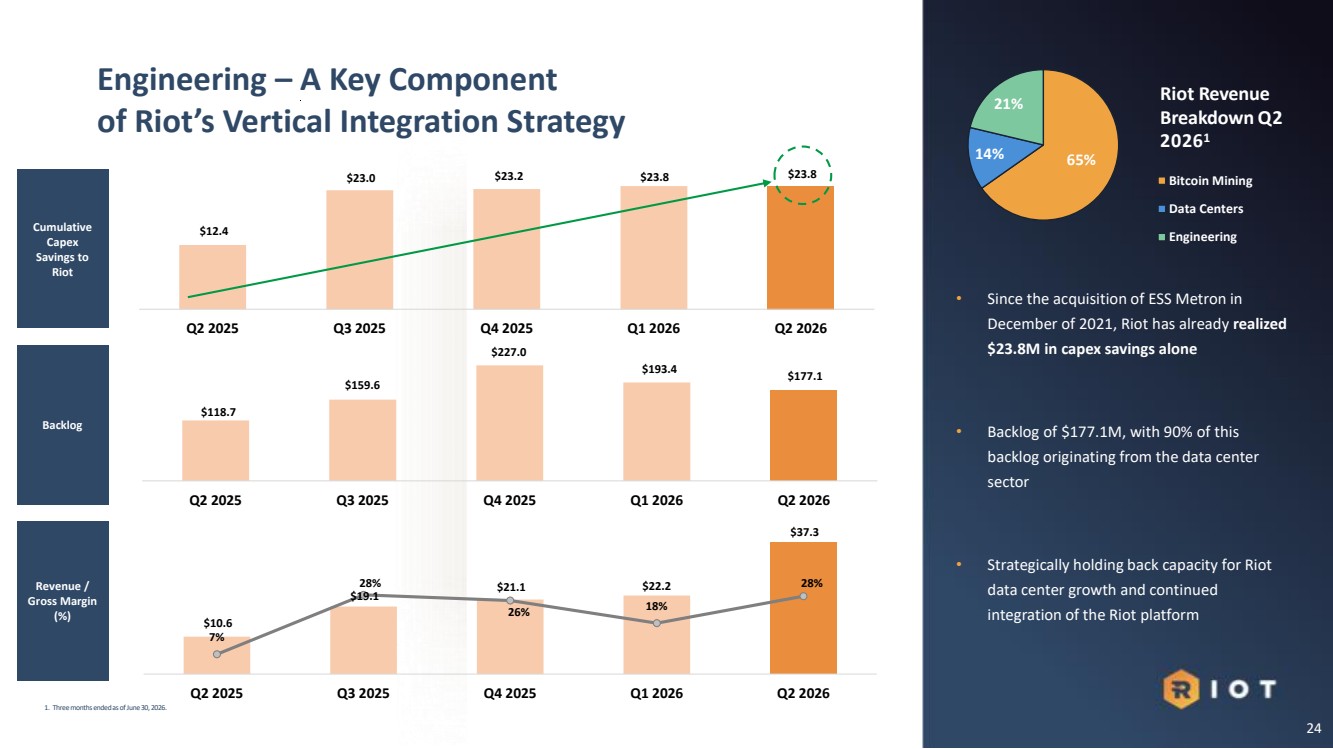
Riot Engineering Provides a Key Competitive Advantage in the Delivery of Critical Data Center Components 17 Riot Engineering provides significant operational synergies • ESS Metron manufactures low and medium voltage switchgear and power distribution units – critical long lead-time components • Riot engineering supporting the procurement process for our data center strategy • Drives greater control of the supply chain and creates cost savings • Derisksthe delivery of a critical data center component • Servicing and maintenance expertise leads to operational efficiencies Data center sector represents 90% of current backlog 17 $10.6 $19.1 $21.1 $22.2 $37.3 Q2 2025 Q3 2025 Q4 2025 Q1 2026 Q2 2026 $118.7 $159.6 $227.0 $193.4 $177.1 Q2 2025 Q3 2025 Q4 2025 Q1 2026 Q2 2026 Conversion cycle of backlog to revenue has improved dramatically with a 25% expansion of manufacturing capacity in 2026 Engineering Backlog ($M) Engineering Revenues Continue to Increase ($M) |
|
CLOSING REMARKS S E C T I O N 5 : 18 |
|
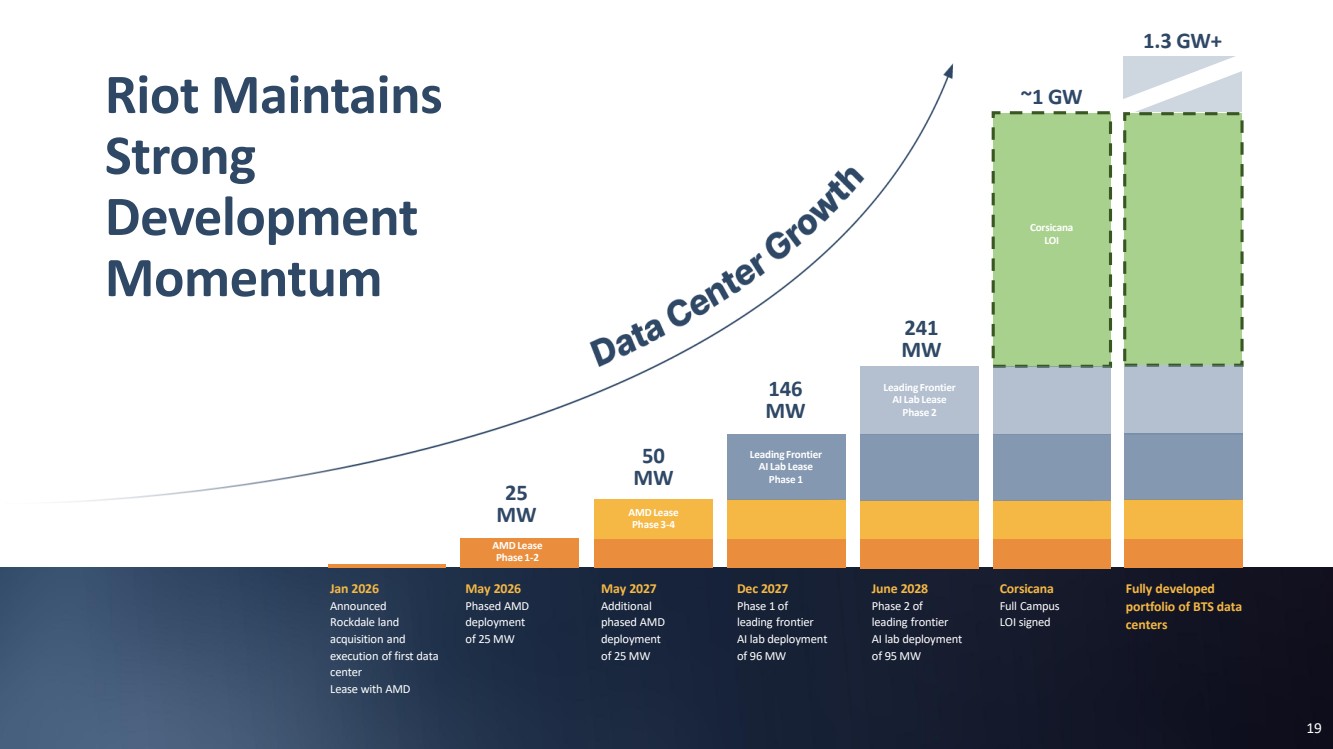
Riot Maintains Strong Development Momentum Jan 2026 Announced Rockdale land acquisition and execution of first data center Lease with AMD May 2026 Phased AMD deployment of 25 MW May 2027 Additional phased AMD deployment of 25 MW Dec 2027 Phase 1 of leading frontier AI lab deployment of 96 MW 241 MW June 2028 Phase 2 of leading frontier AI lab deployment of 95 MW Fully developed portfolio of BTS data centers AMD Lease Phase 1-2 AMD Lease Phase 3-4 Leading Frontier AI Lab Lease Phase 1 146 MW 50 MW 25 MW ~1 GW Corsicana Full Campus LOI signed Corsicana LOI 1.3 GW+ Leading Frontier AI Lab Lease Phase 2 19 |
|
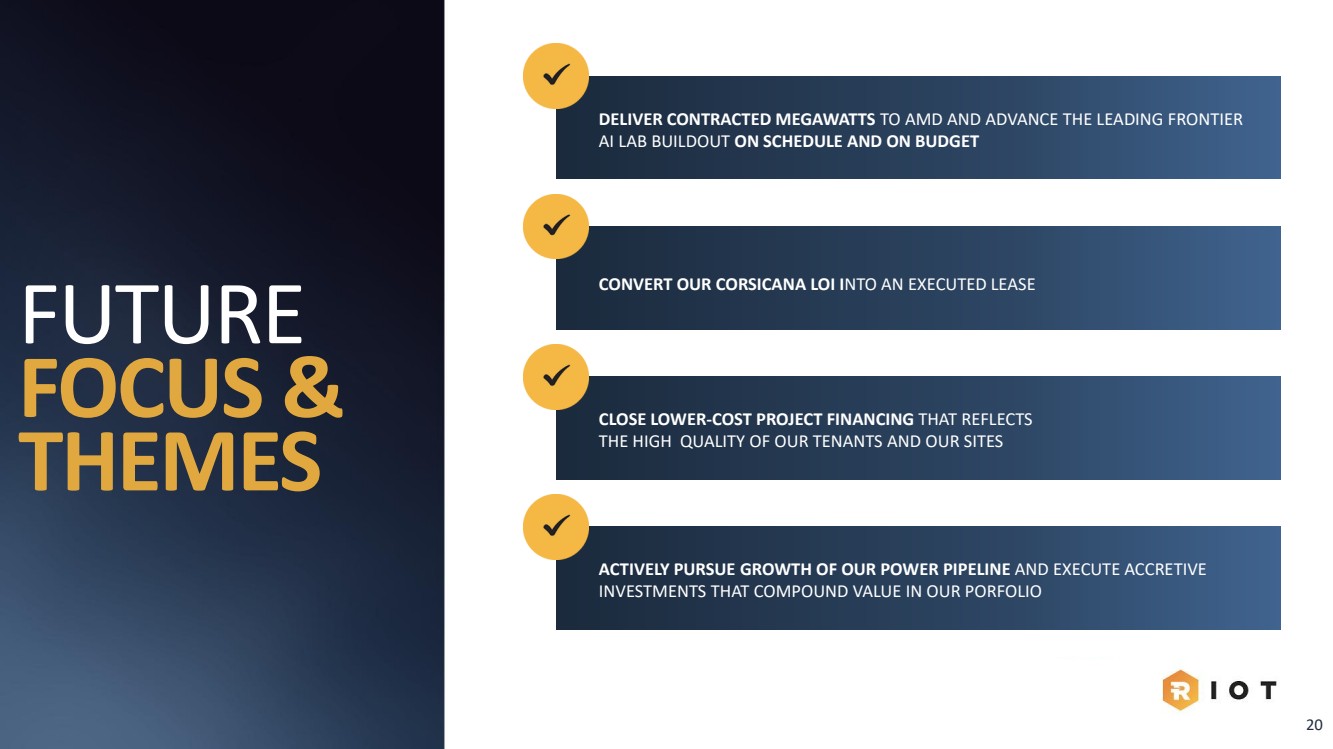
FUTURE FOCUS & THEMES 20 DELIVER CONTRACTED MEGAWATTS TO AMD AND ADVANCE THE LEADING FRONTIER AI LAB BUILDOUT ON SCHEDULE AND ON BUDGET CONVERT OUR CORSICANA LOI INTO AN EXECUTED LEASE CLOSE LOWER-COST PROJECT FINANCING THAT REFLECTS THE HIGH QUALITY OF OUR TENANTS AND OUR SITES ACTIVELY PURSUE GROWTH OF OUR POWER PIPELINE AND EXECUTE ACCRETIVE INVESTMENTS THAT COMPOUND VALUE IN OUR PORFOLIO |
|
Q2 2026 DATA OPERATIONAL A P P E N D I X 21 |
|
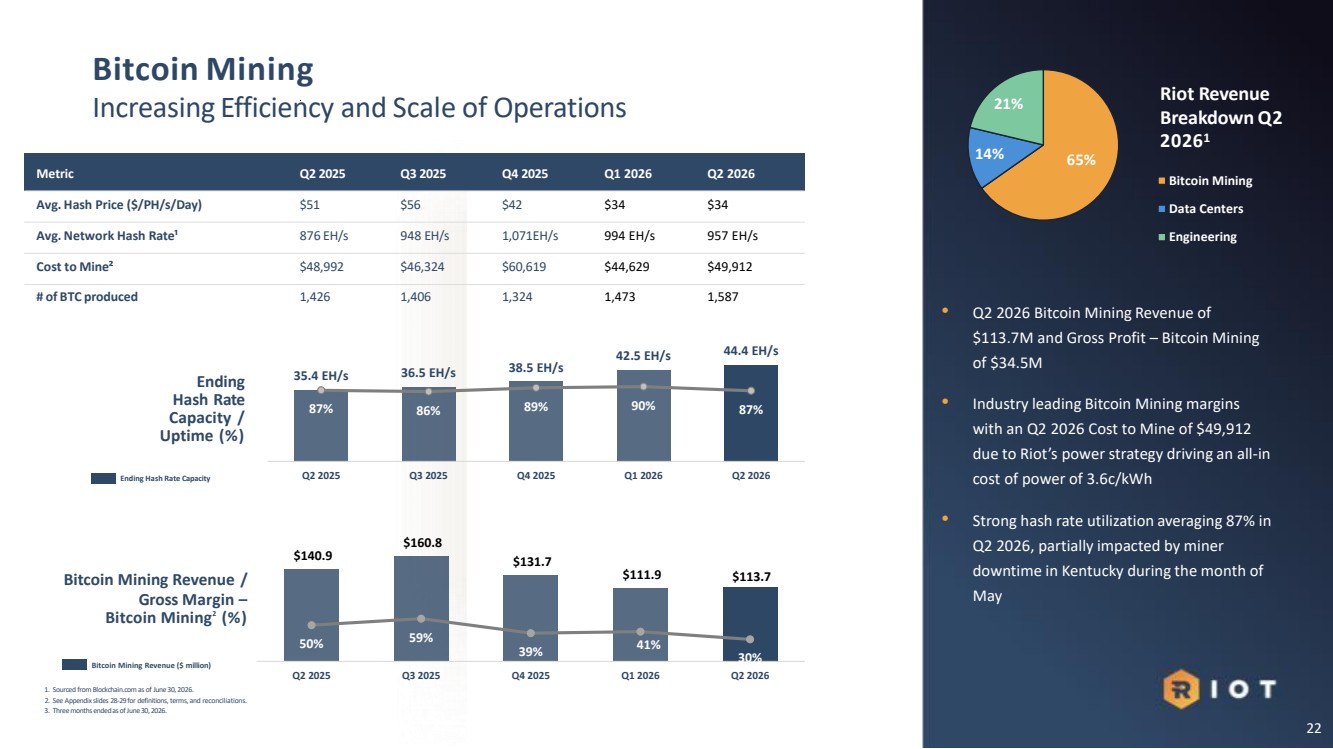
$140.9 $160.8 $131.7 $111.9 $113.7 50% 59% 39% 41% 30% Q2 2025 Q3 2025 Q4 2025 Q1 2026 Q2 2026 35.4 EH/s 36.5 EH/s 38.5 EH/s 42.5 EH/s 44.4 EH/s 87% 86% 89% 90% 87% Q2 2025 Q3 2025 Q4 2025 Q1 2026 Q2 2026 • Q2 2026 Bitcoin Mining Revenue of $113.7M and Gross Profit – Bitcoin Mining of $34.5M • Industry leading Bitcoin Mining margins with an Q2 2026 Cost to Mine of $49,912 due to Riot’s power strategy driving an all-in cost of power of 3.6c/kWh • Strong hash rate utilization averaging 87% in Q2 2026, partially impacted by miner downtime in Kentucky during the month of May Metric Q2 2025 Q3 2025 Q4 2025 Q1 2026 Q2 2026 Avg. Hash Price ($/PH/s/Day) $51 $56 $42 $34 $34 Avg. Network Hash Rate¹ 876 EH/s 948 EH/s 1,071EH/s 994 EH/s 957 EH/s Cost to Mine² $48,992 $46,324 $60,619 $44,629 $49,912 # of BTC produced 1,426 1,406 1,324 1,473 1,587 Ending Hash Rate Capacity / Uptime (%) Bitcoin Mining Increasing Efficiency and Scale of Operations Bitcoin Mining Revenue / Gross Margin – Bitcoin Mining2 (%) Ending Hash Rate Capacity Bitcoin Mining Revenue ($ million) 1. Sourced fromBlockchain.comas of June 30, 2026. 2. See Appendix slides 28-29 for definitions, terms, and reconciliations. 3. Three months ended as of June 30, 2026. 22 14% 65% 21% Bitcoin Mining Data Centers Engineering Riot Revenue Breakdown Q2 20261 |
|
$46,313 $49,912 $9,934 $6,335 Q2 2026 Total Direct Costs per BTC Q2 2026 Power Credits Per BTC Q2 2026 Net Direct Costs per BTC $43,597 $48,992 $11,224 $5,829 Q2 2025 Total Direct Costs per BTC Q2 2025 Power Credits Per BTC Q2 2025 Net Direct Costs per BTC Q2 2025 vs. Q2 2026 Cost to Mine per BTC Q2 2025 1 1,426 BTC Mined Avg. BTC Price of $98,800 Q2 2026 2 1,587 BTC Mined Avg. BTC Price of $71,667 23 1.Three months ended as of June 30, 2025. See Appendix on slides 28-29 for definitions, terms, and reconciliations. 2.Three months ended as of June 30, 2026. See Appendix on slides 28-29 for definitions, terms, and reconciliations. Despite BTC Mining Headwinds, Lost Cost to Mine Drives Continued Profitability • Average global network hash rate up 9% in Q2 2026 vs Q2 2025 • Global network hash rate avg. 957 EH/s in Q2 2026 versus 876 EH/s in Q2 2025 • ‘Non-Power’ includes direct labor, miner insurance, miner and miner-related equipment repair, land lease, property taxes, network costs and other utilities expenses • Riot’s power strategy generated significant power curtailment credits of $10.1 million in Q2 2026, driving an all-in cost of power of 3.6c/kWh • Equates to $6,335 per BTC for the quarter Non-Power Power Non-Power Power |
|
$10.6 $19.1 $21.1 $22.2 $37.3 7% 28% 26% 18% 28% 0% 10% 20% 30% 40% 50% $- $10.0 $20.0 $30.0 $40.0 Q2 2025 Q3 2025 Q4 2025 Q1 2026 Q2 2026 • Since the acquisition of ESS Metron in December of 2021, Riot has already realized $23.8M in capex savings alone • Backlog of $177.1M, with 90% of this backlog originating from the data center sector • Strategically holding back capacity for Riot data center growth and continued integration of the Riot platform Cumulative Capex Savings to Riot Backlog Revenue / Gross Margin (%) 24 Engineering – A Key Component of Riot’s Vertical Integration Strategy 1. Three months ended as of June 30, 2026. $12.4 $23.0 $23.2 $23.8 $23.8 Q2 2025 Q3 2025 Q4 2025 Q1 2026 Q2 2026 $118.7 $159.6 $227.0 $193.4 $177.1 Q2 2025 Q3 2025 Q4 2025 Q1 2026 Q2 2026 14% 65% 21% Bitcoin Mining Data Centers Engineering Riot Revenue Breakdown Q2 20261 |
|
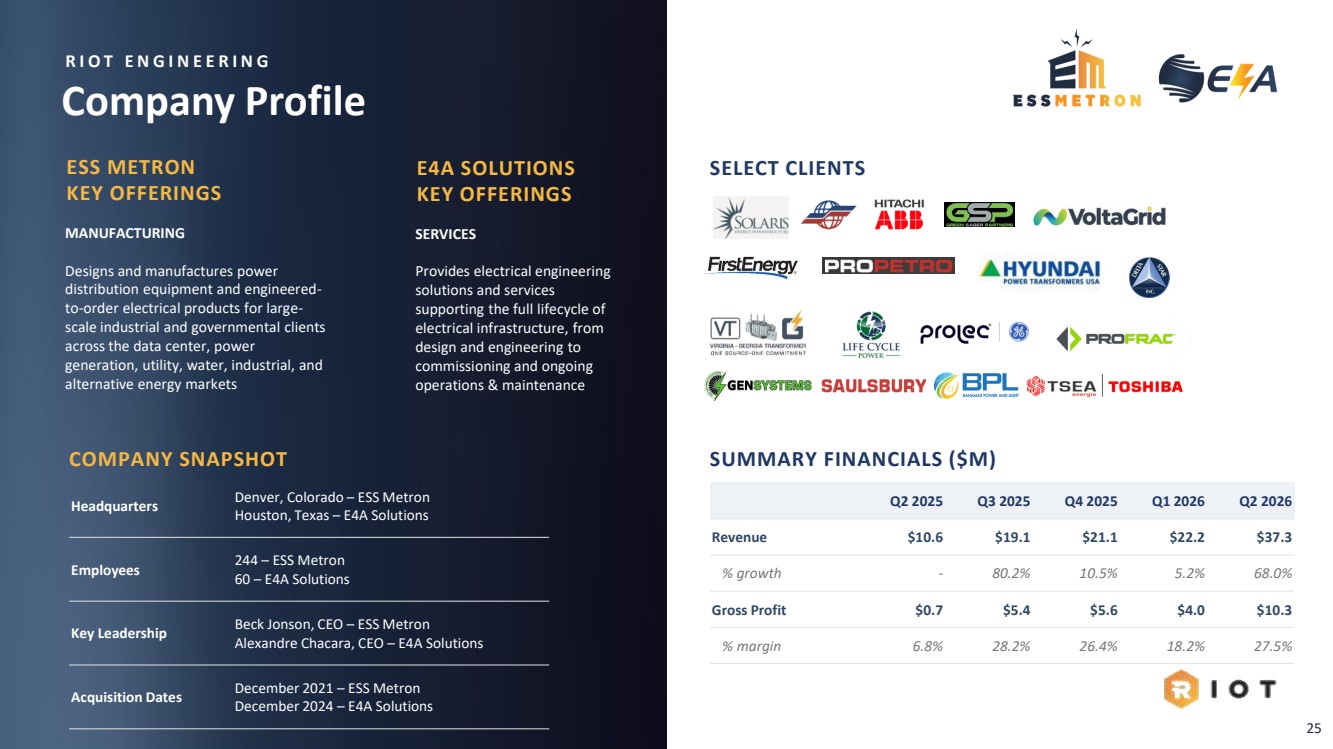
Company Profile 25 COMPANY SNAPSHOT Headquarters Denver, Colorado – ESS Metron Houston, Texas – E4A Solutions Employees 244 – ESS Metron 60 – E4A Solutions Key Leadership Beck Jonson, CEO – ESS Metron Alexandre Chacara, CEO – E4A Solutions Acquisition Dates December 2021 – ESS Metron December 2024 – E4A Solutions ESS METRON KEY OFFERINGS Q2 2025 Q3 2025 Q4 2025 Q1 2026 Q2 2026 Revenue $10.6 $19.1 $21.1 $22.2 $37.3 % growth - 80.2% 10.5% 5.2% 68.0% Gross Profit $0.7 $5.4 $5.6 $4.0 $10.3 % margin 6.8% 28.2% 26.4% 18.2% 27.5% SUMMARY FINANCIALS ($M) SELECT CLIENTS MANUFACTURING Designs and manufactures power distribution equipment and engineered-to-order electrical products for large-scale industrial and governmental clients across the data center, power generation, utility, water, industrial, and alternative energy markets E4A SOLUTIONS KEY OFFERINGS SERVICES Provides electrical engineering solutions and services supporting the full lifecycle of electrical infrastructure, from design and engineering to commissioning and ongoing operations & maintenance R I O T E N G I N E E R I N G |
|
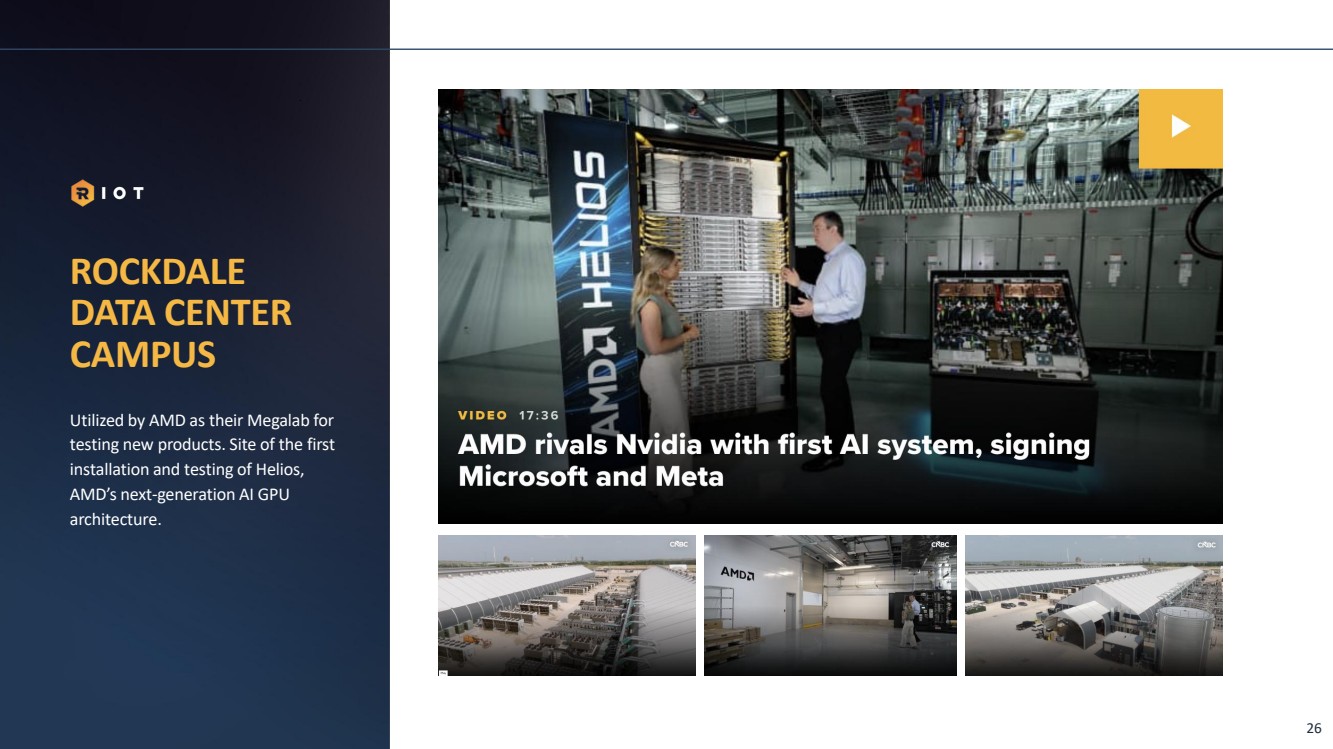
Utilized by AMD as their Megalab for testing new products. Site of the first installation and testing of Helios, AMD’s next -generation AI GPU architecture. ROCKDALE DATA CENTER CAMPUS 26 |
|
Q2 2026 DATA FINANCIAL A P P E N D I X 27 |
|
Definitions, Terms, and Reconciliations (Unaudited) 1.Other direct cost of revenue includes compensation, insurance, repairs, and ground lease rent and related property tax. 2.Costs to finance the purchase of miners were zero in all periods presented as the miners were paid for with cash from the Company’s cash balance. The seller did not provide any financing, nor did the Company borrow from a third-party to purchase the miners. 3.Power curtailment credits are credited against our power invoices as a result of temporarily pausing our operations to participate in ERCOT’s Demand Response Service Programs. Our fixed-price power purchase contracts enable us to strategically curtail our mining operations and participate in these programs, which significantly lower our cost to mine bitcoin. These credits are recognized in Power Curtailment Credits on our Consolidated Statement of Operations, outside of cost of revenue. 4.Computed as revenue recognized from bitcoin mined divided by the quantity of bitcoin mined during the same period. 28 COST TO MINE The Company defines Cost to Mine as the direct cost to mine one Bitcoin, excluding Bitcoin miner depreciation, as calculated in the table below COST OF POWER The Company defines Cost of Power as the cost of power directly used in the process of mining Bitcoin, less power curtailment credits, divided by kilowatt ("kWh") hours used June 30, September 30, December 31, March 31, June 30, 2025 2025 2025 2026 2026 2026 2025 Total Cost of Power $ 62,170 $ 82,370 $ 75,027 $ 72,317 $ 73,499 $ 145,816 $ 123,999 less: Power curtailment credits (8,313) (30,634) (9,981) (21,023) (10,054) (31,077) (16,114) Net Cost of Power $ 53,857 $ 51,736 $ 65,046 $ 51,294 $ 63,445 $ 114,739 $ 107,885 kWh used 1,538,273,540 1,592,798,508 1,669,276,467 1,735,496,392 1,785,649,387 3,521,145,779 2,556,632,711 Cost of Power (c/kWh) $ 3.5 $ 3.2 $ 3.9 $ 3.0 $ 3.6 $ 3.3 $ 4.2 Three Months Ended Six Months Ended June 30, June 30, September 30, December 31, March 31, June 30, 2025 2025 2025 2026 2026 2026 2025 Cost of power for self-mining operations $ 62,170 $ 82,370 $ 75,027 $ 72,317 $ 73,499 $ 145,816 $ 123,999 Other direct cost of revenue for self-mining operations(1)(2), excluding Bitcoin miner depreciation 16,005 13,395 15,226 14,445 15,765 30,210 28,994 Cost of revenue for self-mining operations, excluding Bitcoin miner depreciation 78,175 95,765 90,253 86,762 89,264 176,026 152,993 Less: power curtailment credits(3) (8,313) (30,634) (9,981) (21,023) (10,054) (31,077) (16,114) Cost of revenue for self-mining operations, net of power curtailment credits, excluding Bitcoin miner depreciation 69,862 65,131 80,272 65,739 79,210 144,949 136,879 Bitcoin miner depreciation 60,252 60,106 60,154 76,086 64,622 140,708 117,314 Cost of revenue for self-mining operations, net of power curtailment credits, including Bitcoin miner depreciation $ 130,114 $ 125,237 $ 140,426 $ 141,825 $ 143,832 $ 285,657 $ 254,193 Quantity of Bitcoin mined 1,426 1,406 1,324 1,473 1,587 3,060 2,956 Production value of one Bitcoin mined(4) $ 98,800 $ 114,361 $ 99,482 $ 75,964 $ 71,667 $ 73,736 $ 95,991 Cost to mine one Bitcoin, excluding Bitcoin miner depreciation $ 48,992 $ 46,324 $ 60,619 $ 44,629 $ 49,912 $ 47,369 $ 46,305 Cost to mine one Bitcoin, excluding Bitcoin miner depreciation, as a % of production value of one Bitcoin mined 49.6% 40.5% 60.9% 58.8% 69.6% 64.2% 48.2% Cost to mine one Bitcoin, including Bitcoin miner depreciation $ 91,244 $ 89,074 $ 106,045 $ 96,283 $ 90,631 $ 93,352 $ 85,992 Cost to mine one Bitcoin, including Bitcoin miner depreciation, as a % of production value of one Bitcoin mined 92.4% 77.9% 106.6% 126.7% 126.5% 126.6% 89.6% Three Months Ended Six Months Ended June 30, |
|
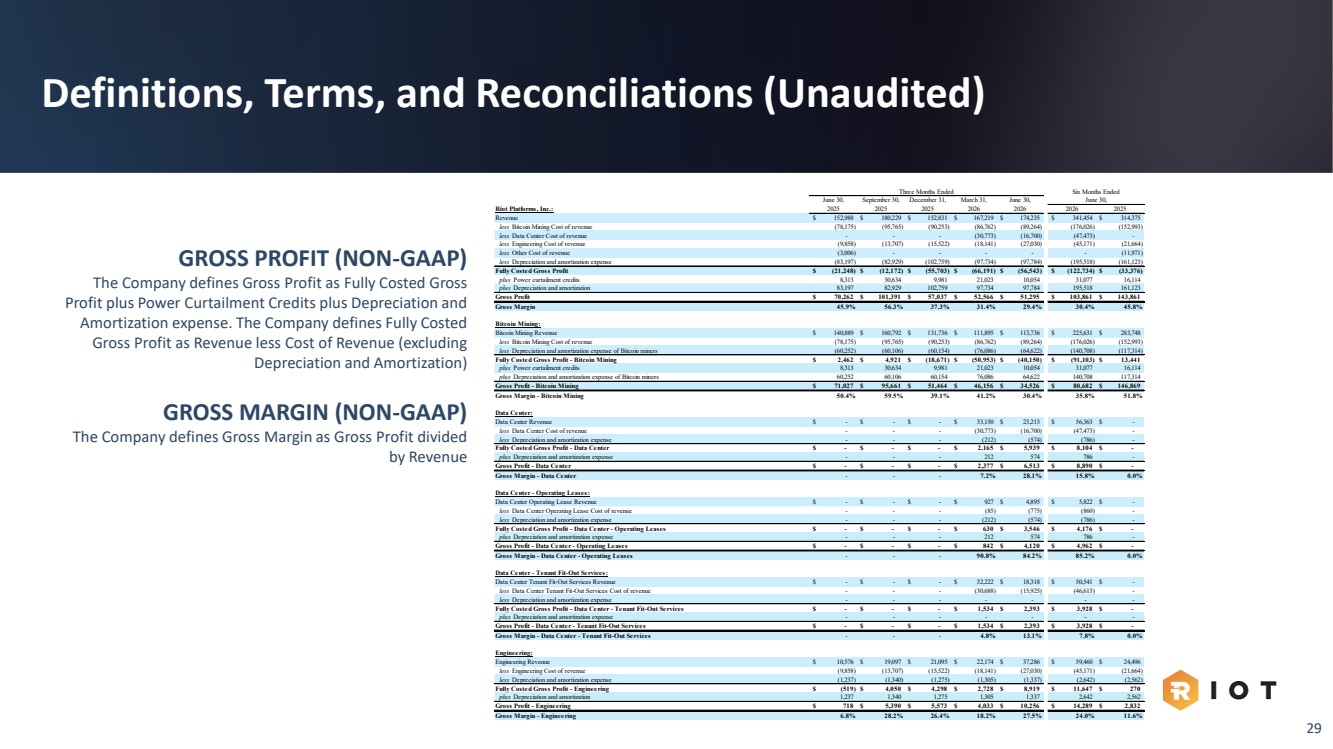
Definitions, Terms, and Reconciliations (Unaudited) 29 GROSS PROFIT (NON-GAAP) The Company defines Gross Profit as Fully Costed Gross Profit plus Power Curtailment Credits plus Depreciation and Amortization expense. The Company defines Fully Costed Gross Profit as Revenue less Cost of Revenue (excluding Depreciation and Amortization) GROSS MARGIN (NON-GAAP) The Company defines Gross Margin as Gross Profit divided by Revenue June 30, September 30, December 31, March 31, June 30, Riot Platforms, Inc.: 2025 2025 2025 2026 2026 2026 2025 Revenue $ 152,988 $ 180,229 $ 152,831 $ 167,219 $ 174,235 $ 341,454 $ 314,375 less Bitcoin Mining Cost of revenue (78,175) (95,765) (90,253) (86,762) (89,264) (176,026) (152,993) less Data Center Cost of revenue - - - (30,773) (16,700) (47,473) - less Engineering Cost of revenue (9,858) (13,707) (15,522) (18,141) (27,030) (45,171) (21,664) less Other Cost of revenue (3,006) - - - - - (11,971) less Depreciation and amortization expense (83,197) (82,929) (102,759) (97,734) (97,784) (195,518) (161,123) Fully Costed Gross Profit $ (21,248) $ (12,172) $ (55,703) $ (66,191) $ (56,543) $ (122,734) $ (33,376) plus Power curtailment credits 8,313 30,634 9,981 21,023 10,054 31,077 16,114 plus Depreciation and amortization 83,197 82,929 102,759 97,734 97,784 195,518 161,123 Gross Profit $ 70,262 $ 101,391 $ 57,037 $ 52,566 $ 51,295 $ 103,861 $ 143,861 Gross Margin 45.9% 56.3% 37.3% 31.4% 29.4% 30.4% 45.8% Bitcoin Mining: Bitcoin Mining Revenue $ 140,889 $ 160,792 $ 131,736 $ 111,895 $ 113,736 $ 225,631 $ 283,748 less Bitcoin Mining Cost of revenue (78,175) (95,765) (90,253) (86,762) (89,264) (176,026) (152,993) less Depreciation and amortization expense of Bitcoin miners (60,252) (60,106) (60,154) (76,086) (64,622) (140,708) (117,314) Fully Costed Gross Profit - Bitcoin Mining $ 2,462 $ 4,921 $ (18,671) $ (50,953) $ (40,150) $ (91,103) $ 13,441 plus Power curtailment credits 8,313 30,634 9,981 21,023 10,054 31,077 16,114 plus Depreciation and amortization expense of Bitcoin miners 60,252 60,106 60,154 76,086 64,622 140,708 117,314 Gross Profit - Bitcoin Mining $ 71,027 $ 95,661 $ 51,464 $ 46,156 $ 34,526 $ 80,682 $ 146,869 Gross Margin - Bitcoin Mining 50.4% 59.5% 39.1% 41.2% 30.4% 35.8% 51.8% Data Center: Data Center Revenue $ - $ - $ - $ 33,150 $ 23,213 $ 56,363 $ - less Data Center Cost of revenue - - - (30,773) (16,700) (47,473) - less Depreciation and amortization expense - - - (212) (574) (786) - Fully Costed Gross Profit - Data Center $ - $ - $ - $ 2,165 $ 5,939 $ 8,104 $ - plus Depreciation and amortization expense - - - 212 574 786 - Gross Profit - Data Center $ - $ - $ - $ 2,377 $ 6,513 $ 8,890 $ - Gross Margin - Data Center - - - 7.2% 28.1% 15.8% 0.0% Data Center - Operating Leases: Data Center Operating Lease Revenue $ - $ - $ - $ 927 $ 4,895 $ 5,822 $ - less Data Center Operating Lease Cost of revenue - - - (85) (775) (860) - less Depreciation and amortization expense - - - (212) (574) (786) - Fully Costed Gross Profit - Data Center - Operating Leases $ - $ - $ - $ 630 $ 3,546 $ 4,176 $ - plus Depreciation and amortization expense - - - 212 574 786 - Gross Profit - Data Center - Operating Leases $ - $ - $ - $ 842 $ 4,120 $ 4,962 $ - Gross Margin - Data Center - Operating Leases - - - 90.8% 84.2% 85.2% 0.0% Data Center - Tenant Fit-Out Services: Data Center Tenant Fit-Out Services Revenue $ - $ - $ - $ 32,222 $ 18,318 $ 50,541 $ - less Data Center Tenant Fit-Out Services Cost of revenue - - - (30,688) (15,925) (46,613) - less Depreciation and amortization expense - - - - - - - Fully Costed Gross Profit - Data Center - Tenant Fit-Out Services $ - $ - $ - $ 1,534 $ 2,393 $ 3,928 $ - plus Depreciation and amortization expense - - - - - - - Gross Profit - Data Center - Tenant Fit-Out Services $ - $ - $ - $ 1,534 $ 2,393 $ 3,928 $ - Gross Margin - Data Center - Tenant Fit-Out Services - - - 4.8% 13.1% 7.8% 0.0% Engineering: Engineering Revenue $ 10,576 $ 19,097 $ 21,095 $ 22,174 $ 37,286 $ 59,460 $ 24,496 less Engineering Cost of revenue (9,858) (13,707) (15,522) (18,141) (27,030) (45,171) (21,664) less Depreciation and amortization expense (1,237) (1,340) (1,275) (1,305) (1,337) (2,642) (2,562) Fully Costed Gross Profit - Engineering $ (519) $ 4,050 $ 4,298 $ 2,728 $ 8,919 $ 11,647 $ 270 plus Depreciation and amortization 1,237 1,340 1,275 1,305 1,337 2,642 2,562 Gross Profit - Engineering $ 718 $ 5,390 $ 5,573 $ 4,033 $ 10,256 $ 14,289 $ 2,832 Gross Margin - Engineering 6.8% 28.2% 26.4% 18.2% 27.5% 24.0% 11.6% Three Months Ended Six Months Ended June 30, |
|
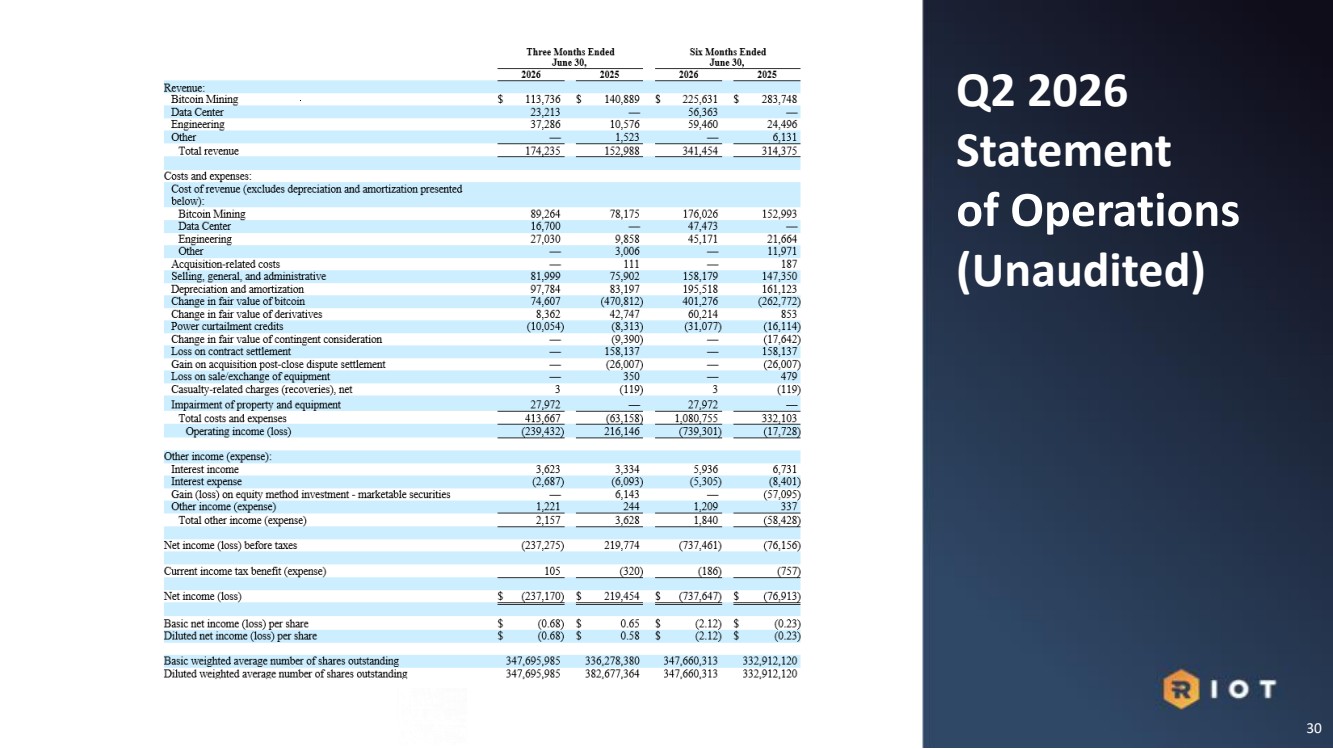
Q2 2026 Statement of Operations (Unaudited) 30 |
|
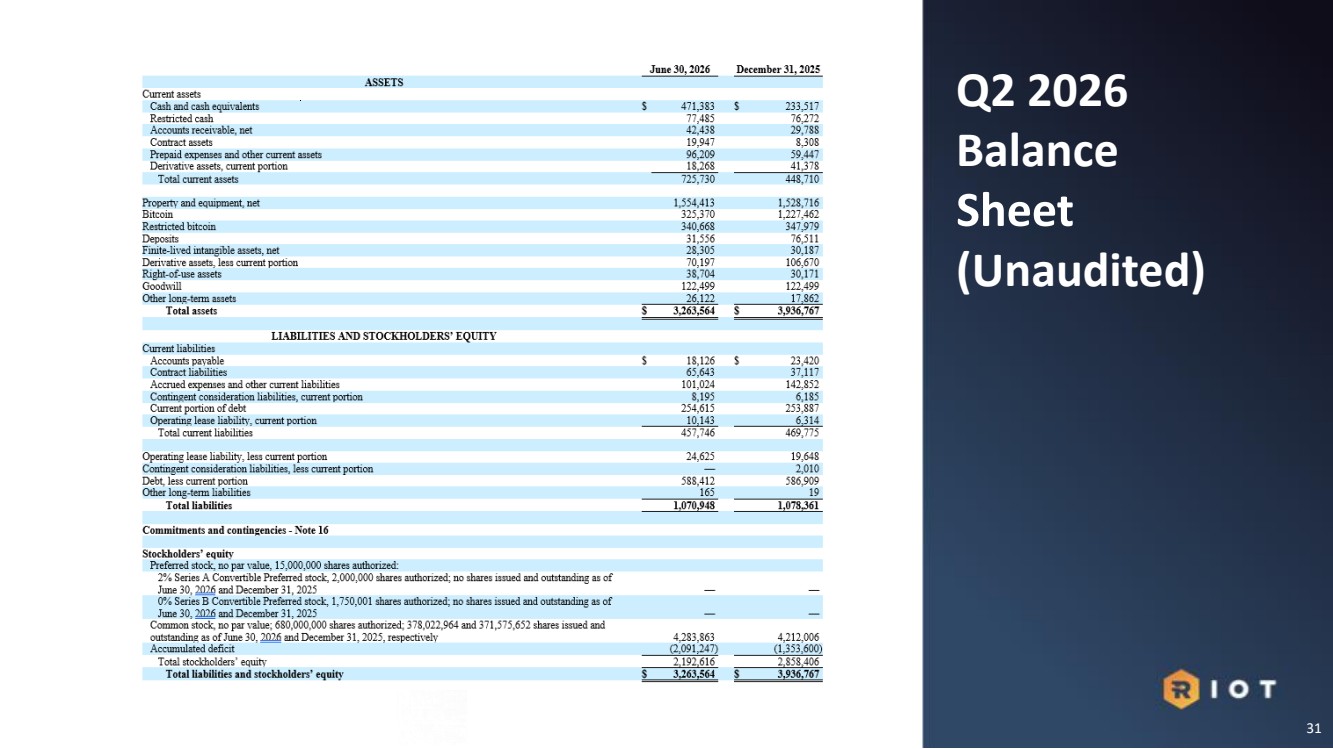
Q2 2026 Balance Sheet (Unaudited) 31 |
|
Non-GAAP Adjusted EBITDA (Unaudited) 32 * Indicates Non-GAAP measure. We use Adjusted EBITDA to eliminate the effects of certain non-cash and/or non-recurring items, that do not reflect our ongoing strategic business operations. Adjusted EBITDA is provided in addition to, and not as a substitute for, or as superior to, the comparable GAAP measure, Net Income. For a full reconciliation of the Non-GAAP measures we use to their comparable GAAP measures, see the discussion under the heading “Non-GAAP Measures”, under Item 2, “Management’s Discussion and Analysis of Financial Condition and Results of Operations” in our June 30, 2026, Form 10-Q. |
|
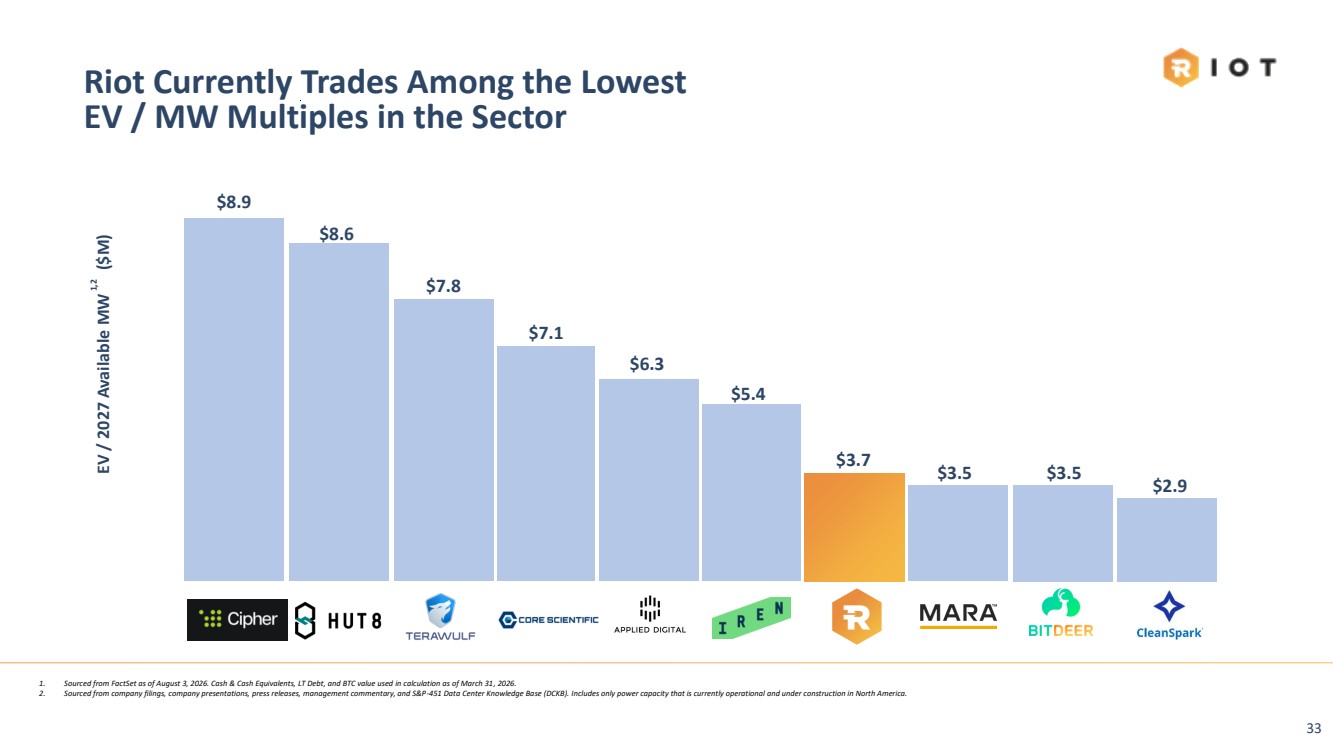
Riot Currently Trades Among the Lowest EV / MW Multiples in the Sector $8.9 $7.8 $6.3 $8.6 $5.4 $7.1 $3.7 $3.5 $2.9 EV / 2027 Available MW $3.5 ($M) 1,2 1. Sourced from FactSet as of August 3, 2026. Cash & Cash Equivalents, LT Debt, and BTC value used in calculation as of March 31, 2026. 2. Sourced from company filings, company presentations, press releases, management commentary, and S&P-451 Data Center Knowledge Base (DCKB). Includes only power capacity that is currently operational and under construction in North America. 33 |