エドガーで原本を確認する
U.S. SECURITIES AND EXCHANGE COMMISSION
Washington, D.C. 20549
FORM 6-K
REPORT OF FOREIGN PRIVATE ISSUER
PURSUANT TO RULE 13a-16 OR 15d-16 UNDER THE
SECURITIES EXCHANGE ACT OF 1934
Dated August 5, 2026
Commission File Number 1-14878
GERDAU S.A.
(Translation of Registrant’s Name into English)
Av. Dra. Ruth Cardoso, 8,501 – 8° andar
São Paulo, São Paulo - Brazil CEP 05425-070
(Address of principal executive offices)
Indicate by check mark whether the registrant files or will file annual reports under cover of Form 20-F or Form 40-F.
Form 20-F x Form 40-F ¨
Exhibit Index
| Exhibit | Description of Exhibit | |
| 99.1 | 2Q26 Earnings Presentation |
SIGNATURES
Pursuant to the requirements of the Securities Exchange Act of 1934, the registrant has duly caused this Report to be signed on its behalf by the undersigned, thereunto duly authorized.
Date: August 5, 2026
| GERDAU S.A. | ||
| By: | /s/ Rafael Dorneles Japur | |
| Name: | Rafael Dorneles Japur | |
| Title: | Vice-President and Investor Relations Officer | |
|
2Q26 Earnings Release August 5th, 2026 |
|
DISCLAIMER This document may contain forward-looking statements. These statements are based on estimates, information or methods that may be incorrect or inaccurate and that may not occur. These estimates are also subject to risks, uncertainties, and assumptions that include, among other factors, general economic, political, and commercial conditions in Brazil and in the markets where we operate, as well as existing and future government regulations. Potential investors are cautioned that these forward-looking statements do not constitute guarantees of future performance, given that they involve risks and uncertainties. Gerdau does not undertake, and expressly waives, any obligation to update any of these forward-looking statements, which speak only as of the date they were made. |
|
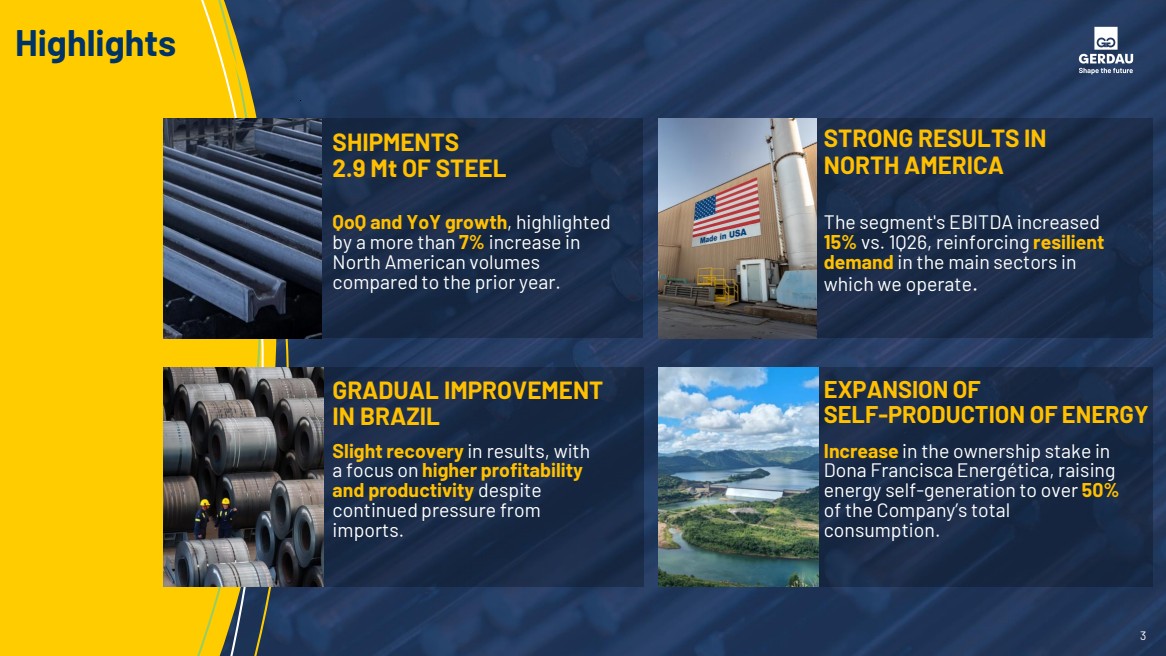
3 Highlights STRONG RESULTS IN NORTH AMERICA EXPANSION OF SELF-PRODUCTION OF ENERGY Increase in the ownership stake in Dona Francisca Energética, raising energy self-generation to over 50% of the Company’s total consumption. QoQ and YoY growth, highlighted by a more than 7% increase in North American volumes compared to the prior year. Slight recovery in results, with a focus on higher profitability and productivity despite continued pressure from imports. SHIPMENTS 2.9 Mt OF STEEL GRADUAL IMPROVEMENT IN BRAZIL The segment's EBITDA increased 15% vs. 1Q26, reinforcing resilient demand in the main sectors in which we operate. |
|
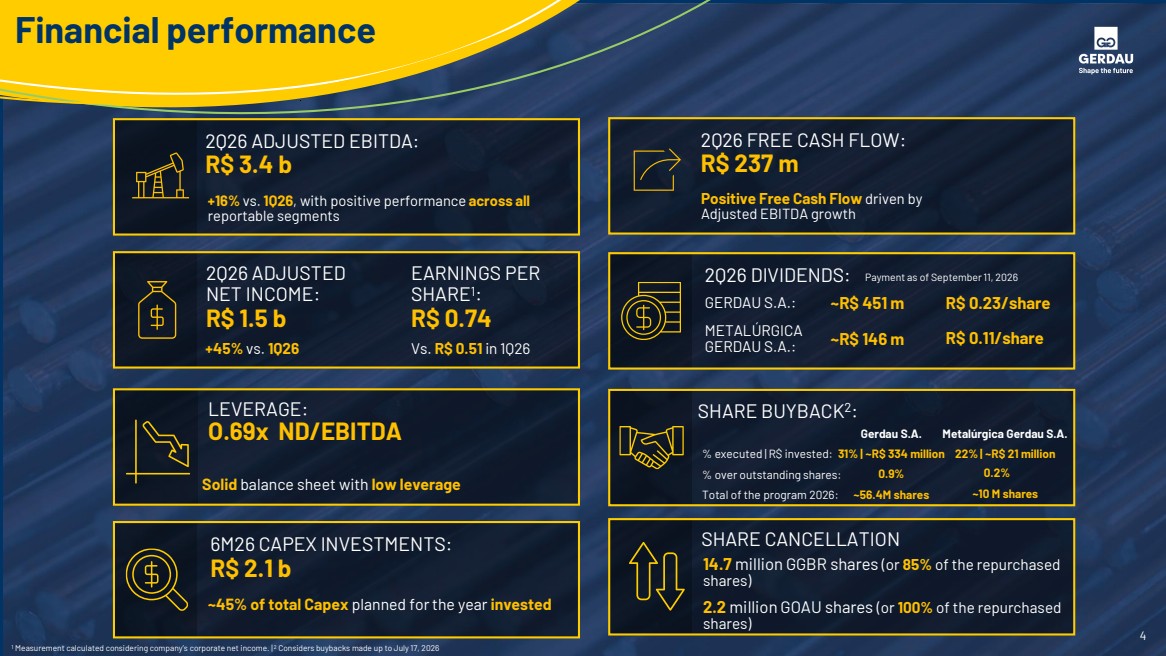
4 Financial performance 6M26 CAPEX INVESTMENTS: R$ 2.1 b ~45% of total Capex planned for the year invested SHARE CANCELLATION 2Q26 ADJUSTED EBITDA: R$ 3.4 b +16% vs. 1Q26, with positive performance across all reportable segments LEVERAGE: O.69x ND/EBITDA Solid balance sheet with low leverage SHARE BUYBACK2 : 1 Measurement calculated considering company’s corporate net income. | 2 Considers buybacks made up to July 17, 2026 % executed | R$ invested: % over outstanding shares: 31% | ~R$ 334 million 0.9% Gerdau S.A. EARNINGS PER SHARE1 : R$ 0.74 2Q26 ADJUSTED NET INCOME: R$ 1.5 b +45% vs. 1Q26 Vs. R$ 0.51 in 1Q26 2Q26 FREE CASH FLOW: R$ 237 m Positive Free Cash Flow driven by Adjusted EBITDA growth Total of the program 2026: ~56.4M shares GERDAU S.A.: 2Q26 DIVIDENDS: METALÚRGICA GERDAU S.A.: Payment as of September 11, 2026 R$ 0.23/share ~R$ 146 m R$ 0.11/share ~R$ 451 m 14.7 million GGBR shares (or 85% of the repurchased shares) 2.2 million GOAU shares (or 100% of the repurchased shares) 22% | ~R$ 21 million 0.2% Metalúrgica Gerdau S.A. ~10 M shares |
|
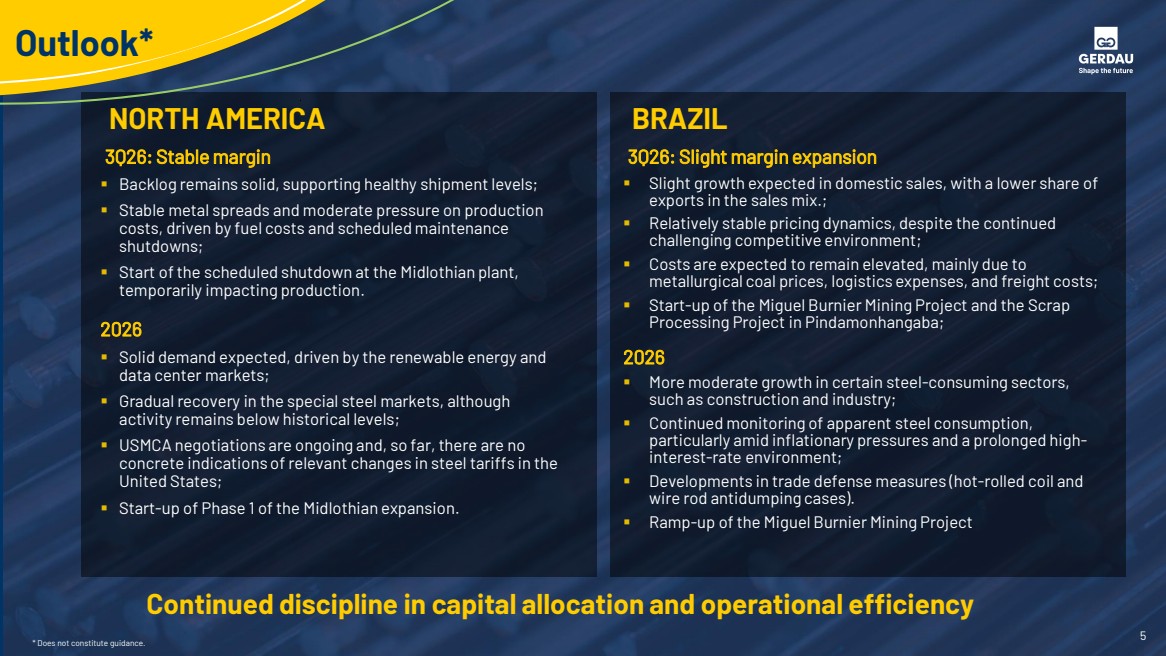
5 Outlook* NORTH AMERICA 3Q26: Stable margin Continued discipline in capital allocation and operational efficiency ▪ Backlog remains solid, supporting healthy shipment levels; ▪ Stable metal spreads and moderate pressure on production costs, driven by fuel costs and scheduled maintenance shutdowns; ▪ Start of the scheduled shutdown at the Midlothian plant, temporarily impacting production. 2026 ▪ Solid demand expected, driven by the renewable energy and data center markets; ▪ Gradual recovery in the special steel markets, although activity remains below historical levels; ▪ USMCA negotiations are ongoing and, so far, there are no concrete indications of relevant changes in steel tariffs in the United States; ▪ Start-up of Phase 1 of the Midlothian expansion. * Does not constitute guidance. BRAZIL 3Q26: Slight margin expansion ▪ Slight growth expected in domestic sales, with a lower share of exports in the sales mix.; ▪ Relatively stable pricing dynamics, despite the continued challenging competitive environment; ▪ Costs are expected to remain elevated, mainly due to metallurgical coal prices, logistics expenses, and freight costs; ▪ Start-up of the Miguel Burnier Mining Project and the Scrap Processing Project in Pindamonhangaba; 2026 ▪ More moderate growth in certain steel-consuming sectors, such as construction and industry; ▪ Continued monitoring of apparent steel consumption, particularly amid inflationary pressures and a prolonged high-interest-rate environment; ▪ Developments in trade defense measures (hot-rolled coil and wire rod antidumping cases). ▪ Ramp-up of the Miguel Burnier Mining Project |
|
6 Q&A To ask questions, please indicate your name and institution via Raise Hand icon, wait to be announced . Once announced, accept the prompt to activate your microphone and camera . |
|
ANEXOS 7 Appendices |
|
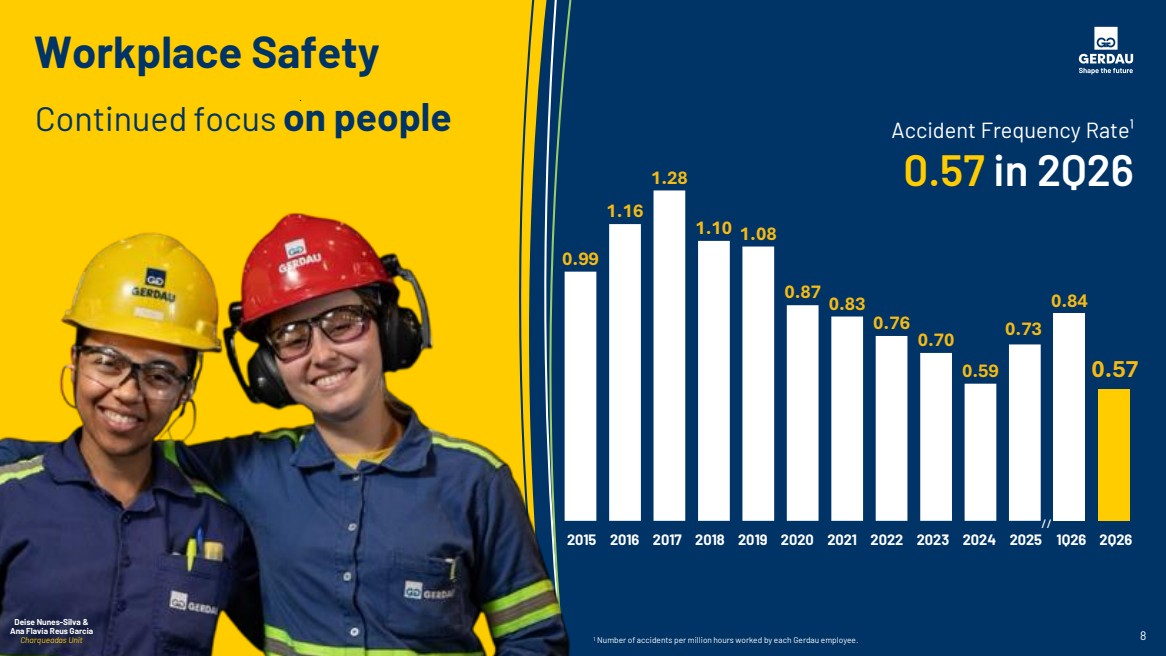
Workplace Safety Continued focus on people Accident Frequency Rate¹ 0.57 in 2Q26 0.99 1.16 1.28 1.10 1.08 0.87 0.83 0.76 0.70 0.59 0.73 0.84 0.57 2015 2016 2017 2018 2019 2020 2021 2022 2023 2024 2Q26 // 1 Number of accidents per million hours worked by each Gerdau employee. 2025 Deise Nunes-Silva & Ana Flavia Reus Garcia Charqueadas Unit 8 1Q26 |
|
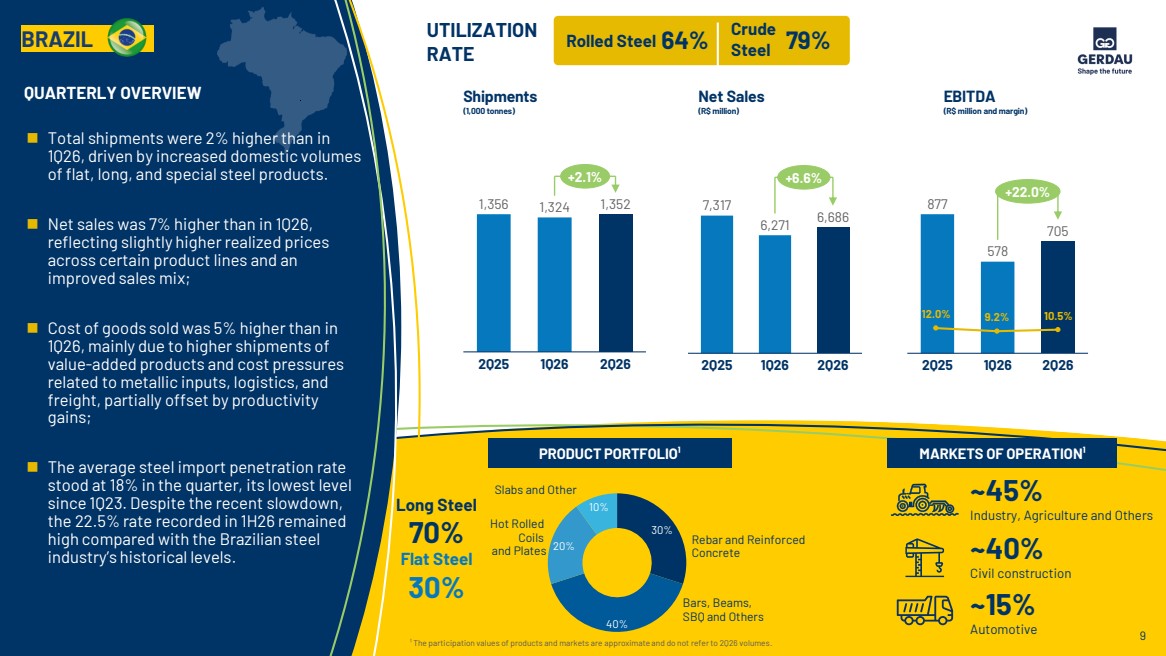
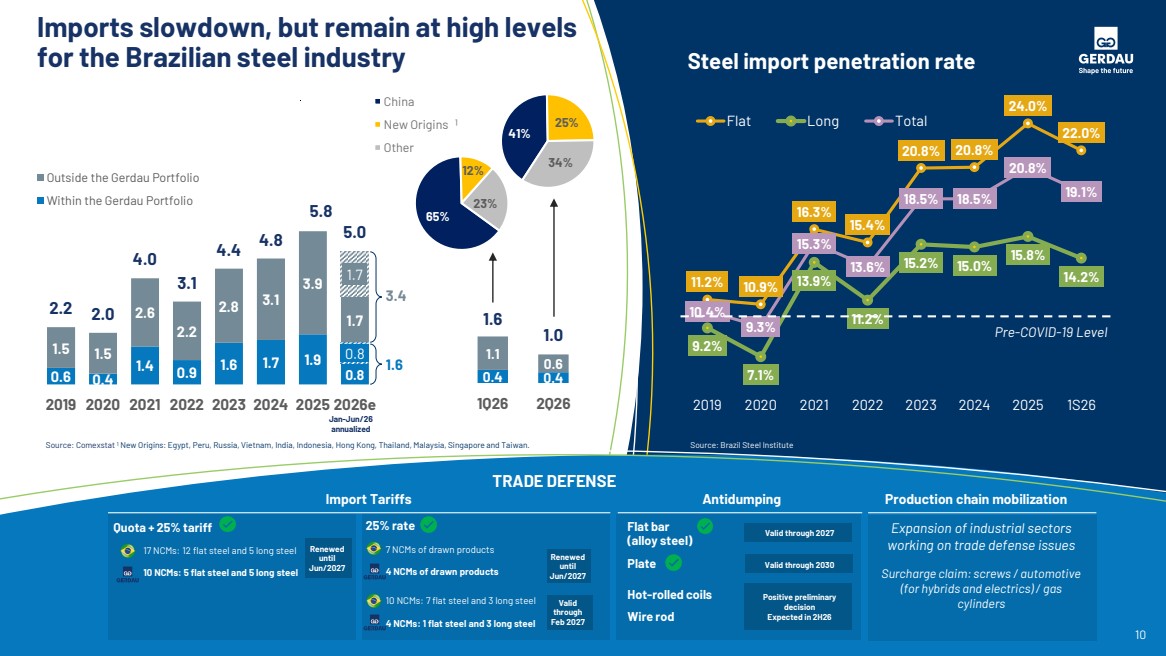
9 QUARTERLY OVERVIEW ◼ Total shipments were 2% higher than in 1Q26, driven by increased domestic volumes of flat, long, and special steel products. ◼ Net sales was 7% higher than in 1Q26, reflecting slightly higher realized prices across certain product lines and an improved sales mix; ◼ Cost of goods sold was 5% higher than in 1Q26, mainly due to higher shipments of value-added products and cost pressures related to metallic inputs, logistics, and freight, partially offset by productivity gains; ◼ The average steel import penetration rate stood at 18% in the quarter, its lowest level since 1Q23. Despite the recent slowdown, the 22.5% rate recorded in 1H26 remained high compared with the Brazilian steel industry’s historical levels. UTILIZATION RATE ~45% Industry, Agriculture and Others ~40% Civil construction ~15% Automotive PRODUCT PORTFOLIO¹ MARKETS OF OPERATION¹ 30% 40% 20% 10% Rebar and Reinforced Concrete Bars, Beams, SBQ and Others Hot Rolled Coils and Plates Slabs and Other ¹ The participation values of products and markets are approximate and do not refer to 2Q26 volumes. Long Steel 70% Flat Steel 30% BRAZIL Shipments (1,000 tonnes) Net Sales (R$ million) EBITDA (R$ million and margin) Rolled Steel 64% Crude Steel 79% 2Q25 1Q26 2Q26 1,356 1,324 1,352 +2.1% 2Q25 1Q26 2Q26 7,317 6,271 6,686 +6.6% 877 578 705 2Q25 1Q26 2Q26 +22.0% 12.0% 9.2% 10.5% |
|
Imports slowdown, but remain at high levels for the Brazilian steel industry Source: Comexstat Steel import penetration rate Source: Brazil Steel Institute TRADE DEFENSE 1 New Origins: Egypt, Peru, Russia, Vietnam, India, Indonesia, Hong Kong, Thailand, Malaysia, Singapore and Taiwan. Import Tariffs Antidumping 25% rate 7 NCMs of drawn products 4 NCMs of drawn products 10 NCMs: 7 flat steel and 3 long steel 4 NCMs: 1 flat steel and 3 long steel Quota + 25% tariff 17 NCMs: 12 flat steel and 5 long steel 10 NCMs: 5 flat steel and 5 long steel Flat bar (alloy steel) Plate Hot-rolled coils Wire rod Production chain mobilization Expansion of industrial sectors working on trade defense issues Surcharge claim: screws / automotive (for hybrids and electrics) / gas cylinders Renewed until Jun/2027 Renewed until Jun/2027 Valid through Feb 2027 Valid through 2027 Positive preliminary decision Expected in 2H26 Valid through 2030 10 11.2% 10.9% 16.3% 15.4% 20.8% 20.8% 24.0% 22.0% 9.2% 7.1% 13.9% 11.2% 15.2% 15.0% 15.8% 14.2% 10.4% 9.3% 15.3% 13.6% 18.5% 18.5% 20.8% 19.1% 2019 2020 2021 2022 2023 2024 2025 1S26 Flat Long Total 0.6 0.4 1.4 0.9 1.6 1.7 1.9 0.8 0.8 1.5 1.5 2.6 2.2 2.8 3.1 3.9 1.7 1.7 2.2 2.0 4.0 3.1 4.4 4.8 5.8 5.0 0.0 1.0 2.0 3.0 4.0 5.0 6.0 7.0 8.0 9.0 2019 2020 2021 2022 2023 2024 2025 2026e Outside the Gerdau Portfolio Within the Gerdau Portfolio 1.6 3.4 Jan-Jun/26 annualized 0.4 0.4 1.1 0.6 1.6 1.0 1Q26 2Q26 65% 12% 23% 41% 25% 34% China New Origins Other ¹ Pre-COVID-19 Level |
|
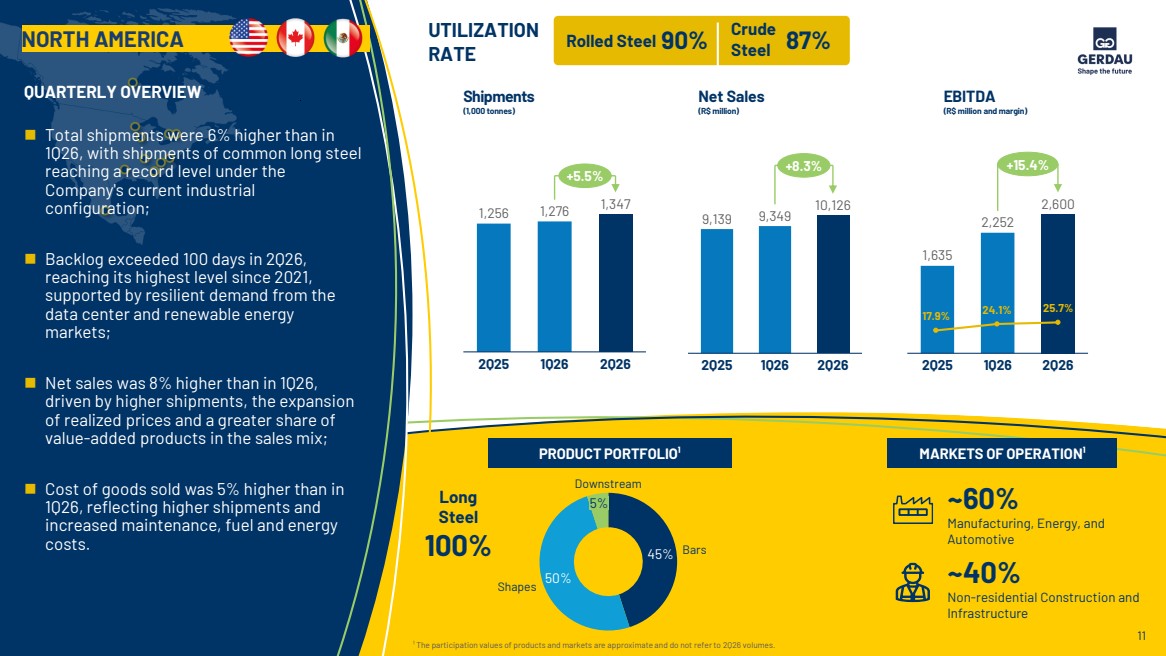
11 Shipments (1,000 tonnes) Net Sales (R$ million) EBITDA (R$ million and margin) QUARTERLY OVERVIEW ◼ Total shipments were 6% higher than in 1Q26, with shipments of common long steel reaching a record level under the Company's current industrial configuration; ◼ Backlog exceeded 100 days in 2Q26, reaching its highest level since 2021, supported by resilient demand from the data center and renewable energy markets; ◼ Net sales was 8% higher than in 1Q26, driven by higher shipments, the expansion of realized prices and a greater share of value-added products in the sales mix; ◼ Cost of goods sold was 5% higher than in 1Q26, reflecting higher shipments and increased maintenance, fuel and energy costs. 45% 50% Bars Shapes 5% Downstream ~40% Non-residential Construction and Infrastructure ~60% Manufacturing, Energy, and Automotive Long Steel 100% ¹ The participation values of products and markets are approximate and do not refer to 2Q26 volumes. NORTH AMERICA UTILIZATION RATE PRODUCT PORTFOLIO¹ MARKETS OF OPERATION¹ Rolled Steel 90% Crude Steel 87% 2Q25 1Q26 2Q26 1,256 1,276 1,347 +5.5% 2Q25 1Q26 2Q26 9,139 9,349 10,126 +8.3% 2Q25 1Q26 2Q26 1,635 2,252 2,600 +15.4% 17.9% 24.1% 25.7% |
|
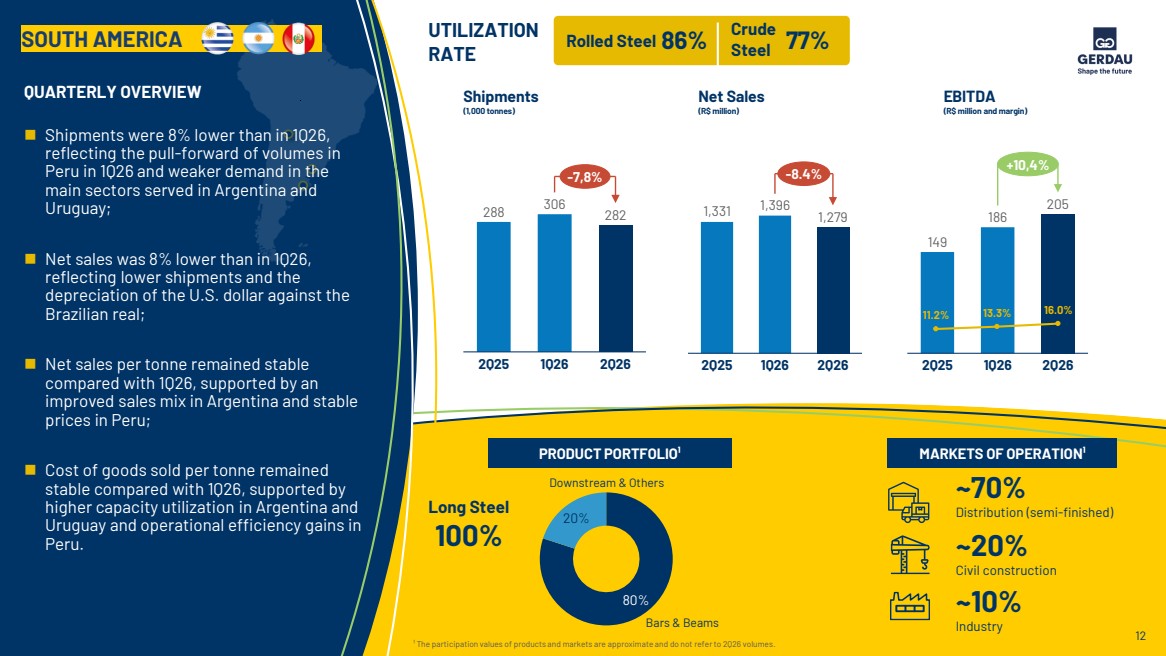
Shipments (1,000 tonnes) Net Sales (R$ million) EBITDA (R$ million and margin) 12 86% UTILIZATION RATE Rolled Steel Crude Steel 77% QUARTERLY OVERVIEW 80% 20% Bars & Beams Downstream & Others ~70% Distribution (semi-finished) ~20% Civil construction ~10% Industry SOUTH AMERICA 288 306 282 2Q25 1Q26 2Q26 -7,8% 2Q25 1Q26 2Q26 1,331 1,396 1,279 -8.4% 149 186 205 2Q25 1Q26 2Q26 +10,4% 11.2% 13.3% 16.0% PRODUCT PORTFOLIO¹ MARKETS OF OPERATION¹ Long Steel 100% ◼ Shipments were 8% lower than in 1Q26, reflecting the pull-forward of volumes in Peru in 1Q26 and weaker demand in the main sectors served in Argentina and Uruguay; ◼ Net sales was 8% lower than in 1Q26, reflecting lower shipments and the depreciation of the U.S. dollar against the Brazilian real; ◼ Net sales per tonne remained stable compared with 1Q26, supported by an improved sales mix in Argentina and stable prices in Peru; ◼ Cost of goods sold per tonne remained stable compared with 1Q26, supported by higher capacity utilization in Argentina and Uruguay and operational efficiency gains in Peru. ¹ The participation values of products and markets are approximate and do not refer to 2Q26 volumes. |
|
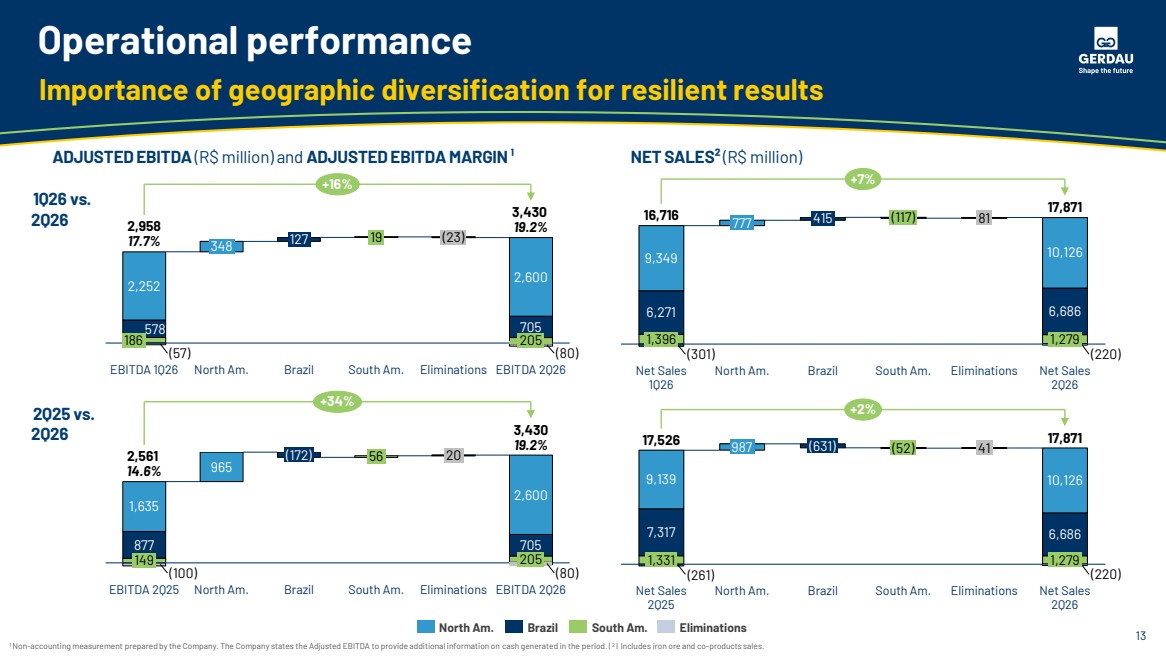
Operational performance 1 Non-accounting measurement prepared by the Company. The Company states the Adjusted EBITDA to provide additional information on cash generated in the period. | 2 I Includes iron ore and co-products sales. Importance of geographic diversification for resilient results ADJUSTED EBITDA (R$ million) and ADJUSTED EBITDA MARGIN ¹ NET SALES² (R$ million) North Am. Brazil South Am. Eliminations (301) Eliminations 10,126 6,686 9,349 6,271 (220) 1,396 Net Sales 2Q26 Net Sales 1Q26 777 North Am. 415 Brazil (117) South Am. 81 16,716 17,871 1,279 +7% -171 578 705 (57) (80) 2,252 186 EBITDA 1Q26 North Am. 127 Brazil 19 South Am. (23) Eliminations 2,600 205 EBITDA 2Q26 2,958 17.7% 3,430 19.2% 348 +16% 1Q26 vs. 2Q26 877 965 705 (100) 1,635 149 EBITDA 2Q25 North Am. (172) Brazil 56 South Am. 20 Eliminations 2,600 205 (80) EBITDA 2Q26 2,561 14.6% 3,430 19.2% +34% (261) Eliminations 10,126 6,686 9,139 7,317 Net Sales 2Q26 1,331 Net Sales 2Q25 987 North Am. (631) Brazil (52) South Am. 17,526 17,871 (220) 41 1,279 2Q25 vs. +2% 2Q26 13 |
|
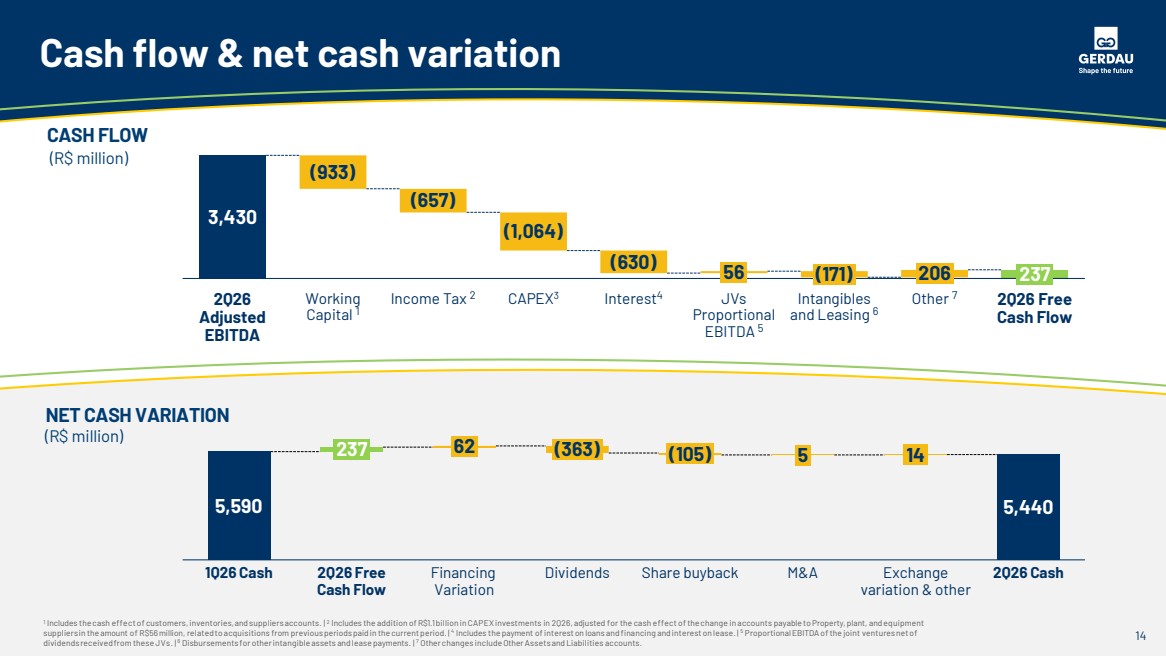
14 Cash flow & net cash variation 1 Includes thecash effect of customers, inventories,andsuppliersaccounts. | 2 Includes the addition of R$1.1billionin CAPEXinvestments in 2Q26, adjusted for the cash effect ofthechange in accounts payable to Property, plant, and equipment suppliersin theamount of R$56million, relatedto acquisitions from previousperiodspaid in the currentperiod. | 4 Includes the payment ofinterest on loans and financing andinterest on lease. | 5 ProportionalEBITDA ofthe joint venturesnet of dividendsreceivedfrom these JVs. | 6 Disbursements for otherintangibleassets and lease payments. | 7 Other changes includeOther Assetsand Liabilities accounts. CASH FLOW (R$ million) NET CASH VARIATION (R$ million) 5,590 1Q26 Cash 237 2Q26 Free Cash Flow 62 Financing Variation (363) Dividends (105) Share buyback 5 M&A 14 Exchange variation & other 5,440 2Q26 Cash 3,430 2Q26 Adjusted EBITDA (933) Working Capital 1 (657) Income Tax 2 (1,064) CAPEX3 (630) Interest4 56 JVs Proportional EBITDA 5 (171) Intangibles and Leasing 6 206 Other 7 237 2Q26 Free Cash Flow |
|
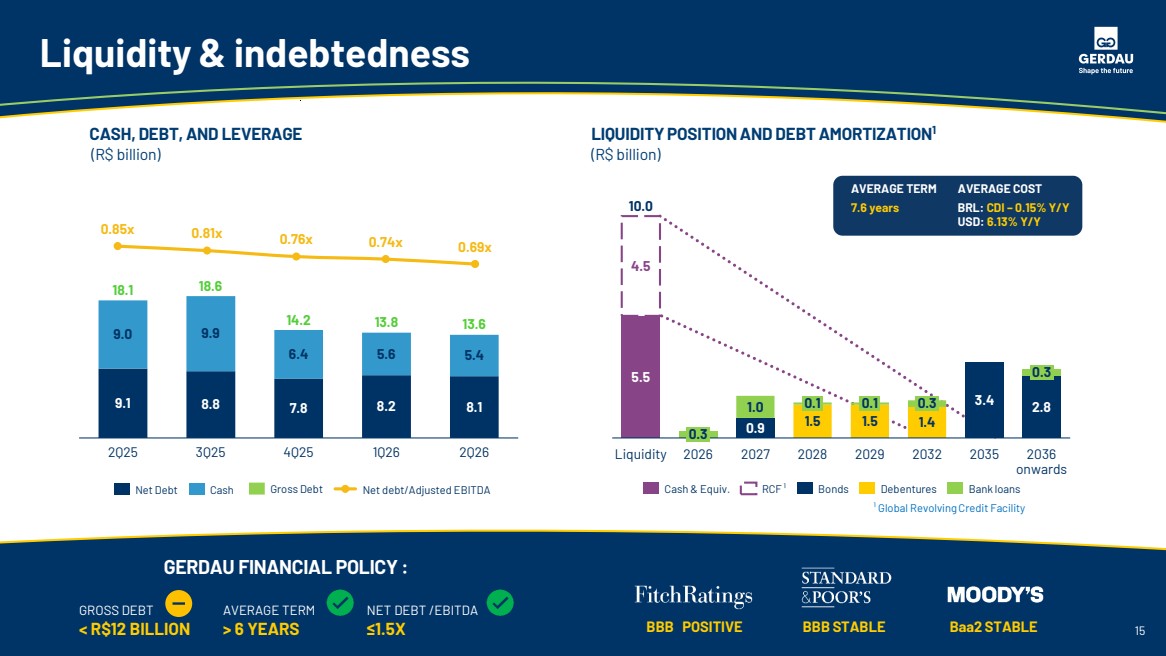
CASH, DEBT, AND LEVERAGE (R$ billion) LIQUIDITY POSITION AND DEBT AMORTIZATION1 (R$ billion) RATINGS: ¹ Global Revolving Credit Facility POLÍTICA FINANCEIRA GERDAU: 15 GROSS DEBT < R$12 BILLION AVERAGE TERM > 6 YEARS NET DEBT /EBITDA ≤1.5X BBB POSITIVE BBB STABLE Baa2 STABLE GERDAU FINANCIAL POLICY : 9.1 9.0 2Q25 8.8 9.9 3Q25 7.8 6.4 4Q25 8.2 5.6 1Q26 8.1 5.4 2Q26 18.1 18.6 14.2 13.8 13.6 Net Debt Cash 0.85x 0.81x 0.76x 0.74x 0.69x Gross Debt Net debt/Adjusted EBITDA Liquidity & indebtedness Cash & Equiv. RCF ¹ Bonds Debentures Bank loans 5.5 4.5 Liquidity 0.3 2026 0.9 1.0 2027 1.5 0.1 2028 1.5 0.1 2029 1.4 0.3 2032 3.4 2035 2.8 0.3 2036 onwards 10.0 AVERAGE COST 7.6 years AVERAGE TERM BRL: CDI – 0.15% Y/Y USD: 6.13% Y/Y 15 |
|
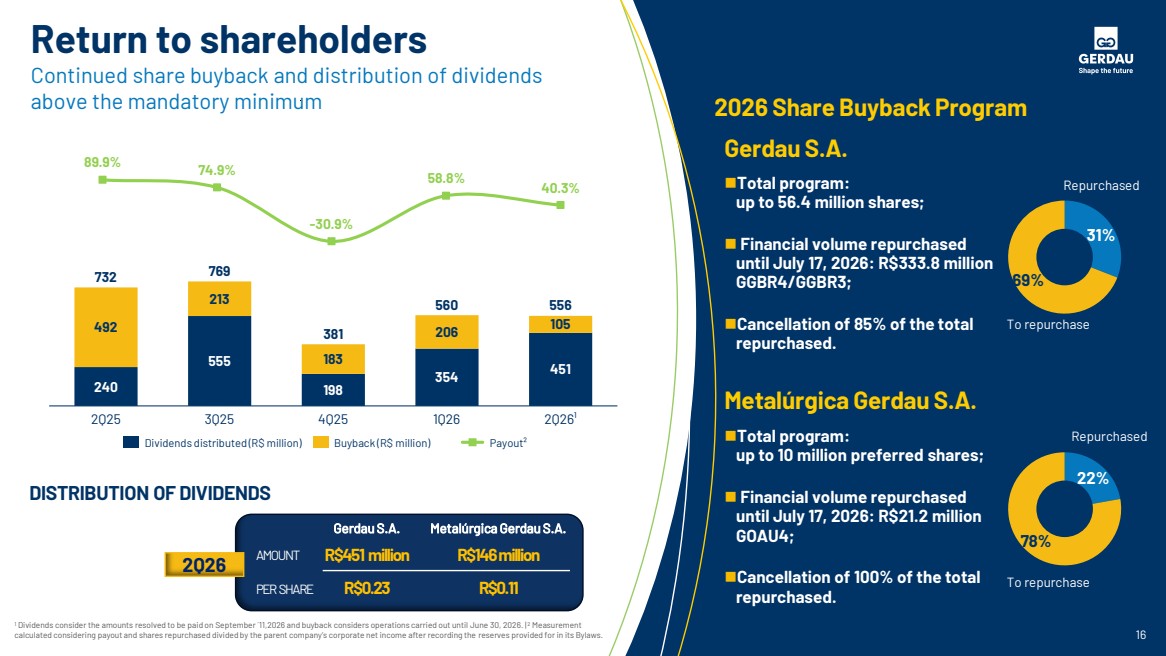
Return to shareholders Continued share buyback and distribution of dividends above the mandatory minimum 2026 Share Buyback Program ◼Total program: up to 56.4 million shares; ◼ Financial volume repurchased until July 17, 2026: R$333.8 million GGBR4/GGBR3; ◼Cancellation of 85% of the total repurchased. Repurchased 31% 69% 240 555 198 354 451 492 213 183 206 105 2Q25 3Q25 4Q25 1Q26 2Q26¹ 732 769 381 560 556 89.9% 74.9% -30.9% 58.8% 40.3% Dividends distributed (R$ million) Buyback (R$ million) Payout² DISTRIBUTION OF DIVIDENDS AMOUNT PER SHARE R$451 million R$0.23 2Q26 Gerdau S.A. R$146 million R$0.11 Metalúrgica Gerdau S.A. 1 Dividends consider the amounts resolved to be paid on September ´11,2026 and buyback considers operations carried out until June 30, 2026. | 2 Measurement calculated considering payout and shares repurchased divided by the parent company’s corporate net income after recording the reserves provided for in its Bylaws. 16 Metalúrgica Gerdau S.A. ◼Total program: up to 10 million preferred shares; ◼ Financial volume repurchased until July 17, 2026: R$21.2 million GOAU4; ◼Cancellation of 100% of the total repurchased. Repurchased 22% 78% Gerdau S.A. To repurchase To repurchase |
|
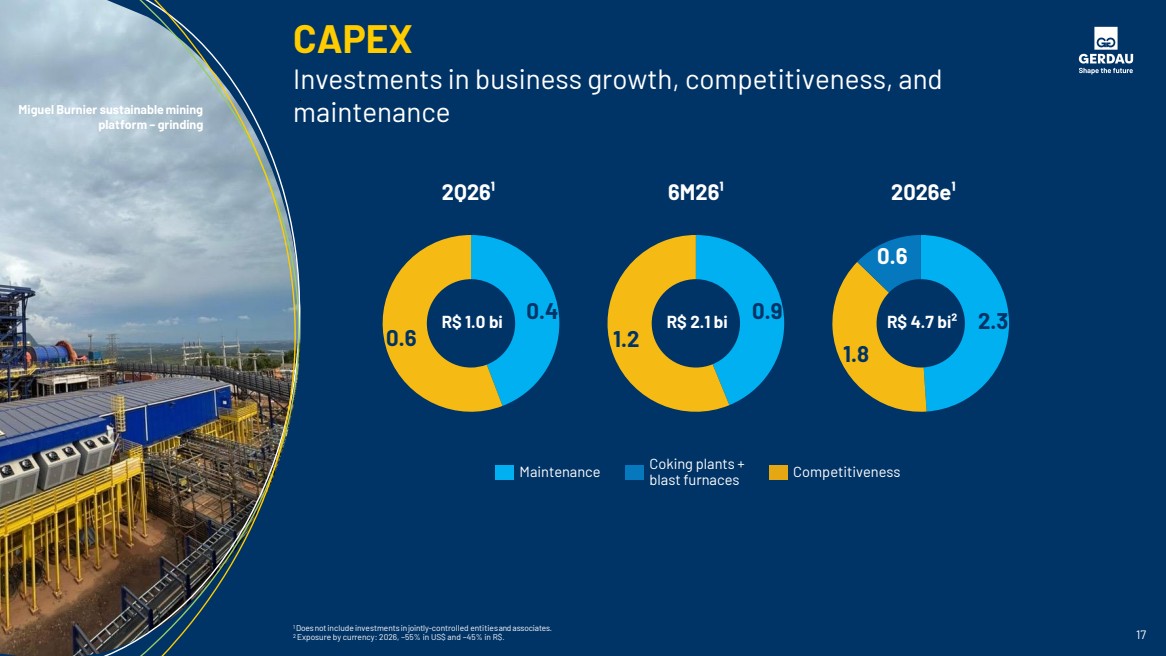
CAPEX Investments in business growth, competitiveness, and maintenance 2026e¹ Maintenance Coking plants + blast furnaces Competitiveness 2.3 1.8 0.6 R$ 4.7 bi² 1 Doesnotinclude investments injointly-controlled entitiesandassociates. 2 Exposure by currency: 2026, ~55% in US$ and ~45% in R$. 2Q26¹ 0.4 0.6 R$ 1.0 bi Miguel Burnier sustainable mining platform – grinding 17 6M26¹ 0.9 1.2 R$ 2.1 bi |
|
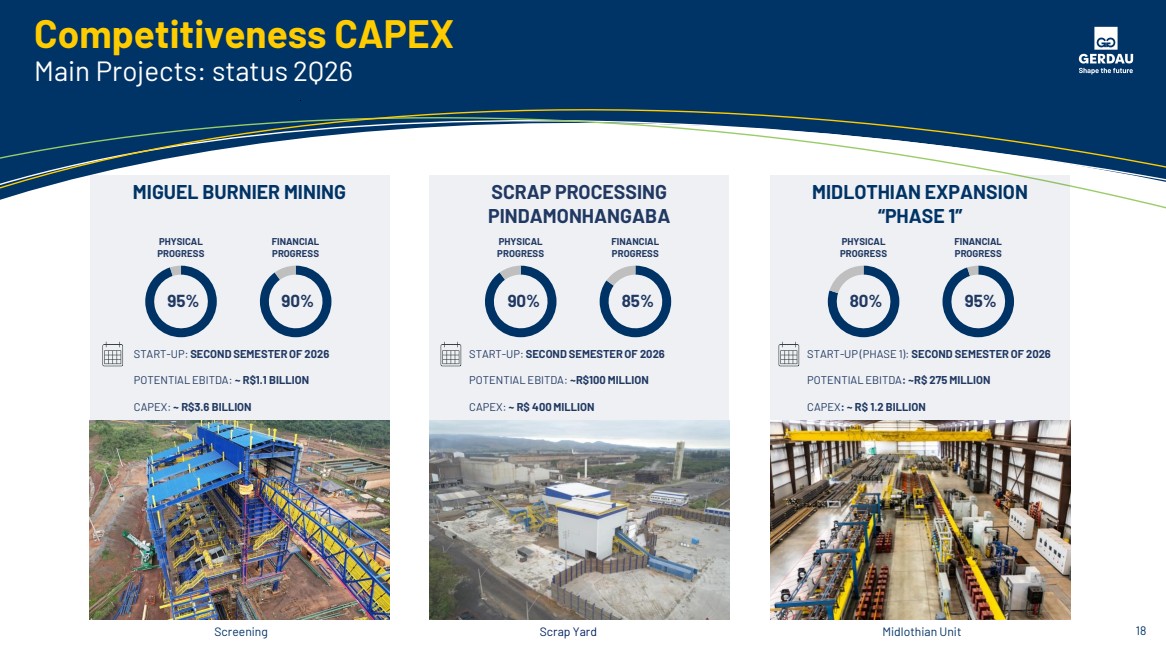
Competitiveness CAPEX Main Projects: status 2Q26 MIGUEL BURNIER MINING PHYSICAL PROGRESS FINANCIAL PROGRESS 95% 90% Screening START-UP: SECOND SEMESTER OF 2026 POTENTIAL EBITDA: ~ R$1.1 BILLION CAPEX: ~ R$3.6 BILLION SCRAP PROCESSING PINDAMONHANGABA Scrap Yard PHYSICAL PROGRESS FINANCIAL PROGRESS 90% 85% START-UP: SECOND SEMESTER OF 2026 POTENTIAL EBITDA: ~R$100 MILLION CAPEX: ~ R$ 400 MILLION MIDLOTHIAN EXPANSION “PHASE 1” Midlothian Unit PHYSICAL PROGRESS FINANCIAL PROGRESS 80% 95% START-UP (PHASE 1): SECOND SEMESTER OF 2026 POTENTIAL EBITDA: ~R$ 275 MILLION CAPEX: ~ R$ 1.2 BILLION 18 |
|
Follow Gerdau on social media. Earnings Release 3Q26 October 26,2026 Videoconference October 27,2026 inform@gerdau.com | ri.gerdau.com |