UNITED STATES
SECURITIES AND EXCHANGE COMMISSION
Washington, D.C. 20549
FORM 8-K
現行レポート
1934年証券取引法第13条または第15条(d)に基づき
報告日(報告された最も早い事象の日付):2026年5月6日
CF Industries Holdings, Inc.
((定款に記載された登録者の正確な名称)
| デラウェア | 001-32597 | 20-2697511 | ||
| (法人設立の州またはその他の管轄区域) | (Commission File Number) | (IRS Employer Identification No.) |
|
2375 Waterview Drive Northbrook, Illinois |
60062 | |||
|
(Address of principal executive offices) |
(Zip Code) |
登録者の電話番号(市外局番を含む):(847) 405-2400
((前回の報告以降に変更があった場合は、旧氏名または旧住所。)
本フォーム8-Kの提出が、以下のいずれかの規定に基づく登録者の提出義務を同時に満たすことを目的とする場合は、以下の該当するチェックボックスにチェックを入れてください(下記「一般指示 A.2.」を参照):
| ¨ | 証券法に基づく規則425に従った書面によるコミュニケーション(17 cfr 230.425) |
| ¨ | 取引所法の下でのルール14a-12(17 cfr 240.14a-12)に基づく資料の勧誘。) |
| ¨ | 取引所法の規則14d-2(b)に基づく開始前のコミュニケーション(17 cfr 240.14d-2(b)) |
| ¨ | 証券取引法の規則13e-4(c)に基づく開始前のコミュニケーション(17 cfr 240.13e-4(c)) |
同法第12条(b)に基づき登録された有価証券:
| Title of each class | Trading symbol(s) | 登録されている各取引所の名称 | ||
| 普通株式、額面1株あたり0.01ドル | CF | New York Stock Exchange |
登録者が、1933年証券法規則405(本章第230.405条)または1934年証券取引法規則12b-2(本章第240.12b-2条)に定義される新興成長企業であるか否かを、チェックマークで示してください。
Emerging growth company ¨
新興成長企業である場合、登録者が証券取引法第13条(a)に基づき定められた新規または改訂された財務会計基準への準拠について、延長移行期間の適用を受けないことを選択した場合は、チェックマークを付けてください。 ¨
| Item 2.02. | 営業成績および財政状態。 |
2026年5月7日、CFインダストリーズ・ホールディングス社は、2026年3月31日締めの四半期決算に関する電話会議を開催し、その際、別紙99.1として添付されているプレゼンテーション資料を使用する予定です。
本書に記載された情報(添付資料を含む)は、改正1934年証券取引法第18条の目的上、「提出された」ものとみなされるものではなく、また、改正1933年証券法に基づくいかなる提出書類においても、当該提出書類において明示的に言及されている場合を除き、参照により組み込まれたものとみなされるものではない。
| Item 9.01. | Financial Statements and Exhibits. |
(d) 証拠書類。
| Exhibit No. | Description of Exhibit | |
| 99.1 | CFインダストリーズ・ホールディングス社のプレゼンテーション(2026年5月6日付) | |
| 104 | カバーページ・インタラクティブデータファイル(カバーページのxbrlタグがinline xbrlドキュメント内に埋め込まれています。) |
SIGNATURES
1934年証券取引法の要件に基づき、登録者は、本報告書に、正当に権限を与えられた下記署名者が登録者に代わって署名するよう適切に手配した。
| Date: May 6, 2026 | CF INDUSTRIES HOLDINGS, INC. | |
| By: | /s/ RICHARD A. HOKER | |
| Name: | Richard A. Hoker | |
| Title: | 副社長兼経理統括責任者および暫定最高財務責任者 | |
Exhibit 99.1
|
2026 First Quarter Financial Results May 6, 2026 NYSE: CF |
|
Safe harbor statement All statements in this presentation by CF Industries Holdings, Inc. (together with its subsidiaries, the “Company”), other than those relating to historical facts, are forward-looking statements. Forward-looking statements can generally be identified by their use of terms such as “anticipate,” “believe,” “could,” “estimate,” “expect,” “intend,” “may,” “plan,” “predict,” “project,” “will” or “would” and similar terms and phrases, including references to assumptions. Forward-looking statements are not guarantees of future performance and are subject to a number of assumptions, risks and uncertainties, many of which are beyond the Company’s control, which could cause actual results to differ materially from such statements. These statements may include, but are not limited to, statements about: strategic plans and management’s expectations with respect to the production of low-carbon ammonia, the development of carbon capture and sequestration projects, the transition to and growth of a hydrogen economy, greenhouse gas reduction targets, projected capital expenditures, statements about future financial and operating results, and other items described in this presentation. Important factors that could cause actual results to differ materially from those in the forward-looking statements include, among others: the Company’s ability to complete the projects at its Blue Point Complex, including the construction of a low-carbon ammonia production facility with its joint venture partners and scalable infrastructure on schedule and on budget or at all; the Company’s ability to fund the capital expenditure needs related to the joint venture at its Blue Point Complex, which may exceed its current estimates; the cyclical nature of the Company’s business and the impact of global supply and demand on the Company’s selling prices and operating results; the global commodity nature of the Company’s nitrogen products, the conditions in the global market for nitrogen products, and the intense global competition from other producers; announced or future tariffs, retaliatory measures, and global trade relations, including the potential impact of tariffs and retaliatory measures on the price and availability of materials for its capital projects and maintenance; conditions in the United States, Europe and other agricultural areas, including the influence of governmental policies and technological developments on the demand for its fertilizer products; the volatility of natural gas prices in North America and globally; weather conditions and the impact of adverse weather events; the seasonality of the fertilizer business; the impact of changing market conditions on the Company’s forward sales programs; difficulties in securing the supply and delivery of raw materials or utilities, increases in their costs or delays or interruptions in their delivery; reliance on third party providers of transportation services and equipment, including those related to carbon dioxide sequestration; the Company’s reliance on a limited number of key facilities; risks associated with cybersecurity; acts of terrorism and regulations to combat terrorism; the significant risks and hazards involved in producing and handling the Company’s products against which the Company may not be fully insured; risks associated with international operations; the Company’s ability to manage its indebtedness and any additional indebtedness that may be incurred; risks associated with changes in tax laws and adverse determinations by taxing authorities, including any potential changes in tax regulations and its qualification for tax credits; risks involving derivatives and the effectiveness of the Company’s risk management and hedging activities; potential liabilities and expenditures related to environmental, health and safety laws and regulations and permitting requirements; regulatory provisions and requirements related to greenhouse gas emissions and sustainability matters, including announced or future changes in environmental, climate change or sustainability laws; the development and growth of the market for low-carbon ammonia and the risks and uncertainties relating to the development and implementation of the Company’s low-carbon ammonia projects; risks associated with investments in and expansions of the Company’s business, including unanticipated adverse consequences and the significant resources that could be required; and failure of technologies to perform, develop or be available as expected, including the low-carbon ATR ammonia production facility with carbon capture and sequestration technologies being constructed at its Blue Point Complex. More detailed information about factors that may affect the Company’s performance and could cause actual results to differ materially from those in any forward-looking statements may be found in CF Industries Holdings, Inc.’s filings with the Securities and Exchange Commission, including CF Industries Holdings, Inc.’s most recent annual and quarterly reports on Form 10-K and Form 10-Q, which are available in the Investor Relations section of the Company’s web site. It is not possible to predict or identify all risks and uncertainties that might affect the accuracy of our forward-looking statements and, consequently, our descriptions of such risks and uncertainties should not be considered exhaustive. There is no guarantee that any of the events, plans or goals anticipated by these forward-looking statements will occur, and if any of the events do occur, there is no guarantee what effect they will have on our business, results of operations, cash flows, financial condition and future prospects. Forward-looking statements are given only as of the date of this presentation and the Company disclaims any obligation to update or revise the forward-looking statements, whether as a result of new information, future events or otherwise, except as required by law. |
|
Note regarding non-GAAP financial measures The Company reports its financial results in accordance with U.S. generally accepted accounting principles (GAAP). Management believes that EBITDA, adjusted EBITDA, free cash flow, and free cash flow to adjusted EBITDA conversion, which are non-GAAP financial measures, provide additional meaningful information regarding the Company's performance and financial strength. Non-GAAP financial measures should be viewed in addition to, and not as an alternative for, the Company’s reported results prepared in accordance with GAAP. In addition, because not all companies use identical calculations, EBITDA, adjusted EBITDA, free cash flow, and free cash flow to adjusted EBITDA conversion included in this presentation may not be comparable to similarly titled measures of other companies. Reconciliations of EBITDA, adjusted EBITDA, and free cash flow to the most directly comparable GAAP measures are provided in the tables accompanying this presentation. EBITDA is defined as net earnings attributable to common stockholders plus interest expense—net, income taxes and depreciation and amortization. Other adjustments include the elimination of the portion of interest income (expense)—net and the portion of depreciation and amortization that are included in noncontrolling interests, and loan fee amortization that is included in both interest and amortization. The Company has presented EBITDA because management uses the measure to track performance and believes that it is frequently used by securities analysts, investors and other interested parties in the evaluation of companies in the industry. Adjusted EBITDA is defined as EBITDA adjusted with the selected items as summarized in the tables accompanying this presentation. The Company has presented adjusted EBITDA because management uses adjusted EBITDA, and believes it is useful to investors, as a supplemental financial measure in the comparison of year-over-year performance. Free cash flow is defined as net cash provided by operating activities, as stated in the consolidated statements of cash flows, reduced by capital expenditures and distributions to noncontrolling interest plus contributions from noncontrolling interests. Free cash flow to adjusted EBITDA conversion is defined as free cash flow divided by adjusted EBITDA. The Company has presented free cash flow and free cash flow to adjusted EBITDA conversion because management uses these measures and believes they are useful to investors, as an indication of the strength of the Company and its ability to generate cash and to evaluate the Company’s cash generation ability relative to its industry competitors. It should not be inferred that the entire free cash flow amount is available for discretionary expenditures. |
|
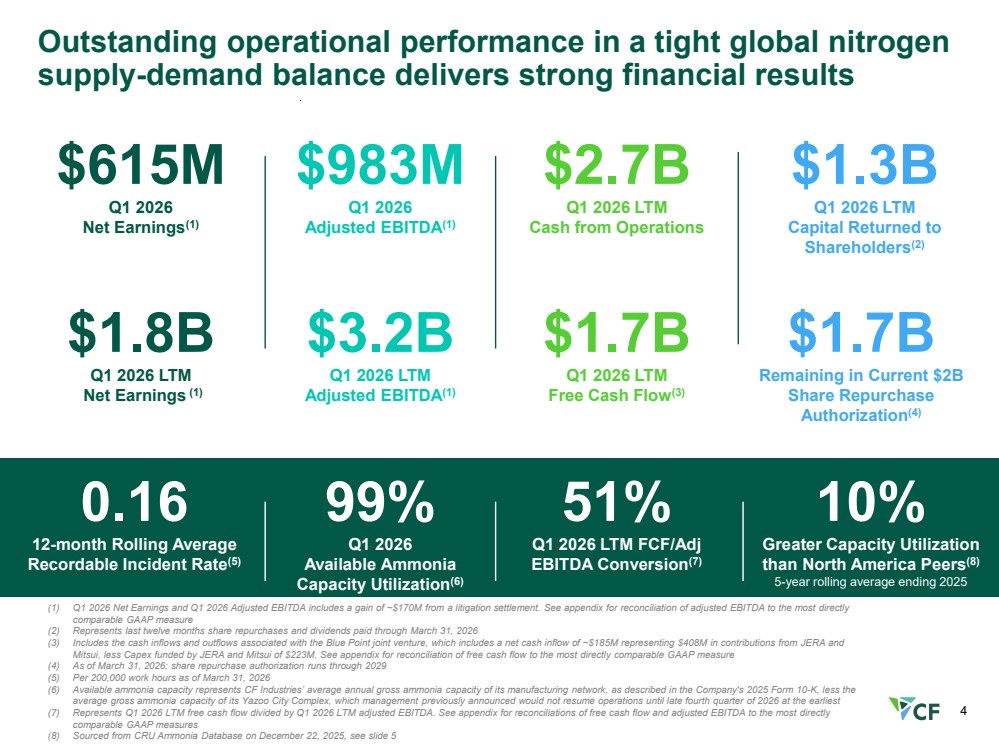
4 Outstanding operational performance in a tight global nitrogen supply-demand balance delivers strong financial results (1) Q1 2026 Net Earnings and Q1 2026 Adjusted EBITDA includes a gain of ~$170M from a litigation settlement. See appendix for reconciliation of adjusted EBITDA to the most directly comparable GAAP measure (2) Represents last twelve months share repurchases and dividends paid through March 31, 2026 (3) Includes the cash inflows and outflows associated with the Blue Point joint venture, which includes a net cash inflow of ~$185M representing $408M in contributions from JERA and Mitsui, less Capex funded by JERA and Mitsui of $223M. See appendix for reconciliation of free cash flow to the most directly comparable GAAP measure (4) As of March 31, 2026; share repurchase authorization runs through 2029 (5) Per 200,000 work hours as of March 31, 2026 (6) Available ammonia capacity represents CF Industries’ average annual gross ammonia capacity of its manufacturing network, as described in the Company's 2025 Form 10-K, less the average gross ammonia capacity of its Yazoo City Complex, which management previously announced would not resume operations until late fourth quarter of 2026 at the earliest (7) Represents Q1 2026 LTM free cash flow divided by Q1 2026 LTM adjusted EBITDA. See appendix for reconciliations of free cash flow and adjusted EBITDA to the most directly comparable GAAP measures (8) Sourced from CRU Ammonia Database on December 22, 2025, see slide 5 99% Q1 2026 Available Ammonia Capacity Utilization(6) 0.16 12-month Rolling Average Recordable Incident Rate(5) 51% Q1 2026 LTM FCF/Adj EBITDA Conversion(7) $983M Q1 2026 Adjusted EBITDA(1) $3.2B Q1 2026 LTM Adjusted EBITDA(1) $2.7B Q1 2026 LTM Cash from Operations $1.7B Q1 2026 LTM Free Cash Flow(3) $1.3B Q1 2026 LTM Capital Returned to Shareholders(2) $1.7B Remaining in Current $2B Share Repurchase Authorization(4) $1.8B Q1 2026 LTM Net Earnings (1) $615M Q1 2026 Net Earnings(1) 10% Greater Capacity Utilization than North America Peers(8) 5-year rolling average ending 2025 |
|
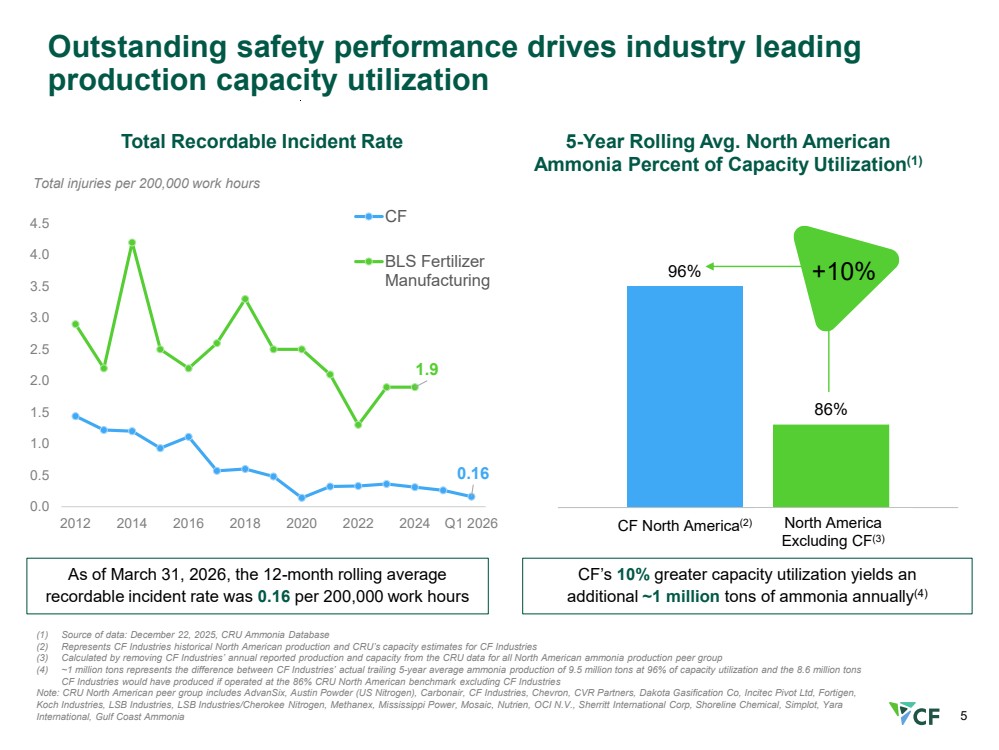
5 Outstanding safety performance drives industry leading production capacity utilization 5-Year Rolling Avg. North American Ammonia Percent of Capacity Utilization(1) CF’s 10% greater capacity utilization yields an additional ~1 million tons of ammonia annually(4) 0.16 1.9 0.0 0.5 1.0 1.5 2.0 2.5 3.0 3.5 4.0 4.5 2012 2014 2016 2018 2020 2022 2024 Q1 2026 CF BLS Fertilizer Manufacturing Total injuries per 200,000 work hours Total Recordable Incident Rate As of March 31, 2026, the 12-month rolling average recordable incident rate was 0.16 per 200,000 work hours 96% 86% 5-year rolling avg. percent of capacity utilization +10% CF North America(2) North America Excluding CF(3) (1) Source of data: December 22, 2025, CRU Ammonia Database (2) Represents CF Industries historical North American production and CRU’s capacity estimates for CF Industries (3) Calculated by removing CF Industries’ annual reported production and capacity from the CRU data for all North American ammonia production peer group (4) ~1 million tons represents the difference between CF Industries’ actual trailing 5-year average ammonia production of 9.5 million tons at 96% of capacity utilization and the 8.6 million tons CF Industries would have produced if operated at the 86% CRU North American benchmark excluding CF Industries Note: CRU North American peer group includes AdvanSix, Austin Powder (US Nitrogen), Carbonair, CF Industries, Chevron, CVR Partners, Dakota Gasification Co, Incitec Pivot Ltd, Fortigen, Koch Industries, LSB Industries, LSB Industries/Cherokee Nitrogen, Methanex, Mississippi Power, Mosaic, Nutrien, OCI N.V., Sherritt International Corp, Shoreline Chemical, Simplot, Yara International, Gulf Coast Ammonia |
|
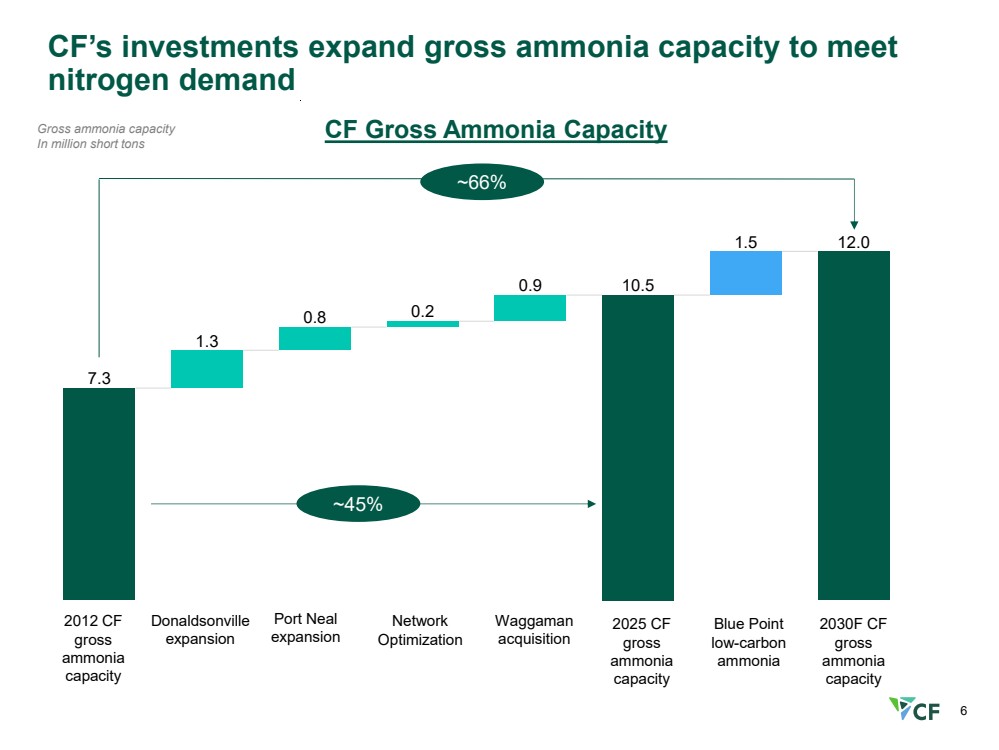
6 CF’s investments expand gross ammonia capacity to meet nitrogen demand Gross ammonia capacity In million short tons CF Gross Ammonia Capacity 7.3 1.3 0.8 0.2 0.9 10.5 1.5 12.0 2012 CF gross ammonia capacity 2025 CF gross ammonia capacity Blue Point low-carbon ammonia 2030F CF gross ammonia capacity Donaldsonville expansion Port Neal expansion Network Optimization Waggaman acquisition ~45% ~66% |
|
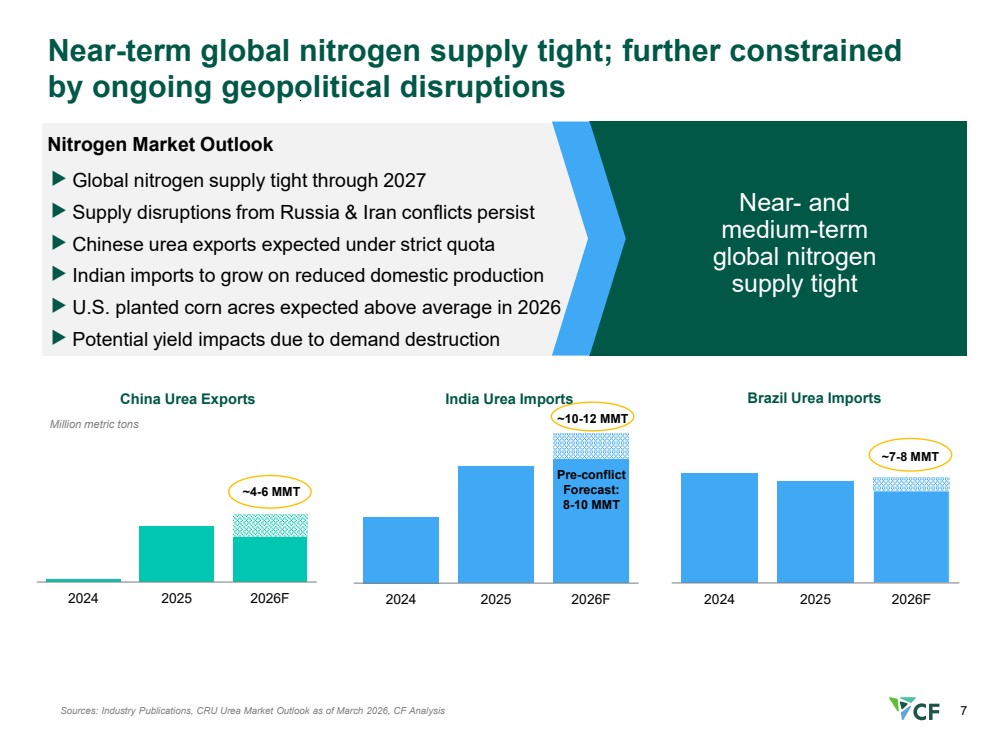
7 2024 2025 2026F Near-term global nitrogen supply tight; further constrained by ongoing geopolitical disruptions Sources: Industry Publications, CRU Urea Market Outlook as of March 2026, CF Analysis India Urea Imports ~10-12 MMT 2024 2025 2026F China Urea Exports Million metric tons ~4-6 MMT 2024 2025 2026F Brazil Urea Imports Nitrogen Market Outlook Global nitrogen supply tight through 2027 Supply disruptions from Russia & Iran conflicts persist Chinese urea exports expected under strict quota Indian imports to grow on reduced domestic production U.S. planted corn acres expected above average in 2026 Potential yield impacts due to demand destruction ~7-8 MMT Near- and medium-term global nitrogen supply tight Pre-conflict Forecast: 8-10 MMT |
|
8 ~50% of first quartile global urea capacity is exposed to geopolitical conflicts 2026 Monthly Delivered U.S. Gulf Urea Cost Curve(1) Y-axis: USD/st X-axis: Monthly Production Capacity at 95% Operating Rate, million short tons “Fragile & Exposed” segment represents plants/regions directly shut down, curtailed or face feedstock limitations due to geopolitical conflicts. Low-risk segment represents plants/regions with minimal feedstock exposure to current geopolitical conflicts. Chinese capacity is largely insulated from global oil/gas shocks due to large share of coal-based production. Limited global supply due to Chinese government export restrictions. First quartile Second quartile Third quartile Fourth quartile (1) 2026 annual average feedstock gas and coal prices represent actuals through March 2026 and forward curves as of April 27, 2026 **India gas cost assumed at $10.81/MMBtu; representative of imported spot LNG to cover typical contracted Middle East LNG supply Source: Industry Publications, CF Analysis |
 株探プレミアムに申し込む(初回無料体験付き)
プレミアム会員の方はこちらからログイン
株探プレミアムに申し込む(初回無料体験付き)
プレミアム会員の方はこちらからログイン