UNITED STATES
SECURITIES AND EXCHANGE COMMISSION
Washington, D.C. 20549
Form 8-K
CURRENT REPORT
Pursuant to Section 13 OR 15(d) of The Securities Exchange Act of 1934
Date of Report (Date of earliest event reported): April 22, 2026
COLONY BANKCORP, INC.
(Exact name of registrant as specified in its charter)
115 South Grant Street, Fitzgerald, Georgia 31750
(Address of principal executive offices) (Zip Code)
(229) 426-6000
(Registrant's telephone number, including area code)
Check the appropriate box below if the Form 8-K filing is intended to simultaneously satisfy the filing obligation of the registrant under any of the following provisions:
Securities registered pursuant to Section 12(b) of the Act:
Indicate by check mark whether the registrant is an emerging growth company as defined in Rule 405 of the Securities Act of 1933 (§230.405 of this chapter) or Rule 12b-2 of the Securities Exchange Act of 1934 (§240.12b-2 of this chapter). Emerging growth company ☐
If an emerging growth company, indicate by check mark if the registrant has elected not to use the extended transition period for complying with any new or revised financial accounting standards provided pursuant to Section 13(a) of the Exchange Act. ☐
Item 2.02. Results of Operation and Financial Condition
On April 22, 2026, Colony Bankcorp, Inc. issued a press release announcing its consolidated financial results for the first quarter ended March 31, 2026, as well as the announcement of a regular quarterly cash dividend. A copy of the press release is attached hereto as Exhibit 99.1 and is incorporated herein by reference.
Item 7.01. Regulation FD Disclosure
The Company is furnishing a copy of its most recent investor presentation, which it intends to use in connection with certain community group presentations. A copy of the presentation materials to be used by the Company is furnished as Exhibit 99.2 to this Current Report and is incorporated herein by reference. The Company will also host an investor earnings call at 9:00 a.m. ET on Thursday, April 23, 2026.
In accordance with General Instruction B.2 of Form 8-K, the information in this Current Report on Form 8-K, including Exhibits 99.1 and 99.2 attached hereto, is being furnished and shall not be deemed “filed” for purposes of Section 18 of the Securities Exchange Act of 1934, as amended (the “Exchange Act”) or otherwise subject to the liabilities of that section, nor shall it be deemed incorporated by reference in any filing under the Securities Act of 1933, as amended, or the Exchange Act, except as expressly set forth by specific reference in such filing.
Item 9.01 Financial Statements and Exhibits
(d) |
Exhibits. |
Exhibit Number |
|
Description |
|
|
|
99.1 |
|
|
99.2 |
|
|
104 |
|
Cover Page Interactive Data File - the cover page XBRL tags are embedded within the Inline XBRL document. |
SIGNATURE
Pursuant to the requirements of the Securities Exchange Act of 1934, as amended, the registrant has duly caused this report to be signed on its behalf by the undersigned hereunto duly authorized.
|
COLONY BANKCORP, INC. |
|
|
|
|
|
|
|
Date: April 22, 2026 |
By: |
/s/ Derek Shelnutt |
|
|
Derek Shelnutt |
|
|
Executive Vice President and Chief Financial Officer |
Exhibit 99.1

For additional information, contact:
Derek Shelnutt
EVP & Chief Financial Officer
229-426-6000, extension 6119
COLONY BANKCORP, INC. REPORTS FIRST QUARTER 2026 RESULTS
DECLARES QUARTERLY CASH DIVIDEND OF $0.12 PER SHARE
FITZGERALD, GA. (April 22, 2026) – Colony Bankcorp, Inc. (NYSE: CBAN) (“Colony” or the “Company”) today reported financial results for the first quarter of 2026. Financial highlights are shown below.
Financial Highlights:
| ● | Net income was $8.2 million, or $0.39 per diluted share, for the first quarter of 2026, compared to $7.8 million, or $0.42 per diluted share, for the fourth quarter of 2025, and $6.6 million, or $0.38 per diluted share, for the first quarter of 2025. |
| ● | Operating net income was $9.5 million, or $0.45 of operating earnings per diluted share, for the first quarter of 2026, compared to $8.9 million, or $0.48 of operating earnings per diluted share, for the fourth quarter of 2025, and $6.6 million, or $0.38 of operating earnings per diluted share, for the first quarter of 2025. (See Reconciliation of Non-GAAP Measures). |
| ● | Provision for credit losses of $1.75 million was recorded in the first quarter of 2026 compared to $1.65 million in the fourth quarter of 2025, and $1.50 million in the first quarter of 2025. |
| ● | Total loans, excluding loans held for sale, were $2.41 billion at March 31, 2026, an increase of $32.2 million, or 1.35%, from the prior quarter. |
| ● | Total deposits were $3.05 billion and $3.07 billion at March 31, 2026 and December 31, 2025, respectively, a decrease of $19.1 million. |
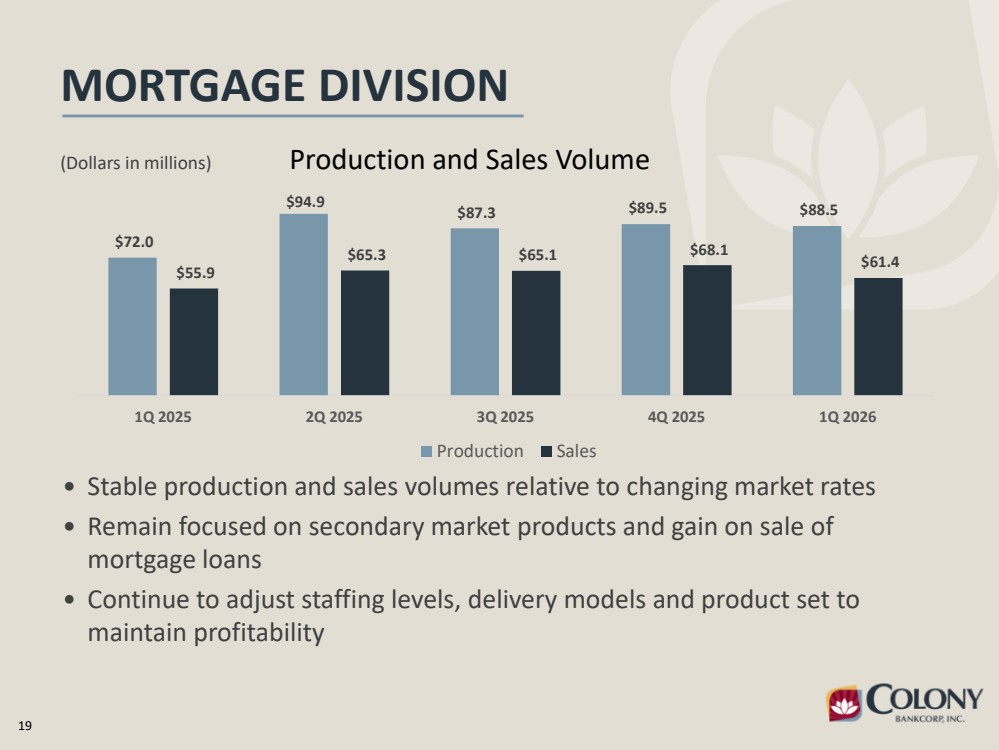
| ● | Mortgage production was $88.5 million, and mortgage sales totaled $61.4 million in the first quarter of 2026 compared to $89.5 million and $68.1 million, respectively, for the fourth quarter of 2025. |
| ● | Small Business Specialty Lending (“SBSL”) closed $13.1 million in Small Business Administration (“SBA”) loans and sold $10.4 million in SBA loans in the first quarter of 2026 compared to $29.1 million and $16.8 million, respectively, for the fourth quarter of 2025. |
The Company also announced that on April 22, 2026, the Board of Directors declared a quarterly cash dividend of $0.12 per share, to be paid on its common stock on May 20, 2026, to shareholders of record as of the close of business on May 6, 2026. The Company had 21,162,104 shares of its common stock outstanding as of April 20, 2026.
"Our first quarter performance represents a strong start to the year, characterized by meaningful improvement compared to the first quarter in the prior year and continued disciplined execution of our strategic initiatives. In addition to our solid financial performance during the quarter, our team successfully completed the TC Federal customer integration and core systems conversion which represents a significant operational achievement that allows us to fully realize the efficiencies of our combined organization and provides a scalable platform for future growth,” said Heath Fountain, Chief Executive Officer.
"Beyond core banking operations, our complementary lines of business continue to demonstrate significant momentum, contributing to a notable increase in noninterest income compared to the first quarter of the prior year. This growth highlights the success of our diversification strategy and our ability to deepen client relationships across our platform.”
1
“Colony Insurance and Colony Financial Advisors both achieved their strongest quarters to date on a pre-tax basis. The performance of these lines of business illustrates the value of our integrated financial services model and provides a resilient, diversified revenue stream that complements our core banking operations."
“We are also encouraged by the continued expansion of our net interest margin, marking another consecutive quarter of improvement. This trend, supported by our diligent management of deposit costs and asset yields, reinforces the underlying strength of our balance sheet. As we move forward, we remain committed to leveraging our enhanced scale and operational stability to deliver consistent results for our shareholders."
Balance Sheet
| ● | Total assets were $3.72 billion at March 31, 2026, a slight decrease of $14.8 million from December 31, 2025. |
| ● | Total loans, excluding loans held for sale, were $2.41 billion at March 31, 2026, an increase of $32.2 million from December 31, 2025. |
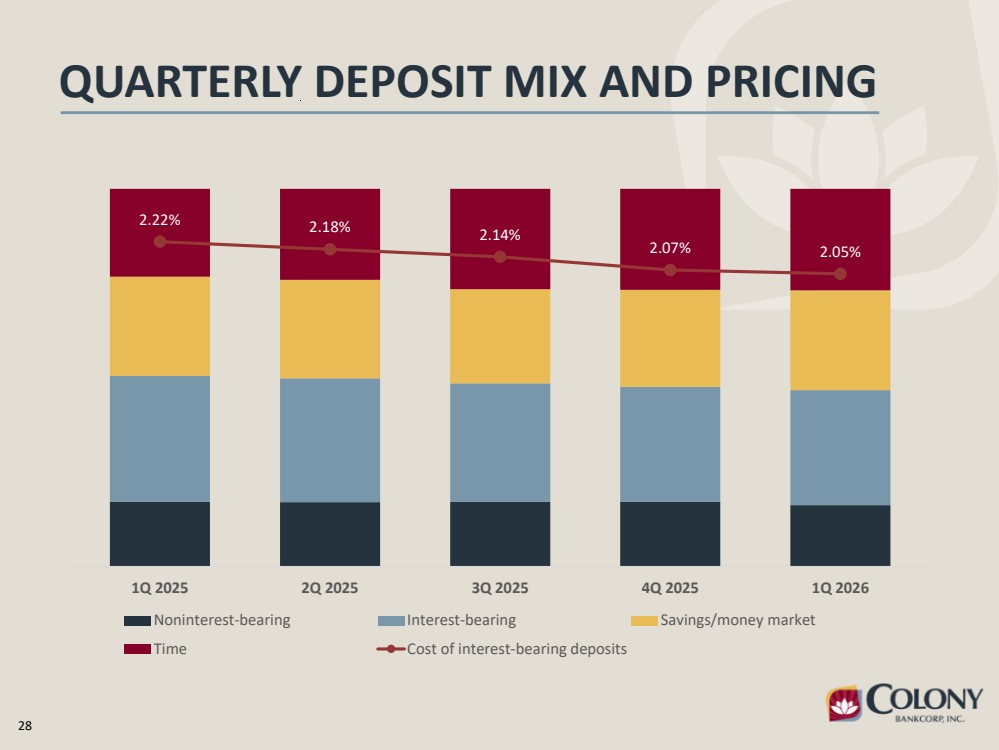
| ● | Total deposits were $3.05 billion and $3.07 billion at March 31, 2026 and December 31, 2025, respectively, a decrease of $19.1 million. Decreases were seen in noninterest-bearing demand deposits of $31.5 million, interest-bearing demand deposits of $4.5 million and time deposits of $1.7 million while savings and money market deposits increased $18.6 million, from December 31, 2025 to March 31, 2026. The decline in organic customer deposits was driven by the seasonal municipal deposit outflow early in the quarter, however customer deposits increased in the month of March. |
| ● | Total borrowings at March 31, 2026 totaled $258.1 million, an increase of $32,000 compared to December 31, 2025. |
Capital
| ● | Colony continues to maintain a strong capital position, with ratios that exceed regulatory minimums required to be considered as “well-capitalized.” |
| ● | Under the Company’s approved stock repurchase program, a total of 89,109 shares of the Company common stock were repurchased during the first quarter of 2026 at an average price of $19.78 per share and a total value of $1,762,839. |
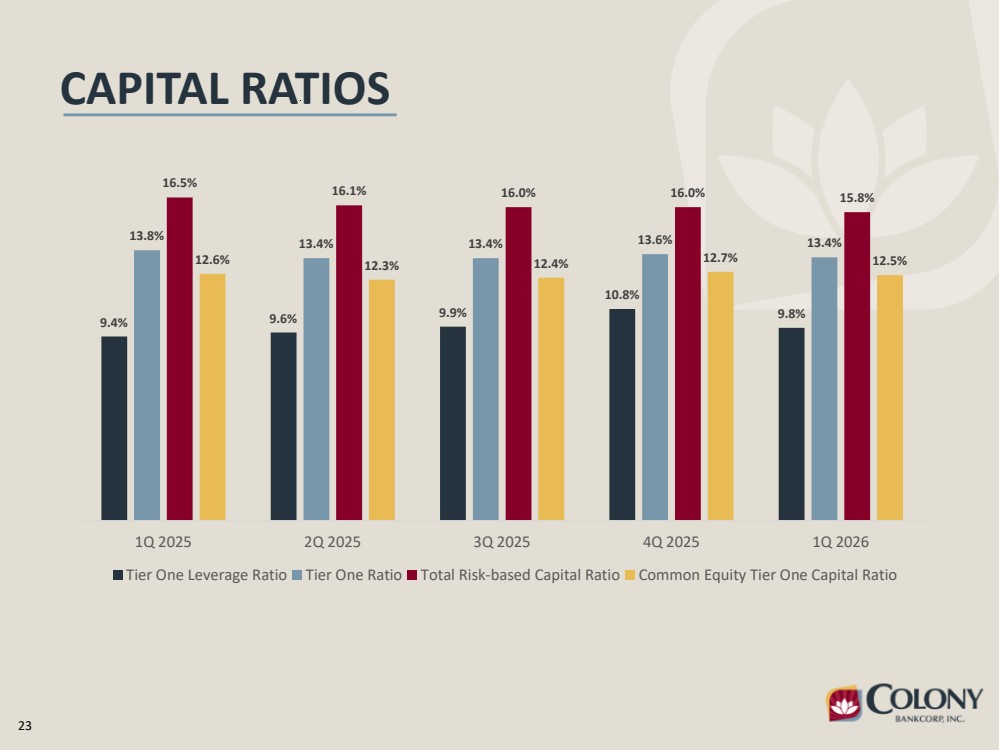
| ● | Preliminary tier one leverage ratio, tier one capital ratio, total risk-based capital ratio and common equity tier one capital ratio were 9.84%, 13.44%, 15.75%, and 12.53%, respectively, at March 31, 2026. |
First Quarter 2026 Results of Operations
| ● | Net interest income, on a tax-equivalent basis, totaled $29.4 million for the first quarter ended March 31, 2026 compared to $21.1 million for the same period in 2025. Increases occurred in income on interest earning assets which was more than offset by a slight increase in interest bearing liabilities. Income on interest earning assets increased $9.3 million to $45.0 million for the first quarter of 2026 compared to the same period in 2025. Expense on interest bearing liabilities increased $1.1 million to $15.7 million for the first quarter of 2026 compared to the same period in 2025. |
| ● | Net interest margin for the first quarter of 2026 was 3.48% compared to 2.93% for the first quarter of 2025. This increase was impacted by the Company’s acquisition of TC Bancshares, Inc. in the fourth quarter of 2025, and in addition related to increases in interest earning asset yields period over period, as well as the decreased cost of funds. |
| ● | Noninterest income totaled $10.7 million for the first quarter of 2026, an increase of $1.6 million, or 18.2%, compared to the same period in 2025. Increases occurred in service charges on deposits, mortgage fee income, interchange fees, insurance commissions and an increase in wealth advisor income included in other noninterest income, partially offset by decreases in gains on sales of SBA loans. |
| ● | Noninterest expense totaled $27.7 million for the first quarter of 2026, compared to $20.2 million for the same period in 2025. This increase was a result of increases in salaries and employee benefits, occupancy and equipment, information technology expenses, professional fees, advertising and public relations, and acquisition expenses related to the acquisition of TC Bancshares, Inc. which occurred in the fourth quarter of 2025. |
Asset Quality
| ● | Nonperforming assets totaled $19.9 million and $24.7 million at March 31, 2026 and December 31, 2025, respectively, a decrease of $4.8 million. |
| ● | Other real estate owned and repossessed assets totaled $2.1 million at March 31, 2026 and $1.2 million at December 31, 2025. |
| ● | Net loans charged-off were $1.7 million, or 0.29% of average loans for the first quarter of 2026, compared to $1.6 million, or 0.30% for the fourth quarter of 2025. |
| ● | The credit loss reserve was $21.7 million, or 0.90% of total loans, at March 31, 2026, compared to $23.0 million, or 0.97% of total loans at December 31, 2025. |
2
Earnings call information
The Company will host an earnings conference call at 9:00 a.m. ET on Thursday, April 23, 2026, to discuss the recent results and answer relevant questions. The conference call can be accessed by dialing 1-800-715-9871 and using the Conference ID: 2679228. A replay of the call will be available until Thursday, April 30, 2026. To listen to the replay, dial 1-800-770-2030 and entering the passcode 2679228#.
About Colony Bankcorp
Colony Bankcorp, Inc. is the bank holding company for Colony Bank. Founded in Fitzgerald, Georgia in 1975, Colony operates locations throughout Georgia as well as in Birmingham, Alabama, and across North Florida, including Tallahassee, Jacksonville, and the Florida Panhandle. Colony Bank provides a consultative approach in offering a range of banking solutions for personal and business customers. In addition to traditional banking services, Colony Bank provides specialized solutions including mortgage lending, government-guaranteed lending, consumer insurance, wealth management, credit cards and merchant services. Colony Bankcorp’s common stock is traded on the New York Stock Exchange (“NYSE”) under the symbol “CBAN.” For more information, please visit www.colony.bank. You can also follow the Company on social media.
Forward-Looking Statements
Certain statements contained in this press release that are not statements of historical fact constitute “forward-looking statements” within the meaning of, and subject to the protections of, Section 27A of the Securities Act of 1933, as amended, and Section 21E of the Securities Exchange Act of 1934, as amended. In addition, certain statements may be contained in the Company’s future filings with the Securities and Exchange Commission (the “SEC”), in press releases, and in oral and written statements made by or with the approval of the Company that are not statements of historical fact and constitute “forward-looking statements” within the meaning of, and subject to the protections of, Section 27A of the Securities Act of 1933, as amended, and Section 21E of the Securities Exchange Act of 1934, as amended. Examples of forward-looking statements include, but are not limited to: (i) projections and/or expectations of revenues, income or loss, earnings or loss per share, the payment or nonpayment of dividends, capital structure and other financial items; (ii) statement of plans and objectives of Colony Bankcorp, Inc. or its management or Board of Directors, including those relating to products or services; (iii) statements of future economic performance; (iv) statements regarding growth strategy, capital management, liquidity and funding, and future profitability; (v) statements relating to the timing, benefits, costs, and synergies of the recently completed acquisition of TC Bancshares, Inc. (“TC Bancshares”) (the “Merger”), and (vi) statements of assumptions underlying such statements. Words such as “may”, “will”, “anticipate”, “assume”, “should”, “support”, “indicate”, “would”, “believe”, “contemplate”, “expect”, “estimate”, “continue”, “further”, “plan”, “point to”, “project”, “could”, “intend”, “target” and similar expressions are intended to identify forward-looking statements but are not the exclusive means of identifying such statements.
Prospective investors are cautioned that any such forward-looking statements are not guarantees of future performance and involve known and unknown risks and uncertainties. Factors that might cause such differences include, but are not limited to: the impact of current and future economic conditions, particularly those affecting the financial services industry, including the effects of declines in the real estate market, tariffs or trade wars (including the resulting reduced consumer spending, lower economic growth or recession, reduced demand for U.S.
3
exports, disruptions to supply chains, and decreased demand for other banking products and services), high unemployment rates, inflationary pressures, changes in interest rates (including the impact of volatile interest rates on our financial projections and models) and slowdowns in economic growth, as well as the financial stress on borrowers as a result of the foregoing; the risk of reductions in benchmark interest rates and the resulting impacts on net interest income; potential impacts of adverse developments in the banking industry highlighted by high-profile bank failures, including impacts on customer confidence, deposit outflows, liquidity and the regulatory response thereto; risks arising from negative media coverage and perceived instability in the banking industry and the banking sector; the risks of changes in interest rates and their effects on the level, cost, and composition of, and competition for, deposits, loan demand and timing of payments, the values of loan collateral, securities, and interest sensitive assets and liabilities; the ability to attract new or retain existing deposits, to retain or grow loans or additional interest and fee income, or to control noninterest expense; the effect of pricing pressures on the Company’s net interest margin; the failure of assumptions underlying the establishment of reserves for possible credit losses, fair value for loans and other real estate owned; changes in real estate values; the Company’s ability to implement its various strategic and growth initiatives; increased competition in the financial services industry, particularly from regional and national institutions, as well as fintech companies and other non-bank financial service providers offering digital, automated or alternative financial products and services; economic conditions, either nationally or locally, in areas in which the Company conducts operations being less favorable than expected; changes in the prices, values and sales volumes of residential and commercial real estate; developments in our mortgage banking business, including loan modifications, general demand, and the effects of judicial or regulatory requirements or guidance; legislation or regulatory changes which adversely affect the ability of the consolidated Company to conduct business combinations or new operations; adverse results from current or future litigation, regulatory examinations or other legal and/or regulatory actions, including as a result of the Company’s participation in and execution of government programs, those related to credit card interest rates, and legislative, regulatory or supervisory actions related to so-called “de-banking,” including any new prohibitions, requirements or enforcement priorities that could affect customer relationships, compliance obligations, or operational practices; significant turbulence or a disruption in the capital or financial markets and the effect of a fall in the stock market prices on our investment securities; significant volatility in the markets for equity, fixed income and other asset classes globally or within specific markets; the effects of war or other conflicts, including the ongoing conflicts in the Middle East; major political shifts domestically or internationally (including the potential for retaliatory actions by governments, market participants or clients based on diverging perspectives or otherwise and, separately, the recent shutdown of the U.S. federal government); general risks related to the Company’s merger and acquisition activity, including risks associated with integrating and realizing the expected financial benefits of previous or pending acquisitions, and the Company’s pursuit of future acquisitions; risks associated with the recent Merger, including the risk that the cost savings and any revenue synergies may not be realized or take longer than anticipated to be realized as well as disruption with customers, suppliers, employee or other business partners relationships; the risk of successful integration of TC Bancshares’ business into the Company; the reaction of each of the Company’s and TC Bancshares’ customers, suppliers, employees or other business partners to the Merger; the risk that the integration of TC Bancshares’ operations into the operations of the Company will be materially delayed or will be more costly or difficult than expected; the timing and achievement of expected cost reductions following the Merger; the timing and achievement of the recovery of the reduction of tangible book value resulting from the Merger; general competitive, economic, political, and market conditions; the impact of emerging technologies, such as generative artificial intelligence; fraud or misconduct by internal or external actors, and system failures, cybersecurity threats or security breaches and the cost of defending against them; a deterioration of the credit rating for U.S. long-term sovereign debt, actions that the U.S. government may take to avoid exceeding the debt ceiling, and uncertainties surrounding debt ceiling and the federal budget; and general competitive, economic, political and market conditions or other unexpected factors or events. These and other factors, risks and uncertainties could cause the actual results, performance or achievements of the Company to be materially different from the future results, performance or achievements expressed or implied by such forward-looking statements. Many of these factors are beyond the Company’s ability to control or predict.
Forward-looking statements speak only as of the date on which such statements are made. These forward-looking statements are based upon information presently known to the Company’s management and are inherently subjective, uncertain and subject to change due to any number of risks and uncertainties, including, without limitation, the risks and other factors set forth in the Company’s filings with the Securities and Exchange Commission, the Company’s Annual Report on Form 10-K for the year ended December 31, 2024, under the captions “Cautionary Note Regarding Forward-Looking Statements” and “Risk Factors,” and in the Company’s quarterly reports on Form 10-Q and current reports on Form 8-K. The Company undertakes no obligation to update any forward-looking statement to reflect events or circumstances after the date on which such statement is made, or to reflect the occurrence of unanticipated events, except as required by applicable law. Readers are cautioned not to place undue reliance on these forward-looking statements.
4
Explanation of Certain Unaudited Non-GAAP Financial Measures
The measures entitled operating noninterest income, operating noninterest expense, operating net income, operating earnings per diluted share, operating return on average assets, operating return on average equity, operating return on average tangible equity, tangible book value per common share, tangible equity to tangible assets, operating efficiency ratio, operating net noninterest expense to average assets and pre-provision net revenue are not measures recognized under U.S. generally accepted accounting principles (“GAAP”) and therefore are considered non-GAAP financial measures. The most comparable GAAP measures are noninterest income, noninterest expense, net income, diluted earnings per share, return on average assets, return on average equity, book value per common share, total equity to total assets, efficiency ratio, net noninterest expense to average assets and net interest income before provision for credit losses, respectively. Operating noninterest income excludes loss on sales of securities. Operating noninterest expense excludes acquisition-related expenses, severance costs and loss related to wire fraud incident. Operating net income, operating return on average assets, operating return on average equity, operating return on average tangible equity and operating efficiency ratio all exclude acquisition-related expenses, severance costs, loss on sales of securities and loss related to wire fraud incident from net income, return on average assets, return on average equity and efficiency ratio, respectively. Operating net noninterest expense to average assets ratio excludes from net noninterest expense, severance costs, acquisition-related expenses, loss on sales of securities and loss related to wire fraud incident. Acquisition-related expenses includes fees associated with acquisitions and vendor contract buyouts. Severance costs includes costs associated with termination and retirement of employees. Operating earnings per diluted share includes the adjustments to operating net income. Tangible book value per common share, tangible equity to tangible assets and operating return on average tangible equity exclude goodwill and other intangibles from book value per common share, total equity to total assets and return on average equity, respectively. Pre-provision net revenue is calculated by adding noninterest income to net interest income before provision for credit losses, and subtracting noninterest expense.
Management uses these non-GAAP financial measures in its analysis of the Company’s performance and believes these presentations provide useful supplemental information, and a clearer understanding of the Company’s performance, and if not provided would be requested by the investor community. The Company believes the non-GAAP measures enhance investors’ understanding of the Company’s business and performance. These measures are also useful in understanding performance trends and facilitate comparisons with the performance of other financial institutions. The limitations associated with operating measures are the risk that persons might disagree as to the appropriateness of items comprising these measures and that different companies might calculate these measures differently.
These disclosures should not be considered an alternative to GAAP. The computations of operating noninterest income, operating noninterest expense, operating net income, operating earnings per diluted share, operating return on average assets, operating return on average equity, operating return on average tangible equity, tangible book value per common share, tangible equity to tangible assets, operating efficiency ratio, operating net noninterest expense to average assets and pre-provision net revenue and the reconciliation of these measures to noninterest income, noninterest expense, net income, diluted earnings per share, return on average assets, return on average equity, book value per common share, total equity to total assets, efficiency ratio, net noninterest expense to average assets and net interest income before provision for credit losses are set forth in the table below.
5
Colony Bankcorp, Inc.
Reconciliation of Non-GAAP Measures
|
|
2026 |
|
2025 |
|||||||||||
|
|
First |
|
Fourth |
|
Third |
|
Second |
|
First |
|||||
(dollars in thousands, except per share data) |
|
Quarter |
|
Quarter |
|
Quarter |
|
Quarter |
|
Quarter |
|||||
Operating noninterest income reconciliation |
|
|
|
|
|
|
|
|
|
|
|
|
|
|
|
Noninterest income (GAAP) |
|
$ |
10,692 |
|
$ |
11,047 |
|
$ |
10,091 |
|
$ |
10,098 |
|
$ |
9,044 |
Loss on sales of securities |
|
|
— |
|
|
— |
|
|
1,039 |
|
|
— |
|
|
— |
Operating noninterest income |
|
$ |
10,692 |
|
$ |
11,047 |
|
$ |
11,130 |
|
$ |
10,098 |
|
$ |
9,044 |
|
|
|
|
|
|
|
|
|
|
|
|
|
|
|
|
Operating noninterest expense reconciliation |
|
|
|
|
|
|
|
|
|
|
|
|
|
|
|
Noninterest expense (GAAP) |
|
$ |
27,674 |
|
$ |
25,709 |
|
$ |
24,612 |
|
$ |
22,004 |
|
$ |
20,221 |
Acquisition-related expenses |
|
|
(1,637) |
|
|
(1,331) |
|
|
(732) |
|
|
— |
|
|
— |
Loss related to wire fraud incident |
|
|
— |
|
|
— |
|
|
(1,252) |
|
|
— |
|
|
— |
Operating noninterest expense |
|
$ |
26,037 |
|
$ |
24,378 |
|
$ |
22,628 |
|
$ |
22,004 |
|
$ |
20,221 |
|
|
|
|
|
|
|
|
|
|
|
|
|
|
|
|
Operating net income reconciliation |
|
|
|
|
|
|
|
|
|
|
|
|
|
|
|
Net income (GAAP) |
|
$ |
8,204 |
|
$ |
7,843 |
|
$ |
5,819 |
|
$ |
7,978 |
|
$ |
6,613 |
Acquisition-related expenses |
|
|
1,637 |
|
|
1,331 |
|
|
732 |
|
|
— |
|
|
— |
Loss related to wire fraud incident |
|
|
— |
|
|
— |
|
|
1,252 |
|
|
— |
|
|
— |
Loss on sales of securities |
|
|
— |
|
|
— |
|
|
1,039 |
|
|
— |
|
|
— |
Income tax benefit |
|
|
(356) |
|
|
(269) |
|
|
(612) |
|
|
— |
|
|
— |
Operating net income |
|
$ |
9,485 |
|
$ |
8,905 |
|
$ |
8,230 |
|
$ |
7,978 |
|
$ |
6,613 |
|
|
|
|
|
|
|
|
|
|
|
|
|
|
|
|
Weighted average diluted shares |
|
|
21,222,237 |
|
|
18,729,511 |
|
|
17,461,434 |
|
|
17,448,945 |
|
|
17,509,059 |
|
|
|
|
|
|
|
|
|
|
|
|
|
|
|
|
Operating earnings per diluted share |
|
$ |
0.45 |
|
$ |
0.48 |
|
$ |
0.47 |
|
$ |
0.46 |
|
$ |
0.38 |
|
|
|
|
|
|
|
|
|
|
|
|
|
|
|
|
Operating return on average assets reconciliation |
|
|
|
|
|
|
|
|
|
|
|
|
|
|
|
Return on average assets (GAAP) |
|
|
0.90 |
% |
|
0.93 |
% |
|
0.75 |
% |
|
1.02 |
% |
|
0.85 |
Acquisition-related expenses |
|
|
0.18 |
|
|
0.15 |
|
|
0.10 |
|
|
— |
|
|
— |
Loss related to wire fraud incident |
|
|
— |
|
|
— |
|
|
0.16 |
|
|
— |
|
|
— |
Loss on sales of securities |
|
|
— |
|
|
— |
|
|
0.13 |
|
|
— |
|
|
— |
Tax effect of adjustment items |
|
|
(0.04) |
|
|
(0.03) |
|
|
(0.08) |
|
|
— |
|
|
— |
Operating return on average assets |
|
|
1.04 |
% |
|
1.05 |
% |
|
1.06 |
% |
|
1.02 |
% |
|
0.85 |
|
|
|
|
|
|
|
|
|
|
|
|
|
|
|
|
Operating return on average equity reconciliation |
|
|
|
|
|
|
|
|
|
|
|
|
|
|
|
Return on average equity (GAAP) |
|
|
8.77 |
% |
|
9.49 |
% |
|
7.80 |
% |
|
11.14 |
% |
|
9.63 |
Acquisition-related expenses |
|
|
1.74 |
|
|
1.62 |
|
|
0.98 |
|
|
— |
|
|
— |
Loss related to wire fraud incident |
|
|
— |
|
|
— |
|
|
1.68 |
|
|
— |
|
|
— |
Loss on sales of securities |
|
|
— |
|
|
— |
|
|
1.39 |
|
|
— |
|
|
— |
Tax effect of adjustment items |
|
|
(0.38) |
|
|
(0.33) |
|
|
(0.82) |
|
|
— |
|
|
— |
Operating return on average equity |
|
|
10.13 |
% |
|
10.78 |
% |
|
11.03 |
% |
|
11.14 |
% |
|
9.63 |
6
Colony Bankcorp, Inc.
Reconciliation of Non-GAAP Measures
|
|
2026 |
|
2025 |
|
|||||||||||
|
|
First |
|
Fourth |
|
Third |
|
Second |
|
First |
|
|||||
(dollars in thousands, except per share data) |
|
Quarter |
|
Quarter |
|
Quarter |
|
Quarter |
|
Quarter |
|
|||||
Operating return on average tangible equity reconciliation |
|
|
|
|
|
|
|
|
|
|
|
|
|
|
|
|
Return on average tangible equity |
|
|
10.80 |
% |
|
11.63 |
% |
|
9.56 |
% |
|
13.70 |
% |
|
11.83 |
% |
Acquisition-related expenses |
|
|
2.16 |
|
|
1.97 |
|
|
1.20 |
|
|
— |
|
|
— |
|
Loss related to wire fraud incident |
|
|
— |
|
|
— |
|
|
2.06 |
|
|
— |
|
|
— |
|
Loss on sales of securities |
|
|
— |
|
|
— |
|
|
1.71 |
|
|
— |
|
|
— |
|
Tax effect of adjustment items |
|
|
(0.47) |
|
|
(0.40) |
|
|
(1.01) |
|
|
— |
|
|
— |
|
Operating return on average tangible equity |
|
|
12.49 |
% |
|
13.20 |
% |
|
13.52 |
% |
|
13.70 |
% |
|
11.83 |
% |
|
|
|
|
|
|
|
|
|
|
|
|
|
|
|
|
|
Tangible book value per common share reconciliation |
|
|
|
|
|
|
|
|
|
|
|
|
|
|
|
|
Book value per common share (GAAP) |
|
$ |
17.98 |
|
$ |
17.69 |
|
$ |
17.31 |
|
$ |
16.87 |
|
$ |
16.41 |
|
Effect of goodwill and other intangibles |
|
|
(3.33) |
|
|
(3.38) |
|
|
(3.11) |
|
|
(3.14) |
|
|
(2.95) |
|
Tangible book value per common share |
|
$ |
14.65 |
|
$ |
14.31 |
|
$ |
14.20 |
|
$ |
13.73 |
|
$ |
13.46 |
|
|
|
|
|
|
|
|
|
|
|
|
|
|
|
|
|
|
Tangible equity to tangible assets reconciliation |
|
|
|
|
|
|
|
|
|
|
|
|
|
|
|
|
Equity to assets (GAAP) |
|
|
10.22 |
% |
|
10.06 |
% |
|
9.59 |
% |
|
9.43 |
% |
|
9.05 |
% |
Effect of goodwill and other intangibles |
|
|
(1.73) |
|
|
(1.76) |
|
|
(1.59) |
|
|
(1.62) |
|
|
(1.51) |
|
Tangible equity to tangible assets |
|
|
8.49 |
% |
|
8.30 |
% |
|
8.00 |
% |
|
7.81 |
% |
|
7.54 |
% |
|
|
|
|
|
|
|
|
|
|
|
|
|
|
|
|
|
Operating efficiency ratio calculation |
|
|
|
|
|
|
|
|
|
|
|
|
|
|
|
|
Efficiency ratio (GAAP) |
|
|
69.37 |
% |
|
69.65 |
% |
|
75.06 |
% |
|
67.74 |
% |
|
67.41 |
% |
Acquisition-related expenses |
|
|
(4.10) |
|
|
(3.61) |
|
|
(1.98) |
|
|
— |
|
|
— |
|
Loss related to wire fraud incident |
|
|
— |
|
|
— |
|
|
(3.38) |
|
|
— |
|
|
— |
|
Loss on sales of securities |
|
|
— |
|
|
— |
|
|
(2.81) |
|
|
— |
|
|
— |
|
Operating efficiency ratio |
|
|
65.27 |
% |
|
66.04 |
% |
|
66.89 |
% |
|
67.74 |
% |
|
67.41 |
% |
|
|
|
|
|
|
|
|
|
|
|
|
|
|
|
|
|
Operating net noninterest expense(1) to average assets calculation |
|
|
|
|
|
|
|
|
|
|
|
|
|
|
|
|
Net noninterest expense to average assets |
|
|
1.86 |
% |
|
1.73 |
% |
|
1.86 |
% |
|
1.52 |
% |
|
1.44 |
% |
Acquisition-related expenses |
|
|
(0.18) |
|
|
(0.15) |
|
|
(0.09) |
|
|
— |
|
|
— |
|
Loss related to wire fraud incident |
|
|
— |
|
|
— |
|
|
(0.16) |
|
|
— |
|
|
— |
|
Loss on sales of securities |
|
|
— |
|
|
— |
|
|
(0.13) |
|
|
— |
|
|
— |
|
Operating net noninterest expense to average assets |
|
|
1.68 |
% |
|
1.58 |
% |
|
1.48 |
% |
|
1.52 |
% |
|
1.44 |
% |
|
|
|
|
|
|
|
|
|
|
|
|
|
|
|
|
|
Pre-provision net revenue |
|
|
|
|
|
|
|
|
|
|
|
|
|
|
|
|
Net interest income before provision for credit losses |
|
$ |
29,203 |
|
$ |
25,865 |
|
$ |
22,699 |
|
$ |
22,385 |
|
$ |
20,952 |
|
Noninterest income |
|
|
10,692 |
|
|
11,047 |
|
|
10,091 |
|
|
10,098 |
|
|
9,044 |
|
Total income |
|
|
39,895 |
|
|
36,912 |
|
|
32,790 |
|
|
32,483 |
|
|
29,996 |
|
Noninterest expense |
|
|
27,674 |
|
|
25,709 |
|
|
24,612 |
|
|
22,004 |
|
|
20,221 |
|
Pre-provision net revenue |
|
$ |
12,221 |
|
$ |
11,203 |
|
$ |
8,178 |
|
$ |
10,479 |
|
$ |
9,775 |
|
|
|
|
|
|
|
|
|
|
|
|
|
|
|
|
|
|
Operating pre-provision net revenue |
|
|
|
|
|
|
|
|
|
|
|
|
|
|
|
|
Net interest income before provision for credit losses |
|
$ |
29,203 |
|
$ |
25,865 |
|
$ |
22,699 |
|
$ |
22,385 |
|
$ |
20,952 |
|
Operating noninterest income |
|
|
10,692 |
|
|
11,047 |
|
|
11,130 |
|
|
10,098 |
|
|
9,044 |
|
Total operating income |
|
|
39,895 |
|
|
36,912 |
|
|
33,829 |
|
|
32,483 |
|
|
29,996 |
|
Operating noninterest expense |
|
|
26,037 |
|
|
24,378 |
|
|
22,628 |
|
|
22,004 |
|
|
20,221 |
|
Operating pre-provision net revenue |
|
$ |
13,858 |
|
$ |
12,534 |
|
$ |
11,201 |
|
$ |
10,479 |
|
$ |
9,775 |
|
| (1) | Net noninterest expense is defined as noninterest expense less noninterest income. |
7
Colony Bankcorp, Inc.
Selected Financial Information
|
|
2026 |
|
2025 |
|
|||||||||||
|
|
First |
|
Fourth |
|
Third |
|
Second |
|
First |
|
|||||
(dollars in thousands, except per share data) |
|
Quarter |
|
Quarter |
|
Quarter |
|
Quarter |
|
Quarter |
|
|||||
EARNINGS SUMMARY |
|
|
|
|
|
|
|
|
|
|
|
|
|
|
|
|
Net interest income |
|
$ |
29,203 |
|
$ |
25,865 |
|
$ |
22,699 |
|
$ |
22,385 |
|
$ |
20,952 |
|
Provision for credit losses |
|
|
1,750 |
|
|
1,650 |
|
|
900 |
|
|
450 |
|
|
1,500 |
|
Noninterest income |
|
|
10,692 |
|
|
11,047 |
|
|
10,091 |
|
|
10,098 |
|
|
9,044 |
|
Noninterest expense |
|
|
27,674 |
|
|
25,709 |
|
|
24,612 |
|
|
22,004 |
|
|
20,221 |
|
Income taxes |
|
|
2,267 |
|
|
1,710 |
|
|
1,459 |
|
|
2,051 |
|
|
1,662 |
|
Net income |
|
$ |
8,204 |
|
$ |
7,843 |
|
$ |
5,819 |
|
$ |
7,978 |
|
$ |
6,613 |
|
|
|
|
|
|
|
|
|
|
|
|
|
|
|
|
|
|
PER COMMON SHARE |
|
|
|
|
|
|
|
|
|
|
|
|
|
|
|
|
Common shares outstanding |
|
|
21,162,104 |
|
|
21,251,695 |
|
|
17,461,284 |
|
|
17,416,702 |
|
|
17,481,709 |
|
Weighted average basic shares |
|
|
21,222,237 |
|
|
18,729,511 |
|
|
17,461,434 |
|
|
17,448,945 |
|
|
17,509,059 |
|
Weighted average diluted shares |
|
|
21,222,237 |
|
|
18,729,511 |
|
|
17,461,434 |
|
|
17,448,945 |
|
|
17,509,059 |
|
Earnings per basic share |
|
$ |
0.39 |
|
$ |
0.42 |
|
$ |
0.33 |
|
$ |
0.46 |
|
$ |
0.38 |
|
Earnings per diluted share |
|
|
0.39 |
|
|
0.42 |
|
|
0.33 |
|
|
0.46 |
|
|
0.38 |
|
Operating earnings per diluted share(b) |
|
|
0.45 |
|
|
0.48 |
|
|
0.47 |
|
|
0.46 |
|
|
0.38 |
|
Cash dividends declared per share |
|
|
0.1200 |
|
|
0.1150 |
|
|
0.1150 |
|
|
0.1150 |
|
|
0.1150 |
|
Common book value per share |
|
|
17.98 |
|
|
17.69 |
|
|
17.31 |
|
|
16.87 |
|
|
16.41 |
|
Tangible book value per common share(b) |
|
|
14.65 |
|
|
14.31 |
|
|
14.20 |
|
|
13.73 |
|
|
13.46 |
|
Pre-provision net revenue(b) |
|
|
12,221 |
|
|
11,203 |
|
|
8,178 |
|
|
10,479 |
|
|
9,775 |
|
|
|
|
|
|
|
|
|
|
|
|
|
|
|
|
|
|
SELECTED PERFORMANCE RATIOS: |
|
|
|
|
|
|
|
|
|
|
|
|
|
|
|
|
Return on average assets |
|
|
0.90 |
% |
|
0.93 |
% |
|
0.75 |
% |
|
1.02 |
% |
|
0.85 |
% |
Return on average total equity |
|
|
8.77 |
|
|
9.49 |
|
|
7.80 |
|
|
11.14 |
|
|
9.63 |
|
Return on average tangible equity |
|
|
10.80 |
|
|
11.63 |
|
|
9.56 |
|
|
13.70 |
|
|
11.83 |
|
Efficiency ratio |
|
|
69.37 |
|
|
69.65 |
|
|
75.06 |
|
|
67.74 |
|
|
67.41 |
|
Net noninterest expense to average assets |
|
|
1.86 |
|
|
1.73 |
|
|
1.86 |
|
|
1.52 |
|
|
1.44 |
|
Total equity to total assets |
|
|
10.22 |
|
|
10.06 |
|
|
9.59 |
|
|
9.43 |
|
|
9.05 |
|
Tangible equity to tangible assets (b) |
|
|
8.49 |
|
|
8.30 |
|
|
8.00 |
|
|
7.81 |
|
|
7.54 |
|
Net interest margin (a) |
|
|
3.48 |
|
|
3.32 |
|
|
3.17 |
|
|
3.12 |
|
|
2.93 |
|
|
|
|
|
|
|
|
|
|
|
|
|
|
|
|
|
|
OPERATING SELECTED PERFORMANCE RATIOS: |
|
|
|
|
|
|
|
|
|
|
|
|
|
|
|
|
Operating return on average assets (b) |
|
|
1.04 |
% |
|
1.05 |
% |
|
1.06 |
% |
|
1.02 |
% |
|
0.85 |
% |
Operating return on average total equity (b) |
|
|
10.13 |
|
|
10.78 |
|
|
11.03 |
|
|
11.14 |
|
|
9.63 |
|
Operating return on average tangible equity (b) |
|
|
12.49 |
|
|
13.20 |
|
|
13.52 |
|
|
13.70 |
|
|
11.83 |
|
Operating efficiency ratio (b) |
|
|
65.27 |
|
|
66.04 |
|
|
66.89 |
|
|
67.74 |
|
|
67.41 |
|
Operating net noninterest expense to average assets(b) |
|
|
1.68 |
|
|
1.58 |
|
|
1.48 |
|
|
1.52 |
|
|
1.44 |
|
|
|
|
|
|
|
|
|
|
|
|
|
|
|
|
|
|
|
|
|
|
|
|
|
|
|
|
|
|
|
|
|
|
|
8
Colony Bankcorp, Inc.
Selected Financial Information
|
|
2026 |
|
2025 |
|
|||||||||||
|
|
First |
|
Fourth |
|
Third |
|
Second |
|
First |
|
|||||
(dollars in thousands, except per share data) |
|
Quarter |
|
Quarter |
|
Quarter |
|
Quarter |
|
Quarter |
|
|||||
ASSET QUALITY |
|
|
|
|
|
|
|
|
|
|
|
|
|
|
|
|
Nonperforming portfolio loans |
|
$ |
12,619 |
|
$ |
17,190 |
|
$ |
9,082 |
|
$ |
4,760 |
|
$ |
7,538 |
|
Nonperforming SBA government loans-guaranteed portion |
|
|
2,012 |
|
|
4,772 |
|
|
4,076 |
|
|
4,583 |
|
|
3,647 |
|
Nonperforming SBA government loans-unguaranteed portion |
|
|
2,968 |
|
|
1,418 |
|
|
1,110 |
|
|
1,241 |
|
|
1,271 |
|
Loans 90 days past due and still accruing |
|
|
178 |
|
|
95 |
|
|
98 |
|
|
107 |
|
|
22 |
|
Total nonperforming loans (NPLs) |
|
|
17,777 |
|
|
23,475 |
|
|
14,366 |
|
|
10,691 |
|
|
12,478 |
|
Other real estate owned |
|
|
1,873 |
|
|
1,048 |
|
|
710 |
|
|
710 |
|
|
522 |
|
Repossessed assets |
|
|
205 |
|
|
190 |
|
|
160 |
|
|
21 |
|
|
6 |
|
Total nonperforming assets (NPAs) |
|
|
19,855 |
|
|
24,713 |
|
|
15,236 |
|
|
11,422 |
|
|
13,006 |
|
Classified loans |
|
|
39,225 |
|
|
40,481 |
|
|
24,183 |
|
|
25,112 |
|
|
26,453 |
|
Criticized loans |
|
|
86,740 |
|
|
84,721 |
|
|
60,505 |
|
|
54,814 |
|
|
55,823 |
|
Net loan charge-offs (recoveries) |
|
|
1,709 |
|
|
1,600 |
|
|
1,827 |
|
|
1,049 |
|
|
606 |
|
Allowance for credit losses to total loans |
|
|
0.90 |
% |
|
0.97 |
% |
|
0.89 |
% |
|
0.96 |
% |
|
1.04 |
% |
Allowance for credit losses to total NPLs |
|
|
122.10 |
|
|
98.04 |
|
|
125.89 |
|
|
179.15 |
|
|
160.26 |
|
Allowance for credit losses to total NPAs |
|
|
109.32 |
|
|
93.13 |
|
|
118.71 |
|
|
167.69 |
|
|
153.75 |
|
Net charge-offs (recoveries) to average loans, net |
|
|
0.29 |
|
|
0.30 |
|
|
0.36 |
|
|
0.21 |
|
|
0.13 |
|
NPLs to total loans |
|
|
0.74 |
|
|
0.99 |
|
|
0.71 |
|
|
0.54 |
|
|
0.65 |
|
NPAs to total assets |
|
|
0.53 |
|
|
0.66 |
|
|
0.48 |
|
|
0.37 |
|
|
0.41 |
|
NPAs to total loans and foreclosed assets |
|
|
0.82 |
|
|
1.04 |
|
|
0.75 |
|
|
0.57 |
|
|
0.68 |
|
|
|
|
|
|
|
|
|
|
|
|
|
|
|
|
|
|
ACTUAL BALANCES |
|
|
|
|
|
|
|
|
|
|
|
|
|
|
|
|
Total assets |
|
$ |
3,720,613 |
|
$ |
3,735,401 |
|
$ |
3,152,746 |
|
$ |
3,115,617 |
|
$ |
3,171,825 |
|
Loans held for sale |
|
|
16,536 |
|
|
78,990 |
|
|
19,286 |
|
|
22,163 |
|
|
24,844 |
|
Loans, net of unearned income |
|
|
2,413,465 |
|
|
2,381,224 |
|
|
2,037,056 |
|
|
1,993,580 |
|
|
1,921,263 |
|
Deposits |
|
|
3,048,419 |
|
|
3,067,521 |
|
|
2,584,329 |
|
|
2,556,230 |
|
|
2,622,531 |
|
Total stockholders’ equity |
|
|
380,403 |
|
|
375,920 |
|
|
302,332 |
|
|
293,857 |
|
|
286,925 |
|
|
|
|
|
|
|
|
|
|
|
|
|
|
|
|
|
|
AVERAGE BALANCES |
|
|
|
|
|
|
|
|
|
|
|
|
|
|
|
|
Total assets |
|
$ |
3,698,663 |
|
$ |
3,357,785 |
|
$ |
3,092,411 |
|
$ |
3,138,125 |
|
$ |
3,149,321 |
|
Loans held for sale |
|
|
21,863 |
|
|
59,868 |
|
|
17,062 |
|
|
22,495 |
|
|
23,253 |
|
Loans, net of unearned income |
|
|
2,399,971 |
|
|
2,148,729 |
|
|
2,024,153 |
|
|
1,960,025 |
|
|
1,869,476 |
|
Deposits |
|
|
3,025,462 |
|
|
2,752,576 |
|
|
2,526,739 |
|
|
2,586,620 |
|
|
2,606,706 |
|
Total stockholders’ equity |
|
|
379,582 |
|
|
327,830 |
|
|
296,027 |
|
|
287,325 |
|
|
278,551 |
|
| (a) | Computed using fully taxable-equivalent net income. |
| (b) | Non-GAAP measure - see “Explanation of Certain Unaudited Non-GAAP Financial Measures” for more information and reconciliation to GAAP. |
9
Colony Bankcorp, Inc.
Average Balance Sheet and Net Interest Analysis
|
|
Three Months Ended March 31, |
|
||||||||||||||
|
|
2026 |
|
2025 |
|
||||||||||||
|
|
Average |
|
Income/ |
|
Yields/ |
|
Average |
|
Income/ |
|
Yields/ |
|
||||
(dollars in thousands) |
|
Balances |
|
Expense |
|
Rates |
|
Balances |
|
Expense |
|
Rates |
|
||||
Assets |
|
|
|
|
|
|
|
|
|
|
|
|
|
|
|
|
|
Interest-earning assets: |
|
|
|
|
|
|
|
|
|
|
|
|
|
|
|
|
|
Loans held for sale |
|
$ |
21,863 |
|
$ |
454 |
|
8.42 |
% |
$ |
23,253 |
|
$ |
328 |
|
5.73 |
% |
Loans, net of unearned income 1 |
|
|
2,399,971 |
|
|
37,568 |
|
6.35 |
% |
|
1,869,476 |
|
|
27,716 |
|
6.01 |
% |
Investment securities, taxable |
|
|
668,824 |
|
|
4,537 |
|
2.75 |
% |
|
710,293 |
|
|
4,837 |
|
2.76 |
% |
Investment securities, tax-exempt 2 |
|
|
94,588 |
|
|
489 |
|
2.10 |
% |
|
94,379 |
|
|
494 |
|
2.12 |
% |
Deposits in banks and short term investments |
|
|
240,446 |
|
|
1,993 |
|
3.36 |
% |
|
229,016 |
|
|
2,322 |
|
4.11 |
% |
Total interest-earning assets |
|
|
3,425,692 |
|
|
45,041 |
|
5.33 |
% |
|
2,926,417 |
|
|
35,697 |
|
4.95 |
% |
Noninterest-earning assets |
|
|
272,972 |
|
|
|
|
|
|
|
222,904 |
|
|
|
|
|
|
Total assets |
|
$ |
3,698,663 |
|
|
|
|
|
|
$ |
3,149,321 |
|
|
|
|
|
|
Liabilities and stockholders’ equity |
|
|
|
|
|
|
|
|
|
|
|
|
|
|
|
|
|
Interest-bearing liabilities: |
|
|
|
|
|
|
|
|
|
|
|
|
|
|
|
|
|
Interest-bearing demand and savings |
|
$ |
1,725,632 |
|
$ |
5,951 |
|
1.40 |
% |
$ |
1,549,509 |
|
$ |
6,468 |
|
1.69 |
% |
Other time |
|
|
812,531 |
|
|
6,863 |
|
3.43 |
% |
|
601,920 |
|
|
5,305 |
|
3.57 |
% |
Total interest-bearing deposits |
|
|
2,538,163 |
|
|
12,814 |
|
2.05 |
% |
|
2,151,429 |
|
|
11,773 |
|
2.22 |
% |
Federal funds purchased |
|
|
0 |
|
|
— |
|
— |
% |
|
— |
|
|
— |
|
— |
% |
Federal Home Loan Bank advances |
|
|
195,000 |
|
|
1,985 |
|
4.13 |
% |
|
185,000 |
|
|
1,873 |
|
4.10 |
% |
Other borrowings |
|
|
63,141 |
|
|
888 |
|
5.71 |
% |
|
63,048 |
|
|
927 |
|
5.97 |
% |
Total other interest-bearing liabilities |
|
|
258,141 |
|
|
2,873 |
|
4.51 |
% |
|
248,048 |
|
|
2,800 |
|
4.58 |
% |
Total interest-bearing liabilities |
|
|
2,796,304 |
|
|
15,687 |
|
2.28 |
% |
|
2,399,477 |
|
|
14,573 |
|
2.46 |
% |
Noninterest-bearing liabilities: |
|
|
|
|
|
|
|
|
|
|
|
|
|
|
|
|
|
Demand deposits |
|
|
487,299 |
|
|
|
|
|
|
$ |
455,277 |
|
|
|
|
|
|
Other liabilities |
|
|
35,479 |
|
|
|
|
|
|
|
16,016 |
|
|
|
|
|
|
Stockholders’ equity |
|
|
379,582 |
|
|
|
|
|
|
|
278,551 |
|
|
|
|
|
|
Total noninterest-bearing liabilities and stockholders’ equity |
|
|
902,360 |
|
|
|
|
|
|
|
749,844 |
|
|
|
|
|
|
Total liabilities and stockholders’ equity |
|
$ |
3,698,663 |
|
|
|
|
|
|
$ |
3,149,321 |
|
|
|
|
|
|
Interest rate spread |
|
|
|
|
|
|
|
3.05 |
% |
|
|
|
|
|
|
2.49 |
% |
Net interest income |
|
|
|
|
$ |
29,354 |
|
|
|
|
|
|
$ |
21,124 |
|
|
|
Net interest margin |
|
|
|
|
|
|
|
3.48 |
% |
|
|
|
|
|
|
2.93 |
% |
1 The average balance of loans includes the average balance of nonaccrual loans. Income on such loans is recognized and recorded on the cash basis. Taxable-equivalent adjustments totaling $48,000 and $68,000 for the quarters ended March 31, 2026 and 2025, respectively, are calculated using the statutory federal tax rate and are included in income and fees on loans. Accretion income of $1.3 million and $20,000 for the quarters ended March 31, 2026 and 2025, respectively, are also included in income and fees on loans.
2 Taxable-equivalent adjustments totaling $103,000 and $104,000 for the quarters ended March 31, 2026 and 2025, respectively, are calculated using the statutory federal tax rate and are included in tax-exempt interest on investment securities.
10
Colony Bankcorp, Inc.
Segment Reporting
|
|
2026 |
|
2025 |
|||||||||||
|
|
First |
|
Fourth |
|
Third |
|
Second |
|
First |
|||||
(dollars in thousands) |
|
Quarter |
|
Quarter |
|
Quarter |
|
Quarter |
|
Quarter |
|||||
Banking Division |
|
|
|
|
|
|
|
|
|
|
|
|
|
|
|
Net interest income |
|
$ |
28,223 |
|
$ |
24,781 |
|
$ |
21,629 |
|
$ |
21,319 |
|
$ |
19,989 |
Provision for credit losses |
|
|
780 |
|
|
776 |
|
|
(371) |
|
|
(330) |
|
|
1,221 |
Noninterest income |
|
|
7,131 |
|
|
6,996 |
|
|
6,144 |
|
|
5,969 |
|
|
5,774 |
Noninterest expenses |
|
|
24,420 |
|
|
22,502 |
|
|
21,075 |
|
|
18,269 |
|
|
16,790 |
Income taxes |
|
|
2,194 |
|
|
1,493 |
|
|
1,413 |
|
|
1,908 |
|
|
1,551 |
Segment income |
|
$ |
7,960 |
|
$ |
7,006 |
|
$ |
5,656 |
|
$ |
7,441 |
|
$ |
6,201 |
|
|
|
|
|
|
|
|
|
|
|
|
|
|
|
|
Total segment assets |
|
$ |
3,619,249 |
|
$ |
3,625,785 |
|
$ |
3,046,699 |
|
$ |
3,010,416 |
|
$ |
3,065,385 |
|
|
|
|
|
|
|
|
|
|
|
|
|
|
|
|
Full time employees |
|
|
426 |
|
|
447 |
|
|
383 |
|
|
390 |
|
|
366 |
|
|
|
|
|
|
|
|
|
|
|
|
|
|
|
|
Mortgage Banking Division |
|
|
|
|
|
|
|
|
|
|
|
|
|
|
|
Net interest income |
|
$ |
38 |
|
$ |
65 |
|
$ |
62 |
|
$ |
44 |
|
$ |
53 |
Provision for credit losses |
|
|
— |
|
|
— |
|
|
— |
|
|
— |
|
|
— |
Noninterest income |
|
|
1,886 |
|
|
2,012 |
|
|
1,851 |
|
|
1,984 |
|
|
1,579 |
Noninterest expenses |
|
|
1,702 |
|
|
1,695 |
|
|
2,066 |
|
|
1,710 |
|
|
1,601 |
Income taxes |
|
|
52 |
|
|
81 |
|
|
(27) |
|
|
69 |
|
|
10 |
Segment income |
|
$ |
170 |
|
$ |
301 |
|
$ |
(126) |
|
$ |
249 |
|
$ |
21 |
|
|
|
|
|
|
|
|
|
|
|
|
|
|
|
|
Total segment assets |
|
$ |
12,036 |
|
$ |
13,648 |
|
$ |
12,959 |
|
$ |
14,296 |
|
$ |
16,041 |
|
|
|
|
|
|
|
|
|
|
|
|
|
|
|
|
Variable noninterest expense(1) |
|
$ |
597 |
|
$ |
984 |
|
$ |
1,229 |
|
$ |
1,157 |
|
$ |
880 |
Fixed noninterest expense |
|
|
1,105 |
|
|
711 |
|
|
837 |
|
|
553 |
|
|
721 |
|
|
|
|
|
|
|
|
|
|
|
|
|
|
|
|
Full time employees |
|
|
48 |
|
|
48 |
|
|
46 |
|
|
43 |
|
|
42 |
|
|
|
|
|
|
|
|
|
|
|
|
|
|
|
|
Small Business Specialty Lending Division |
|
|
|
|
|
|
|
|
|
|
|
|
|
|
|
Net interest income |
|
$ |
942 |
|
$ |
1,019 |
|
$ |
1,008 |
|
$ |
1,022 |
|
$ |
910 |
Provision for credit losses |
|
|
970 |
|
|
874 |
|
|
1,271 |
|
|
780 |
|
|
279 |
Noninterest income |
|
|
1,675 |
|
|
2,039 |
|
|
2,096 |
|
|
2,145 |
|
|
1,691 |
Noninterest expenses |
|
|
1,552 |
|
|
1,512 |
|
|
1,471 |
|
|
2,025 |
|
|
1,830 |
Income taxes |
|
|
21 |
|
|
136 |
|
|
73 |
|
|
74 |
|
|
101 |
Segment income |
|
$ |
74 |
|
$ |
536 |
|
$ |
289 |
|
$ |
288 |
|
$ |
391 |
|
|
|
|
|
|
|
|
|
|
|
|
|
|
|
|
Total segment assets |
|
$ |
89,328 |
|
$ |
95,968 |
|
$ |
93,088 |
|
$ |
90,905 |
|
$ |
90,399 |
|
|
|
|
|
|
|
|
|
|
|
|
|
|
|
|
Full time employees |
|
|
32 |
|
|
31 |
|
|
31 |
|
|
34 |
|
|
35 |
|
|
|
|
|
|
|
|
|
|
|
|
|
|
|
|
Total Consolidated |
|
|
|
|
|
|
|
|
|
|
|
|
|
|
|
Net interest income |
|
$ |
29,203 |
|
$ |
25,865 |
|
$ |
22,699 |
|
$ |
22,385 |
|
$ |
20,952 |
Provision for credit losses |
|
|
1,750 |
|
|
1,650 |
|
|
900 |
|
|
450 |
|
|
1,500 |
Noninterest income |
|
|
10,692 |
|
|
11,047 |
|
|
10,091 |
|
|
10,098 |
|
|
9,044 |
Noninterest expenses |
|
|
27,674 |
|
|
25,709 |
|
|
24,612 |
|
|
22,004 |
|
|
20,221 |
Income taxes |
|
|
2,267 |
|
|
1,710 |
|
|
1,459 |
|
|
2,051 |
|
|
1,662 |
Segment income |
|
$ |
8,204 |
|
$ |
7,843 |
|
$ |
5,819 |
|
$ |
7,978 |
|
$ |
6,613 |
|
|
|
|
|
|
|
|
|
|
|
|
|
|
|
|
Total segment assets |
|
$ |
3,720,613 |
|
$ |
3,735,401 |
|
$ |
3,152,746 |
|
$ |
3,115,617 |
|
$ |
3,171,825 |
|
|
|
|
|
|
|
|
|
|
|
|
|
|
|
|
Full time employees |
|
|
506 |
|
|
526 |
|
|
460 |
|
|
467 |
|
|
443 |
| (1) | Variable noninterest expense includes commission based salary expenses and volume based loan related fees. |
11
Colony Bankcorp, Inc.
Consolidated Balance Sheets
|
|
March 31, 2026 |
|
December 31, 2025 |
||
(dollars in thousands) |
|
(unaudited) |
|
(audited) |
||
ASSETS |
|
|
|
|
|
|
Cash and due from banks |
|
$ |
24,349 |
|
$ |
27,307 |
Interest-bearing deposits in banks and federal funds sold |
|
|
271,457 |
|
|
230,333 |
Cash and cash equivalents |
|
|
295,806 |
|
|
257,640 |
Investment securities available for sale, at fair value |
|
|
375,340 |
|
|
383,817 |
Investment securities held to maturity, at amortized cost |
|
|
371,918 |
|
|
386,618 |
Other investments |
|
|
19,286 |
|
|
19,176 |
Loans held for sale |
|
|
16,536 |
|
|
78,990 |
Loans, net of unearned income |
|
|
2,413,465 |
|
|
2,381,224 |
Allowance for credit losses |
|
|
(21,705) |
|
|
(23,014) |
Loans, net |
|
|
2,391,760 |
|
|
2,358,210 |
Premises and equipment |
|
|
36,842 |
|
|
37,045 |
Other real estate owned |
|
|
1,873 |
|
|
1,048 |
Goodwill |
|
|
63,047 |
|
|
63,873 |
Other intangible assets |
|
|
7,396 |
|
|
7,851 |
Bank owned life insurance |
|
|
68,936 |
|
|
68,457 |
Deferred income taxes, net |
|
|
18,804 |
|
|
19,582 |
Other assets |
|
|
53,069 |
|
|
53,094 |
Total assets |
|
$ |
3,720,613 |
|
$ |
3,735,401 |
|
|
|
|
|
|
|
LIABILITIES AND STOCKHOLDERS’ EQUITY |
|
|
|
|
|
|
Liabilities: |
|
|
|
|
|
|
Deposits: |
|
|
|
|
|
|
Noninterest-bearing |
|
$ |
495,234 |
|
$ |
526,803 |
Interest-bearing |
|
|
2,553,185 |
|
|
2,540,718 |
Total deposits |
|
|
3,048,419 |
|
|
3,067,521 |
Federal Home Loan Bank advances |
|
|
194,981 |
|
|
194,972 |
Other borrowed money |
|
|
63,156 |
|
|
63,132 |
Accrued expenses and other liabilities |
|
|
33,654 |
|
|
33,856 |
Total liabilities |
|
|
3,340,210 |
|
|
3,359,481 |
|
|
|
|
|
|
|
Stockholders’ equity |
|
|
|
|
|
|
Common stock, $1 par value; 50,000,000 shares authorized, 21,162,104 and 21,251,695 issued and outstanding, respectively |
|
|
21,162 |
|
|
21,252 |
Paid in capital |
|
|
227,071 |
|
|
228,577 |
Retained earnings |
|
|
166,237 |
|
|
160,584 |
Accumulated other comprehensive loss, net of tax |
|
|
(34,067) |
|
|
(34,493) |
Total stockholders’ equity |
|
|
380,403 |
|
|
375,920 |
Total liabilities and stockholders’ equity |
|
$ |
3,720,613 |
|
$ |
3,735,401 |
12
Colony Bankcorp, Inc.
Consolidated Statements of Income (unaudited)
|
|
Three months ended March 31, |
||||
|
|
2026 |
|
2025 |
||
(dollars in thousands, except per share data) |
|
|
|
|
|
|
Interest income: |
|
|
|
|
|
|
Loans, including fees |
|
$ |
37,974 |
|
$ |
27,976 |
Investment securities |
|
|
4,923 |
|
|
5,227 |
Deposits in banks and short term investments |
|
|
1,993 |
|
|
2,322 |
Total interest income |
|
|
44,890 |
|
|
35,525 |
|
|
|
|
|
|
|
Interest expense: |
|
|
|
|
|
|
Deposits |
|
|
12,814 |
|
|
11,773 |
Federal Home Loan Bank advances |
|
|
1,985 |
|
|
1,873 |
Other borrowings |
|
|
888 |
|
|
927 |
Total interest expense |
|
|
15,687 |
|
|
14,573 |
Net interest income |
|
|
29,203 |
|
|
20,952 |
Provision for credit losses |
|
|
1,750 |
|
|
1,500 |
Net interest income after provision for credit losses |
|
|
27,453 |
|
|
19,452 |
|
|
|
|
|
|
|
Noninterest income: |
|
|
|
|
|
|
Service charges on deposits |
|
|
2,561 |
|
|
2,172 |
Mortgage fee income |
|
|
1,935 |
|
|
1,579 |
Gain on sales of SBA loans |
|
|
962 |
|
|
1,035 |
Interchange fees |
|
|
2,186 |
|
|
1,938 |
BOLI income |
|
|
477 |
|
|
396 |
Insurance commissions |
|
|
844 |
|
|
469 |
Other |
|
|
1,727 |
|
|
1,455 |
Total noninterest income |
|
|
10,692 |
|
|
9,044 |
|
|
|
|
|
|
|
Noninterest expense: |
|
|
|
|
|
|
Salaries and employee benefits |
|
|
15,923 |
|
|
11,905 |
Occupancy and equipment |
|
|
1,957 |
|
|
1,580 |
Acquisition related |
|
|
1,637 |
|
|
— |
Information technology expenses |
|
|
2,774 |
|
|
2,477 |
Professional fees |
|
|
1,120 |
|
|
748 |
Advertising and public relations |
|
|
1,106 |
|
|
805 |
Communications |
|
|
224 |
|
|
205 |
Other |
|
|
2,933 |
|
|
2,501 |
Total noninterest expense |
|
|
27,674 |
|
|
20,221 |
Income before income taxes |
|
|
10,471 |
|
|
8,275 |
Income taxes |
|
|
2,267 |
|
|
1,662 |
Net income |
|
$ |
8,204 |
|
$ |
6,613 |
Earnings per common share: |
|
|
|
|
|
|
Basic |
|
$ |
0.39 |
|
$ |
0.38 |
Diluted |
|
|
0.39 |
|
|
0.38 |
Dividends declared per share |
|
|
0.1200 |
|
|
0.1150 |
Weighted average common shares outstanding: |
|
|
|
|
|
|
Basic |
|
|
21,222,237 |
|
|
17,509,059 |
Diluted |
|
|
21,222,237 |
|
|
17,509,059 |
13
Colony Bankcorp, Inc.
Quarterly Consolidated Statements of Income
|
|
2026 |
|
2025 |
|||||||||||
|
|
First |
|
Fourth |
|
Third |
|
Second |
|
First |
|||||
|
|
Quarter |
|
Quarter |
|
Quarter |
|
Quarter |
|
Quarter |
|||||
(dollars in thousands, except per share data) |
|
(unaudited) |
|
(unaudited) |
|
(unaudited) |
|
(unaudited) |
|
(unaudited) |
|||||
Interest income: |
|
|
|
|
|
|
|
|
|
|
|
|
|
|
|
Loans, including fees |
|
$ |
37,974 |
|
$ |
34,461 |
|
$ |
31,535 |
|
$ |
30,361 |
|
$ |
27,976 |
Investment securities |
|
|
4,923 |
|
|
4,543 |
|
|
4,518 |
|
|
5,148 |
|
|
5,227 |
Deposits in banks and short term investments |
|
|
1,993 |
|
|
1,696 |
|
|
839 |
|
|
1,326 |
|
|
2,322 |
Total interest income |
|
|
44,890 |
|
|
40,700 |
|
|
36,892 |
|
|
36,835 |
|
|
35,525 |
|
|
|
|
|
|
|
|
|
|
|
|
|
|
|
|
Interest expense: |
|
|
|
|
|
|
|
|
|
|
|
|
|
|
|
Deposits |
|
|
12,814 |
|
|
11,973 |
|
|
11,332 |
|
|
11,632 |
|
|
11,773 |
Federal Home Loan Bank advances |
|
|
1,985 |
|
|
1,947 |
|
|
1,909 |
|
|
1,889 |
|
|
1,873 |
Other borrowings |
|
|
888 |
|
|
915 |
|
|
952 |
|
|
929 |
|
|
927 |
Total interest expense |
|
|
15,687 |
|
|
14,835 |
|
|
14,193 |
|
|
14,450 |
|
|
14,573 |
Net interest income |
|
|
29,203 |
|
|
25,865 |
|
|
22,699 |
|
|
22,385 |
|
|
20,952 |
Provision for credit losses |
|
|
1,750 |
|
|
1,650 |
|
|
900 |
|
|
450 |
|
|
1,500 |
Net interest income after provision for credit losses |
|
|
27,453 |
|
|
24,215 |
|
|
21,799 |
|
|
21,935 |
|
|
19,452 |
|
|
|
|
|
|
|
|
|
|
|
|
|
|
|
|
Noninterest income: |
|
|
|
|
|
|
|
|
|
|
|
|
|
|
|
Service charges on deposits |
|
|
2,561 |
|
|
2,664 |
|
|
2,640 |
|
|
2,219 |
|
|
2,172 |
Mortgage fee income |
|
|
1,935 |
|
|
2,121 |
|
|
1,851 |
|
|
1,984 |
|
|
1,579 |
Gain on sales of SBA loans |
|
|
962 |
|
|
1,376 |
|
|
1,411 |
|
|
1,550 |
|
|
1,035 |
Loss on sales of securities |
|
|
— |
|
|
— |
|
|
(1,039) |
|
|
— |
|
|
— |
Interchange fees |
|
|
2,186 |
|
|
2,154 |
|
|
2,273 |
|
|
2,073 |
|
|
1,938 |
BOLI income |
|
|
477 |
|
|
577 |
|
|
396 |
|
|
423 |
|
|
396 |
Insurance commissions |
|
|
844 |
|
|
755 |
|
|
874 |
|
|
766 |
|
|
469 |
Other |
|
|
1,727 |
|
|
1,400 |
|
|
1,685 |
|
|
1,083 |
|
|
1,455 |
Total noninterest income |
|
|
10,692 |
|
|
11,047 |
|
|
10,091 |
|
|
10,098 |
|
|
9,044 |
|
|
|
|
|
|
|
|
|
|
|
|
|
|
|
|
Noninterest expense: |
|
|
|
|
|
|
|
|
|
|
|
|
|
|
|
Salaries and employee benefits |
|
|
15,923 |
|
|
14,115 |
|
|
13,532 |
|
|
12,865 |
|
|
11,905 |
Occupancy and equipment |
|
|
1,957 |
|
|
1,758 |
|
|
1,732 |
|
|
1,683 |
|
|
1,580 |
Acquisition related |
|
|
1,637 |
|
|
1,331 |
|
|
732 |
|
|
— |
|
|
— |
Information technology expenses |
|
|
2,774 |
|
|
2,903 |
|
|
2,680 |
|
|
2,592 |
|
|
2,477 |
Professional fees |
|
|
1,120 |
|
|
1,019 |
|
|
998 |
|
|
742 |
|
|
748 |
Advertising and public relations |
|
|
1,106 |
|
|
1,402 |
|
|
1,130 |
|
|
942 |
|
|
805 |
Communications |
|
|
224 |
|
|
194 |
|
|
218 |
|
|
188 |
|
|
205 |
Other |
|
|
2,933 |
|
|
2,987 |
|
|
3,590 |
|
|
2,992 |
|
|
2,501 |
Total noninterest expense |
|
|
27,674 |
|
|
25,709 |
|
|
24,612 |
|
|
22,004 |
|
|
20,221 |
Income before income taxes |
|
|
10,471 |
|
|
9,553 |
|
|
7,278 |
|
|
10,029 |
|
|
8,275 |
Income taxes |
|
|
2,267 |
|
|
1,710 |
|
|
1,459 |
|
|
2,051 |
|
|
1,662 |
Net income |
|
$ |
8,204 |
|
$ |
7,843 |
|
$ |
5,819 |
|
$ |
7,978 |
|
$ |
6,613 |
Earnings per common share: |
|
|
|
|
|
|
|
|
|
|
|
|
|
|
|
Basic |
|
$ |
0.39 |
|
$ |
0.42 |
|
$ |
0.33 |
|
$ |
0.46 |
|
$ |
0.38 |
Diluted |
|
|
0.39 |
|
|
0.42 |
|
|
0.33 |
|
|
0.46 |
|
|
0.38 |
Dividends declared per share |
|
|
0.1200 |
|
|
0.1150 |
|
|
0.1150 |
|
|
0.1150 |
|
|
0.1150 |
Weighted average common shares outstanding: |
|
|
|
|
|
|
|
|
|
|
|
|
|
|
|
Basic |
|
|
21,222,237 |
|
|
18,729,511 |
|
|
17,461,434 |
|
|
17,448,945 |
|
|
17,509,059 |
Diluted |
|
|
21,222,237 |
|
|
18,729,511 |
|
|
17,461,434 |
|
|
17,448,945 |
|
|
17,509,059 |
14
Colony Bankcorp, Inc.
Quarterly Deposits Composition Comparison
|
|
2026 |
|
2025 |
|||||||||||
|
|
First |
|
Fourth |
|
Third |
|
Second |
|
First |
|||||
(dollars in thousands) |
|
Quarter |
|
Quarter |
|
Quarter |
|
Quarter |
|
Quarter |
|||||
Noninterest-bearing demand |
|
$ |
495,234 |
|
$ |
526,803 |
|
$ |
442,142 |
|
$ |
434,785 |
|
$ |
449,818 |
Interest-bearing demand |
|
|
927,768 |
|
|
932,262 |
|
|
811,031 |
|
|
838,540 |
|
|
873,156 |
Savings and money markets |
|
|
806,434 |
|
|
787,811 |
|
|
644,312 |
|
|
667,135 |
|
|
689,446 |
Time over $250,000 |
|
|
237,311 |
|
|
239,175 |
|
|
192,545 |
|
|
193,427 |
|
|
189,466 |
Other time |
|
|
581,672 |
|
|
581,470 |
|
|
494,299 |
|
|
422,343 |
|
|
420,645 |
Total |
|
$ |
3,048,419 |
|
$ |
3,067,521 |
|
$ |
2,584,329 |
|
$ |
2,556,230 |
|
$ |
2,622,531 |
Colony Bankcorp, Inc.
Quarterly Deposits by Location Comparison
|
|
2026 |
|
2025 |
|||||||||||
|
|
First |
|
Fourth |
|
Third |
|
Second |
|
First |
|||||
(dollars in thousands) |
|
Quarter |
|
Quarter |
|
Quarter |
|
Quarter |
|
Quarter |
|||||
Augusta |
|
$ |
22,496 |
|
$ |
18,387 |
|
$ |
— |
|
$ |
— |
|
$ |
— |
Florida |
|
|
167,406 |
|
|
157,056 |
|
|
— |
|
|
— |
|
|
— |
Coastal Georgia |
|
|
129,957 |
|
|
141,013 |
|
|
127,587 |
|
|
138,838 |
|
|
142,230 |
Middle Georgia |
|
|
266,574 |
|
|
262,075 |
|
|
259,934 |
|
|
277,880 |
|
|
283,149 |
Atlanta and North Georgia |
|
|
311,159 |
|
|
335,762 |
|
|
315,822 |
|
|
344,329 |
|
|
333,845 |
South Georgia |
|
|
1,421,164 |
|
|
1,431,775 |
|
|
1,205,891 |
|
|
1,203,732 |
|
|
1,249,192 |
West Georgia |
|
|
328,077 |
|
|
326,054 |
|
|
341,056 |
|
|
325,946 |
|
|
335,438 |
Brokered deposits |
|
|
136,894 |
|
|
131,906 |
|
|
130,000 |
|
|
59,494 |
|
|
59,499 |
Reciprocal deposits |
|
|
264,692 |
|
|
263,493 |
|
|
204,039 |
|
|
206,011 |
|
|
219,178 |
Total |
|
$ |
3,048,419 |
|
$ |
3,067,521 |
|
$ |
2,584,329 |
|
$ |
2,556,230 |
|
$ |
2,622,531 |
Colony Bankcorp, Inc.
Quarterly Loan Comparison
|
|
2026 |
|
2025 |
|||||||||||
|
|
First |
|
Fourth |
|
Third |
|
Second |
|
First |
|||||
(dollars in thousands) |
|
Quarter |
|
Quarter |
|
Quarter |
|
Quarter |
|
Quarter |
|||||
Core |
|
$ |
1,940,583 |
|
$ |
1,885,200 |
|
$ |
1,935,648 |
|
$ |
1,887,456 |
|
$ |
1,808,879 |
Purchased |
|
|
472,882 |
|
|
496,024 |
|
|
101,408 |
|
|
106,124 |
|
|
112,384 |
Loans, net of unearned income |
|
$ |
2,413,465 |
|
$ |
2,381,224 |
|
$ |
2,037,056 |
|
$ |
1,993,580 |
|
$ |
1,921,263 |
Colony Bankcorp, Inc.
Quarterly Loans by Composition Comparison
|
|
2026 |
|
2025 |
|||||||||||
|
|
First |
|
Fourth |
|
Third |
|
Second |
|
First |
|||||
(dollars in thousands) |
|
Quarter |
|
Quarter |
|
Quarter |
|
Quarter |
|
Quarter |
|||||
Construction, land & land development |
|
$ |
309,161 |
|
$ |
302,512 |
|
$ |
240,819 |
|
$ |
238,078 |
|
$ |
208,872 |
Other commercial real estate |
|
|
1,240,210 |
|
|
1,249,720 |
|
|
1,064,984 |
|
|
1,059,149 |
|
|
1,052,967 |
Total commercial real estate |
|
|
1,549,371 |
|
|
1,552,232 |
|
|
1,305,803 |
|
|
1,297,227 |
|
|
1,261,839 |
Residential real estate |
|
|
483,247 |
|
|
459,549 |
|
|
377,058 |
|
|
356,515 |
|
|
345,521 |
Commercial, financial & agricultural |
|
|
220,933 |
|
|
218,532 |
|
|
213,274 |
|
|
212,872 |
|
|
213,355 |
Consumer and other |
|
|
159,914 |
|
|
150,911 |
|
|
140,921 |
|
|
126,966 |
|
|
100,548 |
Loans, net of unearned income |
|
$ |
2,413,465 |
|
$ |
2,381,224 |
|
$ |
2,037,056 |
|
$ |
1,993,580 |
|
$ |
1,921,263 |
15
Colony Bankcorp, Inc.
Quarterly Loans by Location Comparison
|
|
2026 |
|
2025 |
|||||||||||
|
|
First |
|
Fourth |
|
Third |
|
Second |
|
First |
|||||
(dollars in thousands) |
|
Quarter |
|
Quarter |
|
Quarter |
|
Quarter |
|
Quarter |
|||||
Alabama |
|
$ |
49,546 |
|
$ |
47,971 |
|
$ |
48,351 |
|
$ |
50,856 |
|
$ |
52,183 |
Florida |
|
|
238,262 |
|
|
236,810 |
|
|
26,061 |
|
|
24,562 |
|
|
19,490 |
Augusta |
|
|
84,548 |
|
|
85,072 |
|
|
92,988 |
|
|
95,246 |
|
|
91,758 |
Coastal Georgia |
|
|
355,350 |
|
|
358,271 |
|
|
263,763 |
|
|
253,177 |
|
|
230,242 |
Middle Georgia |
|
|
115,385 |
|
|
121,276 |
|
|
120,601 |
|
|
125,435 |
|
|
130,302 |
Atlanta and North Georgia |
|
|
455,197 |
|
|
456,593 |
|
|
463,007 |
|
|
445,921 |
|
|
441,323 |
South Georgia |
|
|
512,651 |
|
|
462,085 |
|
|
403,192 |
|
|
408,954 |
|
|
398,295 |
West Georgia |
|
|
186,661 |
|
|
174,626 |
|
|
172,688 |
|
|
168,968 |
|
|
168,851 |
Small Business Specialty Lending |
|
|
83,288 |
|
|
84,928 |
|
|
84,999 |
|
|
81,242 |
|
|
79,517 |
Consumer Portfolio Mortgages |
|
|
236,984 |
|
|
263,385 |
|
|
270,941 |
|
|
262,846 |
|
|
251,816 |
Marine/RV Lending |
|
|
94,775 |
|
|
88,852 |
|
|
88,968 |
|
|
75,649 |
|
|
55,033 |
Other |
|
|
818 |
|
|
1,355 |
|
|
1,497 |
|
|
724 |
|
|
2,453 |
Loans, net of unearned income |
|
$ |
2,413,465 |
|
$ |
2,381,224 |
|
$ |
2,037,056 |
|
$ |
1,993,580 |
|
$ |
1,921,263 |
Colony Bankcorp, Inc.
Classified Loans
|
|
2026 |
|
2025 |
|||||||||||||||||||||
|
|
First |
|
Fourth |
|
Third |
|
Second |
|
First |
|||||||||||||||
(dollars in thousands) |
|
Quarter |
|
Quarter |
|
Quarter |
|
Quarter |
|
Quarter |
|||||||||||||||
|
|
$ |
|
# |
|
$ |
|
# |
|
|
$ |
|
# |
|
$ |
|
# |
|
$ |
|
# |
||||
Construction, land & land development |
|
$ |
214 |
|
8 |
|
$ |
1,438 |
|
10 |
|
$ |
1,644 |
|
8 |
|
$ |
126 |
|
4 |
|
$ |
126 |
|
4 |
Other commercial real estate |
|
|
23,966 |
|
52 |
|
|
22,871 |
|
52 |
|
|
12,973 |
|
45 |
|
|
16,687 |
|
48 |
|
|
18,578 |
|
51 |
Residential real estate |
|
|
6,160 |
|
95 |
|
|
6,115 |
|
92 |
|
|
1,503 |
|
75 |
|
|
1,222 |
|
73 |
|
|
1,670 |
|
76 |
Commercial, financial & agricultural |
|
|
8,655 |
|
107 |
|
|
9,857 |
|
109 |
|
|
7,947 |
|
90 |
|
|
7,071 |
|
64 |
|
|
6,077 |
|
58 |
Consumer and other |
|
|
230 |
|
32 |
|
|
200 |
|
34 |
|
|
116 |
|
27 |
|
|
6 |
|
25 |
|
|
2 |
|
25 |
TOTAL |
|
$ |
39,225 |
|
294 |
|
$ |
40,481 |
|
297 |
|
$ |
24,183 |
|
245 |
|
$ |
25,112 |
|
214 |
|
$ |
26,453 |
|
214 |
Classified loans to total loans |
|
|
1.63 |
% |
|
|
|
1.70 |
% |
|
|
|
1.19 |
% |
|
|
|
1.26 |
% |
|
|
|
1.38 |
% |
|
Colony Bankcorp, Inc.
Criticized Loans
|
|
2026 |
|
2025 |
|||||||||||||||||||||
|
|
First |
|
Fourth |
|
Third |
|
Second |
|
First |
|||||||||||||||
(dollars in thousands) |
|
Quarter |
|
Quarter |
|
Quarter |
|
Quarter |
|
Quarter |
|||||||||||||||
|
|
$ |
|
# |
|
$ |
|
# |
|
$ |
|
# |
|
$ |
|
# |
|
$ |
|
# |
|||||
Construction, land & land development |
|
$ |
6,574 |
|
34 |
|
$ |
17,605 |
|
13 |
|
$ |
14,393 |
|
12 |
|
$ |
2,207 |
|
10 |
|
$ |
4,028 |
|
11 |
Other commercial real estate |
|
|
54,522 |
|
69 |
|
|
40,073 |
|
71 |
|
|
24,934 |
|
60 |
|
|
30,034 |
|
69 |
|
|
28,869 |
|
70 |
Residential real estate |
|
|
12,522 |
|
103 |
|
|
11,515 |
|
99 |
|
|
6,528 |
|
81 |
|
|
7,224 |
|
79 |
|
|
8,289 |
|
83 |
Commercial, financial & agricultural |
|
|
12,892 |
|
114 |
|
|
15,197 |
|
120 |
|
|
14,403 |
|
99 |
|
|
15,212 |
|
85 |
|
|
14,501 |
|
82 |
Consumer and other |
|
|
230 |
|
32 |
|
|
331 |
|
35 |
|
|
247 |
|
28 |
|
|
137 |
|
26 |
|
|
136 |
|
26 |
TOTAL |
|
$ |
86,740 |
|
352 |
|
$ |
84,721 |
|
338 |
|
$ |
60,505 |
|
280 |
|
$ |
54,814 |
|
269 |
|
$ |
55,823 |
|
272 |
Criticized loans to total loans |
|
|
3.59 |
% |
|
|
|
3.56 |
% |
|
|
|
2.97 |
% |
|
|
|
2.75 |
% |
|
|
|
2.91 |
% |
|
16
Exhibit 99.2
|
INVESTOR PRESENTATION First Quarter 2026 |
|
2 CAUTIONARY STATEMENTS This presentation contains “forward-looking statements” within the meaning of, and subject to the protections of, Section 27A of the Securities Act of 1933, as amended, and Section 21E of the Securities Exchange Act of 1934, as amended. In addition, certain statements may be contained in Colony Bankcorp, Inc.’s (the “Company” or “Colony”) future filings with the Securities and Exchange Commission (the “SEC”), in press releases, and in oral and written statements made by or with the approval of the Company that are not statements of historical fact and constitute “forward-looking statements” within the meaning of, and subject to the protections of, Section 27A of the Securities Act of 1933, as amended, and Section 21E of the Securities Exchange Act of 1934, as amended. Examples of forward-looking statements include, but are not limited to: (i) projections and/or expectations of revenues, income or loss, earnings or loss per share, the payment or nonpayment of dividends, capital structure and other financial items; (ii) statement of plans and objectives of Colony Bankcorp, Inc. or its management or Board of Directors, including those relating to products or services; (iii) statements of future economic performance; (iv) statements regarding growth strategy, capital management, liquidity and funding, and future profitability; (v) statements relating to the timing, benefits, costs, and synergies of the recently completed acquisition of TC Bancshares, Inc. (“TC Bancshares”) (the “Merger”), and (vi) statements of assumptions underlying such statements. Words such as “may”, “will”, “anticipate”, “assume”, “should”, “support”, “indicate”, “would”, “believe”, “contemplate”, “expect”, “estimate”, “continue”, “further”, “plan”, “point to”, “project”, “could”, “intend”, “target” and similar expressions are intended to identify forward-looking statements but are not the exclusive means of identifying such statements. Prospective investors are cautioned that any such forward-looking statements are not guarantees of future performance and involve known and unknown risks and uncertainties. Factors that might cause such differences include, but are not limited to: the impact of current and future economic conditions, particularly those affecting the financial services industry, including the effects of declines in the real estate market, tariffs or trade wars (including the resulting reduced consumer spending, lower economic growth or recession, reduced demand for U.S. exports, disruptions to supply chains, and decreased demand for other banking products and services), high unemployment rates, inflationary pressures, changes in interest rates (including the impact of volatile interest rates on our financial projections and models) and slowdowns in economic growth, as well as the financial stress on borrowers as a result of the foregoing; the risk of reductions in benchmark interest rates and the resulting impacts on net interest income; potential impacts of adverse developments in the banking industry highlighted by high-profile bank failures, including impacts on customer confidence, deposit outflows, liquidity and the regulatory response thereto; risks arising from negative media coverage and perceived instability in the banking industry and the banking sector; the risks of changes in interest rates and their effects on the level, cost, and composition of, and competition for, deposits, loan demand and timing of payments, the values of loan collateral, securities, and interest sensitive assets and liabilities; the ability to attract new or retain existing deposits, to retain or grow loans or additional interest and fee income, or to control noninterest expense; the effect of pricing pressures on the Company’s net interest margin; the failure of assumptions underlying the establishment of reserves for possible credit losses, fair value for loans and other real estate owned; changes in real estate values; the Company’s ability to implement its various strategic and growth initiatives; increased competition in the financial services industry, particularly from regional and national institutions, as well as fintech companies and other non-bank financial service providers offering digital, automated or alternative financial products and services; economic conditions, either nationally or locally, in areas in which the Company conducts operations being less favorable than expected; changes in the prices, values and sales volumes of residential and commercial real estate; developments in our mortgage banking business, including loan modifications, general demand, and the effects of judicial or regulatory requirements or guidance; legislation or regulatory changes which adversely affect the ability of the consolidated Company to conduct business combinations or new operations; adverse results from current or future litigation, regulatory examinations or other legal and/or regulatory actions, including as a result of the Company’s participation in and execution of government programs, those related to credit card interest rates, and legislative, regulatory or supervisory actions related to so-called "de-banking," including any new prohibitions, requirements or enforcement priorities that could affect customer relationships, compliance obligations, or operational practices; significant turbulence or a disruption in the capital or financial markets and the effect of a fall in the stock market prices on our investment securities; significant volatility in the markets for equity, fixed income and other asset classes globally or within specific markets; the effects of |
|
3 CAUTIONARY STATEMENTS war or other conflicts, including the ongoing conflicts in the Middle East; major political shifts domestically or internationally (including the potential for retaliatory actions by governments, market participants or clients based on diverging perspectives or otherwise and, separately, the recent shutdown of the U.S. federal government); general risks related to the Company's merger and acquisition activity, Including risks associated with integrating and realizing the expected financial benefits of previous or pending acquisitions, and the Company’s pursuit of future acquisitions; risks associated with the Merger, including (a) the risk that the cost savings and any revenue synergies may not be realized or take longer than anticipated to be realized, (b) disruption with customers, suppliers, employee or other business partners relationships, (c) the risk of successful integration of TC Bancshares' business into the Company, (d) the risk of successful integration of TC Bancshares’ business into the Company, (e) the reaction of each of the Company's and TC Bancshares' customers, suppliers, employees or other business partners to the Merger, (f) the risk that the integration of TC Bancshares' operations into the operations of the Company will be materially delayed or will be more costly or difficult that expected, (g) the timing and achievement of expected cost reductions following the Merger, and (h) the timing and achievement of the recovery of the reduction of tangible book value resulting from the Merger; general competitive, economic, political, and market conditions; the impact of emerging technologies, such as generative artificial intelligence; fraud or misconduct by internal or external actors, and system failures, cybersecurity threats or security breaches and the cost of defending against them; a deterioration of the credit rating for U.S. long-term sovereign debt, actions that the U.S. government may take to avoid exceeding the debt ceiling, and uncertainties surrounding debt ceiling and the federal budget; and general competitive, economic, political and market conditions or other unexpected factors or events. These and other factors, risks and uncertainties could cause the actual results, performance or achievements of the Company to be materially different from the future results, performance or achievements expressed or implied by such forward-looking statements. Many of these factors are beyond the Company’s ability to control or predict. Forward-looking statements speak only as of the date on which such statements are made. These forward-looking statements are based upon information presently known to the Company’s management and are inherently subjective, uncertain and subject to change due to any number of risks and uncertainties, including, without limitation, the risks and other factors set forth in the Company’s filings with the Securities and Exchange Commission, the Company’s Annual Report on Form 10-K for the year ended December 31, 2024, under the captions “Cautionary Note Regarding Forward-Looking Statements” and “Risk Factors,” and in the Company’s quarterly reports on Form 10-Q and current reports on Form 8-K. The Company undertakes no obligation to update any forward-looking statement to reflect events or circumstances after the date on which such statement is made, or to reflect the occurrence of unanticipated events, except as required by applicable law. Readers are cautioned not to place undue reliance on these forward-looking statements. |
|
4 NON-GAAP FINANCIAL MEASURES Statements included in this presentation include non-GAAP financial measures and should be read along with the accompanying tables, which provide a reconciliation of non-GAAP financial measures to GAAP financial measures. The non-GAAP financial measures used in this presentation include the following: operating noninterest income, operating noninterest expense, operating net income, operating earnings per diluted share, operating return on average assets, operating return on average equity, operating return on average tangible equity, tangible book value per common share, tangible equity to tangible assets, operating efficiency ratio, operating net noninterest expense to average assets and pre-provision net revenue. The most comparable GAAP measures are noninterest income, noninterest expense, net income, diluted earnings per share, return on average assets, return on average equity, book value per common share, total equity to total assets, efficiency ratio, net noninterest expense to average assets and net interest income before provision for credit losses, respectively. Operating noninterest income excludes loss on sales of securities. Operating noninterest expense excludes severance costs, acquisition-related expenses and loss related to wire fraud incident. Operating net income, operating return on average assets, operating return on average equity, operating return on average tangible equity and operating efficiency ratio all exclude severance costs, acquisition-related expenses, loss on sales of securities, and loss related to wire fraud incident from net income, return on average assets, return on average equity and efficiency ratio, respectively. Operating net noninterest expense to average assets ratio excludes from net noninterest expense, severance costs, acquisition-related expenses, loss on sales of securities, and loss related to wire fraud incident. Acquisition-related expenses includes fees associated with acquisitions and vendor contract buyouts. Severance costs includes costs associated with termination and retirement of employees. Operating earnings per diluted share includes the adjustments to operating net income. Tangible book value per common share, tangible equity to tangible assets and operating return on average tangible equity exclude goodwill and other intangibles from book value per common share, total equity to total assets and return on average equity, respectively. Pre-provision net revenue is calculated by adding noninterest income to net interest income before provision for credit losses, and subtracting noninterest expense. Management uses these non-GAAP financial measures in its analysis of the Company's performance and believes these presentations provide useful supplemental information, and a clearer understanding of the Company’s performance, and if not provided would be requested by the investor community. The Company believes the non-GAAP measures enhance investors' understanding of the Company's business and performance. These measures are also useful in understanding performance trends and facilitate comparisons with the performance of other financial institutions. The limitations associated with operating measures are the risk that persons might disagree as to the appropriateness of items comprising these measures and that different companies might calculate these measures differently. Non-GAAP financial measures should not be considered as an alternative to any measure of performance or financial condition as promulgated under GAAP, and investors should consider Colony Bankcorp, Inc. performance and financial condition as reported under GAAP and all other relevant information when assessing the performance or financial condition of Colony Bankcorp, Inc. Non-GAAP financial measures have limitations as analytical tools, and investors should not consider them in isolation or as a substitute for analysis of the results or financial condition as reported under GAAP. |
|
5 • $3.7 billion in assets as of March 31, 2026 • 37 locations in Georgia, 1 in Alabama and 5 in Florida • Diversified and scalable revenue streams • Proven history of consistent organic growth • Strong core deposit funding COMPANY PROFILE |
|
6 |
|
7 |
|
8 Name Position Years In Banking Years With Colony T. Heath Fountain Chief Executive Officer 26 7 R. Dallis "D" Copeland, Jr. President 34 4 Derek Shelnutt EVP, Chief Financial Officer 12 5 Edward "Lee" Bagwell EVP, Chief Risk Officer and General Counsel 22 22 Leonard H. "Lenny" Bateman EVP, Chief Credit Officer 29 18* Ed Canup EVP, Chief Banking Officer 43 3 Kimberly Dockery EVP, Chief of Staff 19 7 Daniel Rentz EVP, Chief Information Officer 19 19 Laurie Senn EVP, Chief Administrative Officer 23 5 Greg Eiford EVP, Chief Community Banking Officer 17 17* *Executives joining Colony through mergers include prior organization service EXECUTIVE LEADERSHIP TEAM |
|
9 FIRST QUARTER FINANCIAL HIGHLIGHTS • Operating net income(1) of $9.5 million • Sixth consecutive quarter of net interest margin expansion to 3.48% • Operating return on average assets(1) of 1.04% • Operating earnings per share(1) of $0.45 • Operating return on average equity(1) of 10.13% and operating return on average tangible equity(1) of 12.49% • Loans increased $32.2 million • Decrease in total deposits of $19.1 million • 1.73% cost of deposits • Operating net noninterest expenses to average assets(1) of 1.68% • Tangible book value per common share(1) of $14.65 Reported Operating(1) Net Income ($mm) $8.20 $9.49 Earnings Per Share $0.39 $0.45 Return on Average Assets 0.90% 1.04% Return on Average Total Equity 8.77% 10.13% Return on Average Tangible Equity 10.80% 12.49% Net Interest Margin 3.48% 3.48% (1) Non-GAAP financial measure. See non-GAAP reconciliations within this presentation. |
|
10 QUARTERLY FINANCIAL HIGHLIGHTS (1) Non-GAAP financial measure. See non-GAAP reconciliations within this presentation. $ in thousands, except per share data 1Q26 4Q25 1Q25 Net Income $8,204 $7,843 $6,613 Operating net income(1) $9,485 $8,905 $6,613 Earnings per share $0.39 $0.42 $0.38 Operating earnings per share(1) $0.45 $0.48 $0.38 Pre-Provision Net Revenue(1) $12,221 $11,203 $9,775 Operating Pre-Provision Net Revenue(1) $13,858 $12,534 $9,775 Return on average assets 0.90% 0.93% 0.85% Operating return on average assets(1) 1.04% 1.05% 0.85% Net interest margin 3.48% 3.32% 2.93% Operating net noninterest expense to average assets(1) 1.68% 1.58% 1.44% Book value per common share $17.98 $17.69 $16.41 Tangible book value per common share(1) $14.65 $14.31 $13.46 • Increase in earnings led by another consecutive quarter of net interest margin expansion • Continued increase in Operating Pre-Provision Net Revenue(1) • Consistent growth in tangible book value per common share(1) • Sustained operating efficiency by maintaining net noninterest expense to average assets below peer median |
|
11 DELIVERING SHAREHOLDER VALUE (1) Non-GAAP financial measure. See non-GAAP reconciliations within this presentation. $0.38 $0.46 $0.47 $0.48 $0.45 1Q25 2Q25 3Q25 4Q25 1Q26 Operating Earnings Per Share(1) $6.6 $8.0 $8.2 $8.9 $9.5 1Q25 2Q25 3Q25 4Q25 1Q26 Operating Net Income in million(1) 0.85% 1.02% 1.06% 1.05% 1.04% 1Q25 2Q25 3Q25 4Q25 1Q26 Operating Return on Average Assets(1) 2.93% 3.12% 3.17% 3.32% 3.48% 1Q25 2Q25 3Q25 4Q25 1Q26 Net Interest Margin 7.54% 7.81% 8.00% 8.30% 8.49% 1Q25 2Q25 3Q25 4Q25 1Q26 Tangible Equity to Tangible Assets(1) |
|
12 OBJECTIVES AND FOCUS • Achieve performance objectives in complementary lines of business • Maintain noninterest expense discipline to align with growth expectations • Achieve return on assets target of 1.20% • Focus on growing core deposits and customer relationships • Growing wallet share and revenue per customer using data advancements Short-Term Objectives Long-Term Objectives • 5 complementary lines of business > $1 million in net income • Improve efficiency through economies of scale • Return on assets in top quartile of peers • Continue to benefit from industry consolidation • Grow our customer base by 8 - 12% per year |
|
13 ORGANIC GROWTH • Presence in dynamic growth markets of Atlanta, Augusta, Birmingham, Jacksonville, Tallahassee, the Florida Panhandle, and Savannah provides opportunity for above average growth • Second-tier MSA markets of Albany, Columbus, Macon, Valdosta, and Tifton have significant market share held by large regional and national banks, creating the opportunity for growth in market share • Smaller markets where Colony has stable deposits and significant market shares creates the opportunity to grow insurance, wealth management and other complementary lines of business • Industry consolidation is creating favorable opportunities for us to leverage our scale, strengthen market position, and drive disciplined growth. • Utilization of data improves the effectiveness of marketing and business development activity • Proactive calling effort by bankers, including executive and senior management, to develop new business and deepen relationships • Long term organic growth target of 8 - 12% |
|
14 M&A STRATEGY • Colony seeks to benefit from industry consolidation and become the acquirer of choice in Georgia and contiguous states • 358 banks under $1 billion • 76 banks between $1 billion and $2.5 billion • Proactive outreach effort to generate opportunities • Management team with deep M&A experience |
|
15 EFFICIENCY AND SCALING • Focused on process improvement and ensuring it is easy to do business with Colony Bank • Hired a Director of Optimization with experience from a large regional bank to oversee process improvement and customer experience • Utilization of Robotic Process Automation ("RPA") and other innovative technology to improve the customer experience • Leveraging AI to streamline workflows, reduce manual processes, and scale operations efficiently • Implementation of cross functional teams to reduce friction and improve the customer experience • Building operational capacity in order to maintain efficiency through organic growth and M&A |
|
16 INNOVATION AND DATA STRATEGY • Investing in Innovation: Participating in fintech funds that connect us with leading technology partners and emerging solutions shaping the future of banking • Expanding Through Fintech Partnerships: Partnering with innovative fintechs to deliver modern products and services that allow us to compete with regional and national banks • Building a Data-Driven Foundation: Implementing a data warehouse to unify information across the organization and deliver smarter, faster decisions • Turning Insights into Growth: Leveraging data and advanced analytics to deepen relationships and drive targeted market disruption campaigns • Enhancing the Customer Experience: Using technology to deliver greater convenience while maintaining the personal touch that defines us |
|
17 COMPLEMENTARY LINES OF BUSINESS 1Q 2025 2Q 2025 3Q 2025 4Q 2025 1Q 2026 (Dollars in thousands) Pre-tax Profit/Loss Pre-tax Profit/Loss Pre-tax Profit/Loss Pre-tax Profit/Loss Pre-tax Profit/Loss Mortgage $ 31 $ 317 $ (153) $ 382 $ 222 SBSL 492 362 362 672 95 Marine/RV Lending 236 349 448 538 459 Merchant Services (14) 25 99 116 120 Colony Financial Advisors 35 35 80 66 103 Colony Insurance 66 67 94 (31) 104 TOTAL $ 846 $ 1,155 $ 930 $ 1,743 $ 1,103 |
|
18 SMALL BUSINESS SPECIALTY LENDING GROUP (Dollars in millions) Production and Sales Volume Loan Portfolio Breakdown - $83.3 million $15.4 $15.8 $28.4 $29.1 $13.1 $12.1 $17.9 $18.2 $16.8 $10.4 1Q 2025 2Q 2025 3Q 2025 4Q 2025 1Q 2026 Production Sales |
|
19 MORTGAGE DIVISION (Dollars in millions) • Stable production and sales volumes relative to changing market rates • Remain focused on secondary market products and gain on sale of mortgage loans • Continue to adjust staffing levels, delivery models and product set to maintain profitability Production and Sales Volume $72.0 $94.9 $87.3 $89.5 $88.5 $55.9 $65.3 $65.1 $68.1 $61.4 1Q 2025 2Q 2025 3Q 2025 4Q 2025 1Q 2026 Production Sales |
|
20 COLONY FINANCIAL ADVISORS (Dollars in millions) Experienced and knowledgeable team Our financial advisor team is well established and experienced, further strengthened by the recent addition of two seasoned advisors who bring deep client relationships and proven advisory expertise. Attractive opportunities for growth in key markets of Atlanta, Jacksonville, Savannah, and Tallahassee Investing in talent to drive long-term growth and performance Focused on attracting and recruiting top financial advisors to continue building a strong, experienced team that drives client growth, deepens relationships, and supports long-term business line performance. $198 $219 $206 $462 $555 1Q 2025 2Q 2025 3Q 2025 4Q 2025 1Q 2026 Assets Under Management |
|
21 COLONY INSURANCE • Premium rate increases have presented some retention challenges, though moderation in rate adjustments is expected during 2026 • Investment in both internal and external lead generation to support consistent growth • Bank referrals increased 20% in 2025, reflective of improved team coordination and a sales-focused culture (1) The Company acquired the Ellerbee Insurance Agency on April 1, 2025. 11,756 21,102 20,596 20,309 20,072 1Q 2025 2Q 2025(1) 3Q 2025 4Q 2025 1Q 2026 Items In Force $18.9 $34.2 $34.6 $34.4 $34.2 1Q 2025 2Q 2025(1) 3Q 2025 4Q 2025 1Q 2026 Premiums In Force (Dollars in millions) |
|
22 The current indicated annual rate is $0.48 per share, equating to a yield of 2.3%.(2) SHAREHOLDER FOCUSED DIVIDEND POLICY (1) The Board of Directors declared a dividend to be paid on its common stock on May 20, 2026, to shareholders of record as of the close of business on May 6, 2026. (2) Yield is based on closing stock price on April 20, 2026 of $21.23. $0.1075 $0.1100 $0.1125 $0.1150 $0.1200 2022 2023 2024 2025 2026(1) Quarterly Dividend Payment |
|
23 CAPITAL RATIOS 9.4% 9.6% 9.9% 10.8% 9.8% 13.8% 13.4% 13.4% 13.6% 13.4% 16.5% 16.1% 16.0% 16.0% 15.8% 12.6% 12.3% 12.4% 12.7% 12.5% 1Q 2025 2Q 2025 3Q 2025 4Q 2025 1Q 2026 Tier One Leverage Ratio Tier One Ratio Total Risk-based Capital Ratio Common Equity Tier One Capital Ratio |
|
24 STRENGTH IN OUR LIQUIDITY POSITION Significant liquidity sources (dollars in millions) FRB Reserves $ 242.8 Other Cash and Due from Banks 51.6 Unencumbered Securities 369.9 FHLB Borrowing Capacity 921.2 Fed Fund Lines 143.0 FRB Discount Window 121.8 Total Liquidity Sources $ 1,850.3 Debt Funding* (dollars in millions) *Reported as of last day of each period As of March 31, 2026 $24.2 $24.2 $24.2 $24.2 $24.2 $38.8 $38.9 $38.9 $38.9 $38.9 $185.0 $185.0 $185.0 $195.0 $195.0 1Q 2025 2Q 2025 3Q 2025 4Q 2025 1Q 2026 Trust Preferred Securities Subordinated Debentures FHLB Borrowings |
|
25 ANNUAL NONINTEREST INCOME MIX 35% 30% 31% 34% 30% 0% 10% 20% 30% 40% 50% 60% 70% 80% 90% 100% 2021 2022 2023 2024 2025 Service Charges & Fees Mortgage Loans & Related Fees SBA & Related Fees Insurance Division Merchant Services Wealth Management Interchange Income Other Total Non Int Inc/Total Income |
|
26 QUARTERLY NONINTEREST INCOME MIX 30% 31% 31% 30% 27% 0% 10% 20% 30% 40% 50% 60% 70% 80% 90% 100% 1Q 2025 2Q 2025 3Q 2025 4Q 2025 1Q 2026 Service Charges & Fees Mortgage Loans & Related Fees SBA & Related Fees Insurance Division Merchant Services Wealth Management Interchange Income Other Total Non Int Inc/Total Income |
|
27 ANNUAL DEPOSIT MIX AND PRICING 0.19% 0.32% 1.76% 2.42% 2.15% 2021 2022 2023 2024 2025 Noninterest-bearing Interest-bearing Savings/money market Time Cost of interest-bearing deposits |
|
28 QUARTERLY DEPOSIT MIX AND PRICING 2.22% 2.18% 2.14% 2.07% 2.05% 1Q 2025 2Q 2025 3Q 2025 4Q 2025 1Q 2026 Noninterest-bearing Interest-bearing Savings/money market Time Cost of interest-bearing deposits |
|
29 DEPOSIT BALANCE DATA • Commercial/business is 15.1% of accounts and represents 42.1% of total deposits balance • Consumer is 84.9% of accounts and represents 57.9% of total deposits balance As of March 31, 2026 (excludes brokered and reciprocal deposits) (Dollars in thousands) $13.2 $12.9 $13.2 $14.6 $14.3 $22.2 $21.5 $21.3 $22.9 $21.9 $39.1 $39.4 $38.4 $39.9 $41.7 $52.0 $52.8 $53.4 $55.8 $56.4 1Q 2025 2Q 2025 3Q 2025 4Q 2025 1Q 2026 AVERAGE DEPOSIT BALANCE PER ACCOUNT Noninterest-bearing Interest-bearing Savings/money market Time |
|
30 DIVERSITY OF BUSINESS DEPOSIT BASE As determined by customer provided NAICS Codes As of March 31, 2026 |
|
31 LOAN PORTFOLIO BREAKDOWN As of March 31, 2026 $2,413.5 million $2,032.6 million |
|
32 LOAN PORTFOLIO 5.71% 5.85% 5.89% 5.84% 5.88% 15.59% 15.43% 15.16% 14.39% 13.48% 9.84% 9.84% 9.84% 8.54% 8.67% 10.94% 10.94% 10.89% 11.09% 11.42% 1Q 2025 2Q 2025 3Q 2025 4Q 2025 1Q 2026 Loan Yields by Department/Product Bank-Internally Originated Third Party Originators-Upstart SBSL-7a SBSL-Express/Flash/Lightning $(250,000) $- $250,000 $500,000 $750,000 $1,000,000 1Q 2025 2Q 2025 3Q 2025 4Q 2025 1Q 2026 Net Credit Losses by Department/Product Bank-Internally Originated Third Party Originators-Upstart SBSL-7a SBSL-Express/Flash/Lightning |
|
33 CREDIT MIGRATION $- $5,000,000 $10,000,000 $15,000,000 $20,000,000 $25,000,000 1Q 2025 2Q 2025 3Q 2025 4Q 2025 1Q 2026 Classified Loans Newly Identified Loans Resolutions/Payoffs/Upgrades $- $10,000,000 $20,000,000 $30,000,000 $40,000,000 $50,000,000 1Q 2025 2Q 2025 3Q 2025 4Q 2025 1Q 2026 Criticized Loans Newly Identified Loans Resolutions/Payoffs/Upgrades |
|
34 LOAN PORTFOLIO (Dollars in millions) Commercial Real Estate Production 7.72% 7.78% 7.83% 7.33% 7.11% 1Q 2025 2Q 2025 3Q 2025 4Q 2025 1Q 2026 Organic Loan Growth Organic Purchased Loans Weighted average rate on new & renewed loans $56.4 $49.8 $38.1 $34.7 $43.0 $31.5 $47.1 $34.8 $14.1 $20.6 $48.0 $24.7 $24.0 $18.9 $2.9 1Q 2025 2Q 2025 3Q 2025 4Q 2025 1Q 2026 Permanent NOO CRE Commercial, Construction and Development Residential Construction $11.9 $6.0 $6.6 $14.7 $18.1 $44.4 $43.8 $31.5 $20.0 $24.9 1Q 2025 2Q 2025 3Q 2025 4Q 2025 1Q 2026 Residential Construction Loan Originations by Quarter Consumer Commercial |
|
35 COMMERCIAL REAL ESTATE BY TYPE Type Outstanding Balance Average Deal Size Retail $ 172,830 $ 1,217 Multifamily 106,660 1,159 Office 127,761 926 Industrial & Warehouse 75,396 1,216 Hotel/Motel 104,825 2,496 Convenience Store 9,732 811 Daycare 23,101 1,283 Civic/Event Center 27,844 2,320 Mini-warehouse 56,488 1,822 Government Guaranteed:SBSL 9,517 1,057 Specialty and Other 38,024 905 (Dollars in thousands) As of March 31, 2026 |
|
36 REPRICING SCHEDULE Quarterly Fiscal Year 2028 & (Dollars in millions) 2Q 2026 3Q 2026 4Q 2026 1Q 2027 2026 2027 Beyond Loan Maturity & Repricing Schedule: Fixed Rate Loans $ 75 $ 50 $ 22 $ 28 $ 147 $ 244 $ 1,020 Weighted Average Rate 6.87 % 6.34 % 4.97 % 5.72 % 6.37 % 5.29 % 5.68 % Adjustable & Variable Rate Loans $ 660 $ 10 $ 26 $ 26 $ 696 $ 54 $ 252 Weighted Average Rate 7.07 % 5.74 % 6.20 % 6.15 % 7.50 % 6.13 % 6.14 % Securities Principal Cash Flow and Rolloff Yield: Investments $ 12 $ 16 $ 9 $ 8 $ 37 $ 79 $ 631 Weighted Average Rate 3.88 % 2.79 % 2.77 % 2.93 % 3.14 % 1.91 % 2.46 % |
|
37 INVESTMENT SECURITIES As of: Average Life Effective Duration Book Yield 03/31/2025 6.46 4.76 2.53% 6/30/2025 6.20 4.50 2.48% 9/30/2025 6.00 4.60 2.32% 12/31/2025 5.60 4.30 2.52% 3/31/2026 5.90 4.40 2.53% Other Portfolio Metrics Pre-tax Unrealized Losses on Securities (in millions) Current base case assumptions and modeling suggest principal and interest cash flow from the investment portfolio estimated to be between $13 million and $22 million per quarter for the next 4 quarters 0% 25% 50% 75% 100% 1Q 2025 2Q 2025 3Q 2025 4Q 2025 1Q 2026 AFS/HTM Available for Sale Held to Maturity $38.6 $37.1 $31.5 $29.5 $29.9 $41.4 $40.5 $35.6 $32.4 $33.9 1Q 2025 2Q 2025 3Q 2025 4Q 2025 1Q 2026 AFS HTM |
|
38 INVESTMENT CONSIDERATIONS • Premier Southeast community bank located in growing markets • Core deposit funded with minimal reliance on wholesale funding • Diversified sources of revenue • Improving earnings outlook as new business lines and markets mature • Upside potential to tangible book value as unrealized losses recover • Deep leadership bench with a proven track record • Focused on scalability and efficiency • Investing in technology and leveraging data for revenue growth • Positioned to be the acquirer of choice in the Southeast |
|
39 RECONCILIATION OF NON-GAAP MEASURES (dollars in thousands, except per share data) Operating noninterest income reconciliation Noninterest income (GAAP) $ 10,692 $ 11,047 $ 10,091 $ 10,098 $ 9,044 Loss on sales of securities — — 1,039 — — Operating noninterest income $ 10,692 $ 11,047 $ 11,130 $ 10,098 $ 9,044 Operating noninterest expense reconciliation Noninterest expense (GAAP) $ 27,674 $ 25,709 $ 24,612 $ 22,004 $ 20,221 Acquisition-related expenses (1,637) (1,331) (732) — — Loss related to wire fraud incident — — (1,252) — — Operating noninterest expense $ 26,037 $ 24,378 $ 22,628 $ 22,004 $ 20,221 Operating net income reconciliation Net income (GAAP) $ 8,204 $ 7,843 $ 5,819 $ 7,978 $ 6,613 Acquisition-related expenses 1,637 1,331 732 — — Loss related to wire fraud incident — — 1,252 — — Loss on sales of securities — — 1,039 — — Income tax benefit (356) (269) (612) — — Operating net income $ 9,485 $ 8,905 $ 8,230 $ 7,978 $ 6,613 Weighted average diluted shares 21,222,237 18,729,511 17,461,434 17,448,945 17,509,059 Operating earnings per diluted share $ 0.45 $ 0.48 $ 0.47 $ 0.46 $ 0.38 Operating return on average assets reconciliation Return on average assets (GAAP) 0.90 % 0.93 % 0.75 % 1.02 % 0.85 Acquisition-related expenses 0.18 0.15 0.10 — — Loss related to wire fraud incident — — 0.16 — — Loss on sales of securities — — 0.13 — — Tax effect of adjustment items (0.04) (0.03) (0.08) — — Operating return on average assets 1.04 % 1.05 % 1.06 % 1.02 % 0.85 Operating return on average equity reconciliation Return on average equity (GAAP) 8.77 % 9.49 % 7.80 % 11.14 % 9.63 Acquisition-related expenses 1.74 1.62 0.98 — — Loss related to wire fraud incident — — 1.68 — — Loss on sales of securities — — 1.39 — — Tax effect of adjustment items (0.38) (0.33) (0.82) — — Operating return on average equity 10.13 % 10.78 % 11.03 % 11.14 % 9.63 2026 2025 First Fourth Third Second First Q uarter Q uarter Q uarter Q uarter Q uarter |
|
40 RECONCILIATION OF NON-GAAP MEASURES (dollars in thousands, except per share data) Operating return on average tangible equity reconciliation Return on average tangible equity 10.80 % 11.63 % 9.56 % 13.70 % 11.83 % Acquisition-related expenses 2.16 1.97 1.20 — — Loss related to wire fraud incident — — 2.06 — — Loss on sales of securities — — 1.71 — — Tax effect of adjustment items (0.47) (0.40) (1.01) — — Operating return on average tangible equity 12.49 % 13.20 % 13.52 % 13.70 % 11.83 % Tangible book value per common share reconciliation Book value per common share (GAAP) $ 17.98 $ 17.69 $ 17.31 $ 16.87 $ 16.41 Effect of goodwill and other intangibles (3.33) (3.38) (3.11) (3.14) (2.95) Tangible book value per common share $ 14.65 $ 14.31 $ 14.20 $ 13.73 $ 13.46 Tangible equity to tangible assets reconciliation Equity to assets (GAAP) 10.22 % 10.06 % 9.59 % 9.43 % 9.05 % Effect of goodwill and other intangibles (1.73) (1.76) (1.59) (1.62) (1.51) Tangible equity to tangible assets 8.49 % 8.30 % 8.00 % 7.81 % 7.54 % Operating efficiency ratio calculation Efficiency ratio (GAAP) 69.37 % 69.65 % 75.06 % 67.74 % 67.41 % Acquisition-related expenses (4.10) (3.61) (1.98) — — Loss related to wire fraud incident — — (3.38) — — Loss on sales of securities — — (2.81) — — Operating efficiency ratio 65.27 % 66.04 % 66.89 % 67.74 % 67.41 % Operating net noninterest expense(1) to average assets calculation Net noninterest expense to average assets 1.86 % 1.73 % 1.86 % 1.52 % 1.44 % Acquisition-related expenses (0.18) (0.15) (0.09) — — Loss related to wire fraud incident — — (0.16) — — Loss on sales of securities — — (0.13) — — Operating net noninterest expense to average assets 1.68 % 1.58 % 1.48 % 1.52 % 1.44 % Pre-provision net revenue Net interest income before provision for credit losses $ 29,203 $ 25,865 $ 22,699 $ 22,385 $ 20,952 Noninterest income 10,692 11,047 10,091 10,098 9,044 Total income 39,895 36,912 32,790 32,483 29,996 Noninterest expense 27,674 25,709 24,612 22,004 20,221 Pre-provision net revenue $ 12,221 $ 11,203 $ 8,178 $ 10,479 $ 9,775 Operating pre-provision net revenue Net interest income before provision for credit losses $ 29,203 $ 25,865 $ 22,699 $ 22,385 $ 20,952 Operating noninterest income 10,692 11,047 11,130 10,098 9,044 Total operating income 39,895 36,912 33,829 32,483 29,996 Operating noninterest expense 26,037 24,378 22,628 22,004 20,221 Operating pre-provision net revenue $ 13,858 $ 12,534 $ 11,201 $ 10,479 $ 9,775 (1) Net noninterest expense is define as noninterest expense less noninterest income 2026 2025 First Fourth Third Second First Quarter Quarter Quarter Quarter Quarter |
|