UNITED STATES
SECURITIES AND EXCHANGE COMMISSION
Washington, D.C. 20549
Form 6-K
REPORT OF FOREIGN PRIVATE ISSUER PURSUANT TO
RULE
13a-16 OR 15d-16 UNDER
THE SECURITIES EXCHANGE ACT OF 1934
For the month of March 2026
Commission File Number: 001-34936
Noah Holdings Limited
(Registrant’s name)
No. 1226, South Shenbin Road, Minhang District,
Shanghai, People’s Republic of China
+86 (21) 8035-8292
(Address of principal executive office)
Indicate by check mark whether the registrant files or will file annual reports under cover Form 20-F or Form 40-F.
Form 20-F x Form 40-F ¨
EXHIBIT INDEX
SIGNATURE
Pursuant to the requirements of the Securities Exchange Act of 1934, the registrant has duly caused this report to be signed on its behalf by the undersigned, thereunto duly authorized.
| Noah Holdings Limited | ||
| By: | /s/ Qing Pan | |
| Name: | Qing Pan | |
| Title: | Chief Financial Officer | |
| Date: March 25, 2026 | ||
Exhibit 99.1
Hong Kong Exchanges and Clearing Limited and The Stock Exchange of Hong Kong Limited take no responsibility for the contents of this announcement, make no representation as to its accuracy or completeness and expressly disclaim any liability whatsoever for any loss howsoever arising from or in reliance upon the whole or any part of the contents of this announcement.
Noah Holdings
Noah Holdings Private Wealth and Asset Management Limited
諾亞控股私人財富資產管理有限公司
(Incorporated in the Cayman Islands with limited liability under the name Noah Holdings Limited
and carrying on business in Hong Kong as Noah Holdings Private Wealth and Asset Management Limited)
(Stock Code: 6686)
INSIDE INFORMATION
ANNUAL RESULTS ANNOUNCEMENT
FOR THE YEAR ENDED DECEMBER 31, 2025
This announcement is issued pursuant to Rule 13.09 of the Hong Kong Listing Rules and the Inside Information Provision under Part XIVA of the SFO.
The Company is pleased to announce the unaudited consolidated annual results of the Company for the year ended December 31, 2025, together with the comparative figures for the corresponding period in 2024. These annual results have been prepared under the U.S. GAAP, which are different from the IFRS, and reviewed by the Audit Committee.
In this announcement, “Noah,” “we,” “us” and “our” refer to the Company and where the context otherwise requires, the Group. Certain amounts and percentage figures included in this announcement have been subject to rounding adjustments, or have been rounded to one or two decimal places. Any discrepancies in any table, chart or elsewhere between totals and sums of amounts listed therein are due to rounding.
BUSINESS HIGHLIGHTS
The global macroeconomic environment of 2025 remained volatile, marked by trade fragmentation and diverging monetary policies which further constrained global growth. Against this backdrop, liquidity conditions remained relatively tight as global central banks maintained policy rates at multi-year highs to rein in inflation. Geopolitical headwinds – ranging from renewed trade tensions to technology-export controls – sustained bouts of market volatility and reinforced investors’ preference for safe-haven assets. China’s economy remained under pressure, with subdued consumer demand and ongoing weakness in the real estate sector weighing on overall growth. Within China’s wealth management industry, HNW individuals continued to prioritize wealth preservation and liquidity. As a result, demand is gradually shifting toward providers of high-quality global strategies where transparency, diversification and downside protection are more readily obtained.
Our Company’s disciplined, forward-looking strategy continues to provide us with flexibility to navigate this challenging environment and ensure the resilience of our business. As highlighted in our annual CIO1 report for 2025, we are also witnessing a major paradigm shift occurring. If the past two decades were defined by strategies to hedge against inflation and allocate into inflation-protected assets, the next twenty years will pivot to a new imperative: understanding, embracing, and profiting from technology-driven deflation. We are guiding clients to embrace this evolving landscape where growth is no longer fueled by debt-driven asset bubbles but by deflationary forces and efficiency dividends enabled by technological innovation. In response, our adaptive allocation framework is designed to balance current defensive positioning with future-facing offensive opportunities through three strategic pillars: inflation-hedged anchors, deflation-hedged assets, and flexible bridge holdings.
| 1 | “CIO” refers to the chief investment officer of the Company. |
|
|
Our commitment to overseas expansion continues delivering promising results. By combining our personalized service model with an expanding portfolio of global products, we have established a significant competitive advantage. In 2025, we made notable progress: we established our ARK global headquarters in Singapore, entered into a strategic partnership with Tokyo Star Bank in Japan through our ARK Japan subsidiary, and officially joined the Family Office Association of Hong Kong. These developments position us at the crossroads of Asia’s evolving capital flows, enabling us to turn regional headwinds into long-term strategic advantages. As ever, we continue seeing tremendous growth potential in serving global Chinese HNW investors overseas who share our cultural values and place their trust in our long-standing track record. As a key booking center, Singapore has demonstrated robust momentum, with deposit volumes rising steadily and transaction value through Singapore-based channels increasing substantially, signaling clear potential for further expansion among local clients.
By consistently focusing on client and employee education, we believe we are strongly positioned to guide stakeholders through the coming market shifts. Our global growth journey has only just begun, and we remain confident in our ability to navigate challenges and capitalize on the opportunities that lie ahead.
At the same time, 2025 marked a structural evolution in Noah’s operating model, as AI became embedded across our global platform and transformed our path to scalable, sustainable growth. The deployment of “AI RMs” transitioned the firm toward a more institutionalized, operations-driven model, expanding frontline servicing capacity and mitigating traditional human capital constraints. By augmenting advisory workflows and standardizing processes, AI enhances productivity and enables broader client coverage without proportional cost expansion, reinforcing structural operating leverage. Leveraging our four global booking centers, we further advanced a digitally coordinated service infrastructure, where AI-powered client engagement tools streamline cross-border onboarding and execution processes, significantly shortening time-to-deployment for global asset allocation while preserving compliance rigor. In parallel, we continued optimizing our revenue mix toward a more AUM-driven and investment-oriented structure, increasing the contribution from recurring and investment-related revenues while expanding a diversified suite of global solutions. AI-driven asset allocation – integrating real-time product intelligence with over two decades of proprietary client insights – is reinforcing cross-border synergies and strengthening our differentiated data capabilities. Entering 2026, Noah stands structurally different: the institutional AI integration, global infrastructure coordination and disciplined revenue optimization achieved in 2025 have laid the foundation for compounding efficiency, deeper client engagement and resilient long-term growth in an increasingly AI-native financial landscape.
|
|
FINANCIAL HIGHLIGHTS
During the Reporting Period, we successfully navigated through a complex macroeconomic environment both domestically and internationally, while simultaneously advancing our internal structure transformation. As a result of these efforts and strategic focus, our net revenue for the year ended December 31, 2025 was RMB2,610.2 million, representing an increase of 0.4% compared to 2024. Our net income attributable to the Shareholders increased by 17.5% from RMB475.4 million for the year ended December 31, 2024 to RMB558.9 million for the year ended December 31, 2025. Similarly, our Non-GAAP net income attributable to the Shareholders increased by 11.2% from RMB550.2 million for the year ended December 31, 2024 to RMB611.9 million for the Reporting Period, primarily due to our cost control strategy on employee compensation and a decrease in losses from fair value changes in underlying investments made by certain investment in affiliates, partially offset by contingent litigation expenses related to Camsing Incident.
Despite the challenges, we remain committed to investing in the overseas market by expanding our international relationship managers team and actively increasing our influence and wallet share among our Chinese clients globally. The transaction value of overseas products we distributed increased by 8.1% from RMB31.1 billion for the year ended December 31, 2024 to RMB33.7 billion for the Reporting Period.
Non-GAAP Financial Measures
The following table sets forth unaudited reconciliation of GAAP and non-GAAP results for the period indicated.
| For the Year Ended | ||||||||||||
| December 31, | ||||||||||||
| 2024 | 2025 | Change | ||||||||||
| (RMB in thousands) | (%) | |||||||||||
| Total revenues | 2,621,334 | 2,629,787 | 0.3 | % | ||||||||
| Net revenues | 2,600,982 | 2,610,240 | 0.4 | % | ||||||||
| Income from operations | 633,889 | 776,664 | 22.5 | % | ||||||||
| Income before taxes and income from equity in affiliates | 867,605 | 856,425 | (1.3 | )% | ||||||||
| Net income | 487,004 | 557,219 | 14.4 | % | ||||||||
| Net income attributable to the Shareholders | 475,445 | 558,857 | 17.5 | % | ||||||||
| Non-GAAP Financial Measures: | ||||||||||||
| Net income attributable to the Shareholders | 475,445 | 558,857 | 17.5 | % | ||||||||
| Add: share-based compensation | 109,030 | 66,881 | (38.7 | )% | ||||||||
| Add: non-cash settlement expense reversal | (12,454 | ) | (956 | ) | (92.3 | )% | ||||||
| Less: Tax effect of adjustments | 21,836 | 12,862 | (41.1 | )% | ||||||||
| Adjusted net income attributable to the Shareholders (non-GAAP) | 550,185 | 611,920 | 11.2 | % | ||||||||
Adjusted net income attributable to the Shareholders is a non-GAAP financial measure that excludes the income statement effects of all forms of share-based compensation expenses, non-cash settlement expense reversal and net of relevant tax impact. A reconciliation of adjusted net income attributable to the Shareholders from net income attributable to the Shareholders, the most directly comparable GAAP measure, can be obtained by subtracting expenses for share-based compensations and non-cash settlements. All tax expense impact of such adjustments would also be considered. The Company believes that the non-GAAP financial measures help identify underlying trends in its business and enhance the overall understanding of the Company’s past performance and future prospects.
|
|
The non-GAAP financial measures disclosed by the Company should not be considered a substitute for financial measures prepared in accordance with U.S. GAAP. The financial results reported in accordance with U.S. GAAP and reconciliation of U.S. GAAP to non-GAAP results should be carefully evaluated. The non-GAAP financial measures used by the Company may be prepared differently from and, therefore, may not be comparable to similarly titled measures used by other companies.
When evaluating the Company’s operating performance in the Reporting Period, management reviewed non-GAAP net income results reflecting adjustments to exclude the impact of share-based compensation, non-cash settlement expense reversal and net of relevant tax impact. As such, the Company’s management believes that the presentation of the non-GAAP adjusted net income attributable to the Shareholders provides important supplemental information to investors regarding financial and business trends relating to its results of operations in a manner consistent with that used by management. Pursuant to U.S. GAAP, the Company recognized significant amounts of expenses for all forms of share-based compensation and non-cash settlement expense reversal (net of tax impact). To make its financial results comparable period by period, the Company utilizes non-GAAP adjusted net income attributable to the Shareholders to better understand its historical business operations. The Company encourages investors and others to review its financial information in its entirety and not rely on a single financial measure.
BUSINESS REVIEW AND OUTLOOK
Business Review for the Reporting Period
While 2025 continued to bring challenges, it presented an opportunity for our Company to demonstrate our resilience through cost management and acceleration in our global expansion.
Domestic Business Performance and Strategy
Domestically, our business continued to be impacted by a complex macroeconomic environment in China, with varied sectoral performance and continued structural adjustments. Our revenue contracted modestly during the Reporting Period compared to 2024, despite a significant decrease from distribution of insurance products due to intensified market competition we faced as we continue to invest in building our commission-only broker team; the impact was partially offset by an increase of 15.5% in contribution from public securities products. While contributions from private equity products declined by 10.4%, the business performed better than our expectation, supported by the fact that some of the funds gradually extended their terms.
Operating within China’s evolving economic landscape, we maintained disciplined execution of our domestic strategy despite persistent headwinds. Ongoing challenges in the property sector and cautious consumer sentiment created a complex environment for wealth management services. However, we view this period of consolidation as an opportunity to consolidate and reinforce our operational foundation for future growth. Our domestic operations benefited from the cost optimization initiatives implemented in late 2024, resulting in a 6.8% year-over-year reduction in operating expenses. Going forward, we remain focused on cost control, innovative client acquisition strategies, and operational restructuring to improve efficiency.
|
|
Looking ahead, we believe the growing sophistication of global Chinese investors and their increasing demand for diversified investment solutions align well with our evolving product suite. We continue to invest in talent development and technology infrastructure to ensure readiness to capture emerging opportunities. As domestic capital market conditions continue improving, we expect our strong brand recognition and operational discipline to position us for sustainable growth over the long term.
Details of the development of our domestic business structured around three core segments during the Reporting Period are as follows:
Domestic public securities
Domestic public securities, operating under the Noah Upright brand, is the business that distributes mutual funds and private secondary products. During the Reporting Period, this segment concentrated on developing an “online-first, offline-supported” business model, with the goal of facilitating global asset allocation through RMB-denominated products. Following policy incentives introduced in September 2024, the A-share and Hong Kong markets continued showing strong performance, driving a year-over-year increase of 42.9% in transaction value contributed by the segment, primarily driven by a 107.2% increase in fundraising for our RMB-denominated private secondary products during 2025. Looking ahead, we believe sustained capital market activity and continued policy support will create new opportunities for client acquisition, enabling us to further expand our market share.
Domestic asset management
Domestic asset management, operating under the Gopher Asset Management brand, is the business that manages RMB-denominated private equity funds and private secondary products. The focus remains on managing primary market exits and cross-border ETF products in the secondary market. Due to the absence of new fundraising for RMB-denominated private equity funds in 2025, the gradual expiration of legacy products is expected to reduce the management fee base. In response, we are accelerating the expansion of our overseas investment product offerings and growing our secondary market. These efforts aim to offset – and ultimately exceed – the impact of the declining management fee base from maturing onshore products.
Domestic insurance
Domestic insurance, operating under the Glory brand, is the business that distributes insurance products, consisting mainly of life and health insurance products. In 2025, revenue from this segment was impacted by adjustments to our sales team structure and a strategic shift in product focus. While the transition to a new model will require time to be reflected in our financial results, we believe this restructuring positions the business for long-term, stable growth. Looking ahead, we will prioritize the recruitment of commission-only brokers to drive the delivery of comprehensive family succession planning services, further strengthening this segment’s future potential.
|
|
Overseas Business Expansion and Vision
At the end of 2024, we executed a clear strategic vision to expand our global presence, and in 2025, we achieved considerable progress. Overseas revenue accounted for 49.0% of total net revenue in 2025, representing a year-over-year increase. This was primarily driven by contributions from our exclusive alternative investment products, which rose 26.1% compared to last year. To meet the evolving needs of a growing global client base, we continue offering a comprehensive suite of products denominated in both RMB and USD. Our competitive edge is anchored in an extensive network of esteemed product and investment partners worldwide, enabling us to continuously enhance our portfolio of high-quality, exclusive alternative investment solutions. Building on this strong foundation, the Group will strategically venture into frontier non-traditional asset ecosystems to capture new growth opportunities and further diversify our value proposition. Through strategic expansion in key markets such as Singapore, Japan, and Hong Kong, we have transformed ARK into a truly global wealth management platform. We intend to ride on this momentum by pursuing quality opportunities in new markets, including the U.S. and Canada, while continuing to develop more innovative products in both RMB and USD, and deepening local expertise in the jurisdictions we operate. Our overseas operations are structured into three core segments:
Overseas wealth management
Overseas wealth management, operating under the ARK Wealth Management brand, is the business that provides offline and online wealth management services.
As of December 31, 2025, our overseas registered clients exceeded 19,993, representing a 13.2% year-over-year increase. The number of active clients surpassed 6,231, representing a 12.4% year-over-year increase. Our overseas AUA, including distributed products, reached US$9.5 billion, reflecting an 8.6% increase compared to last year. Looking ahead, we will continue to deepen our coverage in these key markets while expanding our client base through both existing relationships and new client acquisition. To cater to the diverse needs and preferences of our clientele, we will design and introduce tailored suites of investment products aligned with a range of thematic strategies.
Overseas asset management
Overseas asset management, operating under the Olive Asset Management brand, is the business that manages USD-denominated private equity funds and private secondary products. Over the past years, we have significantly enhanced the competitiveness of our overseas primary market product shelf through the establishment of a dedicated U.S. product center. This allows us to offer private equity products that are on par with those provided by leading global private banks. On the secondary market side, we have expanded partnerships with top-tier global managers and diversified our offerings in structured products and hedge funds.
In 2025, fundraising for hedge funds and structured products reached US$957.4 million, representing a significantly 305.6% year-over-year increase. We raised US$680.6 million in USD-denominated private equity and private credit funds, representing a 2.7% year-over-year increase. As of December 31, 2025, our actively managed overseas AUM in USD terms reached US$6.1 billion, representing an increase of 3.9% compared to US$5.8 billion in last year. Moving forward, we will continue to strengthen our global alternative investment capabilities to meet the evolving needs of our clients.
|
|
Overseas insurance and comprehensive services
Overseas insurance and comprehensive services, operating under the Glory Family Heritage brand, is the business that provides comprehensive overseas services such as insurance, trust services and other services. In recent years, competition in the overseas insurance market – particularly in Hong Kong – has intensified, resulting in a decline in revenue from this segment in 2025. In response, we are actively exploring new business models and expanding our insurance offerings beyond Hong Kong to other international markets. We are also investing in the recruitment of licensed, commission-only brokers to enhance our client acquisition efforts. In 2025, Glory Family Heritage has establish a talented team of self-employed, commission-based brokers to catalyze the next phase of client growth for this segment.
Wealth Management Business
During the Reporting Period, we generated total revenue of RMB1,715.6 million from our wealth management business, representing a 5.1% decrease from RMB1,808.4 million in the year ended December 31, 2024, primarily consisting of (i) an 8.8% decrease in total revenue generated from one-time commissions from RMB634.4 million for the year ended December 31, 2024 to RMB578.3 million for the year ended December 31, 2025, primarily due to reduced distribution of insurance products; (ii) a 7.0% decrease in total revenue generated from recurring service fees from RMB983.5 million for the year ended December 31, 2024 to RMB914.2 million for the year ended December 31, 2025, primarily due to a decrease in AUM associated with a decrease in existing private equity products in mainland China; and (iii) a 137.6% increase in total revenue generated from performance-based income from RMB48.9 million for the year ended December 31, 2024 to RMB116.2 million for the year ended December 31, 2025, primarily due to an increase in performance-based income generated from domestic private secondary products and overseas private market products; and (iv) a 24.5% decrease in total revenue generated from other service fees from RMB141.6 million for the year ended December 31, 2024 to RMB106.9 million for the year ended December 31, 2025, primarily due to a reduction in value-added services provided to our clients. In 2025, we achieved an aggregate transaction value of RMB67.0 billion for the various types of investment products that we distributed, representing a 5.0% increase from 2024. The growth was mainly driven by a substantial 107.2% rise in the distribution of domestic private secondary products, which was partially offset by a decrease in the distribution of mutual fund products.
Asset Management Business
During the Reporting Period, we generated total revenue of RMB859.7 million from our asset management business, representing a 11.9% increase compared to the year ended December 31, 2024, mainly due to (i) a 5.6% increase in recurring service fees in the year ended December 31, 2025 compared to 2024; and (ii) a 49.9% increase in performance-based income in the year ended December 31, 2025 compared to 2024, resulting from an increase in income generated from overseas private equity products. Our AUM decreased by 6.5% from RMB151.5 billion as of December 31, 2024 to RMB141.7 billion as of December 31, 2025, among which our overseas AUM in RMB terms fell by 0.5% from RMB42.6 billion as of December 31, 2024 to RMB42.4 billion as of December 31, 2025, solely due to foreign exchange translation effects rather than any contraction in underlying business.
|
|
As of December 31, 2025, we maintained a sound capital structure with total assets of RMB11.7 billion and no interest-bearing liabilities. Throughout the Reporting Period, we remained committed to full compliance with all relevant laws and regulations that had a material impact on our business, such as the SFO, the Insurance Ordinance (Chapter 41 of the Laws of Hong Kong), and the Trustee Ordinance (Chapter 29 of the Laws of Hong Kong), among others.
Business Outlook
We believe the strategic and operational adjustments implemented throughout 2025 have laid a resilient foundation for our next phase of scalable growth. The successful establishment of our global headquarters in Singapore and the robust expansion of our overseas operations validate our strategic trajectory and position us favorably to navigate evolving macroeconomic dynamics. Looking ahead, we remain firmly focused on three key areas:
First, we will continue expanding our client base. Domestically, we intend to capitalize on industry consolidation and improving market conditions to capture market share among HNW individuals seeking trusted wealth management partners. Overseas, we continue seeing significant untapped potential among global Chinese HNW investors, who remain underserved by local financial institutions in their respective domiciles. Building on our momentum in Asia, we are actively exploring market entry and expansion opportunities in new markets, including the U.S. Concurrently, we will continue investing in the recruitment and development of our commission-only broker network to drive the strategic turnaround of our insurance business.
Second, we are committed to enhancing our global product suite and investment capabilities to serve an increasingly diverse clientele. Guided by our “Global Network, Local Depth” approach, we will leverage our multi-jurisdictional presence to source premium, globally diversified investment opportunities while deepening our local market expertise. As our client base expands, we plan to further diversify our RMB- and USD-denominated offerings and optimize our global asset-allocation frameworks to deliver competitive portfolios. In the primary market, we will expand our distinctive ecosystem of top-tier product and investment partners to craft bespoke strategies and secure exclusive opportunities. In the secondary market, we will harness our global research and investment expertise to identify leading strategies from top-tier fund managers, thereby strengthening our capacity to deliver robust and adaptive asset-allocation solutions.
Third, maintaining operational excellence and structural efficiency remains paramount as we pursue sustainable growth. The disciplined cost-optimization initiatives and the integration of AI-driven advisory workflows executed in 2025 have played an instrumental role in navigating the current economic landscape. We believe these structural improvements provide a robust foundation for sustainable margin expansion as revenue rebounds and growth accelerates.
Looking ahead, supported by our strengthened operational foundation, clear strategic vision, robust balance sheet, and healthy cash reserves, we remain highly confident in our ability to navigate market shifts, deliver sustainable growth, and create long-term value for our clients and Shareholders.
|
|
MANAGEMENT DISCUSSION AND ANALYSIS
Revenues
Historically, our revenues are derived from three business segments: wealth management, asset management and other services. Following a comprehensive evaluation of the nature of the Company’s evolving business operations and recent organizational adjustments, management have determined that a new segmentation approach will provide a clearer understanding of the financial performance and strategic progress of each business segment. As a result, since the fourth quarter of 2024, the Company has begun to disclose the Company’s revenues and operation costs and expenses for the Reporting Period for each six domestic and overseas business segments as well as headquarters. This refined segmentation approach is designed to enhance resource allocation, provide investors with clearer insights into the Company’s financial performance across its diverse business segments, and ensure alignment with the Company’s long-term strategic objectives.
The details of the revenue of the Group under the six domestic and overseas business segments as well as the headquarters are as follows:
| For the Year Ended | ||||||||||||
| December 31, | ||||||||||||
| 2024 | 2025 | Change | ||||||||||
| (RMB in thousands) | (%) | |||||||||||
| Revenues | ||||||||||||
| Domestic public securities(1) | ||||||||||||
| One-time commissions | 31,977 | 59,834 | 87.1 | % | ||||||||
| Recurring service fees | 422,433 | 393,053 | (7.0 | )% | ||||||||
| Performance-based income | 39,359 | 117,390 | 198.3 | % | ||||||||
| Total revenue for domestic public securities | 493,769 | 570,277 | 15.5 | % | ||||||||
| Domestic asset management(2) | ||||||||||||
| One-time commissions | 1,354 | 1,431 | 5.7 | % | ||||||||
| Recurring service fees | 745,287 | 684,577 | (8.1 | )% | ||||||||
| Performance-based income | 26,567 | 7,135 | (73.1 | )% | ||||||||
| Total revenue for domestic asset management | 773,208 | 693,143 | (10.4 | )% | ||||||||
| Domestic insurance(3) | ||||||||||||
| One-time commissions | 43,204 | 18,772 | (56.6 | )% | ||||||||
| Total revenue for domestic insurance | 43,204 | 18,772 | (56.6 | )% | ||||||||
| Overseas wealth management(4) | ||||||||||||
| One-time commissions | 441,488 | 320,511 | (27.4 | )% | ||||||||
| Recurring service fees | 143,363 | 161,247 | 12.5 | % | ||||||||
| Other service fees | 89,846 | 65,782 | (26.8 | )% | ||||||||
| Total revenue for overseas wealth management | 674,697 | 547,540 | (18.8 | )% | ||||||||
| Overseas asset management(5) | ||||||||||||
| One-time commissions | 17,164 | 30,388 | 77.0 | % | ||||||||
| Recurring service fees | 334,536 | 376,227 | 12.5 | % | ||||||||
| Performance-based income | 86,813 | 147,320 | 69.7 | % | ||||||||
| Total revenue for overseas asset management | 438,513 | 553,935 | 26.3 | % | ||||||||
|
|
| For the Year Ended | ||||||||||||
| December 31, | ||||||||||||
| 2024 | 2025 | Change | ||||||||||
| (RMB in thousands) | (%) | |||||||||||
| Overseas insurance and comprehensive services(6) | ||||||||||||
| One-time commissions | 100,359 | 150,603 | 50.1 | % | ||||||||
| Other service fees | 38,507 | 28,191 | (26.8 | )% | ||||||||
| Total revenue for overseas insurance and comprehensive services | 138,866 | 178,794 | 28.8 | % | ||||||||
| Headquarters(7) | ||||||||||||
| Recurring service fees | 1,322 | – | (100.0 | )% | ||||||||
| Other service fees | 57,755 | 67,326 | 16.6 | % | ||||||||
| Total revenue for headquarters | 59,077 | 67,326 | 14.0 | % | ||||||||
| Total revenues | 2,621,334 | 2,629,787 | 0.3 | % | ||||||||
Notes:
| (1) | Operates under the Noah Upright brand. |
| (2) | Operates under the Gopher Asset Management brand. |
| (3) | Operates under the Glory brand. |
| (4) | Operates under the ARK Wealth Management brand. |
| (5) | Operates under the Olive Asset Management brand. |
| (6) | Operates under the Glory Family Heritage brand. |
| (7) | Headquarters reflects revenue generated from corporate operations at the Company’s headquarters in Shanghai as well as administrative costs and expenses that were not directly allocated to the aforementioned six business segments. |
Domestic public securities
Domestic public securities is the business that distributes mutual funds and private secondary products. Our total revenue increased by 15.5% from RMB493.8 million for the year ended December 31, 2024 to RMB570.3 million for the year ended December 31, 2025. The change was primarily due to an increase in one-time commissions generated from distribution of private secondary products and an increase in performance-based income from private secondary products.
Domestic asset management
Domestic asset management is the business that manages RMB-denominated private equity funds and private secondary products. Our total revenue decreased by 10.4% from RMB773.2 million for the year ended December 31, 2024 to RMB693.1 million for the year ended December 31, 2025. The change was primarily due to a decrease in private equity products AUM in mainland China.
|
|
Domestic insurance
Domestic insurance is the business that distributes insurance products, consisting mainly of life and health insurance products. Our total revenue decreased by 56.6% from RMB43.2 million for the year ended December 31, 2024 to RMB18.8 million for the year ended December 31, 2025. The change was primarily due to a decrease in distribution of domestic insurance products.
Overseas wealth management
Overseas wealth management is the business that provides offline and online wealth management services. Our total revenue decreased by 18.8% from RMB674.7 million for the year ended December 31, 2024 to RMB547.5 million for the year ended December 31, 2025. The change was primarily due to a decrease in one-time commissions from distribution of our products.
Overseas asset management
Overseas asset management is the business that manages USD-denominated private equity funds and private secondary products. Our total revenue increased by 26.3% from RMB438.5 million for the year ended December 31, 2024 to RMB553.9 million for the year ended December 31, 2025. The change was primarily due to an increase in recurring service fees and performance-based income generated from overseas investment products managed by Olive Asset Management.
Overseas insurance and comprehensive services
Overseas insurance and comprehensive services is the business that provides comprehensive overseas services such as insurance, trust services and other services. Our total revenue increased by 28.8% from RMB138.9 million for the year ended December 31, 2024 to RMB178.8 million for the year ended December 31, 2025. The change was primarily due to an increase in commissions gained from distribution of overseas insurance products by commission-only brokers.
Headquarters
Headquarters reflects revenue generated from corporate operations at the Company’s headquarters in Shanghai as well as administrative costs and expenses that were not directly allocated to the aforementioned six business segments. Our total revenue increased by 14.0% from RMB59.1 million for the year ended December 31, 2024 to RMB67.3 million for the year ended December 31, 2025. The change was primarily due to more value-added services that we offered to our HNW clients.
While the Company has adopted a refined segmentation approach since the fourth quarter of 2024 to better reflect its evolving business operations and support future strategic development, for comparison and analytical purposes, the Company continues to present its financial performance under the traditional segmentation structure. This transitional presentation facilitates a consistent comparison of revenue generated under the traditional segments for the years ended December 31, 2024 and 2025, providing investors with a comprehensive understanding of the Company’s operational and financial trends during the Reporting Period.
|
|
The details of the revenue of the Group under the traditional three business segments are as follows:
| For the Year Ended | ||||||||||||
| December 31, | ||||||||||||
| 2024 | 2025 | Change | ||||||||||
| (RMB in thousands) | (%) | |||||||||||
| Revenues | ||||||||||||
| Wealth management business: | ||||||||||||
| One-time commissions | 634,368 | 578,284 | (8.8 | )% | ||||||||
| Recurring service fees | 983,503 | 914,209 | (7.0 | )% | ||||||||
| Performance-based income | 48,930 | 116,247 | 137.6 | % | ||||||||
| Other service fees | 141,631 | 106,870 | (24.5 | )% | ||||||||
| Total revenue for wealth management business | 1,808,432 | 1,715,610 | (5.1 | )% | ||||||||
| Asset management business: | ||||||||||||
| One-time commissions | 1,178 | 3,255 | 176.3 | % | ||||||||
| Recurring service fees | 663,438 | 700,895 | 5.6 | % | ||||||||
| Performance-based income | 103,809 | 155,598 | 49.9 | % | ||||||||
| Total revenue for asset management business | 768,425 | 859,748 | 11.9 | % | ||||||||
| Other businesses: | ||||||||||||
| Other service fees | 44,477 | 54,429 | 22.4 | % | ||||||||
| Total revenue for other businesses | 44,477 | 54,429 | 22.4 | % | ||||||||
| Total revenues | 2,621,334 | 2,629,787 | 0.3 | % | ||||||||
Our total revenue increased by 0.3% from RMB2,621.3 million for the year ended December 31, 2024 to RMB2,629.8 million for the year ended December 31, 2025. The increase in total revenues was primarily due to an increase in performance-based income from overseas private equity products, partially offset by a decrease in one-time commission from overseas insurance products.
Wealth Management Business
For the wealth management business, our total revenue decreased by 5.1% from RMB1,808.4 million in 2024 to RMB1,715.6 million in 2025. Our transaction value remained stable at RMB67.0 billion for the year ended December 31, 2025 compared to RMB63.9 billion for the year ended December 31, 2024.
| · | Total revenue from one-time commissions decreased by 8.8% from RMB634.4 million for the year ended December 31, 2024 to RMB578.3 million for the year ended December 31, 2025, primarily due to a decrease in distribution of insurance products. |
| · | Total revenue from recurring service fees decreased by 7.0% from RMB983.5 million for the year ended December 31, 2024 to RMB914.2 million for the year ended December 31, 2025, primarily due to a decrease in recurring service fees generated from domestic private equity products. |
|
|
| · | Total revenue from performance-based income increased by 137.6% from RMB48.9 million for the year ended December 31, 2024 to RMB116.2 million for the year ended December 31, 2025, primarily due to an increase in performance-based income from private secondary products. |
| · | Total revenue from other service fees decreased by 24.5% from RMB141.6 million for the year ended December 31, 2024 to RMB106.9 million for the year ended December 31, 2025, primarily due to a reduction in value-added services that we offered to our HNW clients. |
Asset Management Business
For the asset management business, our total revenue increased by 11.9% from RMB768.4 million for the year ended December 31, 2024 to RMB859.7 million for the year ended December 31, 2025. Our AUM decreased by 6.5%, from RMB151.5 billion as of December 31, 2024 to RMB141.7 billion as of December 31, 2025.
| · | Total revenue from one-time commissions increased by 176.3% from RMB1.2 million for the year ended December 31, 2024 to RMB3.3 million for the year ended December 31, 2025, mainly due to an increase in distribution of private secondary products domestically. |
| · | Total revenue from recurring service fees increased by 5.6% from RMB663.4 million for the year ended December 31, 2024 to RMB700.9 million for the year ended December 31, 2025, mainly due to an increase in recurring service fees generated from overseas investment products. |
| · | Total revenue from performance-based income increased by 49.9% from RMB103.8 million for the year ended December 31, 2024 to RMB155.6 million for the year ended December 31, 2025, primarily due to an increase in performance-based income from overseas private equity products. |
Other Businesses
For other businesses, our total revenue was RMB54.4 million for the year ended December 31, 2025, representing a 22.4% increase from RMB44.5 million for the year ended December 31, 2024, primarily driven by an increase in revenue from lease services.
Operating Costs and Expenses
Our financial condition and operating results are directly affected by our operating cost and expenses, primarily consisting of (i) compensation and benefits, including salaries and commissions for our relationship managers, share-based compensation expenses, performance-based bonuses, and other employee salaries and bonuses, (ii) selling expenses, (iii) general and administrative expenses, (iv) provision for credit losses, and (v) other operating expenses, which are partially offset by the receipt of government subsidies. Our operating costs and expenses are primarily affected by several factors, including the number of our employees, rental expenses and certain non-cash charges.
In line with the presentation of revenues under the refined segmentation approach, our operating costs and expenses are also presented under this structure to offer a comprehensive view of the cost and expense profile of each business segment.
|
|
| For the Year Ended | ||||||||||||
| December 31, | ||||||||||||
| 2024 | 2025 | Change | ||||||||||
| (Unaudited) | (Unaudited) | |||||||||||
| (RMB in thousands) | (%) | |||||||||||
| Domestic public securities | 169,771 | 139,112 | (18.1 | )% | ||||||||
| Domestic asset management | 197,995 | 126,203 | (36.3 | )% | ||||||||
| Domestic insurance | 124,449 | 53,105 | (57.3 | )% | ||||||||
| Overseas wealth management | 569,243 | 404,875 | (28.9 | )% | ||||||||
| Overseas asset management | 84,914 | 144,717 | 70.4 | % | ||||||||
| Overseas insurance and comprehensive services | 93,399 | 124,851 | 33.7 | % | ||||||||
| Headquarters | 727,322 | 840,713 | 15.6 | % | ||||||||
| Total operating costs and expenses | 1,967,093 | 1,833,576 | (6.8 | )% | ||||||||
Domestic public securities
For the domestic public securities, our operating costs and expenses decreased by 18.1% from RMB169.8 million for the year ended December 31, 2024 to RMB139.1 million for the year ended December 31, 2025. The change was primarily attributable to our cost-control measures on employee compensation implemented in 2025.
Domestic asset management
For the domestic asset management, our operating costs and expenses decreased by 36.3% from RMB198.0 million for the year ended December 31, 2024 to RMB126.2 million for the year ended December 31, 2025. The change was primarily attributable to our cost-control measures on employee compensation implemented in 2025 and a decrease in one-off expenses Gopher paid to one of its funds as general partner.
Domestic insurance
For the domestic insurance, our operating costs and expenses decreased by 57.3% from RMB124.4 million for the year ended December 31, 2024 to RMB53.1 million for the year ended December 31, 2025. The change was consistent with the decline in revenue from domestic insurance business.
Overseas wealth management
For the overseas wealth management, our operating costs and expenses decreased by 28.9% from RMB569.2 million for the year ended December 31, 2024 to RMB404.9 million for the year ended December 31, 2025. The change was primarily attributable to our cost-control measures on employee compensation implemented in 2025, as well as a corresponding decrease in relationship manager commissions resulting from a reduction in one-time commissions.
|
|
Overseas asset management
For the overseas asset management, our operating costs and expenses increased by 70.4% from RMB84.9 million for the year ended December 31, 2024 to RMB144.7 million for the year ended December 31, 2025. The change is consistent with the growth in revenues from overseas investment products managed by Olive Asset Management.
Overseas insurance and comprehensive services
For the overseas insurance and comprehensive services, our operating costs and expenses increased by 33.7% from RMB93.4 million for the year ended December 31, 2024 to RMB124.9 million for the year ended December 31, 2025. The change was primarily due to higher costs incurred by commission-only brokers in relation to overseas insurance business.
Headquarters
For the headquarters, our operating costs and expenses increased by 15.6% from RMB727.3 million for the year ended December 31, 2024 to RMB840.7 million for the year ended December 31, 2025. The change was primarily due to an increase in provision for credit losses related to the suspended lending business.
For consistency and to provide a meaningful comparison, we also present operating costs and expenses under the traditional segmentation structure for the years ended December 31, 2024 and 2025, facilitating investors’ comprehensive understanding of the Company’s operational and financial trends in terms of costs and expenses during the Reporting Period.
| For the Year Ended | ||||||||||||
| December 31, | ||||||||||||
| 2024 | 2025 | Change | ||||||||||
| (RMB in thousands) | (%) | |||||||||||
| Wealth management | 1,456,661 | 1,338,769 | (8.1 | )% | ||||||||
| Asset management | 379,474 | 342,155 | (9.8 | )% | ||||||||
| Other businesses | 130,958 | 152,652 | 16.6 | % | ||||||||
| Total operating costs and expenses | 1,967,093 | 1,833,576 | (6.8 | )% | ||||||||
Our operating costs and expenses decreased by 6.8% from RMB1,967.1 million for the year ended December 31, 2024 to RMB1,833.6 million for the year ended December 31, 2025, which was primarily due to our cost control strategy on employee compensation and a decrease in one-off expense Gopher paid to one of its funds as general partner.
Wealth Management Business
For the wealth management business, our operating costs and expenses decreased by 8.1% from RMB1,456.7 million for the year ended December 31, 2024 to RMB1,338.8 million for the year ended December 31, 2025, primarily due to a decrease in the provision for losses related to long-term receivables and our cost control strategy on employee compensation.
|
|
Asset Management Business
For the asset management business, our operating costs and expenses decreased by 9.8% from RMB379.5 million for the year ended December 31, 2024 to RMB342.2 million for the year ended December 31, 2025, primarily due to a decrease in one-off expenses Gopher paid to one of its funds as general partner.
Other Businesses
For other businesses, our operating costs and expenses for the year ended December 31, 2025 were RMB152.7 million, representing a 16.6% increase from RMB131.0 million for the year ended December 31, 2024, primarily due to an increase in provision for credit losses related to the suspended lending business.
Compensation and Benefits
Compensation and benefits mainly include salaries and commissions for our relationship managers, salaries and bonuses for investment professionals and other employees, share-based compensation expenses for our employees and Directors, and bonuses related to performance-based income. Our total compensation and benefits decreased by 9.8% from RMB1,349.5 million for the year ended December 31, 2024 to RMB1,216.6 million for the year ended December 31, 2025, primarily due to our cost control strategy on employee compensation.
For the wealth management business, our compensation and benefits decreased by 9.1% from RMB1,065.2 million in 2024 to RMB967.9 million in 2025. During the Reporting Period, our relationship manager compensation decreased by 7.6% compared to 2024, aligning with the decrease in one-time commissions. Our other compensation decreased by 10.7% compared to the year ended December 31, 2024, primarily due to our cost control strategy on employee compensation.
For the asset management business, our compensation and benefits decreased by 9.0% from RMB245.0 million for the year ended December 31, 2024 to RMB222.9 million for the year ended December 31, 2025, primarily due to our cost control strategy on employee compensation.
Selling Expenses
Our selling expenses primarily include (i) expenses associated with the operations of service centers, such as rental expenses, and (ii) expenses for online and offline marketing activities. Our selling expenses decreased by 9.7% from RMB269.0 million for the year ended December 31, 2024 to RMB242.8 million for the year ended December 31, 2025, primarily due to lower rental and related expenses incurred.
For the wealth management business, our selling expenses decreased by 11.4% from RMB195.8 million in 2024 to RMB173.4 million in 2025, primarily due to lower traveling expenses incurred.
For the asset management business, our selling expenses during the Reporting Period were RMB48.0 million, which was effectively flat compared to RMB46.8 million in 2024.
|
|
General and Administrative Expenses
Our general and administrative expenses primarily include rental and related expenses of our leased office spaces and professional service fees. The main items include rental expenses for our Group and regional headquarters and offices, depreciation expenses, audit expenses and consulting expenses, among others. Our general and administrative expenses increased by 3.0% from RMB296.8 million for the year ended December 31, 2024 to RMB305.6 million for the year ended December 31, 2025, primarily due to higher legal expenses incurred in 2025.
For the wealth management business, our general and administrative expenses increased by 6.9% from RMB184.7 million for the year ended December 31, 2024 to RMB197.4 million for the year ended December 31, 2025, primarily due to higher legal expenses incurred in 2025.
For the asset management business, our general and administrative expenses during the Reporting Period were RMB71.7 million, which was effectively flat compared to RMB70.8 million in 2024.
Provision for or Reversal of Credit Losses
Provision for credit losses represents net changes of the allowance for loan losses as well as other financial assets. We recorded provision for credit losses amounting to RMB52.2 million during the Reporting Period, while recorded provision for credit losses of RMB23.9 million for the year ended December 31, 2024, primarily due to an increase in provision for credit losses related to the suspended lending business.
For the wealth management business, our reversal of credit losses for the year ended December 31, 2025 was RMB0.2 million compared to the provision for credit losses of RMB22.2 million for the year ended December 31, 2024, primarily due to a decrease in the provision for losses related to long-term receivables.
For the asset management business, our provision for credit losses for the year ended December 31, 2025 was RMB9.0 million, while we recorded provision for credit losses of RMB3.7 million for the year ended December 31, 2024. The change was primarily attributable to a decrease in expected collection of our accounts receivables.
For other businesses, our provision for credit losses for the year ended December 31, 2025 was RMB43.4 million, while reversal of credit losses was RMB2.0 million for the year ended December 31, 2024. The change was mainly related to an increase in provision for credit losses related to the suspended lending business.
Other Operating Expenses
Our other operating expenses mainly include various expenses incurred directly in relation to our other service fees. Our other operating expenses decreased by 32.5% from RMB93.2 million in 2024 to RMB62.9 million in 2025, primarily due to a decrease in one-off expenses Gopher paid to one of its funds as general partner during the Reporting Period.
For the wealth management business, our other operating expenses decreased by 16.4% from RMB43.1 million for the year ended December 31, 2024 to RMB36.1 million for the year ended December 31, 2025, primarily driven by lower other operating expenses relating to trust business.
|
|
For the asset management business, our other operating expenses for the year ended December 31, 2025 was RMB0.2 million, while other operating expenses for the year ended December 31, 2024 were RMB23.9 million. The change was primarily due to a decrease in one-off expenses Gopher paid to one of its funds as general partner during the Reporting Period.
For other businesses, our other operating expenses during the Reporting Period were RMB26.6 million, which was effectively flat compared to RMB26.2 million in 2024.
Government Subsidies
Our government subsidies are cash subsidies received in the PRC from local governments as incentives for investing and operating in certain local districts. Such subsidies are used by us for general corporate purposes and are reflected as an offset to our operating costs and expenses. Our government subsidies decreased by 28.8% from RMB65.2 million in 2024 to RMB46.5 million in 2025, primarily due to a decrease in government subsidies received from local governments.
For the wealth management business, our government subsidies decreased by 34.3% from RMB54.3 million for the year ended December 31, 2024 to RMB35.7 million for the year ended December 31, 2025, primarily due to a decrease in government subsidies received from local governments during the Reporting Period.
For the asset management business, our government subsidies decreased by 9.8% from RMB10.8 million for the year ended December 31, 2024 to RMB9.7 million for the year ended December 31, 2025, primarily due to a decrease in government subsidies received from local governments during the Reporting Period.
Income from Operations
As a result of the foregoing, our income from operations increased by 22.5% from RMB633.9 million in 2024 to RMB776.7 million in 2025. The increase in income from operations was primarily due to our cost control strategy on employee compensation which led to a 9.8% decrease in employee compensation as well as a decrease in one-off expenses Gopher paid to one of its funds as general partner.
Other Income
Our total other income decreased by 65.9% from RMB233.7 million for the year ended December 31, 2024 to RMB79.8 million for the year ended December 31, 2025. The decrease in other income was primarily attributable to an increase in contingent litigation expenses related to the Camsing Incident, as well as higher exchange losses arising from foreign exchange fluctuations.
Loss from Equity in Affiliates
Our loss from equity in affiliates was RMB1.4 million for the Reporting Period, compared with loss from equity in affiliates of RMB112.0 million for the year ended December 31, 2024. The decrease in losses from equity in affiliates was primarily due to an increase in the fair value of the funds that Gopher managed.
Net Income
As a result of the foregoing, our net income increased by 14.4% from RMB487.0 million for the year ended December 31, 2024 to RMB557.2 million for the year ended December 31, 2025.
|
|
Liquidity and Capital Resources
We finance our operations primarily through cash generated from our operating activities. Our principal use of cash for the Reporting Period was for operating, investing and financing activities. As of December 31, 2025, we had RMB4,360.9 million in cash and cash equivalents, consisting of cash on hand, demand deposits, fixed term deposits and money market funds which are unrestricted as to withdrawal and use. As of December 31, 2025, our cash and cash equivalents of RMB12.9 million were held by the consolidated funds, which although not legally restricted, are not available to our general liquidity needs as the use of such funds is generally limited to the investment activities of the consolidated funds. We believe that our current cash and anticipated cash flow from operations will be sufficient to meet our anticipated cash needs, including our cash needs for at least the next 12 months. We may, however, need additional capital in the future to address unforeseen business conditions or other developments, including any potential investments or acquisitions we may pursue.
Significant Investments
The Company did not make or hold any significant investments during the year ended December 31, 2025.
Material Acquisitions and Disposals
During the Reporting Period, the Company did not conduct any material acquisitions or disposals of subsidiaries and affiliated companies.
Pledge of Assets
As of December 31, 2025, we did not pledge any assets (as of December 31, 2024: nil).
Future Plans for Material Investments or Capital Asset
As of December 31, 2025, the Group did not have detailed future plans for material investments or capital assets.
Gearing Ratio
As of December 31, 2025, the Company’s gearing ratio (i.e., total liabilities divided by total assets, in percentage) was 15.0% (as of December 31, 2024: 15.0%).
Accounts Receivables
Accounts receivable represents amounts invoiced or we have the right to invoice. As we are entitled to unconditional right to consideration in exchange for services transferred to customers, we therefore do not recognize any contract asset. As of December 31, 2025, 90.5% of the balance of our accounts receivable was within one year (as of December 31, 2024: 89.9%).
Accounts Payable
As of December 31, 2025, the Group had no trade payables (as of December 31, 2024: nil).
|
|
Foreign Exchange Exposure
We earn the majority of our revenues and incur the majority of our expenses in Renminbi, and the majority of our sales contracts are denominated in Renminbi and majority of our costs and expenses are denominated in Renminbi, while a portion of our financial assets are denominated in U.S. dollars. Very limited hedging options are available in China to reduce our exposure to exchange rate fluctuations, and we have not used any forward contracts or currency borrowings to hedge our exposure to foreign currency risk. While we may decide to enter into hedging transactions in the future, the availability and effectiveness of these hedges may be limited and we may not be able to adequately hedge our exposure or at all. In addition, our currency exchange losses may be magnified by PRC exchange control regulations that restrict our ability to convert Renminbi into foreign currency. As a result, any significant revaluation of the Renminbi or the U.S. dollar may adversely affect our cash flows, earnings and financial position, and the value of, and any dividends payable on, our Shares and/or ADSs. For example, an appreciation of the Renminbi against the U.S. dollar would make any new RMB-denominated investments or expenditures more costly to us, to the extent that we need to convert U.S. dollars into Renminbi for such purposes. An appreciation of the Renminbi against the U.S. dollar would also result in foreign currency translation losses for financial reporting purposes when we translate our U.S. dollar-denominated financial assets into Renminbi, our reporting currency. Conversely, if we decide to convert Renminbi into U.S. dollars for the purpose of making payments for dividends on our Shares or ADSs, for payment of interest expenses, for strategic acquisitions or investments, or for other business purposes, appreciation of the U.S. dollar against the Renminbi would have a negative effect on us.
Contingent Liabilities
As of December 31, 2025, we had contingent liabilities of RMB505.5 million in relation to the unsettled Camsing Incident (as of December 31, 2024: RMB476.1 million). For further details, please refer to Note 8 to the unaudited condensed consolidated financial statements in this announcement.
Save as disclosed above and in “Material Litigation” in the section headed “Other Information” in this announcement, no material contingent liabilities, guarantees or any litigation against us, in the opinion of our Directors, are likely to have a material and adverse effect on our business, financial condition or results of operations as of December 31, 2025.
Capital Expenditures and Capital Commitment
Our capital expenditures primarily consist of purchases of property and equipment, and renovation and upgrade of our newly purchased office premises. Our capital expenditures were RMB134.1 million for the year ended December 31, 2025 (for the year ended December 31, 2024: RMB82.2 million). Such an increase was primarily driven by our renovation and upgrade of our headquarters in Hong Kong. As of December 31, 2025, we did not have any commitment for capital expenditures or other cash requirements outside of our ordinary course of business (as of December 31, 2024: nil).
Loans and Borrowings
The Group had no outstanding loans, overdrafts or borrowings from banks or any other financial institutions as of December 31, 2025 (as of December 31, 2024: nil).
|
|
Employees and Remuneration
As of December 31, 2025, the Company had a total of 1,778 employees. The following table sets out the breakdown of our full-time employees by function as of December 31, 2025:
| Number of | ||||||||
| Function | Employees | % of Total | ||||||
| PRC | ||||||||
| Domestic public securities | 292 | 16.4 | ||||||
| Domestic asset management | 189 | 10.6 | ||||||
| Domestic insurance | 22 | 1.2 | ||||||
| Overseas | ||||||||
| Overseas wealth management | 146 | 8.2 | ||||||
| Overseas asset management | 106 | 6.0 | ||||||
| Overseas insurance and comprehensive services | 113 | 6.4 | ||||||
| Headquarter | ||||||||
| Business development | 495 | 27.9 | ||||||
| Middle and back office support | 415 | 23.3 | ||||||
| Total | 1,778 | 100.0 | ||||||
We believe we offer our employees competitive compensation packages and a dynamic work environment that encourages initiative and is based on merit. As a result, we have generally been able to attract and retain qualified personnel and maintain a stable core management team.
The remuneration package of our employees includes salaries and commissions for our relationship managers, salaries and bonuses for investment professionals and other employees, share-based compensation expenses for our employees and Directors, and bonuses related to performance-based income.
As required by regulations in China, we participate in various employee social security plans that are organized by municipal and provincial governments, including endowment insurance, unemployment insurance, maternity insurance, employment injury insurance, medical insurance and housing provident fund. We enter into standard labor, confidentiality and non-compete agreements with our employees. The non-compete restricted period typically expires two years after the termination of employment, and we agree to compensate the employee with a certain percentage of his or her pre-departure salary during the restricted period.
We believe that we maintain a good working relationship with our employees, and we have not experienced any significant labor disputes during the Reporting Period.
We have been continuously investing in training and education programs for employees. We provide formal and comprehensive company-level and department-level training to our new employees, followed by on-the-job training. We also provide training and development programs to our employees from time to time to ensure their awareness and compliance with our various policies and procedures. Some of the training is conducted jointly by departments serving different functions but working with or supporting each other in our day-to-day operations.
|
|
The Company also has adopted the 2022 Share Incentive Plan. Further details in respect of the 2022 Share Incentive Plan are set out in the Company’s circular dated November 14, 2022.
OTHER INFORMATION
Compliance with the Corporate Governance Code
The Board is committed to achieving high corporate governance standards. The Board believes that high corporate governance standards are essential in providing a framework for the Company to safeguard the interests of Shareholders and to enhance corporate value and accountability.
During the Reporting Period, we have complied with all the code provisions of the Corporate Governance Code. The Board will review the corporate governance structure and practices from time to time and shall make necessary arrangements when the Board considers appropriate.
Compliance with the Model Code for Securities Transactions by Directors
The Company had implemented the Management Control Measures on Material Non-Public Information and the Policy on Prohibition of Insider Dealing (the “Code”) and on August 22, 2024, further adopted the Statement of Policies Governing Material Non-Public Information and the Prevention of Insider Trading (the “Statement”) as an amendment to the Code. The Statement, with terms no less exacting than the Model Code, serves as the Company’s own securities dealing code to regulate all dealings by Directors and relevant employees of securities in the Company and other matters covered by the Statement.
Specific enquiry has been made of all the Directors and the relevant employees and they have confirmed that they have complied with the Model Code and the Statement during the Reporting Period.
Scope of Work of Deloitte Touche Tohmatsu
The unaudited financial information disclosed in this announcement is preliminary. The audit of the financial statements and related notes to be included in the Company’s annual report to Shareholders for the year ended December 31, 2025 is still in progress. The figures in respect of the Company’s unaudited condensed consolidated statement of operations, unaudited condensed consolidated statement of comprehensive income, unaudited condensed consolidated balance sheet and the related notes thereto for the year ended December 31, 2025 as set out in this announcement have been agreed by the Company’s auditor, Messrs. Deloitte Touche Tohmatsu, to the amounts set out in the Company’s unaudited consolidated financial statements for the year. The work performed by Messrs. Deloitte Touche Tohmatsu in this respect did not constitute an assurance engagement and consequently no opinion or assurance conclusion has been expressed by Messrs. Deloitte Touche Tohmatsu on this announcement.
Events or issues may arise during the course of finalizing and issuing the audited consolidated financial statements of the Group that might result in the need to revise amounts in the Group’s consolidated financial statements.
Review of the Annual Results
The Audit Committee comprises Ms. Xiangrong Li, Ms. Cynthia Jinhong Meng and Mr. David Zhang, each being our non-executive Director or independent Director with appropriate professional qualifications, with Ms. Xiangrong Li, as the chairwoman of the Audit Committee.
The Audit Committee has reviewed the unaudited annual results of the Group for the year ended December 31, 2025 and has recommended for the Board’s approval thereof. The Audit Committee has reviewed together with the management the Group’s accounting principles and policies and the Group’s unaudited consolidated financial statements for the year ended December 31, 2025. The Audit Committee considered that the unaudited annual results are in compliance with the applicable accounting standards, laws and regulations, and the Company has made appropriate disclosures thereof.
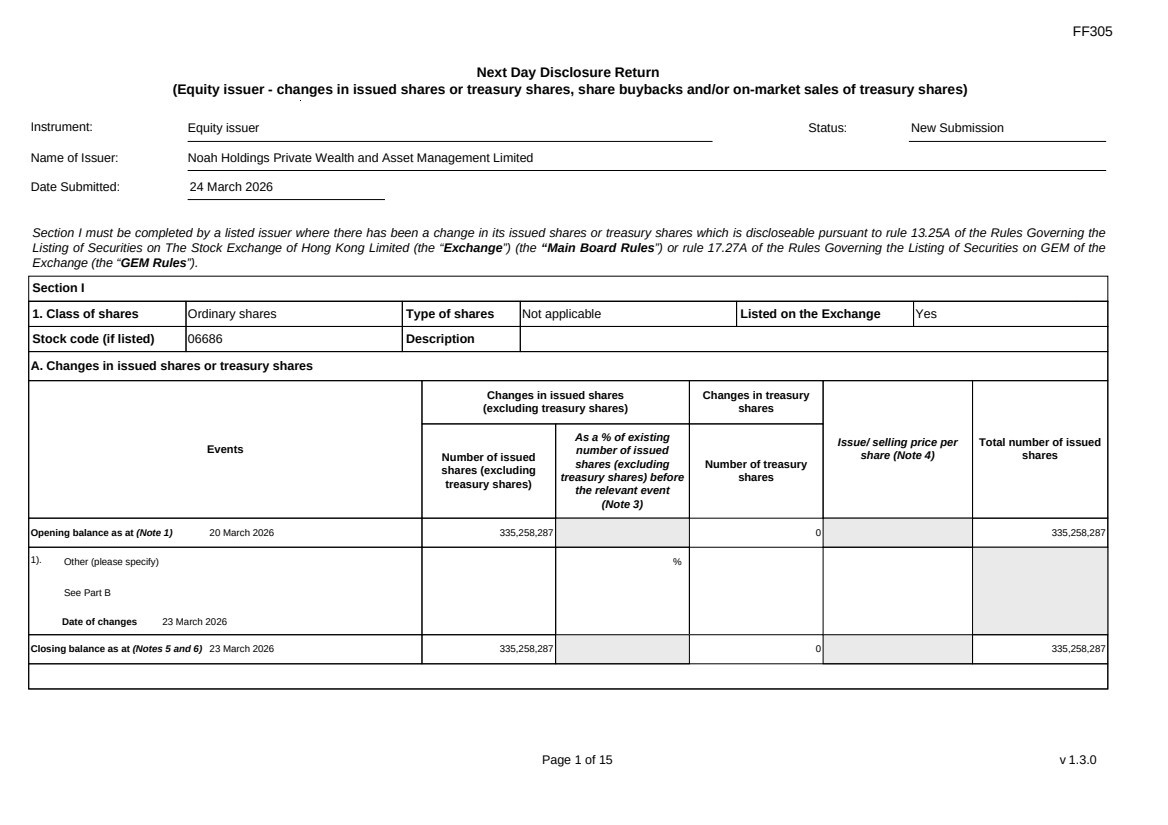
Purchase, Sale or Redemption of the Company’s Listed Securities
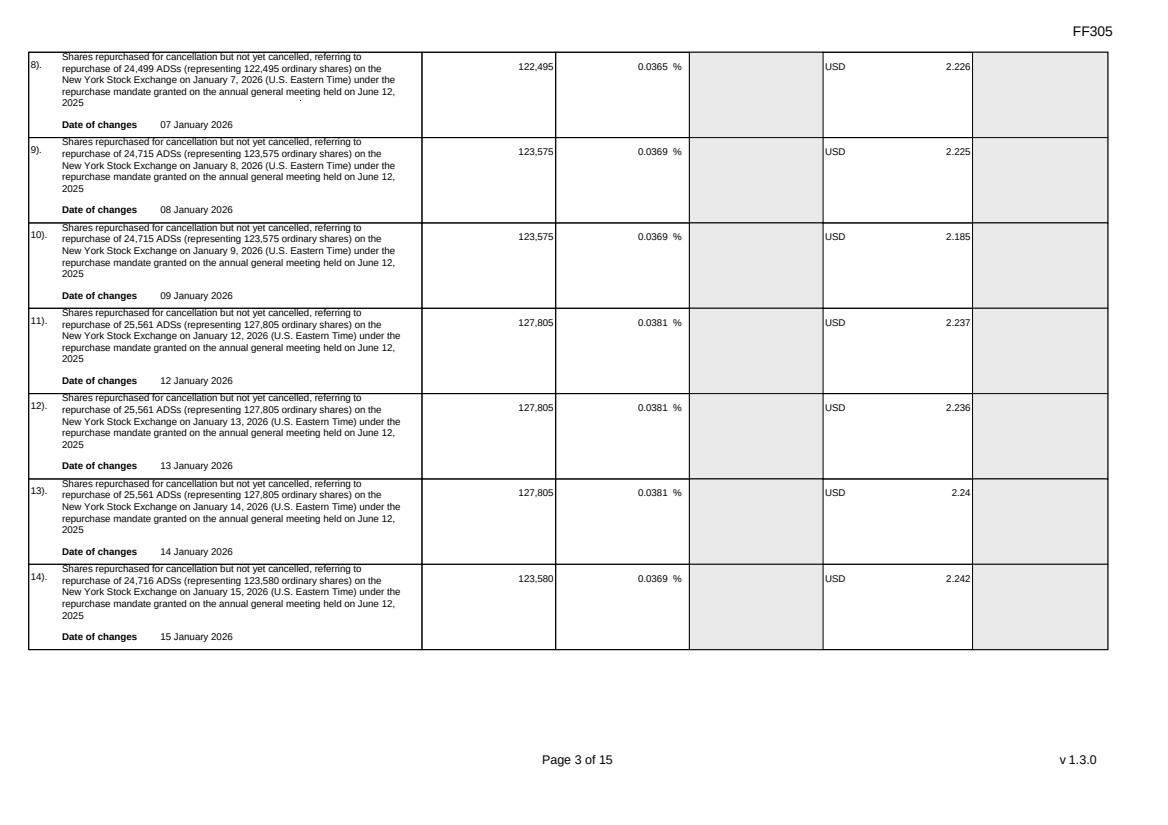
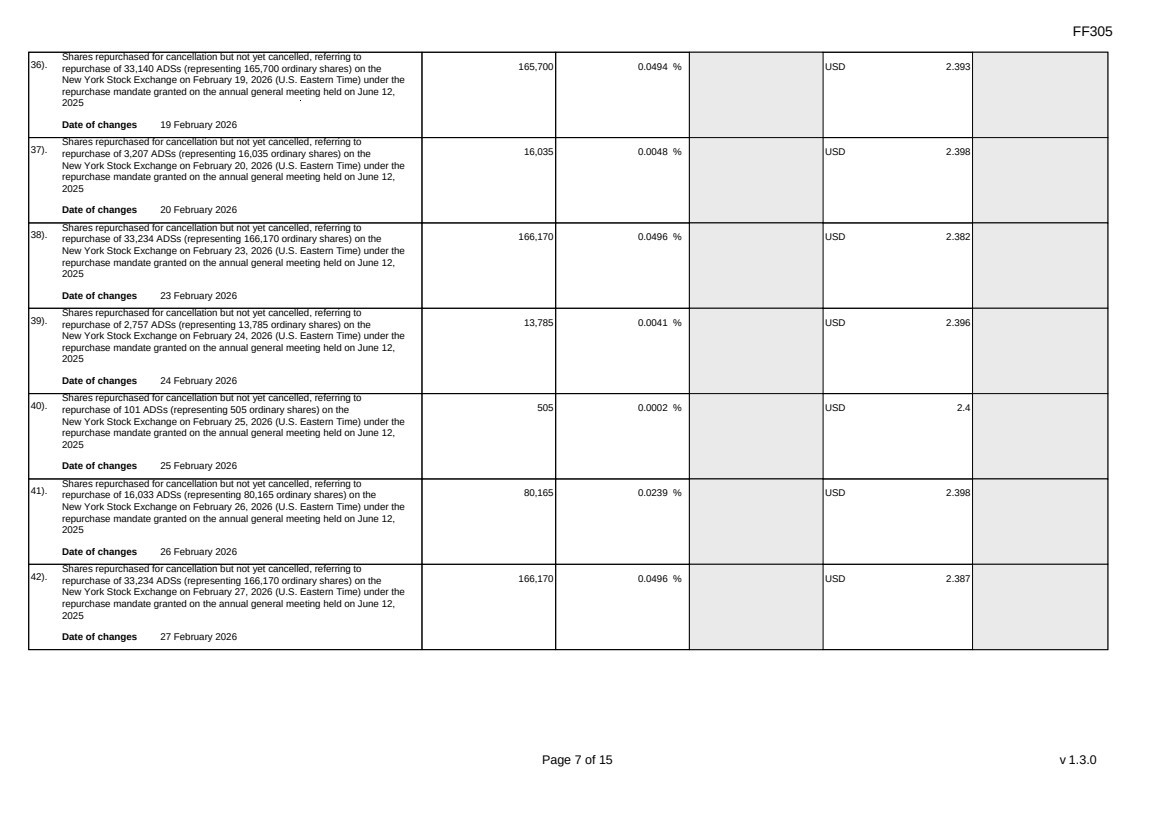
On August 29, 2024, the Board authorized a share repurchase program (the “Share Repurchase Program”), under which the Company may repurchase up to US$50 million of its ADSs or Shares, effective on the same date. The authorized term for carrying out the Share Repurchase Program is two years. For further details of the Share Repurchase Program, please refer to the Company’s announcement dated August 29, 2024.
During the Reporting Period, the Company repurchased a total of 798,870 ADSs on the NYSE (representing 3,994,350 Shares) for an aggregate consideration of US$7,225,692.38 (before expense). As of December 31, 2025, 59,036 ADSs (representing 295,180 Shares) repurchased by the Company during the Reporting Period for cancellation but not yet cancelled. Since December 31, 2025 and up to the date of this announcement, the Company has further repurchased certain ADSs for cancellation, which have yet to be cancelled, and intends to cancel such ADSs on a periodic basis. On November 21, 2025 (Hong Kong Time), the Company cancelled 6,762,680 Shares it held in treasury after evaluating the then market conditions as well as the Company’s capital management plan. The Company did not hold any treasury shares as of December 31, 2025. Particulars of the repurchases made by the Company during the Reporting Period are as follows:
NYSE
| Month in 2025 (U.S. Eastern Time) |
No. of ADS repurchased |
No. of Shares equivalent to the ADS |
Highest price Paid (per ADS) |
Lowest price Paid (per ADS) |
Aggregate consideration Paid (before expense) |
|||||||||||||||
| (US$) | (US$) | (US$) | ||||||||||||||||||
| March 2025 | 7,122 | 35,610 | 9.50 | 9.47 | 67,644.04 | |||||||||||||||
| April 2025 | 620,407 | 3,102,035 | 9.49 | 7.80 | 5,509,111.04 | |||||||||||||||
| May 2025 | 112,305 | 561,525 | 9.49 | 9.31 | 1,062,308.29 | |||||||||||||||
| December 2025 | 59,036 | 295,180 | 9.99 | 9.64 | 586,629.01 | |||||||||||||||
| Total | 798,870 | 3,994,350 | 7,225,692.38 | |||||||||||||||||
Save as disclosed above, neither the Company nor any of its subsidiaries purchased, sold, or redeemed any of the Company’s securities listed on the Hong Kong Stock Exchange or any other stock exchanges (including sale of treasury shares (as defined in the Hong Kong Listing Rules)) during the Reporting Period.
Use of Proceeds from the Global Offering
The net proceeds received by the Company from the Global Offering (as defined in the Prospectus) were approximately HK$315.6 million. There has been no change in the intended use of net proceeds as previously disclosed in the Prospectus. As of December 31, 2025, the Company had utilized all net proceeds in accordance with such intended purposes as disclosed in the Prospectus, illustrating by table below.
| Utilized | ||||||||||||||||||||||||||||
| Utilized | amount for | Utilized | Unutilized | Expected | ||||||||||||||||||||||||
| amount as of | the year ended | amount as of | amount as of | time frame | ||||||||||||||||||||||||
| % of use of | Net | January 1, | December 31, | December 31, | December 31, | for unutilized | ||||||||||||||||||||||
| Purpose | proceeds | proceeds | 2025 | 2025 | 2025 | 2025 | amount | |||||||||||||||||||||
| (HK$ million) | (HK$ million) | (HK$ million) | (HK$ million) | (HK$ million) | ||||||||||||||||||||||||
| Fund the further development of our wealth management business | 35 | % | 110.5 | 110.5 | – | 110.5 | – | – | ||||||||||||||||||||
| Fund the further development our asset management business | 15 | % | 47.3 | 47.3 | – | 47.3 | – | – | ||||||||||||||||||||
| Fund the selective pursuit of potential investments | 20 | % | 63.1 | 10.4 | 52.7 | 63.1 | – | – | ||||||||||||||||||||
| Fund the investment in our in-house technology across all business lines | 10 | % | 31.6 | 31.6 | – | 31.6 | – | – | ||||||||||||||||||||
| Fund our overseas expansion | 10 | % | 31.6 | 31.6 | – | 31.6 | – | – | ||||||||||||||||||||
| General corporate purposes (including but not limited to working capital and operating expenses) | 10 | % | 31.6 | 31.6 | – | 31.6 | – | – | ||||||||||||||||||||
| Total(1) | 100 | % | 315.6 | 263.0 | 52.7 | 315.6 | – | – | ||||||||||||||||||||
Note:
| (1) | The sum of the data may not add up to the total due to rounding. |
As of December 31, 2025, all the net proceeds from the Global Offering has been fully utilized.
Differences Between U.S. GAAP and IFRS
The consolidated financial statements for the year ended December 31, 2025 are prepared by the Directors of the Company under U.S. GAAP, which is different from IFRS. A reconciliation statement setting out the financial effect of any material differences between the financial statements prepared under U.S. GAAP and financial statements prepared using IFRS will be included in the annual report of the Company.
Material Litigation
As of December 31, 2025, 42 legal proceedings (including arbitration proceedings) against Shanghai Gopher and/or its affiliates in connection with the Camsing Incident with an aggregate claimed investment amount over RMB138.1 million were still pending.
As of the date of this announcement, 23 legal proceedings (including arbitration proceedings) against Shanghai Gopher and/or its affiliates in connection with the Camsing Incident with an aggregate claimed investment amount over RMB87.4 million were still pending. Based on the Group’s PRC legal adviser’s advice, the management of the Group has assessed the Group was unable to reasonably predict the timing or outcomes of, or estimate the amount of loss, or range of loss, if any, related to the pending legal proceedings (including arbitration proceedings).
Bozhou Lawsuits
In December 2022, the Group received a civil judgment from the Bozhou Intermediate People’s Court of Anhui Province (the “First Instance Court”). The judgment was related to a civil lawsuit brought by an external institution (the “Plaintiff”) against Noah (Shanghai) Financial Leasing Co., Ltd. (currently known as Shanghai Ziyan Car Leasing Service Co., Ltd.) (the “Defendant”), a subsidiary of the Company. The First Instance Court issued the judgment awarding the Plaintiff monetary damages of RMB99.0 million and corresponding interests (the “First-instance Judgment”). For further details, please refer to the Company’s announcement dated December 12, 2022.
In late March 2024, the Group received the civil judgment on appeal (the “Appellate Judgment”) from the High People’s Court of Anhui Province, affirming the First-instance Judgment. The Appellate Judgment took immediate effect, pursuant to which the Defendant shall make a payment to the Plaintiff within ten days from the date the Appellate Judgment became effective. Based on advice from the Company’s PRC counsel to this civil lawsuit, the Company believed that the claim of the Plaintiff is without merit and is unfounded, and therefore subsequently applied for a retrial (the “Retrial Petition”) to the Supreme People’s Court of the PRC (the “PRC Supreme Court”) with respect to the ruling in the Appellate Judgment.
In early January 2025, the Company received the civil judgment on the retrial (the “Retrial Judgement”) from the PRC Supreme Court, which partially upheld the Company’s Retrial Petition finding errors in the application of law in the original judgments, and accordingly revoked the First-instance Judgment and Appellate Judgment. Pursuant to the Retrial Judgement, the Company shall be held liable for 70% of the compensation of RMB99.0 million along with the corresponding interest losses. As the Group had previously reserved a contingent liability of RMB99.0 million in accordance with the First-instance Judgment prior to the issuance of the Appellate Judgment and the Retrial Judgement, the ruling in the Retrial Judgement is not expected to materially affect the Group’s overall financial position in comparison to its financial position prior to the issuance of the Retrial Judgement.
Arbitration Proceedings
In December 2025, Shanghai Gopher received a number of arbitration awards issued by the Shanghai International Economic and Trade Arbitration Commission (Shanghai International Arbitration Center) (the “SHIAC”) in respect of aforementioned legal proceedings, involving a total of 72 independent cases with an aggregate disputed amount of approximately RMB138.1 million. Pursuant to the arbitration awards, Shanghai Gopher was ordered to compensate the relevant investors for 70% of their principal investments, while claims for interest or investment returns were not supported. The arbitration awards and the related pending arbitration proceedings relate solely to Shanghai Gopher, which is a lawfully established and independently operated historical business entity, with independent accounting and independent civil liabilities.
Subsequent to December 31, 2025 and up to the date of this announcement, three additional arbitration cases have been initiated against Shanghai Gopher and/or its affiliates in connection with the Camsing Incident, involving an additional disputed amount of approximately RMB12.4 million. As of the date of this announcement, SHIAC had issued similar arbitration awards in respect of 94 independent cases in total, with an aggregate disputed amount of approximately RMB299.8 million.
Save as disclosed above, we were not a party to, and we were not aware of any judicial, arbitration or administrative proceedings that were pending or threatened against our Group during the Reporting Period, that, in the opinion of our Directors, were likely to have a material and adverse effect on our business, financial condition or results of operations. We may from time to time be involved in litigation and claims incidental to the conduct of our business.
Settlement under the Settlement Plans
Reference is made to the 2024 annual report of the Company in relation to the settlement plans (the “Settlement Plans”) regarding the Camsing Incident (as defined therein). The Settlement Plans include: (i) two RSU vesting plans (Plan A and Plan B) for the affected clients to choose from offered by the Company prior to the Listing Date (collectively, the “Previous Settlement Plan”), the offers under which was accepted by 595 out of 818 affected clients as of the Listing Date; and (ii) new settlement plan (the “New Settlement Plan”) offered by the Company in 2024 so as to continue settling with the remaining 223 out of 818 affected clients (the “Remaining Affected Clients”), the offer under which was accepted by eight out of the Remaining Affected Clients as of December 31, 2025. The Company shall issue relevant Shares upon vesting of RSUs to the affected clients subject to the settlement pursuant to the issuance mandate granted, renewed or refreshed by the Shareholders at the annual general meeting(s) from time to time. During the Reporting Period, one out of the Remaining Affected Clients had accepted the offer pursuant to the New Settlement Plan.
During the Reporting Period1, (i) 371,512 RSUs involving 3,715,120 Shares (represented by 743,024 ADSs) have vested under the Previous Settlement Plan, and (ii) 7,835 RSUs involving 78,350 Shares (represented by 15,670 ADSs) have vested under the New Settlement Plan.
As of December 31, 2025, 3,770,377 RSUs involving 37,703,770 Shares (represented by 7,540,754 ADSs) have been granted by the affected clients who accepted the offers under the Settlement Plans, among which 2,232,996 RSUs involving 22,329,957 Shares (represented by 4,465,995 ADSs) have vested and 1,537,381 RSUs involving 15,373,813 Shares (represented by 3,074,759 ADSs) were outstanding and yet to vest.
Since December 31, 2025 and up to the date of this announcement, no additional RSUs have vested under the Settlement Plans, and no additional affected clients have accepted the offer under the New Settlement Plan.
Events After the Reporting Period
There were no significant events that might materially affect the Group after December 31, 2025 and immediately before the date of this announcement.
Dividend
The Board has approved and adopted a dividend policy (the “Dividend Policy”) on August 10, 2022, which aims to provide stable and sustainable returns to the Shareholders. The Dividend Policy has become effective from August 10, 2022 and was amended on November 30, 2023. According to the amended Dividend Policy, in normal circumstances, the annual dividends to be declared and distributed in each calendar year shall be, in principle, no less than 35% of the Group’s non-GAAP net income attributable to the Shareholders of the preceding financial year as reported in the Company’s unaudited annual results announcement, subject to various factors. The dividend under the Dividend Policy proposed and/or declared by the Board for a financial year are deemed as final dividend. Any final dividend for a financial year will be subject to Shareholders’ approval. The Company may declare and pay dividends by way of cash or by other means that the Board considers appropriate. Such dividend policy shall in no way constitute a legally binding commitment by the Company in respect of its future dividend and/or in no way obligate the Company to declare a dividend at any time or from time to time. There can be no assurance that dividends will be paid in any particular amount for any given year. In addition, our shareholders by ordinary resolution may declare a dividend, but no dividend may exceed the amount recommended by our Board. Under Cayman Islands law, a Cayman Islands company may pay a dividend on its shares out of either profit or share premium amount, provided that in no circumstances may a dividend be paid if this would result in the company being unable to pay its debts as they fall due in the ordinary course of business. Even if our Board decides to pay dividends, the form, frequency and amount will depend upon our future operations and earnings, capital requirements and surplus, general financial condition, contractual restrictions and other factors that the Board may deem relevant.
The Directors recommended (i) final dividend of RMB306.0 million (approximately US$43.8 million) in aggregate in respect of the year ended December 31, 2025, which will be paid out of the corporate actions budget equivalent to 50% of the non-GAAP net income attributable to Shareholders during the Reporting Period in accordance with the capital management and shareholder return policy of the Company adopted on November 29, 2023; and (ii) special dividend of RMB306.0 million (approximately US$43.8 million) in aggregate, which will be paid out of the accumulated return surplus cash from the years prior to 2025, to Shareholders whose names appear on the register of members of the Company as of the record date for dividend distribution.
Based on the number of issued Shares of the Company (excluding 7,422,860 Shares underlying 1,484,572 ADSs repurchased by the Company as of March 24, 2026 (Hong Kong Time) for cancellation but not yet cancelled) as of the date of this announcement, if declared and paid, (i) a final dividend of RMB0.933 (equivalent to approximately US$0.133 per Share (tax inclusive1) in respect of the year ended December 31, 2025, and (ii) a non-recurring special dividend of RMB0.933 (equivalent to approximately US$0.133) per Share (tax inclusive1); will be paid out to Shareholders who are entitled to dividends, both subject to adjustment to the number of issued Shares of the Company (excluding the treasury shares (if any) and Shares underlying ADSs repurchased by the Company for cancellation but not yet cancelled) entitled to dividend distribution as of the record date for dividend distribution, and the equivalent U.S. dollars amount and Hong Kong dollars amount are also subject to exchange rate adjustment. As of the date of this announcement, the Company did not hold any treasury shares.
Recommendations on the final dividend and special dividend are subject to respective approval by the Shareholders at the forthcoming annual general meeting to be held on or around June 11, 2026. If the proposed final dividend and special dividend are approved by the Shareholders, the Company expects to pay such dividend by August 2026. For details, please refer to the circular of the annual general meeting to be dispatched to the Shareholders and the announcement(s) to be made by the Company in due course.
| 1 | Tax referred to in this announcement in relation to the final dividend and special dividend means any tax that may be applicable to the Shareholder and ADS holders, whereas there is no applicable withholding tax applied to the final dividend and special dividend. |
CONDENSED CONSOLIDATED STATEMENTS OF OPERATIONS
(Amount in Thousands, Except Share and Per Share Data)
| Year Ended December 31, | ||||||||||||||||
| Notes | 2024 | 2025 | 2025 | |||||||||||||
| RMB | RMB | US$ | ||||||||||||||
| (Audited) | (Unaudited) | (Unaudited) | ||||||||||||||
| Revenues: | ||||||||||||||||
| Revenues from others | ||||||||||||||||
| One-time commissions | 614,258 | 574,255 | 82,117 | |||||||||||||
| Recurring service fees | 631,505 | 624,589 | 89,315 | |||||||||||||
| Performance-based income | 47,841 | 116,247 | 16,623 | |||||||||||||
| Other service fees | 186,108 | 161,299 | 23,065 | |||||||||||||
| Total revenues from others | 1,479,712 | 1,476,390 | 211,120 | |||||||||||||
| Revenues from funds | ||||||||||||||||
| Gopher/Olive1 manages | ||||||||||||||||
| One-time commissions | 21,288 | 7,284 | 1,042 | |||||||||||||
| Recurring service fees | 1,015,436 | 990,515 | 141,642 | |||||||||||||
| Performance-based income | 104,898 | 155,598 | 22,250 | |||||||||||||
| Total revenues from funds | ||||||||||||||||
| Gopher/Olive1 manages | 1,141,622 | 1,153,397 | 164,934 | |||||||||||||
| Total revenues | 3 | 2,621,334 | 2,629,787 | 376,054 | ||||||||||||
| Less: VAT related surcharges and other taxes | (20,352 | ) | (19,547 | ) | (2,795 | ) | ||||||||||
| Net revenues | 2,600,982 | 2,610,240 | 373,259 | |||||||||||||
| Operating cost and expenses: | ||||||||||||||||
| Compensation and benefits | ||||||||||||||||
| Relationship manager compensation | (562,523 | ) | (498,454 | ) | (71,278 | ) | ||||||||||
| Other compensations | (786,928 | ) | (718,098 | ) | (102,687 | ) | ||||||||||
| Total compensation and benefits | (1,349,451 | ) | (1,216,552 | ) | (173,965 | ) | ||||||||||
| Selling expenses | (269,038 | ) | (242,808 | ) | (34,721 | ) | ||||||||||
| General and administrative expenses | (296,751 | ) | (305,590 | ) | (43,699 | ) | ||||||||||
| Provision for credit losses | (23,882 | ) | (52,226 | ) | (7,468 | ) | ||||||||||
| Other operating expenses, net | (93,210 | ) | (62,872 | ) | (8,991 | ) | ||||||||||
| Government subsidies | 65,239 | 46,472 | 6,645 | |||||||||||||
| Total operating cost and expenses | (1,967,093 | ) | (1,833,576 | ) | (262,199 | ) | ||||||||||
| Income from operations | 633,889 | 776,664 | 111,060 | |||||||||||||
| 1 | The calculation of the number of vested RSUs under each of the Settlement Plans is based on the U.S. Eastern Time. |
| Year Ended December 31, | ||||||||||||||||
| Notes | 2024 | 2025 | 2025 | |||||||||||||
| RMB | RMB | US$ | ||||||||||||||
| (Audited) | (Unaudited) | (Unaudited) | ||||||||||||||
| Other income: | ||||||||||||||||
| Interest income | 155,751 | 127,547 | 18,239 | |||||||||||||
| Investment income | 50,152 | 32,254 | 4,612 | |||||||||||||
| Reversal of settlement expenses | 7 | 12,454 | 956 | 137 | ||||||||||||
| Contingent litigation expenses | 8 | 14,000 | (50,182 | ) | (7,176 | ) | ||||||||||
| Other income (loss) | 1,359 | (30,814 | ) | (4,406 | ) | |||||||||||
| Total other income | 233,716 | 79,761 | 11,406 | |||||||||||||
| Income before taxes and income from equity in affiliates | 867,605 | 856,425 | 122,466 | |||||||||||||
| Income tax expense | 4 | (268,591 | ) | (297,811 | ) | (42,586 | ) | |||||||||
| Loss from equity in affiliates | (112,010 | ) | (1,395 | ) | (199 | ) | ||||||||||
| Net income | 487,004 | 557,219 | 79,681 | |||||||||||||
| Less: net income (loss) attributable to non- controlling interests | 11,559 | (1,638 | ) | (234 | ) | |||||||||||
| Net income attributable to Noah Holdings Private Wealth And Asset Management Limited shareholders | 475,445 | 558,857 | 79,915 | |||||||||||||
| Net income per share: | 5 | |||||||||||||||
| Basic | 1.36 | 1.60 | 0.23 | |||||||||||||
| Diluted | 1.35 | 1.59 | 0.23 | |||||||||||||
| Weighted average number of shares used in | ||||||||||||||||
| computation: | ||||||||||||||||
| Basic | 350,847,647 | 348,774,922 | 348,774,922 | |||||||||||||
| Diluted | 352,351,257 | 351,962,638 | 351,962,638 | |||||||||||||
| Note 1: | Gopher/Olive refers to the Group’s subsidiaries and consolidated variable interest entities (“VIEs”) under the brands Gopher Asset Management and Olive Asset Management, through which the Group manages investments with underlying assets to better meet the diversified asset allocation and alternative investment demands of high net worth individuals and/or corporate entities. |
The accompanying notes are an integral part of these unaudited condensed consolidated financial statements.
CONDENSED CONSOLIDATED STATEMENTS OF COMPREHENSIVE INCOME
(Amount in Thousands)
| Year Ended December 31, | ||||||||||||
| 2024 | 2025 | 2025 | ||||||||||
| RMB | RMB | US$ | ||||||||||
| (Audited) | (Unaudited) | (Unaudited) | ||||||||||
| Net income | 487,004 | 557,219 | 79,681 | |||||||||
| Other comprehensive income, net of tax Foreign currency translation adjustments | 112,131 | (145,751 | ) | (20,842 | ) | |||||||
| Fair value fluctuation of available-for-sale investment | – | 945 | 135 | |||||||||
| Comprehensive income | 599,135 | 412,413 | 58,974 | |||||||||
| Less: comprehensive income (loss) attributable to non-controlling interests | 11,758 | (1,647 | ) | (236 | ) | |||||||
| Comprehensive income attributable to Noah Holdings Private Wealth and Asset Management Limited shareholders | 587,377 | 414,060 | 59,210 | |||||||||
The accompanying note is an integral part of these unaudited condensed consolidated financial statements.
CONDENSED CONSOLIDATED BALANCE SHEETS
(Amount in Thousands, Except Share and Per Share Data)
| As of December 31, | ||||||||||||||||
| Notes | 2024 | 2025 | 2025 | |||||||||||||
| RMB | RMB | US$ | ||||||||||||||
| (Audited) | (Unaudited) | (Unaudited) | ||||||||||||||
| Assets | ||||||||||||||||
| Current assets: | ||||||||||||||||
| Cash and cash equivalents | 3,822,339 | 4,360,918 | 623,603 | |||||||||||||
| Restricted cash | 8,696 | 11,143 | 1,593 | |||||||||||||
| Short-term investments | 1,274,609 | 657,563 | 94,030 | |||||||||||||
| Accounts receivable, net | 6 | 473,490 | 420,132 | 60,078 | ||||||||||||
| Amounts due from related parties, net | 499,524 | 596,800 | 85,341 | |||||||||||||
| Loans receivable, net | 169,108 | 112,416 | 16,075 | |||||||||||||
| Other current assets | 226,965 | 201,573 | 28,827 | |||||||||||||
| Total current assets | 6,474,731 | 6,360,545 | 909,547 | |||||||||||||
| Long-term investments | 971,099 | 1,172,012 | 167,595 | |||||||||||||
| Investment in affiliates | 1,373,156 | 1,326,131 | 189,634 | |||||||||||||
| Property and equipment, net | 2,382,247 | 2,356,440 | 336,966 | |||||||||||||
| Operating lease right-of-use assets, net | 121,115 | 103,027 | 14,733 | |||||||||||||
| Deferred tax assets | 319,206 | 310,287 | 44,370 | |||||||||||||
| Other non-current assets | 137,291 | 112,492 | 16,086 | |||||||||||||
| Total Assets | 11,778,845 | 11,740,934 | 1,678,931 | |||||||||||||
| Liabilities and Equity | ||||||||||||||||
| Current liabilities: | ||||||||||||||||
| Accrued payroll and welfare expenses | 412,730 | 407,558 | 58,280 | |||||||||||||
| Income tax payable | 63,892 | 147,510 | 21,094 | |||||||||||||
| Deferred revenues | 72,259 | 54,398 | 7,779 | |||||||||||||
| Other current liabilities | 404,288 | 312,240 | 44,650 | |||||||||||||
| Contingent liabilities | 8 | 476,107 | 505,496 | 72,285 | ||||||||||||
| Total current liabilities | 1,429,276 | 1,427,202 | 204,088 | |||||||||||||
| Deferred tax liabilities | 246,093 | 263,608 | 37,695 | |||||||||||||
| Operating lease liabilities, non-current | 75,725 | 60,344 | 8,629 | |||||||||||||
| Other non-current liabilities | 15,011 | 6,820 | 975 | |||||||||||||
| Total Liabilities | 1,766,105 | 1,757,974 | 251,387 | |||||||||||||
| As of December 31, | |||||||||||||||
| Notes | 2024 | 2025 | 2025 | ||||||||||||
| RMB | RMB | US$ | |||||||||||||
| (Audited) | (Unaudited) | (Unaudited) | |||||||||||||
| Contingencies | 8 | ||||||||||||||
| Shareholders’ equity: | |||||||||||||||
| Ordinary shares (US$0.00005 par value): 1,000,000,000 ordinary shares authorized, 335,153,359 shares issued and 330,393,534 shares outstanding as of December 31, 2024 and 1,000,000,000 ordinary shares authorized, 335,258,287 shares issued and 333,370,340 shares outstanding as of December 31, 2025 | 113 | 113 | 16 | ||||||||||||
| Treasury stock | (53,345 | ) | (4,102 | ) | (587 | ) | |||||||||
| Additional paid-in capital | 3,907,992 | 3,973,997 | 568,274 | ||||||||||||
| Retained earnings | 5,904,540 | 5,815,092 | 831,547 | ||||||||||||
| Accumulated other comprehensive loss | 186,548 | 41,751 | 5,970 | ||||||||||||
| Total Noah Holdings Private Wealth and Asset Management Limited shareholders’ equity | 9,945,848 | 9,826,851 | 1,405,220 | ||||||||||||
| Non-controlling interests | 66,892 | 156,109 | 22,324 | ||||||||||||
| Total Shareholders’ Equity | 10,012,740 | 9,982,960 | 1,427,544 | ||||||||||||
| Total Liabilities and Equity | 11,778,845 | 11,740,934 | 1,678,931 | ||||||||||||
The accompanying notes are an integral part of these unaudited condensed consolidated financial statements.
NOTES TO THE UNAUDITED CONDENSED CONSOLIDATED FINANCIAL STATEMENTS
| 1. | Organization and Principal Activities |
Noah Holdings Private Wealth and Asset Management Limited (the “Company”), its subsidiaries and consolidated variable interest entities (“VIEs”) (together, the “Group”), is a leading and pioneer wealth management service provider in the People’s Republic of China (“PRC”) offering comprehensive one-stop advisory services on global investment and asset allocation primarily for high net wealth (“HNW”) investors. The Group began offering services in 2005 through Shanghai Noah Investment Management Co., Ltd. (“Noah Investment”), a consolidated VIE, founded in the PRC in August 2005.
| 2. | Summary of Principal Accounting Policies |
| (a) | Basis of Preparation |
The accompanying unaudited condensed consolidated financial statements of the Group have been prepared in accordance with accounting principles generally accepted in the United States of America (“U.S. GAAP”). In addition, these unaudited condensed consolidated financial statements include applicable disclosures required by the Rules Governing the Listing of Securities on The Stock Exchange of Hong Kong Limited (“Listing Rules”) and by the Hong Kong Companies Ordinance.
| (b) | Use of Estimates |
The preparation of financial statements in conformity with U.S. GAAP requires management to make estimates and assumptions that affect the reported amounts of assets and liabilities and the disclosures of contingent assets and liabilities at the date of the financial statements and the reported amounts of revenue and expense during the reporting period. Actual results could differ materially from such estimates. Significant accounting estimates reflected in the Group’s unaudited condensed consolidated financial statements include assumptions used to determine valuation allowance for deferred tax assets, allowance for credit losses, fair value measurement of underlying investment portfolios of the funds that the Group invests, fair value of Level 3 investments, assumptions related to the consolidation of entities in which the Group holds variable interests and loss contingencies.
| (c) | Foreign Currency Translation |
The Company’s reporting currency is Renminbi (“RMB”). The Company’s functional currency is the United States dollar (“U.S. dollar or US$”). The Company’s operations are principally conducted through the subsidiaries and VIEs located in the PRC where RMB is the functional currency. For those subsidiaries and VIEs which are not located in the PRC and have the functional currency other than RMB, the financial statements are translated from their respective functional currencies into RMB.
Assets and liabilities of the Group’s overseas entities denominated in currencies other than the RMB are translated into RMB at the rates of exchange ruling at the balance sheet date. Equity accounts are translated at historical exchange rates and revenues, expenses, gains and losses are translated using the average rate for the period. Translation adjustments are reported as foreign currency translation adjustment and are shown as a separate component of other comprehensive income in the condensed consolidated statements of comprehensive income.
Translations of amounts from RMB into US$ are included solely for the convenience of the readers and have been made at the rate of US$1 = RMB6.9931 on December 31, 2025, representing the certificated exchange rate published by the Federal Reserve Board. No representation is intended to imply that the RMB amounts could have been, or could be, converted, realized or settled into US$ at that rate, or at any other rate.
| 3. | Revenues |
The Group derives revenue primarily from one-time commissions, recurring service fees and performance-based income paid by clients or investment product providers. The disaggregation of revenues by service lines have been presented in the consolidated statements of operations.
Revenues by timing of recognition is analyzed as follows:
| Year Ended December 31, | ||||||||
| (Amount in Thousands) | ||||||||
| 2024 | 2025 | |||||||
| RMB | RMB | |||||||
| (Audited) | (Unaudited) | |||||||
| Revenue recognized at a point in time | 904,274 | 938,930 | ||||||
| Revenue recognized over time | 1,717,060 | 1,690,857 | ||||||
| Total revenues | 2,621,334 | 2,629,787 | ||||||
For the Group’s revenues generated from different geographic locations, please see Note 9 segment information.
| 4. | Income Taxes |
Cayman Islands
Under the current laws of the Cayman Islands, the Company is not subject to tax on its income or capital gains. In addition, the Cayman Islands do not impose withholding tax on dividend payments.
Hong Kong
Under the current Hong Kong Inland Revenue Ordinance, the first HK$2 million of profits earned by the Company’s subsidiaries incorporated in Hong Kong will be taxed at half the current tax rate (i.e. 8.25%) while the remaining profits will continue to be taxed at the existing 16.5% tax rate. The profits of group entities incorporated in Hong Kong not qualifying for the two-tiered profits tax rates regime will continue to be taxed at a flat rate of 16.5%. In addition, payments of dividends from Hong Kong subsidiaries to their shareholders are not subject to any Hong Kong withholding tax.
PRC
Under the Law of the People’s Republic of China on Enterprise Income Tax (“EIT Law”), domestically-owned enterprises and foreign-invested enterprises (“FIEs”) are subject to a uniform tax rate of 25%. Shanghai Nuorong Information Technology Co., Ltd., a subsidiary of the Company, obtained the approval for preferential income tax rate of 15% due to High and New Technology Enterprise in November 2022 and such preferential income tax rate has expired in November 2025.
Income before income taxes consists of:
| Year Ended December 31, | ||||||||
| (Amount in Thousands) | ||||||||
| 2024 | 2025 | |||||||
| RMB | RMB | |||||||
| (Audited) | (Unaudited) | |||||||
| Mainland China | 493,222 | 262,453 | ||||||
| Hong Kong | 237,512 | 326,646 | ||||||
| Cayman Islands | 13,409 | 155,896 | ||||||
| Others | 123,462 | 111,430 | ||||||
| Total | 867,605 | 856,425 | ||||||
The income tax expense comprises:
| Year Ended December 31, | ||||||||
| (Amount in Thousands) | ||||||||
| 2024 | 2025 | |||||||
| RMB | RMB | |||||||
| (Audited) | (Unaudited) | |||||||
| Current Tax | 177,872 | 271,069 | ||||||
| Deferred Tax | 90,719 | 26,742 | ||||||
| Total | 268,591 | 297,811 | ||||||
| Effective income tax rate | 30.96 | % | 34.77 | % | ||||
| 5. | Net Income Per Share |
The following table sets forth the computation of basic and diluted net income per share attributable to ordinary shareholders:
| Year Ended December 31, | ||||||||
| (Amount in Thousands, Except | ||||||||
| Share and Per Share Data) | ||||||||
| 2024 | 2025 | |||||||
| (Audited) | (Unaudited) | |||||||
| Net income attributable to ordinary shareholders – basic and diluted | 475,445 | 558,857 | ||||||
| Weighted average number of ordinary shares outstanding – basic | 350,847,647 | 348,774,922 | ||||||
| Plus: effect of dilutive non-vested restricted shares awards | 1,503,610 | 3,187,716 | ||||||
| Weighted average number of ordinary shares outstanding – diluted | 352,351,257 | 351,962,638 | ||||||
| Basic net income per share | 1.36 | 1.60 | ||||||
| Diluted net income per share | 1.35 | 1.59 | ||||||
Shares issuable to the investors of Camsing Incident (as defined in Note 7) are included in the computation of basic earnings per share as the shares will be issued for no cash consideration and all necessary conditions have been satisfied upon the settlement.
Diluted net income per share does not include the following instruments as their inclusion would be antidilutive:
| Year Ended December 31, | ||||||||
| 2024 | 2025 | |||||||
| (Audited) | (Unaudited) | |||||||
| Share options | 329,606 | – | ||||||
| Non-vested restricted shares awards under share incentive plan | 374,957 | 520,235 | ||||||
| Total | 704,563 | 520,235 | ||||||
| 6. | Accounts Receivables, net |
Accounts receivable consisted of the following:
| As of December 31, | ||||||||
| (Amount in Thousands) | ||||||||
| 2024 | 2025 | |||||||
| RMB | RMB | |||||||
| (Audited) | (Unaudited) | |||||||
| Accounts receivable, gross | 490,689 | 432,142 | ||||||
| Allowance for credit losses | (17,199 | ) | (12,010 | ) | ||||
| Accounts receivable, net | 473,490 | 420,132 | ||||||
An aging analysis of accounts receivable, based on invoice date, is as follows:
| As of December 31, | ||||||||
| (Amount in Thousands) | ||||||||
| 2024 | 2025 | |||||||
| RMB | RMB | |||||||
| (Audited) | (Unaudited) | |||||||
| Within 1 year | 441,070 | 391,280 | ||||||
| 1-2 years | 23,166 | 14,342 | ||||||
| 2-3 years | 6,412 | 6,870 | ||||||
| 3-4 years | 5,774 | 4,061 | ||||||
| Over 4 years | 14,267 | 15,589 | ||||||
| Accounts receivable, gross | 490,689 | 432,142 | ||||||
| 7. | Settlement for Camsing Incident |
In July 2019, in connection with certain funds managed (“Camsing Credit Funds” or “Camsing Products”) by Shanghai Ziming Private Fund Management Co., Ltd. (“Shanghai Gopher”), formerly known as Shanghai Gopher Asset Management Co., Ltd., a consolidated affiliated subsidiary of the Company, it is suspected that fraud had been committed by third parties related to the underlying investments (the “Camsing Incident”). A total of 818 investors were affected, and the outstanding amount of the investments that is potentially subject to repayment upon default amounted to RMB3.4 billion.
Settlement Plan
To preserve the Group’s goodwill with affected investors, it voluntarily made an exgratia settlement offer (the “Settlement Plan”) to affected investors. An affected client accepting the offer shall receive RSUs, which upon vesting will become ordinary shares of the Company, and in return forgo all outstanding legal rights associated with the investment in the Camsing Credit Funds and irrevocably release the Company and all its affiliated entities and individuals from any and all claims immediately, known or unknown, that relate to the Camsing Credit Funds.
On August 24, 2020, the Settlement Plan was approved by the Board of Directors of the Company that a total number of new Class A ordinary shares not exceeding 1.6% of the share capital of the Company has been authorized to be issued each year for a consecutive ten years for the Settlement Plan.
The Group evaluated and concluded the financial instruments to be issued under the Settlement Plan meet equity classification under ASC 815-40-25-10. Therefore, such instruments were initially measured at fair value and recognized as part of additional-paid-in-capital.
As of December 31, 2020, the Group had no new settlement plan for the remaining unsettled investors, but would not preclude to reaching settlements in the future with similar terms and therefore estimated the probable amount of future settlement taking into consideration of possible forms of settlement and estimated acceptable level, and had recorded it as a contingent liability of US$81.3 million (RMB530.4 million).
During the years ended December 31, 2024 and 2025, the Group remained open to settling with the affected clients, and voluntarily reoffered the Settlement Plan to the remaining unsettled investors with terms substantially unchanged. For the years ended December 31, 2024 and 2025, additional 7 and 1 investors accepted the Settlement Plan, respectively, and the Company recorded reversal of settlement expenses in the amount of RMB12,454 and RMB956 based on the difference between the fair value of the RSUs to be issued at each settlement date and the corresponding contingent liability accrued for these investors.
As of December 31, 2025, 603 out of the total 818 investors (approximately 73.7%) had accepted settlements under the plan, representing RMB2.6 billion (approximately 76.5%) out of the total outstanding investments of RMB3.4 billion under the Camsing Products.
| 8. | Contingencies |
Camsing Incident
In December 2025, Shanghai Gopher received a number of arbitration awards issued by the Shanghai International Economic and Trade Arbitration Commission in respect of aforementioned legal proceedings, involving a total of 72 independent cases with an aggregate disputed amount of approximately RMB236.7 million. Pursuant to the arbitration awards, Shanghai Gopher was ordered to compensate the relevant investors for 70% of their principal investments, while claims for interest or investment returns were not supported. The arbitration awards and the related pending arbitration proceedings relate solely to Shanghai Gopher, which is a lawfully established and independently operated historical business entity, with independent accounting and independent civil liabilities.
As of December 31, 2025, 42 legal proceedings against Shanghai Gopher and/or its affiliates, with an aggregate claimed investment amount over RMB138.1 million were still pending.
Starting from December 2025 and up to the date of this announcement, arbitration awards of same nature were issued by the Shanghai International Economic and Trade Arbitration Commission in respect of 94 independent cases in total with an aggregate disputed amount of approximately RMB299.8 million.
As of the date of this announcement, 23 legal proceedings against Shanghai Gopher and/or its affiliates in connection with the Camsing Incident with an aggregate claimed investment amount over RMB87.4 million were still pending, including 3 new cases initiated subsequent to December 31, 2025. The Group recognized an additional contingent litigation expense of RMB50.2 million based on the difference between (i) the actual compensation amounts ordered under the arbitration awards and (ii) the contingent liabilities previously recorded in respect of the relevant investors who had initiated legal proceedings against Shanghai Gopher and/ or its affiliates as of December 31, 2025. As a result, the remaining balance of the contingent liability was RMB505.5 million as of December 31, 2025.
Others
The Group is subject to periodic legal or administrative proceedings in the ordinary course of business. Other than those related to the Camsing Incident and the litigation mentioned above, the Group does not have any pending legal or administrative proceedings to which the Group is a party that will have a material effect on its business or financial condition.
| 9. | Segment Information |
The Group uses the management approach to determine operating segments. The management approach considers the internal organization and reporting used by the Group’s chief operating decision maker (“CODM”) for making decisions, allocating resources and assessing performance.
The Group operates in a set of segmentation, including six reportable segments and headquarters. The Group’s CODM has been identified as the chief executive officer, who reviews income (loss) from operations as segment profit/loss measurement to make decisions about allocating resources and assessing performance of the Group. Further, the Group’s CODM reviews and utilizes functional expenses or income, including compensation and benefits, selling expenses, general and administrative expenses, other operating expenses, provision for credit losses and government subsidies to manage the segments’ operations. The Group’s CODM does not review balance sheet information of the segments.
Segment information of the Group’s business is as follows:
| Year Ended December 31, 2024 (Amount in Thousands) | ||||||||||||||||||||||||||||||||
| Overseas | ||||||||||||||||||||||||||||||||
| Domestic | Domestic | Overseas | Overseas | insurance and | ||||||||||||||||||||||||||||
| public | asset | Domestic | wealth | asset | comprehensive | |||||||||||||||||||||||||||
| securities | management | insurance | management | management | services | Headquarter1 | Total | |||||||||||||||||||||||||
| RMB | RMB | RMB | RMB | RMB | RMB | RMB | RMB | |||||||||||||||||||||||||
| Revenues: | ||||||||||||||||||||||||||||||||
| Revenues from others | ||||||||||||||||||||||||||||||||
| One-time commissions | 18,619 | 1,354 | 43,204 | 435,937 | 14,785 | 100,359 | – | 614,258 | ||||||||||||||||||||||||
| Recurring service fees | 365,992 | 188,545 | – | 22,694 | 52,952 | – | 1,322 | 631,505 | ||||||||||||||||||||||||
| Performance-based income | 38,058 | 4,908 | – | – | 4,875 | – | – | 47,841 | ||||||||||||||||||||||||
| Other service fees | – | – | – | 89,846 | – | 38,507 | 57,755 | 186,108 | ||||||||||||||||||||||||
| Total revenues from others | 422,669 | 194,807 | 43,204 | 548,477 | 72,612 | 138,866 | 59,077 | 1,479,712 | ||||||||||||||||||||||||
| Revenues from funds | ||||||||||||||||||||||||||||||||
| Gopher/Olive manages | ||||||||||||||||||||||||||||||||
| One-time commissions | 13,358 | – | – | 5,551 | 2,379 | – | – | 21,288 | ||||||||||||||||||||||||
| Recurring service fees | 56,441 | 556,742 | – | 120,669 | 281,584 | – | – | 1,015,436 | ||||||||||||||||||||||||
| Performance-based income | 1,301 | 21,659 | – | – | 81,938 | – | – | 104,898 | ||||||||||||||||||||||||
| Total revenues from funds | ||||||||||||||||||||||||||||||||
| Gopher/Olive manages | 71,100 | 578,401 | – | 126,220 | 365,901 | – | – | 1,141,622 | ||||||||||||||||||||||||
| Total revenues | 493,769 | 773,208 | 43,204 | 674,697 | 438,513 | 138,866 | 59,077 | 2,621,334 | ||||||||||||||||||||||||
| Less: VAT related surcharges | (5,017 | ) | (1,101 | ) | (337 | ) | – | – | – | (13,897 | ) | (20,352 | ) | |||||||||||||||||||
| Net revenues | 488,752 | 772,107 | 42,867 | 674,697 | 438,513 | 138,866 | 45,180 | 2,600,982 | ||||||||||||||||||||||||
| Operating costs and expenses: | ||||||||||||||||||||||||||||||||
| Compensation and benefits | ||||||||||||||||||||||||||||||||
| Relationship manager compensation | (128,189 | ) | (71,316 | ) | (53,904 | ) | (294,973 | ) | (3,730 | ) | (10,411 | ) | – | (562,523 | ) | |||||||||||||||||
| Other compensations | (42,730 | ) | (80,182 | ) | (41,280 | ) | (154,506 | ) | (55,104 | ) | (46,253 | ) | (366,873 | ) | (786,928 | ) | ||||||||||||||||
| Total compensation and benefits | (170,919 | ) | (151,498 | ) | (95,184 | ) | (449,479 | ) | (58,834 | ) | (56,664 | ) | (366,873 | ) | (1,349,451 | ) | ||||||||||||||||
| Selling expenses | (8,429 | ) | (10,574 | ) | (5,599 | ) | (106,175 | ) | (22,321 | ) | (12,177 | ) | (103,763 | ) | (269,038 | ) | ||||||||||||||||
| General and administrative expenses | (2,012 | ) | (12,807 | ) | (23,696 | ) | (13,589 | ) | (3,759 | ) | (7,307 | ) | (233,581 | ) | (296,751 | ) | ||||||||||||||||
| Provision for credit losses | (88 | ) | (10,083 | ) | – | – | – | (7,307 | ) | (6,404 | ) | (23,882 | ) | |||||||||||||||||||
| Other operating expenses | (1,771 | ) | (23,829 | ) | (449 | ) | – | – | (9,944 | ) | (57,217 | ) | (93,210 | ) | ||||||||||||||||||
| Government grants | 13,448 | 10,796 | 479 | – | – | – | 40,516 | 65,239 | ||||||||||||||||||||||||
| Total operating costs and expenses | (169,771 | ) | (197,995 | ) | (124,449 | ) | (569,243 | ) | (84,914 | ) | (93,399 | ) | (727,322 | ) | (1,967,093 | ) | ||||||||||||||||
| Income (loss) from operations | 318,981 | 574,112 | (81,582 | ) | 105,454 | 353,599 | 45,467 | (682,142 | ) | 633,889 | ||||||||||||||||||||||
| Year Ended December 31, 2025 (Amount in Thousands) | ||||||||||||||||||||||||||||||||
| Overseas | ||||||||||||||||||||||||||||||||
| Domestic | Domestic | Overseas | Overseas | insurance and | ||||||||||||||||||||||||||||
| public | asset | Domestic | wealth | asset | comprehensive | |||||||||||||||||||||||||||
| securities | management | insurance | management | management | services | Headquarter1 | Total | |||||||||||||||||||||||||
| RMB | RMB | RMB | RMB | RMB | RMB | RMB | RMB | |||||||||||||||||||||||||
| Revenues: | ||||||||||||||||||||||||||||||||
| Revenues from others | ||||||||||||||||||||||||||||||||
| One-time commissions | 53,152 | 1,243 | 18,772 | 320,221 | 30,264 | 150,603 | – | 574,255 | ||||||||||||||||||||||||
| Recurring service fees | 352,345 | 143,040 | – | 38,765 | 90,439 | – | – | 624,589 | ||||||||||||||||||||||||
| Performance-based income | 115,467 | 630 | – | – | 150 | – | – | 116,247 | ||||||||||||||||||||||||
| Other service fees | – | – | – | 65,782 | – | 28,191 | 67,326 | 161,299 | ||||||||||||||||||||||||
| Total revenues from others | 520,964 | 144,913 | 18,772 | 424,768 | 120,853 | 178,794 | 67,326 | 1,476,390 | ||||||||||||||||||||||||
| Revenues from funds | ||||||||||||||||||||||||||||||||
| Gopher/Olive manages | ||||||||||||||||||||||||||||||||
| One-time commissions | 6,682 | 188 | – | 290 | 124 | – | – | 7,284 | ||||||||||||||||||||||||
| Recurring service fees | 40,708 | 541,537 | – | 122,482 | 285,788 | – | – | 990,515 | ||||||||||||||||||||||||
| Performance-based income | 1,923 | 6,505 | – | – | 147,170 | – | – | 155,598 | ||||||||||||||||||||||||
| Total revenues from funds | ||||||||||||||||||||||||||||||||
| Gopher/Olive manages | 49,313 | 548,230 | – | 122,772 | 433,082 | – | – | 1,153,397 | ||||||||||||||||||||||||
| Total revenues | 570,277 | 693,143 | 18,772 | 547,540 | 553,935 | 178,794 | 67,326 | 2,629,787 | ||||||||||||||||||||||||
| Less: VAT related surcharges | (3,788 | ) | (675 | ) | (124 | ) | – | – | – | (14,960 | ) | (19,547 | ) | |||||||||||||||||||
| Net revenues | 566,489 | 692,468 | 18,648 | 547,540 | 553,935 | 178,794 | 52,366 | 2,610,240 | ||||||||||||||||||||||||
| Operating costs and expenses: | ||||||||||||||||||||||||||||||||
| Compensation and benefits | ||||||||||||||||||||||||||||||||
| Relationship manager compensation | (107,156 | ) | (45,299 | ) | (15,462 | ) | (254,769 | ) | (44,221 | ) | (31,547 | ) | – | (498,454 | ) | |||||||||||||||||
| Other compensations | (26,423 | ) | (63,870 | ) | (22,190 | ) | (79,764 | ) | (63,510 | ) | (48,202 | ) | (414,139 | ) | (718,098 | ) | ||||||||||||||||
| Total compensation and benefits | (133,579 | ) | (109,169 | ) | (37,652 | ) | (334,533 | ) | (107,731 | ) | (79,749 | ) | (414,139 | ) | (1,216,552 | ) | ||||||||||||||||
| Selling expenses | (17,279 | ) | (9,405 | ) | (5,025 | ) | (59,625 | ) | (30,361 | ) | (18,680 | ) | (102,433 | ) | (242,808 | ) | ||||||||||||||||
| General and administrative expenses | (898 | ) | (10,154 | ) | (10,034 | ) | (5,829 | ) | (5,829 | ) | (6,516 | ) | (266,330 | ) | (305,590 | ) | ||||||||||||||||
| Reversal of (provision for) credit losses | 2,424 | (9,071 | ) | – | – | – | 5,356 | (50,935 | ) | (52,226 | ) | |||||||||||||||||||||
| Other operating (expenses) income, net | (1,757 | ) | 1,891 | (406 | ) | (4,888 | ) | (807 | ) | (25,284 | ) | (31,621 | ) | (62,872 | ) | |||||||||||||||||
| Government grants | 11,977 | 9,705 | 12 | – | 11 | 22 | 24,745 | 46,472 | ||||||||||||||||||||||||
| Total operating costs and expenses | (139,112 | ) | (126,203 | ) | (53,105 | ) | (404,875 | ) | (144,717 | ) | (124,851 | ) | (840,713 | ) | (1,833,576 | ) | ||||||||||||||||
| Income (loss) from operations | 427,377 | 566,265 | (34,457 | ) | 142,665 | 409,218 | 53,943 | (788,347 | ) | 776,664 | ||||||||||||||||||||||
| 1. | The financial information shown under “Headquarters” represents the revenues and operating cost and expenses generated by the Group’s headquarters which cannot be allocated to the six business segments. |
The following table summarizes the Group’s revenues generated by the different geographic location.
| Year Ended December 31, | ||||||||
| (Amount in Thousands) | ||||||||
| 2024 | 2025 | |||||||
| RMB | RMB | |||||||
| (Audited) | (Unaudited) | |||||||
| Mainland China | 1,369,258 | 1,349,519 | ||||||
| Hong Kong | 925,846 | 986,362 | ||||||
| Overseas | 326,230 | 293,906 | ||||||
| Total revenues | 2,621,334 | 2,629,787 | ||||||
The geographic information of the Group’s long-lived assets, including property and equipment and operating lease right-of-use assets, as of December 31, 2024 and 2025 is as follows:
| As of December 31, | ||||||||
| (Amount in Thousands) | ||||||||
| 2024 | 2025 | |||||||
| RMB | RMB | |||||||
| (Audited) | (Unaudited) | |||||||
| Mainland China | 2,427,113 | 2,351,825 | ||||||
| Hong Kong | 53,427 | 77,087 | ||||||
| Overseas | 22,822 | 30,555 | ||||||
| Total long-lived assets | 2,503,362 | 2,459,467 | ||||||
| 10. | Dividends |
The 2024 final dividend and non-recurring special dividend, declared during the year ended December 31, 2025, amounted to approximately RMB550.0 million which were paid as of December 31, 2025.
The board of directors of the Company recommended (i) a final dividend of RMB306.0 million (US$43.8 million) in respect of the year ended December 31, 2025, and (ii) a special dividend of RMB306.0 million (US$43.8 million), with an aggregate amount of the final dividend and special dividend of approximately RMB612.0 million (US$87.6 million). This recommendation is subject to the approval by the Company’s shareholders respectively at the forthcoming annual general meeting to be held on or around June 11, 2026.
Based on the number of issued Shares as of the date of this announcement, if declared and paid, (i) a final dividend will amount to RMB0.933 per share (tax inclusive) in respect of the year ended December 31, 2025, and (ii) the special dividend will amount to RMB0.933 per share (tax inclusive), both subject to adjustment to the number of Shares of the Company entitled to dividend distribution as of the record date for dividend distribution.
| DEFINITIONS, ACRONYMS AND GLOSSARY OF TECHNICAL TERMS | |
| “2022 Share Incentive Plan” | the 2022 share incentive plan adopted at the annual general meeting held on December 16, 2022 with effect from December 23, 2022 and filed with the SEC on December 23, 2022 |
| “ADS(s)” | American Depositary Shares (one ADS representing five Shares) |
| “Audit Committee” | the audit committee of the Company |
| “AUM” | the amount of capital commitments made by investors to the funds we provide continuous management services without adjustment for any gain or loss from investment, for which we are entitled to receive recurring service fees or performance- based income, except for public securities investments. For public securities investments, “AUM” refers to the net asset value of the investments we manage, for which we are entitled to receive recurring service fees and performance-based income |
| “Board” | the board of Directors |
| “Camsing Incident” | has the same meaning ascribed to it in the Prospectus |
| “CEO” | chief executive officer of the Company |
| “China” or “PRC” | the People’s Republic of China, excluding, for the purposes of this announcement only, Taiwan and the special administrative regions of Hong Kong and Macau, except where the context otherwise requires |
| “Company” | Noah Holdings Limited, an exempted company with limited liability incorporated in the Cayman Islands on June 29, 2007, carrying on business in Hong Kong as “Noah Holdings Private Wealth and Asset Management Limited (諾亞控股私人財富資產管理有限公司)” |
| “Consolidated Affiliated Entities” or “VIE(s)” | Noah Investment and its subsidiaries, all of which are controlled by our Company through the Contractual Arrangements |
| “Contractual Arrangements” | variable interest entity structure and, where the context requires, the agreements underlying the structure |
| “Corporate Governance Code” | the Corporate Governance Code set out in Appendix C1 of the Hong Kong Listing Rules |
| “Director(s)” | the director(s) of our Company |
| “GAAP” | generally accepted accounting principles |
| “Gopher” or “Gopher Asset Management” | Gopher Asset Management Co., Ltd. (歌斐資產管理有限公司), a limited liability company established under the laws of the PRC on February 9, 2012, and one of our Company’s Consolidated Affiliated Entities, or, where the context requires, with its subsidiaries collectively |
| “Group”, “our Group”, “the Group”, “Noah”, “our”, “us” or “we” | the Company, its subsidiaries and the Consolidated Affiliated Entities from time to time |
| “HK$” | Hong Kong dollars, the lawful currency of Hong Kong |
| “HNW” | high net worth |
| “HNW clients”, “HNW investors” or “HNW individuals” | clients/investors/individuals with investable financial assets of no less than RMB6 million |
| “Hong Kong” | the Hong Kong Special Administrative Region of the PRC |
| “Hong Kong Listing Rules” | the Rules Governing the Listing of Securities on The Stock Exchange of Hong Kong Limited |
| “Hong Kong Stock Exchange” or “HKEX” | The Stock Exchange of Hong Kong Limited |
| “IFRS” | International Financial Reporting Standards, as issued by the International Accounting Standards Board |
| “Listing Date” | July 13, 2022 |
| “Model Code” | the Model Code for Securities Transactions by Directors of Listed Issuers set out in Appendix C3 of the Hong Kong Listing Rules |
| “Noah Investment” | Shanghai Noah Investment Management Co., Ltd. (上海諾亞投資 管理有限公司), a limited liability company established under the laws of the PRC on August 26, 2005, and one of the Consolidated Affiliated Entities |
| “Noah Upright” | Noah Upright Fund Distribution Co., Ltd. (諾亞正行基金銷售有 限公司), a limited liability company established under the laws of the PRC on November 18, 2003, and one of the Consolidated Affiliated Entities and significant subsidiaries |
| “NYSE” | New York Stock Exchange |
| “Prospectus” | the Company’s prospectus published on June 30, 2022 in connection with its secondary listing on the Hong Kong Stock Exchange |
| “Reporting Period” | the year ended December 31, 2025 |
| “RMB” or “Renminbi” | Renminbi yuan, the lawful currency of China |
| “SEC” | the United States Securities and Exchange Commission |
| “SFO” | the Securities and Futures Ordinance (Chapter 571 of the Laws of Hong Kong), as amended or supplemented from time to time |
| “Shanghai Gopher” | Shanghai Ziming Private Fund Management Co., Ltd. (上海自明 私募基金管理有限公司), formerly known as Shanghai Gopher Asset Management Co., Ltd. (上海歌斐資產管理有限公司), a limited liability company established in the PRC on December 14, 2012, and one of the Consolidated Affiliated Entities and significant subsidiaries |
| “Share(s)” | ordinary share(s) of par value of US$0.0005 each in the share capital of the Company prior to the Share Subdivision becoming effective and ordinary share(s) of par value of US$0.00005 each in the share capital of the Company upon the effectiveness of the Share Subdivision |
| “Shareholder(s)” | the holder(s) of the Share(s), and where the context requires, ADSs |
| “Share Subdivision” | the share subdivision of the Company effective on October 30, 2023, pursuant to which the ordinary share of a par value of US$0.0005 each in the share capital of the Company were subdivided into ten (10) ordinary shares of a par value of US$0.00005 each in the share capital of the Company |
| “subsidiary” or “subsidiaries” | has the meaning ascribed thereto in section 15 of the Companies Ordinance (Chapter 622 of the Laws of Hong Kong), as amended or supplemented from time to time |
| “transaction value” | the aggregate value of the investment products we distribute during a given period |
| “U.S.” or “United States” | the United States of America, its territories, its possessions and all areas subject to its jurisdiction |
| “U.S. dollars” or “US$” | United States dollars, the lawful currency of the United States |
| “U.S. GAAP” | accounting principles generally accepted in the United States of America |
| “%” | per cent |
| * | For the purposes of this announcement only, the terms “domestic” and “overseas” refer to the Group’s operations in mainland China and outside of mainland China, respectively. For the purpose of this announcement and for illustrative purpose only, conversions of US$ to RMB are based on the exchange rate of US$1.00 = RMB6.9931. No representation is made that any amounts in RMB or US$ can be or could have been converted at the relevant dates at the above rate or at any other rates or at all. |
PUBLICATION OF THE ANNUAL RESULTS ANNOUNCEMENT AND ANNUAL REPORT
This annual results announcement is published on the websites of the Hong Kong Stock Exchange (www.hkexnews.hk) and the Company (ir.noahgroup.com). The annual report for the year ended December 31, 2025 containing all the information required by Appendix D2 of the Hong Kong Listing Rules will be dispatched only to the Shareholders as per the Company’s corporate communications arrangement and made available for review on the same websites in due course.
| By order of the Board | |
| Noah Holdings Private Wealth and Asset Management Limited | |
| Jingbo Wang | |
| Chairwoman of the Board |
Hong Kong, March 25, 2026
As of the date of this announcement, the Board comprises Ms. Jingbo Wang, the chairwoman, and Mr. Zhe Yin as Directors; Ms. Chia-Yue Chang, Mr. Boquan He and Mr. David Zhang as non-executive Directors; and Ms. Xiangrong Li, Ms. Cynthia Jinhong Meng and Ms. May Yihong Wu as independent Directors.
Exhibit 99.2
Hong Kong Exchanges and Clearing Limited and The Stock Exchange of Hong Kong Limited take no responsibility for the contents of this announcement, make no representation as to its accuracy or completeness and expressly disclaim any liability whatsoever for any loss howsoever arising from or in reliance upon the whole or any part of the contents of this announcement.
Noah Holdings
Noah Holdings Private Wealth and Asset Management Limited
諾亞控股私人財富資產管理有限公司
(Incorporated
in the Cayman Islands with limited liability under the name Noah Holdings Limited and
carrying on business in Hong Kong as Noah Holdings
Private Wealth and Asset Management Limited)
(Stock Code: 6686)
PROPOSED
AMENDMENTS TO THE EXISTING MEMORANDUM AND
ARTICLES OF ASSOCIATION AND ADOPTION OF THE SEVENTH
MEMORANDUM AND ARTICLES OF ASSOCIATION
This announcement is made by Noah Holdings Private Wealth and Asset Management Limited (the “Company”) pursuant to Rule 13.51(1) of the Rules (the “Hong Kong Listing Rules”) Governing the Listing of Securities on The Stock Exchange of Hong Kong Limited.
The board (the “Board”) of directors of the Company proposes to amend the existing memorandum and articles of association of the Company (the “Existing M&A”) and to adopt the seventh amended and restated memorandum and articles of association (the “New M&A”) in substitution for, and to the exclusion of, the Existing M&A in order to, further optimize the implementation of the expansion of paperless listing regime and electronic dissemination of corporate communications as stipulated in the Hong Kong Listing Rules.
The proposed amendments to the Existing M&A and adoption of the New M&A are subject to the approval of the shareholders of the Company (the “Shareholders”) by way of a special resolution at the forthcoming annual general meeting (the “AGM”) of the Company, and will become effective upon the approval by the Shareholders at the AGM. A circular containing, among other things, further details concerning the proposed amendments to the Existing M&A and the full terms of the proposed amendments, together with the notice of the AGM and the proxy form, will be despatched to the Shareholders in due course.
| By order of the Board | |
| Noah Holdings Private Wealth and Asset Management Limited | |
| Jingbo Wang | |
| Chairwoman of the Board |
Hong Kong, March 25, 2026
As of the date of this announcement, the Board comprises Ms. Jingbo Wang, the chairwoman, and Mr. Zhe Yin as Directors; Ms. Chia-Yue Chang, Mr. Boquan He and Mr. David Zhang as non-executive Directors; and Ms. Xiangrong Li, Ms. Cynthia Jinhong Meng and Ms. May Yihong Wu as independent Directors.
Exhibit 99.3
EF001
| Disclaimer |
| Hong Kong Exchanges and Clearing Limited and The Stock Exchange of Hong Kong Limited take no responsibility for the contents of this announcement, make no representation as to its accuracy or completeness and expressly disclaim any liability whatsoever for any loss howsoever arisen from or in reliance upon the whole or any part of the contents of this announcement. |
| Cash Dividend Announcement for Equity Issuer |
| Issuer name | Noah Holdings Private Wealth and Asset Management Limited |
| Stock code | 06686 |
| Multi-counter stock code and currency | Not applicable |
| Other related stock code(s) and name(s) | Not applicable |
| Title of announcement | FINAL DIVIDEND FOR THE YEAR ENDED DECEMBER 31, 2025 |
| Announcement date | 25 March 2026 |
| Status | New announcement |
| Information relating to the dividend | |
| Dividend type | Final |
| Dividend nature | Ordinary |
| For the financial year end | 31 December 2025 |
| Reporting period end for the dividend declared | 31 December 2025 |
| Dividend declared | RMB 0.933 per share |
| Date of shareholders' approval | 11 June 2026 |
| Information relating to Hong Kong share register | |
Default currency and amount in which the dividend will be paid |
HKD amount to be announced |
| Exchange rate | To be announced |
| Ex-dividend date | To be announced |
| Latest time to lodge transfer documents for registration with share registrar for determining entitlement to the dividend | To be announced |
| Book close period | Not applicable |
| Record date | To be announced |
| Payment date | To be announced |
| Computershare Hong Kong Investor Services Limited | |
| Share registrar and its address | Shops 1712-1716 |
| 17/F, Hopewell Center | |
| 183 Queen’s Road East |
| Wan Chai | |
| Hong Kong |
| Page |
EF001
| Information relating to withholding tax | |
| Details of withholding tax applied to the dividend declared | Not applicable |
| Information relating to listed warrants / convertible securities issued by the issuer | |
| Details of listed warrants / convertible securities issued by the issuer | Not applicable |
| Other information | |
| Other information | Not applicable |
| Directors of the issuer | |
| As of the date of this announcement, the Board comprises Ms. Jingbo Wang, the chairwoman, and Mr. Zhe Yin as Directors; Ms. Chia-Yue Chang, Mr. Boquan He and Mr. David Zhang as non-executive Directors; and Ms. Xiangrong Li, Ms. Cynthia Jinhong Meng and Ms. May Yihong Wu as independent Directors. |
| Page |
Exhibit 99.4
EF001
| Disclaimer |
| Hong Kong Exchanges and Clearing Limited and The Stock Exchange of Hong Kong Limited take no responsibility for the contents of this announcement, make no representation as to its accuracy or completeness and expressly disclaim any liability whatsoever for any loss howsoever arisen from or in reliance upon the whole or any part of the contents of this announcement. |
| Cash Dividend Announcement for Equity Issuer |
| Issuer name | Noah Holdings Private Wealth and Asset Management Limited |
| Stock code | 06686 |
| Multi-counter stock code and currency | Not applicable |
| Other related stock code(s) and name(s) | Not applicable |
| Title of announcement | SPECIAL DIVIDEND |
| Announcement date | 25 March 2026 |
| Status | New announcement |
| Information relating to the dividend | |
| Dividend type | Other |
| Special Dividend |
| Dividend nature | Special |
| For the financial year end | Not applicable |
| Reporting period end for the dividend declared | Not applicable |
| Dividend declared | RMB 0.933 per share |
| Date of shareholders' approval | 11 June 2026 |
| Information relating to Hong Kong share register | |
Default currency and amount in which the dividend will be paid |
HKD amount to be announced |
| Exchange rate | To be announced |
| Ex-dividend date | To be announced |
| Latest time to lodge transfer documents for registration with share registrar for determining entitlement to the dividend | To be announced |
| Book close period | Not applicable |
| Record date | To be announced |
| Payment date | To be announced |
| Computershare Hong Kong Investor Services Limited | |
| Share registrar and its address | Shops 1712-1716 |
| 17/F, Hopewell Center | |
| 183 Queen’s Road East |
| Wan Chai | |
| Hong Kong |
| Page |
EF001
| Information relating to withholding tax | |
| Details of withholding tax applied to the dividend declared | Not applicable |
| Information relating to listed warrants / convertible securities issued by the issuer | |
| Details of listed warrants / convertible securities issued by the issuer | Not applicable |
| Other information | |
| Other information | Not applicable |
| Directors of the issuer | |
| As of the date of this announcement, the Board comprises Ms. Jingbo Wang, the chairwoman, and Mr. Zhe Yin as Directors; Ms. Chia-Yue Chang, Mr. Boquan He and Mr. David Zhang as non-executive Directors; and Ms. Xiangrong Li, Ms. Cynthia Jinhong Meng and Ms. May Yihong Wu as independent Directors. |
| Page |
|
FF305 Page 1 of 15 v 1.3.0 Next Day Disclosure Return (Equity issuer - changes in issued shares or treasury shares, share buybacks and/or on-market sales of treasury shares) Instrument: Equity issuer Status: New Submission Name of Issuer: Noah Holdings Private Wealth and Asset Management Limited Date Submitted: 24 March 2026 Section I must be completed by a listed issuer where there has been a change in its issued shares or treasury shares which is discloseable pursuant to rule 13.25A of the Rules Governing the Listing of Securities on The Stock Exchange of Hong Kong Limited (the “Exchange”) (the “Main Board Rules”) or rule 17.27A of the Rules Governing the Listing of Securities on GEM of the Exchange (the “GEM Rules”). Section I 1. Class of shares Ordinary shares Type of shares Not applicable Listed on the Exchange Yes Stock code (if listed) 06686 Description A. Changes in issued shares or treasury shares Events Changes in issued shares (excluding treasury shares) Number of issued shares (excluding treasury shares) As a % of existing number of issued shares (excluding treasury shares) before the relevant event (Note 3) Changes in treasury shares Number of treasury shares Issue/ selling price per share (Note 4) Total number of issued shares Opening balance as at (Note 1) 20 March 2026 335,258,287 0 335,258,287 1). Other (please specify) See Part B Date of changes 23 March 2026 % Closing balance as at (Notes 5 and 6) 23 March 2026 335,258,287 0 335,258,287 |
|
FF305 Page 2 of 15 v 1.3.0 B. Shares redeemed or repurchased for cancellation but not yet cancelled as at the closing balance date (Notes 5 and 6) 1). Shares repurchased for cancellation but not yet cancelled, referring to repurchase of 28,267 ADSs (representing 141,335 ordinary shares) on the New York Stock Exchange on December 23, 2025 (U.S. Eastern Time) under the repurchase mandate granted on the annual general meeting held on June 12, 2025 Date of changes 23 December 2025 141,335 0.043 % USD 1.975 2). Shares repurchased for cancellation but not yet cancelled, referring to repurchase of 299 ADSs (representing 1,495 ordinary shares) on the New York Stock Exchange on December 24, 2025 (U.S. Eastern Time) under the repurchase mandate granted on the annual general meeting held on June 12, 2025 Date of changes 24 December 2025 1,495 0.0004 % USD 1.997 3). Shares repurchased for cancellation but not yet cancelled, referring to repurchase of 1,893 ADSs (representing 9,465 ordinary shares) on the New York Stock Exchange on December 26, 2025 (U.S. Eastern Time) under the repurchase mandate granted on the annual general meeting held on June 12, 2025 Date of changes 26 December 2025 9,465 0.0028 % USD 1.998 4). Shares repurchased for cancellation but not yet cancelled, referring to repurchase of 28,577 ADSs (representing 142,885 ordinary shares) on the New York Stock Exchange on December 29, 2025 (U.S. Eastern Time) under the repurchase mandate granted on the annual general meeting held on June 12, 2025 Date of changes 29 December 2025 142,885 0.043 % USD 1.999 5). Shares repurchased for cancellation but not yet cancelled, referring to repurchase of 28,918 ADSs (representing 144,590 ordinary shares) on the New York Stock Exchange on January 2, 2026 (U.S. Eastern Time) under the repurchase mandate granted on the annual general meeting held on June 12, 2025 Date of changes 02 January 2026 144,590 0.0431 % USD 2.101 6). Shares repurchased for cancellation but not yet cancelled, referring to repurchase of 24,606 ADSs (representing 123,030 ordinary shares) on the New York Stock Exchange on January 5, 2026 (U.S. Eastern Time) under the repurchase mandate granted on the annual general meeting held on June 12, 2025 Date of changes 05 January 2026 123,030 0.0367 % USD 2.243 7). Shares repurchased for cancellation but not yet cancelled, referring to repurchase of 24,674 ADSs (representing 123,370 ordinary shares) on the New York Stock Exchange on January 6, 2026 (U.S. Eastern Time) under the repurchase mandate granted on the annual general meeting held on June 12, 2025 Date of changes 06 January 2026 123,370 0.0368 % USD 2.216 |
|
FF305 Page 3 of 15 v 1.3.0 8). Shares repurchased for cancellation but not yet cancelled, referring to repurchase of 24,499 ADSs (representing 122,495 ordinary shares) on the New York Stock Exchange on January 7, 2026 (U.S. Eastern Time) under the repurchase mandate granted on the annual general meeting held on June 12, 2025 Date of changes 07 January 2026 122,495 0.0365 % USD 2.226 9). Shares repurchased for cancellation but not yet cancelled, referring to repurchase of 24,715 ADSs (representing 123,575 ordinary shares) on the New York Stock Exchange on January 8, 2026 (U.S. Eastern Time) under the repurchase mandate granted on the annual general meeting held on June 12, 2025 Date of changes 08 January 2026 123,575 0.0369 % USD 2.225 10). Shares repurchased for cancellation but not yet cancelled, referring to repurchase of 24,715 ADSs (representing 123,575 ordinary shares) on the New York Stock Exchange on January 9, 2026 (U.S. Eastern Time) under the repurchase mandate granted on the annual general meeting held on June 12, 2025 Date of changes 09 January 2026 123,575 0.0369 % USD 2.185 11). Shares repurchased for cancellation but not yet cancelled, referring to repurchase of 25,561 ADSs (representing 127,805 ordinary shares) on the New York Stock Exchange on January 12, 2026 (U.S. Eastern Time) under the repurchase mandate granted on the annual general meeting held on June 12, 2025 Date of changes 12 January 2026 127,805 0.0381 % USD 2.237 12). Shares repurchased for cancellation but not yet cancelled, referring to repurchase of 25,561 ADSs (representing 127,805 ordinary shares) on the New York Stock Exchange on January 13, 2026 (U.S. Eastern Time) under the repurchase mandate granted on the annual general meeting held on June 12, 2025 Date of changes 13 January 2026 127,805 0.0381 % USD 2.236 13). Shares repurchased for cancellation but not yet cancelled, referring to repurchase of 25,561 ADSs (representing 127,805 ordinary shares) on the New York Stock Exchange on January 14, 2026 (U.S. Eastern Time) under the repurchase mandate granted on the annual general meeting held on June 12, 2025 Date of changes 14 January 2026 127,805 0.0381 % USD 2.24 14). Shares repurchased for cancellation but not yet cancelled, referring to repurchase of 24,716 ADSs (representing 123,580 ordinary shares) on the New York Stock Exchange on January 15, 2026 (U.S. Eastern Time) under the repurchase mandate granted on the annual general meeting held on June 12, 2025 Date of changes 15 January 2026 123,580 0.0369 % USD 2.242 |
|
FF305 Page 4 of 15 v 1.3.0 15). Shares repurchased for cancellation but not yet cancelled, referring to repurchase of 25,561 ADSs (representing 127,805 ordinary shares) on the New York Stock Exchange on January 16, 2026 (U.S. Eastern Time) under the repurchase mandate granted on the annual general meeting held on June 12, 2025 Date of changes 16 January 2026 127,805 0.0381 % USD 2.255 16). Shares repurchased for cancellation but not yet cancelled, referring to repurchase of 28,013 ADSs (representing 140,065 ordinary shares) on the New York Stock Exchange on January 20, 2026 (U.S. Eastern Time) under the repurchase mandate granted on the annual general meeting held on June 12, 2025 Date of changes 20 January 2026 140,065 0.0418 % USD 2.256 17). Shares repurchased for cancellation but not yet cancelled, referring to repurchase of 28,013 ADSs (representing 140,065 ordinary shares) on the New York Stock Exchange on January 21, 2026 (U.S. Eastern Time) under the repurchase mandate granted on the annual general meeting held on June 12, 2025 Date of changes 21 January 2026 140,065 0.0418 % USD 2.276 18). Shares repurchased for cancellation but not yet cancelled, referring to repurchase of 27,868 ADSs (representing 139,340 ordinary shares) on the New York Stock Exchange on January 22, 2026 (U.S. Eastern Time) under the repurchase mandate granted on the annual general meeting held on June 12, 2025 Date of changes 22 January 2026 139,340 0.0416 % USD 2.313 19). Shares repurchased for cancellation but not yet cancelled, referring to repurchase of 27,822 ADSs (representing 139,110 ordinary shares) on the New York Stock Exchange on January 23, 2026 (U.S. Eastern Time) under the repurchase mandate granted on the annual general meeting held on June 12, 2025 Date of changes 23 January 2026 139,110 0.0415 % USD 2.341 20). Shares repurchased for cancellation but not yet cancelled, referring to repurchase of 28,928 ADSs (representing 144,640 ordinary shares) on the New York Stock Exchange on January 26, 2026 (U.S. Eastern Time) under the repurchase mandate granted on the annual general meeting held on June 12, 2025 Date of changes 26 January 2026 144,640 0.0431 % USD 2.312 21). Shares repurchased for cancellation but not yet cancelled, referring to repurchase of 28,928 ADSs (representing 144,640 ordinary shares) on the New York Stock Exchange on January 27, 2026 (U.S. Eastern Time) under the repurchase mandate granted on the annual general meeting held on June 12, 2025 Date of changes 27 January 2026 144,640 0.0431 % USD 2.311 |
|
FF305 Page 5 of 15 v 1.3.0 22). Shares repurchased for cancellation but not yet cancelled, referring to repurchase of 28,812 ADSs (representing 144,060 ordinary shares) on the New York Stock Exchange on January 28, 2026 (U.S. Eastern Time) under the repurchase mandate granted on the annual general meeting held on June 12, 2025 Date of changes 28 January 2026 144,060 0.043 % USD 2.313 23). Shares repurchased for cancellation but not yet cancelled, referring to repurchase of 28,928 ADSs (representing 144,640 ordinary shares) on the New York Stock Exchange on January 29, 2026 (U.S. Eastern Time) under the repurchase mandate granted on the annual general meeting held on June 12, 2025 Date of changes 29 January 2026 144,640 0.0431 % USD 2.329 24). Shares repurchased for cancellation but not yet cancelled, referring to repurchase of 28,928 ADSs (representing 144,640 ordinary shares) on the New York Stock Exchange on January 30, 2026 (U.S. Eastern Time) under the repurchase mandate granted on the annual general meeting held on June 12, 2025 Date of changes 30 January 2026 144,640 0.0431 % USD 2.38 25). Shares repurchased for cancellation but not yet cancelled, referring to repurchase of 30,437 ADSs (representing 152,185 ordinary shares) on the New York Stock Exchange on February 02, 2026 (U.S. Eastern Time) under the repurchase mandate granted on the annual general meeting held on June 12, 2025 Date of changes 02 February 2026 152,185 0.0454 % USD 2.36 26). Shares repurchased for cancellation but not yet cancelled, referring to repurchase of 30,297 ADSs (representing 151,485 ordinary shares) on the New York Stock Exchange on February 03, 2026 (U.S. Eastern Time) under the repurchase mandate granted on the annual general meeting held on June 12, 2025 Date of changes 03 February 2026 151,485 0.0452 % USD 2.335 27). Shares repurchased for cancellation but not yet cancelled, referring to repurchase of 30,437 ADSs (representing 152,185 ordinary shares) on the New York Stock Exchange on February 04, 2026 (U.S. Eastern Time) under the repurchase mandate granted on the annual general meeting held on June 12, 2025 Date of changes 04 February 2026 152,185 0.0454 % USD 2.309 28). Shares repurchased for cancellation but not yet cancelled, referring to repurchase of 30,437 ADSs (representing 152,185 ordinary shares) on the New York Stock Exchange on February 05, 2026 (U.S. Eastern Time) under the repurchase mandate granted on the annual general meeting held on June 12, 2025 Date of changes 05 February 2026 152,185 0.0454 % USD 2.263 |
|
FF305 Page 6 of 15 v 1.3.0 29). Shares repurchased for cancellation but not yet cancelled, referring to repurchase of 30,437 ADSs (representing 152,185 ordinary shares) on the New York Stock Exchange on February 06, 2026 (U.S. Eastern Time) under the repurchase mandate granted on the annual general meeting held on June 12, 2025 Date of changes 06 February 2026 152,185 0.0454 % USD 2.316 30). Shares repurchased for cancellation but not yet cancelled, referring to repurchase of 9,843 ADSs (representing 49,215 ordinary shares) on the New York Stock Exchange on February 09, 2026 (U.S. Eastern Time) under the repurchase mandate granted on the annual general meeting held on June 12, 2025 Date of changes 09 February 2026 49,215 0.0147 % USD 2.392 31). Shares repurchased for cancellation but not yet cancelled, referring to repurchase of 11,610 ADSs (representing 58,050 ordinary shares) on the New York Stock Exchange on February 10, 2026 (U.S. Eastern Time) under the repurchase mandate granted on the annual general meeting held on June 12, 2025 Date of changes 10 February 2026 58,050 0.0173 % USD 2.387 32). Shares repurchased for cancellation but not yet cancelled, referring to repurchase of 6,990 ADSs (representing 34,950 ordinary shares) on the New York Stock Exchange on February 11, 2026 (U.S. Eastern Time) under the repurchase mandate granted on the annual general meeting held on June 12, 2025 Date of changes 11 February 2026 34,950 0.0104 % USD 2.4 33). Shares repurchased for cancellation but not yet cancelled, referring to repurchase of 14,596 ADSs (representing 72,980 ordinary shares) on the New York Stock Exchange on February 12, 2026 (U.S. Eastern Time) under the repurchase mandate granted on the annual general meeting held on June 12, 2025 Date of changes 12 February 2026 72,980 0.0218 % USD 2.395 34). Shares repurchased for cancellation but not yet cancelled, referring to repurchase of 31,606 ADSs (representing 158,030 ordinary shares) on the New York Stock Exchange on February 13, 2026 (U.S. Eastern Time) under the repurchase mandate granted on the annual general meeting held on June 12, 2025 Date of changes 13 February 2026 158,030 0.0471 % USD 2.393 35). Shares repurchased for cancellation but not yet cancelled, referring to repurchase of 8,731 ADSs (representing 43,655 ordinary shares) on the New York Stock Exchange on February 17, 2026 (U.S. Eastern Time) under the repurchase mandate granted on the annual general meeting held on June 12, 2025 Date of changes 17 February 2026 43,655 0.013 % USD 2.392 |
|
FF305 Page 7 of 15 v 1.3.0 36). Shares repurchased for cancellation but not yet cancelled, referring to repurchase of 33,140 ADSs (representing 165,700 ordinary shares) on the New York Stock Exchange on February 19, 2026 (U.S. Eastern Time) under the repurchase mandate granted on the annual general meeting held on June 12, 2025 Date of changes 19 February 2026 165,700 0.0494 % USD 2.393 37). Shares repurchased for cancellation but not yet cancelled, referring to repurchase of 3,207 ADSs (representing 16,035 ordinary shares) on the New York Stock Exchange on February 20, 2026 (U.S. Eastern Time) under the repurchase mandate granted on the annual general meeting held on June 12, 2025 Date of changes 20 February 2026 16,035 0.0048 % USD 2.398 38). Shares repurchased for cancellation but not yet cancelled, referring to repurchase of 33,234 ADSs (representing 166,170 ordinary shares) on the New York Stock Exchange on February 23, 2026 (U.S. Eastern Time) under the repurchase mandate granted on the annual general meeting held on June 12, 2025 Date of changes 23 February 2026 166,170 0.0496 % USD 2.382 39). Shares repurchased for cancellation but not yet cancelled, referring to repurchase of 2,757 ADSs (representing 13,785 ordinary shares) on the New York Stock Exchange on February 24, 2026 (U.S. Eastern Time) under the repurchase mandate granted on the annual general meeting held on June 12, 2025 Date of changes 24 February 2026 13,785 0.0041 % USD 2.396 40). Shares repurchased for cancellation but not yet cancelled, referring to repurchase of 101 ADSs (representing 505 ordinary shares) on the New York Stock Exchange on February 25, 2026 (U.S. Eastern Time) under the repurchase mandate granted on the annual general meeting held on June 12, 2025 Date of changes 25 February 2026 505 0.0002 % USD 2.4 41). Shares repurchased for cancellation but not yet cancelled, referring to repurchase of 16,033 ADSs (representing 80,165 ordinary shares) on the New York Stock Exchange on February 26, 2026 (U.S. Eastern Time) under the repurchase mandate granted on the annual general meeting held on June 12, 2025 Date of changes 26 February 2026 80,165 0.0239 % USD 2.398 42). Shares repurchased for cancellation but not yet cancelled, referring to repurchase of 33,234 ADSs (representing 166,170 ordinary shares) on the New York Stock Exchange on February 27, 2026 (U.S. Eastern Time) under the repurchase mandate granted on the annual general meeting held on June 12, 2025 Date of changes 27 February 2026 166,170 0.0496 % USD 2.387 |
|
FF305 Page 8 of 15 v 1.3.0 43). Shares repurchased for cancellation but not yet cancelled, referring to repurchase of 33,896 ADSs (representing 169,480 ordinary shares) on the New York Stock Exchange on March 02, 2026 (U.S. Eastern Time) under the repurchase mandate granted on the annual general meeting held on June 12, 2025 Date of changes 02 March 2026 169,480 0.0506 % USD 2.36 44). Shares repurchased for cancellation but not yet cancelled, referring to repurchase of 33,896 ADSs (representing 169,480 ordinary shares) on the New York Stock Exchange on March 03, 2026 (U.S. Eastern Time) under the repurchase mandate granted on the annual general meeting held on June 12, 2025 Date of changes 03 March 2026 169,480 0.0506 % USD 2.268 45). Shares repurchased for cancellation but not yet cancelled, referring to repurchase of 33,896 ADSs (representing 169,480 ordinary shares) on the New York Stock Exchange on March 04, 2026 (U.S. Eastern Time) under the repurchase mandate granted on the annual general meeting held on June 12, 2025 Date of changes 04 March 2026 169,480 0.0506 % USD 2.307 46). Shares repurchased for cancellation but not yet cancelled, referring to repurchase of 33,896 ADSs (representing 169,480 ordinary shares) on the New York Stock Exchange on March 05, 2026 (U.S. Eastern Time) under the repurchase mandate granted on the annual general meeting held on June 12, 2025 Date of changes 05 March 2026 169,480 0.0506 % USD 2.287 47). Shares repurchased for cancellation but not yet cancelled, referring to repurchase of 33,896 ADSs (representing 169,480 ordinary shares) on the New York Stock Exchange on March 06, 2026 (U.S. Eastern Time) under the repurchase mandate granted on the annual general meeting held on June 12, 2025 Date of changes 06 March 2026 169,480 0.0506 % USD 2.305 48). Shares repurchased for cancellation but not yet cancelled, referring to repurchase of 34,130 ADSs (representing 170,650 ordinary shares) on the New York Stock Exchange on March 09, 2026 (U.S. Eastern Time) under the repurchase mandate granted on the annual general meeting held on June 12, 2025 Date of changes 09 March 2026 170,650 0.0509 % USD 2.295 49). Shares repurchased for cancellation but not yet cancelled, referring to repurchase of 34,130 ADSs (representing 170,650 ordinary shares) on the New York Stock Exchange on March 10, 2026 (U.S. Eastern Time) under the repurchase mandate granted on the annual general meeting held on June 12, 2025 Date of changes 10 March 2026 170,650 0.0509 % USD 2.362 |
|
FF305 Page 9 of 15 v 1.3.0 50). Shares repurchased for cancellation but not yet cancelled, referring to repurchase of 34,130 ADSs (representing 170,650 ordinary shares) on the New York Stock Exchange on March 11, 2026 (U.S. Eastern Time) under the repurchase mandate granted on the annual general meeting held on June 12, 2025 Date of changes 11 March 2026 170,650 0.0509 % USD 2.35 51). Shares repurchased for cancellation but not yet cancelled, referring to repurchase of 34,130 ADSs (representing 170,650 ordinary shares) on the New York Stock Exchange on March 12, 2026 (U.S. Eastern Time) under the repurchase mandate granted on the annual general meeting held on June 12, 2025 Date of changes 12 March 2026 170,650 0.0509 % USD 2.311 52). Shares repurchased for cancellation but not yet cancelled, referring to repurchase of 33,572 ADSs (representing 167,860 ordinary shares) on the New York Stock Exchange on March 13, 2026 (U.S. Eastern Time) under the repurchase mandate granted on the annual general meeting held on June 12, 2025 Date of changes 13 March 2026 167,860 0.0501 % USD 2.295 53). Shares repurchased for cancellation but not yet cancelled, referring to repurchase of 32,504 ADSs (representing 162,520 ordinary shares) on the New York Stock Exchange on March 16, 2026 (U.S. Eastern Time) under the repurchase mandate granted on the annual general meeting held on June 12, 2025 Date of changes 16 March 2026 162,520 0.0485 % USD 2.286 54). Shares repurchased for cancellation but not yet cancelled, referring to repurchase of 32,504 ADSs (representing 162,520 ordinary shares) on the New York Stock Exchange on March 17, 2026 (U.S. Eastern Time) under the repurchase mandate granted on the annual general meeting held on June 12, 2025 Date of changes 17 March 2026 162,520 0.0485 % USD 2.336 55). Shares repurchased for cancellation but not yet cancelled, referring to repurchase of 32,504 ADSs (representing 162,520 ordinary shares) on the New York Stock Exchange on March 18, 2026 (U.S. Eastern Time) under the repurchase mandate granted on the annual general meeting held on June 12, 2025 Date of changes 18 March 2026 162,520 0.0485 % USD 2.314 56). Shares repurchased for cancellation but not yet cancelled, referring to repurchase of 32,504 ADSs (representing 162,520 ordinary shares) on the New York Stock Exchange on March 19, 2026 (U.S. Eastern Time) under the repurchase mandate granted on the annual general meeting held on June 12, 2025 Date of changes 19 March 2026 162,520 0.0485 % USD 2.279 |
|
FF305 Page 10 of 15 v 1.3.0 57). Shares repurchased for cancellation but not yet cancelled, referring to repurchase of 32,256 ADSs (representing 161,280 ordinary shares) on the New York Stock Exchange on March 20, 2026 (U.S. Eastern Time) under the repurchase mandate granted on the annual general meeting held on June 12, 2025 Date of changes 20 March 2026 161,280 0.0481 % USD 2.278 58). Shares repurchased for cancellation but not yet cancelled, referring to repurchase of 31,238 ADSs (representing 156,190 ordinary shares) on the New York Stock Exchange on March 23, 2026 (U.S. Eastern Time) under the repurchase mandate granted on the annual general meeting held on June 12, 2025 Date of changes 23 March 2026 156,190 0.0466 % USD 2.293 Remarks: (1)The Company repurchased 31,238 ADSs (equivalent to 156,190 ordinary shares) on the New York Stock Exchange on March 23, 2026 (U.S. Eastern Time), for which the weighted average repurchase price was US$11.467 per ADS, or US$2.293 per share (one ADS represents five ordinary shares). (2)The dates of changes, as well as the dates for the opening balance and the closing balance, are all based on U.S. Eastern Time. |
|
FF305 Page 11 of 15 v 1.3.0 Confirmation Pursuant to Main Board Rule 13.25C / GEM Rule 17.27C, we hereby confirm to the best knowledge, information and belief that, in relation to each issue of shares or sale or transfer of treasury shares as set out in Section I, it has been duly authorised by the board of directors of the listed issuer and carried out in compliance with all applicable listing rules, laws and other regulatory requirements and, insofar as applicable: (Note 7) (i) all money due to the listed issuer in respect of the issue of shares, or sale or transfer of treasury shares has been received by it; (ii) all pre-conditions for the listing imposed by the Main Board Rules / GEM Rules under "Qualifications of listing" have been fulfilled; (iii) all (if any) conditions contained in the formal letter granting listing of and permission to deal in the securities have been fulfilled; (iv) all the securities of each class are in all respects identical (Note 8); (v) all documents required by the Companies (Winding Up and Miscellaneous Provisions) Ordinance to be filed with the Registrar of Companies have been duly filed and that compliance has been made with all other legal requirements; (vi) all the definitive documents of title have been delivered/are ready to be delivered/are being prepared and will be delivered in accordance with the terms of issue, sale or transfer; (vii) completion has taken place of the purchase by the issuer of all property shown in the listing document to have been purchased or agreed to be purchased by it and the purchase consideration for all such property has been duly satisfied; and (viii) the trust deed/deed poll relating to the debenture, loan stock, notes or bonds has been completed and executed, and particulars thereof, if so required by law, have been filed with the Registrar of Companies. Notes to Section I: 1. Please insert the closing balance date of the last Next Day Disclosure Return published pursuant to Main Board Rule 13.25A / GEM Rule 17.27A or Monthly Return pursuant to Main Board Rule 13.25B / GEM Rule 17.27B, whichever is the later. 2. Please set out all changes in issued shares or treasury shares requiring disclosure pursuant to Main Board Rule 13.25A / GEM Rule 17.27A together with the relevant dates of changes. Each category will need to be disclosed individually with sufficient information to enable the user to identify the relevant category in the listed issuer's Monthly Return. For example, multiple issues of shares as a result of multiple exercises of share options under the same share option scheme or of multiple conversions under the same convertible note must be aggregated and disclosed as one category. However, if the issues resulted from exercises of share options under 2 share option schemes or conversions of 2 convertible notes, these must be disclosed as 2 separate categories. 3. The percentage change in the number of issued shares (excluding treasury shares) of the listed issuer is to be calculated by reference to the opening balance of the number of issued shares (excluding treasury shares) being disclosed in this Next Day Disclosure Return. |
|
FF305 Page 12 of 15 v 1.3.0 4. In the case of a share repurchase or redemption, the “issue/ selling price per share” shall be construed as “repurchase price per share” or “redemption price per share”. Where shares have been issued/ sold/ repurchased/ redeemed at more than one price per share, a volume-weighted average price per share should be given. 5. The closing balance date is the date of the last relevant event being disclosed. 6. For repurchase or redemption of shares, disclosure is required when the relevant event has occurred (subject to the provisions of Main Board Rules 10.06(4)(a), 13.25A and 13.31 / GEM Rules 13.13(1), 17.27A and 17.35), even if the repurchased or redeemed shares have not yet been cancelled. If repurchased or redeemed shares are to be cancelled upon settlement of such repurchase or redemption after the closing balance date, they shall remain part of the issued shares as at the closing balance date in Part A. Details of these repurchased or redeemed shares shall be disclosed in Part B. 7. Items (i) to (viii) are suggested forms of confirmation. The listed issuer may amend the item(s) that is/are not applicable to meet individual cases. 8. “Identical” means in this context: - the securities are of the same nominal value with the same amount called up or paid up; - they are entitled to dividend/interest at the same rate and for the same period, so that at the next ensuing distribution, the dividend/interest payable per unit will amount to exactly the same sum (gross and net); and - they carry the same rights as to unrestricted transfer, attendance and voting at meetings and rank pari passu in all other respects. |
|
FF305 Page 13 of 15 v 1.3.0 Section II must also be completed by a listed issuer where it has made a repurchase of shares which is discloseable under Main Board Rule 10.06(4)(a) / GEM Rule 13.13(1). Repurchase report Section II 1. Class of shares Ordinary shares Type of shares Not applicable Listed on the Exchange Yes Stock code (if listed) 06686 Description A. Repurchase report Trading date Number of shares repurchased Method of repurchase (Note 1) Repurchase price per share or highest repurchase price per share $ Lowest repurchase price per share $ Aggregate price paid $ 1). 23 March 2026 156,190 On another stock exchange New York Stock Exchange USD 2.3 USD 2.28 USD 358,218.64 Total number of shares repurchased 156,190 Aggregate price paid $ USD 358,218.64 Number of shares repurchased for cancellation 156,190 Number of shares repurchased for holding as treasury shares 0 B. Additional information for issuer who has a primary listing on the Exchange 1). Date of the resolution granting the repurchase mandate 12 June 2025 2). Total number of shares which the issuer is authorised to repurchase under the repurchase mandate 33,077,814 3). Number of shares repurchased on the Exchange or another stock exchange under the repurchase mandate (a) 7,422,860 4). As a % of number of issued shares (excluding treasury shares) as at the date of the resolution granting the repurchase mandate (a) x 100 / number of issued shares (excluding treasury shares) as at the date of the resolution granting the repurchase mandate 2.244 % 5). Moratorium period for any issue of new shares, or sale or transfer of treasury shares after the share repurchase(s) set out in Part A (Note 2) Up to 22 April 2026 |
|
FF305 Page 14 of 15 v 1.3.0 We hereby confirm that the repurchases made on the Exchange set out in Part A above were made in accordance with the Main Board Rules and that there have been no material changes to the particulars contained in the Explanatory Statement dated April 25, 2025 which has been filed with the Exchange. We also confirm that any repurchases made on another stock exchange set out in Part A above were made in accordance with the domestic rules applying to repurchases on that other stock exchange. Notes to Section II: 1. Please state whether the repurchase was made on the Exchange, on another stock exchange (stating the name of the exchange), by private arrangement or by general offer. 2. Subject to the carve-out set out in Main Board Rule 10.06(3)(a)/ GEM Rule 13.12, an issuer may not (i) make a new issue of shares, or a sale or transfer of any treasury shares; or (ii) announce a proposed new issue of shares, or a sale or transfer of any treasury shares, for a period of 30 days after any purchase by it of shares, whether on the Exchange or otherwise, without the prior approval of the Exchange. |
|
FF305 Page 15 of 15 v 1.3.0 Section III must also be completed by a listed issuer where it has made a sale of treasury shares on the Exchange or any other stock exchange on which the issuer is listed which is discloseable under Main Board Rule 10.06B / GEM Rule 13.14B. Report of on-market sale of treasury shares Not applicable Submitted by: Jingbo Wang (Name) Title: Director (Director, Secretary or other Duly Authorised Officer) |