UNITED STATES
SECURITIES AND EXCHANGE COMMISSION
Washington, D.C. 20549
FORM 20-F
(Mark One)
☐ |
REGISTRATION STATEMENT PURSUANT TO SECTION 12(b) OR (g) OF THE SECURITIES EXCHANGE ACT OF 1934 |
OR | |
☒ |
ANNUAL REPORT PURSUANT TO SECTION 13 OR 15(d) OF THE SECURITIES EXCHANGE ACT OF 1934 |
|
For the fiscal year ended December 31, 2025 |
OR | |
☐ |
TRANSITION REPORT PURSUANT TO SECTION 13 OR 15(d) OF THE SECURITIES EXCHANGE ACT OF 1934 |
OR | |
☐ |
SHELL COMPANY REPORT PURSUANT TO SECTION 13 OR 15(d) OF THE SECURITIES EXCHANGE ACT OF 1934 |
Date of event requiring this shell company report___________________
For the transition period from ___________________ to _______________________
Commission file number: 001-41524
RENTOKIL INITIAL PLC |
(Exact name of Registrant as specified in its charter) |
|
England and Wales |
(Jurisdiction of incorporation or organization) |
|
|
Compass House Manor Royal Crawley West Sussex RH10 9PY United Kingdom |
(Address of principal executive offices) |
|
|
Rachel Canham Rentokil Initial plc Compass House Manor Royal Crawley West Sussex RH10 9PY United Kingdom Telephone: +44 (0)1293 858000 E-mail: secretariat@rentokil-initial.com |
(Name, Telephone, E-mail and/or Facsimile number and Address of Company Contact Person) |
Securities registered or to be registered pursuant to Section 12(b) of the Act:
Title of each class |
|
Trading Symbol(s) |
|
Name of each exchange on which registered |
American Depositary Shares, each representing five ordinary shares of £0.01 each |
|
RTO |
|
New York Stock Exchange |
Ordinary shares of £0.01 each |
|
|
|
New York Stock Exchange* |
*Not for trading, but only in connection with the registration of American Depositary Shares representing such ordinary shares pursuant to the requirements of the Securities and Exchange Commission.
Securities registered or to be registered pursuant to Section 12(g) of the Act:
None |
(Title of Class) |
Securities for which there is a reporting obligation pursuant to Section 15(d) of the Act:
None |
(Title of Class) |
Indicate the number of outstanding shares of each of the issuer’s classes of capital or common stock as of the close of the period covered by the annual report.
The number of outstanding shares of each class of stock of Rentokil Initial plc as of December 31, 2025 was:
Title of Class |
|
Number of Shares Outstanding |
|
Ordinary shares of £0.01 each: |
|
2,526,039,885 |
|
Indicate by check mark if the registrant is a well-known seasoned issuer, as defined in Rule 405 of the Securities Act.
Yes ⌧ No ◻
If this report is an annual or transition report, indicate by check mark if the registrant is not required to file reports pursuant to Section 13 or 15(d) of the Securities Exchange Act of 1934.
Yes ◻ No ⌧
Note — Checking the box above will not relieve any registrant required to file reports pursuant to Section 13 or 15(d) of the Securities Exchange Act of 1934 from their obligations under those Sections.
Indicate by check mark whether the registrant (1) has filed all reports required to be filed by Section 13 or 15(d) of the Securities Exchange Act of 1934 during the preceding 12 months (or for such shorter period that the registrant was required to file such reports), and (2) has been subject to such filing requirements for the past 90 days.
Yes ⌧ No ◻
Indicate by check mark whether the registrant has submitted electronically every Interactive Data File required to be submitted and posted pursuant to Rule 405 of Regulation S-T (§232.405 of this chapter) during the preceding 12 months (or for such shorter period that the registrant was required to submit such files).
Yes ⌧ No ◻
Indicate by check mark whether the registrant is a large accelerated filer, an accelerated filer, a non-accelerated filer, or an emerging growth company. See definition of “large accelerated filer,” “accelerated filer,” and “emerging growth company” in Rule 12b-2 of the Exchange Act.
Large accelerated filer ⌧ |
|
Accelerated filer ◻ |
|
Non-accelerated filer ◻ |
Emerging growth company ◻ |
If an emerging growth company that prepares its financial statements in accordance with U.S. GAAP, indicate by check mark if the registrant has elected not to use the extended transition period for complying with any new or revised financial accounting standards† provided pursuant to Section 13(a) of the Exchange Act.☐
† The term “new or revised financial accounting standard” refers to any update issued by the Financial Accounting Standards Board to its Accounting Standards Codification after April 5, 2012.
Indicate by check mark whether the registrant has filed a report on and attestation to its management’s assessment of the effectiveness of its internal control over financial reporting under Section 404(b) of the Sarbanes-Oxley Act (15 U.S.C. 7262(b)) by the registered public accounting firm that prepared or issued its audit report.☒
If securities are registered pursuant to Section 12(b) of the Act, indicate by check mark whether the financial statements of the registrant included in the filing reflect the correction of an error to previously issued financial statements.◻
Indicate by check mark whether any of those error corrections are restatements that required a recovery analysis of incentive-based compensation received by any of the registrant’s executive officers during the relevant recovery period pursuant to §240.10D-1(b).◻
Indicate by check mark which basis of accounting the registrant has used to prepare the financial statements included in this filing:
U.S. GAAP |
◻ |
International Financial Reporting Standards as issued by the International Accounting Standards Board |
⌧ |
Other |
◻ |
|
If “Other” has been checked in response to the previous question, indicate by check mark which financial statement item the registrant has elected to follow.
◻ Item 17 ◻ Item 18
If this is an annual report, indicate by check mark whether the registrant is a shell company (as defined in Rule 12b-2 of the Exchange Act).
Yes ◻ No ⌧
(APPLICABLE ONLY TO ISSUERS INVOLVED IN BANKRUPTCY PROCEEDINGS DURING THE PAST FIVE YEARS)
Indicate by check mark whether the registrant has filed all documents and reports required to be filed by Section 12, 13 or 15(d) of the Securities Exchange Act of 1934 subsequent to the distribution of securities under a plan confirmed by a court.
Yes ◻ No ◻
Pursuant to Rule 12b-23(a) of the Securities Exchange Act of 1934, as amended (the “Exchange Act”), the information for the 2025 Form 20-F of Rentokil Initial plc (the “Company”) set out below is being incorporated by reference from the Company’s Annual Report 2025 included as exhibit 15.1 to this Form 20-F (the “Annual Report 2025”).
Presentation of Financial and Other Information
References below to major headings include all information under such major headings, including subheadings, unless such reference is a reference to a subheading, in which case such reference includes only the information contained under such subheading. To the extent that any information incorporated by reference into this Form 20-F itself incorporates information by reference (including by way of internal cross reference), such information shall not form part of this Form 20-F. All references in this Form 20-F to “us”, “we” or “the Company” are to Rentokil Initial plc. Unless the context otherwise requires, “Rentokil Initial” or “Group” refers to the Company and its consolidated entities. Other information contained within the Annual Report 2025 included as exhibit 15.1 to this Form 20-F, including graphs and tabular data, is not included in this Form 20-F unless specifically identified below. Photographs are also not included. None of the websites referred to in the Annual Report 2025, including where a link or QR code is provided, nor any information contained on such websites is incorporated by reference in this Form 20-F.
In addition to the information set out below, the information set forth under the headings “Glossary” on page 227 and “Cautionary Statement” on page 228, in each case of the Annual Report 2025 included as exhibit 15.1 to this Form 20-F is incorporated by reference.
References herein to Rentokil Initial websites, including where a link is provided, are textual references only and information on or accessible through such websites does not form part of and is not incorporated into this Form 20-F. References to “audited” information (including graphs and tabular data) set forth under the heading “Corporate Governance—Directors’ Annual Remuneration Report-2025—Directors’ remuneration in the year to 31 December 2025” on pages 120 to 130 refer to procedures performed by the Company’s external auditor in accordance with International Standards on Auditing (UK) (‘ISAs (UK)’) and applicable law and does not form part of the “Report of Independent Registered Public Accounting Firm” on pages F-2 to F-4 of this Form 20-F.
Cautionary Note Regarding Forward-Looking Statements
In order, among other things, to utilise the ‘safe harbour’ provisions of the U.S. Private Securities Litigation Reform Act of 1995, we are providing the following cautionary statement:
This Form 20-F and the Annual Report 2025 contain statements that are, or may be, forward-looking regarding the Group’s results of operations, business strategy, plans and objectives, including, among other things, statements about the Group’s financial condition, liquidity, prospects, growth and the economic and business circumstances occurring from time to time in the countries and markets in which the Group operates. These statements are often, but not always, made through the use of words or phrases such as “believe”, “anticipate”, “could”, “shall”, “continues”, “may”, “would”, “is likely to”, “should”, “intend”, “seek”, “aim”, “plan”, “potential”, “predict”, “will”, “expect”, “estimate”, “project”, “positioned”, “strategy”, “outlook”, “target” and similar expressions or negatives of these expressions.
Although we believe that the forward-looking statements in this Form 20-F and the Annual Report 2025 are based on reasonable assumptions, such statements involve risk and uncertainty because they relate to future events and circumstances. There are accordingly a number of factors which might cause actual results and performance to differ materially from those expressed or implied by such statements, including, but not limited to, uncertainties related to the following:
| ● | our ability to integrate acquisitions successfully, or any unexpected costs or liabilities from our disposals; |
| ● | difficulties in integrating, streamlining and optimising our IT systems, processes and technologies, including artificial intelligence technologies; |
| ● | our ability to attract, retain and develop key personnel to lead our business; |
| ● | the availability of a suitably skilled and qualified labour force to maintain our business; |
| ● | cyber security breaches, attacks and other similar incidents, as well as disruptions or failures in our IT systems or data security procedures and those of our third-party service providers; |
| ● | inflationary pressures, such as increases in wages, fuel prices and other operating costs; |
1
| ● | weakening general economic conditions, including changes in the global job market or decreased consumer confidence or spending levels, especially as they may affect demand from our customers; |
| ● | our ability to implement our business strategies successfully, including achieving our growth objectives; |
| ● | our ability to retain existing customers and attract new customers; |
| ● | the highly competitive nature of our industries; |
| ● | extraordinary events that impact our ability to service customers without interruption due to a material incident, including a loss of our third-party distributors; |
| ● | the impact of environmental, social and governance (“ESG”) matters, including those related to climate change and sustainability, on our business, reputation, results of operations, financial condition and/or prospects; |
| ● | supply chain issues, which may result in product shortages, cost increases or other disruptions to our business; |
| ● | our ability to protect our intellectual property and other proprietary rights that are material to our business; |
| ● | our reliance on third parties, including third-party vendors for business process outsourcing initiatives, investment counterparties, and franchisees, and the risk of any termination or disruption of such relationships or counterparty default, fraudulent activity or litigation; |
| ● | any future impairment charges, asset revaluations or downgrades; |
| ● | failure to comply with the many laws and governmental regulations to which we are subject or the implementation of any new or revised laws or regulations that alter the environment in which we do business, as well as the costs to us of complying with any such changes and the risk of related litigation; |
| ● | termite damage claims and lawsuits related thereto and associated impacts on the termite provision; |
| ● | our ability to comply with safety, health and environmental policies, laws and regulations, including laws pertaining to the use of pesticides; |
| ● | any actual or perceived failure to comply with stringent, complex and evolving laws, rules, regulations and standards in many jurisdictions, as well as contractual obligations, including data privacy and security, and any litigation (including class action claims and lawsuits) related to such actual or perceived failures; |
| ● | the identification of a material weakness in our internal control over financial reporting within the meaning of Section 404 of the Sarbanes-Oxley Act; |
| ● | changes in tax laws and any unanticipated tax liabilities; |
| ● | adverse credit and financial market events and conditions, which could, among other things, impede access to, or increase, the cost of financing; |
| ● | the restrictions and limitations within the agreements and instruments governing our indebtedness; |
| ● | a lowering or withdrawal of the ratings, outlook or watch assigned to our debt securities by rating agencies; |
| ● | an increase in interest rates and the resulting increase in the cost of servicing our debt; and |
| ● | exchange rate fluctuations and the impact on our results or the foreign currency value of our American Depositary Shares (“ADSs”) and any dividends. |
Further details on the principal risks that may affect the Group can be found in the “Risks and Uncertainties” section detailed on pages 68 to 70 and the left column on page 71 and under the heading “Strategic Report—Responsible Business—Climate-related risk management” on page 62 (in relation to climate-related risks), in each case of the Company’s Annual Report 2025 included as exhibit 15.1 to this Form 20-F, as well as on pages F-51 to F-54 (in relation to financial risks) and under the heading Item 3.D “Risk Factors”, in each case of this Form 20-F.
Forward-looking statements speak only as of the date they are made and no representation or warranty, whether express or implied, is given in relation to them, including as to their completeness or accuracy or the basis on which they were prepared. Other than in accordance with the Company’s legal or regulatory obligations (including under the UK Listing Rules and the Disclosure Guidance and Transparency Rules), the Company does not undertake any obligation to update or revise publicly any forward-looking statement, whether as a result of new information, future events or otherwise. Information contained in this Form 20-F and the Annual Report 2025 relating to the Company or its share price, or the yield on its shares, should not be relied upon as an indicator of future performance. Nothing in this Form 20-F and the Annual Report 2025 should be construed as a profit forecast.
2
TABLE OF CONTENTS
3
PART I
ITEM 1. IDENTITY OF DIRECTORS, SENIOR MANAGEMENT AND ADVISERS
Not applicable.
ITEM 2. OFFER STATISTICS AND EXPECTED TIMETABLE
Not applicable.
ITEM 3. KEY INFORMATION
A. |
Reserved |
Reserved.
B. |
Capitalization and Indebtedness |
Not applicable.
C. |
Reason for the Offer and Use of Proceeds |
Not applicable.
D. |
Risk Factors |
You should carefully consider the factors described below, in addition to the other information set forth in this Form 20‑F. Providing route-based services carries various inherent risks and uncertainties that may affect our business. In this section, we describe the risks and uncertainties that we consider material to our business in that they may have a significant effect on our business, reputation, results of operations, financial condition and/or prospects.
These disclosures reflect our beliefs and opinions as to factors that could materially and adversely affect us and our securities in the future. References to past events are provided by way of example only and are not intended to be a complete listing or a representation as to whether or not such factors have occurred in the past or their likelihood of occurring in the future.
This Annual Report includes statements that may constitute “forward-looking statements” within the meaning of the Private Securities Litigation Reform Act of 1995, Section 27A of the Securities Act of 1933, as amended, and Section 21E of the Exchange Act. We believe that the forward-looking statements about Rentokil Initial in this Form 20-F, identified by words such as “believes”, “anticipates”, “could”, “shall”, “continues”, “may”, “would”, “is likely to”, “should”, “intends”, “seeks”, “aims”, “plans”, “potential”, “predicts”, “will”, “expects”, “estimates”, “projects”, “positioned”, “strategy”, “outlook”, “target” and similar expressions or negatives of these expressions, are based on reasonable assumptions. However, forward-looking statements involve inherent risks and uncertainties such as those summarised below. They relate to events that may occur in the future, that may be influenced by factors beyond our control and that may have actual outcomes materially different from our expectations. Therefore, other risks, unknown or not currently considered material, could have a material adverse effect on our financial condition or results of operations.
4
Risks Relating to Business Strategies and Operations
If we are unsuccessful in integrating acquisitions or if our disposals result in unexpected costs or liabilities, our business could be materially and adversely affected.
We have a strategy that includes growth by acquisition to extend our geographic footprint and to improve our market share in existing locations. For example, we acquired 36 new businesses in 2025, and we may continue to pursue strategic transactions in the future, which could involve acquisitions or disposals of businesses or assets. These acquisitions need to be integrated quickly and efficiently to minimise potential impact on the operations of the acquired business and the existing business. There are a number of risks to the successful integration of acquired businesses. These risks include, but are not limited to, the possibility that management may be distracted from regular business concerns by the need to integrate operations and that unforeseen difficulties can arise in integrating operations, systems, processes, pay plans, brands and customer offerings as well as difficulties in retaining and assimilating employees and customers. In addition, even where a diligent review of the businesses and/or properties acquired in connection with such acquisitions is performed in accordance with industry norms, such reviews may be incomplete and not necessarily reveal all existing, potential or reasonably foreseeable problems, including actual or contingent liabilities, or permit a full assessment of the deficiencies associated with the businesses or properties. Any acquisition that we make may not provide us with the benefits that were anticipated when entering into such acquisition, or the benefits may not occur within the time periods we anticipated. The realisation of such benefits may be affected by a number of factors, many of which are beyond our control. If we fail to (i) successfully integrate acquisitions into our existing organisational structures and IT systems, (ii) deliver the revenue and profit targets, or (iii) deliver any expected synergy benefits, such as cost savings, the acquired business may not achieve the expected financial and/or operational benefits which could lead to potential adverse short-term or long-term effects on our business, reputation, results of operations, financial condition and/or prospects. Our business may be required to recognise impairment charges or be subject to asset revaluations or downgrades by applying a value in use based test annually. We may also experience difficulties, costs or delays in migrating acquired businesses to our systems, processes and technologies.
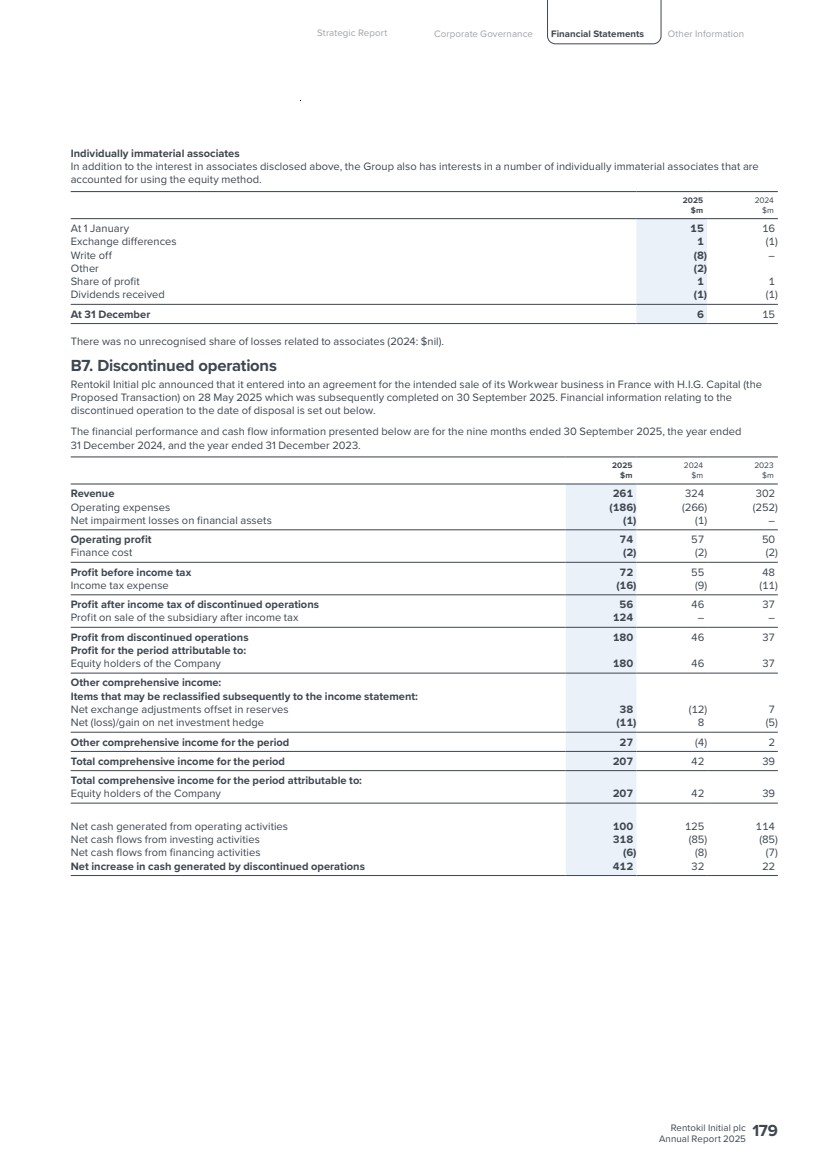
In addition, we have sold a number of our businesses in the past and expect to continue to dispose of businesses from time to time if consistent with our strategy. For example, the Group completed the disposal of its Workwear business in France to H.I.G. Capital on 30 September 2025. Under business sale contracts, we may provide warranties and indemnities to purchasers. Accordingly, we may make provisions in our consolidated financial statements for potential liabilities and costs relating to a disposed business. We may also make provisions in our consolidated financial statements for amounts to cover legal or regulatory claims which are known to be outstanding at the time of sale or which may subsequently become apparent. There can be no assurance that such provisions will be sufficient to cover potential liabilities and consequently disposals of our businesses may have a material adverse effect on our business, reputation, results of operations, financial condition and/or prospects.
We may experience difficulties integrating, streamlining and optimising our IT systems, processes and technologies, including artificial intelligence technologies.
We have invested in, and expect to continue to invest in, a wide range of new systems, processes and technologies intended to improve many aspects of our business, including those incorporating artificial intelligence (“AI”). These systems, processes and technologies impact customers, suppliers, employees and others, including new systems that integrate, streamline and enhance legacy operating IT systems. These activities have required, and may continue to require, significant investment of human and financial resources. We may experience significant delays, increased costs and other difficulties as a consequence of significant disruption or deficiency in implementing such systems, processes and technologies, which could adversely affect our ability to process work orders, send invoices, track and collect payments, fulfil contractual obligations or otherwise operate our business. In addition, our efforts to centralise various business processes within our organisation in connection with this implementation may disrupt operations and negatively impact our business, reputation, results of operations, financial condition and/or prospects.
In addition, a failure to integrate well-designed and properly functioning AI technologies could result in competitive disadvantages, increased costs associated with suboptimal utilisation of AI technology or additional resources to address issues and inefficiencies or non-compliance with applicable AI laws and regulations. Inability to adopt AI technology in an effective and compliant manner could result in reputational damage if we are perceived as being unable to effectively leverage emerging technologies and using data in a manner inconsistent with consumers’ ethical expectations and company values.
5
We depend on key personnel to lead our business.
Our continued success will depend largely on our ability to attract, retain, and develop a high calibre of talent and on the efforts and abilities of our executive officers and certain other key colleagues. As we continue to grow our business, make acquisitions, expand our geographic scope, and offer new products and services, we need the organisational talent necessary to ensure effective succession for executive officer and key colleague roles in order to meet the growth, development and profitability goals of our business. Our operations could be materially and adversely affected if, for any reason, we were unable to attract, retain or develop such officers or key colleagues and successfully execute organisational change and management transitions at leadership levels, or if we have to incur significant costs to retain such individuals or to identify, hire and retain replacements for departing employees. No assurance can be given that we will be able to attract or retain employees to the same extent that we have been able to attract or retain employees in the past.
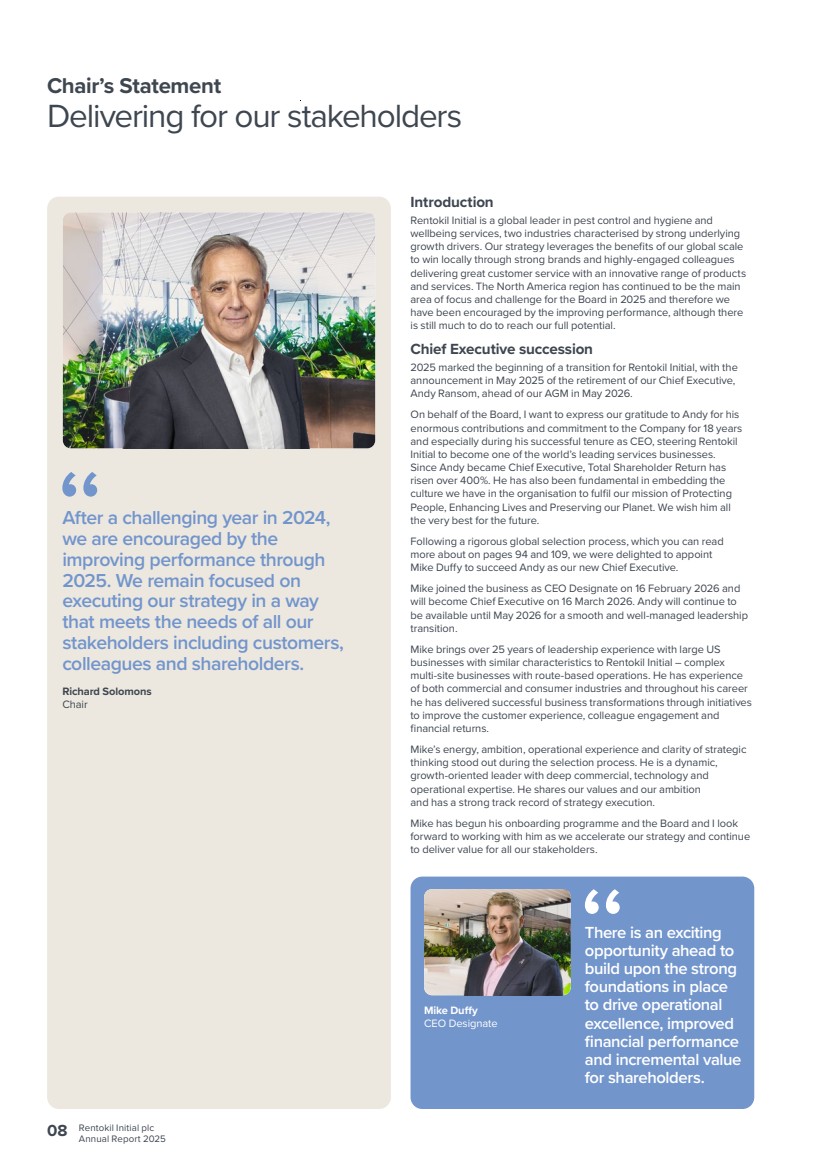
Mike Duffy was appointed as CEO and Executive Director effective on 16 March 2026, succeeding Andy Ransom, our CEO for the last 12 years. Whilst Andy will continue to work with us to ensure a smooth transition ahead of the Company’s annual general meeting on 7 May 2026, leadership transitions can be difficult to manage and may result in disruptions to our business and increase the likelihood of organisational changes and turnover of other key personnel. In addition, the change in leadership could impact our relationships with existing and potential customers, vendors and other third parties, which could result in a loss of business or otherwise hurt our prospects. Any of these events could have a material adverse effect on our business, reputation, results of operations, financial condition and/or prospects.
We depend on a suitably skilled and qualified labour force to maintain the business.
Our ability to maintain our customer service and execute our business strategy depends on our ability to attract and retain a suitably skilled and qualified labour force. There can be no assurance that we will be able to recruit, train and retain such a labour force in sufficient numbers or of sufficient quality, or that pressure to recruit will not lead to a significant increase in employee costs. In markets where overall employment rates are high, and/or our business is growing quickly, either organically or through acquisitions, we may have difficulties attracting, training and retaining operational personnel of suitable capability. In addition, changes in the global job market may cause, or continue to cause, difficulty in recruiting, training and retaining a suitably skilled and qualified labour force. As a result, we could experience difficulty in responding to customer calls in a timely fashion or delivering our services in a high-quality or timely manner, and could be forced to increase wages to attract, train and retain colleagues, which would result in higher operating costs and reduced profitability. Any of these factors may have a material adverse effect on our business, reputation, results of operations, financial condition and/or prospects.
Moreover, some of our colleagues are members of local trade unions and similar organisations. Industrial action in key operations could result in diminished customer service levels or higher costs and, if prolonged, could damage our reputation and ability to retain existing customers or acquire new customers. Although we believe that all of our operations have good relations with their colleagues and the trade unions that represent those colleagues (where applicable), there can be no assurance that work stoppages or other labour-related developments (including the introduction of new labour regulations in countries where we operate) will not adversely affect our business, reputation, results of operations, financial condition and/or prospects. In addition, potential competition from key colleagues who leave Rentokil Initial could impact our ability to maintain our market share in certain geographic areas.
6
Cyber security breaches, attacks and other similar incidents, as well as disruptions or failures in our IT systems or data security procedures and those of our third-party service providers, could expose us to liability, limit our ability to effectively monitor, operate and control operations and adversely impact our business, reputation, results of operations, financial condition and/or prospects.
Our business is dependent on effective IT systems and data security procedures. We and our third-party service providers may be subject to significant system or network disruptions from numerous causes, including cyber security breaches, attacks or other similar incidents, facility access issues, new system implementations, human error, fraud, theft, fire, power loss, telecommunications failure or a similar catastrophic event. Moreover, computer viruses, worms, malware, ransomware, phishing, spoofing, malicious or destructive code, social engineering, denial-of-service attacks, and other cyber attacks have become more prevalent and sophisticated in recent years. Because the techniques used by computer hackers and others to access or sabotage networks and computer systems constantly evolve and generally are not recognised until launched against a target, we and our third-party service providers may be unable to anticipate, detect, react to, counter or mitigate against all of these techniques or remediate any resulting incident. Cyber security risk has increased due to increased online and remote activity and we have in the past experienced, and may continue to experience, increases in the number and seriousness of cyber attacks, including distributed denial-of-service attacks and ransomware incidents. In 2025, our organisation encountered ten cyber security incidents, each effectively addressed through our established incident response protocol and none of which had a material impact on our business. All of these incidents were reported to the Board or Audit Committee, who have oversight of the risks from cyber security threats, by management, who are responsible for managing prevention, detection, mitigation and remediation of cyber security incidents. While similar attacks have previously been detected and mitigated before causing a material impact on the business, there remains a risk that more sophisticated cyber attacks in the future could evade detection or prevention and result in a material impact on our business, reputation, results of operations, financial condition and/or prospects.
Any IT system disruptions or breaches may lead to unauthorised release of data (including colleague, customer and supplier personal data that we hold) and inefficient business operations, including poor supply chain management, and have a negative impact on customer service, resulting in a loss of customers, which could have a material adverse effect on our business, reputation, results of operations, financial condition and/or prospects.
We may be required to expend significant additional resources to continue to modify or enhance our protective measures or to investigate or remediate any cyber security vulnerabilities, breaches, attacks or other similar incidents. Any cyber security incident, attack or other similar incident, or our failure to make adequate or timely disclosures to the public, regulators, or law enforcement agencies following any such event, could harm our competitive position, result in violations of applicable data privacy or cyber security laws or regulations, result in a loss of customer confidence in the adequacy of threat mitigation and detection processes and procedures, cause disruption to business activities, divert management attention and other resources or otherwise adversely affect our internal operations and reputation, degrade financial results, cause us to incur significant costs to remedy the damages caused by the incident or defend legal claims, subject us to additional regulatory scrutiny and expose us to civil litigation, fines, damages or injunctions. With respect to cyber security-related legal claims and regulatory scrutiny, we also may incur additional costs related to the diverse set of laws, rules and regulations to which we are subject across multiple jurisdictions.
Inflationary pressures, such as increases in wages, fuel prices and other operating costs, could adversely impact our business, results of operations, financial condition and/or prospects.
In the year ended 31 December 2025, global inflation rates have steadily declined from previous years, though rates vary significantly by country and region causing some increases in our operating costs and expenses. Whilst we have, to date, been able to pass on such cost increases to customers in the form of increased prices, we may not in the future be able to pass these cost increases on fully, or in a timely manner, to customers. Our financial performance may therefore be adversely affected by sudden or material increases in the level of our operating costs and expenses, which can be triggered by inflationary pressures. For example, fuel prices are subject to market volatility, and our fleet has been negatively impacted by significant increases in fuel prices in the past and could be negatively impacted in the future. In addition, we continue to monitor the adverse impacts of the ongoing conflict in the Middle East, the situation in Venezuela and the war in Ukraine and the associated sanctions against various Russian organisations, companies and individuals on the global economy in general and on our business operations, although we have no direct operations in Russia or Ukraine. Such events have increased fuel prices, and further prolonged conflicts may have further negative consequences such as increased inflation and transportation costs. Fuel price increases have also caused increases in the cost of chemicals and other materials used in our business. To the extent such costs increase further, we may be prevented, in whole or in part, from passing these cost increases on to our existing and prospective customers, which could have a material adverse impact on our results of operations, financial condition and/or prospects.
7
Weakening general economic conditions, including changes in the global job market or decreased consumer confidence or spending levels, especially as they may affect demand from our customers, may adversely impact our business, results of operations, financial condition and/or prospects.
Ongoing volatility in the global economic environment has led to, and may continue to lead to, economic challenges such as low gross domestic product growth in regional and national economies, high volatility in commodity prices and exchange rates and efforts made by governments to increase the minimum wage across markets, as well as wide variations in local market prices and cost inflation across the globe. This may be exacerbated by economic uncertainty caused by geopolitical events, political instability and civil unrest in some local markets, and catastrophic business events, including the continuation and/or broadening of the conflicts in Ukraine and the Middle East and/or the situation in Venezuela. Further economic slowdown or recessions in the markets in which we operate may lead to a reduction in the level of demand from our customers for existing and new services. Low-growth economies with inherent cost inflation may make it difficult for us to maintain profitability if we have weak pricing power in those markets, in particular, in areas of hyperinflation. Furthermore, adverse economic conditions may lead to an increased number of customers not renewing contracts or seeking to reduce prices leading to a reduction in profit margins and cash flows or being unable to pay for existing or additional services leading to an increase in bad debts. Our pricing may be impacted negatively by an increased presence of multinational competitors in the markets in which we operate or an increased reliance on key customer accounts in markets impacted by adverse economic conditions. The entry of multinational competitors may also make it difficult for us to maintain profitability by increasing the cost of acquisitions. Any of these events could have a material adverse effect on our business, reputation, results of operations, financial condition and/or prospects.
We may not successfully implement our business strategies, including achieving our growth objectives.
We may not be able to fully implement our business strategies or realise, in whole or in part within the expected time frames, the anticipated benefits of various growth plans or other initiatives. Our ability to implement our business strategy may be adversely affected by factors that we cannot foresee currently, such as unanticipated costs and expenses, pandemics and other global health crises, technological change, recession and economic slowdown, the level of interest rates, foreign exchange risks, failure to integrate acquisitions, a decline in the effectiveness of our marketing (including digital marketing) activities or disruptions in the supply chain. All of these factors may necessitate changes to our business strategy or adversely affect our business, reputation, results of operations, financial condition and/or prospects.
In addition, we will incur certain costs to achieve efficiency improvements, systems implementations and growth in our business, and we may not meet anticipated implementation timetables or stay within budgeted costs. As these efficiency improvements, system implementations and growth initiatives are implemented, we may not fully achieve expected cost savings and efficiency improvements, system implementations or growth rates, or these initiatives could adversely impact customer retention or our operations. Also, our business strategies may change in light of our ability to implement new business initiatives, competitive pressures, economic uncertainties or developments or other factors.
Our continued growth depends on our ability to retain existing customers and attract new customers.
Our ability to grow is dependent on our ability to retain existing customers and attract new customers. There can be no assurance that our strategy of using new technology and improved sales techniques to attract profitable new clients, up-selling and cross-selling to existing clients and focusing on retaining profitable business when renewing existing customer contracts will be successful. Moreover, failure to maintain consistently high levels of customer service, client management and sales capability, failure to adapt to local business and consumer needs and/or failure to win and retain profitable customers in the face of competition from competitors (including those with lower costs or which are willing to accept lower margins) may have a material adverse effect on our business, results of operations, financial condition and/or prospects. We must be sufficiently agile to develop and deliver products and services that meet local market needs. If we are not able to adapt to local business and consumer needs, our existing customers may choose not to renew contracts, reduce the use of our services across their operations or seek reductions in prices.
We must continue to develop products and services that meet the needs and expectations of our customer base, including to ensure the continued efficacy of our products in the target pest population. Furthermore, as technological developments disrupt the markets in which we operate and change service offerings across our industries, we may need to develop new products and services. In the future, products and services may interact with each other in new ways and enable new capabilities to be offered to consumers, such as systems that are networked and able to be monitored in real time. Our competitors may be earlier to embrace these new technological developments that are disruptive to the market or to develop more effective products, and a delay in our response may lead to adverse effects to our business, reputation, results of operations, financial condition and/or prospects.
8
Our industries are highly competitive.
We compete with a wide variety of competitors of varying sizes and face competition in many of the markets in which we operate. The growing presence of multinational competitors may increase the cost of acquisitions and/or drive down prices, impacting our profitability. Furthermore, the increased presence of facilities management companies in the markets in which we operate may also drive down prices and adversely impact the quality of our relationships with end customers. The principal methods of competition in our business include quality and speed of customer service, brand awareness and reputation, effective use of technology and systems, customer satisfaction, fairness of contract terms (including price and promotions), professional sales forces and referrals. We may be unable to compete successfully against current or future competitors, and the competitive pressures that we face may result in reduced market share, reduced pricing or an adverse impact on our reputation, business, results of operations, financial condition and/or prospects.
Extraordinary events may significantly impact our business if we are unable to ensure business continuity due to a material incident.
The ability to service customers without interruption is essential to our operations. Contingency plans are required to continue or recover operations following a disruption or incident but may not be adequate to enable us to continue or recommence trading without a loss of business. Such incidents may include (a) a significant cyber attack or IT failure which impacts our ability to plan efficient routing, or ability to invoice, and is not recovered quickly, (b) fire, flood or climate event impacting our premises or transportation/supply chain network preventing goods from being available to enable our technicians to service our customers, (c) industrial action by colleagues, or (d) where third parties are engaged for services, the termination of their engagement or business disruption could materially impact the business. Inability to restore or replace critical capacity to an agreed level within an agreed timeframe would prolong the impact of such disruption or incident and could lead to, among other things, negative publicity and reputational damage and could severely affect our business, reputation, results of operations, financial condition and/or prospects.
We have independent, third-party distributors, the loss of which could have an adverse effect on our business, reputation, results of operations, financial condition and/or prospects. Government shutdowns can have a material adverse effect on operations or cash flows by disrupting or delaying new product launches, renewals of registrations for existing products and receipt of import or export licences for raw materials or products.
War (including acts of terrorism or hostilities), natural or man-made disasters (including earthquakes or pandemics), water shortages or severe weather conditions, in particular enhanced by climate change, affecting the food service, hospitality, travel and other industries can cause a downturn in the business of our customers or impact our supply chain, which in turn can have a material adverse effect on our business, results of operations, financial condition or prospects. Hurricanes or other severe weather events impacting the local markets could materially and adversely affect our ability to obtain raw materials at reasonable cost, or at all, and could adversely affect our business. The health and safety of our colleagues in local markets could be harmed by the detrimental effects of natural and man-made disasters, which could have a material adverse effect on our business, reputation, results of operations, financial condition and/or prospects.
ESG matters, including those related to climate change and sustainability, may have an adverse effect on our business, reputation, results of operations, financial condition and/or prospects.
Ongoing activism related to ESG matters may hinder our access to capital, as investors may reconsider their capital investment as a result of their assessment or perception of our ESG practices. Customers, consumers, investors and other stakeholders are focusing on ESG issues, including climate change, water use, deforestation, plastic waste, human and animal health and welfare, chemical usage and other concerns. Changing customer preferences are resulting in, and may continue to result in, increased demands regarding reducing use of virgin plastics and packaging materials, including single-use and non-recyclable plastic packaging, and other components of our products and their impact on human and animal health, biodiversity, and environmental sustainability, a growing demand for natural, organic or non-toxic products and ingredients; or customer concerns or perceptions (whether accurate or inaccurate) regarding the effects of ingredients or substances present in certain products. Certain animal welfare advocacy groups may raise concerns regarding products such as glue boards, snap traps or other products perceived to have animal cruelty issues, and secondary poisoning of predators. These demands, perceptions and preferences could cause us to incur additional costs or to make changes to our operations to comply with such demands and customer preferences, and a delay in our response (or the failure to respond effectively) may lead to adverse effects to our business, results of operations and financial condition, and recruitment and retention of the labour force that we need.
9
Concern over climate change may result in new or increased legal and regulatory requirements to reduce or mitigate impacts to the environment. Increased regulatory requirements, including in relation to various aspects of ESG, such as disclosure requirements, may result in higher compliance costs or input costs of energy and raw materials, which may cause disruptions in the manufacture of our products, and these costs could have a material adverse effect on our results of operations and cash flows. Any failure to achieve our ESG goals or a perception (whether or not valid) of our failure to act responsibly with respect to ESG issues or to effectively respond to new, or changes in, legal or regulatory requirements concerning environmental or other ESG matters, or increased operating or manufacturing costs due to increased regulation, could adversely affect our business, reputation, results of operation, financial condition and/or prospects. In addition, we may also be adversely impacted as a result of conduct by contractors, customers or suppliers that fail to meet our or our stakeholders’ ESG standards.
Supply chain issues may result in product shortages, cost increases or disruptions to our business.
We have a complex global network of suppliers that continues to expand to meet increased customer demand and may, in the future, further evolve in response to market conditions. Although the majority of the products we use are generally available from multiple sources, and alternatives have been generally available in the event of disruption in the past, we could experience material disruptions in production and other supply chain issues on specific bespoke products (including as a result of recent global events impacting shipping or tariffs), which could result in out-of-stock conditions, and our results of operations and relationships with customers could be adversely affected (a) if new or existing suppliers are unable to meet any standards that we set or that are set by government or industry regulations or customers, (b) if we are unable to contract with suppliers at the quantity, quality and price levels needed for our business, or (c) if any of our key suppliers becomes insolvent, ceases or significantly reduces its operations or experiences financial distress.
Our inability to fully or substantially meet customer demand due to supply chain issues could result in, among other things, unmet consumer demand leading to reduced preference for our products or services in the future, customers purchasing products and services from competitors as a result of such shortage of products, strained customer relationships, termination of customer contracts, additional competition and new entrants into the market, and loss of potential sales and revenue, which could adversely affect our business, reputation, results of operations, financial condition and/or prospects.
We may not be able to adequately protect our intellectual property and other proprietary rights that are material to our business.
Our ability to compete effectively depends in part on our ability to obtain, maintain, protect, defend and enforce our intellectual property and other proprietary rights, including the service marks, trademarks, trade names and other intellectual property rights we own or licence, particularly our brand names, including Rentokil, Initial, Ambius, Terminix, Copesan, Assured, McCloud, Gregory, Ehrlich, Presto-X, Western Exterminator, Florida Pest Control, Bug Out, Steritech, PestConnect, Lumnia, Signature, Eradico, Cannon, Ultraprotect, Calmic, Pestfree365, Entotherm, Medentex, Boecker, Radar and Rapid Pro. We have not sought to register or protect all of our intellectual property, including our trademarks, either in the UK, the U.S. or in every jurisdiction in which they are or may be used. Furthermore, because of the differences in foreign trademark, patent and other intellectual property laws, we may not receive the same protection in other countries as we would in the UK or the U.S.
If we are unable to protect our intellectual property and other proprietary rights, including brand names, it could cause a material adverse impact on our business, reputation, results of operations, financial condition and/or prospects. Litigation may be necessary to enforce our intellectual property rights and protect our proprietary information, or to defend against claims by third parties that our products, services or activities infringe on their intellectual property rights.
We rely on third parties, including third-party vendors for business process outsourcing initiatives, investment counterparties, and franchisees. Any termination or disruption of such relationships or counterparty default, fraudulent activity or litigation could have a material adverse effect on our business.
Our strategy to increase profitability, in part, by reducing our costs of operations, and to mitigate and manage our exposure to financial risk, includes the implementation of certain business process outsourcing initiatives and entry into arrangements with investment counterparties, including lenders, insurers and derivative counterparties. As such, we are exposed to counterparty risk. Any disruption, termination or substandard performance of these outsourced services, including possible breaches by third-party vendors of their agreements with us, fraudulent activity by the counterparty or the failure of counterparties to discharge all or part of their obligations (including, for example, due to the deterioration of a counterparty’s actual or perceived creditworthiness) could adversely affect our reputation, customer and colleague relationships, results of operations and financial condition. Also, to the extent a third-party outsourcing provider or counterparty relationship is terminated, there is a risk of disputes or litigation and that we may not be able to enter into a similar agreement with an alternate provider in a timely manner or on terms that we consider favourable, and even if we find an alternate provider, or choose to insource such services or activities, there are significant risks associated with such transition.
10
In addition, to the extent we decide to terminate outsourcing services and insource such services, there is a risk that we may not have the capabilities to perform these services internally, resulting in a disruption to our business, which could adversely impact our business, reputation, results of operations, financial condition and/or prospects. We could incur costs, including personnel and equipment costs, to insource previously outsourced services like these, and these costs could adversely affect our results of operations and cash flows.
Third-party distributors, subcontractors, vendors and franchisees are independent third parties that we do not control, and who own, operate and oversee the daily operations of their businesses. If third party distributors, subcontractors, vendors and franchisees do not successfully operate their businesses in a manner consistent with required laws, standards and regulations, we could be subject to claims from regulators or legal claims for the actions or omissions of such third-party distributors, subcontractors, vendors and franchisees. In addition, our relationship with third-party distributors, subcontractors, vendors and franchisees could become strained (including resulting in litigation) and these strains in relationships or claims could have a material adverse impact on our business, reputation, results of operations, financial condition and/or prospects.
We may be required to recognise impairment charges or be subject to asset revaluations or downgrades.
We have significant amounts of goodwill and intangible assets, such as customer lists. In accordance with applicable accounting standards, goodwill and indefinite-lived intangible assets are not amortised and are subject to assessment for impairment by applying a value in use or fair value less cost to sell test annually, or more frequently if there are indicators of impairment, including:
| ● | observable indications that the asset’s value has declined significantly more than would be expected as a result of the passage of time or normal use; |
| ● | significant changes with an adverse effect on the entity that have taken place, or will take place in the near future, in the technological, market, economic or legal environment in which the entity operates, or in the market to which an asset is dedicated; |
| ● | market interest rates or other market rates of return on investments have increased, and those increases are likely to affect the discount rate used in calculating an asset’s value in use and decrease the asset’s recoverable amount materially; |
| ● | the carrying amount of the net assets of the entity is more than its market capitalisation; |
| ● | evidence that there is obsolescence or physical damage of the asset; |
| ● | significant changes with an adverse effect on the entity that have taken, or are expected to take place in the near future, in the extent to which, or manner in which, an asset is used or is expected to be used. These changes include the asset becoming idle, plans to discontinue or restructure the operation to which an asset belongs, plans to dispose of an asset before the previously expected date, and reassessing the useful life of an asset as finite rather than indefinite; and |
| ● | indication that the economic performance of an asset is, or will be, worse than expected. |
Based upon future economic and financial market conditions, our operating performance and other factors, including those listed above, we may incur impairment charges in the future, in respect of goodwill created and the value at which assets were recognised at completion. It is possible that such impairment, if required, could be material. Any future impairment charges that we are required to record could have a material adverse impact on our business, results of operations, financial condition and/or prospects.
Risks Relating to Legal and Compliance Matters
Government regulations and enforcement, and potential litigation, could have an adverse effect on our financial results.
As a global company, we are subject to many laws and governmental regulations across all of the countries in which we conduct business, including laws and regulations involving marketing, antitrust, anti-bribery, anti-fraud, anti-corruption, consumer protection, product liability, environmental, health and safety, employment laws, intellectual property, data privacy, compliance and other matters, as well as potential litigation, regulatory and administrative actions. If we are unable to comply with all applicable laws and regulations, it could negatively impact our business, results of operations, financial condition, reputation and/or prospects.
11
In addition, new or revised laws or regulations, or changes to the ways existing laws or regulations apply to our business, may alter the environment in which we do business, which could adversely impact our financial results. For example, the Economic Crime and Corporate Transparency Act introduced a new offence in the United Kingdom, effective from 1 September 2025, whereby an organisation can be held criminally liable for the failure to prevent fraud if reasonable internal procedures are not implemented to prevent the fraud. In addition, Provision 29 of the UK Corporate Governance Code 2024 requires boards to annually monitor, review, and declare the effectiveness of their material internal controls in their annual report, starting with annual reports in respect of the year beginning January 1, 2026.
In addition, we face litigation from time to time. Currently we are defending against multiple purported class action lawsuits, including one filed in November 2024 and one filed in April 2025, further details of which can be found under the heading “Financial Statements—Notes to the Consolidated Financial Statements—D3. Contingent liabilities” on page F-67 of this Form 20-F. We may also face exposure to potential future claims or litigation, including exposure to injunctive relief or damages granted by courts in respect of such claims. Regardless of the outcome of any litigation or claims, we may incur additional costs in defending against such claims. An unfavourable outcome or settlement in any litigation may have an adverse effect on our business, reputation, results of operations, financial condition and/or prospects. Additionally, any loss of Rentokil Initial plc’s status as a “foreign private issuer” would require us to comply with the reporting, disclosure, compliance and governance requirements that are applicable to U.S. domestic issuers and could result in significant additional legal, accounting and other expenses, as well as increased demands on management’s time.
While it is our policy and practice to comply with all legal and regulatory requirements applicable to our business, we cannot provide assurance that our internal control policies and procedures and ethics and compliance program will always protect us from acts committed by our colleagues or agents. A finding that we are in violation of, or out of compliance with, applicable laws or regulations could subject us to civil remedies, including fines, damages, injunctions, product recalls or withdrawal of licenses to operate, or criminal or civil sanctions, any of which could adversely affect our business, reputation, results of operations, financial condition and/or prospects. Even if a claim is unsuccessful, is without merit or is not fully pursued, the negative publicity surrounding such assertions regarding our products, processes or business practices could adversely affect our reputation and brand image.
Further, new legislation or regulations may result in increased costs to us indirectly to the extent suppliers increase prices of goods and services because of increased compliance costs, excise taxes or the reduced availability of raw materials. The enactment of unduly onerous and restrictive regulation could have a material adverse effect on our business, results of operations, financial condition and/or prospects.
Termite damage claims and lawsuits related thereto could increase our legal expenses and may adversely impact our business, reputation, results of operations, financial condition and/or prospects.
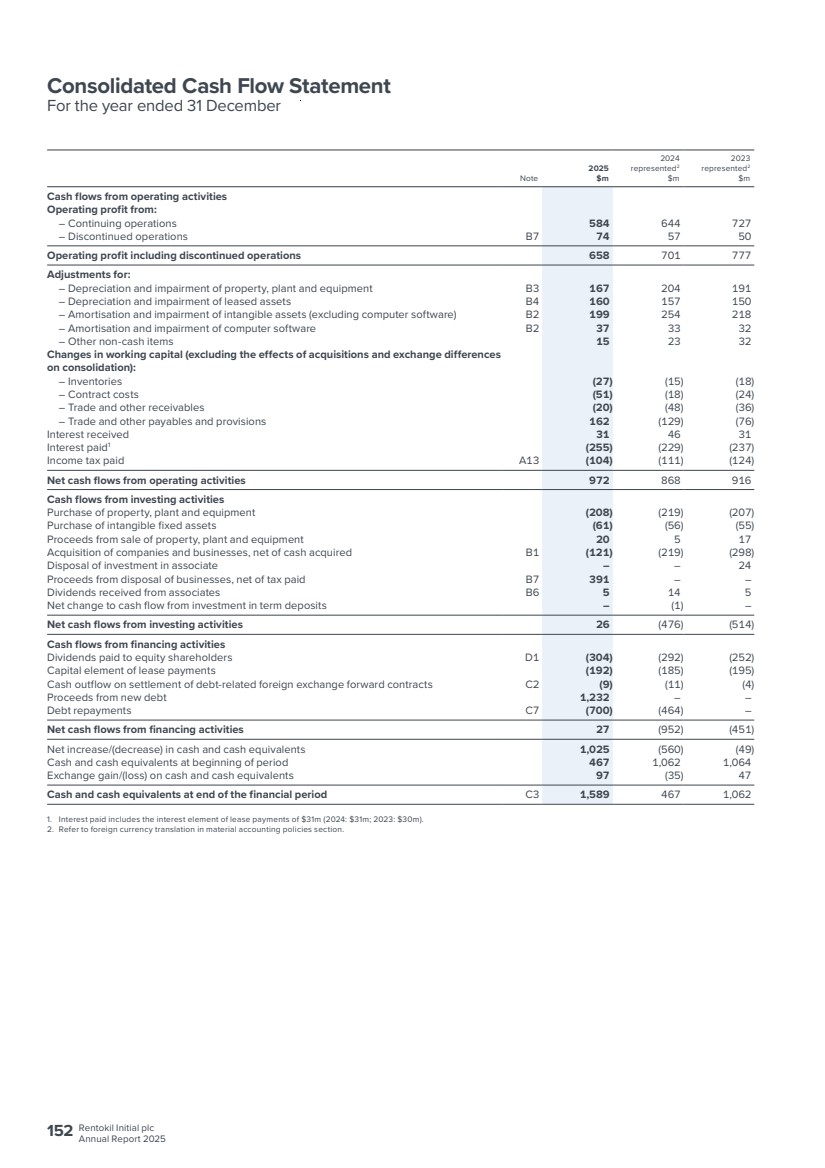
Our business may become subject to a significant number of damage claims related to termite activity in homes/commercial premises, often accompanied by a termite damage warranty/guarantee. Currently, the legacy Terminix business is subject to a significant number of damage claims related to its termite control services and termite damage warranties/guarantees. Damage claims may include circumstances when a customer notifies us that they have experienced damage, and we reach an agreement to remediate that damage (a “Non-litigated Claim”), and circumstances when a customer directly initiates litigation or arbitration proceedings or when we do not reach an agreement with a customer to remediate the damage and that customer initiates litigation or arbitration proceedings (a “Litigated Claim”). Some plaintiffs bringing Litigated Claims may seek to demonstrate a pattern and practice of fraud in connection with Litigated Claims and may seek awards, in addition to repair costs, which include punitive damages and damages for mental anguish. In 2025, we assessed the probable future cash outflows arising from termite damage claims. Due to factors such as inflation, the costs for settling claims and the accelerated settlement time to settle a claim, we have recognised additional provisions of $201 million. The closing provision was $384 million at 31 December 2025.
We intend to defend these Litigated Claims vigorously, and we have taken decisive actions to mitigate any increasing claims costs; however, we cannot give assurance that these mitigating actions will be effective in reducing claims or costs related thereto, and this could result in the costs of termite claims or litigation exceeding our accounting provision for termite claims, nor can we give assurance that lawsuits or other proceedings related to termite damage claims will not materially affect our business, reputation, results of operations, financial condition and/or prospects, even if any such lawsuits are found to be without merit.
12
Our business may also become subject to state regulator claims related to trade practices, including termite renewal pricing, inspection and treatment practices (a “Regulator Claim”). Terminix had entered into settlements in relation to such claims in the past and we intend to defend any future Regulator Claims. We also intend to take action to mitigate claims costs; however, we cannot give assurance that these mitigating actions will be effective in reducing claims or costs related thereto, nor can we give assurance that lawsuits or other proceedings related to trade practices will not materially affect our business, reputation, results of operations, financial condition and/or prospects.
Compliance with, or violation of, health and safety and environmental policies, laws and regulations, including laws pertaining to the use of pesticides, could result in significant costs that adversely impact our business, reputation, results of operations, financial condition and/or prospects.
We have an obligation to ensure that colleagues, customers and other stakeholders remain safe, that the working environment is not detrimental to health and that we are aware of and minimise any adverse impact on the environment. In addition, the pest control, hygiene and textile industries are subject to various laws and regulations regarding safety, health and environmental (“SHE”) matters. Among other things, these laws regarding SHE regulate the emission or discharge of materials into the environment, the use, storage, treatment, disposal, transportation and management of hazardous substances and wastes, the impact of chemicals (including fumigant gases), as well as pesticide and biocide products, on people and the environment, and the protection of the health and safety of our colleagues and the public.
These laws also impose liability for the costs of investigating and remediating, and damages resulting from, present and past releases of hazardous substances, including releases from former activities at sites or by prior owners or operators of sites we have acquired or that we currently own or operate. These laws and regulations can result in costs associated with transporting and managing hazardous materials and waste disposal and plant site clean-up, fines, penalties, orders requiring corrective action or suspending or otherwise impacting our operations or other sanctions if we are found to be in violation of law, as well as modifications, disruptions or discontinuation of certain operations or types of operations including product recalls and reformulations. Changes in such laws and regulations, including among others, air, water, chemical and product regulations, could impact the sales of some of our products or services. In addition to an increase in costs of manufacturing and delivering products, a change in production regulations or product regulations could result in interruptions to our business and potentially cause economic or consequential losses should we be unable to meet the demands of our customers for products.
Products that we use containing pesticides generally must be registered with the relevant governmental agencies or authorities before they can be sold or applied. The failure to obtain, or the cancellation of, any such registration, or the withdrawal from the marketplace of such pesticides, could have an adverse effect on our business, the severity of which would depend on the products involved, whether other products could be substituted and whether competitors were similarly affected. Most of the pesticides we use are manufactured by independent third parties and are evaluated by the relevant governmental authorities or agencies as part of our ongoing exposure risk assessment. Any of these authorities or agencies may decide that a pesticide we use will be limited or will not be re-registered for use in the relevant jurisdiction. We cannot predict the outcome or the severity of the effect of any particular authority’s or agency’s continuing evaluations. In addition, the use of certain pesticide products is regulated by various international, national, federal, state, provincial and local environmental and public health agencies and bodies. Some of our products or service models may also become subject to bans or restrictions due to animal cruelty concerns, such as permanent rodent baiting. Given our dispersed locations, distributed operations and numerous colleagues and franchise associates, we may be unable to prevent violations of these or other laws and regulations or misuse of products by colleagues or others from occurring. Even if we are able to comply with all such laws and regulations and obtain all necessary registrations and licences, the pesticides or other products we apply or use, or the manner in which we apply or use them, could be alleged to cause injury to the environment, to people or to animals, or such products could be banned in certain circumstances. The laws and regulations may also apply to third-party vendors who are hired to repair or remediate property and who may fail to comply with SHE laws and regulations and subject us to risk of legal exposure. The costs of compliance or the investigation and remediation of non-compliance, including combating reputational harm or defending civil or criminal proceedings, products liability, personal injury or other lawsuits, could have a material adverse impact on our business, reputation, results of operations, financial condition and/or prospects.
International, national, federal, state, provincial and local agencies and bodies regulate the disposal, handling and storage of waste, discharges from our facilities and the investigation and clean-up of impacted sites. We could incur significant costs, including investigation and remediation costs, fines, penalties and civil or criminal sanctions and claims by third parties for property damage and personal injury, as a result of violations of, or liabilities under, such laws and regulations enforced by these agencies and bodies. Liability under laws and regulations can be imposed on a joint and several basis and without regard to fault or the legality of the underlying conduct. In addition, potentially significant expenditures could be required to comply with SHE laws and regulations, including requirements or changes in expectations that may be adopted or imposed in the future.
13
A violation of SHE laws or regulations relating to our operations or a failure to comply with the instructions of relevant health and safety authorities, environmental agencies or internal policies could lead to, among other things, personal injury, substantial fines or penalties, including withdrawal of licences to operate, and reputational damage. Such violations could, therefore, have an adverse effect on our business, reputation, results of operations, financial condition and/or prospects.
We are required to comply with stringent, complex and evolving laws, rules, regulations and standards in many jurisdictions, as well as contractual obligations, relating to data privacy and security. Any actual or perceived failure to comply, or litigation related to such actual or perceived failure to comply, with these requirements could have a material adverse effect on our business.
We are required to comply with stringent, complex and evolving laws, rules, regulations and standards in many jurisdictions, as well as contractual obligations, relating to data privacy and security. Ensuring that our collection, use, transfer, storage and other processing of personal information complies with such requirements can increase operating costs, impact the development of new products or services, and reduce operational efficiency.
Internationally, virtually every jurisdiction in which we operate has established its own data privacy and security legal framework with which we must comply. The cost of compliance, and the potential for fines and penalties for non-compliance, with applicable data privacy and security laws and regulations may have a significant adverse effect on our business, reputation, results of operations, financial condition and/or prospects.
If we are otherwise unable to transfer personal data between and among countries and regions in which we operate, it could affect the manner in which we provide our services, the geographical location or segregation of our relevant systems and operations and could adversely affect our financial results. In addition, such procedures and controls, which we operate to comply with relevant data privacy and security requirements in the relevant jurisdictions, may not be effective in ensuring compliance or preventing unauthorised transfers of personal data.
While we strive to publish and prominently display privacy policies that are accurate, comprehensive and compliant with applicable laws, rules, regulations and industry standards, we cannot ensure that our privacy policies and other statements regarding our practices will be sufficient to protect us from claims, proceedings, liability or adverse publicity relating to data privacy and security. Although we endeavour to comply with our privacy policies, we may at times fail to do so or be alleged to have failed to do so. If our public statements about our use, collection, disclosure and other processing of personal information, whether made through our privacy policies, information provided on our website, press statements or otherwise, are alleged to be deceptive, unfair or misrepresentative of our actual practices, we may be subject to potential government or legal investigation or action.
Our compliance efforts are further complicated by the fact that data privacy and security laws, rules, regulations and standards around the world are evolving rapidly, may be subject to uncertain or inconsistent interpretations and enforcement, and may conflict among various jurisdictions. Any failure or perceived failure by us to comply with our privacy policies, or applicable data privacy and security laws, rules, regulations, standards or contractual obligations, or a security breach or deliberate action by colleagues or third parties that leads to theft or other unauthorised access to, or loss or unlawful destruction, use, modification, acquisition, disclosure, release or transfer of, personal information, including customer, colleague, supplier or our proprietary, sensitive or confidential data, may result in requirements to modify or cease certain operations or practices, the expenditure of substantial costs, time and other resources, proceedings or actions against us, legal liability, governmental investigations, enforcement actions, claims, fines, judgements, awards, penalties, sanctions and costly litigation (including class actions). Any of the foregoing could lead to significant reputational damage, distract management and technical personnel, increase our costs of doing business, adversely affect the demand for our products and services, and ultimately result in the imposition of liability, any of which could have a material adverse effect on our business, results of operations, financial condition and/or prospects.
14
Material weaknesses in our internal controls over financial reporting within the meaning of Section 404 of the Sarbanes-Oxley Act could adversely affect our ability to report our financial results accurately or in a timely manner, which may adversely affect our business and reputation.
We are required to comply with certain requirements under the Sarbanes-Oxley Act of 2002, as amended (the “Sarbanes-Oxley Act”), including the maintenance of adequate internal control over financial reporting. We are required to evaluate the effectiveness of our internal control over financial reporting and our independent registered public accounting firm is required to audit the effectiveness of our internal control over financial reporting in compliance with Section 404 of the Sarbanes-Oxley Act. While we have designed an internal control over financial reporting framework for the purposes of the effectiveness evaluation described above, if such controls fail, we may be subject to sanctions or investigations by regulatory authorities, including the U.S. Securities and Exchange Commission (the “SEC”) and the NYSE.
As of 31 December 2025, management has concluded that our internal control over financial reporting was effective. However, we may identify material weaknesses or control deficiencies in the future, and we cannot provide assurance that remediation efforts will be successful or that our internal control over financial reporting will be effective in accomplishing all control objectives. If a material weakness in our internal control over financial reporting is identified and not remediated in a timely manner, we could suffer material misstatements in our consolidated financial statements, fail to meet our reporting obligations or fail to prevent fraud, which may cause investors to lose confidence in our reported financial information, which in turn could have a material and adverse effect on the trading price of ordinary shares in the capital of Rentokil Initial plc, and subject us to potential delisting from the NYSE, regulatory investigations and civil or criminal sanctions. Failure to implement or maintain effective internal control systems required of public companies could also restrict our future access to the capital markets. Furthermore, we may need to incur additional costs and use additional management and other resources as our business and operations further expand or in an effort to remediate any significant control deficiencies that may be identified in the future.
Changes in tax laws and unanticipated tax liabilities could materially and adversely affect the taxes we pay and our profitability.
We operate across many different tax jurisdictions and are subject to changing tax laws, regulations and treaties in and between the jurisdictions in which we operate, as well as periodic tax audits which sometimes challenge the basis on which local tax has been calculated and/or withheld. Changes in tax regimes, or in the interpretation thereof, could result in a material impact on our cash tax liabilities and tax charges. For instance, we have a greater presence in the U.S. following the acquisition of Terminix, which means that changes to tax rules in the U.S. could have a more significant impact on our business. Such an impact could also arise from changes in the application of the existing tax rules that apply to us, including UK tax rules. In either case, this could result in a reduction in financial results depending upon the nature of the change. Further, we are subject to periodic tax audits across many different tax jurisdictions and successful challenges by local tax authorities may have an adverse impact on profitability and cash flow. Unanticipated non-compliance with relevant tax legislation and/or reporting requirements may result in material unprovided tax charges relating to prior years which could have a material adverse effect on our financial condition and/or prospects.
Risks Relating to Financial Markets
Adverse credit and financial market events and conditions could, among other things, impede access to, or increase, the cost of financing, which could have a material adverse impact on our business, results of operations, financial condition and/or prospects.
Disruptions in credit or financial markets could make it more difficult for us to obtain, or increase our cost of obtaining, financing for our operations or investments or to refinance our indebtedness, or cause lenders to depart from prior credit industry practice and not give technical or other waivers under applicable agreements governing such indebtedness to the extent we may seek them in the future, thereby causing us to be in default. There is no assurance that we will be able to refinance or extend the maturity of our indebtedness on favourable terms, or at all. Any inability to refinance our indebtedness on favourable terms could have a material adverse effect on our business, results of operations, financial condition and/or prospects.
15
The agreements and instruments governing our indebtedness contain restrictions and limitations that could impact our ability to operate our business.
As of 31 December 2025, we had aggregate outstanding indebtedness of approximately $6.1 billion. The agreement governing our revolving credit facility maturing October 2029 (the “RCF”), amongst other things, restricts our ability to: (a) transfer or sell assets by way of a Class 1 transaction (as such term was previously defined in the UK Listing Rules), (b) create security over our assets in excess of a certain amount, (c) issue debt instruments at subsidiary level in excess of a certain amount unless certain corporate guarantees are provided, and (d) issue trade instruments in excess of a certain amount. They also contain provisions that, in the event of a ratings downgrade by both S&P and Fitch to BB+ or below, a guarantee will be provided by Rentokil North America, Inc to lenders under the RCF and in respect of Notes issued. The senior unsecured notes issued by Rentokil Initial plc (due October 2028 and June 2032) and Rentokil Initial Finance B.V. (due June 2027 and June 2030), in each case pursuant to our Euro Medium Term Note Programme; and the senior unsecured notes issued by Rentokil Terminix Funding, L.L.C. (due April 2030 and April 2035) (collectively, the “Notes”) contain no such undertakings. Our ability to comply with the undertakings and restrictions contained in the agreement governing the RCF, the Notes and the instruments governing our other indebtedness may be affected by economic, financial and industry conditions beyond our control including credit or capital market disruptions. The breach of any of these covenants or restrictions could result in a default that would permit the applicable lenders or noteholders to declare all amounts outstanding thereunder to be due and payable, together with accrued and unpaid interest. In any such case, we may be unable to borrow under the RCF and/or any such other facility and may not be able to repay the amounts due under such facility or our other outstanding indebtedness. This could have materially adverse consequences to our business, reputation, results of operations, financial condition and/or prospects and could cause us to become bankrupt or insolvent.
A lowering or withdrawal of the ratings, outlook or watch assigned to our debt securities by rating agencies may increase our future borrowing costs and reduce our access to capital.
Our credit rating impacts the cost and availability of future borrowings and, accordingly, our cost of capital. Our credit rating reflects each credit rating organisation’s opinion of our financial and business strength, operating performance and ability to meet our debt obligations. Our public indebtedness has investment grade ratings, and any rating, outlook or watch assigned could be lowered or withdrawn entirely by a rating agency if, in that rating agency’s judgement, current or future circumstances change relating to the basis of the rating, outlook or watch, such as adverse changes to our business. Any future lowering of their ratings, outlook or watch likely would make it more difficult or more expensive for us to obtain debt financing. If our credit rating declines, we may not be able to sell additional debt securities, borrow money, refinance the transaction facilities (if drawn) or establish alternatives to the transaction facilities in the amounts or at the times or interest rates contemplated thereby (or at all), or upon more favourable terms and conditions that might be available if our current credit rating is maintained. The cost of certain of our existing indebtedness will also increase in the event that our credit rating becomes sub-investment grade.
An increase in interest rates would increase the cost of servicing our debt and could adversely impact our business, results of operations, financial condition and/or prospects.
The Term Facility bears interest at a floating rate. As a result, to the extent we have not hedged against rising interest rates, an increase in the applicable benchmark interest rates would increase the cost of servicing the debt in the future and could materially and adversely affect our results of operations, financial condition, liquidity and cash flows. In addition, if we refinance our indebtedness and interest rates increase between the time an existing financing arrangement was consummated and the time such financing arrangement is refinanced, the cost of servicing debt would increase, which could have a material adverse effect on our business, results of operations, financial condition and/or prospects.
Exchange rate fluctuations may adversely affect our results or the foreign currency value of our ADSs and any dividends.
The Rentokil Initial plc consolidated financial statements are expressed in U.S. dollars and are subject to movements in exchange rates on the translation of the financial information of businesses whose operational currencies are other than U.S. dollars. We earn revenues and incur costs in a range of other currencies, including the euro and pounds sterling, and significant fluctuations in these exchange rates could also impact our reported results significantly.
Additionally, our ordinary shares are quoted in pounds sterling on the LSE and our ADSs are quoted in U.S. dollars on the NYSE. Dividends to be paid to holders of our ADSs in respect of our ordinary shares, if any, will be paid in U.S. dollars in accordance with the deposit agreement among Rentokil Initial plc and the depositary and the holders from time to time of ADSs (the “Deposit Agreement”). Fluctuations in the exchange rate between the U.S. dollar and pounds sterling may also affect, among other matters, the value of our ADSs, ordinary shares and of any dividends in respect thereof.
16
ITEM 4. INFORMATION ON THE COMPANY
A. |
History and Development of the Company |
Rentokil Initial plc was incorporated on 15 March 2005. It is a public limited company domiciled in the UK. The Group has maintained a listing on the London Stock Exchange since 1969 (through Rentokil Initial 1927 plc), with the Company introduced as a new holding company in 2005. The Company is registered in England and Wales under the UK Companies Act 1985 with company registration number 05393279 and its registered office is at Compass House, Manor Royal, Crawley, West Sussex, RH10 9PY, UK (Tel: +44 (0)1293 858000). From March 2005 until June 2005, the Company was called Rentokil Initial 2005 plc. On 21 June 2005, the Company changed its name to Rentokil Initial plc.
In 1996, we acquired BET plc (British Electric Traction) and the “Initial” brand to become Rentokil Initial. In 2022, we acquired Terminix Global Holdings, Inc. (“Terminix”), the most recognised brand in U.S. termite and pest management services.
Our purpose is to protect people, enhance lives and preserve our planet. We protect people from the dangers of pest-borne disease and the risks of poor hygiene. We enhance lives with services that protect the health and wellbeing of people and the reputation of our customers’ brands. We aim to preserve the planet by developing ever more sustainable solutions and ways of operating.
The information (including tabular data) set forth under the following headings of the Annual Report 2025 included as exhibit 15.1 to this Form 20-F is incorporated by reference:
| ● | “Strategic Report—Our Businesses—Pest Control” on pages 26 to 31, excluding: |
| o | the column titled “Organic Growth” and the row under the heading “Organic Growth”, each in the table on page 26; |
| o | the three sentences beginning “Organic Revenue Growth…” under the subheading “Our revenue model” on page 26; |
| o | the sentence beginning “We acquired 31 Pest Control…” under the subheading “Our revenue model” on page 26; and |
| o | the caption titled “Revenues in year prior to acquisition” and the figure above such caption on page 26; |
| ● | “Strategic Report—Our Businesses—Hygiene & Wellbeing” on pages 32 to 33, excluding: |
| o | the column titled “Organic Growth” and the row under the heading “Organic Growth”, each in the table on page 32; |
| o | the sentences beginning “Organic Revenue Growth…” and “We acquired 5 Hygiene & Wellbeing…” under the subheading “Leveraging our leadership in Pest Control” on page 32; and |
| o | the caption titled “Revenues in year prior to acquisition” and the figure above such caption on page 32; |
| ● | “Strategic Report—Our Regions—North America” on pages 34 to 36, excluding: |
| o | the sentences beginning “Organic Revenue was…”, “Performance improved in…”, “North America Pest Control Services…”, “Organic Revenue Growth in…”, “Our distribution business delivered…” and “Bolt-on M&A activity continued…” under the subheading “Performance” on page 34; |
| o | the column titled “Organic Growth” and the three rows under the heading “Organic Growth”, each in the table on page 34; |
| o | the sentences beginning “We made good progress…”, “We continue to expect that…” and “We currently expect…” under the subheading “Business simplification and cost efficiencies” on page 35; |
| o | the sentence beginning “We are confident this…” under the subheading “Integrated Pay Plans” on page 36; |
17
| o | the sentences beginning “In 2025…” and “The largest business in the segment…” under the subheading “Strong Standalone Business” on page 36; |
| o | the caption beginning “CAGR through to 2030…” and the figure above such caption on page 36; and |
| o | the caption titled “Organic Growth across Business Services” and the figure above such caption on page 36; |
| ● | “Strategic Report—Our Regions—International” on page 37, excluding: |
| o | the sentences beginning “Organic Revenue was…”, “Performance improved in…” and “The International region acquired…” under the subheading “Performance” on page 37; |
| o | the column titled “Organic Growth” and the row under the heading “Organic Growth”, each in the table on page 37; and |
| ● | “Other Information—Directors’ Report—Company constitution” on page 221. |
Please also refer to the information set forth under the headings “Financial Statements—Notes to the Consolidated Financial Statements—B1. Business combinations” on pages F-39 to F-41 and “Financial Statements—Notes to the Consolidated Financial Statements—B5. Capital commitments” on page F-49 of this Form 20-F.
The SEC maintains a website at https://www.sec.gov which contains in electronic form each of the reports and other information that we have filed electronically with the SEC. Such information is also available on our website at https://www.rentokil-initial.com/investors. The information on our website is not incorporated by reference in this document.
B. |
Business Overview |
The information (including graphs and tabular data) set forth under the following headings of the Annual Report 2025 included as exhibit 15.1 to this Form 20-F is incorporated by reference:
| ● | “Strategic Report—Our Business at a Glance—A global leader in pest control and hygiene and wellbeing services” on pages 6 to 7; |
| ● | “Strategic Report—Chair’s Statement—Delivering for our stakeholders” on pages 8 to 9, excluding: |
| o | the sentence beginning “There were early signs…” under the subheading “Performance” on page 9; |
| ● | “Strategic Report—Letter from the Chief Executive—Executing our strategy” on pages 10 to 13, excluding: |
| o | the sentences beginning “For the year…” and “Organic Revenue Growth…” under the subheading “Building sustainable growth – a year of progress” on page 10; |
| o | the sentences beginning “We were encouraged…” and “All of this puts us…” under the subheading “Focus on execution in North America” on page 11; and |
| o | the sentences beginning “We have a target to…” and “This fuels our…” under the subheading “Focus on efficiency and disciplined capital allocation” on page 13; |
| ● | “Strategic Report—Reasons to Invest—A compelling investment opportunity of long-term compounding growth” on pages 14 to 15, excluding: |
| o | the caption “Organic Revenue Growth” and the figure above such caption on page 14; and |
| o | the sentence beginning “Any excess capital…” under the subheading “Strong Free Cash Flow” on page 15; |
18
| ● | “Strategic Report—Our Strategy and Business Model—Creating value for all stakeholders” on pages 16 to 19, excluding: |
| o | the sentence beginning “Our Group target…” under the subheading “Manage a responsible business” on page 17; |
| ● | “Strategic Report—Capital Allocation—Investing for value creation and sustainable growth” on pages 20 to 21, excluding: |
| o | The sentences beginning “Achieving our target Net Debt…” and “Our framework is underpinned…” under the subheading “Our capital allocation framework” on page 20; |
| o | the sentence beginning “In 2025 we have spent…” on page 21; and |
| o | the caption beginning “Total revenue in the year…” and the figure above such caption on page 21; |
| ● | “Strategic Report—Key Performance Indicators—Colleagues” on page 22; |
| ● | “Strategic Report—Key Performance Indicators—Customers” on page 23; |
| ● | “Strategic Report—Key Performance Indicators—Shareholders” on page 24, excluding: |
| o | the bullet point beginning “Revenue at AER was…” and all sub-bullet points under such bullet point under the subheading “Commentary on performance” on page 24; |
| ● | “Strategic Report—Our Businesses—Pest Control” on pages 26 to 31, excluding: |
| o | the column titled “Organic Growth” and the row under the heading “Organic Growth”, each in the table on page 26; |
| o | the three sentences beginning “Organic Revenue Growth…” under the subheading “Our revenue model” on page 26; |
| o | the sentence beginning “We acquired 31 Pest Control…” under the subheading “Our revenue model” on page 26; and |
| o | the caption titled “Revenues in year prior to acquisition” and the figure above such caption on page 26; |
| ● | “Strategic Report—Our Businesses—Hygiene & Wellbeing” on pages 32 to 33, excluding: |
| o | the column titled “Organic Growth” and the row under the heading “Organic Growth”, each in the table on page 32; |
| o | the sentences beginning “Organic Revenue Growth…” and “We acquired 5 Hygiene & Wellbeing…” under the subheading “Leveraging our leadership in Pest Control” on page 32; and |
| o | the caption titled “Revenues in year prior to acquisition” and the figure above such caption on page 32; |
| ● | “Strategic Report—Our Regions—North America” on pages 34 to 36, excluding: |
| o | the sentences beginning “Organic Revenue was…”, “Performance improved in…”, “North America Pest Control Services…”, “Organic Revenue Growth in…”, “Our distribution business delivered…” and “Bolt-on M&A activity continued…” under the subheading “Performance” on page 34; |
| o | the column titled “Organic Growth” and the three rows under the heading “Organic Growth”, each in the table on page 34; |
| o | the sentences beginning “We made good progress…”, “We continue to expect that…” and “We currently expect…” under the subheading “Business simplification and cost efficiencies” on page 35; |
| o | the sentence beginning “We are confident this…” under the subheading “Integrated Pay Plans” on page 36; |
19
| o | the sentences beginning “In 2025…” and “The largest business in the segment…” under the subheading “Strong Standalone Business” on page 36; |
| o | the caption beginning “CAGR through to 2030…” and the figure above such caption on page 36; and |
| o | the caption titled “Organic Growth across Business Services” and the figure above such caption on page 36; |
| ● | “Strategic Report—Our Regions—International” on page 37, excluding: |
| o | the sentences beginning “Organic Revenue was…”, “Performance improved in…” and “The International region acquired…” under the subheading “Performance” on page 37; and |
| o | the column titled “Organic Growth” and the row under the heading “Organic Growth”, each in the table on page 37; |
| ● | “Strategic Report—Responsible Business—Protecting People. Enhancing Lives. Preserving our Planet.” on pages 48 to 65, excluding: |
| o | the sentences beginning “Our focus is to implement…” and “During the year…” under the subheading “Task Force on Climate-related Financial Disclosures” on page 58; and |
| o | the sentence beginning “We aim to reach…” under the subheading “Potential transition risks (medium-long term)” on page 60; |
| ● | “Strategic Report—Risks and Uncertainties—How the business manages uncertainty and risks” on pages 68 to 70 and the left column on page 71; |
| ● | “Corporate Governance—Our Stakeholders” on pages 95 to 98; and |
| ● | “Cautionary Statement” on page 228. |
Please also refer to the information set forth under the heading “Financial Statements—Notes to the Consolidated Financial Statements—A1. Revenue recognition and operating segments” on pages F-16 to F-21 of this Form 20-F.
C. |
Organizational Structure |
The information (including tabular data) set forth under the following headings of the Annual Report 2025 included as exhibit 15.1 to this Form 20-F is incorporated by reference:
| ● | “Other Information—Directors’ Report—Company constitution” on page 221; and |
| ● | “Other Information—Directors’ Report—Branches” on page 223. |
Please also refer to the information set forth under the heading “Financial Statements—Related Undertakings” on pages F-69 to F-82 of this Form 20-F.
D. |
Property, Plants and Equipment |
As of 31 December 2025, Rentokil Initial leases executive offices in Crawley, UK and operates 2,081 facilities in 90 countries. The number and location of Rentokil Initial’s owned or leased production, manufacturing, storage and office properties for continuing operations are as follows:
|
|
North America |
|
International |
Total |
|
787 |
|
1,294 |
20
Please also refer to the information (including tabular data) set forth under the headings “Financial Statements—Notes to the Consolidated Financial Statements—B3. Property, plant and equipment” on pages F-45 to F-47, “Financial Statements—Notes to the Consolidated Financial Statements—B4. Leases” on pages F-47 to F-48 and “Financial Statements—Notes to the Consolidated Financial Statements—B5. Capital commitments” on page F-49, in each case of this Form 20-F.
ITEM 4A. UNRESOLVED STAFF COMMENTS
Not applicable.
ITEM 5. OPERATING AND FINANCIAL REVIEW AND PROSPECTS
A. |
Operating Results |
The information (including graphs and tabular data) set forth under the headings “Other Information—Management’s Discussion and Analysis of Financial Condition and Results of Operations—The impact of macroeconomic factors on the Group’s business” on page 207, “Other Information—Management’s Discussion and Analysis of Financial Condition and Results of Operations—Key indicators of performance and financial condition” on pages 207 to 208, “Other Information—Management’s Discussion and Analysis of Financial Condition and Results of Operations—Certain components of results of operations” on page 208, “Other Information—Management’s Discussion and Analysis of Financial Condition and Results of Operations—Results of operations” on pages 209 to 210, “Other Information—Management’s Discussion and Analysis of Financial Condition and Results of Operations—Revenue by geographical location” on pages 211 to 212, “Other Information—Management’s Discussion and Analysis of Financial Condition and Results of Operations—Revenue by business segment” on page 212, “Other Information—Management’s Discussion and Analysis of Financial Condition and Results of Operations—Operating expenses by geographic region” on page 213, “Other Information—Management’s Discussion and Analysis of Financial Condition and Results of Operations—Operating expenses by business segment” on page 214, “Other Information—Management’s Discussion and Analysis of Financial Condition and Results of Operations—Non-IFRS measures” on pages 215 to 219, “Other Information—Management’s Discussion and Analysis of Financial Condition and Results of Operations—Liquidity and capital resources” on pages 219 to 220 and “Cautionary Statement” on page 228, in each case of the Annual Report 2025 included as exhibit 15.1 to this Form 20-F is incorporated by reference.
Please also see the information above under the heading “Cautionary Note Regarding Forward-Looking Statements”.
B. |
Liquidity and Capital Resources |
The information (including graphs and tabular data) set forth under the headings “Other Information—Management’s Discussion and Analysis of Financial Condition and Results of Operations—Liquidity and capital resources” on pages 219 to 220, “Other Information—Management’s Discussion and Analysis of Financial Condition and Results of Operations—Cash flow activity” on pages 219 to 220 and “Cautionary Statement” on page 228, in each case of the Annual Report 2025 included as exhibit 15.1 to this Form 20-F is incorporated by reference.
Please also see the information above under the heading “Cautionary Note Regarding Forward-Looking Statements”.
C. |
Research and Development, Patents and Licenses |
Our major research and development facilities are based in the UK and the U.S., following the opening of the Rentokil Terminix North America Innovation Centre in March 2024.
The information set forth under the headings “Strategic Report—Our Businesses—Pest Control—Innovation is a core driver of performance” on page 29, “—Our innovation strategy” on page 29 and “—Product development to meet evolving customer needs” on pages 30 to 31 in each case of the Annual Report 2025 included as exhibit 15.1 to this Form 20-F is incorporated by reference.
Please also refer to the information set forth under the heading “Financial Statements—Notes to the Consolidated Financial Statements—B2. Intangible assets” on pages F-42 to F-45 of this Form 20-F.
21
D. |
Trend Information |
The information (including graphs and tabular data) set forth under the headings “Strategic Report—Financial Review—Funding” on page 41, “Other Information—Management’s Discussion and Analysis of Financial Condition and Results of Operations—The impact of macroeconomic factors on the Group’s business” on page 207, “Other Information—Management’s Discussion and Analysis of Financial Condition and Results of Operations—Key indicators of performance and financial condition” on pages 207 to 208 and “Cautionary Statement” on page 228, in each case of the Annual Report 2025 included as exhibit 15.1 to this Form 20-F is incorporated by reference.
Please also see the information above under the heading “Cautionary Note Regarding Forward-Looking Statements”.
E. |
Critical Accounting Estimates |
The information (including tabular data) set forth under the headings “Corporate Governance—Audit Committee Report—Financial reporting” and “—Significant issues and judgements” on page 102 and “Other Information—Management’s Discussion and Analysis of Financial Condition and Results of Operations—Key indicators of performance and financial condition” on pages 207 to 208, in each case of the Annual Report 2025 included as exhibit 15.1 to this Form 20-F is incorporated by reference.
Please also refer to the information set forth under the heading “Financial Statements—Notes to the Consolidated Financial Statements—Material accounting policies—Sources of estimation uncertainty and significant accounting judgements” on pages F-14 to F-15, in each case of this Form 20-F.
ITEM 6. DIRECTORS, SENIOR MANAGEMENT AND EMPLOYEES
A. |
Directors and Senior Management |
The information (including tabular data) set forth under the headings “Corporate Governance—Snapshot of our Board” on page 79, “Corporate Governance—Board of Directors” on pages 80 to 81, “Corporate Governance— Our Governance” on pages 84 to 94, “Corporate Governance—2025 Directors’ Remuneration Policy—Recruitment—Directors’ service agreements-Executive Directors” on page 137 and “Other Information—Directors’ Report—Re-election of Directors” and “—Directors’ interests” on page 221, in each case of the Annual Report 2025 included as exhibit 15.1 to this Form 20-F is incorporated by reference.
In addition to the Board of Directors, the Executive Leadership Team (“ELT”) supports the Chief Executive in managing the business, overseeing safety, performance, operational plans and actions, governance and risk management. The Board delegates the execution of the Company’s strategy and the day-to-day management of the business to the Chief Executive. The Chief Executive cascades authority to the ELT through a documented Group Authority Schedule, which the Board reviews annually. The information set forth under the heading “Corporate Governance—Executive Leadership Team” on pages 82 and 83 of the Annual Report 2025 included as exhibit 15.1 to this Form 20-F is incorporated by reference.
B. |
Compensation |
The information (including graphs and tabular data) set forth under the following headings of the Annual Report 2025 included as exhibit 15.1 to this Form 20-F is incorporated by reference:
| ● | “Corporate Governance—Directors’ Remuneration Report” on pages 113 to 115, excluding: |
| o | the sentence beginning “This is due to…” under the subheading “Key decisions in 2025” on page 113; |
| ● | “Corporate Governance—Remuneration at a glance” on pages 116 and 117, excluding: |
| o | the caption “Organic Revenue Growth” and the figure and text below such caption on page 116; and |
| o | the caption “North America Organic Revenue Growth (12.8% of bonus)” and the accompanying graphic under the subheading “Bonus” on page 117; |
22
| ● | “Corporate Governance—Directors’ Annual Remuneration Report-Introduction” on pages 118 and 119; |
| ● | “Corporate Governance—Directors’ Annual Remuneration Report-2025” on pages 120 to 130, excluding: |
| o | the “Result” column of the chart titled “NA Organic Revenue Growth” on page 121; |
| o | the two sentences beginning “Delivered increase in Revenue…” and the two sentences beginning “Restored Organic Revenue Growth…” in the row titled “Revenue” on page 122; and |
| o | the two sentences beginning “36 acquisitions completed…” in the row titled “M&A” on page 122; |
| ● | “Corporate Governance—Directors’ Annual Remuneration Report-Looking forward 2026” on pages 131 to 133; and |
| ● | “Corporate Governance—Summary of the 2024 Directors’ Remuneration Policy” on pages 134 to 139. |
Please also refer to the information set forth under the headings “Financial Statements—Notes to the Consolidated Financial Statements—A9. Employee benefit expense” on pages F-29 to F-30, “Financial Statements—Notes to the Consolidated Financial Statements—A10. Retirement benefit obligations” on pages F-30 to F-33, “Financial Statements—Notes to the Consolidated Financial Statements—A11. Share-based payments” on pages F-33 to F-35, “Financial Statements—Notes to the Consolidated Financial Statements—D4. Related party transactions—Key management personnel” on page F-68 and “Financial Statements—Notes to the Consolidated Financial Statements—D5. Post balance sheet events” on page F-68, in each case of this Form 20-F.
C. |
Board Practices |
The information (including graphs and tabular data) set forth under the following headings of the Annual Report 2025 included as exhibit 15.1 to this Form 20-F is incorporated by reference:
| ● | “Corporate Governance—Chair’s Governance Overview” on page 78; |
| ● | “Corporate Governance—Snapshot of our Board” on page 79; |
| ● | “Corporate Governance—Board of Directors” on pages 80 to 81; |
| ● | “Corporate Governance—Our Governance” on pages 84 to 94, excluding: |
| o | the sentence beginning “In July and December…” under the subheading “Strategy” on page 91; |
| ● | “Corporate Governance—Audit Committee Report” on pages 99 to 106; |
| ● | “Corporate Governance—Nomination Committee Report” on pages 107 to 112; |
| ● | “Corporate Governance—Directors’ Remuneration Report” on pages 113 to 115, excluding: |
| o | the sentence beginning “This is due to…” under the subheading “Key decisions in 2025” on page 113; |
| ● | “Corporate Governance—Remuneration at a glance” on pages 116 and 117, excluding: |
| o | the caption “Organic Revenue Growth” and the figure and text below such caption on page 116; and |
| o | the caption “North America Organic Revenue Growth (12.8% of bonus)” and the accompanying graphic under the subheading “Bonus” on page 117; |
| ● | “Corporate Governance—Directors’ Annual Remuneration Report-Introduction” on pages 118 and 119; |
23
| ● | “Corporate Governance—Directors’ Annual Remuneration Report-2025” on pages 120 to 130, excluding: |
| o | the “Result” column of the chart titled “NA Organic Revenue Growth” on page 121; |
| o | the two sentences beginning “Delivered increase in Revenue…” and the two sentences beginning “Restored Organic Revenue Growth…” in the row titled “Revenue” on page 122; and |
| o | the two sentences beginning “36 acquisitions completed…” in the row titled “M&A” on page 122; |
| ● | “Corporate Governance—Directors’ Annual Remuneration Report-Looking forward 2026” on pages 131 to 133; |
| ● | “Corporate Governance—Summary of the 2024 Directors’ Remuneration Policy” on pages 134 to 139; and |
| ● | “Other Information—Directors’ Report—Re-election of Directors” on page 221. |
Please also see the information above under the heading Item 6A “Directors and Senior Management”.
D. |
Employees |
The information set forth under the headings “Strategic Report—Responsible Business—Colleagues and culture” on pages 50 to 51, “Corporate Governance—Our Stakeholders—Colleagues” on page 96, “Corporate Governance—Directors’ Annual Remuneration Report - 2025—Remuneration in context—Wider workforce remuneration policy” on page 128, “—Wider workforce engagement” on page 128, “—Consideration of cost-of-living challenges” on page 128 and “Other Information—Directors’ Report—Engagement with employees, suppliers, customers, and others” on page 223, in each case of the Annual Report 2025 included as exhibit 15.1 to this Form 20-F is incorporated by reference.
Please also refer to the information set forth under the heading “Financial Statements—Notes to the Consolidated Financial Statements—A9. Employee benefit expense” (including the tabular data) on pages F-29 to F-30 of this Form 20-F.
The following table sets forth the number of Group employees as at 31 December 2025, 2024 and 2023.
Colleagues by region as at 31 December |
|
2025 |
|
2024 |
|
2023 |
North America |
|
21,161 |
|
22,128 |
|
21,965 |
International |
|
42,227 |
|
46,357 |
|
40,966 |
Total |
|
63,388 |
|
68,485 |
|
62,931 |
E. |
Share Ownership |
The information (including graphs and tabular data) set forth under the headings “Corporate Governance—Directors’ Remuneration Report—Key decisions in 2025—Performance Share Plan (PSP) vesting” on page 114, “Corporate Governance—Directors’ Remuneration Report—Key decisions in 2025—2025 PSP grant” on page 114, “—Use of discretion” on page 114 and “—Strategic alignment of pay” on page 114, “Corporate Governance—Directors’ Annual Remuneration Report-2025—Performance Share Plan (PSP) and Deferred Bonus Plan (DBP) awards” on pages 123 to 125 and “Corporate Governance—Directors’ Annual Remuneration Report-2025—Directors’ shareholdings and share interests” on pages 126 to 127, in each case of the Annual Report 2025 included as exhibit 15.1 to this Form 20-F is incorporated by reference.
Please also refer to the information set forth under the heading “Financial Statements—Notes to the Consolidated Financial Statements—A11. Share-based payments” on pages F-33 to F-35 of this Form 20-F.
24
Directors’ Share Interests
The interests of Directors and their connected persons in the ordinary share capital of the Company (including any interests held through ADSs) as at 19 March 2026 are set out below.
|
|
Number of ordinary shares |
|
Percentage of issued ordinary shares |
Richard Solomons |
|
84,900 |
|
* |
Mike Duffy(1) |
|
80,000 |
|
* |
Andy Ransom(2) |
|
2,301,466 |
|
* |
Paul Edgecliffe-Johnson |
|
— |
|
* |
Brian Baldwin(3) |
|
64,600,000 |
|
2.56% |
David Frear (4) |
|
16,875 |
|
* |
Sally Johnson |
|
12,263 |
|
* |
Sam Mitchell(5) |
|
16,725 |
|
* |
Sarosh Mistry(6) |
|
1,850 |
|
* |
John Pettigrew |
|
55,000 |
|
* |
Leanne Sheraton |
|
— |
|
* |
Cathy Turner |
|
24,736 |
|
* |
Linda Yueh |
|
1,590 |
|
* |
* Less than 1%
| (1) | Mike Duffy was appointed as CEO and Executive Director effective on 16 March 2026. His share ownership of 80,000 shares are held as 16,000 ADSs. |
| (2) | Andy Ransom stepped down as CEO and Executive Director on 16 March 2026. As such, this table reflects his interest at 16 March 2026. Andy Ransom has an interest in 2,865,003 vested PSP shares from the 2016, 2017, 2018, 2019, 2020, 2021 and 2022 awards, which he has not yet exercised. These figures are not included in his beneficial interest of Rentokil Initial ordinary shares figure as at 16 March 2026 above but are included in the share award table below. |
| (3) | Brian Baldwin’s share ownership includes 64,600,000 ordinary shares beneficially owned by Trian Fund Management, L.P. as a connected person. Brian Baldwin disclaims beneficial ownership over such ordinary shares. |
| (4) | David Frear’s share ownership of 16,875 shares are held as 3,375 ADSs by his PCA (person closely associated), the David John Frear Revocable Trust. |
| (5) | Sam Mitchell’s share ownership of 16,725 shares are held as 3,345 ADSs by his PCA (person closely associated), Samuel J. Mitchell, Jr. Revocable Trust. |
| (6) | As Sarosh Mistry stepped down from the Board on 31 July 2025, this table reflects his interest at 31 July 2025. |
Executive Directors and ELT Members’ Share Interests
The table below sets out the number of Rentokil Initial ordinary shares held as at 19 March 2026 by each Executive Director. Rentokil Initial ordinary shares owned outright include those held by connected persons.
|
|
|
|
|
|
|
|
|
|
|
Interest in PSP |
|
Interest in PSP |
|
|
|
|
|
|
|
|
|
|
|
|
|
and DBP |
|
and DBP |
|
Interest in PSP |
|
|
|
|
|
|
|
|
|
Ordinary |
|
awards |
|
awards |
|
and RSP |
|
|
|
|
|
|
Value of |
|
shares |
|
available to |
|
subject to |
|
awards subject |
|
|
|
Shareholding |
|
Number of |
|
shareholding as |
|
owned outright |
|
exercise |
|
holding |
|
to performance |
|
|
|
requirement as |
|
ordinary shares |
|
at 19 March |
|
as a % of |
|
as at |
|
period as at |
|
conditions as at |
|
|
|
a % of salary |
|
owned outright |
|
2026(1) |
|
salary |
|
19 March 2026 |
|
19 March 2026 |
|
19 March 2026 |
|
Mike Duffy(2) |
|
400 |
% |
80,000 |
|
£ |
374,506 |
|
31.4 |
% |
— |
|
— |
|
1,472,765 |
Andy Ransom(3) |
|
400 |
% |
2,301,466 |
|
£ |
10,775,464 |
|
1036.1 |
% |
3,063,623 |
|
851,366 |
|
2,579,671 |
Paul Edgecliffe-Johnson |
|
300 |
% |
— |
|
£ |
— |
|
— |
% |
— |
|
— |
|
1,192,891 |
25
| (1) | The share price is based on the Company’s closing share price on 19 March 2026 of 468.2p. |
| (2) | Mike Duffy was appointed as CEO and Executive Director effective on 16 March 2026. His share ownership of 80,000 shares are held as 16,000 ADSs. |
| (3) | As Andy Ransom stepped down as CEO and Executive Director on 16 March 2026, this table reflects his interest at 16 March 2026. He is required to maintain his shareholding of 400% of salaries for 2 years post-cessation. |
The interests of ELT members and their connected persons in the ordinary share capital of the Company (including any interests held through ADSs) as at 19 March 2026 are set out below.
|
|
Number of ordinary shares |
|
Percentage of issued ordinary shares |
Rachel Canham |
|
1,571 |
|
* |
Vanessa Evans |
|
17,087 |
|
* |
Mark Gillespie |
|
14,611 |
|
* |
Chris Hunt(1) |
|
16,639 |
|
* |
Alain Moffroid |
|
1,064,060 |
|
* |
Mark Purcell |
|
80,812 |
|
* |
Fabrice Quinquenel |
|
256,136 |
|
* |
Andrew Stone |
|
— |
|
* |
Brian Webb |
|
11,124 |
|
* |
Phill Wood |
|
— |
|
* |
* Less than 1%
| (1) | Includes interest held through 148 ADSs. Each ADS represents five ordinary shares. |
26
Total PSP and DBP Awards held by ELT Members
The tables below set out the number of PSP and DBP awards held (i) by Andy Ransom as at 16 March 2026, the date he stepped down as CEO and Executive Director and (ii) by Mike Duffy and Paul Edgecliffe Johnson as at 19 March 2026. No such awards are held by any other Director.
|
|
|
|
|
|
|
|
|
|
|
|
|
|
Ordinary |
|
|
|
|
|
|
|
|
|
|
|
|
|
|
|
|
|
|
|
|
|
|
shares |
|
|
|
|
|
|
|
|
|
|
|
|
|
|
|
|
Ordinary |
|
Ordinary |
|
|
|
available |
|
|
|
Ordinary |
|
|
|
|
|
|
|
|
|
|
|
|
shares |
|
shares |
|
Dividend |
|
for |
|
|
|
shares |
|
|
|
|
|
|
|
|
Share price |
|
|
|
awarded |
|
lapsed |
|
equivalent |
|
exercise |
|
Dividend |
|
exercised |
|
|
|
|
|
|
|
|
used to |
|
|
|
during |
|
during |
|
ordinary |
|
during |
|
equivalent |
|
during |
|
Outstanding |
|
|
|
|
|
|
determine |
|
Scheme interest |
|
1 Jan 2025 |
|
1 Jan 2025 |
|
shares |
|
1 Jan 2025 |
|
shares at |
|
1 Jan 2025 |
|
awards |
|
Performance |
|
|
Date of award |
|
award |
|
at 1 Jan 2025 |
|
to 16 March 2026 |
|
to 16 March 2026 |
|
at vest |
|
to 16 March 2026 |
|
exercise |
|
to 16 March 2026 |
|
at 16 March 2026 |
|
period end |
2015 PSP1 |
|
|
|
|
|
|
|
|
|
|
|
|
|
|
|
|
|
|
|
|
|
|
Andy Ransom |
|
31/03/2015 |
|
135.5 |
p |
883,906 |
|
— |
|
— |
|
— |
|
883,906 |
|
80,558 |
|
964,464 |
5 |
— |
|
30/03/2018 |
2016 PSP1 |
|
|
|
|
|
|
|
|
|
|
|
|
|
|
|
|
|
|
|
|
|
|
Andy Ransom |
|
12/05/2016 |
|
159.4 |
p |
869,324 |
|
— |
|
— |
|
— |
|
869,324 |
|
— |
|
— |
|
869,324 |
|
10/03/2019 |
2017 PSP1 |
|
|
|
|
|
|
|
|
|
|
|
|
|
|
|
|
|
|
|
|
|
|
Andy Ransom |
|
31/03/2017 |
|
246.4 |
p |
562,676 |
|
— |
|
— |
|
— |
|
562,676 |
|
— |
|
— |
|
562,676 |
|
30/03/2020 |
2018 PSP1 |
|
|
|
|
|
|
|
|
|
|
|
|
|
|
|
|
|
|
|
|
|
|
Andy Ransom |
|
29/03/2018 |
|
271.2 |
p |
487,350 |
|
— |
|
— |
|
— |
|
487,350 |
|
— |
|
— |
|
487,350 |
|
28/03/2021 |
Andy Ransom |
|
14/05/2018 |
|
271.2 |
p |
121,837 |
|
— |
|
— |
|
— |
|
121,837 |
|
— |
|
— |
|
121,837 |
|
13/05/2021 |
2019 PSP1 |
|
|
|
|
|
|
|
|
|
|
|
|
|
|
|
|
|
|
|
|
|
|
Andy Ransom |
|
25/03/2019 |
|
346.6 |
p |
547,805 |
|
— |
|
— |
|
— |
|
547,805 |
|
— |
|
— |
|
547,805 |
|
24/03/2022 |
2019 DBP4 |
|
|
|
|
|
|
|
|
|
|
|
|
|
|
|
|
|
|
|
|
|
|
Andy Ransom |
|
25/03/2019 |
|
346.6 |
p |
74,457 |
|
— |
|
— |
|
— |
|
74,457 |
|
— |
|
— |
|
74,457 |
|
24/03/2022 |
2020 DBP4 |
|
|
|
|
|
|
|
|
|
|
|
|
|
|
|
|
|
|
|
|
|
|
Andy Ransom |
|
24/03/2020 |
|
358.6 |
p |
124,163 |
|
— |
|
— |
|
— |
|
124,163 |
|
— |
|
— |
|
124,163 |
|
23/03/2023 |
2020 PSP |
|
|
|
|
|
|
|
|
|
|
|
|
|
|
|
|
|
|
|
|
|
|
Andy Ransom |
|
08/09/2020 |
|
530.2 |
p |
276,011 |
|
— |
|
— |
|
— |
|
276,011 |
|
— |
|
— |
|
276,011 |
|
07/09/2023 |
2021 PSP |
|
|
|
|
|
|
|
|
|
|
|
|
|
|
|
|
|
|
|
|
|
|
Andy Ransom |
|
23/03/2021 |
|
494.4 |
p |
224,321 |
|
— |
|
— |
|
— |
|
224,321 |
|
— |
|
— |
|
224,321 |
|
23/03/2024 |
Andy Ransom |
|
18/05/2021 |
|
468.5 |
p |
71,016 |
|
— |
|
— |
|
— |
|
71,016 |
|
— |
|
— |
|
71,016 |
|
18/05/2024 |
2022 PSP3 |
|
|
|
|
|
|
|
|
|
|
|
|
|
|
|
|
|
|
|
|
|
|
Andy Ransom |
|
04/03/2022 |
|
497.6 |
p |
659,415 |
|
— |
|
444,380 |
|
16,289 |
|
231,324 |
|
— |
|
— |
|
231,324 |
|
04/03/2025 |
2022 DBP4 |
|
|
|
|
|
|
|
|
|
|
|
|
|
|
|
|
|
|
|
|
|
|
Andy Ransom |
|
22/03/2022 |
|
507.2 |
p |
124,211 |
|
— |
|
— |
|
3,195 |
|
127,406 |
|
— |
|
— |
|
127,406 |
|
22/03/2025 |
2023 DBP4 |
|
|
|
|
|
|
|
|
|
|
|
|
|
|
|
|
|
|
|
|
|
|
Andy Ransom |
|
21/03/2023 |
|
561.0 |
p |
114,078 |
|
114,078 |
|
— |
|
— |
|
— |
|
— |
|
— |
|
114,078 |
|
21/03/2026 |
2023 PSP |
|
|
|
|
|
|
|
|
|
|
|
|
|
|
|
|
|
|
|
|
|
|
Andy Ransom |
|
30/03/2023 |
|
572.2 |
p |
590,647 |
|
590,647 |
|
— |
|
— |
|
— |
|
— |
|
— |
|
590,647 |
|
30/03/2026 |
2024 DBP4 |
|
|
|
|
|
|
|
|
|
|
|
|
|
|
|
|
|
|
|
|
|
|
Andy Ransom |
|
21/03/2024 |
|
471.5 |
p |
— |
|
83,221 |
|
— |
|
— |
|
— |
|
— |
|
— |
|
83,221 |
|
21/03/2027 |
2024 PSP |
|
|
|
|
|
|
|
|
|
|
|
|
|
|
|
|
|
|
|
|
|
|
Andy Ransom |
|
26/03/2024 |
|
463.8 |
p |
— |
|
750,556 |
|
— |
|
— |
|
— |
|
— |
|
— |
|
750,556 |
|
26/03/2027 |
Andy Ransom |
|
03/09/2024 |
|
479.6 |
p |
— |
|
87,347 |
|
— |
|
— |
|
— |
|
— |
|
— |
|
87,347 |
|
03/09/2027 |
2025 PSP |
|
|
|
|
|
|
|
|
|
|
|
|
|
|
|
|
|
|
|
|
|
|
Andy Ransom |
|
11/03/2025 |
|
338.8 |
p |
— |
|
1,151,121 |
|
— |
|
— |
|
— |
|
— |
|
— |
|
1,151,121 |
|
11/03/2028 |
|
|
|
|
|
|
|
|
|
|
|
|
|
|
Ordinary shares |
|
|
|
|
|
|
|
|
|
|
|
|
|
|
|
|
Ordinary shares |
|
Ordinary shares |
|
|
|
available |
|
|
|
Ordinary shares |
|
|
|
|
|
|
|
|
Share price |
|
|
|
awarded |
|
lapsed |
|
Dividend |
|
for exercise |
|
Dividend |
|
exercised |
|
|
|
|
|
|
|
|
used to |
|
Scheme |
|
during 1 Jan |
|
during 1 Jan |
|
equivalent |
|
during 1 Jan |
|
equivalent |
|
during 1 Jan |
|
Outstanding |
|
|
|
|
Date of |
|
determine |
|
interest at |
|
2025 to 19 |
|
2025 to 19 |
|
ordinary shares |
|
2025 to 19 |
|
shares at |
|
2025 to 19 |
|
awards at 19 |
|
Performance |
|
|
award |
|
award |
|
1 Jan 2025 |
|
March 2026 |
|
March 2026 |
|
at vest |
|
March 2026 |
|
exercise |
|
March 2026 |
|
March 2026 |
|
period end |
2025 PSP |
|
|
|
|
|
|
|
|
|
|
|
|
|
|
|
|
|
|
|
|
|
|
Paul Edgecliffe Johnson |
|
11/03/2025 |
|
338.8 |
p |
— |
|
686,245 |
|
— |
|
— |
|
— |
|
— |
|
— |
|
686,245 |
|
11/03/2028 |
2026 PSP |
|
|
|
|
|
|
|
|
|
|
|
|
|
|
|
|
|
|
|
|
|
|
Paul Edgecliffe Johnson |
|
10/03/2026 |
|
458.9 |
p |
— |
|
506,646 |
|
— |
|
— |
|
— |
|
— |
|
— |
|
506,646 |
|
31/12/2028 |
|
|
|
|
|
|
|
|
|
|
|
|
|
|
|
ADS6 |
|
|
|
|
|
|
|
|
|
|
|
|
|
|
|
|
|
ADS6 |
|
ADS6 |
|
|
|
available |
|
|
|
ADS6 |
|
|
|
|
|
|
|
|
Share price |
|
|
|
awarded |
|
lapsed |
|
Dividend |
|
for exercise |
|
Dividend |
|
exercised |
|
|
|
|
|
|
|
|
|
used to |
|
Scheme |
|
during 1 Jan |
|
during 1 Jan |
|
equivalent |
|
during 1 Jan |
|
equivalent |
|
during 1 Jan |
|
Outstanding |
|
|
|
|
|
Date of |
|
determine |
|
interest at |
|
2025 to 19 |
|
2025 to 19 |
|
ordinary shares |
|
2025 to 19 |
|
shares at |
|
2025 to 19 |
|
awards at 19 |
|
Performance |
|
|
|
award |
|
award |
|
1 Jan 2025 |
|
March 2026 |
|
March 2026 |
|
at vest |
|
March 2026 |
|
exercise |
|
March 2026 |
|
March 2026 |
|
period end |
|
2026 Buyout PSP |
|
|
|
|
|
|
|
|
|
|
|
|
|
|
|
|
|
|
|
|
|
|
|
Mike Duffy |
|
06/03/2026 |
|
$ |
31.16 |
|
— |
|
64,184 |
|
— |
|
— |
|
— |
|
— |
|
— |
|
64,184 |
|
06/09/2029 |
2026 Buyout RSP7 |
|
|
|
|
|
|
|
|
|
|
|
|
|
|
|
|
|
|
|
|
|
|
|
Mike Duffy |
|
06/03/2026 |
|
$ |
31.16 |
|
|
|
40,436 |
|
|
|
|
|
|
|
|
|
|
|
40,436 |
|
06/09/2029 |
2026 PSP |
|
|
|
|
|
|
|
|
|
|
|
|
|
|
|
|
|
|
|
|
|
|
|
Mike Duffy |
|
10/03/2026 |
|
$ |
31.59 |
|
— |
|
189,933 |
|
— |
|
— |
|
— |
|
— |
|
— |
|
189,933 |
|
31/12/2028 |
(1)Shares held by Andy Ransom under the 2016, 2017, 2018, 2019, 2020, 2021 and 2022 PSP awards are vested but unexercised and total 2,865,003.
27
(2)PSP awards are entitled to receive dividend equivalents in the form of shares based on dividend payments between the date of grant and vesting. These are included in the total shares at vest. The awards granted prior to 2021 are also entitled to receive dividend equivalents in the form of shares post vesting based on dividend payments between the date of vest and the date one month before exercise. These shares are applied at exercise.
(3)The 2022 PSP award partially vested at 32.6%.
(4)The DBP awards are subject to a three-year holding period, but are not subject to any performance or service conditions.
(5)Andy Ransom exercised his 2015 PSP awards on 26 March 2025. He exercised a total of 964,464 shares, with a share price on exercise of £3.56 per share, giving a total value on exercise of £3,436,675, which was a gain of £2,129,826 compared with the grant price value of these awards. He sold 453,914 shares at a value of £1,617,431 to cover taxes due.
(6)Mike Duffy’s awards have been granted as ADSs. 1 ADS is equivalent to 5 ordinary shares.
(7)20,218 ADSs will vest on 6 March 2028 and 20,218 ADSs will vest on 6 March 2029.
The table below sets out the number of PSP awards held as at 19 March 2026 by each ELT member.
|
|
|
|
Ordinary shares |
|
Ordinary shares |
|
|
|
|
|
|
available for |
|
exercised |
|
Outstanding |
|
|
Scheme interest |
|
exercise 1 Jan 2025 |
|
1 Jan 2025 to |
|
awards at |
|
|
at 1 Jan 2025 |
|
to 19 March 2026 |
|
19 March 2026 |
|
19 March 2026 |
Rachel Canham(1) |
|
309,268 |
|
101,205 |
|
— |
|
491,199 |
Vanessa Evans(2) |
|
536,514 |
|
315,060 |
|
— |
|
729,660 |
Mark Gillespie(3) |
|
357,178 |
|
212,765 |
|
27,637 |
|
455,439 |
Chris Hunt(4) |
|
473,109 |
|
334,195 |
|
88,863 |
|
506,737 |
Alain Moffroid(5) |
|
260,020 |
|
28,941 |
|
28,941 |
|
785,137 |
Mark Purcell(6) |
|
499,214 |
|
332,623 |
|
135,173 |
|
566,848 |
Fabrice Quinnquenel(7) |
|
185,532 |
|
18,503 |
|
18,503 |
|
404,068 |
Andrew Stone(8) |
|
299,057 |
|
169,398 |
|
21,885 |
|
392,551 |
Brian Webb(9) |
|
316,278 |
|
194,882 |
|
881 |
|
414,124 |
Phill Wood(10) |
|
696,995 |
|
463,369 |
|
1,639 |
|
897,973 |
(1)The expiration date of the awards outstanding on 19 March 2026 by Rachel Canham are as follows: (i) 227,418 on 6 September 2032, (ii) 68,813 on 30 March 2033, (iii) 94,329 on 26 March 2034, (iv) 129,132 on 11 March 2035 and (v) 97,720 on 10 March 2036.
(2)The expiration date of the awards outstanding on 19 March 2026 by Vanessa Evans are as follows: (i) 105,244 on 29 March 2028, (ii) 90,263 on 25 March 2029, (iii) 50,713 on 8 September 2030, (iv) 41,216 on 23 March 2031, (v) 27,624 on 4 March 2032 (vi) 72,350 on 30 March 2033, (vii) 95,954 on 26 March 2034, (viii) 140,200 on 11 March 2035 and (ix) 106,096 on 10 March 2036.
(3)The expiration date of the awards outstanding on 19 March 2026 by Mark Gillespie are as follows: (i) 49,143 on 31 March 2027, (ii) 45,075 on 29 March 2028, (iii) 38,658 on 25 March 2029, (iv) 20,048 on 8 September 2030, (v) 21,726 on 23 March 2031, (vi) 17,479 on 4 March 2032, (vii) 47,906 on 30 March 2033, (viii) 62,874 on 26 March 2034, (ix) 86,685 on 11 March 2035 and (x) 65,845 on 10 March 2036.
(4)The expiration date of the awards outstanding on 19 March 2026 by Chris Hunt are as follows: (i) 48,975 on 31 March 2027, (ii) 16,660 on 4 September 2027, (iii) 71,511 on 29 March 2028, (iv) 40,256 on 25 March 2029, (v) 32,174 on 8 September 2030, (vi) 26,148 on 23 March 2031, (vii) 17,524 on 4 March 2032, (viii) 45,901 on March 2033, (ix) 59,292 on 26 March 2034, (x) 84,415 on 11 March 2035 and (xi) 63,881 on 10 March 2036.
(5)The expiration date of the awards outstanding on 19 March 2026 by Alain Moffroid are as follows: (i) 177,790 on 30 June 2026, (ii) 73,586 on 30 March 2033, (iii) 101,808 on 26 March 2034, (iv) 253,543 on 11 March 2035 and (v) 178,410 on 10 March 2036.
28
(6)The expiration date of the awards outstanding on 19 March 2026 by Mark Purcell are as follows: (i) 40,086 on 31 March 2027, (ii) 36,404 on 29 March 2028, (iii) 57,265 on 25 March 2029, (iv) 30,281 on 8 September 2030, (v) 24,610 on 23 March 2031, (vi) 16,495 on 4 March 2032, (vii) 54,002 on 30 March 2033, (viii) 80,853 on 26 March 2034, (ix) 129,132 on 11 March 2035 and (x) 97,720 on 10 March 2036.
(7)The expiration date of the awards outstanding on 19 March 2026 by Fabrice Quinquenel are as follows: (i) 32,729 on 30 March 2026, (ii) 96,062 on 26 March 2027, (iii) 127,320 on 11 March 2028 and (iv) 147,957 on 10 March 2036.
(8)The expiration date of the awards outstanding on 19 March 2026 by Andrew Stone are as follows: (i) 26,983 on 31 March 2027, (ii) 27,389 on 29 March 2028, (iii) 21,999 on 25 March 2029, (iv) 31,463 on 10 September 2029, (v) 25,909 on 8 September 2030, (vi) 15,961 on 4 March 2032, (vii) 43,076 on 30 March 2033, (viii) 55,872 on 26 March 2034, (ix) 83,028 on 11 March 2035 and (x) 60,871 on 10 March 2036.
(9)The expiration date of the awards outstanding on 19 March 2026 by Brian Webb are as follows: (i) 46,976 on 31 March 2027, (ii) 43,079 on 29 March 2028, (iii) 37,222 on 25 March 2029, (iv) 28,313 on 8 September 2030, (v) 23,011 on 23 March 2031, (vi) 15,422 on 4 March 2032, (vii) 40,393 on 30 March 2033, (viii) 51,329 on 26 March 2034, (ix) 73,078 on 11 March 2035 and (x) 55,301 on 10 March 2036.
(10)The expiration date of the awards outstanding on 19 March 2026 by Phill Wood are as follows: (i) 125,974 on 31 March 2027, (ii) 112,158 on 29 March 2028, (iii) 96,192 on 25 March 2029, (iv) 54,045 on 8 September 2030, (v) 43,923 on 23 March 2031, (vi) 29,438 on 4 March 2032, (vii) 77,103 on 30 March 2033, (viii) 99,881 on 26 March 2034, (ix) 147,579 on 11 March 2035 and (x) 111,680 on 10 March 2036.
F. |
Disclosure of a registrant’s action to recover erroneously awarded compensation |
Not applicable.
ITEM 7. MAJOR SHAREHOLDERS AND RELATED PARTY TRANSACTIONS
A. |
Major Shareholders |
The information (including graphs and tabular data) set forth under the headings “Other Information—Directors’ Report—Share capital” on pages 221 to 222 and “Other Information—Directors’ Report—Major shareholders” on page 222, in each case of the Annual Report 2025 included as exhibit 15.1 to this Form 20-F is incorporated by reference.
Between 1 January 2026 and 19 March 2026, the following persons had disclosed an interest in the issued ordinary share capital of the Company in accordance with the requirements of rules 5.1.2 or 5.1.5 of the UK Listing Authority’s Disclosure Guidance and Transparency Rules (“DTR 5”):
| ● | Swedbank Robur Fonder AB notified the Company on 20 February 2026 that its interest had decreased to 75,055,369 ordinary shares (2.97% of issued share capital); |
| ● | GIC Private Limited notified the Company about an acquisition or disposal of shares on four occasions, the latter of which was on 11 March 2026 that its interest had increased to 80,503,946 ordinary shares (3.19% of issued share capital); |
| ● | BlackRock, Inc. notified the Company about an acquisition of shares on two occasions, the latter of which was on 13 March 2026 that its interest had increased to 312,131,771 ordinary shares (12.33% of issued share capital); and |
| ● | Independent Franchise Partners, LLP notified the Company about an acquisition or disposal of shares on two occasions, the latter of which was on 16 January 2026 that it held 125,795,910 ordinary shares (4.98% of issued share capital). |
29
As of 31 December 2025, the following persons had disclosed an interest in the issued ordinary share capital of the Company in accordance with the requirements of DTR 5:
| ● | GIC Private Limited notified the Company about an acquisition or disposal of shares on five occasions, the latter of which was on 4 December 2025 that its interest had decreased to 125,250,650 ordinary shares (4.96% of issued share capital); |
| ● | Swedbank Robur Fonder AB notified the Company on 4 December 2025 that it held 76,308,258 ordinary shares (3.02% of issued share capital). This was Swedbank Robur Fonder AB’s initial notification under DTR 5; |
| ● | BlackRock, Inc. notified the Company on three occasions, the latter of which was 27 October 2025 that its interest had increased to 253,863,914 ordinary shares (10.02% of issued share capital); and |
| ● | Independent Franchise Partners, LLP notified the Company on 7 April 2025 that it held 126,734,383 ordinary shares (5.00% of issued share capital). This was Independent Franchise Partners, LLP’s initial notification under DTR 5. Independent Franchise Partners, LLP subsequently notified the company on 26 November 2025 that its interest had decreased to 123,979,675 ordinary shares (4.91% of issued share capital). |
As of 31 December 2024, the following persons had disclosed an interest in the issued ordinary share capital of the Company in accordance with the requirements of DTR 5:
| ● | BlackRock, Inc. notified the Company on two occasions, the latter of which was on 11 November 2024 that its interest had decreased to 154,286,083 ordinary shares (6.09% of issued share capital); |
| ● | Janus Henderson Group plc notified the Company on 10 July 2024 that it held 126,574,561 ordinary shares (5.01% of issued share capital). This was Janus Henderson Group plc’s initial notification under DTR 5. Janus Henderson Group plc subsequently notified the Company on two separate occasions, the latter of which was on 09 September 2024 that its interest had increased to 132,128,126 ordinary shares (5.23% of issued share capital). (Janus Henderson Group plc also disclosed on a Schedule 13G filed with the US Securities and Exchange Commission on 14 November 2024 that it beneficially owned 135,517,488 ordinary shares (5.4% of issued share capital) as of 30 September 2024.); |
| ● | GIC Private Limited notified the Company on two occasions, the latter of which was on 25 June 2024 that its interest had increased to 126,256,312 ordinary shares (5.00% of issued share capital); and |
| ● | The Capital Group Companies, Inc. notified the Company on 26 April 2024 that its interest had decreased to 119,645,760 ordinary shares (4.73% of issued share capital). |
As of 31 December 2023, the following persons had disclosed an interest in the issued ordinary share capital of the Company in accordance with the requirements of DTR 5:
| ● | GIC Private Limited notified the Company on 3 November 2023 that its interest had increased to 75,807,848 ordinary shares (3.01% of issued share capital); |
| ● | The Capital Group Companies, Inc. notified the Company on 27 April 2023 that its interest had increased to 128,953,806 ordinary shares (5.12% of issued share capital); and |
| ● | The Goldman Sachs Group, Inc. notified the Company on two occasions, the latter of which was on 31 October 2023, disclosing a holding of 63,099,871 ordinary shares (2.50% of issued share capital). |
Information provided to the Company pursuant to DTR 5 is published on a Regulatory Information Service and on our website.
30
As of 31 December 2025, 9,001 record holders with registered addresses in the UK held 2,515,057,397 ordinary shares which represented 99.57% of the Company’s share capital. Some of these shares are held by nominees and so these numbers may not accurately represent the number of ordinary shares beneficially owned in the UK.
B. |
Related Party Transactions |
The information set forth under the headings “Other Information—Directors’ Report—Related party transactions” on page 223 of the Annual Report 2025 included as exhibit 15.1 to this Form 20-F is incorporated by reference.
Please also refer to the information set forth under the headings “Financial Statements—Notes to the Consolidated Financial Statements—B6. Investments in associated undertakings” on pages F-49 and “Financial Statements—Notes to the Consolidated Financial Statements—D4. Related party transactions” on pages F-67 to F-68, in each case of this Form 20-F.
C. |
Interests of Experts and Counsel |
Not applicable.
ITEM 8. FINANCIAL INFORMATION
A. |
Consolidated Statements and Other Financial Information |
Please see the information below under the heading Item 18 “Financial Statements”. The information (including graphs and tabular data) set forth under the headings “Strategic Report—Reasons to Invest—How we win” on page 15, “Strategic Report—Our Strategy and Business Model—Our business model—Capital allocation” on page 18, “Strategic Report—Capital Allocation—Investing for value creation and sustainable growth” on pages 20 to 21, “Strategic Report—Financial Review—Dividend” on page 41, “Other Information—Directors’ Report—Dividend” on page 221 and “Other Information—Additional Shareholder Information—Dividends” on page 225, in each case of the Annual Report 2025 included as exhibit 15.1 to this Form 20-F is incorporated by reference.
Please also refer to the information set forth under the heading “Financial Statements—Notes to the Consolidated Financial Statements—D1. Dividends” on pages F-66 to F-67 of this Form 20-F.
Developments in Legal Proceedings
The following legal proceedings may have, or have had in the recent past, significant effects on our financial position or profitability:
| ● | In November 2024, a purported class action lawsuit was filed on behalf of shareholders who purchased American Depositary Shares in the US between 1 December 2023 and 10 September 2024. The defendants are the Company and three current and former senior executives, Andy Ransom, Stuart Ingall-Tombs, and Bradley Paulsen. The complaint alleges that management made false statements about the progress of the integration of Rentokil and Terminix and its impact upon growth in the US and seeks relief under sections 10(b) and 20(a) of the Securities Exchange Act and SEC rule 10(b)5. The Company and the individual defendants intend to vigorously defend the lawsuit. |
| ● | In April 2025, a purported class action lawsuit was filed in state court in California alleging misrepresentation in the registration statement and prospectuses for the securities issued as part of the acquisition of Terminix. The defendants are the Company, former senior executives Brett Ponton and John Myers, and members of the Company’s Board of Directors. The complaint alleges that the Company made false and misleading statements in the registration and prospectuses in relation to the securities offered as part of the acquisition of Terminix and seeks relief under Sections 11, 12(a)(2), and 15 of the US Securities Act of 1933. The Company and the individual defendants intend to vigorously defend the lawsuit. |
B. |
Significant Changes |
Please see the information set forth under the heading “Financial Statements—Notes to the Consolidated Financial Statements— D5. Post balance sheet events” on page F-68 of this Form 20-F.
Since the date of the annual consolidated financial statements included in this Form 20-F, no significant change has occurred.
31
ITEM 9. THE OFFER AND LISTING
A. |
Offer and Listing Details |
The information set forth under the headings “Other Information—Directors’ Report—Share capital” on pages 221 to 222, the information set forth in the introductory paragraph under the heading “Other Information—Additional Shareholder Information” on page 225 and “Other Information—Additional Shareholder Information—American Depositary Shares” on page 226, in each case of the Annual Report 2025 included as exhibit 15.1 to this Form 20-F is incorporated by reference.
The corresponding trading symbol is “RTO” in each of our principal markets for trading in Rentokil Initial plc shares.
B. |
Plan of Distribution |
Not applicable.
C. |
Markets |
The information set forth under the headings “Other Information—Directors’ Report—Share capital” on pages 221 to 222 and “Other Information—Additional Shareholder Information—American Depositary Shares” on page 226 in each case of the Annual Report 2025 included as exhibit 15.1 to this Form 20-F is incorporated by reference.
D. |
Selling Shareholders |
Not applicable.
E. |
Dilution |
Not applicable.
F. |
Expenses of the Issue |
Not applicable.
ITEM 10. ADDITIONAL INFORMATION
A. |
Share Capital |
Not applicable.
B. |
Memorandum and Articles of Association |
The information set forth under the headings “Other Information—Directors’ Report—Articles of association”, “—Re-election of Directors”, “—Directors’ powers” and “—General meetings” on page 221 and “Other Information—Directors’ Report—Share capital” on pages 221 to 222, in each case of the Annual Report 2025 included as exhibit 15.1 to this Form 20-F is incorporated by reference.
C. |
Material Contracts |
Not applicable.
D. |
Exchange Controls |
Other than certain economic sanctions which may be in effect from time to time, there are no governmental laws, decrees or regulations in the UK restricting the import or export of capital or affecting the remittance of dividends, interest or other payments to non-resident holders of ordinary shares or ADSs.
32
Subject to the effect of any such economic sanctions which may be in effect from time to time, there are no limitations under English law or the Company’s Articles of Association on the right of non-resident or foreign owners to be the registered holders of, or to exercise voting rights in relation to, ordinary shares or ADSs.
E. |
Taxation |
UK Taxation
The following summary contains a description of certain UK tax consequences of the acquisition, ownership and disposal of ordinary shares or ADSs in the Company. It is based on current UK tax law and the current published practice of HM Revenue and Customs (“HMRC”) (which may not be binding on HMRC) as at the date of this Form 20-F which are both subject to change at any time, possibly with retrospective effect. This summary applies to you only if:
| ● | you are an individual citizen or resident of the U.S. or a corporation created or organised in or under the laws of the U.S. or any of its political subdivisions (or are otherwise subject to US federal income tax on a net income basis in respect of your holding of ordinary shares or ADSs); |
| ● | you are the beneficial owner of ordinary shares or ADSs and hold them as a capital asset and not for the purposes of a trade; |
| ● | if you are an individual, you are not resident in the UK for UK tax purposes, and do not hold the ordinary shares or ADSs for the purposes of a trade, profession or vocation that you carry on in the UK through a branch or agency or, if you are a corporation, you are not resident in the UK for UK tax purposes and do not hold the ordinary shares or ADSs for the purposes of a trade carried on in the UK through a permanent establishment in the UK; and |
| ● | you are not domiciled in the UK for inheritance tax purposes. |
In practice, HMRC regard holders of ADSs as the beneficial owners of the ordinary shares represented by those ADSs, although case law has cast some doubt on this. The discussion below assumes that HMRC’s position is followed.
This summary does not constitute legal or tax advice and does not purport to be a comprehensive description of all of the tax considerations that may be relevant to a decision to invest in ordinary shares or ADSs. It does not address the tax treatment of investors that may be subject to special rules (such as rules applicable to charities, dealers in securities, trustees, broker dealers, market makers, insurance companies, collective investment schemes, pension schemes, or persons subject to UK tax on the remittance basis).
If you are in any doubt as to the tax consequences to you of the acquisition, ownership or disposal of ordinary shares or ADSs, you should consult your own tax advisers without delay.
UK Tax Consequences of Owning and Disposing of Ordinary Shares or ADSs in the Company
Taxation of dividends
The Company is not required under English law to withhold tax at source from any dividend payment it makes. A holder of the ordinary shares or ADSs that is not resident in the UK for UK tax purposes and does not carry on a trade, profession or vocation in the UK through a branch or agency (or in the case of a company a permanent establishment) to which the ordinary shares or ADSs are attributable will not generally be liable to pay UK tax on dividends paid by the Company.
33
Taxation of capital gains
A holder of ordinary shares or ADSs that is not resident in the UK for UK tax purposes and does not carry on a trade, profession or vocation in the UK through a branch or agency (or in the case of a company a permanent establishment) to which the ordinary shares or ADSs are attributable will not generally be liable for UK taxation on capital gains or eligible for relief for allowable losses, realised or accrued on the sale or other disposal of ordinary shares or ADSs. A holder of ordinary shares or ADSs who is an individual who has been resident for tax purposes in the UK but who ceases to be so resident or becomes regarded as resident outside the UK for the purposes of any double tax treaty (“Treaty Non-resident”) and continues to not be resident in the UK, or continues to be Treaty Non-resident, for a period of five years or less and who disposes of their ordinary shares or ADSs during that period may also be liable on their return to the UK to UK tax on capital gains, subject to any available exemption or relief, even though they are not resident in the UK, or are Treaty Non-resident, at the time of the disposal.
Inheritance tax
Subject to certain provisions relating to trusts or settlements, an ordinary share or ADS held by an individual holder who is domiciled in the United States for the purposes of the convention between the United States and the United Kingdom relating to estate and gift taxes (the “Convention”) and who is neither domiciled in the UK nor (where certain conditions are met) a UK national (as defined in the Convention), will generally not be subject to UK inheritance tax on the individual’s death (whether held on the date of death or gifted during the individual’s lifetime) provided that any applicable U.S. federal gift or estate tax liability is paid, except where the ordinary share or ADS is part of the business property of a UK permanent establishment or pertains to a UK fixed base of an individual who performs independent personal services. If no relief is given under the Convention, inheritance tax may be charged on death and also on the amount by which the value of an individual’s estate is reduced as a result of any transfer made by way of gift or other gratuitous or undervalue transfer, in general within seven years of death, and in certain other circumstances. In a case where an ordinary share or ADS is subject both to UK inheritance tax and to U.S. federal gift or estate tax, the Convention generally provides for double taxation to be relieved by means of credit relief based on priority rules set forth in the Convention.
Stamp duty and stamp duty reserve tax
The following statements are intended as a general and non-exhaustive guide to the current UK stamp duty and stamp duty reserve tax (“SDRT”) position and apply whether or not the holder of ordinary shares or ADSs is resident in the United States, the United Kingdom or elsewhere. It should be noted that certain categories of person, including market makers, brokers, dealers, persons connected with clearance services and depositary receipt systems and other specified market intermediaries, may not be liable to stamp duty or SDRT or may be liable at a higher rate or may, although not primarily liable for tax, be required to notify and account for it under the Stamp Duty Reserve Tax Regulations 1986.
Paperless transfers of ordinary shares, such as those occurring within the UK-based system for the paperless settlement of trades in listed securities, of which Euroclear UK & International Limited is the operator (“CREST”), are generally liable to SDRT, rather than UK stamp duty, at the rate of 0.5% of the amount or value of the consideration. CREST is obliged to collect SDRT on relevant transactions settled within the system. The charge is generally borne by the purchaser. Under the CREST system, no UK stamp duty or SDRT should arise on a transfer of ordinary shares into the system unless such a transfer is made (or deemed to be made) for a consideration in money or money’s worth, in which case a liability to SDRT (usually at a rate of 0.5%) will arise.
34
UK stamp duty at the rate of 0.5% (rounded up to the next multiple of £5) of the amount or value of the consideration given is generally payable on an instrument transferring ordinary shares. A charge to SDRT will also arise on an unconditional agreement to transfer ordinary shares (at the rate of 0.5% of the amount or value of the consideration payable). However, if within six years of the date of the agreement becoming unconditional an instrument of transfer is executed pursuant to the agreement, and UK stamp duty is paid on that instrument, any SDRT already paid should be refunded (generally, but not necessarily, with interest) provided that a claim for repayment is made, and any outstanding liability to SDRT should be cancelled. An exemption from UK stamp duty is available on an instrument transferring ordinary shares where the amount or value of the consideration is £1,000 or less, and it is certified on the instrument that the transaction effected by the instrument does not form part of a larger transaction or series of transactions for which the aggregate consideration exceeds £1,000. The liability to pay UK stamp duty or SDRT is generally satisfied by the purchaser or transferee.
Transfers of ordinary shares to a connected company of a shareholder (or its nominee) may be subject to stamp duty and/or SDRT based on the market value of the ordinary shares at the time of the transfer, if that is higher than the amount or value of the consideration actually paid for the ordinary shares, subject to any relief which may be available for intragroup transfers.
No UK stamp duty should be payable on the transfer of ADSs, provided that no instrument of transfer is entered into (which should not be necessary). An agreement to transfer ADSs should not give rise to a liability to SDRT.
There is, however, a charge to UK stamp duty or SDRT at the rate of 1.5% of the amount or value of the consideration for the transfer or, in some circumstances, the value of the ordinary shares transferred (rounded up to the next multiple of £5 in the case of stamp duty), where ordinary shares are transferred to the depositary in exchange for ADSs evidenced by ADRs (or to a person whose business is or includes the provision of clearance services, or a nominee or agent for such a person). Such 1.5% charge is subject to exceptions, including for (i) transfers which are made in the course of “capital-raising arrangements” (as defined in sections 72ZA and 97AB of the Finance Act 1986), and (ii) transfers which are made in the course of “qualifying listing arrangements” (as defined in sections 72ZB and 97AC of the Finance Act 1986) and which do not affect the beneficial ownership of the ordinary shares in question. Specific professional advice should be sought in any case where the 1.5% UK stamp duty or SDRT charge may be applicable.
A transfer of ordinary shares by the depositary to an ADS holder where there is no transfer of beneficial ownership will not be chargeable to UK stamp duty or SDRT.
35
United States Federal Income Tax Considerations
The following discussion is a general summary based on present law of certain material U.S. federal income tax considerations relating to the ownership and disposition of ordinary shares or ADSs by a U.S. holder (as defined below). This summary addresses only the U.S. federal income tax considerations for U.S. holders that hold ordinary shares or ADSs as capital assets (generally, property held for investment) and use the U.S. dollar as their functional currency. This summary is for general information purposes only and does not address all U.S. federal income tax considerations that may be relevant to a particular U.S. holder; it is not a substitute for tax advice. In addition, it does not describe all of the U.S. federal income tax considerations that may be relevant to a U.S. holder of ordinary shares or ADSs in light of such U.S. holder’s particular circumstances, nor does it address tax considerations applicable to a holder of ordinary shares or ADSs that may be subject to special rules under the U.S. federal income tax laws, including, banks or other financial institutions, insurance companies, brokers, dealers or traders in securities, currencies, commodities, or notional principal contracts, traders in securities that elect to mark-to-market, tax-exempt entities or organisations, pension funds, “individual retirement accounts”, “Roth IRAs” or other deferred accounts, real estate investment trusts, mutual funds, regulated investment companies, partnerships (including entities or arrangements classified as partnerships for U.S. federal income tax purposes) and other pass-through entities (including S-corporations) and their partners or shareholders, governmental agencies or instrumentalities, certain former citizens or long-term residents of the United States, “controlled foreign corporations”, “passive foreign investment companies”, “personal holding companies”, persons liable for the alternative minimum tax, persons required to accelerate the recognition of any item of gross income as a result of such income being recognised on an “applicable financial statement”, persons that received the ordinary shares or ADSs through the exercise of employee stock options or otherwise as compensation for the performance of services or through a tax-qualified retirement plan, persons that hold ordinary shares or ADSs as part of a hedge, straddle, conversion, constructive sale or other integrated or risk reduction financial transaction, persons that hold their ordinary shares or ADSs in connection with a permanent establishment or fixed base outside the United States or persons that own directly, indirectly, or through attribution 10% or more of the voting power or value of our ordinary shares and ADSs. This summary does not address U.S. federal taxes other than the income tax (such as the Medicare surtax on net investment income, the estate, gift, or alternative minimum tax), any election to apply Section 1400Z-2 of the U.S. Internal Revenue Code of 1986, as amended (the “Code”) to gains recognised with respect to ordinary shares or ADSs, or any U.S. state, local, or non-U.S. tax considerations of the ownership and disposition of ordinary shares or ADSs. This discussion assumes that Rentokil Initial will not be treated as a U.S. corporation for U.S. federal income tax purposes and has not otherwise been nor will be subject to Section 7874 of the Code.
For the purposes of this summary, a “U.S. holder” is a beneficial owner of ordinary shares or ADSs that is (or is treated as), for U.S. federal income tax purposes, (i) an individual who is a citizen or resident of the United States, (ii) a corporation, or any other entity treated as a corporation for U.S. federal income tax purposes, created or organised in or under the laws of the United States, any state thereof, or the District of Columbia, or (iii) an estate, the income of which is subject to U.S. federal income taxation regardless of its source, or a trust, if a court within the United States is able to exercise primary supervision over its administration and one or more U.S. persons have the authority to control all of the substantial decisions of such trust.
If a partnership (or other entity or arrangement treated as a partnership for U.S. federal income tax purposes) holds ordinary shares or ADSs, the U.S. federal income tax consequences relating to an investment in those ordinary shares or ADSs will depend in part upon the status of the partner and the activities of the partnership. A partnership that holds ADSs should consult its tax advisor regarding the U.S. federal income tax considerations for it and for its partners of owning and disposing of ordinary shares or ADSs in its and their particular circumstances.
In general, a U.S. holder that owns ADSs will be treated as the beneficial owner of the underlying ordinary shares represented by those ADSs for U.S. federal income tax purposes. Accordingly, no gain or loss will generally be recognised if a U.S. holder exchanges ADSs for the underlying ordinary shares represented by those ADSs.
36
This summary does not consider your particular circumstances. Persons owning ordinary shares or ADSs or considering an investment in ordinary shares or ADSs should consult their own tax advisors as to the particular tax consequences applicable to them relating to the ownership and disposition of ordinary shares or ADSs, including the applicability of U.S. federal, state and local tax laws and non-U.S. tax laws.
Distributions
Subject to the discussion under “—Passive Foreign Investment Company Considerations” below, the gross amount of distributions paid with respect to our ordinary shares or ADSs including UK tax withheld therefrom, if any (other than pro rata distribution of our ordinary shares or rights to acquire our ordinary shares), generally will be included in a U.S. holder’s gross income as foreign source ordinary dividend income when actually or constructively received to the extent such distribution is paid out of our current and accumulated earnings and profits as determined under U.S. federal income tax principles. Distributions in excess of our current and accumulated earnings and profits will be treated as a non-taxable return of capital and will be applied against and reduce, the U.S. holder’s adjusted tax basis in ordinary shares or ADSs (but not below zero) and distributions in excess of earnings and profits and a U.S. holder’s adjusted tax basis will generally be taxable to the U.S. holder as either long-term or short-term capital gain depending upon whether the U.S. holder has held the ordinary shares or ADSs for more than one year as of the time such distribution is received. However, since we do not calculate our earnings and profits under U.S. federal income tax principles, it is expected that any distribution will be reported as a dividend, even if that distribution would otherwise be treated as a non-taxable return of capital or as capital gain.
Our dividends will not be eligible for the dividends-received deduction generally allowed to U.S. corporations. Dividends paid to non-corporate U.S. holders that satisfy a minimum holding period (during which they are not protected from the risk of loss) and certain other requirements may qualify for the preferential tax rates applicable to qualified dividend income, provided that we are a “qualified foreign corporation” and we are not a PFIC as to the non-corporate U.S. holder in the taxable year of the dividend or the preceding taxable year. A qualified foreign corporation includes a non-U.S. corporation that is eligible for the benefits of a comprehensive income tax treaty with the United States. A non-U.S. corporation also will be considered to be a qualified foreign corporation with respect to any dividend it pays on shares which are readily tradable on an established securities market in the U.S. Our ADSs are listed on the NYSE, which is an established securities market in the U.S., and we expect our ADSs to be readily tradable on the NYSE. However, there can be no assurance that the ADSs will be considered readily tradable on an established securities market in the U.S. in any taxable year. U.S. holders should consult their own tax advisors regarding the application of these rules given their particular circumstances.
If dividends are subject to UK withholding tax, a U.S. holder may be entitled, subject to generally applicable limitations, to claim a U.S. foreign tax credit for UK withholding tax imposed at the appropriate rate. U.S. holders who do not elect to claim a credit for any foreign income taxes paid or accrued during the taxable year may instead claim a deduction of such taxes. The rules relating to the foreign tax credit are complex. Each U.S. holder should consult its own tax advisors regarding the foreign tax credit rules.
In general, the amount of a distribution paid to a U.S. holder in a foreign currency will be the dollar value of the foreign currency calculated by reference to the applicable exchange rate on the day the U.S. holder receives the distribution, regardless of whether the foreign currency is converted into USD at that time. Any foreign currency gain or loss a U.S. holder realises on a subsequent conversion of foreign currency into USD will be U.S. source ordinary income or loss. If dividends received in a foreign currency are converted into USD on the day they are received, a U.S. holder should not be required to recognise foreign currency gain or loss in respect of the dividend.
Sale, Exchange or Other Taxable Disposition of Ordinary Shares or ADSs
Subject to the discussion under “—Passive Foreign Investment Company Considerations” below, a U.S. holder will generally recognise capital gain or loss on the sale, exchange, or other taxable disposition of ordinary shares or ADSs in an amount equal to the difference between the amount realised from such sale or exchange and the U.S. holder’s adjusted basis in the ordinary shares or ADSs, each amount determined in USD. A U.S. holder’s adjusted tax basis in an ordinary share or ADS generally will be equal to the USD cost of such ordinary share or ADS. Any such capital gain or loss generally will be long-term capital gain or loss if the U.S. holder’s holding period for such ordinary share or ADS exceeds one year as of the date of sale or other disposition. Long-term capital gain realised by a non-corporate U.S. holder is generally eligible for preferential reduced tax rates. The deductibility of capital losses for U.S. federal income tax purposes is subject to certain limitations. Any such gain or loss that a U.S. holder recognises generally will be treated as U.S. source income or loss for foreign tax credit limitation purposes.
37
Passive Foreign Investment Company Considerations
In general, a non-U.S. corporation will be classified as a passive foreign investment company, or PFIC, for any taxable year in which, after applying certain look-through rules with respect to certain dividends, rents, interest or royalties received from its affiliates and taking into account its proportionate share of the income and assets of its 25% or more owned subsidiaries, either: (i) at least 75% of its gross income is “passive income”, or (ii) at least 50% of the average quarterly value of its total gross assets is attributable to cash in excess of working capital requirements or assets that produce “passive income” or are held for the production of “passive income”. Passive income for this purpose generally includes dividends, interest, royalties, rents, gains from commodities and securities transactions, the excess of gains over losses from the disposition of assets which produce passive income. While we are treated as a publicly traded company for these purposes, the value of our assets, including goodwill and other intangibles, will be based on their fair market value, which will depend on the market value of our ordinary shares and ADSs, which are subject to change.
Based on our historic and anticipated operations, the composition of our income and the projected composition and estimated fair market values of our assets, we do not believe that we were a PFIC for our most recent taxable year and do not expect to be classified as a PFIC for the current taxable year or for the foreseeable future. However, our possible status as a PFIC is a factual determination made annually after the close of each taxable year and, therefore, may be subject to change. Accordingly, there can be no assurance that we will not be a PFIC for any year in which a U.S. holder holds ordinary shares or ADSs. The Company does not intend to provide any annual assessments of its PFIC status.
If we were to be classified as a PFIC for any taxable year during which a U.S. holder owns ordinary shares or ADSs, gain recognised on a sale or other disposition (including certain pledges) of such U.S. holder’s ordinary shares or ADSs would be allocated rateably over such U.S. holder’s holding period. Amounts allocated to the taxable year of the sale or disposition and to any year before we became a PFIC would be taxed as ordinary income and the amount allocated to each other taxable year would be subject to tax at the highest rate in effect for individuals or corporations, as appropriate, for that taxable year, and an interest charge will be imposed on the resulting tax liability for each such year. In addition, to the extent that distributions received by a U.S. holder on its ordinary shares or ADSs in any taxable year exceed 125% of the average of the annual distributions on such holder’s ordinary shares or ADSs received during the preceding three taxable years (or, if shorter, the U.S. holder’s holding period), such excess distributions will be subject to taxation in the same manner. Furthermore, dividends that are not excess distributions would not be eligible for the preferential tax rate applicable to qualified dividend income received by individuals and certain other non-corporate persons.
If the Company is a PFIC for any taxable year during which you own ordinary shares or ADSs, the Company will generally continue to be treated as a PFIC with respect to you for all succeeding years during which you own the ordinary shares or ADSs, even if the Company ceases to meet the threshold requirements for PFIC status. Certain elections may be available that will result in alternative treatments (such as mark-to-market treatment) of the ordinary shares. U.S. holders should consult their own tax advisors concerning the Company’s possible PFIC status and the consequences to them if the Company were a PFIC for any taxable year, including whether any of these elections will be available, and, if so, what the consequences of the alternative treatments will be in your particular circumstances.
Backup Withholding and Information Reporting
U.S. holders generally will be subject to information reporting requirements with respect to dividends on ordinary shares or ADSs and on the proceeds from the sale, exchange, or disposition of the ordinary shares or ADSs that are paid within the United States or through U.S.-related financial intermediaries, unless the U.S. holder is a corporation or other “exempt recipient”. In addition, U.S. holders may be subject to backup withholding on such payments, unless the U.S. holder provides a correct taxpayer identification number and a duly executed IRS Form W-9 or otherwise establishes an exemption. Backup withholding is not an additional tax, and the amount of any backup withholding will be allowed as a credit against a U.S. holder’s U.S. federal income tax liability and may entitle such holder to a refund, provided that the required information is timely furnished to the IRS.
Foreign Asset Reporting
Certain U.S. holders who are individuals and certain entities controlled by individuals may be required to report information relating to an interest in ordinary shares or ADSs, subject to certain exceptions (including an exception for shares held in accounts maintained by U.S. financial institutions) by filing IRS Form 8938 (Statement of Specified Foreign Financial Assets) with their federal income tax return. Investors who fail to report required information could become subject to substantial penalties. U.S. holders are urged to consult their tax advisors regarding their information reporting obligations, if any, with respect to their ownership and disposition of the ordinary shares or ADSs.
38
THE DISCUSSION ABOVE IS A GENERAL SUMMARY. IT DOES NOT COVER ALL TAX MATTERS THAT MAY BE OF IMPORTANCE TO A PROSPECTIVE INVESTOR. EACH PROSPECTIVE INVESTOR IS URGED TO CONSULT ITS OWN TAX ADVISOR ABOUT THE TAX CONSEQUENCES TO IT OF AN INVESTMENT IN ORDINARY SHARES OR ADSS IN LIGHT OF THE INVESTOR’S OWN CIRCUMSTANCES.
F. |
Dividends and Paying Agents |
Not applicable.
G. |
Statement by Experts |
Not applicable.
H. |
Documents on Display |
The SEC maintains an internet site that contains reports, proxy and information statements, and other information regarding issuers that file electronically with the SEC, including the Company, at https://www.sec.gov. The address of the SEC’s website is provided solely for information purposes and is not intended to be an active link.
We also make our periodic reports, as well as other information filed with or furnished to the SEC, available through our website, at https://www.rentokil-initial.com/investors, as soon as reasonably practicable after those reports and other information are electronically filed with or furnished to the SEC. The information on our website is not incorporated by reference in this document.
I. |
Subsidiary Information |
Not applicable.
J. |
Annual Report to Security Holders |
Not applicable.
ITEM 11. QUANTITATIVE AND QUALITATIVE DISCLOSURES ABOUT MARKET RISK
Please refer to the information set forth under the heading “Financial Statements—Notes to the Consolidated Financial Statements—C1. Financial risk management” on pages F-51 to F-54 of this Form 20-F.
Please also refer to the information above under Item 3 “Key Information—Risk Factors—Risks Relating to Financial Markets”.
ITEM 12. DESCRIPTION OF SECURITIES OTHER THAN EQUITY SECURITIES
A. |
Debt Securities |
Not applicable.
B. |
Warrants and Rights |
Not applicable.
C. |
Other Securities |
Not applicable.
D. |
American Depositary Shares |
Fees and Charges Payable by ADR Holders
The Company’s ADSs are evidenced by American Depositary Receipts (“ADRs”). The Company’s ADR program is administered by The Bank of New York Mellon (“BNY Mellon” or the “Depositary”) as the depositary. Contact details for the Depositary are available under the heading “Other Information—Additional Shareholder Information—American Depositary Shares” on page 226 of the Annual Report 2025 included as exhibit 15.1 to this Form 20-F is incorporated by reference.
39
The holder of an ADR may have to pay the following fees and charges to BNY Mellon in connection with ownership of the ADR:
Category |
|
Depositary actions |
|
Associated fee or charge |
(a) Depositing or substituting the underlying shares |
Issuances upon deposits of shares (including issuances as a result of share distributions or the exercise of rights) |
Up to $5.00 per 100 ADSs (or portion thereof) issued |
||
|
|
|
||
(b) Receiving or distributing cash dividends |
Distributions of cash dividends or other cash distributions (i.e. sale of rights and other entitlements) |
Up to $0.05 per ADS (or portion thereof) |
||
|
|
|
||
(c) Receiving or distributing stock or other securities |
Distributions of stock dividends or other free stock distributions or distributions of securities other than ADSs (which includes rights to purchase additional ADSs) |
Fee equivalent to the fee that would be charged if such securities were deposited for the issuance of ADSs) |
||
|
|
|
||
(d) Withdrawing, cancelling or reducing an underlying security |
Surrendering ADSs for cancellation and withdrawal of deposited property |
Up to $5.00 per 100 ADSs (or portion thereof) surrendered or cancelled (as the case may be) |
||
|
|
|
||
(e) Transferring, splitting or grouping receipts |
|
Not applicable. |
||
|
|
|
||
(f) General depositary services, particularly those charged on an annual basis |
Depositary services fee |
Up to $0.05 per ADS (or portion thereof) per calendar year. |
||
|
|
|
||
(g) Fees and expenses of the depositary |
Fees and expenses incurred by the Depositary or the Depositary’s agents on behalf of holders, including in connection with: ●
taxes (including applicable interest and penalties) and other governmental charges;
●
registration of shares or other deposited securities on the share register of the Company or Foreign Registrar and applicable to transfers of shares or other deposited securities to or from the name of the Depositary, the Custodian or any nominees upon the making of deposits and withdrawals, respectively;
●
cable and facsimile transmission fees and expenses;
●
expenses and charges incurred by the Depositary in the conversion of foreign currency into U.S. dollars; and
●
the charges payable by the Depositary, the Custodian, or any nominee in connection with the servicing of deposited property (as defined in the Deposit Agreement).
|
As incurred by the Depositary. |
Fees and Payments Made by BNY Mellon to Us
The Depositary reimburses the Company for certain expenses it incurs in relation to the ADR programme. The Depositary also pays the standard out-of-pocket maintenance costs for the ADSs, which consist of the expenses for the mailing of annual and interim financial reports, printing and distributing dividend cheques, the electronic filing of U.S. federal tax information, mailing required tax forms, stationery, postage, facsimiles and telephone calls. It also reimburses the Company for certain investor relationship programmes or special investor relations promotional activities. There are limits on the amount of expenses for which the Depositary will reimburse the Company, but the amount of reimbursement is not necessarily tied to the amount of fees the Depositary collects from investors. Under the contractual arrangements with the Depositary, the Company has received or is due to receive approximately $5,463,743.48 in the year ended 31 December 2025 arising out of fees charged in respect of dividends paid during the year and the cancellation or issuance of ADSs.
40
PART II
ITEM 13. DEFAULTS, DIVIDEND ARREARAGES AND DELINQUENCIES
Not applicable.
ITEM 14. MATERIAL MODIFICATIONS TO THE RIGHTS OF SECURITY HOLDERS AND USE OF PROCEEDS
Not applicable.
ITEM 15. CONTROLS AND PROCEDURES
A. |
Disclosure Controls and Procedures |
The Group maintains disclosure controls and procedures, as such term is defined in Rules 13a-15(e) and 15d-15(e) of the Exchange Act, that are designed to ensure that information required to be disclosed in reports the Group files or submits under the Exchange Act is recorded, processed, summarised and reported within the time periods specified in the SEC rules and forms, and that such information is accumulated and communicated to our management to allow timely decisions regarding required disclosure.
In designing and evaluating our disclosure controls and procedures, our management recognises that any controls and procedures, no matter how well designed and operated, can provide only reasonable, not absolute, assurance that the objectives of the disclosure controls and procedures are met. Due to the inherent limitations in all control systems, no evaluation of controls can provide absolute assurance that all control issues and instances of fraud, if any, within the Group have been detected.
Our management, with the participation of our Chief Executive and Chief Financial Officer, has evaluated the effectiveness of the Group’s disclosure controls and procedures pursuant to Rule 13a-15(b) of the Exchange Act as of the end of the period covered by this Annual Report on Form 20-F. Based on such evaluation, our Chief Executive and Chief Financial Officer have concluded that our disclosure controls and procedures were effective as of 31 December 2025.
B. |
Management’s Annual Report on Internal Control over Financial Reporting |
Our management is responsible for establishing and maintaining adequate internal control over financial reporting, as such term is defined in Rule 13a-15(f) of the Securities Exchange Act of 1934, as amended. The Company’s internal control over financial reporting includes those policies and procedures that (i) pertain to the maintenance of records that, in reasonable detail, accurately and fairly reflect the transactions and dispositions of the assets of the Company; (ii) provide reasonable assurance that transactions are recorded as necessary to permit preparation of financial statements in accordance with generally accepted accounting principles, and that receipts and expenditures of the Company are being made only in accordance with authorizations of management and directors of the Company; and (iii) provide reasonable assurance regarding prevention or timely detection of unauthorised acquisition, use, or disposition of the Company’s assets that could have a material effect on the financial statements.
Management conducted an evaluation of the effectiveness of our internal control over financial reporting based on the framework set forth in “Internal Control-Integrated Framework” issued by the Committee of Sponsoring Organizations of the Treadway Commission (2013 framework). Based on such assessment, our management has concluded that, as of 31 December 2025, our internal control over financial reporting was effective.
C. |
Attestation Report of Independent Registered Public Accounting Firm |
The effectiveness of the Company’s internal control over financial reporting as of 31 December 2025 has been audited by PricewaterhouseCoopers LLP, an independent registered public accounting firm, as stated in its report dated 25 March 2026, which is included under the heading “Financial Statements—Report of Independent Registered Public Accounting Firm” on pages F-2 to F-4 of this Form 20-F.
41
D. |
Changes in Internal Control over Financial Reporting |
Based on the evaluation conducted, management has concluded that no such changes have occurred during the period covered by this Form 20-F that have materially affected, or are reasonably likely to materially affect, the Company’s internal control over financial reporting.
ITEM 16. RESERVED
ITEM 16A. AUDIT COMMITTEE FINANCIAL EXPERT
The information set forth under the heading “Corporate Governance—Audit Committee Report—Membership and attendance” on page 100 of the Annual Report 2025 included as exhibit 15.1 to this Form 20-F is incorporated by reference.
ITEM 16B. CODE OF ETHICS
Our principal executives, including the Chief Executive Officer, the Chief Financial Officer and all other members of the ELT are subject to the Rentokil Initial Code of Conduct. No waivers or exceptions to the Codes of Conduct were granted in 2025.
The information set forth under the headings “Strategic Report—Responsible Business—Governance” on page 65, “Corporate Governance—Our Governance—Our Code of Conduct – Our Cornerstone” on page 84, “Corporate Governance—Our Governance—Statement of application of Code principles—Workforce policies and practices” on page 85 and “Corporate Governance—Audit Committee Report—Governance and compliance” on page 105 of the Annual Report 2025 included as exhibit 15.1 to this Form 20-F is incorporated by reference.
ITEM 16C. PRINCIPAL ACCOUNTANT FEES AND SERVICES
The following table sets forth the aggregate fees for professional services rendered by PricewaterhouseCoopers LLP (PCAOB ID 876) in 2025 and 2024:
|
|
Year ended |
||
|
|
December 31, |
||
|
|
2025 |
|
2024 |
|
|
($ million) |
||
Audit fees |
|
13 |
|
14 |
Audit-related fees |
|
1 |
|
— |
Tax fees |
|
— |
|
— |
All other fees |
|
— |
|
— |
Total |
|
14 |
|
14 |
Please also refer to the information set forth under the heading “Financial Statements—Notes to the Consolidated Financial Statements—A8. Auditors’ remuneration” on page F-28 of this Form 20-F.
U.S. law and regulations permit the Audit Committee pre-approval requirement to be waived with respect to engagements for non-audit services aggregating to no more than 5% of the total amount of fees paid by us to our principal accountants, if such engagements were not recognised by us at the time of engagement and were promptly brought to the attention of the Audit Committee or a designated member thereof and approved prior to the completion of the audit. In 2025, no fees paid by us to our principal accountant for non-audit services in each category were subject to such a waiver.
ITEM 16D. EXEMPTIONS FROM THE LISTING STANDARDS FOR AUDIT COMMITTEES
Not applicable.
42
ITEM 16E. PURCHASES OF EQUITY SECURITIES BY THE ISSUER AND AFFILIATED PURCHASERS
|
|
|
|
|
|
|
|
(d) Maximum |
|
|
|
|
|
|
|
|
Number (or |
|
|
|
|
|
|
|
|
Approximate Dollar |
|
|
|
|
|
|
(c) Total Number of |
|
Value) of Shares (or |
|
|
|
|
|
|
Shares (or Units) |
|
Units) that May Yet |
|
|
(a) Total number of |
|
(b) Average Price |
|
Purchased as Part of |
|
Be Purchased Under |
|
|
Shares (or Units) |
|
Paid per Share (or |
|
Publicly Announced |
|
the Plans or |
Period |
|
Purchased |
|
Unit) |
|
Plans or Programs |
|
Programs |
|
|
|
|
(£) |
|
|
|
(£ billion) |
Month #1 (Jan 1 - Jan 31) |
|
0 |
|
N/A |
|
0 |
|
0 |
Month #2 (Feb 1 - Feb 28) |
|
0 |
|
N/A |
|
0 |
|
0 |
Month #3 (Mar 1 - Mar 31) |
|
0 |
|
N/A |
|
0 |
|
0 |
Month #4 (Apr 1 - Apr 30) |
|
0 |
|
N/A |
|
0 |
|
0 |
Month #5 (May 1 - May 31) |
|
0 |
|
N/A |
|
0 |
|
0 |
Month #6 (Jun 1 - Jun 30) |
|
0 |
|
N/A |
|
0 |
|
0 |
Month #7 (Jul 1 - Jul 31) |
|
0 |
|
N/A |
|
0 |
|
0 |
Month #8 (Aug 1 - Aug 31) |
|
0 |
|
N/A |
|
0 |
|
0 |
Month #9 (Sep 1 - Sep 30) |
|
0 |
|
N/A |
|
0 |
|
0 |
Month #10 (Oct 1 - Oct 31) |
|
0 |
|
N/A |
|
0 |
|
0 |
Month #11 (Nov 1 - Nov 30) |
|
0 |
|
N/A |
|
0 |
|
0 |
Month #12 (Dec 1 - Dec 31) |
|
0 |
|
N/A |
|
0 |
|
0 |
Total |
|
0 |
|
N/A |
|
0 |
|
0 |
At the 2025 Annual General Meeting, the Company’s shareholders authorised the Company to repurchase up to 252,000,000 of its own shares and such authority will be valid until the 2026 Annual General Meeting. No purchases of its shares were made by the Company during the year ended 31 December 2025. Authority to make repurchases of the Company’s own shares is normally renewed annually and approval will be sought from shareholders at the 2026 Annual General Meeting to renew such authority for a further year.
ITEM 16F. CHANGE IN REGISTRANT’S CERTIFYING ACCOUNTANT
Not applicable.
ITEM 16G. CORPORATE GOVERNANCE
The Company is a public limited company incorporated in England and Wales, admitted to the equity shares (commercial company) category of the Official List of the FCA and to trading on the main market of the London Stock Exchange. As a result, it follows the UK Corporate Governance Code (the “UK Code”) in respect of its corporate governance practices. The 2024 edition of the UK Code came into effect for reporting periods beginning on or after 1 January 2025 (except Provision 29 of the UK Code) and was effective to the Company for the year ended 31 December 2025. The Companies Act 2006 (the “UK Act”) and the UK Listing Rules impose certain requirements that also influence our corporate governance practices. Furthermore, as a result of the listing of the Company’s ADSs on the NYSE and the Company’s registration under the Exchange Act, we follow the applicable U.S. federal securities laws and regulations, as well as the rules of the NYSE, in particular the corporate governance standards under Section 303A of the NYSE Listed Company Manual. We comply with these standards to the extent such provisions are applicable to us as a foreign private issuer.
We are required to disclose any significant ways in which the Company’s corporate governance practices differ from those followed by U.S. companies under the NYSE listing standards under Section 303A of the NYSE Listed Company Manual. In connection with the Company’s compliance obligations under the Sarbanes-Oxley Act, amongst other things, we have reviewed the corporate governance practices required to be followed by U.S. domestic companies under the NYSE listing standards and our corporate governance practices are generally consistent with those standards.
The below summaries of our corporate governance practices include disclosures regarding the significant ways in which they differ from those followed by U.S. domestic companies under the NYSE listing standards.
43
(i) |
Director Independence |
Pursuant to our corporate governance framework and procedures, the independence of all Directors is considered upon their appointment and is subsequently reviewed as part of the individual Director performance evaluation process to ensure all non-executive Board members retain the necessary independence of judgement. The Board has determined that all our Non-Executive Directors are independent and have retained their independence of character and judgement. In coming to this conclusion, the Board has taken into account any indicators of potential non-independence as set out in the UK Code, as well as the independence requirements outlined in the NYSE’s listing standards.
(ii) |
Committees of the Board |
We have a number of board committees that are broadly comparable in purpose and composition to those required by NYSE’s listing standards for U.S. domestic companies. For instance, the Company has a Nomination Committee (rather than a nominating and corporate governance committee) and a Remuneration Committee (rather than a compensation committee). The Company also has an Audit Committee, which the NYSE’s listing standards require for both U.S. domestic companies and foreign private issuers.
Under U.S. securities laws and the NYSE’s listing standards, we are required to have an audit committee that satisfies the requirements of Rule 10A-3 under the Exchange Act and Section 303A.06 of the NYSE Listed Company Manual, which incorporate the rules concerning audit committees implemented by the SEC under the Sarbanes-Oxley Act. Our Audit Committee complies with these requirements. Our Audit Committee does not have direct responsibility for the appointment, reappointment or removal of the external auditors. Instead, our Audit Committee follows the UK Code by making recommendations to the Board on these matters for the Board to put forward for shareholder approval at a general meeting of the Company.
One of the NYSE’s additional requirements for the audit committee states that at least one member of the audit committee is to have ‘accounting or related financial management expertise’. The Board has determined that Sally Johnson, Chair of the Audit Committee, possesses such expertise and also possesses the financial and audit committee experiences set forth in both the UK Code and SEC rules. Sally Johnson has also been designated as an audit committee financial expert as defined in Item 16A of Form 20-F. The Board has also determined that each member of the Audit Committee meets the financial literacy requirements applicable under NYSE listing standards.
Our Nomination Committee does not develop and recommend to the Board a set of corporate governance guidelines applicable to the Company. Instead, our management oversees the development of corporate governance guidelines for recommendation to and approval by the full Board.
(iii) |
Shareholder Approval of Equity Compensation Plans |
The NYSE listing standards applicable to U.S. domestic companies require that shareholders must be given the opportunity to vote on all equity-compensation plans and material revisions to those plans. The Company complies with UK requirements, which are similar to the NYSE requirements. The Board, however, does not explicitly take into consideration the NYSE’s detailed definition of what are considered ‘material revisions’.
(iv) |
Code of Conduct and Ethics |
The NYSE listing standards require U.S. domestic companies to adopt and disclose a code of business conduct and ethics for all directors, officers and employees and promptly disclose any waivers of the code for directors or executive officers. Our Directors, management, and employees of the Group and all Group companies are bound by a code of conduct. Please also see the information above under the heading Item 16B “Code of Ethics”.
ITEM 16H. MINE SAFETY DISCLOSURE
Not applicable.
ITEM 16I. DISCLOSURE REGARDING FOREIGN JURISDICTIONS THAT PREVENT INSPECTIONS
Not applicable.
44
ITEM 16J. INSIDER TRADING POLICIES
The Board has adopted a dealing policy governing the purchase, sale, and other dispositions of the Company’s securities by Directors, senior management and employees of the Company and its subsidiaries, that is reasonably designed to promote compliance with applicable insider trading laws, rules and regulations, and any applicable listing standards (the “Dealing Policy”).
The Company’s Dealing Policy is included in this Form 20-F as Exhibit 11.1.
The information set forth under the heading “Corporate Governance—Our Governance—Our Code of Conduct - Our Cornerstone” on page 84 of the Annual Report 2025 included as exhibit 15.1 to this Form 20-F is incorporated by reference.
ITEM 16K. CYBER SECURITY
The Board oversees the Group’s risk management and internal control framework, including consideration of the risks posed from cyber security threats.
Management provides an in-depth annual update to the Board on the Group’s IT security arrangements, including details of our cyber security operations and performance, and the status of this risk.
To protect the Group from potential cyber security threats, we have employed complementary processes for assessing, identifying, and managing the risk, with our information systems being protected by a multi-layered set of technology and processes (implemented and monitored by cyber security professionals), and consistent with the US National Institute of Standards and Technology Cybersecurity Framework. This is periodically assessed via recurring independent third-party assessments, internal audits, and penetration testing. The Group has also adopted cyber security incident response plans, to ensure the appropriate escalation of potential threats in a timely manner, and we use our e-learning platform for cyber security training, along with regular phishing simulations, to assess the effectiveness of our training and to test user awareness of current threats. The Group has not experienced previous cyber security incidents that have materially impacted the business or business strategy.
In addition to the annual presentation to the Board, the outputs of these security activities are summarised and reviewed by the Group Risk Committee and discussed at the IT leadership team meetings. The Audit Committee would also be notified of any control incidents. Third-party partners are subject to appropriate controls as specified on Rentokil Initial third-party risk management and procurement processes, and enforced via service agreement and contract terms and conditions.
Management reviews cyber security risks through updates received from the Group Chief Information Security Officer (CISO), IT Risk Committee, and Internal Audit. These updates include details of the actions being taken to prevent, detect, mitigate, and remediate the risk of cyber security threats. Management also considers recommendations from the Group CISO, including any corrective actions required to address exposed risk to information systems from cyber security threats.
The Group’s CISO, who reports to the Chief Information Officer, has more than 20 years of cyber security expertise, across a range of diverse industries, and leads our Information Security team. The Information Security team is supported by an external third party that provides uninterrupted security monitoring.
In addition, the information set forth under the headings “Strategic Report—Risks and Uncertainties—Changes in the company’s risk profile in 2025” on page 70, “Strategic Report—Risks and Uncertainties—Failure to ensure business continuity in a case of material incident” on page 74 and “Corporate Governance—Audit Committee Report—Risk management and internal control—Risk and internal controls” on pages 105 to 106, in each case of the Annual Report 2025 included as exhibit 15.1 to this Form 20-F is incorporated by reference.
Please also see the information above under Item 3 “Key Information—Risk Factors—Cyber security breaches, attacks and other similar incidents, as well as disruptions or failures in our IT systems or data security procedures and those of our third-party service providers, could expose us to liability, limit our ability to effectively monitor, operate and control operations and adversely impact our business, reputation, results of operations, financial condition and/or prospects” as well as “—Extraordinary events may significantly impact our business if we are unable to ensure business continuity due to a material incident.”
45
PART III
ITEM 17. FINANCIAL STATEMENTS
The Company has responded to Item 18 in lieu of this item.
ITEM 18. FINANCIAL STATEMENTS
Please refer to the information (including tabular data) set forth under the heading “Consolidated Financial Statements” on pages F-1 to F-82 of this Form 20-F.
In accordance with Rule 405(a)(3) under Regulation S-T, this information (including tabular data) is reproduced under Item 8 herein tagged with Inline XBRL formatting.
ITEM 19. EXHIBITS(1)
1.1 |
|
|
2.1 |
|
|
2.2 |
|
|
8.1 |
|
|
11.1 |
|
|
12.1 |
|
|
12.2 |
|
|
13.1 |
|
|
15.1 |
|
|
15.2 |
|
Consent of PricewaterhouseCoopers LLP, independent registered public accounting firm. |
97.1 |
|
Rentokil Initial plc SEC Compensation Recoupment Policy dated 19 March 2026. |
101.INS |
|
XBRL Instance Document. |
101.SCH |
|
XBRL Taxonomy Extension Schema. |
101.CAL |
|
XBRL Taxonomy Extension Scheme Calculation Linkbase. |
101.DEF |
|
XBRL Taxonomy Extension Scheme Definition Linkbase. |
101.LAB |
|
XBRL Taxonomy Extension Scheme Label Linkbase. |
46
101.PRE |
|
XBRL Taxonomy Extension Scheme Presentation Linkbase. |
104.Cover |
|
Interactive Data File (formatted as Inline XBRL and included in Exhibit 101) |
(1) |
Exhibits other than those listed above are omitted when in the opinion of the registrant they are either not applicable or not material. Other Exhibits previously filed have been omitted when in the opinion of the registrant such Exhibits are no longer material. |
(2) |
Certain of the information included within Exhibit 15.1, which is provided pursuant to Rule 12b-23(a) of the Securities Exchange Act of 1934, as amended, is incorporated by reference in this Form 20-F, as specified elsewhere in this Form 20-F. With the exception of the items and pages so specified, the Annual Report 2025 is not deemed to be filed as part of this annual report on Form 20-F. |
47
SIGNATURE
The registrant hereby certifies that it meets all of the requirements for filing on Form 20-F and that it has duly caused and authorized the undersigned to sign this annual report on its behalf.
|
Rentokil Initial plc |
||
|
|
||
|
|
||
By: |
/s/ Paul Edgecliffe-Johnson |
||
|
|
Name: |
Paul Edgecliffe-Johnson |
|
|
Title: |
Chief Financial Officer |
London, England
25 March 2026
48
ITEM 8. FINANCIAL STATEMENTS AND SUPPLEMENTARY DATA
INDEX TO FINANCIAL STATEMENTS
Report of Independent Registered Public Accounting Firm - PricewaterhouseCoopers LLP (PCAOB ID 876) |
F-2 |
|
Consolidated Statement of Profit or Loss and Other Comprehensive Income |
F-5 |
|
F-6 |
||
F-7 |
||
F-9 |
||
F-10 |
||
F-1
Report of Independent Registered Public Accounting Firm
To the Board of Directors and Shareholders of Rentokil Initial plc
Opinions on the Financial Statements and Internal Control over Financial Reporting
We have audited the accompanying consolidated balance sheet of Rentokil Initial plc and its subsidiaries (the “Group”) as of 31 December 2025 and 2024, and the related consolidated statement of profit or loss and other comprehensive income, consolidated statement of changes in equity and consolidated cash flow statement for each of the three years in the period ended 31 December 2025, including the related notes (collectively referred to as the “consolidated financial statements”). We also have audited the Group's internal control over financial reporting as of 31 December 2025, based on criteria established in Internal Control - Integrated Framework (2013) issued by the Committee of Sponsoring Organizations of the Treadway Commission (COSO).
In our opinion, the consolidated financial statements referred to above present fairly, in all material respects, the financial position of the Group as of 31 December 2025 and 2024, and the results of its operations and its cash flows for each of the three years in the period ended 31 December 2025 in conformity with International Financial Reporting Standards as issued by the International Accounting Standards Board and UK-adopted International Accounting Standards. Also in our opinion, the Group maintained, in all material respects, effective internal control over financial reporting as of 31 December 2025, based on criteria established in Internal Control - Integrated Framework (2013) issued by the COSO.
Basis for Opinions
The Group’s management is responsible for these consolidated financial statements, for maintaining effective internal control over financial reporting, and for its assessment of the effectiveness of internal control over financial reporting, included in Management's Annual Report on Internal Control over Financial Reporting appearing under Item 15B. Our responsibility is to express opinions on the Group’s consolidated financial statements and on the Group’s internal control over financial reporting based on our audits. We are a public accounting firm registered with the Public Company Accounting Oversight Board (United States) (PCAOB) and are required to be independent with respect to the Group in accordance with the U.S. federal securities laws and the applicable rules and regulations of the Securities and Exchange Commission and the PCAOB.
We conducted our audits in accordance with the standards of the PCAOB. Those standards require that we plan and perform the audits to obtain reasonable assurance about whether the consolidated financial statements are free of material misstatement, whether due to error or fraud, and whether effective internal control over financial reporting was maintained in all material respects.
Our audits of the consolidated financial statements included performing procedures to assess the risks of material misstatement of the consolidated financial statements, whether due to error or fraud, and performing procedures that respond to those risks. Such procedures included examining, on a test basis, evidence regarding the amounts and disclosures in the consolidated financial statements. Our audits also included evaluating the accounting principles used and significant estimates made by management, as well as evaluating the overall presentation of the consolidated financial statements. Our audit of internal control over financial reporting included obtaining an understanding of internal control over financial reporting, assessing the risk that a material weakness exists, and testing and evaluating the design and operating effectiveness of internal control based on the assessed risk. Our audits also included performing such other procedures as we considered necessary in the circumstances. We believe that our audits provide a reasonable basis for our opinions.
F-2
Definition and Limitations of Internal Control over Financial Reporting
A company’s internal control over financial reporting is a process designed to provide reasonable assurance regarding the reliability of financial reporting and the preparation of financial statements for external purposes in accordance with generally accepted accounting principles. A company’s internal control over financial reporting includes those policies and procedures that (i) pertain to the maintenance of records that, in reasonable detail, accurately and fairly reflect the transactions and dispositions of the assets of the company; (ii) provide reasonable assurance that transactions are recorded as necessary to permit preparation of financial statements in accordance with generally accepted accounting principles, and that receipts and expenditures of the company are being made only in accordance with authorisations of management and directors of the company; and (iii) provide reasonable assurance regarding prevention or timely detection of unauthorised acquisition, use, or disposition of the company’s assets that could have a material effect on the financial statements.
Because of its inherent limitations, internal control over financial reporting may not prevent or detect misstatements. Also, projections of any evaluation of effectiveness to future periods are subject to the risk that controls may become inadequate because of changes in conditions, or that the degree of compliance with the policies or procedures may deteriorate.
Critical Audit Matters
The critical audit matters communicated below are matters arising from the current period audit of the consolidated financial statements that were communicated or required to be communicated to the audit committee and that (i) relate to accounts or disclosures that are material to the consolidated financial statements and (ii) involved our especially challenging, subjective, or complex judgments. The communication of critical audit matters does not alter in any way our opinion on the consolidated financial statements, taken as a whole, and we are not, by communicating the critical audit matters below, providing separate opinions on the critical audit matters or on the accounts or disclosures to which they relate.
Impairment assessment of goodwill
As described in the material accounting policies and Note B2 to the consolidated financial statements, the Group recorded $6,584 million of goodwill at 31 December 2025. Goodwill is tested annually for impairment and carried at cost less accumulated impairment losses. For the purpose of impairment testing, goodwill is allocated to cash-generating unit groups (CGU groups) identified according to region of operation and reportable business unit. At the start of 2025, management reviewed its grouping of CGUs and its allocation of goodwill for the purposes of assessing impairment based on the lowest level at which the goodwill is monitored. Based on this review, management has determined that the Group now has six CGU groups. These are North America, UK & SSA, Europe, LATAM, Asia & MENAT, and Pacific. The recoverable amount of a CGU group is determined based on the higher of value-in-use calculations using cash flow projections, and fair value less costs to sell. Management’s value-in-use model uses the following assumptions about the future: revenue growth rate, operating profit margin, discount rate and long-term growth rate (LTGR). The cash flow projections in year one are based on financial budgets approved by management, which are prepared as part of the Group’s normal planning process. Cash flows for years two to five use management’s expectation of revenue growth and operating profit margin, based on past experience and expectations regarding future performance and profitability for each CGU group. Cash flows beyond the five-year period are extrapolated using estimated LTGR.
The principal considerations for our determination that performing procedures relating to the impairment assessment of goodwill is a critical audit matter are: (i) the judgements by management when developing the recoverable amount of the CGU groups; (ii) a high degree of auditor judgement, subjectivity, complexity and effort in performing procedures and evaluating management’s assumptions related to revenue growth rate, operating profit margin, discount rate and LTGR; and (iii) the audit effort involved the use of professionals with specialised skill and knowledge.
F-3
Addressing the matter involved performing procedures and evaluating audit evidence in connection with forming our overall opinion on the consolidated financial statements. These procedures included, among others, (i) testing management’s process for developing the recoverable amount of the CGU groups; (ii) evaluating the appropriateness of the recoverable amount calculation; (iii) testing the completeness and accuracy of underlying data used in the calculation; and (iv) evaluating the reasonableness of the assumptions used by management relating to revenue growth rate, operating profit margin, discount rate and LTGR. Evaluating management’s assumptions involved evaluating whether the assumptions were reasonable considering (i) the current and past performance of the CGU groups; (ii) the consistency with external market and industry data; and (iii) whether these assumptions were consistent with evidence obtained in other areas of the audit. Professionals with specialised skill and knowledge were used to assist in the evaluation of the LTGR and discount rate assumptions.
Valuation of termite damage claim provisions
As described in the material accounting policies and Note A6 to the consolidated financial statements, the Group holds provisions for termite damage claims covered by contractual warranties. With the acquisition of Terminix in 2022, the Group assumed a liability for termite damage claims, based on termite customers existing at the acquisition date, for which a provision has been estimated. The liability arises when a termite infestation occurs, resulting in damage to a property under a termite contract, that requires subsequent remediation by the Group. Termite damage claim provisions are subject to significant assumptions and estimation uncertainty. The assumptions included in valuing termite provisions are based on an estimate of the volume and value of future claims (based on historical incurred claims and latest available historical settled claims respectively), customer churn rates, discount rates and inflation. The provision amounted to $358 million at 31 December 2025.
The principal considerations for our determination that performing procedures relating to the valuation of termite damage claim provisions is a critical audit matter are: (i) significant judgement by management in valuing the provision; and (ii) a high degree of auditor judgement, subjectivity, complexity and effort in performing procedures to evaluate management’s significant assumptions related to the claim value, claim rate and inflation rate.
Addressing the matter involved performing procedures and evaluating audit evidence in connection with forming our overall opinion on the consolidated financial statements. These procedures included, among others, (i) testing management’s process for valuing the provision; (ii) evaluating the appropriateness of the valuation methodology; (iii) testing the completeness and accuracy of data used by management; and (iv) evaluating the reasonableness of significant assumptions related to the claim value, claim rate and inflation rate. Evaluating management’s assumptions related to the claim value, claim rate and inflation rate involved evaluating whether the assumptions were reasonable considering (i) the historical trend; (ii) consistency of assumptions used in the current year versus the prior year; and (iii) whether these assumptions were consistent with evidence obtained in other areas of the audit.
/s/PricewaterhouseCoopers LLP
London, United Kingdom
25 March 2026
We have served as the Group’s auditor since 2021.
F-4
Consolidated Statement of Profit or Loss and Other Comprehensive Income
For the year ended 31 December
|
|
|
|
|
|
2024 |
|
2023 |
|
|
|
|
2025 |
|
represented1 |
|
represented1 |
|
|
Notes |
|
$m |
|
$m |
|
$m |
Revenue |
|
A1 |
|
6,908 |
|
6,617 |
|
6,385 |
Operating expenses |
|
A7 |
|
(6,250) |
|
(5,902) |
|
(5,609) |
Net impairment losses on financial assets |
|
|
|
(74) |
|
(71) |
|
(49) |
Operating profit |
|
A1 |
|
584 |
|
644 |
|
727 |
Finance income |
|
C9 |
|
46 |
|
59 |
|
60 |
Finance cost |
|
C8 |
|
(250) |
|
(250) |
|
(232) |
Share of profit from associates net of tax |
|
B6 |
|
10 |
|
9 |
|
11 |
Profit before income tax |
|
|
|
390 |
|
462 |
|
566 |
Income tax expense |
|
A12 |
|
(100) |
|
(116) |
|
(129) |
Profit from continuing operations |
|
|
|
290 |
|
346 |
|
437 |
Profit from discontinued operations |
|
B7 |
|
180 |
|
46 |
|
37 |
Profit for the year |
|
|
|
470 |
|
392 |
|
474 |
Profit for the year attributable to: |
|
|
|
|
|
|
|
|
Equity holders of the Company |
|
|
|
470 |
|
392 |
|
474 |
Non-controlling interests |
|
|
|
— |
|
— |
|
— |
|
|
|
|
|
|
|
|
|
Other comprehensive income: |
|
|
|
|
|
|
|
|
Items that are not reclassified subsequently to the income statement: |
|
|
|
|
|
|
|
|
Remeasurement of net defined benefit liability |
|
A10 |
|
1 |
|
— |
|
— |
|
|
|
|
|
|
|
|
|
Items that are or may be reclassified subsequently to the income statement: |
|
|
|
|
|
|
|
|
Net exchange adjustments offset in reserves |
|
|
|
(139) |
|
(35) |
|
(172) |
Net gain/(loss) on net investment hedge |
|
|
|
129 |
|
(22) |
|
136 |
Effective portion of changes in fair value of cash flow hedge |
|
|
|
(31) |
|
35 |
|
4 |
Cost of hedging |
|
|
|
— |
|
(7) |
|
12 |
Tax related to items taken to other comprehensive income |
|
A12, A14 |
|
18 |
|
(8) |
|
7 |
Net exchange adjustments transferred to profit on disposal of business |
|
B7 |
|
38 |
|
— |
|
— |
Net gain on net investment hedge transferred to profit on disposal of business |
|
B7 |
|
(11) |
|
— |
|
— |
Other comprehensive income for the year |
|
|
|
5 |
|
(37) |
|
(13) |
Total comprehensive income for the year |
|
|
|
475 |
|
355 |
|
461 |
Total comprehensive income for the year attributable to: |
|
|
|
|
|
|
|
|
Equity holders of the Company |
|
|
|
475 |
|
355 |
|
461 |
Non-controlling interests |
|
|
|
— |
|
— |
|
— |
|
|
|
|
|
|
|
|
|
Earnings per share: |
|
|
|
|
|
|
|
|
From continuing operations |
|
|
|
|
|
|
|
|
Basic (cents) |
|
A2 |
|
11.49 |
|
13.72 |
|
17.37 |
Diluted (cents) |
|
A2 |
|
11.44 |
|
13.69 |
|
17.29 |
From continuing and discontinued operations |
|
|
|
|
|
|
|
|
Basic (cents) |
|
A2 |
|
18.62 |
|
15.54 |
|
18.84 |
Diluted (cents) |
|
A2 |
|
18.54 |
|
15.51 |
|
18.75 |
| 1. | Refer to foreign currency translation in material accounting policies section. |
F-5
Consolidated Balance Sheet
At 31 December
|
|
|
|
|
|
2024 |
|
At 1 January 2024 |
|
|
|
|
2025 |
|
represented1 |
|
represented1 |
|
|
Note |
|
$m |
|
$m |
|
$m |
Assets |
|
|
|
|
|
|
|
|
Non-current assets |
|
|
|
|
|
|
|
|
Intangible assets |
|
B2 |
|
8,917 |
|
8,899 |
|
8,970 |
Property, plant and equipment |
|
B3 |
|
445 |
|
628 |
|
636 |
Right-of-use assets |
|
B4 |
|
576 |
|
577 |
|
576 |
Investments in associated undertakings |
|
B6 |
|
41 |
|
46 |
|
56 |
Other investments |
|
C4 |
|
25 |
|
26 |
|
27 |
Deferred tax assets |
|
A14 |
|
55 |
|
43 |
|
55 |
Contract costs |
|
A1 |
|
337 |
|
298 |
|
285 |
Retirement benefit assets |
|
A10 |
|
6 |
|
4 |
|
4 |
Trade and other receivables |
|
A3 |
|
52 |
|
71 |
|
57 |
Derivative financial instruments |
|
C6 |
|
121 |
|
8 |
|
72 |
|
|
|
|
10,575 |
|
10,600 |
|
10,738 |
Current assets |
|
|
|
|
|
|
|
|
Other investments |
|
C4 |
|
2 |
|
1 |
|
1 |
Inventories |
|
A4 |
|
308 |
|
287 |
|
264 |
Trade and other receivables |
|
A3 |
|
1,151 |
|
1,137 |
|
1,121 |
Current tax assets |
|
A13 |
|
18 |
|
28 |
|
42 |
Derivative financial instruments |
|
C6 |
|
61 |
|
— |
|
18 |
Cash and cash equivalents |
|
C3 |
|
2,319 |
|
1,158 |
|
1,989 |
|
|
|
|
3,859 |
|
2,611 |
|
3,435 |
Liabilities |
|
|
|
|
|
|
|
|
Current liabilities |
|
|
|
|
|
|
|
|
Trade and other payables |
|
A5 |
|
(1,392) |
|
(1,400) |
|
(1,457) |
Current tax liabilities |
|
A13 |
|
(61) |
|
(53) |
|
(61) |
Provisions for liabilities and charges |
|
A6 |
|
(275) |
|
(144) |
|
(119) |
Bank and other short-term borrowings |
|
C2 |
|
(1,411) |
|
(1,460) |
|
(1,444) |
Lease liabilities |
|
B4 |
|
(171) |
|
(163) |
|
(162) |
Derivative financial instruments |
|
C6 |
|
(5) |
|
(4) |
|
(41) |
|
|
|
|
(3,315) |
|
(3,224) |
|
(3,284) |
Net current assets/(liabilities) |
|
|
|
544 |
|
(613) |
|
151 |
Non-current liabilities |
|
|
|
|
|
|
|
|
Other payables |
|
A5 |
|
(46) |
|
(86) |
|
(90) |
Bank and other long-term borrowings |
|
C2 |
|
(4,156) |
|
(3,127) |
|
(4,016) |
Lease liabilities |
|
B4 |
|
(392) |
|
(394) |
|
(405) |
Deferred tax liabilities |
|
A14 |
|
(589) |
|
(638) |
|
(659) |
Retirement benefit obligations |
|
A10 |
|
(27) |
|
(32) |
|
(36) |
Provisions for liabilities and charges |
|
A6 |
|
(397) |
|
(381) |
|
(455) |
Derivative financial instruments |
|
C6 |
|
(18) |
|
(36) |
|
(20) |
|
|
|
|
(5,625) |
|
(4,694) |
|
(5,681) |
Net assets |
|
|
|
5,494 |
|
5,293 |
|
5,208 |
Equity |
|
|
|
|
|
|
|
|
Capital and reserves attributable to the Company’s equity holders |
|
|
|
|
|
|
|
|
Share capital |
|
D2 |
|
41 |
|
41 |
|
41 |
Share premium |
|
|
|
21 |
|
20 |
|
19 |
Other reserves |
|
|
|
(946) |
|
(932) |
|
(903) |
Retained earnings |
|
|
|
6,380 |
|
6,166 |
|
6,053 |
|
|
|
|
5,496 |
|
5,295 |
|
5,210 |
Non-controlling interests |
|
|
|
(2) |
|
(2) |
|
(2) |
Total equity |
|
|
|
5,494 |
|
5,293 |
|
5,208 |
| 1. | Refer to foreign currency translation in material accounting policies section. |
The Financial Statements on pages F-1 to F-82 were approved by the Board of Directors and were signed on its behalf by Andy Ransom and Paul Edgecliffe-Johnson on 5 March 2026.
Andy Ransom |
|
Paul Edgecliffe-Johnson |
Chief Executive |
|
Chief Financial Officer |
F-6
Consolidated Statement of Changes in Equity
For the year ended 31 December
|
|
|
|
Attributable to equity holders of the Company |
|
Non- |
|
|
||||||
|
|
|
|
Share |
|
Share |
|
Other |
|
Retained |
|
controlling |
|
Total |
|
|
|
|
capital |
|
premium |
|
reserves |
|
earnings |
|
interests |
|
equity |
|
|
Notes |
|
$m |
|
$m |
|
$m |
|
$m |
|
$m |
|
$m |
At 1 January 2023 represented2 |
|
|
|
41 |
|
14 |
|
(883) |
|
5,787 |
|
(2) |
|
4,957 |
Profit for the year |
|
|
|
— |
|
— |
|
— |
|
474 |
|
— |
|
474 |
Other comprehensive income: |
|
|
|
|
|
|
|
|
|
|
|
|
|
|
Net exchange adjustments offset in reserves |
|
|
|
— |
|
— |
|
(172) |
|
— |
|
— |
|
(172) |
Net gain on net investment hedge |
|
|
|
— |
|
— |
|
136 |
|
— |
|
— |
|
136 |
Net gain on cash flow hedge1 |
|
|
|
— |
|
— |
|
4 |
|
— |
|
— |
|
4 |
Cost of hedging |
|
|
|
— |
|
— |
|
12 |
|
— |
|
— |
|
12 |
Tax related to items taken directly to other comprehensive income |
|
|
|
— |
|
— |
|
— |
|
7 |
|
— |
|
7 |
Total other comprehensive income for the year |
|
|
|
— |
|
— |
|
(20) |
|
481 |
|
— |
|
461 |
Transactions with owners: |
|
|
|
|
|
|
|
|
|
|
|
|
|
|
Gain on stock options |
|
|
|
— |
|
5 |
|
— |
|
— |
|
— |
|
5 |
Dividends paid to equity shareholders |
|
|
|
— |
|
— |
|
— |
|
(252) |
|
— |
|
(252) |
Cost of equity-settled share-based payment plans |
|
|
|
— |
|
— |
|
— |
|
32 |
|
— |
|
32 |
Movement in the carrying value of put options |
|
|
|
— |
|
— |
|
— |
|
5 |
|
— |
|
5 |
At 31 December 2023 represented2 |
|
|
|
41 |
|
19 |
|
(903) |
|
6,053 |
|
(2) |
|
5,208 |
Profit for the year |
|
|
|
— |
|
— |
|
— |
|
392 |
|
— |
|
392 |
Other comprehensive income: |
|
|
|
|
|
|
|
|
|
|
|
|
|
|
Net exchange adjustments offset in reserves |
|
|
|
— |
|
— |
|
(35) |
|
— |
|
— |
|
(35) |
Net loss on net investment hedge |
|
|
|
— |
|
— |
|
(22) |
|
— |
|
— |
|
(22) |
Net gain on cash flow hedge1 |
|
|
|
— |
|
— |
|
35 |
|
— |
|
— |
|
35 |
Cost of hedging |
|
|
|
— |
|
— |
|
(7) |
|
— |
|
— |
|
(7) |
Tax related to items taken directly to other comprehensive income |
|
|
|
— |
|
— |
|
— |
|
(8) |
|
— |
|
(8) |
Total other comprehensive income for the year |
|
|
|
— |
|
— |
|
(29) |
|
384 |
|
— |
|
355 |
Transactions with owners: |
|
|
|
|
|
|
|
|
|
|
|
|
|
|
Gain on stock options |
|
|
|
— |
|
1 |
|
— |
|
— |
|
— |
|
1 |
Dividends paid to equity shareholders |
|
|
|
— |
|
— |
|
— |
|
(292) |
|
— |
|
(292) |
Cost of equity-settled share-based payment plans |
|
|
|
— |
|
— |
|
— |
|
25 |
|
— |
|
25 |
Tax related to items taken directly to equity |
|
|
|
— |
|
— |
|
— |
|
(3) |
|
— |
|
(3) |
Movement in the carrying value of put options |
|
|
|
— |
|
— |
|
— |
|
(1) |
|
— |
|
(1) |
At 31 December 2024 represented2 |
|
|
|
41 |
|
20 |
|
(932) |
|
6,166 |
|
(2) |
|
5,293 |
Profit for the year |
|
|
|
— |
|
— |
|
— |
|
470 |
|
— |
|
470 |
Other comprehensive income: |
|
|
|
|
|
|
|
|
|
|
|
|
|
|
Remeasurement of net defined benefit liability |
|
|
|
— |
|
— |
|
— |
|
1 |
|
— |
|
1 |
Net exchange adjustments offset in reserves |
|
|
|
— |
|
— |
|
(139) |
|
— |
|
— |
|
(139) |
Net gain on net investment hedge |
|
|
|
— |
|
— |
|
129 |
|
— |
|
— |
|
129 |
Net loss on cash flow hedge1 |
|
|
|
— |
|
— |
|
(31) |
|
— |
|
— |
|
(31) |
Cost of hedging |
|
|
|
— |
|
— |
|
— |
|
— |
|
— |
|
— |
Tax related to items taken directly to other comprehensive income |
|
|
|
— |
|
— |
|
— |
|
18 |
|
— |
|
18 |
Cumulative reserves recycled to income statement on disposal of foreign operations |
|
|
|
— |
|
— |
|
27 |
|
— |
|
— |
|
27 |
Total other comprehensive income for the year |
|
|
|
— |
|
— |
|
(14) |
|
489 |
|
— |
|
475 |
Transactions with owners: |
|
|
|
|
|
|
|
|
|
|
|
|
|
|
Gain on stock options |
|
|
|
— |
|
1 |
|
— |
|
— |
|
— |
|
1 |
Dividends paid to equity shareholders |
|
D1 |
|
— |
|
— |
|
— |
|
(304) |
|
— |
|
(304) |
Cost of equity-settled share-based payment plans |
|
|
|
— |
|
— |
|
— |
|
28 |
|
— |
|
28 |
Tax related to items taken directly to equity |
|
|
|
— |
|
— |
|
— |
|
1 |
|
— |
|
1 |
At 31 December 2025 |
|
|
|
41 |
|
21 |
|
(946) |
|
6,380 |
|
(2) |
|
5,494 |
| 1. | $31m net loss (2024: $35m net gain; 2023: $4m net gain) on cash flow hedge includes a $64m gain (2024: $65m loss; 2023: $36m loss) from the effective portion of changes in fair value, and a $95m loss (2024: $100m gain; 2023: $40m gain) reclassification to the income statement due to changes in foreign exchange rates. |
| 2. | Refer to foreign currency translation in material accounting policies section. |
Shares of $nil (2024: $nil; 2023: $nil) have been netted against retained earnings. This represents 9.8m (2024: 11.4m; 2023: 13.0m) shares held by the Rentokil Initial Employee Share Trust, which is not consolidated. The market value of these shares at 31 December 2025 was $59m (2024: $56m; 2023: $71m). Dividend income from, and voting rights on, the shares held by the Trust have been waived.
F-7
Analysis of other reserves
|
|
Capital |
|
Merger |
|
Cash flow |
|
|
|
|
|
|
|
|
reduction |
|
relief |
|
hedge |
|
Translation |
|
Cost of |
|
|
|
|
reserve |
|
reserve |
|
reserve |
|
reserve |
|
hedging |
|
Total |
|
|
$m |
|
$m |
|
$m |
|
$m |
|
$m |
|
$m |
At 1 January 2023 represented2 |
|
(3,146) |
|
3,326 |
|
4 |
|
(1,062) |
|
(5) |
|
(883) |
Net exchange adjustments offset in reserves |
|
— |
|
— |
|
— |
|
(172) |
|
— |
|
(172) |
Net gain on net investment hedge |
|
— |
|
— |
|
— |
|
136 |
|
— |
|
136 |
Net gain on cash flow hedge1 |
|
— |
|
— |
|
4 |
|
— |
|
— |
|
4 |
Cost of hedging |
|
— |
|
— |
|
— |
|
— |
|
12 |
|
12 |
Total comprehensive income for the year |
|
— |
|
— |
|
4 |
|
(36) |
|
12 |
|
(20) |
At 31 December 2023 represented2 |
|
(3,146) |
|
3,326 |
|
8 |
|
(1,098) |
|
7 |
|
(903) |
Net exchange adjustments offset in reserves |
|
— |
|
— |
|
— |
|
(35) |
|
— |
|
(35) |
Net loss on net investment hedge |
|
— |
|
— |
|
— |
|
(22) |
|
— |
|
(22) |
Net gain on cash flow hedge1 |
|
— |
|
— |
|
35 |
|
— |
|
— |
|
35 |
Cost of hedging |
|
— |
|
— |
|
— |
|
— |
|
(7) |
|
(7) |
Total comprehensive income for the year |
|
— |
|
— |
|
35 |
|
(57) |
|
(7) |
|
(29) |
At 31 December 2024 represented2 |
|
(3,146) |
|
3,326 |
|
43 |
|
(1,155) |
|
— |
|
(932) |
Net exchange adjustments offset in reserves |
|
— |
|
— |
|
— |
|
(139) |
|
— |
|
(139) |
Net gain on net investment hedge |
|
— |
|
— |
|
— |
|
129 |
|
— |
|
129 |
Net loss on cash flow hedge1 |
|
— |
|
— |
|
(31) |
|
— |
|
— |
|
(31) |
Cumulative reserves recycled to income statement on disposal of foreign operations |
|
— |
|
— |
|
— |
|
27 |
|
— |
|
27 |
Total comprehensive income for the year |
|
— |
|
— |
|
(31) |
|
17 |
|
— |
|
(14) |
At 31 December 2025 |
|
(3,146) |
|
3,326 |
|
12 |
|
(1,138) |
|
— |
|
(946) |
| 1. | $31m net loss (2024: $35m net gain; 2023: $4m net gain) on cash flow hedge includes a $64m gain (2024: $65m loss; 2023: $36m loss) from the effective portion of changes in fair value, offset by reclassification to the cost of acquisition of $nil (2024: $nil; 2023: $nil) and a $95m loss (2024: $100m gain; 2023: $40m gain) reclassification to the income statement due to changes in foreign exchange rates. |
| 2. | Refer to foreign currency translation in material accounting policies section. |
The capital reduction reserve arose in 2005 as a result of the scheme of arrangement of Rentokil Initial 1927 plc, under section 425 of the Companies Act 1985, to introduce a new holding company, Rentokil Initial plc, and the subsequent reduction in capital approved by the High Court whereby the nominal value of each ordinary share was reduced from 100p to 1p.
The excess of the fair value of shares issued to fund the acquisition of Terminix over their par value gave rise to a new reserve called a Merger Relief Reserve. Under section 612 of the Companies Act 2006, merger relief is available if certain circumstances are met when a business is acquired by issuing shares to replace already issued shares. This reserve is unrealised (and therefore not distributable), but it may become realised at a later date; for example, on disposal of the investment to which it relates or on impairment of that investment (which may occur after payment of a dividend by the investment).
F-8
Consolidated Cash Flow Statement
For the year ended 31 December
|
|
|
|
|
|
2024 |
|
2023 |
|
|
|
|
2025 |
|
represented2 |
|
represented2 |
|
|
Note |
|
$m |
|
$m |
|
$m |
Cash flows from operating activities |
|
|
|
|
|
|
|
|
Operating profit from: |
|
|
|
|
|
|
|
|
– Continuing operations |
|
|
|
584 |
|
644 |
|
727 |
– Discontinued operations |
|
B7 |
|
74 |
|
57 |
|
50 |
Operating profit including discontinued operations |
|
|
|
658 |
|
701 |
|
777 |
Adjustments for: |
|
|
|
|
|
|
|
|
– Depreciation and impairment of property, plant and equipment |
|
B3 |
|
167 |
|
204 |
|
191 |
– Depreciation and impairment of leased assets |
|
B4 |
|
160 |
|
157 |
|
150 |
– Amortisation and impairment of intangible assets (excluding computer software) |
|
B2 |
|
199 |
|
254 |
|
218 |
– Amortisation and impairment of computer software |
|
B2 |
|
37 |
|
33 |
|
32 |
– Other non-cash items |
|
|
|
15 |
|
23 |
|
32 |
Changes in working capital (excluding the effects of acquisitions and exchange differences on consolidation): |
|
|
|
|
|
|
|
|
– Inventories |
|
|
|
(27) |
|
(15) |
|
(18) |
– Contract costs |
|
|
|
(51) |
|
(18) |
|
(24) |
– Trade and other receivables |
|
|
|
(20) |
|
(48) |
|
(36) |
– Trade and other payables and provisions |
|
|
|
162 |
|
(129) |
|
(76) |
Interest received |
|
|
|
31 |
|
46 |
|
31 |
Interest paid1 |
|
|
|
(255) |
|
(229) |
|
(237) |
Income tax paid |
|
A13 |
|
(104) |
|
(111) |
|
(124) |
Net cash flows from operating activities |
|
|
|
972 |
|
868 |
|
916 |
Cash flows from investing activities |
|
|
|
|
|
|
|
|
Purchase of property, plant and equipment |
|
|
|
(208) |
|
(219) |
|
(207) |
Purchase of intangible fixed assets |
|
|
|
(61) |
|
(56) |
|
(55) |
Proceeds from sale of property, plant and equipment |
|
|
|
20 |
|
5 |
|
17 |
Acquisition of companies and businesses, net of cash acquired |
|
B1 |
|
(121) |
|
(219) |
|
(298) |
Disposal of investment in associate |
|
|
|
— |
|
— |
|
24 |
Proceeds from disposal of businesses, net of tax paid |
|
B7 |
|
391 |
|
— |
|
— |
Dividends received from associates |
|
B6 |
|
5 |
|
14 |
|
5 |
Net change to cash flow from investment in term deposits |
|
|
|
— |
|
(1) |
|
— |
Net cash flows from investing activities |
|
|
|
26 |
|
(476) |
|
(514) |
Cash flows from financing activities |
|
|
|
|
|
|
|
|
Dividends paid to equity shareholders |
|
D1 |
|
(304) |
|
(292) |
|
(252) |
Capital element of lease payments |
|
|
|
(192) |
|
(185) |
|
(195) |
Cash outflow on settlement of debt-related foreign exchange forward contracts |
|
C2 |
|
(9) |
|
(11) |
|
(4) |
Proceeds from new debt |
|
|
|
1,232 |
|
— |
|
— |
Debt repayments |
|
C7 |
|
(700) |
|
(464) |
|
— |
Net cash flows from financing activities |
|
|
|
27 |
|
(952) |
|
(451) |
Net increase/(decrease) in cash and cash equivalents |
|
|
|
1,025 |
|
(560) |
|
(49) |
Cash and cash equivalents at beginning of period |
|
|
|
467 |
|
1,062 |
|
1,064 |
Exchange gain/(loss) on cash and cash equivalents |
|
|
|
97 |
|
(35) |
|
47 |
Cash and cash equivalents at end of the financial period |
|
C3 |
|
1,589 |
|
467 |
|
1,062 |
| 1. | Interest paid includes the interest element of lease payments of $31m (2024: $31m; 2023: $30m). |
| 2. | Refer to foreign currency translation in material accounting policies section. |
F-9
Material accounting policies
Basis of preparation
The Consolidated Financial Statements have been prepared in accordance with UK-adopted International Accounting Standards (IAS) and with the requirements of the Companies Act 2006 as applicable to companies reporting under those standards. The Consolidated Financial Statements also comply fully with International Financial Reporting Standards (IFRSs) as issued by the International Accounting Standards Board (IASB). The Consolidated Financial Statements have been prepared under the historical cost convention, as modified by the revaluation of certain financial assets and liabilities (including derivative instruments). Certain financial and equity instruments have been measured at fair value.
Climate change
The Group has engaged in a detailed review of expected climate change impacts on the business and its assets and liabilities, to establish any adjustments required and what disclosure is necessary in the Consolidated Financial Statements for 2025 under a 1.5–2.0°C pathway.
This process has been completed to ensure material accuracy of the financial reporting, and that disclosure of relevant information complies with the requirements of IAS 1.
The process has involved a detailed review of material revenue segments, all balance sheet line items, and each element of the Group target to reach net zero by 2040, to identify if any of these items are expected to be materially impacted in a negative or positive way by weather, legislative, or societal changes. The conclusions of this process were reviewed and agreed by the Audit Committee and Board on 12 December 2025.
Overall, the conclusion of the review was that, while there will undoubtedly be impacts on the Group, the highly disaggregated nature of the operations significantly reduces the risk profile of the Group to impacts from weather-related changes. The changes necessary to achieve net zero will not have a materially adverse impact on the cash flows of the Group and indeed, warmer climates may present some opportunities. Societal and legislative impacts are not felt to have a material impact on any one segment such that we need to break out reporting in a different way from previous years. Judgements are not felt to be significant, although clearly, understanding of climate change is developing with time. The area with the most judgement is goodwill impairment testing and a description is given in Note B2 of the processes undertaken to give comfort on the valuations. Management review has concluded that this is the only area that has judgement and potential for material impact, although we conclude that none are necessary and that no further disclosures are needed beyond this note.
Going concern
The Directors have prepared Board-approved cash flow forecasts for a period of 18 months to 30 June 2027 to demonstrate that the Group has sufficient liquidity to meet its obligations as they fall due for the period of at least 12 months from the date of approval of these Consolidated Financial Statements, with a longer assessment period to 30 June 2027 being considered as appropriate.
Additionally, the Directors have assessed severe but plausible downside scenarios. The downside scenarios include: (i) a revenue decline of 20% against base budget for six months; and (ii) a 20% revenue decline for 12 months. Both of these scenarios are considerably worse than the actual impact of the COVID-19 pandemic in 2020. These assessments were prepared on the conservative assumption that the Group has no access to the debt capital markets. As part of their analysis, the Board considered mitigating actions at their discretion to improve the position identified by the analysis if the debt capital markets are not accessible, such as cost savings, and adjusting the level of M&A activity and/or dividends paid. In addition to the above, the Directors also considered that the Group has the ability to extend existing or raise new financing, although this was not included in the modelling undertaken for going concern assessment.
The Going Concern analysis demonstrates that under the base case, the Group has c.$0.8bn of headroom at 30 June 2027 and c.$0.5bn under the severe but plausible downside scenario. This is before potential mitigations available, estimated to be c.$1.2bn.
Based on the above, the Directors have concluded that the Group is well placed to manage its financing and other business risks and have a reasonable expectation that the Group will have adequate resources to continue in operation for at least 12 months from the signing date of these Consolidated Financial Statements. They therefore consider it appropriate to adopt the going concern basis in preparing these Consolidated Financial Statements.
F-10
Consolidation
(a)Subsidiaries
Subsidiaries are entities controlled by the Group. The Group controls an entity when it: (i) has power over the entity; (ii) is exposed or has rights to variable returns from its involvement with the entity; and (iii) has the ability to affect those returns through its power over the entity. The Group reassesses whether or not it controls a subsidiary if facts and circumstances indicate that there are changes to one or more of these three elements of control.
The financial statements of subsidiaries are included in the Consolidated Financial Statements from the date that control commences until the date that control ceases. Inter-company transactions, balances, and gains and losses on transactions between Group companies are eliminated on consolidation. When less than 100% of the issued share capital of a subsidiary is acquired, and the acquisition includes an option to purchase the remaining share capital of the subsidiary, the anticipated acquisition method is applied where judged appropriate to do so. The judgement is based on the risks and rewards associated with the option to purchase, meaning that no non-controlling interest is recognised. A liability is carried on the balance sheet equal to the fair value of the option to purchase. This is revised to the fair value at each reporting date, with differences being recorded in equity.
Where the Group ceases to have control of a subsidiary, the assets and liabilities are derecognised along with any related non-controlling interest and other components of equity. Any resulting gain or loss is recognised in the income statement. Any interest retained in the former subsidiary is measured at fair value when control ceases. Changes in the Group’s interest in a subsidiary that do not result in a loss of control are accounted for as equity transactions.
The results and cash flows of significant assets or businesses sold during the year are presented as discontinued operations in the Consolidated Statement of Profit or Loss and the Consolidated Cash Flow Statement. Assets and businesses are classified as held for sale when their carrying amounts are expected to be recovered through sale rather than through continuing use. They only meet the held for sale condition when the assets are ready for immediate sale in their present condition, management is committed to the sale, and it is highly probable that the sale will complete within one year. Depreciation ceases on assets and businesses when they are classified as held for sale and the assets and businesses are impaired if the proceeds less sale costs fall short of the carrying value.
Losses applicable to the non-controlling interests in a subsidiary are allocated to the non-controlling interests, which may cause the non-controlling interests to have a deficit balance. Consideration in excess of net identifiable assets acquired in respect of non-controlling interests in existing subsidiary undertakings is taken directly to equity.
(b)Associates
Associates are those entities in which the Group has significant influence over the financial and operating policies, but not control. Significant influence is usually presumed to exist when the Group holds between 20% and 50% of the voting power of another entity.
Associates are accounted for using the equity method and are initially recognised at cost. The Group’s investment includes goodwill identified on acquisition, net of any accumulated impairment losses. The Consolidated Financial Statements include the Group’s share of the total comprehensive income and equity movements of equity accounted investees, from the date that significant influence commences until the date that significant influence ceases. When the Group’s share of losses exceeds its interest in an equity accounted investee, the carrying amount is reduced to nil and recognition of further losses is discontinued, except to the extent that the Group has incurred legal or constructive obligations or made payments on behalf of an investee.
Gains and losses on transactions between the Group and its associates are eliminated to the extent of the Group’s interest in the associates.
F-11
Foreign currency translation
(a)Functional and presentation currency
Items included in the Financial Statements of each of the Group’s entities are measured using the currency of the primary economic environment in which the entity operates (the functional currency). The Consolidated Financial Statements are presented in US dollars, which differs from the functional currency of Rentokil Initial plc which remains in sterling.
On 25 July 2024, the Group announced that with effect from 1 January 2025 it would be changing its presentation currency from sterling to US dollar. Within the Group’s current portfolio of businesses, sterling denominated earnings, while sizeable, are a relatively small proportion of overall earnings. To reduce the potential for foreign exchange volatility in our future reported earnings, the Board determined that, with effect from 1 January 2025, the Group will present its results in US dollar.
Accordingly, to satisfy the requirements of IAS 21 The Effects of Changes in Foreign Exchange Rates, the reported results for the years ended 31 December 2024 and 31 December 2023 have been translated from sterling to US dollar using the following procedures:
| (i) | assets and liabilities denominated in non-US dollar currencies were translated into US dollar at the relevant closing rates of exchange; |
| (ii) | the trading results of subsidiaries whose functional currency was other than US dollar were translated into US dollar at the average rates of exchange for the relevant period, with material items translated at the rate on the dates of transaction; |
| (iii) | share capital, share premium, capital reduction reserve, and merger relief reserve were translated at the historic rates prevailing on the date of each transaction; and |
| (iv) | the cumulative translation reserve balance was set to nil on 1 January 2004, the date of transition to IFRS, and has been represented on the basis that the Group has reported in US dollar since that date. |
A change in presentation currency represents a change in accounting policy under IAS 8 Accounting Policies, Changes in Accounting Estimates and Errors which is accounted for retrospectively. The £/$ rates used for this exercise are: average 2024 1.2773, 2023 1.2441; and closing 2024 1.2519, 2023 1.2737.
(b)Group companies
The results and financial position of all the Group entities that have a functional currency different from the presentation currency are translated into the presentation currency as follows:
On consolidation, exchange differences arising from the translation of the net investment in foreign entities, and of borrowings and other currency instruments designated as hedges of such investments or deemed to be quasi-equity, are taken to other comprehensive income. When a foreign operation is sold, such exchange differences are recognised in the income statement as part of the gain or loss on sale.
F-12
(c)Transactions and balances
Foreign currency transactions are translated into the functional currency using the exchange rates prevailing at the dates of the transactions. Foreign exchange gains and losses resulting from the settlement of such transactions, or from the translation of monetary assets and liabilities denominated in foreign currencies at reporting period end exchange rates, are recognised under the appropriate heading in the income statement; except when deferred in equity as qualifying net investment hedges or where certain intra-group loans are determined to be quasi-equity (normally not expected to be repaid).
(d)Financial reporting in hyperinflationary economies
The Group has operations in Argentina, Ghana, Lebanon, and Turkey, which remained hyperinflationary in 2025.
The IAS 29 rules are applied as follows:
| (i) | adjustment of the income statement at the end of the reporting period using the change in general price index; |
| (ii) | adjustment of historical cost non-monetary assets and liabilities for the change in purchasing power caused by inflation from the date of initial recognition to the balance sheet date; and |
| (iii) | adjustment of the income statement to reflect the impact of inflation and exchange rate movement on holding monetary assets and liabilities in the local currency. |
Consumer Price Indices have been used for the relevant hyperinflationary adjustments. The indices used for these adjustments are as follows:
Country |
|
Index at 1 January 2025 |
|
Index at 31 December 2025 |
Argentina |
|
7,693.70 |
|
10,121.37 |
Ghana |
|
248.30 |
|
261.70 |
Lebanon |
|
7,061.07 |
|
7,924.35 |
Turkey |
|
2,684.55 |
|
3,513.87 |
Financial instruments
Financial assets and financial liabilities are recognised when the Group becomes a party to the contractual provisions of the relevant instrument, and derecognised when it ceases to be a party to such provisions.
Financial assets
The Group classifies its financial assets depending on the purpose for which the financial assets were acquired. At initial recognition, the Group carries out a solely payments of principal and interest (SPPI) test and a business model test to establish the classification and measurement of its financial assets. Financial assets are classified in the following categories:
(a)Amortised cost
Financial assets under this classification are non-derivative financial assets held to collect the contractual cash flows until maturity and the cash flows are SPPI. Assets measured at amortised cost include trade and other receivables, cash and cash equivalents (excluding money market funds which are classified as fair value through profit and loss), and other investments.
(b)Fair value through other comprehensive income
These are non-derivative financial assets which can be for sale with cash flows that are SPPI. These assets are measured at fair value and changes to market values are recognised in other comprehensive income. The Group has no assets classified under this category.
F-13
(c)Fair value through profit or loss
Financial assets under this classification are assets that cannot be classified in any of the other categories. These assets are measured at fair value and changes to market values are recognised in profit and loss.
Financial liabilities
All financial liabilities are stated at amortised cost using the effective interest rate method except for derivatives, which are classified as held for trading (except where they qualify for hedge accounting) and are held at fair value.
Financial liabilities held at amortised cost include trade payables, deferred consideration, and borrowings.
Sources of estimation uncertainty and significant accounting judgements
The use of estimates, assumptions, and judgements in the application of the Group’s accounting policies is explained below, with major sources of estimation uncertainty and significant judgements separately identified.
Assumptions and estimation uncertainties
The Group makes estimates and assumptions concerning the future. Estimates and assumptions are continually evaluated and are based on historical experience and other factors, including expectations of future events that are believed to be reasonable under the circumstances. Actual results may differ from these estimates and revisions to estimates are recognised prospectively. Sensitivities to the estimates and assumptions are provided, where relevant, in the Notes to the Consolidated Financial Statements.
The estimates and assumptions that have a significant risk of causing a material adjustment to the carrying amounts of assets and liabilities within the next financial year are listed below (please refer to the relevant notes for further detail):
| (a) | Termite damage claim provisions |
With the acquisition of Terminix in 2022, the Group assumed a liability for termite damage claims, based on termite customers existing at the acquisition date, for which a provision has been estimated. The liability arises when a termite infestation occurs, resulting in damage to a property which is under a termite contract, that requires subsequent remediation by the Group. The assumptions used to estimate the historical termite damage claim provisions are based on an assessment of the volume and value of future claims (based on historical information), customer churn rate, discount rates and inflation Starting from the acquisition date, an additional provision is recognised for all new termite customers upon commencement of their contract, based on the estimated average claim cost per customer over the lifetime of the contract. The trend of volume and value of claims will be monitored and reviewed over time and as such the value of the provisions is also likely to change. Sensitivity analysis is provided in Note A6.
Significant accounting judgements
Judgements made in applying accounting policies that have the most significant effects on the amounts recognised in the Consolidated Financial Statements are discussed below:
| (a) | Useful economic life of brands |
The Terminix US brand, acquired in 2022, has been assessed as having an indefinite useful life. Prior to this acquisition, all brands were considered by management to have finite useful lives. Indefinite-lived assets do not get amortised and, therefore, if management had judged that the Terminix brand had a finite life then there would be a significant amortisation expense recognised annually in the income statement. At acquisition, the Terminix brand was valued at $1,435m, which based on a typical 15-year life would result in an annual amortisation charge of $96m.
F-14
Other accounting estimates
The Consolidated Financial Statements include other areas of accounting estimates that do not meet the definition of significant accounting estimates or accounting judgements under IAS 1. The recognition and measurement of certain material assets and liabilities are based on assumptions and/or are subject to longer-term uncertainties, as follows:
| (a) | Impairment of goodwill and other assets |
The annual review for potential impairment of goodwill and other indefinite-lived intangible assets is primarily based on a value-in-use model. This model uses discounted cash flows to assess whether the goodwill carrying value can be supported or whether impairment is required. The model uses the following assumptions about the future:
| ● | revenue growth rate; |
| ● | operating profit margin; |
| ● | discount rate; and |
| ● | long-term growth rate (inflation). |
Management anticipates that the likelihood of a reasonably possible change in assumptions resulting in a material misstatement is remote. Note B2 explains the impairment review process undertaken in the year.
| (b) | Self-insurance provisions |
The Group self-insurance provision increased significantly through the acquisition of Terminix in 2022. Self-insurance provisions are valued annually with the support of external actuaries. Although the carrying value of the provision is significant, it is not expected that there would be any change to assumptions that would cause a significant adjustment to the carrying value in the next financial year and any impact would be expected to crystallise over the long term. Self-insurance provisions are disclosed in Note A6.
| (c) | Provisions for uncertain tax positions |
The Group holds significant provisions for uncertain tax positions on the basis of amounts expected to be paid to the tax authorities. The Group’s current tax liabilities reflect management’s best estimate of the future amounts of corporation tax that will be settled. However, the actual outcome could be significantly different to the estimate made, as the ultimate tax liability cannot be known until a resolution has been reached with the relevant tax authority, or the issue becomes time-barred. Note A13 discusses in detail why the provisions are taken and explains the estimation uncertainty.
Standards, amendments, and interpretations to published standards that are mandatorily effective for the current year
Except as described below, the accounting policies applied in these Consolidated Financial Statements are the same as those applied in the Group’s Consolidated Financial Statements for the year ended 31 December 2024.
The Group has adopted the following new standards and amendments to standards, including any consequential amendments to other standards, with effect from 1 January 2025:
| ● | amendments to IAS 21 – Lack of exchangeability |
The application of this amendment had no material impact on the disclosures of the amounts recognised in the Group’s Consolidated Financial Statements.
F-15
New standards and interpretations not yet adopted
Certain new accounting standards and interpretations have been published that are not mandatory for 31 December 2025 reporting periods, and have not been adopted early by the Group:
| ● | IFRS 18 – Presentation and disclosure in financial statements |
| ● | IFRS 7 & IFRS 9 – Classification and Measurement of Financial Instruments and Power Purchase Agreements (PPAs) |
IFRS 18 is effective for annual periods beginning on or after 1 January 2027 and will replace IAS 1 – Presentation of financial statements. It will introduce new requirements that are intended to help to achieve comparability of the financial performance of similar entities, and provide more relevant information and transparency to users. Even though IFRS 18 will not impact the recognition or measurement of items in the financial statements, its impacts on presentation and disclosure are expected to be pervasive; in particular, those related to the statement of comprehensive income or loss, and providing management-defined performance measures within the financial statements.
IFRS 7 & IFRS 9 is effective for annual periods beginning on or after 1 January 2026. Restatement is required under IAS 8 otherwise the cumulative effect is recognised in the opening balance of retained earnings and other equity components at the date of application. The amendments clarify IFRS 9 rules for derecognition, SPPI assessment (including ESG-linked features), and the treatment of renewable PPAs, while IFRS 7 introduces stronger disclosure requirements for contingent and ESG-linked terms to improve transparency.
Management is currently assessing the detailed implications of applying the new standard on the Group’s consolidated financial statements.
| A. | Operating |
A1. Revenue recognition and operating segments
Revenue recognition
Revenue represents the transfer of promised goods or services to customers in an amount that reflects the consideration to which the Group expects to be entitled. All revenue is considered revenue from contracts with customers as defined by IFRS 15, including job work and sales of goods. Under IFRS 15, revenue is recognised when a customer obtains control of goods or services in line with identifiable performance obligations. In the majority of cases, the Group considers that the contracts it enters into are contracts for bundled services which are accounted for as a single performance obligation. Accordingly, the majority of revenue across the Group is recognised on an output basis evenly over the course of the contract because the customer simultaneously receives and consumes the benefits provided by the Group’s performance as it performs. Job work is short-term contract revenue whereby the period of service is typically less than one month in duration. The performance obligations linked to this revenue type are individual to each job due to their nature, with revenue being recognised at a point in time on completion. Where consumables are supplied separately from the service contract, revenue is recognised at the point the goods transfer.
The transaction price reported for all contracts is the price agreed in the contract and there are no material elements of variable consideration, financing component, or non-cash consideration. The Group applies the practical expedient in paragraph 121 of IFRS 15 and does not disclose information about remaining performance obligations because the Group has a right to consideration from customers in an amount that corresponds directly with the value to the customer of the performance obligations completed to date.
Disaggregation of revenue into region, category, and major type of revenue stream is shown below under segment reporting.
F-16
Performance obligations
Contract service revenue
These are mainly full-service contracts, inclusive of equipment, maintenance, and consumables as required. The inclusive service is treated as a single performance obligation.
| ● | Pest Control: the Group offers a range of services, with the most common being general pest maintenance contracts. Under this type of contract, the Group promises to provide a pest control service for the duration of the contract. In order to fulfil this promise, equipment is supplied (such as bait boxes) and a technician maintains and monitors the equipment at a set number of visits per year. The Group considers that this type of contract is a bundled service as the goods and services are not distinct in the context of the contract; equipment is not supplied without the service. Some countries offer an assurance warranty-type service where any additional call-outs are included in the contract price; in other countries, additional call-outs are chargeable. Where an assurance warranty is offered as part of the contract, revenue is recognised over the duration of the contract. Where no such warranty is offered, revenue is recognised at a point in time when the customer is visited. |
In addition, the Group offers certain termite contracts across a limited number of countries (including North America) where there is a single performance obligation. In these contracts, revenue is recognised as the performance obligation is satisfied, which is generally over a short time period of a few days. These contracts include assurance warranties that last for a period of 12 months from the date of service, but the warranty is not considered to be a performance obligation under IFRS 15. These contracts are annual contracts and are therefore recognised as contract service revenue. Some smaller acquired businesses have legacy termite contract terms that do offer service warranties, resulting in a spread of revenues over the contractual year.
| ● | Hygiene & Wellbeing: the Group offers a similar type of service to Pest Control, providing washroom equipment, consumables, and a technician to service the washroom. This type of contract will include a set number of visits. Dispensers are replenished by the technician. Management considers that the supply of goods and services are not distinct in the context of the contract. Dispensers and other equipment would not be supplied without providing the full service; the equipment is controlled by the Group and ownership does not transfer to the customer. Also included are contracts relating to interior landscaping, specifically the supply and maintenance of interior plants. Maintenance is only offered for plants that were supplied by the Group and therefore the services are not distinct in the context of the contract. The assets are positioned and situated by our technicians and the customer is not permitted to relocate them. At the end of the contract, any assets on the customer’s site are recovered. |
| ● | France Workwear: the main type of contract is for supply and laundering of garments for commercial organisations. Supply and laundry are not offered separately, therefore management considers the services not to be distinct in the context of the contract. The service is treated as a bundle and a single performance obligation. Any equipment remains under ownership and control of the Group. |
Job work
These services are short-term in nature and only an immaterial amount would straddle an accounting period end. There is usually only one performance obligation, with revenue recognised at the point of completion of the work.
| ● | Pest Control: an example of this type of revenue in the Pest Control category is bird-proofing, which is a one-off installation that, depending on the size of the site, may take between a few days and several weeks to complete. There is a single performance obligation (to install bird-proofing) and the customer is billed, and revenue recognised, at the end of the job. |
| ● | Hygiene & Wellbeing: this type of revenue is generated, for example, by our Specialist Hygiene team, which performs specialist cleaning services such as graffiti removal, deep cleaning of kitchens and washrooms, trauma cleaning, flood or fire damage cleaning, and specialist deep cleaning services. These are usually short-term jobs (less than one week) and usually there is a single performance obligation with revenue recognised on completion of the job. |
F-17
Sale of goods
Sale of products and consumables relates mainly to the pest distribution businesses, which sell pest control products to retailers and the pest control industry. In the Hygiene & Wellbeing business there are some sales of consumables to customers. In all cases, revenue is recognised at the point in time that ownership transfers to the customer.
The Group does not consider that any judgements were made that would have a significant impact on the amount or timing of revenue recognised. Those contracts in the business where revenue is recognised over time are repetitive and are based on short cycles that repeat many times per year. Therefore, if revenue had been considered to be recognised at a point in time rather than over time, the in-year impact would be immaterial.
The Group makes a charge against revenue for credit notes not yet issued at the balance sheet date.
Contract costs
Contract costs are mainly incremental costs of obtaining contracts (primarily sales commissions directly related to contracts obtained), and to a lesser extent costs to fulfil contracts which are not within the scope of other standards (mainly incremental costs of putting resources in place to fulfil contracts).
It is anticipated that these costs are recoverable over the life of the contract to which they relate. Accordingly, the Group capitalises them as contract costs and amortises them over the expected life of the contracts. Management takes a portfolio approach to recognising contract costs, and the expected length of contracts across the Group and associated amortisation periods are between three and seven years.
The contract costs recognised in the balance sheet at the period end amounted to $337m (2024: $298m; 2023: $285m). The amount of amortisation recognised in the period was $123m (2024: $117m; 2023: $150m).
Applying the practical expedient in paragraph 94 of IFRS 15, the Group recognises the incremental costs of obtaining contracts as an expense when incurred if the amortisation period of the assets that the Group otherwise would have recognised is one year or less.
Contract assets and accrued income
Contract assets relate to the Group’s right to consideration for performance obligations satisfied, but where further performance obligations need to be satisfied before the customer can be invoiced. Accrued income is recognised where all performance obligations have been satisfied but the customer has yet to be invoiced. A receivable is recognised when all rights to consideration become unconditional, which usually occurs when the Group issues an invoice to the customer. All opening balances have been invoiced during the year.
Contract liabilities
Contract liabilities relate to advance consideration received from customers where the performance obligations have yet to be satisfied. All opening balances have subsequently been satisfied in the year. In most business categories where revenue is recognised over time, customers are invoiced in advance or simultaneously with performance obligations being satisfied.
Segment reporting
Segmental information in accordance with IFRS 8 Operating Segments has been presented on the next page. The Group’s operating segments are regions and this reflects the internal management reporting structures and the way information is reviewed by the chief operating decision maker (the Chief Executive). The businesses within each operating segment operate in a number of different countries and sell services across two business segments, with the workwear segment disposed of in the year.
F-18
Following the acquisition of Terminix, the majority of the Group’s activity is in North America. With effect from 1 January 2025, the Group’s reporting structure has been changed to combine Europe including LATAM, UK & SSA, Pacific, and Asia & MENAT regions into a single operating and reporting segment, International. The Chief Executive remains as chief operating decision maker (CODM) and reviews the results on a monthly basis for the North America and International segments. All reporting to the Board is also done on this basis. Comparative segmental financial information for 2024 and 2023 has been represented.
Disaggregated revenue under IFRS 15 is the same as the segmental analysis below. Restructuring costs, one-off and adjusting items, amortisation and impairment of intangible assets (excluding computer software), and central and regional costs are presented at a Group level as they are not targeted or managed at reportable segment level. The basis of presentation is consistent with the information reviewed by internal management.The segment profit or loss measure that is regularly provided to the CODM is Adjusted Operating Profit.
Revenue and Profit
|
|
|
|
|
|
|
|
Operating |
|
Operating |
|
Operating |
|
|
Revenue |
|
Revenue |
|
Revenue |
|
profit |
|
profit |
|
profit |
|
|
2025 |
|
2024 |
|
2023 |
|
2025 |
|
2024 |
|
2023 |
|
|
$m |
|
$m |
|
$m |
|
$m |
|
$m |
|
$m |
North America |
|
|
|
|
|
|
|
|
|
|
|
|
Pest Control |
|
4,148 |
|
4,026 |
|
3,981 |
|
720 |
|
688 |
|
745 |
Hygiene & Wellbeing |
|
146 |
|
138 |
|
131 |
|
29 |
|
25 |
|
23 |
Sub-total North America |
|
4,294 |
|
4,164 |
|
4,112 |
|
749 |
|
713 |
|
768 |
|
|
|
|
|
|
|
|
|
|
|
|
|
International |
|
|
|
|
|
|
|
|
|
|
|
|
Pest Control |
|
1,555 |
|
1,455 |
|
1,355 |
|
323 |
|
299 |
|
286 |
Hygiene & Wellbeing |
|
1,059 |
|
998 |
|
918 |
|
195 |
|
180 |
|
169 |
Sub-total International |
|
2,614 |
|
2,453 |
|
2,273 |
|
518 |
|
479 |
|
455 |
|
|
|
|
|
|
|
|
|
|
|
|
|
Total |
|
6,908 |
|
6,617 |
|
6,385 |
|
1,267 |
|
1,192 |
|
1,223 |
Central and regional overheads |
|
— |
|
— |
|
— |
|
(191) |
|
(175) |
|
(150) |
Restructuring costs |
|
— |
|
— |
|
— |
|
(6) |
|
(9) |
|
(9) |
Revenue and Adjusted Operating Profit |
|
6,908 |
|
6,617 |
|
6,385 |
|
1,070 |
|
1,008 |
|
1,064 |
One-off and adjusting items |
|
|
|
|
|
|
|
(287) |
|
(110) |
|
(119) |
Amortisation and impairment of intangible assets1 |
|
|
|
|
|
|
|
(199) |
|
(254) |
|
(218) |
Operating profit |
|
|
|
|
|
|
|
584 |
|
644 |
|
727 |
Finance income |
|
|
|
|
|
|
|
46 |
|
59 |
|
60 |
Finance cost |
|
|
|
|
|
|
|
(250) |
|
(250) |
|
(232) |
Share of profit from associates net of tax |
|
|
|
|
|
|
|
10 |
|
9 |
|
11 |
Profit before income tax |
|
|
|
|
|
|
|
390 |
|
462 |
|
566 |
| 1. | Excluding computer software, which is included in our segment operating profit measure. |
F-19
Revenue and operating profit relate to the main groups of business segment and activity of Pest Control and Hygiene & Wellbeing following the disposal of France Workwear. Central and regional overheads represent corporate expenses that are not directly attributable to any reportable segment. Business segment revenue and operating profit are shown in the table below:
|
|
|
|
|
|
|
|
Operating |
|
Operating |
|
Operating |
|
|
Revenue |
|
Revenue |
|
Revenue |
|
profit |
|
profit |
|
profit |
|
|
2025 |
|
2024 |
|
2023 |
|
2025 |
|
2024 |
|
2023 |
|
|
$m |
|
$m |
|
$m |
|
$m |
|
$m |
|
$m |
Pest Control |
|
5,703 |
|
5,481 |
|
5,336 |
|
1,043 |
|
987 |
|
1,031 |
Hygiene & Wellbeing |
|
1,205 |
|
1,136 |
|
1,049 |
|
224 |
|
205 |
|
192 |
Total business segments |
|
6,908 |
|
6,617 |
|
6,385 |
|
1,267 |
|
1,192 |
|
1,223 |
Central and regional overheads |
|
— |
|
— |
|
— |
|
(191) |
|
(175) |
|
(150) |
Restructuring costs |
|
— |
|
— |
|
— |
|
(6) |
|
(9) |
|
(9) |
Revenue and Adjusted Operating Profit |
|
6,908 |
|
6,617 |
|
6,385 |
|
1,070 |
|
1,008 |
|
1,064 |
One-off and adjusting items |
|
|
|
|
|
|
|
(287) |
|
(110) |
|
(119) |
Amortisation and impairment of intangible assets1 |
|
|
|
|
|
|
|
(199) |
|
(254) |
|
(218) |
Operating profit |
|
|
|
|
|
|
|
584 |
|
644 |
|
727 |
| 1. | Excluding computer software, which is included in our segment operating profit measure. |
Analysis of revenue by type
|
|
Revenue |
|
Revenue |
|
Revenue |
|
|
2025 |
|
2024 |
|
2023 |
|
|
$m |
|
$m |
|
$m |
Contract service revenue |
|
4,803 |
|
4,643 |
|
4,489 |
Job work |
|
1,549 |
|
1,472 |
|
1,365 |
Sales of goods |
|
556 |
|
502 |
|
531 |
Total |
|
6,908 |
|
6,617 |
|
6,385 |
Revenue from external customers attributed to the UK amounted to $497m (2024: $466m; 2023: $401m), with overseas countries accounting for the balance of $6,411m (2024: $6,151m; 2023: $5,984m). In 2025, the only country accounting for more than 10% of revenue from external customers was the US, totalling $4,184m (2024: $4,056m; 2023: $4,006m).
The Group is not reliant on turnover from transactions with any single customer and does not receive 10% or more of its turnover from transactions with any single customer.
Segment assets and liabilities are not provided because they are not reported to, or reviewed by, our CODM.
F-20
Revenue and non-current assets for the country of domicile (UK), the US, France, Australia, India, and Spain (being the largest countries outside the UK), and for all other countries are:
|
|
|
|
Non-current |
|
|
|
Non-current |
|
|
|
Non-current |
|
|
Revenue |
|
assets1 |
|
Revenue |
|
assets1 |
|
Revenue |
|
assets1 |
|
|
2025 |
|
2025 |
|
2024 |
|
2024 |
|
2023 |
|
2023 |
|
|
$m |
|
$m |
|
$m |
|
$m |
|
$m |
|
$m |
UK |
|
497 |
|
374 |
|
466 |
|
335 |
|
401 |
|
307 |
USA |
|
4,184 |
|
8,499 |
|
4,056 |
|
8,554 |
|
4,006 |
|
8,578 |
France |
|
186 |
|
103 |
|
176 |
|
358 |
|
170 |
|
359 |
Australia |
|
252 |
|
230 |
|
247 |
|
216 |
|
225 |
|
211 |
India |
|
93 |
|
104 |
|
88 |
|
110 |
|
74 |
|
102 |
Spain |
|
110 |
|
95 |
|
98 |
|
88 |
|
90 |
|
98 |
Other countries |
|
1,586 |
|
922 |
|
1,486 |
|
812 |
|
1,419 |
|
869 |
Total |
|
6,908 |
|
10,327 |
|
6,617 |
|
10,473 |
|
6,385 |
|
10,524 |
| 1. | Non-current assets include: intangible assets; property, plant and equipment; right-of-use assets; contract cost assets; and non-current other receivables. |
Other segment items included in the consolidated income statement are as follows:
|
|
Depreciation, |
|
Net impairment |
|
Depreciation, |
|
Net impairment |
|
Depreciation, |
|
Net impairment |
|
|
amortisation and |
|
losses on financial |
|
amortisation and |
|
losses on financial |
|
amortisation and |
|
losses on financial |
|
|
impairment |
|
assets |
|
impairment |
|
assets |
|
impairment |
|
assets |
|
|
2025 |
|
2025 |
|
2024 |
|
2024 |
|
2023 |
|
2023 |
|
|
$m |
|
$m |
|
$m |
|
$m |
|
$m |
|
$m |
North America |
|
256 |
|
66 |
|
269 |
|
62 |
|
270 |
|
43 |
International |
|
238 |
|
8 |
|
263 |
|
9 |
|
218 |
|
6 |
Central and regional |
|
34 |
|
— |
|
33 |
|
— |
|
28 |
|
— |
Total |
|
528 |
|
74 |
|
565 |
|
71 |
|
516 |
|
49 |
| B. | |
A2. Earnings per share
Basic earnings per share is calculated by dividing the profit after tax attributable to equity holders of the Company by the weighted average number of shares in issue during the year, excluding those held in the Rentokil Initial Employee Share Trust (see note at the bottom of the Consolidated Statement of Changes in Equity) which are treated as cancelled, and including share options for which all conditions have been met.
For diluted earnings per share, the weighted average number of ordinary shares in issue is adjusted to include all potential dilutive ordinary shares. The Group’s potentially dilutive ordinary shares relate to the contingent issuable shares under the Group’s LTIPs to the extent that the performance conditions have been met at the end of the period. These share options are issued for nil consideration to employees if performance conditions are met.
For the calculation of diluted earnings per share, 477,325 share options were anti-dilutive and not included in the calculation of the dilutive effect as at 31 December 2025 (2024: 435,578; 2023: 18,422).
F-21
Details of the calculation of earnings per share are set out below:
|
|
|
|
2025 |
|
2024 |
|
2023 |
|
|
|
|
$m |
|
$m |
|
$m |
Profit attributable to equity holders of the Company from continuing operations |
|
|
|
290 |
|
346 |
|
437 |
Profit attributable to equity holders of the Company from discontinued operations |
|
B7 |
|
180 |
|
46 |
|
37 |
Total profit attributable to equity holders of the Company |
|
|
|
470 |
|
392 |
|
474 |
|
|
|
|
|
|
|
|
|
Weighted average number of ordinary shares in issue (million) |
|
|
|
2,524 |
|
2,521 |
|
2,516 |
Adjustment for potentially dilutive shares (million) |
|
|
|
11 |
|
7 |
|
11 |
Weighted average number of ordinary shares for diluted earnings per share (million) |
|
|
|
2,535 |
|
2,528 |
|
2,527 |
|
|
|
|
|
|
|
|
|
Earnings per share for continuing operations |
|
|
|
|
|
|
|
|
Basic earnings per share (cents) |
|
|
|
11.49 |
|
13.72 |
|
17.37 |
Diluted earnings per share (cents) |
|
|
|
11.44 |
|
13.69 |
|
17.29 |
|
|
|
|
|
|
|
|
|
Earnings per share for discontinued operations |
|
|
|
|
|
|
|
|
Basic earnings per share (cents) |
|
|
|
7.13 |
|
1.82 |
|
1.47 |
Diluted earnings per share (cents) |
|
|
|
7.10 |
|
1.82 |
|
1.46 |
|
|
|
|
|
|
|
|
|
Total earnings per share |
|
|
|
|
|
|
|
|
Basic earnings per share (cents) |
|
|
|
18.62 |
|
15.54 |
|
18.84 |
Diluted earnings per share (cents) |
|
|
|
18.54 |
|
15.51 |
|
18.75 |
A3. Trade and other receivables
The Group’s trade receivables are recognised at the transaction price less provision for impairment. They are generally due for settlement within 30 days and are all classified as current. The amount of the provision for impairment is recognised in the income statement and movements on provisions for impaired trade receivables are recognised within operating expenses in the income statement. Amounts are generally charged to the provision for impairment of trade receivables when there is no expectation of recovering additional cash.
Expected credit loss (ECL) calculations are performed and are used to calculate the provision for impairment of trade receivables. ECL calculations are a probability-weighted estimate of credit losses and are performed at country level. The Group applies the simplified method of applying lifetime ECLs to trade receivables using an allowance matrix to measure the ECLs of trade receivables from its customers, which comprise customer portfolios across several countries. Credit risk factors that are considered as part of ECL calculations may include, but are not limited to: payment history, customer size, customer type (national/residential/commercial/government), age of debt, industry strength, economy, environmental factors such as climate change, and product or service provided.
Loss allowances are also calculated on other financial assets, although the amounts are generally not significant and the asset is recognised net of the allowance.
F-22
There is limited concentration of credit risk with respect to trade receivables due to the Group’s customer base being large and diverse. The amount of credit risk with respect to customers is represented by the carrying amount on the balance sheet. The Group policy is that credit facilities for new customers are approved by designated managers at regional level. Credit limits are set with reference to trading history and reports from credit rating agencies where they are available. Where this is not feasible, the Group may request payment in advance of work being carried out, or settlement by credit card on completion of the work. There are no trade receivables that would otherwise be past due or impaired whose terms have been renegotiated.
|
|
2025 |
|
2024 |
|
|
$m |
|
$m |
Trade receivables |
|
877 |
|
883 |
Less: provision for impairment of trade receivables |
|
(78) |
|
(82) |
Trade receivables – net |
|
799 |
|
801 |
Other receivables1 |
|
172 |
|
160 |
Prepayments |
|
84 |
|
96 |
Accrued income |
|
145 |
|
147 |
Contract assets |
|
3 |
|
4 |
Total |
|
1,203 |
|
1,208 |
|
|
|
|
|
Analysed as follows: |
|
|
|
|
Non-current |
|
52 |
|
71 |
Current |
|
1,151 |
|
1,137 |
Total |
|
1,203 |
|
1,208 |
1. |
Other receivables are stated net of loss allowance of $nil (2024: $nil). |
All of the Group’s provision for impairment relates to trade receivables. Analysis of the Group’s provision for impairment of trade receivables is as follows:
|
|
2025 |
|
2024 |
|
2023 |
|
|
$m |
|
$m |
|
$m |
At 1 January |
|
82 |
|
87 |
|
87 |
Exchange differences |
|
3 |
|
(1) |
|
(4) |
Additional provision |
|
82 |
|
80 |
|
59 |
Receivables written off as uncollectable |
|
(79) |
|
(80) |
|
(48) |
Unused amounts reversed |
|
(7) |
|
(8) |
|
(10) |
Acquisition of companies and businesses |
|
— |
|
4 |
|
3 |
Disposal of companies and businesses |
|
(3) |
|
— |
|
— |
At 31 December |
|
78 |
|
82 |
|
87 |
The ageing of trade receivables and provision for impairment is as follows:
|
|
Trade |
|
Provision for |
|
Trade |
|
Provision for |
|
|
receivables |
|
impairment |
|
receivables |
|
impairment |
|
|
2025 |
|
2025 |
|
2024 |
|
2024 |
|
|
$m |
|
$m |
|
$m |
|
$m |
Not due |
|
387 |
|
— |
|
362 |
|
— |
Overdue by less than 1 month |
|
206 |
|
(1) |
|
213 |
|
(1) |
Overdue by between 1 and 3 months |
|
108 |
|
(6) |
|
152 |
|
(4) |
Overdue by between 3 and 6 months |
|
79 |
|
(9) |
|
67 |
|
(14) |
Overdue by between 6 and 12 months |
|
46 |
|
(17) |
|
49 |
|
(25) |
Overdue by more than 12 months |
|
51 |
|
(45) |
|
40 |
|
(38) |
At 31 December |
|
877 |
|
(78) |
|
883 |
|
(82) |
F-23
The carrying amounts of the Group’s trade receivables are denominated in the following currencies:
|
|
2025 |
|
2024 |
|
|
$m |
|
$m |
Pound sterling |
|
79 |
|
71 |
Euro |
|
167 |
|
200 |
US dollar |
|
380 |
|
378 |
Other currencies |
|
251 |
|
234 |
Carrying value |
|
877 |
|
883 |
Fair value is considered to be equal to carrying value for all trade and other receivables.
A4. Inventories
Inventories are stated at the lower of cost and net realisable value. Cost is determined using the weighted average cost method. The cost of finished goods and work in progress comprises design costs, raw materials, direct labour, other direct costs, and related production overheads (based on normal operating capacity). It excludes borrowing costs. Net realisable value is the estimated selling price less applicable variable selling expenses.
|
|
2025 |
|
2024 |
|
|
$m |
|
$m |
Raw materials |
|
18 |
|
19 |
Work in progress |
|
1 |
|
4 |
Finished goods |
|
289 |
|
264 |
|
|
308 |
|
287 |
An inventory impairment charge of $1m was recognised in 2025 (2024: $2m; 2023: $4m). Inventory recognised as an expense during the period was $417m (2024: $464m; 2023: $479m).
A5. Trade and other payables
|
|
2025 |
|
2024 |
|
|
$m |
|
$m |
Trade payables |
|
382 |
|
394 |
Social security and other taxes |
|
109 |
|
114 |
Other payables |
|
86 |
|
119 |
Accruals |
|
483 |
|
432 |
Contract liabilities1 |
|
292 |
|
312 |
Deferred consideration |
|
16 |
|
21 |
Contingent consideration2 |
|
70 |
|
94 |
Total |
|
1,438 |
|
1,486 |
|
|
|
|
|
Analysed as follows: |
|
|
|
|
Other payables |
|
25 |
|
38 |
Deferred consideration |
|
— |
|
1 |
Contingent consideration2 |
|
21 |
|
47 |
Total non-current portion |
|
46 |
|
86 |
Current portion |
|
1,392 |
|
1,400 |
Total |
|
1,438 |
|
1,486 |
1. |
Contract liabilities represents customer invoices where performance obligations have not yet been satisfied. All opening balances have subsequently been satisfied in the year. In most business categories, our customers are invoiced in advance or simultaneously with performance obligations being satisfied. |
2. |
Contingent consideration includes put option liability of $31m (2024: $33m). |
F-24
Other than the put options, there are no liabilities in the table above that bear interest or are discounted, and therefore the cash flows are equal to the carrying value of the liabilities. Cash is due to flow between one and five years for all non-current liabilities and not beyond. Fair value is equal to carrying value for all trade and other payables. There is no material difference between the fair value and carrying value for all trade and other payables.
Put options are held following the acquisition of PCI in 2017, where the seller may require the Group to purchase the remaining shares of the business in stages over a fixed term between 2023 and 2027. The put options are accounted for as an anticipated acquisition of the remaining shares and no non-controlling interest is recognised. The Group recognised a put option liability for the anticipated acquisition of these shares in contingent consideration, and any movements in the carrying value are recognised through Profit and Loss. The third put option is yet to be exercised and the Group’s total shareholding in PCI remains at 73%. Given the volume of acquisitions and the variety of inputs to the valuation of contingent consideration (depending on each transaction), there is not considered to be any change in input that would have a material impact on the contingent consideration liability.
The currency split of trade and other payables is as follows:
|
|
2025 |
|
2024 |
|
|
$m |
|
$m |
Pound sterling |
|
196 |
|
207 |
Euro |
|
228 |
|
284 |
US dollar |
|
667 |
|
666 |
Other currencies |
|
347 |
|
329 |
Carrying value |
|
1,438 |
|
1,486 |
The ageing of trade payables is as follows:
|
|
2025 |
|
2024 |
|
|
$m |
|
$m |
Less than one year |
|
382 |
|
393 |
Between one and five years |
|
— |
|
1 |
More than five years |
|
— |
|
— |
Total |
|
382 |
|
394 |
Maturity analysis for lease liabilities is included in Note B4, and other financial liabilities in Note C6.
A6. Provisions for liabilities and charges
The Group has provisions for termite damage claims, self-insurance, environmental, and other. Provisions are recognised when the Group has a present obligation as a result of past events, it is probable that an outflow of resources will be required to settle the obligation, and the amount is capable of being reliably estimated. If such an obligation is not capable of being reliably estimated it is classified as a contingent liability (Note D3).
F-25
Future cash flows relating to these obligations are discounted when the effect is material. The effect of discounting environmental provisions and other provisions is not considered to be material due to the low level of expected future cash flows. Termite damage claim provisions and self-insurance provisions are discounted, and the majority of these provisions are held in the US. The discount rate used is based on US government bond rates, and was 3.94% – 5.16% (2024: 4.48% – 5.25%).
|
|
Termite |
|
|
|
|
|
|
|
|
|
|
damage |
|
Self- |
|
|
|
|
|
|
|
|
claims |
|
insurance |
|
Environmental |
|
Other |
|
Total |
|
|
$m |
|
$m |
|
$m |
|
$m |
|
$m |
At 1 January 2024 |
|
330 |
|
209 |
|
21 |
|
14 |
|
574 |
Exchange differences |
|
— |
|
— |
|
(1) |
|
(1) |
|
(2) |
Additional provisions |
|
25 |
|
126 |
|
1 |
|
10 |
|
162 |
Used during the year |
|
(86) |
|
(105) |
|
(3) |
|
(12) |
|
(206) |
Unused amounts reversed |
|
(16) |
|
— |
|
(1) |
|
(2) |
|
(19) |
Acquisition of companies and businesses |
|
— |
|
— |
|
— |
|
2 |
|
2 |
Unwinding of discount on provisions |
|
13 |
|
1 |
|
— |
|
— |
|
14 |
At 31 December 2024 |
|
266 |
|
231 |
|
17 |
|
11 |
|
525 |
|
|
|
|
|
|
|
|
|
|
|
At 1 January 2025 |
|
266 |
|
231 |
|
17 |
|
11 |
|
525 |
Exchange differences |
|
— |
|
— |
|
— |
|
2 |
|
2 |
Additional provisions |
|
201 |
|
126 |
|
6 |
|
10 |
|
343 |
Used during the year |
|
(95) |
|
(89) |
|
(3) |
|
(12) |
|
(199) |
Unused amounts reversed |
|
— |
|
(2) |
|
— |
|
(3) |
|
(5) |
Acquisition of companies and businesses |
|
— |
|
— |
|
— |
|
2 |
|
2 |
Disposal of companies and businesses |
|
— |
|
— |
|
(9) |
|
— |
|
(9) |
Unwinding of discount on provisions |
|
12 |
|
1 |
|
— |
|
— |
|
13 |
At 31 December 2025 |
|
384 |
|
267 |
|
11 |
|
10 |
|
672 |
|
|
2025 |
|
2024 |
|
|
Total |
|
Total |
|
|
$m |
|
$m |
Analysed as follows: |
|
|
|
|
Non-current |
|
397 |
|
381 |
Current |
|
275 |
|
144 |
Total |
|
672 |
|
525 |
Termite damage claims
The Group holds provisions for termite damage claims covered by contractual warranties. Termite damage claim provisions are subject to significant assumptions and estimation uncertainty. The assumptions included in valuing termite provisions are based on an estimate of the volume and value of future claims (based on historical), customer churn rates, discount rates and inflation. Additional amendments may be necessary based on specific underlying facts of the particular legal claim as and when they develop. These provisions are expected to be substantially utilised within the next 15 years at a declining rate. The trend of volume and value of claims is monitored and reviewed over time (with the support of external advisors). It is reasonably possible, based on experience to date, that outcomes within the next financial year that are different from the assumption could require an adjustment to the carrying amount of the provision.
The Group’s provision relates to legacy customer claims (contracts from the period prior to the acquisition of Terminix), estimated at $358m (2024: $246m); and new customer claims, estimated at $26m (2024: $20m). The sensitivity of the legacy claims liability balance to changes in the inputs is illustrated as follows:
F-26
| ● | Discount rate - The exposure to termite damage claims is largely based within the US, therefore measurement is based on a seven-year US bond risk-free rate. During 2025, interest rates (and therefore discount rates) have decreased. Rates could move in either direction and management has modelled that an increase/decrease of 50 bps in yields would decrease/increase the provision by $7m (2024: $6m). Over the 12 months to 31 December 2025, seven-year risk-free rate yields have decreased 54 bps from 4.48% to 3.94% (2024: increased 60 bps). |
| ● | Claim value - Claim value forecasts have been based on the latest available historical settled Termite claims. Claims values are dependent on a range of inputs including, housing costs, materials costs (e.g. timber), whether a claim becomes litigated or not, and specific circumstances including contributory factors at the premises. Management has used an average of claim costs for the last 12 months for non-litigated claims and 24 months for litigated claims, adjusted where necessary to account for ageing of claims, to determine an estimate for costs per claim. Fluctuations in input prices (e.g. timber prices), as have been experienced over recent years, means that there is potential for volatility in claim values and therefore future material changes in provisions. Management has modelled that an increase/decrease of 5% in litigated claim values would increase/decrease the provision by c.$5m (2024: $4m) and an increase/decrease of 5% in non-litigated claim values would increase/decrease the provision by c.$9m (2024: $8m). Over the 12 months to 31 December 2025, costs per litigated claim rose by c.48% (2024: rose 8%) and non-litigated costs rose by 8% (2024: 45%). Actual value of claims settled in the year to December 2025 has been at a combined cost per claim 14% higher than that seen throughout 2024. This is not representative of management’s expectation of future costs as ageing of claims, which drives an increased cost per claim, has reduced in recent months along with a flattening of global inflation, and cost per claim is expected to continue to improve. |
| ● | Claim rate - Management has estimated claim rates based on historical incurred claims. Data has been captured, to establish incidence curves that can be used to estimate likely future cash outflows. Changes in rates of claim are largely outside the Group’s control and may depend on litigation trends within the US, and other external factors such as how often customers move property and how well they maintain those properties. This causes estimation uncertainty that could lead to material changes in provision measurement. Management has modelled that an increase/decrease of 5% in litigated claim rates would increase/decrease the provision by c.$5m (2024: $4m) and an increase/decrease of 5% in non-litigated claim rates would increase/decrease the provision by c.$9m (2024: $8m) accordingly. Over the 12 months to 31 December 2025, litigated claim rates rose by 75% (2024: fell 52%) and non-litigated claim rates fell by 6% (2024: rose 7%). |
| ● | Customer churn rate - If customers choose not to renew their contracts each year, then the assurance warranty falls away. As such there is sensitivity to the assumption on how many customers will churn out of the portfolio of customers each year. Data has been captured and analysed to establish incidence curves for customer churn, and forward-looking assumptions have been made based on these curves. Changes in churn rates are subject to macroeconomic factors and the performance of the Group. A 1% increase or decrease in customer churn rates, would decrease or increase the provision by $13m (2024: $9m), accordingly. On average over the last 10 years churn rates have moved by +/– c.2% per annum (2024: +/-2%). |
| ● | Inflation rate - The exposure to termite damage claims is largely based within the United States and therefore measurement is based on expected long term inflation trends. Settlement costs are driven by a number of factors as discussed in the claim cost section. Management has seen a trend that these costs have tracked above baseline US inflation rates and therefore a premium is taken to expected future inflation rates of 1% per annum. Rates could move in either direction and management has modelled that an increase/decrease of 50 bps would increase/decrease the provision by $6m (2024: $5m). |
Self-insurance
The Group’s self-insurance provisions provide coverage for exposures related to the self-insured retention (SIR), or excesses/deductibles, mainly on General (Public) Liability, Third-Party Automobile Liability and Workers’ Compensation policies. In order to help mitigate the cost of external insurance, the Group self-insures a level of cover on its major insurance policies. At 31 December 2025, the Group recognised provisions of $267m (2024: $231m) in relation to these risks, and the Group retains the primary obligation for these matters. External actuaries are used to help management estimate the provisions held. Due to the nature of the claims, the timing of utilisation of these provisions is uncertain.
F-27
Based on confirmed insurance coverage, and management’s assessment that reimbursement is virtually certain, a separate reimbursement asset of $43m (2024: $30m) is recognised within Other Receivables in Note A3. The reimbursement asset is not offset against the related provision in accordance with IAS 37.53.
Environmental
The Group owns, or formerly owned, a number of properties in Europe and the US where environmental contamination is being managed. These issues tend to be complex to determine and resolve and may be material, although it is often not possible to accurately predict future costs of management or remediation reliably. Provisions are held where liability is probable and costs can be reliably estimated. Contingent liabilities exist where the conditions for recognising a provision under IAS 37 have not been met. The Group monitors such properties to determine whether further provisions are necessary. The provisions that have been recognised are expected to be substantially utilised within the next five years.
Other
Other provisions principally comprise amounts required to cover obligations arising and costs relating to disposed businesses and restructuring costs. Other provisions also includes costs relating to onerous contracts and property dilapidations settlements. Existing provisions are expected to be substantially utilised within the next five years.
A7. Operating expenses
Operating expenses from continuing operations include the following items:
|
|
|
|
2025 |
|
2024 |
|
2023 |
|
|
Notes |
|
$m |
|
$m |
|
$m |
Employee costs |
|
A9 |
|
3,241 |
|
3,128 |
|
3,045 |
Direct materials and services |
|
|
|
1,166 |
|
1,089 |
|
1,087 |
Vehicle costs |
|
|
|
368 |
|
360 |
|
345 |
Property costs |
|
|
|
144 |
|
131 |
|
129 |
Depreciation and impairment of property, plant and equipment |
|
B3 |
|
135 |
|
129 |
|
123 |
Amortisation and impairment of intangible assets |
|
B2 |
|
236 |
|
287 |
|
250 |
Other operating expenses1 |
|
|
|
960 |
|
778 |
|
630 |
Total operating expenses |
|
|
|
6,250 |
|
5,902 |
|
5,609 |
| 1. | Other operating expenses includes professional fees, marketing costs, and amortisation of contract costs. |
A8. Auditors’ remuneration
|
|
2025 |
|
2024 |
|
2023 |
|
|
$m |
|
$m |
|
$m |
Fees payable to the Company’s auditors for the audit of the Parent Company and Group accounts |
|
5 |
|
6 |
|
5 |
Audit of accounts of subsidiaries of the Group |
|
8 |
|
8 |
|
9 |
Audit-related assurance services1 |
|
1 |
|
— |
|
— |
Total |
|
14 |
|
14 |
|
14 |
1. |
Fees for 2024 and 2023, related to the attestation report required by Section 404 of the Sarbanes-Oxley Act, have been reclassified from the audit-related assurance services, to “Fees payable to the Company’s auditors for the audit of the Parent Company and Group accounts” and “Audit of accounts of subsidiaries of the group”, to conform to the current year presentation. |
F-28
A9. Employee benefit expense
Profit-sharing and bonus plans
The Group recognises a liability and an expense for bonuses and profit-sharing, based on calculations of achievements of financial performance targets and the best estimate of the obligation to employees related to personal performance criteria being achieved. A liability is recognised where a contractual obligation exists or where past practice indicates that there is a constructive obligation to make such payments in the future.
Holiday pay
Paid holidays are regarded as an employee benefit and as such are charged to the income statement as the benefits are earned. An accrual is made at the balance sheet date to reflect the fair value of holidays earned but not yet taken.
Termination benefits
Termination benefits are payable when an employment is terminated before the normal retirement date, or whenever an employee accepts voluntary redundancy in exchange for these benefits. The Group recognises termination benefits when it is demonstrably committed to either: terminating the employment of current employees according to a detailed formal plan without possibility of withdrawal; or providing termination benefits as a result of an offer made to encourage voluntary redundancy. Benefits falling due more than 12 months after the balance sheet date are discounted to present value where the effect of discounting is material.
|
|
2025 |
|
2024 |
|
2023 |
|
|
$m |
|
$m |
|
$m |
Wages and salaries |
|
2,862 |
|
2,782 |
|
2,783 |
Social security costs |
|
284 |
|
261 |
|
186 |
Share-based payments |
|
28 |
|
25 |
|
34 |
Pension costs: |
|
|
|
|
|
|
– defined contribution plans |
|
61 |
|
57 |
|
39 |
– defined benefit plans |
|
6 |
|
3 |
|
3 |
|
|
3,241 |
|
3,128 |
|
3,045 |
Monthly average number of people employed by the Group during the year:
|
|
2025 |
|
2024 |
|
2023 |
|
|
Number |
|
Number |
|
Number |
Processing and service delivery |
|
47,620 |
|
46,381 |
|
45,323 |
Sales and marketing |
|
7,590 |
|
7,584 |
|
7,245 |
Administration and overheads |
|
8,874 |
|
9,095 |
|
8,447 |
|
|
64,084 |
|
63,060 |
|
61,015 |
F-29
Emoluments of the Directors of Rentokil Initial plc are detailed below.
|
|
Highest |
|
|
|
|
paid |
|
Other |
|
|
Director |
|
Directors |
|
|
$000 |
|
$000 |
2023 |
|
|
|
|
Aggregate emoluments excluding share options |
|
2,416.4 |
|
1,478.5 |
Aggregate gains made by Directors on exercise of share options |
|
4,639.7 |
|
— |
Aggregate amount receivable under long-term incentive schemes |
|
1,738.7 |
|
603.8 |
Aggregate value of Company contributions to defined contribution pension schemes |
|
— |
|
— |
|
|
8,794.8 |
|
2,082.3 |
2024 |
|
|
|
|
Aggregate emoluments excluding share options |
|
1,319.2 |
|
809.0 |
Aggregate gains made by Directors on exercise of share options |
|
6,162.3 |
|
— |
Aggregate amount receivable under long-term incentive schemes |
|
1,120.3 |
|
563.3 |
Aggregate value of Company contributions to defined contribution pension schemes |
|
— |
|
— |
|
|
8,601.8 |
|
1,372.3 |
2025 |
|
|
|
|
Aggregate emoluments excluding share options |
|
3,160.8 |
|
2,353.5 |
Aggregate gains made by Directors on exercise of share options |
|
4,514.3 |
|
— |
Aggregate amount receivable under long-term incentive schemes |
|
1,151.8 |
|
— |
Aggregate value of Company contributions to defined contribution pension schemes |
|
— |
|
— |
|
|
8,826.9 |
|
2,353.5 |
|
|
2025 |
|
2024 |
|
2023 |
|
|
Number |
|
Number |
|
Number |
Number of Directors accruing retirement benefits |
|
|
|
|
|
|
– defined contribution schemes |
|
— |
|
— |
|
— |
– defined benefit schemes |
|
— |
|
— |
|
— |
Number of Directors exercising share options1 |
|
1 |
|
1 |
|
1 |
Number of Directors receiving shares as part of long-term incentive schemes |
|
1 |
|
2 |
|
2 |
1. |
The highest-paid Director exercised 964,464 (2024: 986,515; 2023: 971,802) share options during the year. |
A10. Retirement benefit obligations
Apart from contributions to legally required social security state schemes, the Group operates a number of pension schemes around the world covering many of its employees.
Defined contribution pension plans
A defined contribution plan is a pension plan under which the Group pays fixed contributions into a separate entity.
The Group pays contributions to publicly or privately administered pension plans on a mandatory, contractual, or voluntary basis. The Group has no further payment obligations once the contributions have been paid. The contributions are recognised as an employee benefit expense when they are due. Prepaid contributions are recognised as an asset to the extent that a cash refund or a reduction in the future payments is available.
Defined benefit pension plans
A defined benefit pension plan is a plan that defines the amount of future pension benefit that an employee will receive on retirement, usually dependent on one or more factors such as years of service, compensation, and age.
F-30
The asset or liability recognised in the balance sheet in respect of defined benefit pension plans is the fair value of plan assets, less the present value of the defined benefit obligation at the balance sheet date. The Group determines the net interest on the net defined benefit asset for the period by applying the discount rate used to measure the defined benefit obligation at the beginning of the annual period to the net defined benefit asset. The defined benefit obligation is calculated annually by independent actuaries using the projected unit credit method. The present value of the defined benefit obligation is determined by discounting the estimated future cash outflows using interest rates of high-quality corporate bonds that have a credit rating of at least AA, are denominated in the currency in which the benefits will be paid, and have terms to maturity approximating to the terms of the related pension liability. The Group will recognise a pension surplus as an asset where there is an unconditional right to a refund or where the Group has a right to reduce future pension contributions, taking into account the adverse effect of any minimum funding requirements.
Current and past service costs, to the extent they have vested, and curtailments are recognised as charges or credits against operating profit in the income statement. Interest income on the net defined benefit asset is recognised in finance income. Remeasurement gains and losses arising from experience adjustments, return on plan assets, and changes in actuarial assumptions are charged or credited to the Consolidated Statement of Comprehensive Income.
The largest retirement benefit obligation in the Group is the Rentokil Initial Irish Pension Scheme (which is in a surplus position).
A number of smaller defined benefit and defined contribution schemes operate elsewhere, which are also funded through payments to trustee-administered funds or insurance companies.
Defined benefit schemes are reappraised annually by independent actuaries based upon actuarial assumptions. Judgement is required in determining these actuarial assumptions, but this is not considered by management to be a significant accounting judgement as defined under IAS 1.
The assumptions used for the Rentokil Initial Irish Pension Scheme are shown below:
|
|
31 December |
|
31 December |
|
|
|
2025 |
|
2024 |
|
Weighted average % |
|
|
|
|
|
Discount rate |
|
4.3 |
% |
3.5 |
% |
Future salary increases |
|
n/a |
|
n/a |
|
Future pension increases |
|
2.0 |
% |
2.1 |
% |
Inflation |
|
2.0 |
% |
2.1 |
% |
Risks
The scheme exposes the Company to a number of risks, the most significant of which are:
Asset volatility – Scheme liabilities are calculated using a discount rate set with reference to corporate bond yields; if assets underperform this yield, this will create a reduction in the current surplus position. The scheme holds a small proportion of growth assets (equities) which, although expected to outperform corporate bonds in the long term, create volatility and risk in the short term. The allocation to growth assets is monitored to ensure it remains appropriate given the long-term scheme objectives.
Changes in bond yields – A decrease in corporate bond yields will increase the value placed on the scheme’s liabilities for accounting purposes, although this will be partially offset by an increase in the value of the scheme’s bond holdings.
Inflation risk – An increase in inflation expectations will increase the value placed on the scheme’s liabilities for accounting purposes, although this may be partially offset to the extent that the scheme’s bond holdings include investments linked to inflation.
Life expectancy – The majority of the scheme’s obligations are to provide benefits for the life of the member, so increases in life expectancy will result in an increase in the liabilities.
For the Rentokil Initial Irish Pension Scheme, the expected duration is 15-16 years.
F-31
Pension benefits
The movement in the net defined benefit obligation for all Group pension schemes over the accounting period is as follows:
|
|
|
|
Fair |
|
|
|
|
|
Fair |
|
|
|
|
Present |
|
value of |
|
|
|
Present |
|
value of |
|
|
|
|
value of |
|
plan |
|
|
|
value of |
|
plan |
|
|
|
|
obligation |
|
assets |
|
Total |
|
obligation |
|
assets |
|
Total |
|
|
2025 |
|
2025 |
|
2025 |
|
2024 |
|
2024 |
|
2024 |
|
|
$m |
|
$m |
|
$m |
|
$m |
|
$m |
|
$m |
At 1 January |
|
(71) |
|
43 |
|
(28) |
|
(77) |
|
45 |
|
(32) |
Current service costs1 |
|
(1) |
|
— |
|
(1) |
|
— |
|
— |
|
— |
Interest on defined benefit obligation/asset1 |
|
(2) |
|
1 |
|
(1) |
|
(2) |
|
2 |
|
— |
Exchange difference |
|
(6) |
|
4 |
|
(2) |
|
2 |
|
(3) |
|
(1) |
Total pension income/(expense) |
|
(9) |
|
5 |
|
(4) |
|
— |
|
(1) |
|
(1) |
Remeasurements: |
|
|
|
|
|
|
|
|
|
|
|
|
– Remeasurement gain/(loss) on scheme assets |
|
— |
|
(1) |
|
(1) |
|
— |
|
— |
|
— |
– Remeasurement gain/(loss) on obligation |
|
2 |
|
— |
|
2 |
|
— |
|
— |
|
— |
Transfers |
|
|
|
|
|
|
|
|
|
|
|
|
– Transferred on disposal of business |
|
8 |
|
— |
|
8 |
|
— |
|
— |
|
— |
Contributions: |
|
|
|
|
|
|
|
|
|
|
|
|
– Employers |
|
(1) |
|
2 |
|
1 |
|
(1) |
|
1 |
|
— |
– Benefit payments |
|
3 |
|
(2) |
|
1 |
|
7 |
|
(2) |
|
5 |
At 31 December |
|
(68) |
|
47 |
|
(21) |
|
(71) |
|
43 |
|
(28) |
|
|
|
|
|
|
|
|
|
|
|
|
|
Retirement benefit obligation schemes2 |
|
(49) |
|
22 |
|
(27) |
|
(53) |
|
21 |
|
(32) |
Retirement benefit asset schemes3 |
|
(19) |
|
25 |
|
6 |
|
(18) |
|
22 |
|
4 |
1. |
Service costs and administration expenses are charged to operating expenses, and interest cost and return on plan assets to finance cost and finance income. |
2. |
Benefit plans in an obligation position include plans situated in Austria, France, Germany, Hong Kong, India, Italy, Martinique, Norway, the Philippines, Saudi Arabia, South Africa, South Korea, Sri Lanka, Thailand, Trinidad and Tobago, and the UK. |
3. |
Benefit plans in an asset position include plans situated in Australia, Barbados, and Ireland. |
Of the $68m (2024: $71m) of obligations in the table above, $16m (2024: $22m) is unfunded.
Total contributions payable to defined benefit pension schemes in 2026 are expected to be less than $1m.
The fair value of plan assets at the balance sheet date is analysed as follows:
|
|
2025 |
|
2024 |
|
|
$m |
|
$m |
Equity instruments |
|
4 |
|
4 |
Debt instruments – unquoted |
|
20 |
|
18 |
Property |
|
1 |
|
1 |
Other |
|
22 |
|
20 |
Total plan assets |
|
47 |
|
43 |
Where available, the fair values of assets are quoted prices (e.g. listed equity, sovereign debt, and corporate bonds). In other cases, the market value as provided by the fund managers has been used in accordance with IFRS 13 Fair Value Measurement:
| ● | unquoted debt instruments (level 2); |
F-32
| ● | interest and inflation rate hedging instruments (level 2); and |
| ● | pooled investment funds (level 3). |
Other significant assets are valued based on observable market inputs. Other assets primarily consist of cash.
The cumulative actuarial gain recognised in the Consolidated Statement of Comprehensive Income was $44m (2024: $43m). A remeasurement gain of $1m was recognised during the year (2024: $nil).
A11. Share-based payments
Share-based compensation
The Group operates two equity-settled share-based long-term incentive plans (LTIPs): the Performance Share Plan and the Restricted Share Plan. The economic cost of awarding shares and share options to employees is recognised as an expense in the income statement, equivalent to the fair value of the benefit awarded. The fair value of the Performance Share Plan is determined by reference to option pricing models, principally stochastic and adjusted Black-Scholes models. The fair value of the Restricted Share Plan is determined by reference to an adjusted Black-Scholes model. The charge for both plans is recognised in the income statement over the vesting period of the award. At each balance sheet date, the Group revises its estimate of the number of shares that vest or options that are expected to become exercisable. Any revision to the original estimates (other than those which are a result of movements in total shareholder return (TSR)) is reflected in the income statement with a corresponding adjustment to equity immediately to the extent it relates to past service, and the remainder over the rest of the vesting period.
Performance Share Plan and Restricted Share Plan
The Company has operated a share-based incentive for senior managers worldwide since 2006, initially through a Performance Share Plan, and then in 2023 a Restricted Share Plan was introduced. The main features of the schemes are as follows:
| ● | For Performance Share Plan awards made in 2023, 2024, and 2025, 50% of the award is based on TSR and 50% is based on performance against certain strategic and financial measures over the vesting period. |
| ● | For Restricted Share Plan awards made in 2023, 2024 and 2025, there are no performance conditions attached. |
| ● | The value of dividends paid during the vesting period is paid on the number of shares that ultimately vest in the form of additional shares. For awards that are nil-cost options made prior to May 2021, this is the value of dividends between grant and exercise. |
F-33
The total charge for the year relating to equity-settled share-based payment plans was $28m (2024: $25m; 2023: $32m). This includes charges for the Performance Share Plan and Restricted Share Plan of $28m (2024: $25m; 2023: $20m). In 2023, there were charges relating to the transfer of existing long-term incentive plans in Terminix and a non-recurring retention award totalling $12m. A summary of the number of shares in active Performance Share Plans is shown below:
|
|
|
|
|
|
|
|
|
|
|
|
|
|
|
|
|
|
|
|
|
|
|
|
|
|
|
Share options outstanding |
|
Share options exercisable |
||||||||||||||||
|
|
|
|
|
|
|
|
|
|
|
|
Shares |
|
|
|
|
|
|
|
|
|
|
|
|
|
|
Scheme |
|
Shares |
|
Shares |
|
Shares |
|
outstanding |
|
Shares |
|
Shares |
|
Shares |
|
Shares |
|
Shares |
Year |
|
|
|
interest at |
|
awarded |
|
lapsed |
|
vested |
|
at |
|
exercisable at |
|
vested |
|
exercised |
|
lapsed |
|
exercisable at |
of |
|
Vesting |
|
1 January |
|
during |
|
during |
|
during |
|
31 December |
|
1 January |
|
during |
|
during |
|
during |
|
31 December |
Grant |
|
Year |
|
2025 |
|
2025 |
|
2025 |
|
2025 |
|
2025 |
|
2025 |
|
2025 |
|
2025 |
|
2025 |
|
2025 |
2015 |
|
2018 |
|
— |
|
— |
|
— |
|
— |
|
— |
|
1,183,287 |
|
— |
|
(1,183,287) |
|
— |
|
— |
2016 |
|
2019 |
|
— |
|
35,895 |
|
— |
|
(35,895) |
|
— |
|
1,423,870 |
|
35,895 |
|
(177,522) |
|
— |
|
1,282,243 |
2017 |
|
2020 |
|
— |
|
29,651 |
|
(70) |
|
(29,581) |
|
— |
|
1,172,343 |
|
29,581 |
|
(42,610) |
|
— |
|
1,159,314 |
2018 |
|
2021 |
|
— |
|
37,102 |
|
(1,032) |
|
(36,070) |
|
— |
|
1,515,273 |
|
36,070 |
|
(74,885) |
|
— |
|
1,476,458 |
2019 |
|
2022 |
|
— |
|
37,188 |
|
(1,493) |
|
(35,695) |
|
— |
|
1,518,848 |
|
35,695 |
|
(97,191) |
|
— |
|
1,457,352 |
2020 |
|
2023 |
|
— |
|
26,635 |
|
(1,879) |
|
(24,756) |
|
— |
|
1,071,405 |
|
24,756 |
|
(62,325) |
|
— |
|
1,033,836 |
2021 |
|
2024 |
|
— |
|
21,432 |
|
(11,583) |
|
(9,849) |
|
— |
|
891,443 |
|
9,849 |
|
(81,222) |
|
— |
|
820,070 |
2022 |
|
2025 |
|
3,918,992 |
|
83,051 |
|
(2,502,398) |
|
(1,499,645) |
|
— |
|
47,415 |
|
1,499,645 |
|
(540,593) |
|
— |
|
1,006,467 |
2023 |
|
2026 |
|
4,031,442 |
|
828 |
|
(317,038) |
|
(6,375) |
|
3,708,857 |
|
— |
|
6,375 |
|
(6,375) |
|
— |
|
— |
2024 |
|
2027 |
|
6,598,782 |
|
6,583 |
|
(1,216,776) |
|
(67,951) |
|
5,320,638 |
|
— |
|
67,951 |
|
(67,951) |
|
— |
|
— |
2025 |
|
2028 |
|
— |
|
8,090,985 |
|
(611,953) |
|
— |
|
7,479,032 |
|
— |
|
— |
|
— |
|
— |
|
— |
|
|
|
|
|
|
|
|
|
|
|
|
|
|
|
|
|
|
|
|
|
|
|
|
|
|
|
Share options outstanding |
|
Share options exercisable |
||||||||||||||||
|
|
|
|
|
|
|
|
|
|
|
|
Shares |
|
|
|
|
|
|
|
|
|
|
|
|
|
|
Scheme |
|
Shares |
|
Shares |
|
Shares |
|
outstanding |
|
Shares |
|
Shares |
|
Shares |
|
Shares |
|
Shares |
Year |
|
|
|
interest at |
|
awarded |
|
lapsed |
|
vested |
|
at |
|
exercisable at |
|
vested |
|
exercised |
|
lapsed |
|
exercisable at |
of |
|
Vesting |
|
1 January |
|
during |
|
during |
|
during |
|
31 December |
|
1 January |
|
during |
|
during |
|
during |
|
31 December |
Grant |
|
Year |
|
2024 |
|
2024 |
|
2024 |
|
2024 |
|
2024 |
|
2024 |
|
2024 |
|
2024 |
|
2024 |
|
2024 |
2013 |
|
2016 |
|
— |
|
— |
|
— |
|
— |
|
— |
|
69 |
|
— |
|
(69) |
|
— |
|
— |
2014 |
|
2017 |
|
— |
|
— |
|
— |
|
— |
|
— |
|
1,151,851 |
|
— |
|
(1,151,851) |
|
— |
|
— |
2015 |
|
2018 |
|
— |
|
26,277 |
|
— |
|
(26,277) |
|
— |
|
1,251,052 |
|
26,277 |
|
(94,042) |
|
— |
|
1,183,287 |
2016 |
|
2019 |
|
— |
|
31,575 |
|
— |
|
(31,575) |
|
— |
|
1,427,960 |
|
31,575 |
|
(35,665) |
|
— |
|
1,423,870 |
2017 |
|
2020 |
|
— |
|
26,381 |
|
— |
|
(26,381) |
|
— |
|
1,209,932 |
|
26,381 |
|
(62,824) |
|
(1,146) |
|
1,172,343 |
2018 |
|
2021 |
|
— |
|
33,926 |
|
— |
|
(33,926) |
|
— |
|
1,564,454 |
|
33,926 |
|
(80,787) |
|
(2,320) |
|
1,515,273 |
2019 |
|
2022 |
|
— |
|
34,750 |
|
— |
|
(34,750) |
|
— |
|
1,770,998 |
|
34,750 |
|
(286,233) |
|
(667) |
|
1,518,848 |
2020 |
|
2023 |
|
— |
|
24,304 |
|
— |
|
(24,304) |
|
— |
|
1,241,998 |
|
24,304 |
|
(193,231) |
|
(1,666) |
|
1,071,405 |
2021 |
|
2024 |
|
3,632,199 |
|
81,393 |
|
(1,878,836) |
|
(1,834,756) |
|
— |
|
— |
|
1,834,756 |
|
(813,178) |
|
(130,135) |
|
891,443 |
2022 |
|
2025 |
|
4,665,701 |
|
6,005 |
|
(705,299) |
|
(47,415) |
|
3,918,992 |
|
5,951 |
|
47,415 |
|
(5,951) |
|
— |
|
47,415 |
2023 |
|
2026 |
|
4,638,991 |
|
3,066 |
|
(610,615) |
|
— |
|
4,031,442 |
|
— |
|
— |
|
— |
|
— |
|
— |
2024 |
|
2027 |
|
— |
|
7,110,973 |
|
(512,191) |
|
— |
|
6,598,782 |
|
— |
|
— |
|
— |
|
— |
|
— |
A summary of the number of shares in active Restricted Share plans is shown below:
|
|
|
|
|
|
|
|
|
|
|
|
|
|
|
|
|
|
|
|
|
|
|
|
|
|
|
Share options outstanding |
|
Share options exercisable |
||||||||||||||||
|
|
|
|
|
|
|
|
|
|
|
|
Shares |
|
|
|
|
|
|
|
|
|
|
|
|
|
|
Scheme |
|
Shares |
|
Shares |
|
Shares |
|
outstanding |
|
Shares |
|
Shares |
|
Shares |
|
Shares |
|
Shares |
Year |
|
|
|
interest at |
|
awarded |
|
lapsed |
|
vested |
|
at |
|
exercisable at |
|
vested |
|
exercised |
|
lapsed |
|
exercisable at |
of |
|
Vesting |
|
1 January |
|
during |
|
during |
|
during |
|
31 December |
|
1 January |
|
during |
|
during |
|
during |
|
31 December |
Grant |
|
Year |
|
2025 |
|
2025 |
|
2025 |
|
2025 |
|
2025 |
|
2025 |
|
2025 |
|
2025 |
|
2025 |
|
2025 |
2023 |
|
2025 |
|
320,025 |
|
16,894 |
|
(295,844) |
|
(41,075) |
|
— |
|
— |
|
41,075 |
|
(41,075) |
|
— |
|
— |
2023 |
|
2026 |
|
794,075 |
|
832 |
|
(238,242) |
|
(146,110) |
|
410,555 |
|
— |
|
146,110 |
|
(146,110) |
|
— |
|
— |
2024 |
|
2025 |
|
149,640 |
|
770 |
|
— |
|
(105,100) |
|
45,310 |
|
— |
|
105,100 |
|
(105,100) |
|
— |
|
— |
2024 |
|
2026 |
|
234,965 |
|
— |
|
(81,850) |
|
(58,175) |
|
94,940 |
|
— |
|
58,175 |
|
(58,175) |
|
— |
|
— |
2024 |
|
2027 |
|
786,290 |
|
— |
|
(157,455) |
|
— |
|
628,835 |
|
— |
|
— |
|
— |
|
— |
|
— |
2024 |
|
2028 |
|
90,630 |
|
— |
|
— |
|
— |
|
90,630 |
|
— |
|
— |
|
— |
|
— |
|
— |
2024 |
|
2029 |
|
90,630 |
|
— |
|
— |
|
— |
|
90,630 |
|
— |
|
— |
|
— |
|
— |
|
— |
2024 |
|
2030 |
|
90,630 |
|
— |
|
— |
|
— |
|
90,630 |
|
— |
|
— |
|
— |
|
— |
|
— |
2025 |
|
2025 |
|
— |
|
31,278 |
|
— |
|
(31,278) |
|
— |
|
— |
|
31,278 |
|
(31,278) |
|
— |
|
— |
2025 |
|
2026 |
|
— |
|
707,123 |
|
(14,409) |
|
— |
|
692,714 |
|
— |
|
— |
|
— |
|
— |
|
— |
2025 |
|
2027 |
|
— |
|
467,658 |
|
— |
|
— |
|
467,658 |
|
— |
|
— |
|
— |
|
— |
|
— |
2025 |
|
2028 |
|
— |
|
1,754,135 |
|
(283,050) |
|
— |
|
1,471,085 |
|
— |
|
— |
|
— |
|
— |
|
— |
F-34
|
|
|
|
|
|
|
|
|
|
|
|
|
|
|
|
|
|
|
|
|
|
|
|
|
|
|
Share options outstanding |
|
Share options exercisable |
||||||||||||||||
|
|
|
|
Scheme |
|
Shares |
|
Shares |
|
Shares |
|
Shares |
|
Shares |
|
Shares |
|
Shares |
|
Shares |
|
Shares |
Year |
|
|
|
interest at |
|
awarded |
|
lapsed |
|
vested |
|
outstanding at |
|
exercisable at |
|
vested |
|
exercised |
|
lapsed |
|
exercisable at |
of |
|
Vesting |
|
1 January |
|
during |
|
during |
|
during |
|
31 December |
|
1 January |
|
during |
|
during |
|
during |
|
31 December |
Grant |
|
Year |
|
2024 |
|
2024 |
|
2024 |
|
2024 |
|
2024 |
|
2024 |
|
2024 |
|
2024 |
|
2024 |
|
2024 |
2023 |
|
2024 |
|
195,310 |
|
— |
|
— |
|
(195,310) |
|
— |
|
— |
|
195,310 |
|
(195,310) |
|
— |
|
— |
2023 |
|
2025 |
|
88,465 |
|
260,000 |
|
(28,440) |
|
— |
|
320,025 |
|
— |
|
— |
|
— |
|
— |
|
— |
2023 |
|
2026 |
|
727,645 |
|
170,000 |
|
(103,570) |
|
— |
|
794,075 |
|
— |
|
— |
|
— |
|
— |
|
— |
2024 |
|
2025 |
|
— |
|
149,640 |
|
— |
|
— |
|
149,640 |
|
— |
|
— |
|
— |
|
— |
|
— |
2024 |
|
2026 |
|
— |
|
282,170 |
|
(47,205) |
|
— |
|
234,965 |
|
— |
|
— |
|
— |
|
— |
|
— |
2024 |
|
2027 |
|
— |
|
914,085 |
|
(127,795) |
|
— |
|
786,290 |
|
— |
|
— |
|
— |
|
— |
|
— |
2024 |
|
2028 |
|
— |
|
90,630 |
|
— |
|
— |
|
90,630 |
|
— |
|
— |
|
— |
|
— |
|
— |
2024 |
|
2029 |
|
— |
|
90,630 |
|
— |
|
— |
|
90,630 |
|
— |
|
— |
|
— |
|
— |
|
— |
2024 |
|
2030 |
|
— |
|
90,630 |
|
— |
|
— |
|
90,630 |
|
— |
|
— |
|
— |
|
— |
|
— |
The fair value of the 2024 awards made under the Performance Share Plan is charged to the income statement over the vesting period, based on values derived from a Monte Carlo model prepared by external remuneration consultants. This is a closed-form solution which takes account of the correlation between share price performance and the likelihood of a TSR performance condition being met. For the shares awarded in March 2025, the significant inputs into the model were a share price of 338.8p (2024: 466.1p), an expected share price volatility of 32.6% (2024: 29.5%), a median share price correlation between the companies in the comparator group of 71.6% (2024: 73.1%), and an expected life commensurate with the three-year performance/vesting period. The share price volatility assumption is based on analysis of historical daily share prices. As the awards are nil-cost (i.e. there is no exercise price), the assumed risk-free rate of return has minimal impact on the fair value of the awards. Similarly, as dividend equivalents are paid on the vesting portion of awards, the fair value of these awards is not reduced to reflect dividends paid during the vesting period. The fair value of the 2025 awards made under the Restricted Share Plan is charged to the income statement over the vesting period based on the fair value of the award on grant date.
The fair value of awards granted during 2025 was $38m (2024: $46m) and the weighted average fair value per award granted during the year was 262.3p (2023: 506.7p). The weighted average share price for options exercised in the year was 383.2p (2024: 471.4p) and the weighted average contract term remaining on shares unexercised at the year end was 533 days (2024: 535 days).
A12. Income tax expense
The income tax charge for the period comprises both current and deferred tax. Current tax charge represents the amount payable on this year’s taxable profits and any adjustment relating to prior years. Taxable profits differ from accounting profits as some items of income or expenditure are not taxable or deductible, or may be taxable or deductible in a different accounting period. The current income tax charge is calculated on the basis of the tax laws enacted or substantively enacted at the balance sheet date in the countries where the Group’s subsidiaries and associates operate and generate taxable income.
Deferred tax is an accounting adjustment to provide for tax that is expected to arise in the future due to differences between accounting and tax bases. Deferred tax is determined using tax rates that are expected to apply when the timing difference reverses based on tax rates which are enacted or substantively enacted at the balance sheet date. Tax is recognised in the income statement, except to the extent that it relates to items recognised in other comprehensive income or equity. In this case, the tax is also recognised in other comprehensive income or equity as appropriate.
Analysis of expense in the year:
|
|
2025 |
|
2024 |
|
2023 |
|
|
$m |
|
$m |
|
$m |
Current tax charge |
|
119 |
|
110 |
|
114 |
Adjustment in respect of previous periods |
|
(5) |
|
6 |
|
(11) |
Total current tax |
|
114 |
|
116 |
|
103 |
Deferred tax (credit)/charge |
|
(14) |
|
9 |
|
31 |
Deferred tax adjustment in respect of previous periods |
|
— |
|
(9) |
|
(5) |
Total deferred tax |
|
(14) |
|
— |
|
26 |
Total income tax charge |
|
100 |
|
116 |
|
129 |
F-35
The tax on the Group’s profit before tax differs from the theoretical amount that would arise using the weighted average tax rate applicable to profits of the consolidated companies as follows:
|
|
2025 |
|
2024 |
|
2023 |
|
|
$m |
|
$m |
|
$m |
Profit before tax |
|
390 |
|
462 |
|
566 |
Tax calculated at domestic tax rates applicable to profits in the respective countries |
|
99 |
|
119 |
|
144 |
Adjustment in respect of previous periods |
|
(5) |
|
(3) |
|
(16) |
Amounts not (taxable)/deductible for tax purposes – one-off and adjusting items |
|
— |
|
(1) |
|
1 |
Expenses not deductible for tax purposes – other |
|
10 |
|
8 |
|
7 |
Income not subject to tax |
|
(3) |
|
(3) |
|
(2) |
Impairment of goodwill |
|
— |
|
8 |
|
— |
Deferred tax recognised on losses |
|
(6) |
|
(11) |
|
(4) |
Deferred tax impact of change in tax rates |
|
(4) |
|
(4) |
|
— |
Impact of items on which no deferred tax has been recognised |
|
9 |
|
3 |
|
— |
Local business taxes |
|
1 |
|
1 |
|
— |
US BEAT liability |
|
— |
|
— |
|
1 |
Tax credits |
|
(2) |
|
(1) |
|
(2) |
Other |
|
1 |
|
— |
|
— |
Total tax charge |
|
100 |
|
116 |
|
129 |
The Group’s effective tax rate (ETR) for 2025 on reported profit before tax was 25.6% (2024: 25.1%; 2023: 22.8%). This compares with a blended rate of tax for the countries in which the Group operates of 25.3% (2024: 25.3%; 2023: 25.1%).
The UK continues to apply a global minimum effective tax rate of 15% for 2025. The legislation implements a domestic top-up tax and a multinational top-up tax, however, the group does not expect a material top up tax each year (less than $1m).
The Group continues to apply the temporary exception under IAS 12 for accounting for deferred taxes arising from the implementation of the Global Minimum Tax rules (“GMT”). The tax charge for the year ended 31 December 2025 includes an immaterial current tax charge related to GMT income taxes that rounds to $nil (2024: $nil) and so no country split has been provided. The Group continues to monitor developments in the implementation of the GMT rules around the world as guidance and legislation evolve.
A tax credit of $18m has been recognised in other comprehensive income (2024: $8m charge; 2023: $7m credit), which mainly relates to the tax effect of mark to market movements on financial instruments and deferred tax on the cash flow hedge and cost of hedging reserves recorded within other comprehensive income.
A13. Current income tax
Tax liabilities are classified as current liabilities unless there is a right to defer the payment of the liability for at least one year after the balance sheet date. As at 31 December 2025, all the Group’s tax liabilities have been classified as current as there is no legally enforceable right to defer payment for more than 12 months.
Current tax assets and liabilities are offset only when there is a legally enforceable right to set off the asset and liability, and there is an intention to either settle on a net basis or to realise the asset and settle the liability simultaneously.
Where required by accounting standards, management establishes provisions for uncertain tax positions on the basis of amounts expected to be paid to the tax authorities. The Group’s current tax liabilities reflect management’s best estimate of the future amounts of corporation tax that will be settled.
The Group is subject to income taxes in numerous jurisdictions. There are various uncertainties relating to the determination of its tax liabilities where the ultimate tax liability cannot be known until a resolution has been reached with the relevant tax authority, or the issue becomes time-barred. Issues can take many years to resolve and therefore assumptions on the likely outcome have to be made by management.
F-36
Each country and tax risk is considered separately when deciding whether it is appropriate to set up an uncertain tax provision. If risks are considered to be linked, the Group will consider the tax treatment in aggregate where appropriate.
This assessment of uncertain tax positions is based on management’s interpretation of relevant tax rules and decided cases, external advice obtained, the statute of limitations and the status of the negotiations, and past experience with tax authorities. In evaluating whether a provision is needed, it is assumed that tax authorities have full knowledge of the facts and circumstances applicable to each issue.
Tax provisions can be built up over a number of years, but in the year of resolution there could be adjustments to these provisions which could have a material positive or negative impact on the tax charge for a particular year. The settlement of a significant issue could also have a material impact on the amount of cash tax payable in any one year. Judgement is required in determining the worldwide provision for income taxes, particularly in relation to the pricing of intra-group goods and services as well as debt financing.
The majority of the tax provisions relate to transfer pricing exposures where the Group faces a number of risks in jurisdictions around the world, and is subject to audits by tax authorities in the territories in which it operates. These tax audits have an uncertain outcome and can take several years to resolve, which in some cases may be dependent on litigation. The actual outcome could vary from management’s estimates, but these are updated at each reporting period in the light of the latest available information.
Total uncertain tax provisions (including interest thereon) amounted to $44m as at 31 December 2025 (2024: $48m). Included within this amount is $6m (2024: $6m) in respect of interest arising on tax provisions, which is included within other payables. These tax provisions relate to multiple issues across the countries in which the Group operates. The net decrease in the provisions for the year is mainly attributable to issues which have been settled in the year or have become statute-barred.
The cash tax paid for the year was $104m (2024: $111m). The decrease was attributable mainly to one-off US tax deductions resulting from the One Big Beautiful Bill Act enacted on 4 July 2025.
|
|
2025 |
|
2024 |
|
|
$m |
|
$m |
Current taxation has been presented on the balance sheet as follows: Current tax asset within current assets |
|
18 |
|
28 |
Current tax liability within current liabilities |
|
(61) |
|
(53) |
|
|
(43) |
|
(25) |
A14. Deferred income tax
Deferred income tax is provided on temporary differences arising between the tax bases of assets and liabilities and their carrying amounts in the Consolidated Financial Statements. The following temporary differences are not provided for: the initial recognition of goodwill; the initial recognition of assets or liabilities in transactions other than a business combination that at the time of the transactions affects neither the accounting nor taxable profit or loss; and differences relating to investments in subsidiaries to the extent that they will probably not reverse in the foreseeable future. The amount of deferred income tax is determined using tax rates (and laws) that have been enacted (or substantively enacted) at the balance sheet date, and are expected to apply when the related deferred income tax asset is realised or the deferred income tax liability is settled. Deferred tax balances are not discounted.
Deferred tax assets and liabilities are offset against each other when the timing differences relate to income taxes levied by the same tax authority on an entity or different entities which are part of a tax consolidation and there would be the intention to settle on a net basis.
Deferred income tax assets are recognised to the extent that it is probable that future taxable profits will be available against which the temporary differences can be utilised. The amount of deferred tax assets recognised at each balance sheet date is adjusted to reflect changes in management’s assessment of future taxable profits. In recognising the deferred tax asset in respect of losses, management has estimated the quantum of future taxable profits, applying a risk weighting to future profits to reflect the uncertainties.
F-37
The movement on the deferred income tax account is as follows, which includes continuing and discontinued movements in Note A12 and Note B7 respectively:
|
|
2025 |
|
2024 |
|
|
$m |
|
$m |
Deferred Tax at 1 January |
|
(595) |
|
(604) |
Exchange differences |
|
(7) |
|
1 |
Impact of business combinations & disposals |
|
43 |
|
25 |
Credited/(Charged) to the income statement |
|
6 |
|
(5) |
Credited/(Charged) to other comprehensive income |
|
18 |
|
(8) |
Credited/(Charged) to equity |
|
1 |
|
(4) |
Deferred Tax at 31 December |
|
(534) |
|
(595) |
Deferred taxation has been presented on the balance sheet as follows: Deferred tax asset within non-current assets |
|
55 |
|
43 |
Deferred tax liability within non-current liabilities |
|
(589) |
|
(638) |
|
|
(534) |
|
(595) |
The major components of deferred tax assets and liabilities at the year end and their changes during the year (without taking into consideration the offsetting of balances within the same tax jurisdiction) are as follows:
|
|
Customer |
|
Accelerated |
|
|
|
|
|
|
|
|
|
|
|
|
|
|
lists/ |
|
tax |
|
|
|
IFRS 15 |
|
Tax |
|
Share-based |
|
|
|
|
|
|
intangibles |
|
depreciation |
|
Provisions |
|
Contracts |
|
losses |
|
payments |
|
Other2 |
|
Total |
|
|
$m |
|
$m |
|
$m |
|
$m |
|
$m |
|
$m |
|
$m |
|
$m |
At 1 January 2024 |
|
(703) |
|
(107) |
|
190 |
|
(52) |
|
48 |
|
19 |
|
1 |
|
(604) |
Exchange differences |
|
(1) |
|
— |
|
4 |
|
(1) |
|
(1) |
|
— |
|
— |
|
1 |
Recognised in income statement |
|
(5) |
|
5 |
|
10 |
|
(24) |
|
4 |
|
1 |
|
4 |
|
(5) |
Recognised in other comprehensive income |
|
— |
|
— |
|
— |
|
— |
|
— |
|
— |
|
(8) |
|
(8) |
Recognised in equity |
|
— |
|
— |
|
— |
|
— |
|
— |
|
(4) |
|
— |
|
(4) |
Impact of business combinations & disposals1 |
|
31 |
|
— |
|
(9) |
|
3 |
|
— |
|
— |
|
— |
|
25 |
At 31 December 2024 |
|
(678) |
|
(102) |
|
195 |
|
(74) |
|
51 |
|
16 |
|
(3) |
|
(595) |
|
|
|
|
|
|
|
|
|
|
|
|
|
|
|
|
|
At 1 January 2025 |
|
(678) |
|
(102) |
|
195 |
|
(74) |
|
51 |
|
16 |
|
(3) |
|
(595) |
Exchange differences |
|
(3) |
|
(6) |
|
2 |
|
(2) |
|
2 |
|
1 |
|
(1) |
|
(7) |
Recognised in income statement |
|
2 |
|
13 |
|
7 |
|
(9) |
|
(7) |
|
5 |
|
(5) |
|
6 |
Recognised in other comprehensive income |
|
— |
|
— |
|
— |
|
— |
|
10 |
|
— |
|
8 |
|
18 |
Recognised in equity |
|
— |
|
— |
|
— |
|
— |
|
— |
|
1 |
|
— |
|
1 |
Impact of business combinations & disposals3 |
|
(9) |
|
51 |
|
(2) |
|
5 |
|
— |
|
— |
|
(2) |
|
43 |
At 31 December 2025 |
|
(688) |
|
(44) |
|
202 |
|
(80) |
|
56 |
|
23 |
|
(3) |
|
(534) |
| 1. | Deferred tax liabilities have been adjusted in 2024 by a decrease of $35m relating to the Terminix acquisition with a corresponding reduction in goodwill. |
| 2. | Other deferred tax assets and liabilities include retirement benefits, unremitted earnings from subsidiaries, and the cash flow hedge reserve. |
3.Deferred tax liabilities have been adjusted in 2025 by a decrease of $52m relating to the France Workwear disposal.
F-38
A deferred tax asset of $56m has been recognised in respect of losses which are expected to be utilised within ten years (2024: $51m), of which $41m (2024: $38m) relates to UK losses (excluding capital losses) carried forward at 31 December 2025 (both amounts having increased due to foreign exchange translation by $3m during the year). These amount have been calculated by estimating the future taxable profits, against which the tax losses will be utilised, progressively risk-weighted, and applying the tax rates (substantively enacted as at the balance sheet date) applicable for each year.
The estimates of future profits are based on management’s financial forecasts which are used to support other aspects of the Financial Statements, such as impairment testing. At the balance sheet date, the Group had tax losses of $397m (2024: $303m) on which no deferred tax asset is recognised because it is not considered probable that future taxable profits will be available in certain jurisdictions to be able to benefit from those tax losses. Of the losses, $340m (2024: $254m) will expire at various dates between 2026 and 2045.
In addition, the Group has UK capital losses carried forward of $372m (2024: $346m) on which no deferred tax asset is recognised. All movements in the year are as a result of foreign exchange translation. These losses have no expiry date, but management considers the future utilisation of these losses to be unlikely.
Dividends received from subsidiaries are largely exempt from UK taxation but may be subject to dividend withholding or other taxes levied by the overseas tax jurisdictions in which the subsidiaries operate. A deferred tax liability of $4m (2024: $4m) has been recognised in respect of this liability as it is anticipated that these profits will be distributed to the UK in the foreseeable future. At the balance sheet date, there is no material unprovided deferred tax liability were overseas earnings to be distributed to the UK.
B. Investing
B1. Business combinations
All business combinations are accounted for using the purchase method (acquisition accounting) in accordance with IFRS 3 Business Combinations. The cost of a business combination is the aggregate of the fair values at the date of exchange of assets given, liabilities incurred or assumed, and equity instruments issued by the Group. The cost of a business combination is allocated at the acquisition date by recognising the acquiree’s identifiable assets, liabilities, and contingent liabilities that satisfy the recognition criteria at their fair values. Any excess of the purchase price over the fair value of the identifiable assets and liabilities is recognised as goodwill. The acquisition date is the date on which the acquirer effectively obtains control of the acquiree.
An intangible asset is recognised if it meets the definition under IAS 38 Intangible Assets. The intangible assets arising on acquisition are goodwill, customer lists, and brands. Goodwill represents the synergies, workforce, and other benefits expected as a result of combining the respective businesses. Customer lists and brands are recognised at their fair value at the date of acquisition using an income-based approach, which involves the use of assumptions including customer termination rates, profit margins, contributory asset charges, and discount rates.
At the date of acquisition, deferred and contingent consideration represents its fair value, with subsequent changes after the measurement period being recognised in the income statement. Costs directly attributable to business combinations are charged to the income statement as incurred and presented as one-off and adjusting items.
Disclosures required by IFRS 3 Business Combinations are provided separately for those individual acquisitions that are considered to be material, and in aggregate for individually immaterial acquisitions. An acquisition would generally be considered individually material if the impact on the Group’s revenue and Adjusted Operating Profit measures (on an annualised basis) is greater than 5%, or the impact on goodwill is greater than 10% of the closing balance for the period. There were no individually material acquisitions in the year (2024: none).
During the year, the Group purchased 100% of the share capital or trade and assets of 36 companies and businesses (2024: 36). The total consideration in respect of these acquisitions was $115m (2024: $232m), and the cash outflow from current and past period acquisitions net of cash acquired was $121m (2024: $219m).
F-39
Goodwill on all acquisitions represents the synergies and other benefits expected to be realised from integrating acquired businesses into the Group, such as improved route density, expansion in use of best-in-class digital tools, and back office synergies. Details of goodwill and the fair value of net assets acquired in the year are as follows:
|
|
2025 |
|
2024 |
|
|
$m |
|
$m |
Purchase consideration |
|
|
|
|
– Cash paid |
|
90 |
|
147 |
– Deferred and contingent consideration |
|
25 |
|
85 |
Total purchase consideration |
|
115 |
|
232 |
Provisional fair value of net assets acquired |
|
(44) |
|
(65) |
Goodwill from current-year acquisitions |
|
71 |
|
167 |
Goodwill expected to be deductible for tax purposes |
|
48 |
|
105 |
Deferred consideration of $12m and contingent consideration of $13m are payable in respect of the above acquisitions (2024: $44m and $41m respectively). Contingent consideration is payable based on a variety of conditions, including revenue and profit targets being met. Amounts for both deferred and contingent consideration are payable over the next five years. The Group has recognised contingent and deferred consideration based on fair value at the acquisition date. A range of outcomes for contingent consideration payments cannot be estimated due to the variety of performance conditions and the volume of businesses the Group acquires. During the year, there were releases of contingent consideration liabilities not paid of $25m (2024: $9m).
The fair values6 of assets and liabilities arising from acquisitions in the year are as follows:
|
|
2025 |
|
2024 |
|
|
$m |
|
$m |
Non-current assets |
|
|
|
|
– Intangible assets1 |
|
47 |
|
72 |
– Property, plant and equipment2 |
|
4 |
|
14 |
Current assets3 |
|
9 |
|
35 |
Current liabilities4 |
|
(4) |
|
(30) |
Non-current liabilities5 |
|
(12) |
|
(26) |
Net assets acquired |
|
44 |
|
65 |
1. |
Includes $46m (2024: $59m) of customer lists and $1m (2024: $13m) of other intangibles. |
2. |
Includes $1m (2024: $5m) of ROU assets. |
3. |
Includes cash acquired of $2m (2024: $3m), inventory of $2m (2024: $14m), and trade and other receivables of $5m (2024: $18m). |
4. |
Includes trade and other payables of $4m (2024: $30m). |
5. |
Includes $8m of deferred tax liabilities relating to acquired intangibles (2024: $11m), lease liabilities of $1m (2024: $5m), and other liabilities of $3m (2024: $10m). |
6. |
The fair values of assets and liabilities from acquisitions in the current year will be finalised in the 2026 Financial Statements. These fair values are provisional as the acquisition accounting has not yet been finalised, primarily due to the proximity of many acquisitions to the year end. |
F-40
The cash outflow from current and past acquisitions is as follows:
|
|
2025 |
|
2024 |
|
|
$m |
|
$m |
Total purchase consideration |
|
115 |
|
232 |
Consideration payable in future periods |
|
(25) |
|
(85) |
Purchase consideration paid in cash |
|
90 |
|
147 |
Cash and cash equivalents in acquired companies and businesses |
|
(2) |
|
(3) |
Cash outflow on current period acquisitions |
|
88 |
|
144 |
Deferred and contingent consideration paid |
|
33 |
|
75 |
Cash outflow on current and past acquisitions |
|
121 |
|
219 |
From the dates of acquisition to 31 December 2025, new acquisitions contributed $29m to revenue and $3m to operating profit (2024: $86m and $2m respectively).
If the acquisitions had occurred on 1 January 2025, the revenue and operating profit of the combined Group would have amounted to $6,943m and $584m respectively (2024: $6,689m and $646m respectively).
F-41
B2. Intangible assets
Intangible assets are stated at cost less accumulated amortisation and accumulated impairment losses, where applicable.
A breakdown of intangible assets is as shown below:
|
|
|
|
Customer |
|
Indefinite-lived |
|
Other |
|
Product |
|
Computer |
|
|
|
|
Goodwill |
|
lists |
|
brands |
|
intangibles |
|
development |
|
software |
|
Total |
|
|
$m |
|
$m |
|
$m |
|
$m |
|
$m |
|
$m |
|
$m |
Cost |
|
|
|
|
|
|
|
|
|
|
|
|
|
|
At 1 January 2024 |
|
6,471 |
|
1,860 |
|
1,436 |
|
97 |
|
83 |
|
291 |
|
10,238 |
Exchange differences |
|
(51) |
|
(48) |
|
(2) |
|
(1) |
|
(1) |
|
(7) |
|
(110) |
Additions |
|
– |
|
— |
|
— |
|
— |
|
11 |
|
59 |
|
70 |
Disposals/retirements |
|
– |
|
(29) |
|
— |
|
(3) |
|
— |
|
(28) |
|
(60) |
Acquisition of companies and businesses |
|
144 |
|
47 |
|
— |
|
13 |
|
— |
|
— |
|
204 |
Hyperinflationary adjustment |
|
12 |
|
5 |
|
— |
|
1 |
|
— |
|
— |
|
18 |
At 31 December 2024 |
|
6,576 |
|
1,835 |
|
1,434 |
|
107 |
|
93 |
|
315 |
|
10,360 |
At 1 January 2025 |
|
6,576 |
|
1,835 |
|
1,434 |
|
107 |
|
93 |
|
315 |
|
10,360 |
Exchange differences |
|
64 |
|
61 |
|
1 |
|
4 |
|
7 |
|
19 |
|
156 |
Additions |
|
– |
|
— |
|
— |
|
— |
|
14 |
|
47 |
|
61 |
Disposals/retirements |
|
(5) |
|
(109) |
|
— |
|
(7) |
|
— |
|
(29) |
|
(150) |
Acquisition of companies and businesses |
|
71 |
|
46 |
|
— |
|
1 |
|
— |
|
— |
|
118 |
Hyperinflationary adjustment |
|
– |
|
2 |
|
— |
|
— |
|
— |
|
— |
|
2 |
At 31 December 2025 |
|
6,706 |
|
1,835 |
|
1,435 |
|
105 |
|
114 |
|
352 |
|
10,547 |
Accumulated amortisation and impairment |
|
|
|
|
|
|
|
|
|
|
|
|
|
|
At 1 January 2024 |
|
(81) |
|
(878) |
|
— |
|
(50) |
|
(56) |
|
(203) |
|
(1,268) |
Exchange differences |
|
6 |
|
35 |
|
— |
|
1 |
|
2 |
|
5 |
|
49 |
Disposals/retirements |
|
— |
|
29 |
|
— |
|
3 |
|
— |
|
26 |
|
58 |
Hyperinflationary adjustment |
|
(10) |
|
(2) |
|
— |
|
(1) |
|
— |
|
— |
|
(13) |
Impairment charge |
|
(36) |
|
— |
|
— |
|
— |
|
(3) |
|
— |
|
(39) |
Amortisation charge |
|
— |
|
(194) |
|
— |
|
(11) |
|
(10) |
|
(33) |
|
(248) |
At 31 December 2024 |
|
(121) |
|
(1,010) |
|
— |
|
(58) |
|
(67) |
|
(205) |
|
(1,461) |
At 1 January 2025 |
|
(121) |
|
(1,010) |
|
— |
|
(58) |
|
(67) |
|
(205) |
|
(1,461) |
Exchange differences |
|
(1) |
|
(49) |
|
— |
|
(2) |
|
(6) |
|
(14) |
|
(72) |
Disposals/retirements |
|
— |
|
109 |
|
— |
|
7 |
|
— |
|
25 |
|
141 |
Hyperinflationary adjustment |
|
— |
|
(2) |
|
— |
|
— |
|
— |
|
— |
|
(2) |
Amortisation charge |
|
— |
|
(182) |
|
— |
|
(7) |
|
(10) |
|
(37) |
|
(236) |
At 31 December 2025 |
|
(122) |
|
(1,134) |
|
— |
|
(60) |
|
(83) |
|
(231) |
|
(1,630) |
Net book value |
|
|
|
|
|
|
|
|
|
|
|
|
|
|
At 1 January 2024 |
|
6,390 |
|
982 |
|
1,436 |
|
47 |
|
27 |
|
88 |
|
8,970 |
At 31 December 2024 |
|
6,455 |
|
825 |
|
1,434 |
|
49 |
|
26 |
|
110 |
|
8,899 |
At 31 December 2025 |
|
6,584 |
|
701 |
|
1,435 |
|
45 |
|
31 |
|
121 |
|
8,917 |
F-42
The main categories of intangible assets are as follows:
Intangible assets-finite useful lives
Intangible assets with finite useful lives are initially measured at either cost or fair value and amortised on a straight-line basis over their useful economic lives, which are reviewed on an annual basis. These assets are reviewed for impairment whenever events or changes in circumstances indicate that the carrying amount of the asset may exceed its recoverable amount. The fair value attributable to intangible assets acquired through a business combination is determined by discounting the expected future cash flows to be generated from that asset at the risk-adjusted weighted average cost of capital for the Group. The residual values of intangible assets are assumed to be $nil.
The estimated useful economic lives of intangible assets are as follows:
|
|
|
Customer lists: |
|
3 to 15 years |
Other intangibles: |
|
2 to 15 years |
Product development: |
|
2 to 5 years |
Computer software: |
|
3 to 5 years |
The following are the main categories of intangible assets with finite useful lives:
(a) Customer lists
Customer lists are acquired as part of business combinations. No value is attributed to internally generated customer lists.
(b) Other intangibles
Other intangibles consists of brands with finite useful lives and intellectual property. Brands are acquired as part of business combinations. No value is attributed to internally generated brands as expenditure incurred to develop, maintain, and renew brands internally is recognised as an expense in the period incurred. Intellectual property costs are incurred in acquiring and maintaining patents and licences. These are recognised only if the cost can be measured reliably, and they are expected to generate economic benefits beyond one year, in excess of their cost.
(c) Product development
Costs incurred in the design and testing of new or improved products are recognised as intangible assets only if the cost can be measured reliably, and it is probable that the project will be a success considering its commercial and technological feasibility. Capitalised product development expenditure is measured at cost less accumulated amortisation.
Other development expenditure and all research expenditure are recognised as an expense as incurred and amount to $4m in the year (2024: $5m).
Development costs recognised as an expense are never reclassified as an asset in a subsequent period. Development costs that have been capitalised are amortised from the date the product is made available.
(d) Computer software
Costs that are directly associated with the production of identifiable and unique software products that are controlled by the Group (including employee costs and external software development costs) are recognised as intangible assets, if they are expected to generate economic benefits beyond one year in excess of their cost. Purchased computer software is initially recognised based on the costs incurred to acquire and bring it into use.
Costs associated with maintaining computer software are recognised as an expense in the period in which they are incurred.
F-43
Intangible assets-indefinite useful lives
(a) Goodwill
Goodwill represents the excess of the cost of an acquisition over the fair value of the Group’s share of the net identifiable assets of the acquired business at the date of acquisition. It is recognised as an intangible asset. Goodwill arising on the acquisition of an associate is included in investments in associates.
(b) Brands with indefinite useful lives
Brands with indefinite useful lives are acquired as part of business combinations. No value is attributed to internally generated brands as expenditure incurred to develop, maintain, and renew brands internally is recognised as an expense in the period incurred.
The Terminix US and Terminix International brands are considered to have indefinite useful lives due to their long history in the US (being founded in 1927) and having a strong brand equity in the US for much of their history and now internationally. The Group plans to continue to support and invest in the Terminix brand; it controls all the associated assets that support the underlying business, and therefore it is considered that there is no foreseeable limit on the period over which these brands will continue to generate net cash inflows.
Goodwill and brands with indefinite useful lives are tested annually for impairment and carried at cost less accumulated impairment losses. For the purpose of impairment testing, goodwill is allocated to cash-generating unit groups (CGU groups) identified according to region of operation and reportable business unit. Gains and losses on the disposal of an entity include the carrying amount of goodwill relating to the entity sold.
At the start of 2025, management reviewed its grouping of CGUs and its allocation of goodwill for the purposes of assessing impairment based on the lowest level at which the goodwill is monitored. Based on this review, management has determined that the Group now has six CGU groups. These are North America, UK & SSA, Europe, LATAM, Asia & MENAT, and Pacific. The key factors considered in management’s conclusion included the change in reporting segments to North America and International, to reflect the high proportion of business in the US, and the subsequent allocation of resources based on the results for each operating segment.
Before initiating the change in CGU grouping, in accordance with IAS 36, management performed a value-in-use impairment test on the pre-existing CGU groups and determined there to be no impairment of goodwill within any of the groups.
The recoverable amount of a CGU group is determined based on the higher of value-in-use calculations using cash flow projections, and fair value less costs to sell. The cash flow projections in year one are based on financial budgets approved by management, which are prepared as part of the Group’s normal planning process. Cash flows for years two to five use management’s expectation of revenue growth and operating profit margin, based on past experience and expectations regarding future performance and profitability for each CGU group. Cash flows beyond the five-year period are extrapolated using estimated long-term growth rates (LTGR).
F-44
Cash flow projections included in the impairment review models include management’s view of the impact of climate change, including costs related to the effects of climate change, as well as the future costs of the Group’s commitment to reach net zero by 2040 and costs of compliance with current legal requirements. The potential increased costs, to meet these commitments less any benefits that may occur, are not expected to be material and therefore have not resulted in any impairments during 2025.
A breakdown of goodwill by region is shown below:
|
|
2025 |
|
2024 |
|
|
$m |
|
$m |
North America |
|
5,718 |
|
5,668 |
International |
|
|
|
|
Europe |
|
250 |
|
218 |
UK & Sub-Saharan Africa |
|
149 |
|
138 |
Asia & MENAT |
|
232 |
|
229 |
LATAM |
|
77 |
|
61 |
Pacific |
|
158 |
|
141 |
Sub-total International |
|
866 |
|
787 |
Total |
|
6,584 |
|
6,455 |
Impairment tests for goodwill and brands with indefinite useful lives
All CGU groups were supported through the value-in-use approach. During the year, the Group recognised no goodwill impairments (2024: $36m). For all goodwill and indefinite-lived brands balances, it can be demonstrated that there is sufficient headroom in the recoverable amount of the CGU goodwill balances based on the assumptions made, and there is no reasonably likely scenario under which material impairment could be expected to occur in the next 12 months based on the testing performed.
The key assumptions used by CGU groups for value-in-use calculations were:
|
|
2025 long-term |
|
2025 pre-tax |
|
2024 long-term |
|
2024 pre-tax |
|
|
|
growth rate1 |
|
discount rate |
|
growth rate1 |
|
discount rate |
|
North America |
|
2.2 |
% |
10.3 |
% |
2.0–2.1 |
% |
8.5–8.7 |
% |
International |
|
|
|
|
|
|
|
|
|
Europe |
|
1.9 |
% |
9.9 |
% |
1.7–2.5 |
% |
8.0–10.8 |
% |
UK & Sub-Saharan Africa |
|
2.3 |
% |
10.9 |
% |
2.0 |
% |
9.3–11.1 |
% |
Asia & MENAT |
|
2.7 |
% |
13.1 |
% |
2.0–4.0 |
% |
7.7–14.1 |
% |
LATAM |
|
2.4 |
% |
12.9 |
% |
2.3–3.0 |
% |
11.2–17.11 |
% |
Pacific |
|
2.4 |
% |
10.0 |
% |
2.0–2.5 |
% |
10.3–10.9 |
% |
1. |
Source: imf.org. |
The growth rates used by CGU groups are based on the LTGR predicted for the relevant sector and countries in which a business operates. They do not exceed the long-term average growth rate for that industry or countries. The pre-tax discount rates are internally calculated weighted average cost of capital for each category and region, weighted based on the profit contribution to the region. The pre-tax discount rates are based on current prices, therefore future cash flow projections include inflation-linked measures.
B3. Property, plant and equipment
Property, plant and equipment is stated at historic cost less depreciation, with the exception of freehold land and assets under construction which are not depreciated. Historic cost includes expenditure that is directly attributable to the acquisition of the items.
F-45
A breakdown of property, plant and equipment is shown below:
|
|
|
|
Service |
|
|
|
Vehicles |
|
|
|
|
Land and |
|
contract |
|
Other plant |
|
and office |
|
|
|
|
buildings |
|
equipment |
|
and equipment |
|
equipment |
|
Total |
|
|
$m |
|
$m |
|
$m |
|
$m |
|
$m |
Cost |
|
|
|
|
|
|
|
|
|
|
At 1 January 2024 |
|
155 |
|
782 |
|
275 |
|
326 |
|
1,538 |
Exchange differences |
|
(6) |
|
(53) |
|
(16) |
|
(11) |
|
(86) |
Additions |
|
9 |
|
161 |
|
18 |
|
31 |
|
219 |
Disposals |
|
(5) |
|
(125) |
|
(20) |
|
(65) |
|
(215) |
Acquisition of companies and businesses |
|
1 |
|
1 |
|
1 |
|
6 |
|
9 |
Hyperinflationary adjustment |
|
1 |
|
— |
|
— |
|
1 |
|
2 |
Reclassification from IFRS 16 ROU assets1 |
|
— |
|
— |
|
— |
|
10 |
|
10 |
At 31 December 2024 |
|
155 |
|
766 |
|
258 |
|
298 |
|
1,477 |
At 1 January 2025 |
|
155 |
|
766 |
|
258 |
|
298 |
|
1,477 |
Exchange differences |
|
15 |
|
84 |
|
28 |
|
16 |
|
143 |
Additions |
|
11 |
|
145 |
|
17 |
|
31 |
|
204 |
Disposals |
|
(96) |
|
(414) |
|
(192) |
|
(35) |
|
(737) |
Acquisition of companies and businesses |
|
— |
|
— |
|
1 |
|
2 |
|
3 |
Hyperinflationary adjustment |
|
1 |
|
— |
|
— |
|
1 |
|
2 |
Reclassification from IFRS 16 ROU assets1 |
|
— |
|
— |
|
— |
|
23 |
|
23 |
At 31 December 2025 |
|
86 |
|
581 |
|
112 |
|
336 |
|
1,115 |
Accumulated depreciation and impairment |
|
|
|
|
|
|
|
|
|
|
At 1 January 2024 |
|
(56) |
|
(470) |
|
(195) |
|
(181) |
|
(902) |
Exchange differences |
|
(1) |
|
34 |
|
13 |
|
6 |
|
52 |
Disposals |
|
4 |
|
123 |
|
20 |
|
58 |
|
205 |
Depreciation charge |
|
(6) |
|
(139) |
|
(18) |
|
(41) |
|
(204) |
At 31 December 2024 |
|
(59) |
|
(452) |
|
(180) |
|
(158) |
|
(849) |
At 1 January 2025 |
|
(59) |
|
(452) |
|
(180) |
|
(158) |
|
(849) |
Exchange differences |
|
(6) |
|
(50) |
|
(21) |
|
(10) |
|
(87) |
Disposals |
|
32 |
|
235 |
|
137 |
|
30 |
|
434 |
Hyperinflationary adjustment |
|
— |
|
— |
|
— |
|
(1) |
|
(1) |
Depreciation charge |
|
(6) |
|
(107) |
|
(13) |
|
(41) |
|
(167) |
At 31 December 2025 |
|
(39) |
|
(374) |
|
(77) |
|
(180) |
|
(670) |
Net book value |
|
|
|
|
|
|
|
|
|
|
At 1 January 2024 |
|
99 |
|
312 |
|
80 |
|
145 |
|
636 |
At 31 December 2024 |
|
96 |
|
314 |
|
78 |
|
140 |
|
628 |
At 31 December 2025 |
|
47 |
|
207 |
|
35 |
|
156 |
|
445 |
1. |
Certain leased assets become owned assets at the end of their lease period and are therefore reclassified from ROU assets (Note B4). |
2. |
Depreciation charge for the year ending 31 December 2025 includes $32m in relation to assets disposed of as part of the French Workwear disposal in Note B7 (2024: $75m). |
F-46
Depreciation of assets is calculated using the straight-line method to allocate the difference between their cost and their residual values over their estimated useful lives, as follows:
Freehold buildings: |
|
50 to 100 years |
Leasehold improvements: |
|
Shorter of the lease term or estimated useful life |
Vehicles: |
|
4 to 10 years |
Plant and equipment (including service contract equipment): |
|
3 to 10 years |
Office equipment, furniture, and fittings: |
|
3 to 10 years |
Residual values and useful lives of assets are reviewed annually and amended as necessary. Fixed assets are reviewed for impairment whenever events or changes in circumstances indicate that the carrying amount of the fixed asset may exceed its recoverable amount. There were no impairments in the year (2024: $nil).
When assets are sold, the gain or loss between sale proceeds and net book value is recognised in the income statement.
The category of service contract equipment represents the pool of assets used by the Group in delivering contracted services to customers. Land and buildings comprise mainly offices and warehouses inclusive of leasehold improvements.
B4. Leases
The Group leases land and buildings, vehicles, and other equipment. The lease durations vary from lease to lease according to the asset leased and local practices. Some of the Group’s leases have extension and termination options attached to them. Lease extension options and lease termination options are only included in the calculation of the lease liability if there is reasonable certainty that they will be exercised. Judgement is required to determine the level of certainty.
The value of leases to which the Group is committed but that have not yet commenced is not material.
A breakdown of the right-of-use (ROU) assets is shown below:
|
|
Land and |
|
|
|
Other |
|
|
|
|
buildings |
|
Vehicles |
|
equipment |
|
Total |
|
|
$m |
|
$m |
|
$m |
|
$m |
Net book value |
|
|
|
|
|
|
|
|
At 1 January 2024 |
|
227 |
|
347 |
|
2 |
|
576 |
Exchange differences |
|
(5) |
|
(7) |
|
— |
|
(12) |
Additions |
|
77 |
|
106 |
|
— |
|
183 |
Disposals |
|
(3) |
|
(5) |
|
— |
|
(8) |
Acquisition of companies and businesses |
|
5 |
|
— |
|
— |
|
5 |
Depreciation charge |
|
(73) |
|
(83) |
|
(1) |
|
(157) |
Reclassification to property, plant and equipment1 |
|
— |
|
(10) |
|
— |
|
(10) |
At 31 December 2024 |
|
228 |
|
348 |
|
1 |
|
577 |
|
|
|
|
|
|
|
|
|
At 1 January 2025 |
|
228 |
|
348 |
|
1 |
|
577 |
Exchange differences |
|
9 |
|
12 |
|
— |
|
21 |
Additions |
|
79 |
|
106 |
|
1 |
|
186 |
Disposals |
|
(8) |
|
(18) |
|
— |
|
(26) |
Acquisition of companies and businesses |
|
— |
|
1 |
|
— |
|
1 |
Depreciation charge |
|
(74) |
|
(85) |
|
(1) |
|
(160) |
Reclassification to property, plant and equipment1 |
|
— |
|
(23) |
|
— |
|
(23) |
At 31 December 2025 |
|
234 |
|
341 |
|
1 |
|
576 |
1. |
Certain leased assets become owned assets at the end of their lease period and are therefore reclassified to property, plant and equipment (Note B3). |
F-47
Analysis of the Group’s lease liabilities is shown below:
|
|
2025 |
|
2024 |
|
|
$m |
|
$m |
At 1 January |
|
557 |
|
567 |
Exchange differences |
|
22 |
|
(13) |
Lease payments |
|
(223) |
|
(216) |
Interest |
|
31 |
|
31 |
Additions |
|
195 |
|
182 |
Disposals |
|
(20) |
|
— |
Acquisition of companies and businesses |
|
1 |
|
6 |
At 31 December |
|
563 |
|
557 |
Analysed as follows: |
|
|
|
|
Non-current |
|
392 |
|
394 |
Current |
|
171 |
|
163 |
Total |
|
563 |
|
557 |
Lease liabilities analysed by currency:
|
|
2025 |
|
2024 |
|
|
$m |
|
$m |
Pound sterling |
|
61 |
|
53 |
Euro |
|
88 |
|
94 |
US dollar |
|
337 |
|
335 |
Other currencies |
|
77 |
|
75 |
At 31 December |
|
563 |
|
557 |
Lease liabilities are payable as follows:
|
|
2025 |
|
2024 |
|
|
$m |
|
$m |
Less than one year |
|
191 |
|
188 |
Between one and five years |
|
356 |
|
361 |
More than five years |
|
74 |
|
81 |
Future minimum payments |
|
621 |
|
630 |
Effect of discounting |
|
(58) |
|
(73) |
Carrying value |
|
563 |
|
557 |
Other lease costs not already described are set out below:
|
|
2025 |
|
2024 |
|
|
$m |
|
$m |
Expenses relating to short-term leases |
|
28 |
|
32 |
Expenses relating to leases of low-value assets |
|
6 |
|
6 |
Expenses relating to variable lease payments |
|
1 |
|
3 |
At 31 December |
|
35 |
|
41 |
The Group has no material arrangements where it acts as a lessor.
F-48
B5. Capital commitments
Capital expenditure contracted for at the balance sheet date but not yet incurred is as follows:
|
|
2025 |
|
2024 |
|
|
$m |
|
$m |
Property, plant and equipment |
|
7 |
|
39 |
Intangible assets |
|
3 |
|
2 |
Total |
|
10 |
|
41 |
B6. Investments in associated undertakings
|
|
2025 |
|
2024 |
|
|
$m |
|
$m |
Interest in Nippon Calmic Limited |
|
35 |
|
31 |
Interest in individually immaterial associated undertakings |
|
6 |
|
15 |
At 31 December |
|
41 |
|
46 |
Nippon Calmic Limited
Nippon Calmic Limited is an associated undertaking in Japan which provides hygiene services, in which the Group has a 49% interest.
The associate is unlisted and the investment value is shown below.
|
|
2025 |
|
2024 |
|
|
$m |
|
$m |
At 1 January |
|
31 |
|
40 |
Exchange differences |
|
(1) |
|
(4) |
Share of profit1 |
|
9 |
|
8 |
Dividends received |
|
(4) |
|
(13) |
At 31 December |
|
35 |
|
31 |
1. |
Share of profit is net of tax of $5m (2024: $4m). |
|
|
Assets |
|
Liabilities |
|
Revenue |
|
Profit |
|
Assets |
|
Liabilities |
|
Revenue |
|
Profit |
|
|
2025 |
|
2025 |
|
2025 |
|
2025 |
|
2024 |
|
2024 |
|
2024 |
|
2024 |
|
|
$m |
|
$m |
|
$m |
|
$m |
|
$m |
|
$m |
|
$m |
|
$m |
Nippon Calmic Ltd (49%) |
|
78 |
|
(40) |
|
73 |
|
9 |
|
73 |
|
(41) |
|
67 |
|
8 |
Individually immaterial associates
In addition to the interest in associates disclosed above, the Group also has interests in a number of individually immaterial associates that are accounted for using the equity method.
|
|
2025 |
|
2024 |
|
|
$m |
|
$m |
At 1 January |
|
15 |
|
16 |
Exchange differences |
|
1 |
|
(1) |
Write off |
|
(8) |
|
— |
Other |
|
(2) |
|
— |
Share of profit |
|
1 |
|
1 |
Dividends received |
|
(1) |
|
(1) |
At 31 December |
|
6 |
|
15 |
There was no unrecognised share of losses related to associates (2024: $nil).
F-49
B7. Discontinued operations
Rentokil Initial plc announced that it entered into an agreement for the intended sale of its Workwear business in France with H.I.G. Capital (the Proposed Transaction) on 28 May 2025 which was subsequently completed on 30 September 2025. Financial information relating to the discontinued operation to the date of disposal is set out below.
The financial performance and cash flow information presented below are for the nine months ended 30 September 2025, the year ended 31 December 2024, and the year ended 31 December 2023.
|
|
2025 |
|
2024 |
|
2023 |
|
|
$m |
|
$m |
|
$m |
Revenue |
|
261 |
|
324 |
|
302 |
Operating expenses |
|
(186) |
|
(266) |
|
(252) |
Net impairment losses on financial assets |
|
(1) |
|
(1) |
|
— |
Operating profit |
|
74 |
|
57 |
|
50 |
Finance cost |
|
(2) |
|
(2) |
|
(2) |
Profit before income tax |
|
72 |
|
55 |
|
48 |
Income tax expense |
|
(16) |
|
(9) |
|
(11) |
Profit after income tax of discontinued operations |
|
56 |
|
46 |
|
37 |
Profit on sale of the subsidiary after income tax |
|
124 |
|
— |
|
— |
Profit from discontinued operations |
|
180 |
|
46 |
|
37 |
Profit for the period attributable to: |
|
|
|
|
|
|
Equity holders of the Company |
|
180 |
|
46 |
|
37 |
Other comprehensive income: |
|
|
|
|
|
|
Items that may be reclassified subsequently to the income statement: |
|
|
|
|
|
|
Net exchange adjustments offset in reserves |
|
38 |
|
(12) |
|
7 |
Net (loss)/gain on net investment hedge |
|
(11) |
|
8 |
|
(5) |
Other comprehensive income for the period |
|
27 |
|
(4) |
|
2 |
Total comprehensive income for the period |
|
207 |
|
42 |
|
39 |
Total comprehensive income for the period attributable to: |
|
|
|
|
|
|
Equity holders of the Company |
|
207 |
|
42 |
|
39 |
Net cash generated from operating activities |
|
100 |
|
125 |
|
114 |
Net cash flows from investing activities |
|
318 |
|
(85) |
|
(85) |
Net cash flows from financing activities |
|
(6) |
|
(8) |
|
(7) |
Net increase in cash generated by discontinued operations |
|
412 |
|
32 |
|
22 |
F-50
The carrying amounts of assets and liabilities as at the date of sale were:
|
|
At 30 September |
|
|
2025 |
|
|
$m |
Assets |
|
|
Intangible assets |
|
8 |
Property, plant and equipment |
|
287 |
Right-of-use assets |
|
22 |
Contract costs |
|
20 |
Inventories |
|
12 |
Trade and other receivables |
|
82 |
Cash and cash equivalents |
|
6 |
|
|
437 |
Liabilities |
|
|
Trade and other payables |
|
(112) |
Lease liabilities |
|
(20) |
Deferred and current tax |
|
(56) |
Retirement benefit obligations |
|
(8) |
Provisions |
|
(9) |
|
|
(205) |
Net assets and liabilities disposed |
|
232 |
Cash consideration received |
|
397 |
Carrying amount of net assets sold |
|
(232) |
Gain on sale before income tax and reclassification of foreign currency translation reserve |
|
165 |
Cumulative exchange recycled from translation reserve |
|
(38) |
Cumulative reserve recycled from net investment hedge reserve |
|
11 |
Costs related to disposal |
|
(14) |
Net profit on disposal |
|
124 |
C. Financing
C1. Financial risk management
The Group’s central treasury function manages cash, borrows on behalf of the Group, and provides finance to Group companies in their local currencies. Treasury activity is governed by a Treasury Committee, which is chaired by the Chief Financial Officer.
The main financial risks faced by the Group are set out below.
(a) Liquidity risk
The Group is committed to ensuring it has sufficient liquidity to meet its business needs, and appropriate reserves to cover operational underperformance or dislocation in the financial markets. It is the Group’s policy to have headroom of unrestricted cash and available committed facilities of at least $750m (2024: $750m), and the Treasury Committee manages financing requirements and associated headroom at least 12 months forward. Available commitments of $1,000m under the Group’s committed debt facilities, together with unrestricted cash of $1,565m (2024: $447m), gives the Group combined headroom of $2,565m at 31 December 2025 (2024: $1,499m).
The Group’s debt facilities have no financial covenants and the Group is compliant with other terms, conditions, and undertakings of its debt facilities.
F-51
The Group targets an investment grade credit rating for debt issuance of BBB over the medium term. Both S&P Global (S&P) and Fitch Ratings (Fitch) rated the Group BBB. In line with ratings criteria, debt maturities are covered at least 12 months in advance using available cash or committed facilities, or by issuance of new debt. Management maintains an active dialogue with both S&P and Fitch, as well as the Group’s relationship banks, to ensure that any changes to the Group’s financing and acquisition strategies are understood.
The Group has one debt maturity of €500m falling due in May 2026. This was redeemed post balance sheet on 2nd March 2026. The Group has sufficient headroom to cover this maturity without issuing new debt.
The €500m bond due May 2026, and the €600m bond due October 2028, issued under the Group’s Euro Medium-Term Notes (EMTN) Programme, contain a coupon step-up which increases the coupon payable by 1.25% in the event that the Group is downgraded to BB+ or below (sub-investment grade). The Group’s bonds may be called by their investors at par in the event of a change of control of the Group. They may also be called within 120 days if the Group’s debt is downgraded below investment grade, or if the rating is withdrawn and the rating agency confirms in writing, either publicly or to the Group or the Trustee, that the rating action occurred either wholly or in part due to a change of control. All other bonds issued under the EMTN Programme do not contain the coupon step-up.
(b) Credit risk
The Group has no significant concentration of credit risk. Sales are typically low-value, high-volume, spreading the risk across a large number of customers and geographies. Policies are in place to ensure that credit sales are only made to customers with an appropriate credit history. The Group operates in some territories where there is increased exposure to trade credit risks and in those territories the Group puts in place appropriate measures to manage its credit risk exposure.
In order to protect the liquid assets and funding relationships of the Group, management aims to maintain banking relationships with counterparties that carry a long-term credit rating of at least A-, or equivalent rating, with one of the major credit rating agencies. In countries where no banks are rated A- or above, balances are monitored monthly and kept to a minimum. In addition, funds held with all counterparties are subject to limits. All exposures are monitored and reported to the Treasury Committee each month. The Group also monitors the creditworthiness of its lenders to ensure that commitments under its facilities are available as needed.
At 31 December 2025 the Group had a total of $19m of cash held on bank accounts with banks rated below A- (2024: $16m). The highest concentration with any single bank rated below A- was $2m (2024: $1m).
(c) Market risk
Foreign exchange risk
The Group’s worldwide operations generate profits and cash flows in foreign currencies. Sales and purchases are typically denominated in the currency of the country in which they are transacted, and the Group’s cross-border procurement is considered insignificant. Sterling-denominated profits from UK operations are exceeded by sterling-denominated Group central costs. This means that approximately 106% of Group operating profit is generated in foreign currencies.
The Group’s primary exposure to foreign exchange risk is in relation to the translation of assets and liabilities, and the Group aims to hold debt in currencies in proportion to its forecast foreign currency profits and cash flows. Foreign exchange derivatives are used to manage foreign currency exposures in excess of $15m that are not covered by debt or assets in the same (or another highly correlated) currency, as long as it makes sense from an economic perspective to do so. The Treasury Committee monitors foreign exchange exposures on a monthly basis. Dealing in foreign exchange products is controlled by dealing mandates approved by the Treasury Committee and all foreign exchange transactions are covered by ISDA documentation.
The most significant foreign currency groups are euros and US dollars, which make up 50% and 35% of Group operating profit respectively.
F-52
At 31 December 2025 the Group’s net debt was approximately 69% US dollar (2024: 63%), 18% euro (2024: 26%) and 13% debt in other currencies, including pound sterling (2024: 11%). The translation of the interest element of euro and US dollar debt provides a partial income statement offset to the translation of earnings.
The Group calculates a hypothetical foreign exchange impact on the income statement and foreign currency translation of net investments in foreign subsidiaries for a 10% movement in foreign exchange rates. The Group’s principal foreign currency exposure is the euro. A 10% movement in €/$ would result in a $39m increase/decrease in operating profit and a $58m increase/decrease in other comprehensive income. The other comprehensive income impact also includes the offsetting impact from financial instruments used to hedge the retranslation of euro net investment in subsidiaries, which is $51m. Where possible, currency cash flows are used to settle liabilities in the same currency in preference to selling currency in the market.
The results of the sensitivity analysis should not be considered as projections of likely future events, gains or losses as actual results in the future may differ materially due to developments in the global financial markets which may cause fluctuations in exchange rates to vary from hypothetical amounts disclosed above.
Comparative figures to foreign exchange risk sensitivity are not disclosed in the Annual Report 2025. Due to the presentational currency change of the Group that is applied prospectively from 1 January 2025, it would not be practicable to compare the re-presented results of the data prior to the presentational currency change with the results of the sensitivity analysis for the Annual Report 2025.
Interest rate risk
The Group seeks to manage interest rate risk to ensure reasonable certainty of its interest charge while allowing an element of risk exposure consistent with the variability of its cash flows. Interest rate risk is managed by the use of fixed interest debt and interest rate derivatives, which are approved in advance by the Treasury Committee. The Group policy is to fix a minimum of 50% of its estimated future interest rate exposures (excluding pensions) for a minimum period of 12 months forward. The Treasury Committee reviews this exposure monthly.
A hypothetical 1.0% increase in euro interest rates would reduce the market value of the Group’s bond liabilities by $61m at 31 December 2025 (2024: $76m). The income statement impact is $nil as changes in interest rates do not change the expected cash flows on the bonds.
A hypothetical 1.0% increase in pound sterling interest rates would reduce the market value of the Group’s bond liabilities by $27m at 31 December 2025 (2024: $28m). The income statement impact is $nil (2024: $nil).
A hypothetical 1.0% increase in US dollar interest rates would reduce the market value of the Group’s bond liabilities by $63m at 31 December 2025 (2024: $nil). The income statement impact is $3m (2024: $3m) as certain leases are denominated in US dollars with floating interest rates. (Note that the $700m term loan was 37.5% hedged on a weighted average basis in 2024).
The Group had outstanding bond debt issues at 31 December 2025 with a fair market value of $4,814m (2024: $3,105m). This is above the book value of $4,748m (2024: $3,122m) as a result of decreases in interest rates in the UK, USA, and Europe. There are no circumstances where the Group would be obliged to pay the fair market value. The Group could however decide to redeem some or all of its bonds early and the fair market value is indicative of the price that would be required to do so.
(d) Capital risk
The Group is committed to maintaining a debt/equity structure that allows continued access to a broad range of financing sources and sufficient flexibility to pursue commercial opportunities as they present themselves, without onerous financing terms and conditions. The Group’s policy is to maintain a strong capital base so as to maintain investor, creditor, and market confidence and to support the Group’s strategy. The Group uses S&P’s and Fitch’s ratings methodologies for a BBB issuer to manage its capital risk. In the event that a ratings downgrade is likely, net debt can be managed by reducing or suspending dividends, M&A spend, and capital expenditure. The Group would also consider raising additional equity to protect its BBB rating.
F-53
(e) Treasury risk
The Group’s treasury activities are governed by a treasury policy, which is reviewed and approved by the Board on an annual basis. The treasury policy covers all activities associated with managing the above risks. The policy requires that financial instruments are only utilised to manage known financial exposures, and speculative derivative contracts are not entered into. The treasury policy requires that treasury must approve opening and closing of all bank accounts, and that funds transfers and other payments are only made in accordance with bank mandates.
To ensure an appropriate control environment exists in the treasury function, duties are segregated between front and back office teams. In addition, a number of controls are in place to protect against potential cyber security and other risks.
C2. Net debt
Net debt is used to assess the Group’s financial capacity. Net debt is not a measure defined by IFRS. Management defines net debt as the total of bank and other borrowings, lease liabilities, other investments, fair value of debt-related derivatives, and cash and cash equivalents (as presented in the Consolidated Balance Sheet).
Closing net debt comprises:
|
|
|
|
2025 |
|
2024 |
|
|
Notes |
|
$m |
|
$m |
Current |
|
|
|
|
|
|
Cash and cash equivalents in the Consolidated Balance Sheet |
|
C3 |
|
2,319 |
|
1,158 |
Other investments1 |
|
C4 |
|
2 |
|
1 |
Fair value of debt-related derivatives |
|
|
|
56 |
|
(3) |
Bank and other short-term borrowings2 |
|
|
|
(1,411) |
|
(1,460) |
Lease liabilities |
|
B4 |
|
(171) |
|
(163) |
Non-current |
|
|
|
|
|
|
Fair value of debt-related derivatives |
|
|
|
103 |
|
(29) |
Bank and other long-term borrowings3 |
|
|
|
(4,156) |
|
(3,127) |
Lease liabilities |
|
B4 |
|
(392) |
|
(394) |
Total net debt |
|
|
|
(3,650) |
|
(4,017) |
| 1. | Net debt excludes other investments which are non-cash, such as the investment in unlisted shares. |
| 2. | Bank and other short-term borrowings consists of $586m bond debt (2024: $nil), $730m overdraft (2024: $692m), $30m loans (2024: $720m), and $65m bond accruals (2024: $48m). |
| 3. | Bank and other long-term borrowings consists of $4,155m bond debt (2024: $3,122m) and $1m loans (2024: $5m). |
F-54
The currency split and cash flows of bank, other borrowings, and debt-related derivatives are as follows:
|
|
2025 |
|
2024 |
|
|
$m |
|
$m |
Pound sterling |
|
1,265 |
|
1,153 |
Euro |
|
1,243 |
|
1,093 |
US dollar |
|
2,860 |
|
2,362 |
Other currencies |
|
40 |
|
11 |
Carrying value |
|
5,408 |
|
4,619 |
Effect of discounting |
|
844 |
|
484 |
Undiscounted value |
|
6,252 |
|
5,103 |
Analysis of undiscounted cash flows of bank and other borrowings: |
|
|
|
|
Less than one year |
|
1,461 |
|
1,565 |
Between one and five years |
|
3,573 |
|
2,314 |
More than five years |
|
1,218 |
|
1,224 |
Future minimum payments |
|
6,252 |
|
5,103 |
Reconciliation of net change in cash and cash equivalents to net debt:
|
|
|
|
|
|
|
|
Non-cash |
|
Non-cash |
|
|
|
|
|
|
|
|
|
|
(fair value |
|
(foreign |
|
|
|
|
|
|
|
|
|
|
changes, |
|
exchange, |
|
|
|
|
|
|
Opening |
|
Cash |
|
accruals and |
|
additions |
|
Closing |
|
|
|
|
2025 |
|
flows |
|
acquisitions) |
|
and other) |
|
2025 |
|
|
Notes |
|
$m |
|
$m |
|
$m |
|
$m |
|
$m |
Bank and other short-term borrowings |
|
|
|
(1,460) |
|
700 |
|
(65) |
|
(586) |
|
(1,411) |
Bank and other long-term borrowings |
|
|
|
(3,127) |
|
(1,232) |
|
— |
|
203 |
|
(4,156) |
Lease liabilities |
|
B4 |
|
(557) |
|
223 |
|
(176) |
|
(53) |
|
(563) |
Other investments |
|
|
|
1 |
|
1 |
|
— |
|
— |
|
2 |
Fair value of debt-related derivatives |
|
|
|
(32) |
|
39 |
|
(58) |
|
210 |
|
159 |
Gross debt |
|
|
|
(5,175) |
|
(269) |
|
(299) |
|
(226) |
|
(5,969) |
Cash and cash equivalents in the Consolidated Balance Sheet |
|
|
|
1,158 |
|
1,161 |
|
— |
|
— |
|
2,319 |
Net debt |
|
|
|
(4,017) |
|
892 |
|
(299) |
|
(226) |
|
(3,650) |
|
|
|
|
|
|
|
|
Non-cash |
|
Non-cash |
|
|
|
|
|
|
|
|
|
|
(fair value |
|
(foreign |
|
|
|
|
|
|
|
|
|
|
changes, |
|
exchange, |
|
|
|
|
|
|
Opening |
|
Cash |
|
accruals and |
|
additions |
|
Closing |
|
|
|
|
2024 |
|
flows |
|
acquisitions) |
|
and other) |
|
2024 |
|
|
Notes |
|
$m |
|
$m |
|
$m |
|
$m |
|
$m |
Bank and other short-term borrowings |
|
|
|
(1,444) |
|
769 |
|
(126) |
|
(659) |
|
(1,460) |
Bank and other long-term borrowings |
|
|
|
(4,016) |
|
— |
|
— |
|
889 |
|
(3,127) |
Lease liabilities |
|
B4 |
|
(567) |
|
216 |
|
(186) |
|
(20) |
|
(557) |
Other investments |
|
|
|
1 |
|
— |
|
— |
|
(0) |
|
1 |
Fair value of debt-related derivatives |
|
|
|
29 |
|
87 |
|
(9) |
|
(139) |
|
(32) |
Gross debt |
|
|
|
(5,997) |
|
1,072 |
|
(321) |
|
71 |
|
(5,175) |
Cash and cash equivalents in the Consolidated Balance Sheet |
|
|
|
1,989 |
|
(814) |
|
— |
|
(17) |
|
1,158 |
Net debt |
|
|
|
(4,008) |
|
258 |
|
(321) |
|
54 |
|
(4,017) |
F-55
Included within the net decrease in cash and cash equivalents is $9m (2024: $11m) cash paid on debt-related foreign exchange forward contracts (which is included within financing activities in the Consolidated Cash Flow Statement).
The total cash inflow in borrowings of $532m (2024: $464m outflow) includes $1,232m proceeds from new debt (included in financing activities) (2024:$nil) and $700m debt repayment (included in financing activities) (2024: $464m).
The derivatives cash outflow of $39m (2024: $85m outflow) includes $9m (2024: $49m outflow) of cash paid on debt-related foreign exchange swaps (included in financing activities) and $30m (2024: $36m) interest paid (included in operating activities).
The cash outflow of $223m from lease liabilities (2024: $216m) includes $192m (2024: $185m) capital paid (included within financing activities) and $31m (2024: $31m) interest paid (included in operating activities).
Fair value is equal to carrying value for all elements of net debt with the exception of bond debt which has a carrying value of $4,748m (2024: $3,122m) and a fair value of $4,814m (2024: $3,105m).
The Group operates notional pooling arrangements whereby cash balances and overdrafts held within the same bank have a legal right of offset. Derivative financial instruments held with the same bank and have a legal right to offset are shown net. The following table shows the effect of offsetting in the balance sheet due to financial instruments subject to enforceable netting arrangements:
|
|
|
|
|
|
|
|
|
|
Amount |
|
|
|
|
|
|
|
|
Gross |
|
|
|
subject to |
|
|
|
|
|
|
|
|
amounts set |
|
Net amounts |
|
master |
|
|
|
|
|
|
Gross |
|
off in the |
|
presented in the |
|
netting |
|
|
|
|
|
|
amount |
|
balance sheet |
|
balance sheet |
|
arrangement |
|
Net amount |
|
|
|
|
2025 |
|
2025 |
|
2025 |
|
2025 |
|
2025 |
|
|
Notes |
|
$m |
|
$m |
|
$m |
|
$m |
|
$m |
Financial assets |
|
|
|
|
|
|
|
|
|
|
|
|
Cash and cash equivalents |
|
C3 |
|
2,319 |
|
— |
|
2,319 |
|
(730) |
|
1,589 |
Trade and other receivables1 |
|
A3 |
|
1,119 |
|
— |
|
1,119 |
|
— |
|
1,119 |
Other financial assets |
|
C4 |
|
2 |
|
— |
|
2 |
|
— |
|
2 |
Derivative financial instruments |
|
C6 |
|
182 |
|
— |
|
182 |
|
(21) |
|
161 |
Total |
|
|
|
3,622 |
|
— |
|
3,622 |
|
(751) |
|
2,871 |
Financial liabilities |
|
|
|
|
|
|
|
|
|
|
|
|
Trade and other payables2 |
|
A5 |
|
(1,037) |
|
— |
|
(1,037) |
|
— |
|
(1,037) |
Borrowings |
|
C2 |
|
(5,567) |
|
— |
|
(5,567) |
|
730 |
|
(4,837) |
Lease liabilities |
|
B4 |
|
(563) |
|
— |
|
(563) |
|
— |
|
(563) |
Derivative financial instruments |
|
C6 |
|
(23) |
|
— |
|
(23) |
|
21 |
|
(2) |
Total |
|
|
|
(7,190) |
|
— |
|
(7,190) |
|
751 |
|
(6,439) |
F-56
|
|
|
|
|
|
|
|
|
|
Amount |
|
|
|
|
|
|
|
|
Gross |
|
|
|
subject to |
|
|
|
|
|
|
|
|
amounts set |
|
Net amounts |
|
master |
|
|
|
|
|
|
Gross |
|
off in the |
|
presented in the |
|
netting |
|
|
|
|
|
|
amount |
|
balance sheet |
|
balance sheet |
|
arrangement |
|
Net amount |
|
|
|
|
2024 |
|
2024 |
|
2024 |
|
2024 |
|
2024 |
|
|
Notes |
|
$m |
|
$m |
|
$m |
|
$m |
|
$m |
Financial assets |
|
|
|
|
|
|
|
|
|
|
|
|
Cash and cash equivalents |
|
C3 |
|
1,158 |
|
— |
|
1,158 |
|
(691) |
|
467 |
Trade and other receivables1 |
|
A3 |
|
1,112 |
|
— |
|
1,112 |
|
— |
|
1,112 |
Other financial assets |
|
C4 |
|
1 |
|
— |
|
1 |
|
— |
|
1 |
Derivative financial instruments |
|
C6 |
|
8 |
|
— |
|
8 |
|
(2) |
|
6 |
Total |
|
|
|
2,278 |
|
— |
|
2,278 |
|
(693) |
|
1,585 |
Financial liabilities |
|
|
|
|
|
|
|
|
|
|
|
|
Trade and other payables2 |
|
A5 |
|
(1,060) |
|
— |
|
(1,060) |
|
— |
|
(1,060) |
Borrowings |
|
C2 |
|
(4,587) |
|
— |
|
(4,587) |
|
691 |
|
(3,896) |
Lease liabilities |
|
B4 |
|
(557) |
|
— |
|
(557) |
|
— |
|
(557) |
Derivative financial instruments |
|
C6 |
|
(40) |
|
— |
|
(40) |
|
2 |
|
(38) |
Total |
|
|
|
(6,244) |
|
— |
|
(6,244) |
|
693 |
|
(5,551) |
| 1. | Trade and other receivables exclude prepayments of $84m (2024: $96m). |
| 2. | Trade and other payables exclude social security and other taxes of $109m (2024: $114m) and contract liabilities of $292m (2024: $312m). |
C3. Cash and cash equivalents
Cash and cash equivalents include cash in hand, short-term bank deposits, and other short-term, highly liquid investments with original maturities of three months or less (and subject to insignificant changes in value). In the cash flow statement, cash and cash equivalents are shown net of bank overdrafts. Bank overdrafts are shown within borrowings in current liabilities on the balance sheet.
Cash at bank and in hand includes $25m (2024: $20m) of restricted cash. This cash is held in respect of specific contracts and can only be utilised in line with terms under the contractual arrangements.
Cash at bank and in hand also includes $99m (2024: $89m) of cash held in countries with foreign exchange regulations. This cash is repatriated to the UK where possible, if not required for operational purposes in country.
Fair value is equal to carrying value for all cash and cash equivalents.
|
|
Gross amounts |
|
Gross amounts |
|
|
2025 |
|
2024 |
|
|
$m |
|
$m |
Cash at bank and in hand |
|
1,390 |
|
997 |
Money market funds |
|
144 |
|
30 |
Short-term bank deposits |
|
785 |
|
131 |
Cash and cash equivalents in the Consolidated Balance Sheet |
|
2,319 |
|
1,158 |
Bank overdraft |
|
(730) |
|
(691) |
Cash and cash equivalents in the Consolidated Cash Flow Statement |
|
1,589 |
|
467 |
As far as it is practical to do so, cash balances are held centrally and are used first to repay borrowings under the Group’s banking facilities before being placed on deposit.
F-57
C4. Other investments
Other investments held at year end mainly comprised investments in unlisted shares in a joint venture based in the Cayman Islands and term deposits maturing in more than three months from the date that the deposit was placed. The weighted average effective interest rate earned is 4.2% (2024: 6.3%), with $nil fixed for six months (2024: $1m) and $2m fixed for six months to one year (2024: $1m). Fair value is equal to carrying value for all other investments.
Financial assets are denominated in the following currencies:
|
|
2025 |
|
2024 |
|
|
$m |
|
$m |
Pound sterling |
|
2 |
|
1 |
Other |
|
25 |
|
26 |
|
|
27 |
|
27 |
Analysed as follows: |
|
|
|
|
Current portion |
|
2 |
|
1 |
Non-current portion |
|
25 |
|
26 |
|
|
27 |
|
27 |
None of the financial assets are either past due or impaired in 2025 (2024: none).
C5. Derivative financial instruments
Accounting for derivative financial instruments and hedging activities
Derivatives are initially recognised at fair value on the date a derivative contract is entered into and are subsequently remeasured at their fair value at the balance sheet date. The method of recognising the resulting gain or loss depends on whether the derivative is designated as a hedging instrument and, if so, the nature of the item being hedged. At the inception of the transaction, the Group documents the relationship between hedging instruments and hedged items, as well as its risk management objective and strategy for undertaking various hedge transactions. The Group also documents its assessment, both at hedge inception and on an ongoing basis, of whether the derivatives that are used in hedging transactions are effective in offsetting changes in fair values of hedged items.
Certain financial instruments are not designated or do not qualify for hedge accounting. Typically the Group will not designate financial instruments for hedge accounting where a perfect or near perfect offset is expected between the change in value of assets and liabilities. Changes in the fair value of any derivative instruments in this category are immediately recognised in the income statement. Where financial instruments are designated for hedge accounting they are designated as either fair value hedge, net investment hedge, or cash flow hedge. When designating cross-currency swaps, the cost of hedging has been excluded from the relationship and any movement in the fair value related to the cost of hedging is deferred in equity and amortised over the life of the hedged item.
(a) Fair value hedge
These instruments are used to hedge exposure to changes in the fair value of recognised assets or liabilities. Changes in the fair value of derivatives that are designated and qualify as fair value hedges are recognised in the income statement, together with any changes in the fair value of the hedged asset or liability that are attributable to the hedged risk. There were two fair value hedges as at the year end date (2024: nil).
The following fair value hedges were designated in June 2025 and remain in place as at 31 December 2025:
€600m bond (maturity June 2030) and £400m bond (maturity June 2032); the notional value of the hedging instruments designated equals the notional of the hedged items, therefore the hedge ratio is considered to be 1:1. The carrying amount of the hedged items is included within borrowings in the Consolidated Balance Sheet.
F-58
The fair value loss on the derivative recognised in the income statement during the year amounted to $5m; this is offset by the gain on the fair value of the hedged items of $7m, resulting in a net fair value hedge gain of $2m.
(b) Net investment hedge
These instruments are used to hedge exposure on translation of net investments in foreign operations. Any gain or loss on the hedging instrument related to the effective portion of the hedge is recognised in other comprehensive income; the gain or loss related to the ineffective portion is recognised immediately in the income statement. In the event of disposal of a foreign operation, the gains and losses accumulated in other comprehensive income are recycled through the income statement. All currencies are directly hedged, therefore the hedge ratio is considered to be 1:1.
The Group expects that the values of the hedged item and hedging instrument will move in opposite directions in response to movements in the same hedged risk. Where there are sufficient levels of denominated net assets, the critical terms are deemed to match.
The following net investment hedges were in place at 31 December 2025:
US dollar net investment hedge relationship: $1,627m (2024: $1,627m) cross-currency swaps notional, $nil (2024: $547m) loan notional and $85m (2024: $137m) cross-currency swaps future interest cash flows have been used to hedge $1,712m (2024: $2,310m) of the net assets of the US operating subsidiaries. The movement in the cross-currency swaps due to changes in $/£ exchange rates are in the opposite direction of the changes due to $/£ in the subsidiaries assets. As the critical terms match, their values will systematically change in the opposite direction of each other. Thus we consider that this demonstrates the existence of an economic relationship.
Euro net investment hedge relationship: €434m (2024: €315m) bonds are used to hedge the net assets of the euro operating subsidiaries totalling €434m (2024: €315m). The movement in the bonds due to changes in €/£ exchange rates are in the opposite direction of the changes due to €/£ in the subsidiaries assets. As the critical terms match, their values will systematically change in the opposite direction of each other. Thus we consider that this demonstrates the existence of an economic relationship.
Japanese yen (JPY) net investment hedge relationship: JPY2,000m (2024: JPY2,000m) cross-currency swap notional and JPY55m (2024: JPY55m) cross-currency swaps future interest cash outflows have been used to hedge JPY2,055m (2024: JPY2,055m) of the net assets of the Japanese associate. The movement in the cross-currency swaps due to changes in JPY/GBP exchange rates are in the opposite direction of the changes due to JPY/GBP in the associate’s assets. As the critical terms match, their values will systematically change in the opposite direction of each other. Thus we consider that this demonstrates the existence of an economic relationship.
During the year there was no gain or loss (2024: $nil) relating to ineffectiveness of net investment in foreign entity hedges. The main source of ineffectiveness of the net investment hedge is the off-market value of the cross-currency swaps used to hedge US dollar net assets at the hedge designation date. Ineffectiveness due to changes in the counterparty credit risk was not material in the year and is expected to remain so due to the Group’s policy of only using counterparties with a credit rating of A- and above.
For the year ended 31 December 2025, the amount in other comprehensive income related to net investment hedge accounting was a gain of $129m (2024: $22m loss; 2023: $136m gain).
F-59
The effect of the foreign currency-related hedging instruments on the Group’s financial position and performance is shown in the table below:
|
|
2025 |
||||||||||||||||
|
|
|
|
|
|
|
|
|
|
|
|
|
|
|
|
|
|
Weighted |
|
|
|
|
Carrying |
|
|
|
|
|
|
|
Change in |
|
|
|
|
|
average |
|
|
|
|
amount |
|
|
|
|
|
|
|
fair value of |
|
Change in |
|
|
|
hedged |
|
|
|
|
at year |
|
Notional |
|
|
|
|
|
outstanding |
|
fair value of |
|
|
|
foreign |
|
|
|
|
end date |
|
amount |
|
|
|
Hedge |
|
instrument |
|
hedged item |
|
Ineffectiveness |
|
exchange |
Hedging instruments |
|
Currency |
|
$m |
|
$m |
|
Maturity date |
|
ratio |
|
$m |
|
$m |
|
$m |
|
raete |
Cross-currency swaps |
|
USD |
|
133 |
|
(1,627) |
|
May 2026 – October 2028 |
|
1:1 |
|
127 |
|
127 |
|
— |
|
1.266 |
Cross-currency swaps |
|
JPY |
|
1 |
|
(13) |
|
June 2027 |
|
1:1 |
|
1 |
|
1 |
|
— |
|
197.620 |
Bonds |
|
EUR |
|
(518) |
|
(509) |
|
June 2027 – June 2030 |
|
1:1 |
|
(22) |
|
(22) |
|
— |
|
1.162 |
|
|
2024 |
||||||||||||||||
|
|
|
|
|
|
|
|
|
|
|
|
|
|
|
|
|
|
Weighted |
|
|
|
|
Carrying |
|
|
|
|
|
|
|
Change in |
|
|
|
|
|
average |
|
|
|
|
amount |
|
|
|
|
|
|
|
fair value of |
|
Change in |
|
|
|
hedged |
|
|
|
|
at year |
|
Notional |
|
|
|
|
|
outstanding |
|
fair value of |
|
|
|
foreign |
|
|
|
|
end date |
|
amount |
|
|
|
Hedge |
|
instrument |
|
hedged item |
|
Ineffectiveness |
|
exchange |
Hedging instruments |
|
Currency |
|
$m |
|
$m |
|
Maturity date |
|
ratio |
|
$m |
|
$m |
|
$m |
|
raete |
Cross-currency swaps |
|
USD |
|
6 |
|
(1,627) |
|
May 2026 – October 2028 |
|
1:1 |
|
(6) |
|
(6) |
|
— |
|
1.241 |
Cross-currency swaps |
|
JPY |
|
— |
|
(13) |
|
June 2027 |
|
1:1 |
|
(1) |
|
(1) |
|
— |
|
169.747 |
Bonds |
|
EUR |
|
(327) |
|
(327) |
|
June 2027 – June 2030 |
|
1:1 |
|
20 |
|
20 |
|
— |
|
1.162 |
Term loan |
|
USD |
|
(547) |
|
(547) |
|
October 2025 |
|
1:1 |
|
8 |
|
8 |
|
— |
|
1.110 |
The change in fair value of the outstanding hedging instrument differs from the amount recognised in other comprehensive income during the year due to the impact of currency basis (excluded from the hedge relationship) and the foreign exchange impact of realised interest on the hedging instrument (not reflected in the fair value change).
(c) Cash flow hedge
These instruments are used to hedge a highly probable forecast transaction, or a change in the cash flows of a recognised asset or liability. The portion of the gain or loss on the hedging instrument relating to the effective portion of the hedge is recognised in other comprehensive income. Any ineffective portion is immediately recognised in the income statement. The gains or losses that are recognised in other comprehensive income are transferred to the income statement in the same period in which the hedged cash flows affect the income statement. In the event that the hedged item occurs or is no longer expected to occur, accumulated gains or losses held in the cash flow hedge reserve are immediately recognised in the income statement. In the event that the hedged item is expected to occur but no longer meets the requirements of hedge accounting, accumulated gains or losses remain in other comprehensive income and are only recognised in the income statement when the forecast transaction occurs or is no longer expected to occur. All cash flow hedge relationships are hedges of a foreign currency risk and all currencies were directly hedged, therefore the hedge ratio is considered to be 1:1.
Cash flow hedge accounting has been applied to derivatives (marked as ‘cash flow hedge’) in the table on page 188 in accordance with IFRS 9. Where no hedge accounting has been applied, related derivatives have been marked as ‘non-hedge’.
The hedged item, a euro bond, creates an exposure to pay interest annually and the principal at maturity. By receiving the same amount at the same dates through a cross-currency swap, this exposure is eliminated. Since the critical terms of the derivative and the hedged debt match (i.e. matching currencies, payment dates, and interest rate on the leg of the swap offsetting the bond), the change in value of the derivative, excluding any basis risk, will be considered to completely offset the changes in the hedged cash flow.
Any ineffectiveness on the cash flow hedge is taken directly to finance costs. During the year there was nil ineffectiveness (2024: $2m gain) from those derivatives in a cash flow hedge relationship. Ineffectiveness due to changes in the counterparty credit risk was not material in the year and is expected to remain the same because the Group’s counterparties credit rating is A- and above.
F-60
Cash flow hedge accounting has been applied to €500m (2024: €500m) of the €500m 2026 bond, €421m (2024: €421m) of the €850m 2027 bond and €600m (2024: €600m) of the €600m 2028 bond. The cross-currency interest rate swaps are used as hedging instruments to hedge the volatility in the £/€ exchange rate of the bonds. Partial cash flow hedge accounting (to June 2028) has also been applied to €600m (2024: nil) of the €600m 2030 bond and £400m (2024: nil) of the £400m 2032 bond. The interest rate swaps are used as hedging instruments to hedge the volatility in floating rate interest rates associated to swaps directly hedging the bond coupon payments. For the year ended 31 December 2025, the amount in other comprehensive income related to cash flow hedge accounting was a loss of $31m (2024: $35m gain; 2023: $4m gain).
The effect of the foreign currency related hedging instruments on the Group’s financial position and performance is shown in the table below:
|
|
2025 |
||||||||||||||||
|
|
|
|
|
|
|
|
|
|
|
|
|
|
|
|
|
|
Weighted |
|
|
|
|
Carrying |
|
|
|
|
|
|
|
Change in |
|
Change in |
|
|
|
average |
|
|
|
|
amount |
|
|
|
|
|
|
|
fair value of |
|
fair value of |
|
|
|
hedged |
|
|
|
|
at year |
|
Notional |
|
|
|
|
|
outstanding |
|
hedged |
|
|
|
foreign |
|
|
|
|
end date |
|
amount |
|
|
|
|
|
instrument |
|
item |
|
Ineffectiveness |
|
exchange |
Hedging instruments |
|
Currency |
|
$m |
|
$m |
|
Maturity date |
|
Hedge ratio |
|
$m |
|
$m |
|
$m |
|
rate |
Cross-currency swaps |
|
EUR |
|
25 |
|
1,785 |
|
May 2026 – October 2028 |
|
1:1 |
|
61 |
|
61 |
|
— |
|
1.150 |
|
|
2024 |
||||||||||||||||
|
|
|
|
|
|
|
|
|
|
|
|
|
|
|
|
|
|
Weighted |
|
|
|
|
Carrying |
|
|
|
|
|
|
|
Change in |
|
Change in |
|
|
|
average |
|
|
|
|
amount |
|
|
|
|
|
|
|
fair value of |
|
fair value of |
|
|
|
hedged |
|
|
|
|
at year |
|
Notional |
|
|
|
|
|
outstanding |
|
hedged |
|
|
|
foreign |
|
|
|
|
end date |
|
amount |
|
|
|
|
|
instrument |
|
item |
|
Ineffectiveness |
|
exchange |
Hedging instruments |
|
Currency |
|
$m |
|
$m |
|
Maturity date |
|
Hedge ratio |
|
$m |
|
$m |
|
$m |
|
rate |
Cross-currency swaps |
|
EUR |
|
(34) |
|
1,574 |
|
May 2026 – October 2028 |
|
1:1 |
|
(50) |
|
(47) |
|
(3) |
|
1.133 |
Amount in cash flow hedge reserves related to continuing hedges is a gain of $12m (2024: $44m gain; 2023: $8m gain), and the amount related to discontinued hedges is $nil (2024: $nil; 2023: $nil).
The change in fair value of the outstanding hedging instrument differs from the amount recognised in other comprehensive income during the year due to the impact of currency basis (excluded from the hedge relationship) and the spot retranslation element of the fair value movement (which offsets the hedged item in the income statement).
F-61
C6. Fair value estimation
All financial instruments held at fair value are classified by reference to the source of inputs used to derive the fair value. The following hierarchy is used:
Level 1 — unadjusted quoted prices in active markets for identical assets or liabilities;
Level 2 — inputs other than quoted prices that are observable for the asset or liability, either directly as prices or indirectly through modelling based on prices; and
Level 3 — inputs for the asset or liability that are not based on observable market data.
Financial instrument |
|
Hierarchy level |
|
Valuation method |
Financial assets traded in active markets |
|
1 |
|
Current bid price |
Financial liabilities traded in active markets |
|
1 |
|
Current ask price |
Listed bonds |
|
1 |
|
Quoted market prices |
Money market funds |
|
1 |
|
Quoted market prices |
Interest rate/currency swaps |
|
2 |
|
Discounted cash flow based on market swap rates |
Forward foreign exchange contracts |
|
2 |
|
Forward exchange market rates |
Borrowings not traded in active markets (term loans and uncommitted facilities) |
|
2 |
|
Nominal value |
Money market deposits |
|
2 |
|
Nominal value |
Trade payables and receivables |
|
2 |
|
Nominal value less estimated credit adjustments |
Contingent consideration (including put option liability) |
|
3 |
|
Discounted cash flow using weighted average cost of capital |
|
|
Fair value |
|
Fair value |
|
Fair value |
|
Fair value |
|
|
assets |
|
liabilities |
|
assets |
|
liabilities |
|
|
2025 |
|
2025 |
|
2024 |
|
2024 |
|
|
$m |
|
$m |
|
$m |
|
$m |
Cross currency interest rate swaps and interest rate swaps (level 2): |
|
|
|
|
|
|
|
|
– net investment hedge |
|
144 |
|
(10) |
|
29 |
|
(23) |
– cash flow hedge |
|
29 |
|
(7) |
|
1 |
|
(35) |
– fair value hedge |
|
4 |
|
(6) |
|
— |
|
— |
Foreign exchange swaps (level 2): |
|
|
|
|
|
|
|
|
– non-hedge |
|
5 |
|
— |
|
— |
|
(4) |
|
|
182 |
|
(23) |
|
30 |
|
(62) |
Analysed as follows: |
|
|
|
|
|
|
|
|
Current portion |
|
61 |
|
(5) |
|
— |
|
(4) |
Non-current portion |
|
121 |
|
(18) |
|
30 |
|
(58) |
Derivative financial instruments |
|
182 |
|
(23) |
|
30 |
|
(62) |
Contingent consideration (including put option liability) (level 3) |
|
— |
|
(70) |
|
— |
|
(94) |
Analysed as follows: |
|
|
|
|
|
|
|
|
Current portion |
|
— |
|
(49) |
|
— |
|
(47) |
Non-current portion |
|
— |
|
(21) |
|
— |
|
(47) |
Other payables |
|
— |
|
(70) |
|
— |
|
(94) |
Certain interest rate swaps have been bifurcated to manage different foreign exchange risks. The interest rate swaps are shown on the balance sheet as net derivative assets of $182m (2024: $8m) and net derivative liabilities of $22m (2024: $40m).
Given the volume of acquisitions and the variety of inputs to the valuation of contingent consideration (depending on each transaction), there are not considered to be any changes in input that would have a material impact on the contingent consideration liability.
F-62
|
|
Contingent |
|
Contingent |
|
|
consideration |
|
consideration |
|
|
2025 |
|
2024 |
|
|
$m |
|
$m |
At 1 January |
|
94 |
|
97 |
Exchange differences |
|
7 |
|
(3) |
Acquisitions |
|
13 |
|
39 |
Payments |
|
(17) |
|
(32) |
Unused amount reversed |
|
(25) |
|
(9) |
Revaluation of put option |
|
(2) |
|
2 |
At 31 December |
|
70 |
|
94 |
Fair value is equal to carrying value for all other trade and other payables.
F-63
The table below analyses the Group’s undiscounted cash flows on borrowings and derivative financial instruments that will be settled on a gross basis, into relevant maturity groupings based on the remaining period to the contractual maturity date at the balance sheet date.
|
|
Less than |
|
Between |
|
More than |
|
|
|
|
1 year |
|
1 and 5 years |
|
5 years |
|
Total |
|
|
$m |
|
$m |
|
$m |
|
$m |
At 31 December 2025 |
|
|
|
|
|
|
|
|
Non-derivative financial instruments |
|
|
|
|
|
|
|
|
Borrowings |
|
(1,518) |
|
(3,676) |
|
(1,217) |
|
(6,411) |
|
|
(1,518) |
|
(3,676) |
|
(1,217) |
|
(6,411) |
Derivative financial instruments |
|
|
|
|
|
|
|
|
Cross-currency interest rate swaps: |
|
|
|
|
|
|
|
|
– outflow |
|
(802) |
|
(1,349) |
|
— |
|
(2,151) |
– inflow |
|
836 |
|
1,444 |
|
— |
|
2,280 |
Interest rate swaps: |
|
|
|
|
|
|
|
|
– outflow |
|
(3) |
|
(7) |
|
— |
|
(10) |
– inflow |
|
— |
|
— |
|
8 |
|
8 |
Foreign exchange swaps: |
|
|
|
|
|
|
|
|
– outflow |
|
(284) |
|
— |
|
— |
|
(284) |
– inflow |
|
289 |
|
— |
|
— |
|
289 |
Foreign exchange forwards: |
|
|
|
|
|
|
|
|
– outflow |
|
(48) |
|
— |
|
— |
|
(48) |
– inflow |
|
48 |
|
— |
|
— |
|
48 |
|
|
35 |
|
88 |
|
8 |
|
131 |
Net outflow |
|
(1,483) |
|
(3,588) |
|
(1,209) |
|
(6,280) |
At 31 December 2024 |
|
|
|
|
|
|
|
|
Non-derivative financial instruments |
|
|
|
|
|
|
|
|
Borrowings |
|
(1,534) |
|
(2,314) |
|
(1,224) |
|
(5,072) |
|
|
(1,534) |
|
(2,314) |
|
(1,224) |
|
(5,072) |
Derivative financial instruments |
|
|
|
|
|
|
|
|
Cross-currency interest rate swaps: |
|
|
|
|
|
|
|
|
– outflow |
|
(59) |
|
(2,122) |
|
— |
|
(2,181) |
– inflow |
|
31 |
|
2,032 |
|
— |
|
2,063 |
Interest rate swaps: |
|
|
|
|
|
|
|
|
– outflow |
|
— |
|
— |
|
— |
|
— |
– inflow |
|
— |
|
— |
|
— |
|
— |
Foreign exchange swaps: |
|
|
|
|
|
|
|
|
– outflow |
|
(455) |
|
— |
|
— |
|
(455) |
– inflow |
|
451 |
|
— |
|
— |
|
451 |
Foreign exchange forwards: |
|
|
|
|
|
|
|
|
– outflow |
|
(13) |
|
— |
|
— |
|
(13) |
– inflow |
|
13 |
|
— |
|
— |
|
13 |
|
|
(32) |
|
(90) |
|
— |
|
(122) |
Net outflow |
|
(1,566) |
|
(2,404) |
|
(1,224) |
|
(5,194) |
F-64
C7. Analysis of bank and bond debt
Borrowings are recognised initially at fair value, net of transaction costs incurred. Borrowings are classified as current liabilities unless the Group has a continuing right to defer settlement of the liability for at least 12 months after the balance sheet date.
The Group’s bank debt facilities comprise:
|
|
Facility |
|
Drawn at |
|
|
|
Interest rate |
|
Facility |
|
Drawn at |
|
|
|
Interest rate |
|
|
amount |
|
year end |
|
Headroom |
|
at year end |
|
amount |
|
year end |
|
Headroom |
|
at year end |
|
|
2025 |
|
2025 |
|
2025 |
|
2025 |
|
2024 |
|
2024 |
|
2024 |
|
2024 |
|
|
$m |
|
$m |
|
$m |
|
% |
|
$m |
|
$m |
|
$m |
|
% |
Current |
|
|
|
|
|
|
|
|
|
|
|
|
|
|
|
|
$700m term Loan due October 2025 (repaid April 2025) |
|
— |
|
— |
|
— |
|
— |
|
700 |
|
700 |
|
— |
|
5.18 |
$50m term loan due May 2025 (ended April 2025) |
|
— |
|
— |
|
— |
|
— |
|
50 |
|
— |
|
50 |
|
0.21 |
Non-current |
|
|
|
|
|
|
|
|
|
|
|
|
|
|
|
|
$1.0bn RCF due October 2029 |
|
1,000 |
|
— |
|
1,000 |
|
0.14 |
|
1,000 |
|
— |
|
1,000 |
|
0.14 |
During April 2025, the Group fully repaid the $700m term loan with proceeds from new bonds (totalling $1.25bn) issued and terminated the $50m term loan.
The Revolving Credit Facility (RCF) remained undrawn throughout 2024 and 2025. There are no financial covenants associated with the RCF or any other debt facility.
Medium-term notes and bond debt comprises:
|
|
Bond interest |
|
Effective hedged |
|
Bond interest |
|
Effective hedged |
|
|
|
coupon |
|
interest rate |
|
coupon |
|
interest rate |
|
|
|
2025 |
|
2025 |
|
2024 |
|
2024 |
|
Current |
|
|
|
|
|
|
|
|
|
€500m bond due May 2026 |
|
Fixed 0.875 |
% |
Fixed 2.73 |
% |
Fixed 0.875 |
% |
Fixed 2.72 |
% |
Non-current |
|
|
|
|
|
|
|
|
|
€850m bond due June 2027 |
|
Fixed 3.875 |
% |
Fixed 4.81 |
% |
Fixed 3.875 |
% |
Fixed 5.05 |
% |
€600m bond due October 2028 |
|
Fixed 0.500 |
% |
Fixed 2.17 |
% |
Fixed 0.500 |
% |
Fixed 2.17 |
% |
€600m bond due June 20301 |
|
Fixed 4.375 |
% |
Fixed 4.55 |
% |
Fixed 4.375 |
% |
Fixed 4.67 |
% |
£400m bond due June 20321 |
|
Fixed 5.000 |
% |
Fixed 5.35 |
% |
Fixed 5.000 |
% |
Fixed 5.30 |
% |
$750m bond due April 20302 |
|
Fixed 5.000 |
% |
Fixed 5.20 |
% |
— |
|
— |
|
$500m bond due April 20352 |
|
Fixed 5.625 |
% |
Fixed 5.73 |
% |
— |
|
— |
|
Average cost of bond debt at year-end rates |
|
|
|
4.38 |
% |
|
|
4.16 |
% |
| 1. | Bonds not in hedging relationship in 2024. |
| 2. | Bonds not in hedging relationship in 2025. |
During April 2025, the Group issued two new bonds totalling $1.25bn, consisting of $750m due 2030 and $500m due 2035. Part of the proceeds was used to settle the $700m term loan.
On 2 March 2026, Rentokil Initial plc redeemed in full the €500m 0.8750% Senior Unsecured Notes due 30 May 2026, at their principal amount together with accrued interest. The redemption was carried out in accordance with the terms and conditions of the notes.
The effective hedged interest rate reflects the interest rate payable after the impact of interest due from cross-currency swaps. The Group’s hedging strategy is to hold foreign currency debt in proportion to foreign currency profit and cash flows, which are mainly in euro and US dollar. As a result, the Group has swapped a portion of the bonds it has issued into US dollars, thus increasing the effective hedged interest rate.
F-65
The Group considers the fair value of other current liabilities to be equal to the carrying value.
C8. Finance cost
|
|
|
|
2025 |
|
2024 |
|
2023 |
|
|
Note |
|
$m |
|
$m |
|
$m |
Hedged interest payable on medium-term notes issued1 |
|
|
|
127 |
|
77 |
|
76 |
Interest payable on bank loans and overdrafts1 |
|
|
|
27 |
|
64 |
|
50 |
Interest payable on RCF1 |
|
|
|
2 |
|
1 |
|
4 |
Interest payable on foreign exchange swaps2 |
|
|
|
50 |
|
56 |
|
54 |
Interest payable on leases |
|
B4 |
|
31 |
|
31 |
|
30 |
Amortisation of discount on provisions |
|
A6 |
|
13 |
|
14 |
|
18 |
Foreign exchange loss on translation of foreign assets/liabilities |
|
|
|
— |
|
7 |
|
— |
Total finance cost |
|
|
|
250 |
|
250 |
|
232 |
1. |
Interest expense on financial liabilities held at amortised cost. |
2. |
Interest payable on foreign exchange swaps including coupon interest payable for the year was $56m (2024: $69m). $6m has been reported in other comprehensive income due to hedge accounting (2024: $13m). |
C9. Finance income
|
|
2025 |
|
2024 |
|
2023 |
|
|
$m |
|
$m |
|
$m |
Bank interest received |
|
31 |
|
46 |
|
31 |
Fair value gain on hedge ineffectiveness |
|
2 |
|
4 |
|
3 |
Foreign exchange gain on translation of foreign assets/liabilities |
|
10 |
|
— |
|
12 |
Hyperinflation accounting adjustment |
|
3 |
|
9 |
|
14 |
Total finance income |
|
46 |
|
59 |
|
60 |
D. Other
D1. Dividends
Dividend distribution to the Company’s shareholders is recognised as a liability in the Consolidated Financial Statements in the period in which the dividends are approved by the Company’s shareholders. Interim dividends are recognised when paid.
|
|
2025 |
|
2024 |
|
2023 |
|
|
$m |
|
$m |
|
$m |
2022 final dividend paid – 6.50 cents per share 1 |
|
— |
|
— |
|
165 |
2023 interim dividend paid – 3.44 cents per share 2 |
|
— |
|
— |
|
87 |
2023 final dividend paid – 7.41 cents per share 1 |
|
— |
|
186 |
|
— |
2024 interim dividend paid – 4.15 cents per share 2 |
|
— |
|
106 |
|
— |
2024 final dividend paid – 7.91 cents per share 1 |
|
198 |
|
— |
|
— |
2025 interim dividend paid – 4.15 cents per share |
|
106 |
|
— |
|
— |
|
|
304 |
|
292 |
|
252 |
1. |
Represented at exchange rate prevailing at AGM’s date (2024: 5.93 pence per share; 2023: 5.93 pence per share). |
2.Represented at exchange rate prevailing at date of announcement (2024: 3.16 pence per share; 2023: 2.75 pence per share).
An interim dividend of 4.15 cents per share was paid on 22 September 2025, amounting to $106m. A final dividend in respect of 2025 of 8.24 cents per share is to be proposed at the Annual General Meeting on 7 May 2026.
F-66
The aggregate amount of the proposed dividend to be paid out of retained earnings at 31 December 2025, but not recognised as a liability at year end, is $208m (2024: $198m; 2023: $186m).
D2. Share capital
The Company’s share capital is made up of the shares that have been issued to its members, whether on, or subsequent to, its incorporation. At the year end, the Company’s issued share capital consisted of ordinary shares of 1p each, with one voting right per share, as detailed below.
The Company does not have a limited amount of authorised capital and does not hold any shares in treasury.
During the year, 1,500,000 new shares were issued in relation to employee share schemes.
|
|
2025 |
|
2024 |
|
|
$m |
|
$m |
Issued and fully paid |
|
|
|
|
At 31 December 2025 – 2,526,039,885 shares (2024: 2,524,539,885) |
|
41 |
|
41 |
D3. Contingent liabilities
The Group has contingent liabilities relating to guarantees in respect of leasehold properties, pensions, third parties, tax, and litigation. The Group also has contingent liabilities for the management or remediation of environmental issues. These issues tend to be complex to determine and resolve and may be material, although it is often not possible to accurately predict future costs reliably. The possibility of any significant outflows in respect of these items is considered to be remote.
In November 2024, a purported class action lawsuit was filed on behalf of shareholders who purchased American Depositary Shares in the US between 1 December 2023 and 10 September 2024. The defendants are the Company and three current and former senior executives, Andy Ransom, Stuart Ingall-Tombs, and Bradley Paulsen. The complaint alleges that management made false statements about the progress of the integration of Rentokil and Terminix and its impact upon growth in the US and seeks relief under sections 10(b) and 20(a) of the Securities Exchange Act and SEC rule 10(b)5. The Company and the individual defendants intend to vigorously defend the lawsuit.
In April 2025, a purported class action lawsuit was filed in state court in California alleging misrepresentation in the registration statement and prospectuses for the securities issued as part of the acquisition of Terminix. The defendants are the Company, former senior executives Brett Ponton and John Myers, and members of the Company’s Board of Directors. The complaint alleges that the Company made false and misleading statements in the registration and prospectuses in relation to the securities offered as part of the acquisition of Terminix and seeks relief under Sections 11, 12(a)(2), and 15 of the US Securities Act of 1933. The Company and the individual defendants intend to vigorously defend the lawsuit.
D4. Related party transactions
Subsidiaries
All transactions between Group subsidiaries were transacted at arm’s length during the ordinary course of business and have been eliminated on consolidation, along with any outstanding balances, and accordingly are not disclosed in this note.
F-67
Key management personnel
The Group’s strategy and policy are managed by the Board and Executive Leadership Team. Their compensation is shown below:
|
|
2025 |
|
2024 |
|
2023 |
|
|
$m |
|
$m |
|
$m |
Salaries and other short-term employee benefits |
|
15 |
|
10 |
|
12 |
Post-employment benefits |
|
1 |
|
— |
|
3 |
Share-based payments |
|
2 |
|
4 |
|
5 |
|
|
18 |
|
14 |
|
20 |
A list of joint ventures and associate entities can be found in the related undertakings disclosures. There are no significant transactions between associate entities and other Group companies.
D5. Post balance sheet events
On 2 March 2026, Rentokil Initial plc redeemed in full the €500m 0.8750% Senior Unsecured Notes due 30 May 2026, at their principal amount together with accrued interest. The redemption was carried out in accordance with the terms and conditions of the notes. There were no other significant events between 31 December 2025 and the date of approval of these accounts that would require amendments to or additional disclosures in the financial statements.
F-68
Related Undertakings
Subsidiaries and other associated undertakings at 31 December 2025. All undertakings are indirectly owned by the Company unless otherwise stated.
Subsidiaries
|
|
|
|
% held by |
|
|
|
|
|
Group |
|
Company name |
|
Share class |
|
companies |
|
Argentina |
|
|
|
|
|
Calle 70 No. 2720, Necochea city, Province of Buenos Aires, Argentina |
|
||||
Ecotec Interocéanica S.A. |
|
Ordinary |
|
100 |
% |
Aruba |
|
|
|
|
|
Avenida Milio Croes 92, Oranjestad, Aruba |
|
|
|
|
|
R&M Professional Pest Control N.V.1 |
|
Ordinary |
|
100 |
% |
Australia |
|
|
|
|
|
c/– Edwards Marshall, level 3/153 Flinders St, Flinders Street, Adelaide SA 5000, Australia |
|
||||
Allstate Holdings (SA) Pty Ltd |
|
Ordinary |
|
100 |
% |
Allstate Pest Control Pty Ltd |
|
Ordinary |
|
100 |
% |
Allstate Services Pty Ltd |
|
Ordinary |
|
100 |
% |
Unit A1, 3-29 Birnie Ave, Lidcombe Business Park, Lidcombe NSW 2141, Australia |
|
||||
Cannon Hygiene Australia Pty Limited |
|
Ordinary |
|
100 |
% |
Geelong Pest Control Pty Ltd |
|
Ordinary |
|
100 |
% |
Green Fingers Plant Hire Pty Limited |
|
Ordinary |
|
100 |
% |
Knock Out Pest Control Pty Limited |
|
Ordinary |
|
100 |
% |
Pest Away Australia Pty Limited |
|
Ordinary |
|
100 |
% |
Rentokil Australia Pty Limited |
|
Ordinary |
|
100 |
% |
Rentokil Initial Asia Pacific Pty Limited |
|
Ordinary |
|
100 |
% |
Rentokil Initial Pty Limited |
|
Ordinary |
|
100 |
% |
Rentokil Initial Track Spray Pty Ltd |
|
Ordinary |
|
100 |
% |
Rentokil Pest Control (QLD) Pty Limited |
|
Ordinary |
|
100 |
% |
Rentokil Pest Holdings Pty Limited |
|
Ordinary |
|
100 |
% |
Rentokil Pty Ltd |
|
Ordinary |
|
100 |
% |
|
|
Preference |
|
100 |
% |
Austria |
|
|
|
|
|
Brown-Boveri-Straße 8/2/8, 2351, Wiener Neudorf, Austria |
|
||||
Rentokil Initial GmbH |
|
Ordinary |
|
100 |
% |
Bahamas |
|
|
|
|
|
Corporate Services International, 308 East Bay Street, Nassau, PO BOX N-7527, Bahamas |
|
|
|
|
|
Rentokil Initial (Bahamas) Limited |
|
Ordinary |
|
100 |
% |
5th Terrace Centreville, P.O. Box N-1388, Nassau, New Providence, Bahamas |
|
||||
Tropical Exterminators (Holdings) Limited |
|
Common |
|
100 |
% |
Tropical Exterminators Limited |
|
Common |
|
100 |
% |
Barbados |
|
|
|
|
|
One Welches, Welches St. Thomas, Barbados |
|
||||
Rentokil Initial (Barbados) Limited |
|
Ordinary |
|
100 |
% |
Belgium |
|
|
|
|
|
Brandekensweg 2, Schelle, 2627, Belgium |
|
||||
Ambius N.V. |
|
Ordinary |
|
100 |
% |
Bug Busters B.V.1 |
|
Ordinary |
|
100 |
% |
Initial Belux NV |
|
Ordinary |
|
100 |
% |
Rentokil N.V. |
|
Ordinary |
|
100 |
% |
Brazil |
|
|
|
|
|
Rua Maria Braga Lima Dias, Alto Cajueiros, Macaé, Rio de Janeiro, 120, Brazil |
|
||||
Ativa Controle Ambiental Ltda |
|
Ordinary |
|
100 |
% |
Avenida Afonso Pena, nº 808, Santos, 11020-004, Brazil |
|
||||
Ecotec Brasil Tratamentos Fitossanitários Ltda |
|
Ordinary |
|
100 |
% |
Rua Professor José Vieira de Mendonça, 770, Sala 308, Belo Horizonte, Estado de Minas Gerais, Brazil |
|
||||
Ecovec Comercio E Licenciamento De Tecnologias Ltda |
|
Ordinary |
|
100 |
% |
Torrinha Street 171, Bairro Parque da Figueira, Campinas, CEP 13040-310, Brazil |
|
|
|
|
|
Impacto Controle de Pragas Ltda. |
|
Ordinary |
|
100 |
% |
Celido Utz, 66, Igrejinha, Rio Grande do Sul, Brazil |
|
|
|
|
|
Imunizadora Hoffmann Ltda |
|
Ordinary |
|
100 |
% |
Rua Francisco Gonçalo, 16, Loja A, Bairro Pires Façanha, Eusébio, Ceará, CEP 61775-070 |
|
||||
Protecta Manejo Integrado de Pragas Ltda |
|
Ordinary |
|
100 |
% |
Avenida Ceci, 348, Fundos, Centro Empresarial Tambore, CEP 06460-120, Barueri -SP, Brazil |
|
||||
Rentokil Initial Do Brasil Ltda |
|
Ordinary |
|
100 |
% |
Rua Cancioneiro Popular, 456, Chacara, Santo Antonio, SP, Brazil |
|
|
|
|
|
Tecnomad Ltda.1 |
|
Ordinary |
|
100 |
% |
Rua Pesqueira, 59 e 59 Fundos, CEP 22.250-145, Bonsucesso, Brazil |
|
|
|
|
|
Techvet Serviços Ltda.1 |
|
Ordinary |
|
100 |
% |
R. Alagoas, 3098, Rua Alagoas, Curitiba, PR, 80630-050, Brazil |
|
||||
União Sul Controle de Pragas Ltda ME |
|
Ordinary |
|
100 |
% |
F-69
Related Undertakings
continued
|
|
|
|
% held by |
|
|
|
|
|
Group |
|
Company name |
|
Share class |
|
companies |
|
Brunei Darussalam |
|
|
|
|
|
Unit D1 & D1-1 Block D, Bgn Hj Lajim & Anak-Anak, Kg Kiarong, Gadong B, Brunei Muara, BE1318, Brunei Darussalam |
|
||||
Rentokil Initial (B) Sdn Bhd |
|
Non-redeemable preference shares |
|
100 |
% |
|
|
Ordinary |
|
90 |
% |
Unit D3, Bgn Hj Lajim & Anak-Anak, Kg Kiarong, Bandar Seri Begawan, Brunei Muara, BE1318, Brunei Darussalam |
|
||||
Rentokil Initial South East Asia Sdn Bhd |
|
Ordinary |
|
90 |
% |
Canada |
|
|
|
|
|
Suite 900, 1959 Upper Water Street, Halifax NS B3J 2X2, Canada |
|
|
|
|
|
Rentokil Canada Corporation |
|
Common Class A |
|
100 |
% |
|
|
Common Class B |
|
|
|
415 Villa Dr, Villa Drive, Little Bras D’or, Cape Breton Regional NS B1Y 2Z2, Canada |
|
|
|
|
|
Cape Breton Pest Control Limited1 |
|
Class A Preferred |
|
100 |
% |
|
|
Class B Common |
|
|
|
|
|
Class C Common |
|
|
|
Chile |
|
|
|
|
|
Galvarino 8481, Bodega 3, Quilicura, Santiago, Chile |
|
|
|
|
|
Comercializadora de Insumos y Servicios Mauco Limitada |
|
Social Rights |
|
100 |
% |
El Trapiche No.1322, Galpón No 4, Codominio Pacific, Coquimbo, Chile |
|
|
|
|
|
Control De Plagas Hidalgo Y Rodriguez Limitada |
|
Ordinary |
|
100 |
% |
Av. El Bosque PC 12 Lo Boza dpto, B05 Pudahuel, Santiago, Chile |
|
|
|
|
|
Desan SPA |
|
Ordinary |
|
100 |
% |
Av. Víctor Uribe No. 2080 Quilicura, Santiago, Chile |
|
|
|
|
|
Ingeclean S.A |
|
Ordinary |
|
100 |
% |
Rentokil Initial Chile SpA |
|
Ordinary |
|
100 |
% |
Av. El Salto, Santiago, 4001, Chile |
|
|
|
|
|
Ingeniería en Sanitización S.A |
|
Ordinary |
|
100 |
% |
San Martin, Los Ángeles, N° 399, Chile |
|
|
|
|
|
Plaguisur Limitada |
|
Ordinary |
|
100 |
% |
Av. Pdte Ibañez 352, Puerto Montt, Chile |
|
|
|
|
|
Sociedad Comercial 7 Plagas Limitada |
|
Ordinary |
|
100 |
% |
Calle Montreal 4566, San Miguel, Santiago, Chile |
|
|
|
|
|
Comercial Mauco SpA1 |
|
Ordinary |
|
100 |
% |
Av. Cuatro Esquinas 1529, 1722215 La Serena, Coquimbo, Chile |
|
|
|
|
|
Fumigaciones y Servicios Ambientales SpA1 |
|
Ordinary |
|
100 |
% |
People’s Republic of China |
|
|
|
|
|
Room 1001, Yijingyuan Comprehensive Building, Hang Zhou Shi, Zhe Jiang Sheng, 310013, China |
|
|
|
|
|
Hangzhou Research Institute of Profume Fumigation Co. Ltd. |
|
Ordinary |
|
80 |
% |
Room 103, Building 2, Yuzhongxili #42, Beijing, China |
|
|
|
|
|
Rentokil Initial (China) Ltd |
|
Ordinary |
|
100 |
% |
Room (2-1), Unit19, Xindian Xingzuo, Haishu district, Ningbo City, Zhejiang Province, China |
|
|
|
|
|
Ningbo Yuying Pest Control Technology Co., Ltd1 |
|
Ordinary |
|
95 |
% |
Room 4600, Floor 1, Building 8, No. 33 Guangshun Rd, Changning District, Shanghai City, China |
|
|
|
|
|
Shanghai Boecker Environmental Technology Co. Ltd1 |
|
Ordinary |
|
100 |
% |
Colombia |
|
|
|
|
|
Balor Medellín, Carrera 65A #34A-09, Balor Bogotá Calle 82 #22-06, Medellín, Colombia |
|
|
|
|
|
Balor S.A.S. |
|
Ordinary |
|
100 |
% |
Cr 42A 80B 07, Barranquilla, Colombia |
|
|
|
|
|
Colplagas S.A.S |
|
Ordinary |
|
100 |
% |
Calle 162# 20-08, Bogota, Colombia |
|
|
|
|
|
Continental De Fumigaciones S.A.S |
|
Ordinary |
|
100 |
% |
Cr 20 No 162-11, Colombia |
|
|
|
|
|
Fumigaciones Young S.A.S |
|
Ordinary |
|
100 |
% |
Calle 15 Sur, No 48-130 Medellin, Antioquia, Colombia |
|
|
|
|
|
Fumigax SAS |
|
Ordinary |
|
100 |
% |
Carrera 19B No 164A-81, Bogota, Colombia |
|
|
|
|
|
Rentokil Initial Colombia S.A.S. |
|
Common |
|
100 |
% |
F-70
Related Undertakings
continued
|
|
|
|
% held by |
|
|
|
|
|
Group |
|
Company name |
|
Share class |
|
companies |
|
Costa Rica |
|
|
|
|
|
San Jose-Escazu San Rafael, Terraforte Building Second Floor, Cordero, Cordero Abogados, Costa Rica |
|
||||
Decolim Limitada |
|
Common |
|
100 |
% |
San Pedro de Montes de Oca, de la Fuente de la Hispanidad, San José, Costa Rica |
|
|
|
|
|
Fumigadora Control Tecnico De Plagas S.A. |
|
Common |
|
100 |
% |
Curaçao |
|
|
|
|
|
Parke Komersial Korsou, A 24 Veeris, Curaçao |
|
||||
Chuchubi Pest Control N.V. |
|
Common |
|
100 |
% |
Czech Republic |
|
|
|
|
|
Praha 2, Vyšehradská 1349/2, Prague, PSČ 12800, Czech Republic |
|
|
|
|
|
Rentokil Initial s.r.o. |
|
Ordinary |
|
100 |
% |
Denmark |
|
|
|
|
|
Paul Bergsoes Vej 22, 2600 Glostrup, Denmark |
|
|
|
|
|
Rentokil Initial A/S |
|
Ordinary |
|
100 |
% |
Gøngehusvej 253, 2790 Hørsholm, Denmark |
|
|
|
|
|
Deichmann Planter ApS |
|
Ordinary |
|
100 |
% |
El Salvador |
|
|
|
|
|
Avenida Sur, Calle Poniente 12, 2526 Edificio Villa Galicia, San Salvador, El Salvador |
|
|
|
|
|
Clean Air, S.A. de C. V. |
|
Ordinary |
|
100 |
% |
Avenida Calzada Guarda Barranco Urbanizacion, Lomas de Altamira, #14 Pasaje Clarineros, San Salvador, El Salvador |
|
||||
SAGRIP, S.A. DE C.V. |
|
Ordinary |
|
100 |
% |
Estonia |
|
|
|
|
|
Turi Str. 3/1, 11313, Tallinn, Estonia |
|
|
|
|
|
Rentokil OÜ |
|
Ordinary |
|
100 |
% |
Eswatini |
|
|
|
|
|
Umkhiwa House Lot 195, Karl Grant Street, Mbabane, Eswatini |
|
|
|
|
|
RI Swaziland (Pty) Ltd |
|
Ordinary |
|
100 |
% |
Fiji |
|
|
|
|
|
Lot 5, Kaua Road, Suva, Fiji |
|
|
|
|
|
Rentokil Initial Pte Limited |
|
Ordinary |
|
100 |
% |
Finland |
|
|
|
|
|
Tikkurilantie 10 Vantaa, Finland, 01380, Finland |
|
|
|
|
|
Rentokil Initial Oy |
|
Ordinary |
|
100 |
% |
Kimokatu 5, Turku, 20380, Finland |
|
|
|
|
|
Antitec Oy1 |
|
Ordinary |
|
100 |
% |
France |
|
|
|
|
|
209 rue de la Belle Etoile, 95700, Roissy-en-France, France |
|
|
|
|
|
Ambius SAS |
|
Ordinary |
|
100 |
% |
145, rue de Billancourt, 92100, Boulogne Billancourt, France |
|
|
|
|
|
Initial Hygiene Services SAS |
|
Ordinary |
|
100 |
% |
39-53 boulevard Ornano Immeuble Pleyad 3, 93200, Saint-Dennis, France |
|
|
|
|
|
Rentokil Initial Environmental Services S.A.S. |
|
Ordinary |
|
100 |
% |
Rentokil Initial SAS |
|
Ordinary |
|
100 |
% |
20 B rue Louis-Philippe, 92200, Neuilly-sur-Seine, France |
|
|
|
|
|
Skillpro SAS1 |
|
Ordinary |
|
100 |
% |
ZAC des Epineaux 7, avenue Louis Blériot 95740 Frépillon, France |
|
|
|
|
|
Technivap SAS |
|
Ordinary |
|
100 |
% |
F-71
Related Undertakings
continued
|
|
|
|
% held by |
|
|
|
|
|
Group |
|
Company name |
|
Share class |
|
companies |
|
French Guiana |
|
|
|
|
|
PAE de Degrad des cannes, Remire-Montjoly, 97354, French Guiana |
|
|
|
|
|
Rentokil Initial Guyane SARL |
|
Ordinary |
|
100 |
% |
Germany |
|
|
|
|
|
Blierweg 2/Saarstraße, 65201, Wiesbaden, Germany |
|
|
|
|
|
Baumhaus GmbH |
|
Ordinary |
|
100 |
% |
Laufer Straße 3, 90571, Schwaig bei Nürnberg, Mittelfranken, BY, Germany |
|
|
|
|
|
IHD Dienstleistungen KG |
|
Interest |
|
100 |
% |
Piderits Bleiche 11, 33689, Bielefeld, Germany |
|
|
|
|
|
Medentex GmbH |
|
Ordinary |
|
100 |
% |
Rentokil Dental GmbH |
|
Ordinary |
|
100 |
% |
Heuesch 1, 49808, Lingen, Germany |
|
|
|
|
|
Rentokil Holdings GmbH |
|
Ordinary |
|
100 |
% |
Rentokil Initial Beteiligungs GmbH |
|
Ordinary |
|
100 |
% |
Rentokil Initial GmbH & Co. KG |
|
Ordinary |
|
100 |
% |
An der Ziegelei, 47 27383, Scheeßel-Westerholz, Germany |
|
|
|
|
|
S & A Service und Anwendungstechnik GmbH |
|
Ordinary |
|
100 |
% |
Ghana |
|
|
|
|
|
43 Cashew Road, Okpoi Gonno, Park Street, Accra, P. O. BOX 8747, Ghana |
|
|
|
|
|
Rentokil Initial Ghana Limited |
|
Ordinary |
|
100 |
% |
Greece |
|
|
|
|
|
7 Aristotelous Street, Tavros, Athens, 177 78, Greece |
|
|
|
|
|
Rentokil Initial Hellas EPE |
|
Ordinary |
|
100 |
% |
Guadeloupe |
|
|
|
|
|
7 Allee des Papillons, Dothemare, Abymes, 97139, Guadeloupe |
|
|
|
|
|
Pole Hygiene et Recyclage Group |
|
Ordinary |
|
100 |
% |
Rentokil Initial Guadeloupe Sarl |
|
Ordinary |
|
100 |
% |
131 ZA de Calbassier, Basse-Terre, 97100, Guadeloupe |
|
|
|
|
|
SOS Guadeloupe Traitement |
|
Ordinary |
|
100 |
% |
Guatemala |
|
|
|
|
|
9 Av. 39-97, Zone 8, Guatemala |
|
|
|
|
|
Servicios Agricolas Profesionales Sociedad Anonima |
|
Ordinary |
|
100 |
% |
Guernsey |
|
|
|
|
|
P O Box 155, Mill Court, La Charroterie, St Peter Port, GY1 4ET, Guernsey |
|
|
|
|
|
Felcourt Insurance Company Limited |
|
Ordinary |
|
100 |
% |
Guyana |
|
|
|
|
|
Lot 8, Charles and Drysdale Streets, Charlestown, Georgetown, Guyana |
|
|
|
|
|
Rentokil Initial Guyana Limited |
|
Ordinary |
|
100 |
% |
Honduras |
|
|
|
|
|
Colonia Palmira, Avenida Republica de Argentina, N 2017, Tegucigalpa Honduras, 11101, Honduras |
|
||||
Compania de Servicios e Inversiones SVM Honduras, S. de R.L. |
|
Ordinary |
|
100 |
% |
Compania de Servicios SVM Olympus, S. de R.L. |
|
Ordinary |
|
100 |
% |
Compania de Servicios SVM Progressive, S. de R.L. |
|
Ordinary |
|
100 |
% |
Compania de Servicios SVM Technicians, S. de R.L. |
|
Ordinary |
|
100 |
% |
Compania de Servicios SVM Vanguard, S. de R.L. |
|
Ordinary |
|
100 |
% |
San Pedro Sula, Departamento de Cortes, San Pedro Sula, Honduras |
|
|
|
|
|
Sagrip Honduras S.A. |
|
Nominative |
|
100 |
% |
Hong Kong |
|
|
|
|
|
23/F, Westin Centre, 26 Hung to Road, Kwun Tong, Kowloon, Hong Kong |
|
|
|
|
|
Rentokil Hong Kong Investment Limited |
|
Ordinary |
|
100 |
% |
Rentokil Initial Hong Kong Limited |
|
Ordinary |
|
100 |
% |
F-72
Related Undertakings
continued
|
|
|
|
% held by |
|
|
|
|
|
Group |
|
Company name |
|
Share class |
|
companies |
|
India |
|
|
|
|
|
2nd Floor, Narayani, Ambabai Temple Compound, Aarey Road, Goregaon West, Mumbai, Maharashtra, 400104, India |
|
||||
Corporate Millennium Hygiene Solutions Private Limited |
|
Ordinary |
|
100 |
% |
Rentokil Initial Hygiene India Private Limited |
|
Ordinary |
|
100 |
% |
Office No. 301, 3rd Floor, L. D. Building, Mehra Industrial Estate, LBS Marg, Vikhroli (West), Mumbai City, Mumbai, Maharashtra, 400079, India |
|
|
|
|
|
HiCare Services Private Limited |
|
Ordinary |
|
73 |
% |
Villa No.3, Crescent Villa, Candolim, Goa, 403515, India |
|
|
|
|
|
PCI Pest Control Private Limited |
|
Ordinary |
|
73 |
% |
Indonesia |
|
|
|
|
|
South Quarter Tower B, Lantai 21, Unit E,F,G,H. JI. R.A., Kartini Kav. 8, RT. 010/RW. 004 Kel., Cilandak Barat, Kec Cilandak, Jakarta, Selatan, Indonesia |
|
||||
PT. Calmic Indonesia |
|
Ordinary A |
|
100 |
% |
|
|
Ordinary B |
|
|
|
PT. Rentokil Indonesia |
|
Ordinary A |
|
100 |
% |
|
|
Ordinary B |
|
|
|
Gedung JDC Lt.6, Jl. Gatot Subroto Kav. 53 Petamburan, Tanah, Abang, Jakarta Pusat, Indonesia |
|
|
|
|
|
PT. Wesen Indonesia |
|
Ordinary |
|
100 |
% |
Ireland |
|
|
|
|
|
Hazel House, Millennium Park, Naas, County Kildare, Ireland |
|
|
|
|
|
Cannon Hygiene International Limited |
|
Ordinary |
|
100 |
% |
Initial Medical Services (Ireland) Limited (t/a Healthcare Waste Mgt Servs) |
|
Ordinary |
|
100 |
% |
Pest Pulse Limited |
|
€0.0075 Ordinary A |
|
100 |
% |
|
|
€0.0075 Ordinary |
|
|
|
|
|
€0.01 Ordinary |
|
|
|
Rentokil Initial Holdings (Ireland) Limited |
|
Ordinary |
|
100 |
% |
Rentokil Initial Limited |
|
Ordinary |
|
100 |
% |
Ronaldon Limited |
|
Ordinary |
|
100 |
% |
Israel |
|
|
|
|
|
13 Hadid 7313500, Israel |
|
|
|
|
|
Eitan Amichai Pest Management IPM Ltd |
|
Ordinary |
|
100 |
% |
Yarokology Ltd. |
|
Ordinary |
|
100 |
% |
Italy |
|
|
|
|
|
Via Paolo Frisi, 4/A, 48124, Ravenna, RA, Italy |
|
|
|
|
|
Evoluzione Servizi Srl1 |
|
Ordinary |
|
100 |
% |
Via Laurentina km. 26,500, 157 a/c, 00071, Pomezia, Italy |
|
|
|
|
|
Rentokil Initial Italia SpA |
|
Ordinary |
|
100 |
% |
Contrada S. Giovanni in Golfo, 221, Contrada San Giovanni i, 86100, CB, Molise, Italy |
|
|
|
|
|
SOGESsp S.R.L. |
|
Ordinary |
|
100 |
% |
Jamaica |
|
|
|
|
|
39-41 Second Street, Newport West, Kingston 13, Jamaica |
|
|
|
|
|
Rentokil Initial (Jamaica) Limited |
|
Ordinary |
|
100 |
% |
Jordan |
|
|
|
|
|
Amman, Jabal AlHussien, Al Lud Str. 37 – 1st floor, Jordan |
|
|
|
|
|
Arena Public Health Co. |
|
Ordinary |
|
100 |
% |
Kenya |
|
|
|
|
|
Unit 5 Sameer Industrial Park, Road C, Off Enterprise Road Industrial Area, Nairobi, Kenya |
|
|
|
|
|
Rentokil Initial Kenya Limited |
|
Ordinary |
|
100 |
% |
Lebanon |
|
|
|
|
|
Boecker Building, Plot no. 3309, Ain El Remmaneh, Beirut, Lebanon |
|
|
|
|
|
Boecker International SAL (Offshore) |
|
Ordinary |
|
100 |
% |
Boecker World (Holding) s.a.l. |
|
Ordinary |
|
100 |
% |
Adonis Building, Bechara el Khoury, Beirut, Lebanon |
|
|
|
|
|
Boecker Public Health s.a.l |
|
Ordinary |
|
100 |
% |
Libya |
|
|
|
|
|
Janzour, Tripoli, Libya |
|
|
|
|
|
Rentokil Delta Libya for Environmental Protection JSCO |
|
Ordinary |
|
65 |
% |
Lithuania |
|
|
|
|
|
Drobės g. 62, LT-45181, Kaunas, Lithuania |
|
|
|
|
|
Dezinfa, UAB |
|
Ordinary |
|
100 |
% |
F-73
Related Undertakings
continued
|
|
|
|
% held by |
|
|
|
|
|
Group |
|
Company name |
|
Share class |
|
companies |
|
Luxembourg |
|
|
|
|
|
Rue de la Chapelle 47, 4967, Clemency, Luxembourg |
|
|
|
|
|
Rentokil Luxembourg Sarl |
|
Ordinary |
|
100 |
% |
6 Rue Eugene Ruppert, Luxembourg, 2453, Luxembourg |
|
|
|
|
|
SVM Finance Luxembourg 1 S.a.r.l. |
|
Ordinary |
|
100 |
% |
SVM Finance Luxembourg 2 S.a.r.l. |
|
Ordinary |
|
100 |
% |
Malawi |
|
|
|
|
|
Plot No. LE 377, Patridge Avenue, Limbe, P O BOX 5135, Malawi |
|
|
|
|
|
Rentokil Initial Limited |
|
Ordinary |
|
100 |
% |
Malaysia |
|
|
|
|
|
Level 8 Symphony House, Block D13, Pusat Dagangan Dana, 47301 Jalan PJU 1A/46, Petaling Jaya, Selangor Darul Ehsan, Malaysia |
|
||||
Rentokil Initial (M) Sdn Bhd |
|
Ordinary |
|
100 |
% |
UFTC Sdn Bhd |
|
Ordinary |
|
100 |
% |
Maldives |
|
|
|
|
|
No. 6-A, Faamudheyrige Building, Orchid Magu, Repu, Malé, Maldives |
|
|
|
|
|
Rentokil Initial Maldives (Pvt) Ltd |
|
Preferential shares |
|
100 |
% |
Martinique |
|
|
|
|
|
Zone Industrielle de Champigny, Ducos, Le Marin, 97224, Martinique |
|
|
|
|
|
Rentokil Initial Martinique Sarl |
|
Ordinary |
|
100 |
% |
Mexico |
|
|
|
|
|
Juan Álvarez #482, Colonia Centro, Monterrey, N.L., 64000, Mexico |
|
|
|
|
|
Balance Urbano Control de Plagas S.A. de CV |
|
Ordinary |
|
100 |
% |
Sauce 29, Col. Santa Maria La Ribera, Cuauhtemoc, CDMX, 06400, Mexico |
|
|
|
|
|
Control Vifer, S.A. de C.V. |
|
Ordinary A |
|
100 |
% |
|
|
Ordinary B |
|
|
|
Servicios de Plagas Terminix, S.A. de C.V. |
|
Ordinary A |
|
100 |
% |
|
|
Ordinary B |
|
|
|
Terminix International S.A. de C.V. |
|
Ordinary A |
|
100 |
% |
|
|
Ordinary B |
|
|
|
Calle 29, No. 210 Col. Garcia Gineres, Merida, Yucatán, 97070, Mexico |
|
|
|
|
|
Personal Profesional de Pesticidas S.A. de C.V. |
|
Ordinary |
|
100 |
% |
Mozambique |
|
|
|
|
|
Avenida da Namaacha, kilometro 6, Residencial Mutateia, Cidade da Matola, Mozambique |
|
|
|
|
|
Rentokil Initial Mozambique Limitada |
|
Ordinary |
|
100 |
% |
Netherlands |
|
|
|
|
|
Impact 6, 6921 RZ, Duiven, Netherlands |
|
|
|
|
|
Ambius B.V. |
|
Ordinary |
|
100 |
% |
Oude Middenweg 77, 2491 AC, Den Haag, Netherlands |
|
|
|
|
|
B.V. Rentokil Funding |
|
Ordinary A |
|
100 |
% |
BET (Properties) B.V. |
|
Ordinary |
|
100 |
% |
BET Finance B.V. |
|
Ordinary |
|
100 |
% |
Holland Reconditionering B.V. |
|
Ordinary |
|
100 |
% |
Rentokil Initial Finance B.V. |
|
Ordinary |
|
100 |
% |
Rentokil Initial International B.V. |
|
Ordinary |
|
100 |
% |
Rentokil Initial Overseas (Holdings) B.V. |
|
Ordinary |
|
100 |
% |
Ravenswade 54-S, 3439, Nieuwegein, LD, Netherlands |
|
|
|
|
|
Rentokil Initial B.V. |
|
Ordinary |
|
100 |
% |
F-74
Related Undertakings
continued
|
|
|
|
% held by |
|
|
|
|
|
Group |
|
Company name |
|
Share class |
|
companies |
|
New Zealand |
|
|
|
|
|
Level 1, 89 Carbine Road, Mount Wellington, Auckland 1060, New Zealand |
|
|
|
|
|
Rentokil Initial Limited |
|
Ordinary |
|
100 |
% |
16 Leonard Road, Mount Wellington, Auckland, 1060, New Zealand |
|
|
|
|
|
Nitrogenx Limited1 |
|
Ordinary |
|
100 |
% |
Norway |
|
|
|
|
|
Sanitetsveien 17, Postboks 84, Skjetten, 2026, Norway |
|
|
|
|
|
Rentokil Initial Norge AS |
|
Ordinary |
|
100 |
% |
Rambergveien 1, Tønsberg, 3115, Norway |
|
|
|
|
|
Skadedyrbutikken AS |
|
Ordinary |
|
100 |
% |
Pakistan |
|
|
|
|
|
S-2 Commercial, 2nd Floor, Lalik Jan Chowk, Phase II, Lahore, Cantonment, Punjab, Pakistan |
|
|
|
|
|
C-Shine Sustainable Solutions (Private) Limited |
|
Ordinary |
|
70 |
% |
Peru |
|
|
|
|
|
Calle 23 Mza, Z-1 Lote 9, Villa El Salvador, Peru |
|
|
|
|
|
Ingeclean Peru S.A.C |
|
Ordinary |
|
100 |
% |
Philippines |
|
|
|
|
|
No 73 Elisco Road, Bo, Kalawaan, Pasig City, 1600, Philippines |
|
|
|
|
|
Rentokil Initial (Philippines) Inc |
|
Ordinary |
|
100 |
% |
Poland |
|
|
|
|
|
Ul. Jana Pawla Woronicza, Nr 31, Lok. 78, 02-640, Warszawa, Poland |
|
|
|
|
|
Rentokil Polska Sp. z o.o. |
|
Ordinary |
|
100 |
% |
Ul. Dąbrowskiego 44, 50-457, Wrocław, Poland |
|
|
|
|
|
Vaco sp. z o.o |
|
Ordinary |
|
100 |
% |
Portugal |
|
|
|
|
|
EN 115, Km 78,67, 2664-502, São Julião do Tojal, Portugal |
|
|
|
|
|
Rentokil Initial Portugal – Serviços de Protecção Ambiental, Unipessoal, Lda |
|
Ordinary |
|
100 |
% |
Republic of Korea |
|
|
|
|
|
2nd Floor, Korea Disaster Relief Association, 371-19 Sinsu-Dong, Mapo-Gu, Seoul, Korea, 121-856, Republic of Korea | |||||
Rentokil Initial Korea Ltd |
|
Common |
|
100 |
% |
Saudi Arabia |
|
|
|
|
|
4477 King Abdul Aziz Road, Suleimaniya, Unit 2 Riyadh KSA, Saudi Arabia |
|
|
|
|
|
BET Trading LLC |
|
Ordinary |
|
100 |
% |
Boecker Public Health Saudia Company Limited |
|
Ordinary |
|
100 |
% |
PO Box 30164, Office No: 401, 4th Floor, Al Tamimi Building, Al Khobar North, Al Khobar, 31952, Saudi Arabia | |||||
Rentokil Saudi Arabia Limited O.P.C |
|
Ordinary |
|
100 |
% |
F-75
Related Undertakings
continued
|
|
|
|
% held by |
|
|
|
|
|
Group |
|
Company name |
|
Share class |
|
companies |
|
Singapore |
|
|
|
|
|
16 Jalan Mesin, Singapore, 368815, Singapore |
|
|
|
|
|
Rentokil Initial Asia Pacific Management Pte Ltd |
|
Ordinary |
|
100 |
% |
Rentokil Initial Singapore Private Limited |
|
Ordinary |
|
100 |
% |
Slovakia |
|
|
|
|
|
Kopcianska 10, Bratislava, 851 01, Slovakia |
|
|
|
|
|
Rentokil Initial s.r.o. |
|
Ordinary |
|
100 |
% |
South Africa |
|
|
|
|
|
Unit D12 Connaught Park, Riley Road, Beaconvale, Parow, 7000, South Africa |
|
|
|
|
|
Cannon Hygiene (SA) Proprietary Limited |
|
Ordinary |
|
100 |
% |
2 Stigant Road, Claremont, Cape Town, 7708, South Africa |
|
|
|
|
|
Newshelf 1232 (Pty) Ltd |
|
Preference |
|
100 |
% |
Rentokil Initial (Proprietary) Limited |
|
Ordinary |
|
100 |
% |
Rentokil Initial Dikapi JV (Pty) Limited |
|
Ordinary |
|
59 |
% |
Spain |
|
|
|
|
|
C/ Los Carros, 1 Bajo, Pobladura de Pelayo de García, 24249, Leon, Spain |
|
|
|
|
|
Desinfeccion de Plagas S.L. |
|
Ordinary |
|
100 |
% |
C/ Monasterio de Nájera 1, 50002, Zaragoza, Spain |
|
|
|
|
|
Desinfecciones Bionext, S.L. |
|
Ordinary |
|
100 |
% |
Pol. Ind. El Prado, Calle Bilbao, Nave 5, Parcel 17, 06800, Mérida, Badajoz, Spain |
|
|
|
|
|
Fumigaciones Extremeñas Merida, S.L. |
|
Ordinary |
|
100 |
% |
C/ Mar Mediiterráneo 1 (entrada por Mar Adriático, San Fernando de Henares), 28830, Madrid, Spain |
|
|
|
|
|
Initial Gaviota S.A.U |
|
Ordinary |
|
100 |
% |
Rentokil Initial España SA |
|
Ordinary A |
|
100 |
% |
|
|
Ordinary B |
|
|
|
|
|
Ordinary C |
|
|
|
Polígono Industrial “Pla de Vallonga”, Calle Meteorito, 59 – Alicante, Spain |
|
|
|
|
|
Lokimica S.A |
|
Ordinary |
|
100 |
% |
C/de la Nena Casas, 71, 08017, Barcelona, Spain |
|
|
|
|
|
Servicios Depec S.L. |
|
Ordinary |
|
100 |
% |
C/ Palanca 34, 28045, Madrid, Spain |
|
|
|
|
|
Tecnologia y Desarrollo Medioambiental, S.L. |
|
Ordinary |
|
100 |
% |
Sri Lanka |
|
|
|
|
|
No. 307, Negombo Road, Peliyagoda, Sri Lanka |
|
|
|
|
|
Rentokil Initial Ceylon (Private) Limited |
|
Ordinary |
|
100 |
% |
F-76
Related Undertakings
continued
|
|
|
|
% held by |
|
|
|
|
|
Group |
|
Company name |
|
Share class |
|
companies |
|
Sweden |
|
|
|
|
|
Avestagatan 61, SE 163 53 Spanga, Sweden |
|
|
|
|
|
Ambius AB |
|
Ordinary |
|
100 |
% |
Rent a Plant Interessenter AB |
|
Ordinary |
|
100 |
% |
Sweden Recycling AB |
|
Ordinary |
|
100 |
% |
c/o Nomor AB, Tusbystråket 1B, 191 61, Sollentuna, Sweden |
|
|
|
|
|
Nomor AB |
|
Ordinary |
|
100 |
% |
Rentokil Försăkring AB |
|
Ordinary |
|
100 |
% |
Nomor Holding AB |
|
Ordinary |
|
100 |
% |
Terminix Nomor AB |
|
Ordinary |
|
100 |
% |
Switzerland |
|
|
|
|
|
Hauptstrasse 3, 4625 Oberbuchsiten, Oberbuchsiten, Switzerland |
|
|
|
|
|
Rentokil Schweiz AG |
|
Ordinary |
|
100 |
% |
Taiwan (Province of China) |
|
|
|
|
|
14F-1, No. 26, Ln. 61, Sec. 1, Guangfu Rd., Sanchong Dist., New Taipei City, Taiwan (Province of China) |
|
|
|
|
|
Initial Hygiene Co Ltd |
|
Ordinary |
|
100 |
% |
Rentokil Co., Limited |
|
Ordinary |
|
100 |
% |
Tanzania |
|
|
|
|
|
1st Floor, Opal Place, 77 Haile Selassie Road, Masaki, P.O. Box 21184, Dar es Salaam, Tanzania |
|
|
|
|
|
Initial Hygiene (T) Limited |
|
Ordinary |
|
100 |
% |
Thailand |
|
|
|
|
|
160 Vibhavadi Rangsit Road, Khwaeng Ratchadapisek, Khat Dindaeng, Thailand, 10400, Thailand |
|
|
|
|
|
Cannon Pest Management Co. Ltd |
|
Ordinary |
|
100 |
% |
Rentokil Initial (Thailand) Ltd |
|
Ordinary |
|
100 |
% |
Trinidad and Tobago |
|
|
|
|
|
Field no. 82, KK-LL, Aranguez South, Trinidad and Tobago |
|
|
|
|
|
Rentokil Initial (Trinidad) Limited |
|
Ordinary |
|
100 |
% |
Turkey |
|
|
|
|
|
Tuna Mahallesi Sanat Caddesi No: 17 Daire: 121, Bornova, İzmir, Turkey |
|
|
|
|
|
Rentokil Initial Çevre Sağlığı Sistemleri Ticaret ve Sanayi A.Ş |
|
Ordinary |
|
100 |
% |
Uganda |
|
|
|
|
|
Plot No 2012, Kalinabiri Road, Ntinda, Kampala, Uganda |
|
|
|
|
|
Rentokil Initial Uganda Limited |
|
Ordinary |
|
100 |
% |
United Arab Emirates |
|
|
|
|
|
Office number 1403, PO Box 41999, TECOM, Al Barsha Heights, Dubai, United Arab Emirates |
|
|
|
|
|
Boecker Food Safety L.L.C. |
|
Ordinary |
|
100 |
% |
Al Shafar Tower 1, 14th Floor, Office No. 1401, TECOM, Al Barsha Heights, Dubai, United Arab Emirates |
|
|
|
|
|
Boecker Pest Control L.L.C. |
|
Ordinary |
|
100 |
% |
Boecker Public Health Pest Control |
|
Ordinary |
|
100 |
% |
Equipment Trading L.L.C. |
|
|
|
|
|
National Pest Control LLC |
|
Ordinary |
|
100 |
% |
Rentokil Initial Pest Control LLC |
|
Ordinary |
|
100 |
% |
Shop No.6, Jurf Industrial Zone 2, Ajman, United Arab Emirates |
|
|
|
|
|
Rentokil Initial Pest Control L.L.C. |
|
Ordinary |
|
100 |
% |
F-77
Related Undertakings
continued
|
|
|
|
% held by |
|
|
|
|
|
Group |
|
Company name |
|
Share class |
|
companies |
|
United Arab Emirates (continued) |
|
|
|
|
|
Al Suhyeen, Rolla, Office 205, Sharjah, United Arab Emirates |
|
||||
Specialist Int. Pest Control LLC |
|
Ordinary |
|
100 |
% |
United Kingdom |
|
|
|
|
|
Compass House, Manor Royal, Crawley, West Sussex, RH10 9PY, United Kingdom |
|
|
|
|
|
AW Limited |
|
Ordinary |
|
100 |
% |
B.E.T. Building Services Limited |
|
Ordinary |
|
100 |
% |
BET (No.18) Limited |
|
Ordinary |
|
100 |
% |
BET (No.68) Limited2 |
|
Ordinary |
|
100 |
% |
BET Environmental Services Ltd |
|
Ordinary |
|
100 |
% |
BET Pension Trust Limited |
|
Ordinary |
|
100 |
% |
BPS Offshore Services Limited3 |
|
Ordinary |
|
100 |
% |
Broadcast Relay Service (Overseas) Limited3 |
|
Ordinary |
|
100 |
% |
Castlefield House Limited |
|
Ordinary |
|
100 |
% |
Chard Services Limited |
|
Ordinary |
|
100 |
% |
CHL Legacy Limited3 |
|
Ordinary |
|
100 |
% |
Contemporary Plant Designs Limited3 |
|
Ordinary |
|
100 |
% |
DCUK (FM) Limited1 |
|
Ordinary |
|
100 |
% |
DCUKFM Holdings Limited1 |
|
Ordinary |
|
100 |
% |
DuctClean (UK) Limited1 |
|
Ordinary |
|
100 |
% |
Dudley Industries Limited3 |
|
Ordinary |
|
100 |
% |
Enigma Laundries Limited |
|
Ordinary |
|
100 |
% |
Enigma Services Group Limited |
|
Ordinary |
|
100 |
% |
Enviro-Fresh Limited |
|
Ordinary |
|
100 |
% |
Environmental Contract Services Limited3 |
|
Ordinary |
|
100 |
% |
Euroguard Technical Services Limited |
|
Ordinary |
|
100 |
% |
Grayston Central Services Limited |
|
Ordinary |
|
100 |
% |
Hometrust Limited |
|
Ordinary |
|
100 |
% |
Initial Limited3 |
|
Ordinary |
|
100 |
% |
Initial Medical Services Limited |
|
Ordinary |
|
100 |
% |
Interior Contracts (UK) Limited3 |
|
Ordinary |
|
100 |
% |
Kent Tropical Interiors Limited3 |
|
Ordinary A |
|
100 |
% |
|
|
Ordinary B |
|
|
|
Marlin Global Services Limited1,3 |
|
Ordinary |
|
100 |
% |
Manor Planting Ltd3 |
|
Ordinary |
|
100 |
% |
Nature At Work Limited |
|
Ordinary |
|
100 |
% |
Newman’s Plants Limited3 |
|
Ordinary A |
|
100 |
% |
|
|
Ordinary B |
|
|
|
|
|
Ordinary C |
|
|
|
Opel Transport & Trading Company Limited |
|
Ordinary |
|
100 |
% |
Paul Lomax Limited |
|
Ordinary A |
|
100 |
% |
|
|
Ordinary B |
|
|
|
|
|
Ordinary C |
|
|
|
Peter Cox Limited |
|
Ordinary A |
|
100 |
% |
Plant Nominees Limited |
|
Ordinary |
|
100 |
% |
Prime Projects International Limited3 |
|
Ordinary |
|
100 |
% |
Prokill (UK) Ltd |
|
Ordinary A |
|
100 |
% |
Prokill Limited |
|
Ordinary A |
|
100 |
% |
|
|
Ordinary B |
|
|
|
|
|
Ordinary C |
|
|
|
|
|
Ordinary D |
|
|
|
Rapid Washrooms Limited |
|
Ordinary A |
|
100 |
% |
|
|
Ordinary B |
|
|
|
|
|
Ordinary C |
|
|
|
F-78
Related Undertakings
continued
|
|
|
|
% held by |
|
|
|
|
|
Group |
|
Company name |
|
Share class |
|
companies |
|
United Kingdom (continued) |
|
|
|
|
|
Rentokil Dormant (No.6) Ltd |
|
Ordinary |
|
100 |
% |
Rentokil Initial (1896) Limited3 |
|
Ordinary |
|
100 |
% |
Rentokil Initial (1993) Limited3 |
|
Ordinary |
|
100 |
% |
|
|
6% Non-Redeemable Preference |
|
|
|
Rentokil Initial 1927 plc |
|
Ordinary |
|
100 |
% |
|
|
Redeemable Preference: AUD, CAD, CLP, DKK, IDR, ILS, NOK, NZD, USD EUR |
|
|
|
|
|
Cumulative Preference (Non-Redeemable) |
|
|
|
Rentokil Initial Americas Limited3 |
|
Ordinary |
|
100 |
% |
Rentokil Initial Asia Pacific Limited3 |
|
Ordinary |
|
100 |
% |
Rentokil Initial Brazil Limited3 |
|
Ordinary |
|
100 |
% |
Rentokil Initial Finance Limited3 |
|
Ordinary |
|
100 |
% |
Rentokil Initial Holdings Limited3,4 |
|
Ordinary |
|
100 |
% |
Rentokil Initial Investments South Africa3 |
|
Ordinary |
|
100 |
% |
Rentokil Initial Pension Trustee Limited |
|
Ordinary |
|
100 |
% |
Rentokil Initial Services Limited |
|
Ordinary |
|
100 |
% |
Rentokil Initial UK Ltd |
|
Ordinary |
|
100 |
% |
Rentokil Insurance Limited |
|
Ordinary |
|
100 |
% |
Rentokil Limited3 |
|
Ordinary |
|
100 |
% |
Rentokil Overseas Holdings Limited3 |
|
Ordinary |
|
100 |
% |
F-79
Related Undertakings
continued
|
|
|
|
% held by |
|
|
|
|
|
Group |
|
Company name |
|
Share class |
|
companies |
|
United Kingdom (continued) |
|
|
|
|
|
Rentokil Property Care Limited |
|
Ordinary |
|
100 |
% |
Rentokil Property Holdings Limited |
|
Ordinary |
|
100 |
% |
RI Dormant No.18 Limited |
|
Ordinary |
|
100 |
% |
RI Dormant No.20 Limited |
|
Ordinary |
|
100 |
% |
Saaman Limited3 |
|
Ordinary |
|
100 |
% |
Stratton House Leasing Limited3 |
|
Ordinary |
|
100 |
% |
SVM International Services Limited |
|
Ordinary |
|
100 |
% |
Target Express Holdings Limited |
|
Ordinary |
|
100 |
% |
Target Express Limited |
|
Ordinary |
|
100 |
% |
Target Express Parcels Limited |
|
Ordinary |
|
100 |
% |
TEB Cleaning Services Limited |
|
Ordinary |
|
100 |
% |
The Palfreymans Limited |
|
Ordinary A |
|
100 |
% |
|
|
Ordinary B |
|
|
|
|
|
Ordinary C |
|
|
|
|
|
Ordinary D |
|
|
|
|
|
Ordinary E |
|
|
|
Tropical Ambience Limited |
|
Ordinary |
|
100 |
% |
Tropical Innovation Limited3 |
|
Ordinary |
|
100 |
% |
Urban Planters Franchise Limited3 |
|
Ordinary |
|
100 |
% |
Waterized Limited |
|
Ordinary |
|
100 |
% |
Stephens & Carter Limited2 |
|
Ordinary |
|
100 |
% |
The Ca’D’Oro, 45 Gordon Street, Glasgow, Scotland, G1 3PE, United Kingdom |
|
|
|
|
|
Duct Clean Services LTD3 |
|
Ordinary |
|
100 |
% |
Industrial Clothing Services Limited |
|
Ordinary |
|
100 |
% |
Pest Protection Services (Scotland) Limited |
|
Ordinary A |
|
100 |
% |
RI Dormant No.12 Limited |
|
Ordinary |
|
100 |
% |
Wise Property Care Ltd. |
|
Ordinary |
|
100 |
% |
F-80
Related Undertakings
continued
|
|
|
|
% held by |
|
|
|
|
|
Group |
|
Company name |
|
Share class |
|
companies |
|
United States |
|
|
|
|
|
1125 Berkshire Blvd, Suite 150, Reading PA 19610, United States |
|
|
|
|
|
Cygnet Enterprises Northwest, Inc |
|
Common |
|
100 |
% |
Cygnet Enterprises West, Inc |
|
Common |
|
100 |
% |
Cygnet Enterprises, Inc |
|
Common |
|
100 |
% |
Medentex LLC |
|
Common |
|
100 |
% |
Oliver Exterminating Dominicana Corp |
|
Common |
|
100 |
% |
Rentokil Initial Environmental Services LLC |
|
Interest |
|
100 |
% |
Rentokil North America, Inc. |
|
Ordinary |
|
100 |
% |
Rentokil of Puerto Rico, Inc. |
|
Common |
|
100 |
% |
Solitude Lake Management, LLC |
|
Common |
|
100 |
% |
Vector Disease Acquisition, LLC |
|
Series A shares |
|
100 |
% |
|
|
Series B shares |
|
|
|
|
|
Common shares |
|
|
|
Vector Disease Control International, LLC |
|
Common |
|
100 |
% |
2288 150th Street Halstad MN 56548, United States |
|
|
|
|
|
Airborne Vector Control LLC |
|
Common |
|
100 |
% |
The Corporation Trust Company, Corporation Trust Center, 1209 Orange Street, Wilmington DE 19801, United States |
|
|
|
|
|
Anza, LLC |
|
Ordinary |
|
100 |
% |
Initial Contract Services LLC |
|
Interest |
|
100 |
% |
Ramac (US) LLC |
|
Interest |
|
100 |
% |
Rentokil Initial US Holdings, Inc. |
|
Common |
|
100 |
% |
Rentokil Terminix Funding, LLC |
|
Interest |
|
100 |
% |
Secure Monthly Affordable Credit Corporation |
|
Common |
|
100 |
% |
Secure Monthly Affordable Credit Limited Partnership |
|
Ordinary |
|
100 |
% |
SVM Honduran Service and Investments Company, LLC |
|
Interest |
|
100 |
% |
SVM Olympus Service Company, LLC |
|
Interest |
|
100 |
% |
SVM Progressive Service Company, LLC |
|
Interest |
|
100 |
% |
SVM Technicians Service Company, LLC |
|
Interest |
|
100 |
% |
SVM Vanguard Service Company, LLC |
|
Interest |
|
100 |
% |
Terminix Consumer Services, LLC |
|
Interest |
|
100 |
% |
Terminix Holdings, LLC |
|
Interest |
|
100 |
% |
Terminix International Holdings, Inc |
|
Common |
|
100 |
% |
Terminix Management Corporation |
|
Interest |
|
100 |
% |
Terminix Receivables Company LLC |
|
Interest |
|
100 |
% |
The Terminix Company, LLC |
|
Interest |
|
100 |
% |
TMX Holdco, LLC |
|
Interest |
|
100 |
% |
United Transport America LLC |
|
Interest |
|
100 |
% |
Virginia Properties Inc |
|
Ordinary |
|
100 |
% |
PO Box 4510 Ten Free Street, Portland ME 04112, United States |
|
|
|
|
|
Asiatic Investments, Inc. |
|
Ordinary |
|
100 |
% |
1000 Labarre Road, Metairie, LA 70001, United States |
|
|
|
|
|
Mississippi Mosquito Control, LLC |
|
Interest |
|
100 |
% |
Mosquito Control of Lafourche, LLC |
|
Interest |
|
100 |
% |
Mosquito Control Services of Florida, LLC |
|
Interest |
|
100 |
% |
Mosquito Control Services of Georgia, LLC |
|
Interest |
|
100 |
% |
Mosquito Control Services, L.L.C |
|
Interest |
|
100 |
% |
Rittiner Group, L.L.C. |
|
Interest |
|
100 |
% |
St. Charles Mosquito Control, L.L.C. |
|
Interest |
|
100 |
% |
St. John Mosquito Control, L.L.C. |
|
Interest |
|
100 |
% |
Terrebonne Mosquito Control, LLC |
|
Interest |
|
100 |
% |
1000 Satellite Blvd, Ste 101, Suwanee, Gwinnett County GA 30024, United States |
|
|
|
|
|
ProPest Products, Inc. |
|
Ordinary |
|
100 |
% |
2540, Lawrenceville Hwy, Lawrenceville, GA 30044, United States |
|
|
|
|
|
Steritech-Canada, Inc. |
|
Common |
|
100 |
% |
Asiatic Holdings LLC |
|
Ordinary |
|
100 |
% |
463 Mountain View Drive, Suite 301, 3rd Floor, Colchester VT 05446, United States |
|
|
|
|
|
Steward Insurance Company |
|
Common |
|
100 |
% |
860 Ridge Lake Blvd., Memphis TN 38120, United States |
|
|
|
|
|
Terminix Gift, L.L.C. |
|
Interest |
|
100 |
% |
150 Peabody Place, Memphis TN 38103, United States |
|
|
|
|
|
The Terminix International Company Limited Partnership |
|
Ordinary |
|
100 |
% |
The Terminix Foundation |
|
Interest |
|
100 |
% |
Uruguay |
|
|
|
|
|
Tomás Giribaldi, apto 3, 2270, Uruguay |
|
|
|
|
|
Amalur Uruguay Sociedad Anónima |
|
Ordinary |
|
100 |
% |
Chana, 2033, Departmento de Montevideo, Uruguay |
|
|
|
|
|
La Sanitaria S.A. |
|
Ordinary |
|
100 |
% |
La Paz, 1227, Departamento de Montevideo, Uruguay |
|
|
|
|
|
Rentokil Uruguay S.A. |
|
Ordinary |
|
100 |
% |
Manuel Calleros 4918, Montevideo, Uruguay |
|
|
|
|
|
Control Productos y Servicios de Higiene Ambiental S.A.1 |
|
Ordinary |
|
100 |
% |
Vietnam |
|
|
|
|
|
54-56 Nguyen Trai Street, Ben Thanh Ward, District 1, Ho Chi Minh City, Vietnam |
|
|
|
|
|
Rentokil Initial (Vietnam) Company Limited |
|
Ordinary |
|
100 |
% |
Virgin Islands, US |
|
|
|
|
|
Merchants Financial Center, 4608 Tutu Park Mall, Suite 202, St Thomas, Virgin Islands, 00802-1816, Virgin Islands, U.S. |
|
||||
Terminix International USVI, LLC |
|
Interest |
|
100 |
% |
F-81
Related Undertakings
continued
Associated undertakings
|
|
|
|
% held by |
|
|
|
|
|
Group |
|
Company name |
|
Share class |
|
companies |
|
People’s Republic of China |
|
|
|
|
|
B3, Xunmei Industrial Zone, Fengze District, Quanzhou City, Fujian Province, China |
|
|
|
|
|
Fujian Xunke Pest Control Company Limited |
|
Ordinary |
|
30 |
% |
Room 1005, Unit 1, Building 1, No.1 Huangjin Road, Dongguan City, Guangdong Province, China |
|
|
|
|
|
Guangdong New Hope Environmental Technology Co., Ltd. |
|
Ordinary |
|
30 |
% |
No.14 Wenguangtingjiao Road, Chaoyang District, Shantou City, China |
|
|
|
|
|
Guangdong Vircon Pest Management Company Limited |
|
Ordinary A |
|
30 |
% |
Egypt |
|
|
|
|
|
Third floor, Jupiter Building, B3, Majara Compound, Sheikh Zayed, Giza, Egypt |
|
|
|
|
|
ServicePros S.A.E.5 |
|
Ordinary |
|
30 |
% |
Japan |
|
|
|
|
|
Kudan Terrace, 1-6-5 Kudan Minami, Chiyoda-Ku, Tokyo, 102-0074, Japan |
|
|
|
|
|
Nippon Calmic Ltd |
|
Ordinary |
|
49 |
% |
Nigeria |
|
|
|
|
|
Old Ojo Road, Off Badagry Expressway, Agboju, Lagos, 359/361, Nigeria |
|
|
|
|
|
Boecker Public Health Services Ltd |
|
Ordinary |
|
30 |
% |
Norway |
|
|
|
|
|
Veverivegen 10, 2848 Skreia, Norway |
|
|
|
|
|
Skadedyrkontrollen øst AS |
|
Ordinary |
|
40 |
% |
Qatar |
|
|
|
|
|
16 A Al Mana Business Tower, Doha, Qatar |
|
|
|
|
|
Boecker Public Safety Services – Qatar W.L.L. |
|
Ordinary |
|
24.5 |
% |
United Kingdom |
|
|
|
|
|
Compass House, Manor Royal, Crawley, West Sussex, RH10 9PY, United Kingdom |
|
|
|
|
|
Hometrust Kitchens Limited |
|
Ordinary |
|
25 |
% |
Torchsound Properties Limited |
|
Ordinary |
|
50 |
% |
| 1. | Acquired or incorporated by the Group in 2025. |
| 2. | Temporary restoration. |
| 3. | As permitted by section 479A of the Companies Act 2006, the Company intends to take advantage of the audit exemption in relation to the individual accounts of these companies. |
| 4. | Held directly by Rentokil Initial plc. |
| 5. | This entity is non-operational and the Group does not carry out business in this jurisdiction. |
F-82
Exhibit 2.2
DESCRIPTION OF SECURITIES
REGISTERED PURSUANT TO SECTION 12 OF THE
SECURITIES EXCHANGE ACT OF 1934
The following description sets forth certain material terms and provisions of the securities of Rentokil Initial plc (“Rentokil Initial”, the “Company”, “we”, “us”, and “our”) that are registered under Section 12 of the Securities Exchange Act of 1934, as amended (the “Act”).
General
The Company’s securities include (a) ordinary shares of par value £0.01 each, and (b) American Depositary Shares (the “ADSs”), each representing five ordinary shares. The ordinary shares are listed on the London Stock Exchange and are registered under the Act, not for trading, but only in connection with the listing of the ADSs, which are listed on the New York Stock Exchange and are held by The Bank of New York Mellon as depositary (the “Depositary”).
As at 31 December 2025, there were 2,526,039,885 ordinary shares outstanding.
Ordinary Shares
The following is a summary of the material terms of (1) the Rentokil Initial ordinary shares as set forth in the articles of association of Rentokil Initial (the “Articles”), and (2) English law insofar as it applies to the Rentokil Initial ordinary shares. The following description of the ordinary shares is a summary and does not purport to be complete. A copy of the Articles is filed as an exhibit to Rentokil Initial’s annual report on Form 20-F for the fiscal year ended 31 December 2025 as Exhibit 1.1.
Share Capital
All Rentokil Initial ordinary shares have equal voting rights and no right to a fixed income. There are no acquisition rights or obligations in relation to the issue of Rentokil Initial ordinary shares in the capital of Rentokil Initial or an undertaking to increase the capital of Rentokil Initial. There are no convertible securities, exchangeable securities or securities with warrants in Rentokil Initial. Rentokil Initial has no authorized share capital limit under its Articles.
Liability of Shareholders
The liability of the shareholders is limited to the amount, if any, unpaid on the shares held by them. Shareholders are referred to as members in the Articles of Rentokil Initial and the UK Companies Act 2006. All Rentokil Initial ordinary shares are fully paid and, accordingly, no further contribution of capital may be required by Rentokil Initial from the holders of Rentokil Initial ordinary shares.
Further Issuances of Share Capital and Pre-emptive Rights
Pursuant to the UK Companies Act 2006, Rentokil Initial’s directors are, with certain exceptions, not permitted to allot any equity securities without express authorization from Rentokil Initial’s shareholders. Further, under the UK Companies Act 2006, Rentokil Initial may not issue shares for cash (other than pursuant to an employee share scheme) without first making an offer to existing shareholders to allot such shares to them on the same or more favourable terms in proportion to their respective shareholdings, unless this requirement is waived by a special resolution of the shareholders.
Subject to receipt of authorization from Rentokil Initial’s shareholders, the directors may issue shares with such rights or restrictions, including shares that are redeemable at the option of Rentokil Initial or the shareholder, as the directors or Rentokil Initial by ordinary resolution may determine. Throughout this section, references to shares of Rentokil Initial refer to any shares that may be issued out of the capital of Rentokil Initial, including Rentokil Initial ordinary shares.
Changes to the Share Capital
Shareholder approval by ordinary resolution is required for Rentokil Initial to:
1
| ● | consolidate and divide all or any of its share capital into shares of larger nominal amount than its existing shares; and |
| ● | sub-divide its shares, or any of them, into shares of smaller nominal amount than its existing shares. |
The UK Companies Act 2006 contains the procedural requirements for a reduction of capital. The reduction of capital must be approved by shareholders by special resolution and must be approved by a court. The decision to approve the reduction is at the court’s discretion, and it will consider whether (a) the reduction is for a discernible purpose, (b) all shareholders are treated equally, (c) the reduction has been properly explained to shareholders and (d) the company’s creditors are safeguarded. Subject to these requirements, Rentokil Initial may reduce its share capital, its capital redemption reserve and any share premium account in any way.
Repurchase of Shares
Once approved by Rentokil Initial shareholders by ordinary resolution and subject to certain procedural requirements of the UK Companies Act 2006, Rentokil Initial may repurchase its own shares. Any shares which have been repurchased may be held as treasury shares or, if not so held, must be cancelled immediately upon the completion of the purchase, thereby reducing the amount of Rentokil Initial’s issued share capital.
Dividends
Rentokil Initial shareholders may by ordinary resolution declare dividends in accordance with the respective rights of the shareholders but no dividends shall exceed the amount recommended by the directors. No dividend shall be paid otherwise than out of profits available for distribution as specified in the UK Companies Act 2006. The directors may pay interim dividends or dividends payable at a fixed rate, if it appears to them that they are justified by the profits of Rentokil Initial available for distribution. If the directors act in good faith, they shall not incur any liability to the holders of shares conferring preferred rights for any loss they may suffer by the lawful payment of an interim dividend on any shares having deferred or non-preferred rights.
Rentokil Initial ordinary shares carry the right to receive dividends and distributions that have been declared by Rentokil Initial on a pro rata basis but have no other right to share in the profits of Rentokil Initial and are not entitled to any fixed income. Rentokil Initial may issue shares that rank prior to the Rentokil Initial ordinary shares in respect of payment of dividends.
Rentokil Initial shareholders may, at a general meeting declaring a dividend, upon the recommendation of the directors and by ordinary resolution, direct that the payment of all or any part of the dividend be satisfied by the distribution of assets and, where any difficulty arises in regard to the distribution, the directors may settle the same as they think fit.
The directors may, with the approval of Rentokil Initial shareholders by ordinary resolution, offer any holders of Rentokil Initial ordinary shares the right to elect to receive Rentokil Initial ordinary shares, credited as fully paid, instead of cash in respect of the whole (or some part, to be determined by the directors) of all or any dividend.
Rentokil Initial or the directors may fix a date as the record date by reference to which a dividend will be declared or paid, or a distribution, allotment or issue made.
No dividend or other money payable in respect of a share shall bear interest against Rentokil Initial, unless otherwise provided by the rights attached to the share.
The directors may elect to pay dividends solely by means of electronic transfer, or such other method as the directors may decide and which method may be different for different holders or groups of holders of shares, to an account nominated in writing by the holder of the shares. Rentokil Initial shall treat any payment due to shareholders who provide no, or invalid, account details as an unclaimed dividend.
Any dividend, or any amount treated as an unclaimed dividend or any other moneys payable in respect of a share shall, be forfeited and cease to remain owing by Rentokil Initial if:
2
| ● | the dividend, amount or moneys has or have remained unclaimed for six years from the date when it or they became due for payment and the directors so resolve; or |
| ● | the share in respect of which the dividend, amount or other moneys is or are payable is sold pursuant to Rentokil Initial’s untraced shares provision. |
Any such sums may (but need not) be paid by Rentokil Initial into an account separate from Rentokil Initial’s own account.
Rentokil Initial may cease sending dividend payments in respect of a share if these payments have been returned undelivered to, or left uncashed by, the shareholder on at least two consecutive occasions or, if following one such occasion, reasonable inquiries have failed to establish a shareholder’s new address. Rentokil Initial must recommence sending payments for dividends payable on that share if the shareholder claims a dividend or cashes a dividend warrant, cheque, or similar financial instrument.
Voting Rights
All Rentokil Initial ordinary shares have equal voting rights and are entitled to attend and vote at all general meetings of Rentokil Initial. Rentokil Initial may issue, subject to certain restrictions, shares with preferential voting rights. This section assumes that all shares have equal voting rights and that no preferential shares are issued.
Under English law, resolutions to be voted on by shareholders at a general meeting can be either an ordinary resolution, which means that the resolution must be passed by a simple majority of shareholders or holders of a simple majority of the shares (depending on whether the vote is by a show of hands or by a poll) present in person or by proxy and entitled to vote at the general meeting, or a special resolution, which means that the resolution must be passed by a majority of not less than 75% of the shareholders or holders of 75% of the shares (depending on whether the vote is by a show of hands or by a poll) present in person or by proxy and entitled to vote at the general meeting. For a resolution to be regarded as a special resolution, the notice of the general meeting must specify the intention to propose the resolution as a special resolution.
A resolution put to the vote at a general meeting held partly by means of electronic facility or facilities shall, unless the chair of the meeting determines that it shall be decided on a show of hands, be decided on a poll. Subject thereto, a resolution put to the vote at a general meeting shall be decided on a show of hands unless before, or on the declaration of the result of, a vote on the show of hands, or on the withdrawal of any other demand for a poll, a poll is duly demanded by:
| ● | the chair of the meeting; |
| ● | not less than five shareholders having the right to vote at the meeting; |
| ● | a shareholder or shareholders representing not less than one-tenth of the total voting rights of all the shareholders having the right to vote at the meeting (excluding any voting rights attached to any shares in Rentokil Initial held as treasury shares); or |
| ● | a shareholder or shareholders holding shares conferring a right to vote on the resolution on which an aggregate sum has been paid up equal to not less than one-tenth of the total sum paid up on all the shares conferring that right (excluding any shares in Rentokil Initial conferring a right to vote at the meeting which are held as treasury shares). |
On a show of hands, every shareholder who is present in person has one vote regardless of the number of shares held by such shareholder. Every proxy duly appointed by a shareholder entitled to vote on the resolution and present has one vote.
On a poll every shareholder present in person or by duly appointed proxy or corporate representative has one vote for every share held by the shareholder. A shareholder, proxy or corporate representative entitled to more than one vote need not, if he or she votes, use all his or her votes or cast all the votes he or she uses the same way.
3
For the purposes of determining which persons are entitled to attend or vote at a general meeting, Rentokil Initial may specify in the notice convening the meeting a time, not more than 48 hours before the time fixed for the meeting, by which a person must be entered on the register in order to have the right to attend or vote at the meeting.
In the case of joint holders, the most senior of the joint holders who tenders a vote shall be accepted to the exclusion of the votes of the other joint holders, and seniority shall be determined by the order in which the names of the holders stand in the register of shareholders.
No shareholder will be permitted to vote at a general meeting or at a separate meeting of the holders of any class of shares in Rentokil Initial, either personally or by proxy, in respect of any share held by him unless all amounts presently payable by such holder in respect of that share have been paid.
Neither English law nor Rentokil Initial’s Articles impose any limitation on the rights of non-UK residents or foreign shareholders to own Rentokil Initial ordinary shares, including the rights to hold or exercise voting rights on the Rentokil Initial ordinary shares.
Transfer of Shares
A share in certificated form may be transferred by an instrument of transfer which may be in any usual form or in any other form approved by the directors, executed by or on behalf of the transferor and, unless the share is fully paid, by or on behalf of the transferee. A share in uncertificated form may be transferred by means of the relevant system concerned.
In their absolute discretion, the directors may refuse to register the transfer of a share in certificated form unless the instrument of transfer:
| ● | is lodged, duly stamped, at the office of Rentokil Initial or such other place as the directors may appoint and is accompanied by the certificate for the share to which it relates and such other evidence as the directors may reasonably require to show the right of the transferor to make the transfer; |
| ● | is in respect of only one class of share; and |
| ● | is not in favour of more than four transferees. |
If the directors refuse to register a transfer of a share in certified form, they shall send the notice of their refusal within two months after the date on which the instrument of transfer was lodged with Rentokil Initial.
No fee shall be charged for the registration of any instrument of transfer or other document or instruction relating to or affecting the title to any share.
The directors may refuse to register a transfer of a share in uncertificated form to a person who is to hold it thereafter in certificated form in any case where Rentokil Initial is entitled to refuse to register the transfer under the Uncertificated Securities Regulations 2001.
For uncertificated shares, transfers shall be registered only in accordance with the terms of the Uncertificated Securities Regulations 2001.
Distribution of Assets on a Winding-up
If Rentokil Initial is wound up, the liquidator may, with the approval of shareholders by a special resolution and any other approvals required by law, divide among the shareholders in specie the whole or any part of the assets of Rentokil Initial and may, for that purpose, value any assets and determine how the division shall be carried out as between the shareholders or different classes of shareholders. The liquidator may, with such approvals, vest the whole or any part of the assets in trustees upon such trusts for the benefit of the shareholders as he or she may with the like sanction determine, but no shareholder shall be compelled to accept any assets upon which there is a liability.
4
Disclosure of Shareholder Ownership
There are no provisions in the Articles whereby persons acquiring, holding or disposing of a certain percentage of the Rentokil Initial ordinary shares are required to make disclosure of their ownership percentage, although there are such requirements under statute and regulation.
Untraced Shareholders
Rentokil Initial is entitled to sell, all or any of the shares of a member or the shares to which a person is entitled by transmission, if:
| ● | there has been a period of 12 years, during which at least three dividends in respect of the shares in question have become payable but no divided has been claimed (the relevant period); |
| ● | Rentokil Initial has made reasonable enquiries to establish the address of the member or person entitled; |
| ● | Rentokil Initial has sent a notice stating that it intends to sell the shares to the last known address of the member or person entitled; and |
| ● | during the relevant period and for the period of three months following the date on which sale notice is deemed to have been received by the member or person entitled, Rentokil Initial has received no indication either of the whereabouts or of the existence of such shareholder or person. |
The net proceeds of the sale shall belong to Rentokil Initial and Rentokil Initial will not be liable to the former shareholder or person who would have been entitled to the shares by transmission for the proceeds of sale. Rentokil Initial may use the proceeds for any purpose as the directors may from time to time decide.
A shareholder shall not be entitled to receive any document or information that is required or authorized to be sent or supplied to the shareholder by Rentokil Initial by a provision of the UK Companies Acts or pursuant to the Articles or to any other rules or regulations to which Rentokil Initial may be subject if documents or information sent or supplied to that shareholder by post in accordance with the Articles have been returned undelivered to Rentokil Initial:
| ● | on at least two consecutive occasions; or |
| ● | on one occasion and reasonable enquiries have failed to establish the shareholder’s address. |
Variation of Rights
If at any time the capital of Rentokil Initial is divided into different classes of shares, the rights attached to any class may be varied, either while Rentokil Initial is a going concern or during or in contemplation of a winding up in such manner (if any) as may be provided by those rights. If there are no such provisions, the rights attaching to that class may be varied either with the consent in writing of the holders of three-quarters in nominal value of the issued shares of that class (not including any treasury shares), or with the approval of a special resolution by the Rentokil Initial shareholders, passed at a separate meeting of the holders of such shares, but not otherwise.
The rights attached to any class of shares will not, unless otherwise expressly provided by the terms of issue, be deemed to be varied by: (i) the creation or issue of further shares ranking equally with them, or (ii) the purchase or redemption by Rentokil Initial of any of its own shares.
Amendment to the Articles of Association
Under English law, Rentokil Initial’s shareholders may, by special resolution, alter, delete, substitute, amend or add to its Articles. The Rentokil Initial board of directors is not authorized to change its Articles.
5
American Depositary Shares
Our ADSs are deposited pursuant to the Amended and Restated Deposit Agreement dated 26 November 2018 (the “Deposit Agreement”), by and among Rentokil Initial, the Depositary and the owners and holders of ADSs deposited with the Depositary. As of the date of this document, the Depositary’s principal executive office is located at 240 Greenwich Street, New York, New York 10286. The following is a description of the rights of the owners and holders of ADSs and the material provisions of the Deposit Agreement. For complete information, please refer to the Deposit Agreement, the form of which has been filed with the SEC as exhibit 4.1 of Rentokil Initial’s Form F-4/A filed with the SEC on 2 September 2022 (File No. 333-265455).
The Depositary will register and deliver Rentokil Initial ADSs. Each Rentokil Initial ADS will represent five Rentokil Initial ordinary shares (or a right to receive five Rentokil Initial ordinary shares) deposited with the custodian. Each Rentokil Initial ADS will also represent any other securities, cash or other property that may be held by the Depositary. The deposited Rentokil Initial ordinary shares, together with any other securities, cash or other property held by the Depositary are referred to as the “deposited securities”.
An individual may hold Rentokil Initial ADSs either (A) directly (i) by having an American depositary receipt (“ADR”), which is a certificate evidencing a specific number of Rentokil Initial ADSs, registered in his or her name, or (ii) by having uncertificated Rentokil Initial ADSs registered in his or her name, or (B) indirectly by holding a security entitlement in Rentokil Initial ADSs through his or her broker or other financial institution that is a direct or indirect participant in DTC. If an individual holds Rentokil Initial ADSs directly, he or she is registered Rentokil Initial ADS holder (a “Rentokil Initial ADS Holder”). This description is applicable to an individual that is a Rentokil Initial ADS Holder. If an individual holds the Rentokil Initial ADSs indirectly, he or she must rely on the procedures of his or her broker or other financial institution to assert the rights of Rentokil Initial ADS Holders described in this section. Such individual should consult with his or her broker or financial institution to find out what those procedures are.
Registered holders of uncertificated Rentokil Initial ADSs will receive statements from the Depositary confirming their holdings.
As a Rentokil Initial ADS Holder, Rentokil Initial will not treat such individual as one of Rentokil Initial’s shareholders and such individual will not have shareholder rights. English law governs the shareholder rights of holders of Rentokil Initial shares. The Depositary will be the holder of the Rentokil Initial ordinary shares underlying the Rentokil Initial ADSs. As a registered holder of Rentokil Initial ADSs, such individual will have Rentokil Initial ADS Holder rights. The Deposit Agreement among Rentokil Initial, the Depositary, Rentokil Initial ADS Holders and all other persons indirectly or beneficially holding Rentokil Initial ADSs sets out Rentokil Initial ADS Holder rights as well as the rights and obligations of the Depositary. New York law governs the Deposit Agreement and the Rentokil Initial ADSs.
Dividends and Other Distributions
The Depositary has agreed to pay or distribute to Rentokil Initial ADS Holders the cash dividends or other distributions it or the custodian receives on Rentokil Initial ordinary shares or other deposited securities, upon payment or deduction of its fees and expenses. Rentokil Initial ADS Holders will receive these distributions in proportion to the number of Rentokil Initial ordinary shares their Rentokil Initial ADSs represent.
Cash Distributions
The Depositary will convert any cash dividend or other cash distribution Rentokil Initial pays on the Rentokil Initial ordinary shares into U.S. dollars, if it can do so on a reasonable basis and can transfer the U.S. dollars to the United States. If that is not possible or if any government approval is needed and cannot be obtained, the Deposit Agreement allows the Depositary to distribute the foreign currency only to those Rentokil Initial ADS Holders to whom it is possible to do so. It will hold the foreign currency it cannot convert for the account of the Rentokil Initial ADS holders who have not been paid. It will not invest the foreign currency and it will not be liable for any interest.
Before making a distribution, any withholding taxes or other governmental charges that must be paid will be deducted. The Depositary will distribute only whole U.S. dollars and cents and will round fractional cents to the nearest whole cent. If the exchange rates fluctuate during a time when the Depositary cannot convert the foreign currency, Rentokil Initial ADS Holders may lose some of the value of the distribution.
6
Ordinary Shares
The Depositary may, and, if Rentokil Initial so requests in writing, shall, distribute additional Rentokil Initial ADSs representing any Rentokil Initial ordinary shares distributed as a dividend or free distribution. The Depositary will only distribute whole Rentokil Initial ADSs. It will sell Rentokil Initial ordinary shares, which would require it to deliver a fraction of a Rentokil Initial ADS (or Rentokil Initial ADSs representing those Rentokil Initial ordinary shares) and distribute the net proceeds in the same way as it does with cash. If the Depositary does not distribute additional Rentokil Initial ADSs, the outstanding Rentokil Initial ADSs will also represent the new Rentokil Initial ordinary shares. The Depositary may sell a portion of the distributed Rentokil Initial ordinary shares (or Rentokil Initial ADSs representing those Rentokil Initial ordinary shares) sufficient to pay its fees and expenses in connection with that distribution and to pay any tax or other governmental charge to which such distribution is subject.
Rights to Purchase Additional Rentokil Initial Ordinary Shares
If Rentokil Initial offers holders of its securities any rights to subscribe for additional Rentokil Initial ordinary shares or any other rights, the Depositary shall, to the extent lawful and practical (i) exercise those rights on behalf of Rentokil Initial ADS Holders, (ii) distribute those rights to Rentokil Initial ADS Holders or (iii) sell those rights and distribute the net proceeds to Rentokil Initial ADS Holders, in each case after deduction or upon payment of its fees and expenses. To the extent the Depositary does not do any of those things, it will allow the rights to lapse. In that case, no value for them will be received. The Depositary will exercise or distribute rights only if Rentokil Initial asks it to and Rentokil Initial and the Depositary enter into a separate agreement setting forth the conditions and procedures of the offering. If the Depositary will exercise rights, it will purchase the securities to which the rights relate and distribute those securities or, in the case of Rentokil Initial ordinary shares, new Rentokil Initial ADSs representing the new Rentokil Initial ordinary shares, to subscribing Rentokil Initial ADS Holders, but only if Rentokil Initial ADS Holders have paid the exercise price to the Depositary. U.S. securities laws may restrict the ability of the Depositary to distribute rights or Rentokil Initial ADSs or other securities issued on exercise of rights to all or certain Rentokil Initial ADS Holders, and the securities distributed may be subject to restrictions on transfer. The Depositary may sell a portion of the rights to subscribe for additional Rentokil Initial ordinary shares sufficient to pay any tax or other governmental charge to which such distribution is subject.
Other Distributions
The Depositary will send to Rentokil Initial ADS Holders anything else Rentokil Initial distributes on deposited securities by any means it thinks is legal, fair and practical. If it cannot make the distribution in that way, the Depositary has a choice. It may decide to sell what Rentokil Initial distributed and distribute the net proceeds, in the same way as it does with cash. Or, it may decide to hold what Rentokil Initial distributed, in which case Rentokil Initial ADSs will also represent the newly distributed property. However, the Depositary is not required to distribute any securities (other than Rentokil Initial ADSs) to Rentokil Initial ADS Holders unless it receives satisfactory assurances from Rentokil Initial that it is legal to make that distribution. The Depositary may sell a portion of the distributed securities or property sufficient to pay its fees and expenses in connection with that distribution and to pay any tax or other governmental charge to which such distribution is subject. U.S. securities laws may restrict the ability of the Depositary to distribute securities to all or certain Rentokil Initial ADS Holders, and the securities distributed may be subject to restrictions on transfer.
The Depositary is not responsible if it decides that it is unlawful or impractical to make a distribution available to any Rentokil Initial ADS Holders. Rentokil Initial has no obligation to register Rentokil Initial ADSs, Rentokil Initial ordinary shares, rights or other securities under the U.S. Securities Act. Rentokil Initial also has no obligation to take any other action to permit the distribution of Rentokil Initial ADSs, Rentokil Initial ordinary shares, rights or anything else to Rentokil Initial ADS Holders. This means that Rentokil Initial ADS Holders may not receive the distributions Rentokil Initial makes on Rentokil Initial ordinary shares or any value for them if it is illegal or impractical for it to make them available to Rentokil Initial ADS Holders.
Deposit, Withdrawal and Cancellation
The Depositary will deliver Rentokil Initial ADSs if the Rentokil Initial ADS Holder or his or her broker deposits Rentokil Initial ordinary shares or evidence of rights to receive Rentokil Initial ordinary shares with the custodian. Upon payment of its fees and expenses and of any taxes or charges, such as stamp taxes or stock transfer taxes or fees, the Depositary will register the appropriate number of Rentokil Initial ADSs in the names requested and will deliver the Rentokil Initial ADSs to or upon the order of the person or persons that made the deposit.
7
Rentokil Initial ADS Holders may surrender their Rentokil Initial ADSs to the Depositary for the purpose of withdrawal. Upon payment of its fees and expenses and of any taxes or charges, such as stamp taxes or stock transfer taxes or fees, the Depositary will deliver Rentokil Initial ordinary shares and any other deposited securities underlying the Rentokil Initial ADSs to the Rentokil Initial ADS Holder or a person the Rentokil Initial ADS Holder designates at the office of the custodian. Or, at such individual’s request, risk and expense, the Depositary will deliver the deposited securities at its office, if feasible. However, the Depositary is not required to accept surrender of Rentokil Initial ADSs to the extent it would require delivery of a fraction of a deposited share or other security. The Depositary may charge the Rentokil Initial ADS Holder a fee and its expenses for instructing the custodian regarding delivery of deposited securities.
Rentokil Initial ADS Holders may surrender their ADRs to the Depositary for the purpose of exchanging their ADRs for uncertificated Rentokil Initial ADSs. The Depositary will cancel that ADR and will send to the Rentokil Initial ADS Holder a statement confirming that the Rentokil Initial ADS Holder is the registered holder of uncertificated Rentokil Initial ADSs. Upon receipt by the Depositary of a proper instruction from a registered holder of uncertificated Rentokil Initial ADSs requesting the exchange of uncertificated Rentokil Initial ADSs for certificated Rentokil Initial ADSs, the Depositary will execute and deliver to the Rentokil Initial ADS Holder an ADR evidencing those Rentokil Initial ADSs.
Voting Rights
Rentokil Initial ADS Holders may instruct the Depositary how to vote the number of deposited shares their Rentokil Initial ADSs represent. After Rentokil Initial requests the Depositary to solicit Rentokil Initial ADS Holders’ voting instructions, the Depositary will notify such individuals of a shareholders’ meeting and send or make voting materials available to them. Those materials will describe the matters to be voted on and explain how Rentokil Initial ADS Holders may instruct the Depositary how to vote. For instructions to be valid, they must reach the Depositary by a date set by the Depositary. The Depositary will try, as far as practical, subject to the laws of England and Wales and the provisions of Rentokil Initial’s Articles or similar documents, to vote or to have its agents vote the Rentokil Initial ordinary shares or other deposited securities as instructed by Rentokil Initial ADS Holders.
Except by instructing the Depositary as described above, Rentokil Initial ADS Holders won’t be able to exercise voting rights unless they surrender their Rentokil Initial ADSs and withdraw the Rentokil Initial ordinary shares. However, Rentokil Initial ADS Holders may not know about the meeting enough in advance to withdraw the Rentokil Initial ordinary shares. In any event, the Depositary will not exercise any discretion in voting deposited securities and it will only vote or attempt to vote as instructed.
Rentokil Initial cannot assure Rentokil Initial ADS Holders that they will receive the voting materials in time to ensure that they can instruct the Depositary to vote their Rentokil Initial ordinary shares. In addition, the Depositary and its agents are not responsible for failing to carry out voting instructions or for the manner of carrying out voting instructions. This means that Rentokil Initial ADS Holders may not be able to exercise voting rights and there may be nothing they can do if their Rentokil Initial ordinary shares are not voted as they requested.
In order to give them a reasonable opportunity to instruct the Depositary as to the exercise of voting rights relating to deposited securities, if Rentokil Initial requests the Depositary to act, Rentokil Initial agrees to give the Depositary notice of any such meeting and details concerning the matters to be voted upon at least 40 days in advance of the meeting, or, in the case of any meeting that is not an annual general meeting, a number of days agreed in writing between Rentokil Initial and the Depositary that shall not be less than 20 days, before the meeting date.
Tender and Exchange Offers; Redemption, Replacement or Cancellation of Deposited Securities
The Depositary will not tender deposited securities in any voluntary tender, exchange offer or similar offer unless instructed to do so by a Rentokil Initial ADS Holder surrendering Rentokil Initial ADSs and subject to any conditions or procedures the Depositary may establish.
If deposited securities are redeemed for cash in a transaction that is mandatory for the Depositary as a holder of deposited securities, the Depositary will call for surrender of a corresponding number of Rentokil Initial ADSs and distribute the net redemption money to the holders of called Rentokil Initial ADSs upon surrender of those Rentokil Initial ADSs.
8
If there is any change in the deposited securities such as a split-up, combination or other reclassification, or any merger, consolidation, recapitalization or reorganization affecting the issuer of deposited securities in which the Depositary receives new securities in exchange for or in lieu of the old deposited securities, the Depositary will hold those replacement securities as deposited securities under the Deposit Agreement. However, if the Depositary decides it would not be lawful and practical to hold the replacement securities because those securities could not be distributed to Rentokil Initial ADS Holders or for any other reason, the Depositary may instead sell the replacement securities and distribute the net proceeds upon surrender of the Rentokil Initial ADSs.
If there is a replacement of the deposited securities and the Depositary will continue to hold the replacement securities, the Depositary may distribute new Rentokil Initial ADSs representing the new deposited securities or ask Rentokil Initial ADS Holders to surrender their outstanding ADRs in exchange for new ADRs identifying the new deposited securities.
If there are no deposited securities underlying Rentokil Initial ADSs, including if the deposited securities are cancelled, or if the deposited securities underlying Rentokil Initial ADSs have become apparently worthless, the Depositary may call for surrender of those Rentokil Initial ADSs or cancel those Rentokil Initial ADSs upon notice to the Rentokil Initial ADS Holders.
Amendment and Termination
Rentokil Initial may agree with the Depositary to amend the Deposit Agreement and the ADRs without Rentokil Initial ADS Holders’ consent for any reason. If an amendment adds or increases fees or charges, except for taxes and other governmental charges or expenses of the Depositary for registration fees, facsimile costs, delivery charges or similar items, or prejudices a substantial right (including, without limitation, any economic, voting or other material right) of Rentokil Initial ADS Holders, it will not become effective for outstanding Rentokil Initial ADSs until 30 days after the Depositary notifies Rentokil Initial ADS Holders of the amendment. At the time an amendment becomes effective, Rentokil Initial ADS Holders are considered, by continuing to hold their Rentokil Initial ADSs, to agree to the amendment and to be bound by the ADRs and the Deposit Agreement as amended.
The Depositary will initiate termination of the Deposit Agreement if Rentokil Initial instructs it to do so. The Depositary may initiate termination of the Deposit Agreement if:
| ● | 60 days have passed since the Depositary told Rentokil Initial it wants to resign, but a successor Depositary has not been appointed and accepted its appointment; |
| ● | Rentokil Initial delists the Rentokil Initial ADSs from an exchange in the United States on which they were listed and, 30 days after the delisting, does not list the Rentokil Initial ADSs on another exchange in the United States or makes arrangements for trading of Rentokil Initial ADSs on the U.S. over-the-counter market; |
| ● | Rentokil Initial delists its Rentokil Initial ordinary shares from an exchange outside the United States on which they were listed and does not list the Rentokil Initial ordinary shares on another exchange outside the United States; |
| ● | the Depositary has reason to believe the Rentokil Initial ADSs have become, or will become, ineligible for registration on Form F-6 under the U.S. Securities Act of 1933; |
| ● | Rentokil Initial appears to be insolvent or enters insolvency proceedings; |
| ● | all or substantially all the value of the deposited securities has been distributed either in cash or in the form of securities; |
| ● | there are no deposited securities underlying the Rentokil Initial ADSs or the underlying deposited securities have become apparently worthless; or |
| ● | there has been a replacement of deposited securities. |
If the Deposit Agreement will terminate, the Depositary will notify Rentokil Initial ADS Holders at least 90 days before the termination date. At any time after the termination date, the Depositary may sell the deposited securities. After that, the Depositary will hold the money it received on the sale, as well as any other cash it is holding under the Deposit Agreement, unsegregated and without liability for interest, for the pro rata benefit of the Rentokil Initial ADS Holders that have not surrendered their Rentokil Initial ADSs.
9
Normally, the Depositary will sell as soon as practicable after the termination date.
After the termination date and before the Depositary sells, Rentokil Initial ADS Holders can still surrender their Rentokil Initial ADSs and receive delivery of deposited securities, except that the Depositary may refuse to accept a surrender for the purpose of withdrawing deposited securities or reverse previously accepted surrenders of that kind that have not settled if it would interfere with the selling process. The Depositary may refuse to accept a surrender for the purpose of withdrawing sale proceeds until all the deposited securities have been sold. The Depositary will continue to collect distributions on deposited securities, but, after the termination date, the Depositary is not required to register any transfer of Rentokil Initial ADSs or distribute any dividends or other distributions on deposited securities to the Rentokil Initial ADS Holders (until they surrender their Rentokil Initial ADSs) or give any notices or perform any other duties under the Deposit Agreement except as described in this paragraph.
Limitations on Obligations and Liability
The Deposit Agreement expressly limits the obligations of Rentokil Initial and the Depositary. It also limits the liability of Rentokil Initial and the Depositary. Rentokil Initial and the Depositary:
| ● | are only obligated to take the actions specifically set forth in the Deposit Agreement without negligence or bad faith, and the Depositary will not be a fiduciary or have any fiduciary duty to Rentokil Initial ADS Holders; |
| ● | are not liable if Rentokil Initial or the Depositary is prevented or delayed by law or by events or circumstances beyond its ability to prevent or counteract with reasonable care or effort from performing each of its obligations under the Deposit Agreement; |
| ● | are not liable if Rentokil Initial or the Depositary exercises discretion permitted under the Deposit Agreement; |
| ● | are not liable for the inability of any Rentokil Initial ADS Holder to benefit from any distribution on deposited securities that is not made available to Rentokil Initial ADS Holders under the terms of the Deposit Agreement, or for any special, consequential, indirect or punitive damages for any breach of the terms of the Deposit Agreement; |
| ● | have no obligation to become involved in a lawsuit or other proceeding related to the Rentokil Initial ADSs or the Deposit Agreement on Rentokil Initial ADS Holders’ behalf or on behalf of any other person; |
| ● | may rely upon any documents Rentokil Initial or the Depositary believes in good faith to be genuine and to have been signed or presented by the proper person; |
| ● | are not liable for the acts or omissions of any securities depository, clearing agency or settlement system; |
| ● | are not liable for the inability or failure of a Rentokil Initial ADS Holder to obtain the benefit of a foreign tax credit, reduced rate of withholding or refund of amounts withheld in respect of tax or any other tax benefit; and |
| ● | the Depositary has no duty to make any determination or provide any information as to the tax status of Rentokil Initial, or any liability for any tax consequences that may be incurred by Rentokil Initial ADS Holders as a result of owning or holding Rentokil Initial ADSs. |
In the Deposit Agreement, Rentokil Initial and the Depositary agree to indemnify each other under certain circumstances.
10
Requirements for Depositary Actions
Before the Depositary will deliver or register a transfer of Rentokil Initial ADSs, make a distribution on Rentokil Initial ADSs, or permit withdrawal of Rentokil Initial ordinary shares, the Depositary may require:
| ● | payment of stock transfer or other taxes or other governmental charges and transfer or registration fees charged by third parties for the transfer of any Rentokil Initial ordinary shares or other deposited securities; |
| ● | satisfactory proof of the identity and genuineness of any signature or other information it deems necessary; and |
| ● | compliance with regulations it may establish, from time to time, consistent with the Deposit Agreement, including presentation of transfer documents. |
The Depositary may refuse to deliver Rentokil Initial ADSs or register transfers of Rentokil Initial ADSs when the transfer books of the Depositary or Rentokil Initial’s transfer books are closed or at any time if the Depositary or Rentokil Initial thinks it advisable to do so.
The Right to Receive the Ordinary Shares Underlying the Rentokil Initial ADSs
Rentokil Initial ADS Holders have the right to cancel their Rentokil Initial ADSs and withdraw the underlying Rentokil Initial ordinary shares at any time except:
| ● | when temporary delays arise because: (i) the Depositary has closed its transfer books or Rentokil Initial has closed its transfer books; (ii) the transfer of Rentokil Initial ordinary shares is blocked to permit voting at a shareholders’ meeting; or (iii) Rentokil Initial is paying a dividend on its Rentokil Initial ordinary shares; |
| ● | when Rentokil Initial ADS Holders owe money to pay fees, taxes and similar charges; or |
| ● | when it is necessary to prohibit withdrawals in order to comply with any laws or governmental regulations that apply to Rentokil Initial ADSs or to the withdrawal of Rentokil Initial ordinary shares or other deposited securities. |
This right of withdrawal may not be limited by any other provision of the Deposit Agreement.
Direct Registration System
In the Deposit Agreement, all parties to the Deposit Agreement acknowledge that DRS and Profile will apply to the Rentokil Initial ADSs. DRS is a system administered by DTC that facilitates interchange between registered holding of uncertificated ADSs and holding of security entitlements in ADSs through DTC and a DTC participant. Profile is a feature of DRS that allows a DTC participant, claiming to act on behalf of a registered holder of uncertificated ADSs, to direct the Depositary to register a transfer of those ADSs to DTC or its nominee and to deliver those ADSs to the DTC account of that DTC participant without receipt by the Depositary of prior authorization from the ADS holder to register that transfer.
In connection with and in accordance with the arrangements and procedures relating to DRS/Profile, the parties to the Deposit Agreement understand that the Depositary will not determine whether the DTC participant that is claiming to be acting on behalf of a Rentokil Initial ADS Holder in requesting registration of transfer and delivery as described in the paragraph above has the actual authority to act on behalf of the Rentokil Initial ADS Holder (notwithstanding any requirements under the Uniform Commercial Code). In the Deposit Agreement, the parties agree that the Depositary’s reliance on and compliance with instructions received by the Depositary through the DRS/Profile system and in accordance with the Deposit Agreement will not constitute negligence or bad faith on the part of the Depositary.
Shareholder Communications; Inspection of Register of Holders of ADSs
The Depositary will make available for Rentokil Initial ADS Holders’ inspection at its office all communications that it receives from Rentokil Initial as a holder of deposited securities that Rentokil Initial makes generally available to holders of deposited securities. The Depositary will send to Rentokil Initial ADS Holders copies of those communications or otherwise make those communications available to them if Rentokil Initial asks it to.
11
Rentokil Initial ADS Holders have a right to inspect the register of Rentokil Initial ADS Holders, but not for the purpose of contacting those holders about a matter unrelated to their business or the Rentokil Initial ADSs.
Jury Trial Waiver
The Deposit Agreement provides that, to the extent permitted by law, Rentokil Initial ADS Holders waive the right to a jury trial of any claim they may have against Rentokil Initial or the Depositary arising out of or relating to Rentokil Initial ordinary shares, Rentokil Initial ADSs or the Deposit Agreement, including any claim under the U.S. federal securities laws. If Rentokil Initial or the Depositary opposed a jury trial demand based on the waiver, the court would determine whether the waiver was enforceable in the facts and circumstances of that case in accordance with applicable case law.
Rentokil Initial ADS Holders will not, by agreeing to the terms of the Deposit Agreement, be deemed to have waived Rentokil Initial’s or the Depositary’s compliance with U.S. federal securities laws or the rules and regulations promulgated thereunder.
12
Exhibit 11.1


|
DEALING A CORE GROUP POLICY |
|
|
Key Points to Remember: •
You must not deal in any securities of the Group if you are in possession of inside information or material non-public information about the Group. You must also not recommend or encourage someone else to deal in the Group’s securities at that time – even if you will not profit from such dealing.
•
You must not disclose any confidential information about the Group (including any inside information or material non-public information) except where you are required to do so as part of your employment or duties. This means that you should not share the Group’s confidential information with family, friends or business acquaintances.
•
You may, from time to time, be given access to inside information or material non-public information about another group of companies (for example, one of the Group’s customers or suppliers). You must not deal in the securities of that group of companies at those times.
•
Failure to comply with this policy may result in internal disciplinary action. It may also mean that you have committed a civil and/or criminal offence.
•
The Company’s directors, the Executive Leadership Team, the Group Leadership Forum, and certain colleagues with access to financial systems or documents detailing the Company’s financial results must adhere to the Group’s Dealing clearance procedures at all times.
|
1
Scope and Audience
This policy has been designed to ensure that you do not misuse, or place yourself under suspicion of misusing, information about the Group which you have, that could be price sensitive to the Company’s securities (which includes, amongst other things, its stocks and shares) and is not public.
Part A of this policy applies to all directors and colleagues of Rentokil Initial plc (the Company) and its subsidiaries.
Part B of this policy contains the Dealing clearance procedures which must be observed by the Company’s PDMRs (Persons Discharging Managerial Responsibilities) and those colleagues who have been told that the clearance procedures apply to them. This means that there will be certain times when such persons cannot Deal in Company Securities.
Part C sets out certain additional obligations which only apply to PDMRs.
Schedule 1 sets out the meaning of capitalised words used in this code.
Part A - Group-Wide Dealing Obligations
Part A applies to all colleagues.
1. |
You must not deal in any securities of the Group if you are in possession of inside information or material non-public information about the Group. You must also not recommend or encourage someone else to deal in the Group’s securities at that time – even if you will not profit from such dealing. |
2. |
You must not disclose any confidential information about the Group (including any inside information or material non-public information) except where you are required to do so as part of your employment or duties. This means that you should not share the Group’s confidential information with family, friends or business acquaintances. |
3. |
You may, from time to time, be given access to inside information or material non-public information about another group of companies (for example, one of the Group’s customers or suppliers). You must not deal in the securities of that group of companies at those times. |
4. |
The Group’s Dealing clearance procedures (as detailed in Part B of this policy) apply to the Company’s directors and to colleagues who are able to access restricted information about the Group (for example, colleagues who are involved in the preparation of the Group’s financial reports and results and those working on other sensitive matters). You will be told if you are required to comply with the Dealing clearance procedures. |
5. |
The Company’s directors, the Executive Leadership Team, the Group Leadership Forum, and certain colleagues with access to financial systems or documents detailing the Company’s financial results must adhere to the Group’s Dealing clearance procedures at all times. You will be told if you are considered to be on this Restricted Persons List, and |
2
required to comply with the Dealing clearance procedures at all times, until notified otherwise.
6. |
Failure to comply with this policy may result in disciplinary action. It may also mean that you have committed a civil and/or criminal offence. |
7. |
If you have any questions about this policy, or if you are not sure whether you can deal in securities at any particular time, please contact the Group General Counsel & Company Secretary or the Deputy Company Secretary. |
Part B – Dealing clearance procedures
Part B applies to Directors of Rentokil Initial plc, and colleagues who are on the Restricted Employees List.
Please refer to Schedule 1 for defined terms, including Closed Period and Dealing.
1.Clearance to Deal
a. |
You must not Deal for yourself or for anyone else, directly or indirectly, in Company Securities without obtaining clearance from the Company in advance. |
b. |
Colleagues must apply for clearance to Deal through the Rentokil Project Portal (https://rentokilprojectportal.com) . |
c. |
PDMRs should speak to the Group General Counsel & Company Secretary before seeking written clearance to deal. |
d. |
You must not submit an application for clearance to Deal if you are in possession of Inside Information or Material Non-Public Information. If you become aware that you are or may be in possession of Inside Information or Material Non-Public Information after you submit an application, you must inform the Group General Counsel & Company Secretary as soon as possible and you must refrain from Dealing (even if you have been given clearance). |
e. |
You will receive a written response to your application, normally within five business days. The Company will not normally give you reasons if you are refused permission to Deal. You must keep any refusal confidential and not discuss it with any other person. |
f. |
If you are given clearance, you will be advised of the approved clearance window. If you do not instruct the Deal within the approval window, you will need to seek clearance again. |
g. |
Clearance to Deal may be given subject to conditions. Where this is the case, you must observe those conditions when Dealing. |
2.Further guidance
3
If you are uncertain as to whether or not a particular transaction requires clearance after reviewing this Policy,you must obtain guidance from the Group General Counsel & Company Secretary or the Deputy Company Secretary before making any instruction.
If you act as the trustee of a trust, you should speak to the Group General Counsel & Company Secretary about your obligations in respect of any Dealing in Company Securities carried out by the trustee(s) of that trust.
You should seek further guidance from the Group General Counsel & Company Secretary before transacting in:
| a. | units or shares in a collective investment undertaking (e.g. a UCITS or an Alternative Investment Fund) which holds, or might hold, Company Securities; or |
| b. | financial instruments which provide exposure to a portfolio of assets which has, or may have, an exposure to Company Securities. |
This is the case even if you do not intend to transact in Company Securities by making the relevant investment.
3.Definition of Dealing
Dealing has a very broad definition. It means any change to the number of shares or securities you personally receive a benefit from. Common transactions that require clearance include:
| - | Buying or selling shares, ADRs, or securities, including setting a limit order |
| - | Exercising share awards and options (including selling to cover tax and selling all) |
| - | Entering into the Dividend Reinvestment Plan, or exiting the Dividend |
| - | Entering into or exiting a Trading Plan |
| - | Entering into a Reinvestment Plan |
| - | Transferring shares or ADRs to someone else |
| - | Transacting in financial instruments |
| - | Using Company Securities as security for a loan or other obligation |
Part C – Additional provisions for PDMRs
PDMRs - Persons Discharging Managerial Responsibilities - are the Board of Directors of Rentokil Initial plc. Part C only applies to these individuals.
1. |
Notification of transactions |
a. |
You must notify the Company and the FCA in writing of every Notifiable Transaction in Company Securities conducted for your account as follows: |
4
i. |
Notifications to the Company must be sent to the Group General Counsel & Company Secretary as soon as practicable and in any event within one business day of the transaction date. You should ensure that your investment managers (whether discretionary or not) notify you of any Notifiable Transactions conducted on your behalf promptly so as to allow you to notify the Company within this time frame. |
ii. |
Notifications to the FCA must be made within three business days of the transaction date. Unless you notify the Group General Counsel & Company Secretary otherwise, the Company will submit the form to the FCA on your behalf, although you will retain responsibility for ensuring that your obligations have been complied with. |
b. |
If you are uncertain as to whether or not a particular transaction is a Notifiable Transaction, you must obtain guidance from the Group General Counsel & Company Secretary before instructing the transaction. |
2. PCAs and investment managers
c. |
You must provide the Company with a list of persons closely associated with you (your PCAs) on your appointment, and notify the Company of any changes that need to be made to that list. |
d. |
You should ask your PCAs not to Deal (whether directly or through an investment manager) in Company Securities during Closed Periods. |
e. |
Your PCAs are also required to notify the Company and the FCA in writing, within the time frames given in paragraph 1, of every Notifiable Transaction conducted for their account. You should inform your PCAs in writing of this requirement and keep a copy. A signed copy of the letter should also be returned to the Group General Counsel & Company Secretary; the Group General Counsel & Company Secretary will provide you with a letter that you can use to do this. Unless you or your PCAs notify the Group General Counsel & Company Secretary otherwise, the Company will submit the form to the FCA on their behalf, although your PCAs will retain responsibility for ensuring their obligations have been complied with. |
f. |
You must ask your investment managers (whether or not discretionary) not to Deal in Company Securities on your behalf during Closed Periods. |
Schedule 1 - Defined terms
‘Closed Period’ means any of the following:
5
a)the period from the end of the relevant financial year up to the release of the preliminary announcement of the Company’s annual results (or, where no such announcement is released, up to the publication of the Company’s annual financial report) or, if longer, the period of 30 calendar days before such release (or publication);
b)the period from the end of the relevant financial period up to the release of the Company’s half-yearly financial report or, if longer, the period of 30 calendar days before such release; and
c)the period from the end of the relevant financial period up to the release of each of the Company’s first quarter trading update and third quarter trading update (if applicable).
‘Company Securities’ means any publicly traded or quoted shares or debt instruments of the Company (or of any of the Company’s subsidiaries or subsidiary undertakings) or any derivatives or other financial instruments linked to any of them. This would include, amongst other things, stocks, shares, depositary receipts, options (including phantom options) and bonds.
‘Dealing’ (together with corresponding terms such as ‘Deal’ and ‘Deals’) means any change to the number of shares or securities you personally receive a benefit from. Common transactions that require clearance include:
- |
Buying or selling shares, ADRs, or securities, including setting a limit order |
- |
Exercising share awards and options (including selling to cover tax and selling all) |
- |
Entering into the Dividend Reinvestment Plan, or exiting the Dividend |
- |
Entering into or exiting a Trading Plan |
- |
Entering into a Reinvestment Plan |
- |
Transferring shares or ADRs to someone else |
- |
Transacting in financial instruments |
- |
Using Company Securities as security for a loan or other obligation |
‘FCA’ means the UK Financial Conduct Authority.
The ‘Group’ means the Company and its subsidiaries.
‘Inside Information’ means any non-public information of a precise nature relating, directly or indirectly, to a business or financial position which, if it were made public, would be likely to have a significant effect on the price of a company’s securities.
‘Investment Programme’ means a share acquisition scheme relating only to the Company’s shares under which: a) shares are purchased by a Restricted Person pursuant to a regular standing order or direct debit or by regular deduction from the person’s salary or director’s fees; or b) shares are acquired by a Restricted Person by way of a standing election to re-invest dividends or other distributions received; or c)
6
shares are acquired as part payment of a Restricted Person’s remuneration or director’s fees.
‘Market Abuse Regulation’ means the assimilated EU law version of the EU Market Abuse Regulation (596/2014) which has applied in the UK since the end of the Brexit transition period.
‘Material Non-Public Information’ means information about a company that has not been disclosed to the public and that would be important to a reasonable person in determining whether to buy, sell or hold the shares or other securities of the company to which the information relates. Even after disclosure of information has been made, it remains “non-public” until investors have been given a reasonable amount of time to analyse the information (generally at least one full trading day after it has been disclosed by a news release, SEC filing or publicly-accessible conference call).
‘Notifiable Transaction’ means any transaction relating to Company Securities conducted for the account of a PDMR or PCA, whether the transaction was conducted by the PDMR or PCA or on his or her behalf by a third party and regardless of whether or not the PDMR or PCA had control over the transaction. This captures every transaction which changes a PDMR’s or PCA’s holding of Company Securities, even if the transaction does not require clearance under this code. It also includes gifts of Company Securities, the grant of options or share awards, the exercise of options or vesting of share awards and transactions carried out by investment managers or other third parties on behalf of a PDMR, including where discretion is exercised by such investment managers or third parties and including under Trading Plans or Investment Programmes.
‘PCA’ means a person closely associated with a PDMR, being:
a)a spouse, or a partner considered to be equivalent to a spouse in accordance with national law; or
b)a dependent child in accordance with national law; or
c)a relative who has shared the same household for at least one year on the date of the transaction concerned; or
d)a legal person, trust or partnership, the managerial responsibilities of which are discharged by a PDMR (or by a person referred to in paragraphs a), b), or c) of this definition), which is directly or indirectly controlled by such a person, which is set up for the benefit of such a person, or the economic interests of which are substantially equivalent to those of such a person.
‘PDMR’ means a person discharging managerial responsibilities in respect of the Company, being either:
a)a director of the Company; or
b)any other employee who has been told that they are a PDMR.
7
‘Restricted Person’ means:
a)a PDMR; or
b)any other person who has been told by the Company that the clearance procedures in Part B of this code apply to him or her.
‘Trading Plan’ means a written plan (including, for the avoidance of doubt, a Rule 10b5-1 trading plan) entered into by a Restricted Person and an independent third party that sets out a strategy for the acquisition and/or disposal of Company Securities by the Restricted Person, and:
a)specifies the amount of Company Securities to be dealt in and the price at which and the date on which the Company Securities are to be dealt in; or
b)gives discretion to that independent third party to make trading decisions about the amount of Company Securities to be dealt in and the price at which and the date on which the Company Securities are to be dealt in; or
c)includes a method for determining the amount of Company Securities to be dealt in and the price at which and the date on which the Company Securities are to be dealt in.
Policy Information
Policy Owner: |
Group General Counsel & Company Secretary |
Policy Creation Date: |
12 December 2019 |
Last Review Date: |
11 December 2025 |
Current Revision Date: |
1 January 2026 |
Policy Review History
Review Date: |
Summary of Revision: |
December 2025 |
●
The Group-wide Share Dealing Policy and the Dealing Code have been combined into a new single Dealing Policy.
●
A restricted persons list has been introduced in place of a closed period list.
|
8
Exhibit 12.1
CERTIFICATION PURSUANT TO SECTION 302 OF THE SARBANES-OXLEY ACT 2002
I, Michael Duffy, certify that:
1. |
I have reviewed this annual report on Form 20-F of Rentokil Initial Plc (the “company”); |
2. |
Based on my knowledge, this report does not contain any untrue statement of a material fact or omit to state a material fact necessary to make the statements made, in light of the circumstances under which such statements were made, not misleading with respect to the period covered by this report; |
3. |
Based on my knowledge, the financial statements, and other financial information included in this report, fairly present in all material respects the financial condition, results of operations and cash flows of the company as of, and for, the periods presented in this report; |
4. |
The company’s other certifying officer and I are responsible for establishing and maintaining disclosure controls and procedures (as defined in Exchange Act Rules 13a-15(e) and 15d-15(e)) and internal control over financial reporting (as defined in Exchange Act Rules 13a-15(f) and 15d-15(f)) for the company and have: |
a. |
Designed such disclosure controls and procedures, or caused such disclosure controls and procedures to be designed under our supervision, to ensure that material information relating to the company, including its consolidated subsidiaries, is made known to us by others within those entities, particularly during the period in which this report is being prepared; |
b. |
Designed such internal control over financial reporting, or caused such internal control over financial reporting to be designed under our supervision, to provide reasonable assurance regarding the reliability of financial reporting and the preparation of financial statements for external purposes in accordance with generally accepted accounting principles; |
c. |
Evaluated the effectiveness of the company’s disclosure controls and procedures and presented in this report our conclusions about the effectiveness of the disclosure controls and procedures, as of the end of the period covered by this report based on such evaluation; and |
d. |
Disclosed in this report any change in the company’s internal control over financial reporting that occurred during the period covered by the annual report that has materially affected, or is reasonably likely to materially affect, the company’s internal control over financial reporting; and |
5. |
The company’s other certifying officer and I have disclosed, based on our most recent evaluation of internal control over financial reporting, to the company’s auditors and the audit committee of the company’s board of directors (or persons performing the equivalent functions): |
a. |
All significant deficiencies and material weaknesses in the design or operation of internal control over financial reporting which are reasonably likely to adversely affect the company’s ability to record, process, summarize and report financial information; and |
b. |
Any fraud, whether or not material, that involves management or other employees who have a significant role in the company’s internal control over financial reporting. |
Date: |
25 March 2026 |
|
|
|
|
By: |
/s/ Michael A. Duffy |
|
|
|
|
Name: |
Michael A. Duffy |
|
Title: |
Chief Executive, Rentokil Initial plc |
|
Exhibit 12.2
CERTIFICATION PURSUANT TO SECTION 302 OF THE SARBANES-OXLEY ACT 2002
I, Paul Edgecliffe-Johnson, certify that:
1. |
I have reviewed this annual report on Form 20-F of Rentokil Initial Plc (the “company”); |
2. |
Based on my knowledge, this report does not contain any untrue statement of a material fact or omit to state a material fact necessary to make the statements made, in light of the circumstances under which such statements were made, not misleading with respect to the period covered by this report; |
3. |
Based on my knowledge, the financial statements, and other financial information included in this report, fairly present in all material respects the financial condition, results of operations and cash flows of the company as of, and for, the periods presented in this report; |
4. |
The company’s other certifying officer and I are responsible for establishing and maintaining disclosure controls and procedures (as defined in Exchange Act Rules 13a-15(e) and 15d-15(e)) and internal control over financial reporting (as defined in Exchange Act Rules 13a-15(f) and 15d-15(f)) for the company and have: |
a. |
Designed such disclosure controls and procedures, or caused such disclosure controls and procedures to be designed under our supervision, to ensure that material information relating to the company, including its consolidated subsidiaries, is made known to us by others within those entities, particularly during the period in which this report is being prepared; |
b. |
Designed such internal control over financial reporting, or caused such internal control over financial reporting to be designed under our supervision, to provide reasonable assurance regarding the reliability of financial reporting and the preparation of financial statements for external purposes in accordance with generally accepted accounting principles; |
c. |
Evaluated the effectiveness of the company’s disclosure controls and procedures and presented in this report our conclusions about the effectiveness of the disclosure controls and procedures, as of the end of the period covered by this report based on such evaluation; and |
d. |
Disclosed in this report any change in the company’s internal control over financial reporting that occurred during the period covered by the annual report that has materially affected, or is reasonably likely to materially affect, the company’s internal control over financial reporting; and |
5. |
The company’s other certifying officer and I have disclosed, based on our most recent evaluation of internal control over financial reporting, to the company’s auditors and the audit committee of the company’s board of directors (or persons performing the equivalent functions): |
a. |
All significant deficiencies and material weaknesses in the design or operation of internal control over financial reporting which are reasonably likely to adversely affect the company’s ability to record, process, summarize and report financial information; and |
b. |
Any fraud, whether or not material, that involves management or other employees who have a significant role in the company’s internal control over financial reporting. |
Date: |
25 March 2026 |
|
|
|
|
By: |
/s/ Paul Edgecliffe-Johnson |
|
|
|
|
Name: |
Paul Edgecliffe-Johnson |
|
Title: |
Chief Financial Officer, Rentokil Initial plc |
|
Exhibit 13.1
CERTIFICATION PURSUANT TO SECTION 906 OF THE SARBANES-OXLEY ACT OF 2002
(SUBSECTIONS (a) and (b) OF SECTION 1350, CHAPTER 63 OF TITLE 18, UNITED STATES CODE)
The certification set forth below is being submitted in connection with the Annual Report on Form 20-F of Rentokil Initial plc for the year ended December 31, 2025 (the “Report”) for the purpose of complying with Rule 13a-14(b) or Rule 15d-14(b) of the Securities Exchange Act of 1934 (the “Exchange Act”) and Section 1350 of Chapter 63 of Title 18 of the United States Code.
Michael Duffy, the Chief Executive, and Paul Edgecliffe-Johnson, the Chief Financial Officer of Rentokil Initial plc, each certifies, to such officer’s knowledge, that:
1. |
the Report fully complies with the requirements of Section 13(a) or 15(d) of the Exchange Act; and |
2. |
the information contained in the Report fairly presents, in all material respects, the financial condition and results of operations of Rentokil Initial plc. |
Date: |
25 March 2026 |
|
|
|
|
By: |
/s/ Michael A. Duffy |
|
|
|
|
Name: |
Michael A. Duffy |
|
Title: |
Chief Executive, Rentokil Initial plc |
|
Date: |
25 March 2026 |
|
|
|
|
By: |
/s/ Paul Edgecliffe-Johnson |
|
|
|
|
Name: |
Paul Edgecliffe-Johnson |
|
Title: |
Chief Financial Officer, Rentokil Initial plc |
|
|
Protecting People. Enhancing Lives. Preserving our Planet. Rentokil Initial plc Annual Report 2025 A CENTURY OF SERVICE. DELIVERING EVERY DAY. Rentokil Initial plc Annual Report 2025 |
|
Strategic Report 03 Introduction 04 Group Highlights 06 Our Business at a Glance 08 Chair’s Statement 10 Letter from the Chief Executive 14 Reasons to Invest 16 Our Strategy and Business Model 20 Capital Allocation 22 Key Performance Indicators 26 Our Businesses 34 Our Regions 38 Financial Review 42 Use of Non-IFRS Measures 48 Responsible Business 66 Section 172(1) Statement 67 Non-Financial and Sustainability Information Statement 68 Risks and Uncertainties 76 Viability Statement Corporate Governance 78 Chair’s Governance Overview 80 Board of Directors 82 Executive Leadership Team 84 Our Governance 95 Our Stakeholders 99 Audit Committee Report 107 Nomination Committee Report 113 Directors’ Remuneration Report 140 Independent Auditors’ Report Financial Statements 148 Consolidated Financial Statements 153 Notes to the Consolidated Financial Statements 193 Related Undertakings 201 Parent Company Financial Statements 203 Notes to the Parent Company Financial Statements Other Information 207 Management’s Discussion and Analysis 221 Directors’ Report 225 Additional Shareholder Information 227 Glossary Contents Non-IFRS Measures The Group uses a number of non-IFRS measures to present the financial performance of the business. These are not measures as defined under IFRS, but management believes that these measures provide valuable additional information for users of the Financial Statements, in order to better understand the underlying trading performance in the year. See pages 42 to 47 for more information. The content of this Annual Report reflects the views, opinions and status of the Company as at 5 March 2026. Letter from the Chief Executive See pages 10 to 13 Our Businesses See pages 26 to 33 Our Regions See pages 34 to 37 02 Rentokil Initial plc Annual Report 2025 |
|
After a century of service, we continue to build a higher-quality company for the next 100 years with investments in engaged colleagues, satisfied customers, leading brands, emerging technology and innovative products. The strategy we have executed in 2025 has delivered an encouraging performance. Rentokil Initial plc Annual Report 2025 03 Strategic Report Corporate Governance Financial Statements Other Information |
|
Group Highlights A year of encouraging progress Financial highlights $6,908m +3.8% 2024: $6,617m +2.3% 2024: +1.5% 11.49¢ 2024: 13.72¢ $972m 2024: $868m $1,070m +5.4% 2024: $1,008m +2.6% 2024: +2.6% +3.0% 2024: +4.4% 25.91¢ +2.4% 2024: 25.31¢ $615m +24.5% 2024: $494m $390m 2024: $462m Revenue1 Adjusted Operating Profit1 North America Organic Revenue Growth1 Basic EPS Net Cash Flows from Operating Activities Organic Revenue Growth1 International Organic Revenue Growth1 Adjusted Basic EPS Free Cash Flow Profit before tax KPIs, see page 24 Find out more on pages 38 to 41 All figures stated as continuing operations. 1. Growth rate stated at constant currency. 04 Rentokil Initial plc Annual Report 2025 |
|
Non-financial highlights 0.28 +3.4% 2024: 0.29 87.4% +110bps 2024: 86.3% 82.6% +50bps 2024: 82.1% 60.6 +2.8pts 2024: 57.8 Customer satisfaction (CVC) Lost Time Accident (LTA)1 Total colleague retention Total customer retention Operational highlights Our businesses Our regions KPIs, see pages 22 and 23 Our Pest Control business is the largest operator in North America, the world’s biggest pest control market, and a leading player globally. Our Hygiene & Wellbeing business is a leader in the provision of hygiene and wellbeing services across our International markets. Rentokil Initial operates regionally and reports performance across two regions – North America and International. The International region covers 88 countries worldwide, in Europe, the United Kingdom, Asia, the Pacific, Latin America, MENAT and Sub-Saharan Africa. Find out more on pages 50 to 52 Find out more on pages 26 to 33 Find out more on pages 34 to 37 Pest Control 83% Hygiene & Wellbeing 17% North America 62% International 38% Pest Control 83% North America 62% Hygiene & Wellbeing 17% International 38% 1. Includes the performance of France Workwear. Revenue split Revenue split Rentokil Initial plc Annual Report 2025 05 Strategic Report Corporate Governance Financial Statements Other Information |
|
Our Business at a Glance A global leader in pest control and hygiene and wellbeing services Our company We provide essential services which protect people from the dangers of pest-borne disease and the risks of poor hygiene. ENGAGED COLLEAGUES GLOBAL OPERATIONS POWER BRANDS LEADERS IN INNOVATION SERVICE EXCELLENCE RESPONSIBLE BUSINESS With c.63,400 colleagues, we are a people and values-based organisation focused on the service expertise of our teams and technicians. With two regions and two businesses across 90 countries, we are a multi-local organisation with local branches and local sales and service teams, serving millions of customers. Our power brands are Rentokil (global), Terminix (US residential and termite), Initial (global), and Ambius (global). Alongside these are strong regional and local brands. We have a strong track record of differentiated innovation in both Pest Control, such as AI-enabled connected technologies, and Hygiene & Wellbeing. We are building our expertise in digital and AI to drive real business outcomes. We perform over 34 million service visits per year – from the largest multinational companies to local shops, restaurants, and homes, and enjoy high levels of customer satisfaction. We are committed to doing business responsibly with a focus on safety, colleague training and engagement, protecting the environment and adding value to our communities. North America International 06 Rentokil Initial plc Annual Report 2025 |
|
Our culture Our vision is to be a world-class services company and our culture is critical to our success. At Rentokil Initial, our colleagues are our brand. They are our experts, focused on delivering a great service for our customers. We live our values every day through our culture, and the professional standards we set. Our culture model OUR MISSION Protecting People. Enhancing Lives. Preserving our Planet. Service We are passionate about delivering excellent customer service to every customer. Relationships We value long-lasting relationships with our colleagues and customers. Teamwork Our business is about great teamwork – getting it right, for our colleagues and customers. Responsibility A duty of care to each other, our customers, the communities in which we live and work, and the planet. Customer focused Firstly, we’re a service company. We strive to meet our customers’ needs and our people go the extra mile to do so. We work hard to support our customers and each other. When things go wrong, we put them right. Commercial We employ smart people to help the company grow by making good decisions that benefit our customers. We constantly seek out new opportunities for growth and ways to work more effectively. Belonging We value everyone’s talents and abilities and strive to attract, recruit and retain the best people from the widest possible pool of talent. We value equal opportunities as part of our way of working. Down to earth We don’t like big egos. People who succeed with us are friendly, down-to-earth, straightforward, and constantly seeking to improve. We work hard to deliver great results for our customers and colleagues. Innovative We use the latest advancements to build an innovation pipeline that sets us apart from the competition. We embrace digital technologies that help create new products and make us more efficient. OUR VALUES OUR CULTURE Rentokil Initial plc Annual Report 2025 07 Strategic Report Corporate Governance Financial Statements Other Information |
|
Chair’s Statement Delivering for our stakeholders Introduction Rentokil Initial is a global leader in pest control and hygiene and wellbeing services, two industries characterised by strong underlying growth drivers. Our strategy leverages the benefits of our global scale to win locally through strong brands and highly-engaged colleagues delivering great customer service with an innovative range of products and services. The North America region has continued to be the main area of focus and challenge for the Board in 2025 and therefore we have been encouraged by the improving performance, although there is still much to do to reach our full potential. Chief Executive succession 2025 marked the beginning of a transition for Rentokil Initial, with the announcement in May 2025 of the retirement of our Chief Executive, Andy Ransom, ahead of our AGM in May 2026. On behalf of the Board, I want to express our gratitude to Andy for his enormous contributions and commitment to the Company for 18 years and especially during his successful tenure as CEO, steering Rentokil Initial to become one of the world’s leading services businesses. Since Andy became Chief Executive, Total Shareholder Return has risen over 400%. He has also been fundamental in embedding the culture we have in the organisation to fulfil our mission of Protecting People, Enhancing Lives and Preserving our Planet. We wish him all the very best for the future. Following a rigorous global selection process, which you can read more about on pages 94 and 109, we were delighted to appoint Mike Duffy to succeed Andy as our new Chief Executive. Mike joined the business as CEO Designate on 16 February 2026 and will become Chief Executive on 16 March 2026. Andy will continue to be available until May 2026 for a smooth and well-managed leadership transition. Mike brings over 25 years of leadership experience with large US businesses with similar characteristics to Rentokil Initial – complex multi-site businesses with route-based operations. He has experience of both commercial and consumer industries and throughout his career he has delivered successful business transformations through initiatives to improve the customer experience, colleague engagement and financial returns. Mike’s energy, ambition, operational experience and clarity of strategic thinking stood out during the selection process. He is a dynamic, growth-oriented leader with deep commercial, technology and operational expertise. He shares our values and our ambition and has a strong track record of strategy execution. Mike has begun his onboarding programme and the Board and I look forward to working with him as we accelerate our strategy and continue to deliver value for all our stakeholders. After a challenging year in 2024, we are encouraged by the improving performance through 2025. We remain focused on executing our strategy in a way that meets the needs of all our stakeholders including customers, colleagues and shareholders. Richard Solomons Chair There is an exciting opportunity ahead to build upon the strong foundations in place to drive operational excellence, improved financial performance and incremental value for shareholders. Mike Duffy CEO Designate 08 Rentokil Initial plc Annual Report 2025 |
|
Performance 2025 has been a year of encouraging performance for the Group. There were early signs of an improvement in performance in North America, where Organic Revenue Growth reached 3.5% in the second half of the year compared to 1.1% in the first half. While this level of growth continues to underperform the market, this remains the primary focus of the Board and the North America leadership team. A disciplined focus on costs and cash delivered 5.4% growth in Operating Profit and 98% Free Cash Flow Conversion. Given this performance, and in line with our progressive dividend policy, the Board is recommending a final dividend of 8.24 cents per share for 2025, bringing the dividend for the year to 12.39 cents per share, up 3.0%. Strategy Throughout the year, the Board has regularly considered the Group’s performance against our strategy, including examining post-integration reviews of M&A. The Board received comprehensive updates from our regional leadership teams on strategy and performance, with a particular focus this year on the execution of our evolved strategy for North America and our plans for 2026. The annual two-day Board strategy session also provided a key opportunity for the Board to reflect and review the Group’s strategic priorities, with a primary focus on organic growth. In line with our capital allocation framework, after investment in the business to drive organic growth, we have continued to execute high-quality bolt-on M&A, focused on Growth and Emerging markets, with 36 businesses acquired in 2025. Further details on our strategy, and the progress that we have made on our strategic priorities in the year, can be found on pages 16 to 19. Safety, health and environment Our mission – Protecting People, Enhancing Lives, and Preserving our Planet – is at the centre of everything we do. The Board considers safety, health, and environment (SHE) performance at every scheduled meeting, and we are pleased to report sustained high levels of colleague safety performance. The Board also received updates on the Company’s sustainability strategy and the progress made against our sustainability initiatives over the year. More information can be found in the Responsible Business section on pages 48 to 65, and in our standalone Responsible Business Report, which can be found at rentokil-initial.com/responsible-delivery. People We believe that it is our colleagues who make Rentokil Initial what it is, and the Board is grateful to the hard-working teams of colleagues that we have around the world. The Group has continued in its investment in being a world-class Employer of Choice, and is pleased to see that our colleague retention continues to rise. During the year, we delivered 2.2m training sessions and created 540 new training items. We currently have 137 customer service apprentices and over 100 participants in our graduate scheme. The Board aims to engage with a broad range of colleagues, through attendance at meetings, site visits and colleague events. In 2025, we joined colleagues to celebrate 100 years of Rentokil. We also receive regular colleague updates, including key themes such as colleague recruitment and retention, through the Chief Executive report at each meeting. The Board is aided in monitoring the culture of the Company through an annual deep dive on culture, and a comprehensive review of the results of our confidential all-colleague survey, Your Voice Counts. It was particularly encouraging to see the results for safety, line manager performance, equal opportunities, customer service and innovation remaining very strong. The Board also received a deep dive on workforce engagement during the year. Board composition We welcomed Leanne Sheraton and Sam Mitchell as Non-Executive Directors in June 2025. Leanne was previously Chief Marketing Officer for PayPal Holdings, Inc., a global leader in fintech. She brings to the Board deep expertise in brand building, consumer marketing and digital customer acquisition. Sam was the former Chief Executive of Valvoline Inc., the North American leader in automotive maintenance. He strengthens the Board by adding recent leadership experience in a North American multi-site business-to-business and business-to-consumer company. Their full biographies can be found on page 81. Sarosh Mistry stepped down as a Non-Executive Director on 31 July 2025, and Linda Yueh will step down as a Non-Executive Director at the conclusion of the Annual General Meeting (AGM) on 7 May 2026. On behalf of the Board, I offer my sincere thanks to Linda and Sarosh for their commitment and dedication to Rentokil Initial, and their valuable advice and counsel during their time on the Board. Board effectiveness In 2025, we undertook an internal Board effectiveness review, including individual Director and Committee reviews. The findings concluded that the Board and Board Committees continue to operate effectively, and individual Directors continue to contribute meaningfully to the Board. Information on this year’s Board performance review, including the themes and actions we will be taking over 2026, and the progress made against the actions from the 2024 internal review, can be found on page 90. Looking ahead It was with mixed emotions that I informed the Board of my intention to retire as Chair of Rentokil Initial, once a successor has been appointed. That search is now underway, and until then I will continue to lead the Board and ensure a smooth transition. With a strong and resilient business model and platform for growth there are substantial opportunities for value creation across the Group. The Board will work with our new Chief Executive, Mike Duffy, to fully capitalise on these opportunities with the core priority to continue to improve organic growth in North America. In closing, I would like to extend my thanks and appreciation to the leaders and teams across Rentokil Initial for their enthusiasm and commitment to exceptional customer service throughout the year, and to our shareholders for their continued support. Richard Solomons Chair Rentokil Initial plc Annual Report 2025 09 Strategic Report Corporate Governance Financial Statements Other Information |
|
2025 was a year of encouraging progress for the Group. We have strengthened our position in North America driven by the relentless execution of our strategy and our commitment to high quality service and efficiency. Globally we continue to deliver sustainable growth with revenues increasing by 3.8%, supported by 36 bolt-on acquisitions, many in emerging markets. Andy Ransom Chief Executive Letter from the Chief Executive Executing our strategy Introduction 2025 has been an important year as we celebrated 100 years of Rentokil, a milestone that brings into the spotlight the strong foundations that have underpinned our growth into the global leader in pest control. Rentokil was born from innovation when Harold Maxwell-Lefroy formulated the first treatment which eradicated a deathwatch beetle infestation from Westminster Hall, the largest medieval timber roof in northern Europe. From this success, Harold founded a company built on science and innovation, a desire to protect people, and an unwavering commitment to provide customers with the best products and services possible. A truly customer-centric organisation puts colleagues first, something that is ever-present across Rentokil Initial as we invest in colleague engagement, training and culture to deliver exceptional service and meet, and, wherever possible, exceed the needs of our customers. What is clear from the centenary celebrations is the immense pride throughout the organisation in our rich heritage and the significant progress we have made in the year. Leading in resilient long-term growth markets Our success is underpinned by the resilient long-term growth markets of pest control and hygiene and wellbeing in which we operate, and the strength of our position in the 90 countries where we do business. The global pest control market is continuously evolving, with urbanisation and climate change creating a more favourable environment for pests, and public health concerns and stricter regulation driving up demand for control services. The global hygiene market is also an attractive industry. Like pest control, hygiene and wellbeing is an essential, non-discretionary business where growth is benefiting from a heightened focus on hand, air and surface hygiene, growing health consciousness afforded by higher disposable incomes, tightening hygiene and sanitation regulations and greater emphasis on health and wellbeing in the workplace. We are executing our strategy to capture these opportunities to deliver sustainable growth. Our markets are also characterised as highly fragmented – which favours the operators of scale where our market leadership positions and investment in product development, innovation and digital technology continue to ensure that we differentiate our global brands, support our customers’ needs to grow our market share and build competitive advantages to drive consolidation. Building sustainable growth – a year of progress 2025 was a year of encouraging progress for the Group, particularly in the second half, where, in North America, we began to see clear evidence that the initiatives we put in place at the start of the year are delivering results and improved momentum. For the year, we reported Organic Revenue Growth of 2.6%, with 1.6% in the first half and 3.5% in the second half. This acceleration in the second half of the year was particularly evident in North America, with good progress in both Pest Control Services and Business Services. Globally, we continue to benefit from our strong footprint in attractive markets. In 2025, our International business grew Revenue 4.8%. Organic Revenue Growth was 3.0% which included Organic Growth in Pest Control of 3.7% and Hygiene & Wellbeing of 2.0%. Balancing investment in growth and cost efficiency, we converted 3.8% Revenue growth into 5.4% Adjusted Operating Profit Growth and improved our margins by 0.3%pts to 15.5%. This was also a year of progress on cash flow, with Free Cash Flow increasing 24.5% and a Free Cash Flow Conversion rate of 97.6%, ahead of our target at the start of the year, and allowing us to reduce leverage to 2.6x. Find out more on pages 27 and 33 10 Rentokil Initial plc Annual Report 2025 |
|
Focus on execution in North America We are a strong leader in pest control in the US, a market where around half of the world’s pest control takes place and which is growing at c.6%, positioning us well for long-term growth. In 2025, our focus has been on growth and bringing together the complementary strengths of Rentokil and Terminix. We were encouraged to see the improving performance in the second half of the year when the initiatives we put in place supported Organic Revenue Growth of 3.5%, compared to 1.1% in the first half. At the start of the year, we outlined a comprehensive overhaul of how we were growing the business, informed by our learnings in 2024. Our growth plan focused on improving lead flow and we have been winning new business at accelerating rates supported by enhanced digital marketing to realise the benefits from better organic lead generation and high-quality, lower-cost paid-for leads. We have responded to the evolving digital landscape with increased investment in our brand websites to ensure their positioning is optimised for AI-generated search answers. In an industry where business is won locally, city by city, we have continued the roll-out of smaller, local branches through our satellite programme, to a total of over 150 to improve customer proximity and presence in the community. Alongside marketing initiatives, we’ve reorganised our local field sales operations back to branch managers to drive more accountability and visibility of results – which we can see in improvements in our core sales metrics which target improved speed from lead to inspection and proposal. In 2025, we also ran a successful pilot of door-to-door residential contract sales through the peak summer season. As well as winning new customers, in a business where the key to sustainable growth is continuing to grow the value of the contract portfolio, we also implemented a range of initiatives to improve customer retention, including investment in a customer saves team to proactively encourage terminating customers to stay and improved billing and customer communications. Customer retention now stands at 80.5% in North America, up 0.4%pts in 2025, and our Net Promoter Score from Customer Voice Counts (CVC) surveys now stands at 61.5, up 2.5pts year-on-year. Looking back on our progress since the acquisition of Terminix, we have achieved a great deal, creating a single North American organisation using aligned back-office technology. We have continued to invest in enhancing the capabilities of the combined organisation with meaningful investments in 2025 in the leadership and newly formed teams supporting pricing and data science. To fuel this investment and drive further improvements in profitability we have increasingly focused on efficiency with enhanced procurement and utilisation of outsourcing. Looking forward to 2026, we are continuing to execute our evolved marketing and multibrand strategy. Informed by the strong growth in leads from our regional brand strategy, we are planning to retain 30 pest brands – powerful national, regional and local brands – representing over 90% of our revenues across a revised target branch network of around 800, including around 220 smaller, local branches. Retaining more brands and branches, combined with an enhanced and streamlined approach to systems migration, simplifies the remaining integration. All of this puts us in a strong position to deliver on the margin enhancement and revenue growth required to achieve our target of above 20% operating margins in our North America business in 2027. Find out more on pages 34 to 36 30 Retaining 30 national, regional and local pest brands North America customer retention 80.5% up 0.4%pts in 2025 Smaller, local branches now total >150 to improve customer proximity c.800 Target branch network by end of 2026 We have responded to the evolving digital landscape with increased investment in our brand websites to ensure their positioning is optimised for AI-generated search answers Rentokil Initial plc Annual Report 2025 11 Strategic Report Corporate Governance Financial Statements Other Information |
|
Letter from the Chief Executive continued Delivering the opportunity for growth in our International region In 2025, we also made progress simplifying our International region with the divestment of France Workwear, leaving this region focused on our two core business lines of Pest Control and Hygiene & Wellbeing. These businesses have similar characteristics being route-based, primarily contract businesses with a colleague-centric approach ensuring high levels of customer satisfaction and a commitment to enhancing profitability through operational excellence and leveraging shared services across the two business lines. Across these two businesses in our International region, we continue to build on a strong base. Excellent colleague retention scores of 90.3% have been sustained from last year. We have been focused on customer service and retention, pricing and leveraging innovation, allowing us to sell more products to our established customers. Our M&A strategy to build density in existing markets and penetrate new cities with high growth potential has led to 24 acquisitions in 2025. Following success in North America, we will use 2026 to explore more potential opportunities for cost efficiencies in our International businesses. Differentiation with innovation and digital We have continued to leverage the benefits of our scale and expertise to invest in innovation and differentiate us from the competition. During 2025, we made great strides forward in our data capabilities, elevating the use of data and AI through the organisation down to the branch level to support decision making with the roll-out of Gemini for Google Workspace to our c.63,400 global workforce. In just six months, colleagues used Gemini AI on over one million occasions to support their work and we have launched our own in-house AI platform, known internally as RatGPT, which currently has over 100 AI agents in development to help us grow and become more efficient. We’re committed to embedding digital transformation across the organisation, and we’re actively using AI to drive real business outcomes. We continue to invest in technology innovation in both Pest Control and Hygiene & Wellbeing with exciting opportunities ahead. These include investments in field-based technology such as in-field camera optics in our rodent traps, generative AI to support our customers and to lower our costs, and maximising our routes to market through optimised AI search. Investing in our people and building our culture We have always seen a clear link between colleague retention and customer retention – by retaining our people we also build deeper relationships with our customers. Our colleague retention in 2025 has risen again to 87.4%. We listen carefully to our colleagues globally through our Your Voice Counts survey, a very detailed, confidential survey which provides every colleague the chance to give feedback on topics including culture, leadership and their line manager. We had record participation this year, with results that benchmark very highly for enablement and engagement. Find out more on page 37 Find out more on pages 29 to 31 Find out more on pages 50 and 51 COLLEAGUES, CUSTOMERS AND AI AI PRODUCTIVITY Core AI integration Rentokil Initial is actively integrating AI, particularly Gemini AI, into its operations. This strategic adoption aims to enhance efficiency and productivity across the business. We launched Google Gemini AI as an integrated tool within email and documents, and as a standalone app to enable further efficiencies. By the end of 2025, all colleagues worldwide had access to Gemini AI, demonstrating a strong commitment to digital transformation, with North America the largest user region. Outcomes-driven AI agents and chatbots We have also developed and begun to roll-out a proprietary AI Portal to create company-specific AI agents. This provides a single, secure repository of multiple industry-standard Large Language Models (LLMs), allowing colleagues to choose the right model for different tasks, and includes custom-made AI chatbots and agents. To date, around 100 AI agents and chatbots are in development across areas such as technician training, HR queries, IT support, national accounts support, sales entry, brand compliance, SOX and cash allocation. AI service innovation Rentokil Initial has also deployed AI in its latest service innovation, PestConnect Optix for rodent control. Motion-detection cameras at customer sites capture and transmit images back to Rentokil technicians and, so far this year, 4.1 million images have been processed and analysed by Rentokil’s AI model, enabling a faster response to potential infestations. The Optix service has now been launched in five countries. SPOTLIGHT ON: INNOVATION AND TECHNOLOGY c.63,400 Colleagues have access to Gemini AI >100 AI agents and chatbots in development AI EFFICIENCY AI SERVICE INNOVATION 12 Rentokil Initial plc Annual Report 2025 |
|
100 AND COUNTING... SPOTLIGHT ON: CULTURE Rentokil 100 Watch the video Rentokil’s centenary year has been a remarkable milestone – an opportunity to reflect on our history but also celebrating the extraordinary commitment, generosity, and passion of our colleagues. We focused the celebrations on giving back and connecting our Rentokil family, and the response was phenomenal. Our initial goal was to support at least 100 charities and communities globally, but thanks to colleagues’ enthusiasm we ultimately supported more than 180 worldwide, far exceeding our target. These charities covered a wide range of causes, with particular emphasis on Health, Hospice and Cancer Support, and Children, Youth and Education. Colleagues across the globe engaged with their local communities, delivering environmental initiatives such as litter picks, tree planting and river restoration. Colleagues also came together at more than 100 local events during the year, with many teams forming the number 100 – captured by drones – as a powerful symbol of Rentokil’s people and passion. A comprehensive marketing and social media campaign ran alongside these activities, ensuring Rentokil’s centenary was recognised and celebrated across the world. 180 Charities and communities supported Focus on efficiency and disciplined capital allocation We have progressed plans to simplify our business in North America and build a more efficient organisation, moving some of our support functions to Global Capability Centres and investing in automation. We have a target to deliver a cost reduction in North America of c.$100m in 2027 compared to an inflation-adjusted 2024 base and deliver operating margins above 20% in 2027 – our progress in 2025 gives us confidence we are on track to deliver against these targets. As we increase cost efficiency and focus on cash, we are driving up our Free Cash Flow growth and Free Cash Flow Conversion. This fuels our capital allocation model, which balances growing the business both organically and inorganically and returning capital to shareholders through sustainable growth in the ordinary dividend, and then through additional returns to shareholders, whilst maintaining leverage within a target range of 2.0 to 2.5x. Rentokil Initial – the next 100 years In May 2025, I announced my plan to retire. It has been a privilege to lead this company as CEO for the last 12 years and as I look back I am immensely proud of what we have achieved and the business we have built based on the solid foundations of people, culture, colleague engagement, commitment to customer service, innovation and leading technology which have been the bedrock of this company for 100 years and will be the cornerstone of its future success. In the last 10 years we have grown Revenue and profit at a compound annual growth rate of 14% and 17% respectively and we have delivered a 6%pt improvement in colleague engagement and an 11%pt improvement in colleague enablement. Our global Pest Control and Hygiene & Wellbeing businesses enjoy highly resilient demand with strong structural growth drivers. We have a strong global presence, with market leadership in dozens of countries. This unique footprint affords significant competitive advantages, leveraging our scale to invest in global capabilities and executing to win locally right down to the individual branch level. We continue to invest in value-creating M&A across the highly fragmented markets that we operate in. Our disciplined capital allocation model and an increasing focus on business simplification and cash discipline is delivering value for shareholders. In 2025, we have made good progress executing our strategies to drive profitable growth in North America and across our International region, and we have started 2026 with pace as we continue to build a powerhouse in pest control in North America. It has been a pleasure to welcome Mike Duffy, as Rentokil Initial’s new CEO, into this industry. He brings a wealth of leadership experience, customer focus, operational rigour, and care for colleagues and is well-placed to take Rentokil Initial forward on its next chapter of sustainable growth and long-term shareholder value creation. I would like to express my thanks to all our colleagues who have been part of this journey and for what they do every day to contribute to the company’s success. I look forward to watching Rentokil Initial continue to go from strength to strength. Andy Ransom Chief Executive Find out more on pages 20 and 21 Rentokil Initial plc Annual Report 2025 13 Strategic Report Corporate Governance Financial Statements Other Information |
|
Where we play Reasons to Invest A compelling investment opportunity of long-term compounding growth $29bn Pest control global market size1 6.2% Pest control forecast global market CAGR to 20351 2.6% Organic Revenue Growth 90 Global footprint in 90 countries A Global leader with strong positions in fast-growing global markets We have a track record of strong organic growth in Pest Control and Hygiene & Wellbeing, benefiting from our diversified global footprint, which extends across 90 countries, with market-leading positions in a number of them. Our strong and growing market positions allow us to serve all segments of the markets in which we operate – commercial, residential and termite – for both contracted and one-off services. A Strong brand awareness Our power brands of Rentokil, Initial, Terminix and Ambius enjoy strong brand awareness and high levels of brand trust, with a reputation for expertise and high-quality delivery. Investment in brand awareness helps us retain existing customers and win new customers. Alongside our power brands, our investment in regional brands in North America, our largest market, is helping us keep close to our customers in a diverse marketplace. A Clear benefits of scale to drive performance As a global leader in pest control and hygiene and wellbeing, our scale advantage comes from our global presence and diverse service portfolio and customer base. This allows us to address the varied needs of residential consumers, small businesses and large corporations, and to maximise customer relationships by managing locally, regionally and globally. Leveraging our scale to invest in brands, people, innovation, technology and operational expertise, we are well placed to meet and exceed customer expectations. A Highly attractive, fragmented and resilient markets Rentokil Initial operates in highly attractive, global markets and in industries which have benefited from strong growth drivers. Our markets are characterised as resilient growth markets with long-term attractive fundamentals, including increasing awareness and demand for our services. Within pest control, the forecast global market CAGR1 to 2035 is 6.2% with untapped opportunities across our regions and markets. The highly fragmented industries of pest control and hygiene and wellbeing support inorganic growth and consolidation of our market share. Our bolt-on M&A programme has enabled us to expand into new, higher-growth markets as well as consolidate our position in our existing markets. A Favourable tailwinds supporting organic growth Across our markets we continue to benefit from favourable market tailwinds underpinned by positive macro trends, which support ongoing strong organic growth. Growth in the pest control market is driven by a number of factors, from climate change and urbanisation to technological advances, stricter regulations and demand for sustainable solutions. In hygiene and wellbeing, positive market drivers include urbanisation, rising disposable incomes, a heightened awareness of hygiene risks and increasing regulation. Attractive markets Leading global positions 1. Market data sources: Allied Markets (Global), The Strategic Analysis of the US Structural Pest Control Industry, Speciality Consultants LLC, QuinceMarket Insights and Company internal revenue data. 14 Rentokil Initial plc Annual Report 2025 |
|
How we win 87.4% Colleague retention 24 Patents granted in 2025 70% Contracted revenue 97.6% Free Cash Flow Conversion A Long-term track record of financial performance Our track record of growing revenue and profits has generated high total returns, strong cash flow, and a strong credit rating. We have a consistent strategy centred on market consolidation, operational efficiency and customer service excellence. A High recurring revenues Both Pest Control and Hygiene & Wellbeing are largely subscription-based businesses, where customers pay for regular inspections, treatments or servicing over a defined contract period. This enables steady, predictable revenue streams, and a low level of exposure to economic cycles. A Strong Free Cash Flow Strong Free Cash Flow Conversion underpins our approach to capital allocation. We prioritise investing in Organic Growth, supporting inorganic growth through targeted bolt-on M&A, and driving sustainable growth in the ordinary dividend. Any excess capital will be used to reduce leverage to our target range of 2.0x to 2.5x, with any surplus capital returned to shareholders at the appropriate time. A Reinvesting for growth We reinvest for growth through both organic investment in the business and inorganic growth via M&A, increasing our density, improving gross margins and strengthening our competitive advantage. Our business model creates a virtuous circle: our low-cost operating model delivers profitable growth and sustainable Free Cash Flow that we reinvest into the business, our people, M&A, brands and R&D. A Investing in people, service, innovation and operations Employer of Choice We have a long-term commitment to invest in colleagues, inclusion and safety. This strong ethos enables us to attract and develop talent and expertise, and supports improvements in colleague retention. High-performance culture Putting people first leads to better recruitment, retention and customer service. Development opportunities are promoted so colleagues see Rentokil Initial as a place to grow, driving engagement and high performance. Innovation Our investment in innovation and our digital pipeline strengthens our brand and differentiates us from our competitors as we continue to enhance our reputation as global experts in our field. It also helps us provide an enhanced service to customers seeking more efficient and cost-effective solutions – for example, through our penetration of connected devices and monitoring, increasingly incorporating AI – improving our ability to upsell additional products and service lines. Operational excellence Operational excellence underpins our business model, driving route density and efficient service, and enabling margin growth. We operate a proven, repeatable, route-based, low-cost business model across both our main business areas. Investments in data and technology are key drivers of performance and informing actions in key focus areas like customer retention. Investing for growth Business model creating value Rentokil Initial plc Annual Report 2025 15 Strategic Report Corporate Governance Financial Statements Other Information |
|
Our Strategy and Business Model Creating value for all stakeholders We have a proven, resilient business model operating across our global operations, supported by a highly diversified portfolio of product and service lines. Our strategic priorities, which drive the in-year execution of our plans, together with our business model, remain a key determinant of the strength and resilience of our long-term performance. Our strategic priorities The Group’s strategic priorities centre on driving profitable growth in North America, while using innovation, digital tools, and disciplined M&A to strengthen our global Pest Control and Hygiene & Wellbeing businesses. Our continuing drive for sustainable growth is underpinned by an increased focus on operational excellence and efficiencies and disciplined financial management. North America Accelerate profitable growth in North America. Find out more, pages 34 to 36 Find out more, page 21 Find out more, pages 30 and 31 Find out more, pages 12 and 15 Find out more, pages 32 and 33 Find out more, pages 20, 21 and 38 1 4 2 5 3 6 M&A Accelerate growth through targeted M&A. International Pest Control Invest in innovation and digital to grow International Pest Control. Hygiene & Wellbeing Deliver operational excellence in global Hygiene & Wellbeing. Financial Focus on efficiency, cash flow and disciplined capital allocation. Organisation Build a high-quality service company through investment in colleagues and technology. 16 Rentokil Initial plc Annual Report 2025 |
|
Our strategic enablers Our four strategic enablers are the key resources and capabilities that support and facilitate the successful implementation of our strategy. They are fundamental to our business model, enabling alignment between goals and execution of our strategic priorities. Be an Employer of Choice We are committed to being a world-class Employer of Choice everywhere we operate. Above everything, our colleagues’ safety comes first – we want to ensure that everyone goes home safely at the end of their working day. Our market-leading practices, together with our training and development programmes, help us to attract, hire and retain the best people. We believe in diversity, ensuring that everyone has an equal opportunity to succeed based on merit. Create value through innovation and digital applications Innovation is integral to our business. Our differentiated solutions provide customers with more efficient products and services while ensuring our operations remain as sustainable as possible. We are incorporating AI to improve how we deliver services and to do so more efficiently. Our scale enables us to invest in new digital technologies that enhance service in a customer-centric way. Digital technologies and AI are increasingly deployed across our businesses to enhance our colleagues’ experience, further improving efficiency and insight. Provide excellent customer service Providing outstanding customer service is a key component of our business model. We serve customers ranging from the largest multinational pharmaceutical, industrial and food production companies to local shops, restaurants and residential customers, and we are passionate about the level of service we deliver to every one of them. As a services business, we know that brand trust and identity matter, and we endeavour to fully understand our customers’ needs so that we can provide the solutions they require. Manage a responsible business Being a responsible business means supporting our communities and environment effectively. We are committed to improving our carbon efficiency, achieving our target to reduce our emissions intensity by 20% by the end of 2025. Our Group target is to achieve net zero carbon emissions by the end of 2040. We aim to make a meaningful contribution to the local economy and support the communities where we operate, through charitable donations and local projects. 87.4% Colleague retention rate c.4,000 PestConnect Optix cameras in operation 98.4% State of Service 21.8% Improvement in emissions intensity – meeting our target of 20% by the end of 2025 Find out more, pages 22, 50 and 51 Find out more, pages 29 to 31 Find out more, page 23 Find out more, pages 56 and 57 Rentokil Initial plc Annual Report 2025 17 Strategic Report Corporate Governance Financial Statements Other Information |
|
Our Strategy and Business Model continued Profit growth Low-cost model Density Innovation & digital Price Additional services to customers Cash M&A Dividend Shareholder value Impact on society Employer of Choice Health & safety Great service Leading brands Customer retention Organic Revenue Growth New business Our business model Within our business model, each cog is related to the others and measured regularly at Group, business, region, country and branch level. By focusing on executing our model, we create long-term value for colleagues, customers, shareholders and society. Colleagues Success in our service businesses starts with our colleagues. Delivering our Employer of Choice programme is the responsibility of all leaders and managers. We have common people management and safety policies and processes across the Group. Growth We generate organic growth by targeting new customers, selling additional services or products to existing customers and expanding into new markets. Our customer contracts enable us to increase prices for most customers and provide protection in high-inflationary environments. Sales colleague engagement and retention is an important factor in driving sales success. Capital allocation We maintain a disciplined capital allocation framework that prioritises the effective use of cash, while retaining the flexibility to adjust as business needs evolve or market opportunities arise. Our framework is built around five key priorities designed to balance growth, shareholder returns and financial resilience. We aim to invest in the business, fund a progressive dividend and return any surplus to shareholders. Customers 70% of our customer revenues are recurring, through annual contracts, with the balance made up of one-time revenue. High levels of service and customer satisfaction support retention, while a broad-spectrum customer base reflects our wide range of services. Profit and margins We have built a proven low-cost operating model where each country team leads integrated, multi-local and multi-service operations, using combined back-office functions underpinned by shared systems and processes. We focus on route density to grow margins. Responsible business Socially and environmentally responsible business practices support the attraction and retention of colleagues and customers. Our innovation pipeline is focused on more sustainable solutions and reducing the use of chemicals. UNDERPINNED BY OUR CENTRAL POLICIES AND PROCESSES 18 Rentokil Initial plc Annual Report 2025 |
|
Our operating model We operate a low-cost density-driven operating model, which, combined with our cash compounding subscription model with 70% of revenue from customers on single or multi-year contracts, generates free cash flow to fund investment in growth and shareholder returns. High levels of contracted, recurring revenue Across our business we are growing contracted, recurring revenues, currently 70%, reflecting our service excellence, expertise in our field and our innovation. In Pest Control, most Commercial customers, and a proportion of Residential and Termite customers, are on annual or multi-year contracts, supporting high retention and enabling regular price increases, which strengthens revenue resilience and cash generation. PestConnect customers in our largest markets typically sign three-year contracts, and this segment is expanding as the service rolls out across regions. While some Residential and Termite customers use annual contracts, many buy on a per-job or per-incident basis. In Hygiene & Wellbeing, 81% of revenue is contracted, predominantly with Commercial and Public Sector customers. Increasing our contract portfolio value In our primarily contract-based business, a key measure of success and how we drive value is the increase in the annual value of our contract portfolio, which indicates future secured revenue and supports stronger top-line growth over time. We increase this value by winning new business and retaining existing customers, supported by pricing discipline. To enhance portfolio growth further, we are focused on driving higher volumes of new customer leads, improving conversion rates, and steadily increasing customer retention through a focus on excellent service. Revenue: Contracted versus one-time revenue 67% Pest Control contracted revenue 30% One-time revenue1 70% Contracted revenue 81% Hygiene & Wellbeing contracted revenue $615m Free Cash Flow Cash compounding subscription model generating value for colleagues, customers, shareholders and our communities. Our low-cost, route-based operating model We run a low-cost model across Pest Control and Hygiene & Wellbeing, with a route-based, high-density service network that spreads fixed costs over recurring service contracts. This makes scheduling more predictable and routes more efficient and supports strong margins. The model is designed to maximise technician productivity and local scale, so each additional customer on a route costs relatively little to serve. By combining a shared global platform (finance, HR) with dense local branch networks, branches capture scale benefits. Our M&A programme supports this route-density approach, using bolt-on acquisitions to ‘fill in’ territories, increase customer density and capture cost synergies from overlapping routes and branches. 1. One-time revenue is a combination of job work and also the sale of goods primarily through our product distribution business. Rentokil Initial plc Annual Report 2025 19 Strategic Report Corporate Governance Financial Statements Other Information |
|
Capital Allocation Investing for value creation and sustainable growth Our capital allocation framework We maintain a disciplined capital allocation framework that prioritises the effective use of cash, with the flexibility to adjust our allocation as business needs evolve or market opportunities arise. Our framework, outlined above, is built around five key priorities designed to balance growth, shareholder returns and financial resilience. As we execute our strategy, we are focused on delivering against an attractive growth algorithm, driving revenue through both organic expansion and strategic acquisitions while improving margins by enhancing operational efficiencies and leveraging our scalable cost base, generating surplus cash which is allocated according to this framework to reinvest at attractive returns and return excess to shareholders. Our framework is underpinned by maintaining an appropriate capital structure, with a target net debt to Adjusted EBITDA range of 2.0–2.5x, and a strong balance sheet consistent with an investment grade credit rating. We remain a highly cash-generative business and are comfortable with our current leverage position, which is aligned with our policy to maintain an investment grade credit rating. Dividends1 (¢) Our disciplined capital allocation model balances investing for sustainable growth, shareholder returns and maintaining financial strength through an appropriate capital structure for the Group. Maintain a strong balance sheet • Strengthening financial health by reducing debt through surplus cash • Achieving our target Net Debt to Adjusted EBITDA ratio of 2.0–2.5x under normalised conditions • Maintaining our BBB investment grade credit rating Invest for growth organically • Funding organic investment in digital technology, operational infrastructure and innovation to enhance efficiency, service quality and market competitiveness. Invest for growth through bolt-on M&A • Targeted bolt-on acquisitions that enhance capabilities, strengthen our market position or accelerate growth. Grow a sustainable ordinary dividend • Maintaining a sustainable progressive dividend policy that ensures dividends grow over time. Return excess capital to shareholders • Keeping under review options to return surplus cash beyond our reinvestment needs to shareholders at the appropriate time. 14 12 10 8 6 4 2 0 4.32 4.39 5.22 5.82 1.86 7.60 9.30 10.85 12.04 12.39 2015 2018 2019 2022 2 2016 2017 2020 2021 2023 2024 2025 8.16 1. USD figures to 2024 are translated from GBP using the payment-date spot rate. 2. 2019 final dividend withdrawn due to COVID. 2.6x Net Debt to Adjusted EBITDA 12.39¢ Full year dividend +3.0% 11.1% 10-year CAGR 20 Rentokil Initial plc Annual Report 2025 |
|
Disciplined investment for growth 217 Acquisitions completed since 2021 $714m Total revenue in the year prior to purchase for the 217 acquisitions since 2021 $1.4bn Spend on acquisitions since 2021 Cities of the Future is our M&A strategy targeting expansion in cities where we expect to see even higher growth levels over future decades, particularly in Asia, Latin America and the Middle East. • Focus on entry platforms for target cities and then bolt-ons • Use Rentokil Initial methods to improve e.g. sales and financial discipline Acquisitions are a core part of our Pest Control growth strategy to build scale and density, increase competitive positioning and improve our ability to service customers. • Building on existing footprint • Focus on urban areas and existing routes • Blend capabilities, customers and people Building density in UAE Kendah Pest Control is a leading operator in the UAE. The acquisition has integrated with existing teams in our dense routes in Dubai and added to less dense routes in Abu Dhabi and Fujairah, alongside bringing Rentokil’s commercial focus and opportunities for cost synergies. Urban expansion in Chile The acquisition of Mauco Ambienta consolidated our position in the Chile Washroom Hygiene market, building on our current business operating in the larger urban areas. Mauco benefited by leveraging Rentokil Initial’s operational capabilities and commercial processes. Cities of the Future in Indonesia Our acquisition of pest operator PT Reliance enables us to leverage its Termite capabilities and creates opportunities for Hygiene cross selling into their loyal hotel and leisure customer base, while also building our position in large cities such as Jakarta and Surabaya. Hygiene & Wellbeing continues to present a growth opportunity through M&A, focused on building city density and supporting specialist extension areas that we have defined as part of our growth plans. • Bolt-ons • Capability extension e.g. mould, medical gas Guided by our strategic priorities and strategic enablers, we have consistently invested both organically, to support the long-term growth of the business, and through bolt-on acquisitions, to expand our position in attractive markets globally, supporting long-term value creation and a more efficient organisation. Allocating capital to inorganic growth alongside operational investment is a key foundation of our growth strategy. It drives organic and inorganic growth, improves our gross margins and generates strong profits and cash flow. Our acquisitions programme extends globally and is focused on bolt-on density building in Pest Control and Hygiene & Wellbeing and expanding in Cities of the Future. In 2025 we have spent $115m successfully acquiring 36 businesses, representing revenues of $63m in the year prior to acquisition. Pest Control bolt-on density building Hygiene & Wellbeing Cities of the Future Rentokil Initial plc Annual Report 2025 21 Strategic Report Corporate Governance Financial Statements Other Information |
|
Key Performance Indicators Monitoring our progress The Group monitors several key metrics to track the financial and non-financial performance of the business. These measures were selected because we believe they provide additional useful information on underlying trends. All figures provided for 2023 onwards include the performance of Terminix, and unless otherwise stated, all figures for 2024 onwards exclude the performance of France Workwear. Colleagues Ensuring everyone goes home safely Employer of Choice Link to strategy • As a service organisation, our people make our Company what it is. Our priority is ensuring every colleague goes home safely. • Health and safety is the first agenda item in senior management meetings (including Executive Leadership Team and Board). Link to remuneration • Both LTA and WDL rates are part of the personal objectives of the Chief Executive and have an impact on the level of annual bonus achieved. Commentary on performance • In 2025, we continued to improve our high level of colleague safety, setting performance records for both LTA and WDL. • In 2025, our LTA rate improved by 3.4% to 0.28 (2024: 0.29). • WDL also improved, by 9.6%, reducing WDL to 5.65. • There were no work-related colleague fatalities in 2025 (2024: one fatality). Lost Time Accident (LTA) rate Total colleague retention Link to strategy • By retaining our people, we also retain and build deeper relationships with our customers, which underpins our organic growth. • Retaining more colleagues reduces the cost of recruitment, as well as driving productivity improvement and allowing new recruits the time to be trained and gain experience. • We invest in training and development to ensure that our colleagues’ expertise is unrivalled. • We recruit, appoint and promote on merit and, where possible, from within the organisation. Link to remuneration • Colleague retention is a Performance Share Plan (PSP) performance measure and is included in annual bonus personal objectives. Commentary on performance • Colleague retention improved by 1.1 percentage point to 87.4%. Total colleague retention in North America increased 2.8 percentage points to 82.2% (2024: 79.4%), while in the International business colleague retention was stable year-on-year at over 90%. • Sales colleague retention increased to 82.1% up 0.7 percentage points on 2024 (81.4%). • Service colleague retention was up year-on-year, rising by 1.5 percentage points to 87.0% (2024: 85.5%), driven by a strong performance in North America, up 3.9 percentage points. 0.28 +3.4% improvement on 2024 2025 0.28 2024 0.29 2023 0.31 2022 0.39 2021 0.38 87.4% +1.1 percentage points 2025 87.4 2024 86.3 2023 84.2 2022 79.5 2021 84.4 Sales colleague retention 82.1% +0.7 percentage points 2025 82.1 2024 81.4 2023 77.4 2022 76.3 2021 82.9 Colleague retention is defined as total colleagues retained in-year as a percentage of average headcount throughout the year. Colleague retention is measured on a rolling 12-month basis. Service colleague retention 87.0% +1.5 percentage points 2025 87.0 2024 85.5 2023 83.3 2022 77.6 2021 82.4 LTA rate defined as number of Lost Time Accidents per 100,000 standard working hours. WDL rate defined as number of Working Days Lost as a result of LTAs per 100,000 standard working hours. These measures are shown including the performance of France Workwear. Working Days Lost (WDL) rate 5.65 +9.6% improvement on 2024 2025 5.65 2024 6.25 2023 7.05 2022 7.90 2021 8.71 Find out more Responsible Business, pages 50 and 51 22 Rentokil Initial plc Annual Report 2025 |
|
Delivering outstanding customer service Link to strategy • We are passionate about delivering excellent service to our customers and keeping our promises to them. • Excellent service helps us retain customers and build deeper relationships with them. Commentary on performance • State of Service performance remained high, up 0.1 percentage points to 98.4% (2024: 98.3%). • Our North America region delivered an excellent 99.0% State of Service, up 0.5 percentage points on 2024. The International region was stable on 2024, at 98.3%. Link to strategy • Customer retention is crucial to our long-term success. • Benefits include: increased purchasing and cross-selling, lower terminations, greater willingness to accept price increases, positive customer recommendations and a strengthened unique selling point. Commentary on performance • Overall customer retention was up 0.5 percentage points at 82.6%. • In North America, customer retention rates improved by 0.4 percentage points to 80.5% and our International region delivered a 0.6 percentage point increase to 85.7%. • More than 5.7 million post-service customer surveys were undertaken during the year with an average score in excess of 4.9 out of 5. • Customer reviews of our UK Pest businesses on Trustpilot.com remained at ‘world-class’ levels, with 90% five-star reviews from more than 10,900 customers. Defined as total number of service visits performed as a percentage of total number of visits due. Defined as total portfolio value of customers retained as a percentage of opening portfolio. State of Service Customer retention Customers Retaining our customers 98.4% +0.1 percentage points 2025 98.4 2024 98.3 2023 97.8 2022 95.9 2021 92.9 82.6% +0.5 percentage points 2025 82.6 2024 82.1 2023 82.3 2022 82.4 2021 85.4 Link to strategy • Our business model depends on servicing the needs of our customers in line with internal high standards and to levels agreed in contracts. • Strong performance on CVC is linked to retention and sales of additional services to customers. • Measuring customer satisfaction allows us to identify unhappy customers, reduce customer attrition, and increase revenue, profit and cash. Link to remuneration • Improving CVC is one of the performance conditions of the PSP, which covers over 1,300 colleagues across the Group. Commentary on performance • Our CVC Net Promoter Score was up at 60.6, an increase of 2.8 points. • Pest Control remained our highest-rated category, at 61.2, an increase of 2.2 points on last year. • Hygiene & Wellbeing scored 57.9 points, up 4.8 points year-on-year. Net Promoter Score: Measured by the implementation of an average Net Promoter Score across branches participating in the CVC programme. CVC score represents the net balance of Promoters (customers who advocate for our service) minus Detractors (those unhappy with our service), expressed as a numerical value. Net Promoter Scores range from -100 to +100; according to the Bain & Company NPS principles, a score above 0 is classed as ‘Good,’ and a score between 50-80 is ‘Excellent,’ indicating strong customer loyalty. CVC scores are based on both telephone and digital survey channels. Global and regional scores have been weighted based on the portfolio value of the market. Net Promoter Score – Customer Voice Counts (CVC) Keeping promises to customers 60.6 +2.8 points 2025 60.6 2024 57.8 2023 50.8 2022 50.9 2021 52.1 Find out more Customer service and retention, page 52 Rentokil Initial plc Annual Report 2025 23 Strategic Report Corporate Governance Financial Statements Other Information |
|
Key Performance Indicators continued Shareholders Cash Conversion Adjusted Operating Profit Growth (at AER) Revenue growth (at CER) Adjusted Free Cash Flow Conversion (at AER) Adjusted Operating Profit Growth (at CER) 4.4% 2025 4.4 2024 3.6 2023 44.7 2022 25.6 2021 5.5 300.7% 2025 300.7 2024 214.7 2023 193.2 2022 258.6 2021 214.1 6.2% 2025 6.2 2024 (5.3) 2023 57.1 2022 29.4 2021 15.0 3.8% 2025 3.8 2024 3.8 2023 45.8 2022 19.4 2021 9.5 97.6% 2025 97.6 2024 81.2 2023 89.7 2022 91.8 2021 108.3 5.4% 2025 5.4 2024 (4.9) 2023 57.0 2022 23.3 2021 19.6 Achieving greater profitability Delivering sustainable Free Cash Flow Driving higher revenue Link to strategy • We aim to drive shareholder value through higher revenues from our Pest Control and Hygiene & Wellbeing businesses, supported by M&A investment. Our objective is to deliver sustainable profit growth by growing Group revenues. • We are a highly cash-generative business and, after dividend and interest payments have been made, we reinvest our cash into the business for future growth through people, technology and M&A. Link to remuneration • Revenue, Profit and Organic Growth targets are one of the Company’s performance elements of the annual bonus, which covers the Executive Directors and managers across the Group, and they have an impact on the level of annual bonus achieved. • Free Cash Flow is also a target for the annual bonus, which covers the Executive Directors and managers across the Group. Commentary on performance • Revenue at AER was up 4.4% to $6,908m and at CER was up 3.8%. – Organic Revenue Growth of 2.6% reflects a strong performance in the second half, with Organic Revenue Growth of 3.5% compared to 1.6% in the first half. – In North America, Revenue grew by 3.2% with growth of 3.1% in Pest Control. Organic Revenue Growth in North America was 2.3% with an improving performance through the year driven by our strategic growth initiatives. – Our International business delivered 4.8% Revenue growth, reflecting good volumes and a strong demand and pricing environment across the UK, Southern European markets and the faster growing economies of Indonesia and India. Organic Revenue Growth was up 3.0%. – Pest Control Organic Revenue Growth was 2.6% and Hygiene & Wellbeing was 2.3%. • Adjusted Operating Profit at AER was up 6.2% and at CER was up 5.4% with Adjusted Operating Profit margin of 15.5%, an increase of 0.3%pts. – In North America Adjusted Operating Profit increased by 5.1% and Adjusted Operating Profit margin increased 0.3%pts to 17.4% reflecting some early benefit from cost efficiency initiatives. – In International, Adjusted Operating Profit increased by 5.7% and Adjusted Operating Profit margin increased 0.3%pts to 19.8%. – Adjusted Operating Profit margin was 18.3% in Pest Control and 18.6% in Hygiene & Wellbeing. • The cash conversion metric reflects statutory ‘net cash flow from operating activities’ expressed as a percentage of ‘profit after tax’ as a measure of overall conversion of profits into cash. • Adjusted Free Cash Flow Conversion at AER was 97.6%, ahead of our target at the start of the year due to real estate sales and some one-off benefits within the overall working capital improvement. – Free Cash Flow of $615m was up 24.5% ($121m) on FY24, predominantly due to an improved performance in trading and working capital. Revenue growth (at AER) Find out more Financial Review, pages 38 to 41 24 Rentokil Initial plc Annual Report 2025 |
|
Rentokil Initial plc Annual Report 2025 25 Strategic Report Corporate Governance Financial Statements Other Information (This page has been left blank intentionally.) |
|
Our Businesses Our strategic focus for Pest Control is to accelerate profitable growth in North America, pursue value-added M&A in attractive markets and increase momentum across our International businesses. What we do We are a leading global pest control company and the largest operator in North America. Our core business is identifying, treating and preventing pests to protect the safety and hygiene of our customers’ premises. Our pest control specialists, operating primarily under the Rentokil brand and under the Terminix brand in North America, protect people, homes and businesses through pest management solutions across our Commercial, Residential and Termite markets. We are an innovation leader in pest control, developing proprietary, connected, digitally enabled and energy‑efficient services and, wherever possible, using non‑toxic, sustainable products. By combining preventative and responsive strategies, we provide holistic, integrated and connected pest management programmes that strengthen protection for our customers. Where we operate Our Pest Control business operates across two regions – North America and International – with operations spanning 89 countries and 98 of the world’s 100 largest cities by GDP. We serve three distinct customer segments across a broad range of industries, spanning food and beverage processing and outlets, leisure and retail, hospitality, facilities management, offices and administrative services, logistics and warehousing, and homes. Our revenue model As an essential service, Pest Control operates a subscription‑based model with a high level of recurring contracted revenue, as customers seek to protect their people, businesses and properties. Contracts are in place across the vast majority of Commercial customers, as well as a significant proportion of residential and termite customers. Commercial customers mainly contract on an annual basis, with PestConnect customers generally contracting on a three‑year basis. A key measure of success and how we drive value is our ability to increase the annual value of our contract portfolio. We increase the value of the portfolio through winning new business, retaining existing customers and increasing pricing. How we do it 1. Pest risk assessment Hassle-free pest survey and consultation • Scheduled pest inspection at a time of your convenience • On-site pest risk review and consultancy • No-obligation quote and recommendations 2. Pest treatment Comprehensive pest treatment programme tailored to your needs • Certified, local pest control experts • Environmentally sensitive approach • Industry-specific legislation expertise supporting audit compliance 3. Pest protection (aftercare) Providing a clean, safe environment and treatment • Integrated pest management (IPM) solutions • Detailed post-service recommendations • Pest prevention aftercare and advice Our performance 2025 $m 2024 $m Change (reported) % Change (constant currency) % Organic Growth Revenue 5,703 5,481 4.1% 3.7% 2.6% Operating Profit 635 715 (11.2)% (12.1)% Adjusted Operating Profit 1,043 987 5.7% 4.9% Adjusted Operating Margin 18.3% 18.0% 0.3%pts 0.2%pts Organic Growth Q1 Q2 Q3 Q4 Full Year Pest Control 1.7% 1.9% 3.4% 3.4% 2.6% Pest Control Revenue increased by 4.1% to $5,703m (FY24: $5,481m) and by 3.7% at constant currency. Organic Revenue Growth was 2.6%. Within the North America business, good revenue growth of 3.1% included 2.1% in Pest Control Services and 8.7% in Business Services supported by a robust pricing environment and a particularly strong performance from Target Specialty Products in Business Services. Organic Revenue Growth was 2.2%, with 1.1% in Pest Control Services and 8.9% in Business Services. Within the International business, good revenue growth of 5.4% was driven principally by strong performances in Europe, the UK and Asia & MENAT, benefiting from favourable economic trends, the roll-out of digital solutions, resilient pricing and strong sales leadership. Organic Revenue Growth was 3.7%. Adjusted Operating Profit increased by 5.7% to $1,043m (FY24: $987m) and by 4.9% at constant currency, with Adjusted Operating Profit Margin increasing to 18.3% (FY24: 18.0%). Statutory Operating Profit decreased by 11.2% to $635m (FY24: $715m). Pest Control represented 83% of Group Revenue and 82% of Group Adjusted Operating Profit. We acquired 31 Pest Control businesses in the period, with revenues in the year prior to acquisition of c.$55m. Pest Control 31 Companies acquired in 2025 $55m Revenues in year prior to acquisition 26 Rentokil Initial plc Annual Report 2025 |
|
Macro trends underpinning our growth Pest control is a largely non‑discretionary, essential service that protects public health, and the global market is evolving rapidly due to a range of interconnected factors. Our services and markets have attractive growth prospects underpinned by positive macro trends, from climate change and increasing urbanisation to stricter regulations and technological advances. These trends, together with our ability to drive efficiency, innovation and digital solutions across our pest control portfolio, have helped maintain Rentokil’s strong global market position in this growing market. Market opportunity The global pest control market is a strong, growing and attractive, largely non-cyclical market, underpinned by long-term structural growth drivers. According to latest industry reports1 , over the past ten years the global pest control market has grown from a value of $15.4bn in 2015 to $29.0bn in 2025 at a CAGR of 6.6%. Industry forecasts1 for the next ten years deliver a CAGR of 6.2% – with the value of the global market expected to reach in excess of $50bn by 2035. Within the North American market, the largest market for pest control, M&A activity continues, but it still remains a highly fragmented market with further opportunity for consolidation. The top 100 pest control operators comprise 85% of the market, with the remaining share coming from 17,000 local operators. 68% of the population will live in cities by 2050 Global pest control market forecast1 to 2035 ($bn) Global pest control market1 (2025) by region and customer segment $29.0bn Commercial 50% Residential 33% Termites 17% North America International Market drivers A Increased urbanisation Rising urban populations and migration to warmer climates are creating favourable conditions for pests, increasing global demand for pest control services. By 2050, 68% of the world’s population is expected to live in cities. Rapid urbanisation and the need to expand food supply chains are driving higher pest prevalence, particularly in dense urban areas. A Climate change Changing weather patterns are further supporting pest growth. More frequent extreme weather events such as storms and flooding introduce new pest challenges, while climate change also affects pest behaviour, distribution, lifecycles and resistance to pesticides. A Growing impact of technological advancements Digital technologies – including remote monitoring, connected cameras, drones, apps and AI – are improving the efficiency and effectiveness of pest control. These tools enable continuous monitoring, early detection and optimised treatment. AI in particular is set to transform the pest control industry through more accurate pest identification, predictive analytics for infestation risks, and the development of autonomous pest control devices, benefiting both customers and scalable operators. A Growing awareness of pest-borne diseases Increasing concern about diseases transmitted by pests is a major driver of demand across residential and commercial markets. About half of the world’s population is now at risk of dengue, with an estimated 100–400 million infections occurring each year. A Regulation and sustainability Many commercial customers face stringent regulatory requirements around pest control and audit reporting, while the industry is subject to evolving chemical regulations. At the same time, demand for sustainable solutions is accelerating innovation in integrated pest management, with greater emphasis on prevention, early detection and environmentally friendly alternatives to traditional chemical treatments. 1. Market data sources: Allied Markets (Global), The Strategic Analysis of the US Structural Pest Control Industry, Speciality Consultants LLC, QuinceMarket Insights and Company internal revenue data. $14.2bn (49%) $14.8bn (51%) 2025 2026 2027 2028 2029 2030 2031 2032 2033 2034 2035 0 20 40 60 10 30 50 c.6.2% Total market CAGR to 2035 Rentokil Initial plc Annual Report 2025 27 Strategic Report Corporate Governance Financial Statements Other Information |
|
Our Businesses: Pest Control continued This year we adjusted our marketing to prioritise organic lead generation, shifting focus from paid digital media to channels that drive greater awareness, reach and incremental lead flow. This shift towards a higher contribution from organic leads also supports more efficient marketing spend, reducing our overall cost per lead. We have supported our regional brands by updating around 800 webpages, providing detailed and useful information for customers, and optimised for AI. Across our major brands we have launched over 400 new branch, metro and state pages to drive up local performance and conversion. These initiatives are already delivering results – e.g. in Q4 we measured a five-fold increase in the number of times Terminix appeared in ‘exterminator near me’ searches and a doubling for ‘pest control near me’. MARKETING AND BRAND DRIVING ORGANIC LEADS SPOTLIGHT ON: NEW CUSTOMERS Watch the latest Terminix adverts on our YouTube channel 28 Rentokil Initial plc Annual Report 2025 |
|
Rentokil’s PestConnect Optix cameras won the Innovation of the Year award at the UK’s National Pest Awards 2025. The category recognises the vital role that innovation plays in the pest control sector. Entries had to demonstrate a unique and novel method of dealing with a challenging pest, a new business idea or business development concept. The winning entry was for Rentokil’s innovative SMART Pest Control solutions, specifically the PestConnect Optix cameras, which use AI-powered connected camera devices to provide 24/7 pest monitoring and management for real-time pest detection and identification. AWARD-WINNING OPTIX INNOVATION SPOTLIGHT ON: INNOVATION Innovation is a core driver of performance Innovation is core to how we operate, and it begins and ends with serving our customers in the most efficient and environmentally responsible way. We focus on finding better ways to solve existing problems while also anticipating and addressing emerging challenges and as yet unknown issues. We are proud of our industry‑leading track record in delivering best‑in‑class, differentiated innovation. Our organisation is built on a strong foundation of innovation, underpinned by ongoing reinvestment in product and solution design, development and rigorous testing to fuel our innovation pipeline and future growth. Our differentiated solutions provide customers with more efficient products and services, while ensuring our operations remain as sustainable as possible. We are also integrating AI to enhance service delivery and further improve efficiency. Innovation as a growth enabler and differentiator Our innovative services enable us to tap into new market segments, drive global organic growth, and differentiate ourselves by offering unique solutions that competitors cannot easily replicate. For example, our Lumnia LED Insect Light Traps offer an eco-friendly and efficient fly control solution, reducing energy costs by 79%, cutting carbon emissions by 62% and providing 80% greater fly control coverage than traditional fluorescent tube products. We have developed a complete range of products – from Slim to Suspended – ensuring that every business, irrespective of its sector or scale, has the ideal protection. Innovation drives margin accretion Adopting innovative processes and technologies drives profitable growth by lowering service costs, reducing consumable usage, and leveraging data to enhance efficiency. This approach also allows us to pursue longer-term customer contracts. Our innovations improve customer conversion, retention and service efficiency, facilitating sustained growth and margin accretion over time in mature markets while positioning us as leaders in emerging countries, especially in commercial sectors. Innovation serves as a powerful sales tool, enhancing operational efficiency and margin growth. We are leaders in our industry when it comes to digital technologies and are committed to further building this competitive advantage. Our smart technology is enhancing remote monitoring solutions and increasing data transparency. For example, PestConnect provides a real-time early-warning digital system for monitoring and controlling rodents and protecting businesses, while delivering a reduction in rodenticide use of up to 60%. Our scale advantage Our scale allows us to rapidly introduce new products and services into both new and existing markets, helping us stay ahead of the competition. It enables us to test and refine products or solutions in a single market, ensuring optimal performance before launching a measured rollout across our cities, markets and regions. This strategic rollout paves the way for future organic growth, supported by a robust pipeline of new projects. Our innovation strategy We have built a long-term track record of delivering market‑ready innovation in Pest Control. We continue to advance pest control technologies and solutions through our four global innovation centres and our team of scientists, engineers and technicians. Our industry‑leading R&D capabilities provide a differentiated platform to develop enhanced solutions across three time horizons: short, medium and long term. Our innovation strategy is currently focused on two key areas: maximising the impact of existing innovations and driving margin-accretive growth through new solutions. We maintain a strong pipeline of potential projects for commercial launch, enabling us to meet industry regulations, satisfy evolving customer needs and improve efficiency. We are well positioned to sustain our leadership in commercial sectors, supported by increased focus and investment in residential pest control in North America. Our four Pest Control innovation centres: The Power Centre, UK: Our global R&D hub for pest control, focusing on early innovation, regulatory analysis, microbiology advancements, and training in pest control solutions. The Technology Centre, UK: Specialises in hardware product development, validation and regulatory excellence. Rentokil Initial Supplies, UK: Dedicated to the research, development, and delivery of more sustainable consumable products, along with achieving industry-leading accreditations. Rentokil Terminix Innovation Centre, Dallas, Texas: Opened in 2024, this centre focuses on developing new technologies and products for residential, vector and termite pest control. Its mission is to significantly enhance Rentokil Terminix’s competitive advantage, particularly in termite and mosquito pest control. Discover the process behind PestConnect Optix Watch the video Rentokil Initial plc Annual Report 2025 29 Strategic Report Corporate Governance Financial Statements Other Information |
|
Our Businesses: Pest Control continued PRODUCT DEVELOPMENT TO MEET EVOLVING CUSTOMER NEEDS Our core suite of pest prevention and control solutions has been developed in a customer‑centric way and we continuously innovate with each new launch, responding to evolving customer needs while anticipating emerging challenges and risks. Rentokil’s fly control solutions include the new EcoCatch product, a sustainable, reusable, outdoor, power‑free fly trap, designed for commercial sites such as hospitality, food retail and leisure areas. The trap is a visually aesthetic fly control solution that uses attractants to lure flies, and hides the flies captured in a more appealing container. It can catch 60% more flies in 24 hours than a traditional fly catch device (in controlled laboratory conditions). Over 30% of the non-toxic, reusable trap unit is made from recycled plastics. Rentokil’s innovative RADAR unit is a proprietary bait-free mouse control device. It is a sealed CO₂ trap used mainly in high risk or sensitive environments, such as food or pharmaceutical sites, where rodenticide bait cannot be used. The RADAR family was expanded with the RADAR Connect model and has recently been upgraded to RADAR X, launched in 2024, with a dual catch chamber. RADAR X growth has been strong, with units now live in multiple countries. These devices link into the PestConnect system and the myRentokil reporting portal – the secure online customer portal providing a dashboard for all pest control activity. 24/7 remote monitoring is provided by our Command Centre, sending instant alerts to technicians and online reporting of rodent activity. ECOCATCH: EFFECTIVE AND REUSABLE RADAR & RADAR X: SAFE, SUSTAINABLE RODENT CONTROL INITIAL LAUNCH 2024 INITIAL LAUNCH 2007 SPOTLIGHT ON: INNOVATION 30 Rentokil Initial plc Annual Report 2025 |
|
PESTCONNECT OPTIX: AI-DRIVEN, DATA-POWERED SOLUTIONS In operation since 2014, PestConnect is Rentokil’s digital pest control system, using a network of connected devices (such as smart traps and monitors) to detect, capture and eliminate pests while transmitting data in real time. We have 600,000 devices installed, with c.100,000 added in 2025. The next-generation PestConnect Optix, launched in 2024, is Rentokil’s AI-enabled environmental camera system within the PestConnect service. It uses smart imaging devices and machine learning algorithms to continuously scan for rodents in difficult to access areas, automatically identifying rodent activity and filtering out non-target images so technicians receive rapid, relevant alerts and can respond quickly to potential infestations. Can AI revolutionise your pest control for unprecedented peace of mind? It certainly can! Find out more Lumnia is Rentokil’s family of patented LED insect light traps for flying insect control. First launched in 2017 with Lumnia Standard, the range has been expanded to meet the needs of different customers with Lumnia Slim/Compact, Lumnia Ultimate and most recently Lumnia Suspended units, launched in 2021. These professional UV LED fly killers are designed for different risk areas, from customer-facing spaces to high-dependency food preparation zones, offering lower energy use and faster catch rates than traditional fluorescent tube products. LUMNIA: HIGHLY EFFECTIVE, REUSABLE LOW-ENERGY FLY CONTROL c.4,000 AI cameras are live in customers’ premises 4.1m Images automatically processed in 2025 INITIAL LAUNCH 2017 INITIAL LAUNCH 2024 Rentokil Initial plc Annual Report 2025 31 Strategic Report Corporate Governance Financial Statements Other Information |
|
Hygiene & Wellbeing Our strategy for Hygiene & Wellbeing is to deliver sustained revenue and margin growth by sharpening operational and sales execution, increasing footprint and density and pursuing M&A to build and support specialist service extensions. What we do Our Hygiene & Wellbeing business, trading under the Initial brand, holds a strong global position in core washroom hygiene services. We provide industry‑leading solutions for hand, air and in‑cubicle hygiene, and the hygienic collection and disposal of washroom waste, as well as the installation and servicing of washroom products. We are increasing our focus on washroom dignity and services for an ageing population. Building on our core Washroom Hygiene business expertise, we also deliver Premises Hygiene and enhance occupant experience through our Enhanced Environments business. Beyond customer premises, our specialist hygiene operations provide clinical waste management, dental hygiene and cleanroom services. Together, our portfolio helps organisations manage hygiene risk, create healthier working environments and public spaces, and make workplaces better and safer for colleagues and visitors. This focus on health and wellbeing translates directly to real cost savings and increased productivity for our customers’ who lose fewer days to sickness as a result. Where we operate Initial Hygiene operates across 74 markets in our International region, and our Ambius planting and scenting business operates in markets across North America and International. We support customers in key sectors: government, health, personal and professional services, leisure and hospitality, retail and manufacturing. Most customers contract with us on an annual basis, and our larger global customers are supported by a dedicated Global Account Manager. Leveraging our leadership in Pest Control The Hygiene & Wellbeing business continues to focus on operational excellence, product development, disciplined sales activity and dedicated Hygiene digital marketing. It leverages the same operating infrastructure as Pest Control, which enables the Group to deliver cost synergy benefits. As well as the shared operational and functional infrastructure, it benefits from common efficiency opportunities, including deploying the same technologies, aggregating procurement and frequently cross‑selling services across the combined customer base. Our performance 2025 $m 2024 $m Change (reported) % Change (constant currency) % Organic Growth Revenue 1,205 1,136 6.1% 4.3% 2.3% Operating Profit 230 196 17.3% 15.9% Adjusted Operating Profit 224 205 9.3% 7.8% Adjusted Operating Margin 18.6% 18.0% 0.6%pts 0.6%pts Organic Growth Q1 Q2 Q3 Q4 Full Year Hygiene & Wellbeing 1.6% 0.2% 3.2% 3.9% 2.3% Hygiene & Wellbeing Revenue increased by 6.1% to $1,205m (FY24: $1,136m) and by 4.3% at constant currency. Organic Revenue Growth was 2.3%. Growth was driven principally by key markets in Europe, UK & Sub-Saharan Africa. Adjusted Operating Profit increased by 9.3% to $224m (FY24: $205m) and by 7.8% at constant currency with Asia & MENAT and UK & Sub-Saharan Africa growing profits ahead of revenue. Adjusted Operating Margin increased to 18.6% (FY24: 18.0%). The profit performance reflected the benefit of pricing and productivity initiatives, alongside continued cost discipline, which more than offset inflationary pressures. Statutory Operating Profit increased by 17.3% to $230m (FY24: $196m). For FY25, Hygiene & Wellbeing represented 17% of Group Revenue and 18% of Group Adjusted Operating Profit. We acquired 5 Hygiene & Wellbeing businesses in the period with revenues of c.$8m in the year prior to acquisition. 5 Companies acquired in 2025 $8m Revenues in year prior to acquisition Our Businesses: Hygiene & Wellbeing continued How we do it 1. Hygiene assessment Hassle-free hygiene survey and consultation • Prompt response from local expert hygiene surveyors • On-site hygiene risk review and consultancy • Detailed inspection against health and safety guidelines, focusing on your business’s hygiene needs 2. Tailored solutions Customised hygiene solutions for your business • Hygiene solutions tailored to your unique business needs • Award-winning products compliant with hygiene and environmental regulations • Quick and discreet installation, ensuring minimal disruption to your business operations 3. Maintenance and aftercare Ongoing support of hygiene excellence • Dedicated manager for global customers providing regular support and query resolution • Regularly scheduled account reviews and on-site hygiene audits • Access to technologies and innovations for continuous improvement in hygiene standards 32 Rentokil Initial plc Annual Report 2025 |
|
CHAMPIONING WASHROOM DIGNITY AMBIUS WINS BIG Access to suitable washrooms is vital for everyone, particularly those with medical conditions requiring urgent or frequent use. Initial Hygiene champions ‘washroom dignity’ to create hygienic, comfortable and inclusive spaces. Men’s facilities have historically been neglected, with our research1 showing that over half of men avoid public washrooms due to bad odours (56%) or uncleanliness (60%). While investment in basic hygiene such as odour control and hand-washing facilities is improving, the most significant shift is our ‘Stalls For All’ project. This initiative advocates for mandatory sanitary waste bins in all washrooms – male, female and gender-neutral. To further support a dignified experience, we have also launched in-cubicle dispensers for male incontinence products. 1. Research conducted by Opinium on behalf of Initial Washroom Hygiene. 17–20 January 2023. 1,000 male UK adults. Ambius secured 20 honours – 17 design awards and three technician awards – at the 2025 International Plantscape Awards. These awards recognise outstanding achievements in interior and exterior plantscaping, honouring companies that push the boundaries of creativity, sustainability and functionality. “At Ambius, every project is unique and crafted to transform spaces into environments that inspire connection, foster wellbeing and celebrate the beauty of nature,” said Lorri MacHarg, President of Ambius. “These 20 awards celebrate our team’s creativity and dedication to making the world healthier and greener, one space at a time.” SPOTLIGHT ON: OPERATIONAL INNOVATION SPOTLIGHT ON: OPERATIONAL EXCELLENCE Macro trends supporting growth Our Hygiene & Wellbeing business operates in an attractive market with strong structural growth opportunities. Demand is underpinned by rising expectations of hygiene in workplaces and public spaces, supported by drivers including: essential non-discretionary services; tighter and more complex regulation; rapid urbanisation and denser city living; and heightened public expectations around health, safety, and cleanliness following recent global health crises. Together, these trends are driving sustained customer demand for partners that can support higher standards of protection, compliance and brand reputation. Market opportunity The global washroom services market is broad and fragmented, making precise sizing difficult. However, we estimate the core washroom market will grow at a CAGR of c.4% to 2030. As the market is expected to exceed GDP growth, the business is well positioned for long-term sustained performance. 4% Global washroom market CAGR to 2030 Market drivers A Heightened focus on hygiene and sanitation The global pandemic has permanently increased hygiene awareness, supporting sustained demand across hygiene products and services. Growth opportunities are also emerging in hygiene and wellbeing solutions that enhance the user experience, which is driving demand for services that create healthier, more pleasant spaces and wellness-enabled buildings. A Environmental and legislative factors Sustainability legislation is increasing alongside customer demand for more sustainable hygiene solutions. Governments worldwide are tightening hygiene and sanitation regulations, raising compliance requirements. A Social and demographic changes Urbanisation continues rapidly, with 68% of the global population expected to live in cities by 2050, largely in developing regions. Rising middle-class populations and the millennial generation’s focus on health and wellbeing are driving higher expectations for hygiene, living standards and health as disposable incomes grow. A Ageing population By 2030, one in six people will be aged 60 or over, increasing demand for accessible washrooms and infection-prevention solutions. The ageing population is a significant demographic trend with long-term implications for the hygiene industry. Rentokil Initial plc Annual Report 2025 33 Strategic Report Corporate Governance Financial Statements Other Information |
|
Our Regions 2025 $m 2024 $m Change (reported) % Change (constant currency) % Organic Growth Revenue 4,294 4,164 3.1% 3.2% 2.3% Pest Control 4,148 4,026 3.0% 3.1% 2.2% Pest Control Services 3,501 3,430 2.1% 2.1% 1.1% Business Services 647 596 8.6% 8.7% 8.9% Hygiene & Wellbeing 146 138 5.8% 6.0% 4.0% Operating Profit 413 534 (22.7)% (22.6)% Adjusted Operating Profit 749 713 5.0% 5.1% Adjusted Operating Margin 17.4% 17.1% 0.3%pts 0.4%pts Organic Growth Q1 Q2 Q3 Q4 Full Year North America 0.7% 1.4% 3.4% 3.6% 2.3% North America Pest Control Services -0.2% 0.3% 1.8% 2.6% 1.1% North America Business Services 5.6% 9.2% 11.9% 7.8% 8.9% Overview Our North America region delivered 62% of Group Revenue in 2025, with 82% generated from the Pest Control Services business,15% from Business Service operations, and 3% from the Hygiene & Wellbeing business. North America benefits from strong underlying fundamentals, including improving colleague retention, good progress on customer satisfaction, and a portfolio of powerful national, regional and specialist brands. North America is the world’s largest pest control market, valued at $14.2bn in 2025, and is expected to grow by a CAGR of c.6% to 2035. Growth is driven by strong commercial demand and the essential nature of pest control services in supporting customers’ ‘licence to operate’. The market is broadly segmented into three areas, with Residential accounting for c.43% of the total market value, followed by Commercial at c.37% and the remainder is Termite. Rentokil Terminix is the largest pest control provider in the region. Our Pest Control business has c.67% of regional revenue generated by our contract portfolio with the remaining 33% coming from one-time revenue - job work and also the sale of goods primarily through our product distribution business. Within Pest Control, our Business Services are high-quality, well-managed businesses. Each benefits from deep specialist expertise within its respective market, including: VDCI for public sector mosquito vector control, SOLitude for lake management, Steritech for food hygiene and brand standards auditing, and Target, which is our Pest Control and Turf & Ornamental Products distribution business. Performance Full year Revenue was up 3.1% to $4,294m and by 3.2% at constant currency. Organic Revenue was up 2.3%. Performance improved in the second half, with H2 Organic Revenue Growth of 3.5% (H1: 1.1%). A robust pricing environment supported strong price realisation, with the measures implemented to drive up customer retention and increase new business contributing to an easing of volume reductions through the year. North America Pest Control Services delivered an encouraging quarterly sequential improvement in Organic Revenue Growth including 2.6% in Q4. North America Business Services continued to see positive momentum through the year with H2 revenues of $341m (H1: $306m). Organic Revenue Growth in H2 was 9.8% (H1: 7.8%). Our distribution business delivered double-digit Organic Revenue Growth in the year, and Q4 was boosted by a good performance from our lake management business. Adjusted Operating Profit increased by 5.1% to $749m. Adjusted Operating Profit margin was 17.4%, up 0.4%pts on the prior year, reflecting some early benefit from the business simplification and cost efficiency programme. Statutory Operating Profit was $413m (FY24: $534m). Colleague retention increased to 82.2% (FY24: 79.4%) and customer retention improved to 80.5% (FY24: 80.1%). Bolt-on M&A activity continued, with 12 acquisitions completed (FY24: 13) with combined revenues of c.$27m in the year prior to acquisition. We continue to selectively pursue high quality M&A assets in the North America region. Improving profitable growth in North America – 2025 progress At the beginning of 2025, we set out our evolved strategy to improve Organic Revenue Growth by strengthening the core performance drivers of customer retention, colleague retention and growth in lead volumes. North America These 2025 activities have delivered encouraging results with improving growth in leads through the year, with 7.1% growth in the second half, and growth in the value of our contract portfolio. Enhanced digital marketing and investment in brand awareness During the year we refocused our marketing investment towards more efficient, higher return opportunities with a stronger focus on organic lead generation and building brand awareness for long-term brand health. We have supported growth in leads through search engine optimisation activity with new digital content, improved local web pages and awareness campaigns. In total we have launched over 400 new branch, metro and state pages across our major brands. For Terminix alone, in Q4, this drove a five-fold increase in the number of times the brand appeared in ‘exterminator near me’ searches. We have also evolved content to maximise AI optimisation driving significant increases in our brands’ appearances in AI searches. This activity has all been supported by, and continues to evolve through, a focus on data-driven marketing performance and efficiency, and we can measure its success through a double-digit reduction in the cost of each lead and a meaningful shift in the proportion of organic leads. Elevating our local marketing execution will remain in focus in 2026, with continued investment in data and insights to better target the highest value leads with the strongest conversion rates. Improved customer proximity and local lead generation In Q4 2024, we started a successful pilot of satellite branches. These are smaller branches that are fully branded and operational, serving as localised hubs with active facilities, but have a low cost to operate. These branches increase local community presence, customer proximity and lead growth in key metro areas with high-value untapped customer demand. We continued the roll-out through 2025, taking the total number of these smaller, local branches to over 150. As these branches mature their performance improves and by Q4, branches with these localised hubs connected to them recorded lead flow more than double that of branches without. In 2026, we will expand this network of smaller, local branches and expect to have around 220 by the end of the year. 34 Rentokil Initial plc Annual Report 2025 |
|
Strengthened sales execution At the beginning of 2025 we integrated sales teams back into field operations leadership at the branch level to drive local accountability with measurable results. By the second half we had improved key metrics of sales visits per day and services proposed. There is even more to do in 2026 to focus on execution and conversion. We successfully piloted door-to-door sales across 25 territories to penetrate an additional fast-growing sales channel for residential contracts in the peak US pest season. We expect to extend this to cover around 40 territories in 2026. Driving up customer retention through focus on customer satisfaction We have continued to execute the ‘Drive to 85’ programme to improve customer retention over time to be closer to the average outside North America. This requires a relentless focus on improving the overall quality of end-to-end service through getting the basics right including service adherence, speed of sale to install, customer communications and billing and scheduling. Our State of Service rate for 2025 was 99%, a strong indication we are delivering on customer expectations. We have had success reducing billing friction through initiatives such as autopay and the investment in the ‘Customer Saves’ team at the start of the year has delivered good results. Another source of improving customer satisfaction has been through investment in the Trusted Advisor programme, training field technicians to build sticky relationships based on delivery of high-value advice and comprehensive pest prevention solutions in addition to recommendations for add-on services, which also provides an additional source of leads. Participation in the Trusted Advisor programme is up 5% year-on-year to 61.5%. Overall, we have seen a 5.3 point year-on-year improvement in US Commercial Pest customer Net Promoter Scores (NPS), with a 3.1 point year-on-year increase for US Residential customers, and an improvement in customer retention of 0.4%pts to 80.5% in North America. This is a metric which is moving slowly, but where we see significant opportunity. Investing in key capabilities – pricing and data One of the key drivers of increase in the value of our contract portfolio is pricing. There remains significant opportunity to optimise pricing (e.g. through pricing segmentation) and in 2025 we invested in new leadership and a new team in this area. There is also a clear opportunity to drive performance through the increasing use of data science and analytics across the organisation, which we have also invested behind in 2025 with new leadership and a new team. Leveraging data and analytics Through 2025 we focused on improving our data and analytics, with one of the key benefits being a more granular branch-level assessment of performance across a full suite of metrics. We used this insight to inform targeted growth initiatives, including replacing branch-level leadership across over 90 branches resulting in meaningful levels of acceleration in growth. Business simplification and cost efficiencies At the same time as driving Organic Revenue Growth we are focused on business simplification and efficiency. We made good progress in 2025 towards our target of a $100m cost reduction in 2027 from the inflation-adjusted 2024 spend level. A number of efficiency programmes are underway to deliver this including a headcount reduction programme during the period, procurement initiatives to benefit from purchasing scale and the use of outsourcing and Global Capability Centres for back-office roles. In 2025, these initiatives delivered in-year savings of $25m. We continue to expect that, in 2027, the delivery of these cost savings, together with an improved organic growth rate, will allow the North American business to achieve Operating Profit margins of above 20%, whilst delivering on the streamlined integration process, supported by enhanced marketing investment and the increased branch network. During the year, we incurred one-time costs to achieve these savings (cash and non-cash) of $77m. We currently expect further one-time costs in 2026 in the region of $70m. 150 Smaller, local branches operating at the end of 2025 >2x Lead generation from branches connected to a local hub DRIVING LOCAL MARKET PENETRATION Expanding smaller, local branch network to increase local community presence In Q4 2024, we launched a successful pilot of smaller, local branches which we called our satellite programme. These smaller branches are fully branded and operational, serving as localised hubs with active facilities, but a lower cost to operate. This is a key part of our strategy to enhance customer proximity and presence in the community, with locations targeted in key metro areas with high-value untapped customer demand. The roll-out of these low-cost branches continued through 2025, taking the total to over 150 by the end of the year. These smaller, local branches are generating strong lead flow and operating profitably, and we plan to open another c.70 in 2026, taking the total to around 220. Performance at these locations continues to improve as they mature and build local five-star reviews. By Q4 2025, branches connected to a local hub were recording more than double the lead flow compared to branches without. SPOTLIGHT ON: LEAD GENERATION Rentokil Initial plc Annual Report 2025 35 Strategic Report Corporate Governance Financial Statements Other Information |
|
Our Regions: North America continued Streamlining operations in 2026 At the start of 2025, we paused integration activity and began the implementation of an evolved strategy to optimise the combination of the Rentokil and Terminix businesses. As we move into 2026, we will continue to progress this strategy with a substantially streamlined approach which simplifies further integration activity across brands, branches, systems and pay plans. Optimising Brand strategy In 2025, we laid out a plan to focus on two national brands and nine well-known regional brands. This focus has increased leads for these brands substantially in the second half. Further data analysis confirms that growth is optimised with multiple brand entry points to tap into highly localised residential and SME demand across national, regional and local brands with strong brand equity. We now plan to retain around 30 brands which represent over 90% of our revenues. Over time we will carefully and progressively retire the remainder, shifting that business to the stronger and more salient retained brands. Optimising Branch strategy Our evolved branch strategy prioritises local customer proximity and protects service quality and customer retention by keeping more local brands and their branches, and by expanding our network of small, local branches from the satellite programme. Our plan is to create a high-quality network of around 800 branches by the end of 2026, including around 220 of the small, local branches. This evolved strategy will minimise change across branches and technicians, which will support customer retention. Simplified Systems approach Following the pause in integration in 2025 we have developed an alternative approach which uses branch data from our existing systems (Mission and PestPac) to build an integrated Branch 360 data reporting, insight and action system accessed through a unified branch BI (Business Intelligence) scorecard which delivers consistent KPIs and insight into the field on how to leverage best practice and target underperforming branches with suggested areas of action. This dashboard enhances the user experience driving accountability for performance, with ongoing development from initial pilot phases already underway. For Commercial branches, systems migration resumed in Q4 2025 with encouraging results. This will continue in 2026, enabling all Commercial customers to access our online portal, PestNet Online, as we consolidate on a single branch system. Integrating Pay Plans The de-coupled approach on systems allows for the harmonisation of pay plans to proceed without the need to complete branch-by-branch IT migration. We have completed the harmonisation of pay plans for branch managers, updated Commercial sales plans to better incentivise performance and there will be no change to Residential sales colleagues plans in 2026. For our Technician colleagues, future changes will involve onboarding new colleagues to the new plans, while existing colleagues will be offered a ‘grandfathering’ choice between old and new plans to ensure stability and talent retention. We are confident this revised plan to optimise the combination of Rentokil and Terminix in North America mitigates further risk of disruption while still allowing us to deliver on our North America margin target of over 20% in 2027. Our plan for more branches and fewer brand combinations bolsters our local presence, maximises our penetration of highest value demand and minimises fewer technician changes, protecting customer retention. Retaining our existing systems reduces risks to growth, and incremental investment through 2025 gives us confidence we can deliver the right data and insights to support performance and satisfy customer expectations. During 2026, we will also remain focused on building momentum in sales and operations through driving accountability and disciplined execution and delivering on a renewed focus on Commercial as a key growth segment through improved service, industry leading offerings and dedicated local and national resources. In North America, Business Services comprises high-quality businesses with deep expertise in specialist areas. They are non-route pest and hygiene operations sitting alongside our core Pest Control activities in the region. These include VDCI for public sector mosquito vector control, SOLitude for lake management, Steritech for food hygiene and brand standards auditing, and Target Specialty Products, our Pest Control and Turf and Ornamental Products distribution business. Business Services accounts for 15% of Revenue in North America. In 2025, Revenue grew 8.7%, with 8.9% Organic Growth. The largest business in the segment is currently Target while the Vector Control, Lake and Food Audit markets are each expected to grow at a CAGR of 5.5% through to 2030. SPOTLIGHT ON: BUSINESS SERVICES STRONG STANDALONE BUSINESSES 5.5% CAGR through to 2030 for each of Vector Control, Lake and Food Audit markets 8.9% Organic Growth across Business Services 36 Rentokil Initial plc Annual Report 2025 |
|
International 2025 $m 2024 $m Change (reported) % Change (constant currency) % Organic Growth Revenue 2,614 2,453 6.6% 4.8% 3.0% Operating Profit 451 377 19.6% 16.8% Adjusted Operating Profit 518 479 8.1% 5.7% Adjusted Operating Margin 19.8% 19.5% 0.3%pts 0.2%pts Organic Growth Q1 Q2 Q3 Q4 Full Year International 3.2% 2.0% 3.4% 3.4% 3.0% Overview The International Region accounted for 38% of Group Revenue in the full year, comprising 59% from the Pest Control business and 41% from the Hygiene & Wellbeing business. The Region is made up of a portfolio of high-quality businesses, operating in strong, largely non-cyclical markets, across 88 countries in Europe, the United Kingdom, Asia, MENAT, Latin America, Sub-Saharan Africa and the Pacific. Rentokil holds leading positions in pest control in key high-demand growth markets such as India, China and Indonesia. Initial Hygiene operates in 72 countries across the International Region, growing its footprint in key Cities of the Future where urbanisation is driving demand. Strong structural growth drivers together with the increasing adoption of digital innovation in pest management, continue to create attractive opportunities across our International markets. We are focused on capturing this growth through our industry leading operations, the roll out of our connected technology, and our excellent M&A programme which targets expansion in some of the fastest growth economies in the world, supported by our Cities of the Future programme. We continue to build scale and density in new and existing cities, while expanding our presence in high-potential territories including Latin America, India, and Australia. Performance Revenue Full year Revenue was up 6.6% to $2,614m and by 4.8% at constant currency. Organic Revenue was up 3.0%. Performance improved in the second half, with H2 Organic Revenue Growth of 3.4% (H1: 2.6%). Europe incl. LATAM saw the strongest growth in the region, driven by the Southern European markets of Spain and Portugal which experienced good volume growth from healthy overall demand and a solid pricing environment. The UK & Sub-Saharan Africa region and Asia & MENAT also saw good growth. In the UK this was driven by the core UK Pest Control and Plants businesses and an improving performance from our Property Services division in H2. In Asia there was strong growth in Indonesia and India benefiting from underlying demand growth in these fast-growing economies. Growth in the Pacific region was softer across both one-off and contract revenue primarily due to weather related challenges which particularly impacted rural and trackspray operations in the year. Profit Adjusted Operating Profit in our International region increased by 8.1% to $518m and by 5.7% at constant currency. Adjusted Operating Margin was 19.8%, up 0.2%pts on the prior year. Statutory Operating Profit was $451m, up 19.6% year-on-year (FY24: $377m). The UK and Sub-Saharan Africa region delivered double-digit growth in Adjusted Operating Profit reflecting the strong revenue performance. Europe and Asia & MENAT also delivered Adjusted Operating Profit growth ahead of the regional average, with Asia & MENAT’s margins demonstrating resilience despite a backdrop of high wage inflation. Within the Pacific region, Operating Profit grew slower than the overall International region, consistent with the revenue growth. Colleague retention of 90.3% was slightly below last year (FY24: 90.5%) with small dips from exceptionally high levels in Asia and Latin America. Customer retention improved to 85.7% (FY24: 85.1%). The International region acquired 24 businesses with total revenues in the year prior to acquisition of $36m. A UNIFIED CULTURE ACROSS EUROPE In November 2025, the top 150 leaders from across the Europe business’s 19 countries gathered in Malaga, Spain, for a three-day summit to launch the European Culture Programme. The Programme is designed to create a unified business across diverse European nations – one that operates with speed and simplicity while acting as a magnet for the best talent. It aims to drive the practical impact of culture over time, moving towards common ways of working across the region to simplify operations. Participants described the Programme as “inspirational”, and it is set to be rolled out further across Europe in 2026. SPOTLIGHT ON: CULTURE AND ENGAGEMENT Rentokil Initial plc Annual Report 2025 37 Strategic Report Corporate Governance Financial Statements Other Information |
|
Financial Review Operating Profit In 2025, Group Adjusted Operating Profit was $1,070m, up 5.4% on a constant currency basis, supporting Operating Profit margin growth of 0.3%pts to 15.5%. Increasing margins through cost efficiencies At the start of this year, I set out a plan to begin to simplify the business and create fuel for growth and margin improvement through cost efficiencies, with a focus on North America. We are tracking well towards our target of a $100m reduction in costs in 2027 in our North America business compared to a 2024 inflation-adjusted base. During the year we have moved some back-office functions to Global Capability Centres, improved our discipline around procurement to better leverage our scale purchasing power, and improved productivity with the use of technology and automation. In the year, we have realised around $25m of the total and have ambitious plans in place for the future to deliver the full $100m. Our confidence in these plans, and the improvements in Organic Growth we have seen in 2025, underscore our North America Operating Profit margin target of over 20% in 2027. Data driving commercial insights and informing improved decision making We have made real progress this year enhancing our data and commercial analytics capabilities and taken significant strides forward in the use of insights to understand and improve performance. In North America, this has driven a more informed understanding of the drivers of performance at our best and worst performing branches. In digital marketing, our insights facilitated the re-allocation of spend to higher-return and more efficient channels, reducing our overall cost per lead. There is more to be done in 2026 to ensure our technicians and sales teams in the field are armed with the best data to deliver an exceptional customer experience in the most efficient way. Cash generation and balance sheet In 2025, we have improved our Free Cash Flow Conversion with a more disciplined focus on working capital and capital expenditure. We have reported Free Cash Flow Conversion of 97.6%, compared to a target of 80%, benefiting from real estate sales and some one-off benefits in the overall working capital improvement. This remains an area of significant focus. Overall Free Cash Flow grew 24.5% to $615m, which combined with the improvement in profitability, supported a reduction in our Net Debt to Adjusted EBITDA ratio to 2.6x. On 30 September 2025 we completed the sale of the France Workwear business for $397m. Strategically this divestment reinforces our focus on our core pest control and hygiene and wellbeing sectors and financially it increases our cash generation going forwards, reducing our capital expenditure needs and improving our cash conversion ratio. Our capital allocation model remains consistent. We will invest in the business organically and inorganically to drive our compounding growth model, grow the dividend sustainably, and then return surplus capital to shareholders whilst maintaining a strong balance sheet. 2026 priorities Looking forward to 2026, across the Group, we will continue to focus on growing organic revenues through more efficient and effective marketing spend, pricing optimisation and improved customer retention. We will also continue to seek out opportunities for improved cost efficiency and cash flow conversion to fuel our long-term compounding growth model of shareholder value creation. We are encouraged to see the positive impact on performance of the strategic initiatives we implemented at the start of this year and will build on this in 2026 with a continued focus on faster organic growth, improving margins and strong Free Cash Flow Conversion. Paul Edgecliffe-Johnson Chief Financial Officer Introduction 2025 was a year of encouraging progress, with improving performance through the second half, as we started to see the benefits of the strategic initiatives implemented at the beginning of the year. In addition to improving organic growth, when I joined Rentokil Initial just over a year ago, I saw significant opportunities to improve our commercial insights and decision making through enhancing data capabilities across the organisation, to grow margins through cost efficiencies and to improve free cash flow to fuel our capital allocation model. We have made good progress in each of these areas in 2025, with more to go for in 2026. Revenue We delivered Revenue of $6,908m in 2025, up 3.8% at constant exchange rates, and including Organic Revenue Growth of 2.6%. We were particularly pleased with the second half and fourth quarter performance, with Organic Revenue Growth of 3.5% in the second half of the year compared to 1.6% in the first half. This improvement was primarily driven by North America Pest Control Services where Organic Revenue Growth accelerated to 2.6% in the fourth quarter from 1.8% in the third quarter and 0.1% in the first half. 38 Rentokil Initial plc Annual Report 2025 |
|
Summary of financial performance Regional performance Revenue Adjusted Operating Profit 2025 $m 2024 $m Change (constant currency) % Organic Revenue Growth % 2025 $m 2024 $m Change (constant currency) % North America Pest Control 4,148 4,026 3.1% 2.2% 720 688 4.7% Hygiene & Wellbeing 146 138 6.0% 4.0% 29 25 17.8% 4,294 4,164 3.2% 2.3% 749 713 5.1% International Pest Control 1,555 1,455 5.4% 3.7% 323 299 5.2% Hygiene & Wellbeing 1,059 998 4.0% 2.0% 195 180 6.5% 2,614 2,453 4.8% 3.0% 518 479 5.7% Central (191) (175) (6.9)% Restructuring costs (6) (9) 35.7% Total 6,908 6,617 3.8% 2.6% 1,070 1,008 5.4% Category performance Revenue Adjusted Operating Profit 2025 $m 2024 $m Change (constant currency) % Organic Revenue Growth % 2025 $m 2024 $m Change (constant currency) % Pest Control 5,703 5,481 3.7% 2.6% 1,043 987 4.9% Hygiene & Wellbeing 1,205 1,136 4.3% 2.3% 224 205 7.8% Central – – – – (191) (175) (6.9)% Restructuring costs – – – (6) (9) 35.7% Total 6,908 6,617 3.8% 2.6% 1,070 1,008 5.4% Revenue Group Revenue increased 3.8% to $6,908m (FY24: $6,617m) driven by a strong demand and pricing environment across our scale markets. Group Organic Revenue grew 2.6%. Revenue growth in North America was 3.2% driven primarily by pricing. Organic Revenue Growth was 2.3%, with improvements through the year (Q1:0.7%; Q2:1.4%; Q3:3.4%; Q4:3.6%). The International business grew Revenue 4.8% for the full year with growth across the region particularly in the UK, Southern Europe and the faster growing economies of India and Indonesia. Organic Revenue Growth was up 3.0%. Our Pest Control category grew Revenue by 3.7% to $5,703m. Organic Revenue Growth was 2.6% with 2.2% Organic Revenue Growth in North America and 3.7% Organic Revenue Growth in International being driven primarily by pricing. Hygiene & Wellbeing Revenue increased by 4.3% to $1,205m. Organic Revenue Growth was up 2.3%. Revenue ($m) H1 H2 Full Year Group 3,364 3,544 6,908 North America 2,106 2,188 4,294 International 1,258 1,356 2,614 Organic Revenue Growth H1 H2 Full Year Group 1.6% 3.5% 2.6% North America 1.1% 3.5% 2.3% International 2.6% 3.4% 3.0% Profit Adjusted Operating Profit increased by 5.4% during the year to $1,070m (FY24: $1,008m) reflecting revenue growth of 3.8% and the benefit of cost efficiency activities. Performance reflected improved results across the Group, with growth delivered in both North America and International. Adjusted Operating Profit for Pest Control increased by 4.9% to $1,043m (FY24: $987m). Hygiene & Wellbeing Adjusted Operating Profit increased by 7.8% to $224m (FY24: $205m). Adjusted Operating Profit growth was 16.7% in the second half of the year with the benefits from cost efficiency initiatives in North America being weighted to later in the year. Adjusted Operating Profit margin of 15.5% increased 0.3%pts year-on-year. There was consistent growth across the Group with year-on-year growth in North America of 0.4%pts and International of 0.2%pts. On a category basis, Adjusted Operating Profit margins in Pest Control grew 0.2%pts and by 0.6%pts in Hygiene & Wellbeing. Adjusted Profit Before Tax, which excludes one-off and adjusting items and amortisation costs, was $876m (FY24: $842m). Adjusted interest was $204m, $29m higher year-on-year due to the interest cost of new bond debt issued, lower bank interest received and a reduction in the impact from hyperinflation accounting. One-off and adjusting operating items of $287m (FY24: $110m) include an increase in the provision for termite claims and costs related to North America transformation and other strategic initiatives. Statutory Operating Profit was $584m (FY24: $644m). Statutory Profit Before Tax was $390m (FY24: $462m). Adjusted Operating Profit ($m) H1 H2 Full Year Group 511 559 1,070 North America 356 393 749 International 242 276 518 Adjusted Operating Profit Margin H1 H2 Full Year Group 15.2% 15.8% 15.5% North America 16.9% 18.0% 17.4% International 19.2% 20.4% 19.8% Rentokil Initial plc Annual Report 2025 39 Strategic Report Corporate Governance Financial Statements Other Information |
|
Financial Review continued Cash flow Cash generation remained a key focus during the year, supported by continued discipline in operational cash conversion and working capital management. Free Cash Flow from continuing operations was $615m (FY24: $494m), with the improvement driven principally by the higher profits and improved working capital position, partly offset by higher cash interest. Free Cash Flow for the Group including discontinued operations was $636m (FY24: $526m), $110m higher year-on-year. Free Cash Flow Conversion of 98% exceeded our guidance as a result of a particularly strong performance in debtor collection across the Group. One-off and adjusting items (non-cash) were an outflow of $214m (FY24: $19m). The Group had a $59m working capital outflow in the year (FY24: $126m outflow). The movement on provisions was a $142m inflow (FY24: $76m outflow), primarily reflecting the increase in the provision for termite damage claims of $201m offset by the $95m of cash settled claims. Capital expenditure additions were $196m (FY24: $190m), with disposals of property, plant and equipment of $20m (FY24: $5m). Lease payments were $186m (FY24: $177m). Cash interest payments were $222m, $41m higher than the prior year, reflecting the impact of refinancing existing debt at higher prevailing rates. Cash tax payments were lower year-on-year at $100m (FY24: $107m) mainly due to a one-off benefit from a change to US tax legislation. Free Cash Flow from discontinued operations was $21m (FY24: $32m). Cash spend on current and prior year acquisitions was $121m, receipts from the disposal of France Workwear were $391m, dividend payments were $304m and the cash impact of one-off and adjusting items was $100m, largely related to North America transformation costs. Disposal of France Workwear The sale of our France Workwear business, which we announced on 28 May 2025, completed on 30 September 2025, with net cash proceeds of €339m ($397m). The business has been accounted for as a discontinued operation since 31 May 2025. In FY24, France Workwear, including flat linen textile and clean room business, generated Revenue of $324m, Adjusted Operating Profit of $57m and had associated capital expenditure of $93m. For the nine months ended 30 September 2025, France Workwear, including flat linen textile and clean room business, generated Revenue of $261m and Adjusted Operating Profit of $74m. M&A In 2025, we acquired 36 businesses, comprising 31 in Pest Control and 5 in Hygiene & Wellbeing for a total consideration of $115m. Revenues in the year prior to purchase were c.$63m. We added 12 new businesses in North America during the period and 24 businesses in our International region. Revenues acquired in the year prior to purchase were c.$27m and c.$36m respectively. M&A remains relevant for our strategy for growth. We continue to seek attractive bolt-on deals, both in Pest Control and Hygiene & Wellbeing, to build density in existing and new markets. Our pipeline of prospects remains strong. Central and regional overheads Central and regional overheads of $191m were up $12m at CER ($16m at AER) on the prior year predominantly as a result of inflationary increases and increased investment in our proprietary digital applications, AI capabilities and IT security. Restructuring costs With the exception of integration costs for significant acquisitions, the Company reports restructuring costs within Adjusted Operating Profit. Costs associated with significant acquisitions are reported as one-off and adjusting items and excluded from Adjusted Operating Profit. Restructuring costs of $6m were down $3m on prior year (FY24: $9m). They consisted mainly of costs in respect of initiatives in our European business. Legacy termite warranty obligations The legacy termite warranty provision is based on an assessment of probable future cash outflows arising from historical and future claims relating to the entire pool of Termite contracts acquired on the acquisition of Terminix. It is based on a number of assumptions including the number, and rate of claims arising, the costs anticipated to resolve these claims, customer churn rate for this pool of contracts, inflation and discount rate, and the actual claim outcomes versus the assumptions which are reviewed in detail at each half year and year end. In the year to 31 December 2025, we have increased the termite provision by $201m to $384m. This increase has largely been driven by: • A continued increase in the number of litigated claims for both Residential and Commercial customers received in 2025 compared to 2024, albeit at a lower level than at the time of acquisition • A continued increase in the cost per claim, as our proactive strategy to solve customer problems and reduce litigation continues • The settlement of some of the larger, legacy complex Commercial cases at a higher average cost than the historical average, due to the particular nature of the underlying facts of these claims • An increase in the long term inflation rate in the model from 2% to 3.2%. When the original provision was booked at the time of the acquisition a long term inflation rate was assumed for the 20 year life of the provision. Since then we have experienced higher levels of general inflation and, specifically, we have seen an inflation premium over general inflation in relation to the cost inputs for settling the claims (namely legal defence costs, building materials and house prices). The cost of settling claims in the year to 31 December 2025 has been $95m and we expect a similar level of cash payments in 2026. Interest Adjusted interest of $204m includes $31m of lease interest charges and a $33m offsetting reduction from the impacts of hyperinflation and net interest received. In the year, hyperinflation of $3m was $6m lower than the prior year (FY24: $9m) due to a drop in hyperinflation in Argentina and devaluation of the Argentinian peso. Cash interest in FY25 was $222m (FY24: $181m), with the year-on-year increase principally reflecting higher bond interest on new debt issuance in the year and a reduction in bank interest received. Tax The income tax charge for the period at actual exchange rates was $100m on the reported Profit Before Tax of $390m, giving an effective tax rate (ETR) of 25.6% (FY24: 25.1%). The Group’s ETR before amortisation of intangible assets (excluding computer software), one-off and adjusting items and the net interest adjustments for FY25 was 25.3% (FY24: 24.2%). This compares with a blended rate of tax for the countries in which the Group operates of 25.3% (FY24: 25.3%). 40 Rentokil Initial plc Annual Report 2025 |
|
Net debt and cash flow Group Free Cash Flow including discontinued operations was $636m, $110m higher than the prior year, predominantly due to an improved performance on trading and working capital. After M&A spend of $121m, disposal receipts of $391m, dividends paid of $304m, the cash impact of one-off and adjusting items of a $100m outflow and a net adverse impact of foreign exchange and other items of $87m, net debt reduced by $367m to $3,650m. The adverse foreign exchange impact was caused by the translational impact on our EUR and GBP denominated bonds carrying value as well as a positive impact on our EUR denominated derivatives. The debt related cash inflows of $532m resulted from the issuance of the Group’s inaugural USD bond transaction in April, raising $1.25bn across two tranches; $750m 5 year bond at 5.0% and a $500m 10 year bond at 5.625%. Subsequently the Group repaid its $700m term loan which was falling due in October 2025. Funding As at 31 December 2025, the Group had liquidity headroom of $2.6bn, including $1bn of undrawn revolving credit facilities, with a maturity date of October 2029. The Net Debt to Adjusted EBITDA ratio was 2.6x at 31 December 2025 (31 December 2024: 2.9x). Dividend The Board is recommending a final dividend in respect of 2025 of 8.24 cents per share. This equates to a full-year dividend of 12.39 cents per share, up 3.0% year-on-year, in line with the Company’s progressive dividend policy. The final dividend is first determined in US dollars and the sterling amount will be announced on 23 April 2026 using the average of the market exchange rates for the three working days commencing 20 April 2026, using the closing spot rate. The dividend is payable to shareholders on the register at the close of business on 10 April 2026, to be paid on 18 May 2026. The last day for DRIP elections is 24 April 2026. Technical guidance update for FY26 P&L • One-off and Adjusting items excl. North America Transformation costs: c.$10-$15m • North America Transformation costs*: c.$70m • P&L adjusted interest costs: c.$210m-$220m, including $5-$10m of hyper-inflation • Estimated Adjusted Effective Tax Rate: 25%–26% Cash • One-off and Adjusting items: c.$80m-$85m • Movement on provisions: c.$85-$95m • Capex excluding right of use (ROU) asset lease payments: $190m-$200m • Cash interest: c.$195m-$205m • Cash tax payments: $110m-$125m • Anticipated spend on M&A in 2026 of c.$200m * Reported as one-off and adjusting items and excluded from Adjusted Operating Profit and Adjusted PBTA. Net debt and cash flow $m at actual exchange rates Year to Date 2025 $m 2024 $m Change $m Adjusted Operating Profit 1,070 1,008 62 Depreciation 329 312 17 Other 31 45 (14) Adjusted EBITDA 1,430 1,365 65 One-off and adjusting items (non-cash) (214) (19) (195) Working capital (59) (126) 67 Movement on provisions 142 (76) 218 Capex – additions (196) (190) (6) Disposals of Property, Plant and Equipment 20 5 15 Capital element of lease payments and initial direct costs incurred (186) (177) (9) Cash interest (222) (181) (41) Cash tax (100) (107) 7 Free Cash Flow – continuing operations 615 494 121 Free Cash Flow – discontinued operations 21 32 (11) Free Cash Flow 636 526 110 Acquisitions (121) (219) 98 Disposal of companies and businesses 391 – 391 Dividends (304) (292) (12) Cash impact of one-off and adjusting items (100) (99) (1) Debt related cash flows Cash inflow/(outflow) on settlement of debt related foreign exchange forward contracts (9) (11) 2 Net investment in term deposits – (1) 1 Proceeds from issue of debt 1,232 – 1,232 Debt repayments (700) (464) (236) Debt related cash flows 523 (476) 999 Net increase/ (decrease) in cash and cash equivalents 1,025 (560) 1,585 Cash and cash equivalents at the beginning of the year 467 1,062 (595) Exchange gains /(losses) on cash and cash equivalents 97 (35) 132 Cash and cash equivalents at end of the financial year 1,589 467 1,122 Net increase/(decrease) in cash and cash equivalents 1,025 (560) 1,585 Debt related cash flows (523) 476 (999) IFRS 16 asset/ (liability) movement (3) 5 (8) Debt acquired (1) (11) 10 Debt disposed 21 – 21 Bond interest accrual (65) (3) (62) Foreign exchange translation and other items (87) 83 (170) (Decrease)/increase in net debt 367 (10) 377 Opening net debt (4,017) (4,007) (10) Closing net debt (3,650) (4,017) 367 Rentokil Initial plc Annual Report 2025 41 Strategic Report Corporate Governance Financial Statements Other Information |
|
Use of Non-IFRS Measures Reconciliation of non-IFRS measures to the nearest IFRS measure The Group uses a number of non-IFRS measures to present the financial performance of the business. These are not measures as defined under IFRS, but management believes that these measures provide valuable additional information for users of the Financial Statements, in order to better understand the underlying trading performance in the year from activities that will contribute to future performance. The Group’s internal strategic planning process is also based on these measures and they are used for management incentive purposes. They should be viewed as complements to, and not replacements for, the comparable IFRS measures. Other companies may use similarly labelled measures which are calculated differently from the way the Group calculates them, which limits their usefulness as comparative measures. Accordingly, investors should not place undue reliance on these non-IFRS measures. The following sets out an explanation and the reconciliation to the nearest IFRS measure for each non-IFRS measure. All non-IFRS measures exclude discontinued operations unless explicitly stated otherwise. Constant exchange rates (CER) Given the international nature of the Group’s operations, foreign exchange movements can have a significant impact on the reported results of the Group when they are translated into US dollar (the presentation currency of the Group). In order to help understand the underlying trading performance of the business, revenue and profit measures are often presented at constant exchange rates. CER is calculated by translating prior year reported numbers at the average exchange rates for the current year. This represents a change from prior periods in which CER was calculated by a translation of current year reported numbers at the average exchange rates for the prior year. It is used to give management and other users of the accounts clearer comparability of underlying trading performance against the prior period by removing the effects of changes in foreign exchange rates. The major exchange rates used to calculate CER in 2025 are $/€0.8917 and $/£0.7613. Comparisons are with the year ended 31 December 2024 unless otherwise stated. Organic Revenue Growth Acquisitions are a core part of the Group’s growth strategy. The Organic Revenue Growth measures (absolute and percentage) are used to help investors and management understand the underlying performance, of the business, by identifying Organic Revenue Growth excluding the impact of Acquired Revenue. This approach isolates changes in performance of the Group that take place under the Company’s stewardship, and thereby reflects the potential benefits and risks associated with owning and managing a professional services business. Organic Revenue Growth is calculated based on year-over-year revenue growth at CER to eliminate the effects of movements in foreign exchange rates. Acquired Revenue represents a 12-month estimate of the increase in Group revenue from each business acquired. Acquired Revenue is calculated as: (a) the revenue from the acquisition date to the year end in the year of acquisition in line with IFRS 3; and (b) the pre-acquisition revenues from 1 January up to the acquisition date in the year of acquisition. The pre-acquisition revenue is based on the previously reported revenues of the acquired entity and is considered to be an estimate. In the year a business is acquired, all of its revenue reported under (a) above is classified as non-organic growth. In the subsequent first full financial year after acquisition, Organic Revenue Growth is calculated for each acquisition as the reported revenue less Acquired Revenue. At a Group level, calculating Organic Revenue Growth therefore involves isolating and excluding from the total year-over-year revenue change: (i) the impacts from foreign exchange rate changes; (ii) the growth in revenues that have resulted from completed acquisitions in the current period; and (iii) the estimate of pre-acquisition revenues from each business acquired. The sum of (ii) and (iii) is equal to the total Acquired Revenues for all acquisitions. The calculated Organic Revenue is expressed as a percentage of prior year revenue. Prior year revenue is not ‘pro-forma’ adjusted in the calculation, as any such estimated adjustments would have an immaterial impact. If an acquisition is considered to be a material transaction, such as the Terminix acquisition in October 2022, the above calculation is amended in order to give a ‘pro-forma’ view of any Organic Revenue Growth for the full financial year in the year of acquisition, as if the acquisition had been part of the Group from the beginning of the prior year. The pro-forma calculation is completed using pre-acquisition revenues to normalise current and prior periods as shown in the table below. These revenue normalisations are considered estimates, and ensure that the potentially larger Organic Revenue Growth is measured over a denominator that includes the material acquisition. While management believes that the methodology used in the calculation of Organic Revenue is representative of the performance of the Group, the calculations may not be comparable with similarly labelled measures presented by other publicly traded companies in similar or other industries. North America $m International $m Total $m 2024 Revenue 4,164 2,453 6,617 2024 Exchange differences (3) 40 37 2024 Revenue (at 2025 CER) 4,161 2,493 6,654 2024 Revenue from closed businesses1 (18) (18) Normalised 2024 Revenue (at 2025 CER) – base for Organic Revenue Growth percentage 4,143 2,493 6,636 Revenue from 2025 acquisitions (at 2025 CER)² 15 15 30 Revenue from 2024 acquisitions (at 2025 CER)³ 41 31 72 Organic Revenue Growth 2025 (at 2025 CER) 95 75 170 2025 Revenue (at AER) 4,294 2,614 6,908 Organic Revenue Growth % 2.3% 3.0% 2.6% 1. The adjustment removes revenue from 1 January 2024 to 31 March 2024 from the Paragon distribution business, closed with effect from 1 April 2024. 2. Revenue from completed acquisitions in the current period. 3. Estimate of revenue from each business acquired by the Group in the previous financial year through to the 12-month anniversary of the Group’s ownership. 4. Organic Revenue Growth includes Organic Revenue Growth for all entities in the Group’s continuing operations as at 31 December 2024. 42 Rentokil Initial plc Annual Report 2025 |
|
North America $m International $m Total $m 2023 Revenue 4,112 2,273 6,385 2023 Exchange differences (3) 31 28 2023 Revenue (at 2025 CER) 4,109 2,304 6,413 2023 Revenue from closed businesses1 (56) (56) Normalised 2023 Revenue (at 2025 CER) – base for Organic Revenue Growth percentage 4,053 2,304 6,357 Revenue from 2024 acquisitions (at 2025 CER)² 28 59 87 Revenue from 2023 acquisitions (at 2025 CER)³ 18 30 48 Organic Revenue Growth 2024 (at 2025 CER) 62 100 162 Exchange differences 3 (40) (37) 2024 Revenue (at AER) 4,164 2,453 6,617 Organic Revenue Growth % 1.5% 4.4% 2.6% 1. The adjustment removes revenue from 1 April 2023 to 31 December 2023 from the Paragon distribution business, closed with effect from 1 April 2024. 2. Revenue from completed acquisitions in the current period. 3. Estimate of revenue from each business acquired by the Group in the previous financial year through to the 12-month anniversary of the Group’s ownership. 4. Organic Revenue Growth includes Organic Revenue Growth for all entities in the Group as at 31 December 2023. Adjusted expenses and profit measures Adjusted expenses and profit measures are used to give investors and management a further understanding of the underlying profitability of the business over time by stripping out income and expenses that can distort results due to their size and nature. Adjusted profit measures are calculated by adding the following items back to the equivalent IFRS profit measure: • amortisation and impairment of intangible assets (excluding computer software); • one-off and adjusting items; and • net interest adjustments. Intangible assets (such as customer lists and brands) are recognised on acquisition of businesses which, by their nature, can vary by size and amount each year. Capitalisation of innovation-related development costs will also vary from year to year. As a result, amortisation of intangibles is added back to assist with understanding the underlying trading performance of the business and to allow comparability across regions and categories (see table on page 159). One-off and adjusting items are significant expenses or income that will have a distortive impact on the underlying profitability of the Group. Typical examples are costs related to the acquisition of businesses, gain or loss on disposal or closure of a business, material gains or losses on disposal of fixed assets, adjustments to legacy environmental and legacy termite liabilities, and payments or receipts as a result of legal disputes. An analysis of one-off and adjusting items is set out below. Net interest adjustments are other non-cash, or one-off and adjusting accounting gains and losses, that can cause material fluctuations and distort understanding of the performance of the business, such as amortisation of discount on legacy provisions and gains and losses on hedge accounting. Adjusted expenses are one-off and adjusting items, and Adjusted Interest. Adjusted profit measures used are Adjusted Operating Profit, Adjusted Profit Before and After Tax, and Adjusted EBITDA. Adjusted Earnings Per Share is also reported, derived from Adjusted Profit After Tax. One-off and adjusting items An analysis of one-off and adjusting items is set out below. One-off and adjusting items cost/(income) $m One-off and adjusting items tax impact $m One-off and adjusting items cash (outflow)/inflow $m 2023 Acquisition and integration costs 15 (2) (16) Fees relating to Terminix acquisition 1 – (31) Terminix integration costs 99 (26) (92) Other 4 (1) 6 Total 119 (29) (133) 2024 Acquisition and integration costs 11 (4) (19) Terminix integration costs 75 (19) (77) Other 24 (6) (3) Total 110 (29) (99) 2025 Acquisition and integration costs (5) 1 (18) Termite provision movement 195 (50) – North America transformation costs 77 (20) (76) Other 20 (3) (6) Total 287 (72) (100) Rentokil Initial plc Annual Report 2025 43 Strategic Report Corporate Governance Financial Statements Other Information |
|
Use of Non-IFRS Measures continued Adjusted Interest Adjusted Interest is calculated by adjusting the reported finance income and costs by net interest adjustments (amortisation of discount on legacy provisions and foreign exchange and hedge accounting ineffectiveness). 2025 $m 2024 $m 2023 $m Finance cost 250 250 232 Finance income (46) (59) (60) Add back: Amortisation of discount on legacy provisions (12) (13) (14) Foreign exchange and hedge accounting ineffectiveness 12 (3) 15 Adjusted Interest 204 175 173 Adjusted Operating Profit Adjusted Operating Profit is calculated by adding back one-off and adjusting items, and amortisation and impairment of intangible assets to operating profit. 2025 $m 2024 $m 2023 $m Operating profit 584 644 727 Add back: One-off and adjusting items 287 110 119 Amortisation and impairment of intangible assets1 199 254 218 Adjusted Operating Profit 1,070 1,008 1,064 1. Excluding computer software. Adjusted Profit Before and After Tax Adjusted Profit Before Tax is calculated by adding back net interest adjustments, one-off and adjusting items, and amortisation and impairment of intangible assets to profit before tax. Adjusted Profit After Tax is calculated by adding back net interest adjustments, one-off and adjusting items, amortisation and impairment of intangible assets, and the tax effect on these adjustments to profit after tax. 2025 IFRS measures $m Net interest adjustments $m One-off and adjusting items $m Amortisation and impairment of intangibles $m Non-IFRS measures $m Profit before income tax 390 – 287 199 876 Adjusted Profit Before Tax Income tax expense (100) 1 (72) (51) (222) Tax on Adjusted Profit Profit for the period 290 1 215 148 654 Adjusted Profit After Tax 2024 IFRS measures $m Net interest adjustments $m One-off and adjusting items $m Amortisation and impairment of intangibles $m Non-IFRS measures $m Profit before income tax 462 16 110 254 842 Adjusted Profit Before Tax Income tax expense (116) (4) (29) (55) (204) Tax on Adjusted Profit Profit for the period 346 12 81 199 638 Adjusted Profit After Tax 2023 IFRS measures $m Net interest adjustments $m One-off and adjusting items $m Amortisation and impairment of intangibles $m Non-IFRS measures $m Profit before income tax 566 (1) 119 218 902 Adjusted Profit Before Tax Income tax expense (129) (2) (29) (55) (215) Tax on Adjusted Profit Profit for the period 437 (3) 90 163 687 Adjusted Profit After Tax 1. Excluding computer software. 44 Rentokil Initial plc Annual Report 2025 |
|
EBITDA and Adjusted EBITDA EBITDA (both continuing and discontinued operations) is calculated by adding back finance income, finance cost, share of profit from associates net of tax, income tax expense, depreciation, amortisation and impairment of intangible assets, and other non-cash expenses to profit for the year. Adjusted EBITDA (both continuing and discontinued operations) is calculated by adding back one-off and adjusting items to EBITDA. 2025 $m 2024 $m 2023 $m Profit for the period 290 346 437 Add back: Finance income (46) (59) (60) Finance cost 250 250 232 Share of profit from associates net of tax (10) (9) (11) Income tax expense 100 116 129 Depreciation 329 312 300 Other non-cash expenses 31 45 37 Amortisation and impairment of intangible assets1 199 254 218 EBITDA 1,143 1,255 1,282 One-off and adjusting items 287 110 119 Adjusted EBITDA 1,430 1,365 1,401 EBITDA attributable to discontinued operations 109 139 122 EBITDA for the Group 1,252 1,394 1,404 Adjusted EBITDA attributable to discontinued operations 109 139 122 Adjusted EBITDA for the Group including discontinued operations 1,539 1,504 1,523 1. Excluding computer software. Adjusted Earnings Per Share Basic earnings per share is calculated by dividing the profit attributable to equity holders of the Company by the weighted average number of shares in issue during the year, and is explained in Note A2 to the Consolidated Financial Statements. Adjusted Earnings Per Share is calculated by dividing adjusted profit from continuing operations attributable to equity holders of the Company by the weighted average number of ordinary shares in issue and is shown below. For Adjusted Diluted Earnings Per Share, the weighted average number of ordinary shares in issue is adjusted to include all potential dilutive ordinary shares. The Group’s potentially dilutive ordinary shares are explained in Note A2 to the Consolidated Financial Statements. 2025 $m 2024 $m 2023 $m Profit attributable to equity holders of the Company 290 346 437 Add back: Net interest adjustments – 16 (1) One-off and adjusting items 287 110 119 Amortisation and impairment of intangibles1 199 254 218 Tax on above items2 (122) (88) (86) Adjusted profit attributable to equity holders of the Company 654 638 687 Weighted average number of ordinary shares in issue (million) 2,524 2,521 2,516 Adjustment for potentially dilutive shares (million) 11 7 11 Weighted average number of ordinary shares for diluted earnings per share (million) 2,535 2,528 2,527 Basic Adjusted Earnings Per Share (cents) 25.91 25.31 27.31 Diluted Adjusted Earnings Per Share (cents) 25.80 25.24 27.19 1. Excluding computer software. 2. The tax effect on add-backs is as follows: one-off and adjusting items $72m (2024: $29m; 2023: $29m); amortisation and impairment of intangibles $51m (2024: $55m; 2023: $55m); and, net interest adjustments $(1)m (2024: $4m; 2023: $2m). Rentokil Initial plc Annual Report 2025 45 Strategic Report Corporate Governance Financial Statements Other Information |
|
Use of Non-IFRS Measures continued Adjusted cash measures The Group aims to generate sustainable cash flow in order to support its acquisition programme and to fund dividend payments to shareholders. Management considers that this is useful information for investors. Adjusted cash measures in use are Free Cash Flow, Adjusted Free Cash Flow, and Adjusted Free Cash Flow Conversion. Free Cash Flow Free Cash Flow (both continuing and discontinued operations) is measured as net cash flows from operating activities, adjusted for cash flows related to the purchase and sale of property, plant, equipment and intangible assets, cash flows related to leased assets, cash flows related to one-off and adjusting items, and dividends received from associates. These items are considered by management to be non-discretionary, as continued investment in these assets is required to support the day-to-day operations of the business. Free Cash Flow is used by management for incentive purposes and is a measure shared with and used by investors. A reconciliation of net cash flows from operating activities in the Consolidated Cash Flow Statement to Free Cash Flow is provided in the table below. 2025 $m 2024 $m 2023 $m Net cash flows from operating activities 872 743 802 Purchase of property, plant, equipment (136) (134) (122) Purchase of intangible assets (60) (56) (55) Capital element of lease payments and initial direct costs incurred (186) (177) (181) Proceeds from sale of property, plant, equipment and software 20 5 17 Cash impact of one-off and adjusting items 100 99 132 Dividends received from associates 5 14 5 Free Cash Flow 615 494 598 Free Cash flow attributable to discontinued operations 21 32 22 Free Cash Flow for the Group including discontinued operations 636 526 620 Adjusted Free Cash Flow and Adjusted Free Cash Flow Conversion Adjusted Free Cash Flow Conversion (both continuing and discontinued operations) is provided to demonstrate to investors the proportion of Adjusted Profit After Tax that is converted to cash. It is calculated by dividing Adjusted Free Cash Flow by Adjusted Profit After Tax, expressed as a percentage. Adjusted Free Cash Flow (both continuing and discontinued operations) is measured as Free Cash Flow adjusted for product development additions and net investment hedge cash interest through other comprehensive income. Product development additions are adjusted due to their variable size and non-underlying nature. Net investment hedge cash interest through other comprehensive income is adjusted because the cash relates to an item that is not recognised in Adjusted Profit After Tax. 2025 $m 2024 $m 2023 $m Free Cash Flow 615 494 598 Product development additions 13 11 13 Net investment hedge cash interest through Other Comprehensive Income 10 13 15 Adjusted Free Cash Flow (a) 638 518 626 Adjusted Profit After Tax (b) 654 638 687 Free Cash Flow conversion (a/b) 97.6% 81.2% 91.1% Free Cash Flow conversion attributable to discontinued operations 69.4% 82.1% 62.6% Free Cash Flow conversion for the Group including discontinued operations 96.3% 81.2% 89.7% The nearest IFRS-based equivalent measure to Adjusted Free Cash Flow Conversion would be Cash Conversion, which is shown in the table below to provide a comparison in the calculation. Cash Conversion (both continuing and discontinued operations) is calculated as net cash flows from operating activities divided by profit attributable to equity holders of the Company, expressed as a percentage. Management considers that this is useful information for investors as it gives an indication of the quality of profits, and ability of the Group to turn profits into cash flows. 2025 $m 2024 $m 2023 $m Net cash flows from operating activities (a) 872 743 802 Profit attributable to equity holders of the Company (b) 290 346 437 Cash Conversion (a/b) 300.7% 214.7% 183.5% Cash Conversion attributable to discontinued operations 55.6% 271.7% 308.1% Cash Conversion for the Group including discontinued operations 206.8% 221.4% 193.2% 46 Rentokil Initial plc Annual Report 2025 |
|
Adjusted Effective Tax Rate (Adjusted ETR) Adjusted Effective Tax Rate is used to show investors and management the rate of tax applied to the Group’s Adjusted Profit Before Tax. The measure is calculated by dividing Adjusted Income Tax Expense by Adjusted Profit Before Tax, expressed as a percentage. 2025 $m 2024 $m 2023 $m Income tax charge 100 116 129 Tax adjustments on: Amortisation and impairment of intangible assets1 51 55 55 Net interest adjustments (1) 4 2 One-off and adjusting items 72 29 29 Adjusted Income Tax Charge (a) 222 204 215 Adjusted Profit Before Tax (b) 876 842 902 Adjusted Effective Tax Rate (a/b) 25.3% 24.2% 23.8% 1. Excluding computer software. The Group’s effective tax rate (ETR) for 2025 on reported profit before tax was 25.6% (2024: 25.1%; 2023: 22.8%). The Group’s Adjusted ETR before amortisation of intangible assets (excluding computer software), one-off and adjusting items, and the net interest adjustments for 2025 was 25.3% (2024: 24.2%; 2023: 23.8%). This compares with a blended rate of tax for the countries in which the Group operates of 25.3% (2024: 25.3%; 2023: 25.1%). The Group’s tax charge and Adjusted ETR will be influenced by the global mix and level of profits, changes in future tax rates and other tax legislation, foreign exchange rates, the utilisation of brought-forward tax losses on which no deferred tax asset has been recognised, the resolution of open issues with various tax authorities, acquisitions and disposals. Rentokil Initial plc Annual Report 2025 47 Strategic Report Corporate Governance Financial Statements Other Information |
|
Responsible Business Protecting People. Enhancing Lives. Preserving our Planet. 0.28 Lost Time Accident rate (2024: 0.29) 3,620 Lower Emission Vehicles (electric and hybrid) in our global fleet (2024: 2,736) 600,000 PestConnect devices installed c.100,000 added in 2025 Find out more on pages 22 and 50 Find out more on pages 25 and 57 Find out more on pages 31 and 56 Find out more on page 22 Find out more on pages 25 and 57 Find out more on page 23 Find out more on page 51 Find out more on pages 25, 62 and 64 Find out more on pages 23 and 52 87.4% Colleague retention (2024: 86.3%) 12.5% Ultra-Low Emission Vehicles % in fleet in the UK and Europe – achieving our 10% by end of 2025 target 98.4% State of Service. 5.7m post-service surveys carried out in 2025 with an average score of 4.94/5 2.2m Training activities completed on U+. 540 new training items created 21.8% Improvement in emissions intensity – exceeding our target of 20% by the end of 2025 60.6 Net Promoter Score, excluding Workwear (2024: 57.8) 2025 highlights During the year, we continued to make good progress across a range of responsible business initiatives. We delivered more training and career development, launched new services, rolled out more lower-emission vehicles and utilised more renewable energy. Most importantly, our safety performance remained very strong. The Company’s commitment to responsible business was validated by independent accreditation and ratings in 2025, including an AA rating from MSCI and a Low Risk, Strong Management rating from Sustainalytics. 48 Rentokil Initial plc Annual Report 2025 |
|
Rentokil Initial plc Annual Report 2025 49 Strategic Report Corporate Governance Financial Statements Other Information (This page has been left blank intentionally.) |
|
Responsible Business continued Rentokil Initial defines a responsible workplace as one focused on safety, underpinned by a values-driven culture. We support our colleagues to develop a long-term career with the company. We are committed to being a Employer of Choice and employ c.63,400 colleagues (2024: 68,500) in 90 countries. This reduction in headcount mainly reflects the divestment of our France Workwear operations in 2025. Colleague retention in 2025 was 87.4% (2024: 86.3%). We are committed to operating with a culture which is safe, inclusive, customer-focused, and innovative. The Company’s shared values are Service, Teamwork, Relationships and Responsibility. Colleague safety This year, we have maintained our first-class level of colleague safety – reducing both the frequency of accidents and the severity with a Lost Time Accident rate of 0.28 (2024: 0.29), and we have further improved Working Days Lost rate to 5.65 (2024: 6.25). This performance was driven by our ongoing focus on safety, robust management standards and commitment to best practices. Safety is the first item on all management meetings. Our award-winning SHE Golden Rules represent the company’s most significant global safety initiative, mandatory for all colleagues. These rules clearly and unambiguously define the essential knowledge and actions required to prevent serious harm. There were no work-related colleague fatalities in 2025 (2024: one fatality). Colleagues and culture 73% 2015 68% 2015 73% 2015 74% 2015 79% 2025 80% 2025 84% 2025 83% 2025 Listening to colleagues In 2025, we once again undertook a global confidential survey, Your Voice Counts (YVC), which provides every colleague with the opportunity to give feedback on workplace culture, leadership, customer focus, development, and line manager performance. 91% of colleagues participated. We maintained high levels of engagement and, in particular, colleague enablement – we give people interesting and challenging work, and the tools to do a great job for customers. Answers to the questions ‘the Company cares about the health and wellbeing of colleagues’ and ‘I am able to achieve a good balance between my work and private life’ both scored above the global company norm. Colleague engagement I receive the training I need to do my job well Colleague enablement Line Manager Index (combines ‘my manager’ questions) Key performance indicators 2025 2024 2023 2022 2021 Lost Time Accidents (LTA)¹ 0.28 0.29 0.31 0.39 0.38 Working Days Lost (WDL)² 5.65 6.25 7.05 7.90 8.71 1. The LTA rate is calculated as the number of Lost Time Accidents (injuries and illnesses) per 100,000 hours worked. 2. The WDL rate is calculated as the number of working days that colleagues could not work because of Lost Time Accidents (injuries and illnesses) per 100,000 hours worked. In 2025, Rentokil Initial was awarded a Gold Medal for Health and Safety for the eighth consecutive year. 50 Rentokil Initial plc Annual Report 2025 |
|
Recruitment and training Our Career+ app is the global platform for colleagues to apply for, refer, or share our career opportunities easily across their social networks. In 2025, total users reduced, as the content became more targeted, but the conversion rate from applicant to recruitment improved. Over 1,600 people were recruited through Career+ in 2025. Colleagues are supported with a wide variety of training opportunities, including technical training and online development through U+. In 2025, using generative AI, many courses were translated into a wider selection of languages, enabling broad distribution. Rentokil Initial was first accepted as an employer provider on the Register of Apprenticeship Training Providers in March 2017. Our apprentice training is delivered in the field via field trainers and assessors, online through U+, and in the classroom using qualified trainers. The outcome for learners has been exceptionally good, with 767 distinctions and a 99% pass rate. During the year, we retained our ‘Good’ grading from Ofsted and achieved ‘Outstanding’ in the behaviour and attitude category. Over 10% of our UK Pest Control technicians are undertaking a level two Customer Service apprenticeship. Colleagues and culture LEARNING SUCCESS 540 new training items created in 2025 >2,000 technical training days were delivered in the UK in 2025 2.2m training sessions in 2025 Our U+ learning platform and our Leading the RI Way initiative have become central to our talent development strategy, showing strong success in 2025. U+ delivered 2.2m training sessions, and the introduction of DeepL for multi-language translation has accelerated content delivery. Our focus on growth and colleague development is reflected in positive YVC survey scores – in particular for learning opportunities provided by the Company, which are at global High Performance levels. Our global leadership development programmes include Leading the RI Way, which has been highly effective, recording over 700 attendances for critical skills like Emotional Intelligence and Coaching, with a 100% recommendation rate from participants, ensuring our leadership pipeline remains robust and well-supported. SPOTLIGHT ON: COLLEAGUE DEVELOPMENT Find out more about career development at Rentokil Initial Rentokil Initial plc Annual Report 2025 51 Strategic Report Corporate Governance Financial Statements Other Information |
|
Responsible Business continued 52 Rentokil Initial plc Annual Report 2025 (This page has been left blank intentionally.) |
|
Rentokil Initial plc Annual Report 2025 53 Strategic Report Corporate Governance Financial Statements Other Information (This page has been left blank intentionally.) |
|
Responsible Business continued 54 Rentokil Initial plc Annual Report 2025 (This page has been left blank intentionally.) |
|
Rentokil Initial plc Annual Report 2025 55 Strategic Report Corporate Governance Financial Statements Other Information (This page has been left blank intentionally.) |
|
Responsible Business continued 56 Rentokil Initial plc Annual Report 2025 (This page has been left blank intentionally.) |
|
Rentokil Initial plc Annual Report 2025 57 Strategic Report Corporate Governance Financial Statements Other Information (This page has been left blank intentionally.) |
|
The Task Force on Climate-related Financial Disclosures’ (TCFD) recommendations set out an important framework for understanding and analysing climate-related risks, and Rentokil Initial is committed to regular reporting to help communicate and track our progress. In accordance with the UK Financial Conduct Authority’s Listing Rule 6.6.6 (8), we confirm that the business is consistent with the TCFD recommendations and 11 disclosures and considered the updated TCFD Annex guidance. We have responded to these in this report on pages 58 to 65, alongside cross-references to where additional disclosures can be found. These disclosures are also made under sections 414CA and 414CB of the Companies Act 2006. Our focus is to implement, embed and track progress at an operational level in each country against our target to achieve net zero emissions by the end of 2040. Details of our 2025 activities can be found on pages 56 to 57. During the year, we acquired 36 businesses with revenues of $63m in the year prior to purchase. Responsible Business continued Task Force on Climate-related Financial Disclosures Climate-related governance We govern climate-related risks and opportunities across both our Board and executive management levels. Our Board is responsible for reviewing the risks, opportunities and recommendations identified at management level, and responding by setting the strategy to create long-term value and sustainability. Our management is responsible for the day-to-day implementation of strategy, the monitoring of progress against targets and the identification of emerging risks and opportunities. The graphic below lays out the structure of our climate-related governance. Group Risk Committee Comprising the Chief Financial Officer and six other functional executives, it reviews the internal control environment and emerging risks, and considers internal policies and procedures for identifying, assessing, and reporting risks, meeting quarterly. Details of its discussions are reported to the Audit Committee. Chief Executive Our Chief Executive is responsible for ensuring effective leadership and day-to-day running of the Company. As part of this, he is responsible for setting and executing strategies, identifying and managing risks and opportunities to achieve the strategy, and promoting the Company’s responsible business agenda. Chief Procurement and Sustainability Officer Our Chief Procurement and Sustainability Officer leads the Global Procurement, Safety, Technical, Supply Chain, and Logistics functions, working closely with the regional and functional teams to drive the environmental and sustainability agenda across the Group. Board The Board has responsibility for oversight of the long-term climate change strategy of the Group, including climate-related opportunities and risks. The Board oversees these risks through the Audit Committee. Regional/SHE Management Consolidates and assesses country-level risks and opportunities, drives regional mitigation actions, and oversees performance through a monthly review process. Country Management Reviews and assesses climate-related risks, implements country-level mitigating actions, and monitors their effectiveness on an ongoing basis. Operational Unit Management Identifies local climate-related risks and opportunities as part of day-to-day operations and maintains corresponding mitigating actions and business continuity plans. Environment Steering Committee Comprising senior regional and functional leaders, the Environment Steering Committee defines and reviews the Company’s environmental policies and procedures, monitors performance through monthly regional reviews, and oversees Group-level mitigating actions delivered through eight specialist environmental workstreams. TCFD index Governance: pages 58 and 59 Risks and opportunities: pages 60 to 62 Risks and Uncertainties: page 68 Climate-related strategy pages 60 and 61 Plan and targets: pages 62 and 63 Transition plan: pages 56 and 63 Metrics: pages 64 and 65 Audit Committee The Audit Committee has responsibility for considering climate change risks. It monitors the assessment of risks and opportunities, and approves the processes for both SHE and business continuity risks, considering these twice each year. 58 Rentokil Initial plc Annual Report 2025 |
|
Board oversight The Board is responsible for overseeing the long-term climate change strategy for the Group, which includes oversight of climate-related risks, opportunities and impacts. In 2025, Safety, Health, and Environmental (SHE) updates were considered at each meeting of the Board, with specific focus on the following: • In February, the Board noted a summary of the environmental and social content proposed for inclusion in the Company’s Responsible Business Report; • In July, the Board received an update on ESG and sustainability, including recent regulatory changes and their impact on the wider ESG and sustainability strategy; and • In December, the Board received an update on culture and workforce engagement, and on ESG and sustainability reporting. Discussions included the Company’s longer-term sustainability approach, progress and priorities, and climate risks and opportunities including changes to proposed regulations, the move to more sustainable fumigation, fleet transition, and the development of more sustainable products and services. Following direction from the Board, during the year, the SHE team has evaluated and determined the most suitable ESG reporting software system to manage the data across the Company. During November 2025, the preferred system and implementation plan was approved and this will significantly enhance reporting capabilities and provide competitive advantage in dealings with clients. Engagement continued in 2025 with our key stakeholders, particularly colleagues, customers, suppliers, shareholders and analysts, about our environmental and social plans, progress and targets. The Board is supported by the Audit Committee, which has responsibility for considering climate change risks: • In February, the Audit Committee approved the disclosures relating to climate change within the 2024 financial statements. This included a review of management’s assessment of climate change’s physical, societal, and legislative impacts on the assets and trading of the Group; and • In December, the Audit Committee also approved the process the Group had undertaken to identify the key risks facing the Group during 2025. The key risks included one in respect of safety, health, environment and sustainability. Find out more Audit Committee Report, pages 99 to 106 Role of management Our Chief Executive has overall accountability for the organisation’s ESG agenda and is supported by the Chief Procurement and Sustainability Officer and wider management team. The Group’s Executive Leadership Team (ELT) and Group Leadership Forum (GLF) meetings have Safety, Health and Environment as the first item on every agenda. One of the ongoing environmental topics is vehicle emissions intensity. For our 25 largest operations, the vehicle fuel efficiency performance for each country (1,000 litres of fuel used, per million of revenue in local currency) is tracked against the prior year. Each of our regions, overseen by a regional executive, has developed sustainability initiatives in line with our overall Group net zero target. They are reviewed quarterly with the Chief Executive (e.g. safety, fumigation, etc.) with deep-dive sessions every six months. Our Corporate Compliance curriculum is mandatory training for all managers within 60 days of hire or promotion to Work Level three. This includes Code of Conduct training, which reinforces the Company’s commitments, including environmental matters. We also conduct a range of SHE training, which includes our Pink Note Training. This covers training on the safe use and control of the quantity of chemicals – helping us to reduce our use of climate-impacting substances. Executive reward is linked to our ESG priorities through the Performance Share Plan (PSP) awards, which are measured against seven performance conditions, including Sales and Service colleague retention, customer satisfaction, and vehicle fuel intensity. Since 2018, Rentokil Initial has been supporting climate change charity Cool Earth in its efforts to protect endangered rainforests in Papua New Guinea, the Congo Basin, and the Peruvian Amazon to safeguard their rainforest communities and fight the climate crisis. Together, we are supporting 40 locally led projects that protect the rainforest by ensuring those who live there can make an income. Cool Earth’s activities align with the United Nations 2030 Agenda for Sustainable Development, including the 17 Sustainable Development Goals (SDG), and it has closely aligned its programme activities with Rentokil Initial to 11 of these goals and their targets. Cool Earth is working with Rentokil Initial to invest in the practical realisation of high-level, ambitious SDGs at a local scale to deliver emissions reduction achieved by rainforest protection. See page 53. Task Force on Climate-related Financial Disclosures Rentokil Initial plc Annual Report 2025 59 Strategic Report Corporate Governance Financial Statements Other Information |
|
Potential climate-related risk Overall risk likelihood and potential severity Potential financial impact Potential physical risks (medium–long term) Loss of physical inventory from floods, wildfires, or other climate disasters. We do not see a material risk in the types of inventories we use being impacted. There is a risk that storage of our physical inventories could be impacted. However, stock-holding locations are small and immaterial, meaning that the severity of this risk is low. Stocks are typically held locally, close to technicians and customers. No material financial impact, but on a local level some loss of stock. Loss of building and infrastructure assets from flood, wildfires, or other climate disasters. Our cost base is predominantly colleague-based and not dependent on significant assets (e.g. large manufacturing plants) or complicated supply chains. In addition, most of our buildings are leasehold, so we have the option to relocate over time. No material financial impact, but some disruption on a local level. Physical events such as floods, wildfires, or other climate disasters destroying material value assets. Most of the assets used for generating revenue (equipment for rental) are low-value assets, meaning that the severity of this risk is low. The geographical spread of these assets means that we do not face the risk of physical events, such as floods or wildfires, destroying material value assets. Physical risks have a low likelihood of resulting in a material risk to asset valuation at a Company level due to distribution of properties across the globe. No material financial impact. Potential transition risks (medium–long term) Possibility of increased or changing legislation related to climate change, in the fields of worker safety, vehicle use, and property maintenance. It is of a medium likelihood that over time legislative (e.g. carbon pricing) or societal changes will impact our customers and the sectors that they operate in. Should this risk materialise, this could have a material impact. Cost and productivity impact of transitioning to a lower emission fleet of vehicles. While the fleet of vehicles we have today is typically internal combustion engine-powered, we have continued to make positive progress in the transition to LEVs which emit under 100 grams of CO2 per km driven (see chart on page 57). We aim to reach 100% LEVs in line with our goal of reaching our net zero target by 2040. However, due to the current slow implementation of LEV availability and charging infrastructure availability in many markets, there may be challenges in achieving this target. During the year, in the UK and Europe, we reached 12.5% of our fleet as ULEVs (emit under 100 grams of CO2 per km driven), ahead of our 2025 target of 10%. If we were to move fully to LEV/ULEVs in the short to medium term, this would have a large impact on cost and productivity. However that is not our strategy. The cost of our fleet transition remains within our existing operational budgets. Failure to decarbonise our operations resulting in reputation and brand damage. Rentokil Initial has a robust net zero transition strategy and plan in place, allowing us to make regular progress towards decarbonising our operations. This means that this risk is of a low likelihood. However, should it occur, the severity of the risk would be medium to high. Should this risk materialise, this could have a material impact. Potential adaptation risks (medium–long term) Failure to adapt operations to climate change impacts – localised flooding and higher temperatures. Rentokil Initial has robust business continuity plans in place. The vast majority of properties are leasehold, allowing us to move in a timely manner should a localised risk increase. Our operational policies and infrastructure, products, and services continue to operate effectively in countries which already have very high temperatures, such as those in MENAT. Should we fail to adapt, we would expect potential loss of revenue and increased operating costs locally to not be material. Note: Short term is up to three years; medium term is four to 10 years; long term is 10 years plus, taking into consideration vehicle and property leases, and workstream decarbonisation plans. Climate-related strategy Climate-related risks For details on our process for managing risk across the business, including risk identification, assessment and management, see our risk management process on page 62. Responsible Business continued Task Force on Climate-related Financial Disclosures 60 Rentokil Initial plc Annual Report 2025 |
|
Climate-related opportunities Rentokil Initial continues to develop sustainable solutions, such as PestConnect for rodent control and Lumnia for flying insect control. Opportunities to differentiate our services as sustainable will become increasingly important to customers of all sizes. To support this, we are launching an ESG hub. This enables teams across the world to access the knowledge and tools available to offer the most appropriate and sustainable solutions to address the needs of our customers. Potential climate-related opportunity Overall opportunity likelihood and potential severity Potential financial impact Increasing urban pest populations (medium–long) Various independent research articles link climate change to the increasing spread of pests and longer breeding seasons, across countries and regions. Increased revenue. Lead in sustainable innovation (short–medium) The Company leads in innovation and digital in pest control, which also increases efficiency and reduces cost. We focus our pipeline of innovations and digital projects to add sustainability benefits. Increased revenue and lower operating costs. Attract and retain customers (medium) Through the successful decarbonising of our operations and services, we will increase our market differentiation and better support customers’ needs to make their supply chain and their own workplaces more sustainable. Our resilient multi-local operations and proven business continuity processes deliver increasing confidence to customers that services will be maintained, particularly high-dependency food and pharmaceutical customers. Increased revenue. Sustainable fumigation (short– medium) Working with global partners to substitute relevant fumigation services with more sustainable alternatives. Increased revenue and lower operating costs. In 2020, we developed a business-wide operational strategy for climate-related environmental sustainability, and 2025 has seen us continue the execution of our ambitious plans as we transition to a more sustainable way of working. This is fully aligned with our strategy and business model (see pages 16 to 19), has clear deliverables, and is one of the ways in which we deliver with impact our mission of Protecting People, Enhancing Lives and Preserving our Planet. Our environmental strategy is aligned with the climate-related risks and opportunities that we have identified and discussed previously. The financial impacts of these are considered by our management forums and incorporated into operational plans. Climate-related scenarios Our strategy is underpinned by an analysis of three climate scenarios. In 2021, a specialist consultancy conducted an assessment of each scenario, adopting a data-driven approach to identify and analyse physical climate risks facing our operations and how those risks may manifest differently in each scenario. The study identified risks and how those risks may manifest differently under emissions scenarios to 2045 (representing average conditions projected for 2031–2060): RCP2.6, RCP4.5 and RCP8.5. These RCPs (representative concentration pathways) represent three potential trajectories of global emissions set by the Intergovernmental Panel on Climate Change. The physical risk survey was conducted across 16 climate risk areas, both acute and chronic. Acute risks are typically high-magnitude/ severity events that occur over a short period of time, while chronic hazards are those that typically occur over a prolonged period. The results, across all three scenarios, reinforced that, while physical impacts do occur, the overall risk to the wider business was localised, with most properties and customer bases not being at direct risk. It found that the majority of risk, such as the increased threat of heat stress, would fall on colleagues, and will require the Company to provide mitigations in the field. Details on our KPIs can be found on pages 22 to 25 The study’s conclusions have supported the Company’s preparation of similar measures that could be introduced elsewhere across the globe as required. Our analysis and conclusions remain current for this reporting period and materiality is unchanged. An internal climate change report was also developed, analysing the potential financial risks to the wider Company. This report found minimal to moderate risk to the Company as an ongoing venture, with any potential effects having little disruption to our global operations. In addition, we have undertaken double materiality assessments of our main business categories and continue to assess material topics in preparation for the additional sustainability reporting requirements that are due in the coming years. Operational resilience The Company has a very disaggregated customer base, both geographically and across many sectors, with low average contract values. We are not exposed to significant climate change risks in our customer base over the short to medium term. As we continue to experience and observe the emerging effects of climate change, we are taking the appropriate steps to respond. This includes a variety of mitigations across our business to minimise the impacts upon our colleagues, customers and the communities and environments in which we operate. New product development We take climate-related resilience into account as part of our new product development. This includes considering temperature and humidity. We test in the majority of regions to ensure that we cover as many extremes as possible. We also have cold- and hot-temperature cabinets at our Technology Centre where we undertake validation testing, to rigorously stress-test products. For example, Eradico, our rodent control unit, is highly durable and able to withstand temperature extremes. Task Force on Climate-related Financial Disclosures Rentokil Initial plc Annual Report 2025 61 Strategic Report Corporate Governance Financial Statements Other Information |
|
Transition monitoring Rentokil Initial continues to monitor local legal changes to ensure that we continue to remain fully compliant with all local, regional and national regulations. City-based vehicle charging is also monitored, and we analyse the availability of low-emission vehicle charging infrastructure and the suitability of LEVs to meet the needs of our local operations. Our local teams continue to monitor their markets and maintain engagement with customers. Climate-related risk management Our climate-related risk management approach is embedded as part of our overall organisational risk management process. For more details on this approach, see page 60. Climate risks are included in our principal risks under ‘Safety, health and environment (SHE) and sustainability’ (see page 75). Our principal SHE operational risk has an overall medium risk and is stable. Our operational and functional teams are responsible for identifying and analysing climate-related risks. For example, our supply chain and procurement teams identify risks related to supply resilience and materials access, while our country and product regulatory teams identify risks related to new laws and regulations. We are regularly reviewing our climate-related risks to ensure that we have identified and assessed the relevant risks and opportunities. In 2024, we undertook an in-depth process of identifying and assessing climate risks and opportunities as part of our double materiality process in preparation for reporting against CSRD. This involved mapping impacts and opportunities, impact drivers, underlying capital dependencies and time horizons. A key component of this process was the mapping and validation workshops, which included the validation of impacts, risks and opportunities that had already been identified and worked on, further identifying any additional or new risks that are potentially material for the business. The workshops were conducted with relevant internal stakeholders at Rentokil Initial, representing different business lines and relevant functions. We assessed the risk by evaluating the severity and likelihood with subject matter experts. We also assessed the financial materiality using the assessment scales for size of financial effect and likelihood, to assess materiality of risks and opportunities arising from the various sustainability topics, including climate. The Company is continuing to review regulatory requirements. Risks and opportunities are discussed at the relevant Boards – Category Boards, and the Executive Leadership Team and the Board. Annually, we update the Audit Committee on any changes in the assessment of climate change, physical, societal, or legislative impacts on the assets and trading of the Company. Our methodology to prioritising climate risks is in line with the approach on risk taken by the Group. Determining priority of actions relating to both opportunities and risks are considered through the numerous management structures. These consider high-level global data and trends combined with operational-level local data to provide evidence to assess materiality and inform decision-making and therefore priority. Our climate risks and opportunities can be seen in the tables on pages 60 to 61. Find out more: Progress on our Environmental Plan, pages 56 and 57 and Metrics on pages 64 and 65 Responsible Business continued Task Force on Climate-related Financial Disclosures 62 Rentokil Initial plc Annual Report 2025 |
|
Rentokil Initial plc Annual Report 2025 63 Strategic Report Corporate Governance Financial Statements Other Information (This page has been left blank intentionally.) |
|
Responsible Business continued 64 Rentokil Initial plc Annual Report 2025 (This page has been left blank intentionally.) |
|
Rentokil Initial has a global policy framework which underpins how we operate. The framework includes items such as Safety, Environment, Human Rights and Inclusion, together with the training and reporting processes to provide assurance of the integrity of our operations. We continue to focus on ensuring that the framework and tools are in place and operating robustly to deliver the target level of professional services while operating with the utmost professional integrity. The Company has a single set of policies and Code of Conduct. During the year, these policies were reviewed and updated. In the Human Rights section of the Code of Conduct, we state that we will under no circumstances make use of forced or coerced labour, servitude or slavery and will only employ individuals who are working of their own free will. We are mindful modern slavery is an increasing issue globally and have reinforced training and awareness among our colleagues. Allied to this, as part of our risk management processes, we have conducted a thematic audit on temporary recruitment in 12 markets where it is estimated there is a greater prevalence of modern slavery. Draft findings from the thematic audit discovered three temporary employees in Indonesia that were being asked to work excessive levels of overtime. This arrangement was by mutual consent, but has been stopped due to the increased health and safety risk. Corporate Sustainability Reporting In 2025, the European Union delayed the introduction and altered the scope of the Corporate Sustainability Reporting Directive (CSRD). Reporting will commence in 2028 for Financial Year 2027. As a result, we continue to consider the developing guidance and advice from corporate advisors. Rentokil Initial recognises that double materiality, as required under CSRD, is key to underpinning our responsible business approach. This refers to sustainability-related impacts, risks and opportunities for a company. The CSRD defines it as comprising impact materiality and financial materiality. We continue our assessment of the applicability of CSRD and the associated requirements. During the year, the Board approved the implementation of a new ESG platform which will consolidate all sustainability data, enabling reporting by country and ensuring Rentokil Initial is well placed to meet both existing and future statutory disclosure requirements, such as CSRD. This platform is being implemented during 2026, with data migrated from other existing systems, and will report in accordance with the corresponding material topics in 2027. In addition, we have identified statutory disclosure requirements in California and the UAE relating to emissions. These will be included in the scope of the new ESG platform. Governance Rentokil Initial plc Annual Report 2025 65 Strategic Report Corporate Governance Financial Statements Other Information (The top half of this page has been left blank intentionally.) |
|
Section 172(1) Statement Section 172(1) of the Companies Act aims to ensure that the board of directors of a company has a comprehensive understanding of its key relationships with a broad range of interested groups, such as employees, suppliers, and customers, and that there is consideration of the impact on both internal and external stakeholder interests in order to secure the company’s long-term success. This section sets out how our Board of Directors (the Board), both individually and collectively, have paid due regard to these factors during 2025 when undertaking the duties set out under section 172(1), and where key disclosures in respect of each of the section 172(1) matters can be found. The sections of the Corporate Governance Report on pages 91 to 94 expand upon the Board’s activities and principal decisions in 2025 and evidence how the Board considered the impact of its decisions on the factors set out in section 172(1). These pages are incorporated by reference into the Strategic Report. Our stakeholders We identify our key stakeholders as colleagues, customers, shareholders, communities, and suppliers. We classify the environment as strongly related to communities and so often consider them together. We also recognise the broadening impact the environment has on all our identified stakeholders and its increasing importance to areas of our business operations. In discharging its section 172(1) duties, the Board has had regard to these key stakeholders and the associated impacts, although some factors may have been more relevant than others, depending on the nature of the matter under consideration. Where appropriate, the Board also gave consideration to other factors or interested parties relevant to the decision being made, such as regulators, industry bodies, or other business relationships. You can read more about how the Board and the Company engage with and respond to the interests and needs of our key stakeholders in the Corporate Governance Report on pages 95 to 98. Our strategy Board decisions and actions are aimed at creating long-term value for our shareholders through our sustained economic success while furthering the Company’s mission of Protecting People, Enhancing Lives and Preserving our Planet. The Board agenda is designed to ensure that key strategic priorities are captured and considered throughout the year, with an in-depth review of the longer-term direction of the business undertaken as part of its annual strategy day sessions. The Board and Committee paper templates encourage paper authors to consider and highlight the impact on the Group’s stakeholders of the matters covered, and management ensures that sufficient information is provided to enable the Board to make informed decisions on any impact to stakeholders. Details of how our Board operates and the way it reaches decisions, including the matters discussed and debated during the year, can be found in the Corporate Governance Report. When considering the needs of relevant stakeholder groups, conflicting requirements inevitably arise and in those circumstances we aim to make judgements that balance and serve the long-term interests of the stakeholders. We acknowledge that not every decision the Board makes will necessarily result in a positive outcome for all stakeholders. However, by considering key stakeholder groups and aligning our activities with our strategic plan, as well as the Company’s culture and values, we aim to act fairly, transparently, responsibly, and in the best interests of the Company over the long term. In making their decisions and choices, and in setting policies and strategy, our Directors also consider any associated risks when discharging their duties. Maintaining effective systems of risk management and internal control, reviewing and mitigating our principal risks, and identifying emerging risks all help underpin the Group’s overall strategy and allow the Board to have regard to factors that could affect stakeholder relationships and their impact on our long-term success. Our responsible business Our reputation is of utmost importance to our business’s success, as we rely on customers’ satisfaction and the continued investment of shareholders. The Group’s culture model includes our mission and values, along with our five core culture themes: customer focused, commercial, belonging, down to earth, and innovative. The Board monitors our culture, recognising the important and evolving role it plays in driving behaviours that bring the business sustainable long-term success. Our comprehensive set of policies and procedures drive high standards of professional business conduct, including embedding adherence to our Code of Conduct. We strive to act fairly and transparently between stakeholders of the Company at all times. Section 172(1) Relevant disclosure The likely consequences of any decision in the long term • Our Business at a Glance: pages 6 and 7 • Our Strategy and Business Model: pages 16 to 19 • Our Businesses: pages 26 to 33 • Dividend policy: page 20 • Responsible Business: pages 48 to 65 • Viability Statement: page 76 • Board activities: pages 91 to 93 The interests of the Company’s employees • Our Business at a Glance: pages 6 and 7 • Our Strategy and Business Model: pages 16 to 19 • Responsible Business: pages 48 to 65 • Non-Financial and Sustainability Information Statement: page 67 • Board activities: pages 91 to 93 • Our Stakeholders: pages 95 to 98 • Directors’ Remuneration Report: pages 113 to 139 The need to foster business relationships with suppliers, customers, and others • Our Business at a Glance: pages 6 and 7 • Our Strategy and Business Model: pages 16 to 19 • Responsible Business: pages 48 to 65 • Non-Financial and Sustainability Information Statement: page 67 • Our Stakeholders: pages 95 to 98 The impact of the Company’s operations on the community and the environment • Responsible Business: pages 48 to 65 • Non-Financial and Sustainability Information Statement: page 67 • Our Stakeholders: pages 95 to 98 The desirability of the Company maintaining a reputation for high standards of business conduct • Corporate Governance: pages 78 to 139 • Non-Financial and Sustainability Information Statement: page 67 The need to act fairly as between members of the Company • Our Strategy and Business Model: pages 16 to 19 • Board activities: pages 91 to 93 • Our Stakeholders: pages 95 to 98 We report here on how our Directors have performed their duties under section 172(1) of the Companies Act 2006 (the Companies Act). 66 Rentokil Initial plc Annual Report 2025 |
|
Rentokil Initial plc Annual Report 2025 67 Strategic Report Corporate Governance Financial Statements Other Information (This page has been left blank intentionally.) |
|
Risks and Uncertainties How the business manages uncertainty and risks Purpose To establish a Group-level approach to manage risk, protect assets, safeguard reputation, maintain resilience, and enable compliance. The framework ensures that risk management is linked to business opportunities and risks, helping colleagues to make decisions that support the Group’s strategy and goals. Risk management activity Group Risk Committee The Committee assists the Executive Management Team in fulfilling its risk management responsibilities. The Committee also supports the Audit Committee (and, in turn, the Board) with its oversight responsibilities of establishing, reviewing and monitoring the effectiveness of the Company’s system of risk management, and the processes for compliance with laws and regulations. The Committee meets regularly to consider risks, and copies of the minutes of the Committee are shared with the Audit Committee. Group policies The Company maintains a suite of Group policies with assigned owners and defined review frequencies. Group policies are accessible to all colleagues. Specific policies related to the risk management process cover Culture and Governance, Compliance, Environment, Health and Safety, and Operational procedures. Process The Group’s approach to risk management is structured into four phases: identification, categorisation, mitigation and monitoring. Defined formal risk management activities are mapped to these phases with clear ownership, and associated internal controls are embedded within the risk management activities. Criteria have been defined to enable assessment of the effectiveness of the risk management and internal control process. There is a governance structure that establishes the policies and procedures that define the process for risk identification and monitoring. 1. Risk identification Identifying potential risks that could impact the business 2. Risk categorisation Categorisation of identified risks 4. Reporting and monitoring Ensures that the risk environment and the effectiveness of mitigation strategies are periodically tracked, reviewed, and appropriately reported 3. Risk mitigation Documenting mitigation actions and controls Risk management approach Phases Group risk register The Company maintains a formal risk register with input from country, regional, and functional management. The register is centrally held, periodically updated, and reviewed by members of the Group Risk Committee. The register categorises the individual risks, documents the mitigating actions and maps them to the principal risks and the Internal Audit Plan. The register also tracks the risk trends and new/emerging risks, determines if the risk is mitigated or accepted by the Company, and includes an assessment of the likelihood and impact at a summary level. Fraud risk assessment The Company completes a fraud risk assessment to identify potential significant exposures to fraud risk. The risks identified are mapped to controls within the framework and reviewed against the risk register and the Internal Audit Plan. The results are communicated to the business via the Finance Leadership Team. 68 Rentokil Initial plc Annual Report 2025 |
|
Assurance of risk management and internal control Assurance criteria Management has defined the following criteria for assessing risk management and internal control assurance: • Evaluating the comprehensiveness of risk identification and assessment • The design and operational effectiveness of controls • The presence of a strong ethical culture and governance • Reporting and monitoring • Evidence of continuous improvement and adaptation to change Our risk consolidation process Governance • Oversight via Audit Committee and Board meetings • Approval of risk process annually • Review of Group Risk Committee minutes • Review of Group strategy annually Reporting and monitoring Categorisation Identification and mitigation • Consolidation and assessment of country risks • Regional mitigation actions and operational priority definition • Second line of defence, internal monitoring and oversight functions • Functional risk identification and assessment • Monthly performance review process • Coordinate risk identification, reporting, and governance activity via a central risk register updated annually • Assessment and categorisation of risk • Group mitigating actions • Define/review Group policies and procedures annually • Review and update Group strategy annually • Monitoring via regional monthly performance reviews • Review and assessment of local risks • Country-level mitigating actions • Monitoring via monthly business unit reviews • First line of defence manages local risk identification as part of day-to-day operations • Local mitigating actions as part of day-to-day operations Regional Management Country Management Operational Unit Executive Management Functional Management Group Risk Committee Audit Committee Board Internal Audit function Emerging risk – Identification and escalation Internal audits & second line – Compliance verification Rentokil Initial plc Annual Report 2025 69 Strategic Report Corporate Governance Financial Statements Other Information |
|
Risks and Uncertainties continued Principal risks and risk profile The Group’s business model remained broadly the same in 2025 as in previous years. It incorporates a number of elements that moderate the risk profile of the Company: • Clear and simple geographic model: Our decentralised model has single-country management teams leading integrated operations, with combined back-office functions underpinned by shared systems. • Low capital intensity and high portfolio retention rates: Our categories exhibit strong defensive qualities, and require minimal upfront investment. • Local market operations: The limited dependency on cross-border flows of people or products reduces the impact of geopolitical risks, and foreign exchange risk is muted since revenue is earned and costs are incurred in local currency. There is natural resilience to fluctuations in market dynamics in individual markets, and geopolitical and trade risks due to our local market operations. The Group’s overall risk management approach is designed to provide reasonable, but not absolute, assurance across the Group that risks are being effectively identified and robustly managed. The Board is satisfied that, through the processes set out above, it is able to effectively identify and manage risks. The Board is further satisfied that the responsible managers have the necessary skills and expertise to ensure that the relevant risk management processes and control systems are in place and fully operative. The Board relies on the assurances provided by management and Internal Audit through periodic reports presented to the Board and Audit Committee. Using the process set out above, the Board confirms that it has undertaken a robust assessment of the principal risks which may impact or otherwise threaten the delivery of the strategy and the long-term viability of the Group. In addition, the Board has assessed the identification and assessment of emerging risks, and is satisfied that appropriate mitigation plans are in place for both emerging and principal risks. Full details of our financial risks can be found in Note C1 on pages 181 and 182. The exact financial impact of one or more of our principal risks materialising will depend on the precise operational impact of the risk, its interaction with other risks, and whether mitigating actions are successful in reducing the overall financial impact. The Group is exposed to other risks and uncertainties related to environmental, political, social, economic, and employment factors in the territories in which we operate. Additional risks and uncertainties not presently known to management or deemed to be of lower materiality may, if they manifest themselves, have an adverse impact on the Group’s growth, profitability, cash flow, and/or net assets. Risk by impact1 Risk trends1 Emerging risks1 Operational 63% Strategic 16% Compliance 15% Reputational 4% Financial 2% Stable 53% Increasing 36% Decreasing 11% Continuing 79% Emerging 21% Principal risks by category Strategic 1. Failure to integrate acquisitions and execute disposals from continuing business 2.Failure to develop products and services that are tailored and relevant to local markets and market conditions Financial 3.Failure to grow our business profitably in a changing macroeconomic environment 4.Failure to mitigate against financial market risks Operational 5.Breaches of laws or regulations 6.Failure to ensure business continuity in case of a material incident 7. Fraud, financial crime, and loss or unintended release of personal data 8.Safety, health, environment (SHE) and sustainability risk 9.Failure to deliver consistently high levels of service to the satisfaction of our customers Changes in the company’s risk profile in 2025 We continue to monitor existing and emerging risks regularly at both the Audit Committee (see pages 99 to 106) and the Group Risk Committee (see page 68), and to take mitigating action as appropriate. Areas where the risk profile of the business has improved in 2025 include: • Continued roll-out of our target financial and operational systems across the globe, including upgrades to SaaS solutions were possible • Standardisation and continued investment into technical infrastructure to mitigate the risk of a successful cyber attack, including a structured training programme for colleagues on threats related to phishing • Targeted expansion of Sarbanes-Oxley (SOX) standard IT general controls across non SOX countries • Continued strong cash flow giving financial headroom to continue to strategically acquire businesses • Fraud risk assessment including additional risks that cover offences as defined by the Economic Crime and Corporate Transparency Act 2023 ‘failure to prevent fraud’ offence • Deep-dive management awareness sessions on management of risks, including ESG reporting and Modern Slavery, Employer of Choice key performance indicators, organic growth, the use of AI, and cost and cash management • Review and update of the risk framework to include: defined effectiveness assessment criteria, structured taxonomy, and impact and likelihood assessment 1. Percentages refer to the number of risks rather than the scale of potential reputational and financial impact. 70 Rentokil Initial plc Annual Report 2025 |
|
Focus areas for risk mitigation in 2026 We continue to look for ways to improve both our risk process and mitigating actions to address the identified risks. In 2026, we plan to focus on the following areas: • Assess material controls as required by provision 29 changes to the UK Corporate Governance Code • Continue to prepare for our reporting requirements under CSRD and ESG risks • Drive additional understanding of and further embed risk management in the business and linkage to business objectives • Define and implement a formal structure and cadence for risk reviews with the regions, to include a consistent agenda for discussion focused on stability of operational risks • Regular reviews with the second line of defence teams, including attendance at the functional meetings, to drive risk awareness and to deep dive into the mitigation actions for significant and high risks • Pre-agreed risk topics for discussion at the Group Risk Committee and Group Leadership Forum meetings, with a focus on emerging and operational risks • Strengthen the risk management skill set by the recruitment of a senior auditor with strong risk management experience Identified and emerging risks Emerging risks are identified at an individual country and functional level and consolidated to the Group level as part of the risk register review activity, as well as identification via the Group Risk Committee quarterly meetings. Notable emerging risks: Compliance: Increased legislation in areas such as pay transparency and corporate governance requirements and non-toxic pest management requirements Operational: Increasing use of AI, internal risks from inappropriate usage or lack of effective use in future technologies, and externally from increasingly sophisticated phishing and spoofing attempts Strategic: Increasing trend for non-toxic pest management requirements The Company has a strategy that includes growth by acquisition, and 36 new businesses were acquired in 2025. These companies need to be integrated quickly and efficiently to minimise potential impact on the acquired business and the existing business. Impact should the risk materialise If the Company fails to successfully integrate acquisitions into its existing organisational structures and IT systems, fails to deliver the revenue and profit targets, or fails to deliver expected synergy savings, the business may not achieve the expected financial and operational benefits, which may adversely impact growth, profitability, and cash flow. Our business may be required to recognise impairment charges or be subject to asset re-evaluations. Business disposals also have to be managed efficiently to minimise risk to the businesses being disposed of and the residual business. Mitigating actions • Integration plans considered by the Investment Committee as part of the acquisition approval process. Integration activities and progress discussed during monthly performance reviews. • Dedicated project teams established for the largest acquisitions and demergers, with clear deliverables over defined time periods. • Continuity of management/leadership in acquired companies, where possible. • Use of transaction structures including deferred consideration to mitigate deal risk, monitored via performance measures. • Group departments involved with acquisitions to drive integration plans and compliance with Group standards, especially when entering new geographies. • Formal post-acquisition review of every acquisition by Investment Committee against original business plan within 18–24 months; Board post-investment review of acquisitions in aggregate every six months. • Board approval of acquisitions involving new countries, new business lines, or above a defined financial threshold. • IT integration playbook to support an effective and timely integration of IT systems. Changes in 2025 versus 2024 • Review and refresh of the Day Zero IT checklist for acquired businesses • Appointment of a Chief Transformation Officer in North America to oversee the integration and replatforming related to the Terminix integration, with a defined team structure and governance framework • Dedicated resources in France to support the disposal of the Workwear business • Use of expert consultants if skills are outside our business expertise Performance measures to monitor risk • Integration plans (day one, 30 days, 100 days, one year) • Reviews of integration plans for specific large acquisitions • Post-acquisition review completions • Post-investment review by the Board of aggregate performance of investment in M&A • Regular steering committee to assess progress Overall risk: High Trend: Stable The ongoing integration of Terminix together with ongoing acquisition activity retains the risk level as high. Strategic priorities Principal risk: Strategic Failure to integrate acquisitions and execute disposals from continuing business North America Accelerate profitable growth in North America. M&A Accelerate growth through targeted M&A. International Pest Control Invest in innovation and digital to grow International Pest Control. Organisation Build a high-quality service company through investment in colleagues and technology. Hygiene & Wellbeing Deliver operational excellence in global Hygiene & Wellbeing. Financial Focus on efficiency, cash flow and disciplined capital allocation. Strategic priorities key: 1 4 2 5 3 6 1 2 3 4 6 Rentokil Initial plc Annual Report 2025 71 Strategic Report Corporate Governance Financial Statements Other Information |
|
Risks and Uncertainties continued The Company’s two core categories (Pest Control and Hygiene & Wellbeing) operate in a global macroeconomic environment that is subject to uncertainty and volatility. Impact should the risk materialise Changes in the macroeconomic environment could have a number of different impacts on the ability of the business to grow profitably, to sustain recruitment, and to deliver against targets. Examples include: • Recession and economic slowdown in some of our key markets. • Changes to the global job market and the dual challenges of recruitment and retention. • Increased costs of doing business, with rising costs as a consequence of political instability, increasing interest rates, and civil unrest. • Low-growth economies with inherent cost inflation where the Company has weak pricing power may make it difficult to maintain profitability, especially in areas of hyperinflation. • Growing market presence of multinational competitors may increase the cost of acquisitions and drive down prices, impacting profitability. • Legislation (including CSRD ESG), regulation, or society expectation limits our ‘licence to operate’. • Inflationary pressures causing us to pass on costs potentially pricing out customers in challenging financial positions, and with wage inflation demands. Mitigating actions • Resourcing being driven by the capital allocation model, differentiated by line of business to maximise opportunities. • Maintaining a low-cost operating model, focused IT investment, incentives to deliver efficient operations, and back-office process alignment and standardisation programme. • International Key Accounts team developing business with multinational customers to take advantage of the unique global capabilities. • A regionally focused defined pricing programme to drive profitability on existing portfolio, build insight, and enable profitable growth from new business and innovations. • Group Procurement team tasked to deliver economies of scale while ensuring robust supply chain. • Regular reviews of customer contracting minimum standards to drive consistent contracting across the Group. Changes in 2025 versus 2024 • Specific programmes at regional level to focus on reduction of back office SG&A costs • Increased focus at regional level on inflationary impacts and mitigating actions through the use of data and profitability tools • Continued focus on governance of pricing decisions in region • Recruitment of colleagues in North America with strong pricing experience Performance measures to monitor risk • Revenue and Organic Revenue Growth, in total and by category W • Revenue contribution from acquisitions • Adjusted Operating Profit W • Group Adjusted Operating Margin • Adjusted Free Cash Flow Conversion W • Net capital expenditure • Customer retention W • Colleague retention W Principal risk: Financial Failure to grow our business profitably in a changing macroeconomic environment We operate across markets that are at different stages in the economic cycle, at varying stages of market development, and have different levels of market attractiveness. We must be sufficiently agile to develop and deliver products and services that meet local market needs, which allows us to meet our growth objectives and stay ahead in a highly competitive industry. Impact should the risk materialise If we are not able to adapt to local business and consumer needs, our existing customers may choose not to renew contracts, or seek reductions in prices. This would negatively impact our ability to maintain or increase margins and cash flow. Examples include: • We must adapt to changes to the regulatory environment that may ban certain products or service models from being used, such as permanent rodent baiting. • We need to respond to the expectations from customers and society for us to reduce our own environmental impact and support our customers in reducing their environmental impact. • We need to develop products that are networked and capable of being monitored in real time, or react to competitor technology developments that are disruptive to the market. Mitigating actions • Acquisition of targets with specific capabilities that address future changes in our markets, governed by a defined authority matrix. • Investment Committee to approve targeted investment in innovation to meet market and regulatory needs. • Category Boards for Pest Control and Hygiene & Wellbeing categories overseeing the roll-out of innovations at pace across our regional businesses. • Continued investment in digital platforms to support Sales and Service frontline colleagues. • Formalised Group key performance indicators (KPIs) for innovation at a customer and colleague level to monitor progress. • Further development of our range of sustainable, non-toxic, and humane pest control solutions, with the Technical Compliance team working closely with all relevant governing bodies. Changes in 2025 versus 2024 • The use of digital technologies at customer sites was increased • Increased use of data analytics to deliver enhanced business insights, in both the International businesses via the Command Center and the North America business via the Rentokil Terminix data hub • Ongoing research into non-toxic pest control solutions Performance measures to monitor risk • Sales growth for key innovations • Percentage of sales revenue from innovation • Number of sites with digital solutions • Percentage of commercial customers registered for digital platforms • Percentage of colleagues using digital applications Emerging risk • Potential for increasing regulatory requirements Overall risk: Medium Trend: Stable No significant changes, resulting in a stable trend. Overall risk: High Trend: Reducing Remains high but reducing due to less economic volatility in our larger countries. Principal risk: Strategic Failure to develop products and services that are tailored and relevant to local markets and market conditions 1 2 3 4 1 2 3 Strategic priorities Strategic priorities 72 Rentokil Initial plc Annual Report 2025 |
|
Our business is exposed to foreign exchange risk, interest rate risk, liquidity risk, counterparty risk, and settlement risk. Impact should the risk materialise If any or a combination of the above risks materialise, this may have a negative impact on profitability, cash flow, and financial statements, and may negatively impact financial ratios and credit ratings, impacting our ability to raise funds for acquisitions or to refinance upcoming debt maturities. Mitigating actions • Financing policy in place to ensure that the Company has sufficient financial headroom to finance operations and bolt-on acquisitions. • Commitment to target credit rating of BBB. • Treasury policies that limit the use of foreign exchange and interest rate derivatives, set limits for financial counterparty exposure, govern how financing is raised in bank and other debt capital markets, and provide rules around Treasury-related matters at operating company level. • Quarterly Treasury Committee to report and monitor financial rating agency metrics, and compliance with treasury policies, supplemented with monthly treasury reports to the Treasury Committee. • Monitoring the impact of exchange rate movements on non-USD profits and net debt. • Cash pooling and debt financing arrangement to match, as far as possible, currency availability/demand across borders. • Revolving credit facility (RCF), unlikely to be affected by adverse credit and financial market events. Changes in 2025 versus 2024 • No material changes Performance measures to monitor risk • Liquidity headroom at the year end of $2.6bn • Counterparty ratings of A- or above • Monthly reporting against ratings metrics • If economically feasible, no unhedged foreign exchange positions above $15m, fixed interest >50%; and matching currency of net debt to underlying profitability • Monitoring of amounts outstanding against counterparty credit limits Principal risk: Financial Failure to mitigate against financial market risks As a responsible company, we aim to comply with all laws and regulations that apply to our businesses across the globe. Impact should the risk materialise Failure to comply with local laws, including bribery and corruption, anti-competitive practice, employment law, data privacy, health and safety, or financial and tax reporting requirements, may result in fines or withdrawal of licences to operate, which could adversely impact growth, profitability, and cash flow, as well as causing reputational damage. The Sarbanes-Oxley Act and other US legislation applies to the Group, and the risk of failing to establish and maintain an effective system of internal controls to meet these laws could impact the Company both financially and operationally. Additionally, the Group operates across many different tax jurisdictions and is subject to periodic tax audits which sometimes challenge the basis on which local tax has been calculated and/or withheld. Successful challenges by local tax authorities may have an adverse impact on profitability and cash flow. Mitigating actions • Group legal oversight of acquisitions. • Annual Board review and approval of tax strategy. • Pre-agreement with the Group Tax Director and Chief Financial Officer for all significant tax planning opportunities, with independent tax advice obtained where necessary. • Regular review of tax exposures. • Group and regional authority schedules in place and subject to regular review. • Group and local policies in place and subject to regular review. • Mandatory reporting of breaches in controls and/or laws to the Group General Counsel and the Director of Internal Audit & Risk. • Follow-up by Group General Counsel on any significant legal or regulatory breach in any country. • Mandatory training on Code of Conduct and other core compliance topics to ensure a highly principled culture of ethical behaviour; completion rates reported to senior management monthly. • All major business transactions or internal reorganisations are subject to rigorous internal and where appropriate external review. Changes in 2025 versus 2024 • Continued development of reporting and monitoring of audit issues • Refresh of a number of corporate policies including the Customer Contracts, Group Data Protection, IP Policy, Procurement Contracts, Minimum Standards and Sanctions Policy • Group authority schedule updated and distributed • Compliance monitoring dashboards on core mandatory training updated to include Failure to Prevent Fraud training • Launch of a Sanctions Screening Tool to support our sanctions compliance Performance measures to monitor risk • Central management of material litigation, including quarterly reporting to the Audit Committee • Regular review of tax exposures and the status of tax audits by the Audit Committee • Completion rate monitoring for mandatory U+ training modules • Monthly monitoring and reporting of audit issues to executive management Emerging risk • Increasing corporate governance requirements Principal risk: Operational Breaches of laws or regulations (including tax, competition, and antitrust laws) Overall risk: Medium Trend: Stable Unchanged, no significant changes, resulting in a stable trend. Overall risk: Medium Trend: Stable Albeit provision 29 of the UK Corporate Governance Code (2024) came into force in 2026. 6 5 Strategic priorities Strategic priorities Rentokil Initial plc Annual Report 2025 73 Strategic Report Corporate Governance Financial Statements Other Information |
|
Risks and Uncertainties continued Collusion between individuals, both internal and external, could result in fraud if internal controls are not in place and working effectively. The business holds personal data on colleagues, some customers and suppliers; unintended loss or release of such data may result in sanctions, fines, and reputational risk. Impact should the risk materialise • Loss of personal data of customers, suppliers, or colleagues could, if significant, result in regulatory intervention, which may result in substantial fines and damage to the Company’s reputation. • Theft of Company assets, including property, customer, or colleague information, or misstatement of financial or other records via deliberate action by colleagues or third parties may constitute fraud and result in financial loss to the business, damage to the Company’s reputation, and/or fines by regulators. Mitigating actions • Robust programme to ensure that all businesses are compliant with data privacy requirements. • Dedicated data privacy team, supporting local privacy officers and privacy champion networks. • Mandatory online training by all senior colleagues on the Code of Conduct. • Compliance with Code of Conduct and other key policies affirmed by the annual Letter of Assurance by all senior management. • Standardised financial control framework operating in all locations. • Confidential Speak Up hotline and email address, monitored and followed up by Internal Audit. • Suspected frauds investigated by fraud specialists as required and lessons learned implemented by management. • Periodic fraud risk assessment process. • User security awareness guidance and policies refreshed and reissued. • Provision of Citrix-only access combined with global patching programmes. • Deployment of anti-ransomware to our data centres. Changes in 2025 versus 2024 • Fraud risk assessments refreshed to include additional risks covering offences as defined by the Economic Crime and Corporate Transparency Act 2023 ‘failure to prevent fraud’ offence • Increased use of data analytics to detect potential fraud • Targeted expansion of IT general controls to non SOX countries • Mandated fraud training included in the mandated U+ training modules Performance measures to monitor risk • Completion rate for mandatory U+ training modules • Speak Up investigations and remediation • Key financial controls pass rates • Periodic review of IT access for critical applications Emerging risk • Inappropriate use of AI potentially exposing personal data Overall risk: Medium Trend: Stable Unchanged, no significant changes, resulting in a stable trend. Principal risk: Operational Fraud, financial crime, and loss or unintended release of personal data The Company needs to have resilience to ensure that the business can continue if impacted by external events, e.g. cyber attack or global events. Impact should the risk materialise Failure to service our customers may affect our ability to retain those customers and damage the Company’s reputation. This may negatively impact growth, profitability, and cash flow. Examples of incidents that could impact our ability to service customers include: • A significant cyber attack or IT failure which impacts our ability to plan efficient routing, or ability to invoice, and is not recovered quickly. • Fire, flood, or climate event impacting our premises or transportation/ supply chain network, preventing goods from being available to enable our technicians to service our customers. • Industrial action by colleagues. • Disruptions to our operations due to the insolvency or operational issues of our third-party suppliers. Mitigating actions • Locations maintain and regularly review business continuity plans. • Key data and applications located within regional data centres with enhanced backup capability and disaster recovery plans. • A dedicated Security Operations Centre is in place to monitor and tackle ongoing cyber threats. • Specific tools deployed at data centres to detect and prevent spreading of cyber attacks. • Data encryption and implementation of Workspace ONE (VMware) on devices and mobile phones. • Ongoing user education awareness programmes. • Penetration testing on all systems to test external firewalls and address any identified weaknesses. • Annual inspections of key sites by insurers, on a rotating basis, to identify potential risks. Changes in 2025 versus 2024 • Formal definition of a business continuity framework • Completion of an Executive Leadership Team Cyber Incident Simulation Exercise • Standardisation and continued investment into technical infrastructure to mitigate the risk of a cyber attack • Targeted expansion of standard IT general controls across countries • Adoption of a standard project management framework to all regions to govern projects • Quarterly reviews focused on cyber incidents, patching and exposure management Performance measures to monitor risk • Number of serious IT incidents and time taken to respond • Major Incident Review actions • Actions arising from IT security self-assessments and monitoring of cyber exposure score and security risk rating • External testing and benchmarking of our IT security environment Emerging risks • Increasingly sophisticated phishing and spoofing attempts • Increase in volume of cyber attacks driven by AI Overall risk: High Trend: Increasing Increasingly sophisticated phishing and spoofing attempts result in this risk being classified as high and increasing. Principal risk: Operational Failure to ensure business continuity in case of a material incident 5 6 5 Strategic priorities Strategic priorities 74 Rentokil Initial plc Annual Report 2025 |
|
The Company is responsible for minimising its environmental impact and ensuring the health and safety of its employees, customers, and other stakeholders in the workplace. Impact should the risk materialise • The Company operates in hazardous environments and situations, for example: – using poisons and fumigants in Pest Control; – driving to and working at customers’ premises; – working at height; and – exposure to needlestick injury/biohazards from medical waste. • Non-compliance with internal policies or industry regulations could lead to personal injury, substantial fines or penalties, including withdrawal of licences to operate and reputational damage. • Environmental risks may arise from former activities at sites currently operated by the Group or acquired by the Group. Legislation and changing expectations may require the business to alter its methods of operation. Mitigating actions • SHE is considered as the first item at all Board and senior management meetings; review of standardised SHE KPIs. • Robust SHE policies supplemented by technical policies address higher-risk and regulated activities. • SHE officers in all jurisdictions, supported by a dedicated central SHE team. • Mandatory training of all relevant colleagues in safe working practices. • Focus on implementation of Group fumigation standards throughout the appropriate businesses and in all new acquisitions. • Formal review of accidents and circulation of lessons learned (e.g. Safety Moments videos and SHE alerts). • Vehicle telematics now deployed in 31 countries to reduce accidents and/or vehicle emissions. • Electric and low-emission vehicles deployed in countries to reduce emissions and drive towards our net zero target. • Strategies to further develop environmentally friendly approaches. Changes in 2025 versus 2024 • Continued expansion of digital site risk assessment application now fully deployed in 77% of our markets • Enhanced training to include sustainability awareness and updated Safety Golden Rules awareness • Further development of our proprietary MySHE platform with new tools and applications to support our colleagues to implement best practices • Ongoing preparation for ESG climate change reporting under CSRD • Fumigation reduction initiatives further embedded Performance measures to monitor risk • Lost Time Accident and Working Days Lost rate W • Total emissions and emissions intensity • Fuel intensity metrics (litres of fuel used per USD of revenue) • Energy usage and percentage of green energy purchased • Electric vehicle deployment (number of vehicles and countries) • Completion rates for mandatory U+ training Emerging risks • Regulatory approval of more environment-friendly alternatives to current fumigants is slow • Slower than expected rate of policy and regulatory support hindering the ecosystem and infrastructure necessary for rapid corporate progress (e.g. charging networks, green energy availability) • Inability of third-party suppliers to decarbonise, impacting Scope 3 emissions Overall risk: Medium Trend: Stable No significant changes, resulting in a stable trend. Principal risk: Operational Safety, health, environment (SHE) and sustainability Our business model depends on servicing the needs of our customers in line with internal high standards and to levels agreed in contracts. Impact should the risk materialise If our operatives are not sufficiently qualified, or do not have the right skills, or we fail to innovate successfully, this may negatively impact our ability to acquire or retain customers, adversely impacting growth, profitability, and cash flow. Industrial action in key operations could result in diminished customer service levels; if prolonged, it could damage the Company’s reputation and ability to secure or renew contracts. In markets where overall employment rates are high, and/or our business is growing fast organically or via acquisition, we may have difficulty attracting and retaining key management of the right capability and the right calibre of operational personnel. Changes in the global job market resulting in difficulty in recruiting and retaining colleagues at all levels of the organisation may impact our ability to service our customers to the highest standards. Major digital change programmes could disrupt our ability to deliver high levels of service to our customers. Mitigating actions • HR development processes, including Employer of Choice programme. • Regular tracking of customer satisfaction and the perception of Rentokil Initial by both customers and non-customers, benchmarked against competitors. • A dedicated Operational Excellence team to drive superior customer service and safe working practices and to establish key metrics, combined with a strong focus on safety by supervisors and frontline staff. • Incentives for Sales and Service staff are closely aligned with strategic priorities and based on delivering improved customer service levels. • Oversight of key industrial relations matters by the Group HR Director and regular review by the Chief Executive for countries where industrial relations risk is elevated. • HR-led recruitment initiatives, including recruiting ahead of time, benchmarked pay plans, and global careers and recruitment websites. • Regular review of major IT programmes by the Chief Information Officer. • An IT Investment Committee to ensure the sufficient allocation of resources, with a quarterly IT risk meeting to ensure oversight of IT transformation plans. • System migration in regions, aligning to standard processes. Changes in 2025 versus 2024 • Further development of the U+ training platform, our primary training tool for colleagues • Continued deployment of IT programmes and tools to frontline colleagues • Ongoing development of our external recruitment website, enhancing our internal job referral platform • Initiative in North America to improve customer retention Performance measures to monitor risk • Sales and Service colleague retention W • U+ learning views • State of Service W • Customer satisfaction (Customer Voice Counts) W • Customer retention W Overall risk: Medium Trend: Stable No significant changes, resulting in a stable trend. Principal risk: Operational Failure to deliver consistently high levels of service to the satisfaction of our customers 1 2 3 4 6 1 2 3 Strategic priorities Strategic priorities Rentokil Initial plc Annual Report 2025 75 Strategic Report Corporate Governance Financial Statements Other Information |
|
Viability Statement In accordance with provision 31 of the Corporate Governance Code, the Board of Directors has assessed the viability of the Group, taking account of the Group’s current financial position, the latest three-year strategic plan, and the potential impact of our principal risks described on pages 71 to 75. Based on this assessment, the Board confirms that it has a reasonable expectation that the Group will be able to continue in operation and meet its liabilities as they fall due over the period to 31 December 2028. The business model of the Group is focused on the delivery of services to customers at their premises. These are professional and often highly technical services, where customers have a need that we can help resolve. While these needs are subject to some seasonality and macroeconomic cycles, overall they are highly stable and growing at GDP rates or faster. The drivers of this growth are key to the Group’s prospects. Population growth, growth of the ‘middle class’ and urbanisation around the world bring growing numbers of humans closer together, increasing the need for hygiene and for control of pests where sources of food are more available. While climate change will undoubtedly have some adverse impacts on the Group, the disaggregated nature of our services at customer locations materially reduces our physical risks. Finally, the change in environment will likely bring upsides as pest breeding seasons are longer, mortality rates are lower, and infestations are able to move into markets where they historically could not survive. Overall, the combination of business model and macroeconomic factors suggests that recent growth trends should foreseeably continue in line with our medium-term targets and beyond. Period of assessment Although the Directors have no reason to believe that the Group will not be viable over a longer time frame, because of the degree of uncertainty, the period over which the Directors have a reasonable expectation as to the Group’s viability is the three-year period to 31 December 2028. Having considered whether the assessment period should be extended, it is the view of the Directors that a three-year period is still appropriate as it is consistent with the historical periods in the budgeting and strategic planning process. Three years is also aligned with the most frequent duration of both the customer and supplier fixed-term contract periods entered into by the Group. Strategic planning process The budget and longer-term plan have been prepared in line with the Group’s strategy as described in detail in the Strategic Report on pages 16 to 19. The Board reviews the Group’s performance at its meetings, and depending on the external environment and its potential impact on the Group’s latest full-year forecast and strategic plan, may model a number of scenarios. Viability assessment In making their assessment, the Directors have considered the current position of the Group and have undertaken a robust evaluation of the principal risks, in particular the ones that could impact on the liquidity, solvency and viability of the Group. The Directors have taken account of the Group’s liquidity position and the Group’s ability to raise finance and deploy capital. The results consider the availability and likely effectiveness of the mitigating actions that could be taken to avoid or reduce the impact or occurrence of the identified underlying risks. Mitigating actions that were identified as part of the viability assessment in previous years, and which were found to be effective during the pandemic, include securing additional liquidity, deferring shareholder distributions, pausing M&A activity, reducing planned capital expenditure, use of recognised tax payment deferral mechanisms, and actively managing the cost base of the Group. Should these measures be insufficient then the Group would consider raising equity funding; however, that has not been required to date. Although the review considered all the emerging and principal risks identified by the Group, the focus was also on how global events, like a worldwide pandemic, could impact the Group’s future financial performance and its cash generation under different scenarios. As a result, severe but plausible downside sensitivities were applied to the three-year plan approved by the Board. The three-year plan is most sensitive to the reduction in revenue due to customer suspensions over extended durations. With that in mind, the directors have chosen scenarios reflecting the principal risks to stress test the three-year plan for the following downside scenarios: • Revenue reduces by 20% against the budget for six months of 2026. This scenario is significantly worse than the customer suspensions experienced during the first half of 2020, before the acquisition of Terminix (which increased the size of the Group by c.60%), which peaked at slightly below 30% for one month only. Risks: failure to grow our business profitably in a changing macroeconomic environment; failure to deliver consistently high levels of service to the satisfaction of our customers; failure to develop products and services that are tailored and relevant to local markets and market conditions; failure to ensure business continuity in case of a material incident; and failure to integrate acquisitions and execute disposals from continuing business. • A prolonged downturn where revenue reduces by 20% for 12 months in 2026 in the model. Risks: failure to grow our business profitably in a changing macroeconomic environment; failure to deliver consistently high levels of service to the satisfaction of our customers; failure to develop products and services that are tailored and relevant to local markets and market conditions; failure to ensure business continuity in case of a material incident; and failure to integrate acquisitions and execute disposals from continuing business. • A significant one-off charge of $250m either in the form of a number of bank failures or as a result of a major fine. Risks: failure to ensure business continuity in case of a material incident; breaches of laws or regulations (including tax, competition and antitrust laws); failure to mitigate against financial market risks; fraud, financial crime and loss or unintended release of personal data; and safety, health, and the environment. We have also considered two joint scenarios of the above: 1) the six-month scenario and a substantial fine; and 2) the twelve-month scenario and a substantial fine. Reverse stress tests were considered to demonstrate the resilience of the Group. A loss or fine exceeding 8% of 2026 Revenue or 39% of 2026 Revenue would be required for existing committed facilities to be used up. With mitigation actions possible, a 94% global downturn in global revenue would need to occur before existing committed facilities were fully used up. The impact of the scenarios has been modelled to test projected liquidity headroom over the three-year viability period. In each of the individual and joint scenarios, the Group continues to retain sufficient liquidity headroom with the mitigating actions it can deploy. In the scenario of a significant one-off charge of $250m, this could be managed using ordinary liquidity management processes. In the three-year period of the viability statement, the Group has three debt maturities: €500m bond in May 2026, €850m bond in June 2027 and €600m bond in October 2028. The May 2026 bond was redeemed on 2 March 2026 as per Note D5 on page 192. As at 31 December 2025, the Group had total undrawn committed facilities and unrestricted cash of $2.5bn. In addition to its committed headroom, the Group also has a $250m accordion linked to its RCF, a £1bn Commercial Paper Programme, and an uncommitted, undrawn overdraft facility amounting to £20m. Throughout 2025, the Group maintained its long-term (BBB with a Stable outlook) and short-term (A-2) credit ratings. The combination of a strong investment-grade credit rating, the RCF banks’ willingness to provide debt funding free of financial covenants, the flexibility the Group has to make material reductions in its cash outflows, which was demonstrated during 2020, and the fact that the Group has continued to generate cash provides the Directors with confidence that the Group could raise additional debt finance if required. The geographical spread of the Group’s operations helps minimise the risk of serious business interruption. Furthermore, the Group is not reliant on one particular group of customers or sectors. Based on this assessment and having carefully considered the Group’s current standing, debt servicing, and the risks and uncertainties referred to above, in line with the UK Corporate Governance Code, the Directors have a reasonable expectation that the Group will be able to continue in operation and meet its liabilities as they fall due over the three-year period ending 31 December 2028. 76 Rentokil Initial plc Annual Report 2025 |
|
78 Chair’s Governance Overview 80 Board of Directors 82 Executive Leadership Team 84 Our Governance 95 Our Stakeholders 99 Audit Committee Report 107 Nomination Committee Report 113 Directors’ Remuneration Report 140 Independent Auditors’ Report Corporate Governance Rentokil Initial plc Annual Report 2025 77 Strategic Report Corporate Governance Financial Statements Other Information |
|
Chair’s Governance Overview The Governance Report that follows provides a summary of the Board’s role and activities, and an overview of the key considerations of the Board during the year. Board changes Board succession has been a key area of focus this year. In May 2025, we announced the retirement of our Chief Executive, Andy Ransom, ahead of our 2026 AGM. After an extensive global selection process, Mike Duffy joined the Company as CEO Designate on 16 February 2026, and will become Chief Executive on 16 March 2026. Andy will remain available until May 2026 to ensure a seamless handover. Leanne Sheraton and Sam Mitchell joined the Board as Non-Executive Directors in June 2025. Sarosh Mistry stepped down as a Non-Executive Director on 31 July 2025 and Linda Yueh will step down from the Board at the conclusion of the 2026 AGM. The Board and Committees During 2025, the Board continued to support the Company’s delivery of its strategy to promote its long-term sustainable success. This included approving the Annual Operating Plan as well as the Medium-Term Strategic Plan. The work of the full Board is complemented by the work of its Committees. The Audit Committee has an important role to play in monitoring the integrity of financial reporting, and reviewing the effectiveness of our internal controls and risk management framework. In 2025, the Committee continued to oversee the Group’s control environment, in particular our compliance with Sarbanes-Oxley (SOX), and monitored the progress of the Group’s implementation of Provision 29 of the UK Corporate Code. The changes to the composition of the Board in the past year highlight the importance of the Nomination Committee in succession planning, including taking the lead in the search for and recruitment of new Directors. The Committee also monitors the Group’s talent development programme, with consideration given to the bench strength for key roles. The Remuneration Committee has also supported the Board on the appointment of our new Chief Executive, and in the departure of the incumbent. The Committee also reviews the remuneration arrangements of our colleagues across the Group. Annual General Meeting The 2026 Annual General Meeting (AGM) will be held at, and broadcast live via webcast from, the Company’s registered office on 7 May 2026 at 2.00pm. We consider the AGM to be a valuable opportunity for us to engage with our shareholders, and to provide an update on the business. UK Corporate Governance Code The Board is pleased to confirm that the Company has applied the Principles and complied with the Provisions set out in UK Corporate Governance Code (the Code) for the period under review. Our application of the Code’s Principles and its compliance with the supporting Provisions during the year is evidenced throughout the Annual Report. Find out more on page 109 Find out more on pages 91 to 94 and 99 to 139 Find out more on pages 84 to 87 Our governance framework is designed to ensure that we deliver our strategy and protect the interests of all our stakeholders by building our business for the long term. Richard Solomons Chair 78 Rentokil Initial plc Annual Report 2025 |
|
Board and Committee attendance at scheduled meetings held in 2025 Board Audit Committee Nomination Committee Remuneration Committee Chair and Executive Directors Richard Solomons 7/7 – 4/4 – Andy Ransom 7/7 – – – Paul Edgecliffe-Johnson 7/7 – – – Non-Executive Directors Brian Baldwin 7/7 – 4/4 4/4 David Frear 7/7 – 3/4 4/4 Sally Johnson 7/7 5/5 4/4 – Sarosh Mistry 4/4 – 0/2 1/2 Sam Mitchell 3/4 2/3 2/3 – John Pettigrew 7/7 5/5 4/4 – Leanne Sheraton 4/4 – 4/4 3/3 Cathy Turner 7/7 – 4/4 4/4 Linda Yueh 7/7 5/5 4/4 4/4 Sarosh Mistry, Sam Mitchell and David Frear were unable to join a small number of meetings due to conflicting commitments which could not be rearranged. While we endeavour to avoid conflicts with other commitments of Board members by setting our calendar in advance, it is sometimes impossible to avoid. A number of ad hoc Board and Committee calls were also held during 2025. Due to the short notice owing to the nature of business and the timing of the calls, a minority of Board members’ prior commitments or their time zones prevented them from attending. Where a Director was unable to attend a meeting, they received and reviewed the papers in advance of the meetings, and their comments were communicated to the Chair or Committee Chair. They received the minutes and were briefed on the outcomes of the meetings. 42–53 37% 54–63 36% 64–73 27% Asian/Asian British 9% White British or other White 82% Prefer not to say 9% Independent Non-Executive Directors 73% (8) Executive Directors 18% (2) Non-Executive Chair 9% (1) Gender Ethnicity Nationalities1 Independence Brian Baldwin 1 year 3 months Sally Johnson Sam Mitchell John Pettigrew Leanne Sheraton Cathy Turner 2 year 9 months 8 years 0 months 7 months 7 months 5 years 9 months Linda Yueh 8 years 2 months David Frear 3 years 3 months Age of Directors Non-Executive Directors’ tenure Snapshot of our Board at 31 December 2025 7 4 1 UK USA Australia Female 36% Male 55% Prefer not to say 9% 1. Linda Yueh has dual US and UK nationality. Rentokil Initial plc Annual Report 2025 79 Strategic Report Corporate Governance Financial Statements Other Information |
|
Cathy Turner Non-Executive Director Appointed: April 2020 Skills, experience, and contribution Cathy is an experienced Non-Executive Director with significant business leadership experience and a deep knowledge of HR and remuneration matters. Her executive career in financial services has included responsibility for strategy, investor relations, HR, corporate affairs, legal, internal audit, branding, and marketing. She brings experience of leading international customer-focused businesses operating in complex, highly regulated industries and navigating challenging environments. She was previously a Non-Executive Director of Quilter plc, Aldermore Bank plc, and MotoNovo Finance Limited, and a Trustee of Gurkha Welfare Trust. She was also Senior Independent Director and Chair of the Remuneration Committee of Spectris plc until 4 December 2025. Current external commitments • Senior Independent Director and Chair of the Remuneration Committee, Lloyds Banking Group plc • Partner, Manchester Square Partners Board of Directors Sally Johnson Non-Executive Director Appointed: April 2023 Skills, experience, and contribution Sally brings substantial commercial and strategic finance experience from her extensive executive career to the Board. Sally is the Chief Financial Officer of FTSE 100 company Pearson plc, which is also listed on the NYSE. Since joining Pearson in 2000, she has held various finance and operational roles across The Penguin Group, the education business, and at a corporate level at Pearson. She was also a Trustee for the Pearson Pension Plan from 2012 to 2018. Sally is a member of the Institute of Chartered Accountants in England and Wales and completed her training at PricewaterhouseCoopers. Current external commitments • Chief Financial Officer, Pearson plc Richard Solomons Chair Appointed: March 2019, and became Chair in May 2019 Skills, experience, and contribution Richard has a strong track record of commercial and strategic development. As former Chief Executive Officer of InterContinental Hotels Group plc, he has experience of leading a successful multinational, delivering growth, and enhancing the effective use of digital tools. Richard trained as a Chartered Accountant with KPMG, and was previously a Non-Executive Director of Marks and Spencer Group plc and the Senior Independent Director of Aston Martin Lagonda Global Holdings plc. Until 12 February 2026, Richard was Chair of HBX Group International plc. Current external commitments • Non-Executive Director and Chair of the Audit Committee, Mandarin Oriental International Limited Andy Ransom Chief Executive* Appointed: May 2008, and became Chief Executive in October 2013 *We announced in January 2026 that Andy would be stepping down as Chief Executive and as a Director on 16 March 2026. Skills, experience, and contribution Andy joined the Board in 2008 as Executive Director, Corporate Development, and brings a focused operational management style, together with a broad range of commercial and strategic skills gained in senior executive positions and legal roles earlier in his career, including several years in the US and Canada. He has more than 30 years of experience creating value through M&A around the world, and has a strong record of engaging with a diverse range of stakeholders. He is a qualified solicitor and a patron of Malaria No More UK. Current external commitments • Non-Executive Director, Informa plc Mike Duffy Chief Executive* Appointed: March 2026 * We announced in January 2026 that Mike would be appointed as Chief Executive and a Director on 16 March 2026. Skills, experience, and contribution Mike brings more than 25 years of leadership experience with large US businesses across B2B and B2C industries. Through his career he has delivered successful business transformations and accelerated profit growth through strategic initiatives including network expansion and optimisation, the effective deployment of technology, and enhanced portfolio management. Prior to joining Rentokil Initial, he served as Chief Executive of OnTrac Logistics, Inc. Current external commitments • Non-Executive Director, Republic Services, Inc. Paul Edgecliffe-Johnson Chief Financial Officer Appointed: January 2025 Skills, experience, and contribution Paul has extensive financial and operational experience in listed international businesses. Prior to joining Rentokil Initial, he served as Chief Financial Officer of Flutter Entertainment plc. Before that, he was Chief Financial Officer and Group Head of Strategy at InterContinental Hotels Group plc, and was also an Associate Director in Corporate Finance at HSBC Holdings plc. Paul is a qualified chartered accountant and is a member of the Association of Corporate Treasurers. Current external commitments • Non-Executive Director and Chair of the Audit & Risk Committee of Watches of Switzerland Group plc Audit Committee Nomination Committee Remuneration Committee Committee Chair Key 80 Rentokil Initial plc Annual Report 2025 |
|
David Frear Non-Executive Director Appointed: October 2022 Skills, experience, and contribution David brings financial experience and a wealth of knowledge of the US market to the Board. He was a Non-Executive Director of Terminix Global Holdings, Inc. prior to its acquisition by Rentokil Initial in October 2022. David previously served as Chief Financial Officer of Sirius XM, Savvis Communications Corporation, Orion Network Systems Inc., and Millicom Incorporated. He was also a Non-Executive Director of The Nasdaq Stock Market LLC, Nasdaq PHLX LLC, Nasdaq BX, Inc., Nasdaq ISE, LLC, Nasdaq GEMX, LLC, and Nasdaq MRX, LLC until 1 July 2025. Current external commitments • None John Pettigrew CBE Senior Independent Director Appointed: January 2018, and became Senior Independent Director in May 2019 Skills, experience, and contribution John has a strong track record of developing and implementing global strategies for profitable growth, deep experience of running a major US business, a strong economic background, and engineering leadership experience. John served as the Chief Executive of FTSE 100 company National Grid plc, which is also listed on the NYSE, for ten years until 16 November 2025. Through his broad executive career, he has experience of dealing with regulatory bodies in the UK and the US, and leading the development of ESG strategies. His skill set also includes service provision to a large commercial and residential customer base, delivering world-class levels of safety performance, and driving transformational change. Current external commitments • Non-Executive Director, BAE Systems plc Sam Mitchell Non-Executive Director Appointed: June 2025 Skills, experience, and contribution Sam has significant executive experience in US retail services, having served as the Chief Executive Officer of Valvoline Inc. from 2016 until 2023. He brings deep expertise in marketing, brand management and general management, alongside a proven track record in corporate leadership, including serving as President of Valvoline since 2002 and successfully leading its spin-out from Ashland Inc. through its 2016 IPO. Sam joined Ashland in 1997. Current external commitments • None Linda Yueh CBE Non-Executive Director Appointed: November 2017 Skills, experience, and contribution Linda brings strong commercial experience gained through her work in corporate law and non-executive positions, as well as deep insights into economics, including key emerging and rapidly developing markets. She was Chair of the Royal Commonwealth Society and acted as advisor to the World Bank and the European Commission. Linda is a fellow of St Edmund Hall, Oxford University and an Adjunct Professor of Economics at London Business School. She is also a Non-Executive Director of the Independent Football Regulator and a member of the UK Soft Power Council and the English Law Promotion Panel. Current external commitments • Chair of the Board and Chair of the Nomination Committee, The Schiehallion Fund Limited • Non-Executive Director, SEGRO plc • Chair of the Royal Parks • Non-Executive Director, Standard Chartered plc Brian Baldwin Non-Executive Director Appointed: October 2024 Skills, experience, and contribution Brian brings extensive experience in investment analysis and operations. As a Partner and Head of Research at Trian Fund Management L.P., he has played leadership roles in many of Trian’s investments, including Ferguson, Allstate, Pentair plc/nVent, Invesco, Janus Henderson, Legg Mason, The Bank of New York Mellon, Lazard, Ingersoll Rand, Wendy’s, Mondelēz, PepsiCo, and Cadbury. Current external commitments • Partner and Head of Research at Trian Fund Management L.P. • Non-Executive Director, Janus Henderson Group plc Leanne Sheraton Non-Executive Director Appointed: June 2025 Skills, experience, and contribution Leanne brings a wealth of commercial and strategic experience in global marketing, honed across a significant executive career. Leanne has extensive experience in building global brands, digital transformation, and driving customer-led growth strategies across various sectors. Leanne most recently served as Chief Marketing Officer for PayPal Holdings, Inc., having joined as Director of Marketing in 2013. Prior to PayPal, Leanne held leadership roles in marketing and sales for global brands including Nestlé, Yahoo and Qantas. Current external commitments • None Rentokil Initial plc Annual Report 2025 81 Strategic Report Corporate Governance Financial Statements Other Information |
|
Executive Leadership Team Rachel Canham Group General Counsel & Company Secretary Appointed: April 2022 Role Rachel has responsibility for legal, corporate governance, and data privacy across the Group. Skills and experience Rachel is an experienced corporate and commercial lawyer. She spent 10 years at BT Group plc where she performed various roles, including General Counsel of its Enterprise division, Company Secretary and Chief Counsel for M&A, joint ventures and restructuring. Rachel is a qualified solicitor, with experience as a corporate lawyer at US law firm Latham & Watkins, and Dickson Minto. Rachel became the Company Secretary in April 2024. Vanessa Evans Group HR Director Appointed: January 2016 Role Vanessa is responsible for shaping and executing our Employer of Choice strategy, ensuring that we can attract, recruit, train, engage, reward, and retain the talent we need to deliver our business strategy. Vanessa will be stepping down from the ELT at the end of March 2026. Skills and experience Vanessa brings valuable business experience and expertise in human resources management. She joined Rentokil Initial from RSA Group plc where she was Group HR, Communications and Customer Director. Prior to that, Vanessa was Global HR Director at Lego and Head of UK HR at GAP. She is a Fellow of the Chartered Institute of Personnel and Development and until October 2024 was a Non-Executive Director of Care UK. Mark Gillespie Managing Director, Asia & MENAT Appointed: April 2022 Role Mark oversees our businesses throughout Asia, the Middle East, and North Africa. Skills and experience During his career at Rentokil Initial, Mark has held a number of roles, including Group Director of Internal Audit & Risk Management and Regional Managing Director for the Rest of World region. He has extensive finance, general management, and M&A experience, and previously held senior roles at Honeywell and Pfizer. Mark is a member of the Institute of Chartered Accountants in England and Wales. Chris Hunt Group M&A and Global Accounts Director Appointed: July 2019 Role Chris leads our efforts to evaluate, negotiate, and integrate acquisitions and disposals. As Head of Global Accounts, he leads the strategy and execution for acquiring, retaining, and expanding multinational partnerships across core sectors. Skills and experience Chris has completed more than 400 deals for the Group. Prior to joining Rentokil Initial, he held various senior roles at AstraZeneca plc, including Head of Finance at AstraZeneca UK’s Marketing Company, Corporate Strategy Director, and Group M&A Director. Prior to that, he was a Director at KPMG Transaction Services. He is a Chartered Accountant and a member of the Institute of Chartered Accountants in England and Wales. Alain Moffroid Interim CEO, North America Appointed: March 2016, and became Interim CEO, North America in January 2025 Role In his role as CEO, North America, Alain oversees our businesses in North America. Skills and experience Alain has served as Chief Commercial Officer, Managing Director, Pacific, and Managing Director, Europe. Prior to joining Rentokil Initial, he held several senior roles at Unilever plc across multiple geographies, with significant experience in marketing, sales, and business development. The ELT supports the Chief Executive in managing the business at Group level, overseeing safety, performance, operational plans and actions, governance, and risk management. The Chief Executive and Chief Financial Officer are also members of the ELT. Their biographies can be found on page 80. The Chief Executive chairs the ELT, which meets regularly throughout the year, and the Managing Director of our Latin America and Caribbean region also attends ELT meetings. In January 2025, we announced that Brad Paulsen was stepping down and that Alain Moffroid had been appointed as Interim CEO, North America. John Myers stepped down from the ELT on 1 April 2025. 82 Rentokil Initial plc Annual Report 2025 |
|
Mark Purcell Chief Information Officer Appointed: April 2019 Role Mark ensures that a ‘safe and secure first’ approach is applied to Rentokil Initial’s global IT systems and infrastructure. He works alongside the regional and functional teams to ensure that the IT strategy and investment is aligned to business priorities. Skills and experience During his career at Rentokil Initial, Mark has held a number of roles, including Global IT Delivery Director, UK Hygiene and Textiles IT Director, Pest Control and Ambius Division IT Director, IT Director for UK & Rest of World, and CIO Europe. Mark has significant experience in business transformation, as well as expertise in M&A integration. Prior to Rentokil Initial, Mark held an executive officer position in IT with the Civil Service. Fabrice Quinquenel Managing Director, Europe Appointed: April 2024 Role Fabrice oversees our businesses throughout the Europe region. Skills and experience Fabrice was previously Managing Director, France, Nordics & Poland. Having joined from Hertz, he also has a wealth of experience in fulfilling senior leadership roles across different jurisdictions and geographies, including as the Vice President Sales for Hertz International. Andrew Stone Managing Director, Pacific Appointed: September 2019 Role Andrew oversees our businesses throughout the Pacific region. Skills and experience Andrew joined Rentokil Initial in 2013 as Finance Director, Pacific. Andrew has extensive commercial, finance, and supply chain experience and previously held several senior finance and sales roles at Unilever within Australasia. Andrew is a Certified Practising Accountant. Brian Webb Chief Procurement and Sustainability Officer Appointed: August 2019 Role Brian leads the Global Procurement, Supply Chain and Logistics functions, as well as being responsible for product quality, safety, and technical governance, and for driving the environmental and sustainability agenda across the Group. Skills and experience Brian joined Rentokil Initial in 2011 as Supply Chain Director for Hygiene and Pest Control. His career has included roles in design and project engineering, production management, and operations in the petrochemical, food, beverage, and personal care sectors at global companies including Sasol, SABMiller, Mars Confectionery, and Sara Lee. Brian is a Chartered Engineer. Phill Wood Managing Director, UK & Sub-Saharan Africa Appointed: October 2013 Role Phill oversees our businesses throughout the UK & Sub-Saharan Africa region. Skills and experience Phill joined Rentokil Initial in 2006, holding various senior Pest Control roles in Europe before his appointment to lead the UK businesses in 2009. Prior to joining Rentokil Initial, Phill held management positions at Lex Services/RAC plc, where he served for 15 years. Phill has extensive commercial and business development experience. He is a Chartered Management Accountant. Rentokil Initial plc Annual Report 2025 83 Strategic Report Corporate Governance Financial Statements Other Information |
|
Compliance with the 2024 UK Corporate Governance Code For the year ended 31 December 2025, we have applied the Principles and complied with all of the applicable Provisions of the 2024 UK Corporate Governance Code (the Code). Our application of the Code’s Principles and compliance with the supporting Provisions during the year is evidenced throughout the Annual Report. We have set out below an overview of how we have applied the Principles of the Code over the 2025 year, with links to relevant sections in the report. During the year, the Board, with the support of the Audit Committee, has been monitoring the work being undertaken to prepare the Company for reporting under Provision 29 of the Code, which is effective from the financial year beginning 1 January 2026. Further details can be found on page 105. The full text of the Code is available on the FRC’s website at frc.org.uk. Statement of application of Code Principles 1. Board leadership and Company purpose A. The role of the Board The Board promotes the long-term sustainable success of the Company through the decisions it takes about the services, customers, and markets in which the Group operates, and maintains a dividend policy to share the value generated by these operations with shareholders. The Directors’ diverse range of skills, experience and industry knowledge, and ability to exercise independent and objective judgement, help the Board to operate effectively in its oversight of delivery of the Group’s strategy, and its contributions to wider society. The biographies of our Directors are outlined on pages 80 and 81, and include details of their respective skills, experience and contribution. The Board ensures that the necessary resources are in place to help the Company meet its objectives and measure its performance against them. The Board’s effective operation is underpinned by our governance structure, as described on page 88. B. Purpose, values, culture and strategy The Board believes that our mission, to protect people from the dangers of pest-borne disease and the risks of poor hygiene, and to enhance lives with services that protect the health and wellbeing of people, and our vision, to be the most loved and respected services business on the planet, position the Company for long-term sustainable success. Our Code of Conduct and our values (service, relationships, teamwork and responsibility) underpin how we work together, and set the baseline for cultural guidance. Dedicated cultural updates and employee engagement activities frame the Board’s assessment of culture in practice. Our culture is summarised on page 7, 50 and 51, and an outline of the Board’s ongoing monitoring of the Company’s values and culture is provided on page 92. The Board is responsible for setting our strategy and policies, overseeing risk and corporate governance, and monitoring progress towards meeting the Group’s objectives. The Board conducts an annual review of the Group’s overall strategy, as summarised on page 91. C. Governance reporting The Board retains a Schedule of Reserved Matters for its decision, alongside a wider Board Governance Manual, which governs Board operations and pertinent Group-wide matters. The Schedule of Reserved Matters can be accessed on our website, alongside the Group’s key corporate governance documents. The Board activities section elaborates on some of the Board decisions taken during the year, such as those made in regard to people, risk, and financial management, and the outcomes of those decisions in the context of the Company’s strategy and objectives, as set out on pages 91 to 94. Our Governance We have a comprehensive Group-wide framework in place to supplement local policies and legislation. The cornerstone of this policy framework is our Code of Conduct. • The Code of Conduct sets out a fundamental commitment to comply with all legal requirements that apply, and to operate with high ethical standards. It outlines responsibilities to colleagues, customers, and the business, and highlights our determination to establish our values, and a culture of integrity, everywhere within the business. • Clear guidelines are provided to all colleagues on how to seek further advice or report concerns, and we also operate a whistleblowing (Speak Up) facility for colleagues and third parties. This is designed to allow colleagues across the Group to raise concerns confidentially internally and to disclose information which the individual believes highlights or would indicate illegality, unethical behaviour, or other serious malpractice. • The Group’s Dealing Policy governs the purchase, sale, and other dispositions of the Company’s securities by Directors, senior management, and colleagues, and are designed to promote compliance with applicable insider trading laws, rules, and regulations. Specific programmes are in place to support the Code of Conduct and underlying policies, national laws, and regulations, while also monitoring and reporting on compliance. This includes the use of e-learning training on our online learning and development platform, U+, and we track dissemination and adoption across the Group. We review policies periodically to ensure they meet current best practice and legislative requirements, and our technical and safety standards and practices often exceed local regulatory requirements. Examples of our key policies are available on our website at www.rentokil-initial.com/responsible-delivery/policies. 1 CODE OF CONDUCT Code of Conduct YOU ARE THE BRAND CODE OF CONDUCT Protecting People. Enhancing Lives. Preserving our Planet. OUR CODE OF CONDUCT – OUR CORNERSTONE SPOTLIGHT ON: POLICIES AND PRACTICES 84 Rentokil Initial plc Annual Report 2025 |
|
D. Stakeholder engagement The Board recognises the importance of our stakeholders to our business, with our values influencing how the Company engages with them. The Board’s oversight and understanding of the views of our stakeholders are achieved through Board engagement. Further details can be found on pages 95 to 98, with the Directors’ section 172(1) statement being found on page 66. E. Workforce policies and practices The Company’s Code of Conduct sets out our values, and the standards of behaviour expected from all colleagues. It empowers colleagues to make decisions in the best interests of the Group, customers, and society, and is applicable to the Group worldwide, including the Board. The Code of Conduct also provides guidance on the Company’s whistleblowing facility, Speak Up. This facility ensures colleagues and third parties are empowered to speak up in relation to wrongdoing. The Audit Committee receives regular reports on our whistleblowing arrangements, covering performance and case trends. These updates support the Committee’s assessment of the effective operation of the whistleblowing arrangements. The Board has full oversight of these matters by way of the Audit Committee Chair’s reports to the Board after each Committee meeting. 2. Division of responsibilities F. Role of the Chair The Chair of the Board, Richard Solomons, is responsible for the Board’s overall effectiveness in directing the Company. His key responsibilities are defined on page 89. Richard was first appointed to the Board in March 2019, and was considered to be independent on his appointment as Chair in May 2019. The performance of the Chair, which is assessed annually, is led by John Pettigrew, our Senior Independent Director. Further details can be found on page 90. G. Board composition, independence and division of responsibilities The Board comprises the Chair, eight independent Non-Executive Directors and two Executive Directors. Excluding the Chair, over half of its membership is independent. The Directors are collectively responsible for the success of the Group. The roles of the Board, Board Committees, Chair, Senior Independent Director, Chief Executive, and Chief Financial Officer are documented, as are the Board’s reserved powers and delegated authorities. The Board’s responsibilities and the governance structure by which it delegates authority are outlined on page 88. Each Director has a duty to disclose any actual or potential conflict of interest, as defined by law, for consideration and approval, if appropriate, by the Board. This requirement is supported by a formal process which manages situations where a Director may have a potential conflict of interest. As part of the process, the Board considers each potential conflict situation on its merits, with authorisation given in accordance with our Articles of Association and the Companies Act 2006. No material conflicts have been declared when requested at each meeting. The current register of conflicts is noted at each Board meeting. The Board also oversees an annual authorisation process which informs the ongoing assessment of the Non-Executive Directors’ independence. The independence of Directors is considered on their appointment, and subsequently reviewed as part of the individual Director performance evaluation process annually to ensure all Non-Executive Directors retain necessary independence of judgement. The Board has determined that all our Non-Executive Directors are independent and have retained their independence of character and judgement. The Non-Executive Directors’ ongoing independence is reflected through their continued challenges to the executive team and senior management. The Board also takes account of the identified indicators of potential non-independence, as set out in the Code, when reaching its conclusion. No Director took part in the Board’s consideration of their own independence. H. Role of the Non-Executive Directors and time commitment The Non-Executive Directors exercise objective judgement in respect of Board decisions, providing scrutiny and challenge and holding management to account. Non-Executive Directors offer strategic guidance and specialist advice based on their breadth of experience and knowledge. Further details can be found on page 89. The Non-Executive Directors regularly meet without the Executive Directors or other management present. Currently, the expected time commitment of the Chair is an average of two days a week, while Non-Executive Directors are required to commit at least 20 days a year. All Directors may accept positions on other boards if they can demonstrate that the additional commitments will not compromise their time commitment with us or represent a conflict of interest. Any new external appointment must be approved by the Board in advance, which gives due consideration to the nature of the appointment and the anticipated time commitment. We consider significant appointments (as referred to in Provision 15 of the Code) to be either a role with a listed company or a role with a time commitment equal to or greater than their time commitment with us. In 2025, the Board considered and approved the appointment of John Pettigrew as a Non-Executive Director of BAE Systems plc and the appointment of Linda Yueh as Chair of the Royal Parks. The Board also considered and approved certain educative and advisory appointments which did not require a significant time commitment of the Directors. The significant external commitments of the Directors can be found in their biographies on pages 80 and 81. We monitor, in line with published investor guidance, the topic of Board Directors becoming over-committed by taking on too many potentially significant positions (otherwise referred to as ‘overboarding’), and the need to remain flexible to deal with unforeseen circumstances. The fact that some of the members of the Board hold multiple non-executive positions has not presented any problems regarding their ability to manage potentially competing demands for their time. In addition to published investor guidance, the Board considers a Director’s time commitment in aggregate and takes into account whether a Non-Executive Director holds any executive appointments. A table detailing the number of Board, Audit, Nomination, and Remuneration Committee meetings held in 2025, and Director attendance at those meetings, is provided on page 79. The performance of the Non-Executive Directors is assessed annually as part of the Board’s performance evaluation, as described on page 90. I. Board policies, processes, information, time, and resources The Group General Counsel & Company Secretary works with the Chair of the Board, the Chairs of the Committees, the Chief Executive, and other members of management to ensure that the Board has the policies, processes, information, and resources it needs in order to function effectively and efficiently. Board and Committee meetings are structured around a pre-agreed annual plan of business, with consideration for the status of projects, strategic workstreams, and the overarching operating context. Adequate time is allocated to support effective and constructive discussion, and guidance is available to the authors and presenters of Board materials. An electronic meeting portal allows efficient navigation of papers, information and requests. In addition, any Director can request further information or advice to support their individual duties or collective Board role. Rentokil Initial plc Annual Report 2025 85 Strategic Report Corporate Governance Financial Statements Other Information |
|
3. Composition, succession, and evaluation J. Appointments to the Board The Nomination Committee (which comprises all the Non-Executive Directors and the Chair) and, where appropriate, the full Board regularly review the composition of the Board and the status of succession to both the ELT and Board-level positions. Directors have regular contact with, and access to, succession candidates for the ELT positions. There is a formal, rigorous and transparent procedure for appointments to the Board. The Nomination Committee Report details the process for appointments approved during the year from page 109. The Nomination Committee also reviews succession plans for the Board and senior management. This work considers the length of tenure of the Non-Executive Directors and the talent pipeline for the Executive Directors. Succession for senior leadership roles is considered by the Committee with support from Group HR. In accordance with the Articles of Association of the Company, all Directors retire at each AGM and may offer themselves for re-election by shareholders. The Notice of AGM will give details of those Directors seeking election or re-election. The Board conducts a review of the skills and experience of the individual Directors and the collective Board, where Directors rate their experience and expertise, and the experience and expertise of the Board as a whole, on an annual basis. A ten-point rating scale is used for the individual ratings, whereby each Director indicates their level of experience and expertise in each area based on a set of descriptors for each level. Scoring under five indicates little or no recent experience and expertise, and scoring closer to ten indicates recent and senior experience. The Board and Nomination Committee use the skills review to identify areas to focus upon when considering succession planning for the Board, and to identify topics for the ongoing training and development of the Board. In the 2024 review, the Board identified US experience and marketing/brands expertise as core areas for training and succession. The Board’s US experience and marketing/brands expertise was bolstered in 2025 with the appointments of Leanne Sheraton and Sam Mitchell. In the 2025 review, the Board identified technology and marketing/ brands expertise as areas for consideration in succession planning. Our skills matrix details the average of the individual ratings for the respective skills. Further details on succession planning may be found in the Nomination Committee Report on page 109. Environment, health & safety: Understanding of environmental, corporate social responsibility, and community issues, global external reporting standards, and the relationship between sustainability and corporate strategy. Executive leadership: Experience as a Board member or executive. Finance: Experience as an executive or senior management in financial accounting and reporting. Governance: Experience as an executive or senior management in a large company subject to rigorous governance, legal, and regulatory standards, and experience of considering the interests of different stakeholder groups. Marketing/Brands: Experience as an executive or senior management in consumer marketing/brand management. Remuneration: Experience serving on a remuneration committee and/or as an executive or senior management in relation to global remuneration programmes. Risk: Experience at Board, executive, or senior management level of the identification, evaluation, and prioritisation of risks. Strategy and M&A: Experience developing and implementing a successful strategy for a large company and/or with significant corporate transactions. Technology and digital: Experience at Board, executive, or senior management level of digital transformation and/or an understanding of new and established technologies. UK listed company experience: Experience as a Board member or executive in a company listed in the UK. US listed company experience: Experience as a Board member or executive in a company listed in the US. Environment, health & safety Executive leadership Finance Remuneration Risk Governance Marketing/Brands Strategy and M&A Technology and digital UK listed company experience US listed company experience 7.3 8.6 8.3 9.6 9.4 8.4 7.6 6.9 7.6 6.3 7.2 K. Board skills, experience, and knowledge The Nomination Committee identifies the skills, knowledge and experience required of the Board for the effective leadership and long-term success of the Company, managing the balance of competencies through succession planning, training and development, and recruitment. This is supported by an assessment of the Board’s skills matrix to identify where a gap or further work may be required. The key skills and experience of each of the Directors are included in the Board biographies on pages 80 and 81, and the output of the skills matrix review can be found below. The Nomination Committee is also mindful of Directors’ lengths of tenure and the need to refresh Board membership over time. L. Board performance review The Board monitors and improves performance by reflecting on the continuing effectiveness of its activities, the quality of its decisions, and considering the individual and collective contribution made by each Director. This is assessed annually through the Board performance review process, which is facilitated externally at least every three years. In 2025, the Board undertook an internally facilitated review. The outcomes, and a review of the 2024 actions, are described on page 90. REVIEWING OUR DIRECTORS’ SKILLS SPOTLIGHT ON: SKILLS OF DIRECTORS Our Governance continued 86 Rentokil Initial plc Annual Report 2025 |
|
4. Audit, risk, and internal control M. Independence and effectiveness of internal and external auditors The Audit Committee is responsible for reporting to the Board on a range of matters concerning audit, risk, and internal controls. The Audit Committee oversees the relationship with our external auditor, PwC, to ensure that the independence, quality, and challenge of the external audit process is maintained. The Audit Committee also assesses the role of Internal Audit, reviewing the independence and effectiveness of its function and work. The Audit Committee reviews significant financial judgements to monitor the integrity of the financial and narrative statements. For more information about the role and work of the Audit Committee, see the Audit Committee Report, from page 99. N. Fair, balanced, and understandable assessment The Board considers whether the Annual Report, taken as a whole, is fair, balanced and understandable and provides the information necessary for shareholders to assess the Group’s position and performance, business model, and strategy. The Board’s approach to ensuring reporting is fair, balanced, and understandable is detailed on page 103, and the Directors’ statement on ‘fair, balanced, and understandable’ can be found on page 224. O. Risk and internal control The Board is responsible for the Company’s risk management and internal control framework, and its effectiveness. The Board delegates some responsibilities for risk management and internal control oversight to the Audit Committee, as summarised on pages 105 and 106. The Group’s approach to risk management and internal control, together with the Group’s principal risks, is set out on pages 68 to 75. 5. Remuneration P. Remuneration Policy and practices The Remuneration Committee is responsible for determining remuneration policies and practices which support the strategy and promote the long-term sustainable success of the Group. For more information about the work of the Remuneration Committee, see the Directors’ Remuneration Report from page 113. The Directors’ Remuneration Policy was approved with over 95% of shareholders’ support at the AGM on 8 May 2024. It is intended the Policy will apply for a period of up to three years and will need to be re-approved at the 2027 AGM at the latest. A copy of the policy can be found on our website at www.rentokil-initial.com/investors/ governance/board-committees. Q. Executive remuneration The Remuneration Committee routinely reviews the Directors’ Remuneration Policy and executive remuneration arrangements to ensure they continue to promote the delivery of the long-term strategy and support the Company’s ability to recruit and retain executive talent to deliver against that strategy. The Remuneration Committee also considers remuneration arrangements in the context of corporate governance best practice and arrangements for the wider workforce, and regularly consults with its major investors on remuneration proposals. Details of how the policy was applied during 2025 and how the Remuneration Committee has undertaken its duties can be found in the Directors’ Remuneration Report on pages 113 to 139. R. Independent judgement and discretion The Remuneration Committee determines remuneration outcomes for the Executive Directors and other members of senior management, and in doing so exercises independent judgement and discretion in the context of Company performance and individual performance and the wider circumstances, as appropriate. No Director or member of management is involved in determining their own pay. In addition, external remuneration advisors (Willis Towers Watson) provide advice to the Remuneration Committee, and they adhere to the Remuneration Consultants’ Group Code of Conduct. 2025 AGM voting outcomes At the 2025 AGM, Resolution 4 to re-elect Richard Solomons as a director received votes cast against of more than 20% (21.15%). Prior to the AGM, the Chair met with a number of significant shareholders as part of his annual engagement exercise. Following the AGM, the Chair contacted the Company’s largest shareholders to offer additional meetings to further understand matters important to each shareholder. The Chair continues to hold periodic meetings with shareholders to hear their views. The Senior Independent Director has also engaged with key shareholders to understand their views on the AGM voting result, and in some cases the reasons for voting against. During these meetings with the Chair and the Senior Independent Director respectively, feedback was provided on the Board’s oversight of financial performance in North America and the Terminix integration, Board diversity, and on succession planning. These views have been carefully considered by the Board, the Nomination Committee and management (as appropriate). In line with usual practice, the Chair will meet with shareholders as part of the annual engagement exercise ahead of the 2026 AGM, to understand their views on governance and strategy matters. Rentokil Initial plc Annual Report 2025 87 Strategic Report Corporate Governance Financial Statements Other Information |
|
Governance framework A strong system of governance throughout the Group is essential to achieving our mission and delivering our strategy. The Board reserves certain responsibilities, with specific responsibilities delegated to the Board Committees, and the day-to-day management of the Group delegated to the Chief Executive, who is supported by the ELT. This governance framework provides the Board with confidence that the appropriate decisions are taken at the appropriate levels, and further allows the Board to ensure it meets its obligations to our shareholders and other stakeholders. Audit Committee Provides effective financial governance and oversees the Group’s financial and narrative reporting, risk management, and internal control environment, and the external and internal audit process. Nomination Committee Ensures the correct balance, structure, and composition of the Board and its Committees, and reviews Board and executive succession planning, talent programmes, and diversity and inclusion. Remuneration Committee Reviews and agrees with the Board the remuneration framework, determines the remuneration packages of the Executive Directors and senior management, and considers workforce remuneration arrangements. The Board The Board’s role is to set the strategy to create sustainable, long-term value for shareholders and other stakeholders. It governs within a framework of prudent and effective controls that enable it to manage and assess risk. The Board strives to operate in a constructive, ethical, and transparent manner at all times, and to set the tone for the rest of the business. Matters reserved for the approval of the Board are set out in writing and reviewed periodically. They are available to view on our website. Chief Executive and the ELT The Board delegates the execution of the Company’s strategy and the day-to-day management of the business to the Chief Executive. The Chief Executive cascades authority to the ELT and wider management team through a documented Group Authority Schedule, which the Board reviews annually. The ELT also manages ESG matters. INFORMING INFORMING INFORMING REPORTING REPORTING REPORTING Board Committees Disclosure Committee Comprising the Chief Executive, Chief Financial Officer, Group Financial Controller, Group General Counsel & Company Secretary, and Head of Investor Relations, the Disclosure Committee supports the Board’s responsibility for the accuracy and timeliness of external disclosures and compliance with the Market Abuse Regulation. Details of its meetings and decisions are reported to the Audit Committee. Treasury Committee Comprising the Chief Financial Officer, Group Treasurer, and Group Financial Controller, it reviews and approves the capital structure and financing strategy, as well as risk and cash management. Group Risk Committee Comprising the Chief Financial Officer and six other functional executives, the Group Risk Committee reviews the internal control environment and emerging risks, and considers internal policies and procedures for identifying, assessing, and reporting risks, meeting quarterly. Details of its discussions are reported to the Audit Committee. Investment Committee Comprising the Chief Executive, Chief Financial Officer, Group Financial Controller, and Group General Counsel & Company Secretary, the Investment Committee reviews and approves investments below the threshold requiring Board approval, including M&A, and expenditure on property and environmental remediation. It also conducts post-acquisition reviews of completed M&A transactions and reviews material litigation quarterly. Find out more: Key activities during 2025, pages 91 to 93 Find out more: Strategy and Business Model, pages 16 to 19 Find out more: Board biographies, pages 80 and 81 Find out more, pages 99 to 106 Find out more, pages 107 to 112 Find out more, pages 113 to 139 Find out more: Strategy and Business Model, pages 16 to 19 Find out more: Executive Leadership Team biographies, pages 82 and 83 Management Committees Operating under authority delegated by the Board to the Chief Executive and Chief Financial Officer, these Committees each have specific remits and authority to approve decisions within set limits approved by the Board. Our Governance continued 88 Rentokil Initial plc Annual Report 2025 |
|
Division of responsibilities The Board has collective responsibility for the governance of the Company, using clear authority and reporting governance structures to undertake its duties as set out on page 88. This clear division of responsibilities enables the Board to operate effectively, fulfil its responsibilities, and provide valuable oversight. The responsibilities of the Board members are set out below. The pro-forma appointment letters for a Non-Executive Director and the Chair of the Board are also available on our website. Chair of the Board Richard Solomons • Leading the effective operation and governance of the Board • Setting the Board agenda, including discussing issues of strategy, performance, accountability, risk, and sustainability • Demonstrating objective judgement and providing constructive challenge to management • Facilitating active engagement by all Directors • Setting clear expectations on culture, values, and behaviour • Ensuring effective communication with shareholders and other stakeholders • Leading the annual evaluation of the performance of the Board and Chief Executive Senior Independent Director John Pettigrew • Leading the Non-Executive Directors in the annual appraisal of the Chair of the Board • Working with the Chair on the effectiveness of the Board • Providing an alternative channel of communication for investors, primarily on corporate governance matters • Being a sounding board for the Chair of the Board • Chairing the Nomination Committee when it is considering succession to the role of Chair of the Board Chief Executive Andy Ransom • Ensuring effective leadership and day-to-day running of the Company • Recommending and executing strategies and strategic priorities • Managing operational and financial performance, including monthly performance reviews with all regions, and identifying and managing risks to achieving the strategy • Keeping the Chair and Board appraised of any key matters • With the Chief Financial Officer, explaining the Company’s performance to shareholders and other stakeholders • Reviewing the organisational structure, including executive management capability, development, and planning for succession • Overall development of Group policies and the communication of the Company’s mission, vision, and values • Promoting the Company’s responsible business and ESG agenda Independent Non-Executive Directors Brian Baldwin, David Frear, Sally Johnson, Sam Mitchell, Leanne Sheraton, Cathy Turner, Linda Yueh • Contributing independent challenge and rigour • Providing external experience and knowledge to the Board’s agenda • Assisting in the development of the Company’s strategy • Ensuring the integrity of financial information, internal controls, and risk management processes • Monitoring the performance of the Executive Directors to agreed goals and objectives • Advising and being a sounding board for Executive Directors and members of the ELT • Performing their Committee responsibilities Chief Financial Officer Paul Edgecliffe-Johnson • Supporting the Chief Executive in developing and implementing strategy • Supporting the Chief Executive in managing the operational and financial performance of the Group • With the Chief Executive, explaining performance to shareholders and other stakeholders • Presenting and reporting accurate and timely historical financial information • Recommending appropriate financing, tax, and treasury arrangements Company Secretary Rachel Canham • Assisting the Chair in developing the Board calendar and agendas • Ensuring that the Board has the policies, processes, information, time, and resources it needs in order to function effectively and efficiently • Assisting the Chair and Senior Independent Director in their evaluation of the Board’s effectiveness • Advising the Board and its Committees on governance matters, and managing effective corporate governance and compliance arrangements for the Board • Facilitating Board induction and development programmes • Facilitating Board engagement with the business and key stakeholders Rentokil Initial plc Annual Report 2025 89 Strategic Report Corporate Governance Financial Statements Other Information |
|
Board and Committee performance review The performance and effectiveness of the Board, its Committees, and individual Directors are comprehensively assessed annually through a formal performance review. In accordance with Provision 21 of the UK Corporate Governance Code, we have adopted a three-year cycle of external Board performance review, with the last external performance review undertaken in 2023. During 2025, we undertook an internal review of the Board and the Committees, conducted through a questionnaire completed by all Directors. The outcome of the evaluation was then reviewed by the Chair and Committee Chairs ahead of discussions on themes and actions being held at the Board meeting in March 2026. The 2025 Board performance review revealed positive feedback on the Board visits to North America, the Board’s role in setting the Group’s strategy, and access to high-quality information and advice from the ELT and Group General Counsel & Company Secretary between meetings. The review concluded that the Board was operating effectively. Following its review of the themes, the Board agreed a certain number of opportunities for improvement and actions noted below. The review process included separate questionnaires for the Committees, completed by Committee members, and by regular Board attendees. In all Committee reviews, positive feedback was given for the relevant Committee Chair. The Committee performance reviews concluded that the Board Committees operate effectively and are well-integrated into Board decision-making processes. Further details are set out in each Committee report on pages 106, 108 and 118. 2025 evaluation recommendations and actions to be taken during 2026 Board succession planning and talent development • The Nomination Committee will focus on succession planning for the Non-Executive Directors due to reach their nine-year tenure in the near term, utilising the areas of focus identified in the Board skills review. • The Nomination Committee identified that depth of talent for succession planning in key roles across the business would continue to be a focus for 2026. Further enhance the oversight of performance and progress by region • The Board will continue to focus on its oversight of the regions this year. Regional MDs will be asked to enhance the presentation of KPIs. Further build the Board’s understanding of technology developments, including AI and cybersecurity • The Board will hold further deep dives during the year into technology developments applicable to our business, including AI and cybersecurity. 2024 evaluation recommendations and progress made during 2025 Oversight of performance and progress by region • The Board continued to focus on its oversight of the regions this year. Board papers were developed to include further operational metrics and business performance against plan and prior year. Further build the Board’s understanding of customers and competitor strategy • The Board held a deep dive into lead generation, customers, and competitors, as part of its strategy session. Board succession planning and talent development • The Board welcomed two new Non-Executive Directors, Leanne Sheraton and Sam Mitchell, in 2025. • The Nomination Committee reviewed the depth of talent for succession planning in key roles across the business. Location and scheduling of Board meetings • The Board held two meetings in North America in 2025, to allow for further engagement with the North America Leadership Team. Director evaluation Evaluation of individual Director performance was carried out by the Chair. The reviews are used to inform the recommendation to shareholders for the re-election of Directors at the AGM. In the Chair’s one-to-one discussions with each Director, topics covered included: • Their performance and individual effectiveness, including their contributions to Board and Committee meetings; • Their time commitment and external appointments; • The Board’s composition and balance of skills, including Non-Executive Director succession plans; and • The overall effective functioning of the Board. The review of the performance of the Chair was led by John Pettigrew, Senior Independent Director. John sought feedback in one-to-one discussions with Non-Executive Directors, without the Chair present, and also took into account the views of the Executive Directors. The feedback was collated and shared with the Chair. Executive Directors are subject to regular review, with the Chief Executive appraising the performance of the Chief Financial Officer as part of the annual Group-wide performance evaluation of all colleagues. The Chair evaluates the performance of the Chief Executive as part of the same process. The Remuneration Committee also reviews Executive Director performance as part of its discussions on remuneration, including bonus payments. The Nomination Committee takes the outcome of these evaluation processes into account each year in order to inform the Nomination Committee’s recommendation for Board members to be put forward for re-election by shareholders. All Directors were deemed to be effective members of the Board and are recommended for re-election at the Company’s AGM. Our Governance continued 90 Rentokil Initial plc Annual Report 2025 |
|
The Board monitors the Group’s performance against its strategy, as defined at the annual strategy review sessions, throughout the year. Strategy updates provided to the Board include reports by the Chief Executive at each scheduled Board meeting, which among other things include an overview of health and safety results, information on our financial and non-financial key performance indicators (KPIs), an update on M&A activity, external insights (including media commentary), and a summary of people matters. The Board also receives performance management reports from the Chief Financial Officer, which include an overview of financial and operational business performance, an update on investor relations, and the outcome of regional business and functional reviews. The Board’s annual strategy session was held over two days in October and November and gave the Board the opportunity to conduct a comprehensive review of the Group’s strategic plan. The event was designed to provide a comprehensive review of the key immediate priorities that would shape the Group’s future success. The acceleration of growth in the North America business was considered, as well as the evolution of our technology strategy, with a particular focus on AI and data. The presentations on our North America business included an update on our growth model for North America, the RIGHT WAY 2 plan. There was a deep dive on lead generation and the acquisition and retention of customers as part of the ‘Drive to 85’ customer retention initiative. The Board also received an update on the Terminix integration, with a focus on priorities and next steps. The presentations on our International business included an overview of the Pest Control and Hygiene & Wellbeing markets, the structure of the international business, and a deep dive into the Group’s innovations. The Board also received a corporate finance update, which focused on our M&A activity, and a financial update on the medium-term strategic plan. During 2025, the Board undertook regional deep dives with the management teams for the North America, Latin America, Asia & MENAT, and UK & Sub-Saharan Africa regions. These sessions provide an overview of operational performance and future strategy for the relevant region, and highlight specific areas of progress or challenge. They also allow the Board the opportunity to gain further knowledge and engage with the leadership team in the region on particular areas of focus. The deep dive for North America took place in Miami in June 2025. The Board reviewed the performance of the business, with a particular focus on growth and performance drivers in the region. They also considered potential strategic opportunities, including benchmarking against our key competitors. Following the presentations, the Board joined the North America management team for dinner. In July and December, the Board considered the Group’s sustainability strategy, including the steps being taken towards achieving the net zero target by 2040 (see the Responsible Business section on pages 48 to 65 for more information). In June, the Board received an update on the Investor Relations function, including the composition of the Company’s share register and planned investor engagement activities. The Board also discussed the Company’s ADR programme and the key areas of focus for investors. Customer and supplier contracts over an agreed threshold are also reviewed and approved by the Board. In 2025, this included a vehicle supply contract. Board activities 2025 In order to discharge responsible leadership and optimise the breadth of Board oversight, the Board conducts discussions at formal meetings facilitated by carefully structured agendas which are agreed in advance with the Chair, in conjunction with the Chief Executive and Group General Counsel & Company Secretary. A review of safety, health, and environment performance is the first item on the agenda at scheduled meetings. The Chairs of our Board Committees also provide verbal reports on the proceedings of those meetings, highlighting key discussion points and particular concerns for the Board’s attention. Other standing agenda items comprise reports on operational and financial performance, and legal and governance updates. Details of the key matters receiving Board attention at meetings in 2025 are set out below. As an acknowledgement of the value of understanding the views of our stakeholders and their importance in the ability to deliver our strategy and purpose, the Board takes into account the Group’s key stakeholders and their diverse perspectives as part of the Board’s discussions. Examples of this approach in relation to certain principal decisions taken by the Board during the year can be found on page 94. Colleagues Shareholders Customers Communities Suppliers Key to stakeholder groups: Strategy ENABLING EFFICIENCY THROUGH AI At the annual strategy session, the Board conducted a comprehensive review of the Group’s technology roadmap, specifically focusing on AI as a primary enabler for operational efficiency. This review emphasised the critical importance of establishing a trusted single source of truth through modernised data foundations and a global governance framework to ensure the responsible and ethical deployment of AI technologies across all our regions. We scrutinised specific high-impact initiatives, including the rollout of an AI agent platform designed to automate complex administrative workflows, and evaluated our transition towards becoming an ‘AI First’ enterprise. North America Accelerate profitable growth in North America. M&A Accelerate growth through targeted M&A. International Pest Control Invest in innovation and digital to grow International Pest Control. Organisation Build a high-quality service company through investment in colleagues and technology. Hygiene & Wellbeing Deliver operational excellence in global Hygiene & Wellbeing. Financial Focus on efficiency, cash flow and disciplined capital allocation. Strategic priorities key: Rentokil Initial plc Annual Report 2025 91 Strategic Report Corporate Governance Financial Statements Other Information |
|
A review of safety, health, and environment (SHE) performance is the first item on the agenda of each scheduled Board meeting – a practice mirrored at our ELT meetings. The Board receives updates from management on health and safety performance, including KPIs, and consideration of any major incidents during the period, identifying any root causes and actions or learnings as a result. Further details on colleague safety can be found in the Responsible Business section on page 50. An update on the Group’s Lost Time Accident and Working Days Lost KPIs (see page 22) is provided in each SHE presentation to the Board. In addition, twice a year, the Board reviews our SHE leading indicators. There are three leading indicators that focus on our more hazardous activities, such as fumigation, which are consistently measured across the Group, and two leading indicators that focus on compliance with key safety training. Throughout the year, the Board discussed the Group’s broader sustainability strategy, including the environmental initiatives in progress across the Group. The Board also considered updates on the stakeholder landscape from an ESG perspective and ESG reporting requirements. We continued to prepare the Group for enhanced reporting required under global and national climate-related standards (see the Responsible Business section on page 65 for more information). During the year, the Board received updates from the Group HR Director on colleague retention, workforce engagement, and culture. This included an overview of the external employment landscape, an update on our Employer of Choice programme, and a summary of the enhancements being made to the Group’s talent and career development initiatives. In December, the Board also received a summary of the key findings from our colleague survey, Your Voice Counts (YVC). The survey, which is undertaken every two years, is one of the principal methods for both senior management and the Board to understand the main areas of focus for our people, and to identify potential opportunities for improvement. During the year, the Board oversaw a number of changes to its composition and also to senior management. Paul Edgecliffe-Johnson succeeded Stuart Ingall-Tombs as the Chief Financial Officer in January 2025 and Sam Mitchell and Leanne Sheraton joined the Board as Non-Executive Directors in July 2025. Succession planning for the North America leadership team continued to be a major focus during the year, with Alain Moffroid succeeding Brad Paulsen as Interim CEO, North America, in January 2025. In March 2026, the Board approved the Company’s Gender Pay Report as required by the Equality Act 2010 (Gender Pay Gap Information) Regulations 2017 (see page 51 for more information). We are also making progress in building our female representation in senior management roles. Safety, health, and environment People Governance and compliance The Board received recommendations from the Nomination Committee on the appointment or reappointment of Directors during 2025, including the appointment of Leanne Sheraton and Sam Mitchell as Non-Executive Directors, as set out on page 109. The Board reviews its effectiveness annually, and in 2025, work was undertaken to progress the actions identified from the previous internal review in 2024. The 2025 review was internally facilitated, by means of a questionnaire, with the themes discussed and the actions arising from that review were agreed at the Board meeting in March 2026. Read more on page 90. Governance procedures and practices are closely monitored by the Board, which also has oversight of forthcoming governance developments and regulatory changes, supported by biannual briefings from the Group General Counsel & Company Secretary. In 2025, the Board spent time considering the changes to the revised UK Corporate Governance Code, in particular Provision 29. Other updates provided to the Board related to climate reporting, the UK Listing Rules, and SEC rules. In December, the Board noted the revision of various key Group policies and approved the Group Authority Schedule, and an updated schedule of governance procedures and practices, and reviewed and approved the Committees’ terms of reference. Our Governance continued NURTURING OUR CULTURE The Board’s review of the Group’s culture and workforce engagement centred on the results of the YVC all-colleague survey. We welcomed the high response rate of 91%, and noted that the Group’s colleague Net Promoter Score (41) remained at world-class levels. The Board focused on the regional variances, and discussed the proposed actions for addressing the colleague insights that the survey proffered. 92 Rentokil Initial plc Annual Report 2025 |
|
The Board receives updates on current M&A activity from the Chief Executive as part of his report to the Board at each scheduled meeting. Regular updates are also included on the status of the M&A pipeline. In 2025, the Group acquired 36 businesses. When a transaction is of a significant size or involves the Group entering a new territory or business line, the business case is reviewed and approved by the Board. During 2025, the Board approved one acquisition. Further details of our M&A activity can be found on page 21. Twice a year, the Board undertakes a post-investment review of acquisitions in aggregate to evaluate the performance of the total investment in acquisitions which completed in the prior 12–30 months, including the delivery against business cases and execution of integration plans. The Board operates a continuous learning model to ensure that processes, including due diligence, are refined with any learnings from previous deals. These continue to indicate ongoing rigour and aggregate performance of the M&A strategy against investment criteria and key metrics. The Board monitors its competitors on an ongoing basis through the Chief Executive’s report and Investor Relations update, with a specific discussion on our competitors also taking place as part of the Board’s annual strategy day. At each meeting, the Chief Financial Officer updates the Board on the financial performance of the Group. The Board reviews the reporting of the Group’s financial performance and approves the financial results and associated regulatory announcements. The Board assessed the viability of the Group over the next three-year period and the potential impact of the principal risks, and stress-tested financial forecasts for severe but plausible scenarios. The Board approved the Viability Statement (refer to page 76) and going concern statement. Having considered the Group’s dividend policy and the financial performance of the Group, the Board approved an interim dividend for 2025 of 4.15 cents per share and is recommending a final dividend for 2025 of 8.24 cents per share. This equates to a full-year dividend of 12.39 cents per share, an increase of 3.0% compared with 2024. The Board reviews the Group’s capital structure, including financing needs and funding, as well as capital allocation throughout the year. In February 2025, the Board approved the issuance of one and a half million ordinary shares to satisfy the 2022 Performance Share Plan awards, which vested in 2025. The Board also approved the issuance of bonds of up to $1.25 billion in order to refinance a $700 million term loan and to create headroom for general corporate purposes. Further information on the Company’s capital structure can be found on pages 221 and 222. The Board reviews the Group’s annual operating plan each year, with a draft considered in December and the final plan approved early in the following year. The Board also reviews the Company’s treasury policy and tax strategy annually. The treasury policy is designed to ensure that the Group has sufficient liquidity and manages financial risk as outlined in Note C1 to the Financial Statements on pages 181 and 182. The tax strategy is aligned to our wider business strategy, in the belief that this approach creates a responsible and sustainable tax strategy that should strengthen long-term shareholder value. The current tax strategy, which was approved in October 2025, is available on the Company’s website. Risk management and internal controls effectiveness are considered by the Board throughout the year as part of its review of business strategy and performance, and in its regular engagement and consultations with executive management. The Audit Committee and senior management also update the Board and give it assurance that risks are being identified, effectively managed, and mitigated. The Board reviewed the Speak Up process and reports received in 2025, and considered any material thematic issues identified (see page 106). The Board undertook a review of the effectiveness of the Group’s risk management and internal controls systems and found them to be effective. Further details can be found on page 121. The Audit Committee and the Board also receive quarterly updates of ongoing material litigation and claims within the Group, including periodic updates on termite damage claims by customers in North America and ongoing actions to manage this risk. Further, the Board receives an annual briefing on IT security, which this year covered the advanced methods being employed by threat actors and the training opportunities in place for colleagues to manage the current and emerging threats. Mergers and acquisitions Financial management Risk monitoring and oversight EXTENDING OUR CYBER RESILIENCE In December, the Board considered an update on the Group’s cyber security resilience, acknowledging the dual nature of emerging technologies as both a strategic opportunity and an evolving risk. We explored the rising volume and sophistication of cyber threats, and considered the continued effectiveness of the Group’s controls and technology investments. Rentokil Initial plc Annual Report 2025 93 Strategic Report Corporate Governance Financial Statements Other Information |
|
Principal decisions of the Board We consider the principal decisions of the Board to be those direct decisions taken, rather than delegated to management or a Committee of the Board (unless considered and approved in principle by the whole Board first), and which may have a potentially material impact on the Company’s strategy, a stakeholder group, or the long-term value creation of the Company. We group the Board’s principal decisions into nine categories: financial results; capital allocation; funding; strategy (including ESG strategy); M&A activity; supplier and customer contracts; Board changes; Company statements; and other matters reserved to the Board. Within these categories, some matters are considered less material or strategically significant. These business-as-usual matters include items such as the Committee’s terms of reference and the issue of new shares to satisfy our executive share plans. An overview of the Board’s activities during 2025 can be found on pages 91 to 93. This contains details of the significant decisions made during the year. In addition, examples are provided below to illustrate how the Directors have had regard to the matters set out in section 172(1)(a)–(f) of the Companies Act 2006 when making principal decisions in 2025 (these include consideration given to key stakeholders, including employees, communities, and commercial counterparties. Relevant Board papers for deliberation or decision by the Board are drafted to set out the potential impact on stakeholder groups, to aid the Board’s consideration. The section 172(1) statement can be found on page 66, with further details of the Board’s engagement with stakeholders during the year provided on pages 95 to 98. Disposal of France Workwear In May 2025, we announced that we had entered into an agreement for the intended sale of the Workwear business in France to H.I.G. Capital. The business comprised Rentokil Initial’s workwear, flat linen and clean room business in France. Long-term results The Board considered that the proposed sale of France Workwear would position the Group more clearly as a streamlined Pest Control and Hygiene & Wellbeing business, enabling the Group to effectively concentrate resources to better capitalise on the large, attractive long-term growth markets within these core areas. Colleagues The Board discussed the transition of colleagues to the new owner, and the need to ensure job security and cultural alignment. It was believed that the deal would provide additional focus and support for France Workwear, enabling the leadership team to flourish as a standalone business. Our business relationships The Board explored the transition of customers to the new owner, to ensure that service levels would be maintained. Outcome In September 2025, we announced the completion of the sale of the Workwear business in France to H.I.G. Capital for an enterprise value of €410m, on a cash-free and debt-free basis, including an earn-out of up to €30m based on the performance of the business in 2026. The proceeds of the sale were allocated in line with the balanced Rentokil Initial model, distributed towards deleveraging the balance sheet, organic growth-focused investment in the core business, and complementary bolt-on M&A activity. Appointment of Mike Duffy as Chief Executive In May 2025, we announced that Andy Ransom would be stepping down from the Board as Chief Executive on or before the 2026 AGM. The search for Andy’s successor was a significant focus for the Board and the Nomination Committee during the year, with regular calls scheduled to provide progress updates on the recruitment process. For further details on the appointment process, refer to the Nomination Committee report on page 109. Long-term results In selecting a successor to Andy, the Board sought candidates who were dynamic leaders, with a strategic growth mindset, able to drive performance and optimise results, and to build capability in order to maximise investment value and leverage scale. The Board considered that a candidate with these attributes would enable the Group to build upon the strong foundations in place to drive operational excellence, and incremental value for shareholders. Colleagues The Board was keen to ensure that the new Chief Executive would be aligned with our mission, vision and values, and able to reenforce our positive, inclusive culture. A successful leader with the ability to retain and attract top talent and inspire our colleagues. Our business relationships The Board focused on candidates with business-to-business and/or business-to-consumer knowledge and experience, who had overseen multi-site operations and route-based services. It was important that the relevant candidate would have an understanding of our business, and the priorities of our customers, to further develop continued improvements in the customer experience. Outcome In January 2026, the Board announced that Mike Duffy would be appointed as Chief Executive and an Executive Director, effective 16 March 2026. Mike joined as Chief Executive Designate on 16 February 2026, to ensure a smooth transition with Andy. The Board believes that Mike, with his proven track record of delivering profitable growth and transforming businesses, has the right skills and capabilities to enable the Group to realise its full potential over the coming years. Our Governance continued 94 Rentokil Initial plc Annual Report 2025 |
|
We recognise the importance of our stakeholders’ views and we ensure that we engage with them across the world to fully understand and act upon their issues and concerns. We approach stakeholder engagement at a global, country and local level, to enable all stakeholder groups to have access to information about our business and activities, and can identify issues important to them. We believe that, by engaging regularly with all of our stakeholders and responding to their feedback, we support the long-term sustainability of our business. We have a broad range of stakeholders who influence, or are affected by, our day-to-day activities, and have varying needs and expectations. Our aim is to develop and maintain positive and productive relationships with all our stakeholders. We identify the key stakeholders relevant to the Group’s businesses or operations as our colleagues, shareholders, customers, communities, and suppliers. The following pages provide information on our key stakeholders, including associated issues and impacts, how our businesses engage with these groups, how the Directors receive information about our key stakeholders, and some examples of engagement the Directors undertook in 2025. You can find our section 172(1) statement, which describes how the Board has regard to key stakeholders, on page 66, with examples of principal decisions taken in 2025 and the attention given to stakeholders in its considerations on page 94. Workforce engagement In assessing the Board’s engagement with the Group’s workforce, we believe our existing arrangements for workforce engagement remain appropriate, taking account of the potential methods, as set out in the UK Corporate Governance Code. Having regard to the size, distribution, and scale of our businesses and our dispersed, global workforce, we believe our framework of local and regional engagement tools, which flow up to the Board, together with supplementary individual Director engagement, remains effective. Management reports to the Board regularly on performance measures such as colleague retention, YVC survey results, and Glassdoor ratings, alongside periodic updates on culture, talent, and workforce engagement initiatives. We encourage each Non-Executive Director to engage individually with a range of colleagues. They do this by visiting technicians or customers, having discussions with relevant management teams across different regions or functions, adding visits to local Rentokil Initial operations to their other travel plans, or attending town hall sessions or management meetings. Their individual engagement activities are then discussed with the Board. We also identify ways for the Board collectively to engage with target groups across the year. The workforce engagement undertaken by the Directors allows the Board to gain a deeper understanding of how individual businesses and functions operate and the approaches taken by management, and an awareness of our culture in practice. Feedback from engagement activities is used to help determine any areas for additional strategic focus by the Board or management. Our purpose and our core values of service, relationships, teamwork, and responsibility reflect the central importance of our stakeholders to our business and influence how we engage with them. Our Stakeholders Colleagues Customers Communities Shareholders Suppliers Why we engage We deliver greater value to our business and customers, by ensuring our suppliers share our values and standards We respect, and accept our wider responsibility to, the communities in which we operate and employ We succeed or fail by the quality of service we offer our customers We aim to be a world-class Employer of Choice, and rely on the skills and commitment of our people to achieve our business goals We aim to generate long-term profitable growth to help deliver value for our shareholders Rentokil Initial plc Annual Report 2025 95 Strategic Report Corporate Governance Financial Statements Other Information |
|
Our Stakeholders continued Our colleagues are those who are directly employed by us. We currently employ c.63,400 colleagues, who operate in 90 countries. Key issues for stakeholder group • Health and safety • Training and career development • Tools to do the job • Wellbeing • Reward • Culture and values • Community support Why we engage We aim to be a world-class Employer of Choice, providing a safe working environment and career and development opportunities. We rely on the skills, experience, and commitment of our people to meet our business goals and place great importance on recruiting the best talent and developing and retaining our colleagues. Impact/value created • Pay and benefits to colleagues • Training and development opportunities • Long-term career opportunities Business engagement All colleagues are provided with information on matters of concern to them in their work, through regular briefing meetings and internal communications, as well as our internal U+ training system, which hosts both technical and leadership courses and learning, and regular briefing meetings and internal communications. Engagement events are also hosted by individual businesses and leaders, such as conferences, town halls, and senior executive updates, to inform colleagues of key factors affecting our business. Other methods include: • biennial YVC colleague survey and periodic pulse surveys; • annual personal development reviews for colleagues and line manager training; • the RIGHT WAY magazine published online quarterly; • the Speak Up ethics hotline; and • works councils, including an EU forum. Measurements We measure our impact by monitoring recruitment and retention levels (colleague retention is a key metric within our Performance Share Plan scheme (see page 123)), diversity, the results of YVC surveys, performance ratings, the amount of new U+ online training content made available and online learning views, and the talent pipeline of graduate schemes and apprenticeships. We also monitor external ratings, such as Glassdoor. Rentokil Indonesia Our Indonesia business celebrated a Rentokil 100 Years Strong Fun Walk, bringing together over 1,000 colleagues, families and partners. The 5km event blended fitness with a festive atmosphere, featuring interactive activities and a drone-captured human formation of the number ‘100’ to mark the historic milestone. RI reception at the House of Commons To commemorate Rentokil’s 100-year anniversary, a reception was held at Westminster Hall, a location of profound historical significance to the company. The event brought together members of the Board, long-standing customers, and colleagues to celebrate the preservation of the hall’s iconic medieval hammer-beam roof – a structure that survives today only because of Rentokil founder Harold Maxwell-Lefroy’s pioneering treatment for deathwatch beetles. This milestone gathering honoured both our heritage and the enduring partnerships that have defined our first 100 years. Colleagues Information flow to the Board • Health and safety reports • Monitoring KPIs, such as colleague retention • Results of YVC colleague and pulse surveys • Regional deep dive presentations • Biannual Employer of Choice update • Key management changes included in every Chief Executive report • Notification of key awards won/shortlisted • Gender Pay Report • Ethical concerns reported via the confidential reporting process, Speak Up • Modern Slavery Statement Board engagement The Board engages with a broad range of the senior management team, whether this is by joining senior management meetings or colleague events, or by colleagues attending and presenting to the Board at its meetings. Wherever possible, the Board seeks to continue this engagement outside of the boardroom via informal events such as lunches or dinners. In June, the Board had dinner with the North America management team, and on two occasions the Board had lunch with colleagues in our talent programme. The Board also had dinner with members of the Executive Leadership Team in October. The Board added an additional North America trip to their 2025 calendar, allowing for further opportunities to interact with our colleagues. The opportunity for Director engagement with other colleagues is primarily via visits to local Rentokil Initial operations, attending town hall sessions, undertaking site visits, or going on ‘ride-alongs’ with technicians. In 2025, as part of their inductions, Leanne Sheraton and Sam Mitchell joined technicians on a ‘ride-along’. Directors also have the opportunity to hold individual meetings with colleagues. The outcome from any engagement, as well as any feedback that has been received, is shared at Board meetings where appropriate. Information is shared from the Board to colleagues via established methods of colleague engagement, as described above. 96 Rentokil Initial plc Annual Report 2025 |
|
Our customers range from global food producers to hotel chains, and from industrial goods businesses and restaurants to individual residential customers. Key issues for stakeholder group • Safety • Expertise and service quality • Innovation • Digital portals • Transparency • Quality assurance and insights • Cost • Regulatory compliance • Sustainability Why we engage In a service industry, we succeed or fail by the quality of the service we offer our customers. Understanding their needs supports our product and service development, and our customer retention rates. Impact/value created • Healthier and more hygienic facilities • Regulatory compliance • Supporting customers’ own sustainability targets Business engagement We carefully manage our ongoing relationship with customers, to ensure we meet the expected level of service. This includes the provision of training for customers’ staff, as necessary. We also engage with our customers, and share our research and innovation, through: • participation in industry forums and events; • our Annual Report and industry-focused publications; and • innovation showcases. Measurements We measure our impact by monitoring our net gain and portfolio development, operating margin and density, and opportunity pipeline. We also monitor customer satisfaction through our Customer Voice Counts (CVC) survey and external ratings and measurements, such as Trustpilot. CVC is a key metric within our Performance Share Plan scheme (see page 123). Information flow to the Board • Regional deep dive presentations • CVC scores • Strategy day review – including product pipeline and innovation • Material customer contracts requiring Board approval • Monitoring external measures such as Trustpilot Board engagement The Board has the opportunity to meet customers on overseas site visits and as part of a ‘ride-along’ with technicians. Due to the highly dispersed nature of our customer base, in which the largest customer represents significantly less than 1% of revenue, we believe that the current level of engagement is appropriate, and we will continue to keep this under review. Business engagement • Institutional investor meetings • Wholesale distribution channels, such as sell side research and broker-led conferences • Investor roadshows • Ad hoc meetings with investors on specific topics, such as ESG • AGM • Correspondence with retail shareholders • Annual Report and Form 20-F • Corporate website • Results presentations • Our Responsible Business Report Measurements We measure our impact by monitoring our share price and TSR, gathering feedback at investor meetings, and reviewing analyst notes. Information flow to the Board • Chief Financial Officer report at each Board meeting includes an investor relations update • Financial performance reports • Analyst notes circulated • Presentations on market perspectives by the Company’s brokers • Feedback from investor meetings Board engagement There are a number of ways the Board engages directly with shareholders, including correspondence with investors, attendance at the Preliminary and Interim Results presentations, meetings with the Chair and the Chair of the Remuneration Committee, and the AGM. 2026 Annual General Meeting The Board values the AGM as an opportunity to engage with our shareholders and update them on the business. The 2026 AGM will be held at 2.00pm on 7 May 2026 at our offices in Compass House, Crawley, and will also be broadcast via live webcast. A separate Notice of Meeting, containing both an explanation of the items of special business and full details of how to join the meeting remotely, has been sent to shareholders and is available on our website. Our shareholders range from global investment funds and institutions based primarily in the UK, North America, and Europe, to small private investors, who are often current or former colleagues. Key issues for stakeholder group • Integration of Terminix • North America organic growth • Total Shareholder Return (TSR) • Growth in revenue and profit • Cash flow and returns, e.g. dividends • Brand and market leadership • Innovation and digital differentiation • Consistent execution of our strategy • ESG performance Why we engage We aim to generate long-term profitable growth to help deliver value for our shareholders, and want our investors and investment analysts to have a strong understanding of our business, strategy, and performance. Our investors are the owners of the business, and continued access to capital is vital to our long-term performance. Impact/value created • Earnings per share • Compounding model • Dividends • Free Cash Flow Customers Shareholders The Chair writes to key shareholders each year to offer the opportunity to engage with him ahead of the AGM. In March 2025, he wrote to our top investors, representing c.34% of the Company’s issued share capital. In response to his offer, the Chair held multiple meetings with investors. Topics covered included the integration of Terminix, sustainability and culture, management succession planning, and Board composition. The Board receives verbal updates from the Chair on meetings he has held with investors. The Chair holds meetings with large investors across the year on request. The Chair and Committee Chairs welcome any comments on this report and shareholders are invited to contact them via email at chair@rentokil-initial.com. They will also be available to answer questions at the Company’s AGM. Rentokil Initial plc Annual Report 2025 97 Strategic Report Corporate Governance Financial Statements Other Information |
|
Our communities are those who live in areas where we work, such as local residents, businesses, schools, and charities. Key issues for stakeholder group • Contribution to public health and safe environment • Jobs and investment • Environmental and societal impacts • Long-term relationships Why we engage We respect the communities in which we operate and employ people, but we also have a wider responsibility to key communities and environments around the world. We partner with charities and community initiatives in communities where we operate, and encourage a long-term partnership approach. Impact/value created • Tax paid • Charitable donations • Reduction in energy and fuel-derived emissions • Employment of people in local communities Business engagement • Sponsorship and colleague volunteering • Partnerships with schools, colleges, and universities Measurements We monitor our impact by measuring the amount of charitable cash donations made each year, our inclusion in ESG indices, and our ranking with independent organisations such as the Dow Jones Sustainability Index and Sustainalytics. Information flow to the Board • Safety, health, and environment updates • Regional deep dive presentations • Annual Report review • Responsible Business Report review • Updates on RI Cares (see page 53) • The RIGHT WAY magazine, which contains a variety of examples of the business and our colleagues engaging with the community Board engagement While communities and the environment continue to be a focus for the Board, no direct engagement took place between Directors and communities during 2025. Given the nature of our business, we believe that the indirect engagement provided is at an appropriate level and no direct Director engagement is required, and we will continue to keep this under review. More information on our responsible business priorities with regard to the environment can be found on pages 56 and 57, and with regard to communities on page 53 to 55. Our suppliers range from major manufacturers of key products and consumables to our global business, to suppliers of indirect goods and services used to support our operations. Products supplied include pest control bait, paper, soaps, and waste collection units, while indirect suppliers include technology services, fleet vehicles, and telecommunications. Key issues for stakeholder group • Long-term engagement and innovation • Pricing • Continuous improvement approach • High standards of product quality and service delivery • ESG matters, including human rights, data protection, and modern slavery • Environmental standards and improvement plans Why we engage Our major suppliers must share our corporate standards and values, as these strategic partnerships deliver significantly more value to our business and our customers. Impact/value created • Optimised supply chain from manufacturer to end customer • Joint development of bespoke products and service innovations • Efficient sourcing of proprietary products from global and local suppliers Business engagement Suppliers are classified into critical, major, and minor suppliers, to ensure that they are managed at the appropriate level. Our Supplier Code of Conduct defines the standards and values expected of our suppliers. It is available in 19 languages and signed by all critical and major suppliers. The Group Procurement team manages the relationships with critical suppliers, including comprehensive audits of their operations. Local procurement teams manage major and minor suppliers. These relationships are coordinated through the quarterly Global Procurement Forum to ensure alignment and sharing of best practice. Measurements We monitor our impact by measuring: • monthly On-Time and In-Full delivery metrics; • delivery lead times and quality complaints; • annual revenue development, product innovations, and pricing management; • supplier audit scores and ESG accreditations; and • suppliers completing our in-house training on modern slavery awareness. Information flow to the Board The Board oversees the principal engagement undertaken by operational management (especially the central procurement and supply chain function, and national procurement managers) through: • the Chief Executive report at each Board meeting, which includes commentary as to the supplier discussions held with the ELT; • review and approval of our major supplier contracts; • approval of our Modern Slavery Statement; and • oversight of the Supplier Speak Up ethical reporting process. Board engagement Given the nature of the business, we do not expect our Directors to have any direct engagement with our suppliers. They instead rely on the indirect engagement methods set out above. Communities Suppliers Our Stakeholders continued Rentokil Initial Chile celebrates World Environment Day In celebration of World Environment Day, Rentokil Initial Chile launched a nationwide environmental campaign across all 14 branches. Engaging over 600 employees, the initiative combined education with direct action, including a national training programme and a family trekking event that cleared 350kg of waste from natural reserves. The campaign also featured ‘Ecobattle’, an internal recycling challenge that recovered over 500kg of plastic bottles, and sustainability projects such as indoor air-purifying plants and a new vegetable garden at our Chile headquarters. 98 Rentokil Initial plc Annual Report 2025 |
|
Audit Committee Report The Audit Committee continues to play a crucial role in providing all of our stakeholders with confidence in the integrity of our reporting and the effectiveness of our controls. Sally Johnson Chair of the Audit Committee Areas of focus in 2025 • Continued oversight of the Company’s SOX programme • Continued review of internal and external audits • Continued oversight of fraud risk and controls • Cyber security • Oversight of financial reporting, including the termite provision Areas of focus in 2026 • Oversight of effectiveness relating to Provision 29 of the 2024 UK Corporate Governance Code • Review of External Quality Assessment of the Internal Audit Function • Continued oversight of the Company’s SOX programme • Continued review of internal and external audits • Fraud control oversight Committee members: Sally Johnson (Chair) John Pettigrew Linda Yueh Sam Mitchell (from 1 June 2025) In this report: • Significant issues and judgements – page 102 • External audit – pages 103 and 104 • Internal audit – page 104 • Risk management and internal control – pages 105 and 106 Dear Shareholder I am pleased to present the Audit Committee Report for the year ended 31 December 2025. The Audit Committee’s extensive agenda included our usual activity relating to financial reporting, oversight of the external audit, and oversight of risk management and internal controls. Key matters considered by the Committee during the year are set out on pages 100 and 101. As Audit Committee Chair, I have held independent meetings throughout the year with finance, legal and internal audit team members as well as the external audit partner. Members of senior management and external advisers have presented to the Audit Committee on key matters including training, regional finance matters, and cyber security. The Audit Committee has overseen good progress in the maturity of the Group’s control environment, with a continued focus on the Group’s SOX compliance. We have had regular and comprehensive updates from management on the SOX programme. PwC was reappointed as external auditor at the AGM in May 2025. In 2025, the Audit Committee continued to focus on the oversight of the quality of the external audit, including the advancement of audit technology to deliver on our 2025 audit strategy. We have completed the annual audit quality review and, alongside PwC, identified a series of actions to improve the audit process, including the enhanced use of technology and review of audit metrics. Overall, the Audit Committee concluded that the external auditor and the audit process were effective. Regular updates on the control environment are received from Internal Audit, giving the Audit Committee the opportunity to review any control incidents at each meeting. We also review major incidents reported via our internal whistleblowing process, Speak Up. The Audit Committee continues to review fraudulent activity across the Group, where we noted a number of internal frauds related to P-Card misuse by colleagues. Following full investigation of these incidents, processes have been updated and further training provided where necessary. These incidents were not material to the Group’s reporting. The Audit Committee continues to play a crucial role in providing all of our stakeholders with confidence in the integrity of our reporting and the effectiveness of our controls. In line with our commitment to manage climate change risk, we have been engaged in assessing and monitoring this risk on an ongoing basis and as part of the year-end audit report, and its disclosure in the 2025 Financial Statements. During the year, the Audit Committee was pleased to note the progress made by the Group in preparing for the implementation of Provision 29 of the 2024 UK Corporate Governance Code with effect from 2026. The Audit Committee will support the Board in making a disclosure covering the effectiveness of the Group’s internal controls in the 2026 Annual Report. Sally Johnson Chair of the Audit Committee Rentokil Initial plc Annual Report 2025 99 Strategic Report Corporate Governance Financial Statements Other Information |
|
Audit Committee Report continued The Audit Committee considered the following key areas during 2025 and early 2026: Matters considered Discussion and outcome Find out more Financial reporting Financial reporting The Audit Committee reviewed the 2024 and 2025 Annual Report and Form 20-F, and the Company’s annual and interim financial statements, and received reports from both the Group Financial Controller and the auditor on the significant financial reporting judgements relating to each statement. Financial reporting on page 102 Accounting policies and practices The Audit Committee considered the application of the Company’s accounting policies and practices. Material accounting policies on pages 153 to 155 Key accounting matters The Audit Committee considered key accounting matters, including termite damage claims and provisioning, and goodwill impairment in relation to the Company’s financial results for 2024 and 2025. Significant issues and judgements on page 102 Other financial reporting matters The Audit Committee reviewed the going concern analysis, the viability statement, and the internal control statement for recommendation to the Board. Other financial reporting matters on page 103 External audit 2024 and 2025 Financial Statements The Audit Committee received a report from PwC on the results of the audit of the 2024 and 2025 Financial Statements respectively, considering key judgements and risks. The corresponding letters of representation were also reviewed and recommended for approval to the Board. – Disclosure of information to the auditor The Audit Committee monitored the arrangements the Company has in place for disclosing all relevant information to the auditor. A formal confirmation on disclosure of information to the auditor is provided in the Directors’ Report. Directors’ Report on page 223 Oversight of the external auditor The Audit Committee reviewed the effectiveness of the oversight of the external auditor during the year in December 2025. – Effectiveness of the external auditor The Audit Committee reviewed the effectiveness of the external auditor to ensure the independence, objectivity, quality, rigour, and challenge of the audit process was maintained. The Audit Committee concluded that the external auditor and the audit process was effective. External auditor and audit process effectiveness on pages 103 and 104 External auditor reappointment The Audit Committee considered the reappointment of PwC as external auditor, including the terms and scope of the audit engagement, at its meeting in February 2025. PwC was reappointed by the Company’s shareholders at the AGM in May 2025. In March 2026, the Audit Committee recommended to the Board the reappointment of PwC as external auditor. External auditor tender and appointment on page 104 Audit objectives The Audit Committee considered an update on the key objectives to evolve the quality of the Group audit in May 2025. External audit plan and strategy on page 103 Audit strategy The Audit Committee considered the audit strategy for the 2025 audit, including the audit approach, significant risks, and areas of audit focus, scope, and level of materiality. External audit plan and strategy on page 103 in overseeing the financial affairs of substantial business undertakings, and Linda Yueh has a strong economic and academic background, with considerable experience gained in advisory roles. The Audit Committee as a whole is, therefore, considered to have competence relevant to the sectors in which the Company operates. Full biographical details of the members of the Audit Committee can be found on pages 80 and 81. The Audit Committee met formally five times during the year. Full details of the attendance of the members during 2025 can be found on page 79. Meetings of the Audit Committee are attended by the Chair of the Board, the Chief Executive, the Chief Financial Officer, the Director of Internal Audit & Risk, the Group Financial Controller, the Group General Counsel & Company Secretary (who acts as secretary to the Audit Committee), and the external auditor. The Audit Committee meets at least once per year separately with the Company’s auditor and the Director of Internal Audit & Risk, without executive management present. In 2025, the Committee met with PwC twice, and met with the Interim Director of Internal Audit & Risk once without management present. The Chair of the Audit Committee also periodically meets other relevant stakeholders. At the Board meeting following Audit Committee meetings, the Chair reports to the Board on the activity of the Audit Committee and any matters of particular relevance in the conduct of its work. Purpose and role of the Audit Committee The Audit Committee assists the Board in its oversight and monitoring of financial reporting, risk management, and internal controls. The Audit Committee’s focus is to review these areas and provide constructive challenge to management, internal audit, and the external auditors. This includes undertaking an annual review of the effectiveness of the Group’s risk management and internal control systems. The Audit Committee also oversees the relationship with the external auditors, including their appointment and the assessment of their independence and effectiveness. The full responsibilities of the Audit Committee are set out in its terms of reference, which are available on our website. The Committee’s terms of reference were last updated in December 2025. Membership and attendance All Audit Committee members are independent Non-Executive Directors. Sally Johnson, Chair of the Audit Committee, is a Chartered Accountant and in early March 2026, the Board determined that the Audit Committee met the UK and US composition requirements by virtue of Sally having recent and relevant financial experience for the purposes of the UK Corporate Governance Code, having competence in accounting and/or auditing for the purpose of the Disclosure Guidance and Transparency Rules, and being a financial expert for the purposes of the Sarbanes-Oxley Act. John Pettigrew and Sam Mitchell both have extensive commercial and operational experience Activities of the Audit Committee in 2025 100 Rentokil Initial plc Annual Report 2025 |
|
Matters considered Discussion and outcome Find out more External audit continued Non-audit services The Audit Committee reviewed and approved the non-audit services and related fees provided by the external auditor for 2025, and the policy on non-audit services. External auditor independence and objectivity on page 104 External audit fees The Audit Committee discussed and approved the fee for the 2025 audit. External auditor independence and objectivity on page 104 Internal Audit Internal Audit The Audit Committee considered the conclusions and themes emerging from Internal Audit reviews conducted during the year, and approved the Internal Audit Plan for 2026 in conjunction with the Board’s strategic review and operating plan for the year. The Audit Committee considered the Internal Audit budget and, in accordance with the Internal Audit Charter, the remuneration and tenure of the Chief Audit Executive. Internal Audit on page 104 Internal Audit investigations The Audit Committee discussed the outcome of Internal Audit investigations, including the most significant issues raised in Internal Audit reports, and received status updates on the resolution of issues raised. Internal Audit on page 104 Internal Audit Charter The Audit Committee considered and approved the Internal Audit Charter in May 2025, which was last reviewed in December 2024. Changes were made to reflect the new global standards issued by the Institute of Internal I thin. Role of Internal Audit on page 104 Effectiveness of Internal Audit The Audit Committee reviewed and confirmed the effectiveness of the Internal Audit function. Internal Audit effectiveness on page 104 Risk management and internal controls Internal control framework The Audit Committee reviewed the effectiveness of the internal control and risk management framework. Risk management and internal controls on pages 105 and 106 Control environment The Audit Committee received and reviewed matters relating to the internal control environment provided by the Director of Internal Audit & Risk, and reviewed the Group Risk Committee minutes. Risk management and internal controls on pages 105 and 106 Group risk The Audit Committee considered the Group risks and actions to enhance their measurement, monitoring, and mitigation actions, including approval of the principal risks disclosed in the 2024 Annual Report and consideration of those for the 2025 Annual Report. Principal risks on pages 68 to 75 Financial controls The Audit Committee reviewed the results of the financial controls testing carried out across the Group by the Company’s auditor, PwC. Risk and internal controls on pages 105 and 106 SOX controls The Audit Committee received regular updates on the status of the Company’s SOX programme. An in-depth review of the status of our SOX compliance for 2025 was undertaken as part of the meeting in December, including discussion as to any identified deficiencies. SOX controls on page 106 Governance and compliance Regional updates The Audit Committee received regional finance and control updates from Europe and LATAM. The reports detailed key priorities regarding people, controls and finance within those regions. See also Board activities on page 93 Tax strategy The Audit Committee considered and recommended the Group’s 2025 tax strategy for approval at its meeting in October 2025. Our tax strategy can be found on our website Litigation The Audit Committee reviewed quarterly reports of all material litigation and disputes provided by the Group General Counsel & Company Secretary. – Disclosure Committee oversight The Audit Committee received a report on the activities of the Disclosure Committee at each meeting, and reviewed and approved minor changes to the committee’s terms of reference. – Group Risk Committee oversight The Audit Committee reviewed the activities of the Group Risk Committee. – Business continuity The Audit Committee received the review of the Group’s Business Continuity Plan considered by the Group Risk Committee. – Letter of Assurance The Audit Committee considered a summary of the outcome of the annual Letter of Assurance review, noting any key exceptions provided by the senior country, regional, and functional management and any actions proposed as a result of those returns. Governance and compliance on page 105 Minimum Standard The Audit Committee reviewed compliance with the FRC Minimum Standard. FRC Minimum Standard on page 103 Terms of reference The annual review of the Audit Committee’s terms of reference was undertaken in December 2025, with amendments to further align with Provision 29 of the UK Corporate Governance Code; and consideration of the Company’s emerging and principal risks, in line with market practice. The Committee’s terms of reference can be found on our website. Audit Committee effectiveness The Audit Committee undertook its annual review of the effectiveness of the Audit Committee. Effectiveness review on page 106 Rentokil Initial plc Annual Report 2025 101 Strategic Report Corporate Governance Financial Statements Other Information |
|
Audit Committee Report continued Financial reporting The Annual Report should provide the information necessary for shareholders to assess the Company’s position, performance, and prospects and, as a whole, should be fair, balanced, and understandable. The Audit Committee considered closely the judgements and decisions taken by the management team in the preparation of the Financial Statements. The Audit Committee reviewed and recommended approval of the half-year and full-year financial statements during the year. Due to the listing of our American Depository Shares on the NYSE, the Company is also required to file a US annual report (Form 20-F), which the Audit Committee reviewed as part of its year-end process. The sections below set out the significant issues and judgements that were applied in preparing the 2025 Annual Report, as well as providing additional details on other financial reporting matters considered during the year. Significant issues and judgements The Audit Committee has reviewed the following significant financial reporting issues and judgements made during the preparation of the Financial Statements with management and the auditor. The significant areas of focus considered and actions taken are set out below. These issues have been discussed and reviewed by the Audit Committee during 2025 and early 2026, notably at the review of the interim results, at the review and agreement of the audit plan for 2025, and as part of the year-end review and approval process. Please see the section on assumptions and estimation uncertainties in Material accounting policies on page 155 for further disclosure on estimates and accounting judgements. Significant matter Action taken Goodwill impairment review The Group carries material balances for goodwill and acquired intangible assets, and due to our acquisition programme makes material additions to these balances each year. The recoverable amount of these assets is determined based on the higher of value-in-use calculations, using cash flow projections and fair value less costs to sell. Annual impairment tests are primarily based on value-in-use calculations, which require significant judgements in relation to the inputs used, including forecast growth rates, operating margins, and discount rates. Management is required to perform annual tests for impairment on indefinite-lived intangible assets and on other acquired intangible assets when there are indicators of impairment. At the start of the year, management reviewed its grouping of CGUs and its allocation of goodwill and determined that the Group now has six CGUs which are North America, UK & SSA, Europe, LATAM, Asia & MENAT, and Pacific. The Committee reviewed this change and the results of management’s impairment tests for intangible assets in December 2025 and March 2026. The intangible assets were grouped into CGUs for the purpose of assessing recoverable amounts, using cash flows based on the most recent strategic plans, as amended for any significant changes since their preparation. Cash flows were discounted using the internally calculated region-specific discount rates. The Audit Committee challenged the key judgements and assumptions used in the impairment review, including operating margins assumed in the terminal year. As a result of this review, the Committee was satisfied that the outcome and sensitivity analysis were adequately disclosed in Note B2 Intangible assets. Legacy termite damage claims provisioning As part of the acquisition of Terminix in October 2022, the Group recognised a significant provision for future termite damage claims whose liability existed at the acquisition date. Termite damage claims include judgements on the quantum, timing, and severity of claims over a multi-year period. Management continues to engage a valuation specialist to support with validation of the provision. During 2025, a new process was put in place to update the modelling on a quarterly basis to indicate changes in advance of half-year and full-year reporting. In Q3, management developed an internal model to enable the increased frequency of tracking and to run scenarios on a look-forward basis. In December 2025 and early March 2026, the Audit Committee reviewed the accounting for the legacy termite damage claim provision, including updates to the key assumptions used in the provision modelling. This included a detailed review of the change in inflation assumption used in the model as well as the treatment of non-litigated and litigated claims, and approved a number of adjustments to the provision including an increase in the long-term inflation rate as well as an additional uplift for a number of live claims. The Audit Committee also reviewed the adequacy of the sensitivity analysis on page 155 in light of the estimation and judgement involved. The Audit Committee approved the classification of movements in the provision as an adjusting item in the Group’s adjusted expenses and profit measures, in line with the Group’s policy and the previous treatment. 102 Rentokil Initial plc Annual Report 2025 |
|
Other financial reporting matters Going concern and viability statements At its meeting in March 2026, the Audit Committee considered the Group’s ability to continue as a going concern, taking into account budgets, borrowing facilities, timing of cash flows, and financial and operational risk management, before recommending to the Board that it adopt the going concern basis of preparation for the 2025 Financial Statements. At the same meeting, the Audit Committee also considered the longer-term viability of the Company, reviewing the analysis from management to support the viability statement in the 2025 Annual Report. Both going concern and viability modelled forecasts of future cash flows that included stress-testing scenarios and an analysis of other risks that could impact the viability of the business over a one-year and three-year period (2026 to 2028) respectively, and how they could be mitigated. The going concern statement for 2025 can be found on page 223 and the viability statement for 2025 can be found on page 76. Fair, balanced, and understandable reporting During 2025, the Audit Committee undertook a review of the 2024 Annual Report ahead of its publication to consider whether it was fair, balanced, and understandable as required by the UK Corporate Governance Code. A similar process was repeated for the 2025 Annual Report at the Audit Committee meeting in March 2026. The Audit Committee received a report from management summarising the process undertaken, which covered, but was not limited to, the following: • the Chief Executive provides input to agree on key elements to be included, which set the tone and balance of the Strategic Report; • all contributors to the Annual Report are made aware of the requirement for content to be fair, balanced, and understandable; • regular review meetings are held with appropriate senior management to ensure consistency of the whole document; • an extensive review and verification process is undertaken by the appropriate departments and senior managers, using verification software to test and track the accuracy of the content; and • additional independent internal reviews are undertaken to enable any perceived lack of clarity, balance, or understanding in the Annual Report to be identified and addressed. The Audit Committee was satisfied that the Annual Report provided a fair, balanced, and understandable assessment of the Company’s position and prospects. The Board’s statement on fair, balanced, and understandable in relation to the 2025 Annual Report can be found on page 224. Correspondence with regulatory bodies In October 2025, we received a letter from the FRC Corporate Reporting Review requesting additional information regarding the nature of the Group’s self-insurance provisions and other accounting observations from the 2024 Annual Report. The scope of the review was limited to the 2024 Annual Report and compliance with reporting requirements; it provided no assurance that the report was materially correct. The letter was shared with the Chair, the Audit Committee Chair and the external auditor. In November 2025, the Company provided a response letter to the FRC which explained the accounting treatments and nature of the Group’s self-insurance provisions, along with confirmation that the other observations would be taken into account when drafting the 2025 Annual Report. In December 2025, the Audit Committee reviewed a summary from management on how these points would be addressed in this Annual Report. In December 2025, the FRC requested further details on the responses, which were provided to the FRC in January 2026. Following our response letter, the FRC confirmed their review had concluded. The FRC’s expectations for 2025/2026 reports identified in its ‘Annual Review of Corporate Reporting 2024/2025’ publication were reviewed. However, no specific changes were required to the Company’s accounts as a result. FRC Minimum Standard The FRC introduced the ‘Audit Committees and the External Audit: Minimum Standard’ (the ‘Minimum Standard’) in May 2023, which operates on a ‘comply or explain’ basis. The Audit Committee considered an in-depth analysis of the new requirements in 2023 and the Committee’s terms of reference were updated as a result. The Audit Committee report, in particular the External audit section of the report, describes how the Audit Committee has complied with each of the provisions of the Minimum Standard during the year. The Audit Committee confirms that the Company has met the requirements of the Minimum Standard. External audit External auditor The external auditor is appointed to give an opinion on the Group and Company Financial Statements. The audit includes the review and testing of the data contained in the Financial Statements to the extent necessary for expressing an audit opinion as to whether they present a true and fair view of the Group and Company affairs as at 31 December 2025. PwC has been the Group’s external auditor since May 2021. PwC was reappointed by shareholders at the 2025 AGM to continue to serve as the Group’s external auditor. Neil Grimes is the Lead Audit Partner. He has been in post since PwC was appointed and will be required to rotate after five years, with the 2025 audit being his final year. A successor has been identified and has been shadowing aspects of the year-end process. The external auditor attends all meetings of the Audit Committee. The Audit Committee met with PwC twice without executive management present and met with the Audit Committee Chair independently five times in 2025. In 2025, the main engagement between the external auditor and the Audit Committee has been in relation to audit strategy, the audit and publication of annual and periodic financial statements, the auditor’s scope and priorities, and its approach to key judgement areas. PwC has also been extensively involved in discussions regarding our SOX programme and the testing of our internal controls. External audit plan and strategy In July, PwC presented the 2025 external audit plan, which summarised the key aspects of its audit planning, including the external auditor’s assessment of Group audit materiality, SOX, audit risks, and scope, and the overall approach to the audit of the Company and its subsidiaries. At the December meeting, the Audit Committee discussed with the auditor the status of its work, focusing in particular on the France Workwear disposal and the status of its SOX testing. The results of the controls testing for SOX reporting purposes were considered by the Audit Committee in March 2026, as detailed on page 106. Effectiveness, quality and performance The effectiveness of the external auditor is monitored throughout the year, including through: • FRC’s Audit Quality Inspection and Supervision report 2024/2025: The Audit Committee received a verbal update on the results of the report during the year, noting that PwC’s audit quality remains consistent, and that the firm has remained focused on continuous improvement. • Progress against external audit plan and strategy: The Audit Committee continually evaluated and monitored progress against the agreed plan, and discussed any issues or reasons for variation from the plan. • Reports to, and interaction with, the Audit Committee: At each meeting, the Audit Committee considers the work undertaken by the external auditor, its insight around key accounting and audit judgements, and the competence with which it has applied constructive challenge in dealing with management. At the year end, the Committee reviews the content of the management letter, and over the year it monitors the recommendations made by the external auditor, including progress against the recommendations. Rentokil Initial plc Annual Report 2025 103 Strategic Report Corporate Governance Financial Statements Other Information |
|
Audit Committee Report continued • Annual audit evaluation survey: A tailored online questionnaire covering the overall audit process and the structure and governance of the external audit team is used annually. The questionnaire is completed by the members of the Audit Committee, relevant country and regional Finance Directors, the Finance Leadership Team, and other key members of the Group team. The results of the survey are collated by the Chief Financial Officer, and a summary of the findings is provided to the Audit Committee and PwC. At its July meeting, the Audit Committee reviewed the results of the annual audit evaluation survey presented by the Chief Financial Officer, which highlighted an overall positive response and an improvement on the prior year. The Audit Committee noted the identified key strengths and areas for improvement which had been agreed with the external auditor. Key focus areas included leveraging technology to drive audit efficiency, and team continuity to ensure a consistent and high-quality audit delivery. Following consideration of all elements of the audit effectiveness review process, including the results of the survey, the Audit Committee confirmed it was satisfied that the external audit process provided by PwC had been delivered effectively for the 2024 financial year. A similar process will be undertaken for the 2025 financial year. External auditor independence and objectivity To safeguard the objectivity and independence of the auditor, the Company has a policy on the engagement of the auditor’s services on audit-related and non-audit services. The Audit Committee accepts that in some instances, certain work of a non-audit nature is best undertaken by the auditor. The policy sets out the nature of services that are permitted and those that are specifically prohibited. In general, permitted services would be limited to matters that are closely related to the annual audit process or where detailed knowledge of the Group is advantageous. The Audit Committee regularly reviews the amount and nature of non-audit work performed by the auditor to ensure that the auditor’s independence is not compromised. Any engagement fee on permitted services in excess of $13,000 requires the advance approval of the Chair of the Audit Committee, and any engagement fee in excess of $320,000 requires the advance approval of the Audit Committee. The Audit Committee has pre-approved permitted services, as outlined in the policy, with fees below $13,000. A copy of the current policy on the provision of non-audit services by the external auditors is available on our website. Fees payable to the external auditor in 2025 for the audit of the Parent Company and Group accounts and the audit of accounts of subsidiaries of the Group were $13m (2024: $14m). Fees for audit-related assurance services and other non-audit services incurred during the year amounted to $1m (2024: $nil). The ratio of non-audit fees to statutory audit fees for the year was therefore 0:1 (2024: 0:1). The majority of non-audit fees for 2025 related to reporting on internal financial controls. Further details on audit services can be found in Note A8 to the Financial Statements on page 164. The Audit Committee also received confirmation from PwC that it was independent and objective within the context of applicable professional standards. The Audit Committee does not believe that there is any material risk of the Company’s auditor withdrawing from the market. The controls and processes in place, as detailed above, help to ensure that the required level of independence of the auditor is maintained. External auditor tender and appointment The role of external auditor will be put out to tender at least every ten years and will be conducted by no later than 2031 in line with prevailing best practice. The last external tender was in 2020, with PwC appointed to undertake the first external audit for the year ended 31 December 2021 following its election as the Company’s auditor at the AGM in May 2021. The Company confirms its compliance with the provisions of the UK Competition & Markets Authority Order regarding statutory audit services for the financial period ended 31 December 2025. The Audit Committee concluded that it is satisfied with the objectivity and independence of the external auditor, PwC, and that the effectiveness of the external audit process was robust. As a result, the Audit Committee does not currently expect to carry out an earlier tender process and the current period remains in the best interests of the Company’s members. The Audit Committee has recommended to the Board that it seeks shareholder approval for the reappointment of PwC as the external auditor for the financial year ending 31 December 2026. Internal audit Role of Internal Audit Internal Audit provides independent and objective assurance to management, the Audit Committee, and the Board on the effectiveness of the Group’s risk management framework and internal controls. Internal Audit, which is led by the Director of Internal Audit & Risk, reports to the Chief Financial Officer and has direct lines of communication with the Chair of the Audit Committee, the Chief Executive, and the Chair of the Board, as well as to all operational and functional leaders in the business. At each meeting, an update on Internal Audit is provided, covering an overview of the work undertaken in the period, actions arising from audits conducted, the tracking of remedial actions and progress against the Internal Audit plan, and SOX compliance. The Audit Committee Chair meets independently with the Director of Internal Audit & Risk to discuss the results of the audits performed and any additional insights obtained on the risk management and control environment across the organisation. In May 2025, the Audit Committee reviewed and approved the Internal Audit Charter, which defines the purpose, authority, and responsibility of the Internal Audit function. Changes were made to reflect the new global standards issued by the Institute of Internal Auditors. The next planned review of the Internal Audit Charter will be in 2027. Internal Audit plan The 2025 Internal Audit plan was approved by the Audit Committee in December 2024. The plan is structured to align with the Group’s risk profile, control environment, and assurance arrangements. The plan for 2025 included a continued focus on SOX testing, fraud management, North America branch audits, preparation for the Internal Audit requirements under CSRD testing, and continued thematic audits. The common themes arising from the Internal Audit work during 2025 were presented to the Audit Committee in December 2025, together with recommendations to senior management to improve the controls across some processes. None of the failures identified in the control environment by Internal Audit or any of the recommendations relating to individual audits represented a systemic underlying issue. The overall work of the Internal Audit function is used by the Audit Committee and the Board in their assessment of the adequacy of the Group’s financial and operational controls environment. The Internal Audit Plan for 2026, approved by the Audit Committee in December 2025, includes system maturity, people development, and process excellence as strategic goals for the year. The plan maintains a broad mix of assurance activities to cover financial, operational, and infrastructure risks, including SOX testing, international/branch audits, and a variety of thematic audits. Internal Audit effectiveness The Audit Committee assessed the effectiveness of the Internal Audit function by reviewing its Internal Quality Assessment. This assessment, conducted anonymously by stakeholders across the Group, including business leaders and Audit Committee members, evaluated service delivery, technical proficiency, and the effectiveness of the Internal Audit plan through a series of targeted questions. The Audit Committee also ensures that an independent third-party assessment of the effectiveness and processes of the Internal Audit function is conducted at least once every five years, in line with the requirements of the Institute of Internal Auditors’ International Standards for the Professional Practice of Internal Auditing. The last assessment was undertaken in 2021 and the next one will be undertaken in 2026. 104 Rentokil Initial plc Annual Report 2025 |
|
Governance and compliance Compliance and whistleblowing The Audit Committee has responsibility for reviewing the Company’s procedures for handling compliance with our Code of Conduct and Anti-Corruption Policy, and confidential reporting (whistleblower) arrangements, known as Speak Up. The Group’s Code of Conduct, which outlines our commitment to comply with all applicable legal requirements and with high ethical standards, can be found on our website. It sets out how colleagues can seek advice and report concerns about suspected ethical or illegal misconduct policy violations. The Company uses an international confidential Speak Up email address and independent phone line to allow colleagues to report any suspected wrongdoing internally to independent senior management at Group level. The Company has also established a separate Speak Up line for suppliers and their employees or other stakeholders to report genuine concerns over malpractice, illegal acts, or failures to comply with recognised standards of ethical behaviour that they observe at any point within our global supply chain. Reported cases are monitored by Internal Audit and any potential misconduct reported is formally investigated and appropriate action taken, with the results of the investigation being reported back to the whistleblower where possible. The Director of Internal Audit & Risk provides regular updates to the Audit Committee of any control incidents. The Audit Committee also periodically reviews the communication process in place throughout the Company regarding whistleblowing and the use of Speak Up, to ensure its effectiveness and to monitor our colleagues’ understanding of the system. The Audit Committee is briefed by the Group General Counsel & Company Secretary on the outcome of the annual Letter of Assurance process whereby senior management below Executive Director level are required to confirm compliance with key Group policies, including the Code of Conduct, and the dissemination of these policies to their respective country and functional teams. An overview of exceptions reported during the process is shared with the Audit Committee, and any thematic issues raised are also shared with the Executive Leadership Team as required. Governance In 2025, the Audit Committee considered the risk review process of the Group, including the updates to the terms of reference of the Group Risk Committee, the mapping of internal controls and assurance to risk activities and the training provided to the Finance Leadership Team on changes to the framework. The Committee also reviewed proposed amendments to the policy on Provision of Non-Audit Services by the External Auditor, and the Treasury Policy. Risk management and internal control Risk management and internal control framework The Board has overall responsibility for maintaining an effective risk management and internal control framework. The Board delegates responsibility for risk management to the Audit Committee, where appropriate. The risk management and internal control framework is designed to manage and mitigate risk, rather than eliminate the risk of failure to achieve business objectives. In pursuing business objectives, internal controls and risk management can only provide reasonable, and not absolute, assurance against material misstatement or loss. The Group’s risk management structure and process is detailed on pages 68 and 69. The responsibilities of the Board, some of which it chooses to delegate to the Audit Committee, include: • review and approval of the Group’s overall strategy, which includes reviewing the risks that may prevent the Group from achieving its objectives and ensuring that these risks are mitigated or managed to an acceptable level; • regular reviews of business performance, including updates of the risks that the business is facing, and challenging management to obtain assurance that these risks are being effectively managed; • review of management’s approach to identifying and managing risk, and recommending enhancements; • evaluation of the effectiveness of internal controls, including financial, operational, and compliance controls; • evaluation of the effectiveness of internal and external audits; • delegation of authority to the Chief Executive and Chief Financial Officer to make commitments on behalf of the Company; and • the evaluation of the effectiveness of our internal controls. Risk and internal controls The identification and management of risk is integrated into the development of the Group’s strategy and the day-to-day operational execution of the strategy by the regions and business units. Ensuring that risks are identified and managed effectively is a part of every manager’s and supervisor’s job through leadership of the teams for which they are responsible. An assessment of the emerging and principal risks facing the Group, including those that would affect its business model and future performance, is carried out by the Board. The principal risks identified can be found in the Risk and Uncertainties section on pages 70 to 75. The Audit Committee receives regular reports from the Chief Financial Officer and the Director of Internal Audit & Risk on financial controls and process improvement programmes, including: • an annual report on the overall status of the control environment in the Group, including the results of testing and reports on identified areas of weakness in controls; • action plans on control environment improvements to prevent a reoccurrence, and updates on their implementation; • periodic reports from regional and Group finance executives, and Internal Audit; and • updates on the SOX implementation programme. During 2025, the Audit Committee was updated on the risk and control environment in the main businesses, as well as the Regional Finance Directors’ assessment of the quality and priorities of the Finance function in the relevant parts of the business. The Audit Committee received updates from the Europe and Latin America regions on key finance and control priorities, with other regional updates provided as part of the Board agenda. This provides a high-level insight for the Audit Committee on potential risks. PROVISION 29 In 2025, the Audit Committee considered the readiness of the Group to comply with Provision 29 of the 2024 Corporate Governance Code, which will apply to financial years beginning on or after 1 January 2026. One of the key matters that the Committee considered was the definition of materiality in order to identify which risks and associated material controls were in scope. To achieve this, the internal working group met with senior stakeholders around the business and engaged EY to complete an assessment. Management are continuing to conduct regular reviews to consider whether material controls are operating effectively, building upon the Group’s existing SOX compliance framework. The Audit Committee also updated its terms of reference to reflect the requirements of Provision 29. The Audit Committee’s terms of reference can be found on our website at rentokil-initial.com/investors/governance. Rentokil Initial plc Annual Report 2025 105 Strategic Report Corporate Governance Financial Statements Other Information |
|
During 2025, the Audit Committee also reviewed the Group’s approach to fraud risk assessment in response to the Economic Crime and Corporate Transparency Act 2023, which came into effect in September 2025. The Audit Committee continues to evaluate cyber incidents and risk throughout the year and, although there is no indication we are a specific target, we remain vigilant given both the number and sophistication of cyber attacks, with repeated distributed denial-of-service attacks and attempted ransomware incidents. Our cyber technology and resilience have continued to allow us to detect and avert complex and volatile threats before they are able to have any material impact on our operations. This is an area we will continue to prioritise and monitor as we integrate and synchronise IT capabilities across the Group. See page 93 for more information on cyber security. The Audit Committee also receives the minutes of the Group Risk Committee. The Group Risk Committee comprises key functional senior managers, and considers the risk framework and key and emerging risks. Where appropriate, items that are raised as significant or emerging issues by the Group Risk Committee are reflected in adjustments to the control environment. In 2025, some control incidents were experienced, including: • a temporary fumigation licence suspension in Fiji, which was remediated by the delivery of additional training; • P-Card misuse by colleagues in North America of immaterial scale to the Group; and • a hosting attack in the North America region of immaterial scale to the Group. No data was compromised and additional measures were introduced for enhanced visual oversight of future threats. The Audit Committee receives regular reports of matters reported via Speak Up, our internal whistleblowing process. There were 109 control incidents reported in 2025 (2024: 108). The nature of the matters reported remains similar to previous years and they principally relate to employee and employment matters, with very few relating to fraudulent activity. There were no reports made to our Supplier Speak Up line. SOX controls At each meeting in 2025, the Audit Committee received an update on the status of the Company’s SOX programme. The updates included details regarding progress against the defined plan and design effectiveness of the specific controls. The updates reviewed both business process controls and IT governance controls, as well as progress by specific processes and countries. The updates also considered testing plans, operating effectiveness results, and tracking any identified deficiencies and associated remediation plans. At the request of the Audit Committee, regular status reports were also provided outside of the scheduled meetings. An in-depth review of the status of our SOX compliance for 2025 was also undertaken at the December 2025 and March 2026 meetings, including discussion as to any identified material weakness. For the 2025 financial year, the evaluation of effectiveness of our internal controls identified no material weakness. Effectiveness of risk management and internal control framework The Board, with the support of the Audit Committee, conducted a review of the effectiveness of the system of internal control for the year ended 31 December 2025 and confirms that: • the Group has an ongoing process for identifying, evaluating, and managing the significant risks faced by the Group; • this process has been in place for the year under review and up to the date of approval of the Annual Report and Financial Statements; • the Board reviews the process regularly; and • the process operates in accordance with the UK Corporate Governance Code and the FRC Risk Management and Internal Control Guidance. Audit Committee effectiveness In 2025, a review of effectiveness of the Audit Committee was undertaken using internal questionnaires. The review concluded that the Audit Committee continues to operate effectively and is well-integrated into the Board decision-making processes. Full details of the Board evaluation review, including its outcomes and actions, are disclosed on page 90. Read the Audit Committee’s terms of reference at rentokil-initial.com/investors/governance Read our Policy on the Provision of Non-Audit Services by the External Auditors at rentokil-initial.com/investors/governance Audit Committee Report continued 106 Rentokil Initial plc Annual Report 2025 |
|
Dear Shareholder I am pleased to present to you the report of the Nomination Committee for the year ended 31 December 2025. During the year, the Nomination Committee continued to assist the Board in fulfilling its responsibilities, with a particular focus placed on Chief Executive succession and the composition of, and succession planning for, the Board, ELT, and senior management. In the early part of 2025, the Nomination Committee undertook a comprehensive recruitment process for the appointment of two Non-Executive Directors, and in May 2025 we announced the appointment of Sam Mitchell and Leanne Sheraton. The appointment of Leanne and Sam has strengthened the Board by adding recent leadership experience in North American multi-site business-to-business and business-to-consumer companies, as well as adding deep expertise in brand building, consumer marketing, and digital customer acquisition. In May 2025, we announced that Andy Ransom would be stepping down as Chief Executive on or before the 2026 AGM. The search for a new Chief Executive was a significant focus for the Nomination Committee during 2025, and regular progress calls were held to update Committee members and the Board. We were pleased to announce in January 2026 that Mike Duffy had been appointed as CEO Designate with effect from 16 February 2026 and as Chief Executive with effect from 16 March 2026. Mike brings to the Board strong leadership experience in large US businesses and a deep understanding of multi-site and route-based operations and customer acquisition strategies. You can read more about the rigorous search process undertaken by the Nomination Committee on page 109. In line with the Nomination Committee’s usual agenda, succession planning for our Executive Directors, ELT, and senior management was kept under review during the year. In December, the Nomination Committee considered detailed succession plans for key roles, which included the Group’s talent development strategy and general information on the external talent market. You can read more about succession planning on pages 109 and 110. Richard Solomons Chair of the Nomination Committee Areas of focus in 2025 • Chief Executive succession • Appointment and induction of two new Non-Executive Directors and the new Chief Financial Officer • Executive Director and senior management succession planning and talent development • Skills, knowledge, experience, and diversity of the Board Areas of focus in 2026 • Transition to, and embedding of, the new Chief Executive • Executive Director and senior management succession planning and talent development • Skills, knowledge, experience, and diversity of the Board Committee members: Richard Solomons (Chair) Brian Baldwin David Frear Sally Johnson Sarosh Mistry (until 31 July 2025) Sam Mitchell (from 1 June 2025) John Pettigrew Leanne Sheraton (from 1 June 2025) Cathy Turner Linda Yueh In this report: • Board succession planning and recruitment – page 109 • Senior management succession planning and talent development – pages 109 and 110 Nomination Committee Report The Nomination Committee continues to look at future-proofing the Company through thorough succession planning. Richard Solomons Chair of the Nomination Committee Rentokil Initial plc Annual Report 2025 107 Strategic Report Corporate Governance Financial Statements Other Information |
|
Nomination Committee Report continued Role of the Nomination Committee The Nomination Committee monitors the composition and balance of the Board and its Committees by identifying and recommending to the Board the appointment of new Directors and Committee members, and ensuring they have the appropriate balance of skills, knowledge, experience, and diversity to govern the Company in a professional, ethical, and transparent manner. The Nomination Committee also oversees talent and succession plans for members of the ELT and the Group General Counsel & Company Secretary, ensuring the development of a pipeline for the future senior management of the Group. Additionally, it plays an active role in setting and meeting diversity objectives and strategies for the Company as a whole, and has oversight of the impact of these initiatives. The full responsibilities of the Nomination Committee are set out in its terms of reference, which were last reviewed in December 2025 and are available on our website. Membership and attendance All Non-Executive Directors are members of the Nomination Committee to ensure they have a formal forum to input and help determine the composition of the Board. The Chair of the Board, Richard Solomons, chairs the Nomination Committee. The Nomination Committee met for four scheduled meetings during the year and full details of members’ attendance during 2025 can be found on page 79. Members of the Nomination Committee also held discussions as required outside of the formal meetings, including a number of unscheduled meetings to consider Chief Executive succession and the appointment of two new Non-Executive Directors. The Nomination Committee Chair will seek views in advance from any member who cannot attend a meeting and provide a briefing on outcomes. Papers and minutes of the meeting are circulated to all Nomination Committee members. The Chief Executive often attends meetings of the Nomination Committee to assist with discussions of executive succession and talent programmes, as does the Group HR Director. The Chief Executive has not participated in meetings concerning his own succession planning. External advisors may be invited to attend for all or part of any meeting, as and when appropriate and necessary. The Group General Counsel & Company Secretary acts as secretary to the Nomination Committee. Nomination Committee effectiveness The effectiveness of the Nomination Committee was considered as part of the Board effectiveness review undertaken in 2025, with the output considered and follow-up actions agreed by the Nomination Committee. The review concluded that the Nomination Committee continues to operate effectively. In 2026, the Nomination Committee will continue to focus on Executive Director and senior management succession planning, including the depth and breadth of skills in senior leaders globally. Full details of the Board evaluation review, including its outcomes and actions, are disclosed on page 90. Managing conflicts of interest The Directors have a statutory duty to avoid a situation where they have, or could have, a direct or indirect interest that conflicts or might possibly conflict with the interests of the Company. The Board is permitted, under powers from shareholders contained in the Company’s articles of association, to authorise actual or potential conflicts of interest. The Nomination Committee and Board have a procedure to manage the situation where a Director has a conflict of interest, and as part of the process the Board considers each potential conflict situation on its merits. Since the procedure was introduced, a number of potential situational conflicts arising from appointments on external boards, or through some other ongoing relationship, have been authorised after review by the Board, none of which is subject to any specific restriction or condition. The Board notes regularly the register of Directors’ conflicts of interest and the conflict authorisations which have been granted to each Director. The Nomination Committee also reviews the current schedule of authorisations to inform the assessment of the independence of Board members. You can find further details of the assessment on page 85.All authorisations given were considered to remain appropriate and none were revoked or otherwise limited. The Nomination Committee considered the following key areas during 2025 and early 2026: Matters considered Discussion and outcome Find out more Board succession The Nomination Committee considered succession plans for the Board and nominated Mike Duffy, Leanne Sheraton and Sam Mitchell for their respective appointments. See page 109 for more information Senior management succession Senior management succession was considered throughout the year, with a detailed briefing on talent and succession planning. See pages 109 and 110 for more information Terms of reference The Nomination Committee reviewed its terms of reference in December 2025. Available to view on our website Nomination Committee effectiveness The Nomination Committee undertook a review of its effectiveness. See above Director effectiveness A review of individual performance of Directors was conducted as part of the Board evaluation process. See page 90 for more information Director reappointment In early 2026, the Nomination Committee reviewed and made recommendations to the Board concerning the re-election by shareholders of Directors at the Company’s AGM. – Diversity The Nomination Committee considered diversity-related reporting and targets and reviewed the effectiveness of the Board diversity policy. Activities of the Nomination Committee in 2025 108 Rentokil Initial plc Annual Report 2025 |
|
Board succession planning and recruitment Succession planning The Nomination Committee is responsible for ensuring plans are in place for orderly succession to the Board, taking into account the challenges and opportunities facing the Company and the skills, expertise, and diversity needed on the Board in the future. A skills matrix, as detailed on page 86, is used by the Board and Nomination Committee to help identify potential areas of focus for succession planning. Accordingly, the Nomination Committee considers Non-Executive Director succession on a regular basis to ensure that changes to the Board are planned proactively. As part of this process, the Nomination Committee monitors the Non-Executive Directors’ tenure and reviews potential departure dates, assuming the relevant Directors do not serve more than nine years from their appointment date, unless in exceptional circumstances. Board recruitment and appointment procedure The Nomination Committee is responsible for ensuring there is a formal, rigorous, and transparent process in place for appointing Directors. Potential appointments are assessed with a view to ensuring the optimal composition for the Board to discharge its duties and responsibilities effectively. Candidates are considered from a diverse group of individuals whose skills and experience have been gained in a variety of backgrounds. Successful candidates have to demonstrate integrity and independence of mind and must enhance the overall effectiveness of the Board. All appointments are considered objectively and are made on merit. We support the process of appointing new Directors to the Board by using external recruitment consultants. Appointment of Non-Executive Directors As noted in last year’s report, we initiated a process to appoint at least one additional Non-Executive Director. The Nomination Committee engaged executive search agency Heidrick & Struggles to support the search. With the support of the Group HR Director, the Nomination Committee agreed a candidate brief to include experience in US network-based services industries and/or business-to-consumer digital marketing. Heidrick & Struggles conducted introductory interviews with potential candidates to evaluate their fit against the candidate brief. The Nomination Committee considered a longlist of diverse potential candidates during the early part of 2025, with shortlisted candidates subsequently meeting with the Chair and Group HR Director. Successful candidates were then interviewed by the Chief Executive, the Chief Financial Officer, the Senior Independent Director, and other members of the Board as appropriate. Full details of the preferred candidates were provided to the Nomination Committee along with feedback from the interview process. Following deliberation, the Nomination Committee recommended the appointments of Leanne Sheraton and Sam Mitchell as Non-Executive Directors, with Leanne joining the Remuneration Committee, Sam joining the Audit Committee, and both joining the Nomination Committee. Heidrick & Struggles does not have any connections with the Company or any Director that may impair its independence and is a signatory to the Enhanced Voluntary Code of Conduct for Executive Search Firms. Appointment of Chief Executive In May 2025, we announced Andy Ransom’s intention to retire by the 2026 AGM, and that the Chair was leading a search to find his successor. Executive search agencies Egon Zehnder and Heidrick & Struggles supported the search. The Nomination Committee agreed a candidate brief, by reviewing the key attributes that would be required of candidates in the context of the Company’s business, strategy and performance, and considering input received from investors in meetings with the Chair. Candidates undertook initial screening interviews by the executive search agency, with certain candidates subsequently meeting with the Chair and Group HR Director. Candidates who progressed to the next stage met with three separate Non-Executive Directors, one of whom was required to be a UK-based Director and another a US-based Director. Candidates also met with the incumbent Chief Executive and the Chief Financial Officer. Feedback on each interview was considered by the Nomination Committee in its deliberations. Preferred candidates were also assessed by Global Futures for independent insights. Shortlisted candidates were then invited to present to the Board. The Nomination Committee held regular calls throughout the process to remain appraised of developments and to input on the process and share its views. Following a rigorous process, we announced the appointment of Mike Duffy in January 2026. Mike became CEO Designate on 16 February 2026 to benefit from a transitional handover from Andy Ransom, who will remain Chief Executive until 16 March. Full details of the induction process for Mike will be included in the 2026 Annual Report. Egon Zehnder does not have any connections with the Company or any Director that may impair its independence, and is a signatory to the Enhanced Voluntary Code of Conduct for Executive Search Firms. Director reappointment In line with the UK Corporate Governance Code, Directors should offer themselves for election by shareholders at the first AGM following their appointment, and for annual re-election thereafter. The appointment letters of the Non-Executive Directors provide that their reappointment is subject to annual re-election by shareholders. The Nomination Committee provides an annual recommendation to the Board as to whether each Director should be put forward for election or re-election by shareholders at the AGM. This assessment considers the annual performance and effectiveness review, independence, tenure, and time commitment of the Non-Executive Directors. The biographies of the Board of Directors on pages 80 and 81 explain how each Director continues to contribute to the Company’s strategy and long-term success. Senior management succession planning and talent development The Board and Nomination Committee recognise that strategic, thoughtful, and practical succession planning and talent development is critical to the long-term success of the Company. The Board has ultimate responsibility for succession planning for senior management, supported by the oversight and recommendations of the Nomination Committee. The Nomination Committee undertakes to bring new challenge and oversight to the process, and to support the business strategy and operational goals in appointments. While Board approval is only required for changes to the ELT, as outlined below, the Nomination Committee also considers senior talent and succession planning below this level. The succession planning process involves the evaluation of each leadership team role along with other critical roles against whether there are successors ready now, ready in one to two years, or ready in three to five or more years, as well as identifying any emergency cover in place for those roles. Colleagues identified as successors and key talent are included in a talent pool and put through a robust development assessment and planning process where strengths and gaps are identified using, among other measures, psychometric assessments, career conversations, and a 360-degree feedback assessment. The information from this is applied to help create effective development plans, as well as to inform the content of the talent pool development sessions. The Nomination Committee kept under review the succession plans for the Chair, the Chief Executive, Chief Financial Officer and members of the ELT. Global and critical role succession was also reviewed, with an update on regional leadership succession plans provided. A deep dive took place on succession, talent and development of the North America Leadership Team. At the December meeting, the Group HR Director and Group Talent Director presented a further detailed update on the Group’s talent strategy and succession updates for key roles, including general external talent market updates. The Nomination Committee considered the progress made towards the priorities identified in relation to talent for 2025. The Company has established global, regional, and fast-track talent pools to help identify successors for key roles and to identify and accelerate the development of fast-track talent. The Board strives to familiarise itself with the senior management team, as well as colleagues identified as successors or ‘high potentials’ through its ongoing engagement programme. Rentokil Initial plc Annual Report 2025 109 Strategic Report Corporate Governance Financial Statements Other Information |
|
Nomination Committee Report continued The effectiveness of our talent development and succession planning activity is regularly monitored. In our ELT and Group Leadership Forum (GLF; our top c.100 senior management team), 80% and 82% of roles respectively have near-term successors identified. While the ELT level is slightly down from the prior year, the GLF level has improved by 4%. Director induction All new Directors receive a formal and tailored induction on joining the Board. The Chair, supported by the Group General Counsel & Company Secretary, ensures an appropriate induction is provided to each new Director. This is tailored to the role of the new Director and accounts for their existing knowledge and experience. The induction programme includes a series of meetings, beginning before the Director joins the Board and running for several months. These one-to-one meetings are arranged with the Chair and existing Non-Executive Directors, the Chief Executive and Chief Financial Officer, members of the ELT including the Group General Counsel & Company Secretary, along with other members of senior management. The new Directors are also introduced to and given access to the Company’s external advisors (auditor, legal advisors, and corporate brokers). Paul Edgecliffe-Johnson, Chief Financial Officer • Joined as CFO Designate to ensure a smooth transition from the incumbent Chief Financial Officer • Meetings with the ELT and Finance Leadership Team • Overseas visits to our offices in North America, Europe, Asia and Pacific • Meetings with the Company’s corporate brokers and relationship banks • A ‘ride-along’ with a Pest Control technician (pictured) and a tour of the Power Centre in Crawley • Meetings with key customers and suppliers • Meetings with key investors Leanne Sheraton and Sam Mitchell, Non-Executive Directors • Leanne attended the RI 100 celebration at the House of Commons (pictured), attended by long-standing clients, senior management, and colleagues from across the UK business • Leanne attended a ‘ride-along’ with a Pest Control technician and had a tour of the Power Centre in Crawley • Sam and Leanne attended a dinner with the North America Leadership Team in Miami INDUCTION HIGHLIGHTS IN 2025 SPOTLIGHT Board members also receive key Company policies and procedures and governance information, the Group structure, analysis of the Company’s key shareholders and share capital, recent analyst notes, minutes and papers from the recent Board and relevant Committee meetings, including the most recent strategy meeting, and guidance on the legal and regulatory responsibilities for a Director of a UK and US publicly listed company. Directors are also encouraged to undertake the same online induction modules as other new colleagues on our online learning and development platform (U+), on key compliance subjects such as our Code of Conduct, anti-bribery and corruption, competition law, information security and privacy, inside information, and conflicts of interest. Between 12 and 18 months after their appointment, Directors are asked to complete a questionnaire to provide feedback on the induction process. This allows us to assess the effectiveness of the induction and any training provided, to identify any areas of improvement, and to highlight any further development needs. 110 Rentokil Initial plc Annual Report 2025 |
|
Rentokil Initial plc Annual Report 2025 111 Strategic Report Corporate Governance Financial Statements Other Information (This page has been left blank intentionally.) |
|
112 Rentokil Initial plc Annual Report 2025 (This page has been left blank intentionally.) |
|
Directors’ Remuneration Report Dear Shareholder I am pleased to present to shareholders, on behalf of the Board, the Directors’ Remuneration Report for the financial year ended 31 December 2025. I hope you find the information in this report clearly explains the remuneration approach adopted and shows how it links performance to business strategy and results. The key areas of focus for the Committee included: • supporting the appointment of a new Chief Executive and agreeing the terms for the departure of the incumbent; • supporting the transition of Chief Financial Officers; • inducting new Committee member Leanne Sheraton; and • focusing on the remuneration for all colleagues as cost-of-living challenges continue to have an impact across the globe. Key decisions in 2025 Context of business performance In 2025, we made progress in resetting performance in North America. Although we still have work to do, we believe that we have the foundations in place to deliver the level of performance we expect in future years. Revenue was up 3.8% and Adjusted Operating Profit up 5.4% for the Group. This is due to the improvement in performance in North America where Organic Revenue Growth increased to 3.6% in Q4, which, combined with strong cost control, resulted in Adjusted Operating Profit being up 5.1% for 2025. The International business increased Revenue by 4.8% and Adjusted Operating Profit by 5.7%. We have continued to make progress against those areas critical for longer-term performance, including; State of Service, which maintained high performance of 98.4% in 2025; and Customer Retention, which increased from 82.1% to 82.6% over the same period (see page 23 for further information). We have also made further progress with our Employer of Choice goals (see pages 50 and 51 for further information); Colleague Retention increased from 86.3% in 2024 to 87.4% in 2025 (see page 22). Our share price finished 11.7% higher at the end of the year than at the start (share price on 31 December 2024 was 400.8p compared to 447.5p on 31 December 2025). While the recovery has been encouraging, we have more to do. Wider workforce engagement The Committee considers the wider workforce to enable understanding of the broader remuneration and related policies, and their impact. We continue to believe in and embed practices that enable all Board members to participate in and support this agenda. Engaging with the wider workforce and understanding their views was already a practice that the Board had undertaken for many years prior to the introduction of the requirements by the FRC UK Corporate Governance Code (Code), through initiatives such as Employer of Choice (see page 22 and pages 50 and 51 for more information). Salary review The CEO’s base salary was not increased in 2025, in line with his contractual terms, following the announcement of his future retirement on 7 May 2025, and it remained at £1,040,000. The CFO is not eligible for an increase until July 2026, in line with the terms agreed on his appointment. Areas of focus in 2025 • Supporting the appointment of a new Chief Executive and agreeing terms for the departure of the incumbent • Supporting the transition of Chief Financial Officers • Inducting new Committee member Leanne Sheraton Areas of focus in 2026 • Supporting the transition of Chief Executives • Reviewing the Directors’ Remuneration Policy ahead of the 2027 renewal • Ensuring pay outcomes appropriately reflect business performance, management contribution and the experience of stakeholders • Continuing to review wider workforce pay arrangements across the Group Committee members: Cathy Turner (Chair) Brian Baldwin David Frear Sarosh Mistry (stepped down 31 July 2025) Leanne Sheraton (from 1 June 2025) Linda Yueh In this report: 116 Remuneration at a glance Key headline details on performance and remuneration in 2025 118 Directors’ Annual Remuneration Report – Introduction Details of the Remuneration Committee and its activities during 2025 120 Directors’ Annual Remuneration Report – 2025 Details of Directors’ remuneration received during 2025 131 Directors’ Annual Remuneration Report – Looking forward 2026 Details of how the Directors’ Remuneration Policy will be implemented in 2026 134 Directors’ Remuneration Policy Copy of the Directors’ Remuneration Policy approved at the Company’s AGM on 8 May 2024 The Remuneration Committee plays a crucial role in ensuring we have the right Remuneration Policy in place to recruit, retain and incentivise our Executive team to achieve our business strategy, as well as ensuring pay outcomes appropriately reflect organisational performance, management contribution and the experience of stakeholders. Cathy Turner Chair of the Remuneration Committee Rentokil Initial plc Annual Report 2025 113 Strategic Report Corporate Governance Financial Statements Other Information |
|
Directors’ Remuneration Report continued Annual bonus outcome The annual bonus for Executive Directors rewards both Company and personal performance. The maximum opportunity is 225% of salary, with a maximum of 195% of salary attributed to Company performance and a maximum of 30% of salary for personal performance. The Company element is designed to reward sustainable profitable growth and Free Cash Flow to align the Executive Directors’ incentives with the Group strategy. As with all incentives across the business, the targets set continue to be stretching. The Company element of the scheme for Executives Directors operates in the same way for all managers, a population of more than 3,400 colleagues, the only difference being that some targets are aligned to their specific business area rather than being based on overall Group performance. How the scheme operates and the performance outcomes at Group level are described below. • Company performance – There are two performance gateways, which are based on profit and cash generation, and both were achieved. The level of bonus payable is then determined by three metrics: Revenue, Adjusted Operating Profit and North America Organic Revenue Growth performance. Performance was assessed against the targets, achieving 36.4% of maximum for Revenue, 65.0% of maximum for Adjusted Operating Profit and 41.4% of maximum for North America Organic Revenue Growth. It was determined that the outcome achieved in accordance with the formula was appropriate and no discretion was applied. • Personal performance – The Executive Directors are assessed on their personal performance, with the potential to achieve up to 30% of salary based on their objectives, which are measured through the Company’s performance and development review (PDR) process. The Committee has given careful consideration to the Executive Directors’ performance ratings and their overall bonus outcomes. • The Committee recognises that this has been an extremely demanding year, particularly with regard to the significant workload related to improving Organic Revenue Growth in North America, and wanted to recognise the overall progress that has been made this year. With this in mind, the CEO, Andy Ransom, has been awarded a performance rating of 5, resulting in a payment of 30% of base salary. The CFO, Paul Edgecliffe-Johnson, has also been awarded a performance rating of 5 recognising his outstanding start in the role, resulting in a payment of 30% of base salary. These assessments are set out on page 122 of the report and demonstrate the excellent personal performance both executives have delivered during a challenging year for the Company. • Total bonus outcome – The table below shows the total outcome as a percentage of base salary. See pages 121 and 122 for a breakdown of the targets and calculation as well as details of the personal performance review. Company performance Personal performance Total bonus outcome Threshold 39% 0% 39% Target 97.5% 15% 112.5% Maximum 195% 30% 225% Andy Ransom 96.5% 30% 126.5% Paul Edgecliffe-Johnson 96.5% 30% 126.5% • Bonus deferral – 50% of the bonus outcome achieved is normally deferred in shares under the Deferred Bonus Plan (DBP). These awards are subject to a three-year holding period, but are not subject to any further performance or service conditions. Due to his retirement and significant shareholding, the bonus payable to Andy Ransom will be paid fully in cash. Performance Share Plan (PSP) vesting 2022 PSP During 2025, the PSP award granted in 2022 came to the end of its three-year performance period. The vesting level of the award was dependent on six performance conditions and the vesting level of 32.6% was in line with the estimates included in the 2024 Annual Report. 2023 PSP The 2023 PSP is due to vest on 30 March 2026 and performance will be measured against six performance conditions. Based on estimates, the TSR element is not expected to vest and the vesting level of the award is expected to be 33.5%. The level of vesting is the formulaic outcome with no discretion applied. See page 123 for a breakdown. The Committee carefully considered the outcomes of the additional financial and strategic measures in the PSP to ensure that these had not been inadvertently made easier by inflationary increases or other impacts outside of management control. On this basis, the Committee concluded that the level of vesting was appropriate. The Committee also satisfied itself that there had been no windfall gains. 2025 PSP grant In March 2025, the Committee awarded the Executive Directors’ PSP awards in line with the limits approved in the Policy, with the CEO receiving an award of 375% of salary and the CFO receiving an award of 300%. See page 124 for full details. Due to the reduction in the share price since the 2024 award, the Committee carefully considered if awards should be scaled back. Following the review, the Committee determined that the awards should be made in full, as the share price at grant was not materially lower than the prior year. When the award vests, the Committee will, as usual, determine whether the formulaic outcomes reflect performance delivered and the shareholder experience over the period. Use of discretion The Remuneration Committee has exercised its discretion on executive remuneration outcomes on a consistent basis over the last few years, in order to ensure any outcome is aligned with performance. The table below shows the Committee’s use of discretion over the past five years. Year Applied to Discretion applied 2021 No discretion was applied 2022 No discretion was applied 2023 In-flight PSP awards The in-flight PSP awards were amended to ensure that the targets remain as originally intended and have not become inadvertently easier or harder as a result of the Terminix acquisition. 2024 No discretion was applied 2025 2024 annual bonus The CEO and CFO, in conjunction with the Remuneration Committee and Board, determined that no bonus should be payable for the personal element of the 2024 bonus. Discretion was applied to reduce it to zero. Strategic alignment of pay Ensuring that our remuneration supports the delivery of the business strategy is important to the Committee and this is achieved through aligning the measures used in our incentive schemes with our key strategic priorities. The Committee also ensures that the right behaviours and actions are driven from the top of the organisation by combining both financial and non-financial outcomes, for example the inclusion of colleague, customer and health, safety and environment metrics in both the personal element of the annual bonus and the PSP. The Committee also takes into consideration the wider business performance when reviewing formulaic outcomes of metrics across all incentives. Policy implementation Taking into consideration all the different elements of the Policy, and a demanding year, the Committee is comfortable that overall, the Policy operated as intended in terms of Company performance and the quantum payable to the Executive Directors for 2025. 114 Rentokil Initial plc Annual Report 2025 |
|
Director changes Paul Edgecliffe-Johnson was appointed to the Board as Chief Financial Officer on 1 January 2025. Leanne Sheraton and Sam Mitchell were appointed to the Board as Non-Executive Directors on 1 June 2025 and Leanne was appointed to the Remuneration Committee on the same date. Sarosh Mistry stepped down from the Board and the Remuneration Committee on 31 July 2025. Looking forward to 2026 Director changes and CEO transition On 13 January 2026 we announced that Mike Duffy would join the Company on 16 February 2026 and would succeed Andy Ransom as Chief Executive Officer on 16 March 2026. Andy Ransom, who is retiring, will step down from the Board on 15 March 2026. To facilitate an orderly transition, Andy is expected to remain an active employee and be available to the Company until the end of his notice period on 6 May 2026. He will be treated as a good leaver, which is the normal default treatment for retirement. This treatment was reviewed and approved by the Remuneration Committee. The arrangements are in line with our approved Remuneration Policy and further details are set out on pages 124 and 125. Mike Duffy will be based in the US and will receive his remuneration in US dollars. The Committee determined that Mike’s starting salary should be $1,600,000, reflecting his experience as a three time CEO. Mike will participate in the 2026 annual bonus and LTIP in line with the Remuneration Policy. In addition, the Company will compensate Mike for remuneration he will forfeit as a result of leaving his current role. He will be compensated for the loss of his 2025 annual bonus and long-term incentive awards forfeited. He will receive a cash payment of $398,610 in lieu of his annual bonus for 2025. In respect of his lapsed long-term incentives, he will receive three replacement awards over Rentokil Initial shares with an aggregate maximum grant date value of $3.98m, of which $2m will be subject to performance conditions relating to Rentokil Initial share price growth. All replacement awards will be subject to clawback and malus provisions. See page 125 for further information. Base salary Our annual pay review will take place mid-year and be effective from 1 July. The salary increase awarded to the CFO is expected to be 3% in line with senior leader pay increases, which will be lower than the wider workforce, as we tend to focus our pay review budgets at our frontline. The new CEO’s pay will not increase in 2026 and will next be reviewed in 2027 (see page 131 for further details). See pages 130 to 133 for further information Annual bonus The new CEO and the CFO will be eligible for a maximum opportunity of 225% of salary in line with the approved Policy. A maximum of 195% of base salary will continue to be subject to Company performance and up to 30% of base salary linked to personal performance. The Company element will be based on the achievement of Revenue, Adjusted Operating Profit and North America Organic Revenue Growth targets, and subject to the achievement of profit and cash gateways. See pages 131 and 132 for full details. Andy Ransom will also be eligible to be considered for a pro-rata bonus for 2026 (see page 124 for details). PSP grants We expect the 2026 PSP awards for the new CEO and the CFO of 375% and 300% respectively to be made during March 2026 (see page 132 for details). Andy Ransom will not be eligible for an award. Policy review 2026 will be the final year under the current Directors’ Remuneration Policy, as at the 2027 AGM we will be seeking your support for a new Policy. We will engage with leading shareholders and their representative bodies as part of developing the proposals and look forward to receiving input. Conclusion I would like to thank our shareholders for their continued support of our Policy, and its application, and our colleagues for their continued hard work and dedication to delivering improved performance. I hope you find the information in this report useful, and that it clearly explains the remuneration approach taken by the Company and enables you to understand how it links to our performance, business strategy, and results. Cathy Turner Chair of the Remuneration Committee Rentokil Initial plc Annual Report 2025 115 Strategic Report Corporate Governance Financial Statements Other Information |
|
Remuneration at a glance Components: Fixed Pay – base salary, benefits, pension Bonus Performance Share Plan (PSP) Unearned Base pay Policy summary – Increases are normally broadly in line with those awarded to the wider workforce. Adjustments to this may be made where the Remuneration Committee deems it appropriate. 2025 implementation – The base salaries were reviewed as part of the July 2025 salary review. No increases were applied. See page 120 for details. Pension Policy summary – Executive Directors may contribute to a defined contribution arrangement or receive a cash supplement in lieu of pension. Contributions are in line with the wider UK workforce, which is currently 3% of salary. 2025 implementation – The CEO and CFO contributions are in line with the wider workforce. Benefits Policy summary – The Company pays the cost of providing the benefits on a monthly, annual, or one-off basis. Benefits are determined taking into account market practice, the level and type of benefits provided throughout the Group, and individual circumstances. All benefits are non-pensionable. Benefits provided during 2025: • Car allowance • Life assurance • Family healthcare insurance • Permanent health insurance Andy Ransom Chief Executive 2025 £1,040,000 2024 £1,040,000 0% increase Andy Ransom Chief Executive 3% Pension contribution during 2025 Paul Edgecliffe-Johnson Chief Financial Officer 2025 £775,000 2024 n/a 0% increase Paul Edgecliffe-Johnson Chief Financial Officer 3% Wider workforce (UK) increases Frontline average 3-6% Other colleagues and managers 2.5-3% Senior managers 2.5% ELT 2.5% Wider workforce (UK) 3% Breakdown of Executive Directors’ total remuneration Fixed pay The table shows a comparison of the CEO’s and CFO’s total remuneration for 2025 and 2024, and shows the potential maximum that was unearned. £’000 Unearned Fixed pay Variable pay Base salary Benefits Pension Bonus PSP Total Andy Ransom Chief Executive 2025 1,040.0 19.3 31.2 1,315.8 876.9 3,283.2 2024 984.1 19.2 29.5 0 868.5 1,901.3 Paul Edgecliffe-Johnson Chief Financial Officer 2025 775.0 15.9 20.3 980.5 – 1,791.7 2024 – – – – – – Revenue Growth (at CER) +3.8% 2025 2024: +3.8% 2023: +45.8% Adjusted Operating Profit (at CER) +5.4% 2025 2024: -4.9% 2023: +57.0% Total Shareholder Return (three-year) -14.7% Estimate to 31 December 2025 (PSP performance period ends 29 March 2026) Adjusted Free Cash Flow Conversion 88.0% 1 January 2023 to 31 December 2025 Organic Revenue Growth +3.3% Cumulative average 1 January 2023 to 31 December 2025 Our performance 116 Rentokil Initial plc Annual Report 2025 |
|
Performance Share Plan 2023-2026 vesting The bar chart compares the estimated value of the 2023 PSP and value of the 2022 PSP included in the 2025 and 2024 single figures and shows how share price growth has influenced the value of the award. PSP 2023-2026 Weighting Estimated vesting level TSR 50% 0.0% Organic Revenue Growth 15% 0.0% Adjusted Free Cash Flow Conversion 15% 13.5% Sales and Service colleague retention 6.7% 6.7% Customer Voice Counts 6.7% 6.7% Vehicle fuel intensity reduction 6.7% 6.7% Total estimated vesting 33.5% PSP value (£’000) Policy summary – Bonus opportunity of 225% of base annual salary, with a maximum opportunity of 195% for Company performance and 30% for personal performance, which operate independently. 50% of bonus is normally deferred into shares, with a minimum three-year holding period. 2025 implementation – The Committee reviewed the targets set at the beginning of the year and determined that they remained suitably stretching in the context of the wider business performance, and that the outcomes were aligned with stakeholder experience. Policy summary – Award levels as a percentage of base salary are 375% for the CEO and 300% for the CFO. No more than 20% of the award will vest for meeting threshold levels of performance and 100% of the award will vest if maximum performance is achieved. There is a two-year holding period. Dividend equivalents may accrue between grant and vest date. 2025 implementation – The Committee granted the CEO and CFO awards in line with the Policy, with the CEO receiving an award of 375% of salary and the CFO receiving an award of 300%. Andy Ransom Chief Executive Bonus targets and outcomes Andy Ransom Chief Executive Company performance 96.5% / £1,003,806 Personal performance 30% / £312,000 2025 outcome 126.5% / £1,315,806 Paul Edgecliffe-Johnson Chief Financial Officer Company performance 96.5% / £748,029 Personal performance 30% / £232,500 2025 outcome 126.5% / £980,529 Andy Ransom Chief Executive Paul Edgecliffe-Johnson Chief Financial Officer Performance Share Plan Bonus Performance measures Awards are subject to the achievement of financial and strategic/ ESG targets, with specific measures and weightings set by the Remuneration Committee each year to ensure alignment with the business strategy at the time of grant. However, a minimum weighting of 75% will relate to financial (including TSR) measures. 2025 implementation – The pie chart shows the performance measures for the 2025 grant. A. 50% relative total shareholder return B. 15% Organic Revenue Growth C. 15% Adjusted Free Cash Flow Conversion D. 20% strategic/ESG measures (colleague retention, customer satisfaction, and vehicle fuel intensity) Policy maximum 375% 2024 grant 375% 2025 grant 375% Policy maximum 300% 2025 grant 300% 2025 876.9 2024 868.5 A B C D Adjusted Operating Profit Threshold Maximum (43.6% of bonus) 1,010.3 1,079.41 1,116.6 Revenue Threshold On target Maximum (43.6% of bonus) 6,832.8 6,870.49 6,970.8 North America Organic Threshold On target Maximum Revenue Growth (12.8% of bonus) 1.80% 2.30% 3.20% On target Find out more on pages 121 to 122 Find out more on page 124 Find out more on page 124 Find out more on pages 120 and 123 Rentokil Initial plc Annual Report 2025 117 Strategic Report Corporate Governance Financial Statements Other Information |
|
Directors’ Annual Remuneration Report – Introduction Introduction The Annual Remuneration Report has been split into three sections for ease of reference. This introductory section provides an overview of the Remuneration Committee and the activities undertaken during the year. The second section, from page 120, provides an explanation of how the current Directors’ Remuneration Policy was implemented in the year ended 31 December 2025 and shows the alignment between the Company’s strategy, remuneration framework, and performance, as well as the payments made to Directors during this period. The final section, from page 131, provides an overview of how the Policy is intended to be applied in 2026. For reference, a copy of the Policy approved at the May 2024 AGM is included at the end of the report from page 134. Remuneration Committee responsibilities The Remuneration Committee’s main responsibilities are developing and setting the Directors’ Remuneration Policy and overseeing its application. It determines and agrees the Policy with the Board and approves individual remuneration arrangements for the Chair, Executive Directors and members of the Executive Leadership Team (ELT). It reviews executive performance and strives to ensure that remuneration structures align the interests of management with those of shareholders and operate in the long-term best interests of the Company. The Remuneration Committee oversees contractual terms on termination affecting Executive Directors and members of the ELT and seeks to ensure that any payments made are fair both to the individual and to the Company, that failure is not rewarded and that the duty to mitigate loss is fully recognised. The Remuneration Committee also oversees the Company’s incentive schemes, including the operation and effectiveness of performance measures and targets in both the annual bonus plan and the PSP. It also lends oversight to major changes in colleague remuneration across the Group. Membership and attendance The Remuneration Committee members in 2025 were: Cathy Turner (Chair), Brian Baldwin, David Frear, Sarosh Mistry (until 31 July 2025), Leanne Sheraton (from 1 June 2025) and Linda Yueh. There were six Remuneration Committee meetings held in 2025, which was higher than the number of meetings held in 2024. This was due to additional work related to the appointment of a new Chief Executive. Details of the members of the Remuneration Committee and their attendance during the year can be found on page 79. The Group HR Director, the Group General Counsel & Company Secretary, and the Group Head of Reward also attend Remuneration Committee meetings. The Group HR Director has direct access to the Chair of the Remuneration Committee and, together with the Group Head of Reward, advises the Remuneration Committee on remuneration matters relating to Executive Directors and members of the ELT. The Company Chair also attends meetings and makes recommendations in relation to the remuneration and incentive arrangements for the Chief Executive. The Chief Executive attends meetings and makes recommendations in respect of remuneration arrangements for his direct reports. No Executive Director or member of the ELT is present when their own remuneration is under consideration. The Remuneration Committee members have a broad and diverse set of skills and knowledge that, when combined, bring the necessary level of experience and know-how to ensure that remuneration matters are dealt with in a balanced, independent, and informed manner. No member of the Remuneration Committee has any personal financial interest in the matters to be decided by the Remuneration Committee, other than as a shareholder. No member of the Remuneration Committee has any conflict of interest in carrying out their role on the Remuneration Committee arising from other directorships, nor does any member participate in any of the Company’s incentive or pension arrangements or have any involvement in the day-to-day running of the Company. In order to avoid any conflict of interest, remuneration is managed through well-defined processes, ensuring no individual is involved in the decision-making process related to their own remuneration. The Remuneration Committee also receives support from external advisors and evaluates the support provided by those advisors annually to ensure that advice is independent, appropriate, and cost-effective. Remuneration Committee effectiveness The Remuneration Committee undertook a review of its performance during the year as part of the broader Board evaluation as detailed on page 90. The review concluded that the Remuneration Committee continued to operate effectively. The findings demonstrate that Committee performance continues to be considered effective in 2025 in terms of the management of meetings, the quality of the content and information provided to the Committee from internal or external advisors, and the Committee’s work to undertake its duties. In 2025, the Remuneration Committee focussed on supporting changes to the Board, which included the appointment of the new Chief Executive, the transition of Chief Financial Officer and induction of new Committee member; Leanne Sheraton; and the ongoing integration of the Terminix acquisition, ensuring the right remuneration packages are in place to attract, motivate, and retain talent. The key area of focus for the Committee in 2026 will be supporting the transition of the Chief Executive role, reviewing the Remuneration Policy ahead of a new Policy being put to shareholder vote at the 2027 AGM, and ensuring the right remuneration packages are in place to attract, motivate, and retain talent. External advisors Material advice and/or services were provided to the Remuneration Committee during the year by Willis Towers Watson (WTW), who were appointed by the Committee on 1 September 2024 following a competitive tender process. They were retained to provide independent advice on executive remuneration matters and on the Company’s long-term incentive arrangements. WTW is a member of the Remuneration Consultants Group and adheres to its code in relation to executive remuneration consulting in the UK. Fees charged during the year for advice to the Remuneration Committee by WTW were £220,855 and were accrued on a time and materials basis. The higher fees are due to additional support provided as part of the CEO recruitment process. WTW does not have any connection with the Company or any Director that may impair their independence, and the Remuneration Committee is satisfied that the advice it receives is independent and objective. AGM voting outcomes The outcomes of the advisory vote in respect of the Directors’ Remuneration Report and the vote on the Directors’ Remuneration Policy at the 2024 AGM are shown in the tables below. Remuneration Report voting results (2025 AGM) Votes for 2,131,852,759 Percentage for 95.81% Votes against 93,234,712 Percentage against 4.19% Total votes cast 2,225,087,471 Votes withheld (abstentions) 4,680,233 Remuneration Policy voting results (2024 AGM) Votes for 2,014,400,119 Percentage for 95.07% Votes against 104,517,698 Percentage against 4.93% Total votes cast 2,118,917,817 Votes withheld (abstentions) 761,093 A vote ‘for’ includes those votes giving the Chair discretion. A vote ‘withheld’ is not classed as a vote in law and is not counted in the calculation of the proportion of votes cast for or against a resolution. 118 Rentokil Initial plc Annual Report 2025 |
|
In 2025, the Remuneration Committee considered the following key areas: Matters considered Discussion and outcome Find out more Executive remuneration Executive Director remuneration The Remuneration Committee considered and approved base salaries for 2025, bonus outcomes for 2024, bonus structure for 2025, and the 2025 PSP awards and targets for the Executive Directors, taking into consideration the wider workforce. See pages 120 to 124 for more information ELT remuneration The Remuneration Committee considered and approved base salaries for 2025, bonus outcomes for 2024, bonus structure for 2025, and the 2025 PSP awards and targets for the members of the ELT, taking into consideration the wider workforce. – 2022 Performance Share Plan (PSP) vest The Remuneration Committee approved the vesting of the 2022 PSP awards as a result of the performance measures being met at 32.6% of maximum. – 2025 PSP award The Remuneration Committee approved the PSP grant in March 2025 and its performance conditions, and subsequently noted a summary of the grants made under the PSP. See page 124 for more information PSP measures The Remuneration Committee monitored the performance status of the outstanding awards under the PSP. – 2025 annual bonus The Remuneration Committee reviewed the overall structure of the 2025 annual bonus plan for Executive Directors and ELT members. See pages 121 and 122 for more information Executive Director appointments and terminations During 2025, the Remuneration Committee approved the remuneration for the appointment of the new Chief Executive and the retirement terms for the previous incumbent. See pages 124 and 125 for more information ELT appointments and terminations During 2025, the Remuneration Committee approved the remuneration for the appointment of an Interim CEO, North America and termination terms for the previous incumbent. – Governance and oversight Share dilution limits The Remuneration Committee noted the impact of the Company’s executive share plans on share dilution limits. – Terms of reference The Remuneration Committee undertook its annual review of its terms of reference. These are available on our website Performance review The Remuneration Committee undertook its annual review of the effectiveness of the Committee. See Committee effectiveness on page 90 Corporate governance and proxy voting guidelines The Remuneration Committee received an update during 2025 on changes in corporate governance and proxy voting guidelines. – Gender Pay Report The Remuneration Committee considered and recommended the 2024 Gender Pay Report for approval by the Board in February, which was published in March 2025. Directors’ Remuneration Report The Remuneration Committee reviewed and approved the Directors’ Remuneration Report to be included in our 2024 Annual Report. Available on our website Annual planner The Remuneration Committee considered the annual planner for 2026. – The Chair of the Remuneration Committee presents a summary of material matters discussed at each meeting to the following Board meeting and minutes of the Remuneration Committee meetings are circulated to all Directors subject to suitable redaction. The Remuneration Committee reports to shareholders annually in this report and the Chair of the Remuneration Committee attends the AGM to address any questions arising. Activities of the Remuneration Committee Rentokil Initial plc Annual Report 2025 119 Strategic Report Corporate Governance Financial Statements Other Information |
|
Directors’ Annual Remuneration Report – 2025 Directors’ remuneration in the year to 31 December 2025 Single total figure for the remuneration of Executive Directors The table below has been audited. Fixed pay Variable pay Total £’000 Value of total attributed to share price growth £’000 % of total attributed to share price Year growth Base Salary £’000 Benefits £’000 Pension £’000 Total fixed pay £’000 Bonus £’000 PSP £’000 Total variable pay £’000 Andy Ransom, Chief Executive 2025 1,040.0 19.3 31.2 1,090.5 1,315.8 876.9 2,192.7 3,283.2 (325.5) −37.1% 2024 984.1 19.2 29.5 1,032.8 0.0 868.5 868.5 1901.3 (253.7) −29.2% Paul Edgecliffe-Johnson, Chief Financial Officer 2025 775.0 15.9 20.3 811.1 980.5 – 980.5 1,791.7 – – 2024 – – – – – – – – – – Notes to the table The notes below have been audited. Appointment • Paul Edgecliffe-Johnson was appointed to the board as Chief Financial Officer on 1 January 2025. Base salary • Base salary earned from 1 January to 31 December for each year. • Andy Ransom did not receive an increase in 2025, in line with his contractual terms, following the announcement of his future retirement on 7 May 2025. • Under the terms of his appointment, Paul Edgecliffe-Johnson was not eligible for an increase in 2025. Benefits • Executive Directors are provided with family health insurance, health screening, life assurance, permanent health insurance, and a car allowance. • The value of the taxable benefits includes the P11D value for health insurance and the gross cash car allowance. There were no other taxable benefits paid to Executive Directors in 2024 or 2025. • Andy Ransom received a gross car allowance of £17,720 per annum in both 2024 and 2025. Paul Edgecliffe-Johnson received a gross car allowance of £15,180 per annum in 2025. Pension • Andy Ransom and Paul Edgecliffe-Johnson received a pension contribution, in the form of a cash supplement, worth 3% of base salary in line with the UK wider workforce. • Neither Andy Ransom or Paul Edgecliffe-Johnson contributed to a Company pension scheme and they do not have any prospective benefits under a Company defined benefit scheme. Bonus • 50% of the individual’s bonus entitlement is normally awarded as deferred shares. These awards are subject to a three-year holding period, but are not subject to performance or service conditions. • For 2024, Andy Ransom did not receive a bonus, following the Committee’s application of discretion to reduce it to zero. See page 114. • For 2025 Andy Ransom received a bonus of 126.5% of salary and Paul Edgecliffe-Johnson received a bonus of 126.5% of salary. See pages 121 and 122 for details of the 2025 bonus calculation. • Due to his retirement and significant shareholding, Andy Ransom’s 2025 bonus will be paid fully in cash. Paul Edgecliffe-Johnson will have 50% of his bonus awarded as deferred shares. PSP • The 2025 single total figure includes the 2023 PSP, which is due to vest in March 2026. The value of the 2023 PSP at vest has been estimated based on the average of the Company’s share price over the last financial quarter of 2025, giving a price of 417.3p, and the anticipated performance outcomes, giving a vesting level of 33.5%. See page 123 for details. • The actual value of the 2023 PSP will be confirmed in next year’s report once the final performance outcome, the share price at the date of vesting, and the impact of dividend accrual are known. • The 2022 PSP estimate included in the 2024 single figure has been restated. The award vested at 32.6%, which was in line with the estimate provided in last year’s report. The value has been restated to reflect the actual share price at the date of vesting on 4 March 2025 of 385.1p, and the impact of dividend accrual. This has reduced the value of the PSP outcome. Value attributed to share price changes • The PSP value included in the 2025 single figure has an estimated share price decline of 154.9p per share attributed to it (estimated share price of 417.3p less share price at grant of 572.2p), which is -37.1% of the PSP value. • The PSP value included in the 2024 single figure had a share price decline of 112.5p per share (share price at vest of 385.1p less share price at grant of 497.6p), which is -29.2% of the PSP value. Single figure Share price on grant Estimated share price at vest Share price change 2023 award 2025 572.2p 417.3p -154.9p 2022 award 2024 497.6p 385.1p -112.5p • The table below summarises the value of the 2023 and 2022 PSP vests split between value attributed to performance and value attributed to share price change for Andy Ransom. • Paul Edgecliffe-Johnson was not part of these PSP grants, as they were awarded prior to his being appointed as CFO. Award Value attributed to performance £’000 Value attributed to share price change £’000 Total value of shares vesting £’000 Andy Ransom, Chief Executive 2023 1,202.3 -325.5 876.9 2022 1,122.2 -253.7 868.5 • The Remuneration Committee has not exercised discretion as a result of this share price appreciation or depreciation for either award. The total emoluments and option gains are disclosed on page 123. Malus and clawback • No malus or clawback powers were exercised during 2025. 120 Rentokil Initial plc Annual Report 2025 |
|
This section has been audited. The annual bonus plan comprises three parts: gateway measures, Company performance, and personal performance. This means that bonuses earned reflect the performance of the constituent businesses which make up the overall Group performance, as well as achievement against specific personal objectives. The gateway measures and Company performance are measured against financial targets. The Executive Directors had a maximum bonus opportunity of 195% of salary if the Company financial targets were achieved in full, and an opportunity to earn up to 30% based on personal performance, which is measured through the Group’s performance and development review (PDR) process. In total, the maximum bonus opportunity is up to 225% of salary and 50% of any bonus earned is normally deferred into shares for three years. 2025 Annual bonus outcome The Remuneration Committee reviewed the 2025 bonus plan outcome for the Group’s senior management population based on the targets set at the start of the financial year. Gateways The Profit and Adjusted Free Cash Flow gateways have to be reached before the financial performance element of the bonus can be paid. The table below shows the targets that were set for each gateway measure and the result. Target $m Result $m Profit Gateway 1,010.3 1,066.4 Adjusted Free Cash Flow Gateway 423.0 615.0 Outcome Both gateways were achieved. Company performance For 2025, the Committee decided to retain the North America Organic Revenue Growth measure first introduced in 2024. The remainder of the bonus opportunity was split equally between delivery of profit and revenue targets. The table below shows how the bonus opportunity for Company performance was split. Metric Threshold Target Maximum Profit 17.0% 42.5% 85.0% Revenue 17.0% 42.5% 85.0% North America Organic Revenue Growth 5.0% 12.5% 25.0% Company performance 39.0% 97.5% 195.0% Targets and results The tables below detail the targets set and the performance against these targets for each of the Company performance metrics. The tables also include the percentage of the maximum bonus that can be achieved for each target level and the percentage of salary payable. Revenue Threshold Target Maximum Result Targets $m 6,832.8 6,901.8 6,970.8 6,870.5 Targets as % of on-target 99% 100% 101% 99.5% % of maximum opportunity achieved 20% 50% 100% 36.4% % of base salary payable 17.0% 42.5% 85.0% 30.9% Adjusted Operating Profit Threshold Target Maximum Result Targets $m 1,010.3 1,063.5 1,116.6 1,079.4 Targets as % of on-target 95% 100% 105% 101.5% % of maximum opportunity achieved 20% 50% 100% 65.0% % of base salary payable 17.0% 42.5% 85.0% 55.2% NA Organic Revenue Growth Threshold On-target Maximum Result Targets 1.8% 2.5% 3.2% 2.3% % of maximum opportunity achieved 20% 50% 100% 41.4% % of base salary payable 5.0% 12.5% 25.0% 10.4% Outcome – Company performance The table below brings together the bonus outcomes for each element to give the total bonus payable as a percentage of the maximum opportunity and as a percentage of base salary. % of maximum opportunity achieved % of base salary payable Revenue 36.4% 30.9% Adjusted Operating Profit 65.0% 55.2% North America Organic Revenue Growth 41.4% 10.4% Bonus outcome 49.5% 96.5% The table below shows the bonus payable to the Chief Executive and Chief Financial Officer. Bonus outcome as a % of base salary Result £’000 Andy Ransom 96.5% 1,003.8 Paul Edgecliffe-Johnson 96.5% 748.0 Personal performance Structure The Executive Directors can earn up to 30% of base salary based on their personal performance against objectives measured through the Company’s PDR process. Objectives typically include areas such as people, customers, safety, systems, governance and control, and key strategic projects. The table below shows the rating scale used in the PDR and the bonus opportunity as a percentage of base salary for each rating. Performance rating and definition Meaning of definition Bonus opportunity as a % of base salary 1: Below standards required Has not delivered against performance criteria 0% 2: Development required Has met some but not all performance criteria 0% 3: Good performer Meets agreed performance 15% 4: Exceeds expectations Meets and exceeds expectations against most aspects 22.5% 5: Outstanding Outstanding achievement against all criteria 30% Results and outcome The assessment of the performance ratings, by the Chair for the Chief Executive and by the Chief Executive for the Chief Financial Officer, took into account their key achievements during 2025. The table below shows the PDR rating awarded and the bonus outcome for the personal element. PDR rating Bonus outcome as % of salary Bonus outcome £’000 Andy Ransom 5 30% 312.0 Paul Edgecliffe-Johnson 5 30% 232.5 See the tables on page 122 for details of the key achievements for the Chief Executive and Chief Financial Officer which were used to determine their performance rating, along with the Committee’s rationale. Annual bonus 2025 Rentokil Initial plc Annual Report 2025 121 Strategic Report Corporate Governance Financial Statements Other Information |
|
Directors’ Annual Remuneration Report – 2025 continued The table details the key achievements for the Chief Executive and Chief Financial Officer which were used to determine their performance rating. Strategic objectives Andy Ransom, Chief Executive Paul Edgecliffe-Johnson, Chief Financial Officer Employer of Choice • Achieved world-class performance in LTA and WDL, with LTA improving 3.4% to 0.28 and WDL improving 9.6% to 5.65. • Increased global colleague retention by 1.1% to 87.4%, service technician retention by 1.5% to 87.0%, and sales colleague retention by 0.7% to 82.1%. • 91% of colleagues participated in Your Voice Counts (YVC) and engagement and enablement levels remained stable. • YVC showed world-class levels of service advocacy – 19 points above Global Norm. • Successfully strengthened Investor Relations and FP&A teams. • Improved capability of North America finance team, enabling better quality analysis and financial control. Customer • Customer retention improved by 0.5% to 82.6% and Customer Voice Counts survey (NPS) improved strongly from 57.8 to 60.6. • State of Service was strong at 98.4%. • Customer retention improved by 0.5% to 82.6% and Customer Voice Counts survey (NPS) improved strongly from 57.8 to 60.6. Revenue • Delivered increase in Revenue of 3.8% over previous year, of which 2.6% was organic growth. • Restored Organic Revenue Growth in North America, with strong performance in the second half of 3.5%. • Over 150 satellite branches in operation, driving additional MQLs with effective ROI. • Optimised over 800 web pages for AI and local search. • Price increases delivered at above the rate of inflation. • Delivered increase in Revenue of 3.8% over previous year, of which 2.6% was organic growth. • Restored Organic Revenue Growth in North America, with strong performance in the second half of 3.5%. • Price increases delivered at above the rate of inflation. Adjusted Operating Profit • Adjusted Operating Profit (CER) was up 5.4% overall, 5.1% North America and 5.7% International business. • Adjusted Operating Margin improved by 0.3%pts to 15.5%. • Adjusted Operating Profit (CER) was up 5.4% overall, 5.1% North America and 5.7% International business. • Adjusted Operating Margin improved by 0.3%pts to 15.5%. • Identified opportunities for significant cost reductions in North America and commenced delivery in 2025. Cash and liquidity • Adjusted Free Cash Flow Conversion was 97.6%. • Delivered improved Net Debt to adjusted EBITDA of 2.6x. • Maintained a BBB rating with a stable outlook with S&P and Fitch. • Adjusted Free Cash Flow Conversion was 97.6%. • Increased Free Cash Flow by $121m to $615m due to improved performance in trading and management of working capital. • Delivered improved Net Debt to adjusted EBITDA ratio of 2.6x. • Maintained a BBB rating with a stable outlook with S&P and Fitch. M&A • 36 acquisitions completed in 2025 with revenues of c.$63m in the year prior to purchase, taking the total since 2021 to 217 acquisitions with revenues of c.$714m. • 36 acquisitions completed in 2025 with revenues of c.$63m in the year prior to purchase. Earnings and returns • ROCE for 2025 was 6.8% for the continuing group. • Continued to deliver progressive dividend policy, with dividend for the year increasing to 12.39 cents. • ROCE for 2025 was 6.8% for the continuing group. • Shareholder engagement quality has improved, driven by enhanced investor relations and external reporting that is both clearer and more concise. Total bonus outcome The table shows the total bonus outcome for each Executive Director. If a bonus is payable, 50% of the outcome achieved is normally deferred in shares under the Deferred Bonus Plan (DBP). These awards are subject to a three-year holding period, but are not subject to any further performance or service conditions. Due to his retirement and significant shareholding, the bonus payable to Andy Ransom will be paid fully in cash. £’000 Company element Personal element Total bonus outcome achieved Bonus outcome payable in cash Bonus outcome deferred in shares Total bonus outcome as % of maximum opportunity Andy Ransom Bonus payable as a % of salary 96.5% 30% 126.5% 126.5% – 56.2% Bonus payable 1,003.8 312.0 1,315.8 1,315.8 – 56.2% Paul Edgecliffe-Johnson Bonus payable as a % of salary 96.5% 30% 126.5% 63.3% 63.3% 56.2% Bonus payable 748.0 232.5 980.5 490.3 490.3 56.2% Rationale The Committee recognises that this has been an extremely demanding year, particularly with regard to the significant workload related to getting the business back on track, and wanted to recognise the excellent progress made, particularly with the delivery of results in the second half of the year. With this in mind, both the Chief Executive, Andy Ransom, and Chief Financial Officer, Paul Edgecliffe-Johnson, were awarded a performance rating of 5. The assessments are set out in the table above; they demonstrate the outstanding personal performance both executives have delivered during a challenging year for the Company and reflects the delivery of results above analyst consensus. This rating results in a bonus of 30% of salary, which equates to 13.3% of the maximum overall bonus opportunity, giving a total bonus payable of 56.2% of the maximum opportunity. Careful consideration was given as to whether or not the outcomes were reflective of overall Company performance and appropriate in the context of the experience of wider stakeholders; it was felt that they were a fair reflection and that no discretion should be applied to adjust the outcome. 122 Rentokil Initial plc Annual Report 2025 |
|
This section has been audited. The PSP is the Company’s long-term incentive plan which the Executive Directors, ELT, and more than 1,300 managers and technical experts participate in. This participation supports the delivery of the Company’s strategic priorities. The DBP is the long-term incentive plan under which 50% of any bonus payable to the Executive Directors is deferred in shares. 2023 PSP award The 2023 PSP award was subject to six performance measures detailed in the table below. Performance measures Weighting Definition Performance period Relative TSR 50% Relative TSR performance measured against a comparator group of the FTSE 350 Index, excluding financial services, property, and primary resources sectors 30/03/2023 to 29/03/2026 Organic Revenue Growth 15% Average Organic Revenue Growth over the three-year performance 01/01/2023 to 31/12/2025 Adjusted Free Cash Flow Conversion 15% Adjusted Free Cash Flow Conversion % over a three-year performance period 01/01/2023 to 31/12/2025 Sales and Service colleague retention 6.7% Average of the 2023, 2024, and 2025 annual overall Sales and Service colleague retention 01/01/2023 to 31/12/2025 Customer satisfaction 6.7% Average of the 2023, 2024, and 2025 annual CVC score over the three-year performance period based on NPS methodology 01/01/2023 to 31/12/2025 Vehicle fuel intensity 6.7% Reduction in vehicle fuel intensity across 20 key countries achieved by the end of the three-year performance period 01/01/2023 to 31/12/2025 2023 PSP vesting level The Remuneration Committee carefully considered shareholder experience when reviewing the outcomes of the annual bonus and PSP vesting level, particularly with respect to whether any downward discretion should be exercised by the Committee. On balance, the Committee decided that the formulaic outcomes take account of financial performance being below expectations, and the non-vesting of the TSR element and the reduction in share price over the period aligned the experience with shareholders over the three-year performance period. In addition, the Committee thoroughly evaluated the outcomes of the additional financial and strategic measures in the PSP to ensure that these had not been inadvertently made easier by inflationary increases or other impacts outside of management control. Following the above reviews, the Committee has not applied discretion to the estimated outcome of the vesting. Vesting is on a straight-line basis between threshold and target and between target and maximum, with the exception of TSR. No shares will vest if the performance is below the threshold for that measure. For the TSR, vesting is on a straight-line basis between median and upper quartile performance. The TSR performance period for the 2023 award is measured over a three-year period ending during the 2026 financial year. The TSR element of the award is therefore estimated using the TSR performance of the Company and comparator group to the end of December 2025. The table below summarises the outcomes for each of the performance conditions. Performance measures Threshold: 20% vesting Target: 50% vesting Maximum: 100% vesting Actual/ estimated result Vesting level Weighted vesting level Relative TSR1 Median TSR performance Straight-line vesting between threshold and maximum Upper quartile TSR performance Ranked 114 of 159 Estimate 0% Estimate 0% Organic Revenue Growth 4.5% 5.5% 6.5% 3.3% 0.0% 0.0% Adjusted Free Cash Flow Conversion 70.0% 80.0% 90.0% 88.0% 90.0% 13.5% Sales and Service colleague retention 74.5% 77.0% 79.5% 84.7% 100.0% 6.7% Customer satisfaction 47.5 49.5 51.5 53.8 100.0% 6.7% Vehicle fuel intensity 4.0% 6.0% 8.0% 13.6% 100.0% 6.7% Total 33.5% 1. This estimate will be restated in next year’s Annual Report to reflect actual performance. 2023 PSP awards vesting Andy Ransom was granted an award of shares worth 375% of base salary in March 2023. The aggregate number of shares estimated to vest in 2026 is summarised in the table below. The table also includes an estimate of the number of additional shares relating to dividends accrued throughout the performance period, which will be added to the final awards. The estimated value of the shares vesting is based on an average of the Company’s share price for the three months to 31 December 2025 of 417.3p. The Remuneration Committee has not exercised any discretion. Maximum award of shares Estimated vesting level of award Total number of shares post performance conditions Dividend equivalent shares at vest Total shares vesting Value of shares vesting £’000 Value of share vesting attributed to share price growth £’000 % of vesting value attributed to share price growth Andy Ransom 590,647 33.5% 197,866 12,261 210,127 £876.9 (£325.5) −37.1% Performance Share Plan (PSP) and Deferred Bonus Plan (DBP) awards Rentokil Initial plc Annual Report 2025 123 Strategic Report Corporate Governance Financial Statements Other Information |
|
Directors’ Annual Remuneration Report – 2025 continued PSP awards granted during the year In March 2025, the Committee awarded the Executive Directors’ PSP awards at the Policy levels, with Andy Ransom receiving an award of 375% of salary and Paul Edgecliffe-Johnson receiving an award of 300%. The number of shares that vest under the PSP will be based on the performance conditions and weightings shown in the table below. From this grant, the TSR performance period will be aligned with the other metrics and follow the financial years and will be measured over three years to 31 December 2027. In addition, when determining the level of vesting, the Remuneration Committee will also consider the underlying financial performance of the business, as well as the value added for shareholders during the performance periods, and may adjust the vesting outcome if it considers this to be appropriate. Performance measures 2025–2027 Weighting Threshold: 20% vesting¹ Target: 50% vesting¹ Maximum: 100% vesting¹ Relative TSR 50% TSR performance is median measured against the FTSE 100 Index, excluding financial services, property, and primary resources sectors Straight-line vesting between threshold and maximum Upper quartile TSR performance against the FTSE 100 Index, excluding financial services, property, and primary resources sectors Organic Revenue Growth 15% 2.75% 3.5% 4.25% Adjusted Free Cash Flow Conversion 15% 75% 85% 90% Strategic/ESG measures – Sales and Service colleague retention – Customer satisfaction 6.7% 6.7% Targets for these measures have not been disclosed as the Board believes that these measures are commercially sensitive. They will be based on straight-line vesting between threshold and target, and between target and maximum performance, which will be reported at vesting. – Vehicle fuel intensity 6.7% 4% 6% 8% 1. Of maximum opportunity. Awards to Executive Directors under the 2025 PSP are set out in the table below; the number of shares awarded are the maximum entitlements, and the actual number of shares (if any) which vest under the PSP will depend on the performance conditions being achieved as set out above. The awards granted were in the form of nil-cost options and may be exercised after vesting up to ten years from the date of grant. The PSP awards are subject to a holding period of two years, which commences from the date of vest. 2025 PSP award Participant Date of award Number of shares awarded Share price used to determine award1 Exercise price Face value of shares £’000 % of salary awarded Date of vest Performance period end Andy Ransom 11/03/2025 1,151,121 338.8p – 3,900 375% 11/03/2028 31/12/2027 Paul Edgecliffe-Johnson 11/03/2025 686,245 338.8p – 2,325 300% 11/03/2028 31/12/2027 1. The share price is the closing share price on the day prior to grant. DBP awards granted during the year The Executive Directors did not receive a bonus for 2024, therefore no grants were awarded under the DBP in 2025. Payments for loss of office This section is audited. Retirement of Andy Ransom Following the announcements of the retirement of Andy Ransom on 7 May 2025 and of the appointment of his successor, Mike Duffy, on 13 January 2026, Andy will step down from the Board of Rentokil Initial plc with effect from 16 March 2026. To facilitate an orderly transition, he is expected to remain an active employee and be available to the Company until the end of his notice period on 6 May 2026. He will be treated as a good leaver, which is the default treatment for retirement and was considered appropriate by the Remuneration Committee. His leaving terms are in line with the Directors’ Remuneration Policy and are summarised below. No discretion has been applied by the Remuneration Committee to his leaving arrangements. • Andy’s salary, pension and car allowance will be paid on a monthly basis up to the end of his notice period of 6 May 2026. In total he will receive £1,040,000, £31,200 and £17,720 respectively over the 12 months notice period. • He will continue to receive contractual benefits during his notice period, including annual leave, family medical insurance, life assurance, and permanent health insurance. • He is eligible for a bonus of a maximum of 225% of base salary for the 2025 financial year, with payment being made fully in cash. See pages 121 and 122 for further details. • He will be eligible for a bonus of a maximum of 225% of base salary for the 2026 financial year on a pro-rata basis to his leave date 6 May 2026. Any bonus payable will be subject to the achievement of performance targets and will be determined by the Remuneration Committee following the end of the 2026 financial year. Any payment due will be made in cash in March 2027. • He will not receive a Performance Share Plan (PSP) award in 2026. • His PSP awards that have vested, but are still in their holding period will be retained in full and will be released at the end of the holding period, in line with our Policy. • In line with the good leaver rules, he will retain a pro-rata of his in-flight PSP awards calculated by reference to grant date and his termination date. These awards will vest at the end of the three-year performance period, subject to the achievement of the performance conditions. Any shares that vest will remain subject to a two-year holding period from the vesting date. • His inflight Deferred Bonus Plan (DBP) awards will be retained in full and released at the end of the three-year deferral period, in line with our Policy. 124 Rentokil Initial plc Annual Report 2025 |
|
• All outstanding PSP and DBP awards will remain subject to malus and clawback and he will comply with the post-cessation shareholding requirements. • He received a contribution of £10,000 towards legal fees incurred for independent advice relating to his termination. No further payments will be made to Andy Ransom and the Remuneration Committee has not applied discretion to his leaving arrangements. Payments to past Directors This section is audited. Stuart Ingall-Tombs (Former Chief Financial Officer, departed 24 November 2025) Stuart Ingall-Tombs stepped down from the Board on 31 December 2024. He remained an active employee until 28 February 2025 and was available to the Company until the end of his notice period on 24 November 2025. He was treated as a good leaver, which is the default treatment for retirement and one the Remuneration Committee agreed was appropriate to apply. No discretion was applied by the Remuneration Committee to his leaving arrangements. Under these arrangements, the following payments were made that relate to 2025. Fixed Pay The table below outlines the base salary, benefits and pension that Stuart Ingall-Tombs received from 1 January 2025 to his retirement on 24 November 2025. Year Base Salary £’000 Benefits £’000 Pension £’000 Total fixed pay £’000 Stuart Ingall-Tombs Former Chief Financial Officer 2025 571.5 15.3 15.0 601.7 Bonus Stuart Ingall-Tombs was eligible for a pro-rata bonus whilst he was an active employee from 1 January 2025 to 28 February 2025. He has been awarded a performance rating of 3, resulting in a payment of 15% of base salary for his personal performance during this period. The table below outlines the payments received. £’000 Company element Personal element Total bonus outcome achieved Bonus outcome payable in cash Bonus outcome deferred in shares Total bonus outcome as % of maximum opportunity Stuart Ingall-Tombs Former Chief Financial Officer Bonus payable as a % of salary 96.5% 15.0% 111.5% 55.8% 55.8% 49.6% Bonus payable 102.2 15.9 118.0 59.0 59.0 49.6% PSP awards The table below outlines the payments received as a result of the 2022 PSP award vesting on 4 March 2025. This award is subject to a further two-year holding period. This award was not pro-rated as it vested whilst in employment. Maximum award of shares Vesting level of award Total number of shares post performance conditions Dividend equivalent shares at vest Total shares vesting Value of shares vesting £’000 Value of share vesting attributed to share price growth £’000 % of vesting value attributed to share price growth Stuart Ingall-Tombs Former Chief Financial Officer 331,592 32.6% 108,132 5,273 113,405 £436.7 (£127.6) −29.2% Appointment of Mike Duffy On 13 January 2026, we announced the appointment of Mike Duffy who, having joined the Company on 16 February 2026, will be appointed to the Board as Chief Executive on 16 March 2026. His remuneration has been set within the parameters of the approved Policy, and consists of: • an annual base salary of $1,600,000, which reflects his experience as a three-time CEO and aligns with the external market. He will next be eligible for a salary review in July 2027; • standard Company benefits available to all employees in the US including (but not limited to), medical insurance, life assurance, and permanent health insurance; • a maximum annual bonus opportunity of 225% of base salary, with 50% of any bonus payable subject to three years’ deferral under the Deferred Bonus Plan; • an annual award of 375% of base salary under the Performance Share Plan. He will be eligible to receive his first award in March 2026; • a requirement to build a shareholding equivalent to 400% of salary within five years of appointment and to maintain this holding for two years post-cessation. Should he not have had sufficient time to build up shares to meet the guideline, he will be required to hold the actual level of shareholding at cessation; and • a contribution of $20,000 towards legal fees incurred for independent advice relating to his appointment. • In addition, the Company will compensate Mike for certain remuneration he will forfeit as a result of leaving his current role. He will be compensated for his 2025 annual bonus and long-term incentive awards forfeited. • He will receive a cash payment in lieu of his 2025 annual bonus of $398,610. Rather than receiving a cash payment in lieu of the bonus forfeited for 2026, he will be eligible for a full year bonus for 2026 in his new role. • In respect of the long-term incentive awards he forfeits, he will receive three replacement awards over Rentokil Initial shares with an aggregate maximum grant date value of $3.98m. These awards are broken down as follows: the first award will have a grant date value of $1.26m, and the second will have a maximum grant date value of $720k. For both of these awards, half will vest two years after the relevant grant date and the other half will vest three years after the grant date. The third award will have a grant date value of $2m and will vest three years after the grant date, subject to the achievement of performance conditions related to Rentokil Initial share price growth, with significant growth required for the award to vest in full. Targets have not been disclosed as the Board believes that they are commercially sensitive. They will be reported at vesting. All replacement awards will be subject to clawback and malus provisions. Rentokil Initial plc Annual Report 2025 125 Strategic Report Corporate Governance Financial Statements Other Information |
|
Single total figure for the remuneration during 2025 of the Chair and Non-Executive Directors Chair and Non-Executive Director fees From 1 July 2025 the fees for the Non-Executive Directors were increased by 2.5% in line with the increase applied to management levels in the UK. The Chair’s fee was not increased in line with the approach taken for the Executive Directors. This followed reviews in June 2025 by the Remuneration Committee for the Chair’s fees and by the Non-Executive Directors’ Terms Committee for the Non-Executive Director fees. Both Committees were supported by the Remuneration Advisors, WTW. Position Fee policy following review Fee policy before review Chair £442,000 per annum £442,000 per annum Non-Executive Director £79,950 per annum £78,000 per annum Senior Independent Director Additional £21,320 per annum Additional £20,800 per annum Chair of Audit Committee Additional £21,320 per annum Additional £20,800 per annum Chair of Remuneration Committee Additional £21,320 per annum Additional £20,800 per annum Intercontinental travel allowance Additional £5,000 per trip Additional £5,000 per trip The table below shows the single total figure for the remuneration during 2025 of the Chair and Non-Executive Directors compared with the prior year. The Non-Executive Directors are eligible to receive an additional travel allowance fee for intercontinental travel of £5,000 per meeting. This has been included in the benefits section in the table below to differentiate it from the main fees. The table has been audited. Chair and Non-Executive Directors Fees 2025 £’000 Fees 2024 £’000 Benefits 2025 £’000 Benefits 2024 £’000 Total 2025 £’000 Total 2024 £’000 Richard Solomons 442.0 433.5 – – 442.0 433.5 Brian Baldwin1 79.0 19.5 15.0 5 94.0 24.5 David Frear 79.0 76.5 15.0 15 94.0 91.5 Sally Johnson 100.0 96.9 10.0 5 110.0 101.9 Sarosh Mistry 45.7 76.5 5.0 5 50.7 81.5 Sam Mitchell2 46.5 – 5.0 – 51.5 – John Pettigrew 99.6 96.5 10.0 – 109.6 96.5 Leanne Sheraton2 46.5 – 10.0 – 56.5 – Cathy Turner 100.0 96.9 5.0 5 105.0 101.9 Linda Yueh 79.0 76.5 10.0 5 89.0 81.5 1. Brian Baldwin was appointed to the Board on 1 October 2024. 2. Sam Mitchell and Leanne Sheraton were appointed to the Board on 1 June 2025. Directors’ shareholdings and share interests Directors’ share interests The interests of the Directors and their connected persons in the share capital of the Company as at 31 December 2025 and at 31 December 2024, or their date of appointment if later, are set out below. No Director has any beneficial interest in the shares of any of the Company’s subsidiaries. This table has been audited. Number of ordinary shares as at 31 Dec 2025 Number of ordinary shares as at 31 Dec 2024 Richard Solomons 84,900 84,900 Andy Ransom1 2,301,466 1,764,166 Paul Edgecliffe-Johnson – – Brian Baldwin2 64,600,000 64,600,000 David Frear 16,875 8,125 Sally Johnson 9,587 6,020 Sarosh Mistry 1,850 1,850 Sam Mitchell3 600 – John Pettigrew 55,000 55,000 Leanne Sheraton3 – – Cathy Turner 24,736 24,736 Linda Yueh 1,590 1,590 1. Andy Ransom has an interest in 3,519,070 vested PSP shares from the 2016, 2017, 2018, 2019, 2020, 2021, and 2022 awards and 198,620 vested DBP shares, which he has not yet exercised. These figures are not included in his beneficial interest of shares figure at 31 December 2025 above but are included in the share award table below. 2. Brian Baldwin holding is the interest beneficially owned by Trian Fund Management, L.P. 3. Sam Mitchell and Leanne Sheraton were appointed to the Board on 1 June 2025. There has been no change to the current Directors’ shareholdings between 31 December 2025 and 5 March 2026. Executive shareholdings All Executive Directors are required to hold shares equivalent in value to a percentage of their salary within a five-year period from their appointment date. The requirement for the Chief Executive is 400% of annual salary and the requirement for the Chief Financial Officer is 300% of annual salary. As of 31 December 2025, the Chief Executive substantially exceeded the minimum shareholding requirement and the Chief Financial Officer was on track to meet the shareholding requirement within five years of appointment. The table below sets out the number of shares held at 31 December 2025 by each Executive Director. Shares owned outright include those held by connected persons. This table has been audited. Directors’ Annual Remuneration Report – 2025 continued 126 Rentokil Initial plc Annual Report 2025 |
|
Shareholding requirement as a % of salary Number of shares owned outright Value of shareholding as at 31 Dec 2025¹ Shares owned outright as a % of salary Interest in PSP and DBP that are available to exercise as at 31 Dec 2025 Interest in PSP and DBP awards subject to holding period as at 31 Dec 2025 Interest in PSP awards subject to performance conditions as at 31 Dec 2025 Andy Ransom 400% 2,301,466 10,299,060 990.3% 3,063,623 851,366 2,579,671 Paul Edgecliffe-Johnson 300% – – – – – 686,245 1. The share price is based on the Company’s share price on 31 December 2025 of 447.5p. Total PSP and DBP awards held by Executive Directors The table below has been audited. Both the PSP and DBP awards granted were in the form of nil-cost options and may be exercised after vesting up to ten years from the date of grant. Date of award Share price used to determine award Scheme interest at 1 Jan 2025 Shares awarded during 2025 Shares lapsed during 2025 Dividend equivalent shares at vest2 Shares available for exercise during 2025 Dividend equivalent shares at exercise2 Shares exercised during 2025 Outstanding awards at 31 Dec 2025 Performance period end 2015 PSP Andy Ransom 31/03/2015 135.5p 883,906 – – – 883,906 80,558 964,4645 – 30/03/2018 2016 PSP1 Andy Ransom 12/05/2016 159.4p 869,324 – – – 869,324 – – 869,324 10/03/2019 2017 PSP1 Andy Ransom 31/03/2017 246.4p 562,676 – – – 562,676 – – 562,676 30/03/2020 2018 PSP1 Andy Ransom 29/03/2018 271.2p 487,350 – – – 487,350 – – 487,350 28/03/2021 Andy Ransom 14/05/2018 271.2p 121,837 – – – 121,837 – – 121,837 13/05/2021 2019 PSP1 Andy Ransom 25/03/2019 346.6p 547,805 – – – 547,805 – – 547,805 24/03/2022 2019 DBP4 Andy Ransom 25/03/2019 346.6p 74,457 – – – 74,457 – – 74,457 24/03/2022 2020 DBP4 Andy Ransom 24/03/2020 358.6p 124,163 – – – 124,163 – – 124,163 23/03/2023 2020 PSP1 Andy Ransom 08/09/2020 530.2p 276,011 – – – 276,011 – – 276,011 07/09/2023 2021 PSP1 Andy Ransom 23/03/2021 494.4p 224,321 – – – 224,321 – – 224,321 23/03/2024 Andy Ransom 18/05/2021 468.5p 71,016 – – – 71,016 – – 71,016 18/05/2024 2022 PSP3 Andy Ransom 04/03/2022 497.6p 659,415 – 444,380 16,289 231,324 – – 231,324 04/03/2025 2022 DBP4 Andy Ransom 22/03/2022 507.2p 124,211 – – 3,195 127,406 – – 127,406 22/03/2025 2023 DBP4 Andy Ransom 21/03/2023 561.0p 114,078 – – – – – – 114,078 21/03/2026 2023 PSP Andy Ransom 30/03/2023 572.2p 590,647 – – – – – – 590,647 30/03/2026 2024 DBP4 Andy Ransom 21/03/2024 471.5p 83,221 – – – – – – 83,221 21/03/2027 2024 PSP Andy Ransom 26/03/2024 463.8p 750,556 – – – – – – 750,556 26/03/2027 Andy Ransom 03/09/2024 479.6p 87,347 – – – – – – 87,347 03/09/2027 2025 PSP Andy Ransom 11/03/2025 338.8p – 1,151,121 – – – – – 1,151,121 31/12/2027 Paul Edgecliffe-Johnson 11/03/2025 338.8p – 686,245 – – – – – 686,245 31/12/2027 1. Shares held by Andy Ransom under the 2016, 2017, 2018, 2019, 2020, 2021, and 2022 PSP awards are vested but unexercised and total 2,865,003. 2. PSP awards are entitled to receive dividend equivalents in the form of shares based on dividend payments between the date of grant and vesting. These are included in the total shares at vest. The awards granted prior to 2021 are also entitled to receive dividend equivalents in the form of shares post vesting based on dividend payments between the date of vest and the date one month before exercise. These shares are applied at exercise. 3. The 2022 PSP award partially vested at 32.6%. 4. The DBP awards are subject to a three-year holding period, but are not subject to any performance or service conditions. 5. Andy Ransom exercised his 2015 PSP awards on 26 March 2025. He exercised a total of 964,464 shares, with a share price on exercise of £3.56, giving a total value on exercise of £3,436,675, which was a gain of £2,129,826 compared with the grant price value of these awards. He sold 453,914 shares at a value of £1,617,431 to cover taxes due. Rentokil Initial plc Annual Report 2025 127 Strategic Report Corporate Governance Financial Statements Other Information |
|
Remuneration in context Wider workforce remuneration policy During 2025, the Company had approximately 63,400 colleagues based in 90 countries. We have a broad remuneration policy which reflects the diversity of cultures, legislative environments, employment markets, and the types and seniority of roles that this geographic spread requires. The Company structures colleagues’ rewards to enable it to recruit and retain the right people, doing the right job for its customers. The following summary provides additional context but does not formally form part of the Policy and may change from time to time. The Remuneration Committee monitors and reviews the effectiveness of the senior remuneration policy and has regard to its impact and compatibility with remuneration policies in the wider workforce. The principles that the Company follows include: • competitive: setting pay with reference to internal relativity and external market practices; • simple: helping all employees to understand how they are rewarded; • fair: achieving consistent outcomes through flexible and transparent policies; and • sustainable: aligning reward to business strategy and performance. Wider workforce engagement The Remuneration Committee continued its engagement with the Company’s colleagues as part of the wider workforce engagement undertaken by the Board of Directors as set out on page 96. This approach enables colleagues’ views to be shared with the Remuneration Committee and the wider Board. The management team is trusted to bring key issues about colleagues to the Committee’s attention and there is a regular flow of information to the Board. Full details can be found on pages 88 and 92. These include the YVC survey results and action plans, regional ‘deep dive’ presentations, and Employer of Choice updates, which ensure that the Committee gets a rounded view from across the Group and gives a much better representation of our c.63,400 colleagues’ views than, for example, conducting individual workshops with a small number of colleagues. That said, in a normal year, the Board takes time to meet colleagues during site visits, undertake ‘ride-alongs’ with specialists and technicians, and attend management meetings. Examples of activities that the Remuneration Committee has undertaken include having dinner with the North America management team, along with the rest of the Board, and on two occasions having lunch with colleagues in our talent programme. Leanne Sheraton and Brian Baldwin attended the RI 100 celebration at the House of Commons, attended by long-standing clients, senior management, and colleagues from across the UK business. Leanne also had a tour of the Power Centre in Crawley and was taken on a ‘ride-along’ route with a pest technician. These activities give the Committee members the opportunity to meet colleagues both formally and informally, and give colleagues the opportunity to ask questions on a range of subjects, including remuneration. In addition to this, the Committee takes into account the pay of the wider workforce when making remuneration decisions for the Executive Directors and the ELT. This is achieved through relevant details about the wider workforce being disclosed to the Committee to provide context when it is making pay decisions. For example, when making salary decisions, the Committee is provided with details of the overall approach for the Group, as well as senior leader and general colleague recommendations for the specific countries in which the Executive Directors and ELT reside. This means, for example, that the approach to pay increases for frontline technicians and managers in Singapore would be taken into account when making decisions about the pay for the Regional Managing Director for Asia & MENAT, who lives and works in Singapore. Consideration of cost-of-living challenges In 2025, the challenges around the impact of the cost-of-living crisis globally continued and we have remained committed to paying our colleagues fairly, with particular focus on the impact that higher inflation has had on our more junior and frontline colleagues over the last few years. We continued a number of the successful initiatives that we had introduced in previous years, which included: • giving higher increases to frontline colleagues compared with senior leaders and management teams; for example, the typical pay increase for frontline colleagues in the UK was double the typical salary increase for management and senior leaders in 2025; • giving frontline colleagues the opportunity to flex their work hours and, based on colleague feedback, offering them the opportunity to increase their contractual hours, and accordingly their pay; • supporting colleagues to help them maximise their incentive opportunity; • increasing meal voucher benefits to support colleagues with the rising costs of food inflation; and • providing support to colleagues to help them develop their own strategies to manage the cost of living challenge; for example, by providing access to a range of financial tools and calculators through our benefit platform in the UK, and partnering with HSBC to deliver financial education webinars. CEO pay ratio The CEO pay ratio compares the CEO single figure earnings with the single figure earnings of UK colleagues. It has been calculated using method A, where the colleagues at each quartile are identified using details of their full-time equivalent pay and benefits for the year being measured. The effective date for the calculation is 31 December of the reporting year. For example, the 2025 colleague figures represent the full-time equivalent pay and benefits for 2025 for colleagues employed on 31 December 2025 and are calculated once the actual data is available, which means that no elements of pay are omitted or departures required from the methodology. This method was chosen as it best replicates the Chief Executive’s single figure. The table below shows the ratios at the 25th percentile, median, and 75th percentile for 2018 to 2025, and the corresponding value of pay and benefits: Year Method 25th percentile pay ratio Median pay ratio 75th percentile pay ratio 2025 A Salary £27,124 £31,673 £42,201 Total pay and benefits £27,977 £33,288 £43,270 Pay ratio 117:1 99:1 76:1 2024 A Pay ratio 76:1 70:1 56:1 2023 A Pay ratio 154:1 123:1 88:1 2022 A Pay ratio 148:1 121:1 85:1 2021 A Pay ratio 281:1 232:1 172:1 2020 A Pay ratio 203:1 160:1 111:1 2019 A Pay ratio 220:1 173:1 119:1 2018 A Pay ratio 229:1 189:1 145:1 The CEO ratios for 2025 have increased compared with 2024; this is due to the CEO’s single figure being more in line with historical outcomes. The 2024 figure was significantly lower due to no bonus being payable for 2024 and a lower vesting level of the PSP, alongside the employee values remaining higher, which was partially due to colleagues being given the opportunity to increase their contractual hours, and accordingly their pay. Directors’ Annual Remuneration Report – 2025 continued 128 Rentokil Initial plc Annual Report 2025 |
|
This table will continue to be built over time to cover a rolling ten-year period and will include reasons for the changes to the ratios from year to year. However, it is anticipated that variations in the PSP and annual bonus outcomes will have the biggest impact on the ratios. For PSP, this is due to vesting levels and the share price changing. For the annual bonus, although our comparator colleagues are also eligible for a bonus, the Chief Executive is targeted on Group-level outcomes, whereas our comparator colleagues are based on their specific remit, which, given the UK makes up only a small percentage of the Group, means the outcomes may vary from year to year. The median pay ratio is consistent with the pay, reward, and progression policies for the Company’s UK colleagues taken as a whole. The Company has a consistent approach to reward across the Group and colleagues’ packages are set with reference to the external market. Relative importance of spend on pay The table below sets out amounts paid in total employee costs and total dividends paid for the years ended 31 December 2025 and 31 December 2024. 2025 £m 2024 £m % change Remuneration paid to all employees of the Group 3,241 3,128 3.6% Distributions to shareholders 304 292 4.1% Details of the remuneration paid to all employees can be found in Note A9 to the Financial Statements on page 164. Details of the dividends declared and paid during the periods are contained in Note D1 to the Financial Statements on page 191. Chief Executive remuneration over a 10-year period Chief Executive Single total figure for remuneration Annual bonus payout versus maximum opportunity % long-term incentive vesting rates versus maximum opportunity 2016 – Andy Ransom £5,581,304 72.2% 67.5% 2017 – Andy Ransom £3,969,607 70.1% 80.3% 2018 – Andy Ransom £4,962,076 55.8% 91.3% 2019 – Andy Ransom £4,227,473 93.1% 90.8% 2020 – Andy Ransom £3,840,871 0.0% 86.0% 2021 – Andy Ransom £5,544,805 100% 96.6% 2022 – Andy Ransom £4,324,407 98.6% 64.6% 2023 – Andy Ransom £3,300,546 58.7% 48.7% 2024 – Andy Ransom1 £1,901,325 0% 32.6% 2025 – Andy Ransom2 £3,283,184 56.2% 33.5% 1. The 2024 single total figure includes the revised value of 225,522 shares under the 2022 PSP award, which vested at 32.6% on 4 March 2025 with a value based on the closing share price on 4 March 2025 of 385.1p. 2. The 2025 single total figure includes the estimated value of 210,127 shares under the 2023 PSP award, which is due to vest on 30 March 2026 based on the average share price over Q4 of 2025 of 417.3p. Use of discretion The Remuneration Committee is cognisant of its responsibility to make informed and thoughtful decisions on remuneration that are both balanced and in the long-term interests of the business and shareholders and, where necessary, will apply discretion to remuneration targets or outcomes that otherwise would be inappropriate. The application of discretion over the last five years is detailed on page 114 and has focused on adjustments to the targets of in-flight PSP awards to take account of material acquisitions and disposals, to ensure that the targets remain as originally intended and have not become inadvertently easier or harder as a result of the acquisition; and adjustments to the 2024 annual bonus outcome, reducing it to zero, to align with the outcome with the overall financial performance for the year. Re-election of Directors and service contracts Details of the Director’s service contracts and notice periods defined under the Directors’ Remuneration Policy can be found on page 137. The notice periods given in service contracts of the current Directors are: Mike Duffy, 12 months by either party; Paul Edgecliffe-Johnson, 12 months by either party; and Richard Solomons, 6 months by either party. The Non-Executive Directors have a notice period of 3 months. Andy Ransom is currently serving notice and will retire on 6 May 2026 (see pages 124 and 125 for further details). The notice period in his service contract is 12 months. TSR performance over a ten-year period relative to FTSE Index The following graph shows TSR over a ten-year period reflecting the holding of the Company’s shares, plotted against the FTSE 100 Index, the FTSE 250 Index, and the FTSE 350 Index, on a consistent basis with the graph shown last year. The Company has been a constituent of one or more of these indices over the ten-year period that is shown. This chart is based on data sourced from Thomson Reuters DataStream and uses spot Return Index data at each year end. Rentokil Initial plc’s TSR compared against the TSR of FTSE 100, FTSE 250, and FTSE 350 indices over a ten-year period 0 £200 £400 £600 £100 £300 £500 £550 £150 £350 £50 £250 £450 Dec 2015 Dec 2016 Dec 2017 Dec 2018 Dec 2019 Dec 2020 Dec 2021 Dec 2022 Dec 2025 Dec 2024 Dec 2023 FTSE 100 FTSE 350 FTSE 250 Rentokil Initial Rentokil Initial plc Annual Report 2025 129 Strategic Report Corporate Governance Financial Statements Other Information |
|
Percentage change in remuneration The table below sets out a comparison of the change in pay versus the previous year for the Chief Executive, Chief Financial Officer, Chair, Non-Executive Directors, and employees of Rentokil Initial plc for the years 2020 to 2025, showing a rolling five-year period. The percentage changes calculated on the actual remuneration received are distorted by two factors: firstly, initiatives undertaken in 2020 to help mitigate the impact of COVID-19, such as management and senior leader pay waivers in Q2 2020 and cancelling the annual management bonus scheme, have impacted the percentage changes; and secondly, the actual remuneration received is not adjusted for in-year starters and leavers. Andy Ransom Paul Edgecliffe-Johnson Richard Solomons Brian Baldwin5 David Frear6 Sally Johnson7 Sarosh Mistry8 Sam Mitchell9 John Pettigrew Leanne Sheraton9 Cathy Turner10 Linda Yueh Employees11 Salary/fees1 2025 5.7% – 2.0% 283.7% 2.7% 7.9% −37.8% – 13.6% – 3.0% 9.2% 9.1% 2024 7.6% – 2.0% – −3.7% 47.3% −14.2% – −3.5% – 1.9% 1.9% 4.8% 2023 3.0% – 10.9% – 337.8% – 40.7% – 34.8% – 27.6% 27.8% 11.1% 2022 1.5% – 2.2% – – – 50.1% – 6.0% – 12.7% 4.3% 1.5% 2021 33.3% – 9.6% – – – – – 9.6% – 89.3% 9.6% 4.4% 2020 −14.3% – 34.6% – – – – – 9.6% – – −8.8% – Annual bonus2 2025 100.0% – – – – – – – – – – – 148.0% 2024 −100.0% – – – – – – – – – – – −74.6% 2023 −38.7% – – – – – – – – – – – −17.6% 2022 −1.3% – – – – – – – – – – – 45.0% 2021 100.0% – – – – – – – – – – – 352.1% 2020 −100.0% – – – – – – – – – – – −62.8% Benefits3,4 2025 0.8% – – – – – – – – – – – 2.7% 2024 0.2% – – – – – – – – – – – 2.20% 2023 −0.9% – – – – – – – – – – – −8.4% 2022 −2.7% – – – – – – – – – – – −0.2% 2021 0.5% – – – – – – – – – – – −4.5% 2020 −0.3% – – – – – – – – – – – 1.3% Total 2025 136.7% – 2.0% 283.7% 2.7% 7.9% −37.8% – 13.6% – 3.0% 9.2% 28.8% 2024 −46.8% – 2.0% – −3.7% 47.3% −14.2% – −3.5% – 1.9% 1.9% −27.6% 2023 −28.0% – 10.9% – 337.8% – 40.7% – 34.8% – 27.6% 27.8% −2.8% 2022 −0.3% – 2.2% – – – 50.1% – 6.0% – 12.7% 4.3% 17.6% 2021 265.4% – 9.6% – – – – – 9.6% – 89.3% 9.6% 45.9% 2020 −63.5% – – – – – – – −4.6% – – −8.8% −15.2% 1. Base salary includes overtime and allowances. 2. Annual bonus includes our Group Management Bonus Scheme (GMBS) and any other bonus commission or cash incentive but excludes any long-term incentives. 3. Benefits include private healthcare, car allowance, cars, fully expensed fuel cards, and commercial vans (private use). 4. Pension and retirement benefits are not included in accordance with the Large and Medium-sized Companies and Groups (Accounts and Reports) (Amendment) Regulations 2013. 5. Brian Baldwin was appointed to the Board on 1 October 2024. 6. David Frear was appointed to the Board on 12 October 2022. 7. Sally Johnson was appointed to the Board on 1 April 2023. 8. Sarosh Mistry was appointed to the Board on 1 April 2021 and stepped down from the Board on 31 July 2025. 9. Sam Mitchell and Leanne Sheraton were appointed to the Board on 1 June 2025. 10.Cathy Turner was appointed as Chair of the Remuneration Committee on 12 May 2021. 11. In line with regulations, employees include those employed by Rentokil Initial plc, excluding Executive Directors and Non-Executive Directors. Directors’ Annual Remuneration Report – 2025 continued 130 Rentokil Initial plc Annual Report 2025 |
|
Directors’ Annual Remuneration Report – Looking forward 2026 Executive Director base salaries from 1 January 2026 Executive Director and ELT salaries are typically reviewed with effect from 1 July each year in accordance with the prevailing Policy. When reviewing salary levels, the Remuneration Committee takes into account a number of internal and external factors, including Company performance during the year, external market data, and the salary review principles applied to the rest of the organisation, to ensure a consistent approach. The Chief Executive will not receive a salary review in 2026, in line with the terms of his appointment. The salary increase for the Chief Financial Officer is expected to be around 3.0% in line with the increases that are anticipated to be applied to senior management. The standard increases for the wider workforce in 2026 are expected to be higher, as the Company normally focuses more of its pay review budget at the frontline. Salary from 1 January 2026 Executive Director Salary from 1 January 2026 ’000 Increase % Salary from 1 July 2026 ’000 Mike Duffy – Chief Executive1 $1,600.0 0.0% $1,600.0 Paul Edgecliffe-Johnson – Chief Financial Officer £775.0 3.0% £798.3 1. This is his salary at appointment on 16 February 2026 and in line with the terms of his appointment, his first salary review will be in July 2027. Fixed pay for 2026 will be: Estimated base salary ’000 Estimated benefits ’000 Estimated pension ’000 Total fixed pay ’000 Mike Duffy – Chief Executive $1,600.0 $18.3 $12.6 $1,630.9 Paul Edgecliffe-Johnson – Chief Financial Officer £786.6 £15.9 £20.5 £823.0 2026 Non-Executive Director fees The table below shows the Non-Executive Director fees from 1 January 2026. As part of the review of the fees conducted in September 2022, it was agreed that the Non-Executive Director fees would be reviewed each year as part of the salary review and, if appropriate, the fees will be increased by the standard amount being applied to Executive Directors. This review will be completed in June 2026 and any increase determined will be applied from 1 July 2026. Position Fee policy from 1 January 2026 Chair £442,000 per annum Non-Executive Director £79,950 per annum Senior Independent Director Additional £21,320 per annum Chair of Audit Committee Additional £21,320 per annum Chair of Remuneration Committee Additional £21,320 per annum Intercontinental travel allowance Additional £5,000 per trip 2026 annual bonus structure The focus of the bonus remains on rewarding sustainable profitable growth and delivery of Adjusted Free Cash Flow in order to align Executive Directors’ incentives with the Group’s strategy. Executive Directors have the following bonus opportunity as a percentage of base salary. Threshold Target Maximum Company performance 39.0% 97.5% 195.0% Personal performance 0.0% 15.0% 30.0% Total 39.0% 112.5% 225.0% Company performance • Gateways: 95% of the Profit target and an Adjusted Free Cash Flow gateway have to be reached at Group level before the financial performance element of the bonus can be paid. • Financial performance: If both these profit and cash flow gateways are achieved, then Executive Directors can earn up to 195% of salary based on the achievement of financial targets. Bonus targets have not been disclosed looking forward for 2026 as the Board believes that this information is commercially sensitive. Disclosing bonus targets could provide information about our business plans to our competitors, which could be damaging to our business interests and therefore to shareholders. However, retrospective bonus targets for 2026 will be disclosed in next year’s Annual Report. The Committee remains dedicated to ensuring that the bonus targets remain stretching and has determined that, in addition to delivery of Group profit and revenue targets, part of the uplift in bonus opportunity approved as part of the new Policy will continue to be based on the achievement of delivery of Organic Revenue Growth in our North America business for 2026. Rentokil Initial plc Annual Report 2025 131 Strategic Report Corporate Governance Financial Statements Other Information |
|
Directors’ Annual Remuneration Report – Looking forward 2026 continued The table below shows how the bonus opportunity for Company performance in 2026 will be split. Threshold Target Maximum Profit 17.0% 42.5% 85.0% Revenue 17.0% 42.5% 85.0% North America Organic Revenue Growth 5.0% 12.5% 25.0% Company performance 39.0% 97.5% 195.0% Personal performance The Executive Directors can earn up to 30% of base salary based on their personal performance against objectives measured through the Company’s performance and development review process. Bonus deferral 50% of any bonus earned will be deferred into shares for three years. How will incentives be aligned with the business strategy in 2026? The table below shows how key elements of the business strategy are reflected in the Executive Directors’ remuneration in 2026. See page 16 for further details. Strategic priorities Link to remuneration 1) Accelerate profitable growth in North America Revenue and profit targets for Group and Organic Revenue Growth targets for North America in the annual bonus. Organic Revenue Growth targets in the PSP. 2) Invest in innovation and digital to grow International Pest Control Revenue targets for Group in the annual bonus, and Organic Revenue Growth targets in the PSP. Innovation and digital targets in personal goals in the annual bonus. 3) Deliver operational excellence in global Hygiene & Wellbeing Revenue and profit targets, and personal goals in the annual bonus. Organic Revenue Growth targets in the PSP. 4) Accelerate growth through targeted M&A M&A is enabled through delivery of Adjusted Free Cash Flow in the annual bonus and Adjusted Free Cash Flow Conversion in the PSP, and its execution is measured through personal goals in the annual bonus. 5) Build a high-quality service company through investment in colleagues and technology Through personal goals in the annual bonus and the Sales and Service colleague retention and Customer Satisfaction performance condition in the PSP. 6) Focus on efficiency, cash flow and disciplined capital allocation Free Cash Flow gateway in annual bonus and Free Cash Flow Conversion performance condition in the PSP. 2026 PSP award Under the Policy, the PSP award limits are a maximum of 375% of base salary for the Chief Executive and 300% of base salary for the Chief Financial Officer. It is currently envisaged that Mike Duffy, Chief Executive from 16 March 2026, will receive an award of 375% of salary and Paul Edgecliffe-Johnson, Chief Financial Officer, an award of 300% of salary in line with the Policy, subject to confirmation that this remains appropriate at the time of grant. Shares under the awards will be released no earlier than five years after grant (i.e. following a three-year vesting period and a two-year holding period). Vesting of this award will be determined by the Company’s performance as follows and performance between targets will be calculated on a straight-line basis. For 2026, the Committee approved a change to the measurement of the TSR performance period, aligning it with the organisation’s calendar year rather than the grant date. This approach aligns with prevailing FTSE market practice and offers administrative advantages in both calculation and disclosure. This change will not be applied retrospectively to in-flight awards. The performance period for the 2026 PSP award for all the metrics will be aligned with the financial year and will run from 1 January 2026 to 31 December 2028. Performance measures 2026–2028 Weighting Threshold: 20% vesting Target: 50% vesting Maximum: 100% vesting Relative TSR¹ 50% TSR performance is median against comparator group Straight-line vesting between threshold and maximum Upper quartile TSR performance against comparator group Organic Revenue Growth 15% 2.75% 3.5% 4.25% Adjusted Free Cash Flow Conversion 15% 75% 85% 90% Strategic measures² 20% (split equally) – Sales and Service colleague retention Targets for these measures have not been disclosed as the Board believes that these measures are commercially sensitive. They will be disclosed on vesting. They will be based on straight-line vesting between threshold and target and between target and maximum performance, which will be reported at vesting. – Customer satisfaction – Vehicle fuel intensity reduction 4% 6% 8% 1. The TSR index of comparators for this cycle will be the constituents of the FTSE 100 Index, excluding financial services, property, and primary resources sectors. 2. The strategic measures will be measured over the three-year performance period. Colleague retention will be measured on average overall Sales and Service colleague retention; customer satisfaction will be measured using average CVC scores; and vehicle fuel efficiency will be measured against an average reduction across our key countries. 132 Rentokil Initial plc Annual Report 2025 |
|
The charts opposite provide an illustration of what could be received by each of the Executive Directors in 2026, including how a 50% increase in the share price could impact what they receive. These charts are illustrative, as the actual value that will be received will depend on business performance in 2026 for the bonus and in the three-year period to 2028 for the PSP, as well as share price performance to the date of exercise for awards made under the DBP and the PSP. Our remuneration arrangements are designed so that a significant proportion of pay is dependent on the delivery of short and long-term goals that are aligned with our strategic objectives and the creation of shareholder value. Key Fixed pay Includes all elements of fixed remuneration, which includes base salary, pension, and benefits. The amounts are based on the proposed new salary levels from 1 July 2026 and assume a full year at this level. Annual bonus including Deferred Bonus Plan (DBP) Represents the potential value of the annual bonus for 2026, as shown on pages 131 and 132. 50% of any bonus would be deferred into shares for three years and this is included in the value shown. Performance Share Plan (PSP) Represents the potential value of the PSP to be awarded in 2026 (375% of salary for the CEO and 300% of salary for the CFO), which would vest in 2029 subject to performance against the targets disclosed on page 132. Awards would be subject to a holding period for a further two years. 50% share price growth Represents the potential impact of a 50% share price increase. This has been applied to the PSP. Chief Executive – Mike Duffy Fixed $1,620,250 Threshold $4,044,250 Target $7,920,250 Maximum $14,220,250 40% 30% 20% 22% 38% 19% 11% 25% 42% 21% 100% 15% 15% $0m $2.5m $5.0m $7.5m $10.0m $12.5m $15.0m Chief Financial Officer – Paul Edgecliffe-Johnson Fixed £834,951 Threshold £1,864,694 Target £3,529,045 Maximum £6,223,139 45% 26% 24% 25% 34% 17% 13% 29% 39% 19% 100% 16% 13% £0m £2.5m £5.0m £7.5m £10.0m £12.5m £15.0m Illustration of proposed Directors’ Remuneration Policy for 2026 The Committee carefully reviewed the performance targets, ensuring they are both stretching yet achievable, in order to effectively motivate participants. In the Committee’s view, the targets remain appropriately challenging as on-target performance is aligned with the consensus of stock market analysts’ expectation of growth over the period, and maximum performance requires outperformance of those analysts’ forecasts. The Remuneration Committee is satisfied that these targets represent a suitably stretching range in light of all relevant factors, including the current business plan and analysts’ forecasts. When determining the level of vesting, the Remuneration Committee will also consider the underlying financial performance of the business, as well as the value added to shareholders during the performance periods, and may adjust the vesting outcome if it considers this to be appropriate. Rentokil Initial plc Annual Report 2025 133 Strategic Report Corporate Governance Financial Statements Other Information |
|
Summary of the 2024 Directors’ Remuneration Policy The information provided in this section of the Remuneration Report is not subject to audit. Base salary Purpose/link to strategy To attract and retain executives of the calibre required to implement our strategy. Operation Base salaries are payable in cash and are normally reviewed annually. Base salaries are set taking into account: • scope and responsibilities of the role; • external economic environment; • individual skills and experience; • contribution to overall business performance; • pay conditions for other colleagues based in the UK and other regions which are considered by the Remuneration Committee to be relevant for that executive; and • comparable salaries in a cross-section of companies of a similar size and complexity at the time of review – which will be taken into consideration, but not be the key determiner of salary levels. Levels of payout Base salaries are set at an appropriate level taking into account the factors described under ‘Operation’ above and salary increases are considered in this context. The maximum salary level is determined by the Remuneration Committee taking into account these factors. The Remuneration Committee would normally expect percentage pay increases for the Executive Directors to be broadly in line with the wider workforce in relevant regions. However, higher increases may be awarded in certain circumstances, where the Remuneration Committee considers this appropriate, such as: • where a new Executive Director has been appointed to the Board at a lower than typical market salary to allow for growth in the role, then larger increases may be awarded in following years to move salary positioning closer to typical market levels as the executive grows in experience, subject to performance; • where the Executive Director has been promoted or has had a change in responsibilities, salary increases in excess of the above level may be awarded; or • a substantial change in the Company’s size or market capitalisation leading to the positioning of an Executive Director’s salary falling behind market practice. In exceptional circumstances, where a Non-Executive Director temporarily takes up an executive position, salary increases for the Non-Executive Director may be awarded as appropriate. Performance measures and period The payment of salary is not dependent on achieving performance targets, although individual performance is taken into account when setting salary levels and determining any salary increases. Pension Purpose/link to strategy To facilitate Executive Directors’ planning for retirement. Operation Executive Director pension arrangements are by way of a defined contribution arrangement or through a cash alternative of a similar value, or a combination of the two. Levels of payout The maximum contribution will be in line with the wider workforce in the UK, which is currently 3% of base salary, although this rate may change from time to time. Should an Executive Director be appointed in a country other than the UK, a maximum contribution appropriate to that market would be considered. Performance measures and period Not applicable. Benefits Purpose/link to strategy To provide market-competitive benefits that support the executive to undertake their role. Operation The Company pays the cost of providing the benefits on a monthly, annual, or one-off basis. Benefits are determined taking into account market practice, the level and type of benefits provided throughout the Group, and individual circumstances, and the benefits provided may be reviewed from time to time. All benefits are non-pensionable. The main benefits for Executive Directors are currently: • life assurance; • car or car allowance; • family healthcare; • permanent health insurance; and • relocation benefits – in the event that an executive were required to relocate to undertake their role, the Remuneration Committee may provide an additional appropriate level of benefits to reflect the relevant circumstances. Such benefits may be one-off or ongoing in nature. Should an Executive Director be appointed in a country other than the UK, benefits appropriate to that market would be considered. The Remuneration Committee retains the discretion to change the benefits provided (including offering additional benefits) in line with market practice and may include offering participation in any future all-employee share plan. Levels of payout Levels of benefits are set in line with market practice. The level of benefits provided varies year-on-year depending on the cost of the provision of benefits to the Company and therefore it is not meaningful to identify a maximum level of benefits. Performance measures and period Not applicable. 134 Rentokil Initial plc Annual Report 2025 |
|
Annual bonus Purpose/link to strategy To recognise and reward for stretching business performance against annual financial targets and/or personal objectives that contribute to Company performance. To attract and retain executives of the calibre required to implement our strategy and drive business performance. The deferral of an element of the annual bonus into shares provides alignment with shareholders’ long-term interests following the successful delivery of short-term targets and supports the balance of achievement of short-term and long-term business performance. Operation The annual bonus is paid each year after the Remuneration Committee has reviewed performance against targets, which are set around the beginning of each year for each Executive Director, taking into consideration the underlying performance of the business. Normally no more than 50% of any bonus is generally paid in cash, with the balance deferred in shares under the Deferred Bonus Plan (DBP). Deferred shares typically vest after a period of three years with no further performance conditions. Shares awarded under the DBP are typically awarded as nil-cost options and have an exercise period that extends from the date of vesting to the 10th anniversary of the award being made, although awards may be structured in other ways. If nil-cost options remain exercisable at the 10th anniversary of grant then they will be exercised automatically on a participant’s behalf. The Remuneration Committee retains the right to exercise discretion to ensure that the level of bonus payable is appropriate and a fair reflection of the Company’s performance. Malus and clawback rules apply to both cash bonus payments and DBP awards (see Malus and Clawback section for details). Deferred shares may be adjusted in accordance with the rules in the event of a variation of the Company’s share capital, demerger, special dividend, or similar event that materially affects the price of shares. Levels of payout Bonus payouts start to accrue at a level of up to 20% of base salary for meeting threshold levels of performance and a maximum opportunity of 225% of base salary, with an on-target bonus opportunity of no more than 50% of the maximum opportunity. Payouts for performance levels in between these levels will typically be paid on a straight-line basis. Dividend equivalents accrue between grant date and vesting date on shares that vest under the DBP and are normally settled in the form of additional shares. Performance measures and period The annual bonus is normally based on the achievement of financial targets and/or personal objectives, although the Committee measures and period may include other strategic priorities. Performance is typically tested over a one-year performance period. The Remuneration Committee reserves the right to set appropriate measures that ensure alignment with business strategy and shareholder interest, subject to the financial measures accounting for at least 75% of the total. Financial measures may be linked to Group performance or the executive’s specific area of responsibility, if appropriate. If events happen which cause the Remuneration Committee to consider that a performance condition would not, without alteration, achieve its original purpose, it may amend that performance condition provided that the amended performance condition is materially no less challenging than it would have been had the event not occurred. The Remuneration Committee retains the right to exercise discretion to ensure that the formulaic vesting outcome is appropriate and a fair reflection of the Company’s performance. Rentokil Initial plc Annual Report 2025 135 Strategic Report Corporate Governance Financial Statements Other Information |
|
2024 Directors’ Remuneration Policy continued Performance Share Plan (PSP) Purpose/link to strategy To motivate and incentivise delivery of stretching business performance over the long term and to create alignment with growth in value for shareholders. To act as a retention tool for Executive Directors. Operation The PSP operates under the rules approved by shareholders in 2016 (and as amended). An award of shares is granted on an annual basis with a face value in line with the multiple of base salary approved by the Remuneration Committee, with vesting subject to the achievement of performance conditions. Shares awarded under the PSP are typically awarded as nil-cost options (although they may be structured in other ways) and have an exercise period that extends from the date of vesting to the 10th anniversary of the award being made. If nil-cost options remain exercisable at the 10th anniversary of grant then they will be exercised automatically on a participant’s behalf. Award levels and performance conditions are set to support the business’s long-term goals and seek to reflect market practice and shareholder guidance. Awards are subject to a two-year holding period post vesting. Directors may sell sufficient shares to pay taxes due related to the award, if required, during this period. Malus and clawback rules apply to shares awarded under the PSP (see Malus and Clawback section for details). Awards may be adjusted in accordance with the rules in the event of a variation of the Company’s share capital, demerger, special dividend, or similar event that materially affects the price of shares. Levels of payout The maximum regular annual award will be 375% of base salary for the Chief Executive and 300% of base salary for the Chief Financial Officer and any other Executive Directors. No more than 20% of the award shall vest for meeting threshold levels of performance and 100% of the award shall vest if maximum performance is achieved. Performance between these points will typically be measured on a straight-line basis. Dividend equivalents may accrue between grant date and vesting date or to the end of the holding period on shares that vest under the PSP and are normally settled in the form of additional shares. Performance measures and period Awards are subject to the achievement of financial and ESG/strategic measures, with specific measures and weightings set by the Remuneration Committee each year to ensure alignment with the business strategy at the time of grant. However, a minimum weighting of 75% should relate to financial (including TSR) measures. Potential measures include: • relative TSR performance; • Organic Revenue Growth; • Adjusted Free Cash Flow conversion; and • ESG measures (colleague retention, customer satisfaction, and vehicle fuel intensity). If events happen which cause the Remuneration Committee to consider that a performance condition would not, without alteration, achieve its original purpose, it may amend that performance condition provided that the amended performance condition is materially no less challenging than it would have been had the event not occurred. The Remuneration Committee retains the right to exercise discretion to ensure that the formulaic vesting outcome is appropriate and a fair reflection of the Company’s performance. Shareholding guidelines Purpose/link to strategy Encourages greater levels of shareholding and aligns Executive Directors’ interests with those of shareholders. Operation Executive Directors are expected to achieve and maintain a holding of the Company’s shares. A further post-cessation shareholding requirement will normally apply to Executive Directors (see Termination section for details). For two years following cessation of employment, Executive Directors will be required to hold shares to the value of the shareholding guideline that applied at the cessation of their employment unless the Remuneration Committee exceptionally determines otherwise; or, in cases where the individual has not had sufficient time to build up shares to meet their guideline, the actual level of shareholding at cessation. Levels of payout Chief Executive: 400% of salary; Chief Financial Officer and other Executive Directors: 300% of salary. To be achieved within five years of appointment or other significant event. Performance measures and period Not applicable. 136 Rentokil Initial plc Annual Report 2025 |
|
Measures and targets All the performance measures selected, both in the financial and ESG/ strategic categories, support the delivery of short and long-term financial performance of the business and shareholder value creation. Targets are set each year based on stretching internal budgets, and achieving or exceeding these targets will both return value to shareholders and reward the executive team for delivery. The annual bonus measures are reviewed annually to focus on delivery of key financial targets and strategic goals for the forthcoming year, as well as key strategic or operational goals relevant to the individual. Over the long term, PSP performance measures are focused on generating returns to shareholders through the relative TSR measure and other measures focus on improving business performance. Malus and clawback Malus and clawback rules apply to the Executive Directors’ incentive arrangements. Under these provisions, the Remuneration Committee at their discretion may reduce bonus payments in respect of the current year or future years and have the ability to scale back awards that have not yet vested under the Company’s PSP or DBP (potentially to nil) in the event of: • a material misstatement of the Company’s audited results for the current year or prior years; • the discovery that an assessment of performance connected to the award (including relating to the original bonus amount for the DBP) was based on misleading or inaccurate information; • there has been fraud or gross misconduct, or circumstances which, in the opinion of the Remuneration Committee, would entitle the Company or any other member of the Group to summarily dismiss the individual; • in the case of malus only, actions which result in serious reputational damage or corporate failure affecting any part of the Group; or • in the case of malus only, circumstances where the Remuneration Committee, in its discretion, considers that this treatment is appropriate. For bonus, a clawback provision exists to give the Remuneration Committee, in the same circumstances to malus, the ability to recover sums already paid for up to two years after bonus determination. For PSP, a clawback provision exists to give the Remuneration Committee, in the same circumstances as malus, the ability to recover sums already paid for up to five years from the grant date. In addition, a separate clawback policy applies as required to comply with SEC regulations in the US. The Committee reserves the right to amend the various malus and clawback provisions from time to time where it considers that to be appropriate and in line with wider practice elsewhere. Use of discretion The Remuneration Committee is cognisant of its responsibility to make informed and thoughtful decisions on remuneration that are both balanced and in the long-term interests of the business and shareholders and, where necessary, will apply discretion to remuneration targets or outcomes that would otherwise be inappropriate. In addition, the Remuneration Committee also retains the right to apply discretion in the operation and administration of the incentive plans. This includes, but is not limited to, the following areas: setting appropriate performance conditions, weightings and targets from year to year for the PSP and annual bonus, the timing of PSP and DBP grants, the timing of annual bonus payments, the size of PSP awards granted, and determining the treatment of leavers. Any discretion applied will be in accordance with the respective plan rules (or relevant documentation) and within the limits of the Policy. Recruitment Executive Directors The Remuneration Committee’s key principle when determining appropriate remuneration arrangements for a new Executive Director (whether appointed from within the organisation or externally) is to ensure that arrangements are in the best interests of both the Company and its shareholders, without paying more than is considered necessary by the Remuneration Committee to recruit an executive of the required calibre to develop and deliver the business strategy. When determining appropriate remuneration arrangements, the Remuneration Committee will take into account all relevant factors. These factors may include (among others): • the level and type of remuneration opportunity being forfeited; • the jurisdiction the candidate was recruited from and whether any relocation is required; • the skills, experience, and calibre of the individual; • the circumstances of the individual; and • the current external market and salary practice, including market practice on additional benefits. The Remuneration Committee would comply with the terms of the Remuneration Policy outlined in the table on pages 134 to 136. In addition, if necessary, it may make awards on appointing an Executive Director to ‘buy out’ remuneration terms forfeited on leaving a previous employer. In doing so, the Remuneration Committee will take account of relevant factors, including any performance conditions attached to these awards, the form in which they were granted (e.g. cash or shares) and the time over which they would have vested. Generally, buy-out awards will be made on a comparable basis to those forfeited but, in any event, will reflect those terms in some way (e.g. through a more substantial discount to the amount). In the event of recruitment, the Remuneration Committee may grant awards to a new Executive Director under Listing Rule 9.4.2R, which allows for the granting of awards, to facilitate, in unusual circumstances, the recruitment of an Executive Director, without seeking prior shareholder approval or under other appropriate Company share plans. The use of UK Listing Rule 9.4.2R will be limited to granting buy-out awards only. In the event that an internal candidate was promoted to the Board, legacy terms and conditions may be honoured, including any outstanding incentive awards and the exercise of any discretion in connection with such payments. Similarly, if an Executive Director is appointed following the Company’s acquisition of or merger with another company, legacy terms and conditions would be honoured; however, steps would be taken to align with the Policy over time. In the event of the appointment of a new Chair of the Board or Non-Executive Director, remuneration arrangements will normally reflect the Policy outlined on page 138. The Remuneration Committee’s intention is that timely disclosure of the remuneration structure of any new Executive Director or Chair of the Board will be made by the Company wherever practical. Directors’ service agreements – Executive Directors Executive Directors are employed on permanent contracts, which are terminable on 12 months’ notice by either party. A description of the payment in lieu of notice provisions can be found below. The Company’s policy in respect of the notice periods for the termination of Executive Directors’ contracts conforms to the UK Corporate Governance Code. The remuneration and contractual arrangements for the Executive Directors and senior management do not contain any matters that are required to be disclosed under the Takeover Directive. The contracts of service for Executive Directors are available for inspection by shareholders at the Company’s registered office. Rentokil Initial plc Annual Report 2025 137 Strategic Report Corporate Governance Financial Statements Other Information |
|
Termination When an Executive Director leaves the business on the basis of mutual agreement, the Remuneration Committee will determine an appropriate payment taking into account the circumstances of leaving, but any payment will be no more generous than that for leavers by reason of disability, ill health, retirement, redundancy, death, or sale of an individual employing business. Base pay and benefits Executive Directors are entitled to a payment in lieu of notice equal to base pay and the value of benefits only for the duration of the remaining notice period, subject to mitigation. The Company has the ability to terminate Executive Directors’ employment, in the event of a prolonged mental or physical incapacity to carry out his/ her Company duties and without notice (summary dismissal), in the event of gross misconduct or being disqualified to act as a Director. Appropriate medical benefits may still be provided in the case of prolonged mental or physical incapacity. Other Executive Directors may be entitled to other payments including, but not limited to, costs of appropriate repatriation/relocation, outplacement, settlement agreement, non-compete agreement, legal and/or tax and other relevant professional costs. The Remuneration Committee would look to ensure that the level of these costs/benefits was reasonable and in the best interests of shareholders. Bonus including Deferred Bonus Plan (DBP) Cash bonus In the event of retirement, death, disability, redundancy, change of control, sale of the employing company, or any other circumstance at the discretion of the Remuneration Committee, Executive Directors may receive a bonus payment for the year in which they cease employment. This payment will normally be pro-rated for time and performance; however, the Remuneration Committee retains the discretion to review overall business and individual performance and determine that a different level of bonus payment is appropriate. Otherwise, generally, Executive Directors must be employed at the date of payment to receive a bonus. In certain circumstances, the Remuneration Committee may determine that a bonus payment may be due to reflect performance and contribution to the point of cessation. DBP – leaving before date of vest Deferred bonus shares will normally vest in full following completion of the three-year vesting period, unless the Committee determines in its absolute discretion that vesting will be accelerated. Participants will have six months from the date of vest to exercise. The vesting of awards will be accelerated in the event of death and there will be a period of 12 months from death to exercise (or up to 24 months if the Remuneration Committee so determines). DBP – leaving after date of vest The Executive Director will normally have six months in which to exercise their awards from the date of leaving (12 months for death (or up to 24 months if the Remuneration Committee so determines)). Performance Share Plan (PSP) Leaving before the end of the performance period In the event of ill health, disability, death, retirement, redundancy, change of control, sale of the employing company, or any other circumstance at the discretion of the Remuneration Committee, awards will vest on the original vesting date on a time-apportioned basis (unless the Remuneration Committee determines otherwise). Performance will be measured at the end of the original performance period. Participants will have six months from the end of the holding period to exercise. At the Remuneration Committee’s discretion in the event of ill health, disability, or death (or in the event of any other exceptional circumstance if it determines), awards can vest early on a time-apportioned basis. In this circumstance, performance will be measured to the early vesting date. Participants will have six months from leaving to exercise (12 months for death (or up to 24 months if the Remuneration Committee so determines)). If participants leave for any other reason before the end of the performance period, their award will lapse on termination. Leaving after the end of the performance period Any awards in the two-year holding period will be available to exercise following completion of the two-year holding period. Participants will have six months from the latest of the end of the holding period or the leaving date to exercise (12 months for death (or up to 24 months if the Remuneration Committee so determines)). Post-cessation shareholding requirement For two years following the cessation of employment, Executive Directors will normally be required to hold shares to the value of the shareholding guideline that applied at the cessation of their employment; or, in cases where the individual has not had sufficient time to build up shares to meet their guideline, the actual level of shareholding at cessation. The post-cessation shareholding requirement is to be satisfied from shares vesting under the DBP and PSP from grants from 2021 onwards. On exercise, sufficient shares may be sold to cover taxes due, but until the shareholding requirement is met the remaining shares will be held by the Company in nominee/escrow for the benefit of the Director. If the Executive Director has met the shareholding requirement through other means, with the exception of shares bought with their own funds, and the above approach results in a shortfall at the date of leaving, the Executive Director will be required to transfer the appropriate number of shares into the nominee/escrow in order to meet the requirement. In the event of ill health, disability, or death (or in the event of any other exceptional circumstance that the Remuneration Committee determines), the post-cessation shareholding requirement will not apply. Chair of the Board and Non-Executive Directors Fees Approach Non-Executive Directors’ remuneration is determined by the Board on the recommendation of the Non-Executive Directors’ Terms Committee of the Board (comprising the Chair of the Board, the Chief Executive, and the Chief Financial Officer) within the limits set by the Articles of Association. Non-Executive Directors’ fees are set at a level which is considered appropriate for the calibre of individual required to support the delivery of business strategy and taking into account skills, experience, time commitment, and independent surveys of fees paid to Non-Executive Directors of similar companies. Fees for the Chair of the Board are determined by the Board based on external remuneration advice and considered by the Remuneration Committee taking into account typical fee arrangements at other companies of a similar size and complexity, the time commitment required to fulfil the role, and the calibre of the individual required. Fees are reviewed at appropriate intervals. Details Non-Executive Directors’ fees are payable in cash and currently consist of a basic fee plus additional fees payable to: • the Senior Independent Director; and • the Board Committee Chairs. Additional fees may be paid to Non-Executive Directors on an ongoing or temporary basis if there is a change in their responsibilities or a significant increase in the time commitment required from them to fulfil their role or to remain competitive. The fees for Non-Executive Directors, including the Chair of the Board, shall not exceed in aggregate £1,000,000 per annum or such higher amount as the Company may from time to time by special resolution determine, as set out in the Company’s Articles of Association. 2024 Directors’ Remuneration Policy continued 138 Rentokil Initial plc Annual Report 2025 |
|
Other items No element of Non-Executive Director remuneration is performance-related. The Chair of the Board and the Non-Executive Directors do not participate in any of the Company’s incentive schemes, nor are they eligible to join the Company’s pension scheme. The Non-Executive Directors do not currently receive any other benefits. However, benefits may be provided in the future if, in the view of the Non-Executive Directors’ Terms Committee (for Non-Executive Directors or the Remuneration Committee for the Chair of the Board), this was considered appropriate. Non-Executive Directors who are based outside the UK may be provided with support in relation to their tax reporting. Letters of appointment Non-Executive Directors The Non-Executive Directors are each appointed by a letter of appointment and either party may terminate the appointment on three months’ written notice. The Non-Executive Directors are subject to annual re-election at the AGM and are generally not expected to serve for a period exceeding nine years. See pages 80 and 81 for details of their appointment dates. Chair of the Board The Chair of the Board has a letter of appointment setting out his responsibilities for the management of the Board. The Chair’s contract may be terminated by either party on six months’ notice, notwithstanding a requirement for annual re-election at the AGM. Copies of the Chair of the Board and Non-Executive Directors’ letters of appointment are available for inspection by shareholders at the Company’s registered office. Remuneration Policy – other information Change of control If the Company is taken over or wound up, PSP awards may vest by reference to the extent to which the performance conditions are met and on a time pro-rated basis (calculated on a monthly basis) unless, in the case of pro-rating, the Remuneration Committee decides otherwise. Outstanding PSP awards may be vested automatically on a change of control on the participants’ behalf. Typically salaries and bonuses will be paid to the date of change of control. DBP awards shall vest in full. If participants are offered, and consent to, an equivalent award in the new company, they will not vest and instead will be exchanged for a new award. Participants have one month from the change of control date to exercise their award; any options that are not exercised at the end of that period will be automatically exercised. Legacy arrangements The Remuneration Committee reserves the right to make any remuneration payments and payments for loss of office (including exercising any discretions available to it in connection with such payments), notwithstanding that they are not in line with the Policy set out above, where the terms of the payment were agreed: • before the date the Company’s first Directors’ Remuneration Policy approved by shareholders in accordance with section 439A of the Companies Act 2006 came into effect; • before the Directors’ Remuneration Policy set out above came into effect, provided that the terms of the payment were consistent with the shareholder-approved Directors’ Remuneration Policy in force at the time they were agreed; or • at a time when the relevant individual was not a Director of the Company and, in the opinion of the Remuneration Committee, the payment was not in consideration for the individual becoming a Director of the Company. For these purposes, ‘payments’ includes the Remuneration Committee satisfying awards of variable remuneration and, in relation to an award over shares, the terms of the payment are ‘agreed’ at the time the award is granted. The Remuneration Committee may make minor amendments to the Directors’ Remuneration Policy (for regulatory, exchange control, tax or administrative purposes, or to take account of a change in legislation) without obtaining shareholder approval for that amendment. Rentokil Initial plc Annual Report 2025 139 Strategic Report Corporate Governance Financial Statements Other Information |
|
140 Rentokil Initial plc Annual Report 2025 (This page has been left blank intentionally.) |
|
Corporate Governance Rentokil Initial plc Annual Report 2025 141 Strategic Report Financial Statements Other Information (This page has been left blank intentionally.) |
|
142 Rentokil Initial plc Annual Report 2025 (This page has been left blank intentionally.) |
|
Corporate Governance Rentokil Initial plc Annual Report 2025 143 Strategic Report Financial Statements Other Information (This page has been left blank intentionally.) |
|
144 Rentokil Initial plc Annual Report 2025 (This page has been left blank intentionally.) |
|
Corporate Governance Rentokil Initial plc Annual Report 2025 145 Strategic Report Financial Statements Other Information (This page has been left blank intentionally.) |
|
146 Rentokil Initial plc Annual Report 2025 (This page has been left blank intentionally.) |
|
148 Consolidated Statement of Profit or Loss and Other Comprehensive Income 149 Consolidated Balance Sheet 150 Consolidated Statement of Changes in Equity 152 Consolidated Cash Flow Statement 153 Notes to the Consolidated Financial Statements 193 Related Undertakings 201 Parent Company Balance Sheet 202 Parent Company Statement of Changes in Equity 203 Notes to the Parent Company Financial Statements Financial Statements Rentokil Initial plc Annual Report 2025 147 Strategic Report Corporate Governance Financial Statements Other Information |
|
Consolidated Statement of Profit or Loss and Other Comprehensive Income For the year ended 31 December Notes 2025 $m 2024 represented1 $m 2023 represented1 $m Revenue A1 6,908 6,617 6,385 Operating expenses A7 (6,250) (5,902) (5,609) Net impairment losses on financial assets (74) (71) (49) Operating profit A1 584 644 727 Finance income C9 46 59 60 Finance cost C8 (250) (250) (232) Share of profit from associates net of tax B6 10 9 11 Profit before income tax 390 462 566 Income tax expense A12 (100) (116) (129) Profit from continuing operations 290 346 437 Profit from discontinued operations B7 180 46 37 Profit for the year 470 392 474 Profit for the year attributable to: Equity holders of the Company 470 392 474 Non-controlling interests – – – Other comprehensive income: Items that are not reclassified subsequently to the income statement: Remeasurement of net defined benefit liability A10 1 – – Items that are or may be reclassified subsequently to the income statement: Net exchange adjustments offset in reserves (139) (35) (172) Net gain/(loss) on net investment hedge 129 (22) 136 Effective portion of changes in fair value of cash flow hedge (31) 35 4 Cost of hedging – (7) 12 Tax related to items taken to other comprehensive income A12, A14 18 (8) 7 Net exchange adjustments transferred to profit on disposal of business B7 38 – – Net gain on net investment hedge transferred to profit on disposal of business B7 (11) – – Other comprehensive income for the year 5 (37) (13) Total comprehensive income for the year 475 355 461 Total comprehensive income for the year attributable to: Equity holders of the Company 475 355 461 Non-controlling interests – – – Earnings per share: From continuing operations Basic (cents) A2 11.49 13.72 17.37 Diluted (cents) A2 11.44 13.69 17.29 From continuing and discontinued operations Basic (cents) A2 18.62 15.54 18.84 Diluted (cents) A2 18.54 15.51 18.75 1. Refer to foreign currency translation in material accounting policies section. 148 Rentokil Initial plc Annual Report 2025 |
|
Consolidated Balance Sheet At 31 December Note 2025 $m 2024 represented1 $m At 1 January 2024 represented1 $m Assets Non-current assets Intangible assets B2 8,917 8,899 8,970 Property, plant and equipment B3 445 628 636 Right-of-use assets B4 576 577 576 Investments in associated undertakings B6 41 46 56 Other investments C4 25 26 27 Deferred tax assets A14 55 43 55 Contract costs A1 337 298 285 Retirement benefit assets A10 6 4 4 Trade and other receivables A3 52 71 57 Derivative financial instruments C6 121 8 72 10,575 10,600 10,738 Current assets Other investments C4 2 1 1 Inventories A4 308 287 264 Trade and other receivables A3 1,151 1,137 1,121 Current tax assets A13 18 28 42 Derivative financial instruments C6 61 – 18 Cash and cash equivalents C3 2,319 1,158 1,989 3,859 2,611 3,435 Liabilities Current liabilities Trade and other payables A5 (1,392) (1,400) (1,457) Current tax liabilities A13 (61) (53) (61) Provisions for liabilities and charges A6 (275) (144) (119) Bank and other short-term borrowings C2 (1,411) (1,460) (1,444) Lease liabilities B4 (171) (163) (162) Derivative financial instruments C6 (5) (4) (41) (3,315) (3,224) (3,284) Net current assets/(liabilities) 544 (613) 151 Non-current liabilities Other payables A5 (46) (86) (90) Bank and other long-term borrowings C2 (4,156) (3,127) (4,016) Lease liabilities B4 (392) (394) (405) Deferred tax liabilities A14 (589) (638) (659) Retirement benefit obligations A10 (27) (32) (36) Provisions for liabilities and charges A6 (397) (381) (455) Derivative financial instruments C6 (18) (36) (20) (5,625) (4,694) (5,681) Net assets 5,494 5,293 5,208 Equity Capital and reserves attributable to the Company’s equity holders Share capital D2 41 41 41 Share premium 21 20 19 Other reserves (946) (932) (903) Retained earnings 6,380 6,166 6,053 5,496 5,295 5,210 Non-controlling interests (2) (2) (2) Total equity 5,494 5,293 5,208 1. Refer to foreign currency translation in material accounting policies section. The Financial Statements on pages 148 to 200 were approved by the Board of Directors and were signed on its behalf by Andy Ransom and Paul Edgecliffe-Johnson on 5 March 2026. Andy Ransom Paul Edgecliffe-Johnson Chief Executive Chief Financial Officer Rentokil Initial plc Annual Report 2025 149 Strategic Report Corporate Governance Financial Statements Other Information |
|
Consolidated Statement of Changes in Equity For the year ended 31 December Attributable to equity holders of the Company Notes Share capital $m Share premium $m Other reserves $m Retained earnings $m Non-controlling interests $m Total equity $m At 1 January 2023 represented2 41 14 (883) 5,787 (2) 4,957 Profit for the year – – – 474 – 474 Other comprehensive income: Net exchange adjustments offset in reserves – – (172) – – (172) Net gain on net investment hedge – – 136 – – 136 Net gain on cash flow hedge1 – – 4 – – 4 Cost of hedging – – 12 – – 12 Tax related to items taken directly to other comprehensive income – – – 7 – 7 Total other comprehensive income for the year – – (20) 481 – 461 Transactions with owners: Gain on stock options – 5 – – – 5 Dividends paid to equity shareholders – – – (252) – (252) Cost of equity-settled share-based payment plans – – – 32 – 32 Movement in the carrying value of put options – – – 5 – 5 At 31 December 2023 represented2 41 19 (903) 6,053 (2) 5,208 Profit for the year – – – 392 – 392 Other comprehensive income: Net exchange adjustments offset in reserves – – (35) – – (35) Net loss on net investment hedge – – (22) – – (22) Net gain on cash flow hedge1 – – 35 – – 35 Cost of hedging – – (7) – – (7) Tax related to items taken directly to other comprehensive income – – – (8) – (8) Total other comprehensive income for the year – – (29) 384 – 355 Transactions with owners: Gain on stock options – 1 – – – 1 Dividends paid to equity shareholders – – – (292) – (292) Cost of equity-settled share-based payment plans – – – 25 – 25 Tax related to items taken directly to equity – – – (3) – (3) Movement in the carrying value of put options – – – (1) – (1) At 31 December 2024 represented2 41 20 (932) 6,166 (2) 5,293 Profit for the year – – – 470 – 470 Other comprehensive income: Remeasurement of net defined benefit liability 1 1 Net exchange adjustments offset in reserves – – (139) – – (139) Net gain on net investment hedge – – 129 – – 129 Net loss on cash flow hedge1 – – (31) – – (31) Cost of hedging – – – – – – Tax related to items taken directly to other comprehensive income – – – 18 – 18 Cumulative reserves recycled to income statement on disposal of foreign operations – – 27 – – 27 Total other comprehensive income for the year – – (14) 489 – 475 Transactions with owners: Gain on stock options – 1 – – – 1 Dividends paid to equity shareholders D1 – – – (304) – (304) Cost of equity-settled share-based payment plans – – – 28 – 28 Tax related to items taken directly to equity – – – 1 – 1 At 31 December 2025 41 21 (946) 6,380 (2) 5,494 1. $31m net loss (2024: $35m net gain; 2023: $4m net gain) on cash flow hedge includes a $64m gain (2024: $65m loss; 2023: $36m loss) from the effective portion of changes in fair value, and a $95m loss (2024: $100m gain; 2023: $40m gain) reclassification to the income statement due to changes in foreign exchange rates. 2. Refer to foreign currency translation in material accounting policies section. Shares of $nil (2024: $nil; 2023: $nil) have been netted against retained earnings. This represents 9.8m (2024: 11.4m; 2023: 13.0m) shares held by the Rentokil Initial Employee Share Trust, which is not consolidated. The market value of these shares at 31 December 2025 was $59m(2024: $56m; 2023: $71m). Dividend income from, and voting rights on, the shares held by the Trust have been waived. 150 Rentokil Initial plc Annual Report 2025 |
|
Analysis of other reserves Capital reduction reserve $m Merger relief reserve $m Cash flow hedge reserve $m Translation reserve $m Cost of hedging $m Total $m At 1 January 2023 represented2 (3,146) 3,326 4 (1,062) (5) (883) Net exchange adjustments offset in reserves – – – (172) – (172) Net gain on net investment hedge – – – 136 – 136 Net gain on cash flow hedge1 – – 4 – – 4 Cost of hedging – – – – 12 12 Total comprehensive income for the year – – 4 (36) 12 (20) At 31 December 2023 represented2 (3,146) 3,326 8 (1,098) 7 (903) Net exchange adjustments offset in reserves – – – (35) – (35) Net loss on net investment hedge – – – (22) – (22) Net gain on cash flow hedge1 – – 35 – – 35 Cost of hedging – – – – (7) (7) Total comprehensive income for the year – – 35 (57) (7) (29) At 31 December 2024 represented2 (3,146) 3,326 43 (1,155) – (932) Net exchange adjustments offset in reserves – – – (139) – (139) Net gain on net investment hedge – – – 129 – 129 Net loss on cash flow hedge1 – – (31) – – (31) Cumulative reserves recycled to income statement on disposal of foreign operations – – – 27 – 27 Total comprehensive income for the year – – (31) 17 – (14) At 31 December 2025 (3,146) 3,326 12 (1,138) – (946) 1. $31m net loss (2024: $35m net gain; 2023: $4m net gain) on cash flow hedge includes a $64m gain (2024: $65m loss; 2023: $36m loss) from the effective portion of changes in fair value, offset by reclassification to the cost of acquisition of $nil (2024: $nil; 2023: $nil) and a $95m loss (2024: $100m gain; 2023: $40m gain) reclassification to the income statement due to changes in foreign exchange rates. 2. Refer to foreign currency translation in material accounting policies section. The capital reduction reserve arose in 2005 as a result of the scheme of arrangement of Rentokil Initial 1927 plc, under section 425 of the Companies Act 1985, to introduce a new holding company, Rentokil Initial plc, and the subsequent reduction in capital approved by the High Court whereby the nominal value of each ordinary share was reduced from 100p to 1p. The excess of the fair value of shares issued to fund the acquisition of Terminix over their par value gave rise to a new reserve called a Merger Relief Reserve. Under section 612 of the Companies Act 2006, merger relief is available if certain circumstances are met when a business is acquired by issuing shares to replace already issued shares. This reserve is unrealised (and therefore not distributable), but it may become realised at a later date; for example, on disposal of the investment to which it relates or on impairment of that investment (which may occur after payment of a dividend by the investment). Rentokil Initial plc Annual Report 2025 151 Strategic Report Corporate Governance Financial Statements Other Information |
|
Consolidated Cash Flow Statement For the year ended 31 December Note 2025 $m 2024 represented2 $m 2023 represented2 $m Cash flows from operating activities Operating profit from: – Continuing operations 584 644 727 – Discontinued operations B7 74 57 50 Operating profit including discontinued operations 658 701 777 Adjustments for: – Depreciation and impairment of property, plant and equipment B3 167 204 191 – Depreciation and impairment of leased assets B4 160 157 150 – Amortisation and impairment of intangible assets (excluding computer software) B2 199 254 218 – Amortisation and impairment of computer software B2 37 33 32 – Other non-cash items 15 23 32 Changes in working capital (excluding the effects of acquisitions and exchange differences on consolidation): – Inventories (27) (15) (18) – Contract costs (51) (18) (24) – Trade and other receivables (20) (48) (36) – Trade and other payables and provisions 162 (129) (76) Interest received 31 46 31 Interest paid1 (255) (229) (237) Income tax paid A13 (104) (111) (124) Net cash flows from operating activities 972 868 916 Cash flows from investing activities Purchase of property, plant and equipment (208) (219) (207) Purchase of intangible fixed assets (61) (56) (55) Proceeds from sale of property, plant and equipment 20 5 17 Acquisition of companies and businesses, net of cash acquired B1 (121) (219) (298) Disposal of investment in associate – – 24 Proceeds from disposal of businesses, net of tax paid B7 391 – – Dividends received from associates B6 5 14 5 Net change to cash flow from investment in term deposits – (1) – Net cash flows from investing activities 26 (476) (514) Cash flows from financing activities Dividends paid to equity shareholders D1 (304) (292) (252) Capital element of lease payments (192) (185) (195) Cash outflow on settlement of debt-related foreign exchange forward contracts C2 (9) (11) (4) Proceeds from new debt 1,232 – – Debt repayments C7 (700) (464) – Net cash flows from financing activities 27 (952) (451) Net increase/(decrease) in cash and cash equivalents 1,025 (560) (49) Cash and cash equivalents at beginning of period 467 1,062 1,064 Exchange gain/(loss) on cash and cash equivalents 97 (35) 47 Cash and cash equivalents at end of the financial period C3 1,589 467 1,062 1. Interest paid includes the interest element of lease payments of $31m (2024: $31m; 2023: $30m). 2. Refer to foreign currency translation in material accounting policies section. 152 Rentokil Initial plc Annual Report 2025 |
|
Notes to the Consolidated Financial Statements Material accounting policies Basis of preparation The Consolidated Financial Statements have been prepared in accordance with UK-adopted International Accounting Standards (IAS) and with the requirements of the Companies Act 2006 as applicable to companies reporting under those standards. The Consolidated Financial Statements also comply fully with International Financial Reporting Standards (IFRSs) as issued by the International Accounting Standards Board (IASB). The Consolidated Financial Statements have been prepared under the historical cost convention, as modified by the revaluation of certain financial assets and liabilities (including derivative instruments). Certain financial and equity instruments have been measured at fair value. Climate change The Group has engaged in a detailed review of expected climate change impacts on the business and its assets and liabilities, to establish any adjustments required and what disclosure is necessary in the Consolidated Financial Statements for 2025 under a 1.5–2.0°C pathway. This process has been completed to ensure material accuracy of the financial reporting, and that disclosure of relevant information complies with the requirements of IAS 1. The process has involved a detailed review of material revenue segments, all balance sheet line items, and each element of the Group target to reach net zero by 2040, to identify if any of these items are expected to be materially impacted in a negative or positive way by weather, legislative, or societal changes. The conclusions of this process were reviewed and agreed by the Audit Committee and Board on 12 December 2025. Overall, the conclusion of the review was that, while there will undoubtedly be impacts on the Group, the highly disaggregated nature of the operations significantly reduces the risk profile of the Group to impacts from weather-related changes. The changes necessary to achieve net zero will not have a materially adverse impact on the cash flows of the Group and indeed, warmer climates may present some opportunities. Societal and legislative impacts are not felt to have a material impact on any one segment such that we need to break out reporting in a different way from previous years. Judgements are not felt to be significant, although clearly, understanding of climate change is developing with time. The area with the most judgement is goodwill impairment testing and a description is given in Note B2 of the processes undertaken to give comfort on the valuations. Management review has concluded that this is the only area that has judgement and potential for material impact, although we conclude that none are necessary and that no further disclosures are needed beyond this note. Going concern The Directors have prepared Board-approved cash flow forecasts for a period of 18 months to 30 June 2027 to demonstrate that the Group has sufficient liquidity to meet its obligations as they fall due for the period of at least 12 months from the date of approval of these Consolidated Financial Statements, with a longer assessment period to 30 June 2027 being considered as appropriate. Additionally, the Directors have assessed severe but plausible downside scenarios. The downside scenarios include: (i) a revenue decline of 20% against base budget for six months; and (ii) a 20% revenue decline for 12 months. Both of these scenarios are considerably worse than the actual impact of the COVID-19 pandemic in 2020. These assessments were prepared on the conservative assumption that the Group has no access to the debt capital markets. As part of their analysis, the Board considered mitigating actions at their discretion to improve the position identified by the analysis if the debt capital markets are not accessible, such as cost savings, and adjusting the level of M&A activity and/or dividends paid. In addition to the above, the Directors also considered that the Group has the ability to extend existing or raise new financing, although this was not included in the modelling undertaken for going concern assessment. The Going Concern analysis demonstrates that under the base case, the Group has c.$0.8bn of headroom at 30 June 2027 and c.$0.5bn under the severe but plausible downside scenario. This is before potential mitigations available, estimated to be c.$1.2bn. Based on the above, the Directors have concluded that the Group is well placed to manage its financing and other business risks and have a reasonable expectation that the Group will have adequate resources to continue in operation for at least 12 months from the signing date of these Consolidated Financial Statements. They therefore consider it appropriate to adopt the going concern basis in preparing these Consolidated Financial Statements. Consolidation (a) Subsidiaries Subsidiaries are entities controlled by the Group. The Group controls an entity when it: (i) has power over the entity; (ii) is exposed or has rights to variable returns from its involvement with the entity; and (iii) has the ability to affect those returns through its power over the entity. The Group reassesses whether or not it controls a subsidiary if facts and circumstances indicate that there are changes to one or more of these three elements of control. The financial statements of subsidiaries are included in the Consolidated Financial Statements from the date that control commences until the date that control ceases. Inter-company transactions, balances, and gains and losses on transactions between Group companies are eliminated on consolidation. When less than 100% of the issued share capital of a subsidiary is acquired, and the acquisition includes an option to purchase the remaining share capital of the subsidiary, the anticipated acquisition method is applied where judged appropriate to do so. The judgement is based on the risks and rewards associated with the option to purchase, meaning that no non-controlling interest is recognised. A liability is carried on the balance sheet equal to the fair value of the option to purchase. This is revised to the fair value at each reporting date, with differences being recorded in equity. Where the Group ceases to have control of a subsidiary, the assets and liabilities are derecognised along with any related non-controlling interest and other components of equity. Any resulting gain or loss is recognised in the income statement. Any interest retained in the former subsidiary is measured at fair value when control ceases. Changes in the Group’s interest in a subsidiary that do not result in a loss of control are accounted for as equity transactions. The results and cash flows of significant assets or businesses sold during the year are presented as discontinued operations in the Consolidated Statement of Profit or Loss and the Consolidated Cash Flow Statement. Assets and businesses are classified as held for sale when their carrying amounts are expected to be recovered through sale rather than through continuing use. They only meet the held for sale condition when the assets are ready for immediate sale in their present condition, management is committed to the sale, and it is highly probable that the sale will complete within one year. Depreciation ceases on assets and businesses when they are classified as held for sale and the assets and businesses are impaired if the proceeds less sale costs fall short of the carrying value. Losses applicable to the non-controlling interests in a subsidiary are allocated to the non-controlling interests, which may cause the non-controlling interests to have a deficit balance. Consideration in excess of net identifiable assets acquired in respect of non-controlling interests in existing subsidiary undertakings is taken directly to equity. (b) Associates Associates are those entities in which the Group has significant influence over the financial and operating policies, but not control. Significant influence is usually presumed to exist when the Group holds between 20% and 50% of the voting power of another entity. Associates are accounted for using the equity method and are initially recognised at cost. The Group’s investment includes goodwill identified on acquisition, net of any accumulated impairment losses. Rentokil Initial plc Annual Report 2025 153 Strategic Report Corporate Governance Financial Statements Other Information |
|
Notes to the Consolidated Financial Statements continued The Consolidated Financial Statements include the Group’s share of the total comprehensive income and equity movements of equity accounted investees, from the date that significant influence commences until the date that significant influence ceases. When the Group’s share of losses exceeds its interest in an equity accounted investee, the carrying amount is reduced to nil and recognition of further losses is discontinued, except to the extent that the Group has incurred legal or constructive obligations or made payments on behalf of an investee. Gains and losses on transactions between the Group and its associates are eliminated to the extent of the Group’s interest in the associates. Foreign currency translation (a) Functional and presentation currency Items included in the Financial Statements of each of the Group’s entities are measured using the currency of the primary economic environment in which the entity operates (the functional currency). The Consolidated Financial Statements are presented in US dollars, which differs from the functional currency of Rentokil Initial plc which remains in sterling. On 25 July 2024, the Group announced that with effect from 1 January 2025 it would be changing its presentation currency from sterling to US dollar. Within the Group’s current portfolio of businesses, sterling denominated earnings, while sizeable, are a relatively small proportion of overall earnings. To reduce the potential for foreign exchange volatility in our future reported earnings, the Board determined that, with effect from 1 January 2025, the Group will present its results in US dollar. Accordingly, to satisfy the requirements of IAS 21 The Effects of Changes in Foreign Exchange Rates, the reported results for the years ended 31 December 2024 and 31 December 2023 have been translated from sterling to US dollar using the following procedures: (i) assets and liabilities denominated in non-US dollar currencies were translated into US dollar at the relevant closing rates of exchange; (ii) the trading results of subsidiaries whose functional currency was other than US dollar were translated into US dollar at the average rates of exchange for the relevant period, with material items translated at the rate on the dates of transaction; (iii) share capital, share premium, capital reduction reserve, and merger relief reserve were translated at the historic rates prevailing on the date of each transaction; and (iv) the cumulative translation reserve balance was set to nil on 1 January 2004, the date of transition to IFRS, and has been represented on the basis that the Group has reported in US dollar since that date. A change in presentation currency represents a change in accounting policy under IAS 8 Accounting Policies, Changes in Accounting Estimates and Errors which is accounted for retrospectively. The £/$ rates used for this exercise are: average 2024 1.2773, 2023 1.2441; and closing 2024 1.2519, 2023 1.2737. (b) Group companies The results and financial position of all the Group entities that have a functional currency different from the presentation currency are translated into the presentation currency as follows: (i) assets and liabilities for each balance sheet presented are translated at the closing rate at the date of the balance sheet; (ii) income and expenses for each income statement are translated at average exchange rates; and (iii) all resulting exchange differences are recognised as a separate component of equity. On consolidation, exchange differences arising from the translation of the net investment in foreign entities, and of borrowings and other currency instruments designated as hedges of such investments or deemed to be quasi-equity, are taken to other comprehensive income. When a foreign operation is sold, such exchange differences are recognised in the income statement as part of the gain or loss on sale. (c) Transactions and balances Foreign currency transactions are translated into the functional currency using the exchange rates prevailing at the dates of the transactions. Foreign exchange gains and losses resulting from the settlement of such transactions, or from the translation of monetary assets and liabilities denominated in foreign currencies at reporting period end exchange rates, are recognised under the appropriate heading in the income statement; except when deferred in equity as qualifying net investment hedges or where certain intra-group loans are determined to be quasi-equity (normally not expected to be repaid). (d) Financial reporting in hyperinflationary economies The Group has operations in Argentina, Ghana, Lebanon, and Turkey, which remained hyperinflationary in 2025. The IAS 29 rules are applied as follows: (i) adjustment of the income statement at the end of the reporting period using the change in general price index; (ii) adjustment of historical cost non-monetary assets and liabilities for the change in purchasing power caused by inflation from the date of initial recognition to the balance sheet date; and (iii) adjustment of the income statement to reflect the impact of inflation and exchange rate movement on holding monetary assets and liabilities in the local currency. Consumer Price Indices have been used for the relevant hyperinflationary adjustments. The indices used for these adjustments are as follows: Country Index at 1 January 2025 Index at 31 December 2025 Argentina 7,693.70 10,121.37 Ghana 248.30 261.70 Lebanon 7,061.07 7,924.35 Turkey 2,684.55 3,513.87 Financial instruments Financial assets and financial liabilities are recognised when the Group becomes a party to the contractual provisions of the relevant instrument, and derecognised when it ceases to be a party to such provisions. Financial assets The Group classifies its financial assets depending on the purpose for which the financial assets were acquired. At initial recognition, the Group carries out a solely payments of principal and interest (SPPI) test and a business model test to establish the classification and measurement of its financial assets. Financial assets are classified in the following categories: (a) Amortised cost Financial assets under this classification are non-derivative financial assets held to collect the contractual cash flows until maturity and the cash flows are SPPI. Assets measured at amortised cost include trade and other receivables, cash and cash equivalents (excluding money market funds which are classified as fair value through profit and loss), and other investments. (b) Fair value through other comprehensive income These are non-derivative financial assets which can be for sale with cash flows that are SPPI. These assets are measured at fair value and changes to market values are recognised in other comprehensive income. The Group has no assets classified under this category. (c) Fair value through profit or loss Financial assets under this classification are assets that cannot be classified in any of the other categories. These assets are measured at fair value and changes to market values are recognised in profit and loss. Financial liabilities All financial liabilities are stated at amortised cost using the effective interest rate method except for derivatives, which are classified as held for trading (except where they qualify for hedge accounting) and are held at fair value. Financial liabilities held at amortised cost include trade payables, deferred consideration, and borrowings. 154 Rentokil Initial plc Annual Report 2025 |
|
Sources of estimation uncertainty and significant accounting judgements The use of estimates, assumptions, and judgements in the application of the Group’s accounting policies is explained below, with major sources of estimation uncertainty and significant judgements separately identified. Assumptions and estimation uncertainties The Group makes estimates and assumptions concerning the future. Estimates and assumptions are continually evaluated and are based on historical experience and other factors, including expectations of future events that are believed to be reasonable under the circumstances. Actual results may differ from these estimates and revisions to estimates are recognised prospectively. Sensitivities to the estimates and assumptions are provided, where relevant, in the Notes to the Consolidated Financial Statements. The estimates and assumptions that have a significant risk of causing a material adjustment to the carrying amounts of assets and liabilities within the next financial year are listed below (please refer to the relevant notes for further detail): (a) Termite damage claim provisions With the acquisition of Terminix in 2022, the Group assumed a liability for termite damage claims, based on termite customers existing at the acquisition date, for which a provision has been estimated. The liability arises when a termite infestation occurs, resulting in damage to a property which is under a termite contract, that requires subsequent remediation by the Group. The assumptions used to estimate the historical termite damage claim provisions are based on an assessment of the volume and value of future claims (based on historical information), customer churn rate, discount rates and inflation Starting from the acquisition date, an additional provision is recognised for all new termite customers upon commencement of their contract, based on the estimated average claim cost per customer over the lifetime of the contract. The trend of volume and value of claims will be monitored and reviewed over time and as such the value of the provisions is also likely to change. Sensitivity analysis is provided in Note A6. Significant accounting judgements Judgements made in applying accounting policies that have the most significant effects on the amounts recognised in the Consolidated Financial Statements are discussed below: (a) Useful economic life of brands The Terminix US brand, acquired in 2022, has been assessed as having an indefinite useful life. Prior to this acquisition, all brands were considered by management to have finite useful lives. Indefinite-lived assets do not get amortised and, therefore, if management had judged that the Terminix brand had a finite life then there would be a significant amortisation expense recognised annually in the income statement. At acquisition, the Terminix brand was valued at $1,435m, which based on a typical 15-year life would result in an annual amortisation charge of $96m. Other accounting estimates The Consolidated Financial Statements include other areas of accounting estimates that do not meet the definition of significant accounting estimates or accounting judgements under IAS 1. The recognition and measurement of certain material assets and liabilities are based on assumptions and/or are subject to longer-term uncertainties, as follows: (a) Impairment of goodwill and other assets The annual review for potential impairment of goodwill and other indefinite-lived intangible assets is primarily based on a value-in-use model. This model uses discounted cash flows to assess whether the goodwill carrying value can be supported or whether impairment is required. The model uses the following assumptions about the future: • revenue growth rate; • operating profit margin; • discount rate; and • long-term growth rate (inflation). Management anticipates that the likelihood of a reasonably possible change in assumptions resulting in a material misstatement is remote. Note B2 explains the impairment review process undertaken in the year. (b) Self-insurance provisions The Group self-insurance provision increased significantly through the acquisition of Terminix in 2022. Self-insurance provisions are valued annually with the support of external actuaries. Although the carrying value of the provision is significant, it is not expected that there would be any change to assumptions that would cause a significant adjustment to the carrying value in the next financial year and any impact would be expected to crystallise over the long term. Self-insurance provisions are disclosed in Note A6. (c) Provisions for uncertain tax positions The Group holds significant provisions for uncertain tax positions on the basis of amounts expected to be paid to the tax authorities. The Group’s current tax liabilities reflect management’s best estimate of the future amounts of corporation tax that will be settled. However, the actual outcome could be significantly different to the estimate made, as the ultimate tax liability cannot be known until a resolution has been reached with the relevant tax authority, or the issue becomes time-barred. Note A13 discusses in detail why the provisions are taken and explains the estimation uncertainty. Standards, amendments, and interpretations to published standards that are mandatorily effective for the current year Except as described below, the accounting policies applied in these Consolidated Financial Statements are the same as those applied in the Group’s Consolidated Financial Statements for the year ended 31 December 2024. The Group has adopted the following new standards and amendments to standards, including any consequential amendments to other standards, with effect from 1 January 2025: • amendments to IAS 21 – Lack of exchangeability The application of this amendment had no material impact on the disclosures of the amounts recognised in the Group’s Consolidated Financial Statements. New standards and interpretations not yet adopted Certain new accounting standards and interpretations have been published that are not mandatory for 31 December 2025 reporting periods, and have not been adopted early by the Group: • IFRS 18 – Presentation and disclosure in financial statements • IFRS 7 & IFRS 9 – Classification and Measurement of Financial Instruments and Power Purchase Agreements (PPAs) IFRS 18 is effective for annual periods beginning on or after 1 January 2027 and will replace IAS 1 – Presentation of financial statements. It will introduce new requirements that are intended to help to achieve comparability of the financial performance of similar entities, and provide more relevant information and transparency to users. Even though IFRS 18 will not impact the recognition or measurement of items in the financial statements, its impacts on presentation and disclosure are expected to be pervasive; in particular, those related to the statement of comprehensive income or loss, and providing management-defined performance measures within the financial statements. IFRS 7 & IFRS 9 is effective for annual periods beginning on or after 1 January 2026. Restatement is required under IAS 8 otherwise the cumulative effect is recognised in the opening balance of retained earnings and other equity components at the date of application. The amendments clarify IFRS 9 rules for derecognition, SPPI assessment (including ESG-linked features), and the treatment of renewable PPAs, while IFRS 7 introduces stronger disclosure requirements for contingent and ESG-linked terms to improve transparency. Management is currently assessing the detailed implications of applying the new standard on the Group’s consolidated financial statements. Rentokil Initial plc Annual Report 2025 155 Strategic Report Corporate Governance Financial Statements Other Information |
|
Notes to the Consolidated Financial Statements continued A. Operating A1. Revenue recognition and operating segments Revenue recognition Revenue represents the transfer of promised goods or services to customers in an amount that reflects the consideration to which the Group expects to be entitled. All revenue is considered revenue from contracts with customers as defined by IFRS 15, including job work and sales of goods. Under IFRS 15, revenue is recognised when a customer obtains control of goods or services in line with identifiable performance obligations. In the majority of cases, the Group considers that the contracts it enters into are contracts for bundled services which are accounted for as a single performance obligation. Accordingly, the majority of revenue across the Group is recognised on an output basis evenly over the course of the contract because the customer simultaneously receives and consumes the benefits provided by the Group’s performance as it performs. Job work is short-term contract revenue whereby the period of service is typically less than one month in duration. The performance obligations linked to this revenue type are individual to each job due to their nature, with revenue being recognised at a point in time on completion. Where consumables are supplied separately from the service contract, revenue is recognised at the point the goods transfer. The transaction price reported for all contracts is the price agreed in the contract and there are no material elements of variable consideration, financing component, or non-cash consideration. The Group applies the practical expedient in paragraph 121 of IFRS 15 and does not disclose information about remaining performance obligations because the Group has a right to consideration from customers in an amount that corresponds directly with the value to the customer of the performance obligations completed to date. Disaggregation of revenue into region, category, and major type of revenue stream is shown below under segment reporting. Performance obligations Contract service revenue These are mainly full-service contracts, inclusive of equipment, maintenance, and consumables as required. The inclusive service is treated as a single performance obligation. • Pest Control: the Group offers a range of services, with the most common being general pest maintenance contracts. Under this type of contract, the Group promises to provide a pest control service for the duration of the contract. In order to fulfil this promise, equipment is supplied (such as bait boxes) and a technician maintains and monitors the equipment at a set number of visits per year. The Group considers that this type of contract is a bundled service as the goods and services are not distinct in the context of the contract; equipment is not supplied without the service. Some countries offer an assurance warranty-type service where any additional call-outs are included in the contract price; in other countries, additional call-outs are chargeable. Where an assurance warranty is offered as part of the contract, revenue is recognised over the duration of the contract. Where no such warranty is offered, revenue is recognised at a point in time when the customer is visited. In addition, the Group offers certain termite contracts across a limited number of countries (including North America) where there is a single performance obligation. In these contracts, revenue is recognised as the performance obligation is satisfied, which is generally over a short time period of a few days. These contracts include assurance warranties that last for a period of 12 months from the date of service, but the warranty is not considered to be a performance obligation under IFRS 15. These contracts are annual contracts and are therefore recognised as contract service revenue. Some smaller acquired businesses have legacy termite contract terms that do offer service warranties, resulting in a spread of revenues over the contractual year. • Hygiene & Wellbeing: the Group offers a similar type of service to Pest Control, providing washroom equipment, consumables, and a technician to service the washroom. This type of contract will include a set number of visits. Dispensers are replenished by the technician. Management considers that the supply of goods and services are not distinct in the context of the contract. Dispensers and other equipment would not be supplied without providing the full service; the equipment is controlled by the Group and ownership does not transfer to the customer. Also included are contracts relating to interior landscaping, specifically the supply and maintenance of interior plants. Maintenance is only offered for plants that were supplied by the Group and therefore the services are not distinct in the context of the contract. The assets are positioned and situated by our technicians and the customer is not permitted to relocate them. At the end of the contract, any assets on the customer’s site are recovered. • France Workwear: the main type of contract is for supply and laundering of garments for commercial organisations. Supply and laundry are not offered separately, therefore management considers the services not to be distinct in the context of the contract. The service is treated as a bundle and a single performance obligation. Any equipment remains under ownership and control of the Group. Job work These services are short-term in nature and only an immaterial amount would straddle an accounting period end. There is usually only one performance obligation, with revenue recognised at the point of completion of the work. • Pest Control: an example of this type of revenue in the Pest Control category is bird-proofing, which is a one-off installation that, depending on the size of the site, may take between a few days and several weeks to complete. There is a single performance obligation (to install bird-proofing) and the customer is billed, and revenue recognised, at the end of the job. • Hygiene & Wellbeing: this type of revenue is generated, for example, by our Specialist Hygiene team, which performs specialist cleaning services such as graffiti removal, deep cleaning of kitchens and washrooms, trauma cleaning, flood or fire damage cleaning, and specialist deep cleaning services. These are usually short-term jobs (less than one week) and usually there is a single performance obligation with revenue recognised on completion of the job. 156 Rentokil Initial plc Annual Report 2025 |
|
Sale of goods Sale of products and consumables relates mainly to the pest distribution businesses, which sell pest control products to retailers and the pest control industry. In the Hygiene & Wellbeing business there are some sales of consumables to customers. In all cases, revenue is recognised at the point in time that ownership transfers to the customer. The Group does not consider that any judgements were made that would have a significant impact on the amount or timing of revenue recognised. Those contracts in the business where revenue is recognised over time are repetitive and are based on short cycles that repeat many times per year. Therefore, if revenue had been considered to be recognised at a point in time rather than over time, the in-year impact would be immaterial. The Group makes a charge against revenue for credit notes not yet issued at the balance sheet date. Contract costs Contract costs are mainly incremental costs of obtaining contracts (primarily sales commissions directly related to contracts obtained), and to a lesser extent costs to fulfil contracts which are not within the scope of other standards (mainly incremental costs of putting resources in place to fulfil contracts). It is anticipated that these costs are recoverable over the life of the contract to which they relate. Accordingly, the Group capitalises them as contract costs and amortises them over the expected life of the contracts. Management takes a portfolio approach to recognising contract costs, and the expected length of contracts across the Group and associated amortisation periods are between three and seven years. The contract costs recognised in the balance sheet at the period end amounted to $337m (2024: $298m; 2023: $285m). The amount of amortisation recognised in the period was $123m (2024: $117m; 2023: $150m). Applying the practical expedient in paragraph 94 of IFRS 15, the Group recognises the incremental costs of obtaining contracts as an expense when incurred if the amortisation period of the assets that the Group otherwise would have recognised is one year or less. Contract assets and accrued income Contract assets relate to the Group’s right to consideration for performance obligations satisfied, but where further performance obligations need to be satisfied before the customer can be invoiced. Accrued income is recognised where all performance obligations have been satisfied but the customer has yet to be invoiced. A receivable is recognised when all rights to consideration become unconditional, which usually occurs when the Group issues an invoice to the customer. All opening balances have been invoiced during the year. Contract liabilities Contract liabilities relate to advance consideration received from customers where the performance obligations have yet to be satisfied. All opening balances have subsequently been satisfied in the year. In most business categories where revenue is recognised over time, customers are invoiced in advance or simultaneously with performance obligations being satisfied. Segment reporting Segmental information in accordance with IFRS 8 Operating Segments has been presented on the next page. The Group’s operating segments are regions and this reflects the internal management reporting structures and the way information is reviewed by the chief operating decision maker (the Chief Executive). The businesses within each operating segment operate in a number of different countries and sell services across two business segments, with the workwear segment disposed of in the year. Following the acquisition of Terminix, the majority of the Group’s activity is in North America. With effect from 1 January 2025, the Group’s reporting structure has been changed to combine Europe including LATAM, UK & SSA, Pacific, and Asia & MENAT regions into a single operating and reporting segment, International. The Chief Executive remains as chief operating decision maker (CODM) and reviews the results on a monthly basis for the North America and International segments. All reporting to the Board is also done on this basis. Comparative segmental financial information for 2024 and 2023 has been represented. Disaggregated revenue under IFRS 15 is the same as the segmental analysis below. Restructuring costs, one-off and adjusting items, amortisation and impairment of intangible assets (excluding computer software), and central and regional costs are presented at a Group level as they are not targeted or managed at reportable segment level. The basis of presentation is consistent with the information reviewed by internal management. The segment profit or loss measure that is regularly provided to the CODM is Adjusted Operating Profit. Rentokil Initial plc Annual Report 2025 157 Strategic Report Corporate Governance Financial Statements Other Information |
|
Notes to the Consolidated Financial Statements continued Revenue and Profit Revenue 2025 $m Revenue 2024 $m Revenue 2023 $m Operating profit 2025 $m Operating profit 2024 $m Operating profit 2023 $m North America Pest Control 4,148 4,026 3,981 720 688 745 Hygiene & Wellbeing 146 138 131 29 25 23 Sub-total North America 4,294 4,164 4,112 749 713 768 International Pest Control 1,555 1,455 1,355 323 299 286 Hygiene & Wellbeing 1,059 998 918 195 180 169 Sub-total International 2,614 2,453 2,273 518 479 455 Total 6,908 6,617 6,385 1,267 1,192 1,223 Central and regional overheads – – – (191) (175) (150) Restructuring costs – – – (6) (9) (9) Revenue and Adjusted Operating Profit 6,908 6,617 6,385 1,070 1,008 1,064 One-off and adjusting items (287) (110) (119) Amortisation and impairment of intangible assets1 (199) (254) (218) Operating profit 584 644 727 Finance income 46 59 60 Finance cost (250) (250) (232) Share of profit from associates net of tax 10 9 11 Profit before income tax 390 462 566 1. Excluding computer software, which is included in our segment operating profit measure. Revenue and operating profit relate to the main groups of business segment and activity of Pest Control and Hygiene & Wellbeing following the disposal of France Workwear. Central and regional overheads represent corporate expenses that are not directly attributable to any reportable segment. Business segment revenue and operating profit are shown in the table below: Revenue 2025 $m Revenue 2024 $m Revenue 2023 $m Operating profit 2025 $m Operating profit 2024 $m Operating profit 2023 $m Pest Control 5,703 5,481 5,336 1,043 987 1,031 Hygiene & Wellbeing 1,205 1,136 1,049 224 205 192 Total business segments 6,908 6,617 6,385 1,267 1,192 1,223 Central and regional overheads – – – (191) (175) (150) Restructuring costs – – – (6) (9) (9) Revenue and Adjusted Operating Profit 6,908 6,617 6,385 1,070 1,008 1,064 One-off and adjusting items (287) (110) (119) Amortisation and impairment of intangible assets1 (199) (254) (218) Operating profit 584 644 727 1. Excluding computer software, which is included in our segment operating profit measure. Analysis of revenue by type Revenue 2025 $m Revenue 2024 $m Revenue 2023 $m Contract service revenue 4,803 4,643 4,489 Job work 1,549 1,472 1,365 Sales of goods 556 502 531 Total 6,908 6,617 6,385 Revenue from external customers attributed to the UK amounted to $497m (2024: $466m; 2023: $401m), with overseas countries accounting for the balance of $6,411m (2024: $6,151m; 2023: $5,984m). In 2025, the only country accounting for more than 10% of revenue from external customers was the US, totalling $4,184m (2024: $4,056m; 2023: $4,006m). The Group is not reliant on turnover from transactions with any single customer and does not receive 10% or more of its turnover from transactions with any single customer. 158 Rentokil Initial plc Annual Report 2025 |
|
Segment assets and liabilities are not provided because they are not reported to, or reviewed by, our CODM. Revenue and non-current assets for the country of domicile (UK), the US, France, Australia, India, and Spain (being the largest countries outside the UK), and for all other countries are: Revenue 2025 $m Non-current assets1 2025 $m Revenue 2024 $m Non-current assets1 2024 $m Revenue 2023 $m Non-current assets1 2023 $m UK 497 374 466 335 401 307 USA 4,184 8,499 4,056 8,554 4,006 8,578 France 186 103 176 358 170 359 Australia 252 230 247 216 225 211 India 93 104 88 110 74 102 Spain 110 95 98 88 90 98 Other countries 1,586 922 1,486 812 1,419 869 Total 6,908 10,327 6,617 10,473 6,385 10,524 1. Non-current assets include: intangible assets; property, plant and equipment; right-of-use assets; contract cost assets; and non-current other receivables. Other segment items included in the consolidated income statement are as follows: Depreciation, amortisation and impairment 2025 $m Net impairment losses on financial assets 2025 $m Depreciation, amortisation and impairment 2024 $m Net impairment losses on financial assets 2024 $m Depreciation, amortisation and impairment 2023 $m Net impairment losses on financial assets 2023 $m North America 256 66 269 62 270 43 International 238 8 263 9 218 6 Central and regional 34 – 33 – 28 – Total 528 74 565 71 516 49 A2. Earnings per share Basic earnings per share is calculated by dividing the profit after tax attributable to equity holders of the Company by the weighted average number of shares in issue during the year, excluding those held in the Rentokil Initial Employee Share Trust (see note at the bottom of the Consolidated Statement of Changes in Equity) which are treated as cancelled, and including share options for which all conditions have been met. For diluted earnings per share, the weighted average number of ordinary shares in issue is adjusted to include all potential dilutive ordinary shares. The Group’s potentially dilutive ordinary shares relate to the contingent issuable shares under the Group’s LTIPs to the extent that the performance conditions have been met at the end of the period. These share options are issued for nil consideration to employees if performance conditions are met. For the calculation of diluted earnings per share, 477,325 share options were anti-dilutive and not included in the calculation of the dilutive effect as at 31 December 2025 (2024: 435,578; 2023: 18,422). Details of the calculation of earnings per share are set out below: 2025 $m 2024 $m 2023 $m Profit attributable to equity holders of the Company from continuing operations 290 346 437 Profit attributable to equity holders of the Company from discontinued operations B7 180 46 37 Total profit attributable to equity holders of the Company 470 392 474 Weighted average number of ordinary shares in issue (million) 2,524 2,521 2,516 Adjustment for potentially dilutive shares (million) 11 7 11 Weighted average number of ordinary shares for diluted earnings per share (million) 2,535 2,528 2,527 Earnings per share for continuing operations Basic earnings per share (cents) 11.49 13.72 17.37 Diluted earnings per share (cents) 11.44 13.69 17.29 Earnings per share for discontinued operations Basic earnings per share (cents) 7.13 1.82 1.47 Diluted earnings per share (cents) 7.10 1.82 1.46 Total earnings per share Basic earnings per share (cents) 18.62 15.54 18.84 Diluted earnings per share (cents) 18.54 15.51 18.75 Rentokil Initial plc Annual Report 2025 159 Strategic Report Corporate Governance Financial Statements Other Information |
|
Notes to the Consolidated Financial Statements continued A3. Trade and other receivables The Group’s trade receivables are recognised at the transaction price less provision for impairment. They are generally due for settlement within 30 days and are all classified as current. The amount of the provision for impairment is recognised in the income statement and movements on provisions for impaired trade receivables are recognised within operating expenses in the income statement. Amounts are generally charged to the provision for impairment of trade receivables when there is no expectation of recovering additional cash. Expected credit loss (ECL) calculations are performed and are used to calculate the provision for impairment of trade receivables. ECL calculations are a probability-weighted estimate of credit losses and are performed at country level. The Group applies the simplified method of applying lifetime ECLs to trade receivables using an allowance matrix to measure the ECLs of trade receivables from its customers, which comprise customer portfolios across several countries. Credit risk factors that are considered as part of ECL calculations may include, but are not limited to: payment history, customer size, customer type (national/residential/commercial/government), age of debt, industry strength, economy, environmental factors such as climate change, and product or service provided. Loss allowances are also calculated on other financial assets, although the amounts are generally not significant and the asset is recognised net of the allowance. There is limited concentration of credit risk with respect to trade receivables due to the Group’s customer base being large and diverse. The amount of credit risk with respect to customers is represented by the carrying amount on the balance sheet. The Group policy is that credit facilities for new customers are approved by designated managers at regional level. Credit limits are set with reference to trading history and reports from credit rating agencies where they are available. Where this is not feasible, the Group may request payment in advance of work being carried out, or settlement by credit card on completion of the work. There are no trade receivables that would otherwise be past due or impaired whose terms have been renegotiated. 2025 $m 2024 $m Trade receivables 877 883 Less: provision for impairment of trade receivables (78) (82) Trade receivables – net 799 801 Other receivables1 172 160 Prepayments 84 96 Accrued income 145 147 Contract assets 3 4 Total 1,203 1,208 Analysed as follows: Non-current 52 71 Current 1,151 1,137 Total 1,203 1,208 1. Other receivables are stated net of loss allowance of $nil (2024: $nil). All of the Group’s provision for impairment relates to trade receivables. Analysis of the Group’s provision for impairment of trade receivables is as follows: 2025 $m 2024 $m 2023 $m At 1 January 82 87 87 Exchange differences 3 (1) (4) Additional provision 82 80 59 Receivables written off as uncollectable (79) (80) (48) Unused amounts reversed (7) (8) (10) Acquisition of companies and businesses – 4 3 Disposal of companies and businesses (3) – – At 31 December 78 82 87 The ageing of trade receivables and provision for impairment is as follows: Trade receivables 2025 $m Provision for impairment 2025 $m Trade receivables 2024 $m Provision for impairment 2024 $m Not due 387 – 362 – Overdue by less than 1 month 206 (1) 213 (1) Overdue by between 1 and 3 months 108 (6) 152 (4) Overdue by between 3 and 6 months 79 (9) 67 (14) Overdue by between 6 and 12 months 46 (17) 49 (25) Overdue by more than 12 months 51 (45) 40 (38) At 31 December 877 (78) 883 (82) 160 Rentokil Initial plc Annual Report 2025 |
|
The carrying amounts of the Group’s trade receivables are denominated in the following currencies: 2025 $m 2024 $m Pound sterling 79 71 Euro 167 200 US dollar 380 378 Other currencies 251 234 Carrying value 877 883 Fair value is considered to be equal to carrying value for all trade and other receivables. A4. Inventories Inventories are stated at the lower of cost and net realisable value. Cost is determined using the weighted average cost method. The cost of finished goods and work in progress comprises design costs, raw materials, direct labour, other direct costs, and related production overheads (based on normal operating capacity). It excludes borrowing costs. Net realisable value is the estimated selling price less applicable variable selling expenses. 2025 $m 2024 $m Raw materials 18 19 Work in progress 1 4 Finished goods 289 264 308 287 An inventory impairment charge of $1m was recognised in 2025 (2024: $2m; 2023: $4m). Inventory recognised as an expense during the period was $417m (2024: $464m; 2023: $479m). A5. Trade and other payables 2025 $m 2024 $m Trade payables 382 394 Social security and other taxes 109 114 Other payables 86 119 Accruals 483 432 Contract liabilities1 292 312 Deferred consideration 16 21 Contingent consideration2 70 94 Total 1,438 1,486 Analysed as follows: Other payables 25 38 Deferred consideration – 1 Contingent consideration2 21 47 Total non-current portion 46 86 Current portion 1,392 1,400 Total 1,438 1,486 1. Contract liabilities represents customer invoices where performance obligations have not yet been satisfied. All opening balances have subsequently been satisfied in the year. In most business categories, our customers are invoiced in advance or simultaneously with performance obligations being satisfied. 2. Contingent consideration includes put option liability of $31m (2024: $33m). Other than the put options, there are no liabilities in the table above that bear interest or are discounted, and therefore the cash flows are equal to the carrying value of the liabilities. Cash is due to flow between one and five years for all non-current liabilities and not beyond. Fair value is equal to carrying value for all trade and other payables. There is no material difference between the fair value and carrying value for all trade and other payables. Put options are held following the acquisition of PCI in 2017, where the seller may require the Group to purchase the remaining shares of the business in stages over a fixed term between 2023 and 2027. The put options are accounted for as an anticipated acquisition of the remaining shares and no non-controlling interest is recognised. The Group recognised a put option liability for the anticipated acquisition of these shares in contingent consideration, and any movements in the carrying value are recognised through Profit and Loss. The third put option is yet to be exercised and the Group’s total shareholding in PCI remains at 73%. Given the volume of acquisitions and the variety of inputs to the valuation of contingent consideration (depending on each transaction), there is not considered to be any change in input that would have a material impact on the contingent consideration liability. Rentokil Initial plc Annual Report 2025 161 Strategic Report Corporate Governance Financial Statements Other Information |
|
Notes to the Consolidated Financial Statements continued The currency split of trade and other payables is as follows: 2025 $m 2024 $m Pound sterling 196 207 Euro 228 284 US dollar 667 666 Other currencies 347 329 Carrying value 1,438 1,486 The ageing of trade payables is as follows: 2025 $m 2024 $m Less than one year 382 393 Between one and five years – 1 More than five years – – Total 382 394 Maturity analysis for lease liabilities is included in Note B4, and other financial liabilities in Note C6. A6. Provisions for liabilities and charges The Group has provisions for termite damage claims, self-insurance, environmental, and other. Provisions are recognised when the Group has a present obligation as a result of past events, it is probable that an outflow of resources will be required to settle the obligation, and the amount is capable of being reliably estimated. If such an obligation is not capable of being reliably estimated it is classified as a contingent liability (Note D3). Future cash flows relating to these obligations are discounted when the effect is material. The effect of discounting environmental provisions and other provisions is not considered to be material due to the low level of expected future cash flows. Termite damage claim provisions and self-insurance provisions are discounted, and the majority of these provisions are held in the US. The discount rate used is based on US government bond rates, and was 3.94%–5.16% (2024: 4.48%–5.25%). Termite damage claims $m Self-insurance $m Environmental $m Other $m Total $m At 1 January 2024 330 209 21 14 574 Exchange differences – – (1) (1) (2) Additional provisions 25 126 1 10 162 Used during the year (86) (105) (3) (12) (206) Unused amounts reversed (16) – (1) (2) (19) Acquisition of companies and businesses – – – 2 2 Unwinding of discount on provisions 13 1 – – 14 At 31 December 2024 266 231 17 11 525 At 1 January 2025 266 231 17 11 525 Exchange differences – – – 2 2 Additional provisions 201 126 6 10 343 Used during the year (95) (89) (3) (12) (199) Unused amounts reversed – (2) – (3) (5) Acquisition of companies and businesses – – – 2 2 Disposal of companies and businesses – – (9) – (9) Unwinding of discount on provisions 12 1 – – 13 At 31 December 2025 384 267 11 10 672 2025 Total $m 2024 Total $m Analysed as follows: Non-current 397 381 Current 275 144 Total 672 525 162 Rentokil Initial plc Annual Report 2025 |
|
Termite damage claims The Group holds provisions for termite damage claims covered by contractual warranties. Termite damage claim provisions are subject to significant assumptions and estimation uncertainty. The assumptions included in valuing termite provisions are based on an estimate of the volume and value of future claims (based on historical), customer churn rates, discount rates and inflation. Additional amendments may be necessary based on specific underlying facts of the particular legal claim as and when they develop. These provisions are expected to be substantially utilised within the next 15 years at a declining rate. The trend of volume and value of claims is monitored and reviewed over time (with the support of external advisors). It is reasonably possible, based on experience to date, that outcomes within the next financial year that are different from the assumption could require an adjustment to the carrying amount of the provision. The Group’s provision relates to legacy customer claims (contracts from the period prior to the acquisition of Terminix), estimated at $358m (2024: $246m); and new customer claims, estimated at $26m (2024: $20m). The sensitivity of the legacy claims liability balance to changes in the inputs is illustrated as follows: • Discount rate – The exposure to termite damage claims is largely based within the US, therefore measurement is based on a seven-year US bond risk-free rate. During 2025, interest rates (and therefore discount rates) have decreased. Rates could move in either direction and management has modelled that an increase/decrease of 50 bps in yields would decrease/increase the provision by $7m (2024: $6m). Over the 12 months to 31 December 2025, seven-year risk-free rate yields have decreased 54 bps from 4.48% to 3.94% (2024: increased 60 bps). • Claim value – Claim value forecasts have been based on the latest available historical settled Termite claims. Claims values are dependent on a range of inputs including, housing costs, materials costs (e.g. timber), whether a claim becomes litigated or not, and specific circumstances including contributory factors at the premises. Management has used an average of claim costs for the last 12 months for non-litigated claims and 24 months for litigated claims, adjusted where necessary to account for ageing of claims, to determine an estimate for costs per claim. Fluctuations in input prices (e.g. timber prices), as have been experienced over recent years, means that there is potential for volatility in claim values and therefore future material changes in provisions. Management has modelled that an increase/decrease of 5% in litigated claim values would increase/decrease the provision by c.$5m (2024: $4m) and an increase/decrease of 5% in non-litigated claim values would increase/decrease the provision by c.$9m (2024: $8m). Over the 12 months to 31 December 2025, costs per litigated claim rose by c.48% (2024: rose 8%) and non-litigated costs rose by 8% (2024: 45%). Actual value of claims settled in the year to December 2025 has been at a combined cost per claim 14% higher than that seen throughout 2024. This is not representative of management’s expectation of future costs as ageing of claims, which drives an increased cost per claim, has reduced in recent months along with a flattening of global inflation, and cost per claim is expected to continue to improve. • Claim rate – Management has estimated claim rates based on historical incurred claims. Data has been captured, to establish incidence curves that can be used to estimate likely future cash outflows. Changes in rates of claim are largely outside the Group’s control and may depend on litigation trends within the US, and other external factors such as how often customers move property and how well they maintain those properties. This causes estimation uncertainty that could lead to material changes in provision measurement. Management has modelled that an increase/decrease of 5% in litigated claim rates would increase/decrease the provision by c.$5m (2024: $4m) and an increase/decrease of 5% in non-litigated claim rates would increase/decrease the provision by c.$9m (2024: $8m) accordingly. Over the 12 months to 31 December 2025, litigated claim rates rose by 75% (2024: fell 52%) and non-litigated claim rates fell by 6% (2024: rose 7%). • Customer churn rate –If customers choose not to renew their contracts each year, then the assurance warranty falls away. As such there is sensitivity to the assumption on how many customers will churn out of the portfolio of customers each year. Data has been captured and analysed to establish incidence curves for customer churn, and forward-looking assumptions have been made based on these curves. Changes in churn rates are subject to macroeconomic factors and the performance of the Group. A 1% increase or decrease in customer churn rates, would decrease or increase the provision by $13m (2024: $9m), accordingly. On average over the last 10 years churn rates have moved by +/– c.2% per annum (2024: +/-2%). • Inflation rate – The exposure to termite damage claims is largely based within the United States and therefore measurement is based on expected long term inflation trends. Settlement costs are driven by a number of factors as discussed in the claim cost section. Management has seen a trend that these costs have tracked above baseline US inflation rates and therefore a premium is taken to expected future inflation rates of 1% per annum. Rates could move in either direction and management has modelled that an increase/decrease of 50 bps would increase/decrease the provision by $6m (2024: $5m). Self-insurance The Group’s self-insurance provisions provide coverage for exposures related to the self-insured retention (SIR), or excesses/deductibles, mainly on General (Public) Liability, Third-Party Automobile Liability and Workers’ Compensation policies. In order to help mitigate the cost of external insurance, the Group self-insures a level of cover on its major insurance policies. At 31 December 2025, the Group recognised provisions of $267m (2024: $231m) in relation to these risks, and the Group retains the primary obligation for these matters. External actuaries are used to help management estimate the provisions held. Due to the nature of the claims, the timing of utilisation of these provisions is uncertain. Based on confirmed insurance coverage, and management’s assessment that reimbursement is virtually certain, a separate reimbursement asset of $43m (2024: $30m) is recognised within Other Receivables in Note A3. The reimbursement asset is not offset against the related provision in accordance with IAS 37.53. Environmental The Group owns, or formerly owned, a number of properties in Europe and the US where environmental contamination is being managed. These issues tend to be complex to determine and resolve and may be material, although it is often not possible to accurately predict future costs of management or remediation reliably. Provisions are held where liability is probable and costs can be reliably estimated. Contingent liabilities exist where the conditions for recognising a provision under IAS 37 have not been met. The Group monitors such properties to determine whether further provisions are necessary. The provisions that have been recognised are expected to be substantially utilised within the next five years. Other Other provisions principally comprise amounts required to cover obligations arising and costs relating to disposed businesses and restructuring costs. Other provisions also includes costs relating to onerous contracts and property dilapidations settlements. Existing provisions are expected to be substantially utilised within the next five years. Rentokil Initial plc Annual Report 2025 163 Strategic Report Corporate Governance Financial Statements Other Information |
|
Notes to the Consolidated Financial Statements continued A7. Operating expenses Operating expenses from continuing operations include the following items: Notes 2025 $m 2024 $m 2023 $m Employee costs A9 3,241 3,128 3,045 Direct materials and services 1,166 1,089 1,087 Vehicle costs 368 360 345 Property costs 144 131 129 Depreciation and impairment of property, plant and equipment B3 135 129 123 Amortisation and impairment of intangible assets B2 236 287 250 Other operating expenses1 960 778 630 Total operating expenses 6,250 5,902 5,609 1. Other operating expenses includes professional fees, marketing costs, and amortisation of contract costs. A8. Auditors’ remuneration 2025 $m 2024 $m 2023 $m Fees payable to the Company’s auditors for the audit of the Parent Company and Group accounts 5 6 5 Audit of accounts of subsidiaries of the Group 8 8 9 Audit-related assurance services1 1 – – Total 14 14 14 1. Fees for 2024 and 2023, related to the attestation report required by Section 404 of the Sarbanes-Oxley Act, have been reclassified from the audit-related assurance services, to “Fees payable to the Company’s auditors for the audit of the Parent Company and Group accounts” and “Audit of accounts of subsidiaries of the group”, to conform to the current year presentation. A9. Employee benefit expense Profit-sharing and bonus plans The Group recognises a liability and an expense for bonuses and profit-sharing, based on calculations of achievements of financial performance targets and the best estimate of the obligation to employees related to personal performance criteria being achieved. A liability is recognised where a contractual obligation exists or where past practice indicates that there is a constructive obligation to make such payments in the future. Holiday pay Paid holidays are regarded as an employee benefit and as such are charged to the income statement as the benefits are earned. An accrual is made at the balance sheet date to reflect the fair value of holidays earned but not yet taken. Termination benefits Termination benefits are payable when an employment is terminated before the normal retirement date, or whenever an employee accepts voluntary redundancy in exchange for these benefits. The Group recognises termination benefits when it is demonstrably committed to either: terminating the employment of current employees according to a detailed formal plan without possibility of withdrawal; or providing termination benefits as a result of an offer made to encourage voluntary redundancy. Benefits falling due more than 12 months after the balance sheet date are discounted to present value where the effect of discounting is material. 2025 $m 2024 $m 2023 $m Wages and salaries 2,862 2,782 2,783 Social security costs 284 261 186 Share-based payments 28 25 34 Pension costs: – defined contribution plans 61 57 39 – defined benefit plans 6 3 3 3,241 3,128 3,045 Monthly average number of people employed by the Group during the year: 2025 Number 2024 Number 2023 Number Processing and service delivery 47,620 46,381 45,323 Sales and marketing 7,590 7,584 7,245 Administration and overheads 8,874 9,095 8,447 64,084 63,060 61,015 164 Rentokil Initial plc Annual Report 2025 |
|
Emoluments of the Directors of Rentokil Initial plc are detailed below. Highest paid Director $000 Other Directors $000 2023 Aggregate emoluments excluding share options 2,416.4 1,478.5 Aggregate gains made by Directors on exercise of share options 4,639.7 – Aggregate amount receivable under long-term incentive schemes 1,738.7 603.8 Aggregate value of Company contributions to defined contribution pension schemes – – 8,794.8 2,082.3 2024 Aggregate emoluments excluding share options 1,319.2 809.0 Aggregate gains made by Directors on exercise of share options 6,162.3 – Aggregate amount receivable under long-term incentive schemes 1,120.3 563.3 Aggregate value of Company contributions to defined contribution pension schemes – – 8,601.8 1,372.3 2025 Aggregate emoluments excluding share options 3,160.8 2,353.5 Aggregate gains made by Directors on exercise of share options 4,514.3 – Aggregate amount receivable under long-term incentive schemes 1,151.8 – Aggregate value of Company contributions to defined contribution pension schemes – – 8,826.9 2,353.5 2025 Number 2024 Number 2023 Number Number of Directors accruing retirement benefits – defined contribution schemes – – – – defined benefit schemes – – – Number of Directors exercising share options1 1 1 1 Number of Directors receiving shares as part of long-term incentive schemes 1 2 2 1. The highest-paid Director exercised 964,464 (2024: 986,515; 2023: 971,802) share options during the year. A10. Retirement benefit obligations Apart from contributions to legally required social security state schemes, the Group operates a number of pension schemes around the world covering many of its employees. Defined contribution pension plans A defined contribution plan is a pension plan under which the Group pays fixed contributions into a separate entity. The Group pays contributions to publicly or privately administered pension plans on a mandatory, contractual, or voluntary basis. The Group has no further payment obligations once the contributions have been paid. The contributions are recognised as an employee benefit expense when they are due. Prepaid contributions are recognised as an asset to the extent that a cash refund or a reduction in the future payments is available. Defined benefit pension plans A defined benefit pension plan is a plan that defines the amount of future pension benefit that an employee will receive on retirement, usually dependent on one or more factors such as years of service, compensation, and age. The asset or liability recognised in the balance sheet in respect of defined benefit pension plans is the fair value of plan assets, less the present value of the defined benefit obligation at the balance sheet date. The Group determines the net interest on the net defined benefit asset for the period by applying the discount rate used to measure the defined benefit obligation at the beginning of the annual period to the net defined benefit asset. The defined benefit obligation is calculated annually by independent actuaries using the projected unit credit method. The present value of the defined benefit obligation is determined by discounting the estimated future cash outflows using interest rates of high-quality corporate bonds that have a credit rating of at least AA, are denominated in the currency in which the benefits will be paid, and have terms to maturity approximating to the terms of the related pension liability. The Group will recognise a pension surplus as an asset where there is an unconditional right to a refund or where the Group has a right to reduce future pension contributions, taking into account the adverse effect of any minimum funding requirements. Current and past service costs, to the extent they have vested, and curtailments are recognised as charges or credits against operating profit in the income statement. Interest income on the net defined benefit asset is recognised in finance income. Remeasurement gains and losses arising from experience adjustments, return on plan assets, and changes in actuarial assumptions are charged or credited to the Consolidated Statement of Comprehensive Income. The largest retirement benefit obligation in the Group is the Rentokil Initial Irish Pension Scheme (which is in a surplus position). A number of smaller defined benefit and defined contribution schemes operate elsewhere, which are also funded through payments to trustee-administered funds or insurance companies. Defined benefit schemes are reappraised annually by independent actuaries based upon actuarial assumptions. Judgement is required in determining these actuarial assumptions, but this is not considered by management to be a significant accounting judgement as defined under IAS 1. Rentokil Initial plc Annual Report 2025 165 Strategic Report Corporate Governance Financial Statements Other Information |
|
Notes to the Consolidated Financial Statements continued The assumptions used for the Rentokil Initial Irish Pension Scheme are shown below: 31 December 2025 31 December 2024 Weighted average % Discount rate 4.3% 3.5% Future salary increases n/a n/a Future pension increases 2.0% 2.1% Inflation 2.0% 2.1% Risks The scheme exposes the Company to a number of risks, the most significant of which are: Asset volatility – Scheme liabilities are calculated using a discount rate set with reference to corporate bond yields; if assets underperform this yield, this will create a reduction in the current surplus position. The scheme holds a small proportion of growth assets (equities) which, although expected to outperform corporate bonds in the long term, create volatility and risk in the short term. The allocation to growth assets is monitored to ensure it remains appropriate given the long-term scheme objectives. Changes in bond yields – A decrease in corporate bond yields will increase the value placed on the scheme’s liabilities for accounting purposes, although this will be partially offset by an increase in the value of the scheme’s bond holdings. Inflation risk – An increase in inflation expectations will increase the value placed on the scheme’s liabilities for accounting purposes, although this may be partially offset to the extent that the scheme’s bond holdings include investments linked to inflation. Life expectancy – The majority of the scheme’s obligations are to provide benefits for the life of the member, so increases in life expectancy will result in an increase in the liabilities. For the Rentokil Initial Irish Pension Scheme, the expected duration is 15–16 years. Pension benefits The movement in the net defined benefit obligation for all Group pension schemes over the accounting period is as follows: Present value of obligation 2025 $m Fair value of plan assets 2025 $m Total 2025 $m Present value of obligation 2024 $m Fair value of plan assets 2024 $m Total 2024 $m At 1 January (71) 43 (28) (77) 45 (32) Current service costs¹ (1) – (1) – – – Interest on defined benefit obligation/asset¹ (2) 1 (1) (2) 2 – Exchange difference (6) 4 (2) 2 (3) (1) Total pension (expense)/income (9) 5 (4) – (1) (1) Remeasurements: – Remeasurement loss on scheme assets – (1) (1) – – – – Remeasurement gain on obligation 2 – 2 – – – Transfers – Transferred on disposal of business 8 – 8 – – – Contributions: – Employers (1) 2 1 (1) 1 – – Benefit payments 3 (2) 1 7 (2) 5 At 31 December (68) 47 (21) (71) 43 (28) Retirement benefit obligation schemes² (49) 22 (27) (53) 21 (32) Retirement benefit asset schemes³ (19) 25 6 (18) 22 4 1. Service costs and administration expenses are charged to operating expenses, and interest cost and return on plan assets to finance cost and finance income. 2. Benefit plans in an obligation position include plans situated in Austria, France, Germany, Hong Kong, India, Italy, Martinique, Norway, the Philippines, Saudi Arabia, South Africa, South Korea, Sri Lanka, Thailand, Trinidad and Tobago, and the UK. 3. Benefit plans in an asset position include plans situated in Australia, Barbados, and Ireland. Of the $68m (2024: $71m) of obligations in the table above, $16m (2024: $22m) is unfunded. Total contributions payable to defined benefit pension schemes in 2026 are expected to be less than $1m. 166 Rentokil Initial plc Annual Report 2025 |
|
The fair value of plan assets at the balance sheet date is analysed as follows: 2025 $m 2024 $m Equity instruments 4 4 Debt instruments – unquoted 20 18 Property 1 1 Other 22 20 Total plan assets 47 43 Where available, the fair values of assets are quoted prices (e.g. listed equity, sovereign debt, and corporate bonds). In other cases, the market value as provided by the fund managers has been used in accordance with IFRS 13 Fair Value Measurement: • unquoted debt instruments (level 2); • interest and inflation rate hedging instruments (level 2); and • pooled investment funds (level 3). Other significant assets are valued based on observable market inputs. Other assets primarily consist of cash. The cumulative actuarial gain recognised in the Consolidated Statement of Comprehensive Income was $44m (2024: $43m). A remeasurement gain of $1m was recognised during the year (2024: $nil). A11. Share-based payments Share-based compensation The Group operates two equity-settled share-based long-term incentive plans (LTIPs): the Performance Share Plan and the Restricted Share Plan. The economic cost of awarding shares and share options to employees is recognised as an expense in the income statement, equivalent to the fair value of the benefit awarded. The fair value of the Performance Share Plan is determined by reference to option pricing models, principally stochastic and adjusted Black-Scholes models. The fair value of the Restricted Share Plan is determined by reference to an adjusted Black-Scholes model. The charge for both plans is recognised in the income statement over the vesting period of the award. At each balance sheet date, the Group revises its estimate of the number of shares that vest or options that are expected to become exercisable. Any revision to the original estimates (other than those which are a result of movements in total shareholder return (TSR)) is reflected in the income statement with a corresponding adjustment to equity immediately to the extent it relates to past service, and the remainder over the rest of the vesting period. Performance Share Plan and Restricted Share Plan The Company has operated a share-based incentive for senior managers worldwide since 2006, initially through a Performance Share Plan, and then in 2023 a Restricted Share Plan was introduced. The main features of the schemes are as follows: • For Performance Share Plan awards made in 2023, 2024, and 2025, 50% of the award is based on TSR and 50% is based on performance against certain strategic and financial measures over the vesting period. • For Restricted Share Plan awards made in 2023, 2024 and 2025, there are no performance conditions attached. • The value of dividends paid during the vesting period is paid on the number of shares that ultimately vest in the form of additional shares. For awards that are nil-cost options made prior to May 2021, this is the value of dividends between grant and exercise. The total charge for the year relating to equity-settled share-based payment plans was $28m (2024: $25m; 2023: $32m). This includes charges for the Performance Share Plan and Restricted Share Plan of $28m (2024: $25m; 2023: $20m). In 2023, there were charges relating to the transfer of existing long-term incentive plans in Terminix and a non-recurring retention award totalling $12m. A summary of the number of shares in active Performance Share Plans is shown below: Share options outstanding Share options exercisable Year of Grant Vesting Year Scheme interest at 1 January 2025 Shares awarded during 2025 Shares lapsed during 2025 Shares vested during 2025 Shares outstanding at 31 December 2025 Shares exercisable at 1 January 2025 Shares vested during 2025 Shares exercised during 2025 Shares lapsed during 2025 Shares exercisable at 31 December 2025 2015 2018 – – – – – 1,183,287 – (1,183,287) – – 2016 2019 – 35,895 – (35,895) – 1,423,870 35,895 (177,522) – 1,282,243 2017 2020 – 29,651 (70) (29,581) – 1,172,343 29,581 (42,610) – 1,159,314 2018 2021 – 37,102 (1,032) (36,070) – 1,515,273 36,070 (74,885) – 1,476,458 2019 2022 – 37,188 (1,493) (35,695) – 1,518,848 35,695 (97,191) – 1,457,352 2020 2023 – 26,635 (1,879) (24,756) – 1,071,405 24,756 (62,325) – 1,033,836 2021 2024 – 21,432 (11,583) (9,849) – 891,443 9,849 (81,222) – 820,070 2022 2025 3,918,992 83,051 (2,502,398) (1,499,645) – 47,415 1,499,645 (540,593) – 1,006,467 2023 2026 4,031,442 828 (317,038) (6,375) 3,708,857 – 6,375 (6,375) – – 2024 2027 6,598,782 6,583 (1,216,776) (67,951) 5,320,638 – 67,951 (67,951) – – 2025 2028 – 8,090,985 (611,953) – 7,479,032 – – – – – Rentokil Initial plc Annual Report 2025 167 Strategic Report Corporate Governance Financial Statements Other Information |
|
Notes to the Consolidated Financial Statements continued Share options outstanding Share options exercisable Year of Grant Vesting Year Scheme interest at 1 January 2024 Shares awarded during 2024 Shares lapsed during 2024 Shares vested during 2024 Shares outstanding at 31 December 2024 Shares exercisable at 1 January 2024 Shares vested during 2024 Shares exercised during 2024 Shares lapsed during 2024 Shares exercisable at 31 December 2024 2013 2016 – – – – – 69 – (69) – – 2014 2017 – – – – – 1,151,851 – (1,151,851) – – 2015 2018 – 26,277 – (26,277) – 1,251,052 26,277 (94,042) – 1,183,287 2016 2019 – 31,575 – (31,575) – 1,427,960 31,575 (35,665) – 1,423,870 2017 2020 – 26,381 – (26,381) – 1,209,932 26,381 (62,824) (1,146) 1,172,343 2018 2021 – 33,926 – (33,926) – 1,564,454 33,926 (80,787) (2,320) 1,515,273 2019 2022 – 34,750 – (34,750) – 1,770,998 34,750 (286,233) (667) 1,518,848 2020 2023 – 24,304 – (24,304) – 1,241,998 24,304 (193,231) (1,666) 1,071,405 2021 2024 3,632,199 81,393 (1,878,836) (1,834,756) – – 1,834,756 (813,178) (130,135) 891,443 2022 2025 4,665,701 6,005 (705,299) (47,415) 3,918,992 5,951 47,415 (5,951) – 47,415 2023 2026 4,638,991 3,066 (610,615) – 4,031,442 – – – – – 2024 2027 – 7,110,973 (512,191) – 6,598,782 – – – – – A summary of the number of shares in active Restricted Share plans is shown below: Share options outstanding Share options exercisable Year of Grant Vesting Year Scheme interest at 1 January 2025 Shares awarded during 2025 Shares lapsed during 2025 Shares vested during 2025 Shares outstanding at 31 December 2025 Shares exercisable at 1 January 2025 Shares vested during 2025 Shares exercised during 2025 Shares lapsed during 2025 Shares exercisable at 31 December 2025 2023 2025 320,025 16,894 (295,844) (41,075) – – 41,075 (41,075) – – 2023 2026 794,075 832 (238,242) (146,110) 410,555 – 146,110 (146,110) – – 2024 2025 149,640 770 – (105,100) 45,310 – 105,100 (105,100) – – 2024 2026 234,965 – (81,850) (58,175) 94,940 – 58,175 (58,175) – – 2024 2027 786,290 – (157,455) – 628,835 – – – – – 2024 2028 90,630 – – – 90,630 – – – – – 2024 2029 90,630 – – – 90,630 – – – – – 2024 2030 90,630 – – – 90,630 – – – – – 2025 2025 – 31,278 – (31,278) – – 31,278 (31,278) – – 2025 2026 – 707,123 (14,409) – 692,714 – – – – – 2025 2027 – 467,658 – – 467,658 – – – – – 2025 2028 – 1,754,135 (283,050) – 1,471,085 – – – – – Share options outstanding Share options exercisable Year of Grant Vesting Year Scheme interest at 1 January 2024 Shares awarded during 2024 Shares lapsed during 2024 Shares vested during 2024 Shares outstanding at 31 December 2024 Shares exercisable at 1 January 2024 Shares vested during 2024 Shares exercised during 2024 Shares lapsed during 2024 Shares exercisable at 31 December 2024 2023 2024 195,310 – – (195,310) – – 195,310 (195,310) – – 2023 2025 88,465 260,000 (28,440) – 320,025 – – – – – 2023 2026 727,645 170,000 (103,570) – 794,075 – – – – – 2024 2025 – 149,640 – – 149,640 – – – – – 2024 2026 – 282,170 (47,205) – 234,965 – – – – – 2024 2027 – 914,085 (127,795) – 786,290 – – – – – 2024 2028 – 90,630 – – 90,630 – – – – – 2024 2029 – 90,630 – – 90,630 – – – – – 2024 2030 – 90,630 – – 90,630 – – – – – 168 Rentokil Initial plc Annual Report 2025 |
|
The fair value of the 2024 awards made under the Performance Share Plan is charged to the income statement over the vesting period, based on values derived from a Monte Carlo model prepared by external remuneration consultants. This is a closed-form solution which takes account of the correlation between share price performance and the likelihood of a TSR performance condition being met. For the shares awarded in March 2025, the significant inputs into the model were a share price of 338.8p (2024: 466.1p), an expected share price volatility of 32.6% (2024: 29.5%), a median share price correlation between the companies in the comparator group of 71.6% (2024: 73.1%), and an expected life commensurate with the three-year performance/vesting period. The share price volatility assumption is based on analysis of historical daily share prices. As the awards are nil-cost (i.e. there is no exercise price), the assumed risk-free rate of return has minimal impact on the fair value of the awards. Similarly, as dividend equivalents are paid on the vesting portion of awards, the fair value of these awards is not reduced to reflect dividends paid during the vesting period. The fair value of the 2025 awards made under the Restricted Share Plan is charged to the income statement over the vesting period based on the fair value of the award on grant date. The fair value of awards granted during 2025 was $38m (2024: $46m) and the weighted average fair value per award granted during the year was 262.3p (2023: 506.7p). The weighted average share price for options exercised in the year was 383.2p (2024: 471.4p) and the weighted average contract term remaining on shares unexercised at the year end was 533 days (2024: 535 days). A12. Income tax expense The income tax charge for the period comprises both current and deferred tax. Current tax charge represents the amount payable on this year’s taxable profits and any adjustment relating to prior years. Taxable profits differ from accounting profits as some items of income or expenditure are not taxable or deductible, or may be taxable or deductible in a different accounting period. The current income tax charge is calculated on the basis of the tax laws enacted or substantively enacted at the balance sheet date in the countries where the Group’s subsidiaries and associates operate and generate taxable income. Deferred tax is an accounting adjustment to provide for tax that is expected to arise in the future due to differences between accounting and tax bases. Deferred tax is determined using tax rates that are expected to apply when the timing difference reverses based on tax rates which are enacted or substantively enacted at the balance sheet date. Tax is recognised in the income statement, except to the extent that it relates to items recognised in other comprehensive income or equity. In this case, the tax is also recognised in other comprehensive income or equity as appropriate. Analysis of expense in the year: 2025 $m 2024 $m 2023 $m Current tax charge 119 110 114 Adjustment in respect of previous periods (5) 6 (11) Total current tax 114 116 103 Deferred tax (credit)/charge (14) 9 31 Deferred tax adjustment in respect of previous periods – (9) (5) Total deferred tax (14) – 26 Total income tax charge 100 116 129 The tax on the Group’s profit before tax differs from the theoretical amount that would arise using the weighted average tax rate applicable to profits of the consolidated companies as follows: 2025 $m 2024 $m 2023 $m Profit before tax 390 462 566 Tax calculated at domestic tax rates applicable to profits in the respective countries 99 119 144 Adjustment in respect of previous periods (5) (3) (16) Amounts not (taxable)/deductible for tax purposes – one-off and adjusting items – (1) 1 Expenses not deductible for tax purposes – other 10 8 7 Income not subject to tax (3) (3) (2) Impairment of goodwill – 8 – Deferred tax recognised on losses (6) (11) (4) Deferred tax impact of change in tax rates (4) (4) – Impact of items on which no deferred tax has been recognised 9 3 – Local business taxes 1 1 – US BEAT liability – – 1 Tax credits (2) (1) (2) Other 1 – – Total tax charge 100 116 129 The Group’s effective tax rate (ETR) for 2025 on reported profit before tax was 25.6% (2024: 25.1%; 2023: 22.8%). This compares with a blended rate of tax for the countries in which the Group operates of 25.3% (2024: 25.3%; 2023: 25.1%). The UK continues to apply a global minimum effective tax rate of 15% for 2025. The legislation implements a domestic top-up tax and a multinational top-up tax, however, the group does not expect a material top up tax each year (less than $1m). The Group continues to apply the temporary exception under IAS 12 for accounting for deferred taxes arising from the implementation of the Global Minimum Tax rules (GMT). The tax charge for the year ended 31 December 2025 includes an immaterial current tax charge related to GMT income taxes that rounds to $nil (2024: $nil) and so no country split has been provided. The Group continues to monitor developments in the implementation of the GMT rules around the world as guidance and legislation evolve. Rentokil Initial plc Annual Report 2025 169 Strategic Report Corporate Governance Financial Statements Other Information |
|
Notes to the Consolidated Financial Statements continued A tax credit of $18m has been recognised in other comprehensive income (2024: $8m charge; 2023: $7m credit), which mainly relates to the tax effect of mark to market movements on financial instruments and deferred tax on the cash flow hedge and cost of hedging reserves recorded within other comprehensive income. A13. Current income tax Tax liabilities are classified as current liabilities unless there is a right to defer the payment of the liability for at least one year after the balance sheet date. As at 31 December 2025, all the Group’s tax liabilities have been classified as current as there is no legally enforceable right to defer payment for more than 12 months. Current tax assets and liabilities are offset only when there is a legally enforceable right to set off the asset and liability, and there is an intention to either settle on a net basis or to realise the asset and settle the liability simultaneously. Where required by accounting standards, management establishes provisions for uncertain tax positions on the basis of amounts expected to be paid to the tax authorities. The Group’s current tax liabilities reflect management’s best estimate of the future amounts of corporation tax that will be settled. The Group is subject to income taxes in numerous jurisdictions. There are various uncertainties relating to the determination of its tax liabilities where the ultimate tax liability cannot be known until a resolution has been reached with the relevant tax authority, or the issue becomes time-barred. Issues can take many years to resolve and therefore assumptions on the likely outcome have to be made by management. Each country and tax risk is considered separately when deciding whether it is appropriate to set up an uncertain tax provision. If risks are considered to be linked, the Group will consider the tax treatment in aggregate where appropriate. This assessment of uncertain tax positions is based on management’s interpretation of relevant tax rules and decided cases, external advice obtained, the statute of limitations and the status of the negotiations, and past experience with tax authorities. In evaluating whether a provision is needed, it is assumed that tax authorities have full knowledge of the facts and circumstances applicable to each issue. Tax provisions can be built up over a number of years, but in the year of resolution there could be adjustments to these provisions which could have a material positive or negative impact on the tax charge for a particular year. The settlement of a significant issue could also have a material impact on the amount of cash tax payable in any one year. Judgement is required in determining the worldwide provision for income taxes, particularly in relation to the pricing of intra-group goods and services as well as debt financing. The majority of the tax provisions relate to transfer pricing exposures where the Group faces a number of risks in jurisdictions around the world, and is subject to audits by tax authorities in the territories in which it operates. These tax audits have an uncertain outcome and can take several years to resolve, which in some cases may be dependent on litigation. The actual outcome could vary from management’s estimates, but these are updated at each reporting period in the light of the latest available information. Total uncertain tax provisions (including interest thereon) amounted to $44m as at 31 December 2025 (2024: $48m). Included within this amount is $6m (2024: $6m) in respect of interest arising on tax provisions, which is included within other payables. These tax provisions relate to multiple issues across the countries in which the Group operates. The net decrease in the provisions for the year is mainly attributable to issues which have been settled in the year or have become statute-barred. The cash tax paid for the year was $104m (2024: $111m). The decrease was attributable mainly to one-off US tax deductions resulting from the One Big Beautiful Bill Act enacted on 4 July 2025. 2025 $m 2024 $m Current taxation has been presented on the balance sheet as follows: Current tax asset within current assets 18 28 Current tax liability within current liabilities (61) (53) (43) (25) A14. Deferred income tax Deferred income tax is provided on temporary differences arising between the tax bases of assets and liabilities and their carrying amounts in the Consolidated Financial Statements. The following temporary differences are not provided for: the initial recognition of goodwill; the initial recognition of assets or liabilities in transactions other than a business combination that at the time of the transactions affects neither the accounting nor taxable profit or loss; and differences relating to investments in subsidiaries to the extent that they will probably not reverse in the foreseeable future. The amount of deferred income tax is determined using tax rates (and laws) that have been enacted (or substantively enacted) at the balance sheet date, and are expected to apply when the related deferred income tax asset is realised or the deferred income tax liability is settled. Deferred tax balances are not discounted. Deferred tax assets and liabilities are offset against each other when the timing differences relate to income taxes levied by the same tax authority on an entity or different entities which are part of a tax consolidation and there would be the intention to settle on a net basis. Deferred income tax assets are recognised to the extent that it is probable that future taxable profits will be available against which the temporary differences can be utilised. The amount of deferred tax assets recognised at each balance sheet date is adjusted to reflect changes in management’s assessment of future taxable profits. In recognising the deferred tax asset in respect of losses, management has estimated the quantum of future taxable profits, applying a risk weighting to future profits to reflect the uncertainties. 170 Rentokil Initial plc Annual Report 2025 |
|
The movement on the deferred income tax account is as follows, which includes continuing and discontinued movements in Note A12 and Note B7 respectively: 2025 $m 2024 $m Deferred Tax at 1 January (595) (604) Exchange differences (7) 1 Impact of business combinations & disposals 43 25 Credited/(Charged) to the income statement 6 (5) Credited/(Charged) to other comprehensive income 18 (8) Credited/(Charged) to equity 1 (4) Deferred Tax at 31 December (534) (595) Deferred taxation has been presented on the balance sheet as follows: Deferred tax asset within non-current assets 55 43 Deferred tax liability within non-current liabilities (589) (638) (534) (595) The major components of deferred tax assets and liabilities at the year end and their changes during the year (without taking into consideration the offsetting of balances within the same tax jurisdiction) are as follows: Customer lists/ intangibles $m Accelerated tax depreciation $m Provisions $m IFRS 15 Contracts $m Tax losses $m Share-based payments $m Other2 $m Total $m At 1 January 2024 (703) (107) 190 (52) 48 19 1 (604) Exchange differences (1) – 4 (1) (1) – – 1 Recognised in income statement (5) 5 10 (24) 4 1 4 (5) Recognised in other comprehensive income – – – – – – (8) (8) Recognised in equity – – – – – (4) – (4) Impact of business combinations & disposals1 31 – (9) 3 – – – 25 At 31 December 2024 (678) (102) 195 (74) 51 16 (3) (595) At 1 January 2025 (678) (102) 195 (74) 51 16 (3) (595) Exchange differences (3) (6) 2 (2) 2 1 (1) (7) Recognised in income statement 2 13 7 (9) (7) 5 (5) 6 Recognised in other comprehensive income – – – – 10 – 8 18 Recognised in equity – – – – – 1 – 1 Impact of business combinations & disposals3 (9) 51 (2) 5 – – (2) 43 At 31 December 2025 (688) (44) 202 (80) 56 23 (3) (534) 1. Deferred tax liabilities have been adjusted in 2024 by a decrease of $35m relating to the Terminix acquisition with a corresponding reduction in goodwill. 2. Other deferred tax assets and liabilities include retirement benefits, unremitted earnings from subsidiaries, and the cash flow hedge reserve. 3. Deferred tax liabilities have been adjusted in 2025 by a decrease of $52m relating to the France Workwear disposal. A deferred tax asset of $56m has been recognised in respect of losses which are expected to be utilised within ten years (2024: $51m), of which $41m (2024: $38m) relates to UK losses (excluding capital losses) carried forward at 31 December 2025 (both amounts having increased due to foreign exchange translation by $3m during the year). These amount have been calculated by estimating the future taxable profits, against which the tax losses will be utilised, progressively risk-weighted, and applying the tax rates (substantively enacted as at the balance sheet date) applicable for each year. The estimates of future profits are based on management’s financial forecasts which are used to support other aspects of the Financial Statements, such as impairment testing. At the balance sheet date, the Group had tax losses of $397m (2024: $303m) on which no deferred tax asset is recognised because it is not considered probable that future taxable profits will be available in certain jurisdictions to be able to benefit from those tax losses. Of the losses, $340m (2024: $254m) will expire at various dates between 2026 and 2045. In addition, the Group has UK capital losses carried forward of $372m (2024: $346m) on which no deferred tax asset is recognised. All movements in the year are as a result of foreign exchange translation. These losses have no expiry date, but management considers the future utilisation of these losses to be unlikely. Dividends received from subsidiaries are largely exempt from UK taxation but may be subject to dividend withholding or other taxes levied by the overseas tax jurisdictions in which the subsidiaries operate. A deferred tax liability of $4m (2024: $4m) has been recognised in respect of this liability as it is anticipated that these profits will be distributed to the UK in the foreseeable future. At the balance sheet date, there is no material unprovided deferred tax liability were overseas earnings to be distributed to the UK. Rentokil Initial plc Annual Report 2025 171 Strategic Report Corporate Governance Financial Statements Other Information |
|
Notes to the Consolidated Financial Statements continued B. Investing B1. Business combinations All business combinations are accounted for using the purchase method (acquisition accounting) in accordance with IFRS 3 Business Combinations. The cost of a business combination is the aggregate of the fair values at the date of exchange of assets given, liabilities incurred or assumed, and equity instruments issued by the Group. The cost of a business combination is allocated at the acquisition date by recognising the acquiree’s identifiable assets, liabilities, and contingent liabilities that satisfy the recognition criteria at their fair values. Any excess of the purchase price over the fair value of the identifiable assets and liabilities is recognised as goodwill. The acquisition date is the date on which the acquirer effectively obtains control of the acquiree. An intangible asset is recognised if it meets the definition under IAS 38 Intangible Assets. The intangible assets arising on acquisition are goodwill, customer lists, and brands. Goodwill represents the synergies, workforce, and other benefits expected as a result of combining the respective businesses. Customer lists and brands are recognised at their fair value at the date of acquisition using an income-based approach, which involves the use of assumptions including customer termination rates, profit margins, contributory asset charges, and discount rates. At the date of acquisition, deferred and contingent consideration represents its fair value, with subsequent changes after the measurement period being recognised in the income statement. Costs directly attributable to business combinations are charged to the income statement as incurred and presented as one-off and adjusting items. Disclosures required by IFRS 3 Business Combinations are provided separately for those individual acquisitions that are considered to be material, and in aggregate for individually immaterial acquisitions. An acquisition would generally be considered individually material if the impact on the Group’s revenue and Adjusted Operating Profit measures (on an annualised basis) is greater than 5%, or the impact on goodwill is greater than 10% of the closing balance for the period. There were no individually material acquisitions in the year (2024: none). During the year, the Group purchased 100% of the share capital or trade and assets of 36 companies and businesses (2024: 36). The total consideration in respect of these acquisitions was $115m (2024: $232m), and the cash outflow from current and past period acquisitions net of cash acquired was $121m (2024: $219m). Goodwill on all acquisitions represents the synergies and other benefits expected to be realised from integrating acquired businesses into the Group, such as improved route density, expansion in use of best-in-class digital tools, and back office synergies. Details of goodwill and the fair value of net assets acquired in the year are as follows: 2025 $m 2024 $m Purchase consideration – Cash paid 90 147 – Deferred and contingent consideration 25 85 Total purchase consideration 115 232 Provisional fair value of net assets acquired (44) (65) Goodwill from current-year acquisitions 71 167 Goodwill expected to be deductible for tax purposes 48 105 Deferred consideration of $12m and contingent consideration of $13m are payable in respect of the above acquisitions (2024: $44m and $41m respectively). Contingent consideration is payable based on a variety of conditions, including revenue and profit targets being met. Amounts for both deferred and contingent consideration are payable over the next five years. The Group has recognised contingent and deferred consideration based on fair value at the acquisition date. A range of outcomes for contingent consideration payments cannot be estimated due to the variety of performance conditions and the volume of businesses the Group acquires. During the year, there were releases of contingent consideration liabilities not paid of $25m (2024: $9m). The fair values6 of assets and liabilities arising from acquisitions in the year are as follows: 2025 $m 2024 $m Non-current assets – Intangible assets1 47 72 – Property, plant and equipment2 4 14 Current assets3 9 35 Current liabilities4 (4) (30) Non-current liabilities5 (12) (26) Net assets acquired 44 65 1. Includes $46m (2024: $59m) of customer lists and $1m (2024: $13m) of other intangibles. 2. Includes $1m (2024: $5m) of ROU assets. 3. Includes cash acquired of $2m (2024: $3m), inventory of $2m (2024: $14m), and trade and other receivables of $5m (2024: $18m). 4. Includes trade and other payables of $4m (2024: $30m). 5. Includes $8m of deferred tax liabilities relating to acquired intangibles (2024: $11m), lease liabilities of $1m (2024: $5m), and other liabilities of $3m (2024: $10m). 6. The fair values of assets and liabilities from acquisitions in the current year will be finalised in the 2026 Financial Statements. These fair values are provisional as the acquisition accounting has not yet been finalised, primarily due to the proximity of many acquisitions to the year end. 172 Rentokil Initial plc Annual Report 2025 |
|
The cash outflow from current and past acquisitions is as follows: 2025 $m 2024 $m Total purchase consideration 115 232 Consideration payable in future periods (25) (85) Purchase consideration paid in cash 90 147 Cash and cash equivalents in acquired companies and businesses (2) (3) Cash outflow on current period acquisitions 88 144 Deferred and contingent consideration paid 33 75 Cash outflow on current and past acquisitions 121 219 From the dates of acquisition to 31 December 2025, new acquisitions contributed $29m to revenue and $3m to operating profit (2024: $86m and $2m respectively). If the acquisitions had occurred on 1 January 2025, the revenue and operating profit of the combined Group would have amounted to $6,943m and $584m respectively (2024: $6,689m and $646m respectively). B2. Intangible assets Intangible assets are stated at cost less accumulated amortisation and accumulated impairment losses, where applicable. A breakdown of intangible assets is as shown below: Goodwill $m Customer lists $m Indefinite-lived brands $m Other intangibles $m Product development $m Computer software $m Total $m Cost At 1 January 2024 6,471 1,860 1,436 97 83 291 10,238 Exchange differences (51) (48) (2) (1) (1) (7) (110) Additions – – – – 11 59 70 Disposals/retirements – (29) – (3) – (28) (60) Acquisition of companies and businesses 144 47 – 13 – – 204 Hyperinflationary adjustment 12 5 – 1 – – 18 At 31 December 2024 6,576 1,835 1,434 107 93 315 10,360 At 1 January 2025 6,576 1,835 1,434 107 93 315 10,360 Exchange differences 64 61 1 4 7 19 156 Additions – – – – 14 47 61 Disposals/retirements (5) (109) – (7) – (29) (150) Acquisition of companies and businesses 71 46 – 1 – – 118 Hyperinflationary adjustment – 2 – – – – 2 At 31 December 2025 6,706 1,835 1,435 105 114 352 10,547 Accumulated amortisation and impairment At 1 January 2024 (81) (878) – (50) (56) (203) (1,268) Exchange differences 6 35 – 1 2 5 49 Disposals/retirements – 29 – 3 – 26 58 Hyperinflationary adjustment (10) (2) – (1) – – (13) Impairment charge (36) – – – (3) – (39) Amortisation charge – (194) – (11) (10) (33) (248) At 31 December 2024 (121) (1,010) – (58) (67) (205) (1,461) At 1 January 2025 (121) (1,010) – (58) (67) (205) (1,461) Exchange differences (1) (49) – (2) (6) (14) (72) Disposals/retirements – 109 – 7 – 25 141 Hyperinflationary adjustment – (2) – – – – (2) Amortisation charge – (182) – (7) (10) (37) (236) At 31 December 2025 (122) (1,134) – (60) (83) (231) (1,630) Net book value At 1 January 2024 6,390 982 1,436 47 27 88 8,970 At 31 December 2024 6,455 825 1,434 49 26 110 8,899 At 31 December 2025 6,584 701 1,435 45 31 121 8,917 Rentokil Initial plc Annual Report 2025 173 Strategic Report Corporate Governance Financial Statements Other Information |
|
Notes to the Consolidated Financial Statements continued The main categories of intangible assets are as follows: Intangible assets – finite useful lives Intangible assets with finite useful lives are initially measured at either cost or fair value and amortised on a straight-line basis over their useful economic lives, which are reviewed on an annual basis. These assets are reviewed for impairment whenever events or changes in circumstances indicate that the carrying amount of the asset may exceed its recoverable amount. The fair value attributable to intangible assets acquired through a business combination is determined by discounting the expected future cash flows to be generated from that asset at the risk-adjusted weighted average cost of capital for the Group. The residual values of intangible assets are assumed to be $nil. The estimated useful economic lives of intangible assets are as follows: Customer lists: 3 to 15 years Other intangibles: 2 to 15 years Product development: 2 to 5 years Computer software: 3 to 5 years The following are the main categories of intangible assets with finite useful lives: (a) Customer lists Customer lists are acquired as part of business combinations. No value is attributed to internally generated customer lists. (b) Other intangibles Other intangibles consists of brands with finite useful lives and intellectual property. Brands are acquired as part of business combinations. No value is attributed to internally generated brands as expenditure incurred to develop, maintain, and renew brands internally is recognised as an expense in the period incurred. Intellectual property costs are incurred in acquiring and maintaining patents and licences. These are recognised only if the cost can be measured reliably, and they are expected to generate economic benefits beyond one year, in excess of their cost. (c) Product development Costs incurred in the design and testing of new or improved products are recognised as intangible assets only if the cost can be measured reliably, and it is probable that the project will be a success considering its commercial and technological feasibility. Capitalised product development expenditure is measured at cost less accumulated amortisation. Other development expenditure and all research expenditure are recognised as an expense as incurred and amount to $4m in the year (2024: $5m). Development costs recognised as an expense are never reclassified as an asset in a subsequent period. Development costs that have been capitalised are amortised from the date the product is made available. (d) Computer software Costs that are directly associated with the production of identifiable and unique software products that are controlled by the Group (including employee costs and external software development costs) are recognised as intangible assets, if they are expected to generate economic benefits beyond one year in excess of their cost. Purchased computer software is initially recognised based on the costs incurred to acquire and bring it into use. Costs associated with maintaining computer software are recognised as an expense in the period in which they are incurred. Intangible assets – indefinite useful lives (a) Goodwill Goodwill represents the excess of the cost of an acquisition over the fair value of the Group’s share of the net identifiable assets of the acquired business at the date of acquisition. It is recognised as an intangible asset. Goodwill arising on the acquisition of an associate is included in investments in associates. (b) Brands with indefinite useful lives Brands with indefinite useful lives are acquired as part of business combinations. No value is attributed to internally generated brands as expenditure incurred to develop, maintain, and renew brands internally is recognised as an expense in the period incurred. The Terminix US and Terminix International brands are considered to have indefinite useful lives due to their long history in the US (being founded in 1927) and having a strong brand equity in the US for much of their history and now internationally. The Group plans to continue to support and invest in the Terminix brand; it controls all the associated assets that support the underlying business, and therefore it is considered that there is no foreseeable limit on the period over which these brands will continue to generate net cash inflows. Goodwill and brands with indefinite useful lives are tested annually for impairment and carried at cost less accumulated impairment losses. For the purpose of impairment testing, goodwill is allocated to cash-generating unit groups (CGU groups) identified according to region of operation and reportable business unit. Gains and losses on the disposal of an entity include the carrying amount of goodwill relating to the entity sold. At the start of 2025, management reviewed its grouping of CGUs and its allocation of goodwill for the purposes of assessing impairment based on the lowest level at which the goodwill is monitored. Based on this review, management has determined that the Group now has six CGU groups. These are North America, UK & SSA, Europe, LATAM, Asia & MENAT, and Pacific. The key factors considered in management’s conclusion included the change in reporting segments to North America and International, to reflect the high proportion of business in the US, and the subsequent allocation of resources based on the results for each operating segment. 174 Rentokil Initial plc Annual Report 2025 |
|
Before initiating the change in CGU grouping, in accordance with IAS 36, management performed a value-in-use impairment test on the pre-existing CGU groups and determined there to be no impairment of goodwill within any of the groups. The recoverable amount of a CGU group is determined based on the higher of value-in-use calculations using cash flow projections, and fair value less costs to sell. The cash flow projections in year one are based on financial budgets approved by management, which are prepared as part of the Group’s normal planning process. Cash flows for years two to five use management’s expectation of revenue growth and operating profit margin, based on past experience and expectations regarding future performance and profitability for each CGU group. Cash flows beyond the five-year period are extrapolated using estimated long-term growth rates (LTGR). Cash flow projections included in the impairment review models include management’s view of the impact of climate change, including costs related to the effects of climate change, as well as the future costs of the Group’s commitment to reach net zero by 2040 and costs of compliance with current legal requirements. The potential increased costs, to meet these commitments less any benefits that may occur, are not expected to be material and therefore have not resulted in any impairments during 2025. A breakdown of goodwill by region is shown below: 2025 $m 2024 $m North America 5,718 5,668 International Europe 250 218 UK & Sub-Saharan Africa 149 138 Asia & MENAT 232 229 LATAM 77 61 Pacific 158 141 Sub-total International 866 787 Total 6,584 6,455 Impairment tests for goodwill and brands with indefinite useful lives All CGU groups were supported through the value-in-use approach. During the year, the Group recognised no goodwill impairments (2024: $36m). For all goodwill and indefinite-lived brands balances, it can be demonstrated that there is sufficient headroom in the recoverable amount of the CGU goodwill balances based on the assumptions made, and there is no reasonably likely scenario under which material impairment could be expected to occur in the next 12 months based on the testing performed. The key assumptions used by CGU groups for value-in-use calculations were: 2025 long-term growth rate1 2025 pre-tax discount rate 2024 long-term growth rate¹ 2024 pre-tax discount rate North America 2.2% 10.3% 2.0–2.1% 8.5–8.7% International Europe 1.9% 9.9% 1.7–2.5% 8.0–10.8% UK & Sub-Saharan Africa 2.3% 10.9% 2.0% 9.3–11.1% Asia & MENAT 2.7% 13.1% 2.0–4.0% 7.7-14.1% LATAM 2.4% 12.9% 2.3–3.0% 11.2-17.11% Pacific 2.4% 10.0% 2.0–2.5% 10.3–10.9% 1. Source: imf.org. The growth rates used by CGU groups are based on the LTGR predicted for the relevant sector and countries in which a business operates. They do not exceed the long-term average growth rate for that industry or countries. The pre-tax discount rates are internally calculated weighted average cost of capital for each category and region, weighted based on the profit contribution to the region. The pre-tax discount rates are based on current prices, therefore future cash flow projections include inflation-linked measures. Rentokil Initial plc Annual Report 2025 175 Strategic Report Corporate Governance Financial Statements Other Information |
|
Notes to the Consolidated Financial Statements continued B3. Property, plant and equipment Property, plant and equipment is stated at historic cost less depreciation, with the exception of freehold land and assets under construction which are not depreciated. Historic cost includes expenditure that is directly attributable to the acquisition of the items. A breakdown of property, plant and equipment is shown below: Land and buildings $m Service contract equipment $m Other plant and equipment $m Vehicles and office equipment $m Total $m Cost At 1 January 2024 155 782 275 326 1,538 Exchange differences (6) (53) (16) (11) (86) Additions 9 161 18 31 219 Disposals (5) (125) (20) (65) (215) Acquisition of companies and businesses 1 1 1 6 9 Hyperinflationary adjustment 1 – – 1 2 Reclassification from IFRS 16 ROU assets1 – – – 10 10 At 31 December 2024 155 766 258 298 1,477 At 1 January 2025 155 766 258 298 1,477 Exchange differences 15 84 28 16 143 Additions 11 145 17 31 204 Disposals (96) (414) (192) (35) (737) Acquisition of companies and businesses – – 1 2 3 Hyperinflationary adjustment 1 – – 1 2 Reclassification from IFRS 16 ROU assets1 – – – 23 23 At 31 December 2025 86 581 112 336 1,115 Accumulated depreciation and impairment At 1 January 2024 (56) (470) (195) (181) (902) Exchange differences (1) 34 13 6 52 Disposals 4 123 20 58 205 Depreciation charge (6) (139) (18) (41) (204) At 31 December 2024 (59) (452) (180) (158) (849) At 1 January 2025 (59) (452) (180) (158) (849) Exchange differences (6) (50) (21) (10) (87) Disposals 32 235 137 30 434 Hyperinflationary adjustment – – – (1) (1) Depreciation charge (6) (107) (13) (41) (167) At 31 December 2025 (39) (374) (77) (180) (670) Net book value At 1 January 2024 99 312 80 145 636 At 31 December 2024 96 314 78 140 628 At 31 December 2025 47 207 35 156 445 1. Certain leased assets become owned assets at the end of their lease period and are therefore reclassified from ROU assets (Note B4). 2. Depreciation charge for the year ending 31 December 2025 includes $32m in relation to assets disposed of as part of the French Workwear disposal in Note B7 (2024:$75m). Depreciation of assets is calculated using the straight-line method to allocate the difference between their cost and their residual values over their estimated useful lives, as follows: Freehold buildings: 50 to 100 years Leasehold improvements: Shorter of the lease term or estimated useful life Vehicles: 4 to 10 years Plant and equipment (including service contract equipment): 3 to 10 years Office equipment, furniture, and fittings: 3 to 10 years Residual values and useful lives of assets are reviewed annually and amended as necessary. Fixed assets are reviewed for impairment whenever events or changes in circumstances indicate that the carrying amount of the fixed asset may exceed its recoverable amount. There were no impairments in the year (2024: $nil). When assets are sold, the gain or loss between sale proceeds and net book value is recognised in the income statement. The category of service contract equipment represents the pool of assets used by the Group in delivering contracted services to customers. Land and buildings comprise mainly offices and warehouses inclusive of leasehold improvements. 176 Rentokil Initial plc Annual Report 2025 |
|
B4. Leases The Group leases land and buildings, vehicles, and other equipment. The lease durations vary from lease to lease according to the asset leased and local practices. Some of the Group’s leases have extension and termination options attached to them. Lease extension options and lease termination options are only included in the calculation of the lease liability if there is reasonable certainty that they will be exercised. Judgement is required to determine the level of certainty. The value of leases to which the Group is committed but that have not yet commenced is not material. A breakdown of the right-of-use (ROU) assets is shown below: Land and buildings $m Vehicles $m Other equipment $m Total $m Net book value At 1 January 2024 227 347 2 576 Exchange differences (5) (7) – (12) Additions 77 106 – 183 Disposals (3) (5) – (8) Acquisition of companies and businesses 5 – – 5 Depreciation charge (73) (83) (1) (157) Reclassification to property, plant and equipment1 – (10) – (10) At 31 December 2024 228 348 1 577 At 1 January 2025 228 348 1 577 Exchange differences 9 12 – 21 Additions 79 106 1 186 Disposals (8) (18) – (26) Acquisition of companies and businesses – 1 – 1 Depreciation charge (74) (85) (1) (160) Reclassification to property, plant and equipment1 – (23) – (23) At 31 December 2025 234 341 1 576 1. Certain leased assets become owned assets at the end of their lease period and are therefore reclassified to property, plant and equipment (Note B3). Analysis of the Group’s lease liabilities is shown below: 2025 $m 2024 $m At 1 January 557 567 Exchange differences 22 (13) Lease payments (223) (216) Interest 31 31 Additions 195 182 Disposals (20) – Acquisition of companies and businesses 1 6 At 31 December 563 557 Analysed as follows: Non-current 392 394 Current 171 163 Total 563 557 Lease liabilities analysed by currency: 2025 $m 2024 $m Pound sterling 61 53 Euro 88 94 US dollar 337 335 Other currencies 77 75 At 31 December 563 557 Rentokil Initial plc Annual Report 2025 177 Strategic Report Corporate Governance Financial Statements Other Information |
|
Notes to the Consolidated Financial Statements continued Lease liabilities are payable as follows: 2025 $m 2024 $m Less than one year 191 188 Between one and five years 356 361 More than five years 74 81 Future minimum payments 621 630 Effect of discounting (58) (73) Carrying value 563 557 Other lease costs not already described are set out below: 2025 $m 2024 $m Expenses relating to short-term leases 28 32 Expenses relating to leases of low-value assets 6 6 Expenses relating to variable lease payments 1 3 At 31 December 35 41 The Group has no material arrangements where it acts as a lessor. B5. Capital commitments Capital expenditure contracted for at the balance sheet date but not yet incurred is as follows: 2025 $m 2024 $m Property, plant and equipment 7 39 Intangible assets 3 2 Total 10 41 B6. Investments in associated undertakings 2025 $m 2024 $m Interest in Nippon Calmic Limited 35 31 Interest in individually immaterial associated undertakings 6 15 At 31 December 41 46 Nippon Calmic Limited Nippon Calmic Limited is an associated undertaking in Japan which provides hygiene services, in which the Group has a 49% interest. The associate is unlisted and the investment value is shown below. 2025 $m 2024 $m At 1 January 31 40 Exchange differences (1) (4) Share of profit1 9 8 Dividends received (4) (13) At 31 December 35 31 1. Share of profit is net of tax of $5m (2024: $4m). Assets 2025 $m Liabilities 2025 $m Revenue 2025 $m Profit 2025 $m Assets 2024 $m Liabilities 2024 $m Revenue 2024 $m Profit 2024 $m Nippon Calmic Ltd (49%) 78 (40) 73 9 73 (41) 67 8 178 Rentokil Initial plc Annual Report 2025 |
|
Individually immaterial associates In addition to the interest in associates disclosed above, the Group also has interests in a number of individually immaterial associates that are accounted for using the equity method. 2025 $m 2024 $m At 1 January 15 16 Exchange differences 1 (1) Write off (8) – Other (2) Share of profit 1 1 Dividends received (1) (1) At 31 December 6 15 There was no unrecognised share of losses related to associates (2024: $nil). B7. Discontinued operations Rentokil Initial plc announced that it entered into an agreement for the intended sale of its Workwear business in France with H.I.G. Capital (the Proposed Transaction) on 28 May 2025 which was subsequently completed on 30 September 2025. Financial information relating to the discontinued operation to the date of disposal is set out below. The financial performance and cash flow information presented below are for the nine months ended 30 September 2025, the year ended 31 December 2024, and the year ended 31 December 2023. 2025 $m 2024 $m 2023 $m Revenue 261 324 302 Operating expenses (186) (266) (252) Net impairment losses on financial assets (1) (1) – Operating profit 74 57 50 Finance cost (2) (2) (2) Profit before income tax 72 55 48 Income tax expense (16) (9) (11) Profit after income tax of discontinued operations 56 46 37 Profit on sale of the subsidiary after income tax 124 – – Profit from discontinued operations 180 46 37 Profit for the period attributable to: Equity holders of the Company 180 46 37 Other comprehensive income: Items that may be reclassified subsequently to the income statement: Net exchange adjustments offset in reserves 38 (12) 7 Net (loss)/gain on net investment hedge (11) 8 (5) Other comprehensive income for the period 27 (4) 2 Total comprehensive income for the period 207 42 39 Total comprehensive income for the period attributable to: Equity holders of the Company 207 42 39 Net cash generated from operating activities 100 125 114 Net cash flows from investing activities 318 (85) (85) Net cash flows from financing activities (6) (8) (7) Net increase in cash generated by discontinued operations 412 32 22 Rentokil Initial plc Annual Report 2025 179 Strategic Report Corporate Governance Financial Statements Other Information |
|
Notes to the Consolidated Financial Statements continued The carrying amounts of assets and liabilities as at the date of sale were: At 30 September 2025 $m Assets Intangible assets 8 Property, plant and equipment 287 Right-of-use assets 22 Contract costs 20 Inventories 12 Trade and other receivables 82 Cash and cash equivalents 6 437 Liabilities Trade and other payables (112) Lease liabilities (20) Deferred and current tax (56) Retirement benefit obligations (8) Provisions (9) (205) Net assets and liabilities disposed 232 Cash consideration received 397 Carrying amount of net assets sold (232) Gain on sale before income tax and reclassification of foreign currency translation reserve 165 Cumulative exchange recycled from translation reserve (38) Cumulative reserve recycled from net investment hedge reserve 11 Costs related to disposal (14) Net profit on disposal 124 180 Rentokil Initial plc Annual Report 2025 |
|
C. Financing C1. Financial risk management The Group’s central treasury function manages cash, borrows on behalf of the Group, and provides finance to Group companies in their local currencies. Treasury activity is governed by a Treasury Committee, which is chaired by the Chief Financial Officer. The main financial risks faced by the Group are set out below. (a) Liquidity risk The Group is committed to ensuring it has sufficient liquidity to meet its business needs, and appropriate reserves to cover operational underperformance or dislocation in the financial markets. It is the Group’s policy to have headroom of unrestricted cash and available committed facilities of at least $750m (2024: $750m), and the Treasury Committee manages financing requirements and associated headroom at least 12 months forward. Available commitments of $1,000m under the Group’s committed debt facilities, together with unrestricted cash of $1,565m (2024: $447m), gives the Group combined headroom of $2,565m at 31 December 2025 (2024: $1,499m). The Group’s debt facilities have no financial covenants and the Group is compliant with other terms, conditions, and undertakings of its debt facilities. The Group targets an investment grade credit rating for debt issuance of BBB over the medium term. Both S&P Global (S&P) and Fitch Ratings (Fitch) rated the Group BBB. In line with ratings criteria, debt maturities are covered at least 12 months in advance using available cash or committed facilities, or by issuance of new debt. Management maintains an active dialogue with both S&P and Fitch, as well as the Group’s relationship banks, to ensure that any changes to the Group’s financing and acquisition strategies are understood. The Group has one debt maturity of €500m falling due in May 2026. This was redeemed post balance sheet on 2 March 2026. The Group has sufficient headroom to cover this maturity without issuing new debt. The €500m bond due May 2026, and the €600m bond due October 2028, issued under the Group’s Euro Medium-Term Notes (EMTN) Programme, contain a coupon step-up which increases the coupon payable by 1.25% in the event that the Group is downgraded to BB+ or below (sub-investment grade). The Group’s bonds may be called by their investors at par in the event of a change of control of the Group. They may also be called within 120 days if the Group’s debt is downgraded below investment grade, or if the rating is withdrawn and the rating agency confirms in writing, either publicly or to the Group or the Trustee, that the rating action occurred either wholly or in part due to a change of control. All other bonds issued under the EMTN Programme do not contain the coupon step-up. (b) Credit risk The Group has no significant concentration of credit risk. Sales are typically low-value, high-volume, spreading the risk across a large number of customers and geographies. Policies are in place to ensure that credit sales are only made to customers with an appropriate credit history. The Group operates in some territories where there is increased exposure to trade credit risks and in those territories the Group puts in place appropriate measures to manage its credit risk exposure. In order to protect the liquid assets and funding relationships of the Group, management aims to maintain banking relationships with counterparties that carry a long-term credit rating of at least A-, or equivalent rating, with one of the major credit rating agencies. In countries where no banks are rated A- or above, balances are monitored monthly and kept to a minimum. In addition, funds held with all counterparties are subject to limits. All exposures are monitored and reported to the Treasury Committee each month. The Group also monitors the creditworthiness of its lenders to ensure that commitments under its facilities are available as needed. At 31 December 2025 the Group had a total of $19m of cash held on bank accounts with banks rated below A- (2024: $16m). The highest concentration with any single bank rated below A- was $2m (2024: $1m). (c) Market risk Foreign exchange risk The Group’s worldwide operations generate profits and cash flows in foreign currencies. Sales and purchases are typically denominated in the currency of the country in which they are transacted, and the Group’s cross-border procurement is considered insignificant. Sterling-denominated profits from UK operations are exceeded by sterling-denominated Group central costs. This means that approximately 106% of Group operating profit is generated in foreign currencies. The Group’s primary exposure to foreign exchange risk is in relation to the translation of assets and liabilities, and the Group aims to hold debt in currencies in proportion to its forecast foreign currency profits and cash flows. Foreign exchange derivatives are used to manage foreign currency exposures in excess of $15m that are not covered by debt or assets in the same (or another highly correlated) currency, as long as it makes sense from an economic perspective to do so. The Treasury Committee monitors foreign exchange exposures on a monthly basis. Dealing in foreign exchange products is controlled by dealing mandates approved by the Treasury Committee and all foreign exchange transactions are covered by ISDA documentation. The most significant foreign currency groups are euros and US dollars, which make up 50% and 35% of Group operating profit respectively. At 31 December 2025 the Group’s net debt was approximately 69% US dollar (2024: 63%), 18% euro (2024: 26%) and 13% debt in other currencies, including pound sterling (2024: 11%). The translation of the interest element of euro and US dollar debt provides a partial income statement offset to the translation of earnings. The Group calculates a hypothetical foreign exchange impact on the income statement and foreign currency translation of net investments in foreign subsidiaries for a 10% movement in foreign exchange rates. The Group’s principal foreign currency exposure is the euro. A 10% movement in €/$ would result in a $39m increase/decrease in operating profit and a $58m increase/decrease in other comprehensive income. The other comprehensive income impact also includes the offsetting impact from financial instruments used to hedge the retranslation of euro net investment in subsidiaries, which is $51m. Where possible, currency cash flows are used to settle liabilities in the same currency in preference to selling currency in the market. Rentokil Initial plc Annual Report 2025 181 Strategic Report Corporate Governance Financial Statements Other Information |
|
The results of the sensitivity analysis should not be considered as projections of likely future events, gains or losses as actual results in the future may differ materially due to developments in the global financial markets which may cause fluctuations in exchange rates to vary from hypothetical amounts disclosed above. Comparative figures to foreign exchange risk sensitivity are not disclosed in the Annual Report 2025. Due to the presentational currency change of the Group that is applied prospectively from 1 January 2025, it would not be practicable to compare the re-presented results of the data prior to the presentational currency change with the results of the sensitivity analysis for the Annual Report 2025. Interest rate risk The Group seeks to manage interest rate risk to ensure reasonable certainty of its interest charge while allowing an element of risk exposure consistent with the variability of its cash flows. Interest rate risk is managed by the use of fixed interest debt and interest rate derivatives, which are approved in advance by the Treasury Committee. The Group policy is to fix a minimum of 50% of its estimated future interest rate exposures (excluding pensions) for a minimum period of 12 months forward. The Treasury Committee reviews this exposure monthly. A hypothetical 1.0% increase in euro interest rates would reduce the market value of the Group’s bond liabilities by $61m at 31 December 2025 (2024: $76m). The income statement impact is $nil as changes in interest rates do not change the expected cash flows on the bonds. A hypothetical 1.0% increase in pound sterling interest rates would reduce the market value of the Group’s bond liabilities by $27m at 31 December 2025 (2024: $28m). The income statement impact is $nil (2024: $nil). A hypothetical 1.0% increase in US dollar interest rates would reduce the market value of the Group’s bond liabilities by $63m at 31 December 2025 (2024: $nil). The income statement impact is $3m (2024: $3m) as certain leases are denominated in US dollars with floating interest rates. (Note that the $700m term loan was 37.5% hedged on a weighted average basis in 2024). The Group had outstanding bond debt issues at 31 December 2025 with a fair market value of $4,814m (2024: $3,105m). This is above the book value of $4,748m (2024: $3,122m) as a result of decreases in interest rates in the UK, USA, and Europe. There are no circumstances where the Group would be obliged to pay the fair market value. The Group could however decide to redeem some or all of its bonds early and the fair market value is indicative of the price that would be required to do so. (d) Capital risk The Group is committed to maintaining a debt/equity structure that allows continued access to a broad range of financing sources and sufficient flexibility to pursue commercial opportunities as they present themselves, without onerous financing terms and conditions. The Group’s policy is to maintain a strong capital base so as to maintain investor, creditor, and market confidence and to support the Group’s strategy. The Group uses S&P’s and Fitch’s ratings methodologies for a BBB issuer to manage its capital risk. In the event that a ratings downgrade is likely, net debt can be managed by reducing or suspending dividends, M&A spend, and capital expenditure. The Group would also consider raising additional equity to protect its BBB rating. (e) Treasury risk The Group’s treasury activities are governed by a treasury policy, which is reviewed and approved by the Board on an annual basis. The treasury policy covers all activities associated with managing the above risks. The policy requires that financial instruments are only utilised to manage known financial exposures, and speculative derivative contracts are not entered into. The treasury policy requires that treasury must approve opening and closing of all bank accounts, and that funds transfers and other payments are only made in accordance with bank mandates. To ensure an appropriate control environment exists in the treasury function, duties are segregated between front and back office teams. In addition, a number of controls are in place to protect against potential cyber security and other risks. C2. Net debt Net debt is used to assess the Group’s financial capacity. Net debt is not a measure defined by IFRS. Management defines net debt as the total of bank and other borrowings, lease liabilities, other investments, fair value of debt-related derivatives, and cash and cash equivalents (as presented in the Consolidated Balance Sheet). Closing net debt comprises: Notes 2025 $m 2024 $m Current Cash and cash equivalents in the Consolidated Balance Sheet C3 2,319 1,158 Other investments1 C4 2 1 Fair value of debt-related derivatives 56 (3) Bank and other short-term borrowings2 (1,411) (1,460) Lease liabilities B4 (171) (163) Non-current Fair value of debt-related derivatives 103 (29) Bank and other long-term borrowings3 (4,156) (3,127) Lease liabilities B4 (392) (394) Total net debt (3,650) (4,017) 1. Net debt excludes other investments which are non-cash, such as the investment in unlisted shares. 2. Bank and other short-term borrowings consists of $586m bond debt (2024: $nil), $730m overdraft (2024: $692m), $30m loans (2024: $720m), and $65m bond accruals (2024: $48m). 3. Bank and other long-term borrowings consists of $4,155m bond debt (2024: $3,122m) and $1m loans (2024: $5m). Notes to the Consolidated Financial Statements continued 182 Rentokil Initial plc Annual Report 2025 |
|
The currency split and cash flows of bank, other borrowings, and debt-related derivatives are as follows: 2025 $m 2024 $m Pound sterling 1,265 1,153 Euro 1,243 1,093 US dollar 2,860 2,362 Other currencies 40 11 Carrying value 5,408 4,619 Effect of discounting 844 484 Undiscounted value 6,252 5,103 Analysis of undiscounted cash flows of bank and other borrowings: Less than one year 1,461 1,565 Between one and five years 3,573 2,314 More than five years 1,218 1,224 Future minimum payments 6,252 5,103 Reconciliation of net change in cash and cash equivalents to net debt: Notes Opening 2025 $m Cash flows $m Non-cash (fair value changes, accruals and acquisitions) $m Non-cash (foreign exchange, additions and other) $m Closing 2025 $m Bank and other short-term borrowings (1,460) 700 (65) (586) (1,411) Bank and other long-term borrowings (3,127) (1,232) – 203 (4,156) Lease liabilities B4 (557) 223 (176) (53) (563) Other investments 1 1 – – 2 Fair value of debt-related derivatives (32) 39 (58) 210 159 Gross debt (5,175) (269) (299) (226) (5,969) Cash and cash equivalents in the Consolidated Balance Sheet 1,158 1,161 – – 2,319 Net debt (4,017) 892 (299) (226) (3,650) Notes Opening 2024 $m Cash flows $m Non-cash (fair value changes, accruals and acquisitions) $m Non-cash (foreign exchange, additions and other) $m Closing 2024 $m Bank and other short-term borrowings (1,444) 769 (126) (659) (1,460) Bank and other long-term borrowings (4,016) – – 889 (3,127) Lease liabilities B4 (567) 216 (186) (20) (557) Other investments 1 – – (0) 1 Fair value of debt-related derivatives 29 87 (9) (139) (32) Gross debt (5,997) 1,072 (321) 71 (5,175) Cash and cash equivalents in the Consolidated Balance Sheet 1,989 (814) – (17) 1,158 Net debt (4,008) 258 (321) 54 (4,017) Included within the net decrease in cash and cash equivalents is $9m (2024: $11m) cash paid on debt-related foreign exchange forward contracts (which is included within financing activities in the Consolidated Cash Flow Statement). The total cash inflow in borrowings of $532m (2024: $464m outflow) includes $1,232m proceeds from new debt (included in financing activities) (2024:$nil) and $700m debt repayment (included in financing activities) (2024: $464m). The derivatives cash outflow of $39m (2024: $85m outflow) includes $9m (2024: $49m outflow) of cash paid on debt-related foreign exchange swaps (included in financing activities) and $30m (2024: $36m) interest paid (included in operating activities). The cash outflow of $223m from lease liabilities (2024: $216m) includes $192m (2024: $185m) capital paid (included within financing activities) and $31m (2024: $31m) interest paid (included in operating activities). Fair value is equal to carrying value for all elements of net debt with the exception of bond debt which has a carrying value of $4,748m (2024: $3,122m) and a fair value of $4,814m (2024: $3,105m). Rentokil Initial plc Annual Report 2025 183 Strategic Report Corporate Governance Financial Statements Other Information |
|
The Group operates notional pooling arrangements whereby cash balances and overdrafts held within the same bank have a legal right of offset. Derivative financial instruments held with the same bank and have a legal right to offset are shown net. The following table shows the effect of offsetting in the balance sheet due to financial instruments subject to enforceable netting arrangements: Notes Gross amount 2025 $m Gross amounts set off in the balance sheet 2025 $m Net amounts presented in the balance sheet 2025 $m Amount subject to master netting arrangement 2025 $m Net amount 2025 $m Financial assets Cash and cash equivalents C3 2,319 – 2,319 (730) 1,589 Trade and other receivables1 A3 1,119 – 1,119 – 1,119 Other financial assets C4 2 – 2 – 2 Derivative financial instruments C6 182 – 182 (21) 161 Total 3,622 – 3,622 (751) 2,871 Financial liabilities Trade and other payables2 A5 (1,037) – (1,037) – (1,037) Borrowings C2 (5,567) – (5,567) 730 (4,837) Lease liabilities B4 (563) – (563) – (563) Derivative financial instruments C6 (23) – (23) 21 (2) Total (7,190) – (7,190) 751 (6,439) Notes Gross amount 2024 $m Gross amounts set off in the balance sheet 2024 $m Net amounts presented in the balance sheet 2024 $m Amount subject to master netting arrangement 2024 $m Net amount 2024 $m Financial assets Cash and cash equivalents C3 1,158 – 1,158 (691) 467 Trade and other receivables1 A3 1,112 – 1,112 – 1,112 Other financial assets C4 1 – 1 – 1 Derivative financial instruments C6 8 – 8 (2) 6 Total 2,278 – 2,278 (693) 1,585 Financial liabilities Trade and other payables2 A5 (1,060) – (1,060) – (1,060) Borrowings C2 (4,587) – (4,587) 691 (3,896) Lease liabilities B4 (557) – (557) – (557) Derivative financial instruments C6 (40) – (40) 2 (38) Total (6,244) – (6,244) 693 (5,551) 1. Trade and other receivables exclude prepayments of $84m (2024: $96m). 2. Trade and other payables exclude social security and other taxes of $109m (2024: $114m) and contract liabilities of $292m (2024: $312m). C3. Cash and cash equivalents Cash and cash equivalents include cash in hand, short-term bank deposits, and other short-term, highly liquid investments with original maturities of three months or less (and subject to insignificant changes in value). In the cash flow statement, cash and cash equivalents are shown net of bank overdrafts. Bank overdrafts are shown within borrowings in current liabilities on the balance sheet. Cash at bank and in hand includes $25m (2024: $20m) of restricted cash. This cash is held in respect of specific contracts and can only be utilised in line with terms under the contractual arrangements. Cash at bank and in hand also includes $99m (2024: $89m) of cash held in countries with foreign exchange regulations. This cash is repatriated to the UK where possible, if not required for operational purposes in country. Fair value is equal to carrying value for all cash and cash equivalents. Gross amounts 2025 $m Gross amounts 2024 $m Cash at bank and in hand 1,390 997 Money market funds 144 30 Short-term bank deposits 785 131 Cash and cash equivalents in the Consolidated Balance Sheet 2,319 1,158 Bank overdraft (730) (691) Cash and cash equivalents in the Consolidated Cash Flow Statement 1,589 467 As far as it is practical to do so, cash balances are held centrally and are used first to repay borrowings under the Group’s banking facilities before being placed on deposit. Notes to the Consolidated Financial Statements continued 184 Rentokil Initial plc Annual Report 2025 |
|
C4. Other investments Other investments held at year end mainly comprised investments in unlisted shares in a joint venture based in the Cayman Islands and term deposits maturing in more than three months from the date that the deposit was placed. The weighted average effective interest rate earned is 4.2% (2024: 6.3%), with $nil fixed for six months (2024: $1m) and $2m fixed for six months to one year (2024: $1m). Fair value is equal to carrying value for all other investments. Financial assets are denominated in the following currencies: 2025 $m 2024 $m Pound sterling 2 1 Other 25 26 27 27 Analysed as follows: Current portion 2 1 Non-current portion 25 26 27 27 None of the financial assets are either past due or impaired in 2025 (2024: none). C5. Derivative financial instruments Accounting for derivative financial instruments and hedging activities Derivatives are initially recognised at fair value on the date a derivative contract is entered into and are subsequently remeasured at their fair value at the balance sheet date. The method of recognising the resulting gain or loss depends on whether the derivative is designated as a hedging instrument and, if so, the nature of the item being hedged. At the inception of the transaction, the Group documents the relationship between hedging instruments and hedged items, as well as its risk management objective and strategy for undertaking various hedge transactions. The Group also documents its assessment, both at hedge inception and on an ongoing basis, of whether the derivatives that are used in hedging transactions are effective in offsetting changes in fair values of hedged items. Certain financial instruments are not designated or do not qualify for hedge accounting. Typically the Group will not designate financial instruments for hedge accounting where a perfect or near perfect offset is expected between the change in value of assets and liabilities. Changes in the fair value of any derivative instruments in this category are immediately recognised in the income statement. Where financial instruments are designated for hedge accounting they are designated as either fair value hedge, net investment hedge, or cash flow hedge. When designating cross-currency swaps, the cost of hedging has been excluded from the relationship and any movement in the fair value related to the cost of hedging is deferred in equity and amortised over the life of the hedged item. (a) Fair value hedge These instruments are used to hedge exposure to changes in the fair value of recognised assets or liabilities. Changes in the fair value of derivatives that are designated and qualify as fair value hedges are recognised in the income statement, together with any changes in the fair value of the hedged asset or liability that are attributable to the hedged risk. There were two fair value hedges as at the year end date (2024: nil). The following fair value hedges were designated in June 2025 and remain in place as at 31 December 2025: €600m bond (maturity June 2030) and £400m bond (maturity June 2032); the notional value of the hedging instruments designated equals the notional of the hedged items, therefore the hedge ratio is considered to be 1:1. The carrying amount of the hedged items is included within borrowings in the Consolidated Balance Sheet. The fair value loss on the derivative recognised in the income statement during the year amounted to $5m; this is offset by the gain on the fair value of the hedged items of $7m, resulting in a net fair value hedge gain of $2m. (b) Net investment hedge These instruments are used to hedge exposure on translation of net investments in foreign operations. Any gain or loss on the hedging instrument related to the effective portion of the hedge is recognised in other comprehensive income; the gain or loss related to the ineffective portion is recognised immediately in the income statement. In the event of disposal of a foreign operation, the gains and losses accumulated in other comprehensive income are recycled through the income statement. All currencies are directly hedged, therefore the hedge ratio is considered to be 1:1. The Group expects that the values of the hedged item and hedging instrument will move in opposite directions in response to movements in the same hedged risk. Where there are sufficient levels of denominated net assets, the critical terms are deemed to match. The following net investment hedges were in place at 31 December 2025: US dollar net investment hedge relationship: $1,627m (2024: $1,627m) cross-currency swaps notional, $nil (2024: $547m) loan notional and $85m (2024: $137m) cross-currency swaps future interest cash flows have been used to hedge $1,712m (2024: $2,310m) of the net assets of the US operating subsidiaries. The movement in the cross-currency swaps due to changes in $/£ exchange rates are in the opposite direction of the changes due to $/£ in the subsidiaries assets. As the critical terms match, their values will systematically change in the opposite direction of each other. Thus we consider that this demonstrates the existence of an economic relationship. Euro net investment hedge relationship: €434m (2024: €315m) bonds are used to hedge the net assets of the euro operating subsidiaries totalling €434m (2024: €315m). The movement in the bonds due to changes in €/£ exchange rates are in the opposite direction of the changes due to €/£ in the subsidiaries assets. As the critical terms match, their values will systematically change in the opposite direction of each other. Thus we consider that this demonstrates the existence of an economic relationship. Rentokil Initial plc Annual Report 2025 185 Strategic Report Corporate Governance Financial Statements Other Information |
|
Japanese yen (JPY) net investment hedge relationship: JPY2,000m (2024: JPY2,000m) cross-currency swap notional and JPY55m (2024: JPY55m) cross-currency swaps future interest cash outflows have been used to hedge JPY2,055m (2024: JPY2,055m) of the net assets of the Japanese associate. The movement in the cross-currency swaps due to changes in JPY/GBP exchange rates are in the opposite direction of the changes due to JPY/GBP in the associate’s assets. As the critical terms match, their values will systematically change in the opposite direction of each other. Thus we consider that this demonstrates the existence of an economic relationship. During the year there was no gain or loss (2024: $nil) relating to ineffectiveness of net investment in foreign entity hedges. The main source of ineffectiveness of the net investment hedge is the off-market value of the cross-currency swaps used to hedge US dollar net assets at the hedge designation date. Ineffectiveness due to changes in the counterparty credit risk was not material in the year and is expected to remain so due to the Group’s policy of only using counterparties with a credit rating of A- and above. For the year ended 31 December 2025, the amount in other comprehensive income related to net investment hedge accounting was a gain of $129m (2024: $22m loss; 2023: $136m gain). The effect of the foreign currency-related hedging instruments on the Group’s financial position and performance is shown in the table below: Hedging instruments 2025 Currency Carrying amount at year end date $m Notional amount $m Maturity date Hedge ratio Change in fair value of outstanding instrument $m Change in fair value of hedged item $m Ineffectiveness $m Weighted average hedged foreign exchange rate Cross-currency swaps USD 133 (1,627) May 2026 – October 2028 1:1 127 127 – 1.266 Cross-currency swaps JPY 1 (13) June 2027 1:1 1 1 – 197.620 Bonds EUR (518) (509) June 2027 – June 2030 1:1 (22) (22) – 1.162 Hedging instruments 2024 Currency Carrying amount at year end date $m Notional amount $m Maturity date Hedge ratio Change in fair value of outstanding instrument $m Change in fair value of hedged item $m Ineffectiveness $m Weighted average hedged foreign exchange rate Cross-currency swaps USD 6 (1,627) May 2026 – October 2028 1:1 (6) (6) – 1.241 Cross-currency swaps JPY – (13) June 2027 1:1 (1) (1) – 169.747 Bonds EUR (327) (327) June 2027 – June 2030 1:1 20 20 – 1.162 Term loan USD (547) (547) October 2025 1:1 8 8 – 1.110 The change in fair value of the outstanding hedging instrument differs from the amount recognised in other comprehensive income during the year due to the impact of currency basis (excluded from the hedge relationship) and the foreign exchange impact of realised interest on the hedging instrument (not reflected in the fair value change). (c) Cash flow hedge These instruments are used to hedge a highly probable forecast transaction, or a change in the cash flows of a recognised asset or liability. The portion of the gain or loss on the hedging instrument relating to the effective portion of the hedge is recognised in other comprehensive income. Any ineffective portion is immediately recognised in the income statement. The gains or losses that are recognised in other comprehensive income are transferred to the income statement in the same period in which the hedged cash flows affect the income statement. In the event that the hedged item occurs or is no longer expected to occur, accumulated gains or losses held in the cash flow hedge reserve are immediately recognised in the income statement. In the event that the hedged item is expected to occur but no longer meets the requirements of hedge accounting, accumulated gains or losses remain in other comprehensive income and are only recognised in the income statement when the forecast transaction occurs or is no longer expected to occur. All cash flow hedge relationships are hedges of a foreign currency risk and all currencies were directly hedged, therefore the hedge ratio is considered to be 1:1. Cash flow hedge accounting has been applied to derivatives (marked as ‘cash flow hedge’) in the table on page 188 in accordance with IFRS 9. Where no hedge accounting has been applied, related derivatives have been marked as ‘non-hedge’. The hedged item, a euro bond, creates an exposure to pay interest annually and the principal at maturity. By receiving the same amount at the same dates through a cross-currency swap, this exposure is eliminated. Since the critical terms of the derivative and the hedged debt match (i.e. matching currencies, payment dates, and interest rate on the leg of the swap offsetting the bond), the change in value of the derivative, excluding any basis risk, will be considered to completely offset the changes in the hedged cash flow. Notes to the Consolidated Financial Statements continued 186 Rentokil Initial plc Annual Report 2025 |
|
Any ineffectiveness on the cash flow hedge is taken directly to finance costs. During the year there was nil ineffectiveness (2024: $2m gain) from those derivatives in a cash flow hedge relationship. Ineffectiveness due to changes in the counterparty credit risk was not material in the year and is expected to remain the same because the Group’s counterparties credit rating is A- and above. Cash flow hedge accounting has been applied to €500m (2024: €500m) of the €500m 2026 bond, €421m (2024: €421m) of the €850m 2027 bond and €600m (2024: €600m) of the €600m 2028 bond. The cross-currency interest rate swaps are used as hedging instruments to hedge the volatility in the £/€ exchange rate of the bonds. Partial cash flow hedge accounting (to June 2028) has also been applied to €600m (2024: nil) of the €600m 2030 bond and £400m (2024: nil) of the £400m 2032 bond. The interest rate swaps are used as hedging instruments to hedge the volatility in floating rate interest rates associated to swaps directly hedging the bond coupon payments. For the year ended 31 December 2025, the amount in other comprehensive income related to cash flow hedge accounting was a loss of $31m (2024: $35m gain; 2023: $4m gain). The effect of the foreign currency related hedging instruments on the Group’s financial position and performance is shown in the table below: Hedging instruments 2025 Currency Carrying amount at year end date $m Notional amount $m Maturity date Hedge ratio Change in fair value of outstanding instrument $m Change in fair value of hedged item $m Ineffectiveness $m Weighted average hedged foreign exchange rate Cross-currency swaps EUR 25 1,785 May 2026 – October 2028 1:1 61 61 – 1.150 Hedging instruments 2024 Currency Carrying amount at year end date $m Notional amount $m Maturity date Hedge ratio Change in fair value of outstanding instrument $m Change in fair value of hedged item $m Ineffectiveness $m Weighted average hedged foreign exchange rate Cross-currency swaps EUR (34) 1,574 May 2026 – October 2028 1:1 (50) (47) (3) 1.133 Amount in cash flow hedge reserves related to continuing hedges is a gain of $12m (2024: $44m gain; 2023: $8m gain), and the amount related to discontinued hedges is $nil (2024: $nil; 2023: $nil). The change in fair value of the outstanding hedging instrument differs from the amount recognised in other comprehensive income during the year due to the impact of currency basis (excluded from the hedge relationship) and the spot retranslation element of the fair value movement (which offsets the hedged item in the income statement). C6. Fair value estimation All financial instruments held at fair value are classified by reference to the source of inputs used to derive the fair value. The following hierarchy is used: Level 1 – unadjusted quoted prices in active markets for identical assets or liabilities; Level 2 – inputs other than quoted prices that are observable for the asset or liability, either directly as prices or indirectly through modelling based on prices; and Level 3 – inputs for the asset or liability that are not based on observable market data. Financial instrument Hierarchy level Valuation method Financial assets traded in active markets 1 Current bid price Financial liabilities traded in active markets 1 Current ask price Listed bonds 1 Quoted market prices Money market funds 1 Quoted market prices Interest rate/currency swaps 2 Discounted cash flow based on market swap rates Forward foreign exchange contracts 2 Forward exchange market rates Borrowings not traded in active markets (term loans and uncommitted facilities) 2 Nominal value Money market deposits 2 Nominal value Trade payables and receivables 2 Nominal value less estimated credit adjustments Contingent consideration (including put option liability) 3 Discounted cash flow using weighted average cost of capital Rentokil Initial plc Annual Report 2025 187 Strategic Report Corporate Governance Financial Statements Other Information |
|
Fair value assets 2025 $m Fair value liabilities 2025 $m Fair value assets 2024 $m Fair value liabilities 2024 $m Cross currency interest rate swaps and interest rate swaps (level 2): – net investment hedge 144 (10) 29 (23) – cash flow hedge 29 (7) 1 (35) – fair value hedge 4 (6) – – Foreign exchange swaps (level 2): – non-hedge 5 – – (4) 182 (23) 30 (62) Analysed as follows: Current portion 61 (5) – (4) Non-current portion 121 (18) 30 (58) Derivative financial instruments 182 (23) 30 (62) Contingent consideration (including put option liability) (level 3) – (70) – (94) Analysed as follows: Current portion – (49) – (47) Non-current portion – (21) – (47) Other payables – (70) – (94) Certain interest rate swaps have been bifurcated to manage different foreign exchange risks. The interest rate swaps are shown on the balance sheet as net derivative assets of $182m (2024: $8m) and net derivative liabilities of $22m (2024: $40m). Given the volume of acquisitions and the variety of inputs to the valuation of contingent consideration (depending on each transaction), there are not considered to be any changes in input that would have a material impact on the contingent consideration liability. Contingent consideration 2025 $m Contingent consideration 2024 $m At 1 January 94 97 Exchange differences 7 (3) Acquisitions 13 39 Payments (17) (32) Unused amount reversed (25) (9) Revaluation of put option (2) 2 At 31 December 70 94 Fair value is equal to carrying value for all other trade and other payables. Notes to the Consolidated Financial Statements continued 188 Rentokil Initial plc Annual Report 2025 |
|
The table below analyses the Group’s undiscounted cash flows on borrowings and derivative financial instruments that will be settled on a gross basis, into relevant maturity groupings based on the remaining period to the contractual maturity date at the balance sheet date. Less than 1 year $m Between 1 and 5 years $m More than 5 years $m Total $m At 31 December 2025 Non-derivative financial instruments Borrowings (1,518) (3,676) (1,217) (6,411) (1,518) (3,676) (1,217) (6,411) Derivative financial instruments Cross-currency interest rate swaps: – outflow (802) (1,349) – (2,151) – inflow 836 1,444 – 2,280 Interest rate swaps: – outflow (3) (7) – (10) – inflow – – 8 8 Foreign exchange swaps: – outflow (284) – – (284) – inflow 289 – – 289 Foreign exchange forwards: – outflow (48) – – (48) – inflow 48 – – 48 35 88 8 131 Net outflow (1,483) (3,588) (1,209) (6,280) At 31 December 2024 Non-derivative financial instruments Borrowings (1,534) (2,314) (1,224) (5,072) (1,534) (2,314) (1,224) (5,072) Derivative financial instruments Cross-currency interest rate swaps: – outflow (59) (2,122) – (2,181) – inflow 31 2,032 – 2,063 Interest rate swaps: – outflow – – – – – inflow – – – – Foreign exchange swaps: – outflow (455) – – (455) – inflow 451 – – 451 Foreign exchange forwards: – outflow (13) – – (13) – inflow 13 – – 13 (32) (90) – (122) Net outflow (1,566) (2,404) (1,224) (5,194) C7. Analysis of bank and bond debt Borrowings are recognised initially at fair value, net of transaction costs incurred. Borrowings are classified as current liabilities unless the Group has a continuing right to defer settlement of the liability for at least 12 months after the balance sheet date. The Group’s bank debt facilities comprise: Facility amount 2025 $m Drawn at year end 2025 $m Headroom 2025 $m Interest rate at year end 2025 % Facility amount 2024 $m Drawn at year end 2024 $m Headroom 2024 $m Interest rate at year end 2024 % Current $700m term Loan due October 2025 (repaid April 2025) – – – – 700 700 – 5.18 $50m term loan due May 2025 (ended April 2025) – – – – 50 – 50 0.21 Non-current $1.0bn RCF due October 2029 1,000 – 1,000 0.14 1,000 – 1,000 0.14 During April 2025, the Group fully repaid the $700m term loan with proceeds from new bonds (totalling $1.25bn) issued and terminated the $50m term loan. Rentokil Initial plc Annual Report 2025 189 Strategic Report Corporate Governance Financial Statements Other Information |
|
The Revolving Credit Facility (RCF) remained undrawn throughout 2024 and 2025. There are no financial covenants associated with the RCF or any other debt facility. Medium-term notes and bond debt comprises: Bond interest coupon 2025 Effective hedged interest rate 2025 Bond interest coupon 2024 Effective hedged interest rate 2024 Current €500m bond due May 2026 Fixed 0.875% Fixed 2.73% Fixed 0.875% Fixed 2.72% Non-current €850m bond due June 2027 Fixed 3.875% Fixed 4.81% Fixed 3.875% Fixed 5.05% €600m bond due October 2028 Fixed 0.500% Fixed 2.17% Fixed 0.500% Fixed 2.17% €600m bond due June 20301 Fixed 4.375% Fixed 4.55% Fixed 4.375% Fixed 4.67% £400m bond due June 20321 Fixed 5.000% Fixed 5.35% Fixed 5.000% Fixed 5.30% $750m bond due April 2030² Fixed 5.000% Fixed 5.20% – – $500m bond due April 2035² Fixed 5.625% Fixed 5.73% – – Average cost of bond debt at year-end rates 4.38% 4.16% 1. Bonds not in hedging relationship in 2024. 2. Bonds not in hedging relationship in 2025. During April 2025, the Group issued two new bonds totalling $1.25bn, consisting of $750m due 2030 and $500m due 2035. Part of the proceeds was used to settle the $700m term loan. On 2 March 2026, Rentokil Initial plc redeemed in full the €500m 0.8750% Senior Unsecured Notes due 30 May 2026, at their principal amount together with accrued interest. The redemption was carried out in accordance with the terms and conditions of the notes. The effective hedged interest rate reflects the interest rate payable after the impact of interest due from cross-currency swaps. The Group’s hedging strategy is to hold foreign currency debt in proportion to foreign currency profit and cash flows, which are mainly in euro and US dollar. As a result, the Group has swapped a portion of the bonds it has issued into US dollars, thus increasing the effective hedged interest rate. The Group considers the fair value of other current liabilities to be equal to the carrying value. C8. Finance cost Note 2025 $m 2024 $m 2023 $m Hedged interest payable on medium-term notes issued1 127 77 76 Interest payable on bank loans and overdrafts1 27 64 50 Interest payable on RCF1 2 1 4 Interest payable on foreign exchange swaps2 50 56 54 Interest payable on leases B4 31 31 30 Amortisation of discount on provisions A6 13 14 18 Foreign exchange loss on translation of foreign assets/liabilities – 7 – Total finance cost 250 250 232 1. Interest expense on financial liabilities held at amortised cost. 2. Interest payable on foreign exchange swaps including coupon interest payable for the year was $56m (2024: $69m). $6m has been reported in other comprehensive income due to hedge accounting (2024: $13m). C9. Finance income 2025 $m 2024 $m 2023 $m Bank interest received 31 46 31 Fair value gain on hedge ineffectiveness 2 4 3 Foreign exchange gain on translation of foreign assets/liabilities 10 – 12 Hyperinflation accounting adjustment 3 9 14 Total finance income 46 59 60 Notes to the Consolidated Financial Statements continued 190 Rentokil Initial plc Annual Report 2025 |
|
D. Other D1. Dividends Dividend distribution to the Company’s shareholders is recognised as a liability in the Consolidated Financial Statements in the period in which the dividends are approved by the Company’s shareholders. Interim dividends are recognised when paid. 2025 $m 2024 $m 2023 $m 2022 final dividend paid – 6.50 cents per share 1 – – 165 2023 interim dividend paid – 3.44 cents per share 2 – – 87 2023 final dividend paid – 7.41 cents per share 1 – 186 – 2024 interim dividend paid – 4.15 cents per share 2 – 106 – 2024 final dividend paid – 7.91 cents per share 1 198 – – 2025 interim dividend paid – 4.15 cents per share 106 – – 304 292 252 1. Represented at exchange rate prevailing at AGM’s date (2024: 5.93 pence per share; 2023: 5.93 pence per share). 2. Represented at exchange rate prevailing at date of announcement (2024: 3.16 pence per share; 2023: 2.75 pence per share). An interim dividend of 4.15 cents per share was paid on 22 September 2025, amounting to $106m. A final dividend in respect of 2025 of 8.24 cents per share is to be proposed at the Annual General Meeting on 7 May 2026. The aggregate amount of the proposed dividend to be paid out of retained earnings at 31 December 2025, but not recognised as a liability at year end, is $208m (2024: $198m; 2023: $186m). D2. Share capital The Company’s share capital is made up of the shares that have been issued to its members, whether on, or subsequent to, its incorporation. At the year end, the Company’s issued share capital consisted of ordinary shares of 1p each, with one voting right per share, as detailed below. The Company does not have a limited amount of authorised capital and does not hold any shares in treasury. During the year, 1,500,000 new shares were issued in relation to employee share schemes. 2025 $m 2024 $m Issued and fully paid At 31 December 2025 – 2,526,039,885 shares (2024: 2,524,539,885) 41 41 D3. Contingent liabilities The Group has contingent liabilities relating to guarantees in respect of leasehold properties, pensions, third parties, tax, and litigation. The Group also has contingent liabilities for the management or remediation of environmental issues. These issues tend to be complex to determine and resolve and may be material, although it is often not possible to accurately predict future costs reliably. The possibility of any significant outflows in respect of these items is considered to be remote. In November 2024, a purported class action lawsuit was filed on behalf of shareholders who purchased American Depositary Shares in the US between 1 December 2023 and 10 September 2024. The defendants are the Company and three current and former senior executives, Andy Ransom, Stuart Ingall-Tombs, and Bradley Paulsen. The complaint alleges that management made false statements about the progress of the integration of Rentokil and Terminix and its impact upon growth in the US and seeks relief under sections 10(b) and 20(a) of the Securities Exchange Act and SEC rule 10(b)5. The Company and the individual defendants intend to vigorously defend the lawsuit. In April 2025, a purported class action lawsuit was filed in state court in California alleging misrepresentation in the registration statement and prospectuses for the securities issued as part of the acquisition of Terminix. The defendants are the Company, former senior executives Brett Ponton and John Myers, and members of the Company’s Board of Directors. The complaint alleges that the Company made false and misleading statements in the registration and prospectuses in relation to the securities offered as part of the acquisition of Terminix and seeks relief under Sections 11, 12(a)(2), and 15 of the US Securities Act of 1933. The Company and the individual defendants intend to vigorously defend the lawsuit. Rentokil Initial plc Annual Report 2025 191 Strategic Report Corporate Governance Financial Statements Other Information |
|
Notes to the Consolidated Financial Statements continued D4. Related party transactions Subsidiaries All transactions between Group subsidiaries were transacted at arm’s length during the ordinary course of business and have been eliminated on consolidation, along with any outstanding balances, and accordingly are not disclosed in this note. Key management personnel The Group’s strategy and policy are managed by the Board and Executive Leadership Team. Their compensation is shown below: 2025 $m 2024 $m 2023 $m Salaries and other short-term employee benefits 15 10 12 Post-employment benefits 1 – 3 Share-based payments 2 4 5 18 14 20 A list of joint ventures and associate entities can be found in the related undertakings disclosures. There are no significant transactions between associate entities and other Group companies. D5. Post balance sheet events On 2 March 2026, Rentokil Initial plc redeemed in full the €500m 0.8750% Senior Unsecured Notes due 30 May 2026, at their principal amount together with accrued interest. The redemption was carried out in accordance with the terms and conditions of the notes. There were no other significant events between 31 December 2025 and the date of approval of these accounts that would require amendments to or additional disclosures in the financial statements. 192 Rentokil Initial plc Annual Report 2025 |
|
Related Undertakings Subsidiaries and other associated undertakings at 31 December 2025. All undertakings are indirectly owned by the Company unless otherwise stated. Subsidiaries Company name Share class % held by Group companies Argentina Calle 70 No. 2720, Necochea city, Province of Buenos Aires, Argentina Ecotec Interocéanica S.A. Ordinary 100% Aruba Avenida Milio Croes 92, Oranjestad, Aruba R&M Professional Pest Control N.V.1 Ordinary 100% Australia c/– Edwards Marshall, level 3/153 Flinders St, Flinders Street, Adelaide SA 5000, Australia Allstate Holdings (SA) Pty Ltd Ordinary 100% Allstate Pest Control Pty Ltd Ordinary 100% Allstate Services Pty Ltd Ordinary 100% Unit A1, 3-29 Birnie Ave, Lidcombe Business Park, Lidcombe NSW 2141, Australia Cannon Hygiene Australia Pty Limited Ordinary 100% Geelong Pest Control Pty Ltd Ordinary 100% Green Fingers Plant Hire Pty Limited Ordinary 100% Knock Out Pest Control Pty Limited Ordinary 100% Pest Away Australia Pty Limited Ordinary 100% Rentokil Australia Pty Limited Ordinary 100% Rentokil Initial Asia Pacific Pty Limited Ordinary 100% Rentokil Initial Pty Limited Ordinary 100% Rentokil Initial Track Spray Pty Ltd Ordinary 100% Rentokil Pest Control (QLD) Pty Limited Ordinary 100% Rentokil Pest Holdings Pty Limited Ordinary 100% Rentokil Pty Ltd Ordinary Preference 100% 100% Austria Brown-Boveri-Straße 8/2/8, 2351, Wiener Neudorf, Austria Rentokil Initial GmbH Ordinary 100% Bahamas Corporate Services International, 308 East Bay Street, Nassau, PO BOX N-7527, Bahamas Rentokil Initial (Bahamas) Limited Ordinary 100% 5th Terrace Centreville, P.O. Box N-1388, Nassau, New Providence, Bahamas Tropical Exterminators (Holdings) Limited Common 100% Tropical Exterminators Limited Common 100% Barbados One Welches, Welches St. Thomas, Barbados Rentokil Initial (Barbados) Limited Ordinary 100% Belgium Brandekensweg 2, Schelle, 2627, Belgium Ambius N.V. Ordinary 100% Bug Busters B.V.1 Ordinary 100% Initial Belux NV Ordinary 100% Rentokil N.V. Ordinary 100% Brazil Rua Maria Braga Lima Dias, Alto Cajueiros, Macaé, Rio de Janeiro, 120, Brazil Ativa Controle Ambiental Ltda Ordinary 100% Avenida Afonso Pena, nº 808, Santos, 11020-004, Brazil Ecotec Brasil Tratamentos Fitossanitários Ltda Ordinary 100% Company name Share class % held by Group companies Rua Professor José Vieira de Mendonça, 770, Sala 308, Belo Horizonte, Estado de Minas Gerais, Brazil Ecovec Comercio E Licenciamento De Tecnologias Ltda Ordinary 100% Torrinha Street 171, Bairro Parque da Figueira, Campinas, CEP 13040-310, Brazil Impacto Controle de Pragas Ltda. Ordinary 100% Celido Utz, 66, Igrejinha, Rio Grande do Sul, Brazil Imunizadora Hoffmann Ltda Ordinary 100% Rua Francisco Gonçalo, 16, Loja A, Bairro Pires Façanha, Eusébio, Ceará, CEP 61775-070, Brazil Protecta Manejo Integrado de Pragas Ltda Ordinary 100% Avenida Ceci, 348, Fundos, Centro Empresarial Tambore, CEP 06460-120, Barueri -SP, Brazil Rentokil Initial Do Brasil Ltda Ordinary 100% Rua Cancioneiro Popular, 456, Chacara, Santo Antonio, SP, Brazil Tecnomad Ltda.1 Ordinary 100% Rua Pesqueira, 59 e 59 Fundos, CEP 22.250-145, Bonsucesso, Brazil Techvet Serviços Ltda.1 Ordinary 100% R. Alagoas, 3098, Rua Alagoas, Curitiba, PR, 80630-050, Brazil União Sul Controle de Pragas Ltda ME Ordinary 100% Brunei Darussalam Unit D1 & D1-1 Block D, Bgn Hj Lajim & Anak-Anak, Kg Kiarong, Gadong B, Brunei Muara, BE1318, Brunei Darussalam Rentokil Initial (B) Sdn Bhd Non-redeemable preference shares Ordinary 100% 90% Unit D3, Bgn Hj Lajim & Anak-Anak, Kg Kiarong, Bandar Seri Begawan, Brunei Muara, BE1318, Brunei Darussalam Rentokil Initial South East Asia Sdn Bhd Ordinary 90% Canada Suite 900, 1959 Upper Water Street, Halifax NS B3J 2X2, Canada Rentokil Canada Corporation Common Class A Common Class B 100% 415 Villa Dr, Villa Drive, Little Bras D’or, Cape Breton Regional NS B1Y 2Z2, Canada Cape Breton Pest Control Limited1 Class A Preferred Class B Common Class C Common 100% Chile Galvarino 8481, Bodega 3, Quilicura, Santiago, Chile Comercializadora de Insumos y Servicios Mauco Limitada Social Rights 100% El Trapiche No.1322, Galpón No 4, Codominio Pacific, Coquimbo, Chile Control De Plagas Hidalgo Y Rodriguez Limitada Ordinary 100% Rentokil Initial plc Annual Report 2025 193 Strategic Report Corporate Governance Financial Statements Other Information |
|
Related Undertakings continued Company name Share class % held by Group companies Av. El Bosque PC 12 Lo Boza dpto, B05 Pudahuel, Santiago, Chile Desan SPA Ordinary 100% Av. Víctor Uribe No. 2080 Quilicura, Santiago, Chile Ingeclean S.A Ordinary 100% Rentokil Initial Chile SpA Ordinary 100% Av. El Salto, Santiago, 4001, Chile Ingeniería en Sanitización S.A Ordinary 100% San Martin, Los Ángeles, N° 399, Chile Plaguisur Limitada Ordinary 100% Av. Pdte Ibañez 352, Puerto Montt, Chile Sociedad Comercial 7 Plagas Limitada Ordinary 100% Calle Montreal 4566, San Miguel, Santiago, Chile Comercial Mauco SpA1 Ordinary 100% Av. Cuatro Esquinas 1529, 1722215 La Serena, Coquimbo, Chile Fumigaciones y Servicios Ambientales SpA1 Ordinary 100% People’s Republic of China Room 1001, Yijingyuan Comprehensive Building, Hang Zhou Shi, Zhe Jiang Sheng, 310013, China Hangzhou Research Institute of Profume Fumigation Co. Ltd. Ordinary 80% Room 103, Building 2, Yuzhongxili #42, Beijing, China Rentokil Initial (China) Ltd Ordinary 100% Room (2-1), Unit19, Xindian Xingzuo, Haishu district, Ningbo City, Zhejiang Province, China Ningbo Yuying Pest Control Technology Co., Ltd1 Ordinary 95% Room 4600, Floor 1, Building 8, No. 33 Guangshun Rd, Changning District, Shanghai City, China Shanghai Boecker Environmental Technology Co. Ltd1 Ordinary 100% Colombia Balor Medellín, Carrera 65A #34A-09, Balor Bogotá Calle 82 #22-06, Medellín, Colombia Balor S.A.S. Ordinary 100% Cr 42A 80B 07, Barranquilla, Colombia Colplagas S.A.S Ordinary 100% Calle 162# 20-08, Bogota, Colombia Continental De Fumigaciones S.A.S Ordinary 100% Cr 20 No 162-11, Colombia Fumigaciones Young S.A.S Ordinary 100% Calle 15 Sur, No 48-130 Medellin, Antioquia, Colombia Fumigax SAS Ordinary 100% Carrera 19B No 164A-81, Bogota, Colombia Rentokil Initial Colombia S.A.S. Common 100% Costa Rica San Jose-Escazu San Rafael, Terraforte Building Second Floor, Cordero, Cordero Abogados, Costa Rica Decolim Limitada Common 100% San Pedro de Montes de Oca, de la Fuente de la Hispanidad, San José, Costa Rica Fumigadora Control Tecnico De Plagas S.A. Common 100% Company name Share class % held by Group companies Curaçao Parke Komersial Korsou, A 24 Veeris, Curaçao Chuchubi Pest Control N.V. Common 100% Czech Republic Praha 2, Vyšehradská 1349/2, Prague, PSČ 12800, Czech Republic Rentokil Initial s.r.o. Ordinary 100% Denmark Paul Bergsoes Vej 22, 2600 Glostrup, Denmark Rentokil Initial A/S Ordinary 100% Gøngehusvej 253, 2790 Hørsholm, Denmark Deichmann Planter ApS Ordinary 100% El Salvador Avenida Sur, Calle Poniente 12, 2526 Edificio Villa Galicia, San Salvador, El Salvador Clean Air, S.A. de C. V. Ordinary 100% Avenida Calzada Guarda Barranco Urbanizacion, Lomas de Altamira, #14 Pasaje Clarineros, San Salvador, El Salvador SAGRIP, S.A. DE C.V. Ordinary 100% Estonia Turi Str. 3/1, 11313 , Tallinn, Estonia Rentokil OÜ Ordinary 100% Eswatini Umkhiwa House Lot 195, Karl Grant Street, Mbabane, Eswatini RI Swaziland (Pty) Ltd Ordinary 100% Fiji Lot 5, Kaua Road, Suva, Fiji Rentokil Initial Pte Limited Ordinary 100% Finland Tikkurilantie 10 Vantaa, Finland, 01380, Finland Rentokil Initial Oy Ordinary 100% Kimokatu 5, Turku, 20380, Finland Antitec Oy1 Ordinary 100% France 209 rue de la Belle Etoile, 95700, Roissy-en-France, France Ambius SAS Ordinary 100% 145, rue de Billancourt, 92100, Boulogne Billancourt, France Initial Hygiene Services SAS Ordinary 100% 39-53 boulevard Ornano Immeuble Pleyad 3, 93200, Saint-Dennis, France Rentokil Initial Environmental Services S.A.S. Ordinary 100% Rentokil Initial SAS Ordinary 100% 20 B rue Louis-Philippe, 92200, Neuilly-sur-Seine, France Skillpro SAS1 Ordinary 100% ZAC des Epineaux 7, avenue Louis Blériot 95740 Frépillon, France Technivap SAS Ordinary 100% French Guiana PAE de Degrad des cannes, Remire-Montjoly, 97354, French Guiana Rentokil Initial Guyane SARL Ordinary 100% 194 Rentokil Initial plc Annual Report 2025 |
|
Company name Share class % held by Group companies Germany Blierweg 2/Saarstraße, 65201, Wiesbaden, Germany Baumhaus GmbH Ordinary 100% Laufer Straße 3, 90571, Schwaig bei Nürnberg, Mittelfranken, BY, Germany IHD Dienstleistungen KG Interest 100% Piderits Bleiche 11, 33689, Bielefeld, Germany Medentex GmbH Ordinary 100% Rentokil Dental GmbH Ordinary 100% Heuesch 1, 49808, Lingen, Germany Rentokil Holdings GmbH Ordinary 100% Rentokil Initial Beteiligungs GmbH Ordinary 100% Rentokil Initial GmbH & Co. KG Ordinary 100% An der Ziegelei, 47 27383, Scheeßel-Westerholz, Germany S & A Service und Anwendungstechnik GmbH Ordinary 100% Ghana 43 Cashew Road, Okpoi Gonno, Park Street, Accra, P. O. BOX 8747, Ghana Rentokil Initial Ghana Limited Ordinary 100% Greece 7 Aristotelous Street, Tavros, Athens, 177 78, Greece Rentokil Initial Hellas EPE Ordinary 100% Guadeloupe 7 Allee des Papillons, Dothemare, Abymes, 97139, Guadeloupe Pole Hygiene et Recyclage Group Ordinary 100% Rentokil Initial Guadeloupe Sarl Ordinary 100% 131 ZA de Calbassier, Basse-Terre, 97100, Guadeloupe SOS Guadeloupe Traitement Ordinary 100% Guatemala 9 Av. 39-97, Zone 8, Guatemala Servicios Agricolas Profesionales Sociedad Anonima Ordinary 100% Guernsey P O Box 155, Mill Court, La Charroterie, St Peter Port, GY1 4ET, Guernsey Felcourt Insurance Company Limited Ordinary 100% Guyana Lot 8, Charles and Drysdale Streets, Charlestown, Georgetown, Guyana Rentokil Initial Guyana Limited Ordinary 100% Honduras Colonia Palmira, Avenida Republica de Argentina, N 2017, Tegucigalpa Honduras, 11101, Honduras Compania de Servicios e Inversiones SVM Honduras, S. de R.L. Ordinary 100% Compania de Servicios SVM Olympus, S. de R.L. Ordinary 100% Compania de Servicios SVM Progressive, S. de R.L. Ordinary 100% Compania de Servicios SVM Technicians, S. de R.L. Ordinary 100% Compania de Servicios SVM Vanguard, S. de R.L. Ordinary 100% Company name Share class % held by Group companies San Pedro Sula, Departamento de Cortes, San Pedro Sula, Honduras Sagrip Honduras S.A. Nominative 100% Hong Kong 23/F, Westin Centre, 26 Hung to Road, Kwun Tong, Kowloon, Hong Kong Rentokil Hong Kong Investment Limited Ordinary 100% Rentokil Initial Hong Kong Limited Ordinary 100% India 2nd Floor, Narayani, Ambabai Temple Compound, Aarey Road, Goregaon West, Mumbai , Maharashtra, 400104, India Corporate Millennium Hygiene Solutions Private Limited Ordinary 100% Rentokil Initial Hygiene India Private Limited Ordinary 100% Office No. 301, 3rd Floor, L. D. Building, Mehra Industrial Estate, LBS Marg, Vikhroli (West), Mumbai City, Mumbai, Maharashtra, 400079, India HiCare Services Private Limited Ordinary 73% Villa No.3, Crescent Villa, Candolim, Goa, 403515, India PCI Pest Control Private Limited Ordinary 73% Indonesia South Quarter Tower B, Lantai 21, Unit E,F,G,H. JI. R.A., Kartini Kav. 8, RT. 010/RW. 004 Kel., Cilandak Barat, Kec Cilandak, Jakarta, Selatan, Indonesia PT. Calmic Indonesia Ordinary A Ordinary B 100% PT. Rentokil Indonesia Ordinary A Ordinary B 100% Gedung JDC Lt.6, Jl. Gatot Subroto Kav. 53 Petamburan, Tanah, Abang, Jakarta Pusat, Indonesia PT. Wesen Indonesia Ordinary 100% Ireland Hazel House, Millennium Park, Naas, County Kildare, Ireland Cannon Hygiene International Limited Ordinary 100% Initial Medical Services (Ireland) Limited (t/a Healthcare Waste Mgt Servs) Ordinary 100% Pest Pulse Limited €0.0075 Ordinary A €0.0075 Ordinary €0.01 Ordinary 100% Rentokil Initial Holdings (Ireland) Limited Ordinary 100% Rentokil Initial Limited Ordinary 100% Ronaldon Limited Ordinary 100% Israel 13 Hadid 7313500, Israel Eitan Amichai Pest Management IPM Ltd Ordinary 100% Yarokology Ltd. Ordinary 100% Italy Via Paolo Frisi, 4/A, 48124, Ravenna, RA, Italy Evoluzione Servizi Srl1 Ordinary 100% Via Laurentina km. 26,500, 157 a/c, 00071, Pomezia, Italy Rentokil Initial Italia SpA Ordinary 100% Contrada S. Giovanni in Golfo, 221, Contrada San Giovanni, 86100, CB, Molise, Italy SOGESsp S.R.L. Ordinary 100% Rentokil Initial plc Annual Report 2025 195 Strategic Report Corporate Governance Financial Statements Other Information |
|
Related Undertakings continued Company name Share class % held by Group companies Jamaica 39-41 Second Street, Newport West, Kingston 13, Jamaica Rentokil Initial (Jamaica) Limited Ordinary 100% Jordan Amman, Jabal AlHussien, Al Lud Str. 37 – 1st floor, Jordan Arena Public Health Co. Ordinary 100% Kenya Unit 5 Sameer Industrial Park, Road C, Off Enterprise Road Industrial Area, Nairobi, Kenya Rentokil Initial Kenya Limited Ordinary 100% Lebanon Boecker Building, Plot no. 3309, Ain El Remmaneh, Beirut, Lebanon Boecker International SAL (Offshore) Ordinary 100% Boecker World (Holding) s.a.l. Ordinary 100% Adonis Building, Bechara el Khoury, Beirut, Lebanon Boecker Public Health s.a.l Ordinary 100% Libya Janzour, Tripoli, Libya Rentokil Delta Libya for Environmental Protection JSCO Ordinary 65% Lithuania Drobės g. 62, LT-45181, Kaunas, Lithuania Dezinfa, UAB Ordinary 100% Luxembourg Rue de la Chapelle 47, 4967, Clemency, Luxembourg Rentokil Luxembourg Sarl Ordinary 100% 6 Rue Eugene Ruppert, Luxembourg, 2453, Luxembourg SVM Finance Luxembourg 1 S.a.r.l. Ordinary 100% SVM Finance Luxembourg 2 S.a.r.l. Ordinary 100% Malawi Plot No. LE 377, Patridge Avenue, Limbe, P O BOX 5135, Malawi Rentokil Initial Limited Ordinary 100% Malaysia Level 8 Symphony House, Block D13, Pusat Dagangan Dana, 47301 Jalan PJU 1A/46, Petaling Jaya, Selangor Darul Ehsan, Malaysia Rentokil Initial (M) Sdn Bhd Ordinary 100% UFTC Sdn Bhd Ordinary 100% Maldives No. 6-A, Faamudheyrige Building, Orchid Magu, Repu, Malé, Maldives Rentokil Initial Maldives (Pvt) Ltd Preferential shares 100% Martinique Zone Industrielle de Champigny, Ducos, Le Marin, 97224, Martinique Rentokil Initial Martinique Sarl Ordinary 100% Mexico Juan Álvarez #482, Colonia Centro, Monterrey, N.L., 64000, Mexico Balance Urbano Control de Plagas S.A. de CV Ordinary 100% Company name Share class % held by Group companies Sauce 29, Col. Santa Maria La Ribera, Cuauhtemoc, CDMX, 06400, Mexico Control Vifer, S.A. de C.V. Ordinary A Ordinary B 100% Servicios de Plagas Terminix, S.A. de C.V. Ordinary A Ordinary B 100% Terminix International S.A. de C.V. Ordinary A Ordinary B 100% Calle 29, No. 210 Col. Garcia Gineres, Merida, Yucatán, 97070, Mexico Personal Profesional de Pesticidas S.A. de C.V. Ordinary 100% Mozambique Avenida da Namaacha, kilometro 6, Residencial Mutateia, Cidade da Matola, Mozambique Rentokil Initial Mozambique Limitada Ordinary 100% Netherlands Impact 6, 6921 RZ, Duiven, Netherlands Ambius B.V. Ordinary 100% Oude Middenweg 77, 2491 AC, Den Haag, Netherlands B.V. Rentokil Funding Ordinary A 100% BET (Properties) B.V. Ordinary 100% BET Finance B.V. Ordinary 100% Holland Reconditionering B.V. Ordinary 100% Rentokil Initial Finance B.V. Ordinary 100% Rentokil Initial International B.V. Ordinary 100% Rentokil Initial Overseas (Holdings) B.V. Ordinary 100% Ravenswade 54-S, 3439, Nieuwegein, LD, Netherlands Rentokil Initial B.V. Ordinary 100% New Zealand Level 1, 89 Carbine Road, Mount Wellington, Auckland 1060, New Zealand Rentokil Initial Limited Ordinary 100% 16 Leonard Road, Mount Wellington, Auckland, 1060, New Zealand Nitrogenx Limited1 Ordinary 100% Norway Sanitetsveien 17, Postboks 84, Skjetten, 2026, Norway Rentokil Initial Norge AS Ordinary 100% Rambergveien 1, Tønsberg, 3115, Norway Skadedyrbutikken AS Ordinary 100% Pakistan S-2 Commercial, 2nd Floor, Lalik Jan Chowk, Phase II, Lahore, Cantonment, Punjab, Pakistan C-Shine Sustainable Solutions (Private) Limited Ordinary 70% Peru Calle 23 Mza, Z-1 Lote 9, Villa El Salvador, Peru Ingeclean Peru S.A.C Ordinary 100% Philippines No 73 Elisco Road, Bo, Kalawaan, Pasig City, 1600, Philippines Rentokil Initial (Philippines) Inc Ordinary 100% 196 Rentokil Initial plc Annual Report 2025 |
|
Company name Share class % held by Group companies Poland Ul. Jana Pawla Woronicza, Nr 31, Lok. 78, 02-640, Warszawa, Poland Rentokil Polska Sp. z o.o. Ordinary 100% Ul. Dąbrowskiego 44, 50-457, Wrocław, Poland Vaco sp. z o.o Ordinary 100% Portugal EN 115, Km 78,67, 2664-502, São Julião do Tojal, Portugal Rentokil Initial Portugal – Serviços de Protecção Ambiental, Unipessoal, Lda Ordinary 100% Republic of Korea 2nd Floor, Korea Disaster Relief Association, 371-19 Sinsu-Dong, Mapo-Gu, Seoul, Korea, 121-856, Republic of Korea Rentokil Initial Korea Ltd Common 100% Saudi Arabia 4477 King Abdul Aziz Road, Suleimaniya, Unit 2 Riyadh KSA, Saudi Arabia BET Trading LLC Ordinary 100% Boecker Public Health Saudia Company Limited Ordinary 100% PO Box 30164, Office No: 401, 4th Floor, Al Tamimi Building, Al Khobar North, Al Khobar, 31952, Saudi Arabia Rentokil Saudi Arabia Limited O.P.C Ordinary 100% Singapore 16 Jalan Mesin, 368815, Singapore Rentokil Initial Asia Pacific Management Pte Ltd Ordinary 100% Rentokil Initial Singapore Private Limited Ordinary 100% Slovakia Kopcianska 10, Bratislava, 851 01, Slovakia Rentokil Initial s.r.o. Ordinary 100% South Africa Unit D12 Connaught Park, Riley Road, Beaconvale, Parow, 7000, South Africa Cannon Hygiene (SA) Proprietary Limited Ordinary 100% 2 Stigant Road, Claremont, Cape Town, 7708, South Africa Newshelf 1232 (Pty) Ltd Preference 100% Rentokil Initial (Proprietary) Limited Ordinary 100% Rentokil Initial Dikapi JV (Pty) Limited Ordinary 59% Spain C/ Los Carros, 1 Bajo, Pobladura de Pelayo de García, 24249, Leon, Spain Desinfeccion de Plagas S.L. Ordinary 100% C/ Monasterio de Nájera 1, 50002, Zaragoza, Spain Desinfecciones Bionext, S.L. Ordinary 100% Pol. Ind. El Prado, Calle Bilbao, Nave 5, Parcel 17, 06800, Mérida, Badajoz, Spain Fumigaciones Extremeñas Merida, S.L. Ordinary 100% C/ Mar Mediiterráneo 1 (entrada por Mar Adriático, San Fernando de Henares), 28830, Madrid, Spain Initial Gaviota S.A.U Ordinary 100% Rentokil Initial España SA Ordinary A Ordinary B Ordinary C 100% Company name Share class % held by Group companies Polígono Industrial “Pla de Vallonga”, Calle Meteorito, 59 – Alicante, Spain Lokimica S.A Ordinary 100% C/de la Nena Casas, 71, 08017, Barcelona, Spain Servicios Depec S.L. Ordinary 100% C/ Palanca 34, 28045, Madrid, Spain Tecnologia y Desarrollo Medioambiental, S.L. Ordinary 100% Sri Lanka No. 307, Negombo Road, Peliyagoda, Sri Lanka Rentokil Initial Ceylon (Private) Limited Ordinary 100% Sweden Avestagatan 61, SE 163 53 Spanga, Sweden Ambius AB Ordinary 100% Rent a Plant Interessenter AB Ordinary 100% Sweden Recycling AB Ordinary 100% c/o Nomor AB, Tusbystråket 1B, 191 61, Sollentuna, Sweden Nomor AB Ordinary 100% Rentokil Försăkring AB Ordinary 100% Nomor Holding AB Ordinary 100% Terminix Nomor AB Ordinary 100% Switzerland Hauptstrasse 3, 4625 Oberbuchsiten, Oberbuchsiten, Switzerland Rentokil Schweiz AG Ordinary 100% Taiwan (Province of China) 14F-1, No. 26, Ln. 61, Sec. 1, Guangfu Rd., Sanchong Dist., New Taipei City, Taiwan (Province of China) Initial Hygiene Co Ltd Ordinary 100% Rentokil Co., Limited Ordinary 100% Tanzania 1st Floor, Opal Place, 77 Haile Selassie Road, Masaki, P.O. Box 21184, Dar es Salaam, Tanzania Initial Hygiene (T) Limited Ordinary 100% Thailand 160 Vibhavadi Rangsit Road, Khwaeng Ratchadapisek, Khat Dindaeng, Thailand, 10400, Thailand Cannon Pest Management Co. Ltd Ordinary 100% Rentokil Initial (Thailand) Ltd Ordinary 100% Trinidad and Tobago Field no. 82, KK-LL, Aranguez South, Trinidad and Tobago Rentokil Initial (Trinidad) Limited Ordinary 100% Turkey Tuna Mahallesi Sanat Caddesi No: 17 Daire: 121, Bornova, İzmir, Turkey Rentokil Initial Çevre Sağlığı Sistemleri Ticaret ve Sanayi A.Ş Ordinary 100% Uganda Plot No 2012, Kalinabiri Road, Ntinda, Kampala, Uganda Rentokil Initial Uganda Limited Ordinary 100% Rentokil Initial plc Annual Report 2025 197 Strategic Report Corporate Governance Financial Statements Other Information |
|
Related Undertakings continued Company name Share class % held by Group companies United Arab Emirates Office number 1403, PO Box 41999, TECOM, Al Barsha Heights, Dubai, United Arab Emirates Boecker Food Safety L.L.C. Ordinary 100% Al Shafar Tower 1, 14th Floor, Office No. 1401, TECOM, Al Barsha Heights, Dubai, United Arab Emirates Boecker Pest Control L.L.C. Ordinary 100% Boecker Public Health Pest Control Equipment Trading L.L.C. Ordinary 100% National Pest Control LLC Ordinary 100% Rentokil Initial Pest Control LLC Ordinary 100% Shop No.6, Jurf Industrial Zone 2, Ajman, United Arab Emirates Rentokil Initial Pest Control L.L.C. Ordinary 100% Al Suhyeen, Rolla, Office 205, Sharjah, United Arab Emirates Specialist Int. Pest Control LLC Ordinary 100% United Kingdom Compass House, Manor Royal, Crawley, West Sussex, RH10 9PY, United Kingdom AW Limited Ordinary 100% B.E.T. Building Services Limited Ordinary 100% BET (No.18) Limited Ordinary 100% BET (No.68) Limited2 Ordinary 100% BET Environmental Services Ltd Ordinary 100% BET Pension Trust Limited Ordinary 100% BPS Offshore Services Limited3 Ordinary 100% Broadcast Relay Service (Overseas) Limited3 Ordinary 100% Castlefield House Limited Ordinary 100% Chard Services Limited Ordinary 100% CHL Legacy Limited3 Ordinary 100% Contemporary Plant Designs Limited3 Ordinary 100% DCUK (FM) Limited Ordinary 100% DCUKFM Holdings Limited Ordinary 100% DuctClean (UK) Limited Ordinary 100% Dudley Industries Limited3 Ordinary 100% Enigma Laundries Limited Ordinary 100% Enigma Services Group Limited Ordinary 100% Enviro-Fresh Limited Ordinary 100% Environmental Contract Services Limited3 Ordinary 100% Euroguard Technical Services Limited Ordinary 100% Grayston Central Services Limited Ordinary 100% Hometrust Limited Ordinary 100% Initial Limited3 Ordinary 100% Initial Medical Services Limited Ordinary 100% Interior Contracts (UK) Limited3 Ordinary 100% Kent Tropical Interiors Limited3 Ordinary A Ordinary B 100% Marlin Global Services Limited1,3 Ordinary 100% Manor Planting Ltd3 Ordinary 100% Nature At Work Limited Ordinary 100% Newman’s Plants Limited3 Ordinary A Ordinary B Ordinary C 100% Opel Transport & Trading Company Limited Ordinary 100% Paul Lomax Limited Ordinary A Ordinary B Ordinary C 100% Peter Cox Limited Ordinary A 100% Plant Nominees Limited Ordinary 100% Prime Projects International Limited3 Ordinary 100% Prokill (UK) Ltd Ordinary A 100% Prokill Limited Ordinary A Ordinary B Ordinary C Ordinary D 100% Company name Share class % held by Group companies Rapid Washrooms Limited Ordinary A Ordinary B Ordinary C 100% Rentokil Dormant (No.6) Ltd Ordinary 100% Rentokil Initial (1896) Limited3 Ordinary 100% Rentokil Initial (1993) Limited3 Ordinary 6% Non-Redeemable Preference 100% Rentokil Initial 1927 plc Ordinary Redeemable Preference: AUD, CAD, CLP, DKK, IDR, ILS, NOK, NZD, USD EUR Cumulative Preference (Non-Redeemable) 100% Rentokil Initial Americas Limited3 Ordinary 100% Rentokil Initial Asia Pacific Limited3 Ordinary 100% Rentokil Initial Brazil Limited3 Ordinary 100% Rentokil Initial Finance Limited3 Ordinary 100% Rentokil Initial Holdings Limited3, 4 Ordinary 100% Rentokil Initial Investments South Africa3 Ordinary 100% Rentokil Initial Pension Trustee Limited Ordinary 100% Rentokil Initial Services Limited Ordinary 100% Rentokil Initial UK Ltd Ordinary 100% Rentokil Insurance Limited Ordinary 100% Rentokil Limited3 Ordinary 100% Rentokil Overseas Holdings Limited3 Ordinary 100% Rentokil Property Care Limited Ordinary 100% Rentokil Property Holdings Limited Ordinary 100% RI Dormant No.18 Limited Ordinary 100% RI Dormant No.20 Limited Ordinary 100% Saaman Limited3 Ordinary 100% Stratton House Leasing Limited3 Ordinary 100% SVM International Services Limited Ordinary 100% Target Express Holdings Limited Ordinary 100% Target Express Limited Ordinary 100% Target Express Parcels Limited Ordinary 100% TEB Cleaning Services Limited Ordinary 100% The Palfreymans Limited Ordinary A Ordinary B Ordinary C Ordinary D Ordinary E 100% Tropical Ambience Limited Ordinary 100% Tropical Innovation Limited3 Ordinary 100% Urban Planters Franchise Limited3 Ordinary 100% Waterized Limited Ordinary 100% Stephens & Carter Limited2 Ordinary 100% The Ca’D’Oro, 45 Gordon Street, Glasgow, Scotland, G1 3PE, United Kingdom Duct Clean Services Ltd3 Ordinary 100% Industrial Clothing Services Limited Ordinary 100% Pest Protection Services (Scotland) Limited Ordinary A 100% RI Dormant No.12 Limited Ordinary 100% Wise Property Care Ltd. Ordinary 100% 198 Rentokil Initial plc Annual Report 2025 |
|
Company name Share class % held by Group companies United States 1125 Berkshire Blvd, Suite 150, Reading PA 19610, United States Cygnet Enterprises Northwest, Inc Common 100% Cygnet Enterprises West, Inc Common 100% Cygnet Enterprises, Inc Common 100% Medentex LLC Common 100% Oliver Exterminating Dominicana Corp Common 100% Rentokil Initial Environmental Services LLC Interest 100% Rentokil North America, Inc. Ordinary 100% Rentokil of Puerto Rico, Inc. Common 100% Solitude Lake Management, LLC Common 100% Vector Disease Acquisition, LLC Series A shares Series B shares Common shares 100% Vector Disease Control International, LLC Common 100% 2288 150th Street Halstad MN 56548, United States Airborne Vector Control LLC Common 100% The Corporation Trust Company, Corporation Trust Center, 1209 Orange Street, Wilmington DE 19801, United States Anza, LLC Ordinary 100% Initial Contract Services LLC Interest 100% Ramac (US) LLC Interest 100% Rentokil Initial US Holdings, Inc. Common 100% Rentokil Terminix Funding, LLC Interest 100% Secure Monthly Affordable Credit Corporation Common 100% Secure Monthly Affordable Credit Limited Partnership Ordinary 100% SVM Honduran Service and Investments Company, LLC Interest 100% SVM Olympus Service Company, LLC Interest 100% SVM Progressive Service Company, LLC Interest 100% SVM Technicians Service Company, LLC Interest 100% SVM Vanguard Service Company, LLC Interest 100% Terminix Consumer Services, LLC Interest 100% Terminix Holdings, LLC Interest 100% Terminix International Holdings, Inc Common 100% Terminix Management Corporation Interest 100% Terminix Receivables Company LLC Interest 100% The Terminix Company, LLC Interest 100% TMX Holdco, LLC Interest 100% United Transport America LLC Interest 100% Virginia Properties Inc Ordinary 100% PO Box 4510 Ten Free Street, Portland ME 04112, United States Asiatic Investments, Inc. Ordinary 100% 1000 Labarre Road, Metairie, LA 70001, United States Mississippi Mosquito Control, LLC Interest 100% Mosquito Control of Lafourche, LLC Interest 100% Mosquito Control Services of Florida, LLC Interest 100% Mosquito Control Services of Georgia, LLC Interest 100% Mosquito Control Services, L.L.C Interest 100% Rittiner Group, L.L.C. Interest 100% St. Charles Mosquito Control, L.L.C. Interest 100% St. John Mosquito Control, L.L.C. Interest 100% Terrebonne Mosquito Control, LLC Interest 100% 1000 Satellite Blvd, Ste 101, Suwanee, Gwinnett County GA 30024, United States ProPest Products, Inc. Ordinary 100% 2540, Lawrenceville Hwy, Lawrenceville, GA 30044, United States Steritech-Canada, Inc. Common 100% Company name Share class % held by Group companies Asiatic Holdings LLC Ordinary 100% 463 Mountain View Drive, Suite 301, 3rd Floor, Colchester VT 05446, United States Steward Insurance Company Common 100% 860 Ridge Lake Blvd., Memphis TN 38120, United States Terminix Gift, L.L.C. Interest 100% 150 Peabody Place, Memphis TN 38103, United States The Terminix International Company Limited Partnership Ordinary 100% The Terminix Foundation Interest 100% Uruguay Tomás Giribaldi, apto 3, 2270, Uruguay Amalur Uruguay Sociedad Anónima Ordinary 100% Chana, 2033, Departmento de Montevideo, Uruguay La Sanitaria S.A. Ordinary 100% La Paz, 1227, Departamento de Montevideo, Uruguay Rentokil Uruguay S.A. Ordinary 100% Manuel Calleros 4918, Montevideo, Uruguay Control Productos y Servicios de Higiene Ambiental S.A.1 Ordinary 100% Vietnam 54-56 Nguyen Trai Street, Ben Thanh Ward, District 1, Ho Chi Minh City, Vietnam Rentokil Initial (Vietnam) Company Limited Ordinary 100% Virgin Islands, US Merchants Financial Center, 4608 Tutu Park Mall, Suite 202, St Thomas, Virgin Islands, 00802-1816, Virgin Islands, U.S. Terminix International USVI, LLC Interest 100% Rentokil Initial plc Annual Report 2025 199 Strategic Report Corporate Governance Financial Statements Other Information |
|
Related Undertakings continued Associated undertakings Company name Share class % held by Group companies People’s Republic of China B3, Xunmei Industrial Zone, Fengze District, Quanzhou City, Fujian Province, China Fujian Xunke Pest Control Company Limited Ordinary 30% Room 1005, Unit 1, Building 1, No.1 Huangjin Road, Dongguan City, Guangdong Province, China Guangdong New Hope Environmental Technology Co., Ltd. Ordinary 30% No.14 Wenguangtingjiao Road, Chaoyang District, Shantou City, China Guangdong Vircon Pest Management Company Limited Ordinary A 30% Egypt Third floor, Jupiter Building, B3, Majara Compound, Sheikh Zayed, Giza, Egypt ServicePros S.A.E.5 Ordinary 30% Japan Kudan Terrace, 1-6-5 Kudan Minami, Chiyoda-Ku, Tokyo, 102-0074, Japan Nippon Calmic Ltd Ordinary 49% Nigeria Old Ojo Road, Off Badagry Expressway, Agboju, Lagos, 359/361, Nigeria Boecker Public Health Services Ltd Ordinary 30% Norway Veverivegen 10, 2848 Skreia, Norway Skadedyrkontrollen øst AS Ordinary 40% Qatar 16 A Al Mana Business Tower, Doha, Qatar Boecker Public Safety Services – Qatar W.L.L. Ordinary 24.5% United Kingdom Compass House, Manor Royal, Crawley, West Sussex, RH10 9PY, United Kingdom Hometrust Kitchens Limited Ordinary 25% Torchsound Properties Limited Ordinary 50% 1. Acquired or incorporated by the Group in 2025. 2. Temporary restoration. 3. As permitted by section 479A of the Companies Act 2006, the Company intends to take advantage of the audit exemption in relation to the individual accounts of these companies. 4. Held directly by Rentokil Initial plc. 5. This entity is non-operational and the Group does not carry out business in this jurisdiction. 200Rentokil Initial plc Annual Report 2025 |
|
Parent Company Balance Sheet At 31 December Notes 2025 £m 2024 £m Non-current assets Investments 3 4,470 4,454 Debtors – amounts falling due after more than one year 4 – 2,750 Deferred tax assets 5 26 21 Derivative financial instruments 6 90 6 4,586 7,231 Current assets Debtors – amounts falling due within one year 4 4,894 2,749 Cash and cash equivalents – 1 Derivative financial instruments 6 41 – 4,935 2,750 Current liabilities Creditors – amounts falling due within one year 7 (2,753) (3,483) Bank and other borrowings 8 (442) (564) Derivative financial instruments 6 (3) – (3,198) (4,047) Net current assets/(liabilities) 1,737 (1,297) Non-current liabilities Bank and other borrowings 8 (2,187) (2,503) Derivative financial instruments 6 (13) (29) (2,200) (2,532) Net assets 4,123 3,402 Equity capital and reserves Share capital 9 25 25 Share premium 10 15 15 Merger relief reserve 2,998 2,998 Cash flow hedge reserve – 8 Retained earnings 1,085 356 Total equity 4,123 3,402 Under section 408 of the Companies Act 2006, the Company is exempt from the requirement to present its own Statement of Comprehensive Income. The Company reported a profit for the year ended 31 December 2025 of £931m (2024: loss of £44m), following the dividends received from subsidiaries of £1,000m. The Financial Statements on pages 201 to 206 were approved by the Board of Directors and were signed on its behalf by Andy Ransom and Paul Edgecliffe-Johnson on 5 March 2025. Andy Ransom Paul Edgecliffe-Johnson Chief Executive Chief Financial Officer Registered number: 05393279 Rentokil Initial plc Annual Report 2025 201 Strategic Report Corporate Governance Financial Statements Other Information |
|
Parent Company Statement of Changes in Equity For the year ended 31 December Share capital £m Share premium £m Merger relief reserve £m Cash flow hedge reserve £m Retained earnings £m Total equity £m At 1 January 2024 25 14 2,998 2 614 3,653 Loss for the year – – – – (44) (44) Other comprehensive income: Movement on cash flow hedge – – – 6 – 6 Tax related to items taken directly to other comprehensive income – – – – (3) (3) Total comprehensive income for the year – – – 6 (47) (41) Transactions with owners: Gain on stock options – 1 – – – 1 Dividends paid to equity shareholders – – – – (229) (229) Share-based payments charged to profit and loss – – – – 4 4 Share-based payments debited to investments – – – – 16 16 Tax related to items taken directly to equity – – – – (2) (2) At 31 December 2024 25 15 2,998 8 356 3,402 Profit for the year – – – – 931 931 Other comprehensive income: Movement on cash flow hedge – – – (8) – (8) Tax related to items taken directly to other comprehensive income – – – – 2 2 Total comprehensive income for the year – – – (8) 933 925 Transactions with owners: Dividends paid to equity shareholders (226) (226) Share-based payments charged to profit and loss – – – – 5 5 Share-based payments debited to investments – – – – 16 16 Tax related to items taken directly to equity – – – – 1 1 At 31 December 2025 25 15 2,998 – 1,085 4,123 Shares of £nil (2024: £nil) have been netted against retained earnings. This represents 9.8m (2024: 11.4m) shares held by the Rentokil Initial Employee Share Trust. The market value of these shares at 31 December 2025 was £44m (2024: £45m). Dividend income from, and voting rights on, the shares held by the Trust have been waived. 202 Rentokil Initial plc Annual Report 2025 |
|
Notes to the Parent Company Financial Statements 1. Accounting convention These Financial Statements are prepared on a going concern basis, using the historical cost convention (as modified to include the revaluation of certain financial instruments), and are prepared in accordance with the Companies Act 2006 as applicable to companies using Financial Reporting Standard 101 Reduced Disclosure Framework (FRS 101). In preparing these Financial Statements, the Company applies the recognition, measurement, and disclosure requirements of UK-adopted International Accounting Standards (IAS) in conformity with the requirements of the Companies Act 2006 (Adopted IFRSs), but makes amendments where necessary in order to comply with the Companies Act 2006 and has set out below where advantage of the FRS 101 disclosure exemptions has been taken. The results of Rentokil Initial plc are included in the Consolidated Financial Statements of Rentokil Initial plc, which are presented on pages 148 to 200. The Company has taken advantage of the following disclosure exemptions under FRS 101, all of which have equivalent disclosures included in the Consolidated Financial Statements: • the requirements of paragraphs 45(b) and 46–52 of IFRS 2 Share-based Payment; • the requirements of paragraphs 62, B64(d), B64(e), B64(g), B64(h), B64(j) to B64(m), B64(n)(ii), B64(o)(ii), B64(p), B64(q)(ii), B66, and B67 of IFRS 3 Business Combinations; • the requirements of IFRS 7 Financial Instruments: Disclosures; • the requirements of paragraphs 91–99 of IFRS 13 Fair Value Measurement; • the requirement in paragraph 38 of IAS 1 Presentation of Financial Statements to present comparative information in respect of: (i) paragraph 79(a) (iv) of IAS 1; (ii) paragraph 73(e) of IAS 16 Property, Plant and Equipment; (iii) paragraph 118(e) of IAS 38 Intangible Assets; (iv) paragraphs 76 and 79(d) of IAS 40 Investment Property; and (v) paragraph 50 of IAS 41 Agriculture; • the requirements of paragraphs 10(d), 10(f), and 134–136 of IAS 1 Presentation of Financial Statements; • the requirements of IAS 7 Statement of Cash Flows; • the requirements of paragraphs 30 and 31 of IAS 8 Accounting Policies, Changes in Accounting Estimates and Errors; • the requirements of paragraph 17 of IAS 24 Related Party Disclosures; • the requirements in IAS 24 Related Party Disclosures to disclose related party transactions entered into between two or more members of a group, provided that any subsidiary which is a party to the transaction is wholly owned by such a member; • the requirements of paragraphs 134(d)–134(f) and 135(c)–135(e) of IAS 36 Impairment of Asset; and • the requirements of paragraphs 88C and 88D of IAS 12 Income Taxes. 2. Material accounting policies Critical accounting estimates and judgements The preparation of Financial Statements in compliance with FRS 101 requires the use of certain critical accounting estimates. It also requires the Company’s Directors to exercise judgement in applying the Company’s accounting policies. The Company makes certain estimates and assumptions regarding the future. Estimates and judgements are continually evaluated based on historical experience and other factors, including expectations of future events that are believed to be reasonable under the circumstances. In the future, actual experience may differ from these estimates and assumptions. Estimates and assumptions have been reviewed to assess whether significant risk of causing a material adjustment to the carrying amounts of assets and liabilities within the next financial year is present; there were no estimates nor assumptions found to have such significant risk. Investments Investments held as fixed assets are stated at cost less provision for any impairment. In the opinion of the Directors, the value of such investments are not less than shown at the balance sheet date. Borrowings Borrowings are recognised initially at fair value, net of transaction costs incurred. Borrowings are subsequently stated at amortised cost (where hedge accounting is not applied); any difference between the proceeds (net of transaction costs) and the redemption value is recognised in the profit and loss account over the period of the borrowings using the effective interest method. Borrowings are classified as current liabilities unless the Company has a continuing right to defer settlement of the liability for at least 12 months after the balance sheet date under its committed bank credit facilities. Deferred tax Deferred tax assets and liabilities are recognised where the carrying amount of an asset or liability in the statement of financial position differs from its tax base, except for differences arising on: • the initial recognition of an asset or liability in a transaction which is not a business combination and at the time of the transaction affects neither accounting nor taxable profit; and • investments in subsidiaries and jointly controlled entities where the Company is able to control the timing of the reversal of the difference and it is probable that the difference will not reverse in the foreseeable future. Recognition of deferred tax assets is restricted to those instances where it is probable that taxable profit will be available against which the difference can be utilised. The amount of the asset or liability is determined using tax rates that have been enacted or substantively enacted by the reporting date and are expected to apply when the deferred tax assets/liabilities are settled/recovered. Financial instruments and risk management The Company policy in respect of financial instruments and risk management is disclosed in Section C of the Notes to the Consolidated Financial Statements on pages 181 to 190. Disclosures have been made on financial instruments as required by the Companies Act 2006. Expected credit loss calculations are performed annually for intercompany debtors and are a probability-weighted estimate of credit losses based on the Company’s historical credit loss experience adjusted for debt-specific factors. Share capital Ordinary shares are classified as equity. Incremental costs directly attributable to the issue of new shares or options are shown in equity. Rentokil Initial plc Annual Report 2025203 Strategic Report Corporate Governance Financial Statements Other Information |
|
Notes to the Parent Company Financial Statements continued Share-based compensation The Group operates two equity-settled share-based long-term incentive plans (LTIPs): the Performance Share Plan and the Restricted Share Plan. The economic cost of awarding shares and share options to employees is recognised as an expense in the income statement, equivalent to the fair value of the benefit awarded. The fair value of the Performance Share Plan is determined by reference to option pricing models, principally stochastic and adjusted Black-Scholes models. The fair value of the Restricted Share Plan is determined by reference to an adjusted Black-Scholes model. The charge for both plans is recognised in the income statement over the vesting period of the award. At each balance sheet date, the Group revises its estimate of the number of shares that vest or options that are expected to become exercisable. Any revision to the original estimates is reflected in the income statement with a corresponding adjustment to equity immediately to the extent it relates to past service, and the remainder over the rest of the vesting period. Dividend distribution Dividend distribution to the Company’s shareholders is recognised as a liability in the Financial Statements in the period in which the dividends are approved by the Company’s shareholders. Interim dividends are recognised when paid. See Note D1 to the Consolidated Financial Statements for details of dividends proposed in the year. 3. Investments 2025 £m 2024 £m At 1 January 4,454 4,438 Share-based payments to employees of subsidiaries 16 16 At 31 December 4,470 4,454 At 31 December 2025, Rentokil Initial Holdings Limited is the Company’s sole direct subsidiary undertaking. All other indirect subsidiary undertakings are listed on pages 193 to 200. 4. Debtors 2025 £m 2024 £m Amounts falling due within one year: Amounts owed by subsidiary undertakings – non-interest-bearing loans (repayable on demand) 2,143 2,740 Amounts owed by subsidiary undertakings – interest-bearing loan (with effective interest rate of 2.5%) 2,750 – Other debtors 1 9 4,894 2,749 Amounts falling due after more than one year: Amounts owed by subsidiary undertakings – interest-bearing loan (with effective interest rate of 2.5%) – 2,750 Amounts owed by subsidiary undertakings due within one year relates to an interest-bearing loan that matures in July 2026. 5. Deferred tax assets 2025 £m 2024 £m The deferred tax asset is made up as follows: LTIP 13 12 Tax losses 13 11 Cash flow hedge reserve – (2) 26 21 The Company is within the scope of the UK income inclusion and domestic top-up tax rules enacted in Finance (No.2) Act 2023. Based on the Group assessment of the exposure to Global Minimum Tax (GMT), no top-up tax charge is expected for the Company so there is no current tax exposure. The Company applies the exception to recognising and disclosing information about deferred tax assets and liabilities related to GMT, as provided in the amendments to IAS 12 issued in May 2023. Further information about the GMT impact on the Group can be found in the Notes to the Consolidated Financial Statements in Note A12. 204 Rentokil Initial plc Annual Report 2025 |
|
6. Derivative financial instruments Fair value assets 2025 £m Fair value assets 2024 £m Fair value liabilities 2025 £m Fair value liabilities 2024 £m Interest rate swaps (level 2): – Non-hedge 126 5 (11) (21) – Cash flow hedge 5 1 (5) (8) 131 6 (16) (29) Analysed as follows: Current portion 41 – (3) – Non-current portion 90 6 (13) (29) 131 6 (16) (29) Cash flow hedge accounting has been applied to derivatives (marked as cash flow hedge in the table above) in accordance with IFRS 9. Where no hedge accounting has been applied, related derivatives have been marked as ‘non-hedge’. Any ineffectiveness on the cash flow hedge is taken directly to finance costs. During the year, hedge ineffectiveness, from those derivatives in a cash flow hedge relationship recognised in the profit and loss, was not material, being less than £100k (2024: £1m loss). Cash flow hedge accounting has been applied to €179m (2024: €179m) of the €500m 2026 bond, and €175m (2024: €175m) of the €600m 2028 bond. The cross-currency interest rate swaps are used as hedging instruments to hedge the volatility in the £/€ exchange rate of the bonds. For the year ended 31 December 2025, the amount in comprehensive income related to cash flow hedge accounting was a loss of £8m (2024: £6m gain). 7. Creditors 2025 £m 2024 £m Amounts falling due within one year: Amounts due to subsidiary undertakings (non-interest-bearing loans repayable on demand) 2,753 3,480 Other creditors – 3 2,753 3,483 8. Bank and other borrowings 2025 £m 2024 £m Amounts falling due within one year 442 564 Amounts falling due after one year 2,187 2,503 2,629 3,067 Medium-term notes and bond debt comprises: Bond interest coupon 2025 Effective hedged interest rate 2025 Bond interest coupon 2024 Effective hedged interest rate 2024 Current €500m bond due May 2026 Fixed 0.875% Fixed 1.326% Fixed 0.875% Fixed 1.365% Non-current – €850m bond due June 2027 Fixed 3.975% – Fixed 3.975% – €600m bond due October 2028 Fixed 0.500% Fixed 0.896% Fixed 0.500% Fixed 0.938% €600m bond due June 2030 Fixed 4.475% – Fixed 4.475% – £400m bond due June 2032 Fixed 5.000% – Fixed 5.000% – Average cost of bond debt at year-end rates 3.24% 3.29% The Company bank debt facilities comprise: Facility amount 2025 £m Drawn at year end 2025 £m Headroom 2025 £m Interest rate at year end 2025 % Facility amount 2024 £m Drawn at year end 2024 £m Headroom 2024 £m Interest rate at year end 2024 % Current $700m term loan due October 2025 – – – – 559 559 – 5.18 $50m term loan due May 2025 – – – – 40 – 40 0.21 Non-current $1.0bn RCF due October 2029 744 – 744 0.14 799 – 799 0.14 The Revolving Credit Facility (RCF) was undrawn throughout 2024 and 2025. There are no financial covenants associated with the RCF or any other debt facility. Rentokil Initial plc Annual Report 2025205 Strategic Report Corporate Governance Financial Statements Other Information |
|
Notes to the Parent Company Financial Statements continued 9. Share capital During the year, 1,500,000 new shares were issued in relation to employee share schemes. 2025 £m 2024 £m Issued and fully paid: At 31 December – 2,526,039,885 shares of 1p each (2024: 2,524,539,885) 25 25 10. Share premium 2025 £m 2024 £m At 31 December 15 15 11. Guarantees and contingent liabilities The Company has provided guarantees in respect of bank and other borrowings held by its subsidiary undertakings. In addition, there are contingent liabilities in respect of litigation, pensions, and tax. The possibility of any significant outflows in respect of these items is considered to be remote. 12. Auditors’ remuneration Note A8 to the Consolidated Financial Statements provides details of the remuneration of the Company’s auditors for the Group. 13. Employees The monthly average number of people employed by the Company during the year was five (2024: four). Details on employee costs are in Note A9 to the Consolidated Financial Statements. Services for finance, taxation, treasury, legal, HR, and IT are provided by Rentokil Initial 1927 plc and recharged to the Company. Information on Directors’ emoluments, share and other interests, transactions, and pension entitlements is included in the Directors’ Remuneration Report in this Annual Report. 14. Share-based payments Share-based payments for the financial year were £21m (2024: £20m), of which £5m (2024: £4m) was charged to the profit and loss account and £16m (2024: £16m) was debited to investments. Share options relating to the Board of Directors are disclosed in the Directors’ Remuneration Report and detailed share-based payment disclosures are shown in Note A11 to the Consolidated Financial Statements. 15. Related party transactions The Company has not undertaken any transactions with related parties during the year, other than transactions with wholly owned related parties of Rentokil Initial plc. Such transactions are exempt from disclosure under FRS 101. There were no transactions with non-wholly owned related parties of Rentokil Initial plc. 16. Post balance sheet events On 2 March 2026, Rentokil Initial plc redeemed in full the €500m 0.8750% Senior Unsecured Notes due 30 May 2026, at their principal amount together with accrued interest. The redemption was carried out in accordance with the terms and conditions of the notes. There were no other significant events between 31 December 2025 and the date of approval of these accounts that would require amendments to or additional disclosures in the financial statements. 206Rentokil Initial plc Annual Report 2025 |
|
Management’s Discussion and Analysis of Financial Condition and Results of Operations The following discussion should be read together with our audited Consolidated Financial Statements and the related notes thereto, included elsewhere in this Annual Report. Some of the information contained in this discussion and analysis or set forth elsewhere in this Annual Report, including information with respect to the Group’s plans and strategy for its business, includes forward-looking statements that reflect plans, estimates and beliefs and involve numerous risks and uncertainties, including but not limited to those described in the ‘Risk Factors’ and sections of this Annual Report, including ‘Cautionary Statement Regarding Forward-Looking Statements’. Therefore, actual results may differ materially from those contained in any forward-looking statements. The impact of macroeconomic factors on the Group’s business Macroeconomic factors Inflation – The Group’s cost base is largely driven by the cost of compensation for employees, the costs of required equipment (including service equipment and uniforms, vehicles and fuel, and technology necessary to deliver the high-quality services), and the cost of the products being used on customer premises including service contract equipment and consumables. All of these costs are subject to inflationary pressures and as such, sustained elevated increases in such costs may not always be possible to pass on to customers. The Group has operations in Argentina, Ghana, Lebanon and Turkey, all hyperinflationary countries. These businesses implement frequent price increases to offset the increases in costs they incur. This demonstrates that the Group has operations in both low and high inflationary markets, and is accustomed to a range of inflationary environments. During 2024 and 2025, the Group has been able to pass along the incurred inflationary impacts in the form of increased prices to its customers. However, the Group cannot predict the extent to which it may experience future cost increases. The Group may be prevented, in whole or in part, from passing these cost increases on to its existing and prospective customers, which could have a material adverse impact on the Group’s business. Shortage of products or supply chain impacts – The Group does not have significant exposure to international logistics as the majority of its purchased products and services are sourced in the country where they are consumed. Where there are local shortages, products are typically able to be imported quickly from neighbouring markets. Where global shortages exist, such as recent microchip shortages impacting IT and vehicle supply chains, the Group has been able to generally extend the life of the asset until supply chains catch up. However, should there be long-term shortages of critical products or services in the future, then this may adversely impact the operational performance of the Group. Labour shortages – The goods and services of the Group are sold by front line sales employees and delivered by a highly skilled technician workforce. These employees are supported by functional support employees in the Group’s offices around the world. The Group typically retains around 87% of employees each year, although this can vary from year to year and by market. As a result of employees leaving each year and the need to replace and hire additional employees for growth, the Group has established experienced recruitment teams and processes, allowing access to many different labour marketplaces. The Group has a very strong recruitment brand and offers attractive remuneration packages and career development opportunities. In the future, a very significant shortage of labour in a specific geography may limit the Group’s ability to service revenue opportunities while finding qualified employees and adversely impact the operational performance of the Group. Key indicators of performance and financial condition The Group focuses on a variety of indicators and key operating and financial metrics, including certain non-IFRS measures, to monitor the financial condition and performance of its business. These metrics include Revenue, Operating profit, Adjusted Operating Profit (at CER), Adjusted Profit Before Tax, Adjusted Profit After Tax, Adjusted Earnings Per Share, Adjusted Interest, EBITDA, Adjusted EBITDA, Free Cash Flow, Adjusted Free Cash Flow, Adjusted Free Cash Flow Conversion, Customer Retention, Colleague Retention and Lost Time Accident Rate. Revenue – Revenue results are primarily a function of the volume and pricing of the services and products provided to the Group’s customers by the business, as well as the mix of services and products provided across the business. The volume of revenue is impacted by new unit sales, the retention of existing customers and acquisitions. The Group serves both residential and commercial customers. During 2025, sales were generated across 90 countries, with the only country accounting for greater than, or equal to, 10% of revenue from external customers being the US (61%). Operating profit – This measure is calculated as revenue less operating expenses, with operating expenses consisting of employee costs, direct materials and services, vehicle costs, property costs, depreciation and impairment of property, plant and equipment, amortisation and impairment of intangible assets, and other operating expenses. Other operating expenses include professional fees, marketing costs, amortisation of contract costs and movements in bad debt provision. Adjusted Operating Profit (at CER) – This is an adjusted measure and is presented before the amortisation and impairment of intangible assets (excluding computer software), one-off and adjusting items (see below) and gain or loss on disposal of businesses. Given the international nature of the Group’s operations, foreign exchange movements can have a significant impact on the reported results of the Group when they are translated into sterling (the functional currency of the Group). In order to help understand the underlying trading performance of the business, revenue and profit measures are often presented at constant exchange rates (CER). CER is calculated by translating prior year reported numbers at the average exchange rates for the current year. See ‘Constant Exchange Rates (CER)’ below (page 215). Adjusted Profit Before and After Tax – This non-IFRS measure is used to give management and investors an understanding of the underlying profitability of the business over time. Adjusted Profit Before Tax is calculated by adding the following items back to profit before income tax: amortisation and impairment of intangible assets (excluding computer software), one-off and adjusting items and net interest adjustments. Intangible assets (excluding computer software) are recognised on acquisition of businesses which, by their nature, can vary by size and amount each year. As a result, amortisation of intangibles is added back to assist with understanding the underlying trading performance of the business and to allow comparability across regions and segments. One-off and adjusting items are significant expenses or income that will have a distortive impact on the underlying profitability of the Group. Typical examples are costs related to the acquisition of businesses, gain or loss on disposal or closure of a business, material gains or losses on disposal of fixed assets, adjustments to legacy environmental and legacy termite liabilities, and payments or receipts as a result of legal disputes. Rentokil Initial plc Annual Report 2025 207 Strategic Report Corporate Governance Financial Statements Other Information |
|
Management’s Discussion and Analysis of Financial Condition and Results of Operations continued Net interest adjustments are other non-cash, or one-off and adjusting accounting gains and losses, that can cause material fluctuations and distort understanding of the performance of the business, such as amortisation of discount on legacy provisions and gains and losses on hedge accounting. These adjustments are made to aid year-on-year comparability. Adjusted Profit After Tax is calculated by adding back amortisation and impairment of intangible assets (excluding computer software), one-off and adjusting items and net interest adjustments, and the tax effect on these adjustments to profit before income tax. Adjusted Earnings Per Share – Basic earnings per share is calculated by dividing the profit after tax attributable to equity holders of the Company by the weighted average number of shares in issue during the year, excluding those held in the Rentokil Initial Employee Share Trust which are treated as cancelled, and including share options for which all conditions have been met. For diluted earnings per share, the weighted average number of ordinary shares in issue is adjusted to include all potential dilutive ordinary shares. The Group’s potentially dilutive ordinary shares relate to the contingent issuable shares under the Group’s long-term incentive plans (LTIPs) to the extent that the performance conditions have been met at the end of the period. These share options are issued for nil consideration to employees if performance conditions are met. For the calculation of diluted earnings per share, 477,325 share options were anti-dilutive and not included in the calculation of the dilutive effect as at 31 December 2025 (31 December 2024: 435,578). Adjusted Earnings Per Share is a non-IFRS measure that is calculated by dividing adjusted profit after tax by the weighted average number of ordinary shares in issue. This supplemental measure is also used by management to gain an understanding of the underlying earnings per share performance of the business over time and enable company-to-company comparisons. Adjusted Interest – Adjusted Interest is calculated by adjusting the reported finance income and costs by net interest adjustments (amortisation of discount on legacy termite provision and foreign exchange and hedge accounting ineffectiveness). EBITDA – is calculated by adding back finance income, finance cost, share of profit from associates net of tax, income tax expense, depreciation, amortisation and impairment of intangible assets, and other non-cash expenses to profit for the year. Adjusted EBITDA – is calculated by adding back one-off and adjusting items to EBITDA. Free Cash Flow – Free Cash Flow is a non-IFRS measure that is measured as net cash from operating activities, adjusted for cash flows related to the purchase and sale of property, plant, equipment and intangible assets, cash flows related to leased assets, cash flows related to one-off and adjusting items and dividends received from associates. These items are considered by management to be non-discretionary, as continued investment in these assets is required to support the day-to-day operations of the business. This measure is also used by management to assess how much cash there is to reinvest into the business for future growth through people, technology and M&A. Adjusted Free Cash Flow and Adjusted Free Cash Flow Conversion – Adjusted Free Cash Flow is measured as Free Cash Flow adjusted for product development additions and net investment hedge cash interest through other comprehensive income. This measure is also used by management to determine the efficiency at which the business is able to convert profits into cash. Free Cash Flow Conversion is calculated by dividing Adjusted Free Cash Flow by Adjusted Profit After Tax, expressed as a percentage. Adjusted Profit After Tax is defined as Adjusted Profit Before Tax adjusted for the tax effect of amortisation and impairment of intangible assets (excluding computer software) and one-off and adjusting items and net interest adjustments. Customer Retention – Customer Retention is used to track the retention of the Group’s renewable customers and is calculated on a rolling, 12-month basis in order to avoid seasonal anomalies. It is defined as the total portfolio value of customers retained as a percentage of the opening portfolio. The Group views Customer Retention as one of the key indicators of the long-term success of the business. Customer Retention was 82.6% in the year ended 31 December 2025 and 82.1% in the year ended 31 December 2024. Colleague Retention – Defined as total colleagues retained in-year as a percentage of average headcount throughout the year. Colleague retention is measured on a rolling 12-month basis. The Group considers Colleague Retention to be a key driver of Customer Retention. Colleague Retention was 87.6% in the year ended 31 December 2025 and 86.6% in the year ended 31 December 2024. The increase of 1.0 percentage points in the year ended 31 December 2025 as compared to the year ended 31 December 2024 was a result of a wide-ranging programme including: a retention dashboard and manager training; monitoring for potential issues before escalation; additional mentoring resources; and an enhanced new hire and onboarding experience. Lost Time Accident Rate – Defined as the number of lost time accidents per 100,000 standard working hours. The Group views Lost Time Accident Rate as a key measure of the Group’s employees’ injury prevention. The rate was 0.28 in the year ended 31 December 2025 and 0.29 in the year ended 31 December 2024. Certain components of results of operations Profit before income tax – This is calculated as revenue less operating expenses and net finance costs plus share of profit from associated undertakings (net of tax). Income tax expense – The income tax expense for the period comprises both current and deferred tax. Current tax expense represents the amount payable on this year’s taxable profits and any adjustment relating to prior years. Taxable profits differ from accounting profits as some items of income or expenditure are not taxable or deductible or may be taxable or deductible in a different accounting period. The current income tax charge is calculated on the basis of the tax laws, enacted or substantively enacted at the balance sheet date, in the countries where the Group’s subsidiaries and associates operate and generate taxable income. Deferred tax is an accounting adjustment to provide for tax that is expected to arise in the future due to differences between accounting and tax bases. Deferred tax is determined using tax rates that are expected to apply when the timing difference reverses based on tax rates which are enacted or substantively enacted at the balance sheet date. Profit for the year – This measure is calculated as profit before income tax less income tax expense. For definitions of revenue and operating profit (including operating expenses), see ‘Key Indicators of Performance and Financial Condition’ above. 208 Rentokil Initial plc Annual Report 2025 |
|
Results of operations Following is a discussion of the Group’s results of operations for the years ended 31 December 2025 and 2024. % Change 2025 $m 2024 $m 2023 $m 2025 2024 Revenue 6,908 6,617 6,385 4.4 3.6 Operating expenses: Employee costs (3,241) (3,128) (3,045) 3.6 2.7 Direct materials and services (1,166) (1,089) (1,087) 7.1 0.2 Vehicle costs (368) (360) (345) 2.2 4.3 Property costs (144) (131) (129) 9.9 1.6 Depreciation of property, plant and equipment (135) (129) (123) 4.7 4.9 Amortisation and impairment of intangible assets (236) (287) (250) (17.8) 14.8 Other operating expenses (960) (778) (630) 23.4 23.5 Total operating expenses (6,250) (5,902) (5,609) 5.9 5.2 Net impairment losses on financial assets (74) (71) (49) 4.2 44.9 Operating profit 584 644 727 (9.3) (11.4) Finance income 46 59 60 (22.0) (1.7) Finance cost (250) (250) (232) – 7.8 Share of profit from associates 10 9 11 11.1 (18.2) Profit before income tax 390 462 566 (15.6) (18.4) Income tax expense (100) (116) (129) (13.8) (10.1) Profit for the year 290 346 437 (16.2) (20.8) Revenue Revenue increased by $291m, or 4.4%, to $6,908m in the year ended 31 December 2025 from $6,617m in the year ended 31 December 2024. Foreign exchange had a favourable effect of $37m. Revenue was favourably impacted by revenues from acquisitions completed during the year ended 31 December 2025 by $30m. The remaining growth of $224m is driven by the flow through of a full year of revenues from acquisitions completed in the year ended 31 December 2024, alongside organic actions taken to increase the existing revenues of the Group, partially offset by the closure of the Paragon distribution business in North America with effect from 1 April 2024, impacting revenue adversely by $18m. The $224m of growth above consists of $179m from the Pest Control segment and $45m from the Hygiene & Wellbeing segment. See ‘Revenue by Geographical Locations’ and ‘Revenue by Business Segment’ for further discussion. Revenue increased by $232m, or 3.6%, to $6,617m in the year ended 31 December 2024 from $6,385m in the year ended 31 December 2023. Foreign exchange had an adverse effect of $9m. Revenue was favourably impacted by revenues from acquisitions completed during the year ended 31 December 2024 by $87m. The remaining growth of $154m is driven by the flow through of a full year of revenues from acquisitions completed in the year ended 31 December 2023, alongside organic actions taken to increase the existing revenues of the Group. The $154m of growth above consists of $109m from the Pest Control segment and $45m from the Hygiene & Wellbeing segment. See ‘Revenue by Geographical Locations’ and ‘Revenue by Business Segment’ for further discussion. Operating expenses Operating expenses increased by $348m, or 5.9%, to $6,250m in the year ended 31 December 2025 from $5,902m in the year ended 31 December 2024. Operating expenses increased by $293m, or 5.2%, to $5,902m in the year ended 31 December 2024 from $5,609m in the year ended 31 December 2023. Employee costs Employee costs increased by $113m, or 3.6%, to $3,241m in the year ended 31 December 2025 from $3,128m in the year ended 31 December 2024. This was as a result of an increase in the number of employees due to businesses acquired during the year ended 31 December 2025, growth during the year ended 31 December 2025, and globally higher wage inflation. Employee costs increased by $83m, or 2.7%, to $3,128m in the year ended 31 December 2024 from $3,045m in the year ended 31 December 2023. This was as a result of an increase in the number of employees due to businesses acquired during the year ended 31 December 2024, growth during the year ended 31 December 2024, and globally higher wage inflation. Direct materials and services Direct materials and services increased by $77m, or 7.1%, to $1,166m in the year ended 31 December 2025 from $1,089m in the year ended 31 December 2024 due to businesses acquired during the years ended 31 December 2024 and 31 December 2025 and growth during the year ended 31 December 2025. Direct materials and services increased by $2m, or 0.2%, to $1,089m in the year ended 31 December 2024 from $1,087m in the year ended 31 December 2023. Vehicle costs Vehicle costs increased by $8m, or 2.2%, to $368m in the year ended 31 December 2025 from $360m in the year ended 31 December 2024. Vehicle costs increased by $15m, or 4.3%, to $360m in the year ended 31 December 2024 from $345m in the year ended 31 December 2023. Property costs Property costs decreased by $13m, or 9.9%, to $144m in the year ended 31 December 2025 from $131m in the year ended 31 December 2024. Property costs increased by $2m, or 1.6%, to $131m in the year ended 31 December 2024 from $129m in the year ended 31 December 2023. Rentokil Initial plc Annual Report 2025209 Strategic Report Corporate Governance Financial Statements Other Information |
|
Management’s Discussion and Analysis of Financial Condition and Results of Operations continued Depreciation and impairment of property, plant and equipment Depreciation and impairment of property, plant and equipment increased by $6m, or 4.7%, to $135m in the year ended 31 December 2025 from $129m in the year ended 31 December 2024. Depreciation and impairment of property, plant and equipment increased by $6m, or 4.9%, to $129m in the year ended 31 December 2024 from £123m in the year ended 31 December 2023. Amortisation and impairment of intangible assets Amortisation and impairment of intangible assets decreased by $51m, or 17.8%, to $236m in the year ended 31 December 2025 from $287m in the year ended 31 December 2024 mainly as a result of no goodwill impairments in the year ended 31 December 2025 compared to goodwill impairments of $36m in Argentina, Brazil, Hong Kong, Israel and Lebanon in the year ended 31 December 2024. Amortisation and impairment of intangible assets increased by $37m, or 14.8%, to $287m in the year ended 31 December 2024 from $250m in the year ended 31 December 2023 mainly as a result of goodwill impairments of $36m in Argentina, Brazil, Hong Kong, Israel and Lebanon. Other operating expenses Other operating expenses increased by $182m, or 23.4%, to $960m in the year ended 31 December 2025 from $778m in the year ended 31 December 2024, largely due to additional provisions for termite damage claims of $201m in the year ended 31 December 2025. Other operating expenses increased by $148m, or 23.5%, to $778m in the year ended 31 December 2024 from $630m in the year ended 31 December 2023, largely due to businesses acquired during the years ended 31 December 2023 and 31 December 2024. Operating profit Operating profit decreased by $60m, or 9.3%, to $584m in the year ended 31 December 2025 from $644m in the year ended 31 December 2024. The increase in operating profit was a result of the increase in revenue of $291m, or 4.4%, to $6,908m in the year ended 31 December 2025 from $6,617m in the year ended 31 December 2024 offset by the increase in operating expenses of $348m, or 5.9%, to $6,250m in the year ended 31 December 2025 from $5,902m in the year ended 31 December 2024. Operating profit decreased by $83m, or 11.4%, to $644m in the year ended 31 December 2024 from $727m in the year ended 31 December 2023. The decrease in operating profit was a result of the increase in revenue of $232m, or 3.6%, to $6,617m in the year ended 31 December 2024 from $6,385m in the year ended 31 December 2023 offset by the increase in operating expenses of $293m, or 5.2%, to $5,902m in the year ended 31 December 2024 from $5,609m in the year ended 31 December 2023. Profit before income tax Profit before income tax decreased by $72m, or 15.6%, to $390m in the year ended 31 December 2025 from $462m in the year ended 31 December 2024 due to the decrease in operating profit by $60m, or 9.3%, to $584m in the year ended 31 December 2025 from $644m in the year ended 31 December 2024. Profit before income tax decreased by $104m, or 18.4%, to $462m in the year ended 31 December 2024 from $566m in the year ended 31 December 2023 due to the decrease in operating profit by $83m, or 11.4%, to $644m in the year ended 31 December 2024 from $727m in the year ended 31 December 2023, with net finance costs increasing by $19m, or 11.0%, to $191m in the year ended 31 December 2024 from $172m in the year ended 31 December 2023. Income tax expense Income tax expense decreased by $16m, or 13.8%, to $100m in the year ended 31 December 2025 from $116m in the year ended 31 December 2024 due to lower profits. The effective tax rate of 25.6% in the year ended 31 December 2025 is higher than the effective tax rate of 25.1% in the year ended 31 December 2024 due to the recognition of a deferred tax asset on previously unrecognised tax losses in 2024. Income tax expense decreased by $13m, or 10.1%, to $116m in the year ended 31 December 2024 from $129m in the year ended 31 December 2023 due to lower profits. The effective tax rate of 25.1% in the year ended 31 December 2024 is higher than the effective tax rate of 22.8% in the year ended 31 December 2023 due to there being significant one-off net prior year tax credits in 2023. Profit for the year Profit for the year decreased by $56m, or 16.2%, to $290m in the year ended 31 December 2025 from $346m in the year ended 31 December 2024. The decrease in profit was a result of the decrease in profit before income tax of $72m, or 15.6%, to $390m in the year ended 31 December 2025 from $462m in the year ended 31 December 2024 partially offset by the decrease in income tax expense of $16m, or 13.8%, to $100m in the year ended 31 December 2025 from $116m in the year ended 31 December 2024. Profit for the year decreased by $91m, or 20.8%, to $346m in the year ended 31 December 2024 from $437m in the year ended 31 December 2023. The decrease in profit was a result of the decrease in profit before income tax of $104m, or 18.4%, to $462m in the year ended 31 December 2024 from $566m in the year ended 31 December 2023 partially offset by the decrease in income tax expenses of $13m, or 10.1%, to $116m in the year ended 31 December 2024 from $129m in the year ended 31 December 2023. 210 Rentokil Initial plc Annual Report 2025 |
|
Revenue by geographical location Following is a discussion of the Group’s revenues by geographical location for the years ended 31 December 2025 and 2024. For the year ended 31 December 2025, revenue from North America and International accounted for 62% and 38% of the Group’s total revenue, respectively. For the year ended 31 December 2024, revenue from North America and International accounted for 63% and 37% of the Group’s total revenue, respectively. % Change 2025 $m 2024 $m 2023 $m 2025 2024 Revenue North America1 4,294 4,164 4,112 3.1 1.3 International2 2,614 2,453 2,273 6.6 7.9 Total 6,908 6,617 6,385 4.4 3.6 1. North America includes the US and Canada. 2. International includes Europe, UK & Sub-Saharan Africa, Asia & MENAT and Pacific. Europe includes France, Germany, Benelux (Belgium, The Netherlands and Luxembourg), Central Eastern Europe, Southern Europe, Nordics (Norway, Sweden, Finland, Denmark and Poland), Latin America and Caribbean (including Puerto Rico). UK & Sub-Saharan Africa includes UK, Ireland, Baltics and Sub-Saharan Africa (South Africa, Kenya, Tanzania, Mozambique and Malawi). Asia & MENAT includes India, China, Indonesia, Malaysia and other Asian countries and MENAT (Turkey, United Arab Emirates, Saudi Arabia, Jordan, Ghana and Lebanon). Pacific includes Australia, New Zealand and Fiji. North America Revenue increased by $130m, or 3.1%, to $4,294m in the year ended 31 December 2025 from $4,164m in the year ended 31 December 2024. Foreign exchange had an adverse effect of $3m. Revenue was favourably impacted by revenues from acquisitions completed during the year ended 31 December 2025 by $15m. The remaining growth of $118m is driven by the flow through of a full year of revenue from acquisitions completed in the year ended 31 December 2024, alongside organic actions taken to increase the existing revenue of the region, partially offset by the closure of the Paragon distribution business with effect from 1 April 2024, impacting revenue adversely by $18m. A robust pricing environment supported consistently strong price realisation, with the measures implemented to improve customer retention and increase new business contributing to an easing of volume reductions through the year. Including the impact of M&A and foreign exchange, contract revenue increased by $38m to $2,854m in the year ended 31 December 2025 from $2,816m in the year ended 31 December 2024, job revenue increased by $45m to $1,021m in the year ended 31 December 2025 from $976m in the year ended 31 December 2024 and product revenue increased by $48m to $448m in the year ended 31 December 2025 from $400m in the year ended 31 December 2024 Revenue increased by $52m, or 1.3%, to $4,164m in the year ended 31 December 2024 from $4,112m in the year ended 31 December 2023. Revenue was favourably impacted by revenues from acquisitions completed during the year ended 31 December 2024 by $28m. The remaining growth of $24m is driven by the flow through of a full year of revenue from acquisitions completed in the year ended 31 December 2023, alongside organic actions taken to increase the existing revenue of the region, partially offset by the closure of the Paragon distribution business with effect from 1 April 2024, impacting revenue adversely by $56m. Including the impact of M&A and foreign exchange, contract revenue increased by $31m to $2,816m in the year ended 31 December 2024 from $2,785m in the year ended 31 December 2023, job revenue increased by $101m to $976m in the year ended 31 December 2024 from $875m in the year ended 31 December 2023 and product revenue decreased by $34m to $400m in the year ended 31 December 2024 from $434m in the year ended 31 December 2023. International Revenue increased by $161m, or 6.6%, to $2,614m in the year ended 31 December 2025 from $2,453m in the year ended 31 December 2024. This increase was driven by Europe (including LATAM) increasing by $96m, or 8.6%, to $1,194m in the year ended 31 December 2025 from $1,098m in the year ended 31 December 2024, UK & Sub-Saharan Africa, which increased by $36m, or 6.4%, to $591m in the year ended 31 December 2025 from $555m in the year ended 31 December 2024, Asia & MENAT, which increased by $25m, or 5.5%, to $476m in the year ended 31 December 2025 from $451m in the year ended 31 December 2024 and Pacific, which increased by $5m, or 1.5%, to $340m in the year ended 31 December 2025 from $335m in the year ended 31 December 2024. Europe (including LATAM) saw the strongest growth in the region, driven by the Southern European markets of Spain, Portugal and Greece which experienced good volume growth from strong overall demand and a solid pricing environment. The UK & Sub-Saharan Africa region and Asia & MENAT also saw strong growth. In the UK this was driven by the core UK Pest control and Plants businesses and an improving performance from our Property Services division in the second half of the year ended 31 December 2025. In Asia there was strong growth in Indonesia and India where underlying demand growth in these fast-growing economies is strong. Growth in the Pacific region was softer across both one-off and contract revenue due to weather related challenges which particularly impacted rural and trackspray operations in the year. Foreign exchange had a favourable effect of $40m. Revenue was favourably impacted by revenue from acquisitions completed during the year ended 31 December 2025 by $15m. The remaining growth of $106m is driven by the flow through of a full year of revenue from acquisitions completed in the year ended 31 December 2024, alongside organic actions taken to increase the existing revenue of the region. Including the impact of M&A and foreign exchange, contract revenue grew by $123m to $1,949m in the year ended 31 December 2025 from $1,826m in the year ended 31 December 2024, job revenue increased by $32m to $560m in the year ended 31 December 2025 from $528m in the year ended 31 December 2024 and product revenue increased by $6m to $108m in the year ended 31 December 2025 from $102m in the year ended 31 December 2024. Rentokil Initial plc Annual Report 2025 211 Strategic Report Corporate Governance Financial Statements Other Information |
|
Management’s Discussion and Analysis of Financial Condition and Results of Operations continued Revenue increased by $180m, or 7.9%, to $2,453m in the year ended 31 December 2024 from $2,273m in the year ended 31 December 2023. This increase was driven by Europe (including LATAM) increasing by $55m, or 5.3%, to $1,098m in the year ended 31 December 2024 from $1,043m in the year ended 31 December 2023, UK & Sub-Saharan Africa, which increased by $69m, or 14.2%, to $555m in the year ended 31 December 2024 from $486m in the year ended 31 December 2023, Asia & MENAT, which increased by $29m, or 6.9%, to $451m in the year ended 31 December 2024 from $422m in the year ended 31 December 2023 and Pacific, which increased by $26m, or 8.4%, to $335m in the year ended 31 December 2024 from $309m in the year ended 31 December 2023. Foreign exchange had an adverse effect of $9m. Revenue was favourably impacted by revenue from acquisitions completed during the year ended 31 December 2024 by $59m. The remaining growth of $130m is driven by the flow through of a full year of revenue from acquisitions completed in the year ended 31 December 2023, alongside organic actions taken to increase the existing revenue of the region. Including the impact of M&A and foreign exchange, contract revenue grew by $122m to $1,826m in the year ended 31 December 2024 from $1,704m in the year ended 31 December 2023, job revenue increased by $53m to $528m in the year ended 31 December 2024 from $475m in the year ended 31 December 2023 and product revenue increased by $5m to $102m in the year ended 31 December 2024 from $97m in the year ended 31 December 2023. Revenue by business segment Following is a discussion of the Group’s revenues by business segment for the years ended 31 December 2025 and 2024. For the year ended 31 December 2025, Pest Control and Hygiene & Wellbeing segments accounted for 83% and 17% of total revenue, respectively. For the year ended 31 December 2024, Pest Control and Hygiene & Wellbeing segments accounted for 83% and 17% of total revenue, respectively. % Change 2025 $m 2024 $m 2023 $m 2025 2024 Revenue Pest Control 5,703 5,481 5,336 4.1 2.7 Hygiene & Wellbeing 1,205 1,136 1,049 6.1 8.3 Total 6,908 6,617 6,385 4.4 3.6 Pest Control Revenue increased by $222m, or 4.1%, to $5,703m in the year ended 31 December 2025 from $5,481m in the year ended 31 December 2024. Foreign exchange had a favourable effect of $17m. Revenue was favourably impacted by revenue from acquisitions completed during the year ended 31 December 2025 by $26m. The remaining growth of $179m is driven by the flow through of a full year of revenue from acquisitions completed in the year ended 31 December 2024 alongside organic actions taken to increase the existing revenue of the segment, partially offset by the closure of the Paragon distribution business in North America with effect from 1 April 2024, impacting revenue adversely by $18m. Including the impacts of M&A and foreign exchange, contract revenue grew by $110m to $3,830m in the year ended 31 December 2025 from $3,720m in the year ended 31 December 2024, job revenue increased by $64m to $1,411m in the year ended 31 December 2025 from $1,347m in the year ended 31 December 2024, and product revenue increased by $50m to $506m in the year ended 31 December 2025 from $456m in the year ended 31 December 2024. Revenue increased by $145m, or 2.7%, to $5,481m in the year ended 31 December 2024 from $5,336m in the year ended 31 December 2023. Foreign exchange had an adverse effect of $6m. Revenue was favourably impacted by revenue from acquisitions completed during the year ended 31 December 2024 by $42m. The remaining growth of $109m is driven by the flow through of a full year of revenue from acquisitions completed in the year ended 31 December 2023 alongside organic actions taken to increase the existing revenue of the segment, partially offset by the closure of the Paragon distribution business with effect from 1 April 2024, impacting revenue adversely by $56m. Including the impacts of M&A and foreign exchange, contract revenue grew by $105m to $3,720m in the year ended 31 December 2024 from $3,615m in the year ended 31 December 2023, job revenue increased by $114m to $1,347m in the year ended 31 December 2024 from $1,233m in the year ended 31 December 2023, and product revenue was down by $25m to $456m in the year ended 31 December 2024 from $481m in the year ended 31 December 2023. Hygiene & Wellbeing Revenue increased by $69m, or 6.1%, to $1,205m in the year ended 31 December 2025 from $1,136m in the year ended 31 December 2024. Foreign exchange had a favourable effect of $20m. Revenue was favourably impacted by revenue from acquisitions completed during the year ended 31 December 2025 by $4m. The remaining growth of $45m is driven by the flow through of a full year of revenue from acquisitions completed in the year ended 31 December 2024, alongside organic actions taken to increase the existing revenue of the segment. Revenue increased by $87m, or 8.3%, to $1,136m in the year ended 31 December 2024 from $1,049m in the year ended 31 December 2023. Foreign exchange had an adverse effect of $3m. Revenue was favourably impacted by revenue from acquisitions completed during the year ended 31 December 2024 by $45m. The remaining growth of $45m is driven by the flow through of a full year of revenue from acquisitions completed in the year ended 31 December 2023, alongside organic actions taken to increase the existing revenue of the segment. 212 Rentokil Initial plc Annual Report 2025 |
|
Operating expenses by geographic region Following is a discussion of the Group’s operating expenses by geographic region for the years ended 31 December 2025 and 2024. North America % Change 2025 $m 2024 $m 2023 $m 2025 2024 Employee costs 1,867 1,873 1,832 (0.3) 2.2 Direct materials and services 700 640 654 9.4 (2.1) Vehicle costs 213 208 204 2.4 2.0 Property costs 78 75 72 4.0 4.2 Depreciation of property, plant and equipment 34 37 34 (8.1) 8.8 Amortisation and impairment of intangible assets 144 156 163 (7.7) (4.3) Other operating expenses 779 579 501 34.5 15.6 Total 3,815 3,568 3,460 6.9 3.1 Operating expenses increased by $247m, or 6.9%, to $3,815m in the year ended 31 December 2025 from $3,568m in the year ended 31 December 2024. The main drivers of this increase was other operating expenses which increased by $200m, or 34.5%, to $779m in the year ended 31 December 2025 from $579m in the year ended 31 December 2024, largely due to additional provisions for termite damage claims of $201m in the year ended 31 December 2025 and direct materials and services which increased by $60m, or 9.4%, to $700m in the year ended 31 December 2025 from $640m in the year ended 31 December 2024, as a result of businesses acquired during the years ended 31 December 2024 and 31 December 2025 and growth during the year ended 31 December 2025. Operating expenses increased by $108m, or 3.1%, to $3,568m in the year ended 31 December 2024 from $3,460m in the year ended 31 December 2023. The main drivers of this increase were other operating expenses which increased by $78m, or 15.6%, to $579m in the year ended 31 December 2024 from $501m in the year ended 31 December 2023 and employee costs which increased by $41m, or 2.2%, to $1,873m in the year ended 31 December 2024 from $1,832m in the year ended 31 December 2023 due to businesses acquired during the years ended 31 December 2023 and 31 December 2024, growth during the year ended 31 December 2024, and globally higher wage inflation. This was partially offset by a decrease in direct materials and services of $14m, or 2.1%, to $640m in the year ended 31 December 2024 from $654m in the year ended 31 December 2023. International % Change 2025 $m 2024 $m 2023 $m 2025 2024 Employee costs 1,197 1,108 1,019 8.0 8.7 Direct materials and services 375 354 346 5.9 2.3 Vehicle costs 153 148 139 3.4 6.5 Property costs 55 50 49 10.0 2.0 Depreciation of property, plant and equipment 100 94 86 6.4 9.3 Amortisation and impairment of intangible assets 58 99 65 (41.4) 52.3 Other operating expenses 216 215 184 0.5 16.8 Total 2,154 2,068 1,888 4.2 9.5 Operating expenses increased by $86m, or 4.2%, to $2,154m in the year ended 31 December 2025 from $2,068m in the year ended 31 December 2024. The main driver of this was employee costs which increased by $89m, or 8.0%, to $1,197m in the year ended 31 December 2025 from $1,108m in the year ended 31 December 2024 due to businesses acquired during the years ended 31 December 2024 and 31 December 2025, growth during the year ended 31 December 2025, and globally higher wage inflation. Operating expenses increased by $180m, or 9.5%, to $2,068m in the year ended 31 December 2024 from $1,888m in the year ended 31 December 2023. The main driver of this were employee costs which increased by $89m, or 8.7%, to $1,108m in the year ended 31 December 2024 from $1,019m in the year ended 31 December 2023 due to businesses acquired during the years ended 31 December 2023 and 31 December 2024, growth during the year ended 31 December 2024, and globally higher wage inflation. Further drivers were amortisation and impairment of intangible assets which increased by $34m, or 52.3%, to $99m in the year ended 31 December 2024 from $65m in the year ended 31 December 2023 and other operating expenses which increased by $31m, or 16.8%, to $215m in the year ended 31 December 2024 from $184m in the year ended 31 December 2023. Rentokil Initial plc Annual Report 2025 213 Strategic Report Corporate Governance Financial Statements Other Information |
|
Management’s Discussion and Analysis of Financial Condition and Results of Operations continued Operating expenses by business segment Following is a discussion of the Group’s operating expenses by business segment for the years ended 31 December 2025 and 2024. Pest Control % Change 2025 $m 2024 $m 2023 $m 2025 2024 Employee costs 2,592 2,543 2,458 1.9 3.5 Direct materials and services 856 784 794 9.2 (1.3) Vehicle costs 307 298 289 3.0 3.1 Property costs 111 106 103 4.7 2.9 Depreciation of property, plant and equipment 68 65 59 4.6 10.2 Amortisation and impairment of intangible assets 195 243 212 (19.8) 14.6 Other operating expenses 864 658 565 31.3 16.5 Total 4,993 4,697 4,480 6.3 4.8 Operating expenses increased by $296m, or 6.3%, to $4,993m in the year ended 31 December 2025 from $4,697m in the year ended 31 December 2024. The main drivers of this was other operating expenses, which increased by $206m, or 31.3%, to $864m in the year ended 31 December 2025 from $658m in the year ended 31 December 2024 largely due to additional provisions for termite damage claims of $201m in the year ended 31 December 2025, and other direct materials and services, which increased by $72m, or 9.2%, to $856m in the year ended 31 December 2025 from $784m in the year ended 31 December 2024 due to businesses acquired during the years ended 31 December 2024 and 31 December 2025 and growth during the year ended 31 December 2025. A further driver was employee costs, which increased by $49m, or 1.9%, to $2,592m in the year ended 31 December 2025 from $2,543m in the year ended 31 December 2024 due to businesses acquired during the years ended 31 December 2024 and 31 December 2025, growth during the year ended 31 December 2025, and globally higher wage inflation. These were partially offset by amortisation and impairment of intangible assets decreasing by $48m, or 19.8%, to $195m in the year ended 31 December 2025 from $243m in the year ended 31 December 2024 mainly due to no goodwill impairments in the year ended 31 December 2025 compared to goodwill impairments of $36m in Argentina, Brazil, Hong Kong, Israel and Lebanon in the year ended 31 December 2024. Operating expenses increased by $217m, or 4.8%, to $4,697m in the year ended 31 December 2024 from $4,480m in the year ended 31 December 2023. The main drivers of this were other operating expenses increased by $93m, or 16.5%, to $658m in the year ended 31 December 2024 from $565m in the year ended 31 December 2023 due to businesses acquired during the year ended 31 December 2024 and employee costs which increased by $85m, or 3.5%, to $2,543m in the year ended 31 December 2024 from $2,458m in the year ended 31 December 2023 as a result of an increase in the number of employees due to businesses acquired during the year ended 31 December 2024, and globally higher wage inflation. A further driver was amortisation of intangible assets, which increased by $31m, or 14.6%, to $243m in the year ended 31 December 2024 from $212m in the year ended 31 December 2023 due to businesses acquired during the period and goodwill impairments of $36m in Argentina, Brazil, Hong Kong, Israel and Lebanon. Hygiene & Wellbeing % Change 2025 $m 2024 $m 2023 $m 2025 2024 Employee costs 472 438 393 7.8 11.5 Direct materials and services 219 210 206 4.3 1.9 Vehicle costs 59 58 54 1.7 7.4 Property costs 22 19 18 15.8 5.6 Depreciation of property, plant and equipment 66 66 61 – 8.2 Amortisation and impairment of intangible assets 7 12 16 (41.7) (25.0) Other operating expenses 131 136 120 (3.7) 13.3 Total 976 939 868 3.9 8.2 Operating expenses increased by $37m, or 3.9%, to $976m in the year ended 31 December 2025 from $939m in the year ended 31 December 2024. The main driver of this was employee costs which increased by $34m, or 7.8%, to $472m in the year ended 31 December 2025 from $438m in the year ended 31 December 2024 due to businesses acquired during the years ended 31 December 2024 and 31 December 2025, growth during the year ended 31 December 2025, and globally higher wage inflation. Operating expenses increased by $71m, or 8.2%, to $939m in the year ended 31 December 2024 from $868m in the year ended 31 December 2023. The main drivers of this were employee costs which increased by $45m, or 11.5%, to $438m in the year ended 31 December 2024 from $393m in the year ended 31 December 2023 as a result of an increase in the number of employees due to businesses acquired during the year and other operating expenses which increased by $16m, or 13.3%, to $136m in the year ended 31 December 2024 from $120m in the year ended 31 December 2023 as a result of businesses acquired during the year. 214 Rentokil Initial plc Annual Report 2025 |
|
Non-IFRS measures The Group uses a number of non-IFRS measures to present the financial performance of the business. These are not measures as defined under IFRS, but management believes that these measures provide valuable additional information for users of the Financial Statements, in order to better understand the underlying trading performance in the year from activities that will contribute to future performance. The Group’s internal strategic planning process is also based on these measures and they are used for management incentive purposes. They should be viewed as complements to, and not replacements for, the comparable IFRS measures. Other companies may use similarly labelled measures which are calculated differently from the way the Group calculates them, which limits their usefulness as comparative measures. Accordingly, investors should not place undue reliance on these non-IFRS measures. The following sets out an explanation and the reconciliation to the nearest IFRS measure for each non-IFRS measure. All non-IFRS measures exclude discontinued operations unless explicitly stated otherwise. Constant exchange rates (CER) Given the international nature of the Group’s operations, foreign exchange movements can have a significant impact on the reported results of the Group when they are translated into US dollar (the presentation currency of the Group). In order to help understand the underlying trading performance of the business, revenue and profit measures are often presented at constant exchange rates. CER is calculated by translating prior year reported numbers at the average exchange rates for the current year. This represents a change from prior periods in which CER was calculated by a translation of current year reported numbers at the average exchange rates for the prior year. It is used to give management and other users of the accounts clearer comparability of underlying trading performance against the prior period by removing the effects of changes in foreign exchange rates. The major exchange rates used to calculate CER in 2025 are €/$ 0.8917 and £/$ 0.7613. Comparisons are with the year ended 31 December 2024 unless otherwise stated. Adjusted expenses and profit measures Adjusted expenses and profit measures are used to give investors and management a further understanding of the underlying profitability of the business over time by stripping out income and expenses that can distort results due to their size and nature. Adjusted profit measures are calculated by adding the following items back to the equivalent IFRS profit measure: • amortisation and impairment of intangible assets (excluding computer software); • one-off and adjusting items; and • net interest adjustments. Intangible assets (such as customer lists and brands) are recognised on acquisition of businesses which, by their nature, can vary by size and amount each year. Capitalisation of innovation-related development costs will also vary from year to year. As a result, amortisation of intangibles is added back to assist with understanding the underlying trading performance of the business and to allow comparability across regions and categories (see table on page 159). One-off and adjusting items are significant expenses or income that will have a distortive impact on the underlying profitability of the Group. Typical examples are costs related to the acquisition of businesses, gain or loss on disposal or closure of a business, material gains or losses on disposal of fixed assets, adjustments to legacy environmental and legacy termite liabilities, and payments or receipts as a result of legal disputes. An analysis of one-off and adjusting items is set out below. Net interest adjustments are other non-cash, or one-off and adjusting accounting gains and losses, that can cause material fluctuations and distort understanding of the performance of the business, such as amortisation of discount on legacy provisions and gains and losses on hedge accounting. Adjusted expenses are one-off and adjusting items, and Adjusted Interest. Adjusted profit measures used are Adjusted Operating Profit, Adjusted Profit Before and After Tax, and Adjusted EBITDA. Adjusted Earnings Per Share is also reported, derived from Adjusted Profit After Tax. One-off and adjusting items An analysis of one-off and adjusting items is set out below. One-off and adjusting items cost/(income) $m One-off and adjusting items tax impact $m One-off and adjusting items cash (outflow)/inflow $m 2023 Acquisition and integration costs 15 (2) (16) Fees relating to Terminix acquisition 1 – (31) Terminix integration costs 99 (26) (92) Other 4 (1) 6 Total 119 (29) (133) 2024 Acquisition and integration costs 11 (4) (19) Terminix integration costs 75 (19) (77) Other 24 (6) (3) Total 110 (29) (99) 2025 Acquisition and integration costs (5) 1 (18) Termite provision movement 195 (50) – North America transformation costs 77 (20) (76) Other 20 (3) (6) Total 287 (72) (100) Rentokil Initial plc Annual Report 2025 215 Strategic Report Corporate Governance Financial Statements Other Information |
|
Management’s Discussion and Analysis of Financial Condition and Results of Operations continued Adjusted Interest Adjusted Interest is calculated by adjusting the reported finance income and costs by net interest adjustments (amortisation of discount on legacy provisions and foreign exchange and hedge accounting ineffectiveness). 2025 $m 2024 $m 2023 $m Finance cost 250 250 232 Finance income (46) (59) (60) Add back: Amortisation of discount on legacy provisions (12) (13) (14) Foreign exchange and hedge accounting ineffectiveness 12 (3) 15 Adjusted Interest 204 175 173 Adjusted Operating Profit Adjusted Operating Profit is calculated by adding back one-off and adjusting items, and amortisation and impairment of intangible assets to operating profit. 2025 $m 2024 $m 2023 $m Operating profit 584 644 727 Add back: One-off and adjusting items 287 110 119 Amortisation and impairment of intangible assets1 199 254 218 Adjusted Operating Profit 1,070 1,008 1,064 1. Excluding computer software. Adjusted Profit Before and After Tax Adjusted Profit Before Tax is calculated by adding back net interest adjustments, one-off and adjusting items, and amortisation and impairment of intangible assets to profit before tax. Adjusted Profit After Tax is calculated by adding back net interest adjustments, one-off and adjusting items, amortisation and impairment of intangible assets, and the tax effect on these adjustments to profit after tax. 2025 IFRS measures $m Net interest adjustments $m One-off and adjusting items $m Amortisation and impairment of intangibles $m Non-IFRS measures $m Profit before income tax 390 – 287 199 876 Adjusted Profit Before Tax Income tax expense (100) 1 (72) (51) (222) Tax on Adjusted Profit Profit for the period 290 1 215 148 654 Adjusted Profit After Tax 2024 IFRS measures $m Net interest adjustments $m One-off and adjusting items $m Amortisation and impairment of intangibles $m Non-IFRS measures $m Profit before income tax 462 16 110 254 842 Adjusted Profit Before Tax Income tax expense (116) (4) (29) (55) (204) Tax on Adjusted Profit Profit for the period 346 12 81 199 638 Adjusted Profit After Tax 2023 IFRS measures $m Net interest adjustments $m One-off and adjusting items $m Amortisation and impairment of intangibles $m Non-IFRS measures $m Profit before income tax 566 (1) 119 218 902 Adjusted Profit Before Tax Income tax expense (129) (2) (29) (55) (215) Tax on Adjusted Profit Profit for the period 437 (3) 90 163 687 Adjusted Profit After Tax 1. Excluding computer software. 216 Rentokil Initial plc Annual Report 2025 |
|
EBITDA and Adjusted EBITDA EBITDA (both continuing and discontinued operations) is calculated by adding back finance income, finance cost, share of profit from associates net of tax, income tax expense, depreciation, amortisation and impairment of intangible assets, and other non-cash expenses to profit for the year. Adjusted EBITDA (both continuing and discontinued operations) is calculated by adding back one-off and adjusting items to EBITDA. 2025 $m 2024 $m 2023 $m Profit for the period 290 346 437 Add back: Finance income (46) (59) (60) Finance cost 250 250 232 Share of profit from associates net of tax (10) (9) (11) Income tax expense 100 116 129 Depreciation 329 312 300 Other non-cash expenses 31 45 37 Amortisation and impairment of intangible assets1 199 254 218 EBITDA 1,143 1,255 1,282 One-off and adjusting items 287 110 119 Adjusted EBITDA 1,430 1,365 1,401 EBITDA attributable to discontinued operations 109 139 122 EBITDA for the Group 1,252 1,394 1,404 Adjusted EBITDA attributable to discontinued operations 109 139 122 Adjusted EBITDA for the Group including discontinued operations 1,539 1,504 1,523 1. Excluding computer software. Adjusted Earnings Per Share Basic earnings per share is calculated by dividing the profit attributable to equity holders of the Company by the weighted average number of shares in issue during the year, and is explained in Note A2 to the Consolidated Financial Statements. Adjusted Earnings Per Share is calculated by dividing adjusted profit from continuing operations attributable to equity holders of the Company by the weighted average number of ordinary shares in issue and is shown below. For Adjusted Diluted Earnings Per Share, the weighted average number of ordinary shares in issue is adjusted to include all potential dilutive ordinary shares. The Group’s potentially dilutive ordinary shares are explained in Note A2 to the Consolidated Financial Statements. 2025 $m 2024 $m 2023 $m Profit attributable to equity holders of the Company 290 346 437 Add back: Net interest adjustments – 16 (1) One-off and adjusting items 287 110 119 Amortisation and impairment of intangibles1 199 254 218 Tax on above items2 (122) (88) (86) Adjusted profit attributable to equity holders of the Company 654 638 687 Weighted average number of ordinary shares in issue (million) 2,524 2,521 2,516 Adjustment for potentially dilutive shares (million) 11 7 11 Weighted average number of ordinary shares for diluted earnings per share (million) 2,535 2,528 2,527 Basic Adjusted Earnings Per Share (cents) 25.91 25.31 27.31 Diluted Adjusted Earnings Per Share (cents) 25.80 25.24 27.19 1. Excluding computer software. 2. The tax effect on add-backs is as follows: one-off and adjusting items $72m (2024: $29m; 2023: $29m); amortisation and impairment of intangibles $51m (2024: $55m; 2023: $55m); and, net interest adjustments $(1)m (2024: $4m; 2023: $2m). Rentokil Initial plc Annual Report 2025 217 Strategic Report Corporate Governance Financial Statements Other Information |
|
Management’s Discussion and Analysis of Financial Condition and Results of Operations continued Adjusted cash measures The Group aims to generate sustainable cash flow in order to support its acquisition programme and to fund dividend payments to shareholders. Management considers that this is useful information for investors. Adjusted cash measures in use are Free Cash Flow, Adjusted Free Cash Flow, and Adjusted Free Cash Flow Conversion. Free Cash Flow Free Cash Flow (both continuing and discontinued operations) is measured as net cash flows from operating activities, adjusted for cash flows related to the purchase and sale of property, plant, equipment and intangible assets, cash flows related to leased assets, cash flows related to one-off and adjusting items, and dividends received from associates. These items are considered by management to be non-discretionary, as continued investment in these assets is required to support the day-to-day operations of the business. Free Cash Flow is used by management for incentive purposes and is a measure shared with and used by investors. A reconciliation of net cash flows from operating activities in the Consolidated Cash Flow Statement to Free Cash Flow is provided in the table below. 2025 $m 2024 $m 2023 $m Net cash flows from operating activities 872 743 802 Purchase of property, plant, equipment (136) (134) (122) Purchase of intangible assets (60) (56) (55) Capital element of lease payments and initial direct costs incurred (186) (177) (181) Proceeds from sale of property, plant, equipment and software 20 5 17 Cash impact of one-off and adjusting items 100 99 132 Dividends received from associates 5 14 5 Free Cash Flow 615 494 598 Free Cash flow attributable to discontinued operations 21 32 22 Free Cash Flow for the Group including discontinued operations 636 526 620 Adjusted Free Cash Flow and Adjusted Free Cash Flow Conversion Adjusted Free Cash Flow Conversion is provided to demonstrate to investors the proportion of Adjusted Profit After Tax that is converted to cash. It is calculated by dividing Adjusted Free Cash Flow by Adjusted Profit After Tax, expressed as a percentage. Adjusted Free Cash Flow (both continuing and discontinued operations) is measured as Free Cash Flow adjusted for product development additions and net investment hedge cash interest through other comprehensive income. Product development additions are adjusted due to their variable size and non-underlying nature. Net investment hedge cash interest through other comprehensive income is adjusted because the cash relates to an item that is not recognised in Adjusted Profit After Tax. 2025 $m 2024 $m 2023 $m Free Cash Flow 615 494 598 Product development additions 13 11 13 Net investment hedge cash interest through Other Comprehensive Income 10 13 15 Adjusted Free Cash Flow (a) 638 518 626 Adjusted Profit After Tax (b) 654 638 687 Free Cash Flow conversion (a/b) 97.6% 81.2% 91.1% Free Cash Flow conversion attributable to discontinued operations 69.4% 82.1% 62.6% Free Cash Flow conversion for the Group including discontinued operations 96.3% 81.2% 89.7% The nearest IFRS-based equivalent measure to Adjusted Free Cash Flow Conversion would be Cash Conversion, which is shown in the table below to provide a comparison in the calculation. Cash Conversion (both continuing and discontinued operations) is calculated as net cash flows from operating activities divided by profit attributable to equity holders of the Company, expressed as a percentage. Management considers that this is useful information for investors as it gives an indication of the quality of profits, and ability of the Group to turn profits into cash flows. 2025 $m 2024 $m 2023 $m Net cash flows from operating activities (a) 872 743 802 Profit attributable to equity holders of the Company (b) 290 346 437 Cash Conversion (a/b) 300.7% 214.7% 183.5% Cash Conversion attributable to discontinued operations 55.6% 271.7% 308.1% Cash Conversion for the Group including discontinued operations 206.8% 221.4% 193.2% 218 Rentokil Initial plc Annual Report 2025 |
|
Adjusted Effective Tax Rate (Adjusted ETR) Adjusted Effective Tax Rate is used to show investors and management the rate of tax applied to the Group’s Adjusted Profit Before Tax. The measure is calculated by dividing Adjusted Income Tax Expense by Adjusted Profit Before Tax, expressed as a percentage. 2025 $m 2024 $m 2023 $m Income tax charge 100 116 129 Tax adjustments on: Amortisation and impairment of intangible assets1 51 55 55 Net interest adjustments (1) 4 2 One-off and adjusting items 72 29 29 Adjusted Income Tax Charge (a) 222 204 215 Adjusted Profit Before Tax (b) 876 842 902 Adjusted Effective Tax Rate (a/b) 25.3% 24.2% 23.8% 1. Excluding computer software. The Group’s effective tax rate (ETR) for 2025 on reported profit before tax was 25.6% (2024: 25.1%, 2023: 22.8%). The Group’s Adjusted ETR before amortisation of intangible assets (excluding computer software), one-off and adjusting items, and the net interest adjustments for 2025 was 25.3% (2024: 24.2%, 2023: 23.8%). This compares with a blended rate of tax for the countries in which the Group operates of 25.3% (2024: 25.3%, 2023: 25.1%). The Group’s tax charge and Adjusted ETR will be influenced by the global mix and level of profits, changes in future tax rates and other tax legislation, foreign exchange rates, the utilisation of brought-forward tax losses on which no deferred tax asset has been recognised, the resolution of open issues with various tax authorities, acquisitions and disposals. Liquidity and capital resources The primary source of the Group’s liquidity over the past two years was cash generated from operations. These funds were generally used to pay interest, taxes and dividends, and to fund capital expenditure and acquisitions, and the Group expects to continue to fund future operating and capital needs. The Group considers its working capital to be sufficient for its present requirements. Cash flow activity Following is a discussion of the Group’s cash flows for the years ended 31 December 2025 and 2024. Cash flows from operating, investing and financing activities, as reflected in the accompanying Consolidated Cash Flow Statement, are summarised in the following table: % change 2025 $m 2024 $m 2023 $m 2025 2024 Net cash provided from (used for): Operating activities 972 868 916 12.0 (5.2) Investing activities 26 (476) (514) 105.5 7.4 Financing activities 27 (952) (451) 102.8 (111.1) Net increase/(decrease) in cash and cash equivalents 1,025 (560) (49) 283.0 (1,042.9) Cash and cash equivalents at the beginning of the year 467 1,062 1,064 (56.0) (0.2) Exchange gains/(losses) on cash and cash equivalents 97 (35) 47 377.1 (174.5) Cash and cash equivalents at end of the financial year 1,589 467 1,062 240.3 (56.0) Operating activities Net cash inflows from operating activities increased by $104m, or 12.0%, to $972m in the year ended 31 December 2025, from $868m in the year ended 31 December 2024. Operating Profit (including discontinued operations) decreased by $43m, to $658m in the year ended 31 December 2025 from $701m in the year ended 31 December 2024. Within Operating Profit, non-cash items moved as follows: (i) depreciation and impairment of property, plant and equipment decreased by $37m to $167m in the year ended 31 December 2025 from $204m in the year ended 31 December 2024, due to businesses acquired during the period; (ii) depreciation of leased assets increased by $3m to $160m in the year ended 31 December 2025 from $157m in the year ended 31 December 2024; and (iii) amortisation and impairment of intangible assets (excluding computer software) decreased by $55m to $199m in the year ended 31 December 2025, from $254m in the year ended 31 December 2024, due to businesses acquired during the period and prior period goodwill impairments of $36m in Argentina, Brazil, Hong Kong, Israel and Lebanon. Net cash inflows from operating activities decreased by $48m, or 5.2%, to $868m in the year ended 31 December 2024, from $916m in the year ended 31 December 2023. Operating Profit decreased by $76m, to $701m in the year ended 31 December 2024 from $777m in the year ended 31 December 2023. Within Operating Profit, non-cash items moved as follows: (i) depreciation and impairment of property, plant and equipment increased by $13m to $204m in the year ended 31 December 2024 from $191m in the year ended 31 December 2023, due to businesses acquired during the period; (ii) depreciation of leased assets increased by $7m to $157m in the year ended 31 December 2024 from $150m in the year ended 31 December 2023; and (iii) amortisation and impairment of intangible assets (excluding computer software) increased by $36m to $254m in the year ended 31 December 2024, from $218m in the year ended 31 December 2023, due to businesses acquired during the period and goodwill impairments of $36m in Argentina, Brazil, Hong Kong, Israel and Lebanon. Rentokil Initial plc Annual Report 2025 219 Strategic Report Corporate Governance Financial Statements Other Information |
|
Management’s Discussion and Analysis of Financial Condition and Results of Operations continued Working capital outflow decreased $274m to a $64m inflow in the year ended 31 December 2025, from $210m in the year ended 31 December 2024, due to termite provision payments and overall growth in the business. This is reflected in the trade and other receivables outflow, decreasing by $28m to $20m in the year ended 31 December 2025 from $48m in the year ended 31 December 2024, and the trade and other payables and provisions outflow decreasing by $291m to a $162m inflow in the year ended 31 December 2025, from $129m in the year ended 31 December 2024. The tax paid outflow was a decrease of $7m to $104m in the year ended 31 December 2025 from $111m in the year ended 31 December 2024. The decrease was attributable mainly to one-off US tax deductions resulting from the One Big Beautiful Bill Act enacted on 4 July 2025. Working capital outflow increased $56m to $210m in the year ended 31 December 2024, from $154m in the year ended 31 December 2023, due to termite provision payments and overall growth in the business. This is reflected in the trade and other receivables outflow, increasing by $12m to $48m in the year ended 31 December 2024 from $36m in the year ended 31 December 2023, and the trade and other payables and provisions outflow increasing by $53m to $129m in the year ended 31 December 2024, from $76m in the year ended 31 December 2023. The net impact of interest and tax paid outflow was a decrease of $36m to $294m in the year ended 31 December 2024 from $330m in the year ended 31 December 2023, due to relatively higher cash balances in 2024, lower bond interest on unhedged euro bonds as sterling strengthened against the euro, and lower profits. Investing activities Net cash outflows from investing activities decreased by $502m, or 105.5%, to a $26m inflow in the year ended 31 December 2025 from $476m in the year ended 31 December 2024. The main drivers of this decrease were acquisitions of companies and businesses decreasing by $98m to $121m in the year ended 31 December 2025 from $219m in the year ended 31 December 2024 and proceeds from disposal of businesses, net of tax paid increasing by $391m to $391m in the year ended 31 December 2025 from $nil in the year ended 31 December 2024 due to the disposal of France Workwear. Net cash outflows from investing activities decreased by $38m, or 7.4%, to $476m in the year ended 31 December 2024 from $514m in the year ended 31 December 2023. The main drivers of this decrease were acquisitions of companies and businesses decreasing by $79m to $219m in the year ended 31 December 2024 from $298m in the year ended 31 December 2023 partially offset by disposal of investment in associate decreasing by $24m to $nil in the year ended 31 December 2024 from $24m in the year ended 31 December 2023 and proceeds from sale of property, plant and equipment decreasing by $12m to $5m in the year ended 31 December 2024 from $17m in the year ended 31 December 2023. Financing activities Net cash outflows from financing activities decreased by $979m to $27m inflow in the year ended 31 December 2025 from $952m in the year ended 31 December 2024. The main drivers of this decrease were proceeds from new debt increasing by $1,232m to $1,232m in the year ended 31 December 2025, from $nil in the year ended 31 December 2024, partially offset by debt repayments increasing by $236m to $700m in the year ended 31 December 2025 from $464m in the year ended 31 December 2024. Net cash outflows from financing activities increased by $501m to $952m in the year ended 31 December 2024 from $451m in the year ended 31 December 2023. The main drivers of this decrease were debt repayments increasing by $464m to $464m for the year ended 31 December 2024, from $nil in the year ended 31 December 2023 due to the repayment of the €400m bond and dividends paid increasing by $40m to $292m in the year ended 31 December 2024 from $252m in the year ended 31 December 2023. 220Rentokil Initial plc Annual Report 2025 |
|
Directors’ Report The Directors submit their report and audited Financial Statements of the Company and the Group to the members of Rentokil Initial plc (the Company) for the year ended 31 December 2025. The Corporate Governance Report for the year on pages 78 to 139 forms part of the Directors’ Report, together with the sections of the Annual Report incorporated by reference. The Company has chosen to disclose the following information in the Strategic Report on pages 2 to 76: • an indication of likely future developments in the business of the Company; • an indication of the Company’s research and development activities; • details of our colleagues and human rights (Responsible Business, pages 50 and 51, 65 and 67); • engagement with colleagues, customers, suppliers, and others (pages 95 to 98); • information on greenhouse gas emissions and energy use (Responsible Business, pages 64 and 65); and • principal risks and uncertainties (Risks and Uncertainties, pages 68 to 75). The Strategic Report and the Directors’ Report constitute the management report as required under the Disclosure and Transparency Rule 4.1.8R. Information to be disclosed under UK Listing Rule 6.6.1R in relation to the allotment of shares for cash and waiver of dividends is set out on page 222. No other paragraphs under UK Listing Rule 6.6.1R apply. Company constitution Rentokil Initial plc is a public company incorporated in England and Wales, with company number 5393279. The Company is a holding company with limited trading in its own right and with subsidiary undertakings in 80 countries (the Group operates in 90 countries). The Company’s related undertakings are listed on pages 193 to 200. Articles of association The articles of association set out the internal regulations of the Company and cover such matters as the rights of shareholders, the conduct of the Board, and general meetings. The articles themselves may be amended by special resolution of the shareholders (by at least 75% of the votes cast by those voting in person or by proxy). Subject to company law and the articles of association, the Directors may exercise all the powers of the Company and may delegate authority to committees, and day-to-day management and decision-making to individual Executive Directors. The Company’s objects are unrestricted. The articles of association are available to shareholders on request and are displayed on our website. Re-election of Directors In accordance with the articles of association, Directors can be appointed by the Board and must be subsequently elected by shareholders at a general meeting. In accordance with the articles of association and the UK Corporate Governance Code (the Code), Directors submit themselves for re-election annually. Directors can be removed, and their replacements appointed, by shareholders in a general meeting. Information on our Board of Directors, including their biographical details, and changes during 2025, can be found in the Corporate Governance Report on pages 80 and 81. With the exception of Linda Yueh, all the Directors will be standing for election or re-election at the 2026 AGM. The notice periods of the current Directors are set out in the Directors’ Remuneration Report on pages 129 and 137. A pro-forma of the Non-Executive Directors’ letter of appointment is available on our website along with the Chair’s letter of appointment. Directors’ powers Under the articles of association, the Directors are responsible for the management of the business of the Company and may exercise all the powers of the Company subject to the provisions of relevant statutes and the Company’s articles of association. For example, the articles contain specific provisions and restrictions regarding the Company’s power to borrow money. The articles of association also give power to the Board to appoint and replace Directors as detailed above. Powers relating to the issuing of shares are also included in the articles of association and such authorities are renewed by shareholders each year at the AGM, as detailed on page 222. Directors’ interests The beneficial interests of the Directors, including the interests of any connected persons, in the share capital of the Company are shown on page 126. During the year, no Director had any material interest in any contract of significance to the Group’s business. There have been no changes to the beneficial interests of the Directors between 31 December 2025 and the date of this report. General meetings AGMs require 21 clear days’ notice to shareholders. Subject to the Companies Act 2006, other general meetings require 14 clear days’ notice. For all general meetings, a quorum of two shareholders is required. An ordinary resolution requires the affirmative vote of a majority of the votes of those persons voting at a meeting at which there is a quorum. A special resolution requires the affirmative vote of not less than three-quarters of the persons voting at a meeting at which there is a quorum. Dividend The Directors have recommended a final dividend of 8.24 cents per share for the financial year ended 31 December 2025. Payment of this dividend is subject to shareholder approval at the 2026 AGM. Further information on the Company’s dividend policy can be found on page 20 and the key dates for the final dividend can be found on page 225. Share capital The Company’s share capital during the year consisted of ordinary shares of 1p each. There were 2,526,039,885 shares in issue at 31 December 2025, which represents 100% of the Company’s issued share capital (2024: 2,524,539,885). The principal markets for trading in our securities are the London Stock Exchange and the New York Stock Exchange. Our securities are listed on both markets under the stock symbol ‘RTO’. At 31 December 2025, the proportion of ordinary shares represented by American Depositary Shares (ADSs) was 12.35% of the issued share capital of the Company. At 31 December 2025 there were 9,596 registered holders of ordinary shares, of which 104 were based in the US, and there were 11 recorded holders of ADSs, all of which were based in the US. All ordinary shares carry the same rights and no shareholder enjoys any preferential rights, regardless of the size of their holding. Each ordinary share (other than treasury shares, which have no voting rights) carries the right to vote at a general meeting of the Company. The Company did not hold any treasury shares between 31 December 2024 and 31 December 2025, and accordingly the Company did not sell any treasury shares. The Company’s articles of association provide that, on a show of hands, every member who is present in person or by proxy at a general meeting of the Company shall have one vote. On a poll, every member who is present in person or by proxy shall have one vote for every share of which they are a holder. Rentokil Initial plc Annual Report 2025 221 Strategic Report Corporate Governance Financial Statements Other Information |
|
Directors’ Report continued The articles do not contain special control rights or restrictions on transfer or limitations on the holding of ordinary shares and there are no requirements for the prior approval of any transfers. There are no restrictions under the Articles that would limit the rights of persons not resident in the UK to own or vote in relation to ordinary shares. No person holds securities in the Company carrying special rights with regard to control of the Company. The Company is not aware of any agreements between holders of securities that may result in restrictions on the transfer of securities or on voting rights. Authority for the Company to allot shares or grant rights to subscribe for shares up to an aggregate nominal amount of £16,800,000 was obtained at the AGM on 7 May 2025. The authority remains in force and approval will be sought from shareholders at the 2026 AGM to renew the authority for a further year. During the year, a total of 1.5 million ordinary shares with an aggregate nominal value of £15,000 were allotted to Computershare Nominees (Channel Islands) Limited, the account nominee of Computershare Trustees (Jersey) Limited, which acts as trustee for the Rentokil Initial Employee Share Trust (the Trustee). The shares were issued to satisfy awards that vested in 2025 under the Company’s Performance Share Plan. Details of the shares held by the Trustee are contained beneath the Consolidated Statement of Changes in Equity table on page 150. As at 31 December 2025, the Trustee holds on trust 0.42% of the issued share capital of the Company to satisfy awards that vest under the Company’s Performance Share Plan, the Deferred Bonus Plan, and the Terminix Share Plan. The Trustee has agreed to waive any right to all dividend payments on shares held by it, and the voting rights in relation to these shares are exercised by the Trustee. The Trustee may vote or abstain from voting with the shares, or accept or reject any offer relating to the shares, in any way it sees fit, without incurring any liability and without being required to give reasons for its decision. Repurchase of shares Authority for the Company to make purchases of its own shares of up to 252,000,000 shares was obtained at the AGM on 7 May 2025 and such authority will be valid until the 2026 AGM. No purchases of its shares were made by the Company during 2025. The authority is normally renewed annually and approval will be sought from shareholders at the 2026 AGM to renew the authority for a further year. Change of control provisions There are a number of agreements that take effect, alter, or terminate upon a change of control of the Company, such as some financial and commercial agreements, and employee long-term incentive or share plans. None of these are deemed to be significant in terms of their potential impact on the Group as a whole. A description of the Group’s debt funding arrangements is set out in Note C7 to the Financial Statements. Note C1 describes the change of control provisions relating to the Group’s EMTN Programme. Political donations It is the Company’s policy not to make payments to political organisations. The Company does, however, maintain a shareholder authority to make payments of a political nature, but does so only in order to ensure that the Company has authority from shareholders for the limited number of activities associated with the operation of the business which might be caught by the broad definition of payments of a political nature contained within current legislation. There were no payments to political organisations during 2025 (2024: £nil). Financial risk management Details of financial risk management and the relevant policies and certain exposures of the Company are disclosed in Note C1, on pages 181 and 182 of the Financial Statements. Post balance sheet events On 2 March 2026, Rentokil Initial plc redeemed in full the €500m 0.8750% Senior Unsecured Guaranteed Notes due 30 May 2026, at their principal amount together with accrued interest. The redemption was carried out in accordance with the terms and conditions of the notes. There were no other significant events between 31 December 2025 and the date of approval of these accounts that would require amendments to or additional disclosures in the financial statements. Major shareholders The Company has been notified pursuant to the Disclosure Guidance and Transparency Rules (DTR 5) that the following shareholders held, or were beneficially interested in, 3% or more of the Company’s issued share capital at 31 December 2025. The information provided below was correct at the date of notification, which may not have been within the current financial year. It should be noted that these holdings are likely to have changed since the Company was notified. However, notification of any change is not required until the next notifiable threshold is crossed. % No. of ordinary shares Date of notification of interest Swedbank Robur Fonder AB 3.02 76,308,258 04/12/25 BlackRock, Inc. 10.02 253,863,914 27/10/25 GIC Private Limited 4.95 125,250,650 04/12/25 Independent Franchise Partners 4.90 123,979,675 26/11/25 Janus Henderson Group plc 5.23 132,128,126 09/09/24 The Capital Group Companies, Inc. 4.73 119,645,760 26/04/24 Citigroup Global Markets Limited 3.76 94,839,249 24/10/22 Ameriprise Financial, Inc.1 4.87 122,117,456 18/10/22 FMR LLC 4.32 108,487,628 18/10/22 T. Rowe Price International Ltd 4.92 91,554,981 28/02/22 Schroders plc 4.91 89,878,920 15/12/16 Invesco Ltd 4.89 89,477,118 22/08/16 Majedie Asset Management Ltd2 5.61 101,963,126 07/03/14 AXA S.A. 4.80 87,093,421 19/10/10 1. Ameriprise Financial, Inc. includes Threadneedle Asset Management Holdings Ltd. 2. Subsequent to the notification, Liontrust Portfolio Management Ltd acquired Majedie Asset Management. Between 31 December 2025 and the date of this report, the Company received the following notifications: % No. of ordinary shares Latest notification of interest GIC Private Limited 3.99 100,832,491 19/01/26 Independent Franchise Partners 4.98 125,795,910 16/01/26 BlackRock, Inc. 11.00 278,002,814 15/01/26 Swedbank Robur Fonder AB 2.97 75,055,369 20/02/26 Equal opportunities The Company regards equality and fairness as a fundamental right of all of its colleagues. Every colleague is required to support the Company to meet its commitment to provide equal opportunities in employment and avoid unlawful discrimination. People with disabilities have full and fair consideration for all vacancies, and disability is not seen to be an inhibitor to employment or career development. Appropriate arrangements are made for the continued employment 222 Rentokil Initial plc Annual Report 2025 |
|
and training, career development, and promotion of people with disabilities employed by the Company. In the event of any colleague becoming disabled while employed by the Company, their needs and abilities would be assessed and, where possible, we would work to retain them and seek to offer alternative employment to them if they were no longer able to continue in their current role. Engagement with employees, suppliers, customers, and others We have c.63,400 colleagues in our workforce. We consider our workforce to be those colleagues who are employed directly by us, and we do not include contractors or agency workers in this group. We employ our colleagues directly wherever possible in order to invest in their training, to ensure their full understanding and compliance with our policies, including health and safety procedures, to allow them to build relationships with our customers, and to become more efficient. The number of contractors or agency workers throughout the business is not sufficiently material to identify and engage with them as a separate stakeholder group. However, like our colleagues, our contractors and agency workers must operate under our Code of Conduct and we will engage with them wherever practicable. A summary of the methods we use to engage with our colleagues (including UK employees), suppliers, customers, and our other key stakeholders, is provided on pages 95 and 96. The section 172(1) statement can be found on page 66 and details of principal decisions taken by the Board during 2025 can be found on page 94. Over 1,300 managers and technical experts participate in our Performance Share Plan (see page 123). Further details on wider workforce remuneration can be found on page 128. Branches The Company, through various subsidiaries, has branches in several different jurisdictions in which the business operates outside the UK. Directors’ indemnity and insurance The Directors are ultimately responsible for most aspects of the Company’s business dealings. They can face significant personal liability under criminal or civil law, or the UK Listing, Prospectus, Disclosure Guidance and Transparency Rules, and equivalent US regulation, and can face a range of penalties, including censure, fines, and imprisonment. The Company considers that it is in its best interests to protect individuals who serve as Directors from the consequences of innocent error or omission, since this enables the Company to continue to attract prudent, appropriately qualified individuals to act as Directors. The Company maintained at its expense a directors’ and officers’ liability insurance policy throughout the year to indemnify in certain circumstances Group personnel, including the Directors. This insurance cover remains in place. The policy does not provide cover where the Director or officer has acted fraudulently or dishonestly. In addition, the Company has granted indemnities in favour of Directors which were in force throughout 2025 and up to the signing of this report, as permitted by sections 232 to 235 of the Companies Act 2006. In general terms, the indemnities protect Directors to the extent permissible by law from all costs and expenses incurred in the defence of any civil or criminal proceedings in which judgement is given in their favour, or the proceedings are otherwise disposed of without finding fault or where there is a successful application to court for relief from liability. The indemnity operates to the extent that the Director is not able to recover the relevant amounts under the Company’s directors’ and officers’ liability insurance. Related party transactions Other than in respect of arrangements relating to the employment of Directors, details of which are provided in the Directors’ Remuneration Report, or as set out in Note D4 on page 192 of the Financial Statements, which also provides details of transactions with joint ventures and associate entities, there is no indebtedness owed to or by the Company to any colleague or any other person considered to be a related party. Disclosure of information to the auditor The Directors confirm that, insofar as each of them is aware, there is no relevant audit information (as defined by section 418(3) of the Companies Act 2006) of which the Company’s auditor is unaware; and each Director has taken all of the steps that should have been taken to ensure that they are each aware of any relevant audit information (as defined by section 418(3) of the Companies Act 2006) and to establish that the Company’s auditors are aware of that information. Going concern The Directors, having made enquiries as set out on page 153, consider that the Company and the Group have adequate resources to continue in operation for a period of at least 12 months from the date of approval of these annual Financial Statements. For this reason, they consider it appropriate to adopt the going concern basis in preparing the Financial Statements. Further details on the Group’s net debt, borrowing facilities, and financial risk management policies are provided in Section C Financing of the Notes to the Financial Statements on pages 181 to 190. Rentokil Initial plc Annual Report 2025 223 Strategic Report Corporate Governance Financial Statements Other Information |
|
Directors’ Report continued Statement of Directors’ responsibilities in respect of the financial statements The Directors are responsible for preparing the Annual Report and the financial statements in accordance with applicable law and regulation. Company law requires the Directors to prepare financial statements for each financial year. Under that law, the Directors have prepared the Group financial statements in accordance with UK-adopted international accounting standards and the Parent Company financial statements in accordance with United Kingdom Generally Accepted Accounting Practice (United Kingdom Accounting Standards, comprising FRS 101 ‘Reduced Disclosure Framework’, and applicable law). In preparing the Group financial statements, the Directors have also elected to comply with International Financial Reporting Standards issued by the International Accounting Standards Board (IFRSs as issued by IASB). Under company law, Directors must not approve the financial statements unless they are satisfied that they give a true and fair view of the state of affairs of the Group and Parent Company, and of the profit or loss of the Group for that period. In preparing the financial statements, the Directors are required to: • select suitable accounting policies and then apply them consistently; • state whether applicable UK-adopted international accounting standards and IFRSs issued by IASB have been followed for the Group financial statements, and United Kingdom Accounting Standards, comprising FRS 101, have been followed for the Parent Company financial statements, subject to any material departures disclosed and explained in the financial statements; • make judgements and accounting estimates that are reasonable and prudent; and • prepare the financial statements on the going concern basis unless it is inappropriate to presume that the Group and Parent Company will continue in business. The Directors are responsible for safeguarding the assets of the Group and Parent Company and hence for taking reasonable steps for the prevention and detection of fraud and other irregularities. The Directors are also responsible for keeping adequate accounting records that are sufficient to show and explain the Group’s and Parent Company’s transactions and disclose with reasonable accuracy at any time the financial position of the Group and Parent Company, and enable them to ensure that the financial statements and the Directors’ Remuneration Report comply with the Companies Act 2006. The Directors are responsible for the maintenance and integrity of the Parent Company’s website. Legislation in the United Kingdom governing the preparation and dissemination of financial statements may differ from legislation in other jurisdictions. Directors’ confirmations Each of the Directors, whose names and functions are listed on pages 80 and 81 of the Annual Report, confirms that, to the best of their knowledge: • the Group Financial Statements, which have been prepared in accordance with UK-adopted international accounting standards and IFRSs as issued by the IASB, give a true and fair view of the assets, liabilities, financial position, and profit of the Group; • the Parent Company Financial Statements, which have been prepared in accordance with United Kingdom Accounting Standards, comprising FRS 101, give a true and fair view of the assets, liabilities, and financial position of the Parent Company; • the Annual Report includes a fair review of the development and performance of the business and the position of the Group and Parent Company, together with a description of the principal risks and uncertainties that it faces; and • the Annual Report, which includes the Directors’ Remuneration Report and the Financial Statements, taken as a whole, is fair, balanced, and understandable, and provides the information necessary for shareholders to assess the Group’s and the Company’s position and performance, business model, and strategy. The Directors’ Report on pages 78 to 139 and pages 221 to 224 and the Strategic Report on pages 2 to 76 were approved by a duly authorised Committee of the Board of Directors and signed on its behalf by Rachel Canham, Group General Counsel & Company Secretary, on 5 March 2026. Rachel Canham Group General Counsel & Company Secretary 5 March 2026 Registered office: Compass House, Manor Royal, Crawley, West Sussex, RH10 9PY. Registered in England and Wales No: 5393279 224 Rentokil Initial plc Annual Report 2025 |
|
Additional Shareholder Information Rentokil Initial plc ordinary shares are listed on the London Stock Exchange and on the New York Stock Exchange in the form of ADSs. Registrar The Company’s Registrar is Equiniti Limited. All enquiries relating to the administration of shareholdings, dividends, change of address, and lost share certificates for the Company’s ordinary shares should be directed to Equiniti. Information and advice can be found on its website. Contacting Equiniti: help.shareview.co.uk 0333 207 6581 (+44 (0)333 207 6581 if calling from outside the UK). Lines are open 8.30am to 5.30pm (UK time), Monday to Friday (excluding public holidays in England and Wales). Equiniti, Aspect House, Spencer Road, Lancing, West Sussex, BN99 6DA. Shareview Portfolio service You can manage your shareholding online via Equiniti’s Shareview Portfolio at shareview.co.uk. This allows shareholders to access a range of information about their shareholdings on registers maintained by Equiniti and includes shareholding details (such as name and address), indicative share prices, recent balance changes, and dividend information. Share dealing services Equiniti offers shareholders a dealing service which allows you to buy or sell Rentokil Initial plc shares. shareview.co.uk 0371 384 2233 (+44 (0)371 384 2233 if calling from outside the UK). Calls are charged at standard national and international rates. Please note that both the internet share dealing and telephone share dealing services are subject to commission charges. Full details can be found on shareview.co.uk. ShareGift Shareholders with small holdings in shares, whose value makes them uneconomical to sell, may wish to donate them to ShareGift (registered charity no. 1052686). For further information, contact: sharegift.org help@sharegift.org +44 (0)20 7930 3737 ShareGift, 6th Floor, 2 London Wall Place, London, EC2Y 5AU. Share price information and history The current price of the Company’s shares can be found at rentokil-initial.com/investors. Mid-market price 31 March 1982 – 7.5375p* * Adjusted for the 1983 bonus issue and the 1990, 1992, and 1997 share splits. Mid-market price 31 December 2025 – 444.10p 2025 high/low – 480.00p/306.00p Dividends 2025 final dividend The Directors have recommended a final dividend of 8.24 cents per share for the financial year ended 31 December 2025. Payment of this dividend is subject to approval at the 2026 AGM. When taken with the interim dividend of 4.15 cents paid on 22 September 2025, this gives a total dividend of 12.39 cents (2024: 12.04 cents). Key dates relating to this dividend are given below. Ex-dividend date Thursday 9 April 2026 Record date Friday 10 April 2026 Last day for DRIP elections Friday 24 April 2026 Annual General Meeting Thursday 7 May 2026 Payment date Monday 18 May 2026 For further dividend information, please see page 221 or go to rentokil-initial.com/investors. Dividend payments Please note that we no longer pay dividends by cheque. All dividend payments are now credited directly into a shareholder’s UK bank or building society account. Shareholders who historically received dividends by cheque and have not yet completed a Dividend Mandate Form will need to contact our Registrar to request a form for completion (see opposite for contact details). For any shareholder who has not submitted their dividend mandate by the deadline of 24 April 2026, cash will be held in an account and they will need to contact our Registrar for the cash to be distributed to their UK bank or building society account. If you do not have a UK bank or building society account, you may be able to arrange for payments to be converted and paid in your local currency. Please contact our Registrar for more information. Dividend reinvestment plan (DRIP) The Company has a DRIP provided by Equiniti Financial Services Limited (Equiniti FS), which is a convenient, easy and cost-effective way to build a shareholding by using cash dividends to buy additional shares. Rather than having a bank account credited with a cash dividend, Equiniti FS will use the dividends payable to DRIP participants to purchase shares on your behalf in the market. Please go to shareview.co.uk for further information. Dividend history Details of the Company’s dividend history can be found on our website at rentokil-initial.com/investors. Rentokil Initial plc Annual Report 2025225 Strategic Report Corporate Governance Financial Statements Other Information |
|
Additional Shareholder Information continued American Depositary Shares The Company’s ADSs are listed on the New York Stock Exchange and trade under the symbol RTO. Each ADS is equivalent to five Rentokil Initial plc ordinary shares and they are evidenced by American Depositary Receipts (ADRs). The Bank of New York Mellon acts as depositary for the ADR programme. For enquiries relating to registered ADR holder accounts and dividends, please contact The Bank of New York Mellon. Voting rights for registered ADR holders can be exercised through The Bank of New York Mellon, and for beneficial ADR holders (and/or nominee accounts) through your US brokerage institution. www.computershare.com/investor shrrelations@cpushareownerservices.com Freephone from the US: +1 888 269 2377 International calls: +1 201 680 6825 Regular mail: BNY Mellon Shareowner Services, P.O. Box 43006, Providence, RI 02940-3078, USA. Overnight/certified/registered mail: BNY Mellon Shareowner Services, 150 Royall Street, Suite 101, Canton, MA 02021, USA. Indirect owners of shares with information rights Please note that beneficial owners of shares who have been nominated by the registered holder of those shares to receive information rights under section 146 of the Companies Act 2006 are required to direct all communications to the registered holder of their shares rather than to Equiniti. How to avoid share fraud Reject cold calls: If you’ve been cold called with an offer to buy or sell shares, the chances are it is a high-risk investment or a scam. You should treat the call with extreme caution. The safest thing to do is to hang up. Check the firm on the Financial Conduct Authority (FCA) register at fca.org.uk/register. The Financial Services Register is a public record of all the firms and individuals in the financial services industry that are regulated by the FCA. Get impartial advice: Think about getting impartial financial advice before you hand over any money. Seek advice from someone unconnected to the firm that has approached you. If you suspect that you have been approached by fraudsters, please tell the FCA using the share fraud reporting form at fca.org.uk/scams, where you can find out more about investment scams. You can also call the FCA Consumer Helpline on 0800 111 6768. If you have lost money to investment fraud, you should report it to Action Fraud on 0300 123 2040 or online at actionfraud.police.uk. Find out more at fca.org.uk/scamsmart. ALWAYS REMEMBER: If it seems too good to be true, it probably is! Unsolicited mail The Company is legally obliged to make its register of members available to the public, subject to a proper purpose test. As a consequence of this, some shareholders may receive unsolicited mail. Shareholders wishing to limit the amount of such mail should contact the Mailing Preference Service at: mpsonline.org.uk +44 (0)20 7291 3310 Annual General Meeting The 2026 AGM will be held at, and be broadcast via live webcast from, the Company’s offices at Compass House, Manor Royal, Crawley, West Sussex, RH10 9PY at 2.00pm on 7 May 2026 (see page 97 for more information). We would recommend joining securely via the live webcast, which removes the requirement to travel and provides an efficient and effective means for shareholders to engage in all elements of the meeting. The Notice of Meeting is available on our website. Published information If you would like to receive a hard copy of this Annual Report, please contact the Company Secretariat at the Company’s registered office below. A PDF copy of this report can be downloaded from our website. Rentokil Initial plc is subject to the US Securities and Exchange Commission (SEC) reporting requirements for foreign companies. The Company’s Form 20-F and other filings can be viewed on our website, as well as the SEC website at sec.gov. As a responsible business we are tackling climate change by committing to achieve net zero carbon emissions from our operations by the end of 2040. We would urge our shareholders to take advantage of the option to receive electronic communications from us by signing up at shareview.co.uk. For each shareholder that elects to go paperless we will make a donation to the UK charity Cool Earth to support their efforts to tackle endangered rainforest degradation. Registered office and headquarters Rentokil Initial plc Registered in England and Wales; Company Number: 5393279 Registered Office: Compass House, Manor Royal, Crawley, West Sussex, RH10 9PY. rentokil-initial.com secretariat@rentokil-initial.com +44 (0)1293 858000 226Rentokil Initial plc Annual Report 2025 |
|
Glossary ADR American Depositary Receipt ADS American Depositary Share AER Actual exchange rates AGM Annual General Meeting Benelux Belgium, the Netherlands, and Luxembourg Board The Board of Directors of Rentokil Initial plc CAGR Compound annual growth rate CER Constant exchange rates CGU Cash-generating unit Cities of the Future Rentokil Initial’s focused M&A programme in Emerging markets (see page 21) Company CSRD Rentokil Initial plc Corporate Sustainability Reporting Directive CVC Customer Voice Counts DBP Rentokil Initial plc Deferred Bonus Plan Director A Director of Rentokil Initial plc EBITDA Earnings before interest, tax, depreciation, and amortisation ECL Expected credit loss ELT Executive Leadership Team EMTN Euro Medium-Term Note EPS Earnings per share ESG Environmental, social, and governance ETR Effective tax rate FRC Financial Reporting Council FRS Financial Reporting Standards FSC Forest Stewardship Council GAAP Generally Accepted Accounting Practice GDP Gross domestic product GHG Greenhouse gas GLF Group Leadership Forum Group Rentokil Initial plc and its subsidiaries Growth and Emerging markets Rentokil Initial defined markets for operations (see page 21) IAS International Accounting Standards IFRS International Financial Reporting Standards ISDA International Swaps and Derivatives Association KPI Key performance indicator LATAM Latin America LEV Low Emission Vehicle LTA Lost Time Accident LTIP Long-term incentive plan M&A Mergers and acquisitions MENAT Middle East, North Africa, and Turkey NED Non-Executive Director NPS Net Promoter Score NYSE New York Stock Exchange OECD Organisation for Economic Co-operation and Development Parent Company Rentokil Initial plc PCF Product Carbon Footprint PCI PCI Pest Control Private Ltd (trading as Rentokil PCI) PPE Personal protective equipment PSP Rentokil Initial plc Performance Share Plan PwC PricewaterhouseCoopers LLP RCF Revolving Credit Facility RIPS Rentokil Initial 2015 Pension Scheme ROU Right-of-use SEC US Securities and Exchange Commission SF Sulfuryl fluoride SHE Safety, health, and environment SID Senior Independent Director SOX Sarbanes-Oxley Act SSA Sub-Saharan Africa TCFD Task Force on Climate-related Financial Disclosures Terminix Terminix Global Holdings, Inc. and its subsidiary undertakings Terminix Share Plan Terminix Global Holdings, Inc. 2014 Omnibus Incentive Plan, as amended from time to time TSR Total Shareholder Return UAE United Arab Emirates ULEV Ultra-Low Emission Vehicle WDL Working Days Lost YVC Your Voice Counts Rentokil Initial plc Annual Report 2025 227 Strategic Report Corporate Governance Financial Statements Other Information |
|
Cautionary Statement In order, among other things, to utilise the ‘safe harbour’ provisions of the US Private Securities Litigation Reform Act of 1995, we are providing the following cautionary statement: This Annual Report 2025 contains statements that are, or may be, forward-looking regarding the Group’s results of operations, business strategy, plans and objectives, including, among other things, statements about the Group’s financial condition, liquidity, prospects, growth and the economic and business circumstances occurring from time to time in the countries and markets in which the Group operates. These statements are often, but not always, made through the use of words or phrases such as “believe”, “anticipate”, “could”, “may”, “would”, “is likely to”, “should”, “intend”, “seek”, “aim”, “plan”, “shall”, “potential”, “predict”, “continue”, “will”, “expect”, “estimate”, “project”, “positioned”, “strategy”, “outlook”, “target”, and similar expressions or negatives of these expressions. Although we believe that the forward-looking statements in this Annual Report 2025 are based on reasonable assumptions, such statements involve risk and uncertainty because they relate to future events and circumstances. There are accordingly a number of factors which might cause actual results and performance to differ materially from those expressed or implied by such statements, including, but not limited to, uncertainties related to: • our ability to integrate acquisitions successfully, or any unexpected costs or liabilities from our disposals; • difficulties in integrating, streamlining, and optimising our IT systems, processes, and technologies, including artificial intelligence technologies; • our ability to attract, retain, and develop key personnel to lead our business; • the availability of a suitably skilled and qualified labour force to maintain our business; • cyber security breaches, attacks, and other similar incidents as well as disruptions or failures in our IT systems or data security procedures and those of our third-party service providers; • inflationary pressures, such as increases in wages, fuel prices, and other operating costs; • weakening general economic conditions, including changes in the global job market, or decreased consumer confidence or spending levels especially as they may affect demand from our customers; • our ability to implement our business strategies successfully, including achieving our growth objectives; • our ability to retain existing customers and attract new customers; • the highly competitive nature of our industries; • extraordinary events that impact our ability to service customers without interruption due to a material incident, including a loss of our third-party distributors; • the impact of ESG matters, including those related to climate change and sustainability, on our business, reputation, results of operations, financial condition, and/or prospects; • supply chain issues, which may result in product shortages, cost increases or other disruptions to our business; • our ability to protect our intellectual property and other proprietary rights that are material to our business; • our reliance on third parties, including third-party vendors for business process outsourcing initiatives, investment counterparties, and franchisees, and the risk of any termination or disruption of such relationships or counterparty default, fraudulent activity or litigation; • any future impairment charges, asset revaluations, or downgrades; • failure to comply with the many laws and governmental regulations to which we are subject or the implementation of any new or revised laws or regulations that alter the environment in which we do business, as well as the costs to us of complying with any such changes and the risk of related litigation; • termite damage claims and lawsuits related thereto and any associated impacts on the termite provision; • our ability to comply with safety, health, and environmental policies, laws, and regulations, including laws pertaining to the use of pesticides; • any actual or perceived failure to comply with stringent, complex, and evolving laws, rules, regulations, and standards in many jurisdictions, as well as contractual obligations, including data privacy and security, and any litigation (including class action claims and lawsuits) related to such actual or perceived failures; • the identification of material weaknesses in our internal control over financial reporting within the meaning of section 404 of the Sarbanes-Oxley Act; • changes in tax laws and any unanticipated tax liabilities; • adverse credit and financial market events and conditions, which could, among other things, impede access to or increase the cost of financing; • the restrictions and limitations within the agreements and instruments governing our indebtedness; • a lowering or withdrawal of the ratings, outlook, or watch assigned to our debt securities by rating agencies; • an increase in interest rates and the resulting increase in the cost of servicing our debt; and • exchange rate fluctuations and the impact on our results, or the foreign currency value of our ADSs and any dividends. Further details on the principal risks that may affect the Group can be found in the Risks and Uncertainties section on pages 70 to 75, as well as page 60 (in relation to climate-related risk) and pages 181 and 182 (in relation to financial risks), of this Annual Report 2025. Forward-looking statements speak only as of the date they are made and no representation or warranty, whether express or implied, is given in relation to them, including as to their completeness or accuracy, or the basis on which they were prepared. Other than in accordance with the Company’s legal or regulatory obligations (including under the UK Listing Rules and the Disclosure Guidance and Transparency Rules), the Company does not undertake any obligation to update or revise publicly any forward-looking statement, whether as a result of new information, future events, or otherwise. Information contained in this Annual Report 2025 relating to the Company or its share price, or the yield on its shares, should not be relied upon as an indicator of future performance. Nothing in this Annual Report 2025 should be construed as a profit forecast. 228 Rentokil Initial plc Annual Report 2025 |
|
This page left intentionally blank |
|
This page left intentionally blank |
|
Designed and produced by Friend www.friendstudio.com Online editing Print Pureprint Group This report has been printed on Amadeus Silk which is FSC® certified and made from 100% Elemental Chlorine Free (ECF) pulp. The mill and the printer are both certified to ISO 14001 environmental management system. The report was printed using vegetable-based inks by a CarbonNeutral® printer. This publication is produced by a CarbonNeutral® company and the paper is Carbon Balanced with World Land Trust. Balancing is delivered by World Land Trust, an international conservation charity, who offset carbon emissions through the purchase and preservation of high conservation value land. Through protecting standing forests, under threat of clearance, carbon is locked in that would otherwise be released. These protected forests are then able to continue absorbing carbon from the atmosphere, referred to as REDD (Reduced Emissions from Deforestation and forest Degradation). This is now recognised as one of the most cost-effective and swiftest ways to arrest the rise in atmospheric CO2 and global warming effects. Additional to the carbon benefits is the flora and fauna this land preserves, including a number of species identified at risk of extinction on the IUCN Red List of Threatened Species. |
|
rentokil-initial.com rentokil.com terminix.com initial.com ambius.com Rentokil Initial plc Annual Report 2025 |
Exhibit 15.2
CONSENT OF INDEPENDENT REGISTERED PUBLIC ACCOUNTING FIRM
We hereby consent to the incorporation by reference in the Registration Statement on Form S-8 (No. 333-267837) of Rentokil Initial plc of our report dated March 25, 2026 relating to the financial statements and the effectiveness of internal control over financial reporting, which appears in this Form 20-F.
/s/ PricewaterhouseCoopers LLP
London, United Kingdom
March 25, 2026
Exhibit 97.1

RENTOKIL INITIAL PLC
SEC COMPENSATION RECOUPMENT POLICY
This Rentokil Initial Plc SEC Compensation Recoupment Policy (the “SEC Policy”) has been adopted by the Remuneration Committee (the “Committee”) of Rentokil Initial Plc, a company registered in England and Wales with company number 5393279, (the “Company”) on 27 September 2023. The Company has ordinary shares represented by American depositary shares listed on the NYSE (“US Listing”). This SEC Policy provides for the recoupment of certain executive compensation in the event of an accounting restatement resulting from material noncompliance with financial reporting requirements under U.S. federal securities laws in accordance with the terms and conditions set forth herein. This SEC Policy is intended to comply with the requirements of Section 10D of the Exchange Act (as defined below) and Section 303A.14 of the NYSE Listed Company Manual (the “Listing Rule”) which applies to the Company due to its US Listing.
1.Definitions. For the purposes of this SEC Policy, the following terms shall have the meanings set forth below.
(a)“Committee” means the remuneration committee of the Board of Directors of Rentokil Initial Plc (“the Board”) or any successor committee thereof. If there is no remuneration committee of the Board, references herein to the Committee shall refer to the Company’s committee of independent directors that is responsible for executive compensation decisions, or in the absence of such a compensation committee, the independent members of the Board.
(b)“Covered Compensation” means any Incentive-based Compensation “received” by a Covered Executive during the applicable Recoupment Period; provided that:
(i) |
such Incentive-based Compensation was received by such Covered Executive (A) on or after the Effective Date, (B) after he or she commenced service as an Executive Officer and (C) while the Company had a class of securities publicly listed on a United States national securities exchange; and |
(ii) |
such Covered Executive served as an Executive Officer at any time during the performance period applicable to such Incentive-based Compensation. |
For purposes of this SEC Policy, Incentive-based Compensation is “received” by a Covered Executive during the fiscal period in which the Financial Reporting Measure applicable to such Incentive-based Compensation (or portion thereof) is attained, even if the payment or grant of such Incentive-based Compensation is made thereafter.
(c)“Covered Executive” means any current or former Executive Officer.
(d)“Effective Date” means the date on which the Listing Rule becomes effective.
(e)“Exchange Act” means the U.S. Securities Exchange Act of 1934, as amended.
(f)“Executive Officer” means an “executive officer” as defined in the Listing Rule, who shall include any other individuals who the Board has determined meet the definition of “executive officer” under the Listing Rule, as well as the members of the Company’s Executive Leadership Team. The determination by the Board as to an individual’s status as an Executive Officer shall be final, conclusive and binding on such individual and all other interested persons.
(g)“Financial Reporting Measure” means any (i) measure that is determined and presented in accordance with the accounting principles used in preparing the Company’s financial statements, (ii) stock price measure or (iii) total shareholder return measure (and any measures that are derived wholly or in part from any measure referenced in clause (i), (ii) or (iii) above). For the avoidance of doubt, any such measure does not need to be presented within the Company’s financial statements or included in a filing with the U.S. Securities and Exchange Commission to constitute a Financial Reporting Measure.
(h)“Financial Restatement” means a restatement of the Company’s financial statements due to the Company’s material noncompliance with any financial reporting requirement under U.S. federal securities laws that is required in order to correct:
(i) |
an error in previously issued financial statements that is material to the previously issued financial statements; or |
(ii) |
an error that would result in a material misstatement if the error were (A) corrected in the current period or (B) left uncorrected in the current period. |
For purposes of this SEC Policy, a Financial Restatement shall not be deemed to occur in the event of a revision of the Company’s financial statements due to an out-of-period adjustment (i.e., when the error is immaterial to the previously issued financial statements and the correction of the error is also immaterial to the current period) or a retrospective (1) application of a change in accounting principles; (2) revision to reportable segment information due to a change in the structure of the Company’s internal organization; (3) reclassification due to a discontinued operation; (4) application of a change in reporting entity, such as from a reorganization of entities under common control; (5) revision for stock splits, reverse stock splits, stock dividends or other changes in capital structure; or (6) adjustment to provisional amounts in connection with a prior business combination.
(i)“Incentive-based Compensation” means any compensation (including, for the avoidance of doubt, any cash or equity or equity-based compensation, whether deferred or current) that is granted, earned and/or vested based wholly or in part upon the achievement of a Financial Reporting Measure. For purposes of this SEC Policy, “Incentive-based Compensation” shall also be deemed to include any amounts which were determined based on (or were otherwise calculated by reference to) Incentive-based Compensation (including, without limitation, any amounts under any long-term disability, life insurance or supplemental retirement or severance plan or agreement or any notional account that is based on Incentive-based Compensation, as well as any earnings accrued thereon).
(j)“NYSE” means the New York Stock Exchange, or any successor thereof.
(k)“Recoupment Period” means the three fiscal years completed immediately preceding the date of any applicable Recoupment Trigger Date. Notwithstanding the foregoing, the Recoupment Period additionally includes any transition period (that results from a change in the Company’s fiscal year) within or immediately following those three completed fiscal years, provided that a transition period between the last day of the Company’s previous fiscal year end and the first day of its new fiscal year that comprises a period of nine (9) to twelve (12) months would be deemed a completed fiscal year.
(l)“Recoupment Trigger Date” means the earlier of (i) the date that the Committee (or the officer(s) of the Company authorized to take such action if the Committee’s action is not required) concludes, or reasonably should have concluded, that the Company is required to prepare a Financial Restatement, and (ii) the date on which a court, regulator or other legally authorized body directs the Company to prepare a Financial Restatement.
2
2.Recoupment of Erroneously Awarded Compensation.
(a)In the event of a Financial Restatement, if the amount of any Covered Compensation received by a Covered Executive (the “Awarded Compensation”) exceeds the amount of such Covered Compensation that would have otherwise been received by such Covered Executive if calculated based on the Financial Restatement (the “Adjusted Compensation”), the Company shall reasonably promptly recover from such Covered Executive an amount equal to the excess of the Awarded Compensation over the Adjusted Compensation, each calculated on a pre-tax basis (such excess amount, the “Erroneously Awarded Compensation”).
(b)If (i) the Financial Reporting Measure applicable to the relevant Covered Compensation is stock price or total shareholder return (or any measure derived wholly or in part from either of such measures) and (ii) the amount of Erroneously Awarded Compensation is not subject to mathematical recalculation directly from the information in the Financial Restatement, then the amount of Erroneously Awarded Compensation shall be determined (on a pre-tax basis) based on the Company’s reasonable estimate of the effect of the Financial Restatement on the Company’s stock price or total shareholder return (or the derivative measure thereof) upon which such Covered Compensation was received.
(c)For the avoidance of doubt, the Company’s obligation to recover Erroneously Awarded Compensation is not dependent on (i) if or when the restated financial statements are filed or (ii) any fault of any Covered Executive for the accounting errors or other actions leading to a Financial Restatement.
(d)Notwithstanding anything to the contrary in Sections 2(a) through (c) hereof, the Company shall not be required to recover any Erroneously Awarded Compensation if both (x) the conditions set forth in either of the following clauses (i), (ii), or (iii) are satisfied and (y) the Committee (or, in the absence of such a committee, a majority of the independent directors serving on the Board) has determined that recovery of the Erroneously Awarded Compensation would be impracticable:
(i) |
the direct expense paid to a third party to assist in enforcing the recovery of the Erroneously Awarded Compensation under this SEC Policy would exceed the amount of such Erroneously Awarded Compensation to be recovered; provided that, before concluding that it would be impracticable to recover any amount of Erroneously Awarded Compensation pursuant to this Section 2(d), the Company shall have first made a reasonable attempt to recover such Erroneously Awarded Compensation, document such reasonable attempt(s) to make such recovery and provide that documentation to the NYSE; |
(ii) |
recovery of the Erroneously Awarded Compensation would violate the laws of England and Wales to the extent such law was adopted prior to November 28, 2022 (provided that, before concluding that it would be impracticable to recover any amount of Erroneously Awarded Compensation pursuant to this Section 2(d)), the Company shall have first obtained an opinion of home country counsel of England and Wales, that is acceptable to the NYSE, that recovery would result in such a violation, and the Company must provide such opinion to the NYSE; or |
3
(iii) |
recovery of the Erroneously Awarded Compensation would likely cause an otherwise tax-qualified retirement plan, under which benefits are broadly available to employees of the Company, to fail to meet the requirements of Sections 401(a)(13) or 411(a) of the U.S. Internal Revenue Code of 1986, as amended (the “Code”). |
(e)The Company shall not indemnify any Covered Executive, directly or indirectly, for any losses that such Covered Executive may incur in connection with the recovery of Erroneously Awarded Compensation pursuant to this SEC Policy, including through the payment of insurance premiums or gross-up payments.
(f)The Committee shall determine, in its sole discretion, the manner and timing in which any Erroneously Awarded Compensation shall be recovered from a Covered Executive in accordance with applicable law, including, without limitation, by (i) requiring reimbursement of Covered Compensation previously paid in cash; (ii) seeking recovery of any gain realized on the vesting, exercise, settlement, sale, transfer or other disposition of any equity or equity-based awards; (iii) offsetting the Erroneously Awarded Compensation amount from any compensation otherwise owed by the Company or any of its affiliates to the Covered Executive; (iv) cancelling outstanding vested or unvested equity or equity-based awards; and/or (v) taking any other remedial and recovery action permitted by applicable law. For the avoidance of doubt, except as set forth in Section 2(d), in no event may the Company accept an amount that is less than the amount of Erroneously Awarded Compensation; provided that, to the extent necessary to avoid any adverse tax consequences to the Covered Executive pursuant to Section 409A of the Code, any offsets against amounts under any nonqualified deferred compensation plans (as defined under Section 409A of the Code) shall be made in compliance with Section 409A of the Code.
3.Administration. This SEC Policy shall be administered by the Committee. All decisions of the Committee shall be final, conclusive and binding upon the Company and the Covered Executives, their beneficiaries, executors, administrators and any other legal representative. The Committee shall have full power and authority to (i) administer and interpret this SEC Policy; (ii) correct any defect, supply any omission and reconcile any inconsistency in this SEC Policy; and (iii) make any other determination and take any other action that the Committee deems necessary or desirable for the administration of this SEC Policy and to comply with applicable law (including Section 10D of the Exchange Act) and applicable stock market or exchange rules and regulations. Notwithstanding anything to the contrary contained herein, to the extent permitted by Section 10D of the Exchange Act and the Listing Rule, the Board may, in its sole discretion, at any time and from time to time, administer this SEC Policy in the same manner as the Committee.
4.Amendment/Termination. Subject to Section 10D of the Exchange Act and the Listing Rule, this SEC Policy may be amended or terminated by the Committee at any time. To the extent that any applicable law, or stock market or exchange rules or regulations require recovery of Erroneously Awarded Compensation in circumstances in addition to those specified herein, nothing in this SEC Policy shall be deemed to limit or restrict the right or obligation of the Company to recover Erroneously Awarded Compensation to the fullest extent required by such applicable law, stock market or exchange rules and regulations. Unless otherwise required by applicable law, this SEC Policy shall no longer be effective from and after the date that the Company no longer has a class of securities publicly listed on a United States national securities exchange.
5.Interpretation. Notwithstanding anything to the contrary herein, this SEC Policy is intended to comply with the requirements of Section 10D of the Exchange Act and the Listing
4
Rule (and any applicable regulations, administrative interpretations or stock market or exchange rules and regulations adopted in connection therewith). The provisions of this SEC Policy shall be interpreted in a manner that satisfies such requirements and this SEC Policy shall be operated accordingly. If any provision of this SEC Policy would otherwise frustrate or conflict with this intent, the provision shall be interpreted and deemed amended so as to avoid such conflict.
6.Other Compensation Clawback/Recoupment Rights. Any right of recoupment under this SEC Policy is in addition to, and not in lieu of, any other remedies, rights or requirements with respect to the clawback or recoupment of any compensation that may be available to the Company pursuant to the terms of any other recoupment or clawback policy of the Company (or any of its affiliates), including the Rentokil Initial plc Malus and Clawback Policy that may be in effect from time to time, any provisions in any employment agreement, offer letter, equity plan, equity award agreement or similar plan or agreement, and any other legal remedies available to the Company, as well as applicable law, stock market or exchange rules, listing standards or regulations; provided, however, that any amounts recouped or clawed back under any other policy that would be recoupable under this SEC Policy shall count toward any required clawback or recoupment under this SEC Policy and vice versa.
7.Exempt Compensation. Notwithstanding anything to the contrary herein, the Company has no obligation under this SEC Policy to seek recoupment of amounts paid to a Covered Executive which are granted, vested or earned based solely upon the occurrence or non-occurrence of nonfinancial events. Such exempt compensation includes, without limitation, base salary, time-vesting awards, compensation awarded on the basis of the achievement of metrics that are not Financial Reporting Measures or compensation awarded solely at the discretion of the Committee or the Board, provided that such amounts are in no way contingent on, and were not in any way granted on the basis of, the achievement of any Financial Reporting Measure performance goal.
8.Miscellaneous.
(a)Any applicable award agreement or other document setting forth the terms and conditions of any compensation covered by this SEC Policy shall be deemed to include the restrictions imposed herein and incorporate this SEC Policy by reference and, in the event of any inconsistency, the terms of this SEC Policy will govern. For the avoidance of doubt, this SEC Policy applies to all compensation that is received on or after the Effective Date, regardless of the date on which the award agreement or other document setting forth the terms and conditions of the Covered Executive’s compensation became effective, including, without limitation, compensation received under the Rentokil Initial Plc Performance Share Plan and any successor plan thereto.
(b)This SEC Policy shall be binding and enforceable against all Covered Executives and their beneficiaries, heirs, executors, administrators or other legal representatives.
(c)All issues concerning the construction, validity, enforcement and interpretation of this SEC Policy and all related documents, including, without limitation, any employment agreement, offer letter, equity award agreement or similar agreement, shall be governed by, and construed in accordance with, the laws of England and Wales, without giving effect to any choice of law or conflict of law rules or provisions (whether of England and Wales or any other jurisdiction) that would cause the application of the laws of any jurisdiction other than England and Wales.
5
(d)If any provision of this SEC Policy is determined to be unenforceable or invalid under any applicable law, such provision will be applied to the maximum extent permitted by applicable law and shall automatically be deemed amended in a manner consistent with its objectives to the extent necessary to conform to any limitations required under applicable law.
6