UNITED STATES
SECURITIES AND EXCHANGE COMMISSION
Washington, D.C. 20549
FORM 10-K
|
|
☒ |
ANNUAL REPORT PURSUANT TO SECTION 13 OR 15(d) OF THE SECURITIES EXCHANGE ACT OF 1934 |
For the fiscal year ended December 31, 2025 | |
☐ |
TRANSITION REPORT UNDER SECTION 13 OR 15(d) OF THE SECURITIES EXCHANGE ACT OF 1934 |
For the transition period from to | |
Commission file number 001-33190
McEWEN INC.
(Name of registrant as specified in its charter)
|
|
Colorado |
84-0796160 |
(State or other jurisdiction of incorporation or organization) |
(I.R.S. Employer Identification No.) |
150 King Street West, Suite 2800, Toronto, Ontario Canada |
M5H 1J9 |
(Address of principal executive offices) |
(Zip Code) |
(866) 441-0690
(Registrant’s telephone number, including area code)
Securities registered pursuant to Section 12(b) of the Act:
Title of each class |
Trading Symbol(s) |
Name of each exchange on which registered |
Common Stock, no par value |
MUX |
New York Stock Exchange (“NYSE”) |
Securities registered pursuant to Section 12(g) of the Act: None
Indicate by check mark if the registrant is a well-known seasoned issuer, as defined in Rule 405 of the Securities Act. Yes ☐ No ☒
Indicate by check mark if the registrant is not required to file reports pursuant to Section 13 or Section 15(d) of the Act. Yes ☐ No ☒
Indicate by check mark whether the registrant (1) has filed all reports required to be filed by Section 13 or 15(d) of the Securities Exchange Act of 1934 during the preceding 12 months (or for such shorter period that the registrant was required to file such reports), and (2) has been subject to such filing requirements for the past 90 days. Yes ☒ No ☐
Indicate by check mark whether the registrant has submitted electronically every Interactive Data File required to be submitted pursuant to Rule 405 of Regulation S-T (§ 232.405 of this chapter) during the preceding 12 months (or for such shorter period that the registrant was required to submit such files). Yes ☒ No ☐
Indicate by check mark whether the registrant is a large accelerated filer, an accelerated filer, a non-accelerated filer, a smaller reporting company or an emerging growth company. See the definitions of “large accelerated filer,” “accelerated filer,” “smaller reporting company” and “emerging growth company” in Rule 12b-2 of the Exchange Act.
|
|
Large accelerated filer ☐ |
Accelerated filer ☒ |
Non-accelerated filer ☐ |
Smaller reporting company ☐ |
|
Emerging growth company ☐ |
If an emerging growth company, indicate by check mark if the registrant has elected not to use the extended transition period for complying with any new or revised financial accounting standards provided pursuant to Section 13(a) of the Exchange Act. ☐
Indicate by check mark whether the registrant has filed a report on and attestation to its management’s assessment of the effectiveness of its internal control over financial reporting under Section 404(b) of the Sarbanes-Oxley Act (15 U.S.C 7262 (b)) by the registered public accounting firm that prepared or issued its audit report. ☒
If securities are registered pursuant to Section 12(b) of the Act, indicate by check mark whether the financial statements of the registrant included in the filing reflect the correction of an error to previously issued financial statements. ☐
Indicate by check mark whether any of those error corrections are restatements that required a recovery analysis of incentive-based compensation received by any of the registrant’s executive officers during the relevant recovery period pursuant to § 240.10D-1(b). ☐
Indicate by check mark whether the registrant is a shell company (as defined in Rule 12b-2 of the Exchange Act). Yes ☐ No ☒
As of June 30, 2025 (the last business day of the registrant’s second fiscal quarter), the aggregate market value of the registrant’s voting and non-voting common equity held by non-affiliates of the registrant was $519,882,572 based on the closing price of $9.61 per share as reported on the NYSE. There were 59,452,799 shares of common stock outstanding on March 16, 2026.
DOCUMENTS INCORPORATED BY REFERENCE: Portions of the registrant’s Proxy Statement for the 2026 Annual Meeting of Shareholders are incorporated into Part III, Items 10 through 14 of this report.
TABLE OF CONTENTS
ADDITIONAL INFORMATION
Descriptions of agreements or other documents in this report are intended as summaries and are not necessarily complete. Please refer to the agreements or other documents filed or incorporated herein by reference as exhibits. Please see Item 15, Exhibits and Financial Statement Schedules in this report for a complete list of those exhibits.
1
SPECIAL NOTE REGARDING FORWARD-LOOKING STATEMENTS
Please see the note under “Item 7. Management’s Discussion and Analysis of Financial Condition and Results of Operations,” for a description of special factors potentially affecting forward-looking statements included in this report.
CAUTIONARY NOTE REGARDING DISCLOSURE OF MINERAL PROPERTIES
Mineral Reserves and Resources
We are subject to the reporting requirements of the Securities and Exchange Act of 1934, as amended (the “Exchange Act”) and applicable Canadian securities laws, and as a result, we have reported our mineral reserves and mineral resources according to two different standards. U.S. reporting requirements are governed by Item 1300 of Regulation S-K (“S-K 1300”), as issued by the U.S. Securities and Exchange Commission (“SEC”). Canadian reporting requirements for disclosure of mineral properties are governed by National Instrument 43-101 Standards of Disclosure for Mineral Projects (“NI 43-101”), as adopted from the definitions provided by the Canadian Institute of Mining, Metallurgy and Petroleum. Both sets of reporting standards have similar goals in terms of conveying an appropriate level of confidence in the disclosures being reported, but the standards embody slightly different approaches and definitions. All disclosures of mineral resources and mineral reserves in this report are reported in accordance with S-K 1300.
Investors should be aware that the estimation of measured and indicated resources involve greater uncertainty as to their existence and economic feasibility than the estimation of proven and probable reserves, and therefore investors are cautioned not to assume that all or any part of measured or indicated resources will ever be converted into reserves that conform to S-K 1300 guidelines. The estimation of inferred resources involves far greater uncertainty as to their existence and economic viability than the estimation of other categories of resources. It is reasonably expected that the majority of the inferred mineral resource could be upgraded to an indicated mineral resource with continued exploration. Investors are cautioned not to assume that all or any part of inferred resources exist, or that they can be mined legally or economically.
Technical Report Summaries and Qualified Persons
The technical information concerning our mineral projects in this Form 10-K have been reviewed and approved by William Shaver, P.Eng., Chief Operating Officer, Luke Willis, P.Geo, Director, Resource Modeling, and Channa Kumarage, P.Eng., Director, Technical Services, each a “qualified person” under S-K 1300. For a description of the key assumptions, parameters and methods used to estimate mineral reserves and mineral resources included in this Form 10-K, as well as data verification procedures and a general discussion of the extent to which the estimates may be affected by any known environmental, permitting, legal, title, taxation, sociopolitical, marketing or other relevant factors, please review the Technical Report Summaries for our material properties which are included as exhibits to the 2021 Form 10-K, except for Fox Complex, which was updated and filed as an exhibit to the 10-K dated March 14, 2025 and the Los Azules copper project which was updated and filed as an exhibit to this 10-K.
RELIABILITY OF INFORMATION
Minera Santa Cruz S.A. (“MSC”), the owner of the San José mine, is responsible for and has supplied to us all reported results from the San José mine. The technical information contained herein regarding the San José mine is based entirely on information provided to us by MSC. Our joint venture partner, a subsidiary of Hochschild Mining plc (“Hochschild”), and its affiliates other than MSC do not accept responsibility for the use of project data or the adequacy or accuracy of this information.
2
PART I
ITEM 1. BUSINESS
History and Organization
McEwen Inc. (the “Company”) is a gold and silver mining production and exploration company with an advanced copper development project, focused on the Americas. We were incorporated under the laws of the state of Colorado in 1979 as US Gold Corp. In September 2011, US Gold Corp. acquired Minera Andes Inc., and was renamed McEwen Mining Inc. Effective July 7, 2025, the Company changed its name from McEwen Mining Inc. to McEwen Inc. We own 100% of the Froome mine and Stock mill in Ontario, Canada; 100% of the Gold Bar Mine Complex in Nevada; 100% of El Gallo (previously known as the Fenix Project) in Sinaloa, Mexico; a 46.3% interest in McEwen Copper Inc., the owner of the Los Azules copper project (“Los Azules”) in San Juan, Argentina; and a 49% interest in MSC, the owner and operator of the San José mine in Santa Cruz, Argentina. In addition to the above, we hold interests in advanced-stage and exploration-stage projects in the United States, Canada, Mexico, and Argentina.
Our commencement of Canadian operations in 2017 was facilitated by the acquisition of Lexam VG Gold Inc. (“Lexam”) in April 2017, followed by the acquisition of the Black Fox and Stock Properties from Primero Mining Corp. in October 2017. These two acquisitions provided us with an operating mine, mill, and significant land interests in the historic Timmins mining district of Ontario (collectively, the “Fox Complex”). On September 19, 2021, our currently operating Froome mine, located within the Black Fox Property, reached commercial production. The Company is currently developing its Stock Property as an underground mine, with production expected to begin by mid-2026. In January 2026, we closed the acquisition of Canadian Gold Corp. which holds a number of exploration-stage assets, including the Tartan Lake project in Manitoba.
In the United States, construction began on our 100% owned Gold Bar mine in Nevada in 2017. The Gold Bar mine poured its first gold ingot on February 16, 2019, and achieved commercial production on May 23, 2019. Current production is from our Pick, Ridge and Gold Bar South deposits. In August 2024, we expanded our portfolio of exploration-stage properties in Nevada through the acquisition of Timberline Resources Corporation (“Timberline”). Together with our Tonkin Project, acquired in 2005, these properties comprise the Gold Bar Mine Complex.
At El Gallo in Sinaloa, Mexico, mining and crushing activities ceased during the second quarter of 2018. The Company now plans to begin mill construction in H1 2026 as part of its heap leach material (“HLM”) reprocessing project contemplated in its 2021 feasibility study. Production is projected to begin by mid-2027 and is expected to run for 10 years, reaching an average annual output of approximately 20,000 GEOs once commercial production is achieved. A second operational phase focusing on silver dominant material has also been planned (“El Gallo Silver”).
Our objective is to increase shareholder value through the exploration for and economic extraction of gold, silver, and other valuable minerals. Other than the San José mine and the Los Azules copper project, both located in Argentina, we generally conduct our activities as the sole owner, but we may enter into strategic arrangements with other companies through joint venture or similar agreements. We hold our mineral property interests and operate our business through various subsidiary companies.
Our principal executive office is located at 150 King Street West, Suite 2800, Toronto, Ontario, Canada M5H 1J9 and our telephone number is (866) 441-0690. Our website is www.mcewenmining.com. We make available at no cost our periodic reports, including Forms 10-K, 10-Q and 8-K, and news releases and certain of our corporate governance documents, including our Code of Business Conduct and Ethics, on our website. Our common stock is listed on the New York Stock Exchange (“NYSE”) and on the Toronto Stock Exchange (“TSX”) under the symbol “MUX.”
In this report, unless otherwise noted, “Au” represents gold; “Ag” represents silver; “Cu” represents copper; “oz” represents troy ounce; “lb” represents pound; “g/t” represents grams per metric tonne; “o/t” represents troy ounces per short ton; “ft” represents feet; “m” represents meter; “sq” represents square; and C$ refers to Canadian dollars. All our financial information is reported in United States (U.S.) dollars, unless otherwise noted. References to our company include, where the context requires, all our subsidiaries.
3
Segment Information
Our operating segments include Canada, United States, Mexico, MSC and McEwen Copper. Financial information for each of our reportable segments can be found under Item 7. Management’s Discussion and Analysis of Financial Condition and Results of Operations and Item 8. Financial Statements and Supplementary Data, Note 3, Operating Segment Reporting.
Products
The end product at our gold and silver operations is generally doré bars or ore concentrate. Doré is an alloy consisting primarily of gold and silver but may also contain other trace elements, cast into unrefined bars. These bars are sent to third party refiners to produce saleable bullion. Ore concentrate, or simply concentrate, is raw mineralized material that has been finely ground into a powdery product from which gangue (waste) is removed, thus concentrating the metal component. Concentrate, as well as slag and fine carbons (which are by-products of the gold production process), are sent to third party smelters for further recovery of gold and silver.
During 2025, production consisted of 100% doré from the Gold Bar Mine Complex, 98% doré and 2% slag and fine carbon from the Fox Complex, and 91% doré and 9% slag and fine carbon from El Gallo. Production from the San José mine consisted of 13% doré and 87% concentrate.
During 2025, we reported the following gold equivalent ounce production attributable to us:
|
|
Gold |
|
Silver |
|
Gold equivalent |
Production |
|
ounces |
|
ounces |
|
ounces(1) |
Gold Bar Mine Complex |
|
33,221 |
|
540 |
|
33,227 |
Fox Complex |
|
23,144 |
|
3,605 |
|
23,187 |
El Gallo |
|
396 |
|
53,047 |
|
1,152 |
San José mine (on 49% basis) |
|
37,715 |
|
1,776,034 |
|
58,120 |
Total production |
|
94,476 |
|
1,833,226 |
|
115,687 |
| (1) | Calculated using an average silver to gold spot price ratio of 86:1. |
Gold and silver contained in our end products are generally sold at the prevailing spot market price per ounce at the time of sale. Concentrates produced by the San José mine are provisionally priced, whereby the selling price is subject to final adjustments at the end of a period ranging from 30 to 90 days after delivery to the customer. The final price is based on the market price of the contained metals at the relevant quotation period stipulated in the contract. Due to the time elapsed between shipment and the final settlement with the buyer, MSC estimates the prices at which sales of metals will be settled. At the end of each financial reporting period, previously recorded provisional sales are adjusted to estimated settlement metals prices based on relevant forward market prices until final settlement with the buyer.
During 2025, revenues from gold and silver sales were $116.7 million from the Gold Bar Mine Complex, $76.0 million from the Fox Complex, $4.8 million from the El Gallo mine, and $225.2 million from the San José mine on a 49% basis. Revenue from the San José mine is not included in our Consolidated Statements of Operations and Comprehensive (Loss) as we use the equity method of accounting for MSC. See Item 7. Management’s Discussion and Analysis of Financial Condition and Results of Operations for additional information regarding production and operating results for our properties, and Item 8. Financial Statements and Supplementary Data, Note 2, Summary of Significant Accounting Policies—Investments and Note 9, Equity Investments for additional information regarding the equity method of accounting.
4
Like all metal producers, our operations are affected by fluctuations in metal prices. The following table presents the annual high, low, and average daily London P.M. Fix prices per ounce for gold and London Fix prices per ounce for silver over the past three years and 2026 to the most recent practical date on the London Bullion Market:
|
|
Gold |
|
Silver |
||||||||||||||
Year |
|
High |
|
Low |
|
Average |
|
High |
|
Low |
|
Average |
||||||
|
|
(in dollars per ounce) |
||||||||||||||||
2023 |
|
$ |
2,078 |
|
|
1,811 |
|
|
1,940 |
|
|
26.03 |
|
|
20.09 |
|
|
23.35 |
2024 |
|
|
2,778 |
|
|
1,985 |
|
|
2,386 |
|
|
34.51 |
|
|
22.08 |
|
|
28.27 |
2025 |
|
|
4,449 |
|
|
2,633 |
|
|
3,431 |
|
|
74.84 |
|
|
29.41 |
|
|
39.99 |
2026 (through March 13, 2026) |
|
|
5,405 |
|
|
4,353 |
|
|
4,930 |
|
|
118.45 |
|
|
71.99 |
|
|
86.87 |
On March 13, 2026, the London P.M. Fix for gold was $5,045 per ounce and the London Fix for silver was $83.70 per ounce.
Processing Methods
At our operations, gold and silver are extracted from mineralized material by either milling or heap leaching depending on, among other things, the amount of gold and silver contained in the material, whether the material is naturally oxidized or not, and the amenability of the material to treatment.
At our Froome mine in Canada, mineralized material from the underground mine is fed to a crushing plant at the mine site and the crushed material is transported to our Stock mill. The final sized product is then leached with cyanide, and gold-cyanide in solution is recovered to activated carbon. The gold is stripped from the carbon and recovered with electrowinning cells, after which the gold is poured into doré bars.
At the Gold Bar mine and the previously operating El Gallo mine, both open pit operations, mineralized material is processed using heap leaching methods. Heap leaching consists of stacking crushed, oxidized material on impermeable pads, where a diluted cyanide solution is applied to the surface of the heap to extract the contained gold and silver content. The gold and silver-bearing solution is then recovered through adsorption onto activated carbon, followed by desorption, electrowinning, retorting and finally smelting into doré bars.
At the San José mine, mineralized material from the underground mine is processed initially using a conventional crushing-grinding-flotation mill. A portion of the flotation concentrate is cyanide leached followed by an electrowinning, which produces a precipitate. This precipitate is then smelted and poured into silver and gold doré bars. The remainder of the concentrate is shipped to third-party smelters for toll processing.
Proven and Probable Mineral Reserves
We had attributable estimated proven and probable gold reserves of 0.3 million ounces of gold at our Gold Bar mine and the San José mine, and 5.2 million ounces of proven and probable silver reserves at the San José mine and 4.7 billion pounds (Blbs) of proven and probable copper reserves at Los Azules at December 31, 2025.
A “mineral reserve” is an estimate of tonnage and grade or quality of measured and indicated mineral resources that, in the opinion of the qualified person, can be the basis of an economically viable project. More specifically, it is the economically mineable part of a measured or indicated mineral resource, which includes diluting materials and allowances for losses that may occur when the material is mined or extracted. The term “economically viable,” as used in the definition of reserve, means that the qualified person has analytically determined that extraction of the mineral reserve is economically viable under reasonable investment and market assumptions.
5
The term “proven reserves” means the economically mineable part of a measured mineral resource and can only result from conversion of a measured mineral resource. The term “probable reserves” means reserves for which quantity and grade are computed from information similar to that used for proven reserves, but the sites for sampling are farther apart or are otherwise less closely spaced. The degree of assurance, although lower than that for proven reserves, is high enough to assume continuity between points of observation. Proven and probable reserves include gold and silver attributable to our ownership or economic interest.
The proven and probable reserve figures presented herein are estimates based on information available at the time of calculation. No assurance can be given that the indicated levels of recovery of gold or silver will be realized. Reserve estimates may require revision based on actual production. Market fluctuations in the price of gold or silver, as well as increased production costs or reduced metallurgical recovery rates, could render certain proven and probable reserves containing higher cost reserves uneconomic to exploit and might result in a reduction of reserves.
Proven and probable reserves are based on extensive drilling, sampling, mine modeling, and metallurgical testing from which we determined economic feasibility. The price sensitivity of reserves depends upon several factors including grade, metallurgical recovery, operating cost, waste-to-ore ratio, and ore type. Metallurgical recovery rates vary depending on the metallurgical properties of each deposit and the production process used.
Proven and probable reserves disclosed at December 31, 2025, and 2024 have been prepared in accordance with Regulation S-K 1300.
The following tables summarize the estimated proven and probable gold, silver and copper reserves attributable to our ownership or economic interest as of December 31, 2025:
|
Gold Reserves at December 31, 2025 |
||||||||||
|
Proven |
|
Probable |
|
Proven and Probable |
||||||
|
Tonnes |
Gold |
Gold |
|
Tonnes |
Gold |
Gold |
|
Tonnes |
Gold |
Gold |
|
(kt) |
(g/t) |
(koz) |
|
(kt) |
(g/t) |
(koz) |
|
(kt) |
(g/t) |
(koz) |
Gold Bar mine (1) |
— |
— |
— |
|
8,624 |
0.61 |
168.0 |
|
8,624 |
0.61 |
168.0 |
San José mine (2) |
494 |
3.72 |
59.1 |
|
358 |
3.69 |
42.5 |
|
852 |
3.71 |
101.6 |
|
Silver Reserves at December 31, 2025 |
||||||||||
|
Proven |
|
Probable |
|
Proven and Probable |
||||||
|
Tonnes |
Silver |
Silver |
|
Tonnes |
Silver |
Silver |
|
Tonnes |
Silver |
Silver |
|
(kt) |
(g/t) |
(Moz) |
|
(kt) |
(g/t) |
(Moz) |
|
(kt) |
(g/t) |
(Moz) |
San José mine (2) |
494 |
199.00 |
3.2 |
|
358 |
175.00 |
2.0 |
|
852 |
189.00 |
5.2 |
|
Copper Reserves at December 31, 2025 |
||||||||||
|
Proven |
|
Probable |
|
Proven and Probable |
||||||
|
Tonnes |
Cu |
Cu |
|
Tonnes |
Cu |
Cu |
|
Tonnes |
Cu |
Cu |
|
(kt) |
(%) |
(Mlbs) |
|
(kt) |
(%) |
(Mlbs) |
|
(kt) |
(%) |
(Mlbs) |
Los Azules (3) |
106,434 |
0.683 |
1,603 |
|
367,239 |
0.386 |
3,127 |
|
473,673 |
0.453 |
4,730 |
| (1) | The reserve estimate for the Gold Bar mine as at December 31, 2025 was prepared by Independent Mining Consultants. |
| (2) | The reserve estimate for the San José mine as at December 31, 2025, presented on a 49% basis, was prepared by Hochschild and audited by P&E Mining Consultants Inc. (“P&E”). |
| (3) | The reserve estimate for Los Azules as at December 31, 2025, presented on a 46.3%, was prepared by AGP Mining Consultants. |
6
The following tables summarize the estimated proven and probable gold and silver reserves attributable to our ownership or economic interest as of December 31, 2024:
|
Gold Reserves at December 31, 2024 |
||||||||||
|
Proven |
|
Probable |
|
Proven and Probable |
||||||
|
Tonnes |
Gold |
Gold |
|
Tonnes |
Gold |
Gold |
|
Tonnes |
Gold |
Gold |
|
(kt) |
(g/t) |
(koz) |
|
(kt) |
(g/t) |
(koz) |
|
(kt) |
(g/t) |
(koz) |
Gold Bar mine (1) |
— |
— |
— |
|
10,852 |
0.64 |
222.0 |
|
10,852 |
0.64 |
222.0 |
San José mine (2) |
343 |
4.72 |
52.1 |
|
215 |
5.50 |
38.0 |
|
558 |
5.02 |
90.1 |
|
Silver Reserves at December 31, 2024 |
||||||||||
|
Proven |
|
Probable |
|
Proven and Probable |
||||||
|
Tonnes |
Silver |
Silver |
|
Tonnes |
Silver |
Silver |
|
Tonnes |
Silver |
Silver |
|
(kt) |
(g/t) |
(Moz) |
|
(kt) |
(g/t) |
(Moz) |
|
(kt) |
(g/t) |
(Moz) |
San José mine (2) |
343 |
295.00 |
3.3 |
|
215 |
272.00 |
1.9 |
|
558 |
286.00 |
5.1 |
|
Copper Reserves at December 31, 2024 |
||||||||||
|
Proven |
|
Probable |
|
Proven and Probable |
||||||
|
Tonnes |
Cu |
Cu |
|
Tonnes |
Cu |
Cu |
|
Tonnes |
Cu |
Cu |
|
(kt) |
(%) |
(Mlbs) |
|
(kt) |
(%) |
(Mlbs) |
|
(kt) |
(%) |
(Mlbs) |
Los Azules |
— |
— |
— |
|
— |
— |
— |
|
— |
— |
— |
| (1) | The reserve estimate for the Gold Bar mine Complex as at December 31, 2024, was prepared by Independent Mining Consultants. |
| (2) | The reserve estimate for the San José mine as at December 31, 2024, presented on a 49% basis, was prepared by Hochschild and audited by P&E. |
The following table is a variance of the mineral reserves from December 31, 2024 to December 31, 2025:
|
Gold Reserves |
||||||||||
|
Proven |
|
Probable |
|
Proven and Probable |
||||||
|
Mass % |
Au Grade % |
Metal % |
|
Mass % |
Au Grade % |
Metal % |
|
Mass % |
Au Grade % |
Metal % |
Gold Bar mine |
— |
— |
— |
|
(21) |
(5) |
(24) |
|
(21) |
(5) |
(24) |
San José mine |
44 |
(21) |
14 |
|
67 |
(33) |
12 |
|
53 |
(26) |
13 |
|
Silver Reserves |
||||||||||
|
Proven |
|
Probable |
|
Proven and Probable |
||||||
|
Mass % |
Ag Grade % |
Metal % |
|
Mass % |
Ag Grade % |
Metal % |
|
Mass % |
Ag Grade % |
Metal % |
San José mine |
44 |
(33) |
(3) |
|
67 |
(36) |
5 |
|
53 |
(34) |
2.0 |
|
Copper Reserves |
||||||||||
|
Proven |
|
Probable |
|
Proven and Probable |
||||||
|
Mass % |
Ag Grade % |
Metal % |
|
Mass % |
Ag Grade % |
Metal % |
|
Mass % |
Ag Grade % |
Metal % |
|
(kt) |
(%) |
(Mlbs) |
|
(kt) |
(%) |
(Mlbs) |
|
(kt) |
(%) |
(Mlbs) |
Los Azules (1) |
— |
— |
— |
|
— |
— |
— |
|
— |
— |
— |
| (1) | A mineral reserve estimate for Los Azules was not reported as at December 31, 2024. |
7
Notes to the 2025 Mineral Reserve tables
Gold Bar mine
Mineral reserves equal the total ore planned for processing from the mine plan based on a $2,750/oz gold price. Mineral reserves are based on the following economic input parameters: $6.17 per average ore tonne mining cost, $4.67 per average waste tonne mining cost, $5.41 per ore tonne crushed process cost, $2.57 per average ore tonne run-of-mine (“ROM”) process cost, $4.24 per average ore tonne general and administrative (“G&A”) cost, $0.475/oz gold refining charge, $1.538/oz transport & sales cost, 99.95% payable gold, a 1% royalty at Gold Bar South and Hunter and a 2% royalty at Cabin. Hunter and Cabin are not included within the stated Reserve Estimate.
The stated mineral reserves are based on a variable cut-off grade (“COG”) based on rock type, mining area, carbon content, clay content and process response. The grades reported from Pick, Ridge and Gold Bar South block models includes adequate mining dilution allowance within the block estimate; therefore, no additional mining dilution was applied. Mineral reserves are contained within an engineered pit design based on the end of December 2025 topography.
The metal price used $2,750/oz for mineral reserves reflects a conservative combination of a recent trailing average sourced from Kitco’s Historic Price data and a consensus forecast via Bloomberg. Recoveries are variable and as follows: 86% crushed oxide recovery at Pick, 90% at Cabin and 78% at Ridge, 50% mid-carbon recovery at Pick, Ridge and Cabin, 79% ROM oxide recovery at Pick, 72% at Ridge, 75% at GBS, 0% ROM mid-carbon recovery. COGs are variable and based on the presence or not of clay content, carbon content and recoveries and range from 0.09 g/t (0.0027 o/t) to 0.71 g/t 0.0206 o/t. The reference point for the mineral reserves is at the primary crusher.
The following changes have impacted mineral reserves during 2025: mining depletion at Pick and Gold Bar South; operating costs increased largely driven by an increase in mining costs; revised interpretation of the mineralization and geological model, an increase to the reserve metal price, project costs were re-estimated based on current mining activity, current contractor quotes and updated engineered pit designs.
San José mine
Mineral reserves are reported at McEwen’s 49% attributable interest. Hochschild hold a 51% interest in San José.
COG is reported in silver equivalent grams per tonne, calculated using a ratio of 83:1 Ag:Au. For mineral reserves, the silver equivalent COG is: cut & fill 192 g/t silver equivalent, long hole 176 g/t silver equivalent.
Mineral reserves as presented are in place and include average internal dilution of 31%, average mining and geotechnical dilution of 50%, and mine extraction of 45%, but do not include allowances for mill or smelter recoveries. For the 2025 mineral reserves estimate, inaccessible mineral resources that contained insufficient tonnages to permit the development of local infrastructure, mineral resources in mined out/isolated areas, mineral resources located in sill and rib pillars and operationally lost mineral resources were not included in the mineral reserves estimate.
The December 31, 2025 mineral reserves estimate was based on a gold price of $2,750/oz and a silver price of $31/oz. P&E determined that these metal prices are suitable to be utilized for mineral reserve estimation since they are based on recognized consensus forecast metal prices.
Ongoing definition, delineation and mine exploration drilling will lead to better definition of existing resources or extensions of known veins that will be reflected on the year-on-year comparison of both mineral reserves. Mine depletion, commodity price changes and equivalents leading to cut-off grade changes will also have an effect on the comparative data.
Los Azules
Mineral reserves are reported at McEwen’s 46.3% attributable interest. Only Mineral Resources that were classified as Measured and Indicated were given economic attributes in the mine design and when demonstrating economic viability.
8
Cut-off is variable and ranges from $4.79/t NSR to $7.23/t NSR. Mineral Reserves incorporate appropriate mining dilution and mining recovery estimations for the open pit mining method. The reference point at which the Mineral Reserves are defined is the point where the ore is delivered to the processing plant and include diluting materials and allowances for mine losses, which occur when the material is mined.
The December 31, 2025 mineral reserves estimate was based on a copper price of $4.25/lb of copper. McEwen Copper determined that the metal price is suitable to be utilized for mineral reserve estimation since it is based on recognized consensus forecast metal prices. Copper recovery varies by lithology. Mining costs vary by bench with a minimum of $2.142/t and a maximum of $4.113/t. Processing costs are variable and range from $3.183/t to $5.620/t leached. The processing costs include: $1.607/t G&A, $0.433/t leached sustaining capital, and $0.15/t leached closure cost. Copper cathode sales cost is $0.02/lb Cu. Copper cathode was assumed to be sold FOB the mine site.
Measured, Indicated, and Inferred Mineral Resources
We had attributable estimated measured and indicated mineral resources of 3.93 million ounces of gold, 35.1 million ounces of silver, and 1.1 million tonnes (or 2.52 billion pounds) of copper at December 31, 2025. We had attributable estimated inferred mineral resources of 3.86 million ounces of gold, 79.1 million ounces of silver, and 4.2 million tonnes (or 9.3 billion pounds) of copper at December 31, 2025.
The measured, indicated, and inferred resource figures presented herein are estimates based on information available at the time of calculation and are exclusive of reserves. A “mineral resource” is a concentration or occurrence of solid material of economic interest in or on the Earth’s crust in such form, grade, or quality and quantity that there are reasonable prospects for eventual economic extraction. The location, quantity, grade or quality, continuity and other geological characteristics of a mineral resource are known, estimated or interpreted from specific geological evidence and knowledge, including sampling. The reference point for mineral resources is in situ. Mineral resources are sub-divided, in order of increasing geological confidence, into inferred, indicated and measured categories. Ounces of gold and silver or pounds of copper included in the measured, indicated and inferred resources are those contained prior to losses during metallurgical treatment. The terms "measured resource," "indicated resource," and "inferred resource" mean that part of a mineral resource for which quantity and grade or quality are estimated on the basis of geological evidence and sampling that is considered to be comprehensive, adequate, or limited, respectively. We publish measured, indicated and inferred resources annually, considering metal prices, changes, if any, to future production and capital costs, divestments and depletion as well as any acquisitions and additions. Measured, indicated, and inferred resources disclosed at December 31, 2025, have been prepared in accordance with Regulation S-K 1300 requirements of the SEC.
The following tables summarize measured, indicated and inferred resources, exclusive of reserves attributable to our ownership or economic interest, by operating segment, as of December 31, 2025, and December 31, 2024:
Canada
Mineral resources, exclusive of reserves, as at December 31, 2025:
Gold |
Measured |
Indicated |
Measured & Indicated |
Inferred |
|
|
||||||||
|
Tonnes (000s) |
Au Grade (g/t) |
Contained Au (000s oz) |
Tonnes (000s) |
Au Grade (g/t) |
Contained Au (000s oz) |
Tonnes (000s) |
Au Grade (g/t) |
Contained Au (000s oz) |
Tonnes (000s) |
Au Grade (g/t) |
Contained Au (000s oz) |
COG Au (g/t) |
Met Rec (%) |
Froome mine |
212 |
2.45 |
17 |
440 |
2.94 |
42 |
651 |
2.78 |
58 |
302 |
2.93 |
28 |
1.35 |
89.5 |
Grey Fox (1) |
— |
— |
— |
19,474 |
3.02 |
1,892 |
19,474 |
3.02 |
1,892 |
5,101 |
2.66 |
436 |
0.4 / 1.35 (1) |
90 |
Stock West & Main |
— |
— |
— |
3,179 |
2.63 |
268 |
3,179 |
2.63 |
268 |
2,468 |
2.31 |
184 |
1.30 |
93 |
Fuller |
— |
— |
— |
1,552 |
3.86 |
193 |
1,552 |
3.86 |
193 |
970 |
2.93 |
91 |
1.95 |
88 |
Stock East |
— |
— |
— |
1,790 |
2.12 |
122 |
1,790 |
2.12 |
122 |
1,350 |
2.02 |
87 |
1.30 |
93 |
Black Fox |
244 |
3.59 |
28 |
141 |
3.54 |
16 |
385 |
3.57 |
44 |
385 |
2.90 |
36 |
1.35 |
95 |
Davidson Tisdale |
223 |
6.87 |
49 |
69 |
6.70 |
15 |
292 |
6.83 |
64 |
133 |
4.01 |
17 |
1.85 |
92 |
Total |
679 |
4.31 |
94 |
26,645 |
2.97 |
2,548 |
27,323 |
3.01 |
2,641 |
10,709 |
2.55 |
879 |
|
|
| (1) | The cut-off grade for the open pit portion of the resource was 0.4 g/t and for the underground portion was 1.35 g/t. |
9
Mineral resources, exclusive of reserves, as at December 31, 2024:
Gold |
Measured |
Indicated |
Measured & Indicated |
Inferred |
|
|
||||||||
|
Tonnes (000s) |
Au Grade (g/t) |
Contained Au (000s oz) |
Tonnes (000s) |
Au Grade (g/t) |
Contained Au (000s oz) |
Tonnes (000s) |
Au Grade (g/t) |
Contained Au (000s oz) |
Tonnes (000s) |
Au Grade (g/t) |
Contained Au (000s oz) |
COG Au (g/t) |
Met Rec (%) |
Froome mine |
241 |
3.44 |
27 |
259 |
3.62 |
30 |
500 |
3.53 |
57 |
168 |
3.51 |
19 |
2.05 |
90 |
Grey Fox |
— |
— |
— |
13,135 |
3.64 |
1,538 |
13,135 |
3.64 |
1,538 |
4,319 |
3.30 |
458 |
1.60 |
90 |
Stock West & Main |
— |
— |
— |
1,938 |
3.31 |
206 |
1,938 |
3.31 |
206 |
1,386 |
2.96 |
132 |
1.95 |
93 |
Fuller |
— |
— |
— |
1,552 |
3.86 |
193 |
1,552 |
3.86 |
193 |
970 |
2.93 |
91 |
1.95 |
88 |
Stock East |
— |
— |
— |
866 |
2.70 |
75 |
866 |
2.70 |
75 |
579 |
2.66 |
50 |
1.95 |
93 |
Black Fox |
189 |
4.61 |
28 |
100 |
4.38 |
14 |
288 |
4.53 |
42 |
225 |
3.93 |
28 |
2.00 |
95 |
Davidson Tisdale |
223 |
6.87 |
49 |
69 |
6.70 |
15 |
292 |
6.83 |
64 |
133 |
4.01 |
17 |
1.85 |
92 |
Total |
653 |
4.95 |
104 |
17,919 |
3.59 |
2,071 |
18,571 |
3.64 |
2,175 |
7,780 |
3.18 |
795 |
|
|
United States
Mineral resources, exclusive of reserves, as at December 31, 2025:
Gold |
Measured |
Indicated |
Measured & Indicated |
Inferred |
|
|
||||||||
|
Tonnes (000s) |
Au Grade (g/t) |
Contained Au (000s oz) |
Tonnes (000s) |
Au Grade (g/t) |
Contained Au (000s oz) |
Tonnes (000s) |
Au Grade (g/t) |
Contained Au (000s oz) |
Tonnes (000s) |
Au Grade (g/t) |
Contained Au (000s oz) |
COG Au (g/t) |
Met Rec (%) |
Gold Bar mine |
— |
— |
— |
9,630 |
0.52 |
162.2 |
9,630 |
0.52 |
162.2 |
1,368 |
0.43 |
19.0 |
0.09 - 0.71 |
var (1) |
Lookout Mountain |
— |
— |
— |
19,570 |
0.64 |
402.3 |
19,570 |
0.64 |
402.3 |
7,292 |
0.57 |
134.2 |
0.17 - 1.71 |
75-78 |
Total |
— |
— |
— |
29,200 |
0.60 |
565 |
29,200 |
0.60 |
565 |
8,660 |
0.55 |
153 |
|
|
| (1) | 86% crushed oxide recovery at Pick & Cabin and 78% at Ridge, 50% mid-carbon recovery at Pick, Ridge, and Cabin, 79% ROM oxide recovery at Pick & Cabin and 72% at Ridge, 75% at GBS Hunter, 0% ROM mid-carbon recovery. |
Mineral resources, exclusive of reserves, as at December 31, 2024:
Gold |
Measured |
Indicated |
Measured & Indicated |
Inferred |
|
|
||||||||
|
Tonnes (000s) |
Au Grade (g/t) |
Contained Au (000s oz) |
Tonnes (000s) |
Au Grade (g/t) |
Contained Au (000s oz) |
Tonnes (000s) |
Au Grade (g/t) |
Contained Au (000s oz) |
Tonnes (000s) |
Au Grade (g/t) |
Contained Au (000s oz) |
COG Au (g/t) |
Met Rec (%) |
Gold Bar mine |
— |
— |
— |
4,368 |
0.68 |
95.9 |
4,368 |
0.68 |
95.9 |
420 |
0.59 |
7.9 |
0.15 - 0.91 |
var (1) |
Lookout Mountain |
— |
— |
— |
— |
— |
— |
— |
— |
— |
— |
— |
— |
— |
— |
Total |
— |
— |
— |
4,368 |
0.68 |
95.9 |
4,368 |
0.68 |
95.9 |
420 |
0.59 |
7.9 |
|
|
| (1) | 86% crushed oxide recovery at Pick & Cabin and 78% at Ridge, 0% mid-carbon recovery at Pick, Ridge, and Cabin, 79% ROM oxide recovery at Pick & Cabin and 72% at Ridge, 61% ROM oxide recovery at Gold Bar South & Hunter, and 0% ROM mid-carbon recovery. |
10
Mexico
Mineral resources, exclusive of reserves, as at December 31, 2025:
Gold |
Measured |
Indicated |
Measured & Indicated |
Inferred |
|
|
||||||||
|
Tonnes (000s) |
Au Grade (g/t) |
Contained Au (000s oz) |
Tonnes (000s) |
Au Grade (g/t) |
Contained Au (000s oz) |
Tonnes (000s) |
Au Grade (g/t) |
Contained Au (000s oz) |
Tonnes (000s) |
Au Grade (g/t) |
Contained Au (000s oz) |
COG |
Met Rec (%) |
El Gallo |
9,000 |
0.51 |
148.0 |
5,700 |
0.27 |
50.0 |
14,700 |
0.42 |
199.0 |
300 |
0.41 |
4.0 |
var (1) |
var (2) |
Total |
9,000 |
0.51 |
148.0 |
5,700 |
0.27 |
50.0 |
14,700 |
0.42 |
199.0 |
300 |
0.41 |
4.0 |
|
|
|
|
|
|
|
|
|
|
|
|
|
|
|
|
|
Silver |
Tonnes (000s) |
Ag Grade (g/t) |
Contained Ag (Moz) |
Tonnes (000s) |
Ag Grade (g/t) |
Contained Ag (Moz) |
Tonnes (000s) |
Ag Grade (g/t) |
Contained Ag (Moz) |
Tonnes (000s) |
Ag Grade (g/t) |
Contained Ag (Moz) |
COG |
Met Rec (%) |
El Gallo |
9,000 |
19.00 |
5.6 |
5,700 |
79.00 |
14.5 |
14,700 |
42.00 |
20.0 |
300 |
33.00 |
0.3 |
var (1) |
var (2) |
Total |
9,000 |
19.00 |
5.6 |
5,700 |
79.00 |
14.5 |
14,700 |
42.00 |
20.0 |
300 |
33.00 |
0.3 |
|
|
| (1) | The El Gallo mine’s HLM has no COG as the entire heap is processed with zero selectivity. El Gallo Silver’s COG is 58 g/t Ag. |
| (2) | The El Gallo mine’s HLM recoveries are 85% Au and 60% Ag. El Gallo Silver’s recoveries are 86% Au and 75% Ag. |
Mineral resources, exclusive of reserves, as at December 31, 2024:
Gold |
Measured |
Indicated |
Measured & Indicated |
Inferred |
|
|
||||||||
|
Tonnes (000s) |
Au Grade (g/t) |
Contained Au (000s oz) |
Tonnes (000s) |
Au Grade (g/t) |
Contained Au (000s oz) |
Tonnes (000s) |
Au Grade (g/t) |
Contained Au (000s oz) |
Tonnes (000s) |
Au Grade (g/t) |
Contained Au (000s oz) |
COG |
Met Rec (%) |
El Gallo |
9,000 |
0.51 |
148.0 |
5,700 |
0.27 |
50.0 |
14,700 |
0.42 |
199.0 |
300 |
0.41 |
4.0 |
var (1) |
var (2) |
Total |
9,000 |
0.51 |
148.0 |
5,700 |
0.27 |
50.0 |
14,700 |
0.42 |
199.0 |
300 |
0.41 |
4.0 |
|
|
|
|
|
|
|
|
|
|
|
|
|
|
|
|
|
Silver |
Tonnes (000s) |
Ag Grade (g/t) |
Contained Ag (Moz) |
Tonnes (000s) |
Ag Grade (g/t) |
Contained Ag (Moz) |
Tonnes (000s) |
Ag Grade (g/t) |
Contained Ag (Moz) |
Tonnes (000s) |
Ag Grade (g/t) |
Contained Ag (Moz) |
COG |
Met Rec (%) |
El Gallo |
9,000 |
19.00 |
5.6 |
5,700 |
79.00 |
14.5 |
14,700 |
42.00 |
20.0 |
300 |
33.00 |
0.3 |
var (1) |
var (2) |
Total |
9,000 |
19.00 |
5.6 |
5,700 |
79.00 |
15.0 |
14,700 |
42.00 |
20.0 |
300 |
33.00 |
0.3 |
|
|
| (1) | The El Gallo mine’s HLM has no COG as the entire heap is processed with zero selectivity. El Gallo Silver’s COG is 58 g/t Ag. |
| (2) | The El Gallo mine’s HLM recoveries are 85% Au and 60% Ag. El Gallo Silver’s recoveries are 86% Au and 75% Ag. |
MSC
Mineral resources, exclusive of reserves, as at December 31, 2025:
Gold |
Measured |
Indicated |
Measured & Indicated |
Inferred |
|
|
||||||||
|
Tonnes (000s) |
Au Grade (g/t) |
Contained Au (000s oz) |
Tonnes (000s) |
Au Grade (g/t) |
Contained Au (000s oz) |
Tonnes (000s) |
Au Grade (g/t) |
Contained Au (000s oz) |
Tonnes (000s) |
Au Grade (g/t) |
Contained Au (000s oz) |
COG AgEq (g/t) |
Met Rec (%) |
San José (49% attrib.) |
270 |
2.93 |
25.5 |
203 |
1.93 |
12.6 |
473 |
2.50 |
38.0 |
1,306 |
3.81 |
160.0 |
186.00 |
90 |
Total |
270 |
2.93 |
25.5 |
203 |
1.93 |
12.6 |
473 |
2.50 |
38.0 |
1,306 |
3.81 |
160.0 |
|
|
|
|
|
|
|
|
|
|
|
|
|
|
|
|
|
Silver |
Tonnes (000s) |
Ag Grade (g/t) |
Contained Ag (Moz) |
Tonnes (000s) |
Ag Grade (g/t) |
Contained Ag (Moz) |
Tonnes (000s) |
Ag Grade (g/t) |
Contained Ag (Moz) |
Tonnes (000s) |
Ag Grade (g/t) |
Contained Ag (Moz) |
COG AgEq (g/t) |
Met Rec (%) |
San José (49% attrib.) |
270 |
202.00 |
1.8 |
203 |
126.00 |
0.8 |
473 |
169.00 |
2.6 |
1,306 |
222.00 |
9.3 |
186.00 |
90 |
Total |
270 |
202.00 |
1.8 |
203 |
126.00 |
0.8 |
473 |
169.00 |
2.6 |
1,306 |
222.00 |
9.3 |
|
|
11
Mineral resources, exclusive of reserves, as at December 31, 2024:
Gold |
Measured |
Indicated |
Measured & Indicated |
Inferred |
|
|
||||||||
|
Tonnes (000s) |
Au Grade (g/t) |
Contained Au (000s oz) |
Tonnes (000s) |
Au Grade (g/t) |
Contained Au (000s oz) |
Tonnes (000s) |
Au Grade (g/t) |
Contained Au (000s oz) |
Tonnes (000s) |
Au Grade (g/t) |
Contained Au (000s oz) |
COG AgEq (g/t) |
Met Rec (%) |
San José (49% attrib.) |
283 |
3.65 |
33.2 |
296 |
3.43 |
32.7 |
580 |
3.54 |
66.0 |
1,119 |
4.59 |
165.2 |
217.00 |
90 |
Total |
283 |
3.65 |
33.2 |
296 |
3.44 |
32.7 |
580 |
3.54 |
66.0 |
1,119 |
4.59 |
165.2 |
|
|
|
|
|
|
|
|
|
|
|
|
|
|
|
|
|
Silver |
Tonnes (000s) |
Ag Grade (g/t) |
Contained Ag (Moz) |
Tonnes (000s) |
Ag Grade (g/t) |
Contained Ag (Moz) |
Tonnes (000s) |
Ag Grade (g/t) |
Contained Ag (Moz) |
Tonnes (000s) |
Ag Grade (g/t) |
Contained Ag (Moz) |
COG AgEq (g/t) |
Met Rec (%) |
San José (49% attrib.) |
283 |
181.00 |
1.6 |
296 |
120.00 |
1.1 |
580 |
150.00 |
2.8 |
1,119 |
252.00 |
9.1 |
217.00 |
90 |
Total |
283 |
181.00 |
1.6 |
296 |
120.00 |
1.1 |
580 |
150.00 |
2.8 |
1,119 |
252.00 |
9.1 |
|
|
McEwen Copper
Mineral resources, exclusive of reserves, as at December 31, 2025:
Gold |
Measured |
Indicated |
Measured & Indicated |
Inferred |
|
|
||||||||
|
Tonnes (000s) |
Au Grade (g/t) |
Contained Au (000s oz) |
Tonnes (000s) |
Au Grade (g/t) |
Contained Au (000s oz) |
Tonnes (000s) |
Au Grade (g/t) |
Contained Au (000s oz) |
Tonnes (000s) |
Au Grade (g/t) |
Contained Au (000s oz) |
COG Cu (%) |
Met Rec (%) |
Los Azules (46.3% attrib.) |
4,739 |
0.06 |
8.6 |
325,629 |
0.05 |
473.9 |
330,369 |
0.05 |
482.5 |
1,962,800 |
0.04 |
2,659.4 |
var NSR |
var. |
Total |
4,739 |
0.06 |
8.6 |
325,629 |
0.05 |
473.9 |
330,369 |
0.05 |
482.5 |
1,962,800 |
0.04 |
2,659.4 |
|
|
|
|
|
|
|
|
|
|
|
|
|
|
|
|
|
Silver |
Tonnes (000s) |
Ag Grade (g/t) |
Contained Ag (Moz) |
Tonnes (000s) |
Ag Grade (g/t) |
Contained Ag (Moz) |
Tonnes (000s) |
Ag Grade (g/t) |
Contained Ag (Moz) |
Tonnes (000s) |
Ag Grade (g/t) |
Contained Ag (Moz) |
COG Cu (%) |
Met Rec (%) |
Los Azules (46.3% attrib.) |
4,739 |
1.81 |
0.3 |
325,629 |
1.15 |
12.0 |
330,369 |
0.86 |
12.3 |
1,962,800 |
1.10 |
69.4 |
var NSR |
var. |
Total |
4,739 |
1.81 |
0.3 |
325,629 |
1.15 |
12.0 |
330,369 |
0.86 |
12.3 |
1,962,800 |
1.10 |
69.4 |
|
|
|
|
|
|
|
|
|
|
|
|
|
|
|
|
|
Copper |
Tonnes (000s) |
Cu Grade (%) |
Contained Cu (Blbs) |
Tonnes (000s) |
Cu Grade (%) |
Contained Cu (Blbs) |
Tonnes (000s) |
Cu Grade (%) |
Contained Cu (Blbs) |
Tonnes (000s) |
Cu Grade (%) |
Contained Cu (Blbs) |
COG Cu (%) |
Met Rec (%) |
Los Azules (46.3% attrib.) |
6,389 |
0.16 |
0.02 |
440,619 |
0.26 |
2.5 |
447,007 |
0.26 |
2.5 |
1,962,800 |
0.21 |
9.2 |
var NSR |
var. |
Total |
6,389 |
0.16 |
0.02 |
440,619 |
0.26 |
2.5 |
447,007 |
0.26 |
2.5 |
1,962,800 |
0.21 |
9.2 |
|
|
Mineral resources, exclusive of reserves, as at December 31, 2024:
Gold |
Measured |
Indicated |
Measured & Indicated |
Inferred |
|
|
||||||||
|
Tonnes (000s) |
Au Grade (g/t) |
Contained Au (000s oz) |
Tonnes (000s) |
Au Grade (g/t) |
Contained Au (000s oz) |
Tonnes (000s) |
Au Grade (g/t) |
Contained Au (000s oz) |
Tonnes (000s) |
Au Grade (g/t) |
Contained Au (000s oz) |
COG Cu (%) |
Met Rec (%) |
Los Azules (46.4% attrib.) |
— |
— |
— |
135,070 |
0.05 |
208.8 |
135,070 |
0.05 |
208.8 |
1,769,500 |
0.03 |
1,967.4 |
var NSR |
var. |
Total |
— |
— |
— |
135,070 |
0.05 |
208.8 |
135,070 |
0.05 |
208.8 |
1,769,500 |
0.03 |
1,967.4 |
|
|
|
|
|
|
|
|
|
|
|
|
|
|
|
|
|
Silver |
Tonnes (000s) |
Ag Grade (g/t) |
Contained Ag (Moz) |
Tonnes (000s) |
Ag Grade (g/t) |
Contained Ag (Moz) |
Tonnes (000s) |
Ag Grade (g/t) |
Contained Ag (Moz) |
Tonnes (000s) |
Ag Grade (g/t) |
Contained Ag (Moz) |
COG Cu (%) |
Met Rec (%) |
Los Azules (46.4% attrib.) |
— |
— |
— |
135,070 |
1.07 |
4.6 |
135,070 |
1.07 |
4.6 |
1,769,500 |
1.22 |
69.2 |
var NSR |
var. |
Total |
— |
— |
— |
135,070 |
1.07 |
4.6 |
135,070 |
1.07 |
4.6 |
1,769,500 |
1.22 |
69.2 |
|
|
|
|
|
|
|
|
|
|
|
|
|
|
|
|
|
Copper |
Tonnes (000s) |
Cu Grade (%) |
Contained Cu (Blbs) |
Tonnes (000s) |
Cu Grade (%) |
Contained Cu (Blbs) |
Tonnes (000s) |
Cu Grade (%) |
Contained Cu (Blbs) |
Tonnes (000s) |
Cu Grade (%) |
Contained Cu (Blbs) |
COG Cu (%) |
Met Rec (%) |
Los Azules (46.4% attrib.) |
— |
— |
— |
573,179 |
0.40 |
5.1 |
573,179 |
0.40 |
5.1 |
2,092,315 |
0.27 |
12.4 |
var NSR |
var. |
Total |
— |
— |
— |
573,179 |
0.40 |
5.1 |
573,179 |
0.40 |
5.1 |
2,092,315 |
0.27 |
12.4 |
|
|
12
The following table is a variance of the mineral resources from December 31, 2024 to December 31, 2025:
Property |
Measured |
Indicated |
Measured & Indicated |
Inferred |
||||||||
|
Mass % |
Grade % |
Metal % |
Mass % |
Grade % |
Metal % |
Mass % |
Grade % |
Metal % |
Mass % |
Grade % |
Metal % |
Froome mine |
(12.03) |
(28.78) |
(37.04) |
69.88 |
(18.78) |
40.00 |
30.20 |
(21.25) |
1.75 |
79.76 |
(16.52) |
47.37 |
Grey Fox |
— |
— |
— |
48.26 |
(17.03) |
23.02 |
48.26 |
(17.03) |
23.02 |
18.11 |
(19.39) |
(4.80) |
Stock West & Main |
— |
— |
— |
64.04 |
(20.54) |
30.10 |
64.04 |
(20.54) |
30.10 |
78.07 |
(21.96) |
39.39 |
Fuller |
— |
— |
— |
— |
— |
— |
— |
— |
— |
— |
— |
— |
Stock East |
— |
— |
— |
106.70 |
(21.48) |
62.67 |
106.70 |
(21.48) |
62.67 |
133.16 |
(24.06) |
74.00 |
Gold Bar mine |
— |
— |
— |
120.47 |
(23.53) |
69.13 |
120.47 |
(23.53) |
69.13 |
225.71 |
(27.12) |
140.51 |
Lookout Mountain |
— |
— |
— |
— |
— |
— |
— |
— |
— |
— |
— |
— |
El Gallo (Gold) |
— |
— |
— |
— |
— |
— |
— |
— |
— |
— |
— |
— |
El Gallo (Silver) |
— |
— |
— |
— |
— |
— |
— |
— |
— |
— |
— |
— |
San José mine (Gold) |
(4.59) |
(19.73) |
(23.28) |
(31.42) |
(43.73) |
(61.46) |
(18.45) |
(29.38) |
(42.40) |
16.71 |
(16.99) |
(3.12) |
San José mine (Silver) |
(4.59) |
11.60 |
12.50 |
(31.42) |
5.00 |
(27.27) |
(18.45) |
12.67 |
(7.14) |
16.71 |
(11.90) |
2.20 |
Los Azules (Gold) |
— |
— |
— |
141.08 |
(5.86) |
126.96 |
144.59 |
(5.53) |
131.06 |
10.92 |
21.87 |
35.18 |
Los Azules (Silver) |
— |
— |
— |
141.08 |
7.54 |
159.25 |
144.59 |
(19.59) |
165.20 |
10.92 |
(9.53) |
0.35 |
Los Azules (Copper) |
— |
— |
— |
(23.13) |
(36.36) |
(50.87) |
(22.01) |
(36.70) |
(50.43) |
(6.19) |
(20.47) |
(25.39) |
Others |
13.35 |
(11.80) |
— |
24.26 |
(14.00) |
6.90 |
16.72 |
(12.70) |
1.89 |
44.69 |
(18.60) |
17.78 |
Notes to the 2025 Mineral Resource tables
Mineral resources are not mineral reserves and do not have demonstrated economic viability. There is no certainty that any part of the mineral resources estimated will be converted into a mineral reserve estimate. The numbers in the tables have been rounded to reflect the accuracy of the estimates and may not sum due to rounding. The inferred mineral resource in these estimates has a lower level of confidence than that applied to an indicated mineral resource and must not be converted to a mineral reserve. It is reasonably expected that the majority of the inferred mineral resource could be upgraded to an indicated mineral resource with continued exploration.
Underground mineral resources include the ‘must take’ minor material below cut-off grade within the potentially mineable shape optimizer stopes that are generated by above-cut-off grade blocks.
Canada
Mineral resources for the Froome mine are reported above an economic cut-off grade of 1.35 g/t gold assuming underground extraction methods and based on a mining cost of C$84.59/t, milling cost of C$43.48/t, G&A cost of C$21.70/t, metallurgical recovery of 89.5%, royalty of C$9.72/t, dilution of 15%, and gold price of $3,000/oz.
Mineral resources for Grey Fox are reported for underground extraction methods above an economic cut-off grade of 1.35 g/t gold based on a mining cost of C$91.42/t, milling cost of C$41.54/t, G&A cost of C$22.41/t, metallurgical recovery of 90%, variable NSR royalties of c.2.45%, dilution of 15%, and gold price of $3,000/oz. Open pit mineral resources for Grey Fox are reported above an economic cut-off grade of 0.4g/t gold based on a mining cost of U$3.38/t, milling cost of U$31.16/t, metallurgical recovery of 90%, variable NSR royalties of c.2.45%, dilution of 8%, and gold price of $3,000/oz.
Mineral resources for the Stock project (West and Main zones) are reported above an economic cut-off grade of 1.30 g/t gold assuming underground extraction methods and based on a mining cost of C$84.59/t, milling cost of C$43.48/t, G&A cost of C$27.67/t, metallurgical recovery of 93%, dilution of 15%, and gold price of $3,000/oz.
Mineral resources for Fuller are reported above an economic cut-off grade of 1.95 g/t gold assuming underground extraction methods and based on a mining cost of C$99.9/t, milling cost of C$34.62/t, G&A cost of C$11.65/t, metallurgical recovery of 88%, 10% Net Profits Interest royalty, dilution of 15% and gold price of $2,000/oz.
Mineral resources for Davidson Tisdale are reported above an economic cut-off grade of 1.85 g/t gold assuming underground extraction methods and based on a mining cost of C$99.9/t, milling cost of C$33.60/t, G&A cost of C$11.65/t, metallurgical recovery of 92%, dilution of 15% and gold price of $2,000/oz.
Mineral resources for Black Fox are reported above an economic cut-off grade of 1.35 g/t gold assuming underground extraction methods and based on a mining cost of C$84.59/t, milling cost of C$43.48/t, G&A cost of C$27.67/t, metallurgical recovery of 95%, dilution of 15% and gold price of $3,000/oz.
13
Mineral resources for the Stock project (East zone) are reported above an economic cut-off grade of 1.30 g/t gold assuming underground extraction methods and based on a mining cost of C$84.59/t, milling cost of C$43.48/t, G&A cost of C$27.67/t, metallurgical recovery of 93%, and gold price of $3,000/oz.
The gold price used in estimating mineral resources of $3,000 was based on a combination of the trailing average from 2022 to 2025 and long-term consensus pricing forecasts for 2026 and 2027. Resources are stated as in-situ. In addition, underground constraining shapes were used to better define reasonable prospects for eventual economic extraction. The Froome and Black Fox mines, the Stock project, and Grey Fox mineral resources used improvements to modeling and estimation methodology and updates based on drilling and chip sampling results. The Froome and Black Fox mines also included changes due to mining depletion. Davidson Tisdale and Fuller estimates remained as last year with no updates.
United States
Mineral resources for the Gold Bar mine are based on the following economic input parameters: $6.17 per average ore tonne mining cost, $4.67 per average waste tonne mining cost, $5.41 per ore tonne crushed process cost, $2.57 per average ore tonne run-of-mine (“ROM”) process cost, $4.24 per average ore tonne general and administrative (“G&A”) cost, $0.475/oz gold refining charge, $1.538/oz transport & sales cost, 99.95% payable gold, a 1% royalty (Gold Bar South and Hunter) and a 2% royalty at Cabin. Mineral resources stated are contained within a $3,000/oz gold sales price Lerchs-Grossmann pits based on end of December 2025 topography.
The gold price used in estimating mineral resources of $3,000 was based on the trailing average from 2022 to 2025 and long-term consensus pricing forecasts for 2026 and 2027. Resources are reported as in-situ. Recoveries are variable and as follows: 86% crushed oxide recovery at Pick, 90% at Cabin and 78% at Ridge, 50% mid-carbon recovery at Pick, Ridge and Cabin, 79% ROM oxide recovery at Pick, 90% at Cabin, 72% at Ridge, 75% at GBS & Hunter, 0% ROM mid-carbon recovery. Cut-off grades are variable and based on the presence or not of clay content, carbon content and recoveries.
Changes in mineral resources are due to mining depletion during 2025 at Pick and Gold Bar South, updated metal price, and updated block models at Pick based on new drilling results. The following changes have impacted the project mineral resources: operating costs increase largely driven by an increase in mining costs; project costs were re-estimated based on current mining activity and new contractor quotes; an update to the mining schedule based on the costs.
Mineral resources for Lookout Mountain are reported above economic cut-off grades of 0.17 g/t (0.005 o/t) for oxide and 1.71 g/t (0.050 o/t) for unoxidized material assuming open pit extraction methods and based on an ore mining cost of $4.29/tonne, waste mining cost of $3.10/tonne, processing costs of $5.43/tonne (oxide), toll milling costs $22.05/tonne (unoxidized), G&A cost of $4.41/tonne, refining cost of $0.48/oz, NSR royalty of 4%, metallurgical recovery of 78% (leached oxide) 75% (unoxidized toll milling) and gold price of $3,000/oz.
Mexico
Gold and silver mineral resources were calculated using metal prices of $1,300/oz and $16/oz, respectively. These prices were based off the 3-year trailing average of the London Closing Fix for 2017 to 2019 ($1,306/oz and $16.32/oz) sourced from Kitco’s Historical Data charts.
Mineral resources are stated as in situ for El Gallo Silver, and as crushed and stacked, ready for hauling and processing for the El Gallo HLM.
El Gallo Silver: Milling recovery assumptions of 86% (sulfide) and 75% (oxide) for silver and 86% gold. Mining costs of $1.95/t, processing and G&A costs of $26.15/t milled were used. Mineral resources are stated using a cut-off grade of 58 g/t Ag within an optimized pit shell indicating reasonable prospects for eventual economic extraction.
HLM: Because of the unconsolidated nature of the heap leach material, the mine schedule plans to mine the entire heap without the benefit of selectivity. Sub-cut-off leach pad material will inherently have potential acid generating sulfide liabilities if placed in our waste dumps and so it will be prudent to process the entire leach pad and place tailings in a previously mined pit at an overall environmental and economic benefit. Metallurgical recovery assumptions for the HLM are 85% gold and 60% silver.
14
Mineral resources have remained the same as last year as no drilling, mining or irrigation activity has taken place during 2025. There was a minor amount of metal recovered of 1,152 ounces of gold at the operation in 2025.
MSC
Mineral resources are reported at McEwen’s 49% attributable interest. Hochschild has a 51% interest in San José. Mineral resources are in situ.
Cut-off grades are reported in silver equivalent grams per tonne, calculated using a ratio of 83:1 Ag:Au. For mineral resources, the silver equivalent cut-off grades are: 186 g/t silver equivalent.
The December 31, 2025 mineral resource estimate was based on a gold price of $2,900/oz and a silver price of $32/oz. P&E determined that these metal prices are suitable to be utilized for mineral resource estimation since they are based on recognized consensus forecast prices.
Ongoing definition, delineation and mine exploration drilling will lead to better definition of existing resources or extensions of known veins that will be reflected on the year-on-year comparison of both mineral resources. Mine depletion, commodity price changes and equivalents leading to cut-off grade changes will also have an effect on the comparative data.
McEwen Copper
The mineral resources estimate for Los Azules is reported inside of an optimized pit shell demonstrating its reasonable prospects for eventual economic extraction (“RPEEE”). The economic value of each block was calculated based on the metal content, the price of each metal, processing costs, and other downstream costs associated with having a final saleable product. This value is stored for each block of the model as Net Smelter Return (“NSR”) and used to generate an open pit with variable cutoff values to cover the material types and recovery methodology (ranging from $4.79/tonne NSR to $7.23/tonne NSR for the Leach material, $5.13/tonne NSR for Enriched in the mill and $5.11/tonne NSR for Primary in the mill). A copper price of $4.80/lb was used with variable recoveries depending on lithology types for the leach method. With the potential for froth flotation as a recovery method the NSR values were calculated for both high-grade enriched and primary material in a mill. Mineral resources are in-situ and are reported exclusive of reserves at McEwen’s 46.3% attributable interest.
Competitive Business Conditions
We compete with many companies in the mining and mineral exploration and production industry, including large, established mining companies with substantial capabilities, personnel, and financial resources. There is a limited supply of desirable mineral lands available for claim-staking, lease, or acquisition in the United States, Canada, Mexico, Argentina, and other areas where we may conduct our mining or exploration activities. We may be at a competitive disadvantage in acquiring mineral properties, since we compete with these individuals and companies, many of which have significantly greater financial resources and larger technical staffs than we do. From time to time, specific properties or areas that would otherwise be attractive to us for exploration or acquisition may be unavailable due to their previous acquisition by other companies or our lack of financial resources.
Competition in the industry is not limited to the acquisition of mineral properties, but also extends to the technical expertise to find, advance, and operate such properties; the labor to operate the properties; and the capital for the purpose of funding such exploration and development. Many competitors not only explore for and mine precious and base metals but conduct refining and marketing operations on a world-wide basis. Such competition may result in our company not only being unable to acquire desired properties, but to recruit or retain qualified employees or to acquire the capital necessary to fund our operation and advance our properties. Our inability to compete with other companies for these resources would have a material adverse effect on our results of operation, financial condition and cash flows.
15
General Government Regulations
In the United States, Canada, Mexico, and Argentina, we are subject to various governmental laws and regulations, including environmental regulations. Other than operating licenses for our mining and processing facilities and concessions granted under contracts with the host government, there are no third-party patents, licenses or franchises material to our business. The applicable laws and regulations applicable to us include but are not limited to:
| ● | mineral concession rights. |
| ● | surface rights. |
| ● | water rights. |
| ● | mining royalties. |
| ● | environmental laws. |
| ● | mining permits. |
| ● | mining and income taxes. |
| ● | health and safety laws and regulations. |
| ● | labor laws and regulations. |
| ● | export regulations. |
We believe that all of our properties are operated in compliance with all applicable governmental laws and regulations.
Reclamation Obligations
Under applicable laws in the jurisdictions where our properties are located, we are required to reclaim disturbances caused by our mining activities. Accordingly, we have recorded estimates in our financial statements for our reclamation obligations, in accordance with United States Generally Accepted Accounting Principles (“US GAAP” or “GAAP”) the most significant of which are related to our properties in the U.S., Canada, and Mexico.
Estimated future reclamation costs are based primarily on legal and regulatory requirements. As at December 31, 2025, we accrued $45.9 million for reclamation costs relating to currently developed and producing properties. These amounts are included in reclamation and remediation liabilities on Item 8. Financial Statements and Supplementary Data, Consolidated Balance Sheets.
U.S. Environmental Laws
We are subject to extensive environmental regulation under the laws of the U.S. and the state of Nevada, where our U.S. operations are conducted. For example, certain mining wastes resulting from the extraction and processing of ores would be considered hazardous waste under the Resource Conservation and Recovery Act (“RCRA”) and state law equivalents, but such mining wastes are currently excluded from regulation as hazardous waste under Subtitle C of RCRA. If our mine wastes were regulated as hazardous waste under RCRA or if any of our properties were placed on the National Priorities List under the Comprehensive Environmental Response, Compensation, and Liability Act (“CERCLA”) or state law equivalents for cleanup, significant expenditures could be required for the construction of additional waste disposal facilities, remediation activities, or natural resource damages. Under CERCLA, any present or past owners or operators of a site may be held jointly and severally liable for investigation and remediation costs and may be required to undertake remedial actions or reimburse the government for its cleanup efforts. Such owners or operators may also be liable to governmental entities for damages to natural resources, which may be substantial. Additional regulations or requirements may also be imposed upon our operations, tailings, and waste disposal areas, as well as upon mine closure, under federal and state environmental laws and regulations, including, without limitation, CERCLA, the Clean Water Act, Clean Air Act, the Safe Drinking Water Act, the Endangered Species Act, and state law equivalents. See Item 8. Financial Statements and Supplementary Data, Note 12, Asset Retirement Obligations, for information on reclamation obligations under governmental environmental laws.
16
We have reviewed and considered current federal legislation relating to climate change and do not believe it to have a material effect on our operations. Future changes in U.S. federal or state laws or regulations could have a material adverse effect upon us and our results of operations.
Foreign Government Regulations
Canada, where the Fox Complex is located, and Mexico, where El Gallo is located, have both adopted laws and guidelines for environmental permitting that are similar to those in effect in the U.S. The permitting process requires a thorough study to determine the baseline condition of the mining site and surrounding area, an environmental impact analysis, and proposed mitigation measures to minimize and offset the environmental impact of exploration and mining operation activities. We have received all permits required to operate our current activities in Canada and Mexico and have received all permits necessary for the exploration activities being conducted at our non-U.S. properties.
Customers
Production from the Gold Bar Mine Complex and the Fox Complex is sold as refined metal on the spot market or doré under the terms set out in doré purchase agreements.
The Company has entered into doré purchase agreements with Asahi Refining (“Asahi”), and Auramet International LLC (“Auramet”). Under the terms of the agreement with Auramet, we have an option to sell up to 100% of the gold and silver contained in doré bars produced at the Gold Bar Mine Complex and Fox Complex prior to the completion of refining. The Company has an option to sell the gold on a spot basis, on a forward basis, and on a supplier advance basis. During the year ended December 31, 2025, in respect of our 100% owned mines, 32% of our sales were made to Asahi and 66% of our sales were made to Auramet, with the remaining 2% made to other customers.
During the year ended December 31, 2025, 55% of the total sales from the San José mine were made to three companies: Aurubis accounted for 21% of the total sales; LS Mining, a Korean Company accounted for 20% of the total sales and Trafigura, accounted for 14% of the total sales. MSC has sales agreements with each of these purchasers. The remaining 45% of San José’s sales are made to several customers under smaller contract quantities.
If our customer relationships or MSC’s customer relationships were interrupted for any reason, we believe that we or MSC could locate other purchasers for our products. However, any interruption may temporarily disrupt the sale of our products and may affect our operating results.
Human Capital Resources
As of December 31, 2025, we had 486 employees, including 113 in the United States, 30 in Toronto, Ontario, Canada, 213 in Timmins, Ontario, Canada, and 130 in Mexico. All our employees based in Toronto work in an executive, technical or administrative position, while our employees in the United States, Timmins, and Mexico include management, laborers, craftsmen, miners, geologists, environmental specialists, information technologists, and various other support roles. As of December 31, 2025, MSC had 1,495 employees in Argentina. We also frequently engage independent contractors in connection with certain administrative matters and the exploration of our properties, such as drillers, geophysicists, geologists, and other specialty technical disciplines. For Canada and United States, we also engage independent contractors for technical and professional expertise as well as extractive and exploration activities such as drilling, geophysics, hauling and crushing. Of our employees in Mexico, 82 are covered by union labor contracts and we believe we have good relations with them.
As part of our fundamental need to attract and retain talent, we regularly evaluate our compensation, benefits, and employee wellness offerings. We have determined that our compensation arrangements are competitive in the industry. Over 96% of our U.S. employees are enrolled in our medical benefit plan, over 93% of U.S. employees contribute to our 401(k) plan and over 95% of employees in Canada contribute to our registered retirement plans. Supplemental healthcare is provided above government requirements in both Canada and Mexico.
17
Risk Factor Summary
Our business and operations are subject to a number of risks and uncertainties which you should be aware of prior to making a decision to invest in our common stock. Listed below is a summary of these risks, which are described more fully immediately following in the section titled “Item 1A. RISK FACTORS.”
Risks Related to Our Financial Condition, Results of Operation and Cash Flows
| ● | Our results of operations, cash flows and the value of our properties are highly dependent on the market prices of gold, silver, and copper and these prices can be volatile, which may cause volatility in the price of our common stock. |
| ● | We have incurred substantial losses in prior years and may not be consistently profitable in future years. |
| ● | Our current operations require substantial capital investment from outside sources, and we may be unable to raise additional funding on favorable terms to develop additional mining operations. |
| ● | Our ongoing reliance on equity funding and any conversion of our convertible debt could result in continued dilution to our existing shareholders. |
| ● | Our indebtedness adversely affects our cash flow and may adversely affect our ability to operate our business. |
| ● | Our outstanding convertible debt may impact the trading price of our common stock. |
| ● | Any failure to meet our debt obligations could harm our business and financial condition and may require us to sell assets or take other steps to satisfy the debt. |
| ● | Increased operating and capital costs could adversely affect our results of operations. |
| ● | If we do not hedge our exposure to reductions in gold and silver prices, we may be subject to significant reductions in the price we receive for our products. |
| ● | Estimates relating to new development projects and mine plans of existing operations are uncertain and we may incur higher costs and lower economic returns than estimated. |
| ● | We are subject to foreign currency risks which may increase our costs and affect our results of operation. |
| ● | Our continuing reclamation obligations at Tonkin, Gold Bar mine, Fox Complex, El Gallo, and other properties could require significant additional expenditure. |
| ● | There is no guarantee that we will declare distributions to shareholders. |
Risks Relating to our Operations as a Mining Company
| ● | Our estimates of proven and probable mineral reserves and resources are based on interpretation and assumptions and may yield less mineral production than is currently estimated or may result in additional impairment charges to our operations. |
| ● | We may be unable to replace gold and silver reserves as they become depleted. |
| ● | Our acquisitions may not achieve their intended results. |
| ● | We own our 49.0% interest in the San José mine under the terms of an option and joint venture agreement and are therefore unable to control all aspects of the exploration and development of, and production from, this property. |
| ● | We own our 46.3% interest in the Los Azules project under the terms of the shareholder agreement and are therefore unable to control all aspects of the exploration and development of this property. The development of the Los Azules project presents challenges that may negatively affect, if not completely negate, the feasibility for development of the property. |
| ● | We may acquire additional exploration-stage properties on which reserves may never be discovered. |
| ● | The nature of mineral exploration and production activities involves a high degree of risk and the possibility of uninsured losses that could adversely and materially affect our operations. |
| ● | Our operations are subject to permitting requirements which could require us to delay, suspend or terminate our operations on our mining properties. |
| ● | Tariffs and the imposition of other restrictions on trade could adversely affect our operating costs. |
18
| ● | Our operations in Argentina, Mexico, and Canada subject us to political and social risks. |
| ● | Our operations face substantial regulation of health and safety. |
| ● | Reform of the General Mining Law in the United States could adversely affect our results of operations. |
| ● | Title to mineral properties can be uncertain, and we may be at risk of loss of ownership of one or more of our properties. |
| ● | We cannot ensure that we will have an adequate supply of water to complete desired exploration or development of our mining properties. |
| ● | Our ongoing operations and past mining activities are subject to environmental risks, which could expose us to significant liability and delay, suspension, or termination of our operations. |
| ● | Our industry is highly competitive, attractive mineral lands are scarce, and we may not be able to obtain quality properties. |
| ● | We rely on contractors to conduct a significant portion of our operations and construction projects. |
| ● | If our employees or contractors engage in a strike, work stoppage or other slowdown, we could experience business disruptions and/or increased costs. |
| ● | Our business is sensitive to nature and climate conditions. |
| ● | Mining companies are increasingly required to consider and provide benefits to the communities, including indigenous communities, and countries, in which they operate in order to maintain operations. |
Risks Related to Our Common Stock
| ● | A small number of existing shareholders own a significant portion of McEwen Inc. common stock, which could limit your ability to influence the outcome of any shareholder vote. |
| ● | Our stock price may be volatile, and as a result you could lose all or part of your investment. |
| ● | Failure of the Company to maintain compliance with the NYSE or TSX listing requirements could result in delisting of our common stock, which in turn could adversely affect our future financial condition and the market for our common stock. |
| ● | Failure of the Company to maintain proper and effective internal controls could impair our ability to produce accurate financial statements on a timely basis, which could adversely affect the market price of our common stock. |
| ● | The future issuances of our common stock will dilute current shareholders and may reduce the market price of our common stock. |
General Risks
| ● | We do not insure against all risks to which we may be subject in our operations. |
| ● | Our business is subject to the U.S. Foreign Corrupt Practices Act and similar worldwide anti-bribery laws, a breach or violation of which could lead to civil and criminal fines and penalties, loss of licenses or permits and reputational harm. |
| ● | We conduct operations in several foreign countries and are exposed to legal, political and social risks associated with those operations. |
| ● | Our business depends on good relations with our employees, and if we are unable to attract and retain additional highly skilled employees, our business and future operations may be adversely affected. |
| ● | Our business could be negatively impacted by security threats, including cybersecurity threats, and other disruptions. |
| ● | Several of our directors and officers are residents outside of the United States, and it may be difficult for shareholders to enforce within the United States any judgments obtained against such directors or officers. |
| ● | The laws of the State of Colorado, our Articles of Incorporation and agreements with certain officers and directors may protect our directors from certain types of lawsuits. |
19
| ● | We may be required to write down certain long-lived assets, due to metal prices, operational challenges or other factors. Such write downs may adversely affect our results of operations and financial condition. |
| ● | A significant delay or disruption in sales of concentrate or doré as a result of the unexpected disruption in services provided by smelters or refiners or other third parties could have a material adverse effect on our results of operations. |
ITEM 1A. RISK FACTORS
Our operations and financial condition are subject to significant risks, including those described below. You should carefully consider these risks. If any of these risks actually occur, our business, financial condition, and/or results of operation could be adversely affected. This report, including the Management’s Discussion and Analysis of Financial Condition and Results of Operations, contains forward-looking statements that may be affected by several risk factors, including those set forth below. The following information summarizes all material risks known to us as of the date of filing this report:
Risks Relating to Our Financial Condition, Results of Operation and Cash Flows
Our results of operations, cash flows and the value of our properties are highly dependent on the market prices of gold, silver, and copper and these prices can be volatile.
The profitability of our gold and silver mining operations and the value of our mining properties are directly related to the market price of gold, silver and copper. The price of gold, silver and copper may also have a significant influence on the market price of our common stock. Historically, the market price of gold, silver, and copper has fluctuated significantly and is affected by numerous factors beyond our control. These factors include supply and demand fundamentals, global or national political or economic conditions, expectations with respect to the rate of inflation, the relative strength of the U.S. dollar and other currencies, interest rates, gold and silver sales and loans by central banks, forward sales by metal producers, accumulation and divestiture by exchange traded funds, and a number of other factors such as industrial and commercial demand. The volatility of mineral prices represents a substantial risk which no amount of planning or technical expertise can fully eliminate. This is especially true since we do not hedge any of our sales.
We derive all of our revenue from the sale of gold and silver and our results of operations will fluctuate as the prices of these metals change. A period of sustained lower gold and silver prices would materially and adversely affect our results of operations and cash flows. In the event metal prices decline or remain low for prolonged periods of time, our existing producing properties may become uneconomic, and we might be unable to develop our undeveloped properties, which may further adversely affect our results of operations, financial performance, and cash flows. An asset impairment charge may also result from the occurrence of unexpected adverse events, including a material diminution in the price of gold, silver, and/or copper, that impacts our estimates of expected cash flows generated from our producing properties or the market value of our non-producing properties and investments, including McEwen Copper Inc.
During 2025, the price of gold, as measured by the London P.M. fix, fluctuated between $2,633 and $4,449 per ounce, the price of silver fluctuated between $29.41 and $74.84 per ounce, and the price of copper fluctuated between $4.05 and $5.86 per ounce. As at March 13, 2026, gold, silver and copper prices were $5,045.00/oz, $83.70oz, and $5.76/lb, respectively.
We have incurred substantial losses in prior years and may not be consistently profitable in future years.
For the year ended December 31, 2025, the Company generated a pre-tax income of $6.9 million. During the two years ended December 31, 2024, and 2023, we generated a pre-tax loss and a pretax income of $46.7 million and $67.0 million, respectively. As of December 31, 2025, our accumulated deficit, which includes historic non-cash impairment charges, was $1.3 billion. In the future, our ability to remain profitable will depend on the profitability of the Gold Bar Mine Complex, Fox Complex, El Gallo and the San José mine, our ability to generate revenue sufficient to cover our costs and expenses, and our ability to advance, sell or otherwise monetize our other properties and our interest in the Los Azules copper project. In pursuit of profitability, we will seek to identify additional mineralization that can be extracted economically at operating and exploration properties.
20
For our non-operating properties that we believe demonstrate economic potential, we need to either develop our properties, locate and enter into agreements with third party operators, or sell the properties. We may suffer significant additional losses in the future and may not be profitable again.
Our business requires substantial capital investment from outside sources, and we may be unable to raise additional funding on favorable terms to develop additional mining operations. In addition, our ongoing reliance on equity funding will and any conversion of our convertible debt could result in continued dilution to our existing shareholders.
We have in the past and will likely in the future require significant capital to develop our exploration projects. A significant portion of that funding in the past has come in the form of sales of our common stock. We continue to evaluate capital and development expenditure requirements as well as other options to monetize certain assets in the Company’s portfolio including Los Azules, Grey Fox, Stock and El Gallo. If we make a positive decision to develop one or more of these initiatives, the expenditure required may significantly exceed our working capital. Our ability to obtain necessary funding, in turn, depends upon a number of factors, including the state of the economy, our operating results and applicable commodity prices. We may not be successful in obtaining the required financing to advance our projects or for other purposes, on terms that are favorable to us or at all, in which case, our ability to replace depleted mineral reserves and continue operating would be adversely affected. Failure to obtain such additional financing could result in delay or indefinite postponement of further exploration or potential development and in the possible partial or total loss of our interest in certain properties. Even if we are successful in obtaining additional equity capital, it will result in dilution to existing shareholders. Additionally, any conversion of our 5.25% Convertible Senior Notes due 2030, could result in dilution to our existing equity shareholders to the extent we deliver common stock upon such conversion.
Our indebtedness adversely affects our cash flow and may adversely affect our ability to operate our business.
As of December 31, 2025, we had an outstanding credit facility with a principal amount of $20.0 million. Repayment of the debt is secured by a lien on certain of our and our subsidiaries’ assets. This debt requires us to make monthly principal payments of $1.0 million beginning on January 31, 2027, with the remaining outstanding principal repayment on August 31, 2028.
We also had $110.0 million in convertible unsecured notes. These convertible notes bear interest at the annual rate of 5.25%, payable semiannually in arrears on August 15 and February 15 of each year, and are expected to mature on August 15, 2030, unless earlier converted, redeemed or repurchased by the Company.
We cannot be certain that our cash flow from operations will be sufficient to allow us to pay the principal and interest on our debt and meet our other obligations. Even if we have sufficient cash flow to retire our debt, those payments will affect the amount of cash we have available for capital investment, exploration, ongoing operations and other purposes. Payments on our debt may also inhibit our ability to react to changing business conditions.
Our outstanding convertible debt may impact the trading price of our common stock.
We believe that some investors in, and potential purchasers of, convertible debt instruments employ, or seek to employ, a convertible arbitrage strategy with respect to these instruments. Investors that employ a convertible arbitrage strategy with respect to convertible debt instruments typically implement that strategy by selling short the common stock underlying the convertible instrument and dynamically adjusting their short position while they hold the instrument. The implementation of this strategy by investors in our convertible debt instruments, as well as related market regulatory actions, could have a significant impact on the trading prices of our common stock, and the trading prices and liquidity of our convertible debt instruments. The price of our common stock and our convertible debt instruments could also be affected by possible sales of our common stock by investors who view our convertible debt instruments as more attractive means of equity participation in us.
21
Any failure to meet our debt obligations could harm our business and financial condition and may require us to sell assets or take other steps to satisfy the debt.
Our ability to make payments on and/or to refinance our indebtedness and to fund planned capital expenditures will depend on our ability to generate sufficient cash flow from operations or financing in the future. We cannot assure that our business will generate sufficient cash flow from operations or that future borrowings, or other financing will be available to us in an amount sufficient to enable us to pay principal and interest on our indebtedness or to fund our other liquidity needs. Decreases in precious metal prices, in addition to our ability to execute our mine plans at existing operations, may adversely affect our ability to generate cash flow from operations. If our cash flow and existing capital resources are insufficient to fund our debt obligations, we may be forced to reduce our planned capital expenditures, sell assets, seek additional equity or debt capital, or restructure our debt, and any of these actions, if completed, could adversely affect our business and/or the holders of our securities. We cannot assure that any of these remedies could, if necessary, be completed on commercially reasonable terms, in a timely manner or at all. In addition, any failure to make scheduled payments of interest and principal on our outstanding indebtedness could result in the immediate acceleration of the debt and foreclosure of our assets.
Restrictive debt covenants could limit our growth and our ability to finance our operations, fund our capital needs, respond to changing conditions, and engage in other business activities that may be in our best interests.
Our credit facility contains covenants that restrict or limit our ability to:
| ● | Borrow additional funds; |
| ● | Repurchase, redeem, or retire our capital stock; |
| ● | Make certain loans and investments; |
| ● | Sell assets; |
| ● | Enter into certain transactions with affiliates; |
| ● | Create or assume certain liens on our assets; |
| ● | Make certain acquisitions; or |
| ● | Engage in certain other corporate activities. |
As part of our facility, the debt can be called in certain circumstances, including on demand in the event of a material adverse change in our business or our inability to satisfy certain financial tests on an ongoing basis. Our ability to comply with these requirements may be affected by events beyond our control, and we cannot assure you that we will satisfy them in the future. In addition, these requirements could limit our ability to obtain future financings, make needed capital expenditures, withstand a future downturn in our business or the economy in general, or otherwise conduct necessary corporate activities. We may also be prevented from taking advantage of potential business opportunities that arise because of the restrictive covenants under our debt agreement. A breach of any of the covenants in our debt agreements could result in a default under the agreement.
Increased operating and capital costs could adversely affect our results of operations.
Costs at any particular mining location are subject to variation due to a number of factors, such as variable ore grade, changing metallurgy and revisions to mine plans in response to the physical shape and location of the ore body, as well as the age and utilization rates for the mining and processing related facilities and equipment. In addition, costs are affected by the price and availability of input commodities, such as fuel, electricity, labor, chemical reagents, explosives, steel, concrete, and mining and processing related equipment and facilities. Commodity costs are, at times, subject to volatile price movements, including increases that could make production at certain operations less profitable. Further, changes in laws and regulations can affect commodity prices, uses and transport. Reported costs may also be affected by changes in accounting standards. A material increase in costs at any significant location could have a significant adverse effect on our results of operation and operating cash flow.
22
We could have significant increases in capital and operating costs over the next several years in connection with the development of new projects in challenging jurisdictions and in the sustaining and/or expansion of existing mining and processing operations. Costs associated with capital expenditures may increase in the future as a result of factors beyond our control. Increased capital expenditures may have an adverse effect on the results of operation and cash flow generated from existing operations, as well as the economic returns anticipated from new projects.
If we do not hedge our exposure to reductions in gold and silver prices, we may be subject to significant reductions in price.
We do not use hedging transactions with respect to any of our gold and silver production. Accordingly, we may be exposed to more significant price fluctuations if gold and/or silver prices decline. While the use of hedging transactions limits the downside risk of price declines, their use also may limit future revenues from price increases. Hedging transactions also involve the risk that the counterparty may be unable to satisfy its obligations.
Estimates relating to new development projects and mine plans of existing operations are uncertain and we may incur higher costs and lower economic returns than estimated.
Our decision to develop a project is typically based on the results of feasibility studies, which estimate the anticipated economic returns of a project. However, the actual project profitability or economic feasibility may differ from such estimates as a result of any of the following factors, among others:
| ● | Changes in metal prices; |
| ● | Changes in tonnage, grades and metallurgical characteristics of mineralized material to be mined and processed; |
| ● | Changes in input commodity and labor costs; |
| ● | The quality of the data on which engineering assumptions were made; |
| ● | Adverse geotechnical conditions; |
| ● | Availability of an adequate and skilled labor force; |
| ● | Availability, supply and cost of utilities such as water and power; |
| ● | Fluctuations in inflation and currency exchange rates; or |
| ● | Changes in tax laws, the laws and/or regulations around royalties and other taxes due to the regional and national governments and royalty agreements. |
Our recent development activities, including at the Gold Bar Mine Complex and the Fox Complex, may not result in the expansion or replacement of past production with new production, or one or more of these new production sites or facilities may be less profitable than currently anticipated or may not be profitable at all, any of which could have a material adverse effect on our results of operations and financial position.
For our existing operations, we base our mine plans on geological, metallurgical, and engineering assumptions, financial projections, and commodity price estimates. These estimates are periodically updated to reflect changes in our operations, including modifications to our proven and probable reserves and measured, indicated, and inferred resources, revisions to environmental obligations, changes in legislation and/or our political or economic environment, and other significant events associated with mining operations. There are numerous uncertainties inherent in estimating quantities and qualities of gold, silver and copper and costs to mine recoverable reserves, including many factors beyond our control, that could cause actual results to differ materially from expected financial and operating results or result in future impairment charges.
We are subject to foreign currency risks which may increase our costs and affect our results of operation.
While we transact most of our business in U.S. dollars, certain expenses, such as labor, operating supplies, and property and equipment, may be denominated in Canadian dollars, Mexican pesos or Argentine pesos. As a result, currency exchange fluctuations and foreign exchange regulations may impact our operating costs. The appreciation of non-U.S. dollar currencies against the U.S. dollar increases costs and the cost of purchasing property and equipment in U.S. dollar terms in Canada, Mexico, and Argentina, which can adversely impact our operating results and cash flows.
23
The value of cash and cash equivalents denominated in foreign currencies also fluctuates with changes in currency exchange rates. The appreciation of non-U.S. dollar currencies results in a foreign currency gain on such investments and a depreciation in non-U.S. dollar currencies results in a loss. We have not utilized market risk sensitive instruments to manage our exposure to foreign currency exchange rates but may do so in the future. We also hold portions of our cash reserves in Canadian, Mexican, and Argentine currency.
Our continuing reclamation obligations at Tonkin, Gold Bar Complex, the Fox Complex, the El Gallo mine, and other properties could require significant additional expenditure.
We are responsible for the reclamation obligations related to disturbances on all our properties. In Canada and the United States, we are required to post bonds to ensure performance of our reclamation obligations. As of December 31, 2025, we have accrued $39.5 million in discounted estimated reclamation costs for our properties in United States and Canada with a corresponding $48.2 million covered by surety bonds. We have not posted a bond in Mexico as none is required by the current legislation; however, we have recorded a liability of $6.4 million based on the estimated amount of our reclamation obligations in that jurisdiction.
There is a risk that any surety bond or recorded liability, even if increased based on the analysis and work performed to update the reclamation obligations, could be inadequate to cover the actual costs of reclamation when actually carried out. The satisfaction of bonding requirements and continuing reclamation obligations will require a significant amount of capital. Further, it is possible that the United States Bureau of Land Management may request that we provide additional long-term financing supported by a long-term trust for an amount that cannot be determined at present. There is a risk that we will be unable to fund any additional bonding requirements or that the surety bonds may no longer be accepted by the governmental agencies as satisfactory reclamation coverage, in which case we would be required to replace the surety bonding with cash, and further, that the regulatory authorities may increase reclamation and bonding requirements to such a degree that it would not be commercially reasonable to continue exploration activities, which may adversely affect our results of operations, financial performance and cash flows.
There is no guarantee that we will declare distributions to shareholders.
We have not made distributions to our shareholders since September 2018, and we may not make any distributions in the future. Any determination to make distributions on our common stock will be based primarily upon covenants in outstanding debt instruments, our financial condition, results of operations and capital requirements, including for capital expenditures and acquisitions, and our Board of Directors’ determination that the distribution to shareholders is in the best interest of our shareholders and in compliance with all laws and agreements applicable to the Company.
Risks Relating to Our Operations as a Mining Company
Our estimates of proven and probable mineral reserves and resources are based on interpretation and assumptions and, under actual conditions, may yield less mineral production than is currently estimated or may result in additional impairment charges to our operations.
Unless otherwise disclosed, proven and probable reserves and measured, indicated, and inferred resources figures presented in our filings with securities regulatory authorities, including the SEC, in our news releases and other public statements that may be made from time to time, are based upon estimates made by both independent and our own internal professionals. Estimates of proven and probable reserves and measured, indicated, and inferred resources are subject to considerable uncertainty and are based, to a large extent, on the prices of gold and silver and interpretations of geologic data obtained from drill holes and other exploration techniques. These prices and interpretations are subject to change. If we determine that certain of our estimated reserves or resources have become uneconomic, we may be forced to reduce our estimates. Actual production may be significantly less than we expect, and such reductions may result in impairment charges such as those we experienced in 2020.
24
When making determinations about whether to advance any of our projects to development, we rely upon such estimated calculations as to the mineralized material and grades of mineralization on our properties. Until ore is mined and processed, mineralized material and grades of mineralization must be considered as estimates only. We cannot ensure that these estimates will be accurate or that this mineralization can be mined or processed profitably.
Any material changes in mineral estimates and grades of mineralization may affect the economic viability of placing a property into production and such property’s return on capital. There can be no assurance that minerals recovered in small- scale tests will be recovered in large-scale tests under on-site conditions or in production scale. Extended declines in market prices for gold and/or silver may render portions of our mineralization estimates uneconomic and result in reduced reported mineralization or adversely affect the commercial viability of one or more of our properties. Any material reductions in estimates of mineralization, or of our ability to extract this mineralization, could have a material adverse effect on our results of operations or financial condition.
Investors should also be aware that calculations of “reserves” and “resources” differ under SEC reporting standards and those under other international standards, such as Canada. Investors should also be aware that resources may not be converted into reserves. Please also see, CAUTIONARY NOTE REGARDING DISCLOSURE OF MINERAL PROPERTIES.
We may be unable to replace gold and silver reserves as they become depleted.
Like all metal producers, we must continually replace reserves depleted by production to maintain production levels over the long term and provide a return on invested capital. Depleted reserves can be replaced in several ways, including expanding known ore bodies, locating new deposits, or acquiring interests in reserves from third parties. Exploration is highly speculative in nature, involves many risks and uncertainties and is frequently unsuccessful in discovering significant mineralization. Accordingly, our current or future exploration programs may not result in new mineral producing operations. Even if significant mineralization is discovered, it will likely take many years from the initial phases of exploration to commencement of production, during which time the economic feasibility of production may change.
From time to time, we may acquire reserves from other parties. Such acquisitions are based on an analysis of a variety of factors including historical operating results, estimates and assumptions on the extent of ore reserves, the timing of production from such reserves, available cash, and other operating costs. In addition, we may rely on data and reports prepared by third parties (including in relation to the ability to permit and comply with existing regulations), which may contain information or data that we are unable to independently verify or confirm in advance. Other than historical operating results, these factors are uncertain, they may contribute to the uncertainties related to the process used to estimate ore reserves and have an impact on our revenue, our cash flow and other operating issues.
As a result of these uncertainties, our exploration programs and acquisitions may not result in the expansion or replacement of our current production with new ore reserves or operations, which could have a material adverse effect on our business, prospects, results of operations and financial position.
Our acquisitions may not achieve their intended results.
Our acquisitions subject us to many risks. We may discover title defects, adverse environmental or other conditions relating to the properties acquired of which we are currently unaware. Environmental, title, and other problems could reduce the value of the properties to us, and depending on the circumstances, we could have limited or no recourse to the sellers with respect to those problems. We have assumed substantially all of the liabilities associated with acquired properties, and such liabilities could be significant.
25
We own our 49.0% interest in the San José mine under the terms of an option and joint venture agreement (“OJVA”), and our 46.3% interest in the Los Azules copper project under the terms of a shareholder agreement, and therefore we are unable to control all aspects of the exploration and development of, and production from, these properties.
Our interests in the San José mine and Los Azules copper project are subject to the risks normally associated with the conduct of joint ventures and corporations. A disagreement between joint venture partners or corporation shareholders on strategic decisions or how to conduct business efficiently, the inability of joint venture partners or corporation shareholders to meet their obligations to the joint venture or corporation or third parties, or litigation arising between joint venture partners or corporation shareholders regarding joint venture or corporation matters could have a material adverse effect on the viability of our interests held through the joint venture or corporation. Since all day-to-day decisions are made by the majority owner of each of the San José mine and the Los Azules copper project, we are unable to participate in those decisions, including whether and when to pay dividends to the venture partners.
Even if McEwen Copper Inc. is successful in achieving one or more of its strategic initiatives at the Los Azules project, its development and copper price assumption provide uncertainty for development of the property.
Los Azules is located in a remote location, previously accessible only by 75 miles of dirt road with fourteen river crossings and two mountain passes above 13,450 feet. An additional access road at lower altitude was completed in May 2022, which has one mountain pass above 11,000 feet. Even assuming that technical difficulties associated with this remote location can be overcome, if the long-term price of copper decreased significantly below the current price or capital cost estimates increased significantly, Los Azules may not be feasible for development, and we may have to write off the remaining carrying value of our investment in McEwen Copper Inc.
We may acquire additional exploration-stage properties on which reserves may never be discovered.
We have acquired in the past and may acquire in the future additional exploration-stage properties. There can be no assurance that we have completed or will be able to complete the acquisition of such properties at reasonable prices or on favorable terms and that reserves will be identified on any properties that we acquire. We may also experience negative reactions from the financial markets if we are unable to successfully complete acquisitions of additional properties or if reserves are not located on acquired properties. These factors may adversely affect the trading price of our common stock or our financial condition or results of operations.
The nature of mineral exploration and production activities involves a high degree of risk and the possibility of uninsured losses that could adversely and materially affect our operations.
Exploration for and production of minerals is highly speculative and involves greater risk than many other businesses. Many exploration programs do not result in the discovery of mineralization, and any mineralization discovered may not be of sufficient quantity or quality to be profitably mined. Few properties that are explored are ultimately advanced to production. Our current exploration efforts, and future development and mining operations are subject to all of the operating hazards and risks normally incident to exploring for and developing mineral properties, such as, but not limited to:
| ● | economically insufficient mineralized material; |
| ● | fluctuations in production costs that may render mining uneconomical; |
| ● | availability of labor, contractors, engineers, power, transportation and infrastructure; |
| ● | labor disputes; |
| ● | potential delays related to social, public health and community issues; |
| ● | negotiations or agreements with aboriginal groups or local populations affecting our efforts to explore, develop or produce gold and silver deposits; |
| ● | unanticipated variations in grade and other geological problems; |
| ● | environmental hazards; |
| ● | water conditions; |
| ● | difficult surface or underground conditions; |
26
| ● | metallurgical and other processing problems; |
| ● | mechanical and equipment performance problems; |
| ● | industrial accidents, personal injury, fire, flooding, cave-ins, landslides, and other natural disasters; and |
| ● | decrease in reserves or resources due to a lower price of silver, gold, or copper. |
Any of these risks can adversely and materially affect, among other things, the development of properties, production quantities and rates, costs and expenditures, potential revenues, and production dates. We currently have no insurance to guard against any of these risks, except in very limited circumstances. If we determine that capitalized costs associated with any of our mineral interests are not likely to be recovered, we would incur a write-down of our investment in these interests. All of these factors may result in losses in relation to amounts spent and those amounts that would then not be recoverable.
Our operations are subject to permitting requirements which could require us to delay, suspend or terminate our operations on our mining properties.
Our mining operations, including ongoing exploration drilling programs and development efforts, require permits from various state and federal governments, including permits for the use of water and for drilling water wells. We may be unable to obtain these permits in a timely manner, on reasonable terms or on terms that provide us with sufficient resources to develop our properties in any way. Even if we are able to obtain such permits, the time required by the permitting process can be significant. If we cannot obtain or maintain the necessary permits, or if there is a delay in receiving these permits, our timetable and business plan for exploration of our properties will be adversely affected, which may in turn adversely affect our results of operations, financial condition, cash flows and market price of our securities.
Due to increased activity levels of non-governmental, aboriginal, and local groups targeting the mining industry, the potential for the government or process instituted by non-governmental, aboriginal, and local groups, to delay the issuance of permits or impose new requirements or conditions upon mining operations may be increased. Any changes in government policies may be costly to comply with and may delay mining operations. Future changes in such laws and regulations, if any, may adversely affect our operations, make them prohibitively expensive, or prohibit them altogether. If our interests are materially adversely affected, as a result of a violation of applicable laws, regulations, permitting requirements or a change in applicable law or regulations, it would have a significant negative impact on the value of our company and could have a significant impact on our stock price.
Tariffs and the imposition of other restrictions on trade could adversely affect the Company.
The U.S. federal government has made changes to the U.S. trade policy. The U.S. federal government has implemented tariffs on certain foreign goods and may implement additional tariffs on foreign goods. Beginning March 4, 2025, and effective through February 24, 2026, the U.S. government implemented executive orders imposing a tariff of between 10% and 35% on certain imports from Mexico and Canada; these tariffs were followed by additional 10% tariffs on goods from certain imports from Argentina. As we currently have mining operations in the United States, these tariffs increased the costs of our product from Argentina, Mexico and Canada as well as inputs from those countries used in our operations, such as supplies, equipment, and machinery. In response, the Canadian government imposed retaliatory tariffs of 25% on a broad range of U.S. goods, though many of these measures were reduced or withdrawn beginning in August 2025. Mexico’s retaliatory actions have been more limited and delayed, with some measures postponed indefinitely. These tariffs would have a similar effect on U.S. goods imported for use at our Mexican and Canadian operations. As of today, these tariffs have been found unlawful by the Court, and the company may be eligible for refund of certain tariffs paid; however, no refund is guaranteed, any refund may not be received by the company for some time, and any refund received may not fully offset the administrative burden of the tariffs while they were implemented. Further, effective February 25, 2026, the U.S. government implemented new tariffs on most imports into the U.S. from all countries under section 122 of the Trade Act of 1974, which permits the imposition of up to 15% tariffs for up to 150 days; these tariffs are currently at a rate of 10%. Future tariffs under alternative statutes are expected. These tariffs and any further legislation or actions taken by the U.S. federal government that restrict trade, such as additional tariffs, trade barriers, and other protectionist or retaliatory measures taken by governments in Canada, Mexico, Europe, Asia, and other countries, could adversely impact the cost of our products and the components and raw materials that go into making them. These increased costs could adversely impact the gross margin that we earn on our products, which could make our business less competitive. Countries may also adopt other protectionist measures that could limit our ability to offer our products and services.
27
The ultimate impact of any tariffs will depend on various factors, including if any tariffs are ultimately implemented, the timing of implementation, and the amount, scope, and nature of the tariffs. Further, United States-Mexico-Canada Agreement (“USMCA”) requires a formal evaluation of the agreement six years after its entry into force, which will commence July 1, 2026.
The U.S. has solicited feedback from the trading community regarding the operation of the agreement, and the joint review could result in changes to the agreement – including the processes by which goods qualify for preferential treatment under the agreement, the tariffs applicable to products under the agreement, or other restrictions on the movement of goods within the region – which could further impact our operations and impact the cost, price and availability of our products and services.
Our operations in Argentina and Mexico are subject to political and social risks.
With respect to our interests in McEwen Copper Inc., which owns the Los Azules copper project, and Minera Santa Cruz S.A, which owns the San José mine, there are risks relating to an uncertain or unpredictable political and economic environment in Argentina, illustrated by the following:
| ● | Argentina defaulted on foreign debt repayments and on the repayment on a number of official loans to multinational organizations in 2002 and 2003 and defaulted again on its bonds in 2014. |
| ● | In 2012, Argentina’s President announced the nationalization of the majority stake of Yacimientos Petrolíferos Fiscales (“YPF”), Argentina’s largest oil company. |
| ● | In December 2017, Argentina enacted comprehensive tax reform (Law No. 27,430 (the “Law”)). Specifically, the Law introduces amendments to tax and other various laws, including a special regime comprising an optional revaluation of assets for income tax purposes. |
| ● | In 2018, Argentina’s federal government introduced a decree imposing a temporary tax on all exports from Argentina. The tax was introduced as an emergency measure due to the significant peso devaluation during the year. |
| ● | In September 2019, Argentine authorities implemented new foreign exchange regulations that impacted the results of MSC. The main restrictions include, but are not limited to, full repatriation of proceeds of exports in cash bank savings to be denominated only in Argentine pesos and authorization from the Argentina Central Bank being required for dividend distributions abroad and intercompany loan payments. |
| ● | In October 2019, Alberto Fernández was elected to office. The prior president, Mr. Mauricio Macri, who assumed office in December 2015, implemented several significant economic and policy reforms, including reforms related to foreign exchange and trade, fiscal policy, labor laws and tax rules. The fiscal, monetary and currency adjustments undertaken by the Macri administration subdued growth in the short-term, and some measures, including the export tax, have negatively impacted Argentina sourced revenues. |
| ● | In December 2019, the Argentina federal government approved a decree delaying the corporate tax rate to change from 30% to 25% to the end of 2021 and extending the temporary export tax introduced in September 2018 to the end of 2021. Furthermore, the decree suspended the increase in the dividend withholding tax from 7% to 13% until January 2021. |
| ● | In 2020, the Alberto Fernández administration marked its first year in office, a year in which it faced numerous challenges including renegotiating Argentina’s foreign debt, managing currency crises, and, most difficult, designing Argentina’s response to the COVID-19 pandemic. |
| ● | On June 16, 2021, Law 27,630, which introduced amendments to the corporate income tax law, entered into force. Under prior law, the corporate income tax rate was 25%. As per the new law applicable to fiscal years starting on or after January 1, 2021, corporate income will be subject to tax at progressive rates ranging from 25% to 35%. Starting in January 2022, these brackets will be annually adjusted to account for inflation, as per the consumer price index published by relevant governmental agency. |
| ● | Under prior law, the distribution of earnings attributable to fiscal year 2021 was subject to withholding tax at a 13% rate. Law 27,630, enacted in June 2021, reduced this withholding tax rate on distributions of earnings to 7%. |
| ● | On November 19, 2023, Argentina elected Javier Milei as its new president. Milei has proposed fast and radical measures to address a large fiscal imbalance, including dramatic cuts to federal spending, full dollarization, closure of the central bank and privatizations. |
28
| ● | On December 28, 2023, Argentine President Javier Milei sent a reform bill to Congress proposing far-reaching changes to the country's tax system, electoral law and public debt management. |
| ● | On October 21, 2024, Argentine President Javier Milei announced plans to replace Argentina’s existing tax agency with the newly formed Agencia de Recaudación y Control Aduanero. |
| ● | On October 26, 2025, Argentine President Javier Milei’s La Libertad Avanza party secured a number of seats in both the Chamber of Deputies and the Senate. Despite this, 2025 was marked by a historic legislative low, with only 13 laws passed by Congress. |
With respect to the El Gallo mine in Mexico, there has been an ongoing level of violence and crime relating to drug cartels and gangs in Sinaloa State where we operate, and in other regions of Mexico. Our facility at the El Gallo mine was robbed in 2015. On December 17, 2019, the US State Department issued a Level 2 (“Increased caution”) warning with respect to five Mexican states, including Sinaloa State, due to violent crime. On September 8, 2020, the US State Department issued a Level 3 (“Reconsider travel”) warning with respect to five Mexican states, including Sinaloa State, due to violent crime and COVID-19. On April 20, 2021, the US State Department issued a Level 4 (“Do not travel”) warning with respect to six Mexican states, including Sinaloa State, due to violent crime and COVID-19. On January 5, 2023, the US State Department reiterated its caution against travel to Sinaloa State due to unrest resulting from the capture of Ovidio Guzmán López, a high-ranking member of the Sinaloa Cartel. A general update on August 22, 2023 reiterated a do not travel warning to Sinaloa State due to violent crime and kidnapping. Sinaloa State continued to be classified as a do not travel state in 2025 and this classification continues into 2026. On January 23, 2026, ten employees from Vizla Silver Corp. were kidnapped in Sinaloa and is suspected to be a result of cartel activity. These events may disrupt our ability to carry out exploration and mining activities and may affect the safety and security of our employees and contractors.
Our operations and properties in Canada expose us to additional political risks.
Our properties in Canada may be of particular interest or sensitivity to one or more interest groups, including aboriginal groups (which are generally referred to as "First Nations" and “Metis” groups). We have mineral projects in Ontario that are in areas with an aboriginal presence. It is our practice to work closely with and consult with First Nations in areas in which our projects are located or which could be impacted by our activities. However, there is no assurance that relationships with such groups will be positive and disputes with such groups may affect our operations and profitability. Accordingly, it is possible that our production, exploration or development activities on these properties could be interrupted or otherwise adversely affected in the future by political uncertainty, native land claims entitlements, expropriations of property, changes in applicable law, governmental policies and policies of relevant interest groups, including those of First Nations. Any changes in law or relations or shifts in political conditions may be beyond our control, or we may enter into agreements with First Nations, all of which may adversely affect our business and operations and if significant, may result in the impairment or loss of mineral concessions or other mineral rights, or may make it impossible to continue our mineral production, exploration or development activities in the applicable area, any of which could have an adverse effect on our financial conditions and results of operations.
Our operations face substantial regulation of health and safety.
Our operations are subject to extensive and complex laws and regulations governing workers’ health and safety across our projects and our failure to comply with applicable legal requirements can result in substantial penalties. Future changes in applicable laws, regulations, permits and approvals or changes in their enforcement or regulatory interpretation could substantially increase costs to achieve compliance, lead to the revocation of existing or future exploration or mining rights or otherwise have an adverse impact on our results of operations and financial position.
Our mines are inspected on a regular basis by government regulators who may issue citations and orders when they believe a violation has occurred under local mining regulations. If inspections result in an alleged violation, we may be subject to fines, penalties or sanctions and our mining operations could be subject to temporary or extended closures.
In addition to potential government restrictions and regulatory fines, penalties or sanctions, our ability to operate (including the effect of any impact on our workforce) and thus, our results of operations and our financial position, could be adversely affected by accidents, injuries, fatalities or events detrimental (or perceived to be detrimental) to the health and safety of our employees, the environment or the communities in which we operate.
29
Reform of the General Mining Law in the United States could adversely affect our results of operations.
Periodically, members of the U.S. Congress have introduced bills which would supplant or alter the provisions of the General Mining Law of 1872, which governs the unpatented claims that we control with respect to our U.S. properties. One such amendment has become law and has imposed a moratorium on the patenting of mining claims, which reduced the security of title provided by unpatented claims such as those on our U.S. properties. If additional legislation is enacted, it could substantially increase the cost of holding unpatented mining claims by requiring payment of royalties and could significantly impair our ability to develop mineral estimates on unpatented mining claims. Such bills have proposed, among other things, to make permanent the patent moratorium, to impose a federal royalty on production from unpatented mining claims and to declare certain lands as unsuitable for mining. Although it is impossible to predict at this time what royalties may be imposed in the future, the imposition of such royalties could adversely affect the potential for development of such mining claims, and the economics of existing operating mines on federal unpatented mining claims. Passage of such legislation could adversely affect our business.
Title to mineral properties can be uncertain, and we may be at risk of loss of ownership of one or more of our properties.
Our ability to explore and operate our properties depends on the validity of our title to those properties. Our U.S. mineral properties include leases of unpatented mining claims, as well as unpatented mining and mill site claims, which we control directly. Unpatented mining claims provide only possessory title, and their validity is often subject to contest by third parties or the federal government, which makes the validity of unpatented mining claims uncertain and generally riskier. Similarly, Canadian mineral properties consist of patented and unpatented claims which each have their respective risks and uncertainties. Further, there may be title defects or additional rights that are not recorded on the title. Our concessions in Mexico are subject to continuing government regulation and failure to adhere to such regulations will result in termination of the concession. Similarly, under Argentine Law, failure to comply with applicable conditions may result in the termination of the concession. Uncertainties inherent in mineral properties relate to such things as the sufficiency of mineral discovery, proper posting and marking of boundaries, assessment work and possible conflicts with other claims not determinable from public record. We have not obtained title opinions covering our entire property, with the attendant risk that title to some claims, particularly title to undeveloped property, may be defective. There may be valid challenges to the title to our property which, if successful, could impair development and/or operations.
We cannot ensure that we will have an adequate supply of water to complete desired exploration or development of our mining properties.
Our mining operations require significant quantities of water for mining, ore processing and related support facilities. Our operations in the United States, Mexico and Argentina are in areas where water is scarce and competition among users for continuing access to water is significant. Continuous production at our mines is dependent on our ability to maintain our water rights and claims and to defeat claims adverse to our current water uses in legal proceedings. We cannot predict the potential outcome of pending or future legal proceedings relating to our water rights, claims and uses. Water shortages may also result from weather or environmental and climate impacts out of the Company’s control.
30
Our ongoing operations and past mining activities are subject to environmental risks, which could expose us to significant liability and delay, suspension or termination of our operations.
All aspects of our operations are subject to United States, Canada, Mexico and Argentina federal, state and local environmental regulation. These regulations mandate, among other things, the maintenance of air and water quality standards and land reclamation. They also set forth limitations on the generation, transportation, storage and disposal of solid and hazardous waste, including cyanide. Furture environmental legislation may require stricter standards and enforcement, increased fines and penalties for non-compliance, more stringent environmental assessments of proposed projects, and a heightened degree of responsibility for us and our officers, directors and employees. Future changes in environmental regulation, if any, may adversely affect our operations, make our operations prohibitively expensive, or prohibit them altogether. Environmental hazards may exist on our properties that are unknown to us at the present and that have been caused by us, previous owners or operators, or that may have occurred naturally. We utilize explosives in our business, which could cause injury to our personnel, and damage to our equipment or assets. Mining properties from the companies we have acquired may cause us to be liable for remediating any damage that those companies may have caused. The liability could include response costs for removing or remediating the release and damage to natural resources, including ground water, as well as the payment of fines and penalties. Failure to comply with applicable environmental laws, regulations and permitting requirements may also result in enforcement actions thereunder, including orders issued by regulatory or judicial authorities, causing operations to cease or be curtailed, and may include corrective measures requiring capital expenditures, installation of additional equipment, or remedial actions.
Our industry is highly competitive, attractive mineral lands are scarce, and we may not be able to obtain quality properties.
We compete with many companies in the mining industry, including large, established mining companies with substantial capabilities, personnel and financial resources. There is a limited supply of desirable mineral lands available for claim staking, lease or acquisition in the United States, Canada, Mexico and Argentina, and other areas where we may conduct exploration activities. We may be at a competitive disadvantage in acquiring mineral properties, since we compete with these individuals and companies, many of which have greater financial resources and larger technical staffs than we do. From time to time, specific properties or areas which would otherwise be attractive to us for exploration or acquisition may be unavailable to us due to their previous acquisition by other companies or our lack of financial resources. Competition in the industry is not limited to the acquisition of mineral properties but also extends to the technical expertise to find, advance, and operate such properties; the labor to operate the properties; and the capital for the purpose of funding such properties. Many competitors not only explore for and mine precious metals but conduct refining and marketing operations on a world-wide basis. Such competition may result in our Company being unable not only to acquire desired properties, but to recruit or retain qualified employees or to acquire the capital necessary to fund our operation and advance our properties. Our inability to compete with other companies for these resources would have a material adverse effect on our results of operation, financial condition and cash flows.
We rely on contractors to conduct a significant portion of our operations and construction projects.
A portion of our operations and construction projects are currently conducted in whole or in part by contractors, including our operations at the Gold Bar Mine Complex, Fox Complex and El Gallo. As a result, our operations are subject to a number of risks, some of which are outside our control, including:
| ● | Negotiating agreements with contractors on acceptable terms; |
| ● | The inability to replace a contractor and its operating equipment in the event that either party terminates the agreement; |
| ● | Reduced control and oversight over those aspects of operations which are the responsibility of the contractor; |
| ● | Failure of a contractor to perform under its agreement; |
| ● | Interruption of operations or increased costs in the event that a contractor ceases its business due to insolvency or other unforeseen events; |
| ● | Failure of a contractor to comply with our standards and policies, as well as with applicable legal and regulatory requirements, to the extent it is responsible for such compliance; and |
| ● | Problems of a contractor with managing its workforce, labor unrest or other related employment issues. |
31
In addition, we may incur liability to third parties as a result of the actions of our contractors. The occurrence of one or more of these risks could potentially adversely affect our results of operations and financial position.
If our employees or contractors engage in a strike, work stoppage or other slowdown, we could experience business disruptions and/or increased costs.
As of December 31, 2025, a number of our employees were represented by different trade unions and work councils which subject us to employment arrangements very similar to collective bargaining agreements. Further, most of our employees are based in foreign locations. The laws of certain foreign countries may place restrictions on our ability to take certain employee-related actions or may require that we conduct additional negotiations with trade unions, works councils or other governmental authorities before we can take such actions.
If the employees or contractors at the Gold Bar Mine Complex, Fox Complex, El Gallo, or San José mine were to engage in a strike, work stoppage, or other slowdown in the future, we could experience a significant disruption of our operations. Such disruption could interfere with our business operations and could lead to decreased productivity, increased labor costs, and lost revenue.
We may not be successful in negotiating new collective bargaining agreements or other employment arrangements when the current ones expire. Furthermore, future labor negotiations could result in significant increases in our labor costs. The occurrence of any of the foregoing could have a material adverse effect on our business, financial condition, and results of operations.
Our business is sensitive to nature and climate conditions.
A number of governments have introduced or are moving to introduce climate change legislation and treaties at the international, national, state/provincial and local levels. Regulations relating to emission levels (such as carbon taxes) and energy efficiency are becoming more stringent in some jurisdictions. If the current regulatory trend continues, this may result in increased costs at some or all of our project locations. In addition, the physical risks of climate change may also have an adverse effect on our operations and properties. Extreme weather events have the potential to disrupt our power supply, surface operations and exploration at our mines and may require us to make additional expenditures to mitigate the impact of such events.
Some of the countries in which we operate have implemented, and are developing, laws and regulations related to climate change and greenhouse gas emissions. In December 2009, the United States Environmental Protection Agency (“EPA”) issued an endangerment finding under the U.S. Clean Air Act that current and projected concentrations of certain mixed greenhouse gases, including carbon dioxide, in the atmosphere threaten public health and welfare. In August 2015, the EPA issued final rules for the Clean Power Plan under Section 111(d) of the Clean Air Act designed to reduce greenhouse gas emissions from electric utilities. On June 19, 2019, the EPA repealed the Clean Power Plan and replaced it with the Affordable Clean Energy rule. In April 2024, the EPA repealed the Affordable Clean Energy rule and adopted new greenhouse gas regulations applicable to certain fossil fuel-fired power plants. In February 2026, the EPA finalized a rule rescinding the 2009 greenhouse gas endangerment finding. The February 2026 rule has been challenged in the United States Court of Appeals for the District of Columbia Circuit, and federal greenhouse gas regulation under the Clean Air Act remains subject to ongoing judicial review and regulatory action. . Legislation and increased regulation and requirements regarding climate change could impose increased costs on us, our venture partners and our suppliers, including increased energy, capital equipment, environmental monitoring and reporting and other costs to comply with such regulations.
Legislation and increased regulation and requirements regarding climate change could impose increased costs on us, our venture partners and our suppliers, including increased energy, capital equipment, environmental monitoring and reporting and other costs to comply with such regulations.
32
Mining companies are increasingly required to consider and provide benefits to the communities and countries in which they operate in order to maintain operations.
Greater scrutiny on the private sector broadly and multi-national companies specifically, to contribute to sustainable outcomes in the places where they operate, has led to a proliferation of standards and reporting initiatives focused on environmental stewardship, social performance and transparency. Extractive industries, and mining in particular, have seen significant increases in stakeholder expectations. These businesses are increasingly required to meaningfully engage with impacted stakeholders, and understand, avoid, or mitigate negative impacts while optimizing economic development and employment opportunities associated with their operations. The expectation is for companies to create shared value for shareholders, employees, governments, local communities and host countries. Such expectations tend to be particularly focused on companies whose activities are perceived to have high socio-economic and environmental impacts. In response, we have developed and continue to evolve a system of Environmental, Social and Governance (“ESG”) management that includes standards, guidance, assurance, participation in international organizations focused on improved performance and outcomes for host communities and the environment. No assurances can be provided that increased stakeholder expectations will not result in adverse financial and operational impacts to the business, including, without limitation, operational disruption, increased costs, increased investment obligations and increased taxes and royalties payable to governments.
Risks Relating to Our Common Stock
A small number of existing shareholders own a significant portion of McEwen Inc. common stock, which could limit your ability to influence the outcome of any shareholder vote.
As of March 16, 2026, Mr. McEwen beneficially owned approximately 14% of the 59.5 million shares of McEwen Inc. common stock outstanding. Under our Articles of Incorporation and the laws of the State of Colorado, the vote of the holders of a majority of the shares voting at a meeting at which a quorum is present is generally required to approve most shareholder action. As a result, Mr. McEwen will be able to significantly influence the outcome of shareholder votes for the foreseeable future, including votes concerning the election of directors, amendments to our Articles of Incorporation or proposed mergers, acquisitions or other significant corporate transactions.
Our stock price may be volatile, and as a result you could lose all or part of your investment.
In addition to other risk factors identified herein and to volatility associated with equity securities in general, the value of your investment could decline due to the impact of any of the following factors upon the market price of our common stock:
| ● | Changes in the worldwide price for gold, silver and/or copper; |
| ● | Disappointing results from our exploration or production efforts; |
| ● | Producing at rates lower than targeted; |
| ● | Political and regulatory risks; |
| ● | Weather conditions, including unusually heavy rains, unusually light rains or drought; |
| ● | Failure to meet our revenue, profit goals or operating budget; |
| ● | Decline in demand for our common stock; |
| ● | Downward revisions in securities analysts’ estimates or changes in general market conditions; |
| ● | Technological innovations by competitors or in competing technologies; |
| ● | Investor perception of our industry or our prospects; |
| ● | Disruption of supply and demand and other economic factors due to virus and other disease; |
| ● | Actions by government central banks; and |
| ● | General economic trends. |
Stock markets in general have in the past and may in the future experience extreme price and volume fluctuations. These fluctuations are often unrelated to operating performance and may adversely affect the market price of our common stock.
33
Adverse price fluctuations may lead to threatened or actual delisting of our common stock from the NYSE or TSX. As a result, you may be unable to resell your shares at the desired price.
Failure of the Company to maintain compliance with the NYSE or TSX listing requirements could result in delisting of its common stock, which in turn could adversely affect its future financial condition and the market for its common stock.
If the common stock ultimately were to be delisted for any reason, it could negatively impact the Company by (i) reducing the liquidity and market price of the Company’s common stock; (ii) reducing the number of investors willing to hold or acquire the Company’s common stock, which could negatively impact the Company’s ability to raise equity financing; (iii) limiting the Company’s ability to use a registration statement to offer and sell freely tradable securities, adversely affecting the Company’s ability to access the public capital markets; and (iv) impairing the Company’s ability to provide equity incentives to its employees.
Failure of the Company to maintain proper and effective internal controls could impair our ability to produce accurate financial statements on a timely basis, which could adversely affect the market price of our common stock.
As a publicly traded company, we are required to maintain disclosure controls and procedures to ensure timely disclosure of material information to the public, and our management is required to review the effectiveness of those controls on a quarterly basis. We are also required to maintain effective internal control over financial reporting, which is a process designed by, or under the supervision of, our Chief Executive Officer and Chief Financial Officer to provide reasonable assurance regarding the reliability of financial reporting and the preparation of financial statements for external purposes in accordance with U.S. GAAP, and our independent registered public accounting firm is required each year to provide an attestation report on the effectiveness of our internal control over financial reporting, including in this Annual Report on Form 10-K. Effective internal controls are necessary for us to provide financial reports and to help us prevent fraud, and our management and other personnel devote a substantial amount of time to these compliance requirements. These requirements, however, also increase our legal and financial compliance costs and make some activities more time-consuming and costly.
We cannot be certain that we will be able to maintain adequate controls over disclosure and financial processes and reporting in the future. We have identified as recently as of the fiscal year ended December 31, 2024, control deficiencies that, in the aggregate, constituted a material weakness in our internal control over financial reporting. If we fail to maintain effective internal controls, investors may lose confidence in the accuracy and completeness of our financial reports, the market price of our common stock may be negatively affected, and our financial position and results of operations could be harmed.
General Risks
We do not insure against all risks to which we may be subject in our operations.
While we currently maintain insurance policies to insure against general commercial liability claims and physical assets at our properties in the United States, Canada, Mexico and Argentina, we do not maintain insurance to cover all of the potential risks associated with our operations. We may also be unable to obtain insurance to cover other risks at economically feasible premiums or at all. Insurance coverage may not continue to be available or may not be adequate to cover liabilities. We might also become subject to liability for environmental, pollution or other hazards associated with mineral exploration and production including bankruptcy of our refiners or other third-party contractors which may not be insured against, which may exceed the limits of our insurance coverage or which we may elect not to insure against because of premium costs or other reasons. Losses from these events may cause us to incur significant costs that could materially adversely affect our financial condition and our ability to fund activities on our property. A significant loss could force us to reduce, temporarily suspend or, in the worst case, terminate our operations.
34
Our business is subject to the U.S. Foreign Corrupt Practices Act and similar worldwide anti-bribery laws, a breach or violation of which could lead to civil and criminal fines and penalties, loss of licenses or permits and reputational harm.
We operate in certain jurisdictions that have experienced governmental and private sector corruption to some degree. The U.S. Foreign Corrupt Practices Act and anti-bribery laws in other jurisdictions generally prohibit companies and their intermediaries from making improper payments for the purpose of obtaining or retaining business or other commercial advantage. Violations of these laws, or allegations of such violations, could lead to civil and criminal fines and penalties, litigation, and loss of operating licenses or permits, and may damage our reputation, which could have a material adverse effect on our business, financial position and results of operations. There can be no assurance that our internal control policies and procedures will always protect us from recklessness, fraudulent behavior, dishonesty, or other inappropriate acts committed by our affiliates, employees or agents. As such, our corporate policies and processes may not prevent all potential breaches of law or other governance practices.
We may not be able to operate successfully if we are unable to recruit, hire, retain and develop key personnel and a qualified and diverse workforce. In addition, we are dependent upon our employees being able to perform their jobs in a safe and respectful work environment.
We depend upon the services of a number of key executives and management personnel. Our success is also dependent on the contributions of our highly skilled and experienced workforce. Our ability to achieve our operating goals depends upon our ability to recruit, hire, retain and develop qualified and diverse personnel to execute on our strategy. We are fundamentally committed to creating and maintaining a work environment in which employees are treated fairly, with dignity, decency, respect and in accordance with all applicable laws. We recognize that bullying, sexual harassment and harassment based on other protected categories, including race, have been prevalent in every industry, including the mining industry. Features of the mining industry, such as being a historically hierarchical and male-dominated culture, create risk factors for harmful workplace behavior. While we do not tolerate discrimination and harassment of any kind (including but not limited to sexual, gender identity, race, religion, ethnicity, age, or disability, among others), our policies and processes may not prevent or detect all potential harmful workplace behaviors. If we fail to maintain a safe, respectful, and inclusive work environment, it could impact our ability to retain talent and maintain a diverse workforce and damage our reputation. There continues to be competition over highly skilled personnel in our industry. If we lose key personnel, or one or more members of our senior management team, and we fail to develop adequate succession plans, or if we fail to hire, retain, and develop qualified and diverse employees, our business, financial condition, results of operations and cash flows could be harmed.
Our business is dependent upon our workforce being able to safely perform their jobs, including the potential for physical injuries or illness. If we experience periods where our employees are unable to perform their jobs for any reason, including as a result of illness, our operations could be adversely affected. In addition to physical safety, protecting the psychological safety of our employees is necessary to maintaining a safe, respectful, and inclusive work environment. If the Company fails to maintain a safe environment that is free of harassment, discrimination, or bullying, it could adversely impact employee engagement, performance and productivity, result in potential legal claims and/or damage the Company’s reputation, which could have a material adverse effect on our business, financial position and results of operations or adversely affect the Company’s market value.
We conduct operations in several foreign countries and are exposed to legal, political and social risks associated with those operations.
A significant portion of our revenue in 2025 was generated by operations outside the United States. Exploration, development, production, and closure activities in many countries are potentially subject to heightened political and social risks that are beyond our control and could result in increased costs, capacity constraints and potential disruptions to our business. These risks include the possible unilateral cancellation or forced renegotiation of contracts in which we may, directly or indirectly, have an interest, unfavorable changes in foreign laws and regulations, royalty and tax increases (including tariffs and taxes associated with the import or export of goods), risks associated with consumption taxes in Mexico, Argentina, and Canada, income tax refund recovery and collection processes in Mexico and Argentina, changes in US legislation as applicable to foreign operations, claims by governmental entities or indigenous communities, expropriation or nationalization of property and other risks arising out of foreign sovereignty over areas in which we conduct our operations.
35
The right to import and export gold and silver may depend on obtaining certain licenses and quotas, which could be delayed or denied at the discretion of the relevant regulatory authorities or could become subject to new taxes or duties imposed by U.S. or foreign jurisdictions, which could have a material adverse effect on our business, financial condition, or future prospects. In addition, our rights under local law may be less secure in countries where the rule of law is less robust and judicial systems may be susceptible to manipulation or influence from government agencies, non-governmental organizations, or civic groups.
Any of these developments could require us to curtail or terminate operations at our mines, incur significant costs in renegotiating contracts and meeting newly-imposed environmental or other standards, pay greater royalties or higher prices for labor or services and recognize higher taxes, or experience significant delays or obstacles in the recovery of consumption taxes or income tax refunds owed, which could materially and adversely affect our financial condition, results of operations and cash flows.
Our ongoing and future success depends on developing and maintaining productive relationships with the communities, including indigenous peoples, and other stakeholders in our operating locations. Notwithstanding our ongoing efforts, local communities and stakeholders can become dissatisfied with our activities or the level of benefits provided, which may result in civil unrest, protests, direct action or campaigns against us. Any such occurrences could materially and adversely affect our financial condition, results of operations and cash flows.
Our business could be negatively impacted by security threats, including cybersecurity threats, and other disruptions.
We face various security threats, including attempts by third parties to gain unauthorized access to sensitive information or to render data or systems unusable; threats to the safety of our employees; threats to the security of our infrastructure; and threats from terrorist acts. There can be no assurance that the procedures and controls we use to monitor and mitigate our exposure to these threats will be sufficient in preventing them from materializing. If any of these events were to materialize, they could lead to losses of sensitive information, critical infrastructure, personnel, or capabilities essential to our operations and could have a material adverse effect on our reputation, financial condition, results of operations, or cash flows.
Our business partners’ technologies, systems and networks may become the target of cyber-attacks or information security breaches that could result in the unauthorized release, gathering, monitoring, misuse, loss or destruction of proprietary and other information, theft of property or other disruption of our business operations. In addition, certain cyber incidents, such as surveillance, may remain undetected for an extended period. A cyber incident involving our business partners’ information systems and related infrastructure could disrupt our business plans and negatively impact our operations. There can be no assurance that we will not be the target of cyberattacks in the future. As cyber threats continue to evolve, we may be required to expend significant additional resources to continue to modify or enhance our protective measures or to investigate and remediate any security vulnerabilities.
Environmental, social and governance matters may impact our business and reputation.
Since 2020, our joint venture partner, Hochschild Mining plc, has published annual sustainability reports. Our El Gallo sustainability report includes our policies and practices on a variety of ESG matters, including water management and preservation; recycling; diversity, equity, and inclusion (“DEI”); employee health and safety; and human capital management. In addition, our business faces increasing scrutiny related to ESG issues, including sustainable development, renewable resources, environmental stewardship, supply chain management, climate change, DEI, workplace conduct, human rights, philanthropy and support for local communities. Implementation of our environmental and sustainability initiatives will require financial expenditures and employee resources.
In addition to the changing rules and regulations related to ESG matters imposed by governmental and self-regulatory organizations such as the SEC and the New York Stock Exchange, a variety of third-party organizations and institutional investors evaluate the performance of companies on ESG topics, and the results of these assessments are widely publicized. These changing rules, regulations and stakeholder expectations have resulted in, and are likely to continue to result in, increased general and administrative expenses and increased management time and attention spent complying with or meeting such regulations and expectations.
36
Reduced access to or increased cost of capital may occur as financial institutions and investors increase expectations related to ESG matters.
Developing and acting on initiatives within the scope of ESG, and collecting, measuring and reporting ESG-related information and metrics can be costly, difficult and time consuming and is subject to evolving reporting standards. We may also communicate certain initiatives and goals, regarding environmental matters, diversity, social investments and other ESG-related matters, in our SEC filings or in other public disclosures. These initiatives and goals within the scope of ESG could be difficult and expensive to implement, the technologies needed to implement them may not be cost effective and may not advance at a sufficient pace, and we could be criticized for the accuracy, adequacy or completeness of the disclosure. Furthermore, statements about our ESG-related initiatives and goals, and progress against those goals, may be based on standards for measuring progress that are still developing, internal controls and processes that continue to evolve and assumptions that are subject to change in the future. In addition, we could be criticized for the scope or nature of such initiatives or goals, or for any revisions to these goals. If our ESG-related data, processes and reporting are incomplete or inaccurate, or if we fail to achieve progress with respect to our goals within the scope of ESG on a timely basis, or at all, our reputation, business, financial performance and growth could be adversely affected.
Several of our directors and officers are residents outside of the United States, and it may be difficult for shareholders to enforce within the United States any judgments obtained against such directors or officers.
Several of our directors and officers are nationals and/or residents of countries other than the United States, and all or a substantial portion of such persons’ assets are located outside of the United States. As a result, it may be difficult for investors to effect service of process on such directors and officers or enforce within the United States any judgments obtained against such directors and officers, including judgments predicated upon the civil liability provisions of the securities laws of the United States or any state thereof. Consequently, shareholders may be effectively prevented from pursuing remedies against such directors and officers under United States federal securities laws. In addition, shareholders may not be able to commence an action in a Canadian court predicated upon the civil liability provisions under United States federal securities laws. The foregoing risks also apply to those experts identified in this report that are not residents of the United States.
The laws of the State of Colorado, our Articles of Incorporation and agreements with certain officers and directors may protect our directors from certain types of lawsuits.
The laws of the State of Colorado provide that our directors will not be liable to us or our shareholders for monetary damages for all but certain types of conduct as directors of the Company. Our Articles of Incorporation permit us to indemnify our directors and officers against all damages incurred in connection with our business to the fullest extent provided or allowed by law, including through stand-alone indemnity agreements. We have also entered into indemnification agreements with our executive officers and directors which require that we indemnify them against certain liabilities incurred by them in their capacity as such. The exculpation provisions may have the effect of preventing shareholders from recovering damages against our directors caused by their negligence, poor judgment, or other circumstances. The indemnification provisions may require us to use our limited assets to defend our directors and officers against claims, including claims arising out of their negligence, poor judgment, or other circumstances.
We may be required to write down certain long-lived assets, due to metal prices, operational challenges, or other factors. Such write- downs may adversely affect the results of our operations and financial condition.
We review our long-lived assets for recoverability pursuant to the Financial Accounting Standard Board’s Accounting Standards Codification Section 360. Under that standard, we review the recoverability of our long-lived assets, such as our mining properties, quarterly or upon a triggering event. Such a review involves estimating the future undiscounted cash flows expected to result from the use and eventual disposition of the asset. Impairment, measured by comparing an asset’s carrying value to its fair value, must be recognized when the carrying value of the asset exceeds these cash flows. We conduct a review of the financial performance of our mines in connection with the preparation of our financial statements for each reported period and determine whether any triggering events are indicated.
37
For example, during the first quarter of 2020, we performed a comprehensive analysis of the Gold Bar mine and the related long-lived assets and determined that indicators of impairment existed, and we ultimately concluded that the carrying value of the long-lived assets for the Gold Bar mine were impaired, and a non-cash impairment charge of $83.8 million was recorded during the first quarter of 2020. If there are further significant and sustained declines in relevant metal prices, or if we fail to control production and operating costs or realize the mineable ore reserves at our mining properties, we may terminate or suspend mining operations at one or more of our properties. These events could require a further write-down of the carrying value of our assets. Any such actions would adversely affect the results of our operations and financial condition.
We may record other types of charges in the future if we sell a property or asset for a price less than its carrying value or have to increase reclamation liabilities in connection with the closure and reclamation of a property. Any additional write-downs of mining properties or other assets could adversely affect our results of operations and financial condition.
A significant delay or disruption in sales of concentrates or doré as a result of the unexpected disruption in services provided by smelters or refiners or other third parties could have a material adverse effect on our results of operations.
We rely on refiners and smelters to refine and process and, in some cases, purchase the gold and silver doré and concentrate produced by our mines or the mines in which we have an interest. Access to refiners and smelters on economic terms is critical to our ability to sell our products to buyers and generate revenues. We have existing agreements with refiners and smelters, some of which operate their refining or smelting facilities outside the United States. Services provided by a refiner or smelter may be disrupted by new or increased tariffs, duties or other cross-border trade barriers, shipping delays, the bankruptcy or insolvency of one or more refiners or smelters or the inability to agree on acceptable commercial or legal terms with a refiner or smelter. Such an event or events may disrupt an existing relationship with a refiner or smelter or result in the inability to create (or the necessity to terminate) a contractual relationship with a refiner or smelter, which may leave us with limited, uneconomical or no access to refining or smelting services for short or long periods of time. Epidemics, pandemics, or natural disasters may also impact refiners, smelters or other third parties with which we have contractual arrangements or have an indirect effect on our ability to obtain refining, smelting or other third-party services.
Any delay or loss of access to refiners or smelters may significantly impact our ability to sell doré and concentrate products and generate revenue. A default by a refiner or smelter on its contractual obligations to us or an insolvency event or bankruptcy filing by a refiner or smelter may result in the loss of all or part of our doré or concentrate in the possession of the refiner or smelter, and such a loss likely would not be insured by our insurance policies. We cannot ensure that alternative refiners or smelters would be available or offer comparable terms if the need for them were to arise or that it would not experience delays or disruptions in sales that would materially and adversely affect results of operations.
38
ITEM 1B. UNRESOLVED STAFF COMMENTS
[NONE]
ITEM 1C. CYBERSECURITY
Risk Management and Strategy
The Company understands the importance of preventing, assessing, identifying, and managing material risks associated with cybersecurity threats. Cybersecurity processes to assess, identify and manage risks from cybersecurity threats have been incorporated as a part of the Company’s overall risk assessment process. On a regular basis we implement into our operations these cybersecurity processes, technologies, and controls to assess, identify, and manage material risks, including those risks posed by our use of third-party service providers. Specifically, we engage third-party cybersecurity firms to assist with network and endpoint monitoring, cloud system monitoring, and assessment of our incident response procedures, risk identification and assessment of material cybersecurity threats.
To manage our material risks from cybersecurity threats and to protect against, detect, and prepare to respond to cybersecurity incidents, we undertake the below listed activities:
| ● | Monitor security and information events on a real-time basis to respond to threats as they occur; |
| ● | Monitor emerging data protection laws and implement changes to our processes to comply; |
| ● | Conduct annual cybersecurity management and incident training for employees involved in our systems and processes that handle sensitive data; |
| ● | Update key employees regularly on phishing email and other cybersecurity risks; |
| ● | Employ artificial intelligence assisted cybersecurity monitoring capabilities; and |
| ● | Complete regular updates to key software and infrastructure. |
Management has not identified any specific risks from cybersecurity threats, including as a result of any previous cybersecurity incidents, that have materially affected or are reasonably likely to materially affect the Company, including its business strategy, results of operations or financial condition. See “Item 1A. Risk Factors, Our business could be negatively impacted by security threats, including cybersecurity threats, and other disruptions.” above for more information. While we continually work to safeguard the information systems we use, and the proprietary, confidential and personal information residing therein, and mitigate potential risks, there can be no assurance that such actions will be sufficient to prevent cybersecurity incidents or mitigate all potential risks to such systems, networks and data or those of our third-party providers.
Governance
Our Audit Committee of the Board of Directors is responsible for oversight of our risk assessment, risk management, disaster recovery procedures and cybersecurity risks. The Audit Committee periodically receives an overview of our cybersecurity threat risk management and strategy processes, including potential impact on the Company, the efforts of management to manage the risks that are identified, and our disaster recovery preparations. Members of the Board of Directors regularly engage in discussions with management on cybersecurity-related news events and discuss any updates to our cybersecurity risk management and strategy programs.
Our cybersecurity risk management and strategy processes, which are discussed in greater detail above, are led by our Director of IT. The Director of IT is informed about and monitors the prevention, mitigation, detection, and remediation of cybersecurity through their management of the cybersecurity risk management and strategy processes described above, including our incident response plan. Together with the General Counsel, information technology staff and outside consultants that comprise our cybersecurity management team, we collectively possess significant experience in evaluating, managing, and mitigating security and other risks, including cybersecurity risks.
39
ITEM 2. PROPERTIES
We classify our mineral properties into reportable segments consistent with the manner in which they are grouped in Item 8. Financial Statements and Supplementary Data, Note 3, Operating Segment Reporting and subdivide them within each segment by their respective stage of development: “production properties”, “advanced-stage properties” and “exploration properties.” Advanced-stage properties consist of properties for which advanced studies and reports have been completed indicating the presence of economically mineable mineralized material or in some cases, proven and probable reserves, and for which we have obtained or are in the process of obtaining the required permitting. Our designation of certain properties as “production properties” or “advanced-stage properties” should not suggest that we have proven or probable reserves at those properties as defined by S-K 1300. Our current operating or advanced stage properties are the following: the Fox Complex in Ontario, Canada; the Gold Bar Mine Complex in Nevada, United States; El Gallo in Sinaloa, Mexico; the Los Azules copper project in San Juan, Argentina; and the San José mine in Santa Cruz, Argentina.
The location of our significant production, advanced-stage and exploration properties is shown below:
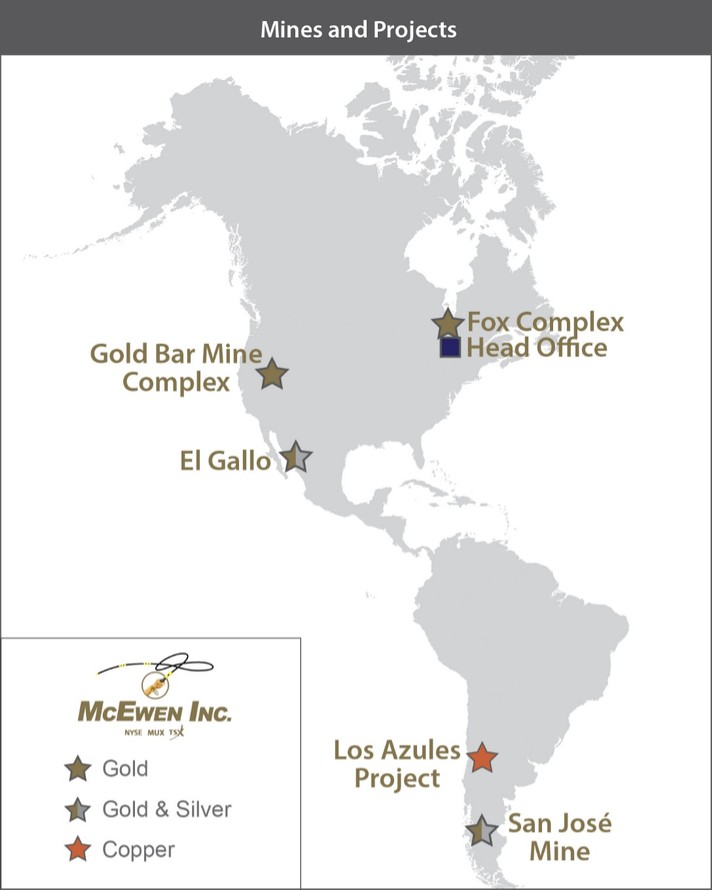
40
SEGMENT: UNITED STATES
The following map depicts the location of our major properties in the United States segment, including the Gold Bar Mine Complex and exploration properties which are fully owned by us or subject to joint venture agreements. The Gold Bar mine is located in the southern Roberts Creek Mountains along the prolific Battle Mountain-Eureka-Cortez gold trend in central Nevada. Approximately 25 miles northwest of the Gold Bar mine is the Cortez gold mine owned by Nevada Gold Mines (Barrick Gold Corporation and Newmont Corporation joint venture), and 25 miles southeast is the producing Ruby Hill mine owned by i-80 Gold Corp.
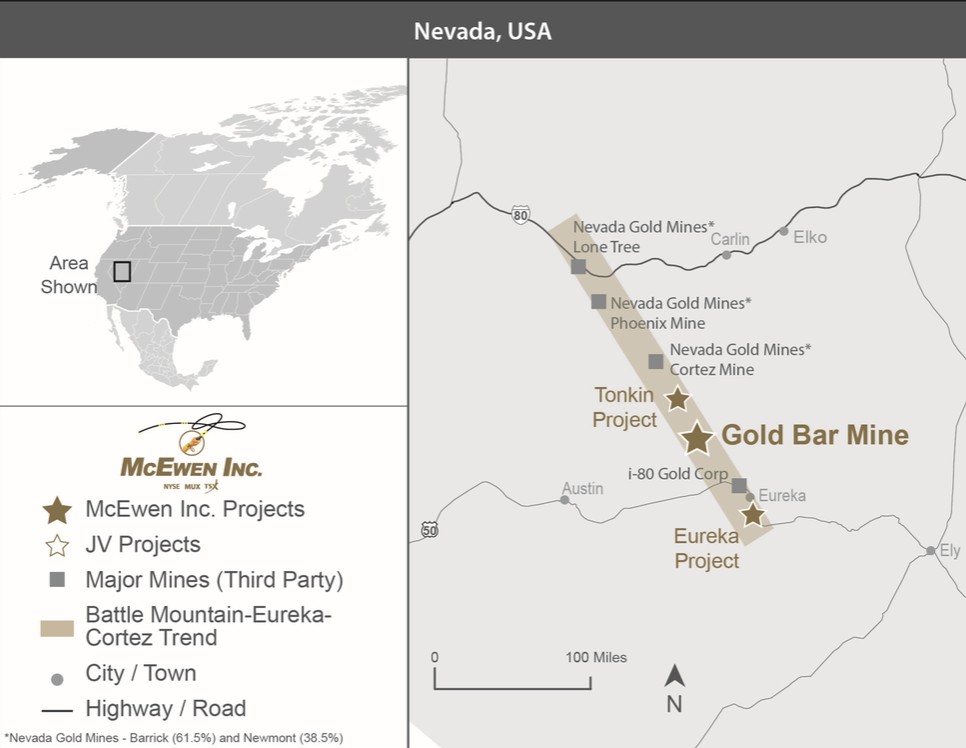
The following table summarizes the land position of our properties in Nevada as of December 31, 2025:
|
|
Number of |
|
Square |
|
Square |
United States Mineral Property Interest |
|
Claims |
|
Miles |
|
Kilometers |
Gold Bar mine |
|
2,376 |
|
97 |
|
251 |
Tonkin |
|
1,390 |
|
45 |
|
117 |
Eureka |
|
1,076 |
|
29 |
|
75 |
Other Properties |
|
1,389 |
|
44 |
|
114 |
Total United States Properties |
|
6,231 |
|
215 |
|
557 |
41
Production Properties
Gold Bar Mine Complex, Nevada (100% owned)
For detailed information on the Gold Bar Mine Complex production statistics and financial results, refer to Item 7. Management’s Discussion and Analysis of Financial Condition and Results of Operations.
Overview and History
The Gold Bar Mine Complex consists of the currently operating Gold Bar mine, as well as the Tonkin and Eureka exploration projects. The Gold Bar mine is an open pit, oxide gold mine with a processing facility, heap leach pad and gold recovery plant. The mine is located primarily on public lands managed by the Nevada Bureau of Land Management. We commenced construction in November 2017 following receipt of the signed Record of Decision from the U.S. Environmental Protection Agency. The Gold Bar mine achieved commercial production on May 23, 2019. Mining currently occurs at the Pick, Ridge, and Gold Bar South deposits.
The property is located within the Battle Mountain-Eureka-Cortez gold trend in Eureka County, Nevada. The property was previously mined from 1987 to 1994 by Atlas Precious Metals Inc.
Location and Access
The Gold Bar mine is located in the Southern Roberts Creek Mountains, in Eureka County, Nevada, approximately 30 miles northwest of the town of Eureka, Nevada, primarily in Township 22 North, Range 50 East (N39°48’16.5”; W116°21’09.65”). The mine site is accessed from US Highway 50 by travelling north on Robert’s Creek Road, an unimproved dirt road maintained by the Company. The mine area is approximately 15 miles from U.S. Highway 50.
Geology and Mineralization
The mine is located in the Battle Mountain-Eureka-Cortez mineral belt in a large window of lower-plate carbonate rocks surrounded by upper-plate rocks. The lower-plate carbonates consist of (from oldest to youngest) an east-dipping section of Silurian Lone Mountain Dolomite, Devonian McColley Canyon Formation, Devonian Denay Formation, Devonian Devils Gate Limestone, and Devonian Horse Canyon siltstone. Gold mineralization is hosted primarily in the Bartine Member of the McColley Canyon Formation, which consists of carbonate wackestones and packstones approximately 250 to 380 feet thick. Minor amounts of mineralization are found in the underlying dolomitic limestone Kobeh Member of the McColley Canyon Formation where it is adjacent to apparent feeder structures. The project is in an area with “Carlin-Type” sediment-hosted gold mineralization characteristics with typical associated alteration (decalcification, argillization, and silicification).
At Ridge, extensive alteration (silicification) and gold mineralization occurs at surface and at depth proximal to three historical open pits. Drilling is ongoing to extend mineralization beyond the currently defined resource.
At Pick, strong alteration and gold mineralization is strata-bound in the Bartine Member of the McColley Canyon Formation and controlled by high-angle north to northeast faults. Mineralization is typically associated with strong decalcification and argillization of the host limestone and local pods of remobilized carbon.
At Gold Bar South, oxide gold mineralization is stratigraphically hosted in Devonian Horse Canyon siltstone overlying the Devonian Devils Gate Limestone. Mineralization occurs along the crest of a broad fold with higher-grade mineralization focused along the intersection of northwest and northeast faults. The alteration footprint significantly extends to the north and south of the deposit with future drilling planned to expand the current footprint.
42
Facilities and Infrastructure
Gold Bar mine construction began in November 2017 with key site facilities and infrastructure completed by the end of 2018. Commercial production was declared on May 23, 2019. The Gold Bar mine has well developed infrastructure including on-site power generation and transmission lines, water, natural gas, and related supply utilities as well as buildings which support the operations and administration. The water supply for the Gold Bar mine and processing facilities comes from production wells located approximately two miles southeast from the site and powered by a diesel generator. Ongoing open-pit mining is performed by a third-party mining contractor. Mineralized material from the mine is transported to the crusher and conveyor system with the crushed and agglomerated material transported to the heap leach pad via an overland conveyor.
The mineralized material is stacked onto the heap using a radial stacker and then leached with a diluted cyanide solution to extract the precious metals. The gold is recovered from the pregnant solution in the carbon plant by adsorbing the dissolved gold onto activated carbon followed by desorption, electrowinning, retorting and smelting to recover the gold as a final doré product.
Exploration Activities
We are in the early stages of evaluating the Trinity Ridge (previously known as Unity Ridge) concept, which contemplates the expansion and merger of three existing open pits at the Gold Bar mine into one larger mining area which could increase gold resources and extend mine life. As of the end of 2025, the Company has completed a series of drillholes between and below the open pits with results that intersected oxide gold mineralization, including a strong intercept of 3.6 g/t gold over 48.8 meters.
Exploration Properties
Tonkin property (100% owned)
The Tonkin property represents our second largest holding within the Battle Mountain-Eureka-Cortez trend in Eureka County, Nevada with approximately 45 square miles of claims. The Tonkin property consists of the Tonkin deposit and the previously operating Tonkin mine.
From 1985 through 1989, the Tonkin mine produced approximately 30,000 ounces of gold utilizing an oxide heap leach and a separate ball mill involving bio-oxidation to treat refractory sulfide mineralized material. Due to cost escalation and recovery issues, the operation was shut down. The mine site is currently on care and maintenance, and we are advancing reclamation while evaluating future development opportunities at the Tonkin mine.
As part of its ongoing business and operations, the Company is required to provide bonding for its environmental reclamation obligations. As at December 31, 2025, the Company had surety facilities in place to cover its $4.2 million of bonding obligations on the Tonkin property.
Eureka property (100% owned)
The Eureka property is a group of exploration stage claims acquired on August 19, 2024 through the acquisition of Timberline Resources Corporation. The property is situated in the southern part of the Eureka mining district and consists of the Lookout Mountain gold resource and a pipeline of earlier-stage targets that feature past gold production, historic gold estimates, and/or drill-indicated gold mineralization. The Company is currently advancing towards establishing a mineral resource on the Windfall property.
43
Drilling at Lookout Mountain focused on infilling areas of the existing deposit to convert Inferred Resources into the Measured and Indicated categories, and obtain samples to commence metallurgical testing to confirm the use of the same heap leach recovery process currently used at the Gold Bar mine. At Windfall, a resource estimate is planned for 2026 with recent results indicating excellent continuity of near-surface oxide gold mineralization along a 1.6-kilometre-long section of the north-south-trending Windfall fault zone. Recent drilling results as of December 8, 2025 include intercepts of 1.0 g/t gold over 89.9 meters at Lookout Mountain and 4.6 g/t gold over 26.7 meters at Windfall.
44
Other exploration properties
We hold other exploration stage properties throughout Nevada and Colorado which are not considered material at this time. The following table summarizes our properties (other than the Gold Bar Mine Complex properties) in the State of Nevada, United States:
Property name |
County |
Type of Interest |
Acres/Hectares |
Conditions |
Ownership |
Cornerstone |
Eureka County |
50 unpatented claims |
1015/411 |
Not currently under agreement. |
Held by Nevada Pacific Gold LLC |
Patty JV |
Eureka County |
Total of 616 claims |
12644/5117 |
Joint Venture with Nevada Gold Mines (60% as Manager) |
McEwen Mining Nevada Inc. |
New Pass |
Churchill County |
107 unpatented claims |
2211/895 |
Under a 50/50 JV with Bonaventure (Iconic) |
Held by McEwen Mining Nevada Inc. |
South Midas |
Elko County |
151 unpatented claims |
3096/1253 |
Under a 50/50 JV with Bonaventure (Iconic) |
Held by McEwen Mining Nevada Inc. |
Slaven Canyon |
Lander County |
68 unpatented claims |
1382/559 |
Not currently under agreement. |
Held by WKGUS LLC |
Keystone and O'Dair |
Eureka County |
2 patented claims |
16/7 |
Not currently under agreement. |
Owned by: |
Trail (Eureka) |
Eureka County |
30 unpatented claims |
620/251 |
Not currently under agreement. |
Held by Wolfpack Gold (Nevada) Corporation |
South Ratto (Eureka) |
Eureka County |
108 unpatented claims |
1850/749 |
Not currently under agreement. |
Held by BH Minerals USA Inc |
Hoosac & North Amselco (Eureka) |
Eureka County |
192 unpatented claims |
3100/1255 |
Not currently under agreement. |
Held by BH Minerals USA Inc |
Silverado (Eureka) |
Eureka County |
10 leased unpatented claims |
947/383 |
1% NSR to Silver International |
Held by Timberline Resources Corporation |
Oswego (Eureka) |
Eureka County |
111 unpatented claims |
1488/602 |
Not currently under agreement. |
Held by BH Minerals USA Inc |
New York Canyon (Eureka) |
Eureka County |
Total of 56 claims |
929/376 |
Not currently under agreement. |
Held by BH Minerals USA Inc and Timberline Resources Corporation |
Q Claims (Eureka) |
Eureka County |
104 unpatented claims |
2149/870 |
Not currently under agreement. |
Held by Timberline Resources Corporation |
LS Claims (Eureka) |
Eureka County |
28 unpatented claims |
578/234 |
Not currently under agreement. |
Held by Timberline Resources Corporation |
Gold Canyon |
Eureka County |
26 unpatented claims |
578/234 |
Not currently under agreement. |
Held by Timberline Resources Corporation |
Seven Troughs |
Pershing County |
Total of 325 claims |
4030/1631 |
Not currently under agreement. |
Held by Timberline Resources Corporation |
Paiute |
Lander-Humboldt County |
65 unpatented claims |
1500/607 |
Not currently under agreement. |
Held by Timberline Resources Corporation |
Elder Creek |
Lander-Humboldt County |
573 unpatented claims |
11838/4791 |
Not currently under agreement. |
Held by Nevada Pacific Gold LLC |
Downeyville |
Nye County |
5 patented claims |
63/25 |
Not currently under agreement. |
Held by Timberline Resources Corporation |
Gold Canyon |
Eureka County |
26 unpatented claims |
537/217 |
Not currently under agreement. |
Held by McEwen Mining Nevada Inc. |
Elder Creek (BMX & E. Marigold) |
Lander-Humboldt County |
573 unpatented claims |
11838/4791 |
Not currently under agreement. |
Held by Nevada Pacific Gold LLC |
45
SEGMENT: CANADA
The following map depicts the location of our major properties forming the Canada segment of our operations. The properties within the Canada segment are located in the well-established Timmins Gold Mining district in Northern Ontario, Canada. The segment consists of the Black Fox and Stock properties and various exploration and advanced stage properties (the “Fox Complex”), comprising 5,100 hectares of land packages intersecting nine miles of the Destor-Porcupine Fault, which is known as the ‘Golden Highway’. The Destor-Porcupine Fault has a total strike length of approximately 124 miles and hosts many of Ontario and Quebec’s prolific gold mines.
The Black Fox property includes the Black Fox mine and surrounding properties, including the advanced-stage Grey Fox property and Froome mine, the latter of which declared commercial production during the third quarter of 2021. The Stock property, the site of the former Stock mine, is located approximately 17 miles west of the Black Fox mine. The Stock property includes the Stock mill, where mineralized material from the Froome mine is transported and processed, and the Stock advanced development project. In addition, the Canada segment includes other exploration properties such as Fuller, Davidson-Tisdale, Buffalo Ankerite and Paymaster.
The location of the various properties is shown below:

46
The following table summarizes the Canada land position of our company as of December 31, 2025:
|
|
Number of |
|
Number of |
|
Square |
|
Square |
Canada Mineral Property Interest |
|
PINs (1) |
|
Claims |
|
Miles |
|
Kilometers |
Black Fox Property |
|
38 |
|
53 |
|
11 |
|
28 |
Stock Property |
|
27 |
|
108 |
|
10 |
|
26 |
Davidson-Tisdale |
|
11 |
|
- |
|
2 |
|
5 |
Fuller |
|
4 |
|
1 |
|
1 |
|
3 |
Paymaster |
|
15 |
|
- |
|
1 |
|
3 |
Buffalo Ankerite |
|
7 |
|
- |
|
3 |
|
8 |
Total Canada Properties |
|
102 |
|
162 |
|
28 |
|
73 |
| (1) | Parcel Identification Number (“PIN”) is a unique number assigned to each automated parcel in the Ontario Land Registry. |
Production Properties
Fox Complex, Canada (100% owned)
For detailed information on the Fox Complex production statistics and financial results, refer to Item 7. Management’s Discussion and Analysis of Financial Condition and Results of Operations.
Overview and History
We acquired the properties comprising the Fox Complex in 2017. These properties are located in the well-established Timmins Gold Mining district in Northern Ontario, Canada. Given the proximity to communities in a region with primary industries of mining and forestry, local supplies and services are easily available and deliverable in a timely manner to our operations.
The Black Fox property includes the Froome and Black Fox mines and the Grey Fox deposit. The Black Fox mine initially produced gold from 1997 to 2001, operated by Exall Resources Limited. Re-commissioned by Brigus Gold Corporation (“Brigus”), the mine restarted in early 2009. Primero Mining Corp. (“Primero”) acquired Brigus on March 5, 2014, and continued to operate the mine. We acquired the property on October 3, 2017, and continued commercial operations. During 2021, mining transitioned to the Froome mine where we have been operating since.
Our Stock property hosts the Stock mill and is the site of the former Stock mine previously operated until 2005 by St Andrew Goldfields Ltd. Exploration initiated by us in 2018 through 2025 has defined three mineralized zones at the Stock property, the down dip component of the historical Stock Mine, and Stock West, within a 2-mile mineralized trend along the Destor-Porcupine Fault. The Company is currently developing the Stock property as an underground mine, targeting commercial production by 2027.
The Fox Complex contains 132 parcels representing patents and leases and 163 unpatented mining claims totaling 28 square miles in mining rights, as well as 13 square miles in surface rights. All land parcels are located within the Beatty, Hislop, Stock, Bond and German townships in the municipality of Black River-Matheson as well as within the Deloro and Tisdale townships in the City of Timmins.
Location and Access
The Black Fox and Froome mines are located six miles east of Matheson, Ontario, and accessed directly from Highway 101 East. Matheson, in turn, is located approximately 45 miles east of Timmins, which has a commercial airport. Timmins is approximately 342 miles north of Toronto by air. The approximate coordinates of the Black Fox mine are N48°32'2" and W80°20'2".
47
The Stock mill is located approximately 17 miles from the Black Fox and Froome mines. Mineralized material is trucked to the mill from the Froome and Black Fox mines. The approximate coordinates for the geographic center for the Stock property are N48°33'0" and W80°45'1".
Geology and Mineralization
All of our properties in the Timmins-Matheson region are located within the Archean aged, Abitibi greenstone belt. Gold mineralization at the Black Fox and Froome mines occurs in different geological environments within a complex system of structurally-prepared pathways (conduits) that host economic quantities of gold mineralization as: (1) free gold grains associated with shallow dipping quartz veins (flats) and stockworks within green carbonate and ankerite-altered ultramafic rocks; (2) gold associated with the development and distribution of pyrite, and (3) free gold carried within steeply dipping sigmoidal/sheared quartz veins.
Facilities and Infrastructure
The Black Fox property has well developed infrastructure including electricity, roads, water supply and high-speed internet access. There are seven fully serviced modular buildings supporting various functions of the underground mine, including a maintenance shop, warehouse, compressed air plant, backfill plant and water management facilities. Mineralized material from the Froome mine is transported to, and processed at, the Stock mill, which has a nominal processing capacity of 1,200 tonnes per day.
The primary water supply for the Black Fox property comes from an on-site freshwater well and water produced from dewatering activities. Current water supplies are adequate to sustain current and planned future operations.
The Stock property, the site of our Stock mill, also has well developed infrastructure including electricity, roads, water supply and high-speed internet access. Two buildings support security and administration of the mill. There is an assay lab and several other buildings to support operations and milling, including a hoist house, warehouse, and maintenance shop, mine dry building, crusher and conveyor systems and the mill building itself. The site also houses various support structures including storage and generator buildings.
Underground Mine Development
Froome mine, Canada (100% Owned)
The Froome mine, which is part of the overall Fox Complex, is accessed from two declines from the bottom of the Black Fox pit and is situated approximately one-half mile west of the Black Fox mine. The mineralized material from Froome is hauled approximately 20 miles to the Stock mill, where it is processed.
Development of the underground access to the Froome mine was completed during 2021 and commercial production was achieved in Q3 2021. While current production is sourced from the Froome mine, we expect to transition activities to the higher grade Stock mine towards the end of 2026.
Advanced-Stage Properties
Stock, Canada (100% owned)
The Stock project is located approximately one mile west of the historic Stock mine shaft and 0.6 miles southwest of the Stock mill. The Stock property is easily accessible via an access road from Highway 101 located approximately one mile to the south. The approximate coordinates for the geographic center for the Stock property are N48°33'0" and W80°45'1".
The Stock property is the site of the former Stock mine, which produced 137,000 ounces of gold from an underground operation between 1989 and 2005.
48
Exploration activities (primarily diamond drilling and geophysical surveys) were initiated at the Stock property in early 2018 and continued at a steady pace throughout 2019. These efforts led to the discovery of additional mineralized material at the East zone, and a new source of potentially economic bulk mineralization at the West zone. From 2021 to 2023, a diamond drill program totaling 197 holes and 224,770 feet was executed at Stock and close to the former producing Stock Mine generally within two plunge vectors. In addition, 11,870 feet of drilling from 16 drillholes were completed at the East zone (located approximately 2,600 feet east of the historic Stock Mine).
Development activities at the Stock project advanced in line with the Company’s 2025 mine development plan. In Q4/25, we invested $10.9 million to advance development at the Stock project (full year 2025 - $29.5 million). Site construction progressed across critical infrastructure, including access roads, building foundations, and essential service areas, as well as surface facilities, including the mine dry, office complex, and maintenance buildings. Rehabilitation of historical infrastructure continued, with steady progress on shaft access and safety improvements. Ramp development advanced at an average rate of 20.0 feet (6.2 meters) per day during Q4/25, supporting key project milestones. Overall, project execution during full year 2025 remained consistent with schedule and budget expectations, reinforcing the Company’s target for commencement of commercial production in 2027.
Grey Fox, Canada (100% owned)
The Grey Fox project is located 2.2 miles southeast of Black Fox mine and adjacent to Agnico Eagle’s formerly producing Hislop mine. Access is either by paved or well maintained, two-way, dirt roads. The approximate coordinates of Grey Fox are N48°30'20.0” and W80°18'20.0”.
An internal feasibility-level study completed on the Grey Fox project in early 2015 by Primero Mining recommended further development of the deposit. Further advanced project work continued until 2016, when Primero ceased all non-essential expenditures.
In 2021, McEwen undertook a substantial surface exploration program of 185 holes and nearly 255,000 feet of core drilling that focused on the Stock and Grey Fox properties supporting a S-K 1300 Initial Assessment Technical Report. A mineral resource update was completed for Grey Fox as of December 31, 2025. The mineral resource update increased the contained indicated gold by 23% to 1,892,000 ounces and due mainly to successful conversion of inferred to indicated, the inferred resource decreased by 5% to 436,000 ounces. The expansion of mineral resources at Grey Fox are attributable to exploration activities conducted during the year and a change in the gold price used in calculations. Exploration at Grey Fox in 2025 included 201,319 feet (61,362 meters) of diamond drilling, primarily focused on the Gibson Zone, where favorable grades and widths were identified. Other priority drill targets included the Stroud property, which is contiguous with Grey Fox, to verify a historical resource. Objectives for 2025 were centered on delineating near-term resources at Grey Fox in support of its prefeasibility study and identifying additional targets to support future resource growth.
Other Exploration Properties
Other exploration properties acquired in connection with our acquisition of Lexam VG Gold Inc. in 2017 include Davidson-Tisdale, Fuller, Paymaster and Buffalo Ankerite which are not considered material at this time. No exploration work was performed at these properties in 2025.
The following table summarizes our properties (other than Black Fox, Grey Fox and Froome mines and the Stock Project) in the Province of Ontario, Canada:
Property name |
Municipality |
Type of Interest |
Acres/Hectares |
Conditions |
Ownership |
Buffalo Ankerite |
Timmins |
7 Patented claims |
1364/552 |
Exploration |
Held by McEwen Inc. via Lexam VG Gold Inc. |
Paymaster |
Timmins |
15 Patented claims |
432/175 |
Exploration |
60% JV interest with Newmont (40%) |
Black Fox North |
Black River-Matheson |
50 Unpatented claims |
1608/651 |
Exploration |
100% McEwen Inc. |
49
SEGMENT: MEXICO
The following map depicts the location of our property forming the Mexico segment, of which El Gallo is described in the sections below:
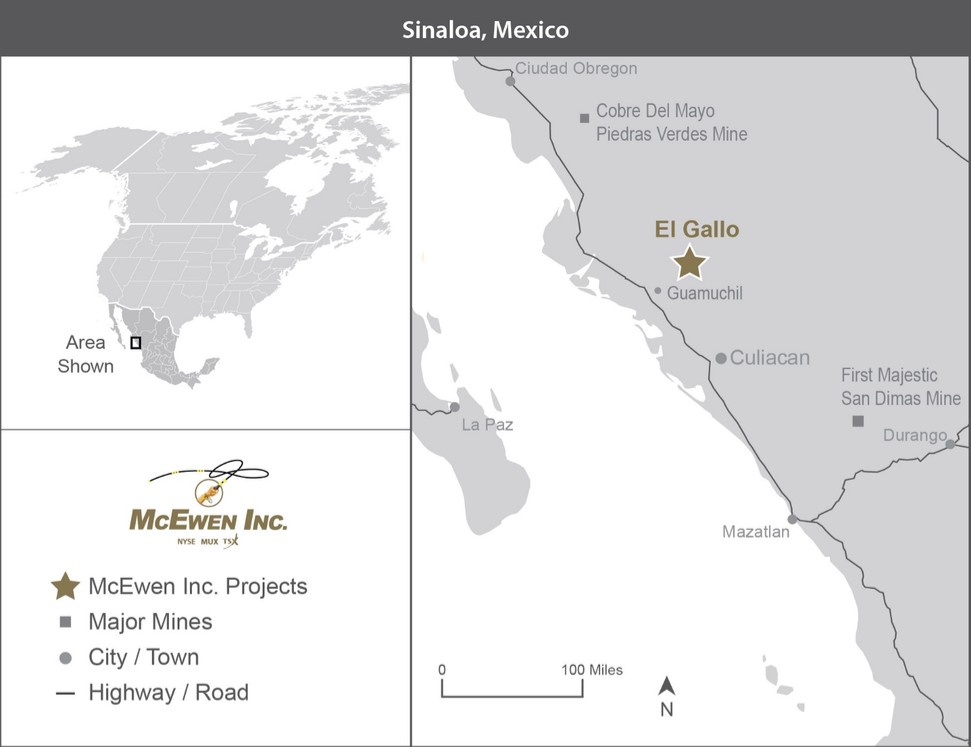
The following table summarizes the Company’s land position in Mexico as of December 31, 2025:
Mexico Mineral Property Interest |
|
Claims |
|
Square Miles |
|
Square Kilometers |
El Gallo |
|
8 |
|
32 |
|
84 |
Other Mexico properties |
|
36 |
|
173 |
|
449 |
Total Mexico Properties |
|
44 |
|
205 |
|
533 |
50
Mexico Properties
El Gallo, Mexico (100% owned)
Overview and History
We own 100% of El Gallo, consisting of the El Gallo mine, originally known as the Magistral mine, in addition to the El Gallo Silver deposit. The El Gallo mine was an open pit gold mine and heap leach operation that we operated from September 2012 to June 2018, when we ceased active mining. Residual leaching production and ongoing closure and reclamation activities continued through 2025.
El Gallo consists of 8 square miles of concessions. Concession titles are granted under Mexican mining law. Mining concessions are subject to annual work requirements and payment of annual surface taxes that are assessed and levied on a semi-annual basis in accordance with Mexican law. An annual lease agreement for surface access to El Gallo is currently in place.
Two areas of interest located within these concessions form the basis for the mineral resource estimate included in a feasibility study published on February 16, 2021 previously referred to as the Fenix Project. The Fenix Project envisions a two-phase development process: Phase 1 involves the reprocessing of material from the leach pad at the existing El Gallo mine, referred to as HLM. Phase 2 encompasses the processing of open-pit silver mineralization from the nearby El Gallo Silver deposit, utilizing our existing processing plant.
The processing plant is expected to employ proven and conventional mineral processing and precious metal recovery technologies. Phase 1 is projected to have a processing rate of 3,400 tonnes per day.
Tailings generated during operations will be stored in the depleted open-pit Samaniego pit at El Gallo. This approach provides increased safety by avoiding the construction of embankment structures, focusing solely on the geochemical stability of the pit, rather than its physical stability.
On December 16, 2025, the Company announced the extension of its Environmental Impact Assessment (Manifestación de Impacto Ambiental) for El Gallo, which was a crucial step in allowing the Company to begin mill construction. Processing of the HLM is expected to continue for 10 years, producing approximately 20,000 GEOs annually once commercial production is achieved. Remaining capital costs to complete construction are estimated at $25 million. Since the material that will be processed has been previously leached, there will be no significant development or exploration costs anticipated.
Location and Access
El Gallo and the surrounding properties are in northwestern Mexico in the western foothills of the Sierra Madre Occidental mountain range, within the State of Sinaloa in the Mocorito Municipality, approximately 60 miles by air northwest of Culiacan, the capital city of Sinaloa State. Access is by paved and well maintained, two-way dirt roads. The concession area is located approximately 20 miles by road from the village of Mocorito, approximately 30 miles from the town of Guamúchil. The approximate coordinates for the center of the district are longitude W107°51’ and latitude N25°38’.
Facilities and Infrastructure
El Gallo has well-developed infrastructure including electricity, roads, water supply and high-speed internet access. There is a truck shop, a warehouse, a fuel depot, core logging facilities, an explosives magazine, heap leach pads, process ponds, an assay laboratory, a three-stage crushing plant, an adsorption-desorption-recovery (“ADR”) process plant with a sulfidation-acidification recovery (“SAR”) circuit added in the first quarter of 2018 and an administrative office. The laboratory is equipped to process all assay samples from the mine, core, chips and soil. The metallurgical lab can determine cyanide leaching amenability and gold and silver recoveries of mineralized material amenable to cyanide leaching.
51
We purchased a secondhand gold processing plant and associated equipment in September 2022. As of the end of 2025, most of the equipment necessary for the plant has been mobilized to our project site to undergo a comprehensive refurbishment program. This will allow us to maximize the utilization of each acquired equipment, with the mills being the first to be mobilized and refurbished, now ready for installation.
The following table summarizes our properties (other than El Gallo) in Mexico:
Property name |
Municipality |
Type of Interest |
Acres/Hectares |
Conditions |
Ownership |
El Gallo Silver (partial) |
Mocorito, Sinaloa Mexico |
1 patented claim |
2923/1183 |
None |
100% McEwen Inc. |
El Encuentro (partial) |
Mocorito, Sinaloa Mexico |
2 patented claims |
1040/421 |
Payment of royalties as of January 31, 2022 |
Held by McEwen Inc. via purchase option with Almaden de Mexico - Minera Gavilan SA de CV |
Palmarito |
Mocorito, Sinaloa Mexico |
1 patented claim |
282/114 |
Payment of royalties for the period from July 14, 2016 to July 14, 2026 |
Held by McEwen Inc. via purchase option with Consorcio Minero Latinoamericano SA de CV |
Palmarito |
Mocorito, Sinaloa Mexico |
2 patented claims |
1774/718 |
None |
Held by McEwen Inc. via purchase option with Atonilco Construcciones SA de CV |
San Dimas |
Mocorito, Sinaloa Mexico |
1 patented claim |
259/105 |
None |
Held by McEwen Inc. via purchase option with Arturo Molina |
Mina Grande (partial) |
Sinaloa de Leyva, Sinaloa Mexico |
1 patented claim |
151/61 |
None |
Held by McEwen Inc. via purchase option with Arturo Molina |
Twin Domes |
Mocorito, Sinaloa Mexico |
1 patented claim |
49/20 |
None |
100% McEwen Inc. |
Haciendita (partial) |
Sinaloa de Leyva, Sinaloa Mexico |
1 patented claim |
358/145 |
None |
100% McEwen Inc. |
52
SEGMENT: MCEWEN COPPER
Our McEwen Copper segment contains the Los Azules copper project in the province of San Juan, Argentina as well as the Elder Creek exploration property in the state of Nevada, United States.
The following map depicts the location of the Los Azules project. Los Azules is located in the Andean Copper Belt in Northern Argentina, which hosts many of the world’s largest copper deposits.

The following table summarizes the primary land positions related to the McEwen Copper segment as of December 31, 2025:
|
|
Number of |
|
Square |
|
Square |
McEwen Copper Mineral Property Interest |
|
Claims |
|
Miles |
|
Kilometers |
Los Azules |
|
22 |
|
124 |
|
320 |
Total McEwen Copper Properties |
|
22 |
|
124 |
|
320 |
53
Los Azules Copper Project, Argentina (46.3% owned)
Overview and History
The Los Azules copper project is an advanced stage porphyry copper exploration project located in the cordilleran region in the province of San Juan, Argentina near the border with Chile. In 1994, Minera Andes Inc. (“Minera Andes”) acquired lands in the southern portion of the Los Azules area. Over the years, additional exploration was performed by Minera Andes and other companies who owned adjacent properties around Los Azules. McEwen Inc. acquired Minera Andes in January 2012. The Los Azules project is held directly by Andes Corporacion Minera S.A., a wholly owned subsidiary of McEwen Copper. The Company currently holds 46.3% of McEwen Copper indirectly through Minera Andes.
Location and Access
The project is located at approximately S31o05’25” and W70o13’30” and abuts the border of Chile and Argentina and is currently accessible via a 120 km gravel road known as the Exploration Road. The elevation at the site ranges between 11,500 feet to 14,750 feet above sea level (“ASL”). A second access road, known as the South Road (max. 11,155 feet ASL) was reconditioned in early 2022, has only one high mountain pass, and was successfully used to extend our drilling season beginning in 2022. We share part of the South Road with other mining projects, including El Pachón (Glencore) and Altar (Sibanye-Stillwater and Aldebaran Resources).
Throughout the 2022-2023 exploration season, notable enhancements were implemented on the existing Exploration Road. These upgrades comprised strategic improvements, notably the integration of five water crossings, with the objective of facilitating smoother vehicular passage and enhancing safety measures. The incorporation of culverts in these river crossings serves a dual function: protecting water bodies from potential sediment in the stream caused by increased vehicular movement and ensuring the safety of travelers and cargo.
Geology and Mineralization
Los Azules is a porphyry copper deposit located in the western province of San Juan in west-central Argentina. This region is characterized by a series of north-south elongated mountain ranges that rise in altitude from east to west to form the rugged Andean Cordillera along the border between Argentina and Chile. Geology at Los Azules comprises Mesozoic volcanic rocks intruded by a Miocene diorite stock, itself intruded by a sub-parallel suite of diorite-dacite porphyry dikes along a major NNW-striking structural zone. Porphyry copper style mineralization and hydrothermal alteration are spatially, temporally, and genetically related to the dikes.
In many respects, the Los Azules deposit is a classic Andean-style porphyry copper deposit. Surface cover consisting of scree and valley fill sits above a barren leached zone that overlies a zone of secondary or supergene enrichment of variable copper grades and thickness. Primary or hypogene mineralization extends to at least 1,000 meters below the present surface. Circulation of meteoric ground water near surface leached primary sulfides (mainly pyrite and chalcopyrite) from the host rocks over the past several million years and the leached copper was redeposited below the water table in a sub-horizontal zone of supergene enrichment as secondary chalcocite and covellite. Hypogene bornite appears at deeper levels together with chalcopyrite. Gold, silver, and molybdenum are present in trace amounts, but copper is by far the most important economic constituent of the Los Azules deposit.
Current Activities
During Q3/25, McEwen Copper achieved a key milestone by completing its Feasibility Study and associated reserve estimate for the project. The study highlights the project’s potential as an environmentally conscious, high-purity, low-cost copper operation. Using a copper price of $4.35 per pound, the Feasibility Study indicates an after-tax net present value of $2.9 billion at a discount rate of 8%, and an internal rate of return of 19.8%.
The feasibility study confirms Los Azules to be a long-life, low-cost producer of high purity copper cathode with strong economic returns. Further, this project allows Los Azules to advance toward construction readiness within a sustainable framework.
54
McEwen Copper continues to perform environmental baseline monitoring work. During 2023, an Environmental Impact Assessment (“EIA”) was completed, which included the geological mapping of the area. The EIA was approved in December of 2024.
Elder Creek property
The Elder Creek property spans approximately 9,600 acres, located along the boundary between T32 - 33N, R43 - 44 E in the Battle Mountain mining district of northern Nevada. The Company does not consider the Elder Creek property material at this time.
Other exploration properties
McEwen Inc. holds other exploration stage properties throughout Argentina which are not considered material at this time. The following table summarizes our properties in Argentina:
Property name |
Municipality |
Type of Interest |
Acres/Hectares |
Conditions |
Ownership |
Cateo Rio Ansilta |
Calingasta-San Juan |
Not applicable |
6439/2606 |
None |
100% Minandes S.A. |
Lagañoso 1 |
Calingasta-San Juan |
21 unpatented claims |
5189/2100 |
None |
100% Minandes S.A. |
Lagañoso 2 |
Calingasta-San Juan |
28 unpatented claims |
6918/2800 |
None |
100% Minandes S.A. |
Nevada |
Calingasta-San Juan |
35 unpatented claims |
12305/4979 |
None |
100% Minandes S.A. |
Nevada 2 |
Calingasta-San Juan |
22 unpatented claims |
5436/2200 |
None |
100% Minandes S.A. |
Chiflones 1 |
Calingasta-San Juan |
6 unpatented claims |
1482/600 |
None |
100% Minandes S.A. |
Chiflones 2 |
Calingasta-San Juan |
6 unpatented claims |
1482/600 |
None |
100% Minandes S.A. |
Diego 1 |
Calingasta-San Juan |
33 unpatented claims |
8107/3280 |
None |
100% Minandes S.A. |
Diego 2 |
Calingasta-San Juan |
30 unpatented claims |
7358/2977 |
None |
100% Minandes S.A. |
Julia 4 |
Calingasta-San Juan |
10 unpatented claims |
2471/1000 |
None |
100% Minandes S.A. |
Julia 1 |
Calingasta-San Juan |
10 unpatented claims |
2471/1000 |
None |
100% Minandes S.A. |
Julia 2 |
Calingasta-San Juan |
10 unpatented claims |
2471/1000 |
None |
100% Minandes S.A. |
Julia 3 |
Calingasta-San Juan |
10 unpatented claims |
2471/1000 |
None |
100% Minandes S.A. |
Julia 5 |
Calingasta-San Juan |
10 unpatented claims |
2471/1000 |
None |
100% Minandes S.A. |
Ines 1 |
Calingasta-San Juan |
35 unpatented claims |
12324/4987 |
None |
100% Minandes S.A. |
Vero |
Calingasta-San Juan |
2 unpatented claims |
409/165 |
None |
100% Minandes S.A. |
55
SEGMENT: MINERA SANTA CRUZ (“MSC”), ARGENTINA
The following map depicts the location of the San José mine land package in the northwest corner of the Deseado Massif region, which forms the Minera Santa Cruz segment. The land package surrounds Newmont’s Cerro Negro property and the San José mine is located approximately 12 miles north of the Cerro Negro mine.

Production Properties
San José mine, Argentina (49% owned)
For detailed information on the San José mine production statistics and financial results, refer to Item 7. Management’s Discussion and Analysis of Financial Condition and Results of Operations.
Overview and History
The San José mine is an underground gold and silver mining operation located in Santa Cruz, Argentina. We acquired our interest in the San José mine in connection with our acquisition of Minera Andes in January 2012. The property is owned and operated under an option and joint venture agreement (“OJVA”) between Minera Andes (49%) and Hochschild (51%) in the name of MSC. The property was acquired by Minera Andes in 1997, followed by an extensive exploration program from 1997 to 2001, leading to the discovery of the Huevos Verdes and Saavedra West Zones. A feasibility study was completed in October 2005 under the direction of MSC and, following construction, commercial production was declared on January 1, 2008.
56
The mine is part of a larger property which covers a total area of approximately 1,004 sq. miles and consists of 141 mining concessions.
MSC has purchased the land and the corresponding occupation rights necessary to conduct its operations.
Location and Access
The San José property is in the province of Santa Cruz, Argentina, lying approximately between latitude S46°41’ and S46°47’ and longitude W70°17’ and W70°00’. The mine is 1,087 miles south-southwest of the city of Buenos Aires and 217 miles southwest of the Atlantic port city of Comodoro Rivadavia. The principal access route to the San José property is a paved highway from Comodoro Rivadavia followed by a 20-mile two-lane dirt road to the mine. Comodoro Rivadavia has regularly scheduled air services to Buenos Aires. The nearest town is Perito Moreno, which is approximately 19 miles west of the San José property.
Geology and Mineralization
The San José property is in the Deseado Massif, which consists of Paleozoic metamorphic basement rocks unconformably overlain by Middle to Upper Jurassic bimodal andesitic and rhyolitic volcanics and volcaniclastics. Cretaceous sediments and Tertiary to Quaternary basalts overlie the Jurassic volcanics. The Jurassic Bajo Pobre Formation is the main host of gold and silver vein mineralization at the mine. The formation is comprised of a lower andesite volcaniclastic unit and an upper andesite lava flow and has a maximum thickness of 394 ft. Mineralization in the San José area occurs as low sulfidation epithermal quartz veins, breccias and stockwork systems accompanying normal sinistral faults.
Facilities and Infrastructure
Infrastructure at the property consists of camp facilities that can accommodate up to approximately 1,100 personnel, a medical clinic, a security building, a maintenance shop, a laboratory, processing facilities, a mine and process facility warehouse, a surface tailings impoundment, support buildings and mine portals, a change house, a core warehouse, an administration building and offices. The laboratory is equipped to process all assays (core, chips and soil). MSC has installed a satellite-based telephone/data/internet communication system.
Electricity is provided by an 81-mile 132 kV electric transmission line, which connects the San José mine processing facility to the national power grid.
The San José mine is a ramp access underground mining operation.
ITEM 3. LEGAL PROCEEDINGS
We are not currently subject to any material legal proceedings. To the best of our knowledge, no such proceeding is threatened, the results of which would have a material impact on our properties, results of operations, or financial condition. Nor, to the best of our knowledge, are any of our officers or directors involved in any legal proceedings in which we are an adverse party.
ITEM 4. MINE SAFETY DISCLOSURES
At McEwen Inc., safety is a core value, and we strive for superior performance. Our health and safety management system, which includes detailed standards and procedures for safe operations, addresses topics such as employee training, risk management, workplace inspection, emergency response, accident investigation and program auditing. Based on strong leadership and involvement from all levels of the organization, these programs and procedures form the cornerstone of safety at McEwen Inc., ensuring that employees are provided a safe and healthy environment and are intended to reduce workplace accidents, incidents and losses, comply with all mining-related regulations and provide support for both regulators and the industry to improve mine safety.
57
The operation of our Gold Bar Mine Complex are subject to regulation by the Federal Mine Safety and Health Administration (“MSHA”) under the Federal Mine Safety and Health Act of 1977 (the “Mine Act”). MSHA inspects our projects and mine on a regular basis and may issue citations and orders when it believes a violation has occurred under the Mine Act. While we assign most of the mining operations at the Gold Bar mine to an independent contractor, we may be considered an “operator” for purposes of the Mine Act and may be issued notices or citations if MSHA believes that we are responsible for violations.
We are required to report certain mine safety violations or other regulatory matters required by Section 1503(a) of the Dodd-Frank Wall Street Reform and Consumer Protection Act and Item 104 of Regulation S-K, and that required information is included in Exhibit 95 filed with this report.
58
PART II
ITEM 5. MARKET FOR COMMON EQUITY, RELATED STOCKHOLDER MATTERS AND ISSUER PURCHASES OF EQUITY SECURITIES
Market Information
On January 24, 2012, our common stock commenced trading on the NYSE and TSX under the symbol “MUX”, subsequent to the completion of the acquisition of Minera Andes. As of March 16, 2026, there were 59,452,799 shares of our common stock outstanding, which were held by approximately 3,000 stockholders of record.
Transfer Agent
Computershare Trust Company, N.A. is the transfer agent for our common stock. The principal office of Computershare is 150 King Street West, Toronto, Ontario, Canada, M5H 1J9. The transfer agent in Canada is Computershare Trust Company of Canada at 100 University Ave., 8th Floor, Toronto ON, M5J 2Y1 and its telephone number is 1-800-564-6253.
Dividends
We have not paid any cash dividends on our Common Stock since 2020 and currently do not expect to pay dividends on our Common Stock for the foreseeable future. The payment of future cash dividends, if any, will be reviewed periodically by the Board of Directors and will depend upon, among other things, our financial condition, funds from operations, the level of our capital and development expenditures, any restrictions imposed by present or future debt or equity instruments, and changes in federal tax policies, if any.
Performance Graph
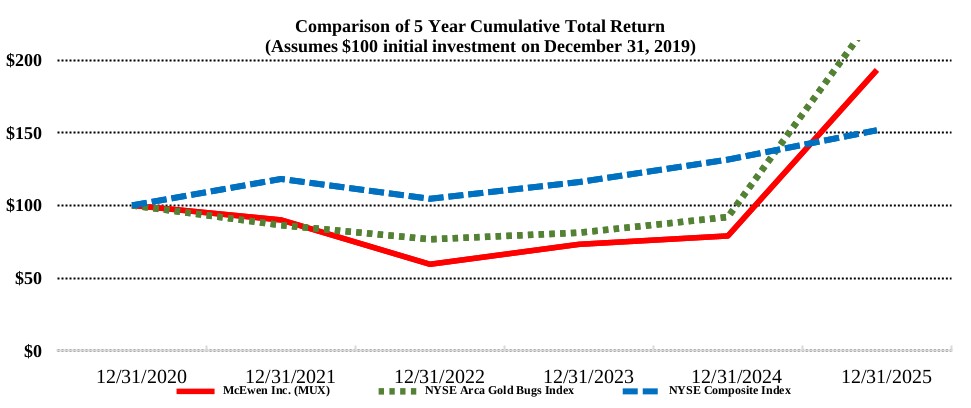
The above graph compares our cumulative total shareholder return for the five years ended December 31, 2025, with (I) the NYSE Arca Gold Bugs Index, which is an index of companies involved in the gold industry and (ii) the NYSE Composite Index, which is a performance indicator of the overall stock market. The graph assumes a $100 investment on December 31, 2020, in our common stock and the two other stock market indices, and assumes the reinvestment of dividends, if any.
|
|
December 31, |
||||||||||||||||
|
|
2020 |
|
2021 |
|
2022 |
|
2023 |
|
2024 |
|
2025 |
||||||
McEwen Inc. (MUX) |
|
$ |
100 |
|
$ |
90 |
|
$ |
59 |
|
$ |
73 |
|
$ |
79 |
|
$ |
188 |
NYSE Arca Gold Bugs Index |
|
|
100 |
|
|
86 |
|
|
77 |
|
|
81 |
|
|
92 |
|
|
234 |
NYSE Composite Index |
|
|
100 |
|
|
118 |
|
|
105 |
|
|
116 |
|
|
131 |
|
|
151 |
59
ITEM 6. [RESERVED]
ITEM 7. MANAGEMENT’S DISCUSSION AND ANALYSIS OF FINANCIAL CONDITION AND RESULTS OF OPERATIONS
Introduction
This section of this Annual Report on Form 10-K generally discusses fiscal 2025 and 2024 items including our results of operations and financial condition, and year-to-year comparisons between 2025 and 2024 with a particular emphasis on 2025. In each case, we discuss factors that we believe have affected our operating results and financial condition and may do so in the future. For a discussion of our financial condition and results of operations for 2024 compared to 2023, please refer to Item 7. Management’s Discussion and Analysis of Financial Condition and Results of Operations in our Annual Report on Form 10-K for the year ended December 31, 2024, filed with the SEC on March 14, 2025.
Regarding properties and projects that are not in production, we provide some details of our plan of operation. This section provides information up to the date of filing this report.
This discussion contains financial performance measures that are not prepared in accordance with United States Generally Accepted Accounting Principles (“US GAAP” or “GAAP”). Each of the following is a non-GAAP measure: cash costs, cash cost per ounce, all-in sustaining costs (“AISC”), all-in sustaining cost per ounce, adjusted earnings before interest, depreciation and amortization (“Adjusted EBITDA”), adjusted EBITDA per share and average realized price per ounce. These non-GAAP measures are used by management in running the business and we believe they provide useful information that can be used by investors to evaluate our performance and our ability to generate cash flows. These measures do not have standardized definitions and should not be relied upon in isolation or as a substitute for measures prepared in accordance with GAAP. For a reconciliation of these non-GAAP measures to the amounts included in our Consolidated Statements of Operations for the years ended December 31, 2025, and 2024 and to our Balance Sheets as of December 31, 2025, and 2024, and certain limitations inherent in such measures, please see the discussion under “Non-GAAP Financial Performance Measures”, beginning on page 77.
This discussion also includes references to advanced-stage properties, which are defined as properties for which advanced studies and reports have been completed indicating the presence of mineralized material or proven or probable reserves, or that have obtained or are in the process of obtaining the required permitting. Our designation of certain properties as “advanced-stage properties” should not suggest that we have or will have proven or probable reserves at those properties as defined by S-K 1300. This section provides information up to the date of the filing of this report.
The information in this section should be read in conjunction with our consolidated financial statements and the notes thereto included in this Annual Report on Form 10-K.
Throughout this Management’s Discussion and Analysis (“MDA”), the reporting periods for the three months ended on December 31, 2025, and December 31, 2024, are abbreviated as Q4/25 and Q4/24 and the reporting for the years ended December 31, 2025, and 2024 are abbreviated as the full year 2025 and the full year 2024 respectively. All quarterly financial and other interim results are unaudited.
In addition, in this report, gold equivalent ounces (“GEO”) includes gold and silver ounces calculated based on a silver to gold ratio of 90:1 for Q1/25, 99:1 for Q2/25, 88:1 for Q3/25, and 76:1 for Q4/25. Beginning in Q2/19, we adopted a variable silver to gold ratio for reporting that approximates the average price during each fiscal quarter.
60
Index to Management’s Discussion and Analysis:
|
Page |
62 |
|
65 |
|
66 |
|
67 |
|
68 |
|
69 |
|
69 |
|
69 |
|
70 |
|
70 |
|
71 |
|
71 |
|
72 |
|
72 |
|
73 |
|
73 |
|
74 |
|
74 |
|
75 |
|
76 |
|
76 |
|
77 |
|
77 |
|
81 |
|
84 |
|
85 |
61
2025 AND Q4/25 OPERATING AND FINANCIAL HIGHLIGHTS
Highlights for the year and quarter ended December 31, 2025, are summarized below and discussed further under “Consolidated Performance”:
Corporate Developments
| ● | On January 31, 2025, the Company amended its Third Amended and Restated Credit Agreement, extending the maturity date from August 31, 2026 to August 31, 2028, and extended the commencement date for monthly repayments of principal from January 31, 2025 to January 31, 2027. As consideration for such amendment, the Company issued 53,160 common shares. On February 21, 2025, the Company repaid $20.0 million of principal under this credit agreement. |
| ● | On February 11, 2025, the Company closed the offering of 5.25% Convertible Senior Notes due 2030 (the “Offering”), for an aggregate principal amount of $110.0 million. The net proceeds from the Offering were approximately $90.7 million after deducting offering related costs of $4.2 million and the purchase of a related capped call of $15.1 million. The capped call option was included to mitigate potential share dilution by effectively raising the conversion price from $11.25 to $17.30, representing a 100% premium over our closing share price on the day prior to the financing announcement. |
| ● | On March 26, 2025, Minera Santa Cruz S.A. paid a dividend of ARS $4.9 billion ($4.6 million) on a 100% basis, or ARS $2.4 billion ($2.2 million) attributable and paid to McEwen Inc., representing the first significant dividend received since 2021. |
| ● | On October 7, 2025, McEwen Copper announced the results of its Feasibility Study (“FS”) for the Los Azules copper project in San Juan, Argentina, with an effective date of September 3, 2025, following the approval of Los Azules to participate in Argentina’s Large Investment Incentive Regime. The FS supports the development of an open-pit mine producing an average of approximately 451 million pounds of copper cathode per year over a 21-year mine life, with an after-tax NPV8% of $2.9 billion and an internal rate of return of 19.8% based on a copper price assumption of $4.35 per pound. The project is expected to have an estimated payback period of 3.9 years. |
| ● | On December 9, 2025, the Company completed the acquisition of 27.3% of Paragon Advanced Labs Inc. (“Paragon”), through the acquisition of 8,742,880 common shares of Paragon in exchange for 709,992 common shares of the Company, with a fair value of $13.7 million, based on the Company’s closing share price of $19.35 per share on December 9, 2025. As of December 31, 2025, the market value of our investments in Paragon was $17.9 million. |
| ● | On December 19, 2025, the Company issued 215,000 flow-through common shares at approximately $23.80 per share for gross proceeds of $5.1 million. The proceeds will be used for exploration of the Grey Fox properties. The Company expects to fulfill obligations associated with this tranche of flow-through shares by the end of 2026. |
Subsequent Events
| ● | On January 5, 2026, the Company successfully completed its acquisition of all of the issued and outstanding shares of Canadian Gold. The Company issued 3,208,481 shares and 1,529,508 subscription receipts on closing, based on an exchange ratio of 0.0225:1. As a result, the Company acquired a 100% interest in the previously operational Tartan Lake property in Manitoba, Canada. |
| ● | On January 22, 2026, the Company issued 350,000 flow-through common shares at approximately $20.90 per share for gross proceeds of $7.3 million. Subsequently, on January 28, 2026, the Company issued an additional 377,000 flow-through common shares at approximately $21.25 per share for gross proceeds of $8.0 million. Proceeds will be used for development of the Stock project. The Company expects to fulfill obligations associated with these tranches of flow-through shares by the end of 2026. |
62
| ● | On February 5, 2026, MSC paid a dividend of ARS $26.0 billion ($18.0 million) on a 100% basis, or ARS $12.7 billion ($8.8 million) attributable and paid to McEwen Inc. |
| ● | On February 6, 2026, McEwen Copper entered into a loan agreement for an amount of up to $240.0 million which may be advanced in one or more tranches upon mutual agreement between McEwen Copper as the borrower, the Company as the agent, and a syndicate of lenders. Approximately $28.5 million of additional funding has been secured under this loan agreement to date, including $13.6 million from the Company. As part of the loan agreement, the Company also received 203,280 transferable warrants to purchase shares of McEwen Copper at $40 per share. The proceeds of the loans are to be used for general corporate purposes, working capital, costs associated with a going public transaction, and to advance the Los Azules Project toward a Final Investment Decision. Annual interest on the loan is 12%. |
Operational Highlights
| ● | Achieved revised annual consolidated GEO production guidance, producing 115,687 GEOs compared with 135,884 GEOs produced in full year 2024. |
| ● | Similarly, we sold 113,732 GEOs on a consolidated basis during 2025, including 55,180 attributable GEOs from the San José mine(1). Our GEO sales in full year 2024 totaled 135,411 GEOs, including 60,501 GEOs from the San José mine(1). |
| ● | At the Fox Complex, we invested $29.5 million in advancing the development of the Stock project. During 2025, ramp development at Stock advanced at an average 20 feet (6.2 meters) per day, keeping the project on track for commercial production in 2027. Production in 2025 was impacted mainly by weather related closures in the latter part of Q4/25 impacting our processing activities, resulting in 5,853 GEOs produced in Q4/25 and 23,187 GEOs for full year 2025, 7% below our revised annual production guidance. |
| ● | At the Gold Bar Mine Complex, we met our revised gold production guidance. We produced 33,227 GEOs in full year 2025, and 44,581 for full year 2024. Lower production was primarily due to the transition from the higher-grade Gold Bar South deposit to the lower-grade Pick III deposit. Production was further impacted by lower-than-expected ounces resulting from discrepancies between the geological model and mined zones. In Q3/25, the Company reinterpreted historic drill data and conducted targeted drilling, which identified geological faults and improved the mine planning process. As a result, production recovered in Q4/25, totaling 8,943 GEOs compared to 6,927 in Q4/24, representing a 29% increase year over year. |
| ● | At the San José Mine, Q4/25 production of 37,739 GEOs decreased by 2% compared to 38,389 GEOs during Q4/24. MSC’s 2025 annual production was 3% lower than prior year primarily due to lower gold and silver head grades and offset by higher silver prices in Q4/25. MSC produced 58,180 attributable GEOs in full year 2025, reaching 2025 production guidance. |
| ● | We continue to meet safety expectations at our 100% owned operations. During 2025, we did not have any lost-time incidents at the Fox Complex, the Gold Bar Mine Complex, or El Gallo. |
Financial Highlights
| ● | Revenue of $197.6 million was reported for full year 2025 from the sale of 58,552 GEOs from our 100% owned operations at an average realized price(2) of $3,532 per GEO. This compares to revenue of $174.5 million from the sale of 74,911 GEOs at an average realized price(2) of $2,390 per GEO during full year 2024. |
| ● | We reported a gross profit of $47.6 million for full year 2025, compared to a gross profit of $30.9 million for full year 2024. The increase was primarily driven by higher revenue from a 48% increase in the average realized gold price. |
| ● | Net income for full year 2025 was $34.4 million, or $0.64 per share, compared to net loss of $43.7 million, or $0.86 per share for full year 2024. Our net income for full year 2025 was driven primarily by the $16.6 million increase in gross profit, a $32.1 million increase in income from our investments in MSC and a $24.4 million increase in income tax recovery. |
63
| ● | Adjusted EBITDA(2) for full year 2025 was $66.2 million, or $1.22 per share, compared to full year 2024 adjusted EBITDA of $29.2 million, or $0.57 per share. Adjusted EBITDA includes the impact of McEwen Copper’s results and reflects the earnings of our operating properties, including the San José mine(1). |
| ● | Fox Complex unit costs: Cash costs(2) and AISC(2) per GEO sold for the Fox Complex for full year 2025 were $2,238 and $2,506, respectively, compared to revised full year 2025 guidance of $2,000 to $2,100 and $2,300 to $2,400, respectively. For full year 2024, cash costs and AISC per GEO sold for the Fox Complex were $1,642 and $1,980, respectively. |
| ● | Gold Bar unit costs: Cash costs(2) and AISC(2) per GEO sold for the Gold Bar Mine Complex for full year 2025 were $2,014 and $2,401, respectively, compared to revised full year 2025 guidance of $2,050 to $2,150 and $2,400 to $2,500, respectively. For full year 2024, cash costs and AISC per GEO sold for the Gold Bar Mine Complex were $1,425 and $1,677, respectively. |
| ● | San José unit costs: Cash costs(2) and AISC(2) per GEO sold for MSC for full year 2025 were $2,206 and $2,636, respectively, compared to full year revised 2025 guidance of $1,900 to $2,050 and $2,200 to $2,350 respectively. For full year 2024, cash costs and AISC per GEO sold for MSC were $1,742 and $2,139, respectively. |
Exploration and Mineral Resources and Reserves
| ● | During 2025, McEwen Copper invested $39.9 million to complete the Feasibility Study for the Los Azules copper project, the results of which were published on October 7, 2025. The study marked a key technical milestone, establishing proven and probable copper reserves of 10.2 billion pounds. The project design emphasizes environmental sustainability, incorporating renewable energy sources and milling methods that reduce water usage. |
| ● | We completed 28,000 feet (8,550 meters) of drilling at our Grey Fox deposit during Q4/25 to support the development of resource estimates. The 2025 year-end resource estimate will form the basis of ongoing technical studies for a pre-feasibility report, scheduled for publication in H1/26. Preliminary technical evaluations, including trade-off analyses and mine design studies, indicate that Grey Fox is a robust and economically resilient asset with an anticipated mine life capable of supporting the growth of the Fox Complex. |
| ● | We incurred $12.0 million in exploration expenses at the Gold Bar Mine Complex in full year 2025. These expenditures were primarily designed to explore the resource potential of Windfall and Lookout Mountain in addition to Gold Bar South targets identified earlier in the year, and advancing ongoing drilling at Trinity Ridge (previously known as Unity Ridge) to extend mineralization. At Windfall, exploration activities revealed multiple high-grade intercepts, including the discovery of a high-grade zone in the footwall. Notable results include 5.5 g/t over 44.2 meters, including 48.38 g/t over 4.6 meters at the Windfall Project. Resource modelling is in progress for Lookout Mountain and Windfall. Additionally, outside the Gold Bar Mine Complex, a drilling program of 7,365 ft in 10 holes was completed at Seven Troughs in Nevada during Q4, and the results are being evaluated. |
| (1) | At our 49% attributable interest. |
| (2) | As used here and elsewhere in this report, this is a Non-GAAP financial performance measure. See “Non-GAAP Financial Performance Measures” beginning on page 77. |
64
SELECTED CONSOLIDATED FINANCIAL AND OPERATING RESULTS
The following tables present selected financial and operating results of the company for the three months ended December 31, 2024, and 2025 and for the years ended December 31, 2023, 2024, and 2025.
|
|
Three months ended December 31, |
|
Year ended December 31, |
|||||||||||
|
|
2025 |
|
2024 |
|
2025 |
|
2024 |
|
2023 |
|||||
|
|
(in thousands, except per share) |
|
|
|
||||||||||
Revenue from gold and silver sales (1) |
|
$ |
64,623 |
|
$ |
33,523 |
|
$ |
197,553 |
|
$ |
174,477 |
|
$ |
166,231 |
Production costs applicable to sales (1) |
|
$ |
(40,189) |
|
$ |
(26,455) |
|
$ |
(122,760) |
|
$ |
(113,313) |
|
$ |
(119,230) |
Gross profit (1) |
|
$ |
17,397 |
|
$ |
363 |
|
$ |
47,564 |
|
$ |
30,935 |
|
$ |
17,780 |
Net income (loss) |
|
$ |
38,126 |
|
$ |
(8,232) |
|
$ |
34,434 |
|
$ |
(43,691) |
|
$ |
55,299 |
Net income (loss) per share |
|
$ |
0.70 |
|
$ |
(0.16) |
|
$ |
0.64 |
|
$ |
(0.86) |
|
$ |
1.16 |
Adjusted EBITDA (2) |
|
$ |
28,156 |
|
$ |
5,196 |
|
$ |
66,163 |
|
$ |
29,235 |
|
$ |
7,669 |
Adjusted EBITDA per share (2) |
|
$ |
0.51 |
|
$ |
0.10 |
|
$ |
1.22 |
|
$ |
0.57 |
|
$ |
0.16 |
Cash from (used in) operating activities |
|
$ |
3,104 |
|
$ |
(1,212) |
|
$ |
6,865 |
|
$ |
29,454 |
|
$ |
(39,617) |
Additions to mineral property interests and plant and equipment |
|
$ |
(13,075) |
|
$ |
(12,749) |
|
$ |
(48,087) |
|
$ |
(43,095) |
|
$ |
(26,099) |
| (1) | Excludes revenue from the San José mine, which is accounted for under the equity method. |
| (2) | As used here and elsewhere in this report, this is a non-GAAP financial performance measure. See “Non-GAAP Financial Performance Measures” beginning on page 77. |
|
|
Three months ended December 31, |
|
Year ended December 31, |
|||||||||||
|
|
2025 |
|
2024 |
|
2025 |
|
2024 |
|
2023 |
|||||
|
|
(in thousands, except per share) |
|
|
|
||||||||||
GEOs produced (1) |
|
|
34,341 |
|
|
32,403 |
|
|
115,687 |
|
|
135,884 |
|
|
154,588 |
100% owned operations |
|
|
15,849 |
|
|
13,591 |
|
|
57,567 |
|
|
75,784 |
|
|
88,915 |
San José mine (49% attributable) |
|
|
18,492 |
|
|
18,812 |
|
|
58,120 |
|
|
60,100 |
|
|
65,673 |
GEOs sold (1) |
|
|
34,952 |
|
|
31,460 |
|
|
113,732 |
|
|
135,411 |
|
|
151,054 |
100% owned operations |
|
|
15,196 |
|
|
13,200 |
|
|
58,552 |
|
|
74,911 |
|
|
88,699 |
San José mine (49% attributable) |
|
|
19,755 |
|
|
18,260 |
|
|
55,180 |
|
|
60,501 |
|
|
62,355 |
Average realized price ($/GEO) (2)(3) |
|
$ |
4,436 |
|
$ |
2,648 |
|
$ |
3,532 |
|
$ |
2,390 |
|
$ |
1,927 |
P.M. Fix Gold ($/oz) |
|
$ |
4,135 |
|
$ |
2,663 |
|
$ |
3,431 |
|
$ |
2,386 |
|
$ |
1,940 |
Cash costs per ounce ($/GEO sold) (2) |
|
|
|
|
|
|
|
|
|
|
|
|
|
|
|
100% owned operations |
|
$ |
2,360 |
|
$ |
2,004 |
|
$ |
2,106 |
|
$ |
1,513 |
|
$ |
1,356 |
San José mine (49% attributable) |
|
$ |
1,940 |
|
$ |
1,635 |
|
$ |
2,206 |
|
$ |
1,742 |
|
$ |
1,393 |
AISC per ounce ($/GEO sold) (2) |
|
|
|
|
|
|
|
|
|
|
|
|
|
|
|
100% owned operations |
|
$ |
2,460 |
|
$ |
2,505 |
|
$ |
2,444 |
|
$ |
1,799 |
|
$ |
1,615 |
San José mine (49% attributable) |
|
$ |
2,201 |
|
$ |
2,038 |
|
$ |
2,636 |
|
$ |
2,139 |
|
$ |
1,815 |
Gold : Silver ratio (1) |
|
|
76:1 |
|
|
85 : 1 |
|
|
86:1 |
|
|
85 : 1 |
|
|
83 : 1 |
| (1) | Silver production is presented as a gold equivalent; the silver to gold ratio used is 86:1 for 2025, 85:1 for 2024, 83:1 for 2023 and 76:1 for Q4/25 and 85:1 for Q4/24. |
| (2) | As used here and elsewhere in this report, this is a non-GAAP financial performance measure. See “Non-GAAP Financial Performance Measures” beginning on page 77. |
| (3) | On sales from 100% owned operations only, excluding streaming arrangement. |
|
|
|
||||
|
|
December 31, 2025 |
|
December 31, 2024 |
||
|
|
(in thousands, unless otherwise indicated) |
||||
Cash and cash equivalents |
|
$ |
51,015 |
|
$ |
13,692 |
Current assets |
|
$ |
107,886 |
|
$ |
41,192 |
Current liabilities |
|
$ |
63,809 |
|
$ |
47,693 |
Long-term debt |
|
$ |
126,168 |
|
$ |
40,000 |
65
CONSOLIDATED OPERATIONS REVIEW
Revenue from gold and silver sales: For full year 2025, revenue from our 100%-owned operations increased to $197.6 million, up from $174.5 million for full year 2024, reflecting an increase of 13%. For Q4/25, revenue from our 100%- owned operations was $64.4 million compared to $33.5 million for Q4/2024. These improvements were primarily driven by higher realized gold prices, which increased to $3,532 per GEO in 2025 compared to $2,390 per GEO in 2024, and $4,436 per GEO in Q4/25, compared to $2,648 in Q4/24.
Production costs applicable to sales: For full year 2025, production costs applicable to sales increased to $122.8 million as compared to $113.3 million for full year 2024. For Q4/25 production costs were $40.2 million compared to $26.5 million for Q4/24. These increases were primarily driven by higher operational stripping costs for deposits mined at the Gold Bar Mine Complex in H2/25. At the Fox Complex, our cost base increased, driven by higher contractor labor and operational development costs to advance Froome West.
Advanced project costs: Advanced project costs of $8.0 million for full year 2025 increased by $0.8 million compared to full year 2024. This increase was primarily attributable to the commencement of our Grey Fox project.
Exploration costs: Exploration costs of $22.2 million for full year 2025 increased by $5.7 million compared to full year 2024 of $16.5 million primarily due to expanded exploration targets. For Q4/25, exploration costs were $6.3 million compared to $5.3 million for Q4/24. Exploration costs of $12.0 million for full year were incurred at the Gold Bar Mine Complex on infill drill programs for operational areas, exploration drilling at the Windfall and Lookout Mountain projects, and the completion of drillholes between and below the open pits at Unity Ridge. At the Fox Complex, exploration costs of $10.2 million for full year 2025 were spent primarily on diamond drilling at the Gibson area of the Grey Fox project.
General and administrative costs: General and administrative costs of $26.7 million for full year 2025 increased by $9.5 million compared to full year 2024 of $17.2 million. For Q4/25, general and administrative costs were $12.2 million compared to $6.5 million for Q4/24. Increases to general and administrative costs in 2025 primarily relate to professional fees and other costs associated with developing our growth plans across our operations.
Loss from investment in McEwen Copper: For full year 2025, we recorded a loss of $25.5 million from our investments in McEwen Copper, compared to a loss of $47.0 million recorded in full year 2024. For Q4/25 a loss of $5.7 million was recorded as compared to $10.3 million for Q4/24. These losses represent our proportion of McEwen Copper’s net loss, which is driven primarily by exploration expenditure. Details of McEwen Copper’s operating results are presented in the “Operations Review” section of this MDA and Note 9 to the Consolidated Financial Statements. Effective September 3, 2025, Los Azules advanced into the development stage following the confirmation of economically viable mineral reserves. During this stage, eligible expenditures are capitalized and depreciated over the life of mine after commercial production is achieved.
Income from investment in MSC: For full year 2025, we recorded an income of $41.1 million from our investments in MSC, compared with $9.0 million income recorded in full year 2024. For Q4/25 we recorded an income of $33.6 million as compared to a loss of $4.3 million in Q4/24. This improvement was a result of year-over-year increases in realized gold and silver prices, considerably improving gross profits. Details of MSC’s operating results are presented in the “Operations Review” section of this MDA and Note 9 to the Consolidated Financial Statements.
Interest and other finance expense, net: Interest and other finance expense totalled $7.2 million for full year 2025, a $2.6 million increase compared to an income of $4.6 million for full year 2024. For Q4/25, interest and other finance expense totalled $2.6 million compared to $1.0 million in Q4/24. These changes reflect the increase in monthly interest payments on the Company’s higher outstanding debt. Details of the Company’s outstanding debt are disclosed in Note 11 to the Consolidated Financial Statements.
Other income: Other income of $10.7 million for full year 2025 improved from $2.7 million for full year 2024. For Q4/25, other expense was $6.2 million compared to a income of $2.4 million in Q4/24. The changes in other income were primarily driven by the unrealized gains on our marketable securities.
66
Dilution gain on McEwen Copper: In Q4/2025, the Company recognized an accounting gain of $0.8 million (Q4/24 - $5.8 million) resulting from the dilution of its ownership in McEwen Copper, which is included in other income on the Statement of Operations. This is discussed further in Note 9 to the Consolidated Financial Statements.
Income and mining tax recovery: For the year ended December 31, 2025, the Company recorded an income tax recovery of $27.5 million, compared to an income tax recovery of $3.0 million for the full year 2024. For Q4 2025, an income tax recovery of $24.0 million was recognized, as compared to an income tax expense of $1.1 million in Q4 2024. The higher income tax recovery for both the full year 2025 and Q4 2025 is primarily attributable to the release of a portion of the U.S. valuation allowance. After evaluating all available positive and negative evidence in accordance with ASC 740, the Company concluded that it is more likely than not that a portion of its deferred tax assets will be realized. Positive evidence supporting this conclusion included sustained improvements in operating performance, continued profitability, and forecasted taxable income supported by the Company’s long-term financial projections. Additional information is provided in Note 19 to the Consolidated Financial Statements.
LIQUIDITY AND CAPITAL RESOURCES
Our cash, cash equivalents and restricted cash balance increased by $37.8 million during 2025, from $17.5 million as at December 31, 2024 to $55.3 million as at December 31, 2025.
Cash provided by operating activities of $6.9 million during 2025 reflects the net income of $34.4 million for the period, adjusted for non-cash impacts, including net income from equity method investments of $15.6 million, depreciation, amortization, and depletion of $27.8 million, flow-through premium amortization of $5.6 million, income and mining tax recovery of $22.3 million, stock-based compensation of $3.7 million, and a $6.7 million change in non-cash working capital. Further details are provided in the Consolidated Statements of Cash Flows.
Cash used in investing activities of $48.0 million during 2025 consisted of additions to mineral property interests and plant and equipment of $44.6 million, driven primarily by capital development at the Fox Complex and capitalized pre-stripping at the Gold Bar Mine Complex, the investment in marketable securities of $2.2 million, and advances to related parties of $5.1 million, partially offset by the proceeds from sale of marketable securities of $1.6 million and dividends received from MSC of $2.2 million.
Cash provided by financing activities of $78.7 million during 2025 consisted of $110.0 million in proceeds from the issuance of Senior Convertible Notes, $4.1 million in proceeds from an exercise of stock options and warrants, and $4.9 million proceeds from issuance of flow-through common shares offset by principal repayments on our term loan facility of $20.0 million, a $4.1 million purchase of capped call options, $15.1 million financing costs related to convertible notes and the $1.1 million repayment of finance lease obligations.
Working capital as at December 31, 2025 was $44.1 million, a $50.6 million increase from negative $6.5 million as at December 31, 2024. The increase in working capital was driven by an increase in cash and cash equivalents of $37.3 million, a $2.9 million increase in receivables from McEwen Copper, a $19.5 million increase in marketable securities, a $8.7 million increase in inventories, a $4.5 million decrease in flow-through share premium, and a $1.5 million decrease in tax liabilities, offset by a $16.5 million increase in accounts payables and accrued liabilities, a $4.0 million increase in contract liability, and a $1.5 million increase in reclamation and remediation liabilities.
The Company believes that it has sufficient liquidity along with funds generated from ongoing operations to fund anticipated cash requirements for operations, capital expenditures and working capital purposes for the next 12 months.
67
ENVIRONMENTAL, SOCIAL, AND GOVERNANCE
McEwen Inc. is committed to upholding the highest corporate governance and sustainability standards, adhering to Environmental, Social and Governance (“ESG”) guidelines, as defined by the Global Reporting Initiative (“GRI”) and other organizations. Our mission is to operate safely and respectfully towards our stakeholders, as we strive for continuous improvement throughout the responsible and sustainable development of our mining projects. Our ESG highlights during 2025 include:
Health and Safety
At our 100% owned Fox Complex, Gold Bar Mine Complex and El Gallo mine operations:
| ● | We reported a total recordable injury frequency rate (“TRIFR”) of 1.60 for Fox Complex, 0 for Gold Bar Mine Complex and 0 for El Gallo mine in 2025. |
| ● | We continued to maintain a lost time injury frequency rate (“LTIFR”) of 0, consistent with 2024 and 2023. |
McEwen Inc. strives to maintain a safe, healthy working environment for all. Our operations aim to meet and exceed occupational health and safety standards. We conduct regular training and safety audits and foster a culture of safety throughout our organization.
Environment
At our 100% owned Fox Complex, Gold Bar Mine Complex and El Gallo mine operations:
| ● | We reported zero significant environmental incidents and zero reportable spills in 2023, 2024 and 2025. |
| ● | Our rates of water recycling have decreased slightly from 2023 to 2025, from over 90% in 2023, to over 80% in 2024 and 2025 at our 100% owned operations. |
| ● | During 2025, we continued our Operations, Maintenance and Surveillance manual for tailings handling, in line with our policies. We completed our annual dam safety inspection at the Fox Complex in late 2025, with no significant findings noted. |
McEwen Inc. conducts its operations with the utmost regard for the environment, focusing on conservation and sustainable development practices. We are committed to the safe handling of tailings, and we adhere to the Global Industry Standard on Tailings Management, as issued by the International Council on Mining and Metals, as well as the UN Environment Programme and Principles for Responsible Investment.
Community Engagement
McEwen Inc. is engaged and proactive in its efforts to improve the quality of life for the communities around us, our employees, and all our stakeholders. Our initiatives range from local development projects to educational and health programs. We engage closely with local communities to ensure our activities yield sustainable and positive outcomes.
McEwen Copper
At McEwen Copper, we embed ESG principles into our business model, prioritizing sustainable development and responsible mining. In 2025, we continued our citizen participation initiative in Calingasta, engaging 963 community members about the Los Azules Project’s environmental and social impacts. Our Local Labor Program connected Calingasta workers with Los Azules contractors during the 2025-2026 season. The Local Supplier Development Program achieved a 13% year-over-year increase in our supplier database, integrating 213 local businesses into our supply chain.
Additionally, the community training program supported 713 individuals with skills development, and educational initiatives continued to prepare students for careers in mining. We also achieved a major milestone with the approval of the EIA, demonstrating our commitment to environmental stewardship and community engagement.
68
OPERATIONS REVIEW
United States Segment
The United States segment is comprised of the Gold Bar Mine Complex, consisting of the operating Gold Bar mine, and the Tonkin, Windfall and Lookout Mountain exploration projects; as well as other exploration properties in the State of Nevada.
Gold Bar Mine Complex
The following table sets out operating results for the Gold Bar Mine Complex for the three months ended December 31, 2025, and 2024, and year ended December 31, 2025, compared to 2024 and 2023:
|
|
Three months ended December 31, |
|
Year ended December 31, |
|||||||||||
|
|
2025 |
|
|
2024 |
|
2025 |
|
2024 |
|
2023 |
||||
Operating Results |
|
(in thousands, unless otherwise indicated) |
|||||||||||||
Mined mineralized material (kt) |
|
|
652 |
|
|
251 |
|
|
1,931 |
|
|
1,960 |
|
|
2,495 |
Average grade (g/t Au) |
|
|
0.55 |
|
|
0.60 |
|
|
0.62 |
|
|
0.82 |
|
|
0.84 |
Stacked mineralized material (kt) |
|
|
690 |
|
|
401 |
|
|
1,989 |
|
|
2,037 |
|
|
2,537 |
Average grade (g/t Au) |
|
|
0.58 |
|
|
0.66 |
|
|
0.62 |
|
|
0.85 |
|
|
0.77 |
Gold ounces: |
|
|
|
|
|
|
|
|
|
|
|
|
|
|
|
Produced |
|
|
8,940 |
|
|
6,926 |
|
|
33,221 |
|
|
44,574 |
|
|
43,669 |
Sold |
|
|
8,984 |
|
|
6,570 |
|
|
33,807 |
|
|
44,595 |
|
|
43,025 |
Silver ounces: |
|
|
|
|
|
|
|
|
|
|
|
|
|
|
|
Produced |
|
|
188 |
|
|
107 |
|
|
540 |
|
|
532 |
|
|
756 |
Sold |
|
|
184 |
|
|
- |
|
|
656 |
|
|
706 |
|
|
708 |
GEOs: |
|
|
|
|
|
|
|
|
|
|
|
|
|
|
|
Produced |
|
|
8,943 |
|
|
6,927 |
|
|
33,227 |
|
|
44,581 |
|
|
43,678 |
Sold |
|
|
8,987 |
|
|
6,570 |
|
|
33,815 |
|
|
44,603 |
|
|
43,034 |
Revenue from gold and silver sales ($000s) |
|
$ |
29,427 |
|
$ |
16,932 |
|
$ |
116,706 |
|
$ |
105,147 |
|
$ |
83,409 |
Cash costs (1) ($000s) |
|
$ |
21,701 |
|
$ |
14,032 |
|
$ |
68,099 |
|
$ |
63,547 |
|
$ |
67,335 |
Cash costs per ounce ($/GEO sold) (1) |
|
$ |
2,415 |
|
$ |
2,136 |
|
$ |
2,014 |
|
$ |
1,425 |
|
$ |
1,565 |
All‑in sustaining costs (1) ($000s) |
|
$ |
22,103 |
|
$ |
18,219 |
|
$ |
81,202 |
|
$ |
74,781 |
|
$ |
81,370 |
AISC per ounce ($/GEO sold) (1) |
|
$ |
2,460 |
|
$ |
2,773 |
|
$ |
2,401 |
|
$ |
1,677 |
|
$ |
1,891 |
Gold : Silver ratio |
|
|
76:1 |
|
|
85 : 1 |
|
|
86:1 |
|
|
85 : 1 |
|
|
83 : 1 |
| (1) | As used here and elsewhere in this report, this is a Non-GAAP financial performance measure. Cash costs for the Company’s 100% owned operations equal Production costs applicable to sales. See “Non-GAAP Financial Performance Measures” beginning on page 77 for additional information. |
2025 compared to 2024
For the full year 2025, the Gold Bar Mine Complex produced 33,227 GEOs, a 25% decrease from 44,581 GEOs in 2024. While the decrease in ounces produced primarily reflects the transition of mining activities from the higher-grade Gold Bar South deposit in 2024 to the lower grade Pick III deposit in 2025, production was also negatively impacted by differences identified between the geological model and mining zones. The Company has reinterpreted historic drill holes supported by the recognition of geological faults in a drilling campaign conducted during Q3/25. As a result, Q4/25 production improved to 8,943 GEOs, a 29% increase from 6,927 GEOs in Q4/24.
Revenue from gold and silver sales for full year 2025 was $116.7 million, up from $105.1 million in 2024, driven by a 48% higher average realized gold price which was partially offset by a 24% decrease in GEOs sold. In Q4/25, revenue increased to $29.4 million from $16.9 million in Q4/24, primarily due to a 29% increase in GEOs sold, and a 48% higher average realized gold price.
69
Production cost applicable to sales for full year 2025 totaled $68.1 million, which increased from $63.5 million in 2024. In Q4/25, production costs applicable to sales increased to $21.7 million from $14.0 million in Q4/24. The increase was primarily driven by increased mining contractor costs to perform stripping activities required at Pick III, which had been capitalized during the comparative period in 2024, partially offset by the effect of fewer GEOs sold in 2025 compared to the prior year period.
Cash cost and AISC per GEO sold were $2,014 and $2,401 for full year 2025, respectively, compared to $1,425 and $1,677 for full year 2024. The increase in cash costs, and a corresponding increase in AISC, was primarily attributable to the increased mining contractor costs to perform stripping activities at Pick III. In Q4/25, cash costs and AISC per GEO sold were $2,415 and $2,460, respectively, compared to $2,136 and $2,773 in Q4/24. The increase in cash costs and AISC per GEO was primarily driven by lower GEOs sold, as noted above.
Exploration Activities
During Q4/25, exploration activities were focused on Windfall and Lookout Mountain. At Windfall, the resource definition program continued until the end of the year. At Lookout Mountain, core was drilled for metallurgical sampling and at Seven Troughs, a drone magnetometer geophysical survey was completed over the entire property. The results will be used to help generate targets for 2026 exploration.
During 2026, exploration work at the Eureka Project will consist of definition and infill drilling at Windfall and Lookout Mountain. Additional metallurgical core holes will also be drilled. Outside of these areas, exploration work is planned in areas with favorable geochemistry, geology, geophysics and drilling results.
2026 Production and Cost Outlook
During 2026, we expect to continue production from Pick III. Mining at Gold Bar South will begin in May, and run through the remainder of 2026. For full year 2026, we expect to produce between 39,000 to 43,000 GEOs at a cash cost per GEO sold between $2,250 and 2,450 and an AISC per GEO sold between $2,350 and $2,550 per ounce.
70
Canada Segment
The Canada segment is comprised of the Fox Complex, which currently includes our Froome underground gold mine (including the Froome West deposit); the Stock Mine (consisting of the West, East and Main zones); the Stock mill; the Grey Fox exploration project; and a number of exploration and other properties located near the city of Timmins, Ontario.
Fox Complex
The following table sets out operating results for the Fox Complex mines for the three months ended December 31, 2025, and 2024, and the years ended December 31, 2025, 2024, and 2023:
|
|
Three months ended December 31, |
|
Year ended December 31, |
|||||||||||
|
|
2025 |
|
2024 |
|
2025 |
|
2024 |
|
2023 |
|||||
Operating Results |
|
(in thousands, unless otherwise indicated) |
|||||||||||||
Mined mineralized material (kt) |
|
|
80 |
|
|
68 |
|
|
303 |
|
|
309 |
|
|
391 |
Average grade (g/t Au) |
|
|
3.05 |
|
|
3.05 |
|
|
2.86 |
|
|
2.90 |
|
|
3.40 |
Processed mineralized material (kt) |
|
|
86 |
|
|
88 |
|
|
307 |
|
|
404 |
|
|
457 |
Average grade (g/t Au) |
|
|
2.69 |
|
|
2.52 |
|
|
2.77 |
|
|
2.54 |
|
|
3.31 |
Gold ounces: |
|
|
|
|
|
|
|
|
|
|
|
|
|
|
|
Produced |
|
|
5,832 |
|
|
6,504 |
|
|
23,144 |
|
|
30,101 |
|
|
44,373 |
Sold, excluding stream |
|
|
5,512 |
|
|
5,930 |
|
|
21,762 |
|
|
27,700 |
|
|
41,300 |
Sold, stream |
|
|
392 |
|
|
700 |
|
|
1,779 |
|
|
2,600 |
|
|
3,500 |
Sold, including stream |
|
|
5,904 |
|
|
6,600 |
|
|
23,541 |
|
|
30,300 |
|
|
44,800 |
Silver ounces: |
|
|
|
|
|
|
|
|
|
|
|
|
|
|
|
Produced |
|
|
1,493 |
|
|
816 |
|
|
3,605 |
|
|
4,245 |
|
|
5,590 |
Sold |
|
|
1,132 |
|
|
- |
|
|
4,358 |
|
|
4,270 |
|
|
5,646 |
GEOs: |
|
|
|
|
|
|
|
|
|
|
|
|
|
|
|
Produced |
|
|
5,853 |
|
|
6,514 |
|
|
23,187 |
|
|
30,151 |
|
|
44,439 |
Sold, excluding stream |
|
|
5,527 |
|
|
5,930 |
|
|
21,813 |
|
|
27,700 |
|
|
41,300 |
Sold |
|
|
5,921 |
|
|
6,630 |
|
|
23,594 |
|
|
30,307 |
|
|
44,868 |
Revenue from gold and silver sales ($000s) |
|
$ |
20,780 |
|
$ |
16,269 |
|
$ |
76,038 |
|
$ |
67,808 |
|
$ |
81,295 |
Cash costs (1) ($000s) |
|
$ |
13,485 |
|
$ |
12,423 |
|
$ |
52,802 |
|
$ |
49,766 |
|
$ |
51,895 |
Cash costs per ounce ($/GEO sold) (1) |
|
$ |
2,278 |
|
$ |
1,874 |
|
$ |
2,238 |
|
$ |
1,642 |
|
$ |
1,157 |
All‑in sustaining costs (1) ($000s) |
|
$ |
13,979 |
|
$ |
14,852 |
|
$ |
59,117 |
|
$ |
59,994 |
|
$ |
60,617 |
AISC per ounce ($/GEO sold) (1) |
|
$ |
2,361 |
|
$ |
2,240 |
|
$ |
2,506 |
|
$ |
1,980 |
|
$ |
1,351 |
Gold : Silver ratio |
|
|
76:1 |
|
|
85 : 1 |
|
|
86:1 |
|
|
85 : 1 |
|
|
83:1 |
| (1) | As used here and elsewhere in this report, this is a Non-GAAP financial performance measure. Cash costs for the Company’s 100% owned operations equal Production costs applicable to sales. See “Non-GAAP Financial Performance Measures” beginning on page 77 for additional information. |
Stock Project
Development activities at the Stock project advanced in line with the Company’s 2025 mine development plan. In Q4/25, we invested $10.9 million to advance development at the Stock project (full year 2025 – $29.5 million). During the period, the project received an updated Closure Plan Permit from the Ministry of Mines and completed major upgrades to ventilation and air heating systems, enhancing underground readiness. Site construction progressed across critical infrastructure, including access roads, building foundations, and essential service areas, as well as surface facilities, including the mine dry, office complex, and maintenance buildings. Rehabilitation of historical infrastructure continued, with steady progress on shaft access and safety improvements. Ramp development advanced at an average rate of 20 feet (6.2 meters) per day during 2025, supporting key project milestones. Overall, project execution during 2025 remained consistent with schedule and budget expectations, reinforcing the Company’s target for commencement of production in 2027.
71
2025 compared to 2024
The Fox Complex produced 5,853 and 23,187 GEOs in Q4/25 and full year 2025, respectively, compared to 6,514 and 30,151 GEOs produced in Q4/24 and full year 2024, respectively. The decrease in GEO production was primarily due to a 32% reduction in processed mineralized material, as mining continues in the lower-grade zones at the bottom of the Froome deposit. The discovery of higher-grade mineralization at the new Froome West deposit extends production into 2026, supporting the transition into the production phase at the Stock project.
Revenue from gold and silver sales was $76.0 million for full year 2025, compared to $67.8 million for full year 2024, representing a 12% increase primarily driven by a 48% increase in the average realized gold price. For Q4/25, revenue from gold and silver sales totaled $20.8 million, up from $16.3 million for Q4/24. The increase was driven by a 68% higher average realized gold price, partially offset by an 11% decrease in GEOs sold. Realized gold prices at the Fox Complex are impacted by historic streaming arrangements, which require the sale of a portion of gold produced from the Froome and Black Fox mines at $611 per ounce for 2025.
Production costs applicable to sales were $13.5 million in Q4/25, compared to $12.4 million in Q4/24, representing a 28% increase primarily driven by higher mining expenses due to additional third-party contractors hired to address labor shortages and operational development costs to advance Froome West. The same factors contributed to the variance between full year 2025 and full year 2024 production costs.
Cash cost and AISC per GEO sold were $2,238 and $2,506 for full year 2025, respectively, compared to $1,642 and $1,980 for full year 2024. In Q4/25, cash cost and AISC per GEO sold were $2,278 and $2,361, respectively, compared to $1,874 and $2,240 in Q4/24. The increase in unit costs was primarily driven by a 22% decrease in GEOs sold for full year 2025. The same factors impacted unit costs on a full year basis, with higher fixed costs spread over fewer ounces sold.
Exploration Activities
During Q4/25, $2.1 million was incurred, primarily for exploration in the Fox Complex. At the Grey Fox property, exploration activities included 28,051 feet (8,550 meters) of diamond drilling, primarily focused on the Gibson Zone, where favorable grades and widths were identified. Other priority drill targets included the Stroud property, which is contiguous with Grey Fox, to verify a historical resource.
2026 Production and Cost Outlook
For full year 2026, we expect to produce between 16,000 to 19,000 GEOs at a cash cost per GEO sold between $2,200 and $2,400 per ounce and an AISC per GEO sold between $2,350 and $2,550 per ounce.
72
Mexico Segment
The Mexico segment consists of El Gallo, located in Sinaloa state.
El Gallo HLM
We have reached a construction decision for the Phase 1 heap leach material reprocessing project contemplated in our Feasibility Study (previously described as the Fenix project). In December 2025, the Company was granted the extension of its Environmental Impact Assessment (Manifestación de Impacto Ambiental) from the Mexican government. The Company is currently proceeding with the final detailed engineering plan for the mill, which has been purchased and is onsite. We anticipate beginning construction mid-2026, with production commencing mid-2027.
Phase 1 is expected to produce for 10 years, producing approximately 20,000 GEOs annually once commercial production is achieved. Production will come from the reprocessing of the material currently on the leach pad, through a ball mill with an operating plan optimized for cash flow and recovery. Remaining capital costs to complete construction are estimated at $25 million. Since the material that will be processed has been previously leached, there will be no significant development or exploration costs anticipated.
73
MSC Segment, Argentina
The MSC segment is comprised of a 49% interest in the San José mine, located in Santa Cruz, Argentina.
MSC – Operating Results
The following table sets out operating results for the San José mine for the three months ended December 31, 2025, and 2024, and for the years ended December 31, 2025, 2024 and 2023 (on a 100% basis):
|
|
Three months ended December 31, |
|
Year ended December 31, |
|||||||||||
|
|
2025 |
|
2024 |
|
2025 |
|
2024 |
|
2023 |
|||||
Operating Results |
|
(in thousands, unless otherwise indicated) |
|||||||||||||
San José Mine—100% basis |
|
|
|
|
|
|
|
|
|
|
|
|
|
|
|
Mined mineralized material (kt) |
|
|
211 |
|
|
174 |
|
|
701 |
|
|
641 |
|
|
563 |
Average grade mined (g/t) |
|
|
|
|
|
|
|
|
|
|
|
|
|
|
|
Gold |
|
|
3.9 |
|
|
4.7 |
|
|
3.7 |
|
|
3.9 |
|
|
4.8 |
Silver |
|
|
207 |
|
|
269 |
|
|
191 |
|
|
209 |
|
|
270 |
Processed mineralized material (kt) |
|
|
186 |
|
|
160 |
|
|
705 |
|
|
581 |
|
|
579 |
Average grade processed (g/t) |
|
|
|
|
|
|
|
|
|
|
|
|
|
|
|
Gold |
|
|
4.7 |
|
|
5.3 |
|
|
3.7 |
|
|
4.5 |
|
|
5.0 |
Silver |
|
|
197 |
|
|
275 |
|
|
185 |
|
|
253 |
|
|
270 |
Average recovery (%): |
|
|
|
|
|
|
|
|
|
|
|
|
|
|
|
Gold |
|
|
87.27 |
|
|
87.27 |
|
|
83.08 |
|
|
86.72 |
|
|
86.52 |
Silver |
|
|
85.38 |
|
|
88.59 |
|
|
83.08 |
|
|
87.78 |
|
|
88.01 |
Gold ounces: |
|
|
|
|
|
|
|
|
|
|
|
|
|
|
|
Produced |
|
|
24,486 |
|
|
23,605 |
|
|
76,970 |
|
|
73,729 |
|
|
80,985 |
Sold |
|
|
25,295 |
|
|
23,026 |
|
|
72,072 |
|
|
74,333 |
|
|
75,064 |
Silver ounces: |
|
|
|
|
|
|
|
|
|
|
|
|
|
|
|
Produced |
|
|
1,008,753 |
|
|
1,255,611 |
|
|
3,624,560 |
|
|
4,150,244 |
|
|
4,422,108 |
Sold |
|
|
1,093,826 |
|
|
1,212,846 |
|
|
3,435,365 |
|
|
4,169,739 |
|
|
4,362,725 |
GEOs: |
|
|
|
|
|
|
|
|
|
|
|
|
|
|
|
Produced |
|
|
37,739 |
|
|
38,389 |
|
|
118,612 |
|
|
122,653 |
|
|
134,027 |
Sold |
|
|
40,317 |
|
|
37,264 |
|
|
112,612 |
|
|
123,471 |
|
|
127,255 |
Revenue from gold and silver sales ($000s) |
|
$ |
201,034 |
|
$ |
99,776 |
|
$ |
459,545 |
|
$ |
310,411 |
|
$ |
242,461 |
Average realized price: |
|
|
|
|
|
|
|
|
|
|
|
|
|
|
|
Gold ($/Au oz) |
|
$ |
4,815 |
|
$ |
2,675 |
|
$ |
3,904 |
|
$ |
2,516 |
|
$ |
1,985 |
Silver ($/Ag oz) |
|
$ |
63.05 |
|
$ |
31.49 |
|
$ |
45.17 |
|
$ |
29.59 |
|
$ |
21.43 |
Cash costs (1) ($000s) |
|
$ |
78,217 |
|
$ |
60,929 |
|
$ |
248,459 |
|
$ |
215,065 |
|
$ |
177,234 |
Cash costs per ounce sold ($/GEO) (1) |
|
$ |
1,940 |
|
$ |
1,635 |
|
$ |
2,206 |
|
$ |
1,742 |
|
$ |
1,393 |
All‑in sustaining costs (1) ($000s) |
|
$ |
88,723 |
|
$ |
75,931 |
|
$ |
296,813 |
|
$ |
264,056 |
|
$ |
231,013 |
AISC per ounce sold ($/GEO) (1) |
|
$ |
2,201 |
|
$ |
2,038 |
|
$ |
2,636 |
|
$ |
2,139 |
|
$ |
1,815 |
Gold : Silver ratio |
|
|
76 : 1 |
|
|
85 : 1 |
|
|
86:1 |
|
|
85 : 1 |
|
|
83 : 1 |
| (1) | As used here and elsewhere in this report, this is a Non-GAAP financial performance measure. Cash costs for the Company’s 100% owned operations equal Production costs applicable to sales. See “Non-GAAP Financial Performance Measures” beginning on page 77 for additional information. |
The comparative analysis below compares the operating and financial results of MSC on a 100% basis.
74
2025 compared to 2024
On a 100% basis, the San José mine produced 118,612 GEOs for full year 2025, compared to 122,653 GEOs for full year 2024. In Q4/2025 production was 37,739 GEOs, compared to 38,389 GEOs in Q4/24. The decrease in full year 2025 was primarily due to lower milled grades, with gold and silver head grades declining by 6% and 9%, respectively, with a related 4% and 5% decrease in recovery rates for gold and silver respectively. These impacts were partially offset by a 21% increase in tonnes processed during the period, driven by the installation of a new vertical mill completed in December 2024, which increased average daily mill throughput by 24% from approximately 1,700 tonnes per day in late 2024 to 2,100 tonnes per day in 2025. The same factors apply for the change in Q4/25.
Revenue from gold and silver sales was $459.5 million for full year 2025, compared to $310.4 million for full year 2024. This increase was primarily driven by 63% and 53% higher realized gold and silver prices, respectively, partially offset by a 9% decrease in GEOs sold. For Q4/25, revenue from gold and silver sales was $201.0 million, compared to $99.8 million in Q4/24, driven by the same factors that impacted revenue for the full year.
Production costs applicable to sales were $78.2 million and $248.5 million in Q4/25 and full year 2025, respectively, compared to $60.9 million and $215.1 million in Q4/24 and full year 2024, respectively. Cost increases during the year were largely attributable to high inflation in the Argentine market, which outpaced the government-controlled depreciation of the peso against the U.S. dollar. This resulted in higher real costs for expenses denominated in local currency. Despite management’s successful efforts to negotiate with key vendors and worker unions to align pricing with currency adjustments, the inflationary environment drove an overall rise in costs.
Cash cost and AISC per GEO sold were $2,206 and $2,638, respectively, compared to $1,742 and $2,139 for full year 2024. In Q4/25, cash cost and AISC per GEO sold were $1,940 and $2,202, respectively, compared to $1,635 and $2,038 in Q4/24. The increase in both cash costs and AISC on a year-over-year basis was primarily due to 16% higher production costs and 9% lower GEOs sold during 2025, as noted above.
Investment in MSC
Our 49% attributable share of operations from our investment in MSC in 2025 resulted in an income of $41.1 million, compared to an income of $9.0 million in 2024. Despite higher than planned unit costs arising from negative macroeconomic factors, the metal price environment has allowed the operation to strengthen its liquidity, improving its working capital balance to $182.8 million as at December 31, 2025, compared to $87.0 million as of December 31, 2024.
Operational performance continued to strengthen during the year, with plant throughput stabilizing at approximately 2,100 tonnes per day, reflecting the increased capacity enabled by the Vertical Tower Mill commissioned in late 2024. Underground productivity also improved following the transition to a three-shift schedule, supporting extraction rates near the 2,000-tonne-per-day level required to consistently supply the plant.
MSC Dividend Distribution (49%)
We received $2.2 million in dividends from MSC for full year 2025 (2024 - $0.4 million).
2026 Production and Cost Outlook
For full year 2026, we expect to produce between 59,000 to 64,000 GEOs at a cash cost per GEO sold between $2,000 and $2,200 per ounce and an AISC per GEO sold between $2,300 and $2,500 per ounce.
75
McEwen Copper Inc.
As of December 31, 2025, we own a 46.3% interest in McEwen Copper, which owns a 100% interest in the Los Azules copper project in San Juan, Argentina, and the Elder Creek exploration project in Nevada, USA. Including amounts spent by Minera Andes Inc. prior to 2012, and directly by McEwen Inc. prior to 2021, we have invested over $430 million in exploration expenditures to develop Los Azules as a world-class copper deposit.
Los Azules, San Juan, Argentina
The Los Azules project is one of the world’s largest undeveloped copper deposits and is located in the Province of San Juan, Argentina. In Q4/25, McEwen Copper achieved a key milestone by completing the Feasibility Study and associated reserve estimate for the project. The study highlights the project’s potential as an environmentally conscious, high-purity, low-cost copper operation. Using a copper price of $4.35 per pound, the Feasibility Study indicates an after-tax net present value of $2.9 billion at a discount rate of 8%, and an internal rate of return of 19.8%.
The Feasibility Study established mineral reserves and resources, with proven and probable reserves totaling 10.2 billion pounds of copper based on a copper price of $4.25 per pound. Mineral resources, comprising 5.4 billion pounds of measured and indicated copper and 20.0 billion pounds of inferred copper, were estimated using a copper price of $4.80 per pound.
Since 2021, McEwen Copper has been advancing Los Azules through significant additional drilling, numerous studies, social consultation, and permitting. Equipped with the results from the Feasibility Study and key government approvals, McEwen Copper will continue developing the Los Azules project in subsequent periods.
Los Azules Exploration
Field exploration activities at Los Azules identified four additional deposits near the Los Azules deposit which could extend the mine life beyond existing project plans. The four targets consist of Tango, Porfido Norte, Franca, and Mercedes, which are porphyry deposits that have potential for hypogene mineralization.
Preliminary drilling of newly identified targets is expected to commence later in 2026. In parallel, refinement of geological mapping and surface sampling across all target areas is ongoing and will continue into the next field season. This work is expected to significantly improve drill targeting accuracy.
Regime of Incentive for Investments (“RIGI”)
On September 26, 2025, McEwen Copper received RIGI approval following an extensive technical application process. RIGI approval entitles the Los Azules project to a series of tax and regulatory benefits, including a reduction in the corporate income tax rate from 35% to 25%, exemption from sales tax during the construction phase, elimination of export duties, and exemption from the obligation to repatriate export revenues. Additionally, the project benefits from a 30-year fiscal stability guarantee and access to international arbitration for dispute resolution. The Government of Argentina established the RIGI program to support and incentivize foreign investment across various industries, including mining.
Energy Supply Contract
McEwen Copper has reached an agreement with YPF Luz to power its Los Azules copper project in San Juan, Argentina, with renewable energy. The companies signed a Memorandum of Understanding to negotiate the energy supply, which will come from YPF Luz’s renewable assets connected to the Argentine Interconnection System. YPF Luz will also develop, construct, and finance a high-voltage transmission line to connect the project to the grid, ensuring a sustainable energy supply for the copper project.
76
COMMITMENTS AND CONTINGENCIES
As of December 31, 2025, we have the following consolidated contractual obligations:
|
|
|
|
|
Payments due by period |
|||||||||||||
|
|
2026 |
|
2027 |
|
2028 |
|
2029 |
|
Thereafter |
|
|
Total |
|||||
Mining and surface rights |
|
$ |
2,495 |
|
$ |
1,878 |
|
$ |
1,028 |
|
$ |
635 |
|
$ |
639 |
|
$ |
6,675 |
Reclamation costs(1) |
|
|
4,919 |
|
|
4,411 |
|
|
2,131 |
|
|
4,671 |
|
|
40,117 |
|
|
56,249 |
Lease obligations (Note 10) |
|
|
1,112 |
|
|
487 |
|
|
348 |
|
|
192 |
|
|
— |
|
|
2,139 |
Total |
|
$ |
8,526 |
|
$ |
6,776 |
|
$ |
3,507 |
|
$ |
5,498 |
|
$ |
40,756 |
|
$ |
65,063 |
| (1) | Amounts presented represent the undiscounted uninflated future payments. |
With respect to reclamation cost commitments disclosed above, we have surety bonds outstanding to provide bonding for our obligations in the United States and Canada. These surety bonds are available for draw down in the event we do not perform our reclamation obligations. If the bond is drawn, we would be obligated to reimburse the surety. When the specific reclamation requirements are met, the beneficiary of the surety bonds will cancel and/or return the instrument to the issuing entity. As of December 31, 2025, no additional liability has been recognized for our surety bonds of $48.2 million.
Lease obligations disclosed above include long-term leases covering office space, exploration expenditures, option payments and option payments on properties.
NON-GAAP FINANCIAL PERFORMANCE MEASURES
We have included in this report certain non-GAAP performance measures as detailed below. In the gold mining industry, these are common performance measures but do not have any standardized meaning and are considered non-GAAP measures. We use these measures to evaluate our business on an ongoing basis and believe that, in addition to conventional measures prepared in accordance with GAAP, certain investors use such non-GAAP measures to evaluate our performance and ability to generate cash flow. We also report these measures to provide investors and analysts with useful information about our underlying costs of operations and clarity over our ability to finance operations. Accordingly, they are intended to provide additional information and should not be considered in isolation or as a substitute for measures of performance prepared in accordance with GAAP. There are limitations associated with the use of such non-GAAP measures. We compensate for these limitations by relying primarily on our US GAAP results and using the non-GAAP measures supplementally.
The non-GAAP measures are presented for our wholly owned mines and our interest in the San José mine. The GAAP information used for the reconciliation to the non-GAAP measures for our minority interest in the San José mine may be found in Item 8. Financial Statements and Supplementary Data, Note 9, Equity Investments. The amounts in the reconciliation tables labeled “49% basis” were derived by applying to each financial statement line item the ownership percentage interest used to arrive at our share of net income or loss during the period when applying the equity method of accounting. We do not control the interest in our operations of MSC and the presentations of assets and liabilities and revenues and expenses of MSC do not represent our legal claim to such items. The amount of cash we receive is based upon specific provisions of the Option and Joint Venture Agreement (“OJVA”) and varies depending on factors including the profitability of the operations.
77
The presentation of these measures, including the minority interest in the San José, has limitations as an analytical tool. Some of these limitations include:
| ● | The amounts shown on the individual line items were derived by applying our overall economic ownership interest percentage determined when applying the equity method of accounting and do not represent our legal claim to the assets and liabilities, or the revenues and expenses; and |
| ● | Other companies in our industry may calculate their cash costs, cash cost per ounce, all-in sustaining costs, all-in sustaining cost per ounce, adjusted EBITDA, adjusted EBITDA per share and average realized price per ounce differently than we do, limiting the usefulness as a comparative measure. |
Cash Costs and All-In Sustaining Costs
Cash costs consist of mining, processing, on-site general and administrative expenses, community and permitting costs related to current operations, royalty costs, refining and treatment charges (for both doré and concentrate products), sales costs, export taxes and operational stripping costs, but exclude depreciation and amortization (non-cash items). The sum of these costs is divided by the corresponding gold equivalent ounces sold to determine a per ounce amount.
All-in sustaining costs consist of cash costs (as described above), plus accretion of retirement obligations and amortization of the asset retirement costs related to operating sites, environmental rehabilitation costs for mines with no reserves, sustaining exploration and development costs, sustaining capital expenditures and sustaining lease payments. Our all-in sustaining costs exclude the allocation of corporate general and administrative costs. The following is additional information regarding our all-in sustaining costs:
| ● | Sustaining operating costs represent expenditures incurred at current operations that are considered necessary to maintain current annual production at the mine site and include mine development costs and ongoing replacement of mine equipment and other capital facilities. Sustaining capital costs do not include costs of expanding the project that would result in improved productivity of the existing asset, increased existing capacity or extended useful life. |
| ● | Sustaining exploration and development costs include expenditures incurred to sustain current operations and to replace reserves and/or resources extracted as part of the ongoing production. Exploration activity performed near-mine (brownfield) or new exploration projects (greenfield) are classified as non-sustaining. |
The sum of all-in sustaining costs is divided by the corresponding gold equivalent ounces sold to determine a per ounce amount.
Costs excluded from cash costs and all-in sustaining costs, in addition to depreciation and depletion, are income and mining tax expenses, all corporate financing charges, costs related to business combinations, asset acquisitions and asset disposals, impairment charges and any items that are deducted for the purpose of normalizing items.
78
The following tables reconcile these non-GAAP measures to the most directly comparable GAAP measure, production costs applicable to sales:
|
|
Three months ended December 31, 2025 |
|
Year ended December 31, 2025 |
||||||||||||||
|
|
Gold Bar |
|
Fox Complex |
|
Total |
|
Gold Bar |
|
Fox Complex |
|
Total |
||||||
|
|
(in thousands, except per ounce) |
|
(in thousands, except per ounce) |
||||||||||||||
Production costs applicable to sales (100% owned) - cash costs |
|
$ |
21,701 |
|
$ |
13,485 |
|
$ |
35,186 |
|
$ |
68,099 |
|
$ |
52,802 |
|
$ |
120,901 |
In‑mine exploration |
|
|
94 |
|
|
— |
|
|
94 |
|
|
563 |
|
|
— |
|
|
563 |
Capitalized mine development (sustaining) |
|
|
— |
|
|
461 |
|
|
461 |
|
|
8,833 |
|
|
6,187 |
|
|
15,020 |
Capital expenditures on plant and equipment (sustaining) |
|
|
294 |
|
|
— |
|
|
294 |
|
|
3,660 |
|
|
— |
|
|
3,660 |
Sustaining leases |
|
|
14 |
|
|
33 |
|
|
47 |
|
|
47 |
|
|
128 |
|
|
175 |
All‑in sustaining costs |
|
$ |
22,103 |
|
$ |
13,979 |
|
$ |
36,082 |
|
$ |
81,202 |
|
$ |
59,117 |
|
$ |
140,319 |
Ounces sold, including stream (GEO) |
|
|
8,987 |
|
|
5,921 |
|
|
14,907 |
|
|
33,815 |
|
|
23,594 |
|
|
57,409 |
Cash cost per ounce sold ($/GEO) |
|
$ |
2,415 |
|
$ |
2,278 |
|
$ |
2,360 |
|
$ |
2,014 |
|
$ |
2,238 |
|
$ |
2,106 |
AISC per ounce sold ($/GEO) |
|
$ |
2,460 |
|
$ |
2,361 |
|
$ |
2,420 |
|
$ |
2,401 |
|
$ |
2,506 |
|
$ |
2,444 |
|
|
Three months ended December 31, 2024 |
|
Year ended December 31, 2024 |
||||||||||||||
|
|
Gold Bar |
|
Fox Complex |
|
Total |
|
Gold Bar |
|
Fox Complex |
|
Total |
||||||
|
|
(in thousands, except per ounce) |
|
(in thousands, except per ounce) |
||||||||||||||
Production costs applicable to sales (100% owned) - cash costs |
|
$ |
14,032 |
|
$ |
12,423 |
|
$ |
26,455 |
|
$ |
63,547 |
|
$ |
49,766 |
|
$ |
113,313 |
In‑mine exploration |
|
|
149 |
|
|
— |
|
|
149 |
|
|
796 |
|
|
— |
|
|
796 |
Capitalized mine development (sustaining) |
|
|
2,617 |
|
|
2,361 |
|
|
4,978 |
|
|
7,863 |
|
|
9,955 |
|
|
17,818 |
Capital expenditures on plant and equipment (sustaining) |
|
|
1,407 |
|
|
— |
|
|
1,407 |
|
|
2,491 |
|
|
— |
|
|
2,491 |
Sustaining leases and other |
|
|
14 |
|
|
68 |
|
|
82 |
|
|
84 |
|
|
273 |
|
|
357 |
All‑in sustaining costs |
|
$ |
18,219 |
|
$ |
14,852 |
|
$ |
33,071 |
|
$ |
74,781 |
|
$ |
59,994 |
|
$ |
134,775 |
Ounces sold, including stream (GEO) |
|
|
6,570 |
|
|
6,630 |
|
|
13,200 |
|
|
44,603 |
|
|
30,307 |
|
|
74,911 |
Cash cost per ounce sold ($/GEO) |
|
$ |
2,136 |
|
$ |
1,874 |
|
$ |
2,004 |
|
$ |
1,425 |
|
$ |
1,642 |
|
$ |
1,514 |
AISC per ounce sold ($/GEO) |
|
$ |
2,773 |
|
$ |
2,240 |
|
$ |
2,505 |
|
$ |
1,677 |
|
$ |
1,980 |
|
$ |
1,799 |
|
|
Three months ended December 31, 2023 |
|
Year ended December 31, 2023 |
||||||||||||||
|
|
Gold Bar |
|
Fox Complex |
|
Total |
|
Gold Bar |
|
Fox Complex |
|
Total |
||||||
|
|
(in thousands, except per ounce) |
|
(in thousands, except per ounce) |
||||||||||||||
Production costs applicable to sales - Cash costs (100% owned) |
|
$ |
25,889 |
|
$ |
13,298 |
|
$ |
39,187 |
|
$ |
67,335 |
|
$ |
51,895 |
|
$ |
119,230 |
In‑mine exploration |
|
|
1,705 |
|
|
— |
|
|
1,705 |
|
|
4,759 |
|
|
— |
|
|
4,759 |
Capitalized underground mine development (sustaining) |
|
|
— |
|
|
2,119 |
|
|
2,119 |
|
|
— |
|
|
8,046 |
|
|
8,046 |
Capital expenditures on plant and equipment (sustaining) |
|
|
1,374 |
|
|
— |
|
|
1,374 |
|
|
9,028 |
|
|
— |
|
|
9,028 |
Sustaining leases |
|
|
11 |
|
|
153 |
|
|
164 |
|
|
248 |
|
|
676 |
|
|
923 |
All‑in sustaining costs |
|
$ |
28,979 |
|
$ |
15,570 |
|
$ |
44,549 |
|
$ |
81,370 |
|
$ |
60,617 |
|
$ |
141,986 |
Ounces sold, including stream (Au Eq. oz) |
|
|
19,245 |
|
|
10,611 |
|
|
29,856 |
|
|
43,034 |
|
|
44,868 |
|
|
87,902 |
Cash cost per ounce ($/Au Eq. oz sold) |
|
$ |
1,345 |
|
$ |
1,253 |
|
$ |
1,313 |
|
$ |
1,565 |
|
$ |
1,157 |
|
$ |
1,356 |
AISC per ounce ($/Au Eq. oz sold) |
|
$ |
1,506 |
|
$ |
1,467 |
|
$ |
1,492 |
|
$ |
1,891 |
|
$ |
1,351 |
|
$ |
1,615 |
79
|
|
Three months ended December 31, |
|
Year ended December 31, |
|||||||||||
|
|
2025 |
|
2024 |
|
2025 |
|
2024 |
|
2023 |
|||||
San José mine cash costs (100% basis) |
|
(in thousands, except per ounce) |
|||||||||||||
Production costs applicable to sales - cash costs |
|
$ |
78,217 |
|
$ |
60,929 |
|
$ |
248,459 |
|
$ |
215,065 |
|
$ |
177,234 |
Site exploration expenses |
|
|
1,728 |
|
|
303 |
|
|
6,737 |
|
|
5,229 |
|
|
9,167 |
Capitalized underground mine development (sustaining) |
|
|
6,683 |
|
|
8,079 |
|
|
32,716 |
|
|
29,504 |
|
|
38,318 |
Less: Depreciation |
|
|
(434) |
|
|
(696) |
|
|
(2,425) |
|
|
(2,732) |
|
|
(2,930) |
Capital expenditures (sustaining) |
|
|
2,529 |
|
|
7,316 |
|
|
11,326 |
|
|
16,990 |
|
|
9,224 |
All‑in sustaining costs |
|
$ |
88,723 |
|
$ |
75,931 |
|
$ |
296,813 |
|
$ |
264,056 |
|
$ |
231,013 |
Ounces sold (GEO) |
|
|
40,317 |
|
|
37,264 |
|
|
112,612 |
|
|
123,471 |
|
|
127,254 |
Cash cost per ounce sold ($/GEO) |
|
$ |
1,940 |
|
$ |
1,635 |
|
$ |
2,206 |
|
$ |
1,742 |
|
$ |
1,393 |
AISC per ounce sold ($/GEO) |
|
$ |
2,201 |
|
$ |
2,038 |
|
$ |
2,636 |
|
$ |
2,139 |
|
$ |
1,815 |
Adjusted EBITDA and adjusted EBITDA per share
Adjusted earnings before interest, taxes, depreciation, and amortization (“Adjusted EBITDA”) is a non-GAAP financial measure and does not have any standardized meaning. We use adjusted EBITDA to evaluate our operating performance and ability to generate cash flow from our wholly owned operations in production; we disclose this metric as we believe this measure provides valuable assistance to investors and analysts in evaluating our ability to finance our precious metal operations and capital activities separately from our copper exploration operations. The most directly comparable measure prepared in accordance with GAAP is net loss before income and mining taxes. Adjusted EBITDA is calculated by adding back McEwen Copper's income or loss impacts on our consolidated income or loss before income and mining taxes.
The following tables present a reconciliation of adjusted EBITDA:
|
|
Three months ended December 31, |
|
Year ended December 31, |
|||||||||||
|
|
2025 |
|
2024 |
|
2025 |
|
2024 |
|
2023 |
|||||
|
|
(in thousands) |
|
(in thousands) |
|
|
|
||||||||
Income (loss) before income and mining taxes |
|
$ |
14,100 |
|
$ |
(7,161) |
|
$ |
6,949 |
|
$ |
(46,739) |
|
$ |
67,036 |
Added back: |
|
|
|
|
|
|
|
|
|
|
|
|
|
|
|
Depreciation and depletion |
|
|
7,182 |
|
|
6,854 |
|
|
27,849 |
|
|
30,863 |
|
|
30,359 |
Loss from investment in McEwen Copper Inc. (Note 9) |
|
|
5,716 |
|
|
10,297 |
|
|
25,547 |
|
|
46,977 |
|
|
57,821 |
Dilution gain from investments in McEwen Copper Inc. (Note 9) |
|
|
(789) |
|
|
(5,777) |
|
|
(789) |
|
|
(5,777) |
|
|
— |
Interest expense |
|
|
1,947 |
|
|
983 |
|
|
6,607 |
|
|
3,911 |
|
|
5,749 |
Gain on deconsolidation of McEwen Copper Inc. |
|
|
— |
|
|
— |
|
|
— |
|
|
— |
|
|
(222,157) |
Advanced Projects - McEwen Copper Inc. |
|
|
— |
|
|
— |
|
|
— |
|
|
— |
|
|
76,345 |
General, interest and other - McEwen Copper Inc. |
|
|
— |
|
|
— |
|
|
— |
|
|
— |
|
|
(7,484) |
Adjusted EBITDA |
|
$ |
28,156 |
|
$ |
5,196 |
|
$ |
66,163 |
|
$ |
29,235 |
|
$ |
7,669 |
Weighted average shares outstanding (thousands) |
|
|
54,751 |
|
|
52,926 |
|
|
54,046 |
|
|
51,021 |
|
|
47,544 |
Adjusted EBITDA per share |
|
$ |
0.51 |
|
$ |
0.10 |
|
$ |
1.22 |
|
$ |
0.57 |
|
$ |
0.16 |
Average realized prices
The term average realized price per ounce used in this report is also a non-GAAP financial measure. We prepare this measure to evaluate our performance against market (London P.M. Fix). The average realized price for our 100% owned properties is calculated as gross sales of gold and silver, less streaming revenue, divided by the number of net ounces sold in the period, less ounces sold under the streaming agreement.
80
The following table reconciles the average realized prices to the most directly comparable U.S. GAAP measure, revenue from gold and silver sales. Ounces of gold and silver sold for the San José mine are provided to us by MSC.
|
|
Three months ended December 31, |
|
Year ended December 31, |
|||||||||||
|
|
2025 |
|
2024 |
|
2025 |
|
2024 |
|
2023 |
|||||
Average realized price - 100% owned |
|
|
(in thousands, except per ounce) |
|
|
|
|||||||||
Revenue from gold and silver sales |
|
$ |
64,623 |
|
$ |
33,523 |
|
$ |
197,553 |
|
$ |
174,477 |
|
$ |
166,231 |
Less: revenue from gold sales, stream |
|
|
240 |
|
|
421 |
|
|
1,087 |
|
|
1,528 |
|
|
2,042 |
Revenue from gold and silver sales, excluding stream |
|
$ |
64,383 |
|
$ |
33,102 |
|
$ |
196,466 |
|
$ |
172,949 |
|
$ |
164,189 |
GEOs sold |
|
|
14,907 |
|
|
13,200 |
|
|
57,409 |
|
|
74,911 |
|
|
88,699 |
Less: gold ounces sold, stream |
|
|
392 |
|
|
700 |
|
|
1,779 |
|
|
2,552 |
|
|
3,500 |
GEOs sold, excluding stream |
|
|
14,515 |
|
|
12,500 |
|
|
55,630 |
|
|
72,359 |
|
|
85,199 |
Average realized price per GEO sold, excluding stream |
|
$ |
4,436 |
|
$ |
2,648 |
|
$ |
3,532 |
|
$ |
2,390 |
|
$ |
1,927 |
|
|
Three months ended December 31, |
|
Year ended December 31, |
|||||||||||
|
|
2025 |
|
2024 |
|
2025 |
|
2024 |
|
2023 |
|||||
Average realized price - San José mine (100% basis) |
|
(in thousands, except per ounce) |
|||||||||||||
Gold sales |
|
$ |
128,362 |
|
$ |
61,587 |
|
$ |
296,157 |
|
$ |
187,009 |
|
$ |
148,971 |
Silver sales |
|
|
72,672 |
|
|
38,189 |
|
|
163,388 |
|
|
123,402 |
|
|
93,490 |
Revenue from gold and silver sales |
|
$ |
201,034 |
|
$ |
99,776 |
|
$ |
459,545 |
|
$ |
310,411 |
|
$ |
242,461 |
Less: commercial discounts |
|
|
(10,266) |
|
|
(3,974) |
|
|
(23,023) |
|
|
(12,073) |
|
|
(12,465) |
Revenue from gold and silver sales, excluding commercial discounts |
|
|
190,768 |
|
|
95,802 |
|
|
436,522 |
|
|
298,338 |
|
|
229,996 |
Gold ounces sold |
|
|
25,295 |
|
|
23,026 |
|
|
72,072 |
|
|
74,333 |
|
|
75,064 |
Silver ounces sold |
|
|
1,093,826 |
|
|
1,212,846 |
|
|
3,435,365 |
|
|
4,169,739 |
|
|
4,362,725 |
GEOs sold |
|
|
40,317 |
|
|
37,264 |
|
|
112,612 |
|
|
123,471 |
|
|
127,255 |
Average realized price per gold ounce sold |
|
$ |
4,815 |
|
$ |
2,675 |
|
$ |
3,904 |
|
$ |
2,516 |
|
$ |
1,985 |
Average realized price per silver ounce sold |
|
$ |
63.05 |
|
$ |
32.00 |
|
$ |
45.17 |
|
$ |
30.00 |
|
$ |
21.43 |
Average realized price per GEO sold |
|
$ |
4,732 |
|
$ |
2,678 |
|
$ |
3,876 |
|
$ |
2,514 |
|
$ |
1,905 |
CRITICAL ACCOUNTING ESTIMATES AND ACCOUNTING DEVELOPMENTS
Management’s Discussion and Analysis of Financial Condition and Results of Operations discuss our consolidated financial statements, which have been prepared in conformity with US GAAP. The preparation of these statements requires that we make estimates and assumptions that affect the reported amounts of assets, liabilities, revenues and expenses. We base these estimates on historical experience and on assumptions that we consider reasonable under the circumstances; however, reported results could differ from those based on the current estimates under different assumptions or conditions. The summary of our significant accounting policies is detailed in Note 2 of the Consolidated Financial Statements.
We believe that significant areas requiring the use of management estimates and assumptions relate to environmental reclamation and closure obligations; asset useful lives utilized for depletion, depreciation, amortization and accretion calculations; the fair value of equity investments and asset groups used in impairment testing; recoverable gold in leach pad inventory; current and long-term inventory and mine development capitalization costs; the collectability of sales taxes receivable; fair values of assets and liabilities acquired in business combinations; reserves; valuation allowances for deferred tax assets; income and mining tax provisions and reserves for contingencies and litigation. There are other items within our financial statements that require estimation but are not deemed to be critical. However, changes in the estimates used in these and other items could have a material impact on our financial statements. In the section below we identify estimates critical to the understanding of our financial condition and results of operations and that require the application of significant management judgment.
81
Asset Retirement Obligation, Reclamation and Remediation Costs: The Company records the fair value of a liability for an asset retirement obligation (“ARO”) in the period that it is incurred if a reasonable estimate of fair value can be made. The Company prepares estimates of the timing and amounts of expected cash flows when an ARO is incurred, which are updated to reflect changes in facts and circumstances. Estimation of the fair value of AROs requires significant judgment, including amount of cash flows, timing of reclamation, inflation rate and credit risk. Accrued reclamation and closure costs can represent a significant and variable liability on our balance sheet. The Company has estimated its liabilities under appropriate accounting guidance and reviews its liabilities on at least an annual basis. However, the ranges of liability could exceed the liabilities recognized. If substantial damages were awarded, claims were settled, or remediation costs were incurred in excess of our accruals, our financial results or condition could be materially adversely affected.
Mineral Property Interests, Plant and Equipment and Mine Development Costs: The Company amortizes its mineral property interests, plant and equipment, and mine development costs using the most appropriate method, which includes the units-of-production method over the estimated life of the mine or ore body based on recoverable ounces to be mined from proven and probable reserves, or the straight-line method over the useful life. The accounting estimates related to amortization are critical accounting estimates because (1) the determination of reserves involves uncertainties with respect to the ultimate geology of its reserves and the assumptions used in determining the economic feasibility of mining those reserves and (2) changes in estimated proven and probable reserves and asset useful lives can have a material impact on net (loss) income.
Estimates regarding mine development capitalization costs involve the determination of proven and probable reserves.
Impairment of Long-lived Assets: The Company reviews and evaluates its long-lived assets for impairment when events or changes in circumstances indicate that the related carrying amounts may not be recoverable. Once it is determined that impairment exists, an impairment loss is measured as the amount by which the asset carrying value exceeds its fair value.
For asset groups where an impairment loss is determined using the discounted future net cash flows method, future cash flows are estimated based on quantities of recoverable mineralized material, expected gold and silver prices (considering current and historical prices, trends and related factors), production levels, operating costs, capital requirements and reclamation costs, all based on life-of-mine plans. The term “recoverable mineralized material” refers to the estimated amount of gold or other commodities that will be obtained after considering losses during processing and treatment. The Company’s estimates of future cash flows are based on numerous assumptions and uncertainties. It is possible that actual future cash flows will be significantly different than the estimates, as actual future quantities of recoverable minerals, gold, silver and other commodity prices, production levels and costs of capital are each subject to significant risks and uncertainties.
Stockpiles, Material on Leach Pads, In-process Inventory, Precious Metals Inventory and Materials and Supplies: Stockpiles are measured by estimating the number of tonnes added and removed from the stockpile, an estimate of the contained metals (based on assay data) and the estimated metallurgical recovery rates. Costs are allocated to stockpiles based on current mining costs incurred including applicable overhead relating to mining operations.
Costs are attributed to the mineralized material on leach pads based on current mining costs incurred up to the point of placing the ore on the pad. Costs are removed from the leach pad inventory based on the average cost per estimated recoverable ounce of gold on the leach pad as the gold is recovered. The estimates of recoverable gold on the leach pads are calculated from the quantities of mineralized material placed on the leach pads (measured tonnes added to the leach pads), the grade of mineralized material placed on the leach pads (based on assay data) and a recovery percentage.
Although the quantities of recoverable gold placed on the leach pads are reconciled by comparing the grades of ore placed on the pads to the quantities of gold recovered (metallurgical balancing), the nature of the leaching process inherently limits the ability to precisely monitor inventory levels. As a result, the metallurgical balancing process is constantly monitored, and the engineering estimates are refined based on actual results over time.
82
In-process material is measured based on assays of the material from the various stages of processing. Costs are allocated to in-process inventories based on the costs of the material fed into the process attributable to the source material coming from the mines, stockpiles and/or leach pads plus the in-process conversion costs incurred to that point in the process.
Costs are allocated to precious metal inventories based on the costs of the respective in-process inventories incurred prior to the refining process plus applicable refining costs.
The assumptions used by the Company to measure metal content during each stage of the inventory conversion process include estimated recovery rates based on laboratory testing and assaying. The Company periodically reviews its estimates compared to actual experience and revises its estimates when appropriate. The ultimate recovery will not be known until the leaching operations cease.
Proven and Probable Reserves: Critical estimates are inherent in the process of determining the Company’s reserves. The Company’s reserves are affected largely by our assessment of future metals prices, as well as by engineering and geological estimates of ore grade, accessibility and production cost. The Company’s assessment of reserves occurs at least annually, and periodically utilizes external audits.
Reserve estimates are used in determining appropriate rates of unit-of-production depreciation, with net book value of many assets depreciated over remaining estimated reserves. Reserves are also a key component in forecasts, with which the Company compares future cash flows to current asset values to ensure that carrying values are reported appropriately. The Company’s forecasts are also used in determining the level of valuation allowances on the Company’s deferred tax assets. Reserves also play a key role in the valuation of certain assets in the determination of the purchase price allocations for acquisitions. Reserves involve many estimates and there are no guarantees that the Company will recover the indicated quantities of metals. Changes in the estimates could result in material adjustments to the Company’s reserves and asset values.
Income and Mining Taxes: The Company accounts for income and mining taxes under ASC 740 using the liability method, recognizing certain temporary differences between the financial reporting basis of liabilities and assets and the related tax basis for such liabilities and assets. This method generates either a net deferred income and mining tax liability or asset for the Company, as measured by the statutory tax rates in effect. The Company derives the deferred income and mining tax charge or benefit by recording the change in either the net deferred income and mining tax liability or asset balance for the year. The Company records a valuation allowance against any portion of those deferred income and mining tax assets when it believes, based on the weight of available evidence, it is more likely than not that some portion or all the deferred income and mining tax assets will not be realized.
Recent Accounting Pronouncements:
In November 2024, the FASB issued ASU 2024-03, Income Statement—Reporting Comprehensive Income—Expense Disaggregation Disclosures (Subtopic 220-40). Amended guidance requires more detailed disclosures about the nature of expenses included in the Consolidated Statements of Operations and Comprehensive Income (Loss). The amendments are effective for fiscal years beginning after December 15, 2026, and interim periods within fiscal years beginning after December 15, 2027. The Company is currently evaluating the impact on reporting requirements.
83
FORWARD-LOOKING STATEMENTS
This report contains or incorporates by reference “forward-looking statements”, as that term is used in federal securities laws, about our financial condition, results of operations and business. These statements include, among others:
| ● | statements about our anticipated exploration results, cost and feasibility of production, production estimates, receipt of permits or other regulatory or government approvals and plans for the development of our properties; |
| ● | statements regarding strategic alternatives that we are, or may in the future, evaluate in connection with our business; |
| ● | statements concerning the benefits or outcomes that we expect will result from our business activities and certain transactions that we contemplate or have completed, such as receipt of proceeds, increased revenues, decreased expenses and avoided expenses and expenditures; |
| ● | statements of our expectations, beliefs, future plans and strategies, anticipated developments and other matters that are not historical facts. |
These statements may be made expressly in this document or may be incorporated by reference to other documents that we will file with the SEC. Many of these statements can be found by looking for words such as “believes”, “expects”, “anticipates”, “estimates” or similar expressions used in this report or incorporated by reference in this report.
Forward-looking statements and information are based upon several estimates and assumptions that, while considered reasonable by management, are inherently subject to significant business, economic and competitive uncertainties, risks and contingencies, and there can be no assurance that such statements and information will prove to be accurate. Therefore, actual results and future events could differ materially from those anticipated in such statements and information.
Included among the forward-looking statements and information that we may provide is production guidance. From time to time the Company provides guidance on operations, based on stand-alone budgets for each operating mine. In developing the mine production portion of the budget, we evaluate several factors and assumptions, which include, but are not limited to:
| ● | gold and silver price forecasts. |
| ● | average gold and silver grade mined, using a resource model. |
| ● | average grade processed by the crushing facility (Gold Bar) or milling facility (San José mine and Fox Complex). |
| ● | expected tonnes moved and strip ratios. |
| ● | available stockpile material (grades, tonnes, and accessibility). |
| ● | estimates of in process inventory (either on the leach pad or plant for the El Gallo mine and Gold Bar, or in the mill facility for the San José mine and the Black Fox mine). |
| ● | estimated leach recovery rates and leach cycle times (the El Gallo mine and Gold Bar). |
| ● | estimated mill recovery rates (San José mine and Fox Complex). |
| ● | dilution of material processed. |
| ● | internal and contractor equipment and labor availability. |
| ● | seasonal weather patterns. |
84
Actual production results are sensitive to variances in any of the key factors and assumptions noted above. As a result, we frequently evaluate and reconcile actual results to budgeted results to determine if key assumptions and estimates require modification. Any changes will, in turn, influence production guidance.
We caution you not to put undue reliance on these forward-looking statements, which speak only as of the date of this report. Further, the information contained in this document or incorporated herein by reference is a statement of our present intention and is based on present facts and assumptions, and may change at any time and without notice, based on changes in such facts or assumptions. Readers should not place undue reliance on forward-looking statements.
RISK FACTORS IMPACTING FORWARD-LOOKING STATEMENTS
Important factors that could prevent us from achieving our stated goals and objectives include, but are not limited to, those set forth in the “Risk Factors” section and the following:
| ● | our ability to raise funds required for the execution of our business strategy. |
| ● | our acquisitions may not achieve their intended results. Our ability to secure permits or other regulatory and government approvals needed to operate, develop or explore our mineral properties and projects. |
| ● | our ability to maintain an ongoing listing of our common stock on the New York Stock Exchange or another national securities exchange in the United States. |
| ● | decisions of foreign countries, banks, and courts within those countries. |
| ● | national and international geopolitical events and conflicts, and unexpected changes in business, economic, and political conditions. |
| ● | operating results of MSC and McEwen Copper. |
| ● | fluctuations in interest rates, inflation rates, currency exchange rates, or commodity prices. |
| ● | timing and amount of mine production. |
| ● | our ability to retain and attract key personnel. |
| ● | technological changes in the mining industry. |
| ● | changes in operating, exploration or overhead costs. |
| ● | access and availability of materials, equipment, supplies, labor and supervision, power and water. |
| ● | results of current and future exploration activities. |
| ● | results of pending and future feasibility studies or the expansion or commencement of mining operations without feasibility studies having been completed. |
| ● | changes in our business strategy. |
| ● | interpretation of drill hole results and the geology, grade and continuity of mineralization. |
| ● | the uncertainty of reserve estimates and timing of development expenditures. |
| ● | litigation or regulatory investigations and procedures affecting us. |
| ● | changes in federal, state, provincial and local laws and regulations. |
| ● | local, indigenous and community impacts and issues including criminal activity and violent crimes. |
| ● | accidents, public health issues, and labor disputes. |
| ● | uncertainty relating to title to mineral properties. |
| ● | changes in relationships with the local communities in the areas in which we operate; and |
| ● | decisions by third parties over which we have no control. |
85
We undertake no responsibility or obligation to update publicly these forward-looking statements, except as required by law and we may update these statements in the future in written or oral statements. Investors should take note of any future statements made by or on our behalf.
ITEM 7A. QUANTITATIVE AND QUALITATIVE DISCLOSURE ABOUT MARKET RISK
Our exposure to market risks includes, but is not limited to, the following risks: changes in foreign currency exchange rates, equity price risks, commodity price fluctuations, credit risk and inflationary risk. We do not use derivative financial instruments as part of an overall strategy to manage market risk.
Further, our participation in the joint venture with Hochschild for the 49.0% interest held at MSC, and 46.3% ownership in McEwen Copper as of December 31, 2025, each creates additional risks because, among other things, we do not exercise decision-making power over the day-to-day activities at MSC or McEwen Copper; however, implications from our partner’s decisions may result in us having to provide additional funding to MSC or McEwen Copper, or result in a further decrease in our percentage of ownership.
Foreign Currency Risk
In general, the devaluation of non-U.S. dollar currencies with respect to the U.S. dollar has a positive effect on our costs and liabilities which are incurred outside the U.S. while it has a negative effect on our assets denominated in non-U.S. dollar currency. Although we transact most of our business in U.S. dollars, some expenses, labor, operating supplies and property and equipment are denominated in Canadian dollars, Mexican pesos, and Argentine pesos. In respect of McEwen Copper and MSC, the Argentine peso is used to conduct a significant portion of their business.
Since 2008, the Argentine peso has been steadily devaluing against the U.S. dollar by 10% to 73% on an annual basis. As noted in the graph below, during 2025 the Argentine peso devalued 30% compared to devaluations of 37% and 73% in 2024 and 2023 respectively.
During 2025, the Mexican peso appreciated 12% against the US dollar, compared to a depreciation of 15% in 2024 and an appreciation of 14% in 2023. During 2025, the Canadian dollar appreciated by 3.3% against the U.S. dollar, compared to a depreciation of 5.6% in 2024 and an appreciation of 1.3% in 2023.
The following chart illustrates changes in the value of these currencies compared to the U.S. dollar in the twelve months ended December 31, 2025:

86
The value of cash and cash equivalents denominated in foreign currencies also fluctuates with changes in currency exchange rates. Appreciation of non-U.S. dollar currencies results in a foreign currency gain on such investments and a depreciation in non-U.S. dollar currencies results in a loss. We have not utilized material market risk-sensitive instruments to manage our exposure to foreign currency exchange rates but may do so in the future. As of December 31, 2025, 96.5% of our foreign currency holdings was held in Canadian dollars, representing 14.5% of our total treasury. We held minor positions in Mexican and Argentine Pesos.
Based on our Canadian cash balance of $7.4 million (C$10.3 million) as at December 31, 2025, a 1% fluctuation in the Canadian dollar would result in a gain/loss of less than $0.1 million in the Consolidated Statements of Operations and Comprehensive (Loss) Income. We also hold negligible portions of our cash reserves in Mexican and Argentine pesos, with effect of a 1% change in this currency resulting in gains/losses immaterial for disclosure purposes.
Furthermore, we are also subject to foreign currency risk on the fluctuation of the Mexican peso on our VAT receivable balance. As of December 31, 2025, our VAT receivable balance was MXN15.5 million, equivalent to approximately $0.9 million, for which a 1% change in the Mexican peso would have resulted in a gain/loss of less than $0.1 million in the Consolidated Statements of Operations and Comprehensive (Loss) Income.
MSC holds a portion of its local cash balances in Argentine pesos and is therefore exposed to the effects of this continued devaluation and also the risk that there may be a sudden severe devaluation of the Argentine peso. A severe devaluation could result in material foreign exchange losses as reported in U.S. dollars.
Equity Price Risk
We have invested and may continue to invest in shares of common stock of other entities in the mining sector. Some of our investments may be highly volatile and lack liquidity caused by lower trading volumes. As a result, we are inherently exposed to fluctuations in the fair value of our investments, which may result in gains or losses upon their valuation. Based on the marketable securities balance of $21.1 million as at December 31, 2025, a 1.0% change in fair value would result in a gain or loss of approximately $0.2 million.
We have in the past sought and will likely in the future seek to acquire additional funding from the sale of common stock or other equity securities. Movements in the price of our investments have been volatile in the past and may also be volatile in the future. As a result, there is a risk that we may not be able to sell equity securities at an acceptable price to meet future funding requirements.
In February 2025, we raised gross proceeds of $110.0 million through the issuance of Convertible Senior Notes due August 15, 2030, as further described in Note 10 to the consolidated financial statements. In connection with the offering, we entered into separate Capped Call Transactions intended to offset potential dilution upon conversion of the Convertible Notes. These transactions, which are subject to customary anti-dilution adjustments, cover the aggregate number of shares of common stock initially underlying the Convertible Notes.
Commodity Price Risk
We produce and sell gold and silver. Changes in the market price of gold and silver have and will in the future significantly affect the results of our operations and cash flows. Changes in the price of gold and silver could materially affect our revenues. Based on our revenues from gold and silver sales of $197.6 million for the full year December 31, 2025, a 10% change in the price of gold and silver would have had an impact of approximately $19.8 million on our revenues. Changes in the price of gold and silver can also affect the provisionally priced sales that we make under sales agreements. At December 31, 2025, we had no gold or silver sales subject to provisional pricing at our 100% owned operations.
We have in the past and may in the future hold a portion of our treasury in gold and silver bullion, where the value is recorded at the lower of cost or market. Gold and silver prices will affect the value of any bullion that we hold in treasury. We do not hedge any of our sales and are therefore subject to all changes in commodity prices.
87
Credit Risk
We may be exposed to credit loss through our precious metals and doré sales agreements with financial institutions and refineries if these customers are unable to make payment in accordance with the terms of the agreements. However, based on the history and the financial condition of our counterparties, we do not anticipate that any of our customers will default on their obligations. As of December 31, 2025, we do not believe we have any significant credit exposure associated with precious metals and our doré sales agreements.
In Nevada and Ontario, Canada we are required to provide security to cover our projected reclamation costs. As at December 31, 2025, we have surety bonds of $48.2 million in place to satisfy bonding requirements for this purpose. The bonds have an annual fee of 2.4% of their value and require an average deposit of 7.2% of the amount of the bond. Although we do not believe we have any significant credit exposure associated with these bonds or the deposit, we are exposed to the risk that the surety may default in returning our deposit or that the surety bonds may no longer be accepted by the governmental agencies as satisfactory reclamation coverage, in which case we would be required to replace the surety bonding with cash.
Interest rate risk
Our outstanding debt consists of the $110.0 million convertible notes due 2030, the $20.0 million term loan facility, and various equipment leases. As the convertible notes and term loan have fixed coupons, we do not have any significant exposure to interest rate risks.
Inflationary Risk
Argentina has experienced a significant amount of inflation over the last ten years and has now been classified as a hyperinflationary economy. ASC 830 defines a hyperinflationary economy as one where the cumulative inflation rate exceeds 100% over the last three years which precede the reporting period. In this scenario, ASC 830 requires companies to change the functional currency of its foreign subsidiaries operating in a hyperinflationary economy, to match the company’s reporting currency. In our case, the functional currency of all our Argentine subsidiaries has always been our reporting currency, the U.S. dollar. As such, we do not expect the classification of Argentina’s economy as a hyperinflationary economy, to change our financial reporting methodology.
88
ITEM 8. FINANCIAL STATEMENTS AND SUPPLEMENTARY DATA
Index to Financial Statements: |
|
Page |
|
|
|
Management’s Report on Internal Control Over Financial Reporting |
|
90 |
|
|
|
Reports of Independent Registered Public Accounting Firm (PCAOB ID: 1263) |
|
91 |
|
|
|
|
95 |
|
|
|
|
Consolidated Balance Sheets as of December 31, 2025, and 2024 |
|
96 |
|
|
|
|
97 |
|
|
|
|
Consolidated Statements of Cash Flows for the years ended December 31, 2025, 2024 and 2023 |
|
98 |
|
|
|
|
100 |
89
MANAGEMENT’S REPORT ON INTERNAL CONTROL OVER FINANCIAL REPORTING
The management of the Company is responsible for establishing and maintaining adequate internal control over financial reporting. The Securities Exchange Act of 1934 defines internal control over financial reporting in Rule 13a-15(f) and 15d-15(f) as a process designed by, or under the supervision of, the Company’s principal executive and principal financial officers and effected by the Company’s Board of Directors, management and other personnel, to provide reasonable assurance regarding the reliability of financial reporting and the preparation of financial statements for external purposes in accordance with generally accepted accounting principles and includes those policies and procedures that:
| ● | Pertain to the maintenance of records that in reasonable detail accurately and fairly reflect the transactions and dispositions of the assets of the Company; |
| ● | Provide reasonable assurance that transactions are recorded as necessary to permit preparation of financial statements in accordance with generally accepted accounting principles, and that receipts and expenditures of the Company are being made only in accordance with authorizations of management and the Board of Directors of the Company; and |
| ● | Provide reasonable assurance regarding prevention or timely detection of unauthorized acquisition, use or disposition of the Company’s assets that could have a material effect on the financial statements. |
All internal control over financial reporting processes and systems, no matter how well designed, have inherent limitations. Therefore, even processes and systems deemed to be effective can provide only reasonable assurance with respect to financial statement preparation and presentation. Also, projections of any evaluation of effectiveness to future periods are subject to the risk that controls may become inadequate due to changes in conditions, or that the degree of compliance with the policies or procedures may deteriorate.
The Company’s management assessed the effectiveness of the Company’s internal control over financial reporting as of December 31, 2025. In making this assessment, the Company’s management used the criteria set forth by the Committee of Sponsoring Organizations of the Treadway Commission (COSO) in Internal Control—Integrated Framework (2013). Based upon its assessment, management concluded that, as of December 31, 2025, the Company’s internal control over financial reporting was effective based upon those criteria.
Ernst & Young LLP, an independent registered public accounting firm, has audited the effectiveness of the Company’s internal control over financial reporting as of December 31, 2025. Ernst & Young LLP’s report on our internal control over financing reporting as of December 31, 2025 can be found under Item 8, Financial Statements and Supplementary Data.
90
REPORT OF INDEPENDENT REGISTERED PUBLIC ACCOUNTING FIRM
To the Shareholders and the Board of Directors of McEwen Inc.
Opinion on the Financial Statements
We have audited the accompanying consolidated balance sheets of McEwen Inc. (the “Company”) as of December 31, 2025 and 2024, the related consolidated statements of operations and comprehensive income (loss), changes in shareholders’ equity and cash flows for each of the three years in the period ended December 31, 2025, and the related notes (collectively referred to as the “consolidated financial statements”). In our opinion, the consolidated financial statements present fairly, in all material respects, the financial position of the Company at December 31, 2025 and 2024, and the results of its operations and its cash flows for each of the three years in the period ended December 31, 2025, in conformity with U.S. generally accepted accounting principles.
We also have audited, in accordance with the standards of the Public Company Accounting Oversight Board (United States) (PCAOB), the Company's internal control over financial reporting as of December 31, 2025, based on criteria established in Internal Control – Integrated Framework issued by the Committee of Sponsoring Organizations of the Treadway Commission (2013 framework), and our report dated March 16, 2026 expressed an unqualified opinion thereon.
Basis for Opinion
These financial statements are the responsibility of the Company's management. Our responsibility is to express an opinion on the Company’s financial statements based on our audits. We are a public accounting firm registered with the PCAOB and are required to be independent with respect to the Company in accordance with the U.S. federal securities laws and the applicable rules and regulations of the Securities and Exchange Commission and the PCAOB.
We conducted our audits in accordance with the standards of the PCAOB. Those standards require that we plan and perform the audit to obtain reasonable assurance about whether the financial statements are free of material misstatement, whether due to error or fraud. Our audits included performing procedures to assess the risks of material misstatement of the financial statements, whether due to error or fraud, and performing procedures that respond to those risks. Such procedures included examining, on a test basis, evidence regarding the amounts and disclosures in the financial statements. Our audits also included evaluating the accounting principles used and significant estimates made by management, as well as evaluating the overall presentation of the financial statements. We believe that our audits provide a reasonable basis for our opinion.
Critical Audit Matters
The critical audit matters communicated below are matters arising from the current period audit of the financial statements that were communicated or required to be communicated to the audit committee and that: (1) relate to accounts or disclosures that are material to the financial statements and (2) involved our especially challenging, subjective or complex judgments. The communication of the critical audit matters does not alter in any way our opinion on the consolidated financial statements, taken as a whole, and we are not, by communicating the critical audit matters below, providing separate opinions on the critical audit matters or on the accounts or disclosures to which they relate.
91
Valuation of Material on Leach Pad
Description of the Matter |
|
As of December 31, 2025, the carrying value of the Company’s inventories was $47 million, of which $31 million related to material on the leach pad as disclosed in Note 7 to the consolidated financial statements. As discussed in Note 2 to the consolidated financial statements, material on leach pads is accounted for using the weighted average cost method and is carried at the lower of average cost or net realizable value. Costs are attributed to the mineralized material on leach pads based on current mining and processing costs incurred related to the ore on the pad. Costs are removed from the leach pad inventory based on the average cost per estimated recoverable ounce of gold on the leach pad as the gold is recovered. The estimate of recoverable gold on the leach pads is calculated from the quantities of mineralized material placed on the leach pads, the grade of mineralized material placed on the leach pads and a recovery percentage. The significant assumption used by management in the valuation of the leach pad inventory is the recovery percentage, which is a subjective and complex estimate. Auditing management’s estimate of the recoverable gold on the leach pad was complex due to the subjective nature of the assumptions used in the calculation. |
How We Addressed the Matter in Our Audit |
|
We obtained an understanding, evaluated the design and tested the operating effectiveness of controls over the quantities of material placed on the leach pad, the grade determination, and the recovery percentage to assess whether the estimate of recoverable gold on the leach pad was appropriate. To test the valuation of material on the leach pad, our audit procedures included, among others, assessing the competence and objectivity of management’s specialists by evaluating their professional qualifications, experience, and their use of accepted industry practices. In addition, we involved our mining specialist to assess the appropriateness of the methods employed in calculating the estimate of recoverable gold on the leach pad to evaluate if it was developed in line with common industry practices. We also evaluated the methodologies used for the determination of the estimate of recoverable gold on the leach pad by understanding the quantities of ore placed on the leach pad, timing of the leaching cycle, the grade determination and recovery percentage with the assistance of our mining specialist. We reperformed management’s calculation of material on the leach pad to test mathematical accuracy. We assessed the adequacy of the Company’s disclosures in Note 2 and Note 7 related to the valuation of the material on leach pad. |
92
Income Taxes - Valuation Allowance for Deferred Tax Asset in the United States
Description of the Matter |
|
As described in Note 19 to the consolidated financial statements, at December 31, 2025, the Company had gross deferred tax assets of $141 million, reduced by a $116 million valuation allowance. Deferred tax assets are reduced by a valuation allowance if, based upon the weight of all available evidence both positive and negative, it is more likely than not that some portion, or all, of the deferred tax assets will not be realized. Management’s analysis of the realizability of its deferred tax assets was significant to our audit because the assessment process related to the realizability of these deferred tax assets is complex with respect to the application of income tax laws, and involves judgments that include projections of future taxable income. |
How We Addressed the Matter in Our Audit |
|
We obtained an understanding, evaluated the design and tested the operating effectiveness of controls relating to the realizability of deferred tax assets, including controls over management’s projections of future taxable income, and valuation allowance assessment under ASC 740 Income Taxes. To test management’s assessment of the realizability of its deferred tax assets, our audit procedures included, among others, evaluation of the assumptions used by the Company to develop projections of future taxable income and testing the completeness and accuracy of the underlying data used in its projections. We involved our mining specialist in understanding future production levels, operating and capital cost estimates included in the forecast. We involved our tax professionals to evaluate the Company's application of tax laws in the Company’s projections of future taxable income. We reperformed management’s calculation of the valuation allowance release to test mathematical accuracy. We assessed the adequacy of the Company’s disclosures in Note 19 related to the valuation allowance for deferred tax assets in the United States. |
/s/ Ernst & Young LLP
Chartered Professional Accountants
Licensed Public Accountants
We have served as the Company’s auditor since 2016.
Toronto, Canada
March 16, 2026
93
REPORT OF INDEPENDENT REGISTERED PUBLIC ACCOUNTING FIRM
To the Shareholders and the Board of Directors of McEwen Inc.
Opinion on Internal Control Over Financial Reporting
We have audited McEwen Inc.’s internal control over financial reporting as of December 31, 2025, based on criteria established in Internal Control—Integrated Framework issued by the Committee of Sponsoring Organizations of the Treadway Commission (2013 framework) (the “COSO criteria”). In our opinion, McEwen Inc. (the “Company”) maintained, in all material respects, effective internal control over financial reporting as of December 31, 2025, based on the COSO criteria.
We also have audited, in accordance with the standards of the Public Company Accounting Oversight Board (United States) (PCAOB) , the consolidated balance sheets of the Company as of December 31, 2025 and 2024, the related consolidated statements of operations and comprehensive income (loss), changes in shareholders' equity and cash flows for each of the three years in the period ended December 31, 2025, and the related notes and our report dated March 16, 2026, expressed an unqualified opinion thereon.
Basis for Opinion
The Company’s management is responsible for maintaining effective internal control over financial reporting and for its assessment of the effectiveness of internal control over financial reporting included in the accompanying Management’s Report on Internal Control over Financial Reporting. Our responsibility is to express an opinion on the Company’s internal control over financial reporting based on our audit. We are a public accounting firm registered with the PCAOB and are required to be independent with respect to the Company in accordance with the U.S. federal securities laws and the applicable rules and regulations of the Securities and Exchange Commission and the PCAOB.
We conducted our audit in accordance with the standards of the PCAOB. Those standards require that we plan and perform the audit to obtain reasonable assurance about whether effective internal control over financial reporting was maintained in all material respects.
Our audit included obtaining an understanding of internal control over financial reporting, assessing the risk that a material weakness exists, testing and evaluating the design and operating effectiveness of internal control based on the assessed risk, and performing such other procedures as we considered necessary in the circumstances. We believe that our audit provides a reasonable basis for our opinion.
Definition and Limitations of Internal Control Over Financial Reporting
A company’s internal control over financial reporting is a process designed to provide reasonable assurance regarding the reliability of financial reporting and the preparation of financial statements for external purposes in accordance with generally accepted accounting principles. A company’s internal control over financial reporting includes those policies and procedures that (1) pertain to the maintenance of records that, in reasonable detail, accurately and fairly reflect the transactions and dispositions of the assets of the company; (2) provide reasonable assurance that transactions are recorded as necessary to permit preparation of financial statements in accordance with generally accepted accounting principles, and that receipts and expenditures of the company are being made only in accordance with authorizations of management and directors of the company; and (3) provide reasonable assurance regarding prevention or timely detection of unauthorized acquisition, use, or disposition of the company’s assets that could have a material effect on the financial statements.
Because of its inherent limitations, internal control over financial reporting may not prevent or detect misstatements. Also, projections of any evaluation of effectiveness to future periods are subject to the risk that controls may become inadequate because of changes in conditions, or that the degree of compliance with the policies or procedures may deteriorate.
/s/ Ernst & Young LLP
Chartered Professional Accountants
Licensed Public Accountants
Toronto, Canada
March 16, 2026
94
McEWEN INC.
CONSOLIDATED STATEMENTS OF OPERATIONS AND COMPREHENSIVE INCOME (LOSS)
(in thousands of U.S. dollars, except per share amounts)
|
|
Year ended December 31, |
|||||||
|
|
2025 |
|
2024 |
|
2023 |
|||
Revenue from gold and silver sales |
|
$ |
197,553 |
|
$ |
174,477 |
|
$ |
166,231 |
Production costs applicable to sales |
|
|
(122,760) |
|
|
(113,313) |
|
|
(119,230) |
Depreciation and depletion |
|
|
(27,229) |
|
|
(30,229) |
|
|
(29,221) |
Gross profit |
|
|
47,564 |
|
|
30,935 |
|
|
17,780 |
|
|
|
|
|
|
|
|
|
|
OTHER OPERATING INCOME (EXPENSES): |
|
|
|
|
|
|
|
|
|
Advanced projects |
|
|
(7,961) |
|
|
(7,152) |
|
|
(82,637) |
Exploration |
|
|
(22,196) |
|
|
(16,546) |
|
|
(20,167) |
General and administrative |
|
|
(26,695) |
|
|
(17,165) |
|
|
(15,449) |
Loss from investment in McEwen Copper Inc. (Note 9) |
|
|
(25,547) |
|
|
(46,977) |
|
|
(57,821) |
Income from investment in Minera Santa Cruz S.A. (Note 9) |
|
|
41,125 |
|
|
9,021 |
|
|
62 |
Depreciation |
|
|
(620) |
|
|
(634) |
|
|
(1,138) |
Reclamation and remediation |
|
|
(3,017) |
|
|
(2,054) |
|
|
(2,693) |
|
|
|
(44,911) |
|
|
(81,507) |
|
|
(179,843) |
Operating income (loss) |
|
|
2,653 |
|
|
(50,572) |
|
|
(162,063) |
|
|
|
|
|
|
|
|
|
|
OTHER INCOME (EXPENSES): |
|
|
|
|
|
|
|
|
|
Interest and other finance (expenses) income, net |
|
|
(7,217) |
|
|
(4,595) |
|
|
36,918 |
Other income (expenses) (Note 18) |
|
|
10,724 |
|
|
2,651 |
|
|
(29,976) |
Dilution gain from investments in McEwen Copper Inc. (Note 9) |
|
|
789 |
|
|
5,777 |
|
|
— |
Gain on deconsolidation of McEwen Copper Inc. (Note 9) |
|
|
— |
|
|
— |
|
|
222,157 |
Total other income |
|
|
4,296 |
|
|
3,833 |
|
|
229,099 |
Income (loss) before income and mining taxes |
|
|
6,949 |
|
|
(46,739) |
|
|
67,036 |
Income and mining tax recovery (expense) (Note 19) |
|
|
27,485 |
|
|
3,048 |
|
|
(33,859) |
Net income (loss) after income and mining taxes |
|
|
34,434 |
|
|
(43,691) |
|
|
33,177 |
Net loss attributable to non-controlling interests |
|
|
— |
|
|
— |
|
|
22,122 |
Net income (loss) and comprehensive income (loss) attributable to McEwen shareholders |
|
$ |
34,434 |
|
$ |
(43,691) |
|
$ |
55,299 |
|
|
|
|
|
|
|
|
|
|
Net income (loss) per share (Note 14): |
|
|
|
|
|
|
|
|
|
Basic |
|
$ |
0.64 |
|
$ |
(0.86) |
|
$ |
1.16 |
Diluted |
|
$ |
0.59 |
|
$ |
(0.86) |
|
$ |
1.16 |
Weighted average common shares outstanding (thousands) (Note 14): |
|
|
|
|
|
|
|
|
|
Basic |
|
|
54,046 |
|
|
51,021 |
|
|
47,544 |
Diluted |
|
|
65,560 |
|
|
51,021 |
|
|
47,544 |
The accompanying notes are an integral part of these consolidated financial statements.
95
McEWEN INC.
CONSOLIDATED BALANCE SHEETS
(in thousands of U.S. dollars)
|
|
As at |
|
As at |
||
|
|
December 31, |
|
December 31, |
||
|
|
2025 |
|
2024 |
||
ASSETS |
|
|
|
|
|
|
Current assets: |
|
|
|
|
|
|
Cash and cash equivalents (Note 4) |
|
$ |
51,015 |
|
$ |
13,692 |
Marketable securities (Note 5) |
|
|
21,114 |
|
|
1,617 |
Receivables, prepaids and other current assets (Note 6) |
|
|
5,752 |
|
|
7,486 |
Due from McEwen Copper Inc. (Note 15) |
|
|
3,169 |
|
|
286 |
Inventories (Note 7) |
|
|
26,836 |
|
|
18,111 |
Total current assets |
|
|
107,886 |
|
|
41,192 |
Mineral property interests and plant and equipment, net (Note 8) |
|
|
227,208 |
|
|
210,922 |
Equity method investments (Note 9) |
|
|
428,641 |
|
|
400,801 |
Due from McEwen Copper Inc. (Note 15) |
|
|
6,052 |
|
|
— |
Deferred tax assets (Note 19) |
|
|
25,591 |
|
|
— |
Inventories (Note 7) |
|
|
20,560 |
|
|
7,834 |
Restricted cash (Note 4) |
|
|
4,246 |
|
|
3,772 |
Other assets |
|
|
34 |
|
|
102 |
TOTAL ASSETS |
|
$ |
820,218 |
|
$ |
664,623 |
|
|
|
|
|
|
|
LIABILITIES & SHAREHOLDERS’ EQUITY |
|
|
|
|
|
|
Current liabilities: |
|
|
|
|
|
|
Accounts payable and accrued liabilities |
|
$ |
44,911 |
|
$ |
28,448 |
Reclamation and remediation liabilities (Note 12) |
|
|
6,473 |
|
|
4,988 |
Contract liability (Note 17) |
|
|
7,549 |
|
|
3,544 |
Flow-through share premium (Note 13) |
|
|
974 |
|
|
5,447 |
Tax liabilities (Note 19) |
|
|
2,976 |
|
|
4,478 |
Lease liabilities (Note 10) |
|
|
926 |
|
|
788 |
Total current liabilities |
|
|
63,809 |
|
|
47,693 |
Long-term debt, net of issuance costs (Note 11) |
|
|
126,168 |
|
|
40,000 |
Reclamation and remediation liabilities (Note 12) |
|
|
39,384 |
|
|
41,075 |
Deferred tax liabilities (Note 19) |
|
|
40,328 |
|
|
36,630 |
Lease liabilities (Note 10) |
|
|
1,088 |
|
|
1,323 |
Other liabilities |
|
|
3,204 |
|
|
2,927 |
Total liabilities |
|
$ |
273,981 |
|
$ |
169,648 |
|
|
|
|
|
|
|
Shareholders’ equity: |
|
|
|
|
|
|
Common shares: 55,517 as at December 31, 2025, and 53,054 as at December 31, 2024 issued and outstanding (in thousands) (Note 13) |
|
$ |
1,821,530 |
|
$ |
1,804,702 |
Accumulated deficit |
|
|
(1,275,293) |
|
|
(1,309,727) |
Total shareholders’ equity |
|
|
546,237 |
|
|
494,975 |
TOTAL LIABILITIES & SHAREHOLDERS’ EQUITY |
|
$ |
820,218 |
|
$ |
664,623 |
The accompanying notes are an integral part of these consolidated financial statements.
96
McEWEN INC.
CONSOLIDATED STATEMENTS OF CHANGES IN SHAREHOLDERS’ EQUITY
(in thousands of U.S. dollars and shares)
|
|
Common Shares |
|
|
|
|
|
|
|
|
||||
|
|
and Additional |
|
|
|
|
|
|
|
|
|
|||
|
|
Paid-in Capital |
|
|
Accumulated |
|
|
Non-controlling |
|
|
|
|||
|
|
Shares |
|
Amount |
|
|
Deficit |
|
|
Interests |
|
|
Total |
|
Balance, December 31, 2022 |
|
47,428 |
|
$ |
1,644,144 |
|
$ |
(1,321,335) |
|
$ |
33,465 |
|
$ |
356,274 |
Stock-based compensation |
|
66 |
|
|
605 |
|
|
— |
|
|
— |
|
|
605 |
Restricted shares issued |
|
43 |
|
|
366 |
|
|
— |
|
|
— |
|
|
366 |
Proceeds from McEwen Copper Inc. financing |
|
— |
|
|
109,913 |
|
|
— |
|
|
75,477 |
|
|
185,390 |
Sale of flow-through shares (Note 13) |
|
1,903 |
|
|
13,428 |
|
|
— |
|
|
— |
|
|
13,428 |
Net loss and comprehensive loss |
|
— |
|
|
— |
|
|
55,299 |
|
|
(22,122) |
|
|
33,177 |
McEwen Copper Inc. deconsolidation (Note 9) |
|
— |
|
|
— |
|
|
— |
|
|
(86,820) |
|
|
(86,820) |
Balance, December 31, 2023 |
|
49,440 |
|
$ |
1,768,456 |
|
$ |
(1,266,036) |
|
$ |
— |
|
$ |
502,420 |
Stock-based compensation |
|
241 |
|
|
3,244 |
|
|
— |
|
|
— |
|
|
3,244 |
Exercise of warrants |
|
1 |
|
|
9 |
|
|
— |
|
|
— |
|
|
9 |
Sale of flow-through shares (Note 13) |
|
1,533 |
|
|
14,374 |
|
|
— |
|
|
— |
|
|
14,374 |
Shares issued to acquire Timberline Resources Corporation |
|
1,839 |
|
|
17,706 |
|
|
— |
|
|
— |
|
|
17,706 |
Warrants assumed in acquisition of Timberline Resources Corporation |
|
— |
|
|
913 |
|
|
— |
|
|
— |
|
|
913 |
Net loss and comprehensive loss |
|
— |
|
|
— |
|
|
(43,691) |
|
|
— |
|
|
(43,691) |
Balance, December 31, 2024 |
|
53,054 |
|
$ |
1,804,702 |
|
$ |
(1,309,727) |
|
$ |
— |
|
$ |
494,975 |
Stock-based compensation |
|
533 |
|
|
7,251 |
|
|
— |
|
|
— |
|
|
7,251 |
Exercise of warrants |
|
85 |
|
|
610 |
|
|
— |
|
|
— |
|
|
610 |
Investment in Goliath Resources Limited (Note 5) |
|
868 |
|
|
6,068 |
|
|
— |
|
|
— |
|
|
6,068 |
Investment in Paragon Advanced Labs Inc. (Note 9) |
|
709 |
|
|
13,719 |
|
|
— |
|
|
— |
|
|
13,719 |
Purchase of capped call options (Note 11) |
|
— |
|
|
(15,114) |
|
|
— |
|
|
— |
|
|
(15,114) |
Shares issued for debt refinancing (Note 11) |
|
53 |
|
|
400 |
|
|
— |
|
|
— |
|
|
400 |
Sale of flow-through shares (Note 13) |
|
215 |
|
|
3,894 |
|
|
— |
|
|
— |
|
|
3,894 |
Net income and comprehensive income |
|
— |
|
|
— |
|
|
34,434 |
|
|
— |
|
|
34,434 |
Balance, December 31, 2025 |
|
55,517 |
|
$ |
1,821,530 |
|
$ |
(1,275,293) |
|
$ |
— |
|
$ |
546,237 |
The accompanying notes are an integral part of these consolidated financial statements.
97
McEWEN INC.
CONSOLIDATED STATEMENTS OF CASH FLOWS
(in thousands of U.S. dollars)
|
|
Year ended December 31, |
|||||||
|
|
2025 |
|
2024 |
|
2023 |
|||
Cash flows from operating activities: |
|
|
|
|
|
|
|
|
|
Net income (loss) |
|
$ |
34,434 |
|
$ |
(43,691) |
|
$ |
33,177 |
Adjustments to reconcile net loss from operating activities: |
|
|
|
|
|
|
|
|
|
Loss from investment in McEwen Copper Inc. (Note 9) |
|
|
25,547 |
|
|
46,977 |
|
|
57,821 |
Income from investment in Minera Santa Cruz S.A. (Note 9) |
|
|
(41,125) |
|
|
(9,021) |
|
|
(62) |
Depreciation, amortization and depletion |
|
|
27,849 |
|
|
30,863 |
|
|
30,359 |
Gain on marketable securities (Note 5) |
|
|
(12,849) |
|
|
(286) |
|
|
(10,684) |
Foreign exchange (gain) loss |
|
|
(235) |
|
|
656 |
|
|
48,977 |
Reclamation accretion and adjustments to estimate |
|
|
3,861 |
|
|
864 |
|
|
2,693 |
Income and mining tax (recovery) expense (Note 19) |
|
|
(22,291) |
|
|
(6,976) |
|
|
37,018 |
Flow through premium amortization (Note 13) |
|
|
(5,649) |
|
|
(2,304) |
|
|
(4,045) |
Stock-based compensation |
|
|
3,713 |
|
|
3,244 |
|
|
971 |
Dilution gain from investments in McEwen Copper Inc. (Note 9) |
|
|
(789) |
|
|
(5,777) |
|
|
— |
Gain on deconsolidation of McEwen Copper Inc. (Note 9) |
|
|
— |
|
|
— |
|
|
(222,157) |
Amortization of debt issuance costs |
|
|
697 |
|
|
— |
|
|
— |
Other |
|
|
437 |
|
|
349 |
|
|
— |
Changes in non-cash working capital items: |
|
|
|
|
|
|
|
|
|
Change in inventories |
|
|
(18,901) |
|
|
(711) |
|
|
4,554 |
Change in other assets related to operations |
|
|
(2,077) |
|
|
3,067 |
|
|
(81) |
Change in accounts payable and accrued liabilities |
|
|
13,016 |
|
|
5,792 |
|
|
(19,865) |
Change in contract liability |
|
|
4,005 |
|
|
3,543 |
|
|
(6,151) |
Change in other liabilities related to operations |
|
|
(2,778) |
|
|
2,865 |
|
|
7,838 |
Cash provided by (used in) operating activities |
|
$ |
6,865 |
|
$ |
29,454 |
|
$ |
(39,637) |
|
|
|
|
|
|
|
|
|
|
Cash flows from investing activities: |
|
|
|
|
|
|
|
|
|
Additions to mineral property interests and plant and equipment |
|
$ |
(44,639) |
|
$ |
(43,095) |
|
$ |
(26,099) |
Advances to related parties - McEwen Copper Inc. (Note 14) |
|
|
(5,056) |
|
|
— |
|
|
— |
Investment in marketable securities (Note 5) |
|
|
(2,154) |
|
|
(366) |
|
|
(34,157) |
Dividends received from Minera Santa Cruz S.A. (Note 9) |
|
|
2,246 |
|
|
— |
|
|
— |
Proceeds from sale of marketable securities |
|
|
1,574 |
|
|
— |
|
|
— |
Investment in McEwen Copper Inc. (Note 9) |
|
|
— |
|
|
(14,000) |
|
|
— |
Proceeds from sale of investment in McEwen Copper Inc. |
|
|
— |
|
|
— |
|
|
6,032 |
Cash outflow on McEwen Copper Inc. deconsolidation |
|
|
— |
|
|
— |
|
|
(45,708) |
Notes receivable from Timberline |
|
|
— |
|
|
(1,880) |
|
|
— |
Cash and restricted cash received from acquisition of Timberline (Note 20) |
|
|
— |
|
|
1,131 |
|
|
— |
Other |
|
|
— |
|
|
164 |
|
|
295 |
Cash used in investing activities |
|
$ |
(48,029) |
|
$ |
(58,046) |
|
$ |
(99,637) |
|
|
|
|
|
|
|
|
|
|
Cash flows from financing activities: |
|
|
|
|
|
|
|
|
|
Proceeds from senior convertible notes (Note 10) |
|
|
110,000 |
|
|
— |
|
|
— |
Purchase of capped call options (Note 10) |
|
|
(15,114) |
|
|
— |
|
|
— |
Convertible notes financing costs (Note 10) |
|
|
(4,123) |
|
|
— |
|
|
— |
Principal repayment on long-term debt (Note 11) |
|
|
(20,000) |
|
|
— |
|
|
(25,000) |
Issuance of flow-through common shares, net of issuance costs (Note 13) |
|
|
4,868 |
|
|
20,424 |
|
|
13,428 |
Proceeds from McEwen Copper Inc. financing |
|
|
— |
|
|
— |
|
|
185,390 |
Proceeds from exercise of stock options |
|
|
3,538 |
|
|
— |
|
|
— |
Proceeds from exercise of warrants |
|
|
610 |
|
|
9 |
|
|
— |
Payment of finance lease obligations |
|
|
(1,053) |
|
|
(1,231) |
|
|
(1,636) |
Cash provided by financing activities |
|
$ |
78,726 |
|
$ |
19,202 |
|
$ |
172,182 |
Effect of exchange rate change on cash and cash equivalents |
|
|
235 |
|
|
(656) |
|
|
(48,977) |
Increase in cash, cash equivalents and restricted cash |
|
|
37,797 |
|
|
(10,046) |
|
|
(16,069) |
Cash, cash equivalents and restricted cash, beginning of period |
|
|
17,464 |
|
|
27,510 |
|
|
43,579 |
Cash, cash equivalents and restricted cash, end of period |
|
$ |
55,261 |
|
$ |
17,464 |
|
$ |
27,510 |
98
Supplemental disclosure of cash flow information: |
|
|
|
|
|
|
|
|
|
Cash received (paid) during the period: |
|
|
|
|
|
|
|
|
|
Interest paid |
|
$ |
(5,067) |
|
$ |
(3,911) |
|
$ |
(4,728) |
Interest received |
|
|
1,126 |
|
|
636 |
|
|
34,680 |
Taxes paid |
|
|
(1,977) |
|
|
(712) |
|
|
(1,410) |
Non-cash investing activities: |
|
|
|
|
|
|
|
|
|
Mineral property additions in accounts payable and accrued liabilities |
|
|
(3,448) |
|
|
— |
|
|
— |
The accompanying notes are an integral part of these consolidated financial statements.
99
NOTE 1 NATURE OF OPERATIONS
McEwen Inc. (the “Company”), through its predecessor entity, US Gold Corporation, was organized under the laws of the State of Colorado on July 24, 1979. Effective July 7, 2025, the Company changed its name from McEwen Mining Inc. to McEwen Inc. The Company is engaged in the production and sale of gold and silver, as well as the development and exploration of copper, gold, and silver mineral properties across North and South America.
The Company operates in the United States, Canada, Mexico and Argentina. The Company owns a 100% interest in the Gold Bar gold mine in Nevada, the Fox Complex in Ontario, Canada, the El Gallo Project in Mexico and a portfolio of exploration properties in Nevada, Canada, Mexico and Argentina. As of December 31, 2025, the Company also owns a 46.3% interest in McEwen Copper Inc. (“McEwen Copper”), owner of the Los Azules copper project in San Juan, Argentina, a 49.0% interest in Minera Santa Cruz S.A. (“MSC”), owner of the producing San José silver-gold mine in Santa Cruz, Argentina, which is operated by the joint venture majority owner Hochschild Mining plc., and a 27.0 % interest in Paragon Advanced Labs Inc. (“Paragon”), a provider of advanced analytical services to the mining industry. The Company reports its investments in McEwen Copper, MSC and Paragon under the equity method of accounting.
NOTE 2 SUMMARY OF SIGNIFICANT ACCOUNTING POLICIES
Basis of Presentation and Use of Estimates:
The Company’s consolidated financial statements have been prepared in accordance with generally accepted accounting principles in the United States of America (“US GAAP”). The preparation of the Company’s consolidated financial statements requires the Company to make estimates and assumptions that affect the reported amounts of assets and liabilities and the related disclosure of contingent assets and liabilities at the date of the consolidated financial statements and the reported amounts of expenses during the reporting period. The more significant areas requiring the use of management estimates and assumptions relate to environmental reclamation and closure obligations; asset useful lives utilized for depletion, depreciation, amortization and accretion calculations; fair value of equity investments and the impairment test; recoverable gold in leach pad inventory; current and long-term inventory; mine development capitalization costs; the collectability of sales taxes receivable; the amount of mineral reserves; life of mine; valuation allowances for deferred tax assets, and income and mining tax provisions. The Company bases its estimates on historical experience and on various other assumptions that are believed to be reasonable under the circumstances. Actual results may differ significantly from these estimates.
References to “CAD” refers to Canadian Dollar, “USD” refers to United States Dollar, “MXN” refers to Mexican Peso, and “ARS” refers to Argentine Peso.
Basis of Consolidation:
The consolidated financial statements include the accounts of the Company and its wholly owned and majority-owned subsidiaries. Intercompany accounts and transactions have been eliminated. Investments over which the Company exerts significant influence but does not control through majority ownership are accounted for using the equity method of accounting, as described in Investments, below.
Cash and Cash Equivalents and Restricted Cash:
The Company considers cash in banks, deposits in transit, and highly liquid term deposits with remaining maturities of three months or less at the date of acquisition to be cash and cash equivalents. Because of the short maturity of these instruments, the carrying amounts approximate their fair value. The Company classifies restricted cash between short-term and long-term based on the restrictions.
100
Investments:
The Company accounts for investments over which it exerts significant influence but does not control through majority ownership using the equity method of accounting pursuant to ASC (“Accounting Standards Codification”) Topic 323, Investments – Equity Method and Joint Ventures. Under the equity method, the Company’s investment is initially recognized at cost in the Consolidated Balance Sheets and subsequently increased or decreased to recognize the Company's share of income and losses of the investee, dividends received from the investee and impairment losses after the initial recognition date. The Company's share of income and losses of the investee and impairment losses are recognized in the Consolidated Statements of Operations and Comprehensive Income (Loss) (“Statement of Operations”) during the period. The Company presents distributions received from investees in the Consolidated Statements of Cash Flows based on the cumulative earnings approach. The Company evaluates the equity method investments for impairment under ASC 323-35-31 and ASC 323-35. An impairment loss on the equity method investments is recognized as an operating expense when the decline in value is determined to be other-than-temporary. The Company assesses significant influence on an ongoing basis. Changes in ownership are accounted for under ASC 323-10-35 and ASC 323-10-40. Decreases in ownership resulting from the issuance of shares by the investee to other investors are recorded as a sale of shares, with a dilution gain or loss recorded in the Statement of Operations.
The Company’s investments in marketable equity securities and warrants are measured at fair value at each period end with changes in fair value recognized in net income (loss) in the Statement of Operations in accordance with ASU 2016-01 with reference to further updates in Accounting Standards Update (“ASU”) 2018-03, ASU 2019-04, and ASU 2020-01.
Stockpiles, Material on Leach Pads, In-process Inventory, Precious Metals Inventory and Materials and Supplies:
Stockpiles, material on leach pads, in-process inventory, precious metals inventory and materials and supplies (collectively, “Inventories”) are accounted for using the weighted average cost method and are carried at the lower of average cost or net realizable value. Net realizable value represents the estimated future sales price of the product based on current and long-term metals prices, less the estimated costs to complete production and bring the product to a saleable form. Write-downs of Inventories resulting from net realizable value impairments are reported as a component of production costs applicable to sales. The current portion of Inventories is determined based on the expected amounts to be processed and/or recovered within the next twelve months of the Consolidated Balance Sheet date, with the remaining portion, if any, classified as long-term.
Stockpiles represent mineralized material extracted from the mine and available for processing. Stockpiles are measured by estimating the number of tonnes added and removed from the stockpile, an estimate of the contained metals (based on assay data) and the estimated metallurgical recovery rates. Costs are allocated to stockpiles based on current mining costs incurred including applicable overhead relating to mining operations. Material is removed from the stockpile at an average cost per tonne.
Mineralized material on leach pads is the material that is placed on pads where it is treated with a chemical solution that dissolves the gold contained in the mineralized material over a period of time. Costs are attributed to the mineralized material on leach pads based on current mining costs and processing costs incurred related to the ore on the pad. Costs are removed from the leach pad inventory based on the average cost per estimated recoverable ounce of gold on the leach pad as the gold is recovered. The estimates of recoverable gold on the leach pads are calculated from the quantities of mineralized material placed on the leach pads (measured tonnes added to the leach pads), the grade of mineralized material placed on the leach pads (based on assay data) and a recovery percentage.
While the quantities of recoverable gold placed on the leach pads are periodically reconciled by comparing the grades of ore placed on the pads to the quantities of gold actually recovered (metallurgical balancing), the nature of the leaching process inherently limits the ability to precisely monitor inventory levels. As a result, the metallurgical balancing process is constantly monitored, and the engineering estimates are refined based on actual results over time.
101
In-process inventories represent materials that are currently in the process of being converted to a saleable product. In-process material is measured based on assays of the material from the various stages of processing. Costs are allocated to in-process inventories based on the costs of the material fed into the process attributable to the source material coming from the mines, stockpiles and/or leach pads plus the in-process conversion costs incurred to that point in the process.
Precious metal inventories include gold and silver doré and bullion that is unsold and held at the Company’s or the refinery’s facilities. Costs are allocated to precious metal inventories based on costs of the respective in-process inventories incurred prior to the refining process plus applicable refining costs.
Materials and supplies inventories are comprised of chemicals, reagents, spare parts and consumable parts used in operating and other activities. Cost includes applicable taxes and freight.
Proven and Probable Reserves:
The definition of proven and probable reserves is set forth in SEC Regulation S-K Item 1300 (“S-K 1300”). Proven mineral reserves are the economically mineable part of a measured mineral resource. For a proven mineral reserve, the qualified person has a high degree of confidence in the results obtained from the application of modifying factors and in the estimates of tonnage and grade or quality. A proven mineral reserve can only result from the conversion of a measured mineral resource. Probable mineral reserves are the economically mineable part of an indicated and, in some cases, measured mineral resource. For a probable mineral reserve, the qualified person’s confidence in the results obtained from the application of the modifying factors and in the estimates of tonnage and grade or quality is lower than what is sufficient for a classification as a proven mineral reserve, but is still sufficient to demonstrate that, at the time of reporting, extraction of the mineral reserve is economically viable under reasonable investment and market assumptions. The lower level of confidence is due to higher geologic uncertainty when the qualified person converts an indicated mineral resource to a probable reserve or higher risk in the results of the application of modifying factors at the time when the qualified person converts a measured mineral resource to a probable mineral reserve. A qualified person must classify a measured mineral resource as a probable mineral reserve when his or her confidence in the results obtained from the application of the modifying factors to the measured mineral resource is lower than what is sufficient for a proven mineral reserve.
Mineral Property Interests and Plant and Equipment:
Mineral property interests: Mineral property interests represent capitalized expenditures related to the development of mineral properties and arising from acquisitions. The amount capitalized for an acquired mineral property represents its fair value at the time of acquisition, either as an individual asset purchase or as a part of a business combination.
Development costs include engineering and metallurgical studies, drilling and related costs to delineate an ore body, removal of overburden to initially expose an ore body at open pit surface mines (“pre-stripping”), and building access paths and other infrastructure to gain access to the ore body at underground mines. Development costs are charged to operations as Advanced Projects in the year incurred until an economically viable deposit has been delineated, after which the costs are capitalized. Where multiple open pits exist at a mine, pre-stripping costs are capitalized separately for each pit. Production commences when saleable minerals, beyond a de minimis amount, are produced.
During the production phase of a mine, costs incurred to provide access to reserves and resources that will be produced in future periods that would not have otherwise been accessible are capitalized and included in the carrying amount of the related mineral property interest.
Drilling and related costs are capitalized for an ore body where an economically viable deposit exists and the activities are directed at obtaining additional information, providing greater definition of the ore body, or converting non-reserve mineralization to proven and/or probable reserves if the benefit is expected to be realized over a period beyond one year. All other drilling and related costs are expensed as incurred as Exploration or Advanced Projects. Exploration costs include costs incurred to identify new mineral resources, evaluate potential resources, and convert non-reserve material into proven and probable reserves. Drilling costs incurred for the purpose of operational ore control during the production stage, rather than for obtaining additional information about the ore body, are allocated to inventory costs and then expensed as a component of production costs applicable to sales once revenue from the sale of inventory is realized.
102
Mineral property interests are amortized upon commencement of production on a unit-of-production basis over proven and probable reserves. When a property does not contain mineralized material that satisfies the definition of proven and probable reserves, the amortization of the capitalized costs is charged to expense based on the most appropriate method, which includes the straight-line method and the units-of-production method over the total estimated production over the life of the mine, as determined by internal mine plans.
Plant and equipment: For properties where the Company has established economically viable deposits, expenditures for plant and equipment or that extend the useful lives of existing plant and equipment are capitalized and recorded at cost. The cost capitalized for plant and equipment includes borrowing costs incurred that are attributable to qualifying plant and equipment. Plant and equipment are depreciated using the straight-line method over the estimated productive life of the asset.
Construction-in-progress costs: Assets under construction are capitalized as construction-in-progress until the asset is available for its intended use, at which point costs are transferred to the appropriate category of plant and equipment or mineral property interest and amortized. The cost of construction-in-progress comprises the purchase price of the asset and any costs directly attributable to bringing it into working condition for its intended use.
For properties where the Company has not established economically viable deposits, substantially all costs, including design, engineering, construction, and installation of equipment, are expensed as incurred, unless the equipment has alternative uses, significant salvage value, or probable future benefit, in which case the equipment is capitalized at cost.
Impairment of Long-lived Assets:
The Company reviews and evaluates its long-lived assets for impairment on a quarterly basis or when events or changes in circumstances indicate that the related carrying amounts may not be recoverable. Once it is determined that impairment exists, an impairment loss is measured as the amount by which the asset carrying amount exceeds its estimated fair value. For the purpose of recognition and measurement of impairment, the Company groups its long-lived assets by specific mine or project, as this represents the lowest level for which identifiable cash flows exist.
For asset groups where an impairment indicator is identified, an impairment loss is determined if the carrying amount of the asset group exceeds the estimated recoverable amount as determined using the undiscounted future net cash flows. An impairment loss, if any, is the amount by which the carrying amount exceeds the estimated discounted future net cash flows. It is possible that actual future cash flows will be significantly different than the estimates, as actual future quantities of recoverable minerals, gold, silver and other commodity prices, production levels and costs of capital are each subject to significant risks and uncertainties.
For asset groups where the Company is unable to determine a reliable estimate of future net cash flows, the Company adopts a market approach to estimate fair value by using a combination of observed market value per square mile and observed market value per ounce or pound of estimated mineralized material based on comparable transactions.
Reclamation and Remediation Liabilities:
Provisions for environmental rehabilitation are made in respect of the estimated future costs of closure and restoration and rehabilitation costs (which include the dismantling and demolition of infrastructure, removal of residual materials and remediation of disturbed areas) in the accounting period when the related environmental disturbance occurs. The associated asset retirement costs, including periodic adjustments, if any, are capitalized as part of the carrying amount of the long-lived asset when proven or probable reserves exist or if they relate to an acquired mineral property interest; otherwise, the costs are charged to operations. Periodic accretion is recorded to reclamation and remediation liabilities and charged to operations.
103
The fair value of reclamation and remediation liabilities is measured by discounting the expected cash flows adjusted for inflation, using a credit-adjusted risk-free rate of interest. The Company prepares estimates of the timing and amounts of expected cash flows when reclamation and remediation liabilities are incurred, which are updated to reflect changes in facts and circumstances. Estimation of the fair value of reclamation and remediation liabilities requires significant judgment, including the amount of cash flows, timing of reclamation, inflation rate and credit risk.
Lease Accounting:
Contracts are analyzed to identify whether the contract contains an operating or financing lease according to ASC 842, Lease Accounting. If a contract is determined to contain a lease, the Company will include lease payments (the lease liability) and the right-of-use (“ROU”) asset representing the right to the underlying asset for the lease term within the Consolidated Balance Sheets. Lease liabilities are disclosed as a distinct line item within the Consolidated Balance Sheets, whereas the ROU asset is included in mineral property interests and plant and equipment. Related depreciation and amortization expense and interest expense for finance leases and rent expense for operating leases is recorded within the Statement of Operations. For leases with a term of twelve months or less, an accounting policy election is made to not recognize lease assets and lease liabilities. The Company has elected to account for non-lease components as part of the lease component to which they relate.
ROU asset balances and lease liabilities are recognized at the commencement date of the lease based on the present value of the future lease payments over the lease term. The Company utilizes the incremental borrowing rate (“IBR”) in determining the present value of the future lease payments. IBR represents the rate of interest that a lessee would have to pay to borrow an amount equal to the lease payments on a collateralized basis over a similar term in a similar economic environment. IBR is determined by using the average bond yield ratings for comparable companies.
Revenue Recognition:
Revenue consists of proceeds received and expected to be received for the Company’s principal products: gold and silver. Revenue from contracts with customers is recognized when control of the goods or services is transferred to the customer at an amount that reflects the consideration to which the Company expects to be entitled in exchange for the products. Control of the products is transferred when the buyer has the ability to direct the use of, and obtain substantially all of the remaining benefits from, the products. Product pricing is determined under the sales agreements, which are referenced against active and freely traded commodity markets, for example, the London bullion market for both gold and silver, in an identical form to the product sold.
In addition to selling refined bullion at spot prices, the Company has doré purchase agreements in place with refiners and traders. Under the agreements, the Company has the option to sell up to 100% of the gold and silver contained in doré bars prior to the completion of refining by the third-party refiner. The Company has an option to sell the gold on a spot basis, on a forward basis and on a supplier advance basis.
Revenue is recognized when the Company has provided irrevocable instructions to the refiner to transfer to the purchaser the refined ounces sold upon final processing, and when payment of the purchase price for the purchased doré or bullion has been made in full by the purchaser.
Foreign Currency:
The functional currency for the Company’s operations is the U.S. dollar. All monetary assets and liabilities denominated in a currency that is not the U.S. dollar are translated at current exchange rates at each Consolidated Balance Sheet date, and the resulting adjustments are included in a separate line item under other income (expense). Revenues and expenses in foreign currencies are translated at the average monthly exchange rates for the corresponding period.
104
Stock-based Compensation:
The Company accounts for stock options at fair value as prescribed in ASC 718, Stock-Based Compensation. The Company estimates the fair value of each stock option at the grant date by using the Black-Scholes option-pricing model and provides for expense recognition over the service period, if any, of the stock option. The Company’s estimates may be impacted by certain variables including, but not limited to, stock price volatility, employee stock option exercise behavior and estimates of forfeitures.
Flow-through Common Shares:
Current Canadian tax legislation permits mining entities to issue flow-through common shares to investors by which the deductions for tax purposes related to resource exploration and evaluation expenditures may be claimed by investors instead of the entity, subject to a renouncement process. Under ASC 740, Income Taxes, proceeds from the issuance of flow-through common shares are allocated first to the common stock based on the underlying quoted price of shares and the residual amount is allocated to the sale of tax benefits, which is classified as a liability. After the sale of the shares, as the Company incurs qualifying exploration and evaluation expenditures to fulfill its obligation, the liability is drawn down and the sale of tax benefits is recognized in the Statement of Operations as a reduction of deferred tax expense.
Income and Mining Taxes:
Income and Mining Taxes. The Company accounts for income and mining taxes under ASC 740 using the liability method. Under this method, the Company recognizes deferred tax assets and liabilities for temporary differences between the financial reporting basis and the tax basis of assets and liabilities, as well as for carry-forwards. Deductible temporary differences and carry-forwards give rise to deferred tax assets, whereas taxable temporary differences give rise to deferred tax liabilities. Deferred taxes are measured using the enacted statutory tax rates expected to apply when the temporary differences reverse. The income tax expense (recovery) for a period includes the change in the net deferred tax asset or liability (inclusive of any valuation allowance). The Company records a valuation allowance to reduce deferred tax assets to the amount that is more-likely-than-not to be realized based on the weight of available positive and negative evidence.
Per Share Amounts:
Basic income or loss per share is computed by dividing income or loss available to common shareholders by the weighted average number of common shares outstanding during the period. Diluted income per share reflects the potential dilution of securities that could share in the earnings of the Company and is computed in accordance with the treasury stock method based on the average number of common shares and dilutive common share equivalents outstanding for stock options and warrants. The if-converted method is applied to the convertible senior unsecured notes. Only those instruments that result in a reduction in income per share are included in the calculation of diluted income per share.
Loans and Borrowings:
Borrowings are recognized initially at fair value, net of financing costs incurred, and subsequently measured at amortized cost. Any difference between the amounts originally received and the redemption value of the debt is recognized in the Statement of Operations over the period to maturity using the effective interest method. Borrowing costs directly attributable to the acquisition, construction, or production of a qualifying asset (i.e., an asset that necessarily takes a substantial period of time to get ready for its intended use or sale) are capitalized as part of the cost of the asset. All other borrowing costs are expensed in the period they occur.
105
Fair Value of Financial Instruments:
Fair value accounting establishes a fair value hierarchy that prioritizes the inputs to valuation techniques used to measure fair value. The hierarchy gives the highest priority to unadjusted quoted prices in active markets for identical assets and liabilities (Level 1 measurements) and the lowest priority to unobservable inputs (Level 3 measurements). The three levels of the fair value hierarchy are described below:
Level 1 |
Unadjusted quoted prices in active markets that are accessible at the measurement date for identical, unrestricted assets or liabilities; |
Level 2 |
Quoted prices in markets that are not active, or inputs that are observable, either directly or indirectly, for substantially the full term of the asset or liability; and |
Level 3 |
Prices or valuation techniques that require inputs that are both significant to the fair value measurement and unobservable (supported by little or no market activity). |
New Accounting Pronouncements Not Yet Adopted:
In November 2024, the FASB issued ASU 2024-03, Income Statement—Reporting Comprehensive Income—Expense Disaggregation Disclosures (Subtopic 220-40). Amended guidance requires more detailed disclosures about the nature of significant expenses included in the Statements of Operations. The amendments are effective prospectively for fiscal years beginning after December 15, 2026, and interim periods within fiscal years beginning after December 15, 2027. Early and retrospective adoption are permitted. The Company is currently evaluating the impact of adopting the ASU on the financial statements and related disclosures.
Recently Adopted Accounting Pronouncements and Securities and Exchange Commissions Rules:
Improvement to income tax disclosure: In December 2023, the FASB issued ASU 2023-09, which requires enhanced income tax disclosures, including disaggregated information within the effective tax rate reconciliation and additional information regarding income taxes paid that meet certain quantitative thresholds. The Company adopted ASU 2023-09 on a prospective basis for the year ended December 31, 2025 and has included the required disclosures in Note 19. As the standard impacts presentation and disclosure only, its adoption did not affect the Company’s consolidated financial position.
NOTE 3 OPERATING SEGMENT REPORTING
McEwen Inc. is a mining and minerals production and exploration company focused on precious and base metals in the United States, Canada, Mexico, and Argentina. The chief operating decision-maker (“CODM”) is the executive leadership team of the Company. The CODM reviews operating results, assesses performance and makes decisions about allocation of resources to these segments at the geographic region level, by major mine/project where the economic characteristics of the individual mines or projects within a geographic region are not alike, or by investee for those which are considered a reportable segment. As a result, these operating segments also represent the Company’s reportable segments.
The CODM reviews segment income or loss, defined as gold and silver sales less production costs applicable to sales, depreciation and depletion, advanced projects, and exploration costs and an allocation of other segment items for all segments except for the McEwen Copper and MSC segments, which are evaluated based on the attributable equity income or loss pickup. The CODM uses segment gross profit (loss) and profit (loss) before taxes, or income (loss) from equity method investments, to allocate resources (including employees, property, and financial or capital resources) for each segment. The CODM predominantly considers such measures in the annual budget and forecasting process. The CODM considers budget-to-actual variances for operating segments on a quarterly basis to support resource allocation and performance evaluation.
Gold and silver sales and production costs applicable to sales for the reportable segments are reported net of intercompany transactions. Capital expenditures include costs capitalized in mineral property interests and plant and equipment in the respective periods.
106
Significant information relating to the Company’s reportable operating segments for the periods presented is summarized in the tables below:
Year ended December 31, 2025 |
|
USA |
|
Canada |
|
Mexico |
|
MSC |
|
McEwen Copper |
|
Total |
||||||
Revenue from gold and silver sales |
|
$ |
116,706 |
|
$ |
76,038 |
|
$ |
4,809 |
|
$ |
— |
|
$ |
— |
|
$ |
197,553 |
Production costs applicable to sales (1) |
|
|
(68,099) |
|
|
(52,802) |
|
|
(1,859) |
|
|
— |
|
|
— |
|
|
(122,760) |
Depreciation and depletion (1) |
|
|
(7,072) |
|
|
(20,157) |
|
|
— |
|
|
— |
|
|
— |
|
|
(27,229) |
Gross profit |
|
|
41,535 |
|
|
3,079 |
|
|
2,950 |
|
|
— |
|
|
— |
|
|
47,564 |
|
|
|
|
|
|
|
|
|
|
|
|
|
|
|
|
|
|
|
Advanced projects (1) |
|
|
— |
|
|
(2,504) |
|
|
(5,457) |
|
|
— |
|
|
— |
|
|
(7,961) |
Exploration (1) |
|
|
(11,973) |
|
|
(10,223) |
|
|
— |
|
|
— |
|
|
— |
|
|
(22,196) |
Income (loss) from equity method investments (2) |
|
|
— |
|
|
— |
|
|
— |
|
|
41,125 |
|
|
(25,547) |
|
|
15,578 |
Other segment items (3) |
|
|
(4,808) |
|
|
(6,152) |
|
|
(6,203) |
|
|
— |
|
|
— |
|
|
(17,163) |
Segment profit (loss) |
|
$ |
24,754 |
|
$ |
(15,800) |
|
$ |
(8,710) |
|
$ |
41,125 |
|
$ |
(25,547) |
|
$ |
15,822 |
|
|
|
|
|
|
|
|
|
|
|
|
|
|
|
|
|
|
|
Unallocated amounts: |
|
|
|
|
|
|
|
|
|
|
|
|
|
|
|
|
|
|
|
|
|
|
|
|
|
|
|
|
|
|
|
|
|
|
|
|
|
Dilution gain from investments in McEwen Copper Inc. (Note 9) |
|
|
|
|
|
|
|
|
|
|
|
|
|
|
|
|
|
789 |
General and administrative (4) |
|
|
|
|
|
|
|
|
|
|
|
|
|
|
|
|
|
(14,571) |
Depreciation (5) |
|
|
|
|
|
|
|
|
|
|
|
|
|
|
|
|
|
(444) |
Interest and other finance expense, net |
|
|
|
|
|
|
|
|
|
|
|
|
|
|
|
|
|
(6,311) |
Other income |
|
|
|
|
|
|
|
|
|
|
|
|
|
|
|
|
|
11,664 |
Income before income and mining taxes |
|
|
|
|
|
|
|
|
|
|
|
|
|
|
|
|
$ |
6,949 |
|
|
|
|
|
|
|
|
|
|
|
|
|
|
|
|
|
|
|
Capital expenditures |
|
$ |
11,306 |
|
$ |
36,581 |
|
$ |
200 |
|
$ |
— |
|
$ |
— |
|
$ |
48,087 |
Year ended December 31, 2024 |
|
USA |
|
Canada |
|
Mexico |
|
MSC |
|
McEwen Copper |
|
Total |
||||||
Revenue from gold and silver sales |
|
$ |
105,147 |
|
$ |
67,808 |
|
$ |
1,522 |
|
$ |
— |
|
$ |
— |
|
$ |
174,477 |
Production costs applicable to sales (1) |
|
|
(63,547) |
|
|
(49,766) |
|
|
— |
|
|
— |
|
|
— |
|
|
(113,313) |
Depreciation and depletion (1) |
|
|
(12,657) |
|
|
(17,572) |
|
|
— |
|
|
— |
|
|
— |
|
|
(30,229) |
Gross profit |
|
|
28,943 |
|
|
470 |
|
|
1,522 |
|
|
— |
|
|
— |
|
|
30,935 |
|
|
|
|
|
|
|
|
|
|
|
|
|
|
|
|
|
|
|
Advanced projects (1) |
|
|
— |
|
|
— |
|
|
(7,152) |
|
|
— |
|
|
— |
|
|
(7,152) |
Exploration (1) |
|
|
(8,420) |
|
|
(8,126) |
|
|
— |
|
|
— |
|
|
— |
|
|
(16,546) |
Income (loss) from equity method investments (2) |
|
|
— |
|
|
— |
|
|
— |
|
|
9,021 |
|
|
(46,977) |
|
|
(37,956) |
Other segment items (3) |
|
|
(1,968) |
|
|
334 |
|
|
(3,644) |
|
|
— |
|
|
— |
|
|
(5,278) |
Segment profit (loss) |
|
$ |
18,555 |
|
$ |
(7,322) |
|
$ |
(9,274) |
|
$ |
9,021 |
|
$ |
(46,977) |
|
$ |
(35,997) |
|
|
|
|
|
|
|
|
|
|
|
|
|
|
|
|
|
|
|
Unallocated amounts: |
|
|
|
|
|
|
|
|
|
|
|
|
|
|
|
|
|
|
|
|
|
|
|
|
|
|
|
|
|
|
|
|
|
|
|
|
|
Dilution gain from investments in McEwen Copper Inc. (Note 9) |
|
|
|
|
|
|
|
|
|
|
|
|
|
|
|
|
|
5,777 |
General and administrative (4) |
|
|
|
|
|
|
|
|
|
|
|
|
|
|
|
|
|
(13,303) |
Depreciation (5) |
|
|
|
|
|
|
|
|
|
|
|
|
|
|
|
|
|
(475) |
Interest and other finance expense, net |
|
|
|
|
|
|
|
|
|
|
|
|
|
|
|
|
|
(3,033) |
Other income |
|
|
|
|
|
|
|
|
|
|
|
|
|
|
|
|
|
292 |
Loss before income and mining taxes |
|
|
|
|
|
|
|
|
|
|
|
|
|
|
|
|
$ |
(46,739) |
|
|
|
|
|
|
|
|
|
|
|
|
|
|
|
|
|
|
|
Capital expenditures |
|
$ |
17,789 |
|
$ |
23,288 |
|
$ |
2,018 |
|
$ |
— |
|
$ |
— |
|
$ |
43,095 |
107
Year ended December 31, 2023 |
|
USA |
|
Canada |
|
Mexico |
|
MSC |
|
McEwen Copper (6) |
|
Total |
||||||
Revenue from gold and silver sales |
|
$ |
83,409 |
|
$ |
81,295 |
|
$ |
1,527 |
|
$ |
— |
|
$ |
— |
|
$ |
166,231 |
Production costs applicable to sales (1) |
|
|
(67,335) |
|
|
(51,895) |
|
|
— |
|
|
— |
|
|
— |
|
|
(119,230) |
Depreciation and depletion (1) |
|
|
(7,130) |
|
|
(22,091) |
|
|
— |
|
|
— |
|
|
— |
|
|
(29,221) |
Gross profit |
|
|
8,944 |
|
|
7,309 |
|
|
1,527 |
|
|
— |
|
|
— |
|
|
17,780 |
|
|
|
|
|
|
|
|
|
|
|
|
|
|
|
|
|
|
|
Advanced projects (1) |
|
|
— |
|
|
— |
|
|
(6,292) |
|
|
— |
|
|
(76,345) |
|
|
(82,637) |
Exploration (1) |
|
|
(6,225) |
|
|
(13,556) |
|
|
— |
|
|
— |
|
|
(386) |
|
|
(20,167) |
Income (loss) from equity method investments (2) |
|
|
— |
|
|
— |
|
|
— |
|
|
62 |
|
|
(57,821) |
|
|
(57,759) |
Other segment items (3) |
|
|
(1,891) |
|
|
(220) |
|
|
(5,002) |
|
|
— |
|
|
7,484 |
|
|
371 |
Segment profit (loss) |
|
$ |
828 |
|
$ |
(6,467) |
|
$ |
(9,767) |
|
$ |
62 |
|
$ |
(127,068) |
|
$ |
(142,412) |
|
|
|
|
|
|
|
|
|
|
|
|
|
|
|
|
|
|
|
Unallocated amounts: |
|
|
|
|
|
|
|
|
|
|
|
|
|
|
|
|
|
|
|
|
|
|
|
|
|
|
|
|
|
|
|
|
|
|
|
|
|
Gain on deconsolidation of McEwen Copper Inc. |
|
|
|
|
|
|
|
|
|
|
|
|
|
|
|
|
|
222,157 |
General and administrative (4) |
|
|
|
|
|
|
|
|
|
|
|
|
|
|
|
|
|
(7,335) |
Depreciation (5) |
|
|
|
|
|
|
|
|
|
|
|
|
|
|
|
|
|
(510) |
Interest and other finance expense, net |
|
|
|
|
|
|
|
|
|
|
|
|
|
|
|
|
|
(5,598) |
Other income |
|
|
|
|
|
|
|
|
|
|
|
|
|
|
|
|
|
734 |
Income before income and mining taxes |
|
|
|
|
|
|
|
|
|
|
|
|
|
|
|
|
$ |
67,036 |
|
|
|
|
|
|
|
|
|
|
|
|
|
|
|
|
|
|
|
Capital expenditures |
|
$ |
9,028 |
|
$ |
9,131 |
|
$ |
1,258 |
|
$ |
— |
|
$ |
6,781 |
|
$ |
26,198 |
| (1) | The significant expense categories and amounts align with the segment-level information that is regularly provided to CODM. |
| (2) | Operating results of MSC and McEwen Copper on a 100% basis are presented in Note 9 – Equity Method Investments. |
| (3) | Other segment items include: |
| a. | General and administrative expenses attributable to the segment |
| b. | Depreciation unrelated to production activities of the segment |
| c. | Accretion expense |
| d. | Interest (other than on long-term debt) |
| e. | Other (income) expenses |
| f. | Foreign currency loss (gain) |
| (4) | General and administrative expenses are comprised primarily of corporate expenses not attributable to any reporting segment. |
| (5) | Depreciation is attributable to corporate assets and other non-productive assets. |
| (6) | Includes the consolidated results for McEwen Copper for the period from January 1, 2023 to October 10, 2023 and the loss from the equity-accounted investment for the period from October 11, 2023 to December 31, 2023. |
Geographic Information
Geographic information includes the following long-lived assets balances and revenues presented for the Company’s operating segments:
|
|
Non-current Assets |
|
Revenue (1) |
|||||||||||
|
|
December 31, |
|
December 31, |
|
Year ended December 31, |
|||||||||
|
|
2025 |
|
2024 |
|
2025 |
|
2024 |
|
2023 |
|||||
USA |
|
$ |
114,644 |
|
$ |
100,488 |
|
$ |
116,706 |
|
$ |
105,147 |
|
$ |
83,409 |
Canada (2) |
|
|
125,364 |
|
|
89,822 |
|
|
76,038 |
|
|
67,808 |
|
|
81,295 |
Mexico |
|
|
25,759 |
|
|
32,320 |
|
|
4,809 |
|
|
1,522 |
|
|
1,527 |
Argentina (3)(4) |
|
|
414,922 |
|
|
400,801 |
|
|
— |
|
|
— |
|
|
— |
Total consolidated |
|
$ |
680,689 |
|
$ |
623,431 |
|
$ |
197,553 |
|
$ |
174,477 |
|
$ |
166,231 |
| (1) | Presented based on the location from which the product originated. |
| (2) | Includes investment in Paragon Advanced Labs Inc. of $13.7 million as of December 31, 2025 (December 31, 2024 – $nil). |
| (3) | Includes investment in MSC of $140.7 million as of December 31, 2025 (December 31, 2024 – $101.9 million). |
| (4) | Includes investment in McEwen Copper of $274.2 million as of December 31, 2025 (December 31, 2024 – $298.9 million). |
108
As gold and silver can be sold through numerous gold and silver markets worldwide, the Company is not economically dependent on a limited number of customers for the sale of its product. The following is a summary of revenue from gold and silver sales for significant customers for the years ended December 31, 2025, 2024 and 2023:
|
|
Year ended December 31, |
|||||||
|
|
2025 |
|
2024 |
|
|
2023 |
||
Auramet International LLC (“Auramet”) |
|
$ |
130,944 |
|
$ |
56,869 |
|
$ |
136,911 |
Asahi Refining Inc. |
|
|
63,444 |
|
|
112,298 |
|
|
24,639 |
Other |
|
|
3,165 |
|
|
5,310 |
|
|
4,681 |
Revenue from gold and silver sales |
|
$ |
197,553 |
|
$ |
174,477 |
|
$ |
166,231 |
NOTE 4 CASH AND CASH EQUIVALENTS AND RESTRICTED CASH
The following table provides a reconciliation of cash and cash equivalents, and restricted cash reported within the Consolidated Balance Sheets that sum to the total of the same such amounts shown in the Consolidated Statements of Cash Flows:
|
|
December 31, 2025 |
|
December 31, 2024 |
|
December 31, 2023 |
|||
Cash and cash equivalents |
|
$ |
51,015 |
|
$ |
13,692 |
|
$ |
23,020 |
Restricted cash in non-current assets |
|
|
4,246 |
|
|
3,772 |
|
|
4,490 |
Total cash and cash equivalents and restricted cash |
|
$ |
55,261 |
|
$ |
17,464 |
|
$ |
27,510 |
Amounts classified as restricted cash in long term assets relate to bonding requirements for environmental reclamation obligations.
NOTE 5 MARKETABLE SECURITIES
The Company’s investment portfolio consists of marketable equity securities and warrants of certain publicly traded companies. The following is a summary of the activity in investments for the years ended December 31, 2025, 2024 and 2023:
|
|
As at |
|
Additions/ |
|
Disposals/ |
|
Gain on |
|
|
As at |
||||
|
|
December 31, |
|
transfers during |
|
transfers during |
|
securities |
|
|
December 31, |
||||
|
|
2024 |
|
period |
|
period |
|
held |
|
|
2025 |
||||
Equity securities |
|
$ |
1,206 |
|
$ |
7,690 |
|
$ |
(1,544) |
|
$ |
11,414 |
|
$ |
18,766 |
Warrants |
|
|
411 |
|
|
982 |
|
|
(480) |
|
|
1,435 |
|
|
2,348 |
Total marketable securities |
|
$ |
1,617 |
|
$ |
8,672 |
|
$ |
(2,024) |
|
$ |
12,849 |
|
$ |
21,114 |
|
|
As at |
|
Additions/ |
|
Disposals/ |
|
Gain (loss) on |
|
As at |
|||||
|
|
December 31, |
|
transfers during |
|
transfers during |
|
securities |
|
December 31, |
|||||
|
|
2023 |
|
period |
|
period |
|
held |
|
2024 |
|||||
Marketable securities |
|
$ |
1,743 |
|
$ |
243 |
|
$ |
(778) |
|
$ |
(2) |
|
$ |
1,206 |
Warrants |
|
|
— |
|
|
123 |
|
|
— |
|
|
288 |
|
|
411 |
Total marketable securities |
|
$ |
1,743 |
|
|
366 |
|
|
(778) |
|
|
286 |
|
|
1,617 |
|
|
As at |
|
Additions/ |
|
Disposals/ |
|
Gain on |
|
McEwen |
|
As at |
||||||
|
|
December 31, |
|
transfers during |
|
transfers during |
|
securities |
|
Copper |
|
December 31, |
||||||
|
|
2022 |
|
year |
|
year |
|
held |
|
deconsolidation |
|
2023 |
||||||
Marketable equity securities |
|
$ |
1,133 |
|
$ |
34,157 |
|
$ |
— |
|
$ |
10,684 |
|
$ |
(44,231) |
|
$ |
1,743 |
Warrants |
|
|
162 |
|
|
— |
|
|
(162) |
|
|
— |
|
|
— |
|
|
— |
Total investments |
|
$ |
1,295 |
|
$ |
34,157 |
|
|
(162) |
|
$ |
10,684 |
|
$ |
(44,231) |
|
$ |
1,743 |
109
On March 10, 2025, the Company acquired 5,181,347 units of Goliath Resources Limited (TSX-V: GOT) (“Goliath Resources”) in exchange for 868,056 common shares of the Company. Each unit consists of one common share and one-half of one warrant. Each whole warrant entitles the Company to purchase one common share of Goliath Resources at a price of C$2.50 for a period of twelve months following the closing of the offering, expiring on March 10, 2026. Following the closing, as at March 10, 2025, the Company held an approximate 4% ownership interest in Goliath Resources. The Company recognized a day one gain of $0.9 million on the difference between the transaction price and fair value of units received.
On March 27, 2025, the Company participated in two private placement offerings by Canadian Gold Corp (TSX-V: CGC) (“Canadian Gold”), acquiring 8,823,529 common shares and 2,941,176 units for a total investment of $1.4 million. Each unit consists of one common share and one non-transferable share purchase warrant. Each whole warrant entitles the holder to acquire one additional common share at an exercise price of C$0.22 per share up to March 27, 2026. Following the closing, as at March 27, 2025, the Company held an approximate 6% ownership interest in Canadian Gold. The Company recognized a day one gain of $0.5 million on the difference between the transaction price and fair value of units received.
On April 28, 2025, the Company exercised 9,200,000 warrants of Inventus Mining Corp. (TSX-V: IVS) to acquire an equal number of common shares at an exercise price of C$0.09 per warrant, for total consideration of $0.6 million. In connection with this transaction, the Company also received 9,200,000 additional warrants of Inventus Mining Corp., each entitling the holder to acquire one common share at an exercise price of C$0.12 per share, expiring on November 6, 2026.
On July 11, 2025, the Company exercised an additional 800,000 warrants of Inventus Mining Corp. to acquire an equal number of common shares at an exercise price of C$0.09 per warrant, for total consideration of approximately $0.1 million.
NOTE 6 RECEIVABLES, PREPAIDS AND OTHER CURRENT ASSETS
Receivables, prepaids and other current assets as at December 31, 2025 and 2024 consist of the following:
|
|
December 31, 2025 |
|
December 31, 2024 |
||
Government sales tax receivable |
|
$ |
3,071 |
|
$ |
3,918 |
Prepaids and other assets |
|
|
2,681 |
|
|
3,568 |
Receivables, prepaids and other current assets |
|
$ |
5,752 |
|
$ |
7,486 |
In Mexico, Argentina, and Canada, sales taxes are assessed on purchases of materials and services and sales of products. Businesses are generally entitled to recover the taxes they have paid related to purchases of materials and services, either as a refund or as a credit against future taxes payable.
NOTE 7 INVENTORIES
Inventories at December 31, 2025 and 2024 consist of the following:
|
|
December 31, 2025 |
|
December 31, 2024 |
||
Material on leach pads |
|
$ |
31,390 |
|
$ |
13,453 |
In-process inventory |
|
|
5,105 |
|
|
2,551 |
Stockpiles |
|
|
3,026 |
|
|
1,112 |
Precious metals |
|
|
412 |
|
|
2,312 |
Materials and supplies |
|
|
7,463 |
|
|
6,517 |
|
|
$ |
47,396 |
|
$ |
25,945 |
Less: long-term portion |
|
|
(20,560) |
|
|
(7,834) |
Current portion |
|
$ |
26,836 |
|
$ |
18,111 |
The Company did not have any inventory write-downs during the year ended December 31, 2025. During the year ended December 31, 2024, the Company incurred $1.8 million and $0.7 million in inventory write-downs at the Fox Complex and Gold Bar Mine Complex, respectively. Of these write-downs, a total of $2.1 million was included in production costs applicable to sales and $0.4 million was included in depreciation and depletion in the Statement of Operations.
110
NOTE 8 MINERAL PROPERTY INTERESTS AND PLANT AND EQUIPMENT
The cost and carrying value of mineral property interests and plant and equipment at December 31, 2025 and 2024 are as follows:
|
|
December 31, 2025 |
|
December 31, 2024 |
||
Mineral property interests, cost |
|
$ |
305,642 |
|
$ |
264,495 |
Less: accumulated depletion |
|
|
(123,427) |
|
|
(98,752) |
Mineral property interests, carrying value |
|
$ |
182,215 |
|
$ |
165,743 |
|
|
|
|
|
|
|
Plant and equipment, cost |
|
|
|
|
|
|
Land |
|
$ |
15,139 |
|
$ |
12,884 |
Construction in progress |
|
|
30,134 |
|
|
30,151 |
Plant and equipment |
|
|
77,159 |
|
|
73,633 |
Subtotal |
|
$ |
122,432 |
|
$ |
116,668 |
Less: accumulated depreciation |
|
|
(77,439) |
|
|
(71,489) |
Plant and equipment, carrying value |
|
$ |
44,993 |
|
$ |
45,179 |
|
|
|
|
|
|
|
Mineral property interests and plant and equipment, carrying value |
|
$ |
227,208 |
|
$ |
210,922 |
Mineral property interest carrying value at December 31, 2025 and 2024 includes the following:
Name of Property/Complex |
|
State/Province |
|
Country |
|
2025 |
|
2024 |
||
Fox Complex, other than Lexam |
|
Ontario |
|
Canada |
|
$ |
49,352 |
|
$ |
37,015 |
Lexam Properties |
|
Ontario |
|
Canada |
|
|
42,400 |
|
|
42,320 |
Gold Bar Mine |
|
Nevada |
|
United States |
|
|
24,485 |
|
|
20,566 |
Tonkin Properties |
|
Nevada |
|
United States |
|
|
5,943 |
|
|
5,623 |
Elder Creek Exploration Property - 1.25% NSR |
|
Nevada |
|
United States |
|
|
150 |
|
|
150 |
Lookout Mountain Project |
|
Nevada |
|
United States |
|
|
22,441 |
|
|
22,369 |
Los Azules Copper Project - 1.25% NSR |
|
San Juan |
|
Argentina |
|
|
28,822 |
|
|
28,821 |
El Gallo |
|
Sinaloa |
|
Mexico |
|
|
8,622 |
|
|
8,879 |
Total mineral property interests |
|
|
|
|
|
$ |
182,215 |
|
$ |
165,743 |
Gold Bar mine mineral property interests are depleted based on the units of production method from the production commencement date over the estimated proven and probable reserves.
The definition of proven and probable reserves is set forth in S-K 1300. If proven and probable reserves exist at the Company’s properties, the relevant capitalized mineral property interests and asset retirement costs are charged to expense based on the units of production method upon commencement of production. The Company’s Gold Bar mine and San José properties have proven and/or probable reserves estimated in accordance with S-K 1300.
The Fox Complex is depleted and depreciated using the straight-line or units of production method over the stated mine life, as the projects do not have proven and probable reserves that conform to S-K 1300.
The Company conducts a review of potential triggering events for impairment for all its mineral projects on a quarterly basis or when events or changes in circumstances indicate that the related carrying amounts may not be recoverable. During the years ended December 31, 2025 and 2024, no impairment has been noted for any of the Company’s mineral property interests.
111
NOTE 9 EQUITY METHOD INVESTMENTS
The Company accounts for investments over which it exerts significant influence but does not control through majority ownership using the equity method of accounting. In applying the equity method of accounting to the Company’s investments in McEwen Copper, Paragon and MSC, the financial statements of Paragon and MSC, which are originally prepared in accordance with IFRS Accounting Standards as issued by the International Accounting Standards Board, have been adjusted to conform with U.S. GAAP.
A reconciliation of the Company’s equity method investments as at December 31, 2025 and 2024, is as follows:
|
|
December 31, 2025 |
|
December 31, 2024 |
||
Investment in McEwen Copper Inc. |
|
$ |
274,189 |
|
$ |
298,947 |
Investment in Minera Santa Cruz S.A. |
|
|
140,733 |
|
|
101,854 |
Investment in Paragon Advanced Labs Inc. |
|
|
13,719 |
|
|
— |
Total equity method investments |
|
$ |
428,641 |
|
$ |
400,801 |
Equity Method Investment in McEwen Copper
In October 2023, McEwen Copper closed on financings with FCA Argentina S.A., an Argentinian subsidiary of Stellantis N.V., and Nuton LLC, a Rio Tinto Venture (“Nuton”), issuing 1,900,000 common shares at ARS 42 billion and 152,615 common shares at $4.0 million, respectively. Additionally, the Company sold 232,000 common shares of McEwen Copper to Nuton for an aggregate purchase price of $6.0 million. Subsequent to the closing of the transactions above, the Company’s ownership decreased to 47.7%. As a result, the Company concluded it no longer controlled McEwen Copper and, accordingly, deconsolidated the entity with the effective date of October 10, 2023.
As a result of the deconsolidation, the carrying amount of the various assets, liabilities and non-controlling interest of McEwen Copper were derecognized. The material amounts deconsolidated were $45.7 million of cash and cash equivalents, $44.2 million of investments, $171.9 million of mineral property interests and plant and equipment, $7.9 million of accounts payable and accrued liabilities, and $86.8 million of non-controlling interest. There were no other material impacts to the Consolidated Balance Sheets resulting from deconsolidation of McEwen Copper.
The remaining interest of 47.7% in McEwen Copper was accounted for under the equity method. The initial carrying amount of the equity investment in McEwen Copper of $384.0 million was determined based on recent private placements of the common shares of McEwen Copper. Due to the temporary differences between the financial reporting basis of liabilities and assets of McEwen Copper and the related tax basis for such liabilities and assets, the Company also recognized $37.8 million of deferred tax liability on its equity investments in McEwen Copper.
The Company recognized a gain on deconsolidation of approximately $222.2 million, which is included in other income on the Statement of Operations. McEwen Copper remains a related party to the Company after deconsolidation.
On July 12, 2024, the Company and Mr. McEwen participated in the first tranche of private placement financing for McEwen Copper, purchasing 466,667 and 166,667 common shares, respectively, for a total investment of $14.0 million and $5.0 million, respectively. Following this transaction, the Company's ownership in McEwen Copper increased from 47.7% to 48.3%. Subsequently, on October 24, 2024, McEwen Copper completed the second tranche of its offering, raising $37.0 million, which included a $35.0 million investment from Nuton. As a result, the Company's ownership in McEwen Copper decreased from 48.3% to 46.4%. The decrease in ownership was accounted for as a notional disposition of shares, resulting in a $5.8 million dilution gain recognized in earnings.
On December 11, 2025, Mr. McEwen exercised 100,000 warrants to acquire an equivalent number of common shares of McEwen Copper at a price of $35.00 per share. As a result, the Company’s ownership in McEwen Copper decreased from 46.4% to 46.3%. The decrease in ownership was accounted for as a notional disposition of shares, resulting in a $0.8 million dilution gain recognized in earnings.
112
A summary of the operating results for McEwen Copper for the years ended December 31, 2025, 2024, and for the period from October 10, 2023 to December 31, 2023, is as follows:
|
|
Year ended December 31, |
|||||||
|
|
2025 |
|
2024 |
|
2023 |
|||
McEwen Copper (100%) |
|
|
|
|
|
|
|
|
|
Advanced projects |
|
$ |
(41,925) |
|
$ |
(114,544) |
|
$ |
(36,475) |
Other expenses |
|
|
(11,679) |
|
|
(6,196) |
|
|
(4,684) |
Foreign exchange gain (loss) |
|
|
(2,701) |
|
|
2,631 |
|
|
(99,338) |
Interest and other income (1) |
|
|
1,294 |
|
|
19,130 |
|
|
19,356 |
Loss before tax |
|
$ |
(55,011) |
|
$ |
(98,979) |
|
$ |
(121,141) |
Current and deferred taxes |
|
|
— |
|
|
— |
|
|
— |
Net loss |
|
$ |
(55,011) |
|
$ |
(98,979) |
|
$ |
(121,141) |
|
|
|
|
|
|
|
|
|
|
Portion attributable to McEwen Inc. |
|
|
|
|
|
|
|
|
|
Loss from investment in McEwen Copper |
|
$ |
(25,547) |
|
$ |
(46,977) |
|
$ |
(57,821) |
| (1) | Interest and other income include gains on marketable securities and other finance-related income. |
Changes in the Company’s investment in McEwen Copper for the years ended December 31, 2025 and 2024, are as follows:
|
|
Year ended December 31, |
||||
|
|
2025 |
|
2024 |
||
Investment, beginning of period |
|
$ |
298,947 |
|
$ |
326,147 |
Additional investment in McEwen Copper |
|
|
— |
|
|
14,000 |
Dilution gain |
|
|
789 |
|
|
5,777 |
Attributable net loss from McEwen Copper |
|
|
(25,547) |
|
|
(46,977) |
Investment, end of period |
|
$ |
274,189 |
|
$ |
298,947 |
A summary of McEwen Copper’s assets and liabilities as at December 31, 2025 and 2024, is as follows:
As at |
|
December 31, 2025 |
|
December 31, 2024 |
||
Current assets |
|
$ |
7,089 |
|
$ |
34,067 |
Total assets |
|
$ |
203,277 |
|
$ |
226,329 |
|
|
|
|
|
|
|
Current liabilities |
|
$ |
(11,365) |
|
$ |
(14,656) |
Total liabilities |
|
$ |
(41,759) |
|
$ |
(14,856) |
As at December 31, 2025, the Company's investment in McEwen Copper exceeded its proportionate share of the underlying net assets by $199.1 million. This basis difference is attributable to equity-method goodwill and is not amortized.
113
Equity Method Investment in MSC
A summary of the operating results of MSC for the years ended December 31, 2025, 2024, and 2023, is as follows:
|
|
Year ended December 31, |
|||||||
|
|
2025 |
|
2024 |
|
|
2023 |
||
Minera Santa Cruz S.A. (100%) |
|
|
|
|
|
|
|
|
|
Revenue from gold and silver sales |
|
$ |
459,545 |
|
$ |
310,411 |
|
$ |
254,926 |
Production costs applicable to sales |
|
|
(248,460) |
|
|
(215,065) |
|
|
(177,234) |
Depreciation and depletion |
|
|
(52,969) |
|
|
(51,188) |
|
|
(58,935) |
Gross profit |
|
|
158,116 |
|
|
44,158 |
|
|
18,757 |
Exploration |
|
|
(13,490) |
|
|
(11,257) |
|
|
(9,346) |
Other expense(1) |
|
|
(11,843) |
|
|
(1,717) |
|
|
(3,977) |
Income before tax |
|
$ |
132,783 |
|
$ |
31,184 |
|
$ |
5,434 |
Current and deferred income tax recovery (expense) |
|
|
(44,505) |
|
|
(6,548) |
|
|
3,051 |
Net income |
|
$ |
88,278 |
|
$ |
24,636 |
|
$ |
8,485 |
|
|
|
|
|
|
|
|
|
|
Portion attributable to McEwen Inc. |
|
|
|
|
|
|
|
|
|
Net income |
|
$ |
43,256 |
|
$ |
12,072 |
|
$ |
4,157 |
Amortization of fair value increments |
|
|
(2,160) |
|
|
(3,088) |
|
|
(4,612) |
Income tax recovery |
|
|
29 |
|
|
37 |
|
|
517 |
Income from investment in MSC, net of amortization |
|
$ |
41,125 |
|
$ |
9,021 |
|
$ |
62 |
| (1) | Other expenses include foreign exchange, accretion of asset retirement obligations and other finance-related expenses. |
The income from investment in MSC attributable to the Company includes amortization of the fair value increments arising from the initial purchase price allocation and related income tax recovery. The income tax recovery reflects the impact of devaluation of the Argentine peso against the U.S. dollar on the peso-denominated deferred tax liability recognized at the time of acquisition, as well as income tax rate changes over the years.
Changes in the Company’s investment in MSC for the years ended December 31, 2025 and 2024, are as follows:
|
|
Year ended December 31, |
||||
|
|
2025 |
|
2024 |
||
Investment, beginning of period |
|
$ |
101,854 |
|
$ |
93,218 |
Attributable net income from MSC |
|
|
43,256 |
|
|
12,072 |
Amortization of fair value increments |
|
|
(2,160) |
|
|
(3,088) |
Income tax recovery |
|
|
29 |
|
|
37 |
Dividend distribution received |
|
|
(2,246) |
|
|
(385) |
Investment, end of period |
|
$ |
140,733 |
|
$ |
101,854 |
A summary of MSC’s assets and liabilities as at December 31, 2025 and 2024, is as follows:
As at |
|
December 31, 2025 |
|
December 31, 2024 |
||
Current assets |
|
$ |
290,704 |
|
$ |
144,327 |
Total assets |
|
$ |
372,994 |
|
$ |
233,003 |
|
|
|
|
|
|
|
Current liabilities |
|
$ |
(107,930) |
|
$ |
(57,373) |
Total liabilities |
|
$ |
(145,761) |
|
$ |
(89,594) |
As at December 31, 2025, the Company's investment in MSC exceeded its proportionate share of the underlying net assets by $29.4 million. This basis difference is primarily attributable to mineral property interests and amortized on a unit of production basis.
114
Equity Method Investment in Paragon
On December 9, 2025, the Company completed the previously announced transaction to acquire 27.32% equity interest in Paragon, a provider of advanced analytical services to the mining industry. The transaction involved a share exchange in which the Company acquired a total of 8,742,880 Paragon shares in exchange for 709,992 common shares of the Company. The total fair value of the transaction was $13.7 million, based on the Company's closing share price of $19.35 per share on December 9, 2025.
As of December 9, 2025, the carrying value of Paragon’s net assets was $4.6 million, consisting of total assets of $36.9 million, including $7.3 million of current assets, and total liabilities of $32.3 million, including $9.9 million of current liabilities. The Company's investment in Paragon exceeded its proportionate share of the underlying net assets by $12.5 million. This basis difference is attributable to equity-method goodwill and is not amortized.
Subsequent to the acquisition, on December 15, 2025, an existing shareholder exercised 400,000 warrants to acquire an equivalent number of common shares of Paragon. As a result, the Company’s ownership in Paragon decreased from 27.3% to 27.0%. This reduction in ownership is accounted for as a notional disposition of shares, resulting in a $0.2 million dilution loss.
Due to the timing of the availability of financial information, the Company recognizes its share of the earnings of Paragon on a three-month lag basis. The Company monitors the investee for material intervening events and concluded that no material adjustments were necessary for the period from December 9, 2025, to December 31, 2025.
NOTE 10 LEASE LIABILITIES
The Company’s lease obligations include equipment, vehicles and office space. For further information on leased assets, refer to Note 8. Mineral Property Interests and Plant and Equipment. The terms and conditions contained in the Company’s leases do not contain variable components.
Lease liabilities as at December 31, 2025 and 2024 are as follows:
|
|
Year ended December 31, |
||||
|
|
2025 |
|
2024 |
||
Finance leases |
|
$ |
744 |
|
$ |
897 |
Operating leases |
|
|
1,270 |
|
|
1,214 |
Lease liabilities |
|
$ |
2,014 |
|
$ |
2,111 |
Current portion |
|
|
(926) |
|
|
(788) |
Long-term portion |
|
$ |
1,088 |
|
$ |
1,323 |
Lease liabilities as at December 31, 2025 are recorded using weighted average discount rate of 6.31% for both finance and operating leases and have a weighted average remaining lease term of 1.4 years for finance leases and 3.4 years for operating leases. By comparison, as at December 31, 2024, lease liabilities were recorded at average rates of 6.58% and 6.30% for finance and operating leases, respectively, and had average remaining lease terms of one year.
115
During the year ended December 31, 2025, the Company recorded $0.7 million (December 31, 2024 – $0.8 million) in interest and other finance costs related to leases. A breakdown of the lease-related costs for the years ended December 31, 2025 and 2024, is as follows:
|
|
Year ended December 31, |
||||
|
|
2025 |
|
2024 |
||
Finance leases: |
|
|
|
|
|
|
Amortization of ROU assets |
|
$ |
577 |
|
$ |
740 |
Interest expense |
|
|
54 |
|
|
78 |
Total |
|
$ |
631 |
|
$ |
818 |
|
|
|
|
|
|
|
Operating leases: |
|
|
|
|
|
|
Rent expense |
|
$ |
71 |
|
$ |
43 |
Minimum undiscounted lease payments as at December 31, 2025 are as follows:
|
|
Payments due by period |
||||||||||||||||
|
|
2026 |
|
2027 |
|
2028 |
|
2029 |
|
|
2030 |
|
Total |
|||||
|
|
(in thousands) |
||||||||||||||||
Operating lease obligation |
|
$ |
458 |
|
$ |
331 |
|
$ |
288 |
|
$ |
192 |
|
$ |
— |
|
$ |
1,269 |
Finance lease obligations |
|
|
654 |
|
|
156 |
|
|
60 |
|
|
— |
|
|
— |
|
|
870 |
Total minimum lease payments |
|
$ |
1,112 |
|
$ |
487 |
|
$ |
348 |
|
$ |
192 |
|
$ |
— |
|
$ |
2,139 |
Less: Imputed interest |
|
|
|
|
|
|
|
|
|
|
|
|
|
|
|
|
|
(125) |
Total |
|
|
|
|
|
|
|
|
|
|
|
|
|
|
|
|
$ |
2,014 |
NOTE 11 DEBT
|
|
December 31, 2025 |
|
December 31, 2024 |
||
Convertible senior unsecured notes due 2030 |
|
$ |
110,000 |
|
$ |
— |
Term loan facility |
|
|
20,000 |
|
|
40,000 |
Debt issuance cost |
|
|
(3,832) |
|
|
— |
|
|
$ |
126,168 |
|
$ |
40,000 |
Less: current maturities of debt |
|
|
— |
|
|
— |
Long-term debt |
|
$ |
126,168 |
|
$ |
40,000 |
Term loan facility
On January 31, 2025, the Company amended its Third Amended and Restated Credit Agreement (“ARCA”). The amendments refinanced the outstanding $40.0 million loan and included the following revisions:
| ● | Scheduled repayments of principal under the ARCA were extended by 24 months. Monthly repayments of principal in the amount of $1.0 million are due beginning on January 31, 2027, with the remaining outstanding principal repayment on August 31, 2028. |
| ● | On May 6, 2025, the Company issued 53,160 shares of common stock with a value equivalent to $0.4 million or 2% of the outstanding loan balance as at March 31, 2025, to an affiliate of Robert R. McEwen as consideration for the maintenance, continuation, and extension of the maturity date of the loan. |
| ● | The Company was permitted to incur up to $110.0 million in principal borrowings under unsecured convertible senior notes due 2030. |
The consideration issued for the maintenance, continuation, and extension of the maturity date of the loan was accounted for as debt issuance costs, which were capitalized as deferred financing costs within long-term debt. These costs are being amortized as interest expense over the term of the debt using the effective interest method.
116
Following the issuance of the Convertible Notes (as defined below), on February 21, 2025, the Company voluntarily repaid $20.0 million in principal under the ARCA.
Total interest expense related to the term loan for the year ended December 31, 2025, was $2.2 million, at an effective interest rate of 11.16%. This included $2.1 million, in interest at the contractual coupon rate of 9.75% and $0.1 million related to the amortization of the debt issuance costs. For the year ended December 31, 2024, total interest expense related to the term loan was $3.9 million, at an effective interest rate equal contractual rate of 9.75%.
Convertible senior unsecured notes
On February 11, 2025, the Company issued $110.0 million in aggregate principal amount of 5.25% convertible senior unsecured notes due 2030 (“Convertible Notes”). The net proceeds from the issuance of the Convertible Notes, after deducting offering-related costs of $4.2 million and cost of a Capped Call Transaction (defined hereinafter) of $15.1 million, were approximately $90.7 million. The Convertible Notes bear interest at the annual rate of 5.25%, payable semiannually in arrears on August 15 and February 15 of each year, beginning on August 15, 2025, and will mature on August 15, 2030, unless earlier converted, redeemed or repurchased by the Company.
The Convertible Notes will be convertible into cash, shares of the Company’s common stock or a combination thereof, at the Company’s election. The initial conversion rate is 88.9284 shares of common stock per each $1,000 principal amount of Convertible Notes, which is equivalent to an initial conversion price of approximately $11.25 per share, subject to adjustment pursuant to the terms of the Indenture governing the Convertible Notes (the “Indenture”). The conversion rate may not exceed 115.6069 shares under the terms of the Indenture.
The Convertible Notes may be converted at any time prior to May 15, 2030 only under the following circumstances:
| (1) | During any calendar quarter starting after March 31, 2025, if, for at least 20 out of the last 30 consecutive trading days of the previous quarter, the closing price of the Company’s common stock is at least 130% of the conversion price; |
| (2) | During the five business days following any ten consecutive trading days in which the trading price of the notes was less than 98% of the value of the Company’s common stock multiplied by the conversion rate on each of those days; |
| (3) | If the Company issues a notice of redemption for the notes, at any time before the close of business on the second trading day prior to the redemption date; or |
| (4) | Upon the occurrence of specified corporate events. |
On or after May 15, 2030, until the close of business on the second trading day before the maturity date, holders may convert their notes at any time, regardless of prior conditions.
The Convertible Notes will be redeemable, in whole or in part, at the Company’s option at any time from August 21, 2028, through the 46th trading day prior to maturity, provided that the Company’s common stock has traded at or above 130% of the conversion price for at least 20 trading days within any 30 consecutive trading day period ending on the day before the redemption notice. The redemption price will be equal to 100% of the principal amount of the notes redeemed, plus accrued and unpaid interest up to, but excluding, the redemption date. No sinking fund is provided for the notes.
If the Company undergoes a “fundamental change”, as defined in the Indenture, and subject to certain conditions and exceptions, holders may require the Company to repurchase all or a portion of their notes for cash at a price equal to 100% of the principal amount, plus accrued and unpaid interest to, but excluding, the fundamental change repurchase date.
The Indenture contains other customary terms and covenants, including certain events of default.
117
The Convertible Notes are accounted for as a single liability in its entirety. No portion of the proceeds was attributed to the conversion option, as the embedded feature did not require bifurcation. In connection with the above-noted transaction, the Company incurred approximately $4.2 million in expenses accounted for as debt issuance costs, which were capitalized as deferred costs within long-term debt. These costs are being amortized as interest expense over the term of the debt using the effective interest method. The total interest expense related to the Convertible Notes for the year ended December 31, 2025, was $5.8 million at an effective interest rate of 6.33%, and was comprised of $5.2 million related to the contractual interest coupon and $0.6 million related to the amortization of the debt issuance costs.
As of December 31, 2025, the Convertible Notes have a net carrying amount of $106.4 million and an estimated fair value of $209.3 million. The fair value is based on Level 1 quoted prices in active markets for identical securities.
Capped call transactions
In connection with the offering of the Convertible Notes, the Company used approximately $15.1 million of the net proceeds from the offering of the Convertible Notes to pay the cost of the Capped Call Transactions. The Capped Call Transactions cover, subject to customary anti-dilution adjustments, the aggregate number of shares of common stock that initially underlie the Convertible Notes, and are expected generally to reduce potential dilution to the common stock upon any conversion of the Convertible Notes and/or offset any cash payments the Company is required to make in excess of the principal amount of converted Convertible Notes, as the case may be, with such reduction and/or offset subject to a cap of $17.30. The Capped Call Transactions are separate transactions entered into by the Company and are not part of the terms of the Convertible Notes.
As the Capped Call Transactions are freestanding instruments which are both indexed to the issuer’s own stock and classified in shareholders’ equity, the premiums paid in the Capped Call Transactions were classified as a reduction to the additional paid-in capital and will not be remeasured as long as they continue to meet the conditions for equity classification.
NOTE 12 ASSET RETIREMENT OBLIGATIONS
The Company is responsible for the reclamation of certain past and future disturbances at its properties. As at December 31, 2025, the asset retirement obligation balances at the properties subject to these obligations were $20.8 million at the Gold Bar, Tonkin and Lookout Mountain properties in Nevada, $18.6 million at the Fox Complex and $6.4 million at the El Gallo mine in Mexico (December 31, 2024 – $22.4 million, $16.7 million and $7.0 million, respectively).
A reconciliation of the Company’s reclamation and remediation liabilities for the years ended December 31, 2025 and 2024, is as follows:
|
|
December 31, |
|
|
December 31, |
|
|
|
2025 |
|
2024 |
||
Reclamation and remediation liabilities, beginning balance |
|
$ |
46,063 |
|
$ |
43,021 |
Acquisitions and divestitures |
|
|
— |
|
|
256 |
Settlements |
|
|
(2,705) |
|
|
(740) |
Accretion of liability |
|
|
3,019 |
|
|
2,757 |
Revisions to estimates and discount rate |
|
|
(1,364) |
|
|
1,959 |
Foreign exchange revaluation |
|
|
844 |
|
|
(1,190) |
Reclamation and remediation liabilities, ending balance |
|
$ |
45,857 |
|
$ |
46,063 |
Less: current portion |
|
|
6,473 |
|
|
4,988 |
Long-term portion |
|
$ |
39,384 |
|
$ |
41,075 |
118
NOTE 13 SHAREHOLDERS’ EQUITY
Flow-through shares issuance
Canadian Exploration Expenses (“CEE”)
On December 14, 2023, the Company issued 788,000 flow-through common shares priced at $9.27 per share for gross proceeds of $7.3 million. The proceeds of this offering are expected to be used for the exploration of the Grey Fox, Stock East, and other Fox Complex properties. The total proceeds were allocated between the sale of tax benefits and the sale of common shares. The total issuance costs related to the issuance of the flow-through shares were $0.5 million, which were accounted for as a reduction to the value of the common shares. The net proceeds of $6.8 million were allocated between the sale of tax benefits in the amount of $1.3 million and the sale of common shares in the amount of $5.5 million.
On June 14, 2024, the Company issued 643,000 flow-through common shares priced at $15.45 per share for gross proceeds of $10.0 million. The proceeds of this offering are expected to be used for the ongoing exploration of the Fox Complex. The total issuance costs related to the issuance of the flow-through shares were $0.7 million, which were accounted for as a reduction to the value of the common shares. The net proceeds of $9.3 million were allocated between the sale of tax benefits in the amount of $3.3 million and sale of common shares in the amount of $6.0 million.
On December 19, 2025, the Company issued 215,000 flow-through common shares priced at $23.88 per share for gross proceeds of $5.1 million. Proceeds from the CEE are expected to be used for the ongoing exploration and development of the Grey Fox properties. Total proceeds were allocated between the sale of tax benefits and the sale of common shares. Total issuance costs of $0.3 million were accounted for as a reduction in the value of the common shares. Net proceeds of $4.9 million were allocated between the sale of tax benefits in the amount of $1.0 million and sale of common shares in the amount of $3.9 million.
The Company is required to spend these flow-through share proceeds on flow-through eligible expenditures, as defined by subsection 66.1(5) and 66.1(6) of the Income Tax Act (Canada). As of December 31, 2025, the Company incurred a total of $17.3 million in eligible CEE (December 31, 2024 – $7.9 million). The Company has fulfilled its CEE commitments related to the June 2024 and December 2023 issuances. The remaining CEE commitments from the most recent raise in December 2025 are expected to be fulfilled by the end of 2026.
Canadian Development Expenses (“CDE”)
On December 14, 2023, the Company issued 1,115,000 flow-through common shares priced at $7.86 per share for gross proceeds of $8.8 million. The proceeds of this offering will be used for the development of Stock West. The total proceeds were allocated between the sale of tax benefits and the sale of common shares. The total issuance costs related to the issuance of the flow-through shares were $0.5 million, which were accounted for as a reduction to the value of the common shares. The net proceeds of $8.3 million were allocated between the sale of tax benefits in the amount of $0.4 million and the sale of common shares in the amount of $7.9 million.
On June 14, 2024, the Company issued 890,000 flow-through common shares priced at $13.40 per share for gross proceeds of $11.9 million. The proceeds of this offering are expected to be used for the ongoing development of the Fox Complex. The total issuance costs related to the issuance of the flow-through shares were $0.8 million, which were accounted for as a reduction to the value of the common shares. The net proceeds of $11.1 million were allocated between the sale of tax benefits in the amount of $2.7 million and sale of common shares in the amount of $8.4 million.
The Company is required to spend these flow-through share proceeds on flow-through eligible expenditures, as defined by subsection 66.1(5) and 66.1(6) of the Income Tax Act (Canada). As of December 31, 2025, the Company incurred a total of $20.7 million in eligible CDE (December 31, 2024 – $9.5). The Company has fulfilled its CDE commitments related to the June 2024 and December 2023 issuances.
119
Shares issued in Timberline acquisition
On August 19, 2024, the Company acquired Timberline Resources Corporation (“Timberline”). Pursuant to the Agreement and Plan of Merger, the Company issued 1,839,306 common shares with a fair value of $18.3 million and 205,349 warrants valued at $0.9 million. The fair value of instruments was included in the cost of acquired assets, as described in Note 20.
The number of common shares to be issued was determined by multiplying the number of Timberline shares outstanding by the exchange ratio of 0.01. The Company recorded $17.7 million in equity for the common shares issued, determined as total proceeds of $18.3 million less issuance costs of $0.6 million.
Outstanding Timberline warrants were assumed by the Company on the date of the acquisition. Each of the warrants assumed entitles the holder to purchase one share of the Company at the agreed-upon exercise price, as converted using the exchange ratio. Of the 205,349 warrants issued, 37,500 expired on October 15, 2024; 72,849 expire on August 31, 2026; and 95,000 expire on December 31, 2027. Exercise prices for each series are $12.00, $8.00, and $6.00, respectively.
Investments in Goliath Resources Limited
On March 10, 2025, the Company issued 868,056 common shares to acquire 5,181,347 units of Goliath Resources in a non-brokered private placement. Each unit is comprised of one common share in the capital of Goliath Resources and one-half of one common share purchase warrant. For further information, refer to Note 5 Marketable Securities.
Investments in Paragon Advanced Labs Inc.
On December 9, 2025, the Company issued 709,992 common shares in exchange of 8,742,880 Paragon shares. For further information, refer to Note 9 Equity Method Investments.
Stock-based Compensation
Stock Options
The Company’s Amended and Restated Equity Incentive Plan (the “Plan”) allows for equity awards to be granted to employees, consultants, advisors, and directors. The Plan is administered by the Compensation Committee of the Board of Directors (the “Committee”), which determines the terms pursuant to which any award is granted. The Committee may delegate to certain officers the authority to grant awards to certain employees (other than such officers), consultants and advisors. The number of shares of common stock reserved for issuance thereunder is 3 million shares, including shares issued under the Plan before it was amended, with no more than 1 million shares subject to grants of options to an individual in a calendar year. The Plan provides for the grant of incentive options under Section 422 of the Internal Revenue Code, which provides potential tax benefits to the recipients compared to non-qualified options.
As of December 31, 2025, 1,492,467 options were outstanding under the plan (December 31, 2024 – 832,614).
120
The following table summarizes information about stock options outstanding under the Plan at December 31, 2025:
|
|
|
|
|
|
|
Weighted |
|
|
|
|
|
|
|
Weighted |
|
Average |
|
|
|
|
|
|
|
|
Average |
|
Remaining |
|
|
|
|
|
|
Number of |
|
Exercise |
|
Contractual |
|
Intrinsic |
||
|
|
Shares |
|
Price |
|
Life (Years) |
|
Value |
||
|
|
(in thousands, except per share and year data) |
||||||||
Balance at December 31, 2022 |
|
448 |
|
$ |
13.43 |
|
2.6 |
|
$ |
— |
Granted |
|
630 |
|
|
7.22 |
|
— |
|
|
— |
Forfeited |
|
(67) |
|
|
11.45 |
|
— |
|
|
3 |
Balance at December 31, 2023 |
|
1,011 |
|
$ |
9.69 |
|
3.0 |
|
$ |
61 |
Exercised |
|
(8) |
|
|
7.10 |
|
— |
|
|
6 |
Forfeited |
|
(75) |
|
|
10.56 |
|
— |
|
|
49 |
Expired |
|
(95) |
|
|
16.70 |
|
— |
|
|
— |
Balance at December 31, 2024 |
|
833 |
|
$ |
8.84 |
|
2.7 |
|
$ |
352 |
Granted |
|
1,091 |
|
|
10.86 |
|
— |
|
|
— |
Exercised |
|
(347) |
|
|
10.50 |
|
— |
|
|
1,286 |
Forfeited |
|
(85) |
|
|
9.94 |
|
— |
|
|
645 |
Balance at December 31, 2025 |
|
1,492 |
|
$ |
9.85 |
|
4.0 |
|
$ |
12,925 |
Exercisable at December 31, 2025 |
|
287 |
|
$ |
7.67 |
|
2.4 |
|
$ |
3,108 |
Stock options have been granted to key employees, directors and consultants under the Plan. Options to purchase shares under the Plan were granted with an exercise price at or above the market value of the common stock as of the date of the grant. During the year ended December 31, 2025, the Company granted stock options to certain employees and directors for an aggregate of 1.1 million shares of common stock at a weighted average exercise price of $10.86 per share. No stock options were granted during the year ended December 31, 2024. The options vest equally over a three-year period if the individuals remain affiliated with the Company and are exercisable for a period of five years from the date of grant.
The fair value of the options granted under the Plan was estimated at the date of grant, using the Black-Scholes option-pricing model, with the following weighted-average assumptions:
|
|
|
2025 |
|
|
2024 |
|
|
2023 |
Risk-free interest rate |
|
|
3.67% |
|
|
— |
|
|
4.44% |
Dividend yield |
|
|
0.00% |
|
|
— |
|
|
0.00% |
Volatility factor of the expected market price of common stock |
|
|
61% |
|
|
— |
|
|
67% |
Weighted-average expected life of option |
|
|
3 years |
|
|
— |
|
|
3 years |
Weighted-average grant date fair value |
|
$ |
4.70 |
|
|
— |
|
$ |
3.36 |
During the year ended December 31, 2025, the Company recorded stock option expense of $1.3 million (December 31, 2024 – $0.9 million, and December 31, 2023 – $0.3 million) while the corresponding fair value of awards vesting in the year was $0.7 million (December 31, 2023 – $0.4 million, and December 31, 2022 – $0.8 million).
As of December 31, 2025, there was $2.9 million (December 31, 2024 – $1.3 million, and December 31, 2023 – $1.9 million) of unrecognized compensation expense related to 1.2 million unvested stock options outstanding (December 31, 2024 – 0.4 million, and December 31, 2023 – 0.6 million). This cost is expected to be recognized over a weighted-average period of approximately 1.6 years (2024 – 1.3 years, 2023 – 1.5 years).
121
The following table summarizes the status and activity of non-vested stock options for the year ended December 31, 2025, for the Company’s Plan:
|
|
|
|
Weighted Average |
|
|
|
|
|
Grant Date |
|
|
|
Number of |
|
Fair Value |
|
|
|
Shares |
|
Per Share |
|
|
|
(in thousands, except per share amounts) |
|||
Non-vested balance at December 31, 2024 |
|
385 |
|
$ |
3.37 |
Granted |
|
1,091 |
|
|
4.70 |
Forfeited |
|
(67) |
|
|
4.18 |
Vested |
|
(202) |
|
|
3.36 |
Non-vested balance at December 31, 2025 |
|
1,207 |
|
$ |
4.53 |
Restricted Stock Units
The following table summarizes information about Restricted Stock Units (“RSUs”) under the Plan for the years ended December 31, 2025, 2024 and 2023:
|
Number of Shares |
|
(in thousands) |
Balance at December 31, 2022 |
— |
Granted |
109 |
Vested and issued |
(80) |
Balance at December 31, 2023 |
29 |
Granted |
258 |
Vested and issued |
(273) |
Balance at December 31, 2024 |
14 |
Granted |
249 |
Vested and issued |
(175) |
Balance at December 31, 2025 |
88 |
The Company provides equity compensation in the form of RSUs to certain eligible employees. For the year ended December 31, 2025, 249,284 RSU awards were granted (December 31, 2024 – 257,906, and December 31, 2023 – 109,000). The related compensation expense recognized during 2025 was $2.4 million (December 31, 2024 – $2.3 million, and December 31, 2023 – $0.6).
NOTE 14 NET INCOME (LOSS) PER SHARE
Basic net income (loss) per share is computed by dividing the net income (loss) by the weighted average number of common shares outstanding during the period. Diluted net income (loss) per share is calculated using the treasury stock method for options and warrants and the if-converted method for the convertible senior unsecured notes. Under the if-converted method, interest expense, net of tax, is added back to net income and the weighted-average shares outstanding are increased by the shares issuable upon conversion of the notes. In applying the treasury stock method, instruments with an exercise price greater than the average quoted market price of the common shares for the period are not included in the calculation, as the impact would be anti-dilutive.
For periods in which the Company has reported a net loss, diluted net loss per share is computed in the same manner as basic net loss per share because potentially dilutive instruments, including the conversion option embedded in the convertible senior unsecured notes, are generally anti-dilutive during such periods.
122
Below is a reconciliation of the basic and diluted weighted average number of common shares and the computations for basic and diluted net income (loss) per share for the years ended December 31, 2025, 2024 and 2023:
|
Year ended December 31, |
|||||||
|
2025 |
|
2024 |
|
2023 |
|||
|
(amounts in thousands, unless otherwise noted) |
|||||||
Basic Earnings per Share |
|
|
|
|
|
|
|
|
Net income (loss) available to common stockholders — Basic earnings per share |
$ |
34,434 |
|
$ |
(43,691) |
|
$ |
55,299 |
Weighted average common shares outstanding |
|
54,046 |
|
|
51,021 |
|
|
47,544 |
Basic net income (loss) per share: |
$ |
0.64 |
|
$ |
(0.86) |
|
$ |
1.16 |
|
|
|
|
|
|
|
|
|
Diluted Earnings per Share |
|
|
|
|
|
|
|
|
Net income (loss) available to common stockholders |
$ |
34,434 |
|
$ |
(43,691) |
|
$ |
55,299 |
Add back: Interest effect of convertible notes, net of tax |
|
4,093 |
|
|
— |
|
|
— |
Net income (loss) available to common stockholders — Diluted earnings per share |
$ |
38,527 |
|
$ |
(43,691) |
|
$ |
55,299 |
|
|
|
|
|
|
|
|
|
Weighted average common shares outstanding |
|
54,046 |
|
|
51,021 |
|
|
47,544 |
Dilutive effect of stock options, restricted stock units, and warrants |
|
261 |
|
|
— |
|
|
— |
Dilutive effect of convertible notes |
|
11,253 |
|
|
— |
|
|
— |
Weighted average diluted shares |
|
65,560 |
|
|
51,021 |
|
|
47,544 |
Diluted net income (loss) per share |
$ |
0.59 |
|
$ |
(0.86) |
|
$ |
1.16 |
For the year ended December 31, 2025, the weighted average number of common shares was increased by 260,815 incremental shares to reflect the impact of dilutive instruments, while 593,577 options were anti-dilutive and excluded.
Convertible senior unsecured notes were assumed to have been converted at their issuance date of February 11, 2025. Accordingly, $4.1 million of interest expense related to the notes, net of tax, was added back to net income, and the weighted-average number of common shares outstanding was increased by 11,253,461 shares representing the shares issuable upon conversion.
For the year ended December 31, 2024, all outstanding options to purchase shares of common stock and share purchase warrants were excluded from the respective computations of diluted loss per share, as the Company was in a loss position, and all potentially dilutive instruments were anti-dilutive and therefore not included in the calculation of diluted net loss per share.
For the year ended December 31, 2023, the outstanding options for which the average market price during the year exceeded the exercise price were anti-dilutive under the treasury stock method and, therefore, not included in the calculation of diluted income per share.
NOTE 15 RELATED PARTY TRANSACTIONS
Due to related parties
The Company incurred the following expenses in respect to the related party outlined below during the years presented:
|
|
Year ended December 31, |
|||||||
|
|
2025 |
|
2024 |
|
2023 |
|||
REVlaw |
|
$ |
312 |
|
$ |
154 |
|
$ |
194 |
Paragon Advanced Labs Inc. |
|
|
168 |
|
|
— |
|
|
— |
Total expenses |
|
$ |
480 |
|
$ |
154 |
|
$ |
194 |
123
The Company has the following outstanding accounts payable balance in respect to the related parties outlined below:
|
|
|
December 31, 2025 |
|
|
December 31, 2024 |
REVlaw |
|
$ |
46 |
|
$ |
30 |
Paragon Advanced Labs Inc. |
|
|
168 |
|
|
— |
Total accounts payable |
|
$ |
214 |
|
$ |
30 |
REVlaw is a company owned by Ms. Carmen Diges, General Counsel of the Company. The legal services of Ms. Diges as General Counsel and other support staff, as needed, are provided by REVlaw in the normal course of business and have been recorded at their exchange amount.
During 2025, the Company purchased 4,817 tonnes of ore inventory from Inventus Mining Corp. for total consideration of $1.4 million. Inventus Mining Corp. is an affiliate of Robert R. McEwen, Perry Ing, Interim Chief Financial Officer, and Stefan M. Spears, Vice President, Corporate Development.
An affiliate of Robert R. McEwen, Chairman and Chief Executive Officer, acted as a lender in the restructured $40.0 million term loan and continued as such under the ARCA. On January 31, 2025, the outstanding $40.0 million loan was refinanced, extending the repayment of principal by 24 months, and is due beginning on January 31, 2027 with the remaining outstanding principal repayment on August 31, 2028. Following the aforementioned financing, the Company repaid $20.0 million in principal. As consideration for the maintenance, continuation, and extension of the maturity date of the loan, the Company issued 53,160 shares with a value equivalent to 2% of the outstanding loan balance as at March 31, 2025. For the year ended December 31, 2025, the Company paid $2.1 million (December 31, 2024 – $3.9 million) in interest to this affiliate. Interest is payable monthly at a rate of 9.75% per annum.
Due from related parties
The Company has the following outstanding accounts receivable balance in respect to the related party outlined below:
|
|
|
December 31, 2025 |
|
|
December 31, 2024 |
Current receivables |
|
$ |
3,169 |
|
$ |
286 |
Non-current receivables |
|
|
6,052 |
|
|
— |
Total receivables from McEwen Copper Inc. |
|
$ |
9,221 |
|
$ |
286 |
As at December 31, 2025, receivables from McEwen Copper primarily comprised of advances and charges for management, technical, legal, financial, administrative, geological and engineering services incurred by the Company and billed to McEwen Copper.
Investments in related parties
On March 27, 2025, the Company participated in a private placement offering of units issued by Canadian Gold, an affiliate of Robert R. McEwen, who owns approximately 32.5% of Canadian Gold Corp., and Ian Ball, a director of the Company, who serves as a consultant for Canadian Gold Corp. and served as its interim Chief Executive Officer from April 2023 to October 2023. For more information, refer to Note 5 Marketable Securities. Subsequent to year end, on January 5, 2026, the Company completed the acquisition of Canadian Gold. For more information, refer to Note 22 Subsequent Events.
On April 28, 2025, the Company exercised 9.2 million of its 10.0 million warrants in Inventus Mining Corp. Subsequently, on July 11, 2025, the Company exercised an additional 800,000 warrants. For more information, refer to Note 5 Marketable Securities.
On December 9, 2025, the Company completed the previously announced transaction to acquire 27.32% equity interest in Paragon.
124
NOTE 16 FAIR VALUE ACCOUNTING
The hierarchy of fair value measurements assigns a level to fair value measurements based on the inputs used in the respective valuation techniques. The levels of the hierarchy, as defined below, give the highest priority to unadjusted quoted prices in active markets for identical assets or liabilities and the lowest priority to unobservable inputs.
● Level 1 is defined as observable inputs such as quoted prices in active markets for identical assets. The Company’s Level 1 assets include investments in equity securities, which are exchange-traded and are valued using quoted market prices in active markets.
● Level 2 is defined as observable inputs other than Level 1 prices. These include quoted prices for similar assets or liabilities in an active market, quoted prices for identical assets and liabilities in markets that are not active, or other inputs that are observable or can be corroborated by observable market data for substantially the full term of the assets or liabilities. The Company’s Level 2 assets include investments in share purchase warrants with fair value determined using the Black-Scholes option pricing model and inputs from observable market data, including historic volatility.
● Level 3 is defined as unobservable inputs in which little or no market data exists, therefore requiring an entity to develop its own assumptions.
The following table presents the Company’s financial assets and liabilities that are recorded at fair value in the accompanying Consolidated Balance Sheets:
|
|
Fair value as at December 31, 2025 |
||||||||||
|
|
Level 1 |
|
Level 2 |
|
Level 3 |
|
Total |
||||
Assets: |
|
|
|
|
|
|
|
|
|
|
|
|
Marketable securities |
|
$ |
18,766 |
|
$ |
2,348 |
|
$ |
— |
|
$ |
21,114 |
|
|
Fair value as at December 31, 2024 |
||||||||||
|
|
Level 1 |
|
Level 2 |
|
Level 3 |
|
Total |
||||
Assets: |
|
|
|
|
|
|
|
|
|
|
|
|
Marketable securities |
|
$ |
1,206 |
|
$ |
411 |
|
$ |
— |
|
$ |
1,617 |
The fair value measurement of the Company’s convertible senior unsecured notes is presented in Note 10 Debt and is not included in the table above. The carrying value of the term loan approximates its fair value based on its recent refinancing.
The fair values of other financial assets and liabilities were assumed to approximate their carrying values due to their short-term nature and historically negligible credit losses.
NOTE 17 COMMITMENTS AND CONTINGENCIES
The following are minimum commitments of the Company as at December 31, 2025, and related payments due over the following five years:
|
|
|
|
|
Payments due by period |
|||||||||||||
|
|
2026 |
|
2027 |
|
2028 |
|
2029 |
|
Thereafter |
|
|
Total |
|||||
Mining and surface rights |
|
$ |
2,495 |
|
$ |
1,878 |
|
$ |
1,028 |
|
$ |
635 |
|
$ |
639 |
|
$ |
6,675 |
Reclamation costs(1) |
|
|
4,919 |
|
|
4,411 |
|
|
2,131 |
|
|
4,671 |
|
|
40,117 |
|
|
56,249 |
Lease obligations (Note 10) |
|
|
1,112 |
|
|
487 |
|
|
348 |
|
|
192 |
|
|
— |
|
|
2,139 |
Total |
|
$ |
8,526 |
|
$ |
6,776 |
|
$ |
3,507 |
|
$ |
5,498 |
|
$ |
40,756 |
|
$ |
65,063 |
| (1) | Amounts presented represent the undiscounted uninflated future payments. |
125
Reclamation Bonds
As part of its ongoing business and operations, the Company is required to provide bonding for its environmental reclamation obligations of $34.4 million in Nevada pertaining primarily to the Tonkin and the Gold Bar properties and $13.8 million (C$18.9 million) in Canada with respect to the Fox Complex. In addition, under Canadian regulations, the Company was required to deposit approximately $0.1 million with respect to its Lexam properties in Timmins, which is recorded as non-current restricted cash. The Company has a surety facility in place to cover all its bonding obligations. The terms of the facility carry an average annual financing fee of 2.4% and require a deposit of 7.2%. Surety bonds are available for drawdown by the beneficiary in the event the Company does not perform its reclamation obligations. If the specific reclamation requirements are met, the beneficiary of the surety bonds will release the instrument to the issuing entity. The Company believes it is in compliance with all applicable bonding obligations and will be able to satisfy future bonding requirements, through existing or alternative means, as they arise. As at December 31, 2025, the Company recorded $4.0 million in restricted cash as a deposit against the surety facility (December 31, 2024 – $3.8 million).
Flow-through Eligible Expenses
On June 14, 2024, the Company completed a flow-through share issuance for gross proceeds of $21.9 million. The proceeds of this offering were be used for the continued exploration and development of the Company’s properties in the Timmins region of Canada. The Company fulfilled its remaining CEE and CDE obligations in 2025. For further information, refer to Note 13 Shareholder’s Equity.
On December 19, 2025, the Company completed a flow-through share issuance for gross proceeds of $5.1 million. The proceeds of this offering will be used for the continued exploration and development of the Company’s properties in the Timmins region of Canada. The Company expects to fulfill its CEE obligations from this offering by the end of 2026.
Prepayment Agreement
On February 1, 2025, the Company extended the existing precious metals purchase agreement with Auramet. Under this agreement, the Company may sell the gold on a spot basis, on a forward basis and on a supplier advance basis, i.e., the gold is priced and paid for while the gold is:
| (i) | at a mine for a maximum of 15 business days before shipment; or |
| (ii) | in transit to a refinery; or |
| (iii) | being refined at a refinery. |
During the year ended December 31, 2025, the Company received net proceeds of $104.1 million from the sales on a supplier advance basis (December 31, 2024 – $8.4 million). The Company recorded revenue of $100.1 million related to the gold sales (December 31, 2024 – $4.9 million), with the remaining $7.5 million representing 1,690 ounces pledged but not yet delivered to Auramet (December 31, 2024 – $3.5 million representing 1,335 ounces pledged but not yet delivered) recorded as a contract liability on the Consolidated Balance Sheets.
Other Potential Contingencies
The Company’s mining and exploration activities are subject to various laws and regulations governing the protection of the environment. These laws and regulations are continually changing and generally becoming more restrictive. The Company conducts its operations so as to protect public health and the environment, and believes its operations are materially in compliance with all applicable laws and regulations. The Company has made, and expects to make in the future, expenditures to comply with such laws and regulations.
The Company and its predecessors have transferred their interest in several mining properties to third parties throughout its history, and has also purchased several interests in mining properties from other third parties. The Company could remain potentially liable for environmental enforcement actions related to its current or prior ownership of such properties. However, the Company has no reasonable belief that any violation of relevant environmental laws or regulations has occurred regarding these transferred properties.
126
NOTE 18 OTHER INCOME (EXPENSE)
The following is a summary of other income (expense) for the years ended December 31, 2025, 2024 and 2023:
|
|
Year ended December 31, |
|||||||
|
|
2025 |
|
2024 |
|
2023 |
|||
Unrealized and realized gain on investments |
|
$ |
12,821 |
|
$ |
433 |
|
$ |
20,462 |
Foreign currency gain on Blue Chip Swap |
|
|
— |
|
|
— |
|
|
7,993 |
Foreign currency gain (loss) |
|
|
(2,041) |
|
|
1,459 |
|
|
(59,503) |
Other income (expense) |
|
|
(56) |
|
|
759 |
|
|
1,072 |
Total other income (expenses) |
|
$ |
10,724 |
|
$ |
2,651 |
|
$ |
(29,976) |
NOTE 19 INCOME AND MINING TAXES
The Company’s income and mining tax (recovery) expense consisted of:
|
|
Year ended December 31, |
|||||||
|
|
2025 |
|
2024 |
|
2023 |
|||
State |
|
$ |
(859) |
|
$ |
2,073 |
|
$ |
971 |
Foreign |
|
|
1,314 |
|
|
2,231 |
|
|
(4,107) |
Current tax (recovery) expense |
|
$ |
455 |
|
$ |
4,304 |
|
$ |
(3,136) |
|
|
|
|
|
|
|
|
|
|
Federal |
|
$ |
(22,222) |
|
$ |
— |
|
$ |
— |
State |
|
|
419 |
|
|
(195) |
|
|
— |
Foreign |
|
|
(6,137) |
|
|
(7,157) |
|
|
36,995 |
Deferred tax (recovery) expense |
|
$ |
(27,940) |
|
$ |
(7,352) |
|
$ |
36,995 |
|
|
|
|
|
|
|
|
|
|
Federal |
|
$ |
(22,222) |
|
$ |
— |
|
$ |
— |
State |
|
|
(440) |
|
|
1,878 |
|
|
971 |
Foreign |
|
|
(4,823) |
|
|
(4,926) |
|
|
32,888 |
Total income and mining tax (recovery) expense |
|
$ |
(27,485) |
|
$ |
(3,048) |
|
$ |
33,859 |
The Company’s income (loss) before income and mining tax consisted of:
|
|
Year ended December 31, |
|||||||
|
|
2025 |
|
2024 |
|
2023 |
|||
United States |
|
$ |
20,028 |
|
$ |
6,130 |
|
$ |
(7,702) |
Foreign |
|
|
(13,079) |
|
|
(52,869) |
|
|
74,738 |
Income (loss) before income and mining taxes |
|
$ |
6,949 |
|
$ |
(46,739) |
|
$ |
67,036 |
127
The table below provides the updated requirements of ASU 2023-09 for 2025. The Company's income and mining tax expense (recovery) for the year ended December 31, 2025 differed from the amounts computed by applying the United States statutory corporate income tax rate for the following reasons:
|
|
Year ended December 31, 2025 |
||||
|
|
|
Amount |
|
|
Percent |
Income before income and mining taxes |
|
$ |
6,949 |
|
|
|
|
|
|
|
|
|
|
U.S. Federal statutory tax rate |
|
|
1,459 |
|
|
21% |
State and local income taxes, net of Federal income tax (1) |
|
|
1,296 |
|
|
19% |
Foreign tax effects |
|
|
— |
|
|
0% |
Canada |
|
|
|
|
|
|
Adjustment for foreign tax rate |
|
|
2,562 |
|
|
37% |
Adjustment for foreign provincial tax rate |
|
|
(4,640) |
|
|
(67)% |
Change in valuation allowance |
|
|
12,248 |
|
|
176% |
Canadian branch losses |
|
|
(10,127) |
|
|
(146)% |
Equity loss from investments |
|
|
3,280 |
|
|
47% |
Foregone interest |
|
|
915 |
|
|
13% |
Realized flow-through expenditures |
|
|
5,483 |
|
|
79% |
Realized flow-through premium |
|
|
(5,649) |
|
|
(81)% |
Deferred mining tax expense net of income tax benefit |
|
|
672 |
|
|
10% |
Withholding taxes |
|
|
342 |
|
|
5% |
Foreign exchange on translation of books |
|
|
(537) |
|
|
(8)% |
Adjustments in relation to prior years |
|
|
(585) |
|
|
(8)% |
Other |
|
|
(112) |
|
|
(2)% |
Argentina |
|
|
|
|
|
|
Adjustment for foreign tax rate |
|
|
(60) |
|
|
(1)% |
Change in valuation allowance |
|
|
8 |
|
|
0% |
Equity income from investments |
|
|
(8,636) |
|
|
(124)% |
Non deductible interest |
|
|
1,772 |
|
|
26% |
Effect of foreign exchange on translation of books and records |
|
|
(1,382) |
|
|
(20)% |
Other |
|
|
57 |
|
|
1% |
Mexico |
|
|
|
|
|
|
Adjustment for foreign tax rate |
|
|
(997) |
|
|
(14)% |
Change in valuation allowance |
|
|
1,411 |
|
|
20% |
Non deductible interest |
|
|
695 |
|
|
10% |
Inflation adjustment on monetary assets |
|
|
738 |
|
|
11% |
Effect of foreign exchange on translation of books and records |
|
|
372 |
|
|
5% |
Other |
|
|
108 |
|
|
2% |
Effect of changes in tax laws/rates enacted in the current period |
|
|
— |
|
|
0% |
Effect of cross-border tax laws |
|
|
931 |
|
|
13% |
Tax credits |
|
|
(74) |
|
|
(1)% |
Changes in valuation allowances |
|
|
(30,209) |
|
|
(435)% |
Nontaxable or nondeductible items |
|
|
478 |
|
|
7% |
Changes in unrecognized tax benefits |
|
|
695 |
|
|
10% |
Income and mining tax recovery |
|
$ |
(27,485) |
|
|
(396)% |
| (1) | State taxes are comprised entirely of Nevada Net Proceeds Tax, net of federal benefit. |
128
The Company’s effective tax rate of (396%) for the year ended December 31, 2025 is primarily attributable to the partial release of the valuation allowance on U.S. federal and certain state deferred tax assets. During 2025, the Company's valuation allowance decreased by $30.2 million after carefully evaluating all available positive and negative evidence in accordance with ASC 740. The positive evidence included sustained improvements in operating performance, continued profitability, and forecasted taxable income supported by the Company’s long‑term financial projections, despite historical operating losses in earlier periods. Management concluded that the positive evidence outweighs the negative evidence, and therefore determined that it is more likely than not that a portion of the Company’s U.S. deferred tax assets will be realized.The release of the valuation allowance resulted in a significant favorable impact on the Company’s effective tax rate for the period.
As previously disclosed for the years ended December 31, 2024 and 2023, prior to the adoption of ASU 2023-09, the effective income tax rate differs from the statutory federal income tax rate as follows:
|
|
Year ended December 31, |
||||
Expected tax expense at |
|
2024 |
|
2023 |
||
(Loss) income before income and mining taxes |
|
$ |
(46,739) |
|
$ |
67,036 |
Statutory tax rate |
|
|
21% |
|
|
21% |
US Federal and State tax (recovery) expense at statutory rate |
|
|
(9,815) |
|
|
14,078 |
Reconciling items: |
|
|
|
|
|
|
Equity loss from investments |
|
|
10,555 |
|
|
15,310 |
Deconsolidation of McEwen Copper Inc. |
|
|
— |
|
|
(46,644) |
Disposal of McEwen Copper Inc.'s shares |
|
|
(1,531) |
|
|
6,179 |
Deferred tax liability on investment in associate |
|
|
— |
|
|
38,340 |
Realized flow-through expenditures |
|
|
4,017 |
|
|
3,570 |
Realized flow-through premium |
|
|
(2,304) |
|
|
(3,423) |
Withholding tax |
|
|
426 |
|
|
632 |
Adjustment for foreign tax rates |
|
|
(3,746) |
|
|
(13,769) |
Permanent differences |
|
|
(2,014) |
|
|
9,909 |
Foreign exchange on translation of books |
|
|
(4,157) |
|
|
42 |
Losses expired |
|
|
3,330 |
|
|
8,282 |
Adjustments in relation to prior years |
|
|
367 |
|
|
(629) |
Current and deferred mining tax liabilities |
|
|
2,283 |
|
|
1,455 |
Movement in valuation allowance |
|
|
(505) |
|
|
821 |
Other |
|
|
46 |
|
|
(294) |
(Loss) income and mining tax (recovery) expense |
|
$ |
(3,048) |
|
$ |
33,859 |
The tax effects of temporary differences that give rise to significant portions of the deferred tax assets and deferred tax liabilities as at December 31, 2025 and 2024, respectively, are presented below:
|
|
Year ended December 31, |
||||
|
|
2025 |
|
2024 |
||
Deferred tax assets: |
|
|
|
|
|
|
Net operating loss carryforward |
|
$ |
72,844 |
|
$ |
61,135 |
Stock based compensation |
|
|
2,294 |
|
|
— |
Mineral properties |
|
|
46,290 |
|
|
52,228 |
Other temporary differences |
|
|
20,018 |
|
|
22,259 |
Total gross deferred tax assets |
|
|
141,446 |
|
|
135,622 |
Less: valuation allowance |
|
|
(115,855) |
|
|
(132,396) |
Net deferred tax assets |
|
$ |
25,591 |
|
$ |
3,226 |
Deferred tax liabilities: |
|
|
|
|
|
|
Unrealized loss |
|
|
(642) |
|
|
— |
Acquired mineral property interests |
|
|
(5,876) |
|
|
(3,928) |
Equity accounted investments |
|
|
(29,600) |
|
|
(32,881) |
Other taxable temporary differences |
|
|
(4,210) |
|
|
(3,047) |
Total deferred tax liabilities |
|
$ |
(40,328) |
|
$ |
(39,856) |
Deferred income and mining tax liability |
|
$ |
(14,737) |
|
$ |
(36,630) |
129
The Company evaluates all available positive and negative evidence to determine whether it is more likely than not that sufficient future taxable income will be generated to realize its deferred tax assets. As the Company continues to experience sustained improvements in operating performance and forecasted taxable income in its U.S. operations, management concluded that it is more likely than not that a portion of its deferred tax assets will be realized. Accordingly, during 2025, the Company's valuation allowance related to its U.S. deferred tax assets decreased by $30.2 million.
With respect to foreign jurisdictions a significant piece of objective negative evidence evaluated was the recent pretax losses and/or expectations of future pretax losses. Such objective evidence limits the ability to consider other subjective evidence such as the Company's projections for future growth.
The table below summarizes changes to the valuation allowance:
|
|
Balance at |
|
|
|
|
|
|
|
|
Balance at |
|
For the year ended December 31, |
|
beginning of year |
|
Additions (1) |
|
Deductions (2) |
|
|
end of year |
|||
2025 |
|
$ |
132,396 |
|
$ |
13,668 |
|
$ |
(30,209) |
|
$ |
115,855 |
2024 |
|
|
130,002 |
|
|
2,780 |
|
|
(386) |
|
|
132,396 |
2023 |
|
|
149,342 |
|
|
3,391 |
|
|
(22,731) |
|
|
130,002 |
| (1) | The additions to valuation allowance mainly result from the Company and its subsidiaries incurring losses and exploration expenses for tax purposes that do not meet the more-likely-than-not criterion for recognition of deferred tax assets. |
| (2) | The reductions to valuation allowance mainly result from release of valuation allowance in the United States. |
As at December 31, 2025, 2024 and 2023, the Company did not have any income-tax related accrued interest and tax penalties.
The following table summarizes the Company’s losses that can be applied against future taxable profit:
Country |
|
Type of Loss |
|
Amount |
|
Expiry Period |
|
United States (1) |
|
Net operating losses |
|
$ |
202,166 |
|
2027-Unlimited |
Mexico |
|
Net operating losses |
|
|
59,631 |
|
2029-2034 |
Canada (1) |
|
Net operating losses |
|
|
47,864 |
|
2026-2045 |
Argentina (1) |
|
Net operating losses |
|
|
1 |
|
2030 |
| (1) | The losses in the United States, Canada, and Argentina are part of multiple consolidating groups and, therefore, may be restricted in use to specific projects. |
Net cash paid for income taxes consisted of the following:
|
|
Year ended December 31, |
|
|
|
|
2025 |
State and local jurisdictions |
|
|
|
Nevada |
|
$ |
203 |
Canada - Ontario |
|
|
1,661 |
Other |
|
|
113 |
Total taxes paid |
|
$ |
1,977 |
130
The following table presents the changes in gross unrecognized tax benefits:
|
|
Year ended December 31, |
|||||||
|
|
|
2025 |
|
|
2024 |
|
|
2023 |
Unrecognized tax benefits - beginning of period |
|
$ |
— |
|
$ |
— |
|
$ |
— |
Additions for tax positions taken in prior years |
|
|
2,644 |
|
|
— |
|
|
— |
Lapses of applicable statues of limitations |
|
|
(507) |
|
|
— |
|
|
— |
Total unrecognized tax benefits |
|
$ |
2,137 |
|
$ |
— |
|
$ |
— |
If recognized, the balance of unrecognized tax benefits that would favorably affect the effective income tax rate would be $0.1 million.
The Company has not recognized an amount for interest and penalties in relation to the unrecognized tax benefit.
The Company or its subsidiaries file income tax returns in the United States, Canada, Mexico and Argentina. These tax returns are subject to examination by local taxation authorities provided the tax years remain open to audit under the relevant statute of limitations. The following summarizes the open tax years by major jurisdiction:
United States: 2020 to 2025
Canada: 2018 to 2025
Mexico: 2019 to 2025
Argentina: 2019 to 2025
NOTE 20 TIMBERLINE ACQUISITION
On August 19, 2024, the Company completed the acquisition of Timberline. The acquisition of Timberline expands the Company’s existing portfolio of exploration-stage mineral property interests in Nevada. The Company acquired 100% of Timberline’s outstanding equity interests.
The transaction was accounted for as an asset acquisition, as substantially all of the fair value of the assets acquired was concentrated in mineral property interests. Timberline was considered a variable interest entity that was not a business due to insufficient equity at risk. The Company, as the primary beneficiary and accounting acquirer, consolidated Timberline on the acquisition date.
Pursuant to the Agreement and Plan of Merger, the Company issued 1,839,306 common shares with a fair value of $18.3 million and 205,349 warrants with a fair value of $0.9 million as part of the consideration. Additionally, outstanding notes payable amounting to $1.9 million were settled and included in the consideration. The Company’s previously held 3.3% equity interest was measured at a fair value of $0.6 million and included in consideration.
The following table summarizes the estimated fair value of assets acquired and liabilities assumed on August 19, 2024:
|
|
Fair Value |
|
|
|
August 19, 2024 |
|
Purchase price: |
|
|
|
Cash and cash equivalents |
|
$ |
603 |
Prepaid and other current assets |
|
|
64 |
Mineral property interests |
|
|
22,369 |
Restrictive time deposits |
|
|
529 |
Accounts payable and accrued liabilities |
|
|
(477) |
Asset retirement obligation |
|
|
(256) |
Deferred income tax liability |
|
|
(1,106) |
|
|
$ |
21,726 |
131
NOTE 21 UNAUDITED SUPPLEMENTARY QUARTERLY INFORMATION
The following table summarizes unaudited supplementary quarterly information for the three months ended March 31, 2025, June 30, 2025, September 30, 2025, and December 31, 2025, and for the corresponding periods in 2024.
|
|
Three months ended |
||||||||||
|
|
March 31, 2025 |
|
June 30, 2025 |
|
September 30, 2025 |
|
December 31, 2025 |
||||
|
|
(unaudited) (in thousands, except per share) |
||||||||||
Revenue from gold and silver sales |
|
$ |
35,696 |
|
$ |
46,700 |
|
$ |
50,534 |
|
$ |
64,623 |
Gross profit |
|
|
10,070 |
|
|
12,281 |
|
|
7,816 |
|
|
17,397 |
Net profit (loss) |
|
|
(6,270) |
|
|
3,040 |
|
|
(462) |
|
|
38,126 |
Net profit (loss) per share: |
|
|
|
|
|
|
|
|
|
|
|
|
Basic |
|
$ |
(0.12) |
|
$ |
0.06 |
|
$ |
(0.01) |
|
$ |
0.70 |
Diluted |
|
|
(0.12) |
|
|
0.06 |
|
|
(0.01) |
|
|
0.57 |
Weighted average shares outstanding: |
|
|
|
|
|
|
|
|
|
|
|
|
Basic |
|
|
53,270 |
|
|
53,968 |
|
|
54,170 |
|
|
54,751 |
Diluted |
|
|
53,270 |
|
|
54,022 |
|
|
54,170 |
|
|
66,614 |
|
|
Three months ended |
||||||||||
|
|
March 31, 2024 |
|
June 30, 2024 |
|
September 30, 2024 |
|
December 31, 2024 |
||||
|
|
(unaudited) (in thousands, except per share) |
||||||||||
Revenue from gold and silver sales |
|
$ |
41,228 |
|
$ |
47,476 |
|
$ |
52,250 |
|
$ |
33,523 |
Gross profit |
|
|
6,011 |
|
|
10,758 |
|
|
13,803 |
|
|
363 |
Net loss |
|
|
(20,383) |
|
|
(12,995) |
|
|
(2,081) |
|
|
(8,232) |
Net loss per share: |
|
|
|
|
|
|
|
|
|
|
|
|
Basic and diluted |
|
$ |
(0.41) |
|
$ |
(0.26) |
|
$ |
(0.04) |
|
$ |
(0.16) |
Weighted average shares outstanding: |
|
|
|
|
|
|
|
|
|
|
|
|
Basic and diluted |
|
|
49,440 |
|
|
49,718 |
|
|
51,953 |
|
|
52,926 |
NOTE 22 SUBSEQUENT EVENTS
Acquisition of Canadian Gold Corp.
On January 5, 2026, the Company completed the acquisition of Canadian Gold, an exploration and production mine which has 100% interest in the Tartan Lake Gold Mine Project (the “Tartan Mine”) located in the province of Manitoba, Canada. The Company acquired 100% of Canadian Gold’s outstanding equity interests.
Under the terms of the agreement, each holder of Canadian Gold common shares received 0.0225 common shares of the Company for each Canadian Gold share held. Management is in the process of finalizing its accounting assessment of this matter.
Flow-through shares issuance – CDE
On January 22, 2026, the Company issued 350,000 flow-through common shares priced at $20.90 per share for gross proceeds of $7.3 million. Subsequently, on January 28, 2026, the Company issued an additional 377,000 flow-through common shares at a price of $21.25 per share for gross proceeds of $8.0 million.
Loan Agreement for McEwen Copper Inc.
On February 6, 2026, McEwen Copper entered into a loan agreement providing for borrowings of up to $240.0 million, which may be advanced in one or more tranches upon mutual agreement among McEwen Copper, as borrower, the Company, as agent, and a syndicate of lenders. As of the date of this filing, approximately $28.5 million of additional funding has been secured under the agreement, including $13.6 million from the Company. As part of the loan agreement, the Company also received 203,280 transferable warrants to purchase shares of McEwen Copper at $40 per share. The loan bears interest at an annual rate of 12%.
132
ITEM 9. CHANGES IN AND DISAGREEMENTS WITH ACCOUNTANTS ON ACCOUNTING AND FINANCIAL DISCLOSURE
[NONE]
ITEM 9A. CONTROLS AND PROCEDURES
Evaluation of Disclosure Controls and Procedures
During the fiscal period covered by this report, our management, with the participation of the Chief Executive Officer and Chief Financial Officer, carried out an evaluation of the effectiveness of the design and operation of our disclosure controls and procedures (as defined in Rules 13a-15(e) and 15d-15(e) of the Exchange Act) as of December 31, 2025. Based on such evaluation, our Chief Executive Officer and Chief Financial Officer have concluded that our disclosure controls and procedures were effective as of December 31, 2025.
Management’s Report on Internal Control Over Financial Reporting
The management of the Company is responsible for establishing and maintaining adequate internal control over financial reporting. The Securities Exchange Act of 1934 defines internal control over financial reporting in Rule 13a-15(f) and 15d-15(f) as a process designed by, or under the supervision of, the Company’s principal executive and principal financial officers and effected by the Company’s Board of Directors, management and other personnel, to provide reasonable assurance regarding the reliability of financial reporting and the preparation of financial statements for external purposes in accordance with generally accepted accounting principles and includes those policies and procedures that:
| ● | Pertain to the maintenance of records that in reasonable detail accurately and fairly reflect the transactions and dispositions of the assets of the Company; |
| ● | Provide reasonable assurance that transactions are recorded as necessary to permit preparation of financial statements in accordance with generally accepted accounting principles, and that receipts and expenditures of the Company are being made only in accordance with authorizations of management and the Board of Directors of the Company; and |
| ● | Provide reasonable assurance regarding prevention or timely detection of unauthorized acquisition, use or disposition of the Company’s assets that could have a material effect on the financial statements. |
All internal control over financial reporting processes and systems, no matter how well designed, have inherent limitations. Therefore, even processes and systems deemed to be effective can provide only reasonable assurance with respect to financial statement preparation and presentation. Also, projections of any evaluation of effectiveness to future periods are subject to the risk that controls may become inadequate due to changes in conditions, or that the degree of compliance with the policies or procedures may deteriorate.
The Company’s management assessed the effectiveness of the Company’s internal control over financial reporting as of December 31, 2025. In making this assessment, the Company’s management used the criteria set forth by the Committee of Sponsoring Organizations of the Treadway Commission (COSO) in Internal Control—Integrated Framework (2013). Based upon its assessment, management concluded that, as of December 31, 2025, the Company’s internal control over financial reporting was effective based upon those criteria.
Ernst & Young LLP, an independent registered public accounting firm, has audited the effectiveness of the Company’s internal control over financial reporting as of December 31, 2025. Ernst & Young LLP’s report on our internal control over financing reporting as of December 31, 2025 can be found under Item 8, Financial Statements and Supplementary Data.
133
Changes in Internal Control Over Financial Reporting
During the fiscal year ended December 31, 2025, the Company completed the remediation efforts necessary to remediate the material weakness in internal control over financial reporting previously disclosed in the Company’s annual report on Form 10-K for the fiscal year ended December 31, 2024. The identified deficiencies that were remediated related to the Company not having a sufficient complement of human resources to support the design and operation of its internal controls associated with certain aspects of non-routine transactions, and other less complex transactions within income taxes.
During the fiscal year ended December 31, 2025, the Company implemented remediation actions including: (i) onboarding of additional human resources; (ii) creation of additional layers of review in relevant control processes, and (iii) ongoing engagement of third-party resources where appropriate. Management evaluated the remediation actions implemented by the Company, including testing the design and operating effectiveness of the controls addressing the material weakness. Based on this evaluation, management has concluded that the previously identified material weakness described above has been remediated as of December 31, 2025.
Except for the changes described in the preceding paragraphs, there were no other changes in the Company's internal control over financial reporting during the fiscal quarter ended December 31, 2025 that have materially affected, or are reasonably likely to materially affect, the Company's internal control over financial reporting.
ITEM 9B. OTHER INFORMATION
Information Required by Item 408(a) of Regulation S-K: During the quarter ended December 31, 2025, none of the Company’s directors or executive officers adopted, modified, or terminated any contract, instruction or written plan for the purchase or sale of Company securities that was intended to satisfy the affirmative defense conditions of Rule 10b5-1(c) or any “non-Rule 10b5-1 trading arrangement.”
ITEM 9C. DISCLOSURE REGARDING FOREIGN JURISDICTIONS THAT PREVENT INSPECTIONS
Not applicable.
PART III
ITEM 10. DIRECTORS, EXECUTIVE OFFICERS AND CORPORATE GOVERNANCE
Pursuant to General Instruction G of Form 10-K, the information required to be included in this Item 10 is incorporated by reference to our Definitive Proxy Statement for our 2026 Annual Meeting of Shareholders, expected to be filed with the SEC on or before April 30, 2026.
The Company has a code of business conduct and ethics that applies to all of its employees, officers and directors. The code of business conduct and ethics is available on our website at www.mcewenmining.com and we will post any amendments to, or waivers, from, the code of ethics on that website.
ITEM 11. EXECUTIVE COMPENSATION
Pursuant to General Instruction G of Form 10-K, the information required to be included in this Item 11 is incorporated by reference to our Definitive Proxy Statement for our 2026 Annual Meeting of Shareholders, expected to be filed with the SEC on or before April 30, 2026.
134
ITEM 12. SECURITY OWNERSHIP OF CERTAIN BENEFICIAL OWNERS AND MANAGEMENT AND RELATED STOCKHOLDER MATTERS
Pursuant to General Instruction G of Form 10-K, the information required to be included in this Item 12 is incorporated by reference to our Definitive Proxy Statement for our 2026 Annual Meeting of Shareholders, expected to be filed with the SEC on or before April 30, 2026.
ITEM 13. CERTAIN RELATIONSHIPS AND RELATED TRANSACTIONS AND DIRECTOR INDEPENDENCE
Pursuant to General Instruction G of Form 10-K, the information required to be included in this Item 13 is incorporated by reference to our Definitive Proxy Statement for our 2026 Annual Meeting of Shareholders, expected to be filed with the SEC on or before April 30, 2026.
ITEM 14. PRINCIPAL ACCOUNTANT FEES AND SERVICES
Pursuant to General Instruction G of Form 10-K, the information required to be included in this Item 14 is incorporated by reference to our Definitive Proxy Statement for our 2026 Annual Meeting of Shareholders, expected to be filed with the SEC on or before April 30, 2026.
135
PART IV
ITEM 15. EXHIBITS AND FINANCIAL STATEMENT SCHEDULES
The exhibits listed in this Item 15 are filed or furnished (except where otherwise indicated) as part of this report:
| (a) | Financial Statements |
We have filed the financial statements in Item 8. Financial Statements and Supplementary Data as a part of this Annual
Report on Form 10-K.
| (b) | Exhibits |
3.1.1 |
|
|||
3.1.2 |
|
|||
3.1.3 |
|
|||
3.1.4 |
|
|||
3.1.5 |
|
|||
3.2 |
|
|||
4.1 |
|
|||
4.2 |
|
|||
4.3 |
|
Form of 5.25% Convertible Senior Note due 2030 (included in Exhibit 10.10). |
||
10.1 |
|
|||
10.2 |
|
|||
10.3 |
|
|||
10.4 |
|
|||
10.5 |
|
|||
10.6 + |
|
Loan Agreement between McEwen Inc., McEwen Copper Inc., and the Lenders, dated February 6, 2026. |
||
10.7 |
|
|||
10.8 |
|
|||
136
10.9 |
|
|||
10.10 |
|
|||
10.11 |
|
|||
10.12 |
|
|||
10.13 # |
|
|||
10.14 # |
|
|||
10.15 # |
|
|||
10.16 # |
|
|||
10.17 # |
|
|||
10.18 # |
|
|||
10.19 # |
|
|||
10.20 # |
|
|||
10.21 # |
|
|||
19 |
|
|||
21 + |
|
|||
22 + |
|
Consent of Ernst & Young LLP, Independent Registered Public Accounting Firm |
||
23.1 + |
|
|||
23.2 + |
|
|||
23.3 + |
|
|||
23.4 + |
|
|||
23.5 + |
|
|||
23.6 + |
|
|||
23.7 + |
|
|||
23.8 + |
|
|||
23.9 + |
|
|||
23.10 + |
|
|||
23.11 + |
|
|||
23.12 + |
|
|||
23.13 + |
|
|||
23.14 + |
|
|||
23.15 + |
|
|||
23.16 + |
|
|||
23.17 + |
|
|||
23.18 + |
|
|||
23.19 + |
|
|||
23.20 + |
|
|||
31.1 + |
|
|||
31.2 + |
|
|||
32 + |
|
Section 1350 Certifications of Chief Executive Officer and Chief Financial Officer. |
||
95 + |
|
|||
96 + |
|
Technical Report Summary of the Loz Azules Copper Mining Project |
||
96.1 |
|
|||
137
97 |
|
|||
101 SCH |
|
Inline XRBL Taxonomy Extension Schema Document. |
||
101 CAL |
|
Inline XBRL Taxonomy Extension Calculation Linkbase Document. |
||
101 DEF |
|
Inline XBRL Taxonomy Extension Definition Linkbase Document. |
||
101.LAB |
|
Inline XBRL Taxonomy Extension Label Linkbase Document. |
||
101.PRE |
|
Inline XBRL Taxonomy Extension Presentation Linkbase Document. |
||
104 |
|
Cover Page Interactive Data File (embedded within the Inline XBRL document). |
||
|
||||
+ |
|
Furnished with this report |
||
# |
|
Indicates management contract or compensatory plan or arrangement |
||
ITEM 16. FORM 10-K SUMMARY
[NONE]
138
SIGNATURES
Pursuant to the requirements of Section 13 or 15(d) of the Securities Exchange Act of 1934, the registrant has duly caused this report to be signed on its behalf by the undersigned, thereunto duly authorized.
|
|
MCEWEN INC. |
||||
|
By: |
/s/ ROBERT R. MCEWEN |
||||
Dated: March 16, 2026 |
|
Robert R. McEwen, |
||||
|
|
Chairman of the Board of Directors and |
||||
|
|
Chief Executive Officer |
||||
|
|
|
||||
/s/ ROBERT R. MCEWEN |
|
Chairman of the Board of Directors and Chief Executive Officer (Principal Executive Officer) |
|
March 16, 2026 |
||
Robert R. McEwen |
|
|
||||
|
|
|
|
|
||
/s/ PERRY ING |
|
Interim Chief Financial Officer (Principal Financial Officer and Principal Accounting Officer) |
|
March 16, 2026 |
||
Perry Ing |
|
|
||||
|
|
|
|
|
||
/s/ RICHARD W. BRISSENDEN |
|
Director |
|
March 16, 2026 |
||
Richard W. Brissenden |
|
|
||||
|
|
|
|
|
||
/s/ WILLIAM SHAVER |
|
Director |
|
March 16, 2026 |
||
William Shaver |
|
|
||||
|
|
|
|
|
||
/s/ IAN J. BALL |
|
Director |
|
March 16, 2026 |
||
Ian Ball |
|
|
||||
|
|
|
|
|
||
/s/ MICHELLE MAKORI |
|
Director |
|
March 16, 2026 |
||
Michelle Makori |
|
|
|
|
||
|
|
|
|
|
||
/s/ NICOLAS DARVEAU |
|
Director |
|
March 16, 2026 |
||
Nicolas Darveau |
|
|
|
|
||
|
|
|
|
|
||
/s/ ALFRED COLAS |
|
Director |
|
March 16, 2026 |
||
Alfred Colas |
|
|
|
|
||
|
|
|
|
|
||
JOHN C FLOREK |
|
Director |
|
March 16, 2026 |
||
John C Florek |
|
|
|
|
||
|
|
|
|
|
||
DALIA ASTERBADI |
|
Director |
|
March 16, 2026 |
||
Dalia Asterbadi |
|
|
|
|
||
|
|
|
|
|
||
STEVE KASZAS |
|
Director |
|
March 16, 2026 |
||
Steve Kaszas |
|
|
|
|
||
|
|
|
|
|
||
MICHAEL MELANSON |
|
Director |
|
March 16, 2026 |
||
Michael Melanson |
|
|
|
|
||
139
EXHIBIT 10.6
LOAN AGREEMENT
This Loan Agreement is dated effective as of February 6th, 2026.
BETWEEN:
MCEWEN COPPER INC.
(the “Borrower”) as Borrower
THE LENDERS FROM TIME TO TIME PARTY TO THIS AGREEMENT
(the “Lenders”) as Lenders
(the “Agent”)
as Administrative and Collateral Agent
RECITALS:
| A. | The Borrower has requested, and the Lenders have agreed to provide, the Advances described in this Agreement in favour of the Borrower on and subject to the terms and conditions set forth herein. |
| B. | The Lenders wish to appoint the Agent, and the Agent has agreed to accept the appointment, to act as administrative and collateral agent in respect of the Loan Facility established herein, on and subject to the terms and conditions set forth herein. |
The parties hereto agree as follows:
ARTICLE I
Definitions and Interpretation Section 1.01 Definitions.
Section 1.01 Definitions.
In this Agreement, the following terms shall have the meanings set forth below:
“Acquisition” means the purchase or acquisition (whether in one or a series of related transactions) regardless of how accomplished or effected (including any such purchase or other acquisition effected by way of amalgamation, merger, arrangement, business combination or other form of corporate reorganization or by way of purchase, lease or other acquisition arrangements), by any Person of: (a) Control of another Person; or (b) all or substantially all of the property or assets of another Person or a division or line of business or business unit of another Person, whether or not involving a merger or amalgamation with such Person.
“Advance” means the extension of credit under this Agreement by way of an advance in United States Dollars which accrues interest as set forth herein.
“Affiliate” means, with respect to any Person, any other Person that directly or indirectly, through one or more intermediaries, Controls, is controlled by, or is under common Control with, such Person.
“Agent” means McEwen Inc., in its capacity as administrative and collateral agent for the Lenders under this Agreement, and any successor administrative and collateral agent appointed in accordance with this Agreement.
“Agent's Office” means Suite 2800, 150 King Street West, Toronto, Ontario, Canada, M5H 1J9 or such other office or branch that the Agent may from time to time designate by notice in writing to the Borrower and the Lenders.
“Agreement” means this loan agreement, including all Schedules to this Agreement. In any other Loan Document, the term “Agreement” means the Loan Document in which the term is used.
“Anti-Corruption Laws” means all Applicable Law of any jurisdiction applicable to the Borrower or any Subsidiary from time to time concerning or relating to bribery or corruption.
“Anti-Terrorist Financing and Anti-Money Laundering Laws” means all Applicable Law concerning or related to money laundering or financing terrorism and which are applicable to the Agent, any Lender, the Borrower or any Subsidiary including, but not limited to Part II.1 of the Criminal Code, R.S.C. 1985, c.C-46, the Proceeds of Crime (Money Laundering) and Terrorist Financing Act, S.C. 2000, c. 17, and regulations promulgated pursuant to the Special Economic Measures Act, S.C. 1992, c. 17 and the United Nations Act, R.S.C. 1985, c. U-2.
“Applicable Law” means: (a) any domestic or foreign statute, law (including common and civil law), treaty, code, ordinance, rule, regulation, restriction of by-law (zoning or otherwise); (b) any judgment, order, writ, injunction, decision, ruling, decree or award; (c) any regulatory policy, practice, request, guideline or directive; or (d) any franchise, licence, qualification, authorization, consent, exemption, waiver, right, permit or other approval of any Governmental Authority, binding on or affecting the Person referred to in the context in which the term is used or binding on or affecting the Property of that Person, in each case whether or not having the force of law.
“Applicable Percentage” means with respect to any Lender at a particular point in time, the percentage of the total of all outstanding Advances represented by such Lender's total outstanding Advances at such time. Each Lender's Applicable Percentage of the Loan Facility as of the date of this Agreement is specified on Exhibit “A”.
“Assignment Agreement” is defined in Section 16.02(c).
“Bankruptcy and Insolvency Law” means the Bankruptcy and Insolvency Act (Canada), the Companies' Creditors Arrangement Act (Canada), the Canada Business Corporations Act, the Winding-up and Restructuring Act (Canada), or any successor statute and all other liquidation, winding-up, bankruptcy, assignment for the benefit of creditors, conservatorship, moratorium, receivership, insolvency, plan of arrangement, reorganization, proposal or similar statutes, laws, rules and regulations of Canada, or any province or territory thereof, or any other applicable jurisdictions, in effect from time to time.
“Borrower” means McEwen Copper Inc., a corporation incorporated under the laws of the Province of Alberta, Canada, which through its subsidiaries owns the Los Azules Project and the Elder Creek Project.
“Business Day” means any day other than a Saturday, Sunday or other day on which commercial banks in Toronto, Ontario are authorized or required by law to be closed for business.
“Change in Law” means the occurrence, after the date of this Agreement, of any of the following:
(a) the phase-in, adoption or taking effect of any Applicable Law; (b) any change in any Applicable Law or in its administration, interpretation, implementation or application by any Governmental Authority.
“Closing Date” means February 6, 2026.
“Commitment” means, for each Lender, the obligation of such Lender to provide an Advance to the Borrower under the Loan Facility in the principal amount set out in Exhibit “A”.
“Contractual Obligation” of any Person, means any obligation or liability of such person under any agreement, franchise, lease, security, easement, servitude, privilege and other rights (other than Permits) acquired from others, to which such Person is a party or by which it or any of its Property is bound or may hereafter become a party or be bound, other than the Obligations.
“Control” means the possession, directly or indirectly, of the power to direct or cause the direction of the management or policies of a Person, whether through the ability to exercise voting power, by contract or otherwise; “controlling” and “controlled” have corresponding meanings.
“Debt” of any Person at any date, without duplication, means:
| (a) | all indebtedness of such Person for borrowed money; |
| (b) | all obligations of such Person for the deferred purchase price of property or services (other than (i) trade payables and accrued expenses incurred in the ordinary course of business and not past due for more than ninety (90) days after the date on which each such trade payable or account payable was created, and (ii) any earn-out, purchase price adjustment or similar obligation until such obligation appears in the liabilities section of the balance sheet of such Person); |
| (c) | all obligations of such Person evidenced by notes, bonds, debentures or other similar instruments; |
| (d) | all indebtedness created or arising under any conditional sale or other title retention agreement with respect to property acquired by such Person (even though the rights and remedies of the seller or lender under such agreement in the Event of Default are limited to repossession or sale of such property); |
| (e) | all obligations of such Person to purchase, redeem, retire, defease or otherwise make any payment in respect of any Equity Interests in such Person or any other Person or any warrants, rights or options to acquire such Equity Interests, valued, in the case of redeemable preferred interests, at the greater of its voluntary or involuntary liquidation preference plus accrued and unpaid dividends; |
| (f) | all obligations of such Person, contingent or otherwise, as an account party or applicant under acceptance, letter of credit or similar facilities in respect of obligations of the kind referred to in (a) through (e); |
| (g) | all Guarantee Obligations of such Person in respect of obligations of the kind referred to in (a) through (f); |
| (h) | all obligations of the kind referred to in (a) through (f) secured by (or which the holder of such obligation has an existing right, contingent or otherwise, to be secured by) any Encumbrance on property (including accounts and contract rights) owned by such Person, whether or not such Person has assumed or become liable for the payment of such obligation; and |
| (i) | all debt of any partnership, unlimited liability company or unincorporated joint venture in which such Person is a general partner, member or a joint venturer, respectively (unless such Debt is expressly made non-recourse to such Person). |
“Default” means any of the events specified in Section 12.01 which constitutes an Event of Default or which, upon the giving of notice, the lapse of time, or both, would, unless cured or waived, become an Event of Default.
“Defaulting Lender” means any Lender that:
| (a) | has failed to: (i) fund all or any part of its Advances within two Business Days of the date such funding is due, unless such Lender delivers written notice to the Agent and the Borrower stating that such failure is the result of such Lender's determination that one or more conditions precedent to funding has not been satisfied, and specifically identifies each such condition precedent and any applicable Default in such written notice; or (ii) pay to the Agent or any other Lender any other amount required to be paid by it hereunder within two Business Days of the date when due; |
| (b) | has delivered written notice to the Borrower or the Agent stating that it does not intend to comply with its funding obligations hereunder, or has made a public statement to that effect(unless such writing or public statement relates to such Lender's obligation to fund an Advance hereunder and states that such position is based on such Lender's determination that a condition precedent to funding cannot be satisfied, and specifically identifies such condition precedent and any applicable Default in such writing or public statement); |
| (c) | has failed, within three Business Days after its receipt of a written request from the Agent or the Borrower, to confirm in writing to the Agent and the Borrower that it will comply with its prospective funding obligations hereunder; provided that, if such Lender has become a Defaulting Lender under this clause (c) by failing to make such confirmation, upon receipt by the Agent and the Borrower of such written confirmation of such Lender, such Lender shall cease to be a Defaulting Lender under this clause (c); or |
| (d) | has, or has a direct or indirect parent company: (i) that has become the subject of a bankruptcy or insolvency proceeding under any Bankruptcy and Insolvency Laws; or (ii) for which an interim receiver, receiver, receiver manager, custodian, conservator, trustee, administrator, assignee for the benefit of creditors or similar Person charged with reorganization or liquidation of its business or assets has been appointed. |
Any determination by the Agent that a Lender is a Defaulting Lender under clauses (a) through (d) above shall be conclusive and binding absent manifest error, and such Lender shall be deemed to be a Defaulting Lender upon delivery of written notice of such determination to the Borrower and each other Lender.
“Distribution” means, with respect to any Person, (a) any declaration or payment, directly or indirectly, by such Person of any dividends on any Equity Interest of such Person, other than dividends payable in shares; (b) any payment, directly or indirectly by such Person, on account of, or for the purposes of the repurchase, redemption, retraction, retirement, purchase for cancellation or other acquisition of, any Equity Interests of such Person or of any options, warrants or other rights to acquire any of such Equity Interests; (c) any payment, directly or indirectly, by such Person of any other distribution or payments in respect of its Equity Interests, other than distributions of additional Equity Interests and the payment of cash in lieu of the issuance of fractional shares; or (d) any payment, directly or indirectly, by any such Person of any principal, interest, fees, expenses, premiums, or other amounts arising out of or in connection with any Debt.
“Elder Creek Property” means the Borrower's copper project located in the Humboldt and Lander counties, Nevada, consisting of consisting of 573 unpatented mineral claims, as further described in Schedule “A” hereto.
“Eligible Assignee” means any Person (other than a natural person, any Subsidiary or Affiliate of a Subsidiary, any Defaulting Lender or Affiliate of a Defaulting Lender or any Person who would be a Defaulting Lender upon becoming a Lender) in respect of which all consents required under Section 16.02 have been obtained.
“Encumbrance“ means:
| (a) | any security interest, mortgage, debenture, pledge, hypothecation, assignment (as security), deposit arrangement, lien (statutory or other), charge, consignment, deed of trust, encumbrance, royalty interest, adverse claim, defect of title, or other security agreement or trust; |
| (b) | the interest of a vendor or a lessor under any conditional sale agreement, capital or financial lease, or title retention agreement having substantially the same economic effect as any of the foregoing, relating to any Property; |
| (c) | any purchase option, call or similar right of a third party in respect of securities; |
| (d) | any netting or set-off arrangement (except one arising by operation of law in the ordinary course), defeasance arrangement or reciprocal fee arrangement; and |
and “Encumbrances” shall have corresponding meanings.
“Environmental Claim” means any Governmental Order, action, suit, demand, demand letter, claim, notice of violation or non-compliance, notice of liability or potential liability, investigation, proceeding, lien, fine, penalty, consent order or consent agreement by or from any Person alleging liability of whatever kind or nature (including liability or responsibility for the costs of enforcement proceedings, investigations, cleanup, governmental response, removal or remediation, natural resources damages, property damages, personal injuries, medical monitoring, penalties, contribution, indemnification and injunctive relief) arising out of, based on, or resulting from: (a) the presence, release of, or exposure to, any Hazardous Material; or (b) any actual or alleged non-compliance with any Environmental Law or term or condition of any permit, letter, clearance, consent, waiver, closure, exemption, decision or other action required under or issued, granted, given, authorized by or made pursuant to Environmental Law.
“Environmental Law” means any Applicable Law, and any Governmental Order or binding agreement with any Governmental Authority: (a) relating to pollution (or the cleanup thereof) or the protection of natural resources, endangered or threatened species, human health or safety, or the environment (including ambient air, soil, surface water or groundwater, or subsurface strata); or (b) concerning the presence of, exposure to, or the management, manufacture, use, containment, storage, recycling, reclamation, reuse, treatment, generation, discharge, transportation, processing, production, disposal or remediation of any Hazardous Material. Without limiting the foregoing, the term “Environmental Law” includes the following (including their respective regulations and any comparable provincial or territorial legislation): Canadian Environmental Protection Act, 1999 (Canada); Environmental Protection Act (Ontario); Occupational Health and Safety Act (Ontario); Ontario Water Resources Act (Ontario) and the Argentine Mining Code - Law No. 1919 and all relevant environmental federal laws, and provincial and municipal regulations (Argentina);
“Equity Interests” means any and all shares, interests, participations or other equivalents (however designated) of shares in a corporation or an exempted company, any and all equivalent ownership (or profit) interests in a Person (including partnership, membership or trust interests therein), securities convertible into or exchangeable for shares of capital stock of (or other ownership or profit interests in) such Person, and any and all warrants, rights or options to purchase any of the foregoing, whether voting or nonvoting, and whether or not such shares, warrants, options, rights or other interests are authorized or otherwise existing on any date of determination.
“Event of Default” is defined in Section 12.01.
“Excluded Taxes” means, with respect to the Agent, any Lender or any other recipient of any payment to be made by, or on account of any obligation of, the Borrower under any Loan Document:
| (a) | Taxes imposed on or measured by its net income or capital, and franchise taxes imposed on such recipient, by the jurisdiction (or any political subdivision thereof) under the laws of which (i) such recipient is organized, (ii) such recipient's principal office is located, or (iii) in the case of any Lender, in which its lending office is located; |
| (b) | any branch profits Taxes or any similar Tax imposed by any jurisdiction in which a Lender is located; and |
| (c) | in the case of a Foreign Lender (other than (x) an assignee pursuant to a request by the Borrower under Section 14.04, or (y) an assignee pursuant to an Assignment Agreement made when an Event of Default has occurred and is continuing), any withholding Tax (which includes any Tax that a Foreign Lender is required to pay pursuant to Part XIII of the Income Tax Act (Canada) or any successor provision thereto) that is required by Applicable Law on the date such Foreign Lender becomes a party hereto (or designates a new lending office) to be withheld or paid in respect of any amount payable hereunder or under any other Loan Document to such Foreign Lender or is attributable to such Foreign Lender's failure or inability (other than as a result of a Change in Law) to comply with Section 14.02(f) except to the extent that such Foreign Lender (or its assignor, if any) was entitled, at the time of designation of a new lending office (or assignment), to receive |
additional amounts from the Borrower with respect to such withholding Tax pursuant to Section 14.02.
“FATCA Withholding Tax” means any United States federal withholding tax imposed or collected pursuant to sections 1471 through 1474 of the U.S. Internal Revenue Code of 1986, as amended (the “Code”), any current or future regulations or official interpretations thereof, any agreement entered into pursuant to section 1471(b) of the Code, or any fiscal or regulatory legislation, rules or practices adopted pursuant to any intergovernmental agreement entered into in connection with the implementation of those sections of the Code.
“Fiscal Quarter” means each successive three-month period of the Borrower's fiscal year ending on: March 31st, June 30th, September 30th and December 31st.
“Fiscal Year” means the fiscal year-end of the Borrower ending on December 31st of each calendar year.
“Foreign Lender” means any Lender that is not organized under the laws of the jurisdiction in which the Borrower is resident for Tax purposes and that is not otherwise considered or deemed in respect of any amount payable to it hereunder or under any Loan Document to be resident for income tax or withholding tax purposes in the jurisdiction in which the Borrower is resident for tax purposes by application of the laws of that jurisdiction. For purposes of this definition, Canada and each Province and Territory thereof shall be deemed to constitute a single jurisdiction and the United States of America, each State thereof and the District of Columbia shall be deemed to constitute a single jurisdiction.
“GAAP” means generally accepted accounting principles which are in effect from time to time in Canada, applied in a consistent manner from period to period.
“Governmental Authority” means the government of Canada or of any other nation, or of any political subdivision thereof, whether state, provincial or local, and any agency, authority, instrumentality, regulatory body, court, central bank or other entity exercising executive, legislative, judicial, taxing, regulatory or administrative powers or functions of or pertaining to government, including any supra-national bodies such as the European Union or the European Central Bank and including a Minister of the Crown, Superintendent of Financial Institutions or other comparable authority or agency.
“Governmental Order” means any order, writ, judgment, injunction, decree, stipulation, determination or award made, issued, proclaimed, entered by or with any Governmental Authority.
“Guarantee Obligation” as to any Person, means any: (a) obligation, contingent or otherwise, of such Person guaranteeing or having the effect of guaranteeing any Debt or other obligation payable or performable by another Person (the “primary obligor”) in any manner, whether directly or indirectly, and including any obligation of such Person, direct or indirect, (i) to purchase or pay (or advance or supply funds for the purchase or payment of) such Debt or other obligation, (ii) to purchase or lease property, securities or services for the purpose of assuring the obligee in respect of such Debt or other obligation of the payment or performance of such Debt or other obligation,
(iii) to maintain working capital, equity capital, net worth or solvency or liquidity or any level of income or cash flow of the primary obligor so as to enable the primary obligor to pay such Debt or other obligation, or (iv) entered into for the purpose of assuring in any other manner the obligee in respect of such Debt or other obligation of the payment or performance thereof or to protect such obligee against loss in respect thereof (in whole or in part); or (b) Encumbrance on any assets of such Person securing any Debt or other obligation of any other Person, whether or not such Debt or other obligation is assumed by such Person (or any right, contingent or otherwise, of any holder of such Debt to obtain any such Encumbrance). The amount of any Guarantee Obligation shall be deemed to be an amount equal to the stated or determinable amount of the related primary obligation, or portion thereof, in respect of which such Guarantee Obligation is made or, if not stated or determinable, the maximum reasonably anticipated liability in respect thereof as determined by the guaranteeing Person in good faith.
“Hazardous Materials” means: (a) any gasoline, petroleum or petroleum products or by-products, radioactive materials, friable asbestos or asbestos-containing materials, urea-formaldehyde insulation, polychlorinated biphenyls and radon gas; and (b) any other chemicals, materials or substances designated, classified or regulated as hazardous or toxic or as a pollutant or contaminant under any Environmental Law.
“Indemnified Taxes” means: (a) Taxes, other than Excluded Taxes, imposed on or with respect to any payment made by, or on account of, the Borrower under any Loan Document; and (b) to the extent not otherwise described in (a), any and all present or future stamp, court, recording, filing, intangible, documentary or similar Taxes or any other excise or property Taxes, charges or similar levies arising from any payment made hereunder or under any other Loan Document or from the execution, delivery or enforcement or registration of, or performance under, or from the receipt or perfection of a security interest under or otherwise with respect to this Agreement or any other Loan Document (other than Excluded Taxes imposed with respect to an assignment).
“Investment” means any direct or indirect (a) acquisition of any Equity Interests, bonds, notes, debentures or other debt securities of a Person by any other Person; (b) advance, loan, extension of credit (by way of guarantee or otherwise) or capital contribution to any Person by another Person; and (c) Acquisition.
“Lenders” means each of the Persons listed on Exhibit “A” and other lenders that from time to time become Lenders in accordance with ARTICLE XVI or a Loan Increase Agreement, and “Lender” means any one of the Lenders.
“Loan Documents” means, collectively, this Agreement, guarantees, pledges, and security documents, including the Security Documents, all Warrants and all other agreements, documents, certificates and instruments executed and delivered to the Agent and the Lenders, or any of them, in connection with this Agreement and the obligations created hereunder.
“Loan Facility” means the non-revolving term loan facility established in Section 2.01. “Loan Increase Agreement” is defined in Section 2.01.
“Loan Party” means the Borrower, Los Azules Mining Inc., and San Juan Copper Inc.
“Los Azules Property” means the Borrower's porphyry copper project located in the Province of San Juan, Argentina, consisting of 22 mineral claims, as described in Schedule “A” hereto.
“Material Adverse Effect” means any matter, event or circumstance that, individually or in the aggregate could, in the opinion of the Agent, acting reasonably, be expected to have a material adverse effect on: (a) the business, assets, properties, liabilities (actual or contingent), operations, or condition (financial or otherwise) of the Borrower, individually, or the Borrower and its Subsidiaries taken as a whole; (b) the validity or enforceability of this Agreement or any Loan Document; (c) the perfection or priority of any Encumbrance granted by the Borrower or any other Person pursuant to the Security Documents or any other Loan Document; (d) the rights or remedies of the Agent and the Lenders under this Agreement or any other Loan Document; or (e) the ability of the Borrower or any Subsidiary to perform any of its material obligations under this Agreement or any other Loan Document to which it is a party.
“Material Contract” means, with respect to any Person, each contract to which such Person is a party and which:
| (a) | is listed on Schedule “B”; |
| (b) | involves aggregate remaining consideration payable by or to such Person in excess of $1,000,000 annually or $1,000,000 over the life of the contract; |
| (c) | if terminated, would impair the ability of such Person to carry on business in the ordinary course or would have a Material Adverse Effect; or |
| (d) | is otherwise material to the business, condition (financial or otherwise), operations, performance, properties or prospects of such Person. |
“Maturity Date” means the date of the fourth anniversary of the Closing Date (the “Maturity Date”).
“McEwen Advance” means the Advance made by McEwen Inc. in the amount of $13,552,000.
“Mining Assets” means any fee lands, mining claims, mining concessions, leases, licenses or other like rights, all permits, government consents, concessions, water rights, easements, surface rights, subsurface rights, rights of way, property rights, temporary occupation agreements and other, including, but not limited to the Los Azules Project and the Elder Creek Project.
“Net Cash Proceeds” means in connection with any issuance or sale of Equity Interests or any incurrence of Debt, the cash proceeds received from such issuance or incurrence, net of legal fees, investment banking fees, accountants' fees, underwriting discounts and commissions, and other customary fees and expenses actually incurred in connection therewith.
“Obligations” means, collectively and at any time and from time to time, all of the indebtedness, liability and obligations (present or future, absolute or contingent, matured or not) of the Borrower to the Agent and the Lenders under, pursuant or relating to the Loan Facility, this Agreement or the Loan Documents and whether the same are from time to time reduced and thereafter increased or entirely extinguished and thereafter incurred again and including all principal, interest, fees, legal and other costs, charges and expenses, and other amounts payable by the Borrower under this Agreement.
“Other Taxes” means all present or future stamp or documentary taxes or any other excise or property taxes, charges or similar levies arising from any payment made hereunder or under any other Loan Document or from the execution, delivery or enforcement of, or otherwise with respect to, this Agreement or any other Loan Document.
“Permits” means permits, franchises, licences, qualifications, authorizations, consents, certificates, registrations, exemptions, waivers, filings, grants, notifications, privileges, rights, orders, judgments, rulings, directives and other approvals obtained from, or required by, a Governmental Authority.
“Permitted Encumbrances” means:
| (a) | Encumbrances created pursuant to, or arising under, any Loan Document; |
| (b) | Encumbrances imposed by law for Taxes, assessments or governmental charges or levies not yet due or which are being contested in good faith and by appropriate proceedings diligently conducted if adequate reserves with respect thereto are maintained in accordance with GAAP on the books of the applicable Person; |
| (c) | construction, repair and storage liens and other similar Encumbrances imposed by law, arising in the ordinary course of business and securing obligations that are not overdue by more than ninety (90) days or that are being contested in good faith and by appropriate proceedings diligently conducted; |
| (d) | Encumbrances arising in connection with workers' compensation, employment insurance, pension and employment or other social security laws or regulations in respect of amounts which are not due or delinquent; |
| (e) | pledges and deposits made in good faith and in the ordinary course of business (i) in connection with offers, tenders, leases or contracts (excluding, however, contracts for the borrowing of money or the repayment of money borrowed), or (ii) to secure surety or appeal bonds or the costs of litigation when required by law, not to exceed $10,000,000 at any one time outstanding. |
“Person” means a natural person, corporation, company, body corporate, partnership, joint venture, Governmental Authority, unincorporated organization, trust, association, estate or other entity.
“Property” means, with respect to any Person, any or all of its present and future undertaking, property and assets, whether tangible or intangible, real or personal and includes Contractual Obligations, rights under Permits and any mining rights, mining leases, mineral leases and any other mining or mineral rights, claims or interest whether personal property, real property or otherwise including, for avoidance of doubt, any personal property, real property or otherwise relating to the Mining Assets.
“Register” is defined in Section 16.04.
“Related Parties” with respect to any Person, means such Person's Affiliates and the directors, officers, employees, partners, agents, trustees, administrators, managers, advisors and representatives of such Person and its Affiliates.
“Required Lenders” means, at any point in time, those Lenders who are then holding, in the aggregate, a minimum of 66⅔% of the outstanding Advances; provided that, should there be two Lenders, “Required Lenders” means both of them, and any Lender that becomes an assignee of the foregoing in accordance with the terms of this Agreement. The portion of the Advances held by a Defaulting Lender shall be excluded for the purposes of making a determination of Required Lenders.
“Sanctioned Person” means any Person that is: (a) designated under, listed on, or owned or controlled by a Person designated under or listed on, or acting on behalf of a Person designated under or listed on, any list of Persons who are subject to Sanctions under Applicable Law that is binding on the Agent, any Lender, the Borrower or any of its Subsidiaries; (b) located in, incorporated under the laws of, or owned or controlled (directly or indirectly) by, or acting on behalf of a Person located in or organized under the laws of a country or territory that is the target of country-wide or territory-wide Sanctions; or (c) with whom the Agent or any Lender would not be permitted to make a loan, continue to make a loan or provide financial accommodation to pursuant to any Sanctions.
“Sanctions” means any Applicable Law governing transactions in controlled goods or technologies or dealings with countries, entities, organizations, or individuals subject to economic sanctions and similar measures, including, without limitation, the Special Economic Measures Act (Canada), the United Nations Act (Canada), the Justice for Victims of Corrupt Foreign Officials Act (Canada), the Freezing Assets of Corrupt Foreign Officials Act (Canada), Part II.1 of the Criminal Code (Canada), and the Export and Import Permits Act (Canada), and any regulations thereunder.
“Sanctions Authority” means any of: (a) the government of Canada; (b) the government of the United States of America; (c) the United Nations; (d) the European Union; (e) the United Kingdom; or (f) the respective departments and agencies of any of the foregoing, including Foreign Affairs, Trade and Development Canada, Public Safety Canada, the Office of Foreign Assets Control of the U.S. Department of the Treasury, and the U.S. Department of State.
“Security Documents” is defined in Section 5.01 and “Security Document” means any one of the Security Documents, as applicable.
“Subsidiary” means, with respect to a Person, any other Person if at such time the first mentioned Person: (a) owns, directly or indirectly, Equity Interests in such other Person having, in the aggregate, the voting power to elect a majority of the board of directors or persons performing similar functions for such Person; or (b) has, directly or indirectly, through the operation of an agreement or otherwise, the ability to elect, or cause to be elected, a majority of the board of directors or persons performing similar functions for such Person or otherwise exercise control over the management and policies of such other Person.
Unless otherwise qualified, all references to a “Subsidiary” or to “Subsidiaries” in this Agreement shall refer to a direct or indirect Subsidiary or Subsidiaries of the Borrower. Unless otherwise qualified, all references to “Subsidiaries” in this Agreement shall refer to all direct and indirect Subsidiaries of the Borrower and “Subsidiary” shall have a corresponding meaning.
“Super Majority” means, at any point in time, those Lenders who are then holding, in the aggregate, a minimum of 90% of the outstanding Advances; provided that, should there be two Lenders, “Super Majority” means both of them, and any Lender that becomes an assignee of the foregoing in accordance with the terms of this Agreement. The portion of the Advances held by a Defaulting Lender shall be excluded for the purposes of making a determination of a Super Majority.
“Taxes” means any and all present or future income, stamp or other taxes, levies, imposts, duties, deductions, charges, fees or withholdings imposed, levied, withheld or assessed by any Governmental Authority, together with any interest, additions to tax or penalties imposed thereon and with respect thereto.
“US Dollars” and “USD” mean the lawful currency of the United States of America. Any reference to “dollars” or “$” shall be deemed to be a reference to USD unless otherwise indicated.
“Warrants” means transferable warrants to purchase Common Shares, issued by the Borrower to a Lender, providing the Lender with a right to acquire, in respect of each US$1,000 of Advance made by such Lender, 15 common shares of the Borrower at a per common share price of US$40 for a period of 5 years from the date of issuance, subject to an accelerated expiry in certain circumstances, and standard adjustments and anti-dilution provisions, all as provided for in the form of Warrant attached hereto Schedule “E”.
Section 1.02 Interpretation.
With reference to this Agreement and each other Loan Document, unless otherwise specified herein or in such other Loan Document:
| (a) | The definitions of terms in this Agreement and any other Loan Document shall apply equally to the singular and plural forms of the terms defined. Whenever the context may require, any pronoun shall include the corresponding masculine, feminine and neuter forms. The words “include,” “includes” and “including” shall be deemed to be followed by the phrase “without limitation.” The word “will” shall be construed to have the same meaning and effect as the word “shall”. The phrases “the aggregate of”, “the total of”, “the sum of” and phrases of similar meaning shall mean “the aggregate (or total or sum), without duplication, of”. |
| (i) | to any agreement, instrument or other document (including any reference to this Agreement) shall be construed as referring to such agreement, instrument or other document as from time to time amended, supplemented, restated or otherwise modified (subject to any restrictions on such amendments, supplements, restatements or modifications set forth herein or in any other Loan Document); |
| (ii) | to any Person shall be construed to include such Person's successors and permitted assigns; |
| (iii) | to the words “herein,” “hereof” and “hereunder,” and words of similar import when used in any Loan Document, shall be construed to refer to such Loan Document in its entirety and not to any particular provision thereof; |
| (iv) | to Articles, Sections and Schedules shall be construed to refer to Articles and Sections of, and Schedules to, the Loan Document in which such references appear; |
| (v) | to any law shall include all statutory and regulatory provisions consolidating, amending, replacing or interpreting such law and any reference to any law or regulation shall, unless otherwise specified, refer to such law or regulation as amended, modified or supplemented from time to time; and |
| (vi) | the words “asset” and “property” shall be construed to have the same meaning and effect and to refer to any and all tangible and intangible assets and properties, including cash, securities, accounts and contract rights. |
| (c) | The division of a Loan Document into articles and sections, and the insertion of headings and a table of contents are for reference only and shall not affect the interpretation of the Loan Document. |
| (d) | In the computation of periods of time from a specified date to a later specified date, the word “from” means “from and including;” the words “to” and “until” each mean “to but excluding;” and the word “through” means “to and including”. |
Section 1.03 Construction.
This Agreement and the other Loan Documents have been negotiated by each of the parties hereto and thereto with the benefit of legal representation, and any rule of construction to the effect that any ambiguities are to be resolved against the drafting party shall not apply to the construction or interpretation of the Loan Documents.
Section 1.04 Currency.
Unless otherwise specified in a Loan Document, all references to dollar amounts (without further description) shall mean US Dollars.
Section 1.05 Knowledge.
References in this Agreement and any other Loan Document to the knowledge of any party means to the best of the knowledge, information and belief of such party after reviewing all relevant records and making due inquiries regarding the subject matter.
Section 1.06 Business Days.
If any provision of this Agreement or any other Loan Document requires a party to take an action on or before a date that is not a Business Day, the action is valid if taken by the relevant party on or before the next Business Day; except that, in the case of a payment, if the next Business Day is in a different calendar month than the date specified for the payment, the payment shall be due on the preceding Business Day.
Section 1.07 Schedules.
The Schedules annexed hereto are incorporated by reference and deemed to be a part of this Agreement.
ARTICLE II
The Loan Facility Section 2.01 Loan Facility.
Section 2.01 Loan Facility.
Subject to the terms and conditions of this Agreement, the Lenders hereby establish severally (not jointly and not jointly and severally) a non-revolving term loan facility (the “Loan Facility”) in favour of the Borrower in the amount of $59,552,000 subject to increase from time to time by approval of the Required Lenders and the execution of a loan facility increase agreement in substantially the form set out in Exhibit “B” (a “Loan Increase Agreement”), provided the total amount of the Advances made under the Loan Facility shall not at any time exceed $240,000,000. The obligation of each Lender to make Advances under the Loan Facility shall be limited to its Commitment.
Section 2.02 Purpose and Use of the Loan Facility.
The proceeds of the Loan Facility shall be used by the Borrower for general corporate purposes, working capital, costs associated with a going public transaction, and to advance the Los Azules Project toward a Final Investment Decision (FID), including without limitation, (i) completion of basic, detailed, and vendor engineering; (ii) site infrastructure improvements, including the expansion of the construction camps, pioneer road construction, and access road upgrades; (iii) execution of drilling programs comprising geotechnical, hydrological, condemnation, and certain exploration drilling; (iv) deposits and progress payments for critical long-lead capital equipment (including transformers); and (v) additional site investigation activities.
Section 2.03 Reborrowing.
The Loan Facility is a non-revolving loan facility and accordingly no principal amounts repaid under the Loan Facility (whether scheduled, voluntary or mandatory) may be reborrowed.
Section 2.04 Warrants.
Upon the making of an Advance, the Lender making such Advance shall receive Warrants in respect thereof.
ARTICLE III
Term and Repayment Section 3.01 Mandatory Repayment.
Section 3.01 Mandatory Repayment.
The Borrower shall repay or pay, as the case may be, all Obligations under or in connection with the Loan Facility in full on the Maturity Date, including all Advances under the Loan Facility, accrued interest, fees and other amounts then unpaid with respect to such Advances, and the Loan Facility and the Commitments thereunder shall be automatically terminated on the Maturity Date.
Section 3.02 Mandatory Prepayments.
If (i) any Debt (other than an Advance) is incurred by the Borrower or any of its Subsidiaries; or (ii) any Equity Interests are issued by the Borrower or any of its Subsidiaries to any Person other than another Loan Party or an Affiliate thereof other than a Lender, then, in each case, the Borrower shall apply 100% of the Net Cash Proceeds received from such incurrence or issuance to repay the outstanding principal amount of the McEwen Advance together with all interest accrued and owing thereon within 10 Business Days after the Borrower or any of its Subsidiaries, as applicable, receives such Net Cash Proceeds.
Section 3.03 Voluntary Prepayment.
The Borrower may at any time and from time to time repay to the Agent, for the benefit of the Lenders, the whole or any part of the outstanding Advances owing by it, together with accrued interest thereon to the date of prepayment; provided that:
| (a) | the Borrower shall deliver irrevocable notice to the Agent not later than 11:00 a.m. (Toronto time) three (3) Business Days prior to the proposed prepayment date; and |
| (b) | the proposed prepayment date is a Business Day; and |
| (c) | the proposed prepayment includes an additional premium payment equal to 5% of the principal amount of the Advances (other than the McEwen Advance) being repaid, it being acknowledged that such premium payment is a genuine pre-estimate of damages sustained by the Lenders in respect early repayment of the Advances, and not a penalty. |
Voluntary prepayments by the Borrower of the Advances under the Loan Facility shall permanently reduce the Loan Facility, and such amounts cannot be re-borrowed.
Section 3.04 Application of Prepayments.
Except in respect of amounts prepaid pursuant to Section 3.02 or paid following an Event of Default, all amounts of principal repaid hereunder shall be applied to the repayment of the Advances ratably among the Lenders in proportion to the amounts owing to each Lender at such time over the total amount owing to all Lenders at such time. Each prepayment of Advances under this Agreement shall be accompanied by accrued interest to the date of such prepayment on the amount prepaid. McEwen Inc. shall not be entitled to receive the 5% premium referenced in Section 3.03 in connection with the repayment of the McEwen Advance, and all such premium payments shall be paid ratably to the Lenders on account of the other Advances.
ARTICLE IV
Interest and Other Amounts Payable Section 4.01 Interest on Advance.
Section 4.01 Interest on Advance.
The Borrower shall pay interest on the Advance, in US Dollars, at the rate of 12% per annum.
Section 4.02 Calculation and Payment of Interest.
| (a) | Interest on the Advance shall be calculated and paid monthly in arrears on the last Business Day of each calendar month. |
| (b) | All interest payments to be made under this Agreement shall be paid without allowance or deduction for deemed re-investment or otherwise, both before and after maturity and before and after default and/or judgment, if any, until payment, and interest shall accrue on overdue interest. |
| (c) | All computations of interest or other amounts “per annum” for the Advance shall be made on the basis of a year of 365 or 366 days, as the case may be, using the actual number of days elapsed, and the nominal rate method of calculation, and will not be calculated using the effective rate method of calculation or on any other basis that gives effect to the principle of deemed re-investment of interest. |
| (d) | For the purposes of the Interest Act (Canada) and disclosure under such Act whenever any interest to |
be paid under this Agreement is to be calculated on the basis of any period of time that is less than a calendar year (a “deemed year”), such rate of interest shall be expressed as a yearly rate by multiplying such rate of interest for the deemed year by the actual number of days in the calendar year in which the rate is to be ascertained and dividing it by the number of days in the deemed year.
| (e) | Each determination by the Agent of an interest rate or other amount payable hereunder shall be conclusive and binding for all purposes, absent manifest mathematical error in calculating such amount. |
Section 4.03 Interest on Overdue Amounts.
Notwithstanding any other provision hereof, if all or any portion of any amount due hereunder (including any amounts of principal or interest or other amount payable) is not paid when due, whether at stated maturity, by acceleration or otherwise, the Borrower shall pay interest on such overdue amount (including interest on interest) if, and to the fullest extent, permitted by Applicable Law, from the date that such amount is due until the date that such amount is paid in full (but excluding the date of such payment if the payment is made before 1:00 p.m. (Toronto time) on the date of such payment), at a rate of 14% per annum. Interest under this Section 4.03 shall be calculated daily, compounded on the last Business Day of each calendar month, and payable on demand, both before and after maturity, default and judgment.
Section 4.04 Maximum Interest.
In the event that any provision of this Agreement or any other Loan Document would oblige the Borrower to make any payment of interest or any other payment which is construed by a court of competent jurisdiction to be interest in an amount or calculated at a rate which would be prohibited by Applicable Law or would result in a receipt by the Agent or any Lender of interest at a criminal rate (as such terms are construed under the Criminal Code (Canada)), then notwithstanding such provision, such amount or rate shall be deemed to have been adjusted nunc pro tunc to the maximum amount or rate of interest, as the case may be, as would not be so prohibited by Applicable Law or so result in a receipt by the Agent or applicable Lender of interest at a criminal rate, such adjustment to be effected, to the extent necessary as follows:
| (b) | Thereafter, by reducing commissions, premiums or other amounts required to be paid to the Lender which would constitute interest for the purposes of Section 347 of the Criminal Code (Canada). |
If, notwithstanding the provisions of this Section 4.04 and after giving effect to all adjustments contemplated thereby, the Agent or any Lender shall have received an amount in excess of the maximum permitted by Applicable Law, then such excess shall be applied to the reduction of the principal balance of the outstanding principal of the applicable Advance and not to the payment of interest, or if such excessive interest exceeds such principal balance, such excess shall be refunded to the Borrower.
ARTICLE V
Security
Section 5.01 Security.
As general and continuing security for the payment and performance of the Obligations under this Agreement, howsoever arising or incurred, the following security shall be granted to the Agent for the benefit of the Lenders, in each case in form and substance satisfactory to the Agent:
| (a) | a general security agreement governed by the laws of Alberta executed by the Borrower in favour of the Agent for the benefit of the Lenders, creating a first priority security interest in all of the present and after-acquired personal property, assets and undertakings of the Borrower; |
| (b) | a share mortgage governed by the laws of the Cayman Islands executed by the Borrower in favour of the Agent for the benefit of the Lenders, creating a first priority equitable mortgage and security interest in all of its right, title and interest in all Equity Interests of International Copper Mining Inc.; |
| (c) | a share pledge agreement governed by the laws of Argentina executed by the Borrower in favour of the Agent for the benefit of the Lenders, creating a first priority pledge and security interest in all of its right, title and interest in all Equity Interests of Andes Corporación Minera S.A.; |
| (d) | a guarantee of the Obligations provided by each of Los Azules Mining Inc. and San Juan Copper Inc. in favour of the Agent for the benefit of the Lenders; and |
| (e) | share pledge agreements governed by the laws of Argentina executed by Los Azules Mining Inc. and San Juan Copper Inc in favour of the Agent, creating a first priority pledge and security interest in all of their respective right, title and interest in all Equity Interests of Andes Corporación Minera S.A. |
In this Agreement, all security held by the Agent for the benefit of the Lenders securing (or intended to secure) the Obligations as the same may be amended, amended and restated, supplemented or otherwise modified from time to time, are collectively referred to as the “Security Documents”.
Section 5.02 Registration.
Upon the request of the Agent, the Borrower shall, at its own expense, register, file or record, or cause to be registered, filed or recorded, the Security Documents, any amendments or notice thereof in all offices and jurisdictions where such registration, filing, notice or recording is necessary or, in the Agent’s reasonable determination, advisable or to the advantage of the Agent and the Lenders, to create, perfect or preserve the Security Documents granted by the Borrower and the interest of the Agent and the Lenders in the collateral granted thereunder and to renew and maintain such registrations, filings and recordings from time to time to keep them in full force and effect.
Section 5.03 After-Acquired Property and Further Assurances.
| (a) | Each Loan Party shall, within 10 days of acquiring Property which, if owned by such Loan Party on the date of this Agreement would be subject to the Security Documents, for which the Lenders do not have a perfected security interest, execute and deliver to the Agent for the benefit of the Lenders all such supplements or amendments to the Security Documents and all such other documents as the Agent deems necessary or advisable to provide the Lenders with a perfected security interest in any such Property, subject only to Permitted Encumbrances. |
| (b) | Each Loan Party shall from time to time at the request of the Agent, provide the Agent with such assistance, do such acts and execute and deliver all such further deeds or other instruments of conveyance, assignment, transfer, mortgage, pledge or charge of any of its Property intended to be subject to the Security Documents, as are reasonably required by the Agent. |
ARTICLE VI
Conditions Precedent
Section 6.01 Conditions Precedent to Effectiveness of Agreement.
This Agreement shall become effective at such time as the following conditions precedent shall have been satisfied (or waived by the Agent on the instructions to the Required Lenders):
| (a) | The Agent shall have received, in each case duly executed and delivered by the Borrower and in form and substance satisfactory to the Agent: |
| (i) | this Agreement; |
| (ii) | all other Loan Documents; and |
| (iii) | Warrants for each Lender. |
| (b) | All governmental, regulatory, shareholder and third party consents and approvals necessary or desirable in connection with the entering into of this Agreement and transactions contemplated hereby shall have been obtained and be in full force and effect. |
| (c) | The Agent shall have received results of recent searches in each of the jurisdictions where the Loan Parties and their assets that are subject to the Encumbrances granted in favour of the Agent are located, and such searches shall have confirmed the first-ranking priority of the Encumbrances in favour of the Agent for the benefit of the Lenders and reveal no Encumbrances on any of the assets of the Borrower, except for Permitted Encumbrances. |
| (d) | The Agent shall have received, in form and substance satisfactory to it, a certificate of each of the Loan Parties certified by an officer of such entity, dated the Closing Date, including: |
| (i) | true and complete copies of the organizational documents of each of each Loan Party and all amendments thereto; |
| (ii) | resolutions of the board of directors and shareholders of each of the Loan Parties, as applicable, authorizing the execution, delivery and performance of its obligations under each Loan Document delivered herewith to which it is or is to be a party and the transactions contemplated by this Agreement, including, but not limited to, the pledge or mortgage (as applicable) of shares of International Copper Mining Inc. and Andes Corporación Minera S.A. to the Agent and any subsequent disposition thereof by the Agent in accordance with the terms of any Security Document; |
| (iii) | incumbency of the officers of each Loan Party authorized to sign each Loan Document delivered in connection herewith to which it is or is to be a party and other documents to be delivered hereunder and thereunder, including each such officer's name, titles and specimen signature; |
| (iv) | a true, complete and current record of all registered holders of the shares or securities issued by International Copper Mining Inc. and Andes Corporación Minera S.A. and the number and class of shares or security held by each such holder; and |
| (v) | such other matters as the Lender or its counsel may reasonably require. |
| (e) | The Agent shall have received a certificate of good standing for each Loan Party from its jurisdiction of incorporation, dated on or about the Closing Date. |
| (f) | The Agent shall have received a legal opinion addressed to the Agent and the Lenders from counsel to the Loan Parties covering all such matters as the Agent may reasonably require. |
| (g) | The Agent shall have received the certificates representing the Equity Interests pledged to the Agent for the benefit of the Lenders pursuant to the Security Documents, together with a share transfer power of attorney for each such certificate executed in blank by a duly authorized officer of the pledgor thereof. |
| (h) | The Agent shall have received satisfactory evidence that all registrations, filings, recordings and notices necessary or desirable (as determined by the Agent and its own counsel, acting reasonably) in connection with the Security Documents have been properly made, filed or completed, including all such registrations, filings, recordings and notices required to create a perfected first priority |
security interest in favour of the Agent for the benefit of the Lenders in the collateral described therein prior and superior in right to any other Person (other than with respect to Permitted Encumbrances).
| (i) | The Agent shall have received such additional evidence, information, documents, instruments, waivers or undertakings as the Agent may reasonably require to conclude the transactions contemplated by this Agreement. |
Section 6.02 Waiver of Conditions Precedent.
The conditions set forth in Section 6.01 are included for the sole benefit of the Lenders and may be waived by the Agent in whole or in part (with or without terms or conditions) in respect of the effectiveness of this Agreement.
ARTICLE VII
Details Regarding Advance and Payments
Section 7.01 Evidence of Indebtedness.
The Agent will open and maintain books of account evidencing the Obligations and each Lender shall maintain records concerning their Advances. The information entered in the foregoing accounts by the Agent shall constitute prima facie evidence (absent manifest error) of the obligations of the Borrower to the Agent and the Lenders hereunder with respect to the Advances and all other Obligations; provided that, no failure of the Agent or any Lender to correctly record any detail relating to an Advance shall adversely affect the obligation of the Borrower to pay any of the Obligations in accordance with this Agreement. The Agent shall provide copies of such accounts to the Borrower upon the Borrower's reasonable request.
Section 7.02 Payments by the Borrower.
| (a) | Except when specifically provided otherwise in this Agreement, all payments of principal, interest and all other amounts to be made by the Borrower under this Agreement shall be paid to the Agent for the ratable account of the Lenders entitled thereto in the currency in which it is due for value at or before 1:00 p.m. (Toronto time) on the day such payment is due at the Agent's Office. If any such day is not a Business Day, such amount shall be deemed for purposes of this Agreement to be due on the next Business Day following such day, and any such extension of time shall be included in the computation of any interest or other amounts payable under this Agreement. |
| (b) | Except as otherwise provided in this Agreement, the Agent shall distribute: |
| (i) | payments on account of interest in accordance with each Lender's Applicable Percentage of the Loan Facility; |
| (ii) | repayments of principal in accordance with each Lender's Applicable Percentage of the Loan Facility; and |
| (iii) | all other payments received by the Agent, including amounts received on account of the realization of any security for the Obligations held by the Agent, in accordance with each Lender's Applicable Percentage of the Loan Facility, except that no Lender shall receive proceeds of realization in excess of the Obligations owing to it. |
Section 7.03 Payments by the Agent.
The provisions of this Section 7.03 shall apply to any payment made by the Agent to the Lenders under this Agreement:
| (a) | The Agent shall have no obligation to make any payment to any Lender until a corresponding amount in respect of that payment has been received by the Agent from the Borrower; if the Agent receives any amount less than the full amount of any payment to be made by the Borrower under this Agreement, the Agent shall have no obligation to remit any amounts to the Lenders in excess of the amount actually received by the Agent. |
| (b) | If any Lender advances more or less than its Applicable Percentage of the Loan Facility, then such Lender's entitlement to a share of any payment on account of the Advance shall be increased or decreased, as the case may be, in proportion to the amount actually advanced by such Lender. |
| (c) | The Agent, acting reasonably and in good faith after consultation with the Lenders in the case of any dispute, shall determine in all cases the amount of all payments to which each Lender is entitled and that determination shall be binding and conclusive, absent manifest error. |
| (d) | On request, the Agent shall deliver to the Lenders a statement detailing any of the payments made by it to the Lenders under this Agreement. |
| (e) | Unless the Borrower provides notice to the Agent, in writing, not less than one Business Day before the date on which any payment hereunder is due to the Agent for the account of the Lenders, the Agent may assume that the Borrower will be making its payment as required hereunder and may, in reliance upon such assumption, distribute such amount to the Lenders. If the Agent does distribute funds to the Lenders in reliance on such assumption and the Borrower does not, in fact, make such payment to the Agent on the relevant date, then each Lender severally agrees to repay to the Agent, immediately on demand, the amount distributed to the Lender, together with interest on such amount at a rate per annum determined by the Agent in accordance with prevailing banking industry rules on interbank settlements. |
ARTICLE VIII
Representations and Warranties
To induce the Agent and the Lenders to enter into this Agreement, the Borrower, for and on behalf of itself and on behalf of each of its Subsidiaries hereby represents and warrants to the Agent and the Lenders:
Section 8.01 Incorporation and Existence.
Each of the Borrower and its Subsidiaries
| (a) | is incorporated, existing and in good standing under the laws of its jurisdiction of incorporation; and |
| (b) | is qualified to carry on business, and is in good standing, in each jurisdiction in which it owns property or assets or carries on business. |
Section 8.02 Power and Capacity; Authorization, Execution and Delivery; Enforceability.
| (a) | Each of the Borrower and its Subsidiaries has the power and capacity, and the legal right, to own or lease and operate its property, and to carry on its business as now conducted and as proposed to be conducted ad has the power and capacity to enter into, execute, deliver and perform the Loan Documents to which it is a party and, in the case of the Borrower, to obtain the Loan Facility and the Advances hereunder. |
| (b) | Each of the Loan Parties has taken all necessary action to authorize the entry into, execution, delivery and performance of the Loan Documents to which it is a party and, in the case of the Borrower, to authorize borrowing on the terms and conditions contained herein. No consent or authorization of, filing with, notice to or other act by, or in respect of, any Governmental Authority or any other Person is required in connection with the extensions of credit hereunder or with the entry into, execution, delivery, performance, validity or enforceability of this Agreement or any of the Loan Documents. |
| (c) | The Loan Documents have been duly executed and delivered by the Borrower, and this Agreement constitutes, and each other Loan Document when delivered will constitute, a valid and legally binding obligation of each party thereto, enforceable against the Borrower in accordance with its terms, except as enforceability may be limited by applicable bankruptcy, insolvency, reorganization, arrangement, moratorium or similar laws affecting the enforcement of creditors' rights generally and by general equitable principles (whether enforcement is sought by proceedings in equity or at law). |
Section 8.03 No Breach of Constating Documents, Laws or Contracts.
The execution, delivery and performance of this Agreement and the other Loan Documents delivered in connection herewith, obtaining the Advances hereunder and the use of the proceeds thereof do not and will not conflict with, contravene, violate or result in a breach of:
| (a) | any Loan Party’s articles, by-laws, organizational or other constating documents or any resolutions of directors, shareholders, partners or similar governing body, as applicable, or the provisions of any shareholders, partnership agreement or declaration of trust; |
| (b) | any Applicable Law; or |
| (c) | any Contractual Obligation of Loan Party. |
Section 8.04 Financial Statements.
| (a) | The audited consolidated balance sheets of the Borrower as at the end of the most recently completed Fiscal Year, and the related consolidated statements of operations and of cash flows for the Fiscal Year ended on such date, are complete and present fairly the assets, liabilities (whether accrued, absolute, contingent or otherwise) and consolidated financial condition of the Borrower and its Subsidiaries as at such date, and the revenues, expenses, consolidated results of their operations and their consolidated cash flows for the Fiscal Year then ended, in accordance with GAAP. |
| (b) | The most recently prepared condensed consolidated balance sheets of the Borrower for a three month period and the related consolidated statements of operations and of cash flows for the same period, are complete and present fairly the assets, liabilities (whether accrued, absolute, contingent or otherwise) and consolidated financial condition of the Borrower and its Subsidiaries as at such date, and the revenues, expenses, consolidated results of their operations and their consolidated cash flows for the three months then ended, in accordance with GAAP. |
Section 8.05 No Material Adverse Effect.
Since the date of the financial statements delivered in Section 8.04(a), no development or event has occurred that has had or could reasonably be expected to have a Material Adverse Effect.
Section 8.06 No Litigation.
No action, suit, litigation, investigation or proceeding of or before any Governmental Authority is pending or threatened by or against the Borrower or any of its Subsidiaries or against any of its Property.
Section 8.07 No Default.
No Default or Event of Default has occurred and is continuing and no default has occurred and is continuing under or with respect to any Contractual Obligation of the Borrower or any of its Subsidiaries that could reasonably be expected to have a Material Adverse Effect.
Section 8.08 Ownership of Property.
Each of the Loan Parties:
| (a) | has good and marketable title to, or valid leasehold interests in, its Property, free and clear of Encumbrances other than Permitted Encumbrances; and |
| (b) | has kept and maintained its Property in good operating condition and repair, paid its corresponding governmental duties and has made all necessary replacement thereof and renewals thereto so that the value and operating efficiency thereof shall at all times be preserved and maintained, ordinary wear and tear excepted, and except where the failure to do so would not have, either individually or in the aggregate, a Material Adverse Effect. |
Section 8.09 Mining Assets.
| (a) | Schedule “A” sets out all of the Mining Assets owned or held by the Borrower and its Subsidiaries, directly or indirectly. The Mining Assets are registered and recorded in the name of Andes Corporación Minera S.A. and NPGUS LLC as set out therein, Subsidiaries of the Borrower, as to a 100% undivided legal and beneficial interest, free and clear of all liens, attachments and encumbrances other than Permitted Encumbrances. Except as set out in Schedule “A”, no other Person has any interest in the Mining Assets or any right to acquire any such interest. |
| (b) | The consideration contractually agreed between the prior owners of the Mining Assets and each of Andes Corporación Minera S.A. and NPGUS LLC to acquire such Mining Assets, including but not limited to the purchase price thereof, have been duly paid or otherwise settled, except to the extent that such consideration includes future royalty obligations. |
| (c) | Any and all material filings required to have been filed to maintain the Mining Assets in good standing as of the date hereof have been filed. |
| (d) | Each of the Borrower, Andes Corporación Minera S.A. and NPGUS LLC have complete authority to deal with the Mining Assets as provided in this Agreement and have obtained all necessary third party consents required for performance of their obligations under this Agreement and under the Security Documents. |
| (e) | The Mining Assets have been or are reasonably in the process of being validly and properly located, filed/applied for, marked out, recorded, granted and registered in accordance with Applicable Laws and there are no disputes, threatened or now existing as to title to or applying for or recording of the Mining Assets. |
| (f) | The Borrower, Andes Corporación Minera S.A. and NPGUS LLC have the right to access and enter upon the surface lands over which the Mining Assets are located and there is no illegal occupation of such lands by (or threatened by) any Person. |
| (g) | The Mining Assets are not located in any area which is subject to any conflict of geographical limits between any jurisdiction (including any Province or State) and there are no overlappings affecting the Mining Assets. |
| (h) | None of the Borrower, Andes Corporación Minera S.A., or NPGUS LLC is currently subject to any revocation or threat of revocation, in whole or in part, of any of the Mining Assets by any Governmental Authority. While written notice of a potential revocation was previously received, the matter has been timely addressed with the relevant Governmental Authority, and to the knowledge of the Borrower no further action or proceeding is currently threatened in connection therewith; |
| (i) | There are no adverse claims, actions, suits or proceedings pending or threatened, affecting or which could affect the title to or ownership or use by the Borrower, Andes Corporación Minera S.A. or NPGUS LLC of the Mining Assets. |
| (j) | The Mining Assets do not lie within any protected area, rescue area, reserve, reservation, reserved area or special needs lands as designated by any governmental entity having jurisdiction that would materially impair the development of a mining project on such lands. |
| (k) | No dispute exists, is pending or is threatened, with respect to the Mining Assets and (i) any surface landowner, and/or (ii) a Governmental Authority and/or any state-owned company. |
| (l) | No archaeological remains have been discovered and no damages to any archaeological remains have been caused as a direct or indirect result of activities undertaken on the Mining Assets. |
| (m) | No dispute between the Borrower or Andes Corporación Minera S.A. or NPGUS LLC and any non-governmental organization, community, community group, aboriginal peoples or aboriginal group or is threatened or imminent with respect to any of the Mining Assets, in each case that could reasonably be expected to have a Material Adverse Effect. |
| (n) | None of the Borrower, Andes Corporación Minera S.A. or NPGUS LLC have received any correspondence or other written communication from any non-governmental organization, community, community group or first nation in relation to the Mining Assets, in each case that could reasonably be expected to have a Material Adverse Effect. |
| (o) | All Permits required by Environmental Laws are in place and all exploration works on the Mining Assets, can be conducted as such exploration activities are contemplated as of the date hereof. |
Section 8.10 Environmental Matters.
| (a) | No Environmental Claim is pending or threatened, to which the Borrower or its Subsidiaries is or will be a party with respect to the Mining Assets, nor are there any decrees or orders or other judicial requirements outstanding under any Environmental Law with respect to the Mining Assets. |
| (b) | There are no Hazardous Materials located on, above or below the surface of the Mining Assets or contained in the soil or water constituting the Mining Assets. |
| (c) | There has been no release, spill, leak, emission, discharge, dumping or disposal of Hazardous Materials at or from the Mining Assets in violation of Environmental Laws. |
Section 8.11 Material Contracts.
Schedule “B” sets forth all Material Contracts to which the Borrower or its Subsidiaries is a party or is bound. The Borrower has delivered true, correct and complete copies of such Material Contracts to the Agent, all of which are in full force and effect and except as set forth therein, have not been amended. Neither the Borrower nor its Subsidiaries is in breach or in default in any material respect of or under any Material Contract and, no other party is in breach or default thereunder in any material respects, nor are there any events that are continuing which, but for giving notice, lapse of time or any other condition subsequent, would constitute a default of a material obligation thereunder or allow for the termination of any Material Contract.
Section 8.12 Taxes.
| (a) | Each of the Borrower and its Subsidiaries have duly filed on a timely basis all Tax returns, elections and reports that are required to be filed by them under Applicable Law and has paid, collected and remitted all Taxes and remittances shown thereon to be due and payable, collectible or remittable by it under Applicable Law, together with applicable interest and penalties, and all other Taxes, fees or other charges imposed on it or any of its property by any Governmental Authority (except those that are currently being contested in good faith by appropriate proceedings and with respect to which reserves in conformity with GAAP have been provided on the books of the relevant Person). No tax liens have been filed, and no claim is being asserted, with respect to any such Tax, fee or other charge. |
| (b) | Each of the Borrower and its Subsidiaries have made adequate provision for, and all required installment payments have been made in respect of, Taxes and remittances due and payable for the current period for which returns are not yet required to be filed. |
| (c) | There are no agreements, waivers or other arrangements providing for an extension of time with respect to the filing of any tax return or the payment of any Taxes or remittances described above. |
| (d) | There are no actions, proceedings or claims pending or, to the knowledge of the Borrower or the Subsidiaries, threatened by any Governmental Authority to enforce the payment of any Taxes or remittances described above and no such proceedings or actions are being contemplated by such authorities. |
Section 8.13 Subsidiaries; Equity Interests.
Except as disclosed to the Agent by the Borrower in writing from time to time after the Closing Date:
| (a) | Schedule “C” attached hereto sets out, in respect of the Borrower and each Subsidiary, each such party's authorized and issued Equity Interests (other than the Equity Interests of the Borrower) and the direct or indirect registered and beneficial holders of all such Equity Interests. |
| (b) | there are no outstanding subscriptions, options, warrants, calls, rights or other agreements or commitments (other than stock options granted to employees and save for statutory preemptive rights) relating to any Equity Interest of the Borrower or the Subsidiaries, other than as set out in Schedule “C”. |
| (c) | All of the outstanding Equity Interests of the Borrower and the Subsidiaries have been validly issued, are fully-paid and non-assessable free and clear of all Encumbrances. |
| (d) | None of the Borrower or any Subsidiary has any equity investments in any corporation or entity other than those disclosed in Schedule “C”. |
| (e) | Except as set out in Schedule “C” as of the date hereof, none of the Borrower or any Subsidiary is a party to any unanimous shareholders agreement, shareholders agreement, partnership or other agreement relating to shares or other equity interests in the Borrower or any Subsidiary. |
Section 8.14 Solvency.
The Borrower is, and after giving effect to the incurrence of all Debt and obligations incurred in connection herewith will be, solvent, is able to pay its debts as they become due, has capital sufficient to carry on its business, and now owns property having a value (both at fair market value and on a liquidation basis) greater than the amount required to repay all of its Debt.
Section 8.15 Sanctions.
No part of the Advances will be used to fund any operations in, finance or facilitate any investments, activities, business or transaction with, or make any payments to, a Sanctioned Person or in any country or territory, that, at the time of such funding, is, or whose government is, the subject of Sanctions in any manner that would result in any violation by any Person (including the Lender) of (i) any Sanctions; or (ii) any applicable regulations, rules or executive orders issued or administered by any Sanctions Authority. None of the Borrower, its Subsidiaries or any director, officer, employee, agent of the Borrower (i) is or will become a Sanctioned Person; or (ii) knowingly engages or will engage in any dealings or transactions, or is or will be otherwise knowingly associated, with any Sanctioned Person that would result in any violation of (A) any Sanctions, or (B) applicable regulations, rules or executive orders issued or administered by any Sanctions Authority.
Section 8.16 Anti-Terrorist Financing and Anti-Money Laundering Laws.
The Borrower, its Subsidiaries and their respective directors, officers, employees and agents are and have conducted its business, in compliance with Anti-Terrorist Financing and Anti-Money Laundering Laws. No part of the Advances, use of proceeds, or other transactions contemplated by this Agreement will violate Anti-Terrorist Financing and Anti-Money Laundering Laws. Neither the Borrower, its Subsidiaries nor their respective directors, officers, employees or agents is the subject of any investigation, inquiry or enforcement proceedings by any Governmental Authority regarding any offence or alleged offence under any Anti-Terrorist Financing and Anti-Money Laundering Laws, and to the knowledge of the Borrower, no such investigation, inquiry or proceeding is pending or has been threatened.
Section 8.17 Anti-Corruption Laws.
The Borrower, its Subsidiaries and their respective directors, officers, employees and agents are and have conducted its business in compliance with all Anti-Corruption Laws. The Borrower shall not, and shall ensure that its directors, officers, employees and agents do not, use, directly or indirectly, any part of the Advances for any payments to any governmental official or employee, political party, official of a political party, candidate for political office, or anyone else acting in an official capacity, in order to obtain, retain or direct business or obtain any improper advantage. Neither the Borrower, its Subsidiaries nor their respective directors, officers, employees or agents is the subject to any investigation, inquiry or enforcement proceedings by any Governmental Authority regarding any offence or alleged offence under any Anti-Corruption Laws, and no such investigation, inquiry or proceeding is pending or has been threatened.
Section 8.18 Accuracy of Information.
The Borrower has disclosed to the Agent and the Lenders all agreements, instruments and corporate or other restrictions to which it or any of its Subsidiaries is subject, and all other matters known to it, that, individually or in the aggregate, could reasonably be expected to have a Material Adverse Effect. No statement or information contained in this Agreement, any other Loan Document, or any other document, certificate or statement furnished by or on behalf of the Borrower to the Agent and the Lenders for use in connection with the transactions contemplated by this Agreement or the other Loan Documents, is incorrect or incomplete in any material respect or contains, as of the date such statement, information, document or certificate was so furnished, any untrue statement of a material fact or omits to state a material fact necessary to make a statement contained herein or therein not misleading.
Section 8.19 Nature of Representations and Warranties.
The representations and warranties set out in, or deemed to be made under, this Agreement, or under any certificates or other documents delivered to the Agent and the Lenders pursuant hereto, shall survive the execution and delivery of this Agreement, notwithstanding any investigations or examinations which may be made by the Agent and the Lenders, and the Lenders shall be deemed to have relied on such representations and warranties in entering into this Agreement. Such representations and warranties shall survive until the Obligations have been fully and finally paid and satisfied and this Agreement has been terminated.
ARTICLE IX
Positive Covenants
During the term of this Agreement, the Borrower, for and on behalf of itself and on behalf of each Subsidiary, covenants and agrees that it shall, and shall cause each Subsidiary to:
Section 9.01 Payment of Obligations.
Duly and punctually pay all Debts due and payable by each of them to any Person including all Obligations, Taxes and Contractual Obligations.
Section 9.02 Maintenance of Existence.
Maintain and renew in full force and effect its existence, organization and status in each jurisdiction of incorporation, formation or organization and in each other jurisdiction in which they carry on business or own assets and make all corporate, partnership and other registrations and filings necessary to do so.
Section 9.03 Conduct of Business and Maintenance of Property.
| (a) | Conduct its business in accordance with sound business practices and in compliance with: |
(i)its articles, bylaws (or equivalent) and constating documents; (ii) all Applicable Laws;(iii) its Contractual Obligations; and (iv) Permits to which it or its Property is subject.
| (b) | Maintain in good standing and obtain, as and when required, all Permits and contracts that it requires to permit it to acquire, own, operate and maintain its business and Property and to perform its obligations under the Loan Documents to which it is or will be a party. |
| (c) | Maintain and preserve all of its Property useful and necessary in its business in good repair, payment of governmental fees, working order and condition, ordinary wear and tear excepted. |
Section 9.04 Performance of Material Contracts.
Perform and observe all the terms and provisions of each Material Contract to be performed or observed by it, maintain each Material Contract in full force and effect, enforce each such Material Contract in accordance with its terms.
Section 9.05 Taxes and Withholdings.
| (a) | Duly file on a timely basis all material tax returns required to be filed by it, and duly and punctually pay all Taxes as they become due and payable under Applicable Law unless they are being contested in good faith by appropriate proceedings and an adequate reserve has been provided on the books of the relevant entity for payment of the contested amount. |
| (b) | Withhold from each payment made to any of its past or present employees, officers, directors, partners, and to any non-resident of the country in which the entity is resident, the amount of all Taxes and other deductions required to be withheld and pay the amount withheld to the proper Governmental Authority within the time required under Applicable Law. |
| (c) | Collect from all Persons the amount of all Taxes required to be collected from them under Applicable Law and remit the amount collected to the proper Governmental Authority within the time required under any Applicable Law. |
Section 9.06 Environmental Laws.
| (a) | Comply with all applicable Environmental Laws and obtain, maintain and comply in all respects with any and all Permits required by applicable Environmental Laws, and ensure the same by all of its tenants and subtenants, if any. |
| (b) | Ensure that there are no Hazardous Materials located on, above or below the surface of any Property except as would not be expected to result in a Material Adverse Effect. |
| (c) | Promptly, upon acquiring knowledge thereof, give written notice to the Agent of any non-compliance with Environmental Laws occurring on or in relation to any Property which would reasonably be expected to have a Material Adverse Effect. |
| (d) | Conduct and complete all remedial, removal and other actions necessary to remove and clean up all Hazardous Materials from any of its properties required under Environmental Laws and promptly comply in all respects with all lawful orders and directives of all Governmental Authorities regarding Environmental Laws. |
| (e) | Establish and implement such procedures as may be necessary to continuously determine and assure that the obligations under this section are timely and fully satisfied. |
Section 9.07 Use of Proceeds.
Use the Advances solely for the purposes set out in Section 2.02.
Section 9.08 Anti-Terrorist Financing and Anti-Money Laundering Laws and Anti-Corruption Laws.
| (a) | Comply with all Anti-Terrorist Financing and Anti-Money Laundering Laws. |
| (b) | Comply with all Anti-Corruption Laws and conduct its business in such a way and to adopt and maintain adequate policies, procedures and controls to ensure that it and each of its directors, officers, employees and agents is in compliance with all Anti-Corruption Laws. |
Section 9.09 Sanctions.
| (a) | Comply with all Sanctions. |
| (b) | Conduct its business in such a way and adopt and maintain adequate policies, procedures and controls to ensure that it and each of its directors, officers, employees and agents is in compliance with all Sanctions. |
Section 9.10 Certificates.
Within 15 Business Days after the end of each Fiscal Quarter, the Borrower shall deliver to the Agent and each Lender a certificate confirming that there has been no Event of Default under this Agreement and the Loan Documents, together with a balance sheet and list of aged payables for the Fiscal Quarter just ended.
Section 9.11 Further Assurances.
Promptly upon the request of the Agent:
| (a) | correct any material defect or error that may be discovered in any Loan Document or in the execution, acknowledgement, filing or recordation thereof; and |
| (b) | do, execute, acknowledge, deliver, record, re-record, file, re-file, register and re-register any and all such further acts, deeds, conveyances, pledge agreements, mortgages, deeds of trust, trust deeds, |
assignments, financing statements and continuations thereof, termination statements, notices of assignments, transfers, certificates, assurances and other instruments as the Agent may require from time to time in order to:
| (i) | carry out more effectively the purposes of the Loan Documents; |
| (ii) | perfect and maintain the validity, effectiveness and priority of the security interests intended to be created under the Security Documents and the other Loan Documents; and |
| (iii) | assure, convey, grant, assign, transfer, preserve, protect and confirm more effectively to the Lenders, the rights granted or now or hereafter intended to be granted to the Lenders under any Loan Document. |
ARTICLE X
Notice Requirements
Section 10.01 Notices.
Promptly and in any event within three days after learning of such event give notice to the Agent and Lenders of:
| (a) | the occurrence of any Default or Event of Default; |
| (b) | any default (however defined) under any Material Contract or Permit of the Borrower or any Subsidiary; |
| (c) | the occurrence of any Environmental Claim; |
| (d) | any development or event that has had or could reasonably be expected to have a Material Adverse Effect; and |
| (e) | notice of any Related Party transaction (or series of related transactions) or agreement having a value or involving payments by or to the Borrower or any Subsidiary of (a) $5,000,000, either for any one transaction or on a per annum basis or (b) $5,000,000 in aggregate over the life of the agreement or any series of transactions. |
Each notice provided pursuant to this Section 10.01 shall be accompanied by a statement of an officer of the Borrower setting forth details of the occurrence referred to therein and stating what action the relevant Person proposes to take with respect thereto.
ARTICLE XI
Negative Covenants
During the term of this Agreement, the Borrower, for and on behalf of itself and on behalf of its Subsidiaries, covenants and agrees that, without the prior written consent of the Required Lenders, it shall not and shall cause each of its Subsidiaries not to:
Section 11.01Limitations on Changes to Capital Structure.
Authorize or issue any Equity Interests of any of the Borrower’s Subsidiaries except issuances of Equity Interests to the Borrower or another Subsidiary of the Borrower.
Section 11.02Limitation on Investments.
Make any Investment, other than in the ordinary course of business or an Investment in an existing Subsidiary of the Borrower.
Section 11.03Limitation on Distributions.
Make any Distributions.
ARTICLE XII
Events of Default and Remedies
Section 12.01Events of Default.
The occurrence of any one or more of the following events or conditions shall constitute an “Event of Default” under this Agreement:
| (a) | Payment Default. The Borrower fails to pay: (i) any principal amount owing under this Agreement or any other Loan Document when due, whether at stated maturity, by acceleration, by notice of voluntary prepayment, by mandatory prepayment or otherwise and such failure remains unremedied for a period of three (3) Business Days; or (ii) any interest or other amount payable hereunder or under any other Loan Document when due and payable and such failure remains unremedied for a period of five (5) Business Days. |
| (b) | Incorrect Representations. Any representation, warranty, certification or other statement of fact made or deemed made by or on behalf of the Borrower or any of its Subsidiaries herein or in any other Loan Document or any amendment or modification hereof or thereof proves to have been incorrect, incomplete or misleading in any material respect on or as of the date made or deemed made. |
| (c) | Breach of Covenants. The Borrower or any of its Subsidiaries fails to perform or observe any of its other covenants, terms, conditions or agreements contained in this Agreement or any other Loan Document and such failure continues unremedied for a period of fifteen (15) Business Days after the earlier of: (x) the Borrower becoming aware of such failure, or (y) the Agent giving the Borrower notice of such failure. |
| (d) | Cross-Default. The Borrower or any Subsidiary: |
| (i) | fails to pay any principal or interest in respect of any Debt (including any Guarantee Obligation, but excluding any Debt outstanding under this Agreement) when due and such failure continues after the applicable grace period, if any, specified in the agreement or instrument relating to such Debt; or |
| (ii) | an event of default occurs under any such Debt; |
provided that, a default, event or condition described in clause (i) or (ii) shall not at any time constitute an Event of Default unless, at such time, one or more defaults, events or conditions of the type described in clauses (i) and (ii) has occurred and is continuing with respect to Debt, the outstanding principal amount of which exceeds, in the aggregate, $5,000,000.
| (e) | Voluntary Bankruptcy or Insolvency. The Borrower or any Subsidiary: |
| (i) | commences or institutes any application, proceeding or other action under any Bankruptcy and Insolvency Law and any other applicable corporate legislation, seeking (A) to have an order for relief entered with respect to it or to petition for its winding up, or (B) to adjudicate it as bankrupt or insolvent, or (C) reorganization, arrangement, adjustment, winding-up, liquidation, dissolution, composition, compromise, proposal, stay of proceedings of creditors generally, or other relief with respect to it or its debts; |
| (ii) | admits in writing its inability to pay its debts generally or makes a general assignment for the benefit of its creditors; or |
| (iii) | takes any action in furtherance of, or indicating its consent to, approval of, or acquiescence in, any of the acts set forth in Section 12.01(f). |
| (f) | Involuntary Bankruptcy or Insolvency. With respect to the Borrower or any Subsidiary: |
| (i) | there is commenced against such Person in a court of competent jurisdiction any application, proceeding or other action of a nature referred to in Section 12.01(e) which (A) results in the entry of an order for relief or any such adjudication or appointment, or (B) remains undismissed, undischarged, unstayed or unbonded for forty-five (45) days; |
| (ii) | there is commenced against such Person, any application, proceeding or other action seeking issuance of a warrant of seizure and sale, execution, garnishment or similar process against all or any substantial part of its Property which results in the entry of an order for any such relief which has not been vacated, discharged, stayed or bonded pending appeal within forty-five (45) days from the entry thereof; or |
| (iii) | the appointment of a receiver, liquidator, provisional liquidator, interim receiver, receiver and manager, trustee, custodian, conservator or other similar official for it or for all or any part of its assets. |
| (g) | Judgments. The entry of one or more judgments or the issuance or registration of any writ of enforcement or order against the Borrower or any Subsidiary involving, in the aggregate, a liability (not paid or fully covered by insurance as to which the relevant insurance company has been notified and has accepted coverage) in an amount in excess of $2,000,000 and all such judgments or writs have not been released, bonded, satisfied, discharged, vacated, stayed or accepted for payment by an insurer within forty-five (45) days from the entry, commencement or levy thereof. |
| (h) | Invalidity of Loan Documents. If: |
| (i) | any provision of any Loan Document ceases for any reason to be valid, binding and in full force and effect, or any security interest created by the Security Documents is not, or ceases to constitute, in whole or in part, a first ranking Encumbrance on the Property the Loan Parties, and in each case is not replaced by a valid, binding and enforceable Loan Document; |
| (ii) | any Person contests in any manner the validity or enforceability of any provision of any Loan Document; |
| (iii) | the Borrower denies that it has any or further liability or obligation under any provision of any Loan Document (other than as a result of repayment in full of the Obligations and termination of the Commitments) or purports to revoke, terminate or rescind any provision of any Loan Document; or |
| (iv) | any Loan Document is invalidated in any material respect by any act, regulation, or governmental action or is determined to be invalid in any material respect by a court or other judicial entry and such determination has not been stayed pending appeal. |
| (i) | Abandonment of Assets. The Borrower, Andes Corporation Minera S.A. or NPGUS LLC takes or seeks to take any action to abandon all or any material portion of the Mining Assets. |
| (j) | Expropriation. Any Governmental Authority directly or indirectly condemns, expropriates, nationalizes, seizes or appropriates any material property which relates to or forms part of the Mining Assets and which is not vacated, discharged, stayed or bonded pending appeal within forty-five (45) days from the entry thereof. |
Section 12.02Remedies Upon an Event of Default.
| (a) | Acceleration on Default. Following the occurrence of an Event of Default and for so long as an Event of Default is continuing: (i) the entire principal amount of all Advances then outstanding, together with all accrued and unpaid interest thereon, (ii) an additional amount equal to 5% of the principal amount of all Advances then outstanding (it being acknowledged that such additional amount is a genuine pre-estimate of damages sustained by the Lenders in respect early repayment of the Advances, and not a penalty), and (iii) all other amounts owing under this Agreement and the other Loan Documents, shall be accelerated and become immediately due and payable upon written notice to that effect from the Agent to the Borrower, all without any other notice and without presentment, protest, demand, notice of dishonour or any other demand whatsoever (all of which are expressly waived by the Borrower). In such event, the Security Documents shall become immediately enforceable and the Agent may exercise any right or recourse and proceed by any action, suit, remedy or proceeding as the Agent and the Lenders are entitled to take under Applicable Law, this Agreement, the Security Documents and the other Loan Documents for the recovery and payment in full of all Obligations, and such other action as the Agent deems advisable to enforce their rights and remedies, all without any notice, presentment, demand, protect or other formality, all of which are expressly waived by the Borrower. No such remedy for the enforcement of the rights of the Agent and the Lenders shall be exclusive of, or dependent on, any other remedy, but any one or more of such remedies may from time to time be exercised independently or in combination with any other remedy. |
| (b) | Automatic Acceleration. In addition to the rights of the Agent and Lenders under Section 12.02(a), in the event of an Event of Default under Section 12.01(e) or (f), (i) the entire principal amount of the Advances then outstanding, together with all accrued and unpaid interest thereon, (ii) an additional amount equal to 5% of the principal amount of all Advances then outstanding (it being acknowledged that such additional amount is a genuine pre-estimate of damages sustained by the Lenders in respect early repayment of the Advances, and not a penalty), and (iii) all other amounts owing under this Agreement and the other Loan Documents, shall automatically become immediately due and payable without any other notice and without presentment, protest, demand, notice of dishonour or any other demand whatsoever (all of which are expressly waived by the Borrower). |
Section 12.03Saving.
The Agent and the Lenders shall have no obligation to the Borrower, to pursue any specific remedy, to realize on any collateral securing the Obligations, to enforce the Security Documents or to allow any of its collateral to be sold, dealt with or otherwise disposed of. The Agent and the Lenders shall not be responsible to the Borrower for any loss or damage upon the realization or enforcement of, the failure to realize on or enforce or the failure to permit any of the collateral to be sold, dealt with, or otherwise disposed of, or for any act or omission, except that the Agent and the Lenders may be responsible for any loss or damage arising from the willful misconduct or gross negligence of the Agent or the Lenders, as applicable.
Section 12.04Agent May Perform.
Following the occurrence of an Event of Default, and for so long as such event shall persist, if the Borrower shall fail to perform any of its covenants or agreements in this Agreement or any of the other Loan Documents, the Required Lenders may (but shall have no obligation to) instruct the Agent, on behalf of the Lenders, to perform any or all such covenants or agreements in any manner deemed fit by the Required Lenders without thereby waiving any rights to enforce the Loan Documents. All expenses and disbursements incurred by the Agent and the Lenders (including legal fees and disbursements) shall be an Obligation secured by the Security Documents and shall be payable on demand by the Agent or the Lenders, as applicable.
Section 12.05Application of Payments.
Notwithstanding any other provision of this Agreement or any other Loan Document, after the occurrence and during the continuance of an Event of Default, all payments made by or on behalf of the Borrower under this Agreement or from the proceeds of realization under any of the Security Documents, or otherwise collected by the Agent or any Lender on account of any of the Obligations, shall be applied to the Obligations as follows (as the same become due at maturity, by acceleration or otherwise):
| (a) | first, to the payment of any fees, indemnities, expenses and other amounts (other than principal and interest, but including fees of counsel and other advisors engaged by the Agent and including in connection with realizing on the Security Documents) payable to the Agent in its capacity as such hereunder or under any other Loan Document; |
| (b) | second, to the payment of any indemnities, expenses and other amounts (other than principal and interest) owed to the Lenders hereunder or under any other Loan Document, rateably among the Lenders in proportion to the amounts owing to each Lender under this clause over the total amount owing to all Lenders under this clause; |
| (c) | third, to the payment of all outstanding amounts of interest payable under the Loan Documents (including default interest and interest payable before and after the commencement of any insolvency or bankruptcy proceeding), rateably among the Lenders in proportion to the amounts owing to each Lender under this clause over the total amount owing to all Lenders under this clause; |
| (d) | fourth, to the payment of the outstanding principal amount of all Advances rateably among the Lenders in proportion to the amounts owing to each Lender under this clause over the total amount owing to all Lenders under this clause; and |
| (e) | fifth, any balance remaining to the Borrower or as otherwise required by Applicable Law. |
Section 12.06Third Parties.
No Person dealing with any Lender, the Agent or any other representative of the Lenders is required to determine: (a) whether the Security Documents (or any of them) have become enforceable, the powers that the Lenders, the Agent or any other representative of the Lenders are purporting to exercise have become exercisable, or any Obligations remain outstanding; (b) as to the necessity or expediency of the conditions which any sale may be subject to; (c) otherwise as to the propriety or regularity of any sale, disposition or any other dealing with the collateral charged by the Security Documents or any part thereof; or (d) how any payments to the Lenders, the Agent or any other representative of the Lenders has been or will be applied. Any Person who acquires collateral that is charged by the Security Documents from a Lender or Lenders, the Agent or any representative of any of them in good faith will acquire it free from any interest of any Loan Party.
ARTICLE XIII
The Agent and the Lenders
Section 13.01Appointment and Authority.
Each Lender hereby irrevocably appoints the Agent to act on its behalf as the Agent hereunder and under the other Loan Documents, and authorizes the Agent to take such actions on its behalf and to exercise such powers as are delegated to the Agent by the terms hereof or thereof, together with such actions and powers as are reasonably incidental thereto. The provisions of this Article are solely for the benefit of the Agent and the Lenders. Neither the Borrower nor any Subsidiary thereof shall have rights as a third party beneficiary of any of the provisions of this Article. The use of the term “agent” in any Loan Document with reference to the Agent is not intended to connote any fiduciary or other implied (or express) obligation arising under agency doctrine of any Applicable Laws. Instead, the term is used as a matter of market custom and is intended to create or reflect only an administrative relationship between contracting parties.
Section 13.02Rights as a Lender.
The Person serving as the Agent hereunder shall have the same rights and powers in its capacity as a Lender as any other Lender and may exercise the same as though it were not the Agent, and the term “Lender” or “Lenders” shall, unless otherwise expressly indicated or unless the context otherwise requires, include the Person serving as the Agent hereunder in its individual capacity. Such Person and its Affiliates may accept deposits from, lend money to, own securities of, act as the financial advisor or in any other advisory capacity for and generally engage in any kind of business with the Borrower, any Subsidiary or any Affiliate thereof, all as if such Person were not the Agent hereunder and without any duty to account to the Lenders.
Section 13.03No Fiduciary Duty and Exculpatory Provisions.
| (a) | The Agent shall not have any duties or obligations except those expressly set out in the Loan Documents, which shall be administrative in nature. Without limiting the generality of the foregoing, the Agent: |
| (i) | shall not be subject to any fiduciary or other implied duties, regardless of whether a Default has occurred and is continuing; |
| (ii) | shall not have any duty to take any discretionary action or exercise any discretionary powers, except discretionary actions and powers expressly contemplated by the Loan Documents that the Agent is required to exercise as directed in writing by the Required Lenders (or such other number or percentage of the Lenders as shall be expressly provided for in the Loan Documents); provided that, the Agent shall not be required to take any action that, in its opinion or the opinion of its counsel, may expose the Agent to liability or that is contrary to any Loan Document or Applicable Law; and |
| (iii) | shall not, except as expressly set out in the Loan Documents, have any duty to disclose, and shall not be liable for the failure to disclose, any information relating to the Borrower, any Subsidiary or any of their Affiliates that is communicated to the Agent. |
| (b) | The Agent shall not be liable for any action taken or not taken by it: (i) with the consent or at the request of the Required Lenders (or such other number or percentage of the Lenders as is necessary or as the Agent believes in good faith is necessary, under the Loan Documents); or (ii) in the absence of its own gross negligence or willful misconduct as determined by a final and non-appealable judgment of a court of competent jurisdiction. |
| (c) | The Agent shall be deemed not to have knowledge of any Default unless and until notice describing the Default is given to the Agent by the Borrower or a Lender. |
| (d) | Except as otherwise expressly provided in this Agreement, the Agent shall not be responsible for or have any duty to ascertain or inquire into: (i) any statement, warranty or representation made in or in connection with the Loan Documents; (ii) the contents of any certificate, report or other document delivered in connection with the Loan Documents;(iii) the performance or observance of any of the covenants, agreements or other terms or conditions set out in the Loan Documents or the occurrence of any Default; (iv) the validity, enforceability, effectiveness or genuineness of the Loan Documents; or (v) the satisfaction of any condition specified in this Agreement, other than to confirm receipt of items expressly required to be delivered to the Agent. |
Section 13.04Reliance by the Agent.
The Agent shall be entitled to rely on, and shall not incur any liability for relying on any notice, request, certificate, consent, statement, instrument, document or other writing (including, any electronic message, internet or intranet website posting or other distribution) believed by it to be genuine and to have been signed, sent or otherwise authenticated by the proper Person. The Agent may rely on any statement made to it orally or by telephone and believed by it to have been made by the proper Person, and shall not incur any liability for relying thereon. In determining compliance with any condition hereunder to the making of an Advance that by its terms must be fulfilled to the satisfaction of a Lender, the Agent may presume that such condition is satisfactory to such Lender unless the Agent shall have received written notice to the contrary from such Lender before making such Advance. The Agent may consult with legal counsel, independent accountants and other experts selected by it, and shall not be liable for any action taken or not taken by it in accordance with the advice of any such counsel, accountants or experts.
Section 13.05Delegation of Duties.
The Agent may perform any and all of its duties and exercise its rights and powers under any of the Loan Document by or through any one or more sub-agents appointed by the Agent. The Agent and any such sub-agent may perform any and all of its duties and exercise its rights and powers by or through their respective Related Parties. The exculpatory provisions of this Article shall apply to any such sub-agent and to the Related Parties of the Agent and any such sub-agent, and shall apply to their respective activities in connection with the syndication of the credit facilities as well as activities as Agent. The Agent shall have no responsibility for the conduct or negligence of any sub-agent appointed by it hereunder, except to the extent that a court of competent jurisdiction determines that the Agent acted with gross negligence or willful misconduct in the appointment of such sub-agent.
Section 13.06Sharing of Payments by Lenders.
If any Lender, by exercising any right of set-off or counterclaim or otherwise, obtains any payment or other reduction that might result in such Lender receiving payment or other reduction of a proportion of the aggregate amount of its Commitment and accrued interest thereon or other obligations hereunder greater than its pro rata share thereof as provided herein, then the Lender receiving such payment or other reduction shall: (i) notify the Agent of such fact; and (ii) purchase (for cash at face value) participations in the Commitment and such other obligations of the other Lenders, or make such other adjustments as shall be equitable, so that the benefit of all such payments shall be shared by the Lenders rateably in accordance with the aggregate amount of principal of and accrued interest on their respective Commitments and other amounts owing them, provided that:
| (a) | if any such participations are purchased and all or any portion of the payment giving rise thereto is recovered, such participations shall be rescinded and the purchase price restored to the extent of such recovery, without interest; |
| (b) | the provisions of this Section shall not be construed to apply to: (i) any payment made by the Borrower pursuant to and in accordance with the express terms of this Agreement; or |
| (c) | the provisions of this Section shall not be construed to apply to: (i) any payment made while no Default has occurred and is continuing in respect of obligations of the Borrower to such Lender that do not arise under or in connection with the Loan Documents; (ii) any payment made in respect of an obligation that is secured by a Permitted Encumbrance, or that is otherwise entitled to priority over the Borrower's obligations under or in connection with the Loan Documents; (iii) any reduction arising from an amount owing to the Borrower upon the termination of derivatives entered into between the Borrower and such Lender; or (iv) any payment to which such Lender is entitled as a result of any form of credit protection obtained by such Lender. |
The Borrower consents to the foregoing and agrees, to the extent that they may effectively do so under Applicable Law, that any Lender acquiring a participation pursuant to the foregoing arrangements may exercise against the Borrower rights of set-off and counterclaim and similar rights of Lenders with respect to such participation as fully as if such Lender were a direct creditor of the Borrower in the amount of such participation.
Section 13.07Administration of Credits.
| (a) | Duties of the Agent. Unless otherwise specified in this Agreement, the Agent shall perform the following duties: |
| (i) | ensure that all conditions precedent to any Advance have been fulfilled or waived in accordance with, and subject to, the terms of this Agreement; |
| (ii) | receive and distribute each Lender's Applicable Percentage of an Advance to the Borrower in accordance with the terms of this Agreement; |
| (iii) | use reasonable efforts to collect promptly all sums due and payable by the Borrower under this Agreement and distribute all payments received from the Borrower to each Lender in accordance with such Lender's Applicable Percentage and the terms of this Agreement; |
| (iv) | hold and execute, as agent on behalf of the Lenders, the Security Documents or collateral and take all required steps to perfect (whether by registration, possession, control or otherwise) and maintain the Security Documents; |
| (v) | release and discharge the security interest of the Lenders under the Security Documents with respect to any property or assets to the extent necessary to complete any disposition permitted by this Agreement; |
| (vi) | hold all legal documents relating to the Loan Facility, maintain complete and correct records showing all Advances made by the Lenders, all remittances and payments made by the Borrower to the Agent, all remittances and payments made by the Agent to the Lenders and all other sums received by the Agent and allow each Lender and its advisors to examine such accounts, records and documents at its own expense, and provide any Lender upon reasonable notice, with such copies thereof as such Lender may reasonably require from time to time at the Lender's expense; |
| (vii) | promptly forward to each Lender, upon receipt, copies of: (x) all financial information received from the Borrower; (y) an up-to-date loan status report; and |
(z) other notices, correspondence or information received by the Agent from the Borrower involving or relating to the Lenders;
| (viii) | promptly forward to each Lender, upon request and at the expense of such Lender, copies of the Loan Documents; |
| (ix) | promptly notify each Lender of the occurrence of any Default or Event of Default of which the Agent has actual knowledge; and |
| (x) | except as otherwise provided in this Agreement, act in accordance with any instructions given to the Agent by the Required Lenders or all the Lenders, as applicable. |
| (b) | Actions Requiring Consent of a Super Majority of the Lenders. Unless otherwise specified in this Agreement, the Agent may only take the following actions with the prior consent of a Super Majority of the Lenders: |
| (i) | amend, terminate or waive any terms of the Loan Documents (including this Agreement) if such amendment, termination or waiver would: |
| (A) | increase the amount of any Lender's Commitment; |
| (B) | decrease the amount of any payment or repayment (as applicable) of principal, interest or other amounts due under the Loan Documents; |
| (C) | extend the Maturity Date; |
| (D) | extend any date fixed by the Loan Documents for the payment of principal, interest or other amounts due under the Loan Documents; |
| (E) | change the definition of Required Lenders or Super Majority; |
| (F) | change any provision relating to the pro rata treatment of Lenders; |
| (ii) | release any Loan Party; |
| (iii) | release any Security Document or change the priority of any Lender's security interest in the Property, except as otherwise expressly permitted under this Agreement; |
| (iv) | amend, terminate or waive this Article or Section 17.03 or any other provision of this Agreement providing for a Super Majority of Lenders; |
| (v) | consent to the assignment or transfer by the Borrower of any of its rights and obligations under the Loan Documents. |
| (c) | Actions Requiring the Consent of Required Lenders. Unless otherwise specified in this Agreement, the Agent may only take the following actions with the prior written consent of the Required Lenders: |
| (i) | subject to this Section 13.07, exercise any rights of notice and approval granted to the Lenders under this Agreement; |
| (ii) | amend, terminate or waive any term of the Loan Document (including a waiver of a Default) other than any amendments, terminations or waivers set out in Section 13.07(b) which require the consent of a Super Majority of the Lenders; |
| (iii) | all actions or decisions relating to matters not expressly set out in Section 13.07(a) and (b) above, including: |
| (A) | amend or waive any conditions precedent set out in ARTICLE VI; |
| (B) | amend or waive a Default; |
| (C) | provide written notice to the Borrower of a Default; |
| (D) | accelerate the Obligations; |
| (E) | issue a demand letter or enforcement notices to any Loan Party; |
| (F) | take any action to enforce performance of the Obligations and realize on the Security Documents including without limitation the appointment of an interim receiver, receiver, receiver manager or other trustee; |
| (G) | pay insurance premiums, Taxes and any sums that may be required to be paid to protect the Lenders and preserve their collateral; |
| (H) | enter into a Loan Increase Agreement; and |
| (I) | engage professionals; |
| (iv) | as between the Borrower, on the one hand, and the Agent and the Lenders, on the other hand: |
| (A) | all statements, certificates, consents and other documents which the Agent purports to deliver on behalf of the Lenders or the Required Lenders shall be binding on each of the Lenders, and the Borrower shall not be required to ascertain or confirm the authority of the Agent in delivering such documents; |
| (B) | all certificates, statements, notices and other documents which are delivered by the Borrower to the Agent in accordance with this Agreement, shall be deemed to have been duly delivered to each of the Lenders; and |
| (C) | all payments which are delivered by the Borrower to the Agent in accordance with this Agreement shall be deemed to have been duly delivered to each of the Lenders; and |
| (v) | except in its own right as a Lender, the Agent shall not be required to advance its own funds for any purpose and, in particular, shall not be required to pay with its own funds insurance premiums, taxes or public utility charges or the cost of repairs or maintenance with respect to any Property that is the subject matter of any security, nor shall it be required to pay with its own funds the fees of solicitors, counsel, auditors, experts or agents engaged by it as permitted hereby. |
| (vi) | notwithstanding the foregoing, no amendment, modification or waiver affecting the rights or obligations of the Agent may be made without consent. |
Section 13.08Indemnification.
Each Lender agrees to indemnify the Agent and hold it harmless (to the extent not reimbursed by the Borrower), rateably according to its Applicable Percentage (and not jointly or jointly and severally) from and against any and all losses, claims, damages, liabilities and related expenses, including the fees, charges and disbursements of any counsel, which may be incurred by or asserted against the Agent in any way relating to or arising out of the Loan Documents or the transactions therein contemplated. However, no Lender shall be liable for any portion of such losses, claims, damages, liabilities and related expenses resulting from the Agent's gross negligence or willful misconduct as determined by a judgment of a court of competent jurisdiction. The Agent shall not be required to take or continue any action unless the Agent has received sufficient funds or arrangements satisfactory to it for indemnification to cover the cost of the proposed action.
Section 13.09Replacement of Agent.
| (a) | The Agent may at any time give written notice of its resignation to the Lenders and the Borrower. On receipt of any such notice of resignation, the Required Lenders shall have the right, in consultation with the Borrower, to appoint a successor Agent, which shall be a Lender having an office in Toronto, Ontario, or an Affiliate of any such Lender with an office in Toronto, Ontario. The Agent may also be removed at any time by the Required Lenders on 30 days' notice to the Agent and the Borrower as long as the Required Lenders, in consultation with the Borrower, appoint and obtain the acceptance of a successor within those 30 days, which successor shall be a Lender having an office in Toronto, Ontario or an Affiliate of any such Lender with an office in Toronto, Ontario. |
| (b) | If no successor has (i) been appointed by the Required Lenders, and (ii) accepted the appointment within thirty (30) days after the retiring Agent gives notice of its resignation, or by such earlier date as agreed by the Required Lenders, then the retiring Agent may, on behalf of the Lenders, appoint a successor Agent meeting the qualifications set out above and that is not a Defaulting Lender; provided that, if the Agent notifies the Borrower and the Lenders that no qualifying Person has accepted that appointment, then the resignation shall nonetheless become effective in accordance with the retiring Agent's notice and (i) the retiring Agent shall be discharged from its duties and obligations under the Loan Documents (except that the retiring Agent shall continue to hold the Security Documents on behalf of the Lenders until a successor Agent is appointed), and (ii) all payments, communications and determinations provided to be made by, to or through the Agent shall instead be made by or to each Lender directly, until the Required Lenders appoint a successor Agent. |
| (c) | On the successor's appointment as Agent, the successor shall succeed to and become vested with all of the rights, powers, privileges and duties of the former Agent, and the former Agent shall be discharged from all of its duties and obligations under the Loan Documents (if not already discharged from them as provided in the previous subsection). The fees payable by the Borrower to a successor Agent shall be the same as those payable to its predecessor unless otherwise agreed between the Borrower and such successor. After the termination of the service of the former Agent, the provisions of this Article and of ARTICLE XV shall continue in effect for the benefit of the former Agent, its sub-agents and their respective Related Parties in respect of any actions taken or omitted to be taken by any of them while the former Agent was acting as Agent. |
Section 13.10Non-Reliance on Agent and Other Lenders.
Each Lender acknowledges that it has, independently and without reliance on the Agent or any other Lender or any of their Related Parties and based on such documents and information as it has deemed appropriate, made its own credit analysis and decision to enter into this Agreement. Each Lender also acknowledges that it will, independently and without reliance on the Agent or any other Lender or any of their Related Parties and based on such documents and information as it shall from time to time deem appropriate, continue to make its own decisions in taking or not taking action under or based on this Agreement, any other Loan Document or any related agreement or any document furnished hereunder or thereunder.
Section 13.11Collective Action of the Lenders.
Each of the Lenders hereby acknowledges that, to the extent permitted by Applicable Law, any collateral security and the remedies provided under the Loan Documents to the Lenders are for the benefit of the Lenders collectively and acting together and not severally and further acknowledges that its rights hereunder and under any collateral security are to be exercised not severally, but by the Agent on the decision of the Required Lenders (or such other number or percentage of the Lenders as shall be expressly provided for in the Loan Documents). Accordingly, despite any of the provisions contained herein or in any collateral security, each of the Lenders hereby agrees that it shall not be entitled to take any action hereunder or thereunder including any declaration of default hereunder or thereunder but that any such action shall be taken only by the Agent with the prior written agreement of the Required Lenders (or such other numbers or percentage of the Lenders as shall be expressly provided for in the Loan Documents). Each of the Lenders hereby further agrees that, on any such written agreement being given, it shall co-operate fully with the Agent to the extent requested by the Agent.
Despite the foregoing, in the absence of instructions from the Lenders and where in the sole opinion of the Agent, acting reasonably and in good faith, the exigencies of the situation warrant such action, the Agent may without notice to or consent of the Lenders take such action on behalf of the Lenders as it deems appropriate or desirable in the interests of the Lenders. The Agent may refrain from acting in accordance with any instructions from the Required Lenders to take any steps to enforce or realize on any Property subject to the Security Documents, until it shall have received such security as it may reasonably require against all costs and expenses (including legal fees) that it will or may incur in complying with such instructions.
Section 13.12Defaulting Lenders.
Notwithstanding, any provision in this Agreement to the contrary, upon a Lender becoming a Defaulting Lender:
| (a) | The provisions of this Section 13.12(a) to (e) shall apply to the extent permitted by Applicable Law until the Lender is no longer a Defaulting Lender. |
| (b) | Such Defaulting Lender will not be entitled to vote on any issue (other than on a reduction of the principal amount of its loan or any increase or extension of its Commitment) and its Commitment will be excluded in the determination of decisions requiring the consent of the Required Lenders or the consent of a Super Majority of the Lenders. |
| (c) | Non-Defaulting Lenders will be allocated, based on their Applicable Percentage (excluding the Defaulting Lender's Commitment and up to such Non-Defaulting Lender's Commitment), the funding obligations of the Defaulting Lender to the Borrower. The Defaulting Lender will not be released from its obligations to the Borrower, notwithstanding such reallocation. |
| (d) | The Agent can withhold any amount that it receives which would otherwise be payable to a Defaulting Lender in a segregated account and apply such amounts at such time or times as may be determined by the Agent as follows: |
| (i) | First, to the payment of any amounts owing by the Defaulting Lender to the Agent under this Agreement; |
| (ii) | Second, to repay on a pro rata basis the incremental portion of any Commitments made by a Lender pursuant to this Section in order to fund a shortfall created by a Defaulting Lender and, upon receipt of such repayment, each such Lender shall be deemed to have assigned to the Defaulting Lender such incremental portion of such Commitment; |
| (iii) | Third, to the payment of any amounts owing to the Borrower as a result of any judgment of a court of competent jurisdiction obtained by the Borrower against such Defaulting Lender as a result of such Defaulting Lender's breach of its obligations under this Agreement; and |
| (iv) | Forth, to such Defaulting Lender or as otherwise directed by a court of competent jurisdiction; |
| (e) | A Defaulting Lender will remain a Defaulting Lender until the Agent notifies the Defaulting Lender that they are satisfied that such Defaulting Lender is no longer a Defaulting Lender. Concurrently, with such notification, the Agent will make such adjustments among the Lenders as are necessary to give effect to the foregoing and the provisions in this Section shall cease to apply, provided that no retroactive adjustments will be made (including with respect to interest and other amounts payable). |
Section 13.13Agent May File Proofs of Claim.
| (a) | In case of the pendency of any proceeding under any Bankruptcy and Insolvency Laws, the Agent (irrespective of whether the principal of any Advance shall then be due and payable as set forth herein or by declaration or otherwise and irrespective of whether the Agent shall have made any demand on the Borrower) shall be entitled and empowered (but not obligated), by intervention in such proceeding or otherwise: |
| (i) | to file and prove a claim in such proceeding for the full amount of the principal, interest, fees (including legal fees), expenses, premiums, indemnities and other amounts owing and unpaid in respect of any Advance and all other Obligations that are owing and unpaid; and |
| (ii) | to collect and receive any monies or other property payable or deliverable on any such claims and to distribute the same; |
and any custodian, receiver, interim receiver, assignee, trustee, liquidator, sequestrator or other similar official in any such judicial proceeding is hereby authorized by each Lender to make such payments to the Agent and, if the Agent shall consent to the making of such payments directly to the Lenders, to pay to the Agent any amount due for the reasonable compensation, expenses, disbursements and advances of the Agent and its agents and counsel, and any other amounts due the Agent.
| (b) | Nothing contained herein shall be deemed to authorize the Agent to authorize or consent to or accept or adopt on behalf of any Lender any plan of reorganization, arrangement, proposal, compromise or composition affecting the Obligations or the rights of any Lender or to authorize the Agent to vote in respect of the claim of any Lender in any such proceeding. |
Section 13.14Provisions Operative Between Lenders and Agent Only.
The provisions of this Article relating to the rights and obligations of the Lenders and the Agent inter se shall be operative as between the Lenders and the Agent only, and the Borrower shall not have any rights or obligations under, or be entitled to rely for any purpose on, such provisions.
ARTICLE XIV
Change of Circumstance
Section 14.01 Change in Law.
| (a) | Increased Costs Generally. If any Change in Law shall: |
| (i) | impose, modify or deem applicable any reserve, special deposit, compulsory loan, insurance charge or similar requirement against assets of, deposits with or for the account of, or credit extended or participated in by, any Lender; |
| (ii) | subject any Lender to any Taxes of any kind whatsoever with respect to this Agreement or any Advance made by it, or change the basis of taxation of payments to a Lender in respect of this Agreement or any Advance, except for Indemnified Taxes, Other Taxes covered by Section 14.02 and Excluded Taxes; |
| (iii) | impose on any Lender any other condition, cost or expense affecting this Agreement or the Advance made by that Lender; |
and the result of any of the foregoing shall be to increase the cost to a Lender of making, converting to, continuing or maintaining any Advance, of maintaining its obligation to make any such Advance, or to reduce the amount of any sum received or receivable by a Lender hereunder (whether of principal, interest or any other amount) then, upon request of the Lender, the Borrower will pay to the Lender such additional amount or amounts as will compensate the Lender for such additional costs incurred or reduction suffered.
| (b) | Certificate of Increased Costs. A certificate from a Lender setting forth the amount or amounts necessary to compensate it or its holding company as specified in Section 14.01(a) (collectively, “Additional Compensation”), including reasonable detail of the basis of calculation of the amount or amounts, and delivered to the Borrower, shall be conclusive absent manifest error. The Borrower shall pay the Additional Compensation to the applicable Lender within 10 days after receipt of any such certificate. |
| (c) | Delay in Making a Request. Failure or delay on the part of a Lender to demand Additional Compensation pursuant to this Section shall not constitute a waiver of the Lender's right to demand such compensation. |
Section 14.02 Taxes.
| (a) | Any and all payments by or on account of any obligation of the Borrower hereunder or under any other Loan Document shall be made free and clear of and without reduction or withholding for any Taxes, other than Excluded Taxes; provided that if the Borrower is required by Applicable Law (as determined in the good faith discretion of the Borrower) to deduct or withhold any Taxes from any such payment, then: |
| (i) | if such Tax is an Indemnified Tax, the amount payable by the Borrower shall be increased so that after making all required deductions or withholdings (including |
deductions or withholdings applicable to additional amounts payable under this Section), the Agent, Lender or other payee, as applicable, receives an amount equal to the amount it would have received had no such deductions or withholdings been made; and
| (ii) | the Borrower shall make such deductions, pay the full amount deducted to the relevant Governmental Authority promptly and in accordance with Applicable Law, and provide to the Agent, Lender or other payee, as applicable, official receipts or other evidence satisfactory to such payee of each such payment. |
| (b) | The Borrower shall timely pay all Other Taxes to the relevant Governmental Authority in accordance with Applicable Law or, at the option of the Agent, promptly reimburse the Agent for the payment of any Other Taxes. |
| (c) | The Borrower shall jointly and severally indemnify the Agent and each Lender, on demand, for the full amount of any Indemnified Taxes (including Indemnified Taxes imposed or asserted on or attributable to amounts payable under this Section) payable or paid by the Agent or that Lender or required to be withheld or deducted from a payment to the Agent or that Lender and any reasonable expenses arising from or with respect to the Indemnified Taxes, whether or not they were correctly or legally imposed or asserted by the relevant Governmental Authority. A certificate as to the amount of the payment or liability delivered to the Borrower by a Lender (with a copy to the Agent), or by the Agent on its own behalf or on behalf of a Lender, shall be conclusive absent manifest error. |
| (d) | Each Lender shall severally indemnify the Agent, within 10 days after demand therefor, for: |
| (i) | any Indemnified Taxes attributable to such Lender (but only to the extent that the Borrower has not already indemnified the Agent for such Indemnified Taxes and without limiting the obligation of the Borrower to do so); |
| (ii) | any Taxes attributable to such Lender's failure to comply with the maintenance of the Register; and |
| (iii) | any Excluded Taxes attributable to such Lender, in each case, that are paid or payable by the Agent in connection with any Loan Document, and any reasonable expenses arising therefrom or with respect thereto, whether or not such Taxes were correctly or legally imposed or asserted by the relevant Governmental Authority. A certificate as to the amount of such payment or liability delivered to any Lender by the Agent shall be conclusive absent manifest error. Each Lender hereby authorizes the Agent to set off and apply any and all amounts at any time owing to such Lender under any Loan Document or otherwise payable by the Agent to the Lender from any other source against any amounts due to the Agent under this Section 14.02(d). |
| (e) | As soon as practicable after any payment of Taxes by the Borrower to a Governmental Authority pursuant to this Section 14.02, the Borrower shall deliver to the Agent the original or a certified true copy of the receipt issued by the Governmental Authority evidencing such payment, a copy of the return reporting the payment or other evidence of the payment that is satisfactory to the Agent, acting reasonably. |
| (f) | Any Foreign Lender that is entitled to an exemption from or reduction of withholding tax under the law of the jurisdiction in which the Borrower is resident for tax purposes, or any treaty to which that jurisdiction is a party, with respect to payments under any Loan Document shall deliver to the Borrower (with a copy to the Agent), at the time or times prescribed by Applicable Law and at any time reasonably requested by the Borrower or the Agent, all properly completed and executed documentation prescribed by Applicable Law that will permit the payments to be made without withholding or at a reduced rate of withholding. In addition: (i) any Lender shall deliver such other documentation prescribed by Applicable Law or reasonably requested by the Borrower or the Agent that will enable the Borrower or the Agent to determine whether or not that Lender is subject to withholding or information reporting requirements; and (ii) any Lender shall notify the Borrower and the Agent in writing within five Business Days of ceasing to be, or to be deemed to be, (i) resident in Canada for purposes of Part XIII of the Income Tax Act (Canada) or any successor provision, or (ii) resident in the United States for purposes of the Internal Revenue Code of the United States. Each Lender agrees that if any form or certification it delivers pursuant to this Section 14.02(f) expires or becomes obsolete, inaccurate or incomplete in any respect, it shall update such form, certification and other documentation as required by Applicable Law and provide such revised documentation to the Borrower within five business days of the event causing such obsolesce or inaccuracy. |
| (g) | If a payment made to a Lender under any Loan Document would be subject to FATCA Withholding Tax if that Lender were to fail to comply with the applicable reporting requirements provided by Sections 1471-74 of the Internal Revenue Code of the United States, and Treasury Regulations and other guidance issued thereunder, the Lender shall deliver to the Borrower and the Agent at the time or times prescribed by Applicable Law or reasonably requested by the Borrower or the Agent, the documentation prescribed by Applicable Law and such additional documentation reasonably requested by the Borrower or the Agent as may be necessary for the Borrower and the Agent to comply with their obligations relating to FATCA Withholding Tax and to determine that the Lender has complied with its obligations relating to FATCA Withholding Tax or to determine the amount to deduct and withhold from the payment. Each Lender agrees that if any form or certification it delivers pursuant to this Section 14.02(g) expires or becomes obsolete, inaccurate or incomplete in any respect, it shall update such form, certification and other documentation as required by Applicable Law and provide such revised documentation to the applicable Borrower within five business days of the event causing such obsolesce or inaccuracy. |
| (h) | If any party to this Agreement determines, in its sole discretion exercised in good faith, If any party to this Agreement determines, in its sole discretion exercised in good faith, that it has received a refund of any Taxes as to which it has been indemnified pursuant to this Section 14.02 (including by the payment of additional amounts pursuant to this Section), or that, because of the indemnification, it has benefited from a reduction in Excluded Taxes otherwise payable by it, it shall pay to the indemnifying party an amount equal to the refund or reduction (but only to the extent of the indemnification), net of all out-of-pocket expenses of the Agent or Lender, as the case may be, and without interest (other than any net after Tax interest paid by the relevant Governmental Authority with respect to any such refund). The indemnifying party, upon the request of the indemnified party, shall repay to the indemnified party the amount paid over pursuant to this Section 14.02(h) if the indemnified party is required to repay the refund or to the Governmental Authority. Notwithstanding anything to the contrary in this Section 14.02(h), in no event shall the indemnified party be required to pay any amount to an indemnifying party pursuant to this |
Section 14.02(h) the payment of which would place the indemnified party in a less favourable net after-Tax position than the indemnified party would have been in if the Tax subject to indemnification and giving rise to such refund or reduction had not been deducted, withheld or otherwise imposed and the indemnification payments or additional amounts with respect to such Tax had never been paid. This Section shall not be construed to require any indemnified party to make available its tax returns (or any other information relating to its Taxes that it deems confidential) to the indemnifying party or to any other Person, to arrange its affairs in any particular manner or to claim any available refund or reduction.
Section 14.03 Illegality.
If any Lender determines that any Applicable Law (including any Sanctions), has made it unlawful, or that any Governmental Authority has asserted that it is unlawful, for the Lender or its applicable lending office to make or maintain any Advance (or to maintain its obligation to make any Advance), or to determine or charge interest rates based upon any particular rate, then, on notice by that Lender to the Borrower through the Agent, any obligation of the Lender with respect to the activity that is unlawful shall be suspended until the Lender notifies the Agent and the Borrower that the circumstances giving rise to that determination no longer exist. Upon receipt of that notice, the Borrower shall, upon demand from that Lender (with a copy to the Agent), or prepay in order to avoid the activity that is unlawful. Upon any such prepayment, the Borrower shall also pay accrued interest on the amount so prepaid.
Section 14.04 Replacement of Lenders.
| (a) | Designation of Different Lending Office. If any Lender requests compensation under Section 14.01 (Change in Law), or requires the Borrower to pay any additional amount to any Lender or to any Governmental Authority for the account of any Lender pursuant to Section 14.02 (Taxes), then such Lender shall use reasonable efforts to designate a different lending office for funding or booking its Advance or to assign its rights and obligations under this Agreement to another of its offices, branches or Affiliates, if, in the judgment of the Lender, doing so (i) would eliminate or reduce amounts payable pursuant to Section 14.01 or Section 14.02, as the case may be, in the future, and (ii) would not subject the Lender to any unreimbursed cost or expense and would not otherwise be disadvantageous to the Lender. The Borrower hereby agrees to pay all reasonable costs and expenses incurred by any Lender in connection with any such designation or assignment. |
| (b) | Replacement of Lenders. Subject to Section 14.04(a), if: |
| (i) | any Lender requests compensation under Section 14.01 (Change of Law); |
| (ii) | the Borrower is required to pay any additional amount to any Lender or any Governmental Authority for the account of any Lender pursuant to Section 14.02 (Taxes); |
| (iii) | any Lender's obligations are suspended pursuant to Section 14.03 (Illegality); |
| (iv) | any FATCA Withholding Tax is imposed on any payment to a Lender under or in connection with this Agreement (whether the payment is made directly or through another financial institution); or |
| (v) | any Lender becomes a Defaulting Lender, |
then the Borrower may, at its sole expense and effort, upon 10 days' notice to that Lender and the Agent, require the Lender to assign and delegate, without recourse (in accordance with and subject to the restrictions contained in, and consents required by, ARTICLE XVI), all of its interests, rights and obligations under this Agreement and the related Loan Documents to an assignee that shall assume such obligations (which assignee may be another Lender, if a Lender accepts such assignment); provided that:
| (A) | the Borrower pays the Agent the assignment fee specified in Section 16.02(c); |
| (B) | there is no Default or Event of Default; |
| (C) | the Lender receives payment of an amount equal to the outstanding principal of its Advance, accrued interest, and all other amounts payable to it under the Loan Documents (including any breakage costs and amounts required to be paid under this Agreement as a result of prepayment to a Lender) from any assignee and/or the Borrower; |
| (D) | in the case of any assignment resulting from a claim for compensation under Section 14.01, or payments required to be made pursuant to Section 14.02, the assignment will result in a reduction in future compensation or payments; and |
| (E) | any assignment does not conflict with Applicable Laws. |
| (c) | No Lender shall be required to make any assignment or delegation pursuant to the foregoing Section 14.04(b) or accept repayment if, before completion, as a result of a waiver by the Lender or otherwise, the circumstances entitling the Borrower to require the assignment and delegation or repayment cease to apply. |
ARTICLE XV
Costs, Expenses and Indemnities
Section 15.01 Costs and Expenses.
The Borrower agrees to pay promptly on demand:
| (a) | all reasonable costs and expenses incurred by the Agent and the Lenders, including the reasonable fees, charges and disbursements of counsel for the Agent and the Lenders, in connection with the Loan Facility, the preparation, negotiation, execution, delivery and administration of the Loan Documents, and any amendments, modifications or waivers of their provisions (whether or not the transactions contemplated by them are consummated); and |
| (b) | all reasonable and documented out-of-pocket expenses incurred by the Agent or any Lender, including the reasonable fees, charges and disbursements of counsel, in connection with the enforcement or protection of its rights under or in connection with the Loan Documents, including its rights under this Section, or in connection with the Loan Facility, |
including all such out-of-pocket expenses (including lawyers, auditors, consultants and accountants) incurred during any workout, restructuring, or negotiations in respect of the Obligations or the Loan Facility.
Section 15.02 Indemnity by the Borrower
In addition to any liability or obligation of the Borrower to the Agent or Lenders under any other provision of this Agreement, the Borrower shall indemnify and hold the Agent (and its sub-agents), each Lender and each Related Party of any of the foregoing Persons (each, an “Indemnified Party”) harmless against any and all losses, claims, damages, liabilities and related expenses, including the fees, charges and disbursements of any counsel for any Indemnified Party (collectively, the “Claims”), incurred by any Indemnified Party or asserted against any Indemnified Party by the Borrower or other Person (except an Indemnified Party) arising out of, in connection with, or as a result of:
| (a) | the execution or delivery of any Loan Document or any agreement or instrument contemplated in any Loan Document, the performance or non-performance by the parties of their respective obligations under any Loan Document or the consummation or non-consummation of the transactions contemplated by the Loan Documents; |
| (b) | the Loan Facility or the use or the proposed use of its proceeds; |
| (c) | any actual or alleged presence or release of Hazardous Materials on or from any Property, or any claim or liability under Environmental Laws related to the Borrower or any of its Subsidiaries in any way; or |
| (d) | any actual or prospective claim, investigation, litigation or proceeding relating to any of the foregoing, whether based on contract, tort or any other theory, whether brought by a third party or by the Borrower, and regardless of whether any Indemnified Party is a party thereto; |
provided that, such indemnity shall not be available to any Indemnified Party to the extent that the Claims: (i) are determined by a court of competent jurisdiction by final and non-appealable judgment to have resulted from the fraud, gross negligence or willful misconduct of such Indemnified Party; or (ii) result from a claim brought by the Borrower against any Indemnified Party for breach in bad faith of such Indemnified Party’s obligations hereunder or under any other Loan Document, if the Borrower has obtained a final and non-appealable judgment in its favour on such claim as determined by a court of competent jurisdiction.
Section 15.03 Reimbursement by the Lenders.
To the extent that the Borrower for any reason fails to indefeasibly pay any amount required under this Article to be paid by it to the Agent (or any sub-agent thereof) or any Related Party of any of the foregoing, each Lender severally agrees to pay to the Agent (or any sub-agent) or such Related Party, as the case may be, such Lender's Applicable Percentage (determined as of the time that the applicable unreimbursed expense or indemnity payment is sought) of such unpaid amount, provided that the unreimbursed expense or indemnified loss, claim, demands, liability or related expense, as the case may be, was incurred by or asserted against the Agent, or against any Related Party of any of the foregoing acting for the Agent (or any such sub-agent) in connection with such capacity. The obligations of the Lenders under this Section are subject to the other provisions of this Agreement concerning several liability of the Lenders.
Section 15.04 Funding Indemnity.
| (a) | In addition to any liability or obligation of the Borrower to the Agent and the Lenders under any other provision of this Agreement, the Borrower shall indemnify and hold the Indemnified Parties harmless against any and all Claims (including any expense or cost incurred in the liquidation and re-deployment of funds acquired to fund or maintain any portion of an Advance and reasonable and documented out-of-pocket expenses and legal fees on a solicitor and her own client basis) incurred by any Indemnified Party as a result of or in connection with: |
| (i) | the Borrower's failure to fulfill any of its Obligations, including any cost or expense incurred by reason of the liquidation or redeployment in whole or in part of deposits or other funds required by the Lender to fund or maintain any Advance, as a result of the Borrower's failure to make any payment, repayment or prepayment on the date required hereunder or specified by it in any notice given hereunder; |
| (ii) | the Borrower's failure to pay any other amount, including any interest or other amount, when due under this Agreement or any other Loan Document; or |
| (iii) | the Borrower's failure to provide any notice required to be given by it to the Agent or the Lenders hereunder. |
| (b) | A certificate from the Agent or the affected Lender setting forth the amount or amounts necessary to compensate it for any such loss, claim, cost, damage or liability, including reasonable detail of the basis of calculation of the amount or amounts, and delivered to the Borrower, shall be conclusive absent manifest error. |
Section 15.05 Waiver of Consequential Damages.
The Borrower agrees, to the fullest extent permitted by Applicable Law, not to assert, and hereby waives, any claim against any Indemnified Party, on any theory of liability, for indirect, consequential, punitive, aggravated or exemplary damages (as opposed to direct damages), arising out of, in connection with, or as a result of this Agreement, any other Loan Document, or any agreement or instrument contemplated hereby (or any breach thereof), the transactions contemplated hereby or thereby, the Loan Facility or the use of the proceeds thereof. No Indemnified Party shall be liable for any damages arising from the use by unintended recipients of any information or other materials distributed by it through telecommunications, electronic or other information transmission systems in connection with this Agreement or the other Loan Documents or the transactions contemplated hereby or thereby.
Section 15.06 Payments.
All amounts due under this Article shall be payable promptly after demand is made for payment by the Indemnified Party. A certificate of the Agent or a Lender setting forth the amount or amounts owing under this Article, including reasonable detail of the basis of calculation thereof, and delivered to the Borrower shall be conclusive absent manifest error.
Section 15.07 Releases.
The Borrower agrees that neither it nor any of its Subsidiaries will settle, compromise or consent to the entry of any judgment in any pending or threatened claim, action or proceeding in respect of which indemnification or contribution could be sought hereunder (whether or not any Indemnified Party is an actual or potential party to such claim, action or proceeding) without the prior written consent of the applicable Indemnified Party, unless such settlement, compromise or consent includes an unconditional release of such Indemnified Party from all liability arising out of such claim, action or proceeding.
ARTICLE XVI
Successors and Assigns; Assignment and Participation
Section 16.01 Successors and Assigns.
The provisions of this Agreement shall be binding upon and inure to the benefit of the parties hereto and their respective successors and assigns permitted hereby, except that the Borrower may not assign or otherwise transfer any of its rights or obligations hereunder without the prior written consent of the Agent and each Lender and no Lender may assign or otherwise transfer any of its rights or obligations hereunder except: (i) to an Eligible Assignee in accordance with the provisions of Section 16.02; (ii) by way of participation in accordance with the provisions of Section 16.05; or (iii) by way of pledge or assignment of a security interest subject to the restrictions of Section 16.06 (and any other attempted assignment or transfer by any party hereto shall be null and void). Nothing in this Agreement, expressed or implied, shall be construed to confer upon any Person (other than the parties hereto, their respective successors and assigns permitted hereby, sub-agents contemplated hereby, Participants to the extent provided in Section 16.05 and, to the extent expressly contemplated hereby, the Affiliates of each of the Agent, any sub-agent and the Lenders) any legal or equitable right, remedy or claim under or by reason of this Agreement.
Section 16.02 Assignments by Lenders.
Any Lender may at any time assign to one or more Eligible Assignees all or a portion of its rights and obligations under this Agreement (including all or a portion of its Commitment and the Advance at the time owing to it), provided that:
| (a) | each partial assignment shall be made as an assignment of a proportionate part of all the assigning Lender's rights and obligations under this Agreement with respect to the Advance or the Commitment assigned; except that this clause shall not prohibit any Lender from assigning all or a portion of its rights and obligations among separate credits on a non-pro rata basis; |
| (b) | any assignment must be approved by the Agent, in its sole discretion; |
| (c) | the assigning Lender and the applicable Eligible Assignee shall execute and deliver to the Agent an assignment and assumption agreement in substantially the form of Schedule “D” or any other form approved by the Agent (an “Assignment Agreement”), together with all consents required hereunder; and the Eligible Assignee, if it is not a Lender, shall deliver any administrative questionnaire required by the Agent; |
| (d) | no such assignment shall be made to: (i) the Borrower or any of its Subsidiaries or Affiliates; (ii) a natural Person or a holding company, investment vehicle or trust for, or owned and operated for the primary benefit of, a natural Person; or (iii) any Defaulting Lender or any of its Subsidiaries, or any Person who, upon becoming a Lender, would constitute a Defaulting Lender or a Subsidiary thereof; |
| (e) | in connection with any assignment of the Advance or Commitments of any Defaulting Lender, such assignment shall not be effective until all conditions to such assignment set forth herein are satisfied and the parties to the assignment make such additional payments to the Agent in an aggregate amount sufficient, upon distribution thereof as appropriate (which may be outright payment, purchases by the assignee of participations or subparticipations, or other compensating actions, including, with the consent of the Borrower and the Agent, funding the applicable pro rata share of the Advance previously requested but not funded by the Defaulting Lender, to each of which the applicable assignee and assignor hereby irrevocably consent) to: (i) pay and satisfy in full all payment liabilities (including accrued interest) owed by such Defaulting Lender to the Agent and each other Lender hereunder; and (ii) acquire and fund, if applicable, its full pro rata share of the Advance in accordance with its Applicable Percentage. Notwithstanding the foregoing, if any assignment of the Advance or Commitments of any Defaulting Lender hereunder shall become effective under Applicable Law without compliance with the provisions of this paragraph, then the assignee of such interest shall be deemed to be a Defaulting Lender for all purposes of this Agreement until such compliance occurs. |
Section 16.03 Effect of Assignment.
Subject to acceptance and recording thereof by the Agent pursuant to Section 16.04, from and after the effective date specified in each Assignment Agreement, the Eligible Assignee thereunder shall be a party to this Agreement and, to the extent of the interest assigned by such Assignment Agreement, have the rights and obligations of a Lender under this Agreement and the other Loan Documents, including the Security Documents, and the assigning Lender thereunder shall, to the extent of the interest assigned by such Assignment Agreement, be released from its obligations under this Agreement (and, in the case of an Assignment Agreement covering all of the assigning Lender's rights and obligations under this Agreement, such Lender shall cease to be a party hereto) but shall continue to be entitled to the benefits of Section 16.01, Section 16.02, Section 16.03 and ARTICLE XV and shall continue to be liable for any breach of this Agreement by such Lender with respect to facts and circumstances occurring before the effective date of such assignment; provided that, except as otherwise expressly agreed by the affected parties, no assignment by a Defaulting Lender will constitute a waiver or release of any claim of any party hereunder arising from that Lender having been a Defaulting Lender. Any assignment or transfer by a Lender of rights or obligations under this Agreement that does not comply with this Section 16.03 shall be treated for purposes of this Agreement as a sale by such Lender of a participation in such rights and obligations in accordance with Section 16.05. Any payment by an assignee to an assigning Lender in connection with an assignment or transfer shall not be or be deemed to be a repayment by the Borrower or a new Advance to the Borrower.
Section 16.04 Register.
The Agent shall maintain, at the Agent's Office, a copy of each Assignment Agreement delivered to it and a register recording the names and addresses of the Lenders, and the Commitments of, and principal amounts (and stated interest) of the Advances owing to, each Lender under the terms hereof from time to time (the “Register”). The entries in the Register shall be conclusive absent manifest error, and the Borrower, the Agent, and the Lenders shall treat each Person whose name is recorded in the Register under the terms hereof as a Lender hereunder for all purposes of this Agreement. The Register shall be available for inspection by the Borrower and by any Lender at any reasonable time and from time to time upon reasonable prior notice.
Section 16.05 Participations.
| (a) | Any Lender may at any time, without the consent of, or notice to, the Borrower but with the prior written consent of the Agent (which consent may be unreasonably withheld), sell participations to any Person (other than a natural Person, a Borrower or any of the Borrower's Affiliates or Subsidiaries) (each, a “Participant”) in all or a portion of such Lender's rights and obligations under this Agreement (including all or a portion of its Commitments and the Advance owing to it); provided that, (i) such Lender's obligations under this Agreement shall remain unchanged; (ii) such Lender shall remain solely responsible to the other parties hereto for the performance of such obligations; (iii) the Borrower, the Agent and the other Lenders shall continue to deal solely and directly with such Lender in connection with such Lender's rights and obligations under this Agreement. Any payment by a Participant to a Lender in connection with a sale of a participation shall not be deemed to be a repayment by the Borrower or a new Advance to the Borrower. For the avoidance of doubt, each Lender shall be responsible for the indemnity under Section 13.08 with respect to any payments made by such Lender to its Participants. |
| (b) | Subject to this Section, the Borrower agrees that each Participant shall be entitled to the benefits of Section 14.01 and Section 14.02 to the same extent as if it were a Lender and had acquired its interest by assignment pursuant to Section 16.02. To the extent permitted by Applicable Law, each Participant also shall be entitled to the benefits of Section 12.05 as though it were a Lender; provided that, the Participant agrees to be subject to Section 13.06 as though it were a Lender. |
| (c) | Any agreement or instrument under which a Lender sells such a participation shall provide that such selling Lender shall retain the sole right to enforce this Agreement and to approve any amendment, modification or waiver of any provision of this Agreement; provided that, such agreement or instrument may provide that such selling Lender will not, without the consent of the Participant, agree to any amendment, waiver or other modification that would: reduce the principal of, or interest on, an Advance or any other amounts payable hereunder; postpone any date fixed for any payment of principal of, or interest on, an Advance or any other amounts payable hereunder; or increase the Commitment or extend the maturity date of an Advance, in each case to the extent subject to such participation, or release a material portion of the Security Documents, any collateral held for the Obligations or the value of any guarantees. |
| (d) | A Participant shall not be entitled to receive any greater payment under Section 14.01 and Section 14.02 than the applicable Lender would have been entitled to receive with respect to the participation sold to such Participant, unless the sale of the participation to the Participant is made with the Borrower's prior written consent. |
Section 16.06 Certain Pledges.
Any Lender may at any time pledge or assign a security interest in all or any portion of its rights under this Agreement to secure obligations of such Lender; provided that, no such pledge or assignment shall release such Lender from any of its obligations hereunder or substitute any such pledgee or assignee for such Lender as a party hereto.
ARTICLE XVII
Miscellaneous
Section 17.01 Notices.
All notices and other communications provided for herein shall be made in writing and mailed by certified or registered mail, delivered by hand or overnight courier service or e-mail address, as the case may be, specified beside each party's signature on the signature page hereto. Notices mailed by certified or registered mail or sent by hand or overnight courier service shall be deemed to have been given when received. Notices and other communications sent by email shall be deemed received on the day sent; provided that, if such notice, email or other communication is not sent during the recipient’s normal business hours, such notice, email or other communication shall be deemed to have been sent at the recipient’s opening of business on the next Business Day.
Section 17.02 Waiver and Cumulative Remedies.
| (a) | No failure to exercise and no delay in exercising, on the part of the Agent or any Lender, any right, remedy, power or privilege hereunder or under the other Loan Documents shall operate as a waiver thereof, nor shall any single or partial exercise of any right, remedy, power or privilege hereunder preclude any other or further exercise thereof or the exercise of any other right, remedy, power or privilege. No breach of any provision of any Loan Document may be waived or discharged verbally, and any waiver of, or consent to, any departure by the Borrower therefrom shall in any event be effective unless the same shall be made by way of an instrument in writing signed by the Agent, and then such waiver or consent shall be effective only in the specific instance and for the time and purpose for which given. Without limiting the generality of the foregoing, the making of an Advance shall not be construed as a waiver of any Default, regardless of whether the Agent or any Lender may have had notice or knowledge of such Default at the time. |
| (b) | The rights and remedies of the Agent and Lenders under the Loan Documents are cumulative and are in addition to and not in substitution for any rights or remedies provided by Applicable Law. Any single or partial exercise by the Agent and the Lenders of any right or remedy for a Default or Event of Default shall not be a waiver of or alter, affect or prejudice any other right or remedy to which they may be lawfully entitled for the same Default or Event of Default. Any waiver by the Agent and Lenders of a Default or Event of Default, shall not be a waiver of any subsequent Default or Event of Default. |
Section 17.03 Amendments.
Neither this Agreement nor any other Loan Document nor any provision hereof or thereof may be amended or modified except:
| (a) | in the case of this Agreement, pursuant to an agreement or agreements in writing entered into by the parties hereto, or by the Borrower and the Agent, with the consent of those Lenders required to provide consent pursuant to Section 13.07 hereof; and |
| (b) | in the case of any other Loan Document, pursuant to an agreement or agreements in writing entered into by the Agent and the Borrower. |
Section 17.04 Judgment Currency.
| (a) | If, for the purpose of obtaining a judgment in any court, it is necessary to convert a sum due to the Lender in any currency (the “Original Currency”) into another currency (the “Other Currency”), the parties agree, to the fullest extent that they may effectively do so, that the rate of exchange used shall be that at which, in accordance with normal banking procedures, the Lender may purchase the Original Currency with the Other Currency on |
the Business Day preceding the day on which the final judgment is given or, if permitted by Applicable Law, on the day on which the judgment is paid or satisfied.
| (b) | The obligations of the Borrower in respect of any sum due in the Original Currency from it to the Lender under any of the Loan Documents shall, notwithstanding any judgment in any Other Currency, be discharged only to the extent that on the Business Day following receipt by the Lender of any sum adjudged to be so due in the Other Currency, the Lender may, in accordance with normal banking procedures, purchase the Original Currency with the Other Currency. If the amount of the Original Currency so purchased is less than the sum originally due to the Lender in the Original Currency, the Borrower agrees, as a separate obligation and notwithstanding the judgment, to indemnify the Lender against any loss and, if the amount of the Original Currency so purchased exceeds the sum originally due to the Lender in the Original Currency, the Lender shall remit such excess to the Borrower. |
Section 17.05 Survival.
All covenants, agreements, representations and warranties made by the Borrower in the Loan Documents and in the certificates or other instruments delivered in connection with or pursuant to this Agreement or any other Loan Document shall be considered to have been relied upon by the other parties hereto and shall survive the execution and delivery of the Loan Documents and the making of the Advance, regardless of any investigation made by any such other party or on its behalf and notwithstanding that the Agent or any Lender may have notice or knowledge of any Default or Event of Default or incorrect representation or warranty at the time any credit is extended hereunder, and shall continue in full force and effect as long as the principal of, or any accrued interest on, any Advance or any other amount payable under this Agreement is outstanding and unpaid and so long as the Commitments have not expired or terminated. The provisions of ARTICLE XV shall survive and remain in full force and effect regardless of the consummation of the transactions contemplated hereby, the repayment of the Advance, the expiration or termination of the Commitments or the termination of this Agreement or any provision hereof.
Section 17.06 Counterparts; Effectiveness.
| (a) | This Agreement and any amendments, waivers, consents or supplements hereto may be executed in counterparts (and by different parties hereto on different counterparts), each of which shall constitute an original, but all of which when taken together shall constitute a single contract. Except as provided in ARTICLE VI, this Agreement shall become effective when it shall have been executed by the Agent and when the Agent has received counterparts hereof that, when taken together, bear the signatures of each of the other parties hereto. Delivery of an executed counterpart of a signature page to this Agreement by facsimile or by sending a scanned copy by electronic mail shall be effective as delivery of a manually executed counterpart of this Agreement. |
| (b) | The words “execution,” “signed,” “signature,” and words of similar import in any Loan Document shall be deemed to include electronic or digital signatures or the keeping of records in electronic form, each of which shall be of the same effect, validity and enforceability as manually executed signatures or a paper-based recordkeeping system, as the case may be, to the extent and as provided for under Applicable Law, including the Personal Information Protection and Electronic Documents Act (Canada), the Electronic Commerce Act, 2000 (Ontario) and other similar federal or provincial laws based on the Uniform Electronic Commerce Act of the Uniform Law Conference of Canada or its Uniform Electronic Evidence Act, as the case may be. |
Section 17.07 Severability.
If any term or provision of any Loan Document is invalid, illegal or unenforceable in any jurisdiction, such invalidity, illegality or unenforceability shall not affect any other term or provision thereof or invalidate or render unenforceable such term or provision in any other jurisdiction.
Section 17.08 Governing Law; Jurisdiction.
This Agreement and the other Loan Documents and any claim, controversy, dispute or cause of action (whether in contract or tort or otherwise) based upon, arising out of or relating to this Agreement or any other Loan Document (except, as to any other Loan Document, as expressly set forth therein) and the transactions contemplated hereby and thereby shall be governed by, and construed in accordance with, the laws of the Province of Ontario and the federal laws of Canada applicable therein, without regard to any choice or conflict of laws principles. The parties hereto irrevocably attorn to the non-exclusive jurisdiction of the courts of the Province of Ontario.
Section 17.09 Time of the Essence.
Time is of the essence of this Agreement.
[SIGNATURE PAGE FOLLOWS]
IN WITNESS WHEREOF, the parties hereto have executed this Agreement as of the date first written above.
BORROWER: |
|
MCEWEN COPPER INC., as Borrower |
|
|
|
|
|
McEwen Copper Inc., |
|
By: |
/s/Michael Meding |
150 King Street West, Suite 2800, |
|
Name: |
Michael Meding |
Toronto, Ontario, M5H 1J9 |
|
Title: |
Managing Director |
Attention: General Counsel |
|
|
|
E-mail: notice@mcewenmining.com |
|
|
|
AGENT: |
|
MCEWEN INC., as Agent |
|
|
|
|
|
McEwen Inc. |
|
By: |
/s/Perry Ing |
150 King St. W #2800 |
|
Name: |
Perry Ing |
Toronto, ON M5H 1J9 |
|
Title: |
Chief Financial Officer |
Attention: General Counsel |
|
|
|
E-mail: notice@mcewenmining.com |
|
|
|
LENDERS: |
|
EVANACHAN LIMITED, as a Lender |
|
|
|
|
|
Evanachan Limited |
|
By: |
/s/Robert McEwen |
150 King St. W #2800 |
|
Name: |
Robert R. McEwen |
Toronto, ON M5H 1J9 |
|
Title: |
President |
Attention: Robert McEwen |
|
|
|
E-mail: rob@mcewenmining.com |
|
|
|
|
|
MCEWEN INC. as a Lender |
|
|
|
|
|
McEwen Inc. |
|
By: |
/s/Perry Ing |
150 King St W #2800 |
|
Name: |
Perry Ing |
Toronto, ON M5H 1J9 |
|
Title: |
Chief Financial Officer |
Attention: General Counsel |
|
|
|
E-mail: notice@mcewenmining.com |
|
|
|
William Shaver |
|
/s/William Shaver |
||
1764 South Lane Road |
|
WILLIAM SHAVER |
||
Sudbury, ON P3G 1N8 |
|
|
||
E-mail: wshaver@mcewen.com |
|
|
||
|
|
|
||
Witnessed by: |
|
|
Name of witness: |
|
|
|
|
|
|
EXHIBIT “A”
LENDERS AND COMMITMENTS
Lender |
Applicable Percentage |
Amount |
Evanachan Limited |
75.6% |
$45,000,000 |
McEwen Inc. |
22.7% |
$13,552,000 |
William Shaver |
1.7% |
$1,000,000 |
Total |
100% |
$59,552,000 |
EXHIBIT “B”
LOAN INCREASE AGREEMENT
This AGREEMENT, dated as of [DATE] is made by and among McEwen Copper Inc., the borrower (the “Borrower”), McEwen Inc., as administrative and collateral agent (the “Agent”) and parties executing this agreement as a “Lender” below (the “Lenders”).
RECITALS:
| A. | The Borrower entered into a loan agreement dated effective as of February , 2026 (as amended, amended and restated, renewed, extended, supplemented, replaced or otherwise modified from time to time, the “Loan Agreement”) with the Agent and [Insert existing Lenders] (the “Existing Lenders”) pursuant to which the Existing Lenders have made and will continue to make the Loan Facility available to the Borrower. |
| B. | Pursuant to Section 2.01 of the Loan Agreement and subject to the terms and conditions described therein, the Borrower, the Agent and the [Required Lenders] may agree that the maximum amount of the Advances to be made under the Loan Facility can be increased by entering into this Agreement. |
| C. | [Ÿ (the “New Lender”) has agreed to become a Lender under the Loan Agreement and provide the Commitment set out in Exhibit “A” hereto by making an Advance in the amount of its Commitment on Ÿ.] [NTD: This Agreement to be modified appropriately if Commitments are being increased without the addition of a Lender.] |
The parties hereto agree as follows:
| 4. | Agreements of the New Lender. The New Lender hereby represents, warrants and agrees that: |
| 6. | The Loan Agreement. |
[Signature page follows.]
BORROWER: |
|
MCEWEN COPPER INC., as Borrower |
|
|
|
|
|
McEwen Copper Inc., |
|
By: |
|
150 King Street West, Suite 2800, |
|
Name: |
Michael Meding |
Toronto, Ontario, M5H 1J9 |
|
Title: |
Managing Director |
Attention: |
|
|
|
E-mail: |
|
|
|
AGENT: |
|
MCEWEN INC., as Agent |
|
|
|
|
|
McEwen Inc., |
|
By: |
|
150 King Street West, Suite 2800, |
|
Name: |
Perry Ing |
Toronto, Ontario, M5H 1J9 |
|
Title: |
Chief Financial Officer |
Attention: |
|
|
|
E-mail: |
|
|
|
LENDERS: |
|
|
|
|
|
Evanachan Limited |
|
|
150 King St. W #2800 |
|
|
Toronto, ON M5H 1J9 |
|
|
Attention: Robert McEwen |
|
|
E-mail: rob@mcewenmining.com |
|
|
|
|
EVANACHAN LIMITED, as a Lender |
|
|
|
|
|
McEwen Inc. |
|
By: |
|
150 King St. W #2800 |
|
Name: |
Robert R. McEwen |
Toronto, ON M5H 1J9 |
|
Title: |
President |
Attention: |
|
|
|
E-mail: |
|
|
|
|
|
MCEWEN INC. as a Lender |
|
|
|
|
|
|
|
By: |
|
|
|
Name: |
Perry Ing |
|
|
Title: |
Chief Financial Officer |
|
|
|
|
|
|
|
|
William Shaver |
|
|
||
1764 South Lane Road |
|
WILLIAM SHAVER |
||
Sudbury, ON P3G 1N8 |
|
|
||
E-mail: wshaver@mcewen.com |
|
|
||
|
|
|
||
Witnessed by: |
|
|
Name of witness: |
|
|
|
|
|
|
[Insert address of New Lender] |
|
[NEW LENDER] |
|
Attention: |
|
as New Lender |
|
|
|
|
|
|
|
By: |
|
Email: |
|
Name: |
|
|
|
Title: |
|
SCHEDULE “A” MINING ASSETS
Table 1: Los Azules
N.° |
Tenure ID |
Location |
Property Name |
Area (ha) |
1 |
1124-108-A-10 |
San Juan, Argentina |
Agostina |
1.184,00 |
2 |
520-0279-M-98 |
San Juan, Argentina |
Azul 1 |
2.098,20 |
3 |
520-0280-M-98 |
San Juan, Argentina |
Azul 2 |
1.299,90 |
4 |
1124-0121-A-06 |
San Juan, Argentina |
Azul 3 |
166,76 |
5 |
1124-473-M-08 |
San Juan, Argentina |
Azul 4 |
903,06 |
6 |
1124-119-A-09 |
San Juan, Argentina |
Azul 5 |
3.001,32 |
7 |
1124-186-A-07 |
San Juan, Argentina |
Azul Este |
2.372,48 |
8 |
1124-668-M-07 |
San Juan, Argentina |
Azul Norte |
131,94 |
9 |
1124-35-A-12 |
San Juan, Argentina |
Cecilia |
1.702,26 |
10 |
0153-F28-C-96 |
San Juan, Argentina |
Escorpio I |
168,81 |
11 |
0154-F28-C-96 |
San Juan, Argentina |
Escorpio II |
1.991,00 |
12 |
0155-C-96 |
San Juan, Argentina |
Escorpio III |
199,45 |
13 |
425-213-C-03 |
San Juan, Argentina |
Escorpio IV* |
4.411,71 |
14 |
1124-168-A-10 |
San Juan, Argentina |
Gina |
1.762,99 |
15 |
1124-495-A-09 |
San Juan, Argentina |
Marcela |
2.952,77 |
16 |
0644-F28-M-96 |
San Juan, Argentina |
Mercedes |
836,06 |
17 |
1124-141-M-09 |
San Juan, Argentina |
Mirta |
354,40 |
18 |
1124-169-A-10 |
San Juan, Argentina |
Rosario |
1.768,44 |
19 |
1124-167-A-10 |
San Juan, Argentina |
Sofía |
3.324,97 |
20 |
414-1324-C-05 |
San Juan, Argentina |
Totora |
504,86 |
21 |
520-0496-C-99 |
San Juan, Argentina |
Totora II |
1.561,12 |
N.° |
Tenure ID |
Location |
Property Name |
Area (ha) |
22 |
25-299-C-84 |
San Juan, Argentina |
Soberanía |
179.66 |
23 |
1124-354-A-18 |
San Juan, Argentina |
Power Line Easement |
104,00 km |
24 |
520-0680-M-96 |
San Juan, Argentina |
Southern Road Easement |
79,59 km |
25 |
520-680-M-96 |
San Juan, Argentina |
Aerodrome Occupation Easement |
278,55 ha |
26 |
520-0439-M-97 |
San Juan, Argentina |
Exploration Road Easement |
97,35 km |
27 |
1124-218-A-18 |
San Juan, Argentina |
Northern Road Easement |
103,30 km |
28 |
1124-762-2024 |
San Juan, Argentina |
Closed River Road Easement |
49,60 Km |
29 |
1124.660-A-2012 |
San Juan, Argentina |
Candadito Camp Easement |
4,56 ha |
30 |
1124-544-A-22 |
San Juan, Argentina |
Illanes Mery Field Occupation Easement |
10.108,41 ha |
31 |
1124-231-A-10 |
San Juan, Argentina |
Estomonte Field Occupation Easement |
11.362,86 ha |
Illustration Mining rights: Mine and Easements Table 2: Elder Creek, Nevada (NV)

No. |
Claim Name |
Location |
BLM Serial # |
Legacy BLM |
County Recordin g |
|
NMC Serial # |
|||||
1 |
BBC #37 |
Lander, NV |
NV10136616 5 |
841157 |
224751 |
2 |
BBC #38 |
Lander, NV |
NV10136616 6 |
841158 |
224752 |
3 |
BBC #39 |
Lander, NV |
NV10136695 0 |
841159 |
224753 |
4 |
BBC #40 |
Lander, NV |
NV10136695 1 |
841160 |
224754 |
5 |
BBC #41 |
Lander, NV |
NV10136695 2 |
841161 |
224755 |
6 |
BBC #42 |
Lander, NV |
NV10136695 3 |
841162 |
224756 |
7 |
BBC #43 |
Lander, NV |
NV10136695 4 |
841163 |
224757 |
8 |
BBC #44 |
Lander, NV |
NV10136695 5 |
841164 |
224758 |
9 |
BBC #45 |
Lander, NV |
NV10136695 6 |
841165 |
224759 |
10 |
BBC #46 |
Lander, NV |
NV10136695 7 |
841166 |
224760 |
11 |
BBC #105 |
Lander, NV |
NV10136955 8 |
841225 |
224763 |
12 |
BBC #124 |
Lander, NV |
NV10151714 9 |
841244 |
224765 |
13 |
BBC #133 |
Lander, NV |
NV10151715 8 |
841253 |
224767 |
14 |
BBC #134 |
Lander, NV |
NV10151715 9 |
841254 |
224768 |
15 |
BBC #135 |
Lander, NV |
NV10151716 0 |
841255 |
224681 |
16 |
BBC #136 |
Lander, NV |
NV10151716 1 |
841256 |
224682 |
17 |
BBC #137 |
Lander, NV |
NV10151716 2 |
841257 |
224683 |
18 |
BBC #138 |
Lander, NV |
NV10151716 3 |
841258 |
224684 |
19 |
BBC #139 |
Lander, NV |
NV10151716 4 |
841259 |
224685 |
20 |
BBC #140 |
Lander, NV |
NV10151716 5 |
841260 |
224686 |
21 |
BBC #141 |
Lander, NV |
NV10151716 6 |
841261 |
224687 |
22 |
BBC #142 |
Lander, NV |
NV10151802 3 |
841262 |
224688 |
23 |
BBC #143 |
Lander, NV |
NV10151802 4 |
841263 |
224689 |
24 |
BBC #144 |
Lander, NV |
NV10151802 5 |
841264 |
224690 |
25 |
BBC #145 |
Lander, NV |
NV10151802 6 |
841265 |
224691 |
26 |
BBC #146 |
Lander, NV |
NV10151802 7 |
841266 |
224692 |
27 |
BBC #147 |
Lander, NV |
NV10151802 8 |
841267 |
224693 |
28 |
BBC #148 |
Lander, NV |
NV10151802 9 |
841268 |
224694 |
29 |
BBC #149 |
Lander, NV |
NV10151803 0 |
841269 |
224695 |
30 |
BBC #150 |
Lander, NV |
NV10151803 1 |
841270 |
224696 |
31 |
BBC #151 |
Lander, NV |
NV10151803 2 |
841271 |
224697 |
32 |
BBC #152 |
Lander, NV |
NV10151803 3 |
841272 |
224698 |
33 |
BBC #153 |
Lander, NV |
NV10151803 4 |
841273 |
224769 |
34 |
BBC #154 |
Lander, NV |
NV10151803 5 |
841274 |
224770 |
35 |
BBC #155 |
Lander, NV |
NV10151803 6 |
841275 |
224771 |
36 |
BBC #156 |
Lander, NV |
NV10151803 7 |
841276 |
224772 |
37 |
BBC #157 |
Lander, NV |
NV10151803 8 |
841277 |
224773 |
38 |
BBC #158 |
Lander, NV |
NV10151803 9 |
841278 |
224774 |
39 |
BBC #159 |
Lander, NV |
NV10151804 0 |
841279 |
224699 |
40 |
BBC #160 |
Lander, NV |
NV10151804 1 |
841280 |
224700 |
41 |
BBC #161 |
Lander, NV |
NV10151804 2 |
841281 |
224701 |
42 |
BBC #162 |
Lander, NV |
NV10151804 3 |
841282 |
224702 |
43 |
BBC #163 |
Lander, NV |
NV10151882 3 |
841283 |
224703 |
44 |
BBC #164 |
Lander, NV |
NV10151882 4 |
841284 |
224704 |
45 |
BBC #165 |
Lander, NV |
NV10151882 5 |
841285 |
224705 |
46 |
BBC #166 |
Lander, NV |
NV10151882 6 |
841286 |
224706 |
47 |
BBC #167 |
Lander, NV |
NV10151882 7 |
841287 |
224707 |
48 |
BBC #168 |
Lander, NV |
NV10151882 8 |
841288 |
224708 |
49 |
BBC #169 |
Lander, NV |
NV10151882 9 |
841289 |
224709 |
50 |
BBC #170 |
Lander, NV |
NV10151883 0 |
841290 |
224710 |
51 |
BBC #171 |
Lander, NV |
NV10151883 1 |
841291 |
224711 |
52 |
BBC #172 |
Lander, NV |
NV10151883 2 |
841292 |
224712 |
53 |
BBC #173 |
Lander, NV |
NV10151883 3 |
841293 |
224713 |
54 |
BBC #174 |
Lander, NV |
NV10151883 4 |
841294 |
224714 |
55 |
BBC #175 |
Lander, NV |
NV10151883 5 |
841295 |
224715 |
56 |
BBC #176 |
Lander, NV |
NV10151883 6 |
841296 |
224716 |
57 |
BBC #625 |
Lander, NV |
NV10136537 0 |
842141 |
224804 |
58 |
BBC #626 |
Lander, NV |
NV10136537 1 |
842142 |
224805 |
59 |
BBC #627 |
Lander, NV |
NV10136537 2 |
842143 |
224806 |
60 |
BBC #628 |
Lander, NV |
NV10136537 3 |
842144 |
224807 |
61 |
BBC #629 |
Lander, NV |
NV10136537 4 |
842145 |
224808 |
62 |
BBC #630 |
Lander, NV |
NV10136537 5 |
842146 |
224809 |
63 |
BBC #631 |
Lander, NV |
NV10136537 6 |
842147 |
224810 |
64 |
BBC #632 |
Lander, NV |
NV10136537 7 |
842148 |
224811 |
65 |
BBC #633 |
Lander, NV |
NV10136537 8 |
842149 |
224812 |
66 |
BBC #634 |
Lander, NV |
NV10136537 9 |
842150 |
224813 |
67 |
BBC #635 |
Lander, NV |
NV10136538 0 |
842151 |
224814 |
68 |
BBC #636 |
Lander, NV |
NV10136616 7 |
842152 |
224815 |
69 |
BBC #637 |
Lander, NV |
NV10136616 8 |
842153 |
224816 |
70 |
BBC #638 |
Lander, NV |
NV10136616 9 |
842154 |
224817 |
71 |
BBC #639 |
Lander, NV |
NV10136617 0 |
842155 |
224818 |
72 |
BBC #640 |
Lander, NV |
NV10136617 1 |
842156 |
224819 |
73 |
BBC #641 |
Lander, NV |
NV10136617 2 |
842157 |
224820 |
74 |
BBC #642 |
Lander, NV |
NV10136617 3 |
842158 |
224821 |
75 |
BBC #643 |
Lander, NV |
NV10136617 4 |
842159 |
224822 |
76 |
BBC #644 |
Lander, NV |
NV10136617 5 |
842160 |
224823 |
77 |
BBC #645 |
Lander, NV |
NV10136617 6 |
842161 |
224824 |
78 |
BBC #646 |
Lander, NV |
NV10136617 7 |
842162 |
224825 |
79 |
BBC #647 |
Lander, NV |
NV10136617 8 |
842163 |
224826 |
80 |
BBC #648 |
Lander, NV |
NV10136617 9 |
842164 |
224827 |
81 |
MOTE #181 |
Lander, NV |
NV10136792 0 |
843698 |
225347 |
82 |
MOTE #182 |
Lander, NV |
NV10136792 1 |
843699 |
225348 |
83 |
MOTE #183 |
Lander, NV |
NV10136792 2 |
843700 |
225349 |
84 |
MOTE #184 |
Lander, NV |
NV10136792 3 |
843701 |
225350 |
85 |
MOTE #185 |
Lander, NV |
NV10136792 4 |
843702 |
225351 |
86 |
MOTE #186 |
Lander, NV |
NV10136792 5 |
843703 |
225352 |
87 |
MOTE #187 |
Lander, NV |
NV10136792 6 |
843704 |
225353 |
88 |
MOTE #188 |
Lander, NV |
NV10136792 7 |
843705 |
225354 |
89 |
MOTE #189 |
Lander, NV |
NV10136792 8 |
843706 |
225355 |
90 |
MOTE #190 |
Lander, NV |
NV10136792 9 |
843707 |
225356 |
91 |
MOTE #191 |
Lander, NV |
NV10136793 0 |
843708 |
225357 |
92 |
MOTE #192 |
Lander, NV |
NV10136793 1 |
843709 |
225358 |
93 |
MOTE #193 |
Lander, NV |
NV10136793 2 |
843710 |
225359 |
94 |
MOTE #194 |
Lander, NV |
NV10136793 3 |
843711 |
225360 |
95 |
MOTE #195 |
Lander, NV |
NV10136793 4 |
843712 |
225361 |
96 |
MOTE #196 |
Lander, NV |
NV10136793 5 |
843713 |
225362 |
97 |
MOTE #197 |
Lander, NV |
NV10136793 6 |
843714 |
225363 |
98 |
MOTE #198 |
Lander, NV |
NV10136793 7 |
843715 |
225364 |
99 |
MOTE #199 |
Lander, NV |
NV10136793 8 |
843716 |
225365 |
100 |
MOTE #200 |
Lander, NV |
NV10136878 1 |
843717 |
225366 |
101 |
MOTE #201 |
Lander, NV |
NV10136878 2 |
843718 |
225367 |
102 |
MOTE #202 |
Lander, NV |
NV10136878 3 |
843719 |
225368 |
103 |
MOTE #203 |
Lander, NV |
NV10136878 4 |
843720 |
225369 |
104 |
MOTE #204 |
Lander, NV |
NV10136878 5 |
843721 |
225370 |
105 |
MOTE #205 |
Lander, NV |
NV10136878 6 |
843722 |
225371 |
106 |
MOTE #206 |
Lander, NV |
NV10136878 7 |
843723 |
225372 |
107 |
MOTE #207 |
Lander, NV |
NV10136878 8 |
843724 |
225373 |
108 |
MOTE #208 |
Lander, NV |
NV10136878 9 |
843725 |
225374 |
109 |
MOTE #209 |
Lander, NV |
NV10136879 0 |
843726 |
225375 |
110 |
MOTE #210 |
Lander, NV |
NV10136879 1 |
843727 |
225376 |
111 |
MOTE #211 |
Lander, NV |
NV10136879 2 |
843728 |
225377 |
112 |
LP 1 |
Lander, NV |
NV10162463 0 |
862186 |
230380 |
113 |
LP 2 |
Lander, NV |
NV10162501 0 |
862187 |
230381 |
114 |
LP 3A |
Lander, NV |
NV10162501 1 |
862188 |
230382 |
115 |
LP 4A |
Lander, NV |
NV10162501 2 |
862189 |
230383 |
116 |
LP 5A |
Lander, NV |
NV10162501 3 |
862190 |
230384 |
117 |
LP 6A |
Lander, NV |
NV10162501 4 |
862191 |
230385 |
118 |
BBC #47 |
Humboldt and Lander, NV |
NV10136695 8 |
841167 |
224761 |
119 |
BBC #48 |
Humboldt and Lander, NV |
NV10136695 9 |
841168 |
224762 |
120 |
BBC #123 |
Humboldt and Lander, NV |
NV10151714 8 |
841243 |
224764 |
121 |
BBC #132 |
Humboldt and Lander, NV |
NV10151715 7 |
841252 |
224766 |
122 |
BBC 1 |
Humboldt, NV |
NV10151527 7 |
888766 |
2005-489 |
123 |
BBC 2 |
Humboldt, NV |
NV10151527 8 |
888767 |
2005-490 |
124 |
BBC 3 |
Humboldt, NV |
NV10151527 9 |
888768 |
2005-491 |
125 |
BBC 4 |
Humboldt, NV |
NV10151528 0 |
888769 |
2005-492 |
126 |
BBC 5 |
Humboldt, NV |
NV10151528 1 |
888770 |
2005-493 |
127 |
BBC 6 |
Humboldt, NV |
NV10151528 2 |
888771 |
2005-494 |
128 |
BBC 7 |
Humboldt, NV |
NV10151528 3 |
888772 |
2005-495 |
129 |
BBC 8 |
Humboldt, NV |
NV10151528 4 |
888773 |
2005-496 |
130 |
BBC 9 |
Humboldt, NV |
NV10151528 5 |
888774 |
2005-497 |
131 |
BBC 10 |
Humboldt, NV |
NV10151646 5 |
888775 |
2005-498 |
132 |
BBC 11 |
Humboldt, NV |
NV10151646 6 |
888776 |
2005-499 |
133 |
BBC 12 |
Humboldt, NV |
NV10151646 7 |
888777 |
2005-500 |
134 |
BBC 13 |
Humboldt, NV |
NV10151646 8 |
888778 |
2005-501 |
135 |
BBC 14 |
Humboldt, NV |
NV10151660 1 |
888779 |
2005-502 |
136 |
BBC 15 |
Humboldt, NV |
NV10151660 2 |
888780 |
2005-503 |
137 |
BBC 16 |
Humboldt, NV |
NV10151660 3 |
888781 |
2005-504 |
138 |
BBC 17 |
Humboldt, NV |
NV10151660 4 |
888782 |
2005-505 |
139 |
BBC 18 |
Humboldt, NV |
NV10151660 5 |
888783 |
2005-506 |
140 |
BBC 213 |
Humboldt, NV |
NV10151660 6 |
888784 |
2005-508 |
141 |
BBC 214 |
Humboldt, NV |
NV10151660 7 |
888785 |
2005-509 |
142 |
BBC 215 |
Humboldt, NV |
NV10151660 8 |
888786 |
2005-510 |
143 |
BBC 216 |
Humboldt, NV |
NV10151660 9 |
888787 |
2005-511 |
144 |
BBC 217 |
Humboldt, NV |
NV10151661 0 |
888788 |
2005-512 |
145 |
BBC 218 |
Humboldt, NV |
NV10151661 1 |
888789 |
2005-513 |
146 |
BBC 219 |
Humboldt, NV |
NV10151661 2 |
888790 |
2005-514 |
147 |
BBC 220 |
Humboldt, NV |
NV10151661 3 |
888791 |
2005-515 |
148 |
BBC 221 |
Humboldt, NV |
NV10252242 9 |
888792 |
2005-516 |
149 |
BBC 222 |
Humboldt, NV |
NV10252243 0 |
888793 |
2005-517 |
150 |
BBC 223 |
Humboldt, NV |
NV10252243 1 |
888794 |
2005-518 |
151 |
BBC 224 |
Humboldt, NV |
NV10252243 2 |
888795 |
2005-519 |
152 |
BBC 225 |
Humboldt, NV |
NV10252243 3 |
888796 |
2005-520 |
153 |
BBC 226 |
Humboldt, NV |
NV10252243 4 |
888797 |
2005-521 |
154 |
BBC 227 |
Humboldt, NV |
NV10252243 5 |
888798 |
2005-522 |
155 |
BBC 228 |
Humboldt, NV |
NV10252243 6 |
888799 |
2005-523 |
156 |
BBC 229 |
Humboldt, NV |
NV10252243 7 |
888800 |
2005-524 |
157 |
BBC 230 |
Humboldt, NV |
NV10252243 8 |
888801 |
2005-525 |
158 |
BBC 231 |
Humboldt, NV |
NV10252243 9 |
888802 |
2005-526 |
159 |
BBC 232 |
Humboldt, NV |
NV10252244 0 |
888803 |
2005-527 |
160 |
BBC 233 |
Humboldt, NV |
NV10252244 1 |
888804 |
2005-528 |
161 |
BBC 234 |
Humboldt, NV |
NV10252244 2 |
888805 |
2005-529 |
162 |
BBC 235 |
Humboldt, NV |
NV10252244 3 |
888806 |
2005-530 |
163 |
BBC 236 |
Humboldt, NV |
NV10252244 4 |
888807 |
2005-531 |
164 |
BBC 237 |
Humboldt, NV |
NV10252244 5 |
888808 |
2005-532 |
165 |
BBC 238 |
Humboldt, NV |
NV10252244 6 |
888809 |
2005-533 |
166 |
BBC 239 |
Humboldt, NV |
NV10252244 7 |
888810 |
2005-534 |
167 |
BBC 240 |
Humboldt, NV |
NV10252244 8 |
888811 |
2005-535 |
168 |
BBC 241 |
Humboldt, NV |
NV10252244 9 |
888812 |
2005-536 |
169 |
BBC 242 |
Humboldt, NV |
NV10252366 5 |
888813 |
2005-537 |
170 |
BBC 243 |
Humboldt, NV |
NV10252366 6 |
888814 |
2005-538 |
171 |
BBC 244 |
Humboldt, NV |
NV10252366 7 |
888815 |
2005-539 |
172 |
BBC 245 |
Humboldt, NV |
NV10252366 8 |
888816 |
2005-540 |
173 |
BBC 246 |
Humboldt, NV |
NV10252366 9 |
888817 |
2005-541 |
174 |
BBC 247 |
Humboldt, NV |
NV10252367 0 |
888818 |
2005-542 |
175 |
BBC 248 |
Humboldt, NV |
NV10252367 1 |
888819 |
2005-543 |
176 |
BBC 321 |
Humboldt, NV |
NV10252367 2 |
888820 |
2005-545 |
177 |
BBC 322 |
Humboldt, NV |
NV10252367 3 |
888821 |
2005-546 |
178 |
BBC 323 |
Humboldt, NV |
NV10252367 4 |
888822 |
2005-547 |
179 |
BBC 324 |
Humboldt, NV |
NV10252367 5 |
888823 |
2005-548 |
180 |
BBC 325 |
Humboldt, NV |
NV10252367 6 |
888824 |
2005-549 |
181 |
BBC 326 |
Humboldt, NV |
NV10252367 7 |
888825 |
2005-550 |
182 |
BBC 327 |
Humboldt, NV |
NV10252367 8 |
888826 |
2005-551 |
183 |
BBC 328 |
Humboldt, NV |
NV10252367 9 |
888827 |
2005-552 |
184 |
BBC 329 |
Humboldt, NV |
NV10252368 0 |
888828 |
2005-553 |
185 |
BBC 330 |
Humboldt, NV |
NV10252368 1 |
888829 |
2005-554 |
186 |
BBC 331 |
Humboldt, NV |
NV10252368 2 |
888830 |
2005-555 |
187 |
BBC 332 |
Humboldt, NV |
NV10252368 3 |
888831 |
2005-556 |
188 |
BBC 333 |
Humboldt, NV |
NV10252368 4 |
888832 |
2005-557 |
189 |
BBC 334 |
Humboldt, NV |
NV10252368 5 |
888833 |
2005-558 |
190 |
BBC 335 |
Humboldt, NV |
NV10252488 5 |
888834 |
2005-559 |
191 |
BBC 336 |
Humboldt, NV |
NV10252488 6 |
888835 |
2005-560 |
192 |
BBC 337 |
Humboldt, NV |
NV10252488 7 |
888836 |
2005-561 |
193 |
BBC 338 |
Humboldt, NV |
NV10252488 8 |
888837 |
2005-562 |
194 |
BBC 339 |
Humboldt, NV |
NV10252488 9 |
888838 |
2005-563 |
195 |
BBC 340 |
Humboldt, NV |
NV10252489 0 |
888839 |
2005-564 |
196 |
BBC 341 |
Humboldt, NV |
NV10252489 1 |
888840 |
2005-565 |
197 |
BBC 342 |
Humboldt, NV |
NV10252489 2 |
888841 |
2005-566 |
198 |
BBC 343 |
Humboldt, NV |
NV10252489 3 |
888842 |
2005-567 |
199 |
BBC 344 |
Humboldt, NV |
NV10252489 4 |
888843 |
2005-568 |
200 |
BBC 345 |
Humboldt, NV |
NV10252489 5 |
888844 |
2005-569 |
201 |
BBC 346 |
Humboldt, NV |
NV10252489 6 |
888845 |
2005-570 |
202 |
BBC 347 |
Humboldt, NV |
NV10252489 7 |
888846 |
2005-571 |
203 |
BBC 348 |
Humboldt, NV |
NV10252489 8 |
888847 |
2005-572 |
204 |
BBC 349 |
Humboldt, NV |
NV10252489 9 |
888848 |
2005-573 |
205 |
BBC 350 |
Humboldt, NV |
NV10252490 0 |
888849 |
2005-574 |
206 |
BBC 351 |
Humboldt, NV |
NV10252490 1 |
888850 |
2005-575 |
207 |
BBC 352 |
Humboldt, NV |
NV10252490 2 |
888851 |
2005-576 |
208 |
BBC 353 |
Humboldt, NV |
NV10252490 3 |
888852 |
2005-577 |
209 |
BBC 354 |
Humboldt, NV |
NV10252490 4 |
888853 |
2005-578 |
210 |
BBC 355 |
Humboldt, NV |
NV10252490 5 |
888854 |
2005-579 |
211 |
BBC 356 |
Humboldt, NV |
NV10131146 4 |
888855 |
2005-580 |
212 |
MOTE #1 |
Humboldt, NV |
NV10136200 3 |
835945 |
2002-6081 |
213 |
MOTE #2 |
Humboldt, NV |
NV10136200 4 |
835946 |
2002-6082 |
214 |
MOTE #3 |
Humboldt, NV |
NV10136200 5 |
835947 |
2002-6083 |
215 |
MOTE #4 |
Humboldt, NV |
NV10136200 6 |
835948 |
2002-6084 |
216 |
MOTE #5 |
Humboldt, NV |
NV10136200 7 |
835949 |
2002-6085 |
217 |
MOTE #6 |
Humboldt, NV |
NV10136200 8 |
835950 |
2002-6086 |
218 |
MOTE #7 |
Humboldt, NV |
NV10136200 9 |
835951 |
2002-6087 |
219 |
MOTE #8 |
Humboldt, NV |
NV10136201 0 |
835952 |
2002-6088 |
220 |
MOTE #9 |
Humboldt, NV |
NV10136201 1 |
835953 |
2002-6089 |
221 |
MOTE #10 |
Humboldt, NV |
NV10136201 2 |
835954 |
2002-6090 |
222 |
MOTE #11 |
Humboldt, NV |
NV10136201 3 |
835955 |
2002-6091 |
223 |
MOTE #12 |
Humboldt, NV |
NV10136201 4 |
835956 |
2002-6092 |
224 |
MOTE #13 |
Humboldt, NV |
NV10136201 5 |
835957 |
2002-6093 |
225 |
MOTE #14 |
Humboldt, NV |
NV10136201 6 |
835958 |
2002-6094 |
226 |
MOTE #15 |
Humboldt, NV |
NV10136201 7 |
835959 |
2002-6095 |
227 |
MOTE #16 |
Humboldt, NV |
NV10136201 8 |
835960 |
2002-6096 |
228 |
MOTE #17 |
Humboldt, NV |
NV10136201 9 |
835961 |
2002-6097 |
229 |
MOTE #18 |
Humboldt, NV |
NV10136202 0 |
835962 |
2002-6098 |
230 |
MOTE #19 |
Humboldt, NV |
NV10136202 1 |
835963 |
2002-6099 |
231 |
MOTE #20 |
Humboldt, NV |
NV10136202 2 |
835964 |
2002-6100 |
232 |
MOTE #21 |
Humboldt, NV |
NV10136282 4 |
835965 |
2002-6101 |
233 |
MOTE #22 |
Humboldt, NV |
NV10136282 5 |
835966 |
2002-6102 |
234 |
MOTE #23 |
Humboldt, NV |
NV10136282 6 |
835967 |
2002-6103 |
235 |
MOTE #24 |
Humboldt, NV |
NV10136282 7 |
835968 |
2002-6104 |
236 |
MOTE #25 |
Humboldt, NV |
NV10136282 8 |
835969 |
2002-6105 |
237 |
MOTE #26 |
Humboldt, NV |
NV10136282 9 |
835970 |
2002-6106 |
238 |
MOTE #27 |
Humboldt, NV |
NV10136283 0 |
835971 |
2002-6107 |
239 |
MOTE #28 |
Humboldt, NV |
NV10136283 1 |
835972 |
2002-6108 |
240 |
MOTE #29 |
Humboldt, NV |
NV10136283 2 |
835973 |
2002-6109 |
241 |
MOTE #30 |
Humboldt, NV |
NV10136283 3 |
835974 |
2002-6110 |
242 |
MOTE #31 |
Humboldt, NV |
NV10136283 4 |
835975 |
2002-6111 |
243 |
MOTE #32 |
Humboldt, NV |
NV10136283 5 |
835976 |
2002-6112 |
244 |
MOTE #33 |
Humboldt, NV |
NV10136283 6 |
835977 |
2002-6113 |
245 |
MOTE #34 |
Humboldt, NV |
NV10136283 7 |
835978 |
2002-6114 |
246 |
MOTE #35 |
Humboldt, NV |
NV10136283 8 |
835979 |
2002-6115 |
247 |
MOTE #36 |
Humboldt, NV |
NV10136283 9 |
835980 |
2002-6116 |
248 |
MOTE #37 |
Humboldt, NV |
NV10136284 0 |
835981 |
2002-6117 |
249 |
MOTE #38 |
Humboldt, NV |
NV10136284 1 |
835982 |
2002-6118 |
250 |
MOTE #39 |
Humboldt, NV |
NV10136284 2 |
835983 |
2002-6119 |
251 |
MOTE #40 |
Humboldt, NV |
NV10136284 3 |
835984 |
2002-6120 |
252 |
MOTE #41 |
Humboldt, NV |
NV10136284 4 |
835985 |
2002-6121 |
253 |
MOTE #42 |
Humboldt, NV |
NV10136363 6 |
835986 |
2002-6122 |
254 |
MOTE #43 |
Humboldt, NV |
NV10136363 7 |
835987 |
2002-6123 |
255 |
MOTE #44 |
Humboldt, NV |
NV10136363 8 |
835988 |
2002-6124 |
256 |
MOTE #45 |
Humboldt, NV |
NV10136363 9 |
835989 |
2002-6125 |
257 |
MOTE #46 |
Humboldt, NV |
NV10136364 0 |
835990 |
2002-6126 |
258 |
MOTE #47 |
Humboldt, NV |
NV10136364 1 |
835991 |
2002-6127 |
259 |
MOTE #48 |
Humboldt, NV |
NV10136364 2 |
835992 |
2002-6128 |
260 |
MOTE #49 |
Humboldt, NV |
NV10136364 3 |
835993 |
2002-6129 |
261 |
MOTE #50 |
Humboldt, NV |
NV10136364 4 |
835994 |
2002-6130 |
262 |
MOTE #51 |
Humboldt, NV |
NV10136364 5 |
835995 |
2002-6131 |
263 |
MOTE #52 |
Humboldt, NV |
NV10136364 6 |
835996 |
2002-6132 |
264 |
MOTE #53 |
Humboldt, NV |
NV10136364 7 |
835997 |
2002-6133 |
265 |
MOTE #54 |
Humboldt, NV |
NV10136364 8 |
835998 |
2002-6134 |
266 |
MOTE #55 |
Humboldt, NV |
NV10136364 9 |
835999 |
2002-6135 |
267 |
MOTE #56 |
Humboldt, NV |
NV10136365 0 |
836000 |
2002-6136 |
268 |
MOTE #129 |
Humboldt, NV |
NV10136365 1 |
836001 |
2002-6137 |
269 |
MOTE #130 |
Humboldt, NV |
NV10136365 2 |
836002 |
2002-6138 |
270 |
MOTE #131 |
Humboldt, NV |
NV10136365 3 |
836003 |
2002-6139 |
271 |
MOTE #132 |
Humboldt, NV |
NV10136365 4 |
836004 |
2002-6140 |
272 |
MOTE #133 |
Humboldt, NV |
NV10136365 5 |
836005 |
2002-6141 |
273 |
MOTE #134 |
Humboldt, NV |
NV10136365 6 |
836006 |
2002-6142 |
274 |
MOTE #135 |
Humboldt, NV |
NV10136446 5 |
836007 |
2002-6143 |
275 |
MOTE #136 |
Humboldt, NV |
NV10136446 6 |
836008 |
2002-6144 |
276 |
MOTE #137 |
Humboldt, NV |
NV10136446 7 |
836009 |
2002-6145 |
277 |
MOTE #138 |
Humboldt, NV |
NV10136446 8 |
836010 |
2002-6146 |
278 |
MOTE #139 |
Humboldt, NV |
NV10136446 9 |
836011 |
2002-6147 |
279 |
MOTE #140 |
Humboldt, NV |
NV10136447 0 |
836012 |
2002-6148 |
280 |
MOTE #141 |
Humboldt, NV |
NV10136447 1 |
836013 |
2002-6149 |
281 |
MOTE #142 |
Humboldt, NV |
NV10136447 2 |
836014 |
2002-6150 |
282 |
MOTE #143 |
Humboldt, NV |
NV10136447 3 |
836015 |
2002-6151 |
283 |
MOTE #144 |
Humboldt, NV |
NV10136447 4 |
836016 |
2002-6152 |
284 |
MOTE #145 |
Humboldt, NV |
NV10136447 5 |
836017 |
2002-6153 |
285 |
MOTE #146 |
Humboldt, NV |
NV10136447 6 |
836018 |
2002-6154 |
286 |
MOTE #147 |
Humboldt, NV |
NV10136447 7 |
836019 |
2002-6155 |
287 |
MOTE #148 |
Humboldt, NV |
NV10136447 8 |
836020 |
2002-6156 |
288 |
BBC #19 |
Humboldt, NV |
NV10136126 7 |
839953 |
2003-37 |
289 |
BBC #20 |
Humboldt, NV |
NV10136126 8 |
839954 |
2003-38 |
290 |
BBC #21 |
Humboldt, NV |
NV10136126 9 |
839955 |
2003-39 |
291 |
BBC #22 |
Humboldt, NV |
NV10136127 0 |
839956 |
2003-40 |
292 |
BBC #23 |
Humboldt, NV |
NV10136127 1 |
839957 |
2003-41 |
293 |
BBC #24 |
Humboldt, NV |
NV10136127 2 |
839958 |
2003-42 |
294 |
BBC #25 |
Humboldt, NV |
NV10136127 3 |
839959 |
2003-43 |
295 |
BBC #26 |
Humboldt, NV |
NV10136127 4 |
839960 |
2003-44 |
296 |
BBC #27 |
Humboldt, NV |
NV10136127 5 |
839961 |
2003-45 |
297 |
BBC #28 |
Humboldt, NV |
NV10136127 6 |
839962 |
2003-46 |
298 |
BBC #29 |
Humboldt, NV |
NV10136206 5 |
839963 |
2003-47 |
299 |
BBC #30 |
Humboldt, NV |
NV10136206 6 |
839964 |
2003-48 |
300 |
BBC #31 |
Humboldt, NV |
NV10136206 7 |
839965 |
2003-49 |
301 |
BBC #32 |
Humboldt, NV |
NV10136206 8 |
839966 |
2003-50 |
302 |
BBC #33 |
Humboldt, NV |
NV10136206 9 |
839967 |
2003-51 |
303 |
BBC #34 |
Humboldt, NV |
NV10136207 0 |
839968 |
2003-52 |
304 |
BBC #35 |
Humboldt, NV |
NV10136207 1 |
839969 |
2003-53 |
305 |
BBC #36 |
Humboldt, NV |
NV10136207 2 |
839970 |
2003-54 |
306 |
MOTE #93 |
Humboldt, NV |
NV10136207 3 |
839971 |
2003-56 |
307 |
MOTE #94 |
Humboldt, NV |
NV10136207 4 |
839972 |
2003-57 |
308 |
MOTE #95 |
Humboldt, NV |
NV10136207 5 |
839973 |
2003-58 |
309 |
MOTE #96 |
Humboldt, NV |
NV10136207 6 |
839974 |
2003-59 |
310 |
MOTE #97 |
Humboldt, NV |
NV10136207 7 |
839975 |
2003-60 |
311 |
MOTE #98 |
Humboldt, NV |
NV10136207 8 |
839976 |
2003-61 |
312 |
MOTE #99 |
Humboldt, NV |
NV10136207 9 |
839977 |
2003-62 |
313 |
MOTE #100 |
Humboldt, NV |
NV10136208 0 |
839978 |
2003-63 |
314 |
MOTE #101 |
Humboldt, NV |
NV10136208 1 |
839979 |
2003-64 |
315 |
MOTE #102 |
Humboldt, NV |
NV10136208 2 |
839980 |
2003-65 |
316 |
MOTE #103 |
Humboldt, NV |
NV10136208 3 |
839981 |
2003-66 |
317 |
MOTE #104 |
Humboldt, NV |
NV10136208 4 |
839982 |
2003-67 |
318 |
MOTE #105 |
Humboldt, NV |
NV10136208 5 |
839983 |
2003-68 |
319 |
MOTE #106 |
Humboldt, NV |
NV10136288 7 |
839984 |
2003-69 |
320 |
MOTE #107 |
Humboldt, NV |
NV10136288 8 |
839985 |
2003-70 |
321 |
MOTE #108 |
Humboldt, NV |
NV10136288 9 |
839986 |
2003-71 |
322 |
MOTE #109 |
Humboldt, NV |
NV10136289 0 |
839987 |
2003-72 |
323 |
MOTE #110 |
Humboldt, NV |
NV10136289 1 |
839988 |
2003-73 |
324 |
MOTE #111 |
Humboldt, NV |
NV10136289 2 |
839989 |
2003-74 |
325 |
MOTE #112 |
Humboldt, NV |
NV10136289 3 |
839990 |
2003-75 |
326 |
MOTE #113 |
Humboldt, NV |
NV10136289 4 |
839991 |
2003-76 |
327 |
MOTE #114 |
Humboldt, NV |
NV10136289 5 |
839992 |
2003-77 |
328 |
MOTE #115 |
Humboldt, NV |
NV10136289 6 |
839993 |
2003-78 |
329 |
MOTE #116 |
Humboldt, NV |
NV10136289 7 |
839994 |
2003-79 |
330 |
MOTE #117 |
Humboldt, NV |
NV10136289 8 |
839995 |
2003-80 |
331 |
MOTE #118 |
Humboldt, NV |
NV10136289 9 |
839996 |
2003-81 |
332 |
MOTE #119 |
Humboldt, NV |
NV10136290 0 |
839997 |
2003-82 |
333 |
MOTE #120 |
Humboldt, NV |
NV10136290 1 |
839998 |
2003-83 |
334 |
MOTE #121 |
Humboldt, NV |
NV10136290 2 |
839999 |
2003-84 |
335 |
MOTE #122 |
Humboldt, NV |
NV10136290 3 |
840000 |
2003-85 |
336 |
MOTE #123 |
Humboldt, NV |
NV10136290 4 |
840001 |
2003-86 |
337 |
MOTE #124 |
Humboldt, NV |
NV10136290 5 |
840002 |
2003-87 |
338 |
MOTE #125 |
Humboldt, NV |
NV10136290 6 |
840003 |
2003-88 |
339 |
MOTE #126 |
Humboldt, NV |
NV10136290 7 |
840004 |
2003-89 |
340 |
MOTE #127 |
Humboldt, NV |
NV10136370 0 |
840005 |
2003-90 |
341 |
MOTE #128 |
Humboldt, NV |
NV10136370 1 |
840006 |
2003-91 |
342 |
BBC #393 |
Humboldt, NV |
NV10136370 2 |
840079 |
2003-167 |
343 |
BBC #394 |
Humboldt, NV |
NV10136370 3 |
840080 |
2003-168 |
344 |
BBC #395 |
Humboldt, NV |
NV10136370 4 |
840081 |
2003-169 |
345 |
BBC #396 |
Humboldt, NV |
NV10136370 5 |
840082 |
2003-170 |
346 |
BBC #397 |
Humboldt, NV |
NV10136370 6 |
840083 |
2003-171 |
347 |
BBC #398 |
Humboldt, NV |
NV10136370 7 |
840084 |
2003-172 |
348 |
BBC #399 |
Humboldt, NV |
NV10136370 8 |
840085 |
2003-173 |
349 |
BBC #400 |
Humboldt, NV |
NV10136370 9 |
840086 |
2003-174 |
350 |
BBC #401 |
Humboldt, NV |
NV10136371 0 |
840087 |
2003-175 |
351 |
BBC #402 |
Humboldt, NV |
NV10136371 1 |
840088 |
2003-176 |
352 |
BBC #403 |
Humboldt, NV |
NV10136371 2 |
840089 |
2003-177 |
353 |
BBC #404 |
Humboldt, NV |
NV10136371 3 |
840090 |
2003-178 |
354 |
BBC #405 |
Humboldt, NV |
NV10136371 4 |
840091 |
2003-179 |
355 |
BBC #406 |
Humboldt, NV |
NV10136371 5 |
840092 |
2003-180 |
356 |
BBC #407 |
Humboldt, NV |
NV10136371 6 |
840093 |
2003-181 |
357 |
BBC #408 |
Humboldt, NV |
NV10136371 7 |
840094 |
2003-182 |
358 |
BBC #409 |
Humboldt, NV |
NV10136371 8 |
840095 |
2003-183 |
359 |
BBC #410 |
Humboldt, NV |
NV10136371 9 |
840096 |
2003-184 |
360 |
BBC #411 |
Humboldt, NV |
NV10136372 0 |
840097 |
2003-185 |
361 |
BBC #412 |
Humboldt, NV |
NV10136453 0 |
840098 |
2003-186 |
362 |
BBC #413 |
Humboldt, NV |
NV10136453 1 |
840099 |
2003-187 |
363 |
BBC #414 |
Humboldt, NV |
NV10136453 2 |
840100 |
2003-188 |
364 |
BBC #415 |
Humboldt, NV |
NV10136453 3 |
840101 |
2003-189 |
365 |
BBC #416 |
Humboldt, NV |
NV10136453 4 |
840102 |
2003-190 |
366 |
BBC #417 |
Humboldt, NV |
NV10136453 5 |
840103 |
2003-191 |
367 |
BBC #418 |
Humboldt, NV |
NV10136453 6 |
840104 |
2003-192 |
368 |
BBC #419 |
Humboldt, NV |
NV10136453 7 |
840105 |
2003-193 |
369 |
BBC #420 |
Humboldt, NV |
NV10136453 8 |
840106 |
2003-194 |
370 |
BBC #421 |
Humboldt, NV |
NV10136453 9 |
840107 |
2003-195 |
371 |
BBC #422 |
Humboldt, NV |
NV10136454 0 |
840108 |
2003-196 |
372 |
BBC #423 |
Humboldt, NV |
NV10136454 1 |
840109 |
2003-197 |
373 |
BBC #424 |
Humboldt, NV |
NV10136454 2 |
840110 |
2003-198 |
374 |
BBC #425 |
Humboldt, NV |
NV10136454 3 |
840111 |
2003-199 |
375 |
BBC #426 |
Humboldt, NV |
NV10136454 4 |
840112 |
2003-200 |
376 |
BBC #427 |
Humboldt, NV |
NV10136454 5 |
840113 |
2003-201 |
377 |
BBC #428 |
Humboldt, NV |
NV10136454 6 |
840114 |
2003-202 |
378 |
BBC #49 |
Humboldt, NV |
NV10136696 0 |
841169 |
2003-421 |
379 |
BBC #50 |
Humboldt, NV |
NV10136700 1 |
841170 |
2003-422 |
380 |
BBC #51 |
Humboldt, NV |
NV10136700 2 |
841171 |
2003-423 |
381 |
BBC #52 |
Humboldt, NV |
NV10136700 3 |
841172 |
2003-424 |
382 |
BBC #53 |
Humboldt, NV |
NV10136700 4 |
841173 |
2003-425 |
383 |
BBC #54 |
Humboldt, NV |
NV10136700 5 |
841174 |
2003-426 |
384 |
BBC #55 |
Humboldt, NV |
NV10136700 6 |
841175 |
2003-427 |
385 |
BBC #56 |
Humboldt, NV |
NV10136700 7 |
841176 |
2003-428 |
386 |
BBC #57 |
Humboldt, NV |
NV10136700 8 |
841177 |
2003-429 |
387 |
BBC #58 |
Humboldt, NV |
NV10136700 9 |
841178 |
2003-430 |
388 |
BBC #59 |
Humboldt, NV |
NV10136701 0 |
841179 |
2003-431 |
389 |
BBC #60 |
Humboldt, NV |
NV10136785 7 |
841180 |
2003-432 |
390 |
BBC #61 |
Humboldt, NV |
NV10136785 8 |
841181 |
2003-433 |
391 |
BBC #62 |
Humboldt, NV |
NV10136785 9 |
841182 |
2003-434 |
392 |
BBC #63 |
Humboldt, NV |
NV10136786 0 |
841183 |
2003-435 |
393 |
BBC #64 |
Humboldt, NV |
NV10136786 1 |
841184 |
2003-436 |
394 |
BBC #65 |
Humboldt, NV |
NV10136786 2 |
841185 |
2003-437 |
395 |
BBC #66 |
Humboldt, NV |
NV10136786 3 |
841186 |
2003-438 |
396 |
BBC #67 |
Humboldt, NV |
NV10136786 4 |
841187 |
2003-439 |
397 |
BBC #68 |
Humboldt, NV |
NV10136786 5 |
841188 |
2003-440 |
398 |
BBC #69 |
Humboldt, NV |
NV10136786 6 |
841189 |
2003-441 |
399 |
BBC #70 |
Humboldt, NV |
NV10136786 7 |
841190 |
2003-442 |
400 |
BBC #71 |
Humboldt, NV |
NV10136786 8 |
841191 |
2003-443 |
401 |
BBC #72 |
Humboldt, NV |
NV10136786 9 |
841192 |
2003-444 |
402 |
BBC #73 |
Humboldt, NV |
NV10136787 0 |
841193 |
2003-576 |
403 |
BBC #74 |
Humboldt, NV |
NV10136787 1 |
841194 |
2003-577 |
404 |
BBC #75 |
Humboldt, NV |
NV10136787 2 |
841195 |
2003-578 |
405 |
BBC #76 |
Humboldt, NV |
NV10136787 3 |
841196 |
2003-579 |
406 |
BBC #77 |
Humboldt, NV |
NV10136787 4 |
841197 |
2003-580 |
407 |
BBC #78 |
Humboldt, NV |
NV10136787 5 |
841198 |
2003-581 |
408 |
BBC #79 |
Humboldt, NV |
NV10136871 8 |
841199 |
2003-582 |
409 |
BBC #80 |
Humboldt, NV |
NV10136871 9 |
841200 |
2003-583 |
410 |
BBC #81 |
Humboldt, NV |
NV10136872 0 |
841201 |
2003-584 |
411 |
BBC #82 |
Humboldt, NV |
NV10136872 1 |
841202 |
2003-585 |
412 |
BBC #83 |
Humboldt, NV |
NV10136872 2 |
841203 |
2003-586 |
413 |
BBC #84 |
Humboldt, NV |
NV10136872 3 |
841204 |
2003-587 |
414 |
BBC #85 |
Humboldt, NV |
NV10136872 4 |
841205 |
2003-588 |
415 |
BBC #86 |
Humboldt, NV |
NV10136872 5 |
841206 |
2003-589 |
416 |
BBC #87 |
Humboldt, NV |
NV10136872 6 |
841207 |
2003-590 |
417 |
BBC #88 |
Humboldt, NV |
NV10136872 7 |
841208 |
2003-591 |
418 |
BBC #89 |
Humboldt, NV |
NV10136872 8 |
841209 |
2003-592 |
419 |
BBC #90 |
Humboldt, NV |
NV10136872 9 |
841210 |
2003-593 |
420 |
BBC #91 |
Humboldt, NV |
NV10136873 0 |
841211 |
2003-594 |
421 |
BBC #92 |
Humboldt, NV |
NV10136873 1 |
841212 |
2003-595 |
422 |
BBC #93 |
Humboldt, NV |
NV10136873 2 |
841213 |
2003-596 |
423 |
BBC #94 |
Humboldt, NV |
NV10136873 3 |
841214 |
2003-597 |
424 |
BBC #95 |
Humboldt, NV |
NV10136873 4 |
841215 |
2003-598 |
425 |
BBC #96 |
Humboldt, NV |
NV10136873 5 |
841216 |
2003-599 |
426 |
BBC #97 |
Humboldt, NV |
NV10136873 6 |
841217 |
2003-600 |
427 |
BBC #98 |
Humboldt, NV |
NV10136873 7 |
841218 |
2003-601 |
428 |
BBC #99 |
Humboldt, NV |
NV10136873 8 |
841219 |
2003-602 |
429 |
BBC #100 |
Humboldt, NV |
NV10136955 3 |
841220 |
2003-603 |
430 |
BBC #101 |
Humboldt, NV |
NV10136955 4 |
841221 |
2003-604 |
431 |
BBC #102 |
Humboldt, NV |
NV10136955 5 |
841222 |
2003-605 |
432 |
BBC #103 |
Humboldt, NV |
NV10136955 6 |
841223 |
2003-606 |
433 |
BBC #104 |
Humboldt, NV |
NV10136955 7 |
841224 |
2003-607 |
434 |
BBC #106 |
Humboldt, NV |
NV10136955 9 |
841226 |
2003-608 |
435 |
BBC #107 |
Humboldt, NV |
NV10136956 0 |
841227 |
2003-609 |
436 |
BBC #108 |
Humboldt, NV |
NV10136956 1 |
841228 |
2003-610 |
437 |
BBC #109 |
Humboldt, NV |
NV10136956 2 |
841229 |
2003-611 |
438 |
BBC #110 |
Humboldt, NV |
NV10136956 3 |
841230 |
2003-612 |
439 |
BBC #111 |
Humboldt, NV |
NV10136956 4 |
841231 |
2003-613 |
440 |
BBC #112 |
Humboldt, NV |
NV10136956 5 |
841232 |
2003-614 |
441 |
BBC #113 |
Humboldt, NV |
NV10136956 6 |
841233 |
2003-615 |
442 |
BBC #114 |
Humboldt, NV |
NV10136956 7 |
841234 |
2003-616 |
443 |
BBC #115 |
Humboldt, NV |
NV10136956 8 |
841235 |
2003-617 |
444 |
BBC #116 |
Humboldt, NV |
NV10136956 9 |
841236 |
2003-445 |
445 |
BBC #117 |
Humboldt, NV |
NV10136957 0 |
841237 |
2003-446 |
446 |
BBC #118 |
Humboldt, NV |
NV10136957 1 |
841238 |
2003-447 |
447 |
BBC #119 |
Humboldt, NV |
NV10136957 2 |
841239 |
2003-448 |
448 |
BBC #120 |
Humboldt, NV |
NV10136957 3 |
841240 |
2003-449 |
449 |
BBC #121 |
Humboldt, NV |
NV10151714 6 |
841241 |
2003-450 |
450 |
BBC #122 |
Humboldt, NV |
NV10151714 7 |
841242 |
2003-451 |
451 |
BBC #125 |
Humboldt, NV |
NV10151715 0 |
841245 |
2003-452 |
452 |
BBC #126 |
Humboldt, NV |
NV10151715 1 |
841246 |
2003-453 |
453 |
BBC #127 |
Humboldt, NV |
NV10151715 2 |
841247 |
2003-454 |
454 |
BBC #128 |
Humboldt, NV |
NV10151715 3 |
841248 |
2003-455 |
455 |
BBC #129 |
Humboldt, NV |
NV10151715 4 |
841249 |
2003-456 |
456 |
BBC #130 |
Humboldt, NV |
NV10151715 5 |
841250 |
2003-457 |
457 |
BBC #131 |
Humboldt, NV |
NV10151715 6 |
841251 |
2003-458 |
458 |
BBC #285 |
Humboldt, NV |
NV10151883 7 |
841297 |
2003-539 |
459 |
BBC #286 |
Humboldt, NV |
NV10151883 8 |
841298 |
2003-540 |
460 |
BBC #287 |
Humboldt, NV |
NV10151883 9 |
841299 |
2003-541 |
461 |
BBC #288 |
Humboldt, NV |
NV10151884 0 |
841300 |
2003-542 |
462 |
BBC #289 |
Humboldt, NV |
NV10151884 1 |
841301 |
2003-543 |
463 |
BBC #290 |
Humboldt, NV |
NV10151884 2 |
841302 |
2003-544 |
464 |
BBC #291 |
Humboldt, NV |
NV10151884 3 |
841303 |
2003-545 |
465 |
BBC #292 |
Humboldt, NV |
NV10151965 2 |
841304 |
2003-546 |
466 |
BBC #293 |
Humboldt, NV |
NV10151965 3 |
841305 |
2003-547 |
467 |
BBC #294 |
Humboldt, NV |
NV10151965 4 |
841306 |
2003-548 |
468 |
BBC #295 |
Humboldt, NV |
NV10151965 5 |
841307 |
2003-549 |
469 |
BBC #296 |
Humboldt, NV |
NV10151965 6 |
841308 |
2003-550 |
470 |
BBC #297 |
Humboldt, NV |
NV10151965 7 |
841309 |
2003-551 |
471 |
BBC #298 |
Humboldt, NV |
NV10151965 8 |
841310 |
2003-552 |
472 |
BBC #299 |
Humboldt, NV |
NV10151965 9 |
841311 |
2003-553 |
473 |
BBC #300 |
Humboldt, NV |
NV10151966 0 |
841312 |
2003-554 |
474 |
BBC #301 |
Humboldt, NV |
NV10151966 1 |
841313 |
2003-555 |
475 |
BBC #302 |
Humboldt, NV |
NV10151966 2 |
841314 |
2003-556 |
476 |
BBC #303 |
Humboldt, NV |
NV10151966 3 |
841315 |
2003-557 |
477 |
BBC #304 |
Humboldt, NV |
NV10151966 4 |
841316 |
2003-558 |
478 |
BBC #305 |
Humboldt, NV |
NV10151966 5 |
841317 |
2003-559 |
479 |
BBC #306 |
Humboldt, NV |
NV10151966 6 |
841318 |
2003-560 |
480 |
BBC #307 |
Humboldt, NV |
NV10151966 7 |
841319 |
2003-561 |
481 |
BBC #308 |
Humboldt, NV |
NV10151966 8 |
841320 |
2003-562 |
482 |
BBC #309 |
Humboldt, NV |
NV10151966 9 |
841321 |
2003-563 |
483 |
BBC #310 |
Humboldt, NV |
NV10151967 0 |
841322 |
2003-564 |
484 |
BBC #311 |
Humboldt, NV |
NV10151967 1 |
841323 |
2003-565 |
485 |
BBC #312 |
Humboldt, NV |
NV10151967 2 |
841324 |
2003-566 |
486 |
BBC #313 |
Humboldt, NV |
NV10136045 4 |
841325 |
2003-567 |
487 |
BBC #314 |
Humboldt, NV |
NV10136045 5 |
841326 |
2003-568 |
488 |
BBC #315 |
Humboldt, NV |
NV10136045 6 |
841327 |
2003-569 |
489 |
BBC #316 |
Humboldt, NV |
NV10136045 7 |
841328 |
2003-570 |
490 |
BBC #317 |
Humboldt, NV |
NV10136045 8 |
841329 |
2003-571 |
491 |
BBC #318 |
Humboldt, NV |
NV10136045 9 |
841330 |
2003-572 |
492 |
BBC #319 |
Humboldt, NV |
NV10136046 0 |
841331 |
2003-573 |
493 |
BBC #320 |
Humboldt, NV |
NV10136046 1 |
841332 |
2003-574 |
494 |
BBC #249 |
Humboldt, NV |
NV10136373 7 |
842006 |
2003-657 |
495 |
BBC #250 |
Humboldt, NV |
NV10136373 8 |
842007 |
2003-658 |
496 |
BBC #251 |
Humboldt, NV |
NV10136373 9 |
842008 |
2003-659 |
497 |
BBC #252 |
Humboldt, NV |
NV10136374 0 |
842009 |
2003-660 |
498 |
BBC #253 |
Humboldt, NV |
NV10136374 1 |
842010 |
2003-661 |
499 |
BBC #254 |
Humboldt, NV |
NV10136455 1 |
842011 |
2003-662 |
500 |
BBC #255 |
Humboldt, NV |
NV10136455 2 |
842012 |
2003-663 |
501 |
BBC #256 |
Humboldt, NV |
NV10136455 3 |
842013 |
2003-664 |
502 |
BBC #257 |
Humboldt, NV |
NV10136455 4 |
842014 |
2003-665 |
503 |
BBC #258 |
Humboldt, NV |
NV10136455 5 |
842015 |
2003-666 |
504 |
BBC #259 |
Humboldt, NV |
NV10136455 6 |
842016 |
2003-667 |
505 |
BBC #260 |
Humboldt, NV |
NV10136455 7 |
842017 |
2003-668 |
506 |
BBC #261 |
Humboldt, NV |
NV10136455 8 |
842018 |
2003-669 |
507 |
BBC #262 |
Humboldt, NV |
NV10136455 9 |
842019 |
2003-670 |
508 |
BBC #263 |
Humboldt, NV |
NV10136456 0 |
842020 |
2003-671 |
509 |
BBC #264 |
Humboldt, NV |
NV10136456 1 |
842021 |
2003-672 |
510 |
BBC #265 |
Humboldt, NV |
NV10136456 2 |
842022 |
2003-673 |
511 |
BBC #266 |
Humboldt, NV |
NV10136456 3 |
842023 |
2003-674 |
512 |
BBC #267 |
Humboldt, NV |
NV10136456 4 |
842024 |
2003-675 |
513 |
BBC #268 |
Humboldt, NV |
NV10136456 5 |
842025 |
2003-676 |
514 |
BBC #269 |
Humboldt, NV |
NV10136456 6 |
842026 |
2003-677 |
515 |
BBC #270 |
Humboldt, NV |
NV10136456 7 |
842027 |
2003-678 |
516 |
BBC #271 |
Humboldt, NV |
NV10136456 8 |
842028 |
2003-679 |
517 |
BBC #272 |
Humboldt, NV |
NV10136456 9 |
842029 |
2003-680 |
518 |
BBC #273 |
Humboldt, NV |
NV10136457 0 |
842030 |
2003-681 |
519 |
BBC #274 |
Humboldt, NV |
NV10136457 1 |
842031 |
2003-682 |
520 |
BBC #275 |
Humboldt, NV |
NV10136536 0 |
842032 |
2003-683 |
521 |
BBC #276 |
Humboldt, NV |
NV10136536 1 |
842033 |
2003-684 |
522 |
BBC #277 |
Humboldt, NV |
NV10136536 2 |
842034 |
2003-685 |
523 |
BBC #278 |
Humboldt, NV |
NV10136536 3 |
842035 |
2003-686 |
524 |
BBC #279 |
Humboldt, NV |
NV10136536 4 |
842036 |
2003-687 |
525 |
BBC #280 |
Humboldt, NV |
NV10136536 5 |
842037 |
2003-688 |
526 |
BBC #281 |
Humboldt, NV |
NV10136536 6 |
842038 |
2003-689 |
527 |
BBC #282 |
Humboldt, NV |
NV10136536 7 |
842039 |
2003-690 |
528 |
BBC #283 |
Humboldt, NV |
NV10136536 8 |
842040 |
2003-691 |
529 |
BBC #284 |
Humboldt, NV |
NV10136536 9 |
842041 |
2003-692 |
530 |
MOTE #57 |
Humboldt, NV |
NV10136622 7 |
843654 |
2003-1260 |
531 |
MOTE #58 |
Humboldt, NV |
NV10136622 8 |
843655 |
2003-1261 |
532 |
MOTE #59 |
Humboldt, NV |
NV10136622 9 |
843656 |
2003-1262 |
533 |
MOTE #60 |
Humboldt, NV |
NV10136623 0 |
843657 |
2003-1263 |
534 |
MOTE #61 |
Humboldt, NV |
NV10136623 1 |
843658 |
2003-1264 |
535 |
MOTE #62 |
Humboldt, NV |
NV10136623 2 |
843659 |
2003-1265 |
536 |
MOTE #63 |
Humboldt, NV |
NV10136623 3 |
843660 |
2003-1266 |
537 |
MOTE #64 |
Humboldt, NV |
NV10136623 4 |
843661 |
2003-1267 |
538 |
MOTE #65 |
Humboldt, NV |
NV10136623 5 |
843662 |
2003-1268 |
539 |
MOTE #66 |
Humboldt, NV |
NV10136623 6 |
843663 |
2003-1269 |
540 |
MOTE #67 |
Humboldt, NV |
NV10136623 7 |
843664 |
2003-1270 |
541 |
MOTE #68 |
Humboldt, NV |
NV10136623 8 |
843665 |
2003-1271 |
542 |
MOTE #69 |
Humboldt, NV |
NV10136623 9 |
843666 |
2003-1272 |
543 |
MOTE #70 |
Humboldt, NV |
NV10136624 0 |
843667 |
2003-1273 |
544 |
MOTE #71 |
Humboldt, NV |
NV10136624 1 |
843668 |
2003-1274 |
545 |
MOTE #72 |
Humboldt, NV |
NV10136624 2 |
843669 |
2003-1275 |
546 |
MOTE #73 |
Humboldt, NV |
NV10136624 3 |
843670 |
2003-1276 |
547 |
MOTE #74 |
Humboldt, NV |
NV10136624 4 |
843671 |
2003-1277 |
548 |
MOTE #75 |
Humboldt, NV |
NV10136624 5 |
843672 |
2003-1278 |
549 |
MOTE #76 |
Humboldt, NV |
NV10136624 6 |
843673 |
2003-1279 |
550 |
MOTE #77 |
Humboldt, NV |
NV10136624 7 |
843674 |
2003-1280 |
551 |
MOTE #78 |
Humboldt, NV |
NV10136705 3 |
843675 |
2003-1281 |
552 |
MOTE #79 |
Humboldt, NV |
NV10136705 4 |
843676 |
2003-1282 |
553 |
MOTE #80 |
Humboldt, NV |
NV10136705 5 |
843677 |
2003-1283 |
554 |
MOTE #81 |
Humboldt, NV |
NV10136705 6 |
843678 |
2003-1284 |
555 |
MOTE #82 |
Humboldt, NV |
NV10136705 7 |
843679 |
2003-1285 |
556 |
MOTE #83 |
Humboldt, NV |
NV10136705 8 |
843680 |
2003-1286 |
557 |
MOTE #84 |
Humboldt, NV |
NV10136705 9 |
843681 |
2003-1287 |
558 |
MOTE #85 |
Humboldt, NV |
NV10136706 0 |
843682 |
2003-1288 |
559 |
MOTE #86 |
Humboldt, NV |
NV10136706 1 |
843683 |
2003-1289 |
560 |
MOTE #87 |
Humboldt, NV |
NV10136706 2 |
843684 |
2003-1290 |
561 |
MOTE #88 |
Humboldt, NV |
NV10136706 3 |
843685 |
2003-1291 |
562 |
MOTE #89 |
Humboldt, NV |
NV10136706 4 |
843686 |
2003-1292 |
563 |
MOTE #90 |
Humboldt, NV |
NV10136706 5 |
843687 |
2003-1293 |
564 |
MOTE #91 |
Humboldt, NV |
NV10136706 6 |
843688 |
2003-1294 |
565 |
MOTE #92 |
Humboldt, NV |
NV10136706 7 |
843689 |
2003-1295 |
566 |
MOTE #149 |
Humboldt, NV |
NV10136706 8 |
843690 |
2003-1252 |
567 |
MOTE #150 |
Humboldt, NV |
NV10136706 9 |
843691 |
2003-1253 |
568 |
MOTE #151 |
Humboldt, NV |
NV10136707 0 |
843692 |
2003-1254 |
569 |
MOTE #152 |
Humboldt, NV |
NV10136707 1 |
843693 |
2003-1255 |
570 |
MOTE #153 |
Humboldt, NV |
NV10136707 2 |
843694 |
2003-1256 |
571 |
MOTE #154 |
Humboldt, NV |
NV10136707 3 |
843695 |
2003-1257 |
572 |
MOTE #155 |
Humboldt, NV |
NV10136791 8 |
843696 |
2003-1258 |
573 |
MOTE #156 |
Humboldt, NV |
NV10136791 9 |
843697 |
2003-1259 |
SCHEDULE “B”
MATERIAL CONTRACTS
# |
Date of Contract |
Parties to Contract |
Subject Matter of Contract |
1 |
02/04/2022 |
Michael Meding & McEwen Copper Inc. |
Letter of employment |
2 |
03/22/2024 |
Michael Meding & McEwen Copper Inc. |
Extension and amendment of letter of employment |
3 |
02/24/2023 |
FCA Argentina SA, McEwen Copper Inc., McEwen Mining Inc., Minera Andes Inc., and Robert McEwen |
Investor Rights Agreement |
4 |
08/30/2022 |
Nuton LLC, McEwen Copper Inc., McEwen Mining Inc., and Robert McEwen |
Nuton Collaboration Agreement: study and test work at the Los Azules Project |
5 |
03/09/2023 |
Nuton LLC, McEwen Copper Inc., McEwen Mining Inc., and Robert McEwen |
Amendment No. 1 to Nuton Collaboration Agreement |
6 |
03/10/2023 |
FCA Argentina SA, McEwen Copper Inc., McEwen Mining Inc., Minera Andes Inc., and Robert McEwen |
Amendment No. 1 to Investor Rights Agreement |
7 |
10/10/2023 |
FCA Argentina SA, McEwen Copper Inc., McEwen Mining Inc., Minera Andes Inc., and Robert McEwen |
Amendment No. 3 to Investor Rights Agreement |
8 |
10/18/2023 |
Nuton LLC, McEwen Copper Inc., McEwen Mining Inc., and Robert McEwen |
Amendment No. 2 to Nuton Collaboration Agreement |
9 |
10/18/2023 |
Nuton LLC, McEwen Copper Inc., McEwen Mining Inc., and Robert McEwen |
Amendment No. 3 to Nuton Collaboration Agreement |
10 |
09/22/2025 |
International Finance Corporation, McEwen Copper Inc., Andes Corporacion Minera S.A. |
IFC Collaboration Agreement |
SCHEDULE “C”
EQUITY INTERESTS AND SHAREHOLDER AGREEMENTS
Company |
Authorized Equity Interests |
Issued equity |
Direct Beneficial owner |
Outstanding options, warrants, calls, rights |
McEwen Copper Inc. |
Common shares |
32,804,284 common shares |
Minera Andes Inc (46.44%), FCA Argentina SA (18.29%), Nuton LLC 17.23%), Evanachan Limited (12.7%), Others (5.34%) |
40,000 Stock Options of McEwen Copper upon the Initial Public Offering of MCI, as per Michael Meding's employment agreement dated February 4th, 2022 |
International Copper Mining Inc. (Cayman) |
Ordinary shares |
1,000 ordinary shares |
McEwewn Copper Inc. (100%) |
No |
Los Azules Mining Inc. (Cayman) |
Ordinary shares |
2,000 ordinary shares |
International Copper Mining Inc. (100%) |
No |
San Juan Copper Inc. (Cayman) |
Ordinary shares |
1 ordinary share |
International Copper Mining Inc. (100%) |
No |
Andes Corporacion Minera SA |
Common shares |
665,643,664 common shares |
McEwen Copper Inc. (85.6254%), Los Azules Mining Inc (14.3845%), San Juan Copper Inc (0.089%) |
No |
Date |
Parties to Contract |
Subject Matter of Contract |
08/20/2021 |
McEwen Copper Inc. and Shareholders |
Unanimous Shareholder Agreement |
SCHEDULE “D”
ASSIGNMENT AGREEMENT
This Assignment and Assumption (this “Assignment and Assumption”) is dated as of the Effective Date (defined below) and is entered into by and between the Assignor identified below (the “Assignor”) and the Assignee identified below (the “Assignee”). Capitalized terms not otherwise defined herein shall have the respective meanings assigned to such terms in the Loan Agreement identified below (as amended, amended and restated, renewed, extended, supplemented, replaced or otherwise modified from time to time, the “Loan Agreement”). The parties hereto hereby agree to the Standard Terms and Conditions for Assignment and Assumption (the “Standard Terms and Conditions”) specified in Annex 1 attached hereto which are incorporated herein by reference and made a part of this Assignment and Assumption as if set forth in full herein. The Assignee hereby acknowledges receipt of a copy of the Loan Agreement.
Subject to and in accordance with the Standard Terms and Conditions and the Loan Agreement, as of the Effective Date (selected by the Agent identified below), and for an agreed consideration, the Assignor hereby irrevocably sells and assigns to the Assignee, and the Assignee hereby irrevocably purchases and assumes from the Assignor: (a) all of the Assignor's rights and obligations as a Lender under the Loan Agreement, the Loan Documents and any other documents or instruments delivered pursuant thereto to the extent related to the amount and percentage interest identified below of all of such outstanding rights and obligations of the Assignor under the facilities identified below (including, without limitation, any letters of credit, swingline loans and guarantees included therein); and (b) to the extent permitted by Applicable Law, all suits, claims, causes of action and any other right of the Assignor (as a Lender) against any Person, whether known or unknown, arising under or with respect to the Loan Agreement, any other Loan Document, any other documents or instruments delivered pursuant thereto or the loan transactions governed thereby or otherwise based on or related to any of the foregoing, including, but not limited to, contract claims, tort claims, malpractice claims, statutory claims, and all other claims at law or in equity with respect to the rights and obligations sold and assigned pursuant to clause (a) above (the rights and obligations sold and assigned pursuant to clauses (a) and (b) above, collectively, the “Assigned Interest”). Such sale and assignment is without recourse to the Assignor and, except as expressly provided in this Assignment and Assumption, without representation or warranty by the Assignor. The Assignor is released from its obligations under the Loan Agreement, the Loan Documents and any other documents or instruments delivered pursuant thereto to the extent of the Assigned Interest.
| 1. | Assignor: |
| 2. | Assignee: |
| 3. | Borrower(s): |
| 6. | Assigned Interest: |
-2-
Facility Assigned |
Aggregate Amount of Commitment/Loans for all Lenders |
Amount of Commitment/Loans Assigned |
Percentage of Commitment/Loans Assigned |
Loan Facility |
$[AMOUNT] |
$[AMOUNT] |
[NUMBER]% |
[SIGNATURE PAGE FOLLOWS]
-3-
The terms set forth in this Assignment and Assumption are hereby agreed to this [DAY] day of [MONTH], [YEAR] (the “Effective Date”):
|
ASSIGNOR |
|
|
[NAME OF ASSIGNOR] |
|
|
|
|
|
By |
|
|
Title: |
|
|
|
|
|
|
|
|
ASSIGNEE |
|
|
[NAME OF ASSIGNEE] |
|
|
|
|
|
By |
|
|
Title: |
|
|
|
|
|
[Consented to and] Accepted: |
|
|
[NAME OF ADMINISTRATIVE AGENT], as |
|
|
Agent |
|
|
|
|
|
By |
|
|
Title: |
|
|
|
|
|
[Consented to:] |
|
|
[NAME OF PARTY] |
|
|
|
|
|
By |
|
|
Title: |
|
-4-
SCHEDULE “E”
FORM OF WARRANT CERTIFICATE
Unless permitted under securities legislation, the holder of this security must not trade the security before the date that is 4 months and a day after the later of (i) *, and (ii) the date the issuer became a reporting issuer in any province or territory.
WARRANT CERTIFICATE |
No. 2026-00* |
|
Right to Purchase |
|
* Common Shares |
WARRANT TO PURCHASE COMMON SHARES OF MCEWEN COPPER INC.
INCORPORATED UNDER THE LAWS OF ALBERTA
On the terms hereof, this is to certify that FOR VALUE RECEIVED, NAME OF HOLDER AND ADDRESS AND EMAIL ADDRESS, the registered holder hereof (the “Holder”), has the right to purchase * fully paid and non-assessable common shares (the “Common Shares”) without par value in the capital of McEwen Copper Inc. (the “Company”) as constituted on the date hereof at a purchase price of US$40.00 per Common Share (the “Exercise Price”), subject to adjustment as hereinafter set forth, which shall be exercisable at any time and from time to time, up to and including 4:00 p.m. (Toronto time) on the earlier of: (a) *, 2031 (the “Expiry Time”); or (b) 30 days after the closing date on which the Company has issued or transferred at least 10% of its issued and outstanding Common Shares to one or more new shareholders at a price per share of US$60.00 or more (subject to adjustment on the same basis as the Exercise Price as provided herein), provided that the Common Shares of the Company are not then trading on a stock exchange in the United States or Canada; or (c) 30 days after the Common Shares have traded for 15 consecutive trading days on a volume weighted average price basis of US$60.00 or more (subject to adjustment on the same basis as the Exercise Price as provided herein), on a stock exchange on which the Company’s Common Shares are listed (each of (b) and (c) collectively, the (“Accelerated Expiry Date”).
The Company agrees that the Common Shares so purchased shall be and be deemed to be issued to the Holder as of the close of business on the date on which this Warrant Certificate shall have been surrendered and payment made for such shares in accordance with the terms hereof.
Nothing contained herein shall confer any right upon the Holder to exercise this Warrant for the purchase of any Common Shares at any time after the Expiry Time or the Accelerated Expiry Date, and from and after the Expiry Time or the Accelerated Expiry Date, as the case may be, this Warrant and all rights hereunder shall be void and of no value.
-5-
The above provisions are, however, subject to the following:
SECTION 1. In the event the Holder desires to exercise the right conferred hereby to purchase Common Shares in the capital of the Company, the Holder shall at or before the Expiry Time or the Accelerated Expiry Date: (a) duly complete, execute and deliver to the Company a Subscription Form for such Common Shares in the form annexed hereto, together with any additional documentation required thereby, (b) surrender this Warrant Certificate to the Company at the address of the Company indicated in Section 15 hereof, and
(c) pay in immediately available funds the aggregate Exercise Price in respect of the Common Shares in the capital of the Company subscribed for either in cash, by bank draft or by certified cheque drawn on a Canadian chartered bank and payable to the Company. Upon such delivery, surrender and payment as aforesaid and subject to the provisions hereof, the Holder shall be deemed for all purposes to be a shareholder of record of the number of Common Shares in the capital of the Company to be so issued and the Holder shall be entitled to delivery of a certificate or certificates evidencing such Common Shares (which certificates, as well as all certificates issued in exchange for or in substitution thereof, shall bear any applicable restrictive legends) and the Company shall cause such certificate or certificates to be delivered to the Holder at the address specified in said Subscription Form within five days of said surrender and payment as aforesaid.
If the Holder is in the United States or is a “U.S. person” (a “U.S. Person”), as such term is defined in Regulation S (“Regulation S”) under the U.S. Securities Act of 1933, as amended (the “U.S. Securities Act”), for purposes of complying with the U.S. Securities Act and applicable U.S. state securities laws, the Holder understands and acknowledges that upon the issuance of the Common Shares issuable hereunder, all the certificates representing the Common Shares, as well as all certificates issued in exchange for or in substitution of the foregoing securities, shall bear the following additional legend (as applicable):
“THE SECURITIES REPRESENTED HEREBY HAVE NOT BEEN REGISTERED UNDER THE UNITED STATES SECURITIES ACT OF 1933, AS AMENDED (THE “U.S. SECURITIES ACT”), OR ANY STATE SECURITIES LAWS. THE HOLDER HEREOF, BY PURCHASING THESE SECURITIES, AGREES FOR THE BENEFIT OF THE ISSUER THAT THESE SECURITIES MAY BE OFFERED, SOLD PLEDGED OR OTHERWISE TRANSFERRED ONLY (A) TO THE ISSUER, (B) OUTSIDE THE UNITED STATES IN ACCORDANCE WITH RULE 903 OR 904 OF REGULATION S UNDER THE U.S. SECURITIES ACT AND IN COMPLIANCE WITH APPLICABLE CANADIAN AND PROVINCIAL LAWS AND REGULATIONS, (C) WITHIN THE UNITED STATES IN ACCORDANCE WITH (1) RULE 144A UNDER THE U.S. SECURITIES ACT OR (2) RULE 144 UNDER THE U.S. SECURITIES ACT, IF AVAILABLE, AND, IN EACH CASE, IN COMPLIANCE WITH APPLICABLE STATE SECURITIES LAWS OF THE UNITED STATES, OR (D) WITHIN THE UNITED STATES IN A TRANSACTION THAT DOES NOT REQUIRE REGISTRATION UNDER THE U.S. SECURITIES ACT OR ANY APPLICABLE STATE SECURITIES LAWS, PROVIDED THAT IN THE CASE OF TRANSFERS PURSUANT TO CLAUSE (C) OR (D) ABOVE, A LEGAL OPINION SATISFACTORY TO THE ISSUER MUST FIRST BE PROVIDED.”;
-6-
provided, however, that if the Common Shares issuable hereunder are being sold in compliance with the requirements of Rule 904 of Regulation S at the time when the Company is a “foreign issuer” within the meaning of Regulation S, the foregoing U.S. legend may be removed by providing a declaration to the Company’s transfer agent, in the form attached hereto (or as the Company may prescribe from time to time); notwithstanding the foregoing, the Company’s transfer agent for the Common Shares may impose additional requirements for the removal of legends from securities sold in compliance with Rule 904 of Regulation S in the future; and provided further, that, if any of the Common Shares issuable hereunder are being sold pursuant to Rule 144 of the U.S. Securities Act, the legend may be removed by delivering to the Company’s transfer agent an opinion of counsel of recognized standing in form and substance satisfactory to the Company to the effect that the legend is no longer required under applicable requirements of the U.S. Securities Act or state securities laws.
This Warrant may not be exercised in the United States or by or on behalf of a U.S. Person, unless an exemption from registration is available under the U.S. Securities Act and any applicable state securities laws and the Company has received an opinion of counsel of recognized standing in form and substance reasonably satisfactory to the Company to such effect; provided that an institutional “accredited investor” that satisfies the criteria set forth in Rule 501(a)(1), (2), (3), (7) or (8) of Regulation D under the
U.S. Securities Act that purchased warrants in the Company’s private placement of Common Shares and Warrants in the United States and to U.S. Persons will not be required to deliver an opinion of counsel in connection with the exercise of those Warrants.
SECTION 2. The right to purchase Common Shares in the capital of the Company conferred hereby may be exercised in whole or in part. In the event that prior to the Expiry Time or the Accelerated Expiry Date the Holder subscribes for and purchases any number of Common Shares which is less than the number of Common Shares referred to in this Warrant Certificate, the Holder shall present the original of this Warrant Certificate to the Company and the Holder will be entitled to receive a further Warrant Certificate in respect of the Common Shares referred to in this Warrant Certificate but not subscribed for.
SECTION 3. This Warrant Certificate may be exchanged for Warrant Certificates in any other denomination representing in the aggregate the same number of underlying Common Shares provided, however, that no Warrant Certificates for fractional Common Shares shall be given. The Holder may exercise this right by surrendering this Warrant Certificate, together with a written direction, to the Company at the address of the Company indicated in Section 15 below and the Company shall cause the new Warrant Certificates to be delivered to the Holder at the address specified in such direction within ten days of said surrender as aforesaid.
SECTION 4. In case this Warrant Certificate shall become mutilated or be lost, destroyed or stolen, the Company shall, upon the Holder complying with this Section 4, issue and deliver a new Warrant Certificate of like date and tenor in exchange for and in place of the one mutilated, lost, destroyed or stolen and upon surrender and cancellation of such mutilated Warrant Certificate or in substitution for such lost, destroyed or stolen Warrant Certificate.
-7-
The applicant for the issue of a new Warrant Certificate pursuant to this Section 4 shall bear the cost of the issue thereof and in case of loss, destruction or theft shall, as a condition precedent to the issue thereof, furnish to the Company such evidence of ownership and of the loss, destruction or theft of the Warrant Certificate so lost, destroyed or stolen as shall be reasonably satisfactory to the Company.
SECTION 5. Unless required by applicable securities laws, the holding of this Warrant shall not constitute or deem the Holder a shareholder of the Company nor entitle the Holder to any right or interest in respect thereof except as herein expressly provided. Except as otherwise specifically provided herein, the Holder, solely in such Person’s capacity as a holder of this Warrant, shall not be entitled to vote or receive dividends or be deemed the holder of share capital of the Company for any purpose, nor shall anything contained in this Warrant be construed to confer upon the Holder, solely in such Person’s capacity as the Holder of this Warrant, any of the rights of a shareholder of the Company or any right to vote, give or withhold consent to any corporate action (whether any reorganization, issue of shares, reclassification of shares, consolidation, merger, conveyance or otherwise), receive notice of meetings, receive dividends or subscription rights, or otherwise, prior to the issuance to the Holder of the Warrant Shares which such Person is then entitled to receive upon the due exercise of this Warrant.
SECTION 6. The Company represents and warrants that:
| (a) | it is duly authorized to create and issue this Warrant; |
| (b) | this Warrant is a valid and enforceable obligation of the Company in accordance with the terms hereof; |
| (c) | it will take all such action as may be necessary to ensure that all Common Shares issuable hereunder, may be so issued without violation of any applicable requirements of any exchange or over-the-counter market upon which the Common Shares may be listed or in respect of which the Common Shares are qualified for unlisted trading privileges; |
| (d) | the issuance of certificates of Common Shares upon the exercise of the Warrants shall be made without charge to the Holder for any issuance tax in respect thereto, provided that the Company shall not be required to pay any tax which may be payable in respect of any transfer involved in the issuance and delivery of any certificate in a name other than that of the Holder; and |
| (e) | the Company will attend to all filings required to be made by the Company under applicable securities legislation in respect of the exercise of the Warrant in accordance with the terms hereof. For greater certainty, such requirement will not impose any obligation on the Company to file a prospectus or registration statement or similar document, or to become a reporting issuer or a registrant in any province, state or territory. |
The Company covenants and agrees that it will cause the Common Shares subscribed for and purchased in the manner herein provided and the certificate or certificates evidencing such Common Shares to be duly issued and that, at all times prior to the Expiry Time or the Accelerated Expiry Date, it shall reserve and there shall remain unissued out of its authorized capital a sufficient number of Common Shares to satisfy the right of purchase herein provided for.
-8-
All Common Shares which shall be issued upon the exercise of the right of purchase herein provided for, upon payment therefor of the aggregate Exercise Price for such Common Shares, shall be and be deemed to be fully paid and non-assessable and the Holder shall not be liable to the Company or its creditors in respect thereof.
SECTION 7. In Section 7 and Section 8:
“Equity Shares” means the Common Shares and any shares of any class or series of the Company which may from time to time be authorized for issue if by their terms such shares confer on the holders thereof the right to participate in the distribution of assets upon the voluntary or involuntary liquidation, dissolution, or winding-up of the Company beyond a fixed sum or a fixed sum plus accrued dividends; and
“Current Market Price” of the Common Shares at any date means the weighted average price per share at which the Common Shares have traded on a primary stock exchange on which the Common Shares are listed during any 20 consecutive trading days ending not more than 5 trading days immediately preceding such date. In the event the Common Shares are not listed on any stock exchange, the Current Market Price of the Common Shares shall be determined by the directors acting reasonably and in good faith.
If at any time from the date of this Warrant and prior to the Expiry Time or the Accelerated Expiry Date and while this Warrant is outstanding there shall be a reclassification of the Common Shares outstanding at any time or a change of the Common Shares into other shares or securities, or any other capital reorganization except as described in Section 8, or a consolidation, amalgamation or merger of the Company with or into any other corporation (other than a consolidation, amalgamation or merger which does not result in any reclassification of the outstanding Common Shares or a change of the Common Shares into other shares or securities), or a transfer of the undertaking or assets of the Company as an entirety or substantially as an entirety to another corporation or other entity (any of such events being called a “Capital Reorganization”), should the Holder exercise thereafter its right to purchase Common Shares hereunder, the Holder shall be entitled to receive, and shall accept for the same aggregate consideration, in lieu of the number of Common Shares to which it was theretofore entitled upon the exercise of the right to purchase Common Shares hereunder, the kind and amount of shares or other securities or property which the Holder would have been entitled to receive as a result of such Capital Reorganization if, on the effective date thereof, it had been the registered holder of the number of Common Shares to which it was theretofore entitled upon such exercise.
If at any time from the date of this Warrant and prior to the Expiry Time and while this Warrant is outstanding any adjustment in the Exercise Price shall occur as a result of:
| (i) | an event referred to in Subsection 8(a); or |
| (ii) | the fixing by the Company of a record date for an event referred to in Subsection 8(b), |
-9-
then the number of Common Shares purchasable upon any subsequent exercise of this Warrant shall be simultaneously adjusted by multiplying the number of Common Shares purchasable upon the exercise of this Warrant immediately prior to such adjustment by a fraction which shall be the reciprocal of the fraction employed in the adjustment of the Exercise Price. To the extent that any adjustment in subscription rights occurs pursuant to this Section 7 as a result of a distribution of exchangeable or convertible securities referred to in Subsection 8(a)(iii) other than Equity Shares or as a result of the fixing by the Company of a record date for the distribution of rights, options or warrants referred to in Subsection 8(b), the number of Common Shares purchasable upon the exercise of the Warrant shall be readjusted immediately after the expiration of any relevant exchange, conversion or exercise right to the number of Common Shares which would be purchasable based upon the number of Common Shares actually issued and remaining issuable immediately after such expiration, and shall be further readjusted in such manner upon expiration of any further such right.
SECTION 8. The Exercise Price in effect at any date shall be subject to adjustment from time to time as follows:
| (a) | If and whenever at any time from the date of this Warrant and prior to the Expiry Time and while this Warrant is outstanding, the Company shall: |
| (i) | subdivide the outstanding Common Shares into a greater number of Common Shares, |
| (ii) | consolidate the outstanding Common Shares into a lesser number of Common Shares, or |
| (iii) | make any distribution, other than by way of a dividend in the ordinary course, to the holders of all or substantially all of the outstanding Common Shares payable in Common Shares or securities exchangeable for or convertible into Common Shares, |
(any of such events being called a “Common Share Reorganization”), the Exercise Price shall be adjusted effective after the effective date or record date, as the case may be, on which the holders of Common Shares are determined for the purpose of the Common Share Reorganization by multiplying the Exercise Price in effect immediately prior to such effective date or record date by a fraction, the numerator of which shall be the number of Common Shares of the Company outstanding on such effective date or record date before giving effect to such Common Share Reorganization and the denominator of which shall be the number of Common Shares outstanding immediately after giving effect to such Common Share Reorganization including, in the case where securities exchangeable for or convertible into Common Shares are distributed, the number of Common Shares that would have been outstanding had all such securities been exchanged for or converted into Common Shares on such record date.
-10-
For purposes of this Subsection 8(a), “dividend in the ordinary course” means dividends having a value which does not exceed, in the aggregate, the greater of (i) 50% of the retained earnings of the Company as at the end of its immediately preceding fiscal year; and (ii) 100% of the aggregate consolidated net income of the Company determined before computation of extraordinary or unusual items, for its immediately preceding fiscal year.
| (b) | If and whenever at any time from the date of this Warrant and prior to the Expiry Time or the Accelerated Expiry Date and while this Warrant is outstanding, the Company shall fix a record date for the issue of rights, options or warrants to the holders of all or substantially all of its outstanding Common Shares under which such holders are entitled, during a period expiring not more than ninety days after the record date for such issue, to subscribe for or purchase Common Shares at a price per Common Share or having a conversion or exchange price per Common Share less than 95% of the Current Market Price per Common Share on such record date, the Exercise Price shall be adjusted immediately after such record date so that it shall equal the price determined by multiplying the Exercise Price in effect on such record date by a fraction, the numerator of which shall be the total number of Common Shares outstanding on such record date plus a number equal to the number arrived at by dividing the aggregate price of the total number of additional Common Shares offered for subscription or purchase, or the aggregate conversion or exchange price of the convertible securities so offered, by such Current Market Price per Common Share, and of which the denominator shall be the total number of Common Shares outstanding on such record date plus the total number of additional Common Shares offered for subscription or purchase (or into which the convertible securities so offered are convertible or exchangeable). Any Common Shares owned by or held for the account of the Company or any subsidiary of the Company shall be deemed not to be outstanding for the purpose of any such computation. To the extent that any adjustment in the Exercise Price occurs pursuant to this Subsection 8(b) as a result of the fixing by the Company of a record date for the distribution of rights, options or warrants referred to in this Subsection 8(b), the Exercise Price shall be readjusted immediately after the expiration of any relevant exchange, conversion or exercise right to the Exercise Price which would then be in effect based upon the number of Common Shares actually issued and remaining issuable after such expiration, and shall be further readjusted in such manner upon expiration of any further such right. |
SECTION 9. In any case in which it shall be required that an adjustment shall become effective immediately after a record date for an event referred to herein, the Company may defer, until the occurrence of such event,
| (a) | issuing to the Holder, if the Warrant is exercised after such record date and before the occurrence of such event (the date of such exercise being herein referred to as |
-11-
the “Exercise Date”), the additional Common Shares issuable upon such exercise by reason of the adjustment required by such event, and
| (b) | delivering to the Holder any distributions declared with respect to such additional Common Shares after such Exercise Date and before such event, |
provided, however, that the Company shall deliver to the Holder an appropriate instrument evidencing its right, upon the occurrence of the event requiring the adjustment, to an adjustment in the Exercise Price or the number of Common Shares purchasable upon exercise of this Warrant and to such distributions declared with respect to any such additional Common Shares issuable on the exercise of this Warrant.
The adjustments provided for herein are cumulative; shall, in the case of adjustments to the Exercise Price, be computed to the nearest one-tenth of one cent; and shall apply (without duplication) to successive subdivisions, consolidations, distributions, issuances or other events resulting in any adjustment under the provisions hereof provided that, notwithstanding any other provision hereof, no adjustment of the Exercise Price shall be required unless such adjustment would require an increase or decrease of at least 1% in the Exercise Price then in effect and no adjustment shall be made in the number of Common Shares purchasable on the exercise of the Warrant unless it would result in a change of at least one-hundredth of a share (provided, however, that any adjustments which by reason of this Section 9 are not required to be made shall be carried forward and taken into account in any subsequent adjustment).
In the event of any question arising with respect to the adjustments provided for herein such question shall be conclusively determined by a firm of independent chartered accountants (who may be the Company’s auditors) appointed by the Company; such accountants shall have access to all necessary records of the Company and such determination shall, in the absence of manifest error, be binding upon the Company and the Holder. The Company agrees to take all measures possible so as to not unfairly disadvantage the Holder in the event any adjustment is required as a result of any corporate transaction.
In case the Company after the date of this Warrant shall take any action affecting the Common Shares, other than an action described herein, which in the reasonable opinion of the directors of the Company would materially affect the rights of the Holder, the Exercise Price and/or the number of Common Shares purchasable upon exercise of this Warrant shall be adjusted, subject to the prior written consent of any stock exchange on which the Common Shares are listed, if required, in such manner, if any, and at such time, by action by the directors, in their discretion as they may determine to be equitable in the circumstances, acting reasonably. Failure of the directors to make an adjustment in accordance with this Section 9 shall be conclusive evidence that the directors have determined that it is equitable to make no adjustment in the circumstances.
If the Company shall set a record date to determine the holders of the Common Shares for the purpose of entitling them to receive any issue or distribution or for the issue of any rights, options or warrants and shall thereafter and before such distribution or issue to such shareholders legally abandon its plan to make such distribution or issue, then no adjustment in the Exercise Price or the number of Common Shares purchasable upon exercise of this Warrant shall be required by reason of the setting of such record date.
As a condition precedent to the taking of any action which would require any adjustment to this Warrant, including the Exercise Price, the Company must take any corporate action which may be necessary in order that the Company have unissued and reserved in its authorized capital and may validly and legally issue as fully paid and non-assessable all the shares or other securities which the Holder is entitled to receive on the full exercise thereof in accordance with the provisions hereof.
-12-
In the absence of a resolution of the directors fixing a record date for any of the events referred to in Subsection 8(b), the Company shall be deemed to have fixed as the record date therefor the date on which any of such events is effected.
SECTION 10.As a condition precedent to the taking of any action which would require an adjustment pursuant to Sections 7 or 8, the Company shall take any action which may, in the reasonable opinion of counsel, be necessary in order that the Company may validly and legally issue as fully paid and non-assessable all the Common Shares to which Holder is entitled to receive on the full exercise hereof in accordance with the provisions hereof.
SECTION 11.At least ten days prior to the effective date or record date, as the case may be, of any event which, if implemented, will require an adjustment in any of the subscription rights pursuant to this Warrant, including the Exercise Price and the number of Common Shares which are purchasable upon the exercise hereof, the Company shall give notice to the Holder of the particulars of such event and, if determinable and applicable, the required or anticipated adjustment and the computation of such adjustment.
In case any adjustment for which a notice in this Section 11 has been given is not then determinable, the Company shall promptly after such adjustment is determinable give notice to the Holder of the adjustment and the computation of such adjustment.
SECTION 12.The Company covenants and agrees that at its sole expense, it will do, acknowledge and deliver, or cause to be done, executed, acknowledged and delivered, all such other acts, deeds and assurances as the Holder shall reasonably require for the better accomplishing and completion of the intentions and provisions of this Warrant.
SECTION 13.Time shall be of the essence hereof.
SECTION 14.This Warrant, any amendment, addendum, exhibit, supplement or other document relating hereto, and any and all disputes arising herefrom or related hereto, shall be governed by and construed in accordance with the internal laws of the Province of Ontario, and the federal laws of Canada applicable therein, governing disputes occurring, and contracts made and to be performed, wholly therein, and without reference to its principles governing the choice or conflict of laws. The parties hereto irrevocably attorn and submit to the exclusive jurisdiction of the courts of the Province of Ontario, sitting in the City of Toronto, with respect to any dispute related to or arising from this Agreement.
SECTION 15.Any notice required or permitted to be given hereunder shall be in writing and may be given by delivery or by electronic transmission of same addressed as follow:
| (a) | if to the Company: |
McEwen Copper Inc.
150 King Street West, Suite 2800, Toronto, Ontario, Canada M5H 1J9
-13-
Fax: 647-258-0408
Attention: General Counsel
Email: notice@mcewenmining.com
| (b) | if to the Holder, at the address shown on the first page of this Warrant Certificate. |
Any notice aforesaid shall, if delivered, be deemed to have been given and received on the date on which it was delivered to the address provided herein (if a business day, and if not, on the next succeeding business day) and if sent by electronic transmission be deemed to have been given and received at the time of receipt unless actually received after 5:00 p.m. at the point of delivery in which case it shall be deemed to have been given and received on the next business day. Any of such parties may change its address for service from time to time by notice given in accordance with the foregoing.
SECTION 16.This Warrant shall enure to the benefit of the Holder and its successors and be binding upon the Company and its successors. The Company shall not enter into any transaction whereby all or substantially all of its undertaking, property and assets would become the property of any other corporation (herein called a “successor corporation”) whether by way of reorganization, reconstruction, consolidation, amalgamation, merger, transfer, sale, disposition or otherwise, unless prior to or contemporaneously with the consummation of such transaction the Company and the successor corporation shall have executed such instruments and done such things as, in the opinion of counsel to the Holder, are necessary or advisable to establish that upon the consummation of such transaction:
| (i) | the successor corporation will have assumed all the covenants and obligations of the Company under this Warrant, and |
| (ii) | the Warrant will be a valid and binding obligation of the successor corporation entitling the Holder, as against the successor corporation, to all the rights of the Holder under this Warrant, mutatis mutandis. |
Whenever the conditions of subsection 16 shall have been duly observed and performed the successor corporation shall possess, and from time to time may exercise, each and every right and power of the Company under this Warrant in the name of the Company or otherwise and any act or proceeding by any provision hereof required to be done or performed by any director or officer of the Company may be done and performed with like force and effect by the like directors or officers of the successor corporation.
SECTION 17.This Warrant may be transferred by the holder upon surrender of this original Warrant Certificate to the Company, together with a completed and originally executed assignment in the form attached hereto.
SECTION 18.This Warrant Certificate may be executed by electronic transmission in PDF format, which shall be deemed an original.
-14-
[THE SIGNATURE PAGE IS THE NEXT PAGE]
IN WITNESS WHEREOF McEwen Copper Inc. has caused this Warrant Certificate to be signed by a duly authorized signatory as of the * day of *, 2026.
|
MCEWEN COPPER INC. |
|
|
|
|
|
By: |
|
|
Michael Meding |
|
|
(Vice President and General Manager) |
|
SUBSCRIPTION FORM
TO:MCEWEN COPPER INC.
The undersigned holder of the within warrant (the “Warrant”) hereby subscribes for common shares (the “Common Shares”) of McEwen Copper Inc. (the “Company”) referred to in the Warrant according to the conditions thereof and herewith makes payment of the purchase price for the said number of common shares, in the aggregate amount of
$ .
The undersigned represents, warrants and certifies as follows (only one of the following must be checked):
 The undersigned holder (a) at the time of exercise of the Warrant is not in the United States; (b) is not a “U.S. person” (a “U.S. Person”), as defined in Regulation S under the U.S. Securities Act of 1933, as amended (the “U.S. Securities Act”), and is not exercising the Warrant on behalf of a U.S. Person or a person in the United States; and (c) did not execute or deliver this subscription form in the United States; or The undersigned holder (a) purchased the Warrant directly from the Company pursuant to a written subscription agreement for the purchase of Warrants; (b) is exercising the Warrant solely for its own account and not on behalf of any other person; and (c) was an institutional “accredited investor” that satisfies the criteria set forth in Rule 501(a)(1), (2), (3), (7) or (8) of Regulation D under the U.S. Securities Act, both on the date the Warrant was purchased from the Company and on the date of exercise of the Warrant; or The undersigned holder has delivered a written opinion of counsel of recognized standing in form and substance reasonably satisfactory to the Company to the effect that an exemption from the registration requirements of the U.S. Securities Act and applicable state securities laws is available for the issuance of the Common Shares.
The undersigned holder understands that unless Box A above is checked, the certificate(s) representing the Common Shares will bear a legend restricting transfer without registration under the U.S. Securities Act and applicable state securities laws unless an exemption from registration is available.
The undersigned hereby directs that the common shares hereby subscribed for be issued and delivered as follows:
-2-
Name in Full |
Address in Full |
Number of Shares |
|
|
|
|
|
|
|
|
|
Note: Certificates representing Common Shares will not be registered or delivered to an address in the United States unless Box B or C is checked.
(Please state full names in which share certificates are to be issued, stating whether Mr., Mrs., Ms. or Miss is applicable)
Dated this day of , 20 .
|
|
|
Witness |
|
Signature of Holder |
|
|
|
|
|
|
|
|
|
|
|
|
|
|
Address of Holder |
|
|
|
Instructions For Subscription
The above subscription form is to be signed by the Holder. The signature to the subscription as signed by the Holder must correspond in every particular with the name written upon the face of this Warrant Certificate.
The above subscription form must be signed and accompanied by payment in Canadian funds of the subscription price specified in the Warrant by cash, certified cheque or bank draft payable to the Company at par and must be surrendered at the office of the Company, 150 King Street West, Suite 2800, Toronto, Ontario, Canada M5H, at or before 4:00p.m. (Toronto time) on the earlier of: (a) *, 2031 (the “Expiry Time”); or (b) 30 days after the closing date on which the Company has issued or transferred at least 10% of its issued and outstanding Common Shares to one or more new shareholders at a price per share of US$60.00 or more (subject to adjustment on the same basis as the Exercise Price as provided herein), provided that the Common Shares of the Company are not then trading on a stock exchange in the United States or Canada; or (c) 30 days after the Common Shares have traded for 15 consecutive trading days on a volume weighted average price basis of US$60.00 or more (subject to adjustment on the same basis as the Exercise Price as provided herein), on a stock exchange on which the Company’s Common Shares are listed (each of (b) and (c) collectively, the (“Accelerated Expiry Date”), following which time the right to subscribe will expire.
No fractional common shares will be issued.
-3-
Upon surrender and payment and otherwise subject to the terms of the Warrant, the Company will issue to the person named in the subscription form the number of Common Shares subscribed for and within five days, deliver to such person at the address specified in the subscription form a certificate evidencing the common shares subscribed for. If the Holder subscribes for a lesser number of Common Shares than the number of Common Shares referred to in this Warrant, the Holder will be entitled to receive a further Warrant Certificate in respect of the Common Shares referred to in this Warrant Certificate but not subscribed for. All certificates representing the foregoing securities shall bear any applicable restrictive legends.
If Box C is checked, any opinion tendered to the Company must be in form and substance reasonably satisfactory to the Company, acting reasonably. Holders planning to deliver an opinion of counsel in connection with the exercise of Warrants should contact the Company in advance to determine whether any opinions to be tendered will be acceptable to the Company.
FORM OF DECLARATION FOR REMOVAL OF LEGEND
TO:McEwen Copper Inc.
The undersigned:
| (2) | certifies that: |
-4-
Dated: |
|
|
By: |
|
|
|
|
Name: |
|
|
|
|
Title: |
|
-5-
Assignment
FOR VALUE RECEIVED the undersigned hereby sells, assigns and transfers unto
(name and address of assignee)
the within Warrant and all rights represented thereby and does hereby irrevocably constitute and appoint as attorney of the undersigned to enter the same on the books of McEwen Copper Inc. with full power of subscription hereunder.
DATED the day of , 20 .
|
|
|
(Guarantor of Signature) |
|
(Signature of Holder) |
|
|
|
|
|
|
|
|
(Name of Holder (please print)) |
Instructions For Assignment
The signature on the foregoing assignment must correspond with the name of the Holder as set forth on the face of this Warrant in every particular, without alteration or enlargement or any change whatever and must be guaranteed by a Canadian chartered bank or trust company or by a member firm of the Toronto Stock Exchange, or in some other manner satisfactory to McEwen Copper Inc.
EXHIBIT 21
SUBSIDIARIES OF THE COMPANY
10393444 Canada Inc. (aka McEwen Ontario), an Ontario corporation
11195581 Canada Inc., a Canadian federal corporation
912413 Ontario Inc., an Ontario corporation
Compania Minera Pangea S.A. de C.V., a Mexican corporation
Gold Bar Enterprises LLC, a Nevada limited liability company
Golden Pick LLC, a Nevada limited liability company
Las Yaretas S.A., an Argentinean corporation
Latin America Exploration Inc., a Cayman corporation
Lexam Explorations (USA), Inc., a Colorado corporation
Lexam VG Gold Inc., an Ontario corporation
McEwen Mining - Minera Andes Acquisition ULC, an Alberta corporation
McEwen Mining Alberta ULC, an Alberta corporation
Timberline Resources Company, a Delaware corporation
Wolfpack Gold, Nevada corporation (subsidiary of Timberline Resources Company)
Talapoosa Development, Delaware corporation (subsidiary of Timberline Resources Company)
BH Minerals USA, Inc., Colorado corporation (subsidiary of Timberline Resources Company)
Lookout Mountain LLC, Delaware corporation (subsidiary of Timberline Resources Company)
McEwen Mining Nevada Inc., a Delaware corporation
McEwen Copper Inc., an Alberta corporation (46.3% interest)
Minandes S.A., an Argentinean corporation
Minera Andes Gold Inc., a Cayman corporation
Minera Andes Inc., an Alberta corporation
Minera Andes Mining Inc., a Cayman corporation
Minera Andes S.A., an Argentinean corporation
Minera Andes Santa Cruz Inc., a Cayman corporation
Minera Santa Cruz S.A., an Argentinean corporation (49.0% interest)
Nevada Pacific Gold (US) Inc., a Nevada corporation
Oro de Soltula S.A. de C.V., a Mexican corporation
Pangea Resources, Inc., an Arizona corporation
Paragon Advanced Labs Inc. (27.0% interest)
Ticup LLC, a Nevada limited liability company
Tonkin Springs Gold Mining Company, a Colorado corporation
Tonkin Springs LLC, a Delaware limited liability company
Tonkin Springs Venture Limited Partnership, a Nevada limited partnership
U.S. Environmental Corporation, a Colorado corporation
VG Holdings Inc., a New Brunswick corporation
WKGUS LLC, a Nevada limited liability company We consent to the incorporation by reference in the following Registration Statements:
EXHIBIT 22
CONSENT OF INDEPENDENT REGISTERED PUBLIC ACCOUNTING FIRM
| 1. | Registration Statements on Form S-3 (Nos. 333-275324) of McEwen Inc., |
| 2. | Registration Statement on Form S-4 (Nos. 333-281729) of McEwen Inc., and |
| 3. | Registration Statements on Form S-8 (Nos. 333-144563, 333-144569, 333-112269, 333-179143, 333-179144, 333-204693, 333-222609, 333-275325 and 333-281728) of McEwen Inc. |
of our reports dated March 16, 2026, with respect to the consolidated financial statements of McEwen Inc. and the effectiveness of internal control over financial reporting of McEwen Inc., included in this Annual Report (Form 10-K) of McEwen Inc. for the year ended December 31, 2025.
/s/ Ernst & Young LLP
Chartered Professional Accountants
Licensed Public Accountants
Toronto, Canada
March 16, 2026
EXHIBIT 23.1
CONSENT OF QUALIFIED PERSON
Regarding the “Technical Report Summary on the Initial Assessment of the Fox Complex, Ontario, Canada”, that is current as of December 31, 2025 (the “Technical Report Summary”):
In connection with the filing of the Annual Report of McEwen Inc. for the year ended December 31, 2025, on Form 10-K (the “Form 10-K”), Luke Willis consents to:
| ● | the use of my name and status as a “Qualified Person” in the Form 10-K. |
| ● | any quotation from, or summarization of any of the information that I am responsible for preparing in the Technical Report Summary in the Form 10-K. |
| ● | the incorporation by reference of any quotation from, or summarization of any of the information that I am responsible for preparing in the Technical Report Summary in the Company’s Registration Statements on Form S-3 (Nos. 333-275324), Form S-4 (Nos. 333-281729) and Form S-8 (Nos. 333-144563, 333-144569, 333-112269, 333-179143, 333-179144, 333-204693, 333-222609, 333-275325 and 333-281728). |
Date: March 16, 2026
Signed by:
/s/ Luke Willis |
|
P. Geo., Director of Resource Modelling |
|
McEwen Inc. |
|
EXHIBIT 23.2
CONSENT OF QUALIFIED PERSON
Regarding the “Technical Report Summary on the Initial Assessment of the Fox Complex, Ontario, Canada”, that is current as of December 31, 2024 (the “Technical Report Summary”):
In connection with the filing of the Annual Report of McEwen Inc. for the year ended December 31, 2025, on Form 10-K (the “Form 10-K”), Channa Kumarage consents to:
| ● | the use of my name and status as a “Qualified Person” in the Form 10-K. |
| ● | any quotation from, or summarization of any of the information that I am responsible for preparing in the Technical Report Summary in the Form 10-K. |
| ● | the incorporation by reference of any quotation from, or summarization of any of the information that I am responsible for preparing in the Technical Report Summary in the Company’s Registration Statements on Form S-3 (Nos. 333-275324), Form S-4 (Nos. 333-281729) and Form S-8 (Nos. 333-144563, 333-144569, 333-112269, 333-179143, 333-179144, 333-204693, 333-222609, 333-275325 and 333-281728). |
Date: March 16, 2026
Signed by:
/s/ Channa Kumarage |
|
P. Eng., Technical Services Director |
|
McEwen Inc. |
|
EXHIBIT 23.3
CONSENT OF QUALIFIED PERSON
Regarding the “Technical Report Summary on the Initial Assessment of the Fox Complex, Ontario, Canada”, that is current as of December 31, 2024 (the “Technical Report Summary”):
In connection with the filing of the Annual Report of McEwen Inc. for the year ended December 31, 2025, on Form 10-K (the “Form 10-K”), Sean Farrell consents to:
| ● | the use of my name and status as a “Qualified Person” in the Form 10-K. |
| ● | any quotation from, or summarization of any of the information that I am responsible for preparing in the Technical Report Summary in the Form 10-K. |
| ● | the incorporation by reference of any quotation from, or summarization of any of the information that I am responsible for preparing in the Technical Report Summary in the Company’s Registration Statements on Form S-3 (Nos. 333-275324), Form S-4 (Nos. 333-281729) and Form S-8 (Nos. 333-144563, 333-144569, 333-112269, 333-179143, 333-179144, 333-204693, 333-222609, 333-275325 and 333-281728). |
Date: March 16, 2026
Signed by:
/s/ Sean Farrell |
|
P. Geo., Exploration Manager |
|
McEwen Ontario |
|
EXHIBIT 23.4
CONSENT OF QUALIFIED PERSON
Regarding the “Technical Report Summary on the Initial Assessment of the Fox Complex, Ontario, Canada”, that is current as of December 31, 2024 (the “Technical Report Summary”):
In connection with the filing of the Annual Report of McEwen Inc. for the year ended December 31, 2025, on Form 10-K (the “Form 10-K”), Rob Glover consents to:
| ● | the use of my name and status as a “Qualified Person” in the Form 10-K. |
| ● | any quotation from, or summarization of any of the information that I am responsible for preparing in the Technical Report Summary in the Form 10-K. |
| ● | the incorporation by reference of any quotation from, or summarization of any of the information that I am responsible for preparing in the Technical Report Summary in the Company’s Registration Statements on Form S-3 (Nos. 333-275324), Form S-4 (Nos. 333-281729) and Form S-8 (Nos. 333-144563, 333-144569, 333-112269, 333-179143, 333-179144, 333-204693, 333-222609, 333-275325 and 333-281728). |
Date: March 16, 2026
Signed by:
/s/ Rob Glover |
|
P. Geo., Chief Geologist |
|
EXHIBIT 23.5
CONSENT OF QUALIFIED PERSON
Regarding the “Technical Report Summary on the Initial Assessment of the Fox Complex, Ontario, Canada”, that is current as of December 31, 2024 (the “Technical Report Summary”):
In connection with the filing of the Annual Report of McEwen Inc. for the year ended December 31, 2025, on Form 10-K (the “Form 10-K”), Carson Cybolsky consents to:
| ● | the use of my name and status as a “Qualified Person” in the Form 10-K. |
| ● | any quotation from, or summarization of any of the information that I am responsible for preparing in the Technical Report Summary in the Form 10-K. |
| ● | the incorporation by reference of any quotation from, or summarization of any of the information that I am responsible for preparing in the Technical Report Summary in the Company’s Registration Statements on Form S-3 (Nos. 333-224476, 333-234612 and 333-275324), Form S-4 (No. 333-226858) and Form S-8 (Nos. 333-144563, 333-144569, 333-112269, 333-179143, 333-179144, 333-204693, 333-222609 and 333-275325). |
Date: March 16, 2026
Signed by:
/s/ Carson Cybolsky |
|
P. Geo., Senior Resource Geologist |
|
McEwen Ontario |
|
EXHIBIT 23.6
CONSENT OF QUALIFIED PERSON
Regarding the "Gold Bar Project, S-K 1300 Technical Report Summary, Feasibility Study, Eureka County, Nevada", that is current as of December 31, 2021 (the "Technical Report Summary"):
In connection with the filing of the Annual Report of McEwen Inc. for the year ended December 31, 2025, on Form 10-K (the “Form 10-K”), Dave Tyler consents to:
| ● | the use of my name and status as a “Qualified Person” in the Form 10-K. |
| ● | any quotation from, or summarization of any of the information that I am responsible for preparing in the Technical Report Summary in the Form 10-K. |
Date: March 16, 2026
Signed by:
/s/ Dave Tyler |
|
Registered Member, Society for Mining, Metallurgy and Exploration, #3288830 |
|
McEwen Inc. |
|
EXHIBIT 23.7
CONSENT OF QUALIFIED PERSON
Regarding the "Gold Bar Project, S-K 1300 Technical Report Summary, Feasibility Study, Eureka County, Nevada", that is current as of December 31, 2021 (the "Technical Report Summary"):
In connection with the filing of the Annual Report of McEwen Inc. for the year ended December 31, 2025, on Form 10-K (the “Form 10-K”), Michael C. Bauman consents to:
| ● | the use of my name and status as a “Qualified Person” in the Form 10-K. |
| ● | any quotation from, or summarization of any of the information that I am responsible for preparing in the Technical Report Summary in the Form 10-K. |
Date: March 16, 2026
Signed by:
/s/ Michael C. Bauman |
|
P.Geo., Senior Resource Modeler |
|
McEwen Inc. |
|
EXHIBIT 23.8
CONSENT OF QUALIFIED PERSON
Regarding the "Gold Bar Project, S-K 1300 Technical Report Summary, Feasibility Study, Eureka County, Nevada", that is current as of December 31, 2021 (the "Technical Report Summary"):
In connection with the filing of the Annual Report of McEwen Inc. for the year ended December 31, 2025, on Form 10-K (the “Form 10-K”), Benjamin Bermudez consents to:
| ● | the use of my name and status as a “Qualified Person” in the Form 10-K. |
| ● | any quotation from, or summarization of any of the information that I am responsible for preparing in the Technical Report Summary in the Form 10-K. |
Date: March 16, 2026
Signed by:
/s/ Benjamin Bermudez |
|
Benjamin Bermudez, PE (Nevada #029152) |
|
M3 Engineering & Technology Corporation |
|
EXHIBIT 23.9
CONSENT OF QUALIFIED PERSON
Regarding the "Gold Bar Project, S-K 1300 Technical Report Summary, Feasibility Study, Eureka County, Nevada", that is current as of December 31, 2021 (the "Technical Report Summary"):
In connection with the filing of the Annual Report of McEwen Inc. for the year ended December 31, 2025, on Form 10-K (the “Form 10-K”), Kevin W. Kunkel consents to:
| ● | the use of my name and status as a “Qualified Person” in the Form 10-K. |
| ● | any quotation from, or summarization of any of the information that I am responsible for preparing in the Technical Report Summary in the Form 10-K. |
Date: March 16, 2026
Signed by:
/s/ Kevin W. Kunkel |
|
Certified Professional Geologist, American Institute of Professional Geologists (AIPG), #11139 |
|
EXHIBIT 23.10
CONSENT OF QUALIFIED PERSON
Regarding the "Gold Bar Project, S-K 1300 Technical Report Summary, Feasibility Study, Eureka County, Nevada", that is current as of December 31, 2021 (the "Technical Report Summary"):
In connection with the filing of the Annual Report of McEwen Inc. for the year ended December 31, 2025, on Form 10-K (the “Form 10-K”), Independent Mining Consultants, Inc. consents to:
| ● | the use of my name and status as a “Qualified Person” in the Form 10-K. |
| ● | any quotation from, or summarization of any of the information that I am responsible for preparing in the Technical Report Summary in the Form 10-K. |
Date: March 16, 2026
Signed by:
/s/ Joseph S.C. McNaughton |
|
Independent Mining Consultants, Inc. |
|
EXHIBIT 23.11
CONSENT OF QUALIFIED PERSON
Regarding the "Gold Bar Project, S-K 1300 Technical Report Summary, Feasibility Study, Eureka County, Nevada", that is current as of December 31, 2021 (the "Technical Report Summary"):
In connection with the filing of the Annual Report of McEwen Inc. for the year ended December 31, 2025, on Form 10-K (the “Form 10-K”), Barry L. Carlson consents to:
| ● | the use of my name and status as a “Qualified Person” in the Form 10-K. |
| ● | any quotation from, or summarization of any of the information that I am responsible for preparing in the Technical Report Summary in the Form 10-K. |
Date: March 16, 2026
Signed by:
/s/ Barry L. Carlson |
|
Barry L. Carlson, RM SME |
|
Forte Dynamics |
|
EXHIBIT 23.12
CONSENT OF QUALIFIED PERSON
In connection with the McEwen Inc. Current Report on Form 10-K filed with the Securities and Exchange Commission on March 16, 2026, and any amendments or supplements and/or exhibits thereto, including without limitation Amendment No. 1 thereto (collectively, the “Form 10-K”), the undersigned consents to the following:
| ● | the filing and use of the technical report summary titled “Technical Report Summary of the Los Azules Copper Mining Project” (the “TRS”), effective September 3, 2025, and current as of December 31, 2025, as an exhibit to and referenced in the Form 10-K; |
| ● | the incorporation by reference of the TRS in the Registration Statements of McEwen Inc. on Form S-8 (Nos. 333-144563, 333-144569, 333-112269, 333-179143, 333-179144, 333-204693, 333-222609, 333-275325 and 333-281728), Form S-3 (File No. 333-275324) and Form S-4 (File No. 333-281729) (collectively, the “Registration Statements”); |
| ● | the use of and references to our name, including our status as an expert or “qualified person” (as defined in Subpart 1300 of Regulation S-K promulgated by the Securities and Exchange Commission), in connection with the TRS, Form 10-K and the Registration Statements; and |
| ● | any extracts from or summaries of the TRS included or incorporated by reference in the Form 10-K and the Registration Statements, and the use of any information derived, summarized, quoted or referenced from the TRS, or portions thereof, that were prepared by us, that we supervised the preparation of, and/or that were reviewed and approved by us, that is included or incorporated by reference in the Form 10-K and the Registration Statements. |
Date: March 16, 2026
Signed by:
/s/ W. David Tyler |
|
W. David Tyler, Registered Member, Society for Mining, Metallurgy and Exploration, #3288830 |
|
McEwen Inc. |
|
EXHIBIT 23.13
CONSENT OF QUALIFIED PERSON
In connection with the McEwen Inc. Current Report on Form 10-K filed with the Securities and Exchange Commission on March 16, 2026, and any amendments or supplements and/or exhibits thereto, including without limitation Amendment No. 1 thereto (collectively, the “Form 10-K”), the undersigned consents to the following:
| ● | the filing and use of the technical report summary titled “Technical Report Summary of the Los Azules Copper Mining Project” (the “TRS”), effective September 3, 2025, and current as of December 31, 2025, as an exhibit to and referenced in the Form 10-K; |
| ● | the incorporation by reference of the TRS in the Registration Statements of McEwen Inc. on Form S-8 (Nos. 333-144563, 333-144569, 333-112269, 333-179143, 333-179144, 333-204693, 333-222609, 333-275325 and 333-281728), Form S-3 (File No. 333-275324) and Form S-4 (File No. 333-281729) (collectively, the “Registration Statements”); |
| ● | the use of and references to our name, including our status as an expert or “qualified person” (as defined in Subpart 1300 of Regulation S-K promulgated by the Securities and Exchange Commission), in connection with the TRS, Form 10-K and the Registration Statements; and |
| ● | any extracts from or summaries of the TRS included or incorporated by reference in the Form 10-K and the Registration Statements, and the use of any information derived, summarized, quoted or referenced from the TRS, or portions thereof, that were prepared by us, that we supervised the preparation of, and/or that were reviewed and approved by us, that is included or incorporated by reference in the Form 10-K and the Registration Statements. |
Date: March 16, 2026
Signed by:
/s/ AGP Mining Consultants Inc. |
|
AGP Mining Consultants Inc. |
|
EXHIBIT 23.14
CONSENT OF QUALIFIED PERSON
In connection with the McEwen Inc. Current Report on Form 10-K filed with the Securities and Exchange Commission on March 16, 2026, and any amendments or supplements and/or exhibits thereto, including without limitation Amendment No. 1 thereto (collectively, the “Form 10-K”), the undersigned consents to the following:
| ● | the filing and use of the technical report summary titled “Technical Report Summary of the Los Azules Copper Mining Project” (the “TRS”), effective September 3, 2025, and current as of December 31, 2025, as an exhibit to and referenced in the Form 10-K; |
| ● | the incorporation by reference of the TRS in the Registration Statements of McEwen Inc. on Form S-8 (Nos. 333-144563, 333-144569, 333-112269, 333-179143, 333-179144, 333-204693, 333-222609, 333-275325 and 333-281728), Form S-3 (File No. 333-275324) and Form S-4 (File No. 333-281729) (collectively, the “Registration Statements”); |
| ● | the use of and references to our name, including our status as an expert or “qualified person” (as defined in Subpart 1300 of Regulation S-K promulgated by the Securities and Exchange Commission), in connection with the TRS, Form 10-K and the Registration Statements; and |
| ● | any extracts from or summaries of the TRS included or incorporated by reference in the Form 10-K and the Registration Statements, and the use of any information derived, summarized, quoted or referenced from the TRS, or portions thereof, that were prepared by us, that we supervised the preparation of, and/or that were reviewed and approved by us, that is included or incorporated by reference in the Form 10-K and the Registration Statements. |
Date: March 16, 2026
Signed by:
/s/ Samuel Engineering Inc. |
|
Samuel Engineering Inc. |
|
EXHIBIT 23.15
CONSENT OF QUALIFIED PERSON
In connection with the McEwen Inc. Current Report on Form 10-K filed with the Securities and Exchange Commission on March 16, 2026, and any amendments or supplements and/or exhibits thereto, including without limitation Amendment No. 1 thereto (collectively, the “Form 10-K”), the undersigned consents to the following:
| ● | the filing and use of the technical report summary titled “Technical Report Summary of the Los Azules Copper Mining Project” (the “TRS”), effective September 3, 2025, and current as of December 31, 2025, as an exhibit to and referenced in the Form 10-K; |
| ● | the incorporation by reference of the TRS in the Registration Statements of McEwen Inc. on Form S-8 (Nos. 333-144563, 333-144569, 333-112269, 333-179143, 333-179144, 333-204693, 333-222609, 333-275325 and 333-281728), Form S-3 (File No. 333-275324) and Form S-4 (File No. 333-281729) (collectively, the “Registration Statements”); |
| ● | the use of and references to our name, including our status as an expert or “qualified person” (as defined in Subpart 1300 of Regulation S-K promulgated by the Securities and Exchange Commission), in connection with the TRS, Form 10-K and the Registration Statements; and |
| ● | any extracts from or summaries of the TRS included or incorporated by reference in the Form 10-K and the Registration Statements, and the use of any information derived, summarized, quoted or referenced from the TRS, or portions thereof, that were prepared by us, that we supervised the preparation of, and/or that were reviewed and approved by us, that is included or incorporated by reference in the Form 10-K and the Registration Statements. |
Date: March 16, 2026
Signed by:
/s/ Knight Piesold Ltd. |
|
Knight Piesold Ltd. |
|
EXHIBIT 23.16
CONSENT OF QUALIFIED PERSON
In connection with the McEwen Inc. Current Report on Form 10-K filed with the Securities and Exchange Commission on March 16, 2026, and any amendments or supplements and/or exhibits thereto, including without limitation Amendment No. 1 thereto (collectively, the “Form 10-K”), the undersigned consents to the following:
| ● | the filing and use of the technical report summary titled “Technical Report Summary of the Los Azules Copper Mining Project” (the “TRS”), effective September 3, 2025, and current as of December 31, 2025, as an exhibit to and referenced in the Form 10-K; |
| ● | the incorporation by reference of the TRS in the Registration Statements of McEwen Inc. on Form S-8 (Nos. 333-144563, 333-144569, 333-112269, 333-179143, 333-179144, 333-204693, 333-222609, 333-275325 and 333-281728), Form S-3 (File No. 333-275324) and Form S-4 (File No. 333-281729) (collectively, the “Registration Statements”); |
| ● | the use of and references to our name, including our status as an expert or “qualified person” (as defined in Subpart 1300 of Regulation S-K promulgated by the Securities and Exchange Commission), in connection with the TRS, Form 10-K and the Registration Statements; and |
| ● | any extracts from or summaries of the TRS included or incorporated by reference in the Form 10-K and the Registration Statements, and the use of any information derived, summarized, quoted or referenced from the TRS, or portions thereof, that were prepared by us, that we supervised the preparation of, and/or that were reviewed and approved by us, that is included or incorporated by reference in the Form 10-K and the Registration Statements. |
Date: March 16, 2026
Signed by:
/s/ SRK Consulting (Argentina) S.A. |
|
SRK Consulting (Argentina) S.A. |
|
EXHIBIT 23.17
CONSENT OF QUALIFIED PERSON
We hereby consent to the incorporation by reference of any estimates of reserves or mineralized material and other analyses performed by us in our capacity as an independent consultant to McEwen Inc. (“the Company”), which are set forth in the Company’s Annual Report on Form 10-K for the year ended December 31, 2025, and as incorporated by reference in the Company’s Registration Statements on Form S-3 (Nos. 333-275324), Form S-4 (Nos. 333-281729) and Form S-8 (Nos. 333-144563, 333-144569, 333-112269, 333-179143, 333-179144, 333-204693, 333-222609, 333-275325 and 333-281728), and any amendment, prospectuses or supplements thereto, and in any amendment to any of the foregoing. We further consent to the use of our name in the Annual Report on Form 10-K.
Date: March 16, 2026
Signed by:
/s/ Peter Lock |
|
Peter Lock, Director |
|
Mining Plus Canada Consulting Ltd. |
|
EXHIBIT 23.18
CONSENT OF QUALIFIED PERSON
We hereby consent to the incorporation by reference of any estimates of reserves or mineralized material and other analyses performed by us in our capacity as an independent consultant to McEwen Inc. (“the Company”), which are set forth in the Company’s Annual Report on Form 10-K for the year ended December 31, 2025, and as incorporated by reference in the Company’s Registration Statements on Form S-3 (Nos. 333-275324), Form S-4 (Nos. 333-281729) and Form S-8 (Nos. 333-144563, 333-144569, 333-112269, 333-179143, 333-179144, 333-204693, 333-222609, 333-275325 and 333-281728), and any amendment, prospectuses or supplements thereto, and in any amendment to any of the foregoing. We further consent to the use of our name in the Annual Report on Form 10-K.
Date: March 16, 2026
Signed by:
/s/ Eugene Puritch |
|
Eugene Puritch, P. Eng., FEC, CET |
|
P&E Mining Consultants Inc. |
|
EXHIBIT 23.19
CONSENT OF QUALIFIED PERSON
In connection with the McEwen Inc. Current Report on Form 10-K filed with the Securities and Exchange Commission on March 16, 2026, and any amendments or supplements and/or exhibits thereto, including without limitation Amendment No. 1 thereto (collectively, the “Form 10-K”), the undersigned consents to the following:
| ● | the filing and use of the technical report summary titled “Technical Report Summary of the Los Azules Copper Mining Project” (the “TRS”), effective September 3, 2025, and current as of December 31, 2025, as an exhibit to and referenced in the Form 10-K; |
| ● | the incorporation by reference of the TRS in the Registration Statements of McEwen Inc. on Form S-8 (Nos. 333-144563, 333-144569, 333-112269, 333-179143, 333-179144, 333-204693, 333-222609, 333-275325 and 333-281728), Form S-3 (File No. 333-275324) and Form S-4 (File No. 333-281729) (collectively, the “Registration Statements”); |
| ● | the use of and references to our name, including our status as an expert or “qualified person” (as defined in Subpart 1300 of Regulation S-K promulgated by the Securities and Exchange Commission), in connection with the TRS, Form 10-K and the Registration Statements; and |
| ● | any extracts from or summaries of the TRS included or incorporated by reference in the Form 10-K and the Registration Statements, and the use of any information derived, summarized, quoted or referenced from the TRS, or portions thereof, that were prepared by us, that we supervised the preparation of, and/or that were reviewed and approved by us, that is included or incorporated by reference in the Form 10-K and the Registration Statements. |
Date: March 16, 2026
Signed by:
/s/ Luke Willis |
|
P. Geo., Director of Resource Modelling |
|
McEwen Inc. |
|
EXHIBIT 23.20
CONSENT OF QUALIFIED PERSON
In connection with the McEwen Inc. Current Report on Form 10-K filed with the Securities and Exchange Commission on March 16, 2026, and any amendments or supplements and/or exhibits thereto, including without limitation Amendment No. 1 thereto (collectively, the “Form 10-K”), the undersigned consents to the following:
| ● | the filing and use of the technical report summary titled “Technical Report Summary of the Los Azules Copper Mining Project” (the “TRS”), effective September 3, 2025, and current as of December 31, 2025, as an exhibit to and referenced in the Form 10-K; |
| ● | the incorporation by reference of the TRS in the Registration Statements of McEwen Inc. on Form S-8 (Nos. 333-144563, 333-144569, 333-112269, 333-179143, 333-179144, 333-204693, 333-222609, 333-275325 and 333-281728), Form S-3 (File No. 333-275324) and Form S-4 (File No. 333-281729) (collectively, the “Registration Statements”); |
| ● | the use of and references to our name, including our status as an expert or “qualified person” (as defined in Subpart 1300 of Regulation S-K promulgated by the Securities and Exchange Commission), in connection with the TRS, Form 10-K and the Registration Statements; and |
| ● | any extracts from or summaries of the TRS included or incorporated by reference in the Form 10-K and the Registration Statements, and the use of any information derived, summarized, quoted or referenced from the TRS, or portions thereof, that were prepared by us, that we supervised the preparation of, and/or that were reviewed and approved by us, that is included or incorporated by reference in the Form 10-K and the Registration Statements. |
Date: March 16, 2026
Signed by:
/s/ CRM-SA, LLC. |
|
CRM-SA, LLC. |
|
EXHIBIT 31.1
CERTIFICATE
Pursuant to Section 302 of the
Sarbanes-Oxley Act of 2002
I, ROBERT R. MCEWEN, certify that:
1.I have reviewed this Annual Report on Form 10-K of McEwen Inc. for the year ended December 31, 2025;
2.Based on my knowledge, this Report does not contain any untrue statement of a material fact or omit to state a material fact necessary to make the statements made, in light of the circumstances under which such statements were made, not misleading with respect to the period covered by this Report;
3.Based on my knowledge, the financial statements, and other financial information included in this Report, fairly present in all material respects the financial condition, results of operations and cash flows of the registrant as of, and for, the periods presented in this Report;
4.The registrant’s other certifying officer(s) and I are responsible for establishing and maintaining disclosure controls and procedures (as defined in Exchange Act Rules 13a-15(e) and 15d-15(e)) and internal control over financial reporting (as defined in Exchange Act Rules 13a-15(f) and 15d-15(f)) for the registrant and have:
a.Designed such disclosure controls and procedures, or caused such disclosure controls and procedures to be designed under our supervision, to ensure that material information relating to the registrant, including its consolidated subsidiaries, is made known to us by others within those entities, particularly during the period in which this Report is being prepared;
b.Designed such internal control over financial reporting, or caused such internal control over financial reporting to be designed under our supervision, to provide reasonable assurance regarding the reliability of financial reporting and the preparation of financial statements for external purposes in accordance with generally accepted accounting principles;
c.Evaluated the effectiveness of the registrant’s disclosure controls and procedures and presented in this Report our conclusions about the effectiveness of the disclosure controls and procedures, as of the end of the period covered by this Report based on such evaluation; and
d.Disclosed in this Report any change in the registrant’s internal control over financial reporting that occurred during the registrant’s most recent fiscal quarter (the registrant’s fourth fiscal quarter in the case of an annual report) that has materially affected, or is reasonably likely to materially affect, the registrant’s internal control over financial reporting; and
5.The registrant’s other certifying officer(s) and I have disclosed, based on our most recent evaluation of internal control over financial reporting, to the registrant’s auditors and the audit committee of the registrant’s board of directors (or persons performing the equivalent functions):
a.All significant deficiencies and material weaknesses in the design or operation of internal control over financial reporting which are reasonably likely to adversely affect the registrant’s ability to record, process, summarize and report financial information; and
b.Any fraud, whether or not material, that involves management or other employees who have a significant role in the registrant’s internal control over financial reporting.
Dated: March 16, 2026
|
McEWEN INC. |
|
|
By: |
/s/ Robert R. McEwen |
|
|
Robert R. McEwen, Chairman of the Board of Directors and Chief Executive Officer |
EXHIBIT 31.2
CERTIFICATE
Pursuant to Section 302 of the
Sarbanes-Oxley Act of 2002
I, PERRY ING, certify that:
1.I have reviewed this Annual Report on Form 10-K of McEwen Inc. for the year ended December 31, 2025;
2.Based on my knowledge, this Report does not contain any untrue statement of a material fact or omit to state a material fact necessary to make the statements made, in light of the circumstances under which such statements were made, not misleading with respect to the period covered by this Report;
3.Based on my knowledge, the financial statements, and other financial information included in this Report, fairly present in all material respects the financial condition, results of operations and cash flows of the registrant as of, and for, the periods presented in this Report;
4.The registrant’s other certifying officer(s) and I are responsible for establishing and maintaining disclosure controls and procedures (as defined in Exchange Act Rules 13a-15(e) and 15d-15(e)) and internal control over financial reporting (as defined in Exchange Act Rules 13a-15(f) and 15d-15(f)) for the registrant and have:
a.Designed such disclosure controls and procedures, or caused such disclosure controls and procedures to be designed under our supervision, to ensure that material information relating to the registrant, including its consolidated subsidiaries, is made known to us by others within those entities, particularly during the period in which this Report is being prepared;
b.Designed such internal control over financial reporting, or caused such internal control over financial reporting to be designed under our supervision, to provide reasonable assurance regarding the reliability of financial reporting and the preparation of financial statements for external purposes in accordance with generally accepted accounting principles;
c.Evaluated the effectiveness of the registrant’s disclosure controls and procedures and presented in this Report our conclusions about the effectiveness of the disclosure controls and procedures, as of the end of the period covered by this Report based on such evaluation; and
d.Disclosed in this Report any change in the registrant’s internal control over financial reporting that occurred during the registrant’s most recent fiscal quarter (the registrant’s fourth fiscal quarter in the case of an annual report) that has materially affected, or is reasonably likely to materially affect, the registrant’s internal control over financial reporting; and
5.The registrant’s other certifying officer(s) and I have disclosed, based on our most recent evaluation of internal control over financial reporting, to the registrant’s auditors and the audit committee of the registrant’s board of directors (or persons performing the equivalent functions):
a.All significant deficiencies and material weaknesses in the design or operation of internal control over financial reporting which are reasonably likely to adversely affect the registrant’s ability to record, process, summarize and report financial information; and
b.Any fraud, whether or not material, that involves management or other employees who have a significant role in the registrant’s internal control over financial reporting.
Dated: March 16, 2026
|
McEWEN INC. |
|
|
By: |
/s/ Perry Ing |
|
|
Perry Ing, Interim Chief Financial Officer |
EXHIBIT 32
CERTIFICATION
Pursuant to Section 906 of the
Sarbanes-Oxley Act of 2002
In connection with the Annual Report on Form 10-K of McEwen Inc., a Colorado corporation (the “Company”) for the year ended December 31, 2025, as filed with the Securities and Exchange Commission (the “Report”), each of the undersigned officers of the Company does hereby certify pursuant to Section 906 of the Sarbanes-Oxley Act of 2002 that to the best of our knowledge:
1.The Report fully complies with the requirements of Section 13(a) or 15(d) of the Securities Exchange Act of 1934; and
2.The information contained in the Report fairly presents, in all material respects, the financial condition and results of operations of the Company.
Dated: March 16, 2026
|
McEWEN INC. |
|
|
|
|
|
By: |
/s/ Robert R. McEwen |
|
|
Robert R. McEwen, Chairman of the Board of Directors and Chief Executive Officer |
|
|
|
|
By: |
/s/ Perry Ing |
|
|
Perry Ing, Interim Chief Financial Officer |
EXHIBIT 95
MINE SAFETY DISCLOSURE
The following disclosures are provided pursuant to the Dodd-Frank Wall Street Reform and Consumer Protection Act (the “Act”) and Item 104 of Regulation S-K, which require certain disclosures by companies required to file periodic reports under the Securities Exchange Act of 1934, as amended, that operate mines regulated under the Federal Mine Safety and Health Act of 1977 (the “Mine Act”). The disclosures reflect our U.S. mining operations at the Gold Bar mine only, as the requirements of the Act and Item 104 of Regulation S-K do not apply to our mines operated outside the United States.
Whenever the Federal Mine Safety and Health Administration (“MSHA”) believes a violation of the Mine Act, any health or safety standard or any regulation has occurred, it may issue a citation which describes the alleged violation and fixes a time within which the mining operator must abate the alleged violation. The citation may include a civil penalty or fine.
The table below reflects citations and orders issued to our subsidiary, McEwen Mining Nevada Inc., which may be considered an operator under the Mine Act, by MSHA during the quarter ended December 31, 2025. The proposed assessments for the quarter ended December 31, 2025, were taken from the MSHA data retrieval system.
|
Mine or Operation (1) |
|
|
Gold Bar Mine |
|
|
MSHA ID #26-02818 |
|
Total number of 104(a) citations |
1 |
|
Total # of "Significant and Substantial" Violations Under §104(a) |
|
0 |
Total # of Orders Issued Under §104(b) |
|
0 |
Total # of Citations and Orders Issued Under §104(d) |
|
0 |
Total # of Flagrant Violations Under §110(b) |
|
0 |
Total # of Imminent Danger Orders Under §107(a) |
|
0 |
Total Amount of Proposed Assessments from MSHA under the Mine Act |
$ |
0 |
Total # of Mining-Related Fatalities |
|
0 |
Received Notice of Pattern of Violations under Section 104(e) |
|
No |
Received Notice of Potential to have Patterns under Section 104(e) |
|
No |
Pending Legal Actions |
|
0 |
Legal Actions Instituted |
|
1 |
Legal Actions Resolved |
|
0 |
Additional information about the Act and MSHA references used in the table are as follows:
| ◾ | Section 104(a) S&S Citations: Citations received from MSHA under section 104(a) of the Mine Act for violations of mandatory health or safety standards that could significantly and substantially contribute to the cause and effect of a mine safety or health hazard. |
| ◾ | Section 104(b) Orders: Orders issued by MSHA under section 104(b) of the Mine Act, which represents a failure to abate a citation under section 104(a) within the period of time prescribed by MSHA. This results in an order of immediate withdrawal from the area of the mine affected by the condition until MSHA determines that the violation has been abated. |
| ◾ | Section 104(d) S&S Citations and Orders: Citations and orders issued by MSHA under section 104(d) of the Mine Act for unwarrantable failure to comply with mandatory, significant and substantial health or safety standards. |
| ◾ | Section 110(b)(2) Violations: Flagrant violations issued by MSHA under section 110(b)(2) of the Mine Act. |
| ◾ | Section 107(a) Orders: Orders issued by MSHA under section 107(a) of the Mine Act for situations in which MSHA determined an “imminent danger” (as defined by MSHA) existed. |
Exhibit 96

|
SEC S-K 229.1304 TECHNICAL REPORT SUMMARY FEASIBILITY STUDY - INDIVIDUAL DISCLOSURE regenerative Los Azules Copper Mining Project aRGENTINA for MCEWen INC. PREPARED FOR McEwen Inc. (NYSE:MUX; TSX:MUX) 150 King Street West Suite 2800 Toronto, ON M5H IJ9 647.258.0395 PREPARED BY Samuel Engineering, Inc. 8450 East Crescent Pkwy. Ste. 200 Greenwood Village, CO. 80111-2816 303.714.4840 Qualified Persons: |
|
W. David Tyler, SME-RM – McEwen Copper Inc. |
James L. Sorensen, FAusIMM – Samuel Engineering |
Luke Willis, PGeo – McEwen Inc. |
Jeff Sullivan, PhD, FAusImm – CRM-SA |
Bruno Borntraeger, P.Eng., Knight Piésold Ltd. |
Marcela Casini, MAusIMM (CP) – B&W |
Diego Marrero, MAusIMM – SRK |
Michael McGlynn, PE, SME-RE – Samuel Engineering |
Gordon Zurowski, PE, MBA – AGP Mining Consultants |

Nolberto Contrador Villegas, RPE Chile – E-Mining Technology S.A |
Scott Effner, PG, SME-RM – Knight Présold Ltd. |
Steven Alan Pozder, PE, MBA – Samuel Engineering |
SE Project No. 21139-03, Rev A
Effective Date: September 3, 2025
Report Date: December 31, 2025
DATE AND SIGNATURE PAGE
This report, titled “SEC S-K 229.1304 TECHNICAL REPORT SUMMARY, FEASIBILITY STUDY - INDIVIDUAL DISCLOSURE, REGENERATIVE LOS AZULES COPPER MINING PROJECT”, located in San Juan Province, Argentina, dated December 31, 2025, with an effective date of September 3, 2025, was prepared and signed by:
|
W. David Tyler, SME-RM Dated March 16, 2026 |
|
|
William Luke Willis, P.Geo Dated March 16, 2026 |
|
|
Samuel Engineering Inc. Dated March 16, 2026 |
|
|
Knight Piesold Ltd. Dated March 16, 2026 |
|
|
SRK Dated March 16, 2026 |
|
|
AGP Mining Consultants Dated March 16, 2026 |
|
This report was authored by the qualified persons (each a “QP” and collectively, the “QPs”) listed in Table 2.1. Each QP and their respective Company only assumes responsibility for those sections or areas of the report that are referenced opposite their name in Table 2.1. None of such QPs, however, accept any responsibility or liability for the sections or areas of this report that were prepared by other QPs.
LISTS OF ABBREVIATIONS AND ACRONYMS
Abbreviations and Acronyms | |
|---|---|
Acid Generating |
AG |
Acid Rock Drainage |
ARD |
Acid Rock Drainage and Metal Leaching |
ARDML |
Alex Steward International Laboratories |
ASi |
Alternating Current |
AC |
Ammonium Nitrate Fuel Oil |
ANFO |
Aqua Regia |
AR |
Argentine National Census Bureau (Instituto Nacional de Estadística y Censos) |
INDEC |
Association for the Advancement of Cost Engineering |
AACE |
Andes Corporación Minera S.A. |
ACM |
Autogenous/Ball Mill/Crushing |
ABC |
Battle Mountain Gold |
BMG |
Bond Ball Mill Work Index |
BWi |
British Columbia Securities |
BC Securities Commission |
British Pound |
BP |
B&W Hidrogeología y Medioambiente SRL |
BW |
Inductively Coupled Plasma |
ICP |
Canadian Dollar |
CAD |
Canadian Imperial Bank of Commerce |
CIBC |
Canadian Institute of Mining, Metallurgy and Petroleum |
CIM |
Canadian National Instrument 43-101 |
NI 43-101 |
Canadian Securities Administrators’ |
CSA |
Certificate Of Approval |
CofA |
Closed-Circuit Fully Autogenous Grinding Milling |
FAC |
Closed-Circuit Television |
CCTV |
Closure Plan |
CP |
Community Training Program (Programa de Educacion a la Comunidad) |
PEC |
Computational Fluid Dynamics |
CFD |
Conceptual Closure and Rehabilitation Plan |
CRP |
Construction Quality Assurance |
CQA |
Consultora de Recursos Minerales S.A. |
CRM |
Copper Cathodes and Concentrates Purchase Rights Agreement |
CCCPRA |
Cost, Insurance and Freight |
CIF |
Direct Current |
DC |
Diorite (Pre-Mineral Pluton) |
DIO / PMP |
Doctor of Philosophy |
PhD |
Early Mineralized Porphyry |
EMP |
Electric Vehicle |
EV |
Electrical Tomography |
ET |
E-Mining Technology S.A. |
EMT |
Engineering, Procurement and Construction Management |
EPCM |
Enrichment Ratio |
ER |
Environmental and Social Management Plan |
ESMP |
Environmental Impact Assessment |
EIA |
Environmental Impact Statement (Declaración de Impacto Ambiental) |
DIA |
Environmental Impact Report (Informe de Impacto Ambiental) |
IIA |
Environmental Management Plan |
EMP |
Environment, Social & Governance |
ESG |
Exploratory Data Analysis |
EDA |
Euro |
EUR |
Feasibility Study |
FS |
Fellow of the Australasian Institute of Mining and Metallurgy |
FAusIMM |
Free on Board |
FOB |
General and Administrative |
G&A |
Ground Engaging Tools |
GET |
Heap Leach Pad |
HLP |
High-Density Polyethylene |
HDPE |
High Voltage |
HV |
Humidity Cell Test |
HCT |
Hydrogeological Unit |
HGU |
Hydrothermal Breccia |
HBX |
Hypogene (Primary Mineralization Zone) |
HYP |
Induced Polarization |
IP |
Inductively Coupled Plasma |
ICP |
Information Technology |
IT |
Instituto Provincial de Exploraciones y Explotaciones Mineras |
IPEEM |
Inter-mineral Dikes |
IMP |
Internal Rate of Return |
IRR |
International Energy Agency |
IEA |
International Organization for Standardization |
ISO |
In-pit Crushing and Conveyor |
IPCC |
In-The-Hole |
ITH |
Inverse Distance-Weighted |
ID |
Inter Mineral Porphyry |
IMP |
International Monetary Fund |
IMF |
International Organization for Standardization |
ISO |
Initial Assessment |
IA |
Initial Public Offering |
IPO |
Knight Piésold |
KP |
Large Major User (electricity) – Grandes Usuarios Mayores |
GUMA |
Leach Zone |
LIX |
Leakage Collection and Recovery System |
LCRS |
Lerchs-Grossman |
LG |
Life-Of-Mine |
LOM |
Load-Haul-Dump |
LHD |
London Metal Exchange |
LME |
Los Azules Mining, Inc |
LAMI |
Low-Grade |
LG |
Magmatic Hydrothermal Breccia |
MAG HYD BX |
Magneto Telluric |
MT |
Manifestaciones de Descubrimiento |
MD |
Master’s in Business Administration |
MBA |
Maximum Design Earthquake |
MDE |
Memorandum of Understanding |
MOU |
Million Years Ago |
Mya |
Mine Block Intrusion |
MBI |
Mine Waste Rock Storage Facility |
MWRSF |
Minera Andes S.A. |
MASA |
Mineral Resource Estimate |
MRE |
Minimum Environmental Protection Standard Laws |
MEPSLs |
Mixed Zone |
MX |
Mount Isa Mines |
MIM |
|
|
National Electricity Regulatory Agency (Ente Nacional Regulador de Energia Electrica) |
ENRE |
National Road Department – Direccion Nacional de Vialidad |
DNV |
National Route (Ruta Nacional) |
RN |
Nearest Neighbor |
NN |
Net Acid Generating/Generation |
NAG |
Net Present Value |
NPV |
Net Smelter Return |
NSR |
New York Stock Exchange |
NYSE |
Observation Well (Hydrogeology) |
OBS |
Operating Basis Earthquake |
OBE |
Optical Emission Spectroscopy |
OES |
Ordinary Kriging |
OK |
Overburden |
OB |
Overburden Stockpile |
SOVB |
Overburden Zone |
OVB |
Oxide Zone |
OX |
Particulate Matter |
PM |
pH Units |
UpH |
Portable Infrared Spectrometer |
Pima |
Pregnant Leach Solution |
PLS |
Preliminary Economic Assessment |
PEA |
Primary Bornite |
BN |
Primary Bornite-Chalcopyrite |
BN-CPY |
Primary Zone |
PR |
Professional Geoscientist (Canada) |
P.Geo |
Professional Engineer (Canada) |
P.Eng |
Professional Engineer (USA) |
PE |
Provincial Energy Society of the State (Energia Provincial Sociedad del Estado) |
EPSE |
Provincial Road Department – Direccion Provincial de Vialidad |
DVP |
Provincial Route (Ruta Provincial) |
RP |
Qualified Persons |
QPs |
Quality Assurance |
QA |
Quality Control |
QC |
Registered Geologist (USA) |
RG |
Reasonable Prospects of Eventual Economic Extraction |
RPEEE |
Refining Charges |
RF |
Relative Bulk Strength |
RBS |
Reverse Circulation |
RC |
Rock Mass Rating |
RMR |
Rock Quality Designation |
RQD |
Run-Of-Mine |
ROM |
Samuel Engineering |
SE |
Selective Mining Unit |
SMU |
Semi-Autogenous |
SAG |
Semi-Autogenous/Ball Mill/Crushing |
SABC |
SGS Lakefield Research Ltd. |
SGS |
Shape Accel Arrays |
SAA |
Short-Wave Infrared |
SWIR |
Snow Water Equivalent |
SWE |
Society for Mining, Metallurgy and Exploration Registered Member |
SME-RM |
Solitario Argentina S.A. |
SASA |
Solvent Extraction and Electrowinning |
SX/EW |
Specific Gravity |
SG |
Standard Deviation |
SD |
Standard Reference Material |
SRM |
Supergene Enriched |
SG |
Tailings Storage Facility |
TSF |
Thematic Mapper |
TM |
Time Domain Reflectometer |
TDR |
Toronto Stock Exchange |
TSX |
Total Depth |
TD |
Trademark |
TM |
Transformer Station (Estacion Tansformadora) |
ET |
Transition Zone |
TR |
Treatment Charges |
TC |
Trigger Action Response Plan |
TARP |
Unconfined Compressive Strength |
UCS |
Unidirectional Solidification Texture |
UST |
United Nations Development Program |
UNDP |
US Securities & Exchange Commission |
SEC |
Value-Added Tax |
VAT |
Vargas & Galindez |
V&G |
Vertical Advance Rate |
VAR |
Volcanics |
VOLCS |
Waste Rock Facility |
WRF |
Waste Rock Storage Facility |
WRSF |
Wholesale Electricity Market (Mercado Eléctrico Mayorista) |
MEM |
Work Accident Insurance Company (Aseguradora de Riesgos de Trabajo) |
ART |
Work Breakdown Structure |
WBS |
World Health Organization |
WHO |
World Meteorological Organization |
WMO |
Yacimientos Petroliferos Fiscales S.A. |
YPF |
UNITS OF MEASURE
Units of Measure | |
|---|---|
Above Mean Sea Level |
AMSL |
Ampere |
A |
Amperes per Square Meter |
ASM |
Annum (Year) |
a |
Argentine Peso |
AR$ |
Billion |
B |
British Thermal Unit |
BTU |
Centimeter |
cm |
Cubic Centimeter |
cm3 |
Cubic Feet Per Minute |
cfm |
Cubic Feet Per Second |
ft3/s |
Cubic Foot |
ft3 |
Cubic Inch |
in3 |
Cubic Meter |
m3 |
Cubic Yard |
yd3 |
Coefficients Of Variation |
CVs |
Day |
d |
Days Per Week |
d/wk |
Days Per Year (Annum) |
d/a |
Dead Weight Tonnes |
DWT |
Decibel Adjusted |
dBa |
Decibel |
dB |
Degree |
° |
Degrees Celsius |
°C |
Units of Measure | |
|---|---|
Diameter |
ø |
Dollar (American) |
US$ |
Dollar (Canadian) |
CDN$ |
Dry Metric Ton |
dmt |
Foot |
ft |
Gallon (US) |
gal |
Gallons Per Minute (US) |
gpm |
Gigajoule |
GJ |
Gigapascal |
GPa |
Gigawatt |
GW |
Gram |
g |
Grams per cubic centimeter |
g/cc |
Grams Per Liter |
g/L |
Grams Per Tonne |
g/t |
Greater Than |
> |
Hectare (10,000 m2) |
ha |
Hectopascals |
hPa |
Hertz |
Hz |
Horsepower |
hp |
Hour |
h |
Hours Per Day |
h/d |
Hours Per Week |
h/wk |
Hours Per Year |
h/a |
Inch |
in |
Kilo (Thousand) |
k |
Units of Measure | |
|---|---|
Kilogram |
kg |
Kilograms Per Cubic Meter |
kg/m3 |
Kilograms Per Hour |
kg/h |
Kilograms Per Square Meter |
kg/m2 |
Kilometer |
km |
Kilometers Per Hour |
km/h |
Kilopascal |
kPa |
Kilotonne (1,000 Tonnes) |
kt |
Kilovolt |
kV |
Kilovolt-Ampere |
kVA |
Kilowatt |
kW |
Kilowatt Hour |
kWh |
Kilowatt Hours Per Tonne |
kWh/t |
Kilowatt Hours Per Year |
kWh/a |
Less Than |
< |
Liter |
L |
Liters Per Minute |
L/m |
Liters Per Second |
L/s |
Megabytes Per Second |
Mb/s |
Megapascal |
MPa |
Megavolt-Ampere |
MVA |
Megawatt |
MW |
Megawatt Hour |
MWh |
Meter |
m |
Meters Above Sea Level |
mASL |
Units of Measure | |
|---|---|
Meters Per Minute |
m/min |
Meters Per Second |
m/s |
Micron |
μm |
Milligram |
mg |
Milligrams Per Liter |
mg/L |
Milliliter |
mL |
Millimeter |
mm |
Million |
M |
Million Bank Cubic Meters |
Mbm3 |
Million Bank Cubic Meters Per Annum |
Mbm3/a |
Million tonnes |
Mt |
Million tonnes per annum |
Mt/a |
Million tonnes per hour |
Mt/h |
Minute (Plane Angle) |
' |
Minute (Time) |
min |
Month |
mo |
Ounce |
oz |
Pascal |
Pa |
Centipoise (MPa·S) |
cP |
Parts Per Million |
ppm |
Parts Per Billion |
ppb |
Percent |
% |
Pound(S) |
lb |
Pounds Per Square Inch |
psi |
Revolutions Per Minute |
rpm |
Units of Measure | |
|---|---|
Second (Plane Angle) |
" |
Second (Time) |
s |
Short Ton (2,000 lb) |
st |
Short Tons Per Day |
st/d |
Short Tons Per Year |
st/y |
Specific Gravity |
SG |
Square Centimeter |
cm2 |
Square Foot |
ft2 |
Square Inch |
in2 |
Square Kilometer |
km2 |
Square Meter |
m2 |
Three-Dimensional |
3D |
Tonne (1,000 kg) (Metric Ton) |
t |
Tonnes Per Day |
t/d |
Tonnes Per Hour |
t/h |
Tonnes per annum |
t/a |
Tonnes Seconds Per Hour Meter Cubed |
ts/hm3 |
United States Dollar |
USD or $ |
Volt |
V |
Watt |
W |
Week |
wk |
Weight/Weight |
w/w |
Wet Metric Ton |
wmt |
Year |
yr |
Table of Contents
1.0 |
|
Executive Summary |
1 |
1.1 |
|
Property Location, description, and OWNERSHIP |
1 |
1.2 |
|
INFRASTRUCTURE |
2 |
1.3 |
|
EXPLORATION & DRILLING |
3 |
1.4 |
|
mineral resource estimates |
4 |
1.5 |
|
mining |
6 |
1.6 |
|
Metallurgical Testwork and Recovery Methods |
7 |
1.7 |
|
project economics |
8 |
1.8 |
|
key project risks & opportunities |
10 |
1.9 |
|
qualified persons recommendations and conclusions |
13 |
2.0 |
|
Introduction |
14 |
2.1 |
|
Feasibility Study Overview |
14 |
2.2 |
|
Sustainability Strategy and Responsible Development |
15 |
2.3 |
|
Terms of Reference |
18 |
2.4 |
|
Qualified Persons and Sources of Information |
18 |
2.5 |
|
Personal Inspections |
20 |
3.0 |
|
Property Description |
21 |
3.1 |
|
Project Location |
21 |
3.2 |
|
property and title in argentina |
23 |
3.3 |
|
OWNERSHIP |
24 |
3.4 |
|
ROYALTIES AND RETENTIONS |
40 |
3.5 |
|
BACK-IN RIGHTS |
40 |
3.6 |
|
ENVIRONMENTAL LIABILITIES |
40 |
3.7 |
|
PERMITTING REQUIREMENTS |
40 |
3.8 |
|
PERMITTING REGULATIONS |
42 |
3.9 |
|
GLACIER ENVIRONMENTAL PROTECTION |
44 |
3.10 |
|
ENVIRONMENTAL BASELINE STUDIES |
44 |
4.0 |
|
Accessibility, Climate, Local Resources, Infrastructure and Physiography |
46 |
4.1 |
|
Accessibility |
46 |
4.2 |
|
Climate and Seasonal Constraints |
46 |
4.3 |
|
Local Resources and Infrastructure |
48 |
4.4 |
|
Topography, elevation and vegetation |
50 |
4.5 |
|
Availability of Area for Mine and Processing Facilities |
55 |
5.0 |
|
History |
57 |
5.1 |
|
Early Exploration |
57 |
5.2 |
|
Discovery and exploration |
57 |
5.3 |
|
transition of Ownership and Consolidation |
58 |
5.4 |
|
formation of mcewen copper and project structuring |
58 |
5.5 |
|
INVESTMENTS AND FINANCING |
59 |
5.6 |
|
RECENT DEVELOPMENTS |
59 |
5.7 |
|
Historical Mineral Resource Estimates |
59 |
5.8 |
|
Historical Production |
60 |
6.0 |
|
Geological Setting, Mineralization, and Deposit |
61 |
6.1 |
|
Regional Geology |
61 |
6.2 |
|
Property Geology |
65 |
6.3 |
|
OTHER MINERALIZATION |
86 |
6.4 |
|
Deposit Type |
86 |
7.0 |
|
Exploration |
90 |
7.1 |
|
exploration history |
90 |
7.2 |
|
Geological Mapping and Studies |
90 |
7.3 |
|
GEOPHYSICS |
90 |
7.4 |
|
SURVEYS AND INVESTIGATIONS |
96 |
7.5 |
|
FUTURE EXPLORATION |
98 |
7.6 |
|
conclusions & adequacy |
99 |
7.7 |
|
Drilling |
99 |
8.0 |
|
Sample preparation, analyses, and security |
124 |
8.1 |
|
Introduction |
124 |
8.2 |
|
Sampling methods |
124 |
8.3 |
|
Sample Preparation and Analyses |
128 |
8.4 |
|
control samples |
132 |
8.5 |
|
Conclusions |
138 |
9.0 |
|
Data Verification |
139 |
9.1 |
|
DRILL SITE INSPECTION, LOS AZULES |
139 |
9.2 |
|
CORE LOGGING COMPOUND |
141 |
9.3 |
|
CALINGASTA SAMPLE PREPARATION AND STORAGE AREA |
142 |
9.4 |
|
ALEX STEWART ASSAY LAB, MENDOZA |
143 |
9.5 |
|
GLOBAL DATABASE MANAGER, DATABASE CURATOR & EXPLORATION MANAGER, SAN JUAN |
145 |
9.6 |
|
geological modelling |
145 |
9.7 |
|
conclusions |
145 |
10.0 |
|
Mineral Processing and Metallurgical Testing |
146 |
10.1 |
|
introduction |
146 |
10.2 |
|
historical testwork summary |
146 |
10.3 |
|
PHASE 1 METALLURGICAL TESTWORK RESULTS |
147 |
10.4 |
|
PHASE 2 METALLURGICAL TESTWORK RESULTS |
150 |
10.5 |
|
PHASE 3 METALLURGICAL TESTWORK RESULTS |
160 |
10.6 |
|
COLUMN VS CRUSHER PREDICTED SIZE DISTRIBUTIONS |
179 |
10.7 |
|
METALLURGICAL PERFORMANCE |
180 |
10.8 |
|
DELETERIOUS ELEMENTS |
185 |
10.9 |
|
CORE RECOVERY ANALYSIS |
185 |
10.10 |
|
CONCLUSIONS AND RECOMMENDATIONS |
186 |
10.11 |
|
ADEQUACY OF DATA AND USE |
186 |
11.0 |
|
Mineral Resource Estimates |
187 |
11.1 |
|
INTRODUCTION |
187 |
11.2 |
|
GEOLOGIC MODEL |
195 |
11.3 |
|
DATA ANALYSIS - COPPER |
205 |
11.4 |
|
ESTIMATION DOMAINS – COPPER |
215 |
11.5 |
|
DATA ANALYSIS AND DOMAIN DEFINITION, GOLD, SILVER, AND DENSITY |
225 |
11.6 |
|
VARIOGRAPHY |
238 |
11.7 |
|
MODEL SETUP AND LIMITS |
244 |
11.8 |
|
INTERPOLATION PARAMETERS |
244 |
11.9 |
|
COPPER GRADE ESTIMATION APPROACH |
249 |
11.10 |
|
VALIDATION |
249 |
11.11 |
|
FACTORS AFFECTING THE MINERAL RESOURCES |
265 |
11.12 |
|
ADEQUACY STATEMENT ON SECTION 11 |
266 |
12.0 |
|
Mineral Reserve Estimates |
267 |
12.1 |
|
SUMMARY |
267 |
12.2 |
|
OVERVIEW |
267 |
12.3 |
|
GEOTECHNICAL PIT SLOPE ASSESSMENT AND DESIGN GUIDANCE |
268 |
12.4 |
|
MINING MODEL PREPARATION |
268 |
12.5 |
|
PIT OPTIMIZATION |
268 |
12.6 |
|
Dilution and Ore Losses |
272 |
12.7 |
|
Cut-off Grade Descriptor |
272 |
12.8 |
|
Mine Design |
273 |
12.9 |
|
MINE SCHEDULE |
278 |
12.10 |
|
MINERAL RESERVES |
278 |
12.11 |
|
FACTORS AFFECTING THE MINERAL RESERVES |
279 |
12.12 |
|
ADEQUACY STATEMENT ON SECTION 12 |
279 |
13.0 |
|
Mining Methods |
280 |
13.1 |
|
overview |
280 |
13.2 |
|
PIT GEOTECHNICAL DESIGN CRITERIA |
280 |
13.3 |
|
HYDROGEOLOGICAL AND WATER MANAGEMENT CONSIDERATIONS |
285 |
13.4 |
|
mine design |
304 |
13.5 |
|
Production Schedule |
313 |
13.6 |
|
Waste Material Handling |
317 |
13.7 |
|
mine operations |
317 |
13.8 |
|
Mine Decarbonization Strategy |
344 |
14.0 |
|
Processing and Recovery Methods |
347 |
14.1 |
|
introduction |
347 |
14.2 |
|
Process design basis |
347 |
14.3 |
|
processing facilites and site layout |
349 |
14.4 |
|
process description & design basis |
351 |
14.5 |
|
PROCESSING REAGENTS |
363 |
14.6 |
|
PROCESS STAFFING & LABOR |
370 |
14.7 |
|
PROCESS WATER REQUIREMENTS |
373 |
14.8 |
|
PROCESS POWER REQUIREMENTS |
374 |
14.9 |
|
adequacy statement ON SECTION 14 |
376 |
15.0 |
|
infrastructure |
377 |
15.1 |
|
introduction |
377 |
15.2 |
|
access to los azules |
380 |
15.3 |
|
POWER SUPPLY TO LOS AZULES |
384 |
15.4 |
|
MINE ROCK STORAGE FACILITIES, LOW-GRADE STOCKPILE, AND PRIMARY MATERIAL STOCKPILE |
388 |
15.5 |
|
camp facilities |
390 |
15.6 |
|
IT AND OT COMMUNICATIONS INFRASTRUCTURE |
402 |
15.7 |
|
transportation |
402 |
15.8 |
|
Water Consumption |
403 |
15.9 |
|
water supply |
405 |
15.10 |
|
HEAP LEACH PADS AND PONDS |
410 |
16.0 |
|
market studies and contracts |
414 |
16.1 |
|
Copper Market Outlook – Supply vs Demand |
414 |
16.2 |
|
copper market outlook - Prices |
415 |
16.3 |
|
Precious Metal Prices |
418 |
16.4 |
|
payables, treatment and refining charges |
421 |
16.5 |
|
Mineral Resource Estimate |
421 |
16.6 |
|
marketing |
422 |
16.7 |
|
cathode or concentrate transportation |
422 |
16.8 |
|
Contracts |
422 |
17.0 |
|
Environmental Studies, Permitting and Plans, Negotiations, or Agreements with Local Individuals or Groups |
423 |
17.1 |
|
Baseline Studies and Environmental Setting |
423 |
17.2 |
|
Geochemistry |
428 |
17.3 |
|
ENVIRONMENTAL MANAGEMENT AND MONITORING PLANS |
440 |
17.4 |
|
project permitting |
441 |
17.5 |
|
Community Engagement and Social Programs |
446 |
17.6 |
|
Closure Plans |
446 |
18.0 |
|
capital and operating costs |
453 |
18.1 |
|
capital cost estimation |
453 |
18.2 |
|
Project Development Execution Plan And Schedule |
462 |
18.3 |
|
OPERATING COST ESTIMATION |
469 |
19.0 |
|
economic analysis |
492 |
19.1 |
|
CAUTIONARY statement |
492 |
19.2 |
|
Methodology Used |
492 |
19.3 |
|
Financial Model Parameters |
493 |
19.4 |
|
Economic Results |
498 |
19.5 |
|
Sensitivity Analysis |
503 |
19.6 |
|
Mine Life and Capital Payback |
511 |
20.0 |
|
adjacent properties |
511 |
21.0 |
|
other relevant data and information |
512 |
21.1 |
|
UPSIDE POTENTIAL |
512 |
21.2 |
|
CONVENTIONAL MILLING OPTION |
512 |
21.3 |
|
CONCLUSIONS |
518 |
22.0 |
|
interpretation and conclusions |
519 |
22.1 |
|
Overall Risks and Opportunities Summary |
519 |
22.2 |
|
Metallurgy and Mineral Processing |
521 |
22.3 |
|
Pit Geotechnical |
525 |
22.4 |
|
MINE PLAN AND MINING METHODS |
527 |
22.5 |
|
PROJECT INFRASTRUCTURE |
527 |
22.6 |
|
ENVIRONMENTAL STUDIES, PERMITTING AND SOCIAL OR COMMUNITY IMPACT |
531 |
22.7 |
|
MINE ROCK STORAGE FACILITIES |
536 |
23.0 |
|
recommendations |
537 |
23.1 |
|
Overall recommendations |
537 |
23.2 |
|
metallurgy and mineral processing |
537 |
23.3 |
|
MINING |
538 |
23.4 |
|
pit geotechnical |
539 |
24.0 |
|
REFERENCES |
545 |
25.0 |
|
Reliance on information provided by the registrant |
551 |
List of Tables
Table 1.1: |
|
Exploration Drilling by Year and by Company |
3 |
Table 1.2: |
|
Mineral Resources (Exclusive of Mineral Reserves) |
4 |
Table 1.3: |
|
Project Metrics – Business Case |
9 |
Table 1.4: |
|
Annual Project Expenditure Plan (USD 000's) |
13 |
Table 2.1: |
|
Summary of Qualified Persons |
19 |
Table 3.1: |
|
Main Mining Rights Data and Annual Fee Andes Corporación Minera S.A. Mineral Claims Descriptions |
26 |
Table 3.2: |
|
Los Azules Project Easements |
27 |
Table 4.1: |
|
Risk Assessment of Project Infrastructure using the Qualitative Risk Matrix |
52 |
Table 4.2: |
|
Risk Reassessment of Project Infrastructure using the Qualitative Risk Matrix. |
53 |
Table 5.1: |
|
Los Azules Historical Resource Estimates |
60 |
Table 7.1: |
|
Exploration Drilling by Year and by Company |
100 |
Table 7.2: |
|
Examples of Significant Drilling Results Prior to 2022 |
106 |
Table 7.3: |
|
Examples of Significant Copper, Gold and Silver Drilling Results From January 2022 to December 2023 |
110 |
Table 8.1: |
|
Sample Control Standards (2007-2008) |
132 |
Table 8.2: |
|
Sample Control Standards (2011-2022) |
133 |
Table 8.3: |
|
Sample Control Standards (2023-2024) |
133 |
Table 10.1: |
|
Historical metallurgical test work programs |
147 |
Table 10.2: |
|
Phase 1 Column Results – 19mm |
148 |
Table 10.3: |
|
Phase 1 Column Results – 12.5mm |
149 |
Table 10.4: |
|
Phase 2 Metallurgical Testwork Program Composites |
151 |
Table 10.6: |
|
Phase 2 Column Results |
153 |
Table 10.6: |
|
Phase 3 Column Results |
162 |
Table 10.7: |
|
Phase 2 Metallurgical Testwork Program Composites |
164 |
Table 10.8: |
|
Phase 2 Metallurgical Testwork Program Composites |
165 |
Table 10.9: |
|
Relevant Copper Leach Benchmarks |
178 |
Table 10.10: |
|
Los Azules FS Extraction Data Set |
181 |
Table 10.11: |
|
Los Azules FS Extraction Modeled Through Orebody |
184 |
Table 11.1: |
|
Mineral Resources (Exclusive of Mineral Reserves) |
190 |
Table 11.2: |
|
Inferred Resources under the Cryogenic Geoforms (Exclusive of Mineral Reserves) |
192 |
Table 11.3: |
|
Principal Controlling Structures (Mortimer, 2024) |
197 |
Table 11.4: |
|
Principal boundary faults (Mortimer, 2024) |
199 |
Table 11.5: |
|
Sequence of lithological events and the units modelled |
201 |
Table 11.6: |
|
Mineral Zonation Criteria. |
203 |
Table 11.7: |
|
Geologic Events Altering and Effecting the Los Azules Deposit |
204 |
Table 11.8: |
|
Total Volumes of Modeled Mineral Zones and Lithology Units |
206 |
Table 11.9: |
|
Copper Estimation Domains |
216 |
Table 11.10: |
|
Total Copper % Declustered Statistics by Estimation Domain |
217 |
Table 11.11: |
|
Cyanide Soluble Copper(%), Declustered Statistics By Estimation Domain |
219 |
Table 11.12: |
|
Acid Soluble Copper(%), Declustered Statistics By Estimation Domain |
220 |
Table 11.13: |
|
The Proportion of Missing Assays by Estimation Domain |
222 |
Table 11.14: |
|
Summary of Metal Removal Due to Capping, Copper |
224 |
Table 11.15: |
|
Gold Capping and Metal Removal |
230 |
Table 11.16: |
|
Gold Statistics by Estimation Domain |
231 |
Table 11.17: |
|
Silver Local Capping Results |
234 |
Table 11.18: |
|
Silver, Basic Stats By Estimation Domain |
236 |
Table 11.19: |
|
Basic statistics of Density by Mineral Zone |
237 |
Table 11.20: |
|
Estimation variogram models |
242 |
Table 11.21: |
|
Block Model Origin and Dimensions. |
244 |
Table 11.22: |
|
Search Strategy for Copper Estimation, Pass 1 to 3 |
245 |
Table 11.23: |
|
Search Strategy for Copper Estimation, Pass 4 to 6 |
246 |
Table 11.24: |
|
Search parameters for gold and silver |
247 |
Table 11.25: |
|
Comparison of Resource and NN Estimates in The Block Model. |
251 |
Table 11.26: |
|
Change in Potential Resource, Enriched Zone (July, 2024 Less March 2023 |
262 |
Table 12.1: |
|
Proven and Probable Reserves – September 3, 2025 |
267 |
Table 12.2: |
|
Pit Optimization Inputs |
268 |
Table 12.3: |
|
Mine Design Parameters |
273 |
Table 12.4: |
|
Pit Optimization Versus Mine Design Comparison |
273 |
Table 12.5: |
|
Los Azules Mineral Reserves Statement, Effective Date 03 September 2025 |
278 |
Table 13.1: |
|
Rock Mass Characterization |
280 |
Table 13.2: |
|
Recommended Pit Slope Design Criteria |
282 |
Table 13.3: |
|
Recharge Estimates for the Geological Environments of the Rio De Las Salinas Basin |
289 |
Table 13.4: |
|
Pumping Parameters and Hydraulic Parameters Estimated for Each DWT Well |
294 |
Table 13.5: |
|
Pumping Parameters and Hydraulic Parameters Estimated for Each Overburden Well |
297 |
Table 13.6: |
|
Summary of the Hydrogeologic Units |
298 |
Table 13.7: |
|
Summary of the Simulated Dewatering Wells |
303 |
Table 13.8: |
|
Summary Production Schedule |
315 |
Table 13.9: |
|
Waste Blast Designs (Blast Dynamics, 2024) |
318 |
Table 13.10: |
|
Ore Blast Designs (Blast Dynamics, 2024) |
318 |
Table 13.11: |
|
Loading Equipment |
320 |
Table 13.12: |
|
PC8000 E Productivity Estimate |
321 |
Table 13.13: |
|
Truck Payload |
323 |
Table 13.14: |
|
Equipment Hours |
323 |
Table 13.15: |
|
Top Truck Speeds |
325 |
Table 13.16: |
|
Average 980E-5 Truck Speed |
325 |
Table 13.17: |
|
Fixed Times |
325 |
Table 13.18: |
|
Mechanical Availability |
326 |
Table 13.19: |
|
Equipment Numbers |
328 |
Table 13.20: |
|
Mine Personnel |
330 |
Table 13.21: |
|
Auxiliary Equipment Requirements |
331 |
Table 14.1: |
|
Process Design Basis |
348 |
Table 14.2: |
|
Estimated Annual Net Acid Requirements |
359 |
Table 14.3: |
|
Acid Plant Emissions Standards Summary (various sources) |
361 |
Table 14.4: |
|
Sulfur Pricing Build-up (Ellzey Zissos & Associates August 2025) |
364 |
Table 14.5: |
|
Elemental Sulfur Supply Mote Carlo Simulation of Landed Pricing Assumptions (Ellzey Zissos & Associates August 2025) |
365 |
Table 14.6: |
|
Average SX Reagent & Diluent Make-up Requirements |
368 |
Table 14.7: |
|
Cobalt Sulfate Usage |
368 |
Table 14.8: |
|
Guar Gum Consumption Estimates |
369 |
Table 14.9: |
|
Process Operations & Maintenance Staffing Plan |
370 |
Table 14.10: |
|
Process Fresh Water Annual Consumption by Area |
373 |
Table 14.11: |
|
Processing Areas Annual Power Demand & Consumption |
375 |
Table 15.1: |
|
MRSF’s and Stockpiles Design Parameters |
389 |
Table 15.2: |
|
Projected Camp Operations Staffing Requirements |
400 |
Table 15.3: |
|
Key Assumptions for Water Usage Estimates |
403 |
Table 15.4. |
|
Hydraulic parameters estimated for DWT-OVB-3 at the Rio de las Salinas aquifer |
406 |
Table 15.5: |
|
Hydraulic parameters for DWT-OVB-5 at the Embarrada aquifer |
408 |
Table 15.6: |
|
Hydraulic parameters estimated for OBS-OVB-MW-4_1 at the Atutia aquifer. |
409 |
Table 15.7: |
|
Heap Leach Pad Design Parameters |
411 |
Table 16.1: |
|
S&P Consensus Commodity Target Long-term Copper Pricing (US$/lb) (source: S&P Global, Sep 2025) |
415 |
Table 16.2: |
|
Consensus Long-term Copper Pricing (US$/lb) (source: CIBC, Oct 2025) |
416 |
Table 16.3: |
|
Analyst Consensus Gold Price Forecasts (US$/oz, CIBC, Oct 2025) |
418 |
Table 16.4: |
|
Analyst Consensus Silver Price Forecasts (US$/oz, CIBC, Oct 2025) |
419 |
Table 16.5: |
|
Market Assumptions for Mineral Resources |
421 |
Table 17.1: |
|
Summary of future environmental and social work plan |
428 |
Table 17.2: |
|
Summary of Samples and Testing by Mineralization |
429 |
Table 17.3: |
|
Summary of ABA Results1 |
431 |
Table 17.4: |
|
Summary of NAG pH Results2 |
432 |
Table 17.5: |
|
Summary of Outputs from Base Case Numerical Water Quality Models |
437 |
Table 17.6: |
|
Summary of Outputs from Base Case Numerical Water Quality Models for Rio Salinas |
438 |
Table 17.7: |
|
Environmental Permits – Construction/Operation Stage |
441 |
Table 17.8: |
|
Sectorial Permits - Before Construction |
442 |
Table 17.9: |
|
Project Facilities |
447 |
Table 17.10: |
|
Cost summary |
452 |
Table 18.1: |
|
Initial Capital Cost Summary |
454 |
Table 18.2: |
|
Major Equipment Budget Cost Sources |
455 |
Table 18.3: |
|
Sustaining Capital Plan |
458 |
Table 18.4: |
|
Mine Capital Cost – Summary |
460 |
Table 18.5: |
|
Long-lead Equipment Delivery Assumptions |
466 |
Table 18.6: |
|
Start-up Plan from Notice to Proceed |
467 |
Table 18.7: |
|
Annual Project Expenditure Plan (USD 000's) |
468 |
Table 18.8: |
|
Life of Mine Operating Cost Summary* |
470 |
Table 18.9: |
|
Annual Mine Expenditure |
473 |
Table 18.10: |
|
Open Pit Mining Costs ($/t Total Material) |
475 |
Table 18.11: |
|
Unit Supply Assumptions |
476 |
Table 18.12: |
|
Life of Mine Operating Cost Summary |
477 |
Table 18.13: |
|
Consolidated G&A (San Juan, Calingasta, Los Azules Site) |
478 |
Table 18.14: |
|
Los Azules Site G&A |
480 |
Table 18.15: |
|
Site Camp Planning |
483 |
Table 18.16: |
|
Los Azules Site Based G&A Staffing and Cost |
483 |
Table 18.17: |
|
Calingasta Site G&A |
486 |
Table 18.18: |
|
Calingasta Staffing |
487 |
Table 18.19: |
|
San Juan Office G&A |
487 |
Table 18.20: |
|
San Juan Office Staffing |
488 |
Table 19.1: |
|
Common Model Inputs |
493 |
Table 19.2: |
|
Life of Mine Capital Cost Summary ($000s) |
494 |
Table 19.3: |
|
Project Royalties |
496 |
Table 19.4: |
|
Economic Results Summary |
499 |
Table 19.5: |
|
Detailed Cashflow |
501 |
Table 19.6: |
|
Copper Price Sensitivity |
503 |
Table 19.7: |
|
CAPEX Sensitivity (Initial + Sustaining) |
506 |
Table 19.8: |
|
OPEX Sensitivity |
506 |
Table 21.1: |
|
Optimized Lock-cycle Flotation Results |
513 |
Table 21.2: |
|
Mill Option Direct Operating Cost Summary |
515 |
Table 21.3: |
|
Mill Option Capital Costs Summary |
516 |
Table 21.4: |
|
Mill Option Economic Model Summary |
517 |
Table 22.1: |
|
Financial Highlights @ $4.78/lb |
521 |
Table 23.1: |
|
Summary of proposed geotechnical drillholes |
540 |
Table 23.2: |
|
Proposed additional laboratory tests |
543 |
List of Figures
Figure 1.1: |
|
Life of Mine Copper Production (SE 2025) |
8 |
Figure 1.2: |
|
Project IRR Sensitivity Analysis (SE 2025) |
10 |
Figure 2.1: |
|
Scope 1 GHG Emission Sources for Current Project Basis (SE 2025) |
16 |
Figure 3.1: |
|
Project Location (Andes Corporación Minera SA 2024) |
22 |
Figure 3.2: |
|
Los Azules Ownership Structure as of Sep 24, 2025 (McEwen, 2025) |
25 |
Figure 3.3: |
|
Los Azules Project Mines (see Table 4.1 for legend) (Andes Corporación Minera SA 2025 |
26 |
Figure 3.4: |
|
Mining Easements (McEwen 2025) |
29 |
Figure 3.5: |
|
Projected Route of the Power Line and Access Road (McEwen 2025) |
30 |
Figure 3.6: |
|
Location of Marisa I Relative to the Los Azules Project (Andes Corporación Minera SA, 2025) |
33 |
Figure 3.7: |
|
Map of Mineral Claims (Minas), Easements (Servidumbres) and Surface (Superficie) Ownership (Andes Corporación Minera SA - 2025) |
35 |
Figure 3.8: |
|
Easements (Andes Corporación Minera SA - 2025) |
39 |
Figure 4.1: |
|
Los Azules Project Site General Arrangement (SE, 2025) |
56 |
Figure 6.1: |
|
Physiographic features of San Juan Province, Argentina (Rojas 2010) |
62 |
Figure 6.2: |
|
Regional geology of the Andean Cordillera of Argentina and Chile (Rojas 2010) |
64 |
Figure 6.3: |
|
Model for Los Azules (pink: potassic alteration, green: chloritic alteration, blue: sericitic alteration, yellow: advanced argillic lithocap), (Sillitoe, 2014) |
66 |
Figure 6.4: |
|
Geologic map of Los Azules (Pratt and Bolsover 2010) |
67 |
Figure 6.5: |
|
3D block view of the Pre-mineral diorite pluton (PMP) in dark green. Drillhole traces are shown in grey. (McEwen Copper, 2024). |
68 |
Figure 6.6: |
|
The La Ballena ridge is characterized by the relatively resistant Early Mineralized Porphyry Dike. Looking NW (McEwen 2025) |
69 |
Figure 6.7: |
|
Early mineral porphyry with type-A quartz veinlets cut by type-D veinlets of pyrite replaced by supergene chalcocite. Pervasive sericite alteration. (Vásquez, 2015). |
69 |
Figure 6.8: |
|
Inter-mineral Dikes (yellow) and their relationship to the EMP (red). The most prominent IMP is located on the East side of the EMP. (McEwen, 2024) |
70 |
Figure 6.9: |
|
Inter-mineral Dikes with potassic alteration. (McEwen, 2024) |
71 |
Figure 6.10: |
|
Magmatic-hydrothermal breccia with chalcopyrite and tourmaline in the breccia matrix. Clasts are partially sericitized (Hole AZ1297, 477 m) (Vázquez, 2015) |
71 |
Figure 6.11: |
|
Early magmatic-hydrothermal breccia (green) along the edges and the cupola zones of the EMP (red) (McEwen 2024). |
72 |
Figure 6.12: |
|
Inter-mineral magmatic-hydrothermal breccia (red) occur along the western edges of the IMP (yellow) (McEwen Copper 2024). |
73 |
Figure 6.13: |
|
3D block view showing green and white Sericite alteration in green with the deeper potassic alteration zone in purple. (McEwen 2024) |
75 |
Figure 6.14: |
|
Typical drill core from Los Azules indicating the strongly fractured nature of the rock (Jemielita, 2010). |
76 |
Figure 6.15: |
|
Diorite (precursor pluton) with potassic alteration cut by a quartz-chalcopyrite type-A veinlet (Vázquez, 2015). |
76 |
Figure 6.16: |
|
Early Mineralized Porphyry Dike (red). The entire dike is affected by potassic alteration. The dike is not yet constrained at depth by drilling (McEwen, 2024) |
77 |
Figure 6.17: |
|
The White and Green Sericite alteration zone is shown in green. The sericite alteration affected the EMP, inter-mineral dikes, and surrounding quartz diorite rock (not shown). (McEwen Copper, 2024). |
78 |
Figure 6.18: |
|
Supergene enrichment zone (yellow) superimposed on the potassic zone (purple). The supergene enrichment zone is defined as having a Soluble Cu ratio >50%. (McEwen, 2024) |
79 |
Figure 6.19: |
|
Sulphate front modeled using hyperspectral data (McEwen, 2024). |
80 |
Figure 6.20: |
|
Typical drill core from Los Azules indicating the strongly fractured nature of the rock (Jemielita, 2010). |
80 |
Figure 6.21: |
|
Surface Structural Map (CIGEA, 2024). |
83 |
Figure 6.22: |
|
Schematic drawing of the principal faults and their relationship to mineralization. The principal compression directions are shown with red arrows and the principal extension directions are shown with blue arrows. (CIGEA, 2024) |
84 |
Figure 6.23: |
|
First order faults modeled at Los Azules (CIGEA, 2024) |
85 |
Figure 6.24: |
|
Miocene - Early Pliocene porphyry copper belt (red) of the north and Central Andes. The Paleogene belt is orange (Piquer, et al, 2021). |
87 |
Figure 6.25: |
|
Diagram Showing Spatial Relationships between a Porphyry Copper System and the Surrounding Environment (Sillitoe 2010) |
89 |
Figure 7.1: |
|
Magnetic Map of Los Azules (Reduced to Pole) and IP lines. (Rojas, 2008 after Xstrata, 2003). Note: Red box indicates the mag low across the Ballena Ridge. |
92 |
Figure 7.2: |
|
The 2010 survey Section 58,400N Showing 2D IP Inversion Anomaly (Southwest Target) (McEwen 2012). Note the Resource Limiting Shell is historic in nature (2012) and does not represent the current 2025 pitshell outline. |
94 |
Figure 7.3: |
|
Total Magnetic Field Map of Los Azules. (Quantec, 2012). Note: Dashed red box indicates the location of the mag low across the Ballena Ridge seen in Fig 7.1 – the solid red box indicates the discontinuous mag low to the southwest. |
95 |
Figure 7.4: |
|
Resistivity voxel in 3D view of the surveyed area. Top from surface, bottom from 2900 m ASL. The location of Los Azules is shown by a yellow star. (Expert 2025) |
96 |
Figure 7.5: |
|
Plan Showing Locations of drill holes at Los Azules (McEwen 2025). Note that not all drillholes are shown, only those in the immediate pit and resource areas. |
101 |
Figure 7.6: |
|
Logging and inspection of drill core (McEwen 2023) |
104 |
Figure 7.7: |
|
Geotechnical logging and data collection (McEwen 2023) |
105 |
Figure 8.1: |
|
Dedicated static photo booth for consistent photography of core (McEwen 2023) |
125 |
Figure 8.2: |
|
An example of the labelling of core boxes for photography (McEwen 2023) |
125 |
Figure 8.3: |
|
The securing and loading of the core boxes for shipment to Calingasta (McEwen 2023) |
126 |
Figure 8.4: |
|
The geoLOGr hyperspectral scanning unit (McEwen 2023) |
126 |
Figure 8.5: |
|
The hydraulic core splitter (McEwen 2025) |
127 |
Figure 8.6: |
|
Showing the sequence of bagging, tagging, sealing, and securing the samples for dispatch (McEwen 2023) |
128 |
Figure 8.7: |
|
Total Copper Assays vs Re-Assays (CRM 2023) |
130 |
Figure 8.8: |
|
Cyanide Soluble Copper Assays vs Re-Assays (CRM 2023) |
131 |
Figure 8.9: |
|
Diagnostic Charts for Standards Used at Los Azules 2023-2024, Standard 501d (McEwen 2025) |
134 |
Figure 8.10: |
|
Diagnostic Charts for Standards Used at Los Azules 2023-2024, Standard 504d (McEwen 2025) |
135 |
Figure 8.11: |
|
Diagnostic Charts for Standards Used at Los Azules 2023-2024, Standard 507 (McEwen 2025) |
135 |
Figure 8.12: |
|
Cu. Average of Std quantifications vs Best Value (McEwen 2025) |
136 |
Figure 8.13: |
|
Coarse duplicate scatterplot 2023-2024 (McEwen 2025) |
137 |
Figure 8.14: |
|
Pulp Duplicate Scatterplot 2023-2024 (McEwen 2025) |
137 |
Figure 8.15: |
|
Gold in Blank vs Gold in Previous Sample (McEwen 2025) |
138 |
Figure 9.1: |
|
Rig location tracking system (McEwen 2025) |
140 |
Figure 9.2: |
|
Stake and initial collar coordinates for hole IND59 (McEwen 2025) |
141 |
Figure 9.3: |
|
Bagged Samples (McEwen 2025) |
143 |
Figure 9.4: |
|
Sample Bags on Pallet (L) and Sample After Ordering (R) (McEwen 2025) |
144 |
Figure 10.1: |
|
Phase 2 Soluble Copper Kinetic Extraction Results – Diorite Composites (SE 2025) |
156 |
Figure 10.2: |
|
Phase 2 Soluble Copper Kinetic Extraction Results – EMP Composites (SE 2025) |
157 |
Figure 10.3: |
|
Phase 2 Soluble Copper Kinetic Extraction Results – IMP Composites (SE 2025) |
158 |
Figure 10.4: |
|
Phase 2 Net Acid Consumption Results – Diorite Composites (SE 2025) |
158 |
Figure 10.5: |
|
Phase 2 Net Acid Consumption Results – IMP Composites (SE 2025) |
159 |
Figure 10.6: |
|
Phase 2 Net Acid Consumption Results – EMP Composites (SE 2025) |
159 |
Figure 10.7: |
|
Phase 2 column extraction results plotted from lowest CuSOL/CuT Ratio to highest (SE 2025) |
160 |
Figure 10.8: |
|
Phase 3 Soluble Copper Kinetic Extraction Results – Diorite (SE 2025) |
168 |
Figure 10.9: |
|
Phase 3 Net Acid Consumption Results – Diorite (SE 2025) |
169 |
Figure 10.10: |
|
Phase 3 Soluble Copper Kinetic Extraction Results – EMAG Hydrothermal Breccia (SE 2025) |
170 |
Figure 10.11: |
|
Phase 3 Net Acid Consumption Results – EMAG Hydrothermal Breccia (SE 2025) |
171 |
Figure 10.12: |
|
Phase 3 Soluble Copper Kinetic Extraction Results – EMP (SE 2025) |
172 |
Figure 10.13: |
|
Phase 3 Net Acid Consumption Results – EMP (SE 2025) |
173 |
Figure 10.14: |
|
Phase 3 Soluble Copper Kinetic Extraction Results – IMAG Hydrated Breccia (SE 2025) |
174 |
Figure 10.15: |
|
Phase 3 Net Acid Consumption Results – IMAG Hydrated Breccia (SE 2025) |
174 |
Figure 10.16: |
|
Phase 3 Soluble Copper Kinetic Extraction Results – IMP (SE 2025) |
175 |
Figure 10.17: |
|
Phase 3 Net Acid Consumption Results – IMP (SE 2025) |
176 |
Figure 10.18: |
|
Phase 3 Soluble Copper Kinetic Extraction Results (SE 2025) |
176 |
Figure 10.19: |
|
Phase 3 Net Acid Consumption Results (SE 2025) (SE 2025) |
177 |
Figure 10.20: |
|
Average size distribution of column test work vs. Los Azules Crushing Circuit Model output. (SE 2025) |
180 |
Figure 10.21: |
|
All column tests, 360-day total extraction data plotted with copper solubility with data sorted with increasing copper solubility. (SE 2025) |
183 |
Figure 10.22: |
|
All 360-day column extraction data plotted as CuSOL/CuT ratio of the head grade broken out by lithology and ratios. (SE 2025) |
184 |
Figure 11.1: |
|
Drill Hole Location Map (CRM 2025) |
194 |
Figure 11.2: |
|
Section Lines in Section Layout, Level 3500 (CRM 2025) |
195 |
Figure 11.3: |
|
The early mineral porphyry (red) and its relation to the Ballena, Largatija, Piuquenes, and Emma faults (grey). (CRM 2025) |
197 |
Figure 11.4: |
|
First and second-order faulting and their relationship to potassic and sericitic alteration. Faults are shown in grey, potassic alteration in purple, and sericitic alteration in green. Oblique plan view. (CRM 2025) |
198 |
Figure 11.5: |
|
Faults that act as boundaries to mineralization are labeled in plain view (block model copper grades level 3500m are also shown). (CRM 2025) |
200 |
Figure 11.6: |
|
Level plan (3270 m) and section 37 of the lithological model. (CRM 2025) |
202 |
Figure 11.7: |
|
Average Copper Grades by Lithology and Mineral Zone (CRM 2025) |
207 |
Figure 11.8: |
|
Level 3450 +/- 10m, Enriched Zone, 2m Composite Grades (CRM 2025) |
208 |
Figure 11.9: |
|
Average Total Copper Grade by Distance to Central Line (CRM 2025) |
209 |
Figure 11.10: |
|
Copper grades as a function of distance for lithologies in addition to the diorite (CRM 2025) |
210 |
Figure 11.11: |
|
Box Plot by Primary Vein Type and Lithology (CRM 2025) |
211 |
Figure 11.12: |
|
Box plots of total copper grade by lithology and vein-type (CRM 2025) |
212 |
Figure 11.13: |
|
Average Copper by Distance to Central Structure and Lithology (CRM 2025) |
213 |
Figure 11.14: |
|
Enriched Zone Composites, Average Grade and Solubility By Depth (CRM 2025) |
214 |
Figure 11.15: |
|
Hypogene Zone Composites, Average Copper and Solubility Below Base of Enrichment (CRM 2025) |
215 |
Figure 11.16: |
|
Spatial distribution of the estimation domains and a comparison with the drillhole data. Looking NW. (CRM 2025) |
217 |
Figure 11.17: |
|
Total Copper Grade Distribution (left) and after Capping (right) for Enriched Zone Domains (CRM 2025) |
224 |
Figure 11.18: |
|
Box Plot of Gold by Mineral Zone (CRM 2025) |
226 |
Figure 11.19: |
|
Gold by Distance to the Central Structure (CRM 2025) |
227 |
Figure 11.20: |
|
Gold by Mineral Zone and Lithology (CRM 2025) |
228 |
Figure 11.21: |
|
Gold by Elevation and Lithology / Vein type (CRM 2025) |
229 |
Figure 11.22: |
|
Example of Local Gold Capping Results for Domains 102 and 1031 (CRM 2025) |
230 |
Figure 11.23: |
|
Box plots of Silver grade (CRM 2025) |
232 |
Figure 11.24: |
|
Silver Box Plots by Initial Groups (CRM 2025) |
233 |
Figure 11.25: |
|
Silver Local Capping Results, Domains 30102 and 31031 (CRM 2025) |
235 |
Figure 11.26: |
|
Variogram for Domain 3102 (CRM 2025) |
238 |
Figure 11.27: |
|
Variogram for Domain 31031 (CRM 2025) |
239 |
Figure 11.28: |
|
Gold variograms for domains 102 and 1031 (CRM 2025) |
240 |
Figure 11.29: |
|
Silver variograms for domains 30102 and 31031 (CRM 2025) |
241 |
Figure 11.30: |
|
Example section comparing drillhole and block model grades. Fault lines are shown in blue. Looking NW. (CRM 2025) |
250 |
Figure 11.31: |
|
Average grade estimate comparison with drillhole data. Enriched zone. (CRM 2025) |
253 |
Figure 11.32: |
|
Average grade estimate comparison with drillhole data. Outside enriched zone. (CRM 2025) |
253 |
Figure 11.33: |
|
Total copper validation scatterplots for domains 3102 and 31031 (CRM 2025) |
255 |
Figure 11.34: |
|
Model and Data Average Gold Over Large Blocks (CRM 2025) |
256 |
Figure 11.35: |
|
Model and Data Average Silver Over Large Blocks (CRM 2025) |
256 |
Figure 11.36: |
|
Swath plot validations in domain 3102 (CRM 2025) |
257 |
Figure 11.37: |
|
Comparison of Total Copper Model and Data Averages By Relative Depth (CRM 2025) |
258 |
Figure 11.38: |
|
Model validation by lithology in enriched zone (CRM 2025) |
259 |
Figure 11.39: |
|
Example of initial versus smoothed classification at Level 3500. (CRM 2025) |
261 |
Figure 11.40: |
|
Compares estimated average grades within the dominant “A-Vein” volume. (CRM 2025) |
264 |
Figure 11.41: |
|
Average grades for blocks outside of the “A-Vein” volume (CRM 2025) |
265 |
Figure 12.1: |
|
Pit-by-Pit Graph (AGP 2025) |
271 |
Figure 12.2: |
|
Ultimate Pit Shell (AGP 2025) |
272 |
Figure 12.3: |
|
Ultimate Pit Design (AGP 2025) |
275 |
Figure 12.4: |
|
Ultimate Pit Design and Selected Pit Shell – Section 1 (AGP 2025) |
276 |
Figure 12.5: |
|
Ultimate Pit Design and Selected Pit Shell – Section 2 (AGP 2025) |
277 |
Figure 12.6: |
|
Ultimate Pit Design and Selected Pit Shell – Section 3 (AGP 2025) |
277 |
Figure 13.1: |
|
Recommended Design Parameters by Design Sector and Geotechnical Environment (EMT 2025) |
284 |
Figure 13.2: |
|
Mining Activities Related to the Main Hydrological Basins (BW 2025) |
287 |
Figure 13.3: |
|
Los Azules Project Area, May 2024 (BW) |
288 |
Figure 13.4: |
|
Delineated Zones & Slopes Used for Recharge Estimate & its Associated Lithologies (BW, 2025) |
288 |
Figure 13.5: |
|
Equipotential Lines from the Rio Salinas Watershed. (BW 2025) |
291 |
Figure 13.6: |
|
Piezometers and Pumping Wells Locations (BW 2025) |
292 |
Figure 13.7: |
|
Curves Time- Drawdown During the Simultaneous Pumping Test at DWT-1, DWT-2 and DWT-3 (BW 2025) |
295 |
Figure 13.8: |
|
Maximum Water Level Changes Recorded in the Wells During the Simultaneous Pumping Test at DWT-1, DWT-2 and DWT-3 (BW 2025) |
296 |
Figure 13.9: |
|
Schematic Conceptual Model for the Natural Hydrological System in the Zone of the Future Open Pit Area (Cross-Sectional View) (BW 2025) |
301 |
Figure 13.10. |
|
Hydrogeological Numerical Model Domain (BW 2025) |
302 |
Figure 13.11: |
|
Hydraulic Heads Observed Versus Simulated After the Steady-State Calibration (BW 2025) |
303 |
Figure 13.12: |
|
Ultimate Pit Design (AGP 2025) |
305 |
Figure 13.13: |
|
Interim Phases Layout (AGP 2025) |
306 |
Figure 13.14: |
|
Interim Phases – Section 1 (AGP 2025) |
307 |
Figure 13.15: |
|
Interim Phases – Section 2 (AGP 2025) |
307 |
Figure 13.16: |
|
Interim Phases – Section 3 (AGP 2025) |
308 |
Figure 13.17: |
|
Low-Grade Stockpile Design (AGP 2025) |
309 |
Figure 13.18: |
|
Low-Grade Stockpile Balance (AGP 2025) |
309 |
Figure 13.19: |
|
Primary Stockpile Design (AGP 2025) |
310 |
Figure 13.20: |
|
Northeast Mine Rock Storage Facility Design (AGP 2025) |
311 |
Figure 13.21: |
|
South Mine Rock Storage Facility Design (AGP 2025) |
312 |
Figure 13.22: |
|
MRSF and Stockpile Location (AGP 2025) |
313 |
Figure 13.23: |
|
Annual Production Schedule (AGP 2025) |
317 |
Figure 13.24: |
|
Open Pit Monitoring Strategy (SRK 2023) |
334 |
Figure 13.25: |
|
Pit Configuration at the End of Year -2 (AGP 2025) |
335 |
Figure 13.26: |
|
Pit Configuration at the End of Year -1 (AGP 2025) |
336 |
Figure 13.27: |
|
Pit Configuration at the End of Year 1 (AGP 2025) |
337 |
Figure 13.28: |
|
Pit Configuration at the End of Year 2 (AGP 2025) |
338 |
Figure 13.29: |
|
Pit Configuration at the End of Year 3 (AGP 2025) |
339 |
Figure 13.30: |
|
Pit Configuration at the End of Year 4 (AGP 2025) |
340 |
Figure 13.31: |
|
Pit Configuration at the End of Year 5 (AGP 2025) |
341 |
Figure 13.32: |
|
Pit Configuration at the End of Year 10 (AGP 2025) |
342 |
Figure 13.33: |
|
Pit Configuration at the End of Year 15 (AGP 2025) |
343 |
Figure 13.34: |
|
Pit Configuration at the End of Year 21 (AGP 2025) |
344 |
Figure 14.1: |
|
Simplified Process Flow Diagram (SE 2025) |
350 |
Figure 14.2: |
|
Processing Facilities Layout (SE 2025) |
351 |
Figure 14.3: |
|
Mined Ore Grades to Leach Pad & Cathode Production (SE 2025) |
352 |
Figure 14.4: |
|
Crushing Systems General Layout (SE 2025) |
354 |
Figure 14.5: |
|
Example Stacking System Operation (Terra Nova Technologies) |
355 |
Figure 14.6: |
|
Processing Area Layout (SE 2025) |
357 |
Figure 14.10: |
|
Sulfur Landed Costs Probability Assessment (Ellzey Zissos & Associates Aug 2025) |
367 |
Figure 15.1: |
|
Regional Infrastructure (Google 2025) |
378 |
Figure 15.2: |
|
Overall Site Layout (SE 2025) |
379 |
Figure 15.3: |
|
Existing Access & Infrastructure (ACMSA, 2022) |
381 |
Figure 15.4: |
|
Existing Access Road Photos (McEwen, 2023) |
383 |
Figure 15.5: |
|
Future Access Road (McEwen, 2025) |
384 |
Figure 15.6: |
|
Calculated load over time. (SE 2025) |
385 |
Figure 15.7: |
|
Annual Energy Consumption by Area (MWh) (SE 2025) |
386 |
Figure 15.8: |
|
Regional Power Infrastructure and Proposed Upgrades/Construction (McEwen 2025) |
387 |
Figure 15.9: |
|
Los Azules Master Plan referencing an alternate camp location (McLennan 2025) |
391 |
Figure 15.10: |
|
CTL Camp Exterior Perspective (McLennan 2025) |
392 |
Figure 15.11: |
|
CTL Camp Courtyard Perspective (McLennan 2025) |
393 |
Figure 15.12: |
|
Section through CTL Camp ‘Main Street’ showing Passive and Active Energy and Water Treatment Systems (McLennan 2025) |
394 |
Figure 15.13: |
|
Aerial Rendering representing CTL Campus and Regenerative Camp (McLennan 2025) |
396 |
Figure 15.14: |
|
Regenerative Camp Rendering (McLennan 2025) |
397 |
Figure 15.15: |
|
Regenerative Camp Roof Plan indicating solar panels (McLennan 2025) |
398 |
Figure 15.16: |
|
Regenerative Camp Central Town Hall: Dining, Amenities, Services, and Offices (McLennan 2025) |
399 |
Figure 15.17: |
|
Regenerative Camp Wastewater Diagram (McLennan 2025) |
400 |
Figure 15.18: |
|
Regenerative Camp exterior rendering (McLennan 2025) |
401 |
Figure 15.19: |
|
Annual Water Consumption by Major Consumer (M3/hr) (KP 2025) |
404 |
Figure 15.20: |
|
Groundwater water supply sites (BW 2025) |
405 |
Figure 15.21: |
|
Electrical Tomography at the Río de las Salinas sub-basin. (BW 2025) |
406 |
Figure 15.22: |
|
Electrical Tomography at the Embarrada sub-basin. (BW 2025) |
407 |
Figure 15.23: |
|
Electrical Tomographies at the Atutia River within the Río Castaño basin. (BW 2025) |
409 |
Figure 16.1: |
|
Future Copper Market Supply and Demand Outlook (from S&P Global, Aug 2025) |
415 |
Figure 16.2: |
|
LME 3-Month Contract Copper Prices (US$/lb) 2020 to Present (source: https://www.lme.com/en/Metals/Non-ferrous/LME-Copper#Price+graphs, retrieved 1-Oct-2025) |
417 |
Figure 17.1: |
|
Graph of NPR against NAG pH (SRK 2025) |
433 |
Figure 18.1: |
|
Percentage of Total Capital by Cost Center (SE 2025) |
461 |
Figure 18.2: |
|
Conceptual Project Execution Schedule (McEwen 2025) |
463 |
Figure 18.3: |
|
Tonnage Mined and Mine Operating Costs (AGP 2025) |
471 |
Figure 18.4: |
|
Cost by Cost Item (AGP 2025) |
472 |
Figure 18.5: |
|
Operating Cost by Cost Center (AGP 2025) |
473 |
Figure 19.1: |
|
The percentage splits of each LOM operating cost component. (SE 2025) |
496 |
Figure 19.2: |
|
Copper Price per Pound Sensitivity on NPV @ 8% (Pre-tax) (SE 2025) |
504 |
Figure 19.3: |
|
Copper Price per Pound Sensitivity on IRR (Pre-tax) (SE 2025) |
505 |
Figure 19.4: |
|
Multiple % Sensitivity on NPV @ 8% (Pre-tax) (SE 2025) |
507 |
Figure 19.5: |
|
Multiple % Sensitivity on NPV @ 8% (Post-tax) (SE 2025) |
508 |
Figure 19.6: |
|
Multiple % Sensitivity on IRR (Pre-tax) (SE 2025) |
509 |
Figure 19.7: |
|
Multiple % Sensitivity on IRR (Post-tax) (SE 2025) |
510 |
Figure 21.6: |
|
Annual Mill Feed Tonnes and Grades |
514 |
Figure 21.2: |
|
Mill Option Payable Copper Production Estimates |
516 |
Figure 23.1: |
|
Location of proposed geotechnical drillholes (EMT 2025) |
542 |
Executive Summary
This Technical Report Summary (“Report”) is prepared for McEwen Inc. (McEwen) trading under the symbols TSX:MUX/NYSE:MUX for the purposes of disclosing current updates and information related to its 46.40% owned subsidiary McEwen Copper Inc. (McEwen Copper), which controls the Los Azules copper property and associated surface and mineral rights. The information presented herein is based on the McEwen Copper’s 100% interest in the Los Azules Project through its Argentine subsidiary, Andes Corporación Minera S.A. (ACM).
This report is a Technical Report Summary (TRS) which summarizes the findings of the Feasibility Study (FS) completed for the Los Azules Project in accordance with The United States Securities Exchange Commission (SEC) 17 CFR Part §229.1300 (S-K 1300) Standard Instructions for Regulation S-K subpart 1300 SEC S-K §229. 1304 and §229.601(b)(96). This TRS is intended to meet the requirements of S-K 1300 as considered for a Feasibility Study level of study and disclosure as defined in the regulations and supporting reference documents. The Report has been prepared in accordance with the standards and guidelines of S-K 1300 for the disclosure of material information and serves as the basis for declaring Mineral Reserves. The Effective Date for this report is September 3, 2025.
This report has been consolidated and prepared by Samuel Engineering Inc. for McEwen with contributions from Knight Piésold Consulting, AGP Mining Consultants Inc, Nuton LLC, a Rio Tinto Venture, E-Mining Technology S.A., Call & Nicholas, Inc., Itasca Consulting Group, Inc., CRM-SA, LLC, McLennan Design/Perkins&Will, Whittle Consulting Pty Ltd, Techint S.A.C.I., BW Hidrogeología y Medioambiente, and SRK Consulting UK Limited.
The 2025 FS includes an updated independent Mineral Resources and Reserves estimate, which contains:
Mineral Resources (exclusive of Reserves) of 5.4 B lbs Cu classed as Measured and Indicated (grade 0.26% Cu) and 20.0 B lbs Cu as Inferred (grade 0.21% Cu).
A maiden Mineral Reserve of 10.2 B lbs Cu proven and probable (grade 0.45% Cu).
With the completion of this FS, the Los Azules Project has progressed beyond the exploration stage, achieving the level of technical and economic confidence required to support Mineral Reserve estimation. The Qualified Persons (QPs) meet the standards for a FS-level assessment and confirm the Los Azules Project's technical and financial viability, supporting the transition to the next stages of permitting, financing, and project development.
This Report builds upon previous technical studies, including the last S-K 1300 Technical Summary Report Initial Assessment published in 2023 (IA 2023). NI 43-101 compliant PEA reports were completed for the Los Azules property in 2009 and updated in 2010, 2013, 2017, and 2023. Due to the advanced nature of the deposit definition and multiple options considered in the 2023 work, a pre-feasibility study was not produced, and the information has been consolidated into this work and documentation.
Property Location, description, and OWNERSHIP The Los Azules Copper Project is in the Frontal Andes of San Juan Province, Argentina, approximately 80 km from the town of Calingasta and 294 km west of the provincial capital of San Juan.
The project sits at elevations ranging from 3,200 to 4,500 mASL in a remote, high-altitude environment adjacent to the Chilean border. Access is currently seasonal and requires significant road improvements for project use, with new infrastructure under development to support construction and year-round operations.
Access to the project is currently provided via 120 km of improved road, measured from the town of Villa Calingasta, suitable for pickup trucks, chassis trucks, and semi-trailers. The route includes two high-altitude mountain passes, Cabeza de León and La Totora, both located above 4,100 mASL. All required easements are duly secured and properly established through their respective administrative resolutions (administrative acts of establishment). Planned improvements include road upgrades and the construction of a new access road that will connect the existing route to the project site via an alternative alignment to avoid the two high altitude passes and impact glaciers or geoforms along the route.
The site does not have a nearby population or infrastructure, and temporary camps currently support exploration activities. A phased infrastructure strategy is in place, beginning with an expanded pioneer camp for construction and later leading to the development of a regenerative design operations camp. The Project’s land position and access have been carefully secured to support long-term development.
McEwen Copper Inc. holds a 100% interest in the Los Azules Project through its Argentine subsidiary, Andes Corporación Minera S.A. (ACM). ACM controls all required mining and surface rights, as well as easements and access routes, with fully established legal and administrative standing. Other significant ownership positions in McEwen Copper Inc. are FCA Argentina S.A. (Stellantis) 18.3%, Nuton LLC (Rio Tinto) 17.2%, and Evanachan Limited (R.R. McEwen) 12.7%. McEwen Copper is in the process of simplifying its ownership structure and consolidating control under Argentine law.
All information in this report is reported on a 100% project basis.
INFRASTRUCTURE
The Los Azules Project is in a remote, high-altitude region of San Juan Province, Argentina, requiring the development of significant new infrastructure to support mine construction and operations. The Project will be accessed via upgraded and newly constructed roads, including a year-round southern route and a future optimized corridor. Copper cathodes will be transported to Chilean ports for export.
Power will be supplied from the Argentinian grid via the Calingasta Transformer Station (ET Calingasta) 500/220/132 kV. Initially, the project will require approximately 39/36 MW (gross/net demand), in year -1, increasing to a peak of 157/129 MW (gross/net demand) in year 10 as the processing facilities are expanded and mine power requirements increase over time.
Water supply will initially be met through pit dewatering, with long-term supply secured from confirmed groundwater reserves and well systems. Ore processing will rely on a large-scale heap leach facility with engineered containment, water management, and recovery systems.
Mine infrastructure includes engineered waste rock and ore storage facilities, processing areas, and support buildings. Worker accommodations will be provided in two main camps: a modular Construction, Training, and Logistics Campus, and an innovative Regenerative Camp designed for long-term occupancy and sustainability. A comprehensive digital infrastructure supports autonomous operations and centralized control via a remote operations center in San Juan.
EXPLORATION & DRILLING
Exploration at Los Azules commenced in the mid-1990s and included various studies of geology, geophysics, and geochemistry, as well as drilling with both reverse circulation and diamond core drills, sampling and analysis of surface and drill core samples, and road construction. Drilling programs have been undertaken at Los Azules between 1998 and 2025 by five different mineral exploration companies including BMG, MIM Argentina (now Glencore), and McEwen Mining as Minera Andes and McEwen Copper. Drilling included reverse circulation programs mostly for gold exploration and diamond (core) drilling focusing on supergene and hypogene porphyry-style copper mineralization. Table 1.1 presents a summary of the drilling information which includes resource, geotechnical, hydrological, and metallurgical components.
Table 1.1: Exploration Drilling by Year and by Company | |||
|---|---|---|---|
Year |
Company |
No. of holes |
Meters |
1998 –1999 |
Battle Mountain Gold |
27 |
6,493 |
2004 |
Glencore Xstrata (MIM) |
13 |
2,930 |
2003 – 2011 |
Minera Andes |
127 |
32,259 |
2011 – 2018 |
McEwen |
143 |
30,940 |
2022-2025 |
McEwen Copper |
659 |
136,338 |
Total |
|
969(1) |
208,960 |
This table includes all drilling that has occurred on the property. Some holes were redrilled due to drilling difficulties and are not included in the database. Not all holes are used in the resource database. Holes that were started in one season and completed the following season are counted in the year they were started, but the meters drilled in each season are shown for the respective seasons. The drilling reflects all holes to the data cut-off date of April 2025.
The current database is sufficient for preparing a long-range model that will serve as a basis for modeling associated with completing the FS. The extent of mineralization along strike exceeds three kilometers, and the distance across strike is approximately one km. The deposit is open at depth. Over the approximately 2.5 km strike length where mineralization is strongest, the average drill spacing ranges from approximately 50 m to more than 120 m. The central core of the enriched zone is drilled at an approximate 50 m spacing.
The assay database considers 627 drillholes with 132,255.2 m of assayed intervals. Resource estimation work was performed using Datamine Studio modeling software.
mineral resource estimates
Copper occurs primarily as chalcocite in the supergene enrichment zone and as chalcopyrite and bornite at depth. The estimate was prepared in accordance with the CIM Definition Standards and incorporates detailed geological modeling, domaining, variography, and block model interpolation.
The Mineral Resource estimate is reported within a Whittle-optimized pit shell using a base case NSR (Net Smelter Return) cut-off, which incorporates assumptions for metal prices, recoveries, smelter terms, and operating costs. Mineral resources are determined using an NSR cut-off value to cover the processing cost for each recovery methodology.
For supergene and primary material using sulfuric acid bioleaching and SX/EW copper recovery, a marginal cut-off was used that was variable ranging from $4.79/t NSR to $7.23/t NSR. The supergene and primary material can be treated in a float mill with NSR cutoffs of $5.13/t and $5.11/t, respectively. NSR values are based on a copper price of $4.80/lb, gold at $2,500/oz and silver at $32/oz where applicable. Variable pit slopes between 32° and 37° were applied depending on sector.
The current Mineral Resource estimate is summarized as follows:
Table 1.2: Mineral Resources (Exclusive of Mineral Reserves) | ||||||||||||
|---|---|---|---|---|---|---|---|---|---|---|---|---|
|
Million Tonnes (MT) |
Average Grade |
Contained Metal |
||||||||||
|
CuT % |
CuSol % |
Au (g/t) |
Ag (g/t) |
Cu (Blbs) |
Au (Moz) |
Ag (Moz) |
||||||
Measured |
Supergene Leach |
3.6 |
0.244 |
0.113 |
0.0 |
|||||||
Supergene Mill or Nuton Leach* |
8.2 |
0.075 |
0.033 |
0.06 |
1.83 |
0.0 |
0.0 |
0.5 |
||||
Primary Mill or Nuton Leach* |
2.1 |
0.359 |
0.066 |
0.06 |
1.77 |
0.0 |
0.0 |
0.1 |
||||
Total Measured |
Supergene Leach & Mill or Nuton Leach* |
13.8 |
0.161 |
0.059 |
0.0 |
0.0 |
0.6 |
|||||
Indicated |
Supergene Leach |
248.4 |
0.303 |
0.167 |
1.7 |
|||||||
Supergene Mill or Nuton Leach* |
69.4 |
0.112 |
0.043 |
0.04 |
1.03 |
0.2 |
0.1 |
2.3 |
||||
Primary Mill or Nuton Leach* |
633.9 |
0.254 |
0.046 |
0.05 |
1.16 |
3.6 |
0.9 |
23.7 |
||||
Table 1.2: Mineral Resources (Exclusive of Mineral Reserves) | ||||||||||||
|---|---|---|---|---|---|---|---|---|---|---|---|---|
|
Million Tonnes (MT) |
Average Grade |
Contained Metal |
||||||||||
|
CuT % |
CuSol % |
Au (g/t) |
Ag (g/t) |
Cu (Blbs) |
Au (Moz) |
Ag (Moz) |
||||||
Total Indicated |
Supergene Leach & Mill or Nuton Leach* |
951.7 |
0.257 |
0.078 |
5.4 |
1.0 |
26.0 |
|||||
|
Total Measured & Indicated |
Supergene Leach |
251.9 |
0.303 |
0.167 |
1.7 |
|||||||
Supergene Mill or Nuton Leach* |
77.6 |
0.108 |
0.042 |
0.04 |
1.11 |
0.2 |
0.1 |
2.8 |
||||
Primary Mill or Nuton Leach* |
635.9 |
0.255 |
0.046 |
0.05 |
1.17 |
3.6 |
0.9 |
23.8 |
||||
Total M&I |
Supergene Leach & Mill or Nuton Leach* |
965.5 |
0.255 |
0.077 |
5.4 |
1.0 |
26.6 |
|||||
Inferred |
Supergene Mill or Nuton Leach* |
601.1 |
0.292 |
0.131 |
0.04 |
1.32 |
3.9 |
0.9 |
25.5 |
|||
Primary Mill or Nuton Leach* |
3,638.2 |
0.201 |
0.027 |
0.04 |
1.06 |
16.1 |
4.9 |
124.5 |
||||
Total Inferred |
Leach & Mill or Nuton Leach* |
4,239.3 |
0.214 |
0.042 |
20.0 |
5.7 |
149.9 |
|||||
*Note: For the purposes of Mineral Resource estimation, a proven commercial process with a convention mill and concentrator has been assumed as the basis for RPEEE. Precious metals recovery is appropriate in this application and gold and silver grades are shown. Alternately, if Nuton® Technology can be applied in future, the precious metals values will not apply.
Additional Notes to Table 1.2:
The Qualified Person for the Mineral Resource estimate is Jeff Sullivan – CRM-SA, LLC. Mineral Resources have an effective date of September 3, 2025. Mineral Resources are reported on a 100% basis.
Mineral Resources, which are not Mineral Reserves, do not have demonstrated economic viability. The estimate of mineral resources may be materially affected by environmental, permitting, legal, title, socio-political, marketing, or other relevant factors.
The quantity and grade of reported inferred mineral resources in this estimation are uncertain in nature and there is insufficient exploration to define these inferred mineral resources as an indicated or measured mineral resource; it is expected that further infill drilling will result in upgrading the majority of this material to an indicated or measured classification.
Reasonable prospects of eventual economic extraction are demonstrated by using a calculated NSR value in each block to evaluate an open pit shell using Measured, Indicated and Inferred blocks in Geovia Whittle™ pit optimization software.
NSR was calculated using the following: metal prices of $4.80/lb for copper, $2,500/oz for gold and $32/oz for silver, processing costs of $4.91/t for supergene and $4.88/t for primary ores, total freight costs of $150/t for concentrate, selling costs of $0.02/lb for copper.
A marginal cut-off was used that was variable ranging from $4.79/t NSR to $7.23/t NSR based on extraction of the resource from the enriched zone using sulfuric acid bioleaching and SX/EW copper recovery; the recovery was calculated using the extractions shown in Table 15.2 and applying a 95% operational efficiency.
Supergene and primary material can potentially be treated in a mill/concentrator with NSR cut-offs of $5.13/t for supergene and $5.11/t for primary respectively. The mill has the added benefit of also recovering the gold and silver present in the resource. Additional parameters are used for the NSR calculation for this scenario.
Depending on the potential depth of the pit, total pit slope angles ranged from 32° to 37° depending on the sector. Overburden slopes were set at 32°.
Composites of 2 m length were capped where needed; the capping strategy is based on the distribution of grade which varies by location (i.e. domain or proximity to controlling structures) and the associated potential metal removal. The resource estimate is based on uncapped copper grades; local capped grades are used for gold and silver.
Block grades were estimated using a combination of ordinary Kriging and inverse distance squared weighting depending on domain size.
Model blocks are 20 m x 20 m x 15 m in size.
Mineral Resources under the Cryogenic geoforms are classified as inferred
mining
The project considers a large open pit mine for ore production. Pit design parameters were defined for the pit geometry by design sector for each Geotechnical Unit and reference overall slope angles established, which could vary depending on the depth of the pit design. The adopted configuration, based on single benches of 15 meters and ramp widths of 40 meters, along with the established berms and angles, ensures a geometry compatible with technical, operational, and economic criteria.
The equipment fleet will be capable of mining up to approximately 175 Mt/a. The haul truck fleet will increase over time as haulage distances grow due to increasing depth of the pit and length of the waste storage facility. The mine production fleet currently assumes the use of electric shovels and drills, and diesel-powered autonomous haul trucks. Support equipment requirements will remain relatively constant over the proposed mine life.
The mine schedule targets the crushing of a maximum 50 Mt/a of leach material with an initial 3-year ramp-up period to allow the leach pad development and process plant to come fully online. Oxide and enriched material are sent to the crusher or to a stockpile to be processed later in the mine schedule. The material is crushed and then conveyed and stacked on the Heap Leach Facility.
The mine plan assumes conventional truck-and-shovel operations. Waste and ore will be drilled and blasted, loaded by hydraulic shovels and loaders, and transported by haul trucks to external mine rock storage facilities (MRRFs), a long-term stockpile, low grade ore stockpile or a run-of-mine (ROM) pad from where it will be fed to a primary crusher for processing or dumped directly into the crusher from the production haul trucks.
Total LOM heap leach production will be 1.023 billion tonnes grading 0.453% copper over a 21 year mine life plus 2 years of preproduction. The overall mine waste will be 1.684 billion tonnes, resulting in an overall mine strip ratio of 1.65:1 (waste: ore). Mine waste will be stored in two waste rock storage facilities with the main one to the northeast of the Los Azules pit.
Primary copper sulfide material mined in the plan is stored in a separate stockpile to the north of the Los Azules pit and not processed as part of the Feasibility plan, nor considered as Mineral Reserves.
A numerical groundwater flow model was developed using FEFLOW v8.0 to simulate the evolution of the pit dewatering system at Los Azules and assess its implications for water management and mine planning over the 2027–2054 period.
Metallurgical Testwork and Recovery Methods
The metallurgical development for the Los Azules feasibility was completed in three phases:
Phase 1: baseline testing from the test work program outlined in the 2023 IA.
Phase 2: testing using samples from the 2021–2022 drilling campaigns, to expand the variability database from Phase 1 and to extend the geometallurgical data set to include lithologic domains.
Phase 3: scale-up validation using samples from the 2022-2023 exploration campaigns, to validate scale-up from the baseline 3-meter columns to the planned 9-meter bench height of the heap leach pad and to confirm extraction within the test programs. The Phase 3 master composites were built by lithologic domain and were pulled from within the pit shell for the initial five years of operation. Additional samples were collected from the 2023-2024 exploration campaign from holes drilled through the initial mining target (north-central zone) of the deposit.
The metallurgical work completed to date provides comprehensive understanding of the expected performance characteristics of the Los Azules deposit. Recoverable copper estimates were developed for each host rock type in the deposit (IMP = Inter-mineral Porphyry, IMP BX = IMP Breccia, DIO = Diorite, EMP = Early Mineral Porphyry, and EMP BX = EMP Breccia). Recoverable copper is calculated by mining block and varies with host rock type, copper mineralogy present and grade.
Copper recovered to cathodes will consider a heap efficiency and inventory factor of 95% of the extractable copper, based on general experience and industry practice. The expected overall total copper recovery to cathodes is approximately 70.8% and is distributed over a three-year timeframe from placement on the leach pad to account for timing of active leaching cycles as the pad is constructed. The copper extraction estimation methodology best reflects the potential variability related to host rock materials and the expected variability related to copper grades, mineralogy and recovery that can be practically applied in the mining modeling.
The 2025 FS for Los Azules envisions an average annual copper cathode production of 452 million lbs per year (204,800 tonnes) during the first five years of operation, representing an increase of 50 million lbs per year compared to the initial five years of the 2023 IA production schedule. Over the 22-year life of the mine operation and stockpile reclaim, the average annual copper cathode production is projected at 327 million lbs per year (148,200 tonnes). The figure below shows copper cathode production for the life of the Los Azules project defined in this report.

Figure 1.1: Life of Mine Copper Production (SE 2025)
Future processing of the primary copper material can be achieved by using the Nuton® Technology bioleaching process, alternative leaching processes such as chloride leaching, or by using a conventional milling operation to produce concentrates. The advantage of conventional milling is the additional revenue from the recovered gold and silver in the deposit. The next stage of metallurgical test work will include sufficient work to evaluate the processing method to be used for the primary ores conducted during the detailed engineering and initial operations phase.
project economics
All currency shown in the 2025 FS is expressed in constant Q3 2025 USD unless otherwise noted.
The Business Case for the leach project uses a copper price assumption of $4.35/lb. Summary results are provided below in Table 1.3.
Table 1.3: Project Metrics – Business Case | ||
|---|---|---|
Project Metric |
Unit |
Number |
Mine Life |
Years |
21 |
Tonnes Processed |
Billion tonnes |
1.023 |
Tonnes Waste Mined |
Billion tonnes |
1.684 |
Strip Ratio |
|
1.65 |
Total Copper Grade (CuT) |
% CuT |
0.453% |
Soluble Copper Grade (CuSOL) |
% CuSOL |
0.312% |
Total Copper Recovery |
% |
70.8% |
Copper Production (LOM avg.) |
tonnes/yr |
148,200 |
Copper Production (Yrs 1-5) |
tonnes/yr |
204,800 |
Copper Production – cathode Cu |
ktonnes |
3,279 |
Initial Capital Cost |
USD Millions |
$3,168 |
Sustaining Capital Cost |
USD Millions |
$2,131 |
Closure Costs |
USD Millions |
$386 |
C1 Cost (Life of Mine) |
USD/lb Cu |
$1.71 |
All-in Sustaining Costs (AISC) |
USD/lb Cu |
$2.11 |
Before Taxes |
|
|
Net Cumulative Cashflow |
USD Millions |
$12,284 |
Internal Rate of Return (IRR) |
% |
24.3% |
Net Present Value (NPV) @ 8% |
USD Millions |
$4,280 |
After Taxes |
|
|
Net Cumulative Cashflow |
USD Millions |
$9,208 |
Table 1.3: Project Metrics – Business Case | ||
|---|---|---|
Project Metric |
Unit |
Number |
Internal Rate of Return (IRR) |
% |
19.8% |
Net Present Value (NPV) @ 8% |
USD Millions |
$2,940 |
Pay Back Period |
Years |
3.9 |
The project NPV at 8% breaks even at a copper price of $3.10 per pound. Project IRR sensitivity to copper price, capital and operating costs are shown in the figure below.

Figure 1.2: Project IRR Sensitivity Analysis (SE 2025)
key project risks & opportunities
The work completed for the Los Azules Feasibility Study reported here is believed to meet all reasonable requirements for information and analysis that would be expected at the direction of the respective QPs. As a feasibility study level of investigation, the information presented still includes the risks and opportunities for the technical and economic outcomes that should be expected for similar types of studies and projects.
The project costs are expressed in constant Q3 2025 United States Dollars and foreign currency conversion without escalation or inflation. The inflation risk in Argentina is unique and has the potential to fluctuate differently than typical global macroeconomic factors would warrant. This volatility may positively or negatively impact on the expected economics shown.
Social license and political risks are acknowledged for the project. A social engagement strategy and actions are developed and being implemented. Regular interactions with local, Provincial and National government entities are an ongoing focus area. The project is believed to have local and regional support based on measured outcomes. National elections held in October 2025 showed no change for potential impacts to the current political climate in Argentina.
The Environmental Impact Assessment (EIA) for Los Azules was granted on December 3, 2024. This approval resulted in the issuance of the Environmental Impact Statement (Declaración de Impacto Ambiental, DIA), confirming that the project meets applicable environmental standards. The DIA represents a key permitting milestone and provides the regulatory foundation for advancing the project towards execution and future operations.
Los Azules was accepted into Argentina’s Large Investment Incentive Regime (RIGI) on September 26, 2025. The regime provides tax, foreign exchange, and customs stability for 30 years. In addition, legal certainty has been provided along with foreign exchange regulations that allow leaving export proceeds abroad (that will reach 100% by the time the project is expected to start exports), and access to international arbitration in case of disputes.
The copper price used for Mineral Reserves estimation ($4.30/lb) and economic evaluation ($4.35/lb) are approximately 15% below the current LME market price at the report date and offer some upside of potential revenues. At the McEwen Press Release date of October 7, 2025, LME 3-month closing price of $4.78/lb Cu, project metrics would improve to:
Financial Highlights @ $4.78/lb* | ||
Pre-Tax | ||
LOM Cashflow |
$ Millions |
$15,737 |
LOM Net Present Value |
$ Millions |
$5,626 |
LOM IRR |
% |
28.4% |
Project Payback Period |
Years |
2.8 |
Post-Tax | ||
LOM Cashflow |
$ Millions |
$11,909 |
LOM Net Present Value |
$ Millions |
$3,945 |
LOM IRR |
% |
23.1% |
Project Payback Period |
Years |
3.4 |
*Note: LME Website 3-month closing price data for October 7, 2025.
The YPF power infrastructure repayment adds $1,039 million ($1.03/tonne processed or $0.14/lb Cu) to the direct operating costs over the initial 15-year operating timeframe. The Los Azules project also bears all the costs for sub-station upgrades that would be useful for other mining projects in the area as part of this cost. An alternative means of financing this infrastructure and potential sharing of costs with other mining project interests in the region present a significant opportunity to reduce capital and operating costs as presented in this study.
Geotechnical risk in the open pit mine design and potential for pit slope failure has been studied and represents the most significant technical risk on the project. The suggested slopes for the pit are based on limited geotechnical information. The slope angles presented assume a low consequence of failure, with an associated target factor of safety of 1.2. Additional work and analyses are recommended to continue to refine the understanding of impacts and potential mitigation strategies as the mine develops over its life.
Geohazards (seismic, avalanche, rockfall) have been assessed at the project site and access route. Significant risks exist and design changes have been made to minimize personnel and facilities risks where severe or extreme risks were identified.
Seismic, climate and geotechnical risks in the heap leach pad area have been assessed, and significant risks are present at Los Azules. Design mitigations have been included to minimize impacts and potential environmental damage.
Water management and conservation mitigations and strategies have been developed for the project to minimize the potential for ground water impact and contamination. Contact water potential has been minimized, and contact water and wastewater are reintroduced and used in the process to avoid discharges and minimize freshwater use. Non-contact water conservation and redirection into the existing aquifers have been a priority in site design development.
Glacier and geoforms studies have been conducted annually to assess potential ice or water containing structures. Site layouts and access routes have been developed to avoid contact or impact to these potential regional water sources.
Copper recovery is directly related to the amount of copper and copper mineralogy distribution in each tonne of material mined. Actual recovery will vary as these parameters vary over time. Copper production predicted in the financial analysis (70.8% life-of-mine) relies on the block sequential copper grades mined. The recovery predicted benchmarks well to similar copper bio-leach commercial operations that have publicly reported their copper recovery performance information.
The most significant risk in the processing area is the performance of the bio-heap leaching system as considered. Based on the estimation methodology employed, the recovery estimate represents a reasonable and practical expectation for copper production. There are opportunities for improvement in both timing and actual recovery estimated as well as downside risks, the range of outcomes over time is expected to fall within +/-5%. The following mitigation strategies have been considered:
Variability has been sampled and tested for all significant geologic and mineralogic domains and has included parallel testing to validate the response. Adjustments to the expected crushing circuit product size distributions have also been considered.
A heap leach performance factor of 95% from the testing column results has been applied to account for inefficiencies in the heap solution flows and other factors.
A three-year recovery period, extended from one year testing results, provides practical consideration of leaching cycles and timing of material placement and solution flows in a commercial operation.
Operating flexibility has been included in the agglomeration system, aeration system, and leach flow controls to allow for changing conditions.
Sulfur supply and cost for acid production are areas for potential fluctuations in the economics of the project. A confirmed supply source or sources will be required once a project development decision has been made to advance project implementation and production.
Exploration has shown that there are multiple porphyry targets near to the Los Azules deposit that could provide further extension to mine life. Exploration of the newly identified targets will start in Q4 2025. High priority targets near to Los Azules include Tango, Porfido Norte, Franca, and Mercedes.
qualified persons recommendations and conclusions
In the opinion of the QPs responsible for each area of work and collectively, the information and analyses support the standards and guidelines of 17 CFR Part §229.1300 (S-K 1300) for a feasibility level of study and reporting.
Based on the outcomes of the Los Azules feasibility study work completed, the demonstrated economic potential for the project and work plans proposed for the Los Azules Copper Project, it is recommended to continue to proceed to development and operation when the necessary permitting, project approvals, and financing requirements are obtained.
Depending on funding and permitting being available to support an early project develop path “Early Works” for initial infrastructure and engineering development, the potential annual project expenditure requirements for the project development to operations is shown in the Table below. These values do not include other potential expenditures related to regional exploration activity unrelated to the immediate project development activities.
Table 1.4: Annual Project Expenditure Plan (USD 000's) | ||||
Early Works |
Year -3 |
Year -2 |
Year -1 |
Total |
$ 172,283 |
$ 360,943 |
$ 1,343,323 |
$ 1,291,401 |
$ 3,167,950 |
Introduction
Feasibility Study Overview
This Technical Report Summary (TRS) has been prepared for McEwen Inc. (“McEwen” or the “Company”) to disclose the results of the completed Feasibility Study (FS) for the Los Azules Copper Project, located in San Juan, Argentina. McEwen holds a 46.40% ownership interest in the project through its subsidiary, McEwen Copper Inc. The information presented herein is based on the McEwen Copper’s 100% interest in the Los Azules Project through its Argentine subsidiary, Andes Corporación Minera S.A. (ACM).
This TRS has been prepared in accordance with 17 CFR Part §229.1300 (S-K 1300) Standard Instructions for Regulation S-K subpart 1300 SEC S-K §229. 1304 and §229.601(b)(96). and to comply with the disclosure requirements of Subpart 1300 of Regulation S-K, adopted by the U.S. Securities and Exchange Commission (SEC) for mining property disclosure.
The Los Azules Feasibility Study demonstrates the technical and economic viability of the project, supporting the declaration of mineral reserves and providing a basis for future permitting, financing, and development decisions. This study incorporates:
Updated mineral resource and reserve estimates
Detailed engineering and cost estimation
Refinements in mine planning and process design
Assessment of infrastructure, logistics, and execution planning
Previous studies, including an Initial Assessment TRS for the project prepared in 2023 and Preliminary Economic Assessments (PEAs) prepared in accordance with Canadian NI 43-101 standards between 2009 and 2023, provided early-stage technical and economic assessments of the Los Azules Project. This Feasibility Study, supersedes those earlier reports and incorporates significant advancements in geology, metallurgy, engineering, and environmental planning. Key updates from previous technical studies include:
Expanded site geological, hydrological, geotechnical, hydrogeological, and geochemical characterization,
Updated capital and operating cost estimates,
Updated Mineral Resource estimation,
Mineral Reserve declaration,
Updated mine design and production schedule,
Updated Heap Leach Pad design,
Refinements to process flowsheet,
Design of enabling infrastructure (roads, camp, admin buildings.), Project execution and operations readiness planning,
Plans for site electrification.
This FS confirms the Los Azules Project's technical and financial viability, supporting the transition to the next stages of permitting, financing, and project development.
Sustainability Strategy and Responsible Development
Copper holds promise to be a key ingredient of technological solutions to give the world a chance to increase electrification and reduce GHG emissions. A responsible, carbon positive mine at Los Azules could become a beacon of hope for a new form of industry that does more good than harm. Imagine the world’s first Regenerative Copper Mine, providing valuable materials for a renewably powered world.
Copper is essential for global decarbonization, enabling electrification, renewable energy, and battery-powered transportation. However, conventional mining methods pose significant environmental and social challenges. Los Azules aims to redefine copper production by developing the world’s first Regenerative Copper Mine, prioritizing sustainability, low-carbon footprint operations, and minimizing environmental impact.
This study advances those concepts along the pathway established in the project’s regenerative philosophy and principles included in the Los Azules Guiding Principles Regeneration Vision document (May 3, 2022 – McLennan Design). This document is intended to be a foundational manifesto for the development of the Los Azules Mine – with the express goal of developing the World’s Greenest Mine, that not only delivers exceptional value, but sets new standards for the entire industry – ultimately leaving the world a better place because of, rather than despite, its existence.
The decision to move from conventional milling to a hydrometallurgical approach for the initial project development is a key step taken in the prior 2023 IA study.
Project Achievement Highlights:
Process water use: 158 L/s LOM average, 73% lower than a conventional mill and concentrator producing copper concentrate with approx. 600 L/s.
Peak Site water use: 244.2 L/s, with 227 L/s allocated for mining activities and 17.2 L/s for human use.
Electricity demand: 119 MW (48% lower than mill/concentrators)
Multifaceted Design: on-site acid production from elemental sulfur reduces transport costs by 66% and allows for cogeneration of power without CO2 emissions for 20% of the site requirements. Waste heat recovered from cooling systems are used for process heating, eliminating the need for additional fossil or electric heat requirements. Wastewater can be consumed in the process, eliminating treatment requirements and supplemental make-up.
Reducing Our Carbon Footprint as Technology Advances The project continues to develop GHG reduction strategies for the mine and overall project including application of electrification using trolley assist for mine haulage, in-pit crushing and conveying, and waste conveyance.
The timing for these applications and others is under final analysis. Los Azules is also well positioned to take advantage of emerging opportunities (e.g. battery electric mine and services vehicles) and longer-term developing technologies. The capstone project goal is to achieve carbon neutrality by 2038.
For the current project basis, the estimated annual average Green House Gas (GHG) emissions for the Los Azules project are 1,082 kg CO2-e/t Cu from Scope 1&2 sources. The primary sources for GHG emissions for Scope 1 are shown in Figure 2.1 below. Scope 2 (Electricity) contributions are negligible due to the inclusion of 100% renewable power as the source from the provider.

Figure 2.1: Scope 1 GHG Emission Sources for Current Project Basis (SE 2025)
This places the project on the lowest 6th centile of the copper industry carbon curve, well below the estimated industry average of 4,026 kg CO2-e/t Cu using Skarn Associates mine-to-metal “E1” metric (Skarn Associates, 2025). At the start of operations, Los Azules will already be one of the lowest carbon copper cathode producers in the world.
Key sustainability initiatives at Los Azules include:
Hydrometallurgical Processing: opportunity to apply Nuton® Technology to reduce water and energy consumption compared to conventional milling as the deposit changes in the future.
100% Renewable Energy: MOU signed to provide Power sourced from YPF Luz, eliminating fossil fuel reliance for electrical energy.
Electrified Mining Fleet: transitioning to fully electric haulage or waste conveying to reduce diesel emissions is being applied where practical initially, and the project is positioned to adopt additional opportunities and new power technology developments.
Minimal Water Footprint: innovative water management strategies, including an underdrainage system for non-contact water, multiple use and re-usage to support process requirements, and passive treatment methods when necessary.
Carbon Neutrality by 2038: strategic electrification, renewable energy adoption, and low-impact processing to achieve net-zero Scope 1 & 2 emissions well ahead of industry standards.
Responsible Land Use: avoiding impacts on cryogenic geoforms, minimizing project footprint, implementing ecological restoration, and maintaining biodiversity.
1 Skarn Associates Copper Mine GHG & Energy Curve, June 2025 dataset for the year 2030. E1 metric includes all GHG emissions from mine to refined metal. Skarn recommends E1 intensity as the most suitable metric for comparing operations, allowing SX/EW and concentrate producers to be evaluated on the same curve, at the same product boundary - refined copper cathode. Permission has been granted for this citation through Rio Tinto. McEwen’s estimates have not been verified by Skarn.
Sustainable Worker Accommodations: the Los Azules mine camp will feature a net-positive energy microgrid, designed to promote worker well-being, high energy efficiency, water reuse, and a minimal environmental footprint.
Worker Training: from education and internships to vocational training with the help of our partners, Los Azules has reached over 400 students and trained over 1,600 useful people in useful trades.
By leveraging cutting-edge technologies and sustainable practices, Los Azules is positioned to be a model for responsible copper production and an important contributor to the global clean energy transition.
Terms of Reference
The Qualified Persons (QPs) have prepared this Technical Report Summary under the assumption that all technical data provided by McEwen and its consultants were accurate and complete as of the effective date. No significant limitations were imposed on the scope of work, and the QPs exercised professional judgment in all interpretations and conclusions presented herein.
Qualified Persons and Sources of Information
This Technical Report Summary was prepared by Samuel Engineering Inc. and other consultants in collaboration with McEwen between 2024 and 2025 to declare Mineral Reserves for the Los Azules Project. The FS results and the Los Azules property are material to McEwen.
The conclusions, interpretations, and estimates contained herein are based on:
Information available at the time of preparation,
Data supplied by outside sources, and
Assumptions, conditions, and qualifications outlined in this report.
This report is intended to be read as a whole, as individual sections may not fully represent the context of the study. Each QP assumes responsibility only for the specific sections assigned to them, as detailed in Table 2.1 and does not assume liability for sections authored by other QPs.
The QPs believe the report complies with 17 CFR Part §229.1300 (S-K 1300) Standard Instructions for Regulation S-K subpart 1300 SEC S-K §229. 1304 and §229.601(b)(96) and meets the requirements of S-K 1300 as considered for a Feasibility Study (FS) level of study and reporting disclosure as defined in the regulations and supporting reference documents.
A summary of the Qualified Persons (QPs), as defined in NI 43-101, and their respective areas of responsibility is provided below.
Table 2.1: Summary of Qualified Persons | |||
|---|---|---|---|
Areas of Responsibility |
Qualified Person (QP) |
Company |
S-K 1300 Item No. |
Property, Ownership, Surface Rights, Pricing and Contracts, Adjacent Properties |
W. David Tyler, SME-RM |
McEwen Copper Inc. |
3 (except 3.10), 5 (except 5.6 and 5.7), 19.3.3, 19.3.4, 20. |
Process, Metallurgy and Testing, Project Infrastructure, Project & Study Execution Market Studies, Capital and Operating Costs |
James L. Sorensen, FAusIMM |
Samuel Engineering |
2, 4, 10, 14, 15 (except 15.4, 18.9, 15.10), 16.1, 16.2, 16.4, 16.7, 16.8, 18 (except 18.1.2 and 18.3.1), 21 |
Geology, Mineralization, Deposit Types, Exploration, Drilling |
Luke Willis, P.Geo |
McEwen Inc. |
6, 7. |
Resource Estimation, Sample Preparation, Analyses and Data Verification |
Jeff Sullivan, PhD, FAusIMM |
Consultores Recursos Minerales S.A. (CRM) |
11, 12. |
Mineral Reserve Estimate and Mining Methods |
Gordon Zurowski, PE, MBA |
AGP Mining Consultants |
12, 13 (except 13.2.4 and 13.8), 18.1.3 & 18.3.1 |
Heap Leaching Design, Mine Rock Storage Facilities, Environmental Studies & Permitting |
Bruno Borntraeger, P.Eng. |
Knight Piésold Ltd. |
3.10, 15.4, 15.10, 17 (except 17.2), 22.6 |
Pit Geotech |
Nolberto Contador Villegas, RPE Chile |
E-Mining Technology SA |
13.2.4. |
Hydrogeology, Pit Dewatering, Water Supply |
Marcela Casini |
B&W |
16.8, 18.9 |
Geochemistry |
Scott Effner, PG, SME-RM |
Knight Piésold and Co. |
17.2 |
Geohazards |
Diego Marrero, MAusIMM (CP) |
SRK |
4.4.1 |
Economic Analysis |
Steven Alan Pozder, PE, MBA |
Samuel Engineering |
19 |
Information relating to areas of responsibility for Sections |
All |
All |
1, 2, 22, 23, 24, 25 |
Personal Inspections
In compliance with SEC SK-1300 disclosure requirements, multiple Qualified Persons have conducted site visits to Los Azules for technical verification.
Key site inspections include:
David Tyler (McEwen Copper) – Multiple visits (2022-2025) for project oversight.
James Sorensen (Samuel Engineering) – January 2024, focused on process design and infrastructure.
Luke Willis (McEwen Inc.) – Multiple visits (2022-2024) for project oversight.
Jeff Sullivan (CRM S.A.) – March 2024, reviewed drilling practices and sampling protocols.
Gordon Zurowski (AGP Mining) – Dec 2025, assessed mine design and geotechnical stability
Kirk Hanson (AGP Mining) – January 2024, assessed mine design and geotechnical stability.
Daniel Yang (Knight Piésold) – January 2025, evaluated open-pit geotechnical conditions.
Marcela Casini (B&W) – February 2025, conducted hydrogeological assessments.
Bruno Borntraeger (Knight Piésold Ltd. (KP)) – January 2023, evaluating leach pad site locations and assessing field-testing requirements for the geotechnical design of the leach pad and review of environmental conditions.
Scott Effner (Knight Piésold Ltd. (KP)) – January 2025, reviewed planned site facilities and drill core, and evaluated the geochemical characterization and geochemical modeling.
These inspections validate the technical basis of the Feasibility Study, ensuring compliance with industry best practices.
Property Description
Project Location
The Los Azules Project is a porphyry copper development project located in the Frontal Andes Cordilleran region of San Juan Province, Argentina, near the Chilean border, at approximately South 31° 05’25” latitude and West 70° 13’30” longitude. It lies approximately 80 km west-northwest of the town of Calingasta, situated approximately 294 km by road west of the provincial capital of San Juan (Figure 3.1).
The terrain elevation at the project site ranges between 3,200 mASL at the proposed camp location and up to 4,500 mASL on the highest peaks, with an average height of 3,600 mASL. The area is remote, lacking nearby towns, indigenous communities, or settlements, and existing public infrastructure requires improvements.
Access to the project is currently provided via 120 km of improved road, measured from the town of Villa Calingasta, suitable for pickup trucks, chassis trucks, and semi-trailers. The route includes two high-altitude mountain passes, Cabeza de León and La Totora, both located above 4,100 mASL. In the winter season, this route requires special maintenance to ensure the road remains clear, safe, and passable. Along the private mining road segment, which begins at kilometer 0 (Alumbrera), there are 14 river crossings. Planned improvements include road upgrades and the construction of a new access road that will connect the existing route to the project site via an alternative alignment through the Quebrada del Río Cerrado. All required easements are duly secured and properly established through their respective administrative resolutions (administrative acts of establishment).

Figure 3.1: Project Location (Andes Corporación Minera SA 2024)
property and title in argentina
Mineral title laws in Argentina differ from those in the United States and Canada. Mineral rights are owned and regulated by provincial governments, separate from surface ownership. The Argentine Mining Code and supplemental provincial laws govern these rights, which are considered real property and may be sold, leased, or assigned to third parties commercially. Exploration permits (“Cateos”), and mining concessions (“Minas”) are key forms of mineral rights. These can be forfeited if minimum work requirements or annual payments are not met, though notice and an opportunity to remedy are typically provided.
Surface rights differ from mineral rights, and mining is deemed to be a priority public interest activity. Surface owners cannot prevent mining rights and properties from being granted or mining activities on their property blocked. Still, they are entitled to compensation for their land use and any damages. Mining concessions may impose easements, such as rights of way and land occupation, subject to the owner's compensation.
The provinces under the Mining Code regulate environmental and safety provisions. Before starting operations, applicants must submit an Environmental Impact Report (“Informe de Impacto Ambiental”, IIA) to the provincial mining authority. The IIA details the proposed activities, identifies potential environmental impacts, and outlines measures to mitigate those impacts. Approval of the IIA results in an Environmental Impact Statement (“Declaración de Impacto Ambiental,” (DIA)). If measures are inadequate, additional requirements may be imposed, and non-compliance may lead to suspending operations without prejudice to the mining title.
The Environmental Impact Statement (DIA) represents the formal approval of the IIA, issued as a ministerial resolution. The DIA confirms that the project has undergone rigorous review and complies with environmental standards, supporting its viability and sustainability. The DIA is a critical permitting milestone that provides the foundation for advancing feasibility, construction, and eventual operation.
On December 3, 2024, Resolution N° 805-MM-2024 approved the IIA for the exploitation stage of the Los Azules project. This resolution, processed under file number 1100-265-2023, affirms the project’s commitment to sustainable development and marks significant progress towards its subsequent phases.
Cateo
A cateo is an exploration permit that grants the holder a preferential right to obtain a mining concession for the same area but does not allow commercial mining. Cateos are measured in units of 500 ha, with a maximum size of 20 units (10,000 ha) per cateo and a limit of 400 units (200,000 ha) per person in a province.
The duration of a cateo depends on its area: 150 days for the first unit (500 ha) plus 50 days for each subsequent unit. After 300 days, holders must relinquish 50% of the area exceeding four units (2,000 ha). At 700 days, another 50% of the remaining area must be relinquished. At each stage, the land can be converted to one or more “Manifestaciones de Descubrimiento” (MD). Extensions may be granted for adverse weather or seasonal access restrictions.
Cateos are identified by a file number and awarded through provincial administrative processes, which can take up to two years. While pending approval, applicants may explore the area with the surface owner’s consent, and the relinquishment period begins 30 days after formal approval. If multiple parties apply for the same land, priority is given to the first applicant, except for areas released by prior owners, which are awarded by a blind drawing. The application must be submitted along with proof of provisional payment for the exploration fee, based on the number of measurement units requested. As per the 2025 San Juan Province Tax Law, the exploration fee is set at AR $68,826.67 per unit of measurement. Since each unit corresponds to 500 hectares, the total cost is calculated by multiplying this rate by the number of hectares requested.
Mina
To convert an exploration permit (cateo) into a mining concession (mina), part or all the cateo must first be declared as a Manifestación de Descubrimiento (MD) and then converted into a mina. Minas are mining concessions that allow for commercial mining. The area of a mina is measured in pertenencias, which represent individual ownership units. Conventional pertenencias are 6 ha each, while pertenencias for disseminated deposits cover 100 ha. Once granted, minas have an indefinite term, provided exploration, development, or mining activities continue and investment conditions set by the Mining Code are met. An annual canon fee of AR 135,111.20 (2025 rates) per pertenencia is required.
OWNERSHIP
McEwen Inc, incorporated in Colorado on July 24, 1979, is listed on the New York Stock Exchange (NYSE) and the Toronto Stock Exchange (TSX) under the symbol MUX. Its head office is in Toronto, Canada. The company owns 46.4% of McEwen Copper, which holds a 100% interest in the Los Azules copper project in San Juan, Argentina, operated by Andes Corporación Minera SA (ACM), and the Elder Creek exploration project in Nevada, USA (Figure 3.2).
ACM, registered with Mendoza’s Dirección de Personas Jurídicas under Resolution #2025 (November 2, 2005), has maintained good legal and financial standing. In December 2024, ACM raised its capital from AR$15.95 billion to AR$66.56 billion, reflecting market growth and stability.
As of December 2024, ACM is wholly owned by Los Azules Mining Inc., a Cayman Islands company registered under Resolution #2281 (November 27, 2006), and holding 95,749,638 shares at AR$100 each. San Juan Copper Inc., another Cayman Islands entity (Resolution #2372, December 7, 2006), holds 592,919 shares, and McEwen Copper Inc., a Canadian corporation, owns 569,301,107 million shares, all valued AR$100 each. The Cayman Islands subsidiaries are in the process of being removed from the ownership structure, and in the future, ACM will be solely owned by McEwen Copper.
McEwen Copper Inc. is finalizing its registration in Argentina, as Article 123 of Law #19,550 requires.
McEwen cash advances totaling USD 5.1M to cover McEwen Copper’s operating expenses are now being incorporated into a secured loan. Evanachan LTD provided a USD 25M term loan to McEwen Copper as interim financing ahead of the next funding round.
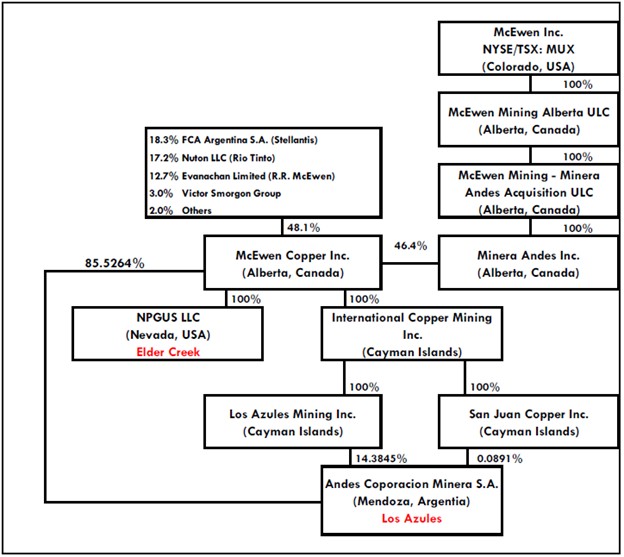
Figure 3.2: Los Azules Ownership Structure as of Sep 24, 2025 (McEwen, 2025)
Mineral Rights
The Los Azules project comprises 22 registered and surveyed mines with up-to-date mining fees. These mines are shown in Figure 3.3.

Figure 3.3: Los Azules Project Mines (see Table 4.1 for legend) (Andes Corporación Minera SA 2025
Table 3.1 shows the main mining rights data and annual fees:
|
Table 3.1: Main Mining Rights Data and Annual Fee Andes Corporación Minera S.A. Mineral Claims Descriptions (values expressed in AR$) | |||||||
|---|---|---|---|---|---|---|---|
|
Mining Claim |
File Number |
Surface (ha) |
Annual Mining Fee |
Legal Status |
Ad. Resolution |
Registration Date |
1 |
Agostina |
1124.108-A-10 |
1.184,00 |
AR$ 1.621.334,40 |
Registered |
55-DM-10 |
12/08/2010 |
2 |
Azul 1 |
520.0279-M-98 |
2.098,20 |
AR$2.837.335,20 |
Registered |
75-DM-99 |
18/06/1999 |
3 |
Azul 2 |
520.0280-M-98 |
1320.00 |
AR$1.756.445,60 |
Registered |
76-DM-99 |
18/06/1999 |
4 |
Azul 3 |
1124.121-A-06 |
166,76 |
AR$270.222,40 |
Registered |
21-DRMyC-12 |
24/06/2012 |
5 |
Azul 4 |
1124.473-M-08 |
903,06 |
AR$1.351.112,00 |
Registered |
60-DRMyC-13 |
16/10/2013 |
6 |
Azul 5 |
1124.119-A-09 |
3000 |
AR$4.188.447,20 |
Registered |
56-DRMyC-10 |
12/08/2010 |
|
Table 3.1: Main Mining Rights Data and Annual Fee Andes Corporación Minera S.A. Mineral Claims Descriptions (values expressed in AR$) | |||||||
|---|---|---|---|---|---|---|---|
|
Mining Claim |
File Number |
Surface (ha) |
Annual Mining Fee |
Legal Status |
Ad. Resolution |
Registration Date |
7 |
Azul Este |
1124.186-A-07 |
2.372,48 |
AR$3.242.668,80 |
Registered |
27DRMyC-13 |
24/04/2008 |
8 |
Azul Norte |
1124.668-M-07 |
131,94 |
AR$270.222,40 |
Registered |
57-DM-10 |
12/11/2010 |
9 |
Cecilia |
1124.035-A-12 |
1.702,26 |
AR$2.432.001,60 |
Registered |
27DRMyC-13 |
31/07/2013 |
10 |
Escorpio I |
0153-C-96 |
168,81 |
AR$270.222,40 |
Registered |
63-DRMyC-08 |
05/03/2008 |
11 |
Escorpio II |
0154-C-96 |
1.991,00 |
AR$2.702.224,00 |
Registered |
39-DM-07 |
24/09/2007 |
12 |
Escorpio III |
0155-C-96 |
199,45 |
AR$270.222,40 |
Registered |
15DRMyC-12 |
19/06/2012 |
13 |
Escorpio IV |
425.213-C-03 |
3.500,00 |
AR$4.728.892,00 |
Registered |
32-DM-05 |
29/07/2005 |
14 |
Gina |
1124.168-A-10 |
1.762,99 |
AR$2.432.001,60 |
Registered |
54-DM-10 |
12/08/2010 |
15 |
Marcela |
1124.495-A-09 |
2.952,77 |
AR$4.053.336,00 |
Registered |
61-DM-10 |
13/08/2010 |
16 |
Mercedes |
0644-M-96 |
836,06 |
AR$1.216.000,80 |
Registered |
66-DM-97 |
14/08/1997 |
17 |
Mirta |
1124.0141-M-09 |
354,4 |
AR$540.444,80 |
Registered |
42-DM-10 |
16/07/2010 |
18 |
Rosario |
1124.169-A-10 |
1.768,44 |
AR$2.432.001,60 |
Registered |
53-DM-10 |
12/08/2010 |
19 |
Sofia |
1124.167-A-10 |
3.324,97 |
AR$4.593.780,80 |
Registered |
70-DM-10 |
23/11/2010 |
20 |
Totora |
414.1324-C-05 |
504,86 |
AR$810.667,2 |
Registered |
51-DM-10 |
26/07/2010 |
21 |
Totora II |
520.496-C-99 |
1.561,12 |
AR$2.161.779,20 |
Registered |
55-DM-00 |
17/05/2000 |
22 |
Soberanía |
259-299-6-84 |
179,66 |
AR$270.222,4 |
Registered |
239-DM-86 |
14/07/2023 |
Under Argentina’s Mining Code, the Los Azules project includes the mining easements listed in Table 3.2 and Figure 3.4.
Table 3.2: Los Azules Project Easements | |||||
|
Claim |
File |
Legal Status |
Ad. |
Registration |
|
|
|
|
Resolution |
Date |
1 |
Exploration Access Road |
519 0439-M-97 |
Granted |
507-HCM-1999 |
28/6/1999 |
2 |
Southern access road |
0680-M-96 |
Granted |
332-CM-2017 |
7/11/2017 |
3 |
Northern Access Road |
1124.218-A-2018 |
Granted |
394-CM.2018 |
3/12/2018 |
4 |
Power Line |
1124-.354-A-2018 |
In process |
- |
- |
5 |
Candadito Camp |
1124.660-M-12 |
Granted |
334-CM-2022 |
19/10/2022 |
6 |
Surface occupation Illanes Mery property |
1124.544-A-22 |
Granted |
246-CM-2024 |
8/8/2024 |
7 |
Surface occupation Estomonte property |
1124. 231-A-11 |
Granted |
244-CM-2024 |
8/8/2024 |
8 |
Surface occupation Cortez Ángel Custodio property |
1124. 673-A-23 |
In process |
N/A |
N/A |
9 |
Surface occupation Landing strip |
0680-M-96 |
In process |
N/A |
N/A |

Figure 3.4: Mining Easements (McEwen 2025)
Probable Power Line and Principal Access Road The Los Azules Project is assessing potential routes for new access roads and the electrical power line needed to supply the project.
Multiple alternatives are under evaluation to optimize infrastructure and associated. The most robust to date is shown in Figure 3.5.
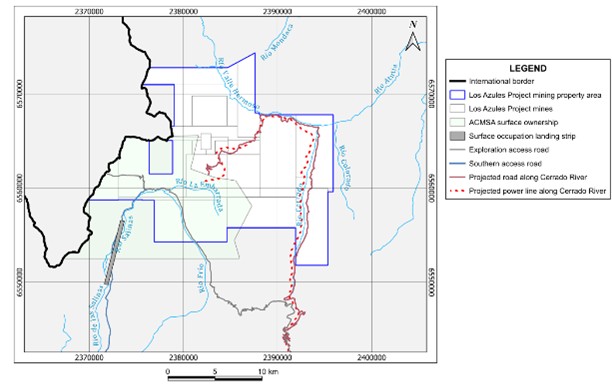
Figure 3.5: Projected Route of the Power Line and Access Road (McEwen 2025)
Legal Review and Opinion Report
This section is based on a legal review and opinion titled: “Incorporation and good standing status of Andes Corporación Minera S.A. (ACM) and its mining rights,” by attorney José Vargas Gei of Vargas & Galindez (V&G), dated July 21, 2025. The following conclusions were drawn from the V&G memorandum:
Mining Rights and Title Status
The Los Azules Project comprises 22 mining rights, duly granted and registered, covering a total surface area of 31,983.23 hectares. All rights have been officially surveyed, and the corresponding survey closure certificate has been issued without observations. Of these, seventeen concessions have already received final survey approval resolutions, while the remaining five, all of which have approved technical reports and favorable survey opinions, have been submitted to the Joint Boundary Commission between Argentina and Chile for validation of the international boundary.
In 2018, Andes Corporación Minera S.A. (ACM) filed an application (File No. 1124.553-A-2018) to consolidate the 22 Mining Rights into a single unified mining property. The purpose of this application is to recognize the mineralized zone as one geological, economic, and environmental unit, once all individual surveys have received final approval.
Ownership and Legal Compliance
Andes Corporación Minera S.A. (ACM) is the sole and exclusive owner of all Mining Rights comprising the Los Azules Project, holding full ownership, title, and interest in each concession. These rights have undergone legal review and are in good standing, free of liens, encumbrance, or claims. All properties have been properly surveyed in accordance with applicable mining regulations.
ACM’s Mining Rights are subject to the obligations established by the Argentine Mining Code, including payment of the annual canon. As of the date of this report, all corresponding payments have been duly made throughout the second half of 2025.
Status of Activation and Reactivation Plans:
In accordance with Article 225 of the Argentine Mining Code, the mining authority requested the submission and implementation of an activation and reactivation plan for the following mining permits: “Azul 1,” “Escorpio II,” “Escorpio IV,” and “Mirta.” ACM has duly submitted the required plans, which are currently being executed. As of the date of this report, the mining authority has not issued formal approval, nor has it provided any comments or requested modifications. ACM continues to submit updated progress reports every six months. The status of these four mining permits does not impact or alter ACM’s plans for the Los Azules Project. The plan commits ACM to begin the mine development by January 2028.
Investments:
ACM has invested over 300 times the annual canon requirement for the Los Azules project as a unit, meeting the minimum threshold under Article 217 of the Mining Code. A presentation of this investment was submitted to the mining authority in August 2023, with no objections or approvals issued to date, considering the Los Azules Project as a whole unit. In August 2023, ACM informed the mining authority of the total investment in the Los Azules Project, considering it a geological, economic, financial, and environmental unit. As of the date of this opinion, the mining authority has neither made observations on ACM’s presentation nor approved the fulfillment of the investment plan.
Environmental Compliance:
The seventh Environmental Impact Report for exploration, filed on March 17th, 2025, was approved by Resolution #410-MM-2025, of the Ministry of Mining of the province of San Juan.
In April 2023 the Environmental Impact Report for exploitation was filed, and approved by Resolution #805-MM-2024, of the Ministry of Mining of the province of San Juan.
Glacial and peri-glacial studies have been carried out by the consulting firm Mountain Pass Consulting and have been included in the Environmental Impact Report referred to above and in the Environmental Impact Report for exploitation stage. These studies have determined that the construction and production of Los Azules Project is not affected by the existence of glaciers, rock glaciers and permafrost. In addition, these studies have also been filed with the Provincial Council for Glacier Protection.
Legal Agreements and Royalties:
Pursuant to the agreement executed on June 20, 2003 between Ms. Dina Myriam Elizondo de Bosque and Mr. Hugo Arturo Bosque and MIM Argentina Exploraciones S.A. (assigned to ACM as per an agreement dated November 2, 2007), ACM shall have to pay USD 500,000 to Ms. Dina Myriam Elizondo de Bosque and Mr. Hugo Arturo Bosque 30 days after completion of the feasibility study of the Mining Rights 16 (Mercedes) and 17 (Mirta), as listed on Exhibit A; road easement (file #0680-M- 96); and road easement (file #520-0439-M-97).
Pursuant to a Transfer Agreement, dated October 16, 2014, entered between TNR Gold Corp., Compañía Minera Solitario Argentina S.A., Los Azules Mining Inc., ACM and McEwen Mining Inc.; ACM agreed to pay Compañía Minera Solitario Argentina S.A. a 0.4% net smelter return royalty in respect of Los Azules Project.
Exploration Rights
Andes Corporación Minera S.A. (ACM) is the operator of the mining right known as “Marisa I”, which grants the authority to conduct exploration and, in the future, exploitation over an area of 6,770 hectares. This right is independent from the Los Azules Project, although it borders its southern sector and includes within its boundaries the area designated for the planned airstrip of Los Azules. The location of Marisa 1 is shown in Figure 3.6.
ACM has made an agreement with the corresponding surface rights holder, thereby ensuring full availability of the area for the execution of the required activities. This circumstance consolidates a strategic block of surface and mining rights that strengthens the overall development of the Los Azules Project.
The origin of ACM’s right over Marisa I derives from a public and competitive bidding process carried out by the Provincial Institute of Mineral Exploration and Exploitation (IPEEM), an entity under the Government of San Juan, in which ACM was awarded the concession.

Figure 3.6: Location of Marisa I Relative to the Los Azules Project (Andes Corporación Minera SA, 2025)
Surface Rights and Access Agreements
Under Argentine law, mining rights, granted by provincial authorities, take precedence over surface rights, provided proper compensation or surety is offered. ACM may access and operate on mining properties regardless of surface ownership and may request easements when agreements are not reached.
On March 3, 2010, ACM acquired 18,000 hectares of surface rights from CCM S.A. with border zone approval granted by Resolution 907/2010. These rights are perpetual and allow infrastructure development, subject to environmental and construction permits.
In areas outside ACM’s direct ownership, ACM holds surface occupation easements with similar rights. Additionally, in August 2022, ACM secured a permanent agreement over 59.36 hectares with the owners of the La Totora property, covering 49.47 km of the exploration road and granting access, land use, and water rights essential to project operations.

Figure 3.7: Map of Mineral Claims (Minas), Easements (Servidumbres) and Surface (Superficie) Ownership (Andes Corporación Minera SA - 2025)
Approved Measurements:
Seventeen rights: Azul 1, Azul 2, Azul 3, Azul 5, Azul Este, Escorpio I, Escorpio II, Escorpio III, Agostina, Sofia, Marcela, Gina, Mirta, Cecilia, Soberania, Totora and Totora II have received final resolutions approving their measurements.
Pending Approvals:
The measurements of the remaining 5 rights (Mercedes, Escorpio IV, Azul 4, Azul Norte y Rosario) have been sent to be revised and approved by the national boundary commission (CONALI) because they are adjacent to the international border with Chile.
Mining Group Registration:
Once all measurements are approved, a resolution will formalize the Los Azules mining group (file No. 1124.553-A-2018), a process that the provincial authority has already initiated. Under Argentine law, the approval of these measurements is a prerequisite for constituting a mining group. Once approved, the state cannot deny the grouping option. Approved measurements are required under Argentine law to constitute a mining group. The formation of a mining group is an administrative tool to optimize management. Its absence does not impact on project execution but simplifies compliance with Article 217 of the Mining Code.
In summary, we can conclude that:
ACM is the sole owner and has good and valid legal title over 18,000 hectares of surface rights purchased from CCM S.A. on March 3rd, 2010 (see Exhibit C), free from any liens and encumbrances.
ACM has good and valid legal and beneficial title to the following easements (see Exhibit D), free from any liens and encumbrances:
File #520.0439-M-97: “Camino de Exploración” road easement
File #0680-M-96: “Camino Sur” road easement.
File #1124.218-A-18: “Camino Norte” road easement.
File #1124.660-M-12: “Candadito” camp easement.
File #1124.544-A-2022: Illanes Mery land occupation easement.
File #1124.231-A-2010: Estomonte A.G. land occupation easement.
ACM has requested the following easements, not yet granted:
File #1124.354-A-2018: power line.
File #0680-M-96: airstrip land occupation easement.
File #1124-673-23: Cortez, Angel Custodio land occupation easement.
File #1124.762-2024: “Río Cerrado” road easement.
ACM has all the necessary surface rights, easements, access rights and other necessary rights and interests over the land overlapping with the Mining Permits listed on Exhibit A, including leases, easements or rights of way, permits, real estate or licenses from landowners or government authorities required to conduct Los Azules Project as currently conducted.
Land Use Notes
No infrastructure is planned in the future released area of Escorpio IV, although ACM retains surface rights over that zone.
The north mine rock storage facility partially extends into the future Escorpio IV released area, which remains under surface rights held by ACMSA. This is permitted under Argentine law.
Small portions of the east and west diversion channels from the leach pad are similarly situated on ACM surface property outside the mining concession.
Los Azules Surface Rights
Under Argentine law, mining rights, granted by provincial authorities, prevail over surface rights, provided that the corresponding compensation or guarantee is granted.
ACM may access and operate on its mining concessions by virtue of existing mining easement rights, ownership of its own surface lands, and agreements entered with surface rights holders.
On March 3, 2010, ACM acquired 18,000 hectares of surface rights, duly recorded and registered in its name in the official records of the Province of San Juan. These rights are perpetual and enable the development of infrastructure, subject to the sectoral permits applicable to mining activities.
The main infrastructure of the Los Azules Project is entirely located on ACM’s own mining and surface rights. A large portion of its mining concessions are situated within ACM’s surface landholding. Those concessions located outside this area are secured by guaranteed mining easements encumbering the surface property of third parties, in accordance with the Argentine Mining Code and concessions granted by the provincial government of San Juan.
In August 2022, ACM entered into an agreement with the owners of La Totora surface rights (Campo La Totora), which includes the use of aggregates and grants rights of use and occupancy over 49.47 km of the exploration or access road, as well as 4.56 hectares corresponding to the area occupied by the service camp for the road known as “Candadito.”
In August 2025, ACM entered into an agreement with the holder of Cortez Monroy surface rights (Campo Cortez Monroy) (CCM S.A.) that includes the use of aggregates and grants rights of use and occupancy over:
The future airstrip proposed, now located wholly within the Cortez Monroy land and ACM land.
30 km of the alternative access road or southern road, whose alignment across third-party lands covers 59.69 km. The entire alignment is secured by a guaranteed and valid mining easement.
11.87 km of the exploration or access road, which, together with the agreement with the owners of La Totora land (Campo La Totora), complete 51.34 km of the total 78.97 km across third-party lands. The entire alignment is also secured by a guaranteed and valid mining easement.
An area located south of the project was also included in the agreement, adding a total surface of 12,823.33 hectares, thereby enhancing security and control over the surface rights adjacent to the Los Azules Project’s mining rights.
An illustration summarizing the above is presented below.

Figure 3.8: Easements (Andes Corporación Minera SA - 2025)
ROYALTIES AND RETENTIONS
The property is free of outstanding royalties, payments, or encumbrances, except for:
A one-time payment of USD 500,000 to D Elizondo and H Bosque upon delivery of a feasibility study.
A 3% royalty charged by San Juan Province, based on the “mine head value” (sale price minus select costs such as transportation, processing, administration, smelting, and refining). However, since July 2011, this calculation has shifted to a taxable base on gross sales without deductions, applied through direct agreements with mining companies rather than legislation. Up to 70% of this provincial mining royalty revenue can be offset to repay the investment in “public utilities” as declared by the provincial legislature. The investment in the electrical interconnection to the national grid and the mining access road are expected to meet the requirements as they will improve regional connectivity and strengthen energy reliability, and the road will improve border control.
Additionally, TNR Gold Corp holds a 0.4% net smelter return (NSR) royalty on the project, and McEwen holds a 1.25%.
BACK-IN RIGHTS
There are no back-in rights.
ENVIRONMENTAL LIABILITIES
Wetland Disturbance:
Seasonal livestock grazing ("veranadas") originating from Chile, primarily involving large herds of goats, has led to reduced vegetation cover, caused erosion along streambanks, and alterations to surface drainage caused by soil compaction. This situation was disclosed in the approved Environmental Impact Report for the project and is classified as a pre-existing activity, unrelated to mine operations. Accordingly, it is reported as such in the biodiversity environmental monitoring reports.
Infrastructure works are expected to affect approximately 201 hectares of wetlands, representing a significant environmental impact. This impact was disclosed in the project's Environmental Impact Report and has been approved by the provincial mining authority.
To mitigate the identified impacts, the company submitted an environmental compensation plan, which is currently under implementation. At the time of this report, and with the collaboration of the National University of San Juan, scientific research is underway in wetland areas to collect the relevant data and biologic material required for the execution of the compensation plan.
PERMITTING REQUIREMENTS
Argentine laws differentiate prospecting, exploration, and exploitation activities. Exploration includes mapping, sampling (including bulk samples), geophysics, trenching, and drilling, whereas mining involves all socio-economic activities to extract resources.
Mining activities require a range of permits, the most critical of which are environmental permits. Environmental protection regulations are established in Law No. 24,585 (Mining Environmental Protection Law, 1995) and in Title Thirteen of the Mining Code, while in the Province of San Juan these provisions are further regulated by Provincial Decree No. 007/2024. The federal government sets forth Minimum Environmental Protection Standard Laws (MEPSLs), which apply nationwide, while provinces are entitled to enact stricter local regulations.
Permits Requirements by Project Phase
The primary permit for the exploration and exploitation at Los Azules is the Environmental Impact Statement (Declaración de Impacto Ambiental or DIA), which must be updated biannually with the provincial mining authority. An Environmental Impact Report (Informe de Impacto Ambiental or IIA) must be submitted for each project phase: prospecting, exploration, and exploitation (including mineral processing, transportation, and marketing).
Exploration Stage Permits:
McEwen currently continues exploration activities on their property. Exploration permits have appropriately been issued.
Initial approval: Resolution No. No. 294-SEM-2010
Updates: Resolution Nos. 250-MM-2012, 276-MM-2014, 305-MM-2016, 1269-MM-2018, 317-MM-2021 (amended by 352-MM-2021) and 408-MM-2024.
Exploitation Stage Permits:
The exploitation stage's Environmental Impact Statement (DIA) has been granted under Resolution No. 805-MM-2024. This permit enables the project execution stage.
The company is in compliance with the requirements set forth in the Environmental Impact Statement (DIA) for the exploitation phase of the Los Azules Project (Resolution No. 805-MM-2024). However, it has submitted technical and legal observations regarding four specific matters: the management of water with potential acid drainage, the application of extreme seismic standards to the leach pads, the requirement for protective structures and seismic criteria for waste dumps, and the inclusion of a financial contribution associated with a social trust.
In this context, ACM has initiated a dialogue with the provincial authorities with the aim of reaching a mutually agreed resolution, in line with its commitments to sustainability and corporate social responsibility.
Several key operational permits are required in addition to the DIA. McEwen has a clear roadmap for securing these approvals, with no identified fatal flaws or significant risks.
Water Concession
The process for obtaining water use rights both for human consumption and mining purposes is structured in two stages:
Aquifer Assessment: Initiated on September 20, 2024, and already completed through drilling activities, pumping tests, and the submission of technical reports to the competent authority.
Concession Application: Initiated on July 15, 2025, this stage includes a technical evaluation and studies on the hydrological suitability of the source aquifer, as well as a comprehensive water balance analysis.
Although the applicable legislation does not establish a statutory timeframe for this process, based on comparable cases, the concession is expected to be granted during the third quarter of 2026.
The administrative files related to the Los Azules water concession are as follows:
Mining use: File No. 506-2719-2024-DH – requested flow: 227 L/s
Population use: File No. 506-2720-2024-DH – requested flow: 17.2 L/s
The average projected consumption of water: 159 L/s.
Power Line
The permitting process for the power line involves both national and provincial authorities and is expected to take a minimum of one year. The Los Azules Project has completed the basic engineering design and technical studies for the proposed works and technical specifications for bidding process, along with the environmental documentation required for submission to the relevant provincial authorities.
Definitive Access Road
The existing access road is suitable for initiating early work. The company has completed basic engineering for proposed upgrades which are currently under evaluation by the provincial technical authorities. The technical specifications for the bidding process have also been completed.
Other Sectoral Permits
Environmental authorizations (archaeological surveys, flora/fauna studies)
Infrastructure and safety approvals (camp facilities, fire protection, healthcare, catering)
Hazardous materials management (fuel storage, waste disposal, effluent discharge)
Construction permits for civil works.
McEwen actively manages these processes, ensuring all permitting milestones align with the project timelines.
PERMITTING REGULATIONS
The Los Azules project is subject to five key regulatory frameworks: environmental, mining, hazardous waste, health and safety, and the Mining Investment Law.
Environmental Regulations
Environmental regulations stem from four sources:
Mining-specific environmental provisions in the Mining Code.
Federal laws, including Minimum Environmental Protection Standard Laws (MEPSLs).
Provincial regulations supplementing MEPSLs.
Additional local laws that align with or exceed MEPSL standards.
Failure to comply may result in fines, work suspensions, or mine closure, but does not impact concession ownership.
Mining Regulation
The Mining Code (National Law No. 1919) and Provincial Law No. 688-M govern mineral acquisition, exploitation, and use. San Juan also applies National Law No. 24585 for environmental protection in mining.
Hazardous Waste Regulation
National Law No. 24.051, adopted by San Juan province, regulates hazardous waste management, including generation, handling, transportation, treatment, and disposal.
Health and Safety Regulation
Two national laws govern workplace health and safety:
Law No. 19.587 (1972) and regulated by National Decree N° 351/1979: focuses on technical standards and preventive measures, requiring employers to establish Occupational Health, Safety, and Medicine services. Mining-specific regulations were added in 2007.
Law No. 24.557 (1995): requires companies to contract a Work Accident Insurance Company (ART) to manage risk prevention, report accidents, and repair damages from workplace incidents.
Mining Investment Law
Law No. 24196 allows companies to establish special accounting provisions for environmental preservation. Up to 5% of material extraction costs can be deducted annually for income tax purposes.
Archaeological Sites
Archeological sites are managed by the San Juan Ministry of Culture. Permits for site removal require a detailed work plan prepared by qualified professionals and submitted one year in advance. Permits typically take two months for approval and must include a site map.
GLACIER ENVIRONMENTAL PROTECTION
In 2010, Argentina enacted National Law No. 26,639, a Minimum Environmental Protection Standard Law (MEPSL) aimed at safeguarding water resources stored in glaciers, explicitly prohibiting activities that may affect them. In compliance with this legal mandate, glaciers across Argentina, and specifically in the Province of San Juan, were inventoried by the Argentine Institute for Snow Research, Glaciology and Environmental Sciences (IANIGLA). These glaciers have been fully considered in the project’s infrastructure planning and will not be impacted.
The Province of San Juan enacted its own Glacier Protection Law (Law No. 1076_L), which partially diverges from the national regulation in its technical definitions and carried out a provincial glacier inventory. The cryoforms inventoried by the province do not differ from those in the national registry and, therefore, have likewise been accounted for in the project’s infrastructure planning. As such, they will not be affected.
Project Key Findings and Compliance:
No uncovered or “white glaciers” (ice glaciers) exist on the Los Azules property, but several small cryogenic geoforms identified as “rock glaciers” have been mapped.
The company fully complies with national and provincial glacier protection laws.
A provincial inventory confirmed that exploration activities at Los Azules have not impacted the rock glaciers.
Future exploration and mine development will avoid affecting mapped rock glaciers.
The water contribution and storage capacity of rock glaciers are currently being evaluated and will continue to be assessed.
Audits and Monitoring:
In March 2013, a multi-agency environmental audit led by the Provincial Government found no adverse impacts, confirming McEwen Copper’s compliance with provincial glacier protection laws.
In 2016, the Provincial Government initiated an inventory of glaciers in San Juan to assess potential impacts or constraints on mining development, though the report remains unpublished.
ACMSA conducts annual monitoring in compliance with environmental regulations and the commitments in the Exploration EIA.
ENVIRONMENTAL BASELINE STUDIES
Between 2007 and 2012, Ausenco Vector conducted environmental baseline monitoring and data collection on:
Surface and groundwater flow and quality Since 2011, Dr. Andres Meglioli, of Mountain Pass LLC, has been monitoring cryogenic geoforms in the project area (Meglioli, 2025).
Soils
Flora and fauna
Archeology
Weather conditions
Cryogenic geoforms
Beginning in 2013, under the National University of San Juan through the Institute of Hydraulic Research and senior biologists Juan C. Acosta and Hector J. Villavicencio, the institute has collected baseline data on surface and groundwater conditions, flora and fauna, as well as additional studies on the vegas, including a compensation proposal. These studies remain under contract with McEwen.
Additionally, the company studied the wetlands in the project area, locally known as “vegas.” As part of the Environmental Impact Report (IIA) for the exploitation phase of the Los Azules project, approved in 2024, a technical report on environmental compensation related to wetland impacts was submitted. The National University of San Juan is currently conducting scientific studies on the vegas to obtain technical data relevant to the environmental compensation plan.
In late 2017 and throughout 2018, McEwen, consultants, and specialists conducted full-year baseline studies for fauna, flora, and hydrology.
In 2022, additional environmental baseline studies were undertaken to support the completion of the Environmental Impact Report (IIA) for mine exploitation. This report was submitted in 2023 and approved in December 2024.
Since 2022, the project’s physical and biological environment has been continuously monitored and maintained. Currently, the results of these monitoring activities (2023-2025) are being integrated into the environmental baseline for the development of the first biennial update of the Environmental Impact Report (IIA).
Accessibility, Climate, Local Resources, Infrastructure and Physiography
Accessibility
Access to Los Azules is via provincial routes and mining easements granted under Argentine law. The primary access to the project from Villa Calingasta is via Provincial Route No. RP 437, which connects to RP 406 at La Alumbrera, covering approximately 25 km. From La Alumbrera, the Exploration Road begins, extending 87 km to the project site. This route crosses the Calingasta River and follows the Arroyo de la Totora, passing through Cuesta del Gringo, La Totora, Concontita, and Cabeza de León before reaching the Embarrada camp at the project site. The Los Azules camp is located approximately 5 km east of Embarrada.
The Exploration Road provides access to the site, typically snow-free from October until May. The Exploration Road was successfully kept open during the 2023 winter season using conventional earthmoving equipment. The Exploration Road is covered by a mining road easement (file No. 520-0439-M-97) and is maintained by ACMSA, who is responsible for its upkeep and signage. The road was upgraded in 2022-2023 to accommodate larger vehicles and improve safety. It will continue to serve as the primary access route and support infrastructure, such as the incoming high-voltage powerline, once the project moves to the execution phase.
Improvements planned for the Exploration Road are described in Section 15.2. The road design complies with Argentine and international road safety standards and is currently under the permitting process.
An alternative Southern access route begins at Barreal in Calingasta and follows Provincial Route No. 400 to La Junta before continuing west and then northwest along a third-party easement issued to Glencore for the El Pachón project (file No. 156.424-C-72). The road follows the La Pantanosa River, Colorado River, Los Piuquenes River, Arroyo Verde, and Las Salinas River before reaching Los Azules. The total distance from Barreal to Los Azules is approximately 240 km. This route is traversable as an emergency route to site for smaller vehicles, however improvements are not included in the Feasibility Study.
Climate and Seasonal Constraints
The Los Azules project area experiences a high-altitude climate strongly influenced by the South Pacific Subtropical High-Pressure System, which results in clear skies, low humidity, and prevailing winds from the west and southwest. The region exhibits a strong climatic gradient due to its Andean location, with precipitation decreasing from west to east as elevation declines.
A detailed climatic assessment was conducted as part of the Knight Piésold (KP) study for the Environmental Impact Report (IIA) (KP, 2023). This study incorporates long-term meteorological data from on-site weather stations and regional climate datasets to support hydrological modeling, mine infrastructure design, and operational planning.
Since the Knight Piésold climate report in 2023, McEwen has continued refining the climatic characterization of the project area through the installation of additional meteorological stations (Antena and Norte) in 2023 and ongoing data collection. In 2024, BW Hidrogeología y Medioambiente SRL (BW)
released the report "Estudio de evaluación del recurso hídrico subterráneo – Etapa de Factibilidad" (BW, 2024a), which provided updated meteorological information with a specific focus on characterizing the water resource and supporting the hydrogeological model. The climatic dataset is continuously updated, improving the overall understanding of site conditions over time.
Meteorological Stations
Climate data for the Los Azules project is derived from three meteorological stations installed within the project area, supplemented by regional data from government and private monitoring networks. These stations continuously record temperature, wind speed and direction, precipitation, relative humidity, solar radiation, and barometric pressure. The strategic positioning of these stations enables accurate analysis of climatic trends and water balance modeling.
The key meteorological stations include:
El Calderón Station (near the project site, strategic for hydrological studies).
Los Azules Station (on-site, providing direct operational climate data).
Vega Station (located in lower areas, contributing to regional climate assessment).
Data from these stations, as analyzed in the KP study, provide insights into the climatic conditions that affect mining operations, infrastructure, and water management strategies.
Temperature
The project site at Los Azules has a cold climate, with an annual average temperature of 2.75°C. Summer temperatures can reach a maximum of 23.3°C (January), while winter temperatures can drop to -24.3°C (July). The mean summer temperature is approximately 9.2°C, whereas winter averages around -3.6°C.
Precipitation
Annual precipitation at Los Azules averages 220 mm, primarily occurring as snowfall due to the site's high elevation. Winter precipitation is associated with frontal systems moving in from the Pacific, with the heaviest snowfall occurring between May and August. Summer precipitation is rare and typically occurs as isolated convective storms, with occasional snow or sleet.
Atmospheric Pressure & Humidity
The mean atmospheric pressure at the site is 681.83 hPa, consistent with high-altitude conditions. The relative humidity averages 32.28%, with the highest values occurring in winter when snowfall increases moisture levels. The summer months experience lower humidity due to limited precipitation and intense solar radiation.
Wind Patterns
Winds at Los Azules predominantly originate from the north and southwest, with an average annual wind speed of 10.54 km/h. Wind speeds peak at 52.2 km/h, with occasional gusts reaching 102.96 km/h, particularly during frontal weather events.
Solar Radiation & Evapotranspiration
Due to its high elevation, the site receives strong solar radiation, with annual average values of 256 W/m². The highest solar radiation occurs in summer, reaching a peak of 1423 W/m² in January. Evapotranspiration follows seasonal trends, peaking in December and January, and decreasing significantly in winter. Solar power opportunities are being considered in building designs but have not yet been finalized for inclusion in the current work.
Operating Season
Due to limited winter access and appropriate all-season accommodations, the current exploration field season at Los Azules typically runs from October to May. However, once in operation, the project will run year-round, supported by enhanced infrastructure, winter road maintenance, and logistical planning to ensure continuous access and supply reliability.
Local Resources and Infrastructure
The Los Azules Project area is remote, with no pre-existing regional infrastructure within the immediate project footprint. There are no nearby towns or settlements. Exploration infrastructure currently supports project activities, including temporary two-person camps located within the development area. Development of permanent site infrastructure, such as access roads, power supply, and water management, is planned and detailed in Section 15.
Available Personnel
The nearest population center is Villa Calingasta, a historic mining town formerly supported by alum extraction and gold mining at the Casposo mine. While mining is no longer a dominant economic activity, remediation programs led by the United Nations Development Program (UNDP) and other national and international entities have addressed environmental liabilities from past mining operations.
As of the 2022 national census (INDEC), the Calingasta Department had a population of 11,034, of which 4,462 are economically active. The local economy is now centered on agriculture (primarily apple and walnut orchards), public services, and small-scale industries. Other economic activities include:
Timber and vegetable production
Wood manufacturing
Cider production
Tourism (hotels, restaurants)
Commercial services and retail
Public sector employment (border police, health, safety, education)
The availability of skilled mining labor in the local area is limited. A portion of the operational workforce, particularly in specialized technical and supervisory roles, is expected to need to be sourced from other regions in San Juan Province or nationally. Local community members may be eligible for employment in support services such as maintenance, security, and camp operations. Many of the community members are supportive of employment that will keep their family members living in the province.
Through a cooperative program with the contractors executing the exploration programs at Los Azules, the Project has executed eight programs and trained 440 residents of the Calingasta Department in exploration drilling, hospitality, surveying, long-distance driving, heavy equipment operation, solar panel installation, construction quality control, project document control, electrical system maintenance, and best practices in agricultural irrigation.
In addition, the McEwen Copper has delivered a course on mining to local teachers taught by professionals from the Los Azules team. The course was approved by the Ministry of Education and provided attendees with an official certification of completion. McEwen Copper also supports the General Savio mining school in Calingasta through internships for professional practice and educational trips to conferences.
Future plans include using simulators to train mining equipment and plant operations staff from the local workforce on-site and in San Juan.
Power
There is currently no grid-connected power at the Los Azules site.
In May 2025, McEwen Copper and YPF Luz signed a Memorandum of Understanding (MOU) outlining the framework for long-term power supply to the Project. The agreement includes the construction of a new substation at Calingasta and the development of a transmission line from the substation to the project site. Power will be supplied at a negotiated rate of $0.064/kWh under a minimum 15-year term, with an investment recovery mechanism established between the two parties.
The power infrastructure will be designed and constructed by YPF Luz, with operations and maintenance responsibilities defined in a forthcoming Power Purchase Agreement (PPA). Construction is expected to begin in Q1 2027, with commissioning planned for Q4 2028, prior to the start of operations.
Permitting for the transmission corridor is currently in progress, and environmental assessments have been approved. For additional information on power infrastructure, refer to Section 15.3 – Power Supply to Los Azules.
Water
Surface water within the property is currently sufficient to support McEwen’s exploration activities. FS-level Hydrological studies by B-W have evaluated both short and long-term water needs for the Project.
During the early years of operation, pit dewatering will provide sufficient water to meet site demand. Water requirements are projected to increase to 108 L/s by year 5 of operations. Dewatering flows are expected to meet this demand initially, supplying up to 116 L/s. From year 5 onward, dewatering output is projected to decline gradually, from approximately 100 L/s to 64 L/s, becoming insufficient to meet full operational demand.
To supplement future supply, additional water will be sourced from identified groundwater reserves in the Rio de las Salinas and Embarrada subbasins. A water balance model supports the feasibility of these sources and the long-term sustainability of supply. The water concession application has been made to the Hydraulic Department and is expected to be obtained by Q1 2026.
For additional details, see Section 15.9 – Water Supply.
Topography, elevation and vegetation
The Los Azules Project is in a broad valley formed by faulting and glaciation, flanked by steep ridges to the east and west. The deposit is centered on the La Ballena ridge, a low NNW-SSE trending ridge. The rugged terrain ranges in elevation from 3,200 to nearly 4,500 mASL, with sparse vegetation absent at higher elevations.
Vegetated Areas and Water Features
Long, narrow vegetated areas (“vegas”) occupy valley floors on both sides of La Ballena. These vegas are sustained by spring water, snowmelt and groundwater, with standing water levels at approximately 3,600 mASL. Springs are observed at:
~ 3,790 mASL upstream of the vegas on the west side of La Ballena.
~ 3,800-3,900 mASL along the eastern flank of the Cordillera de la Totora.
The vegas feed the Rio La Embarrada, which flows west to join the Rio Frio to the west and eventually the Rio de las Salinas, a tributary of the San Juan River.
Surface Cover
The deposit area is covered by glacial debris (moraines) and scree, with deposits exceeding 80 m in thickness in some areas. The cover on La Ballena ridge is thinner, starting at 10 m.
No “white glaciers” (classic ice glaciers) are present within the project area. Nearby rock geoforms that may have some embedded ice have been identified, typically above the 3,900 mASL elevation, but will not be impacted by the Project’s exploration or development activities. The project site facilities layouts and locations for the life of mine operations were made to avoid any impacts to these features.
Geohazards
The Los Azules Project is in a high-altitude Andean setting and is exposed to significant natural geohazards. These include rockfalls, landslides, and snow avalanches, which pose considerable risks to infrastructure integrity, personnel safety, and long-term operational continuity.
In response, SRK Consulting (Argentina) S.A. conducted a comprehensive geohazard assessment between 2024 and 2025. This work supports site optimization and engineering design and is considered material to the project’s Feasibility Study due to its relevance to risk reduction and cost-efficiency.
The Los Azules Project is situated in a high-altitude sector of the Andes, within a geomorphologically complex region subject to multiple natural geohazards. Dominant hazard types include rockfalls, landslides, and snow avalanches. SRK Consulting (Argentina) S.A. undertook a comprehensive geohazard characterization campaign during 2024 and 2025. This work, integrating terrain analysis, hazard mapping, and site-specific risk modelling, is considered a material input to the feasibility study given its implications for infrastructure siting, risk-informed engineering design, and overall project risk and cost.
Risk Assessment of Project Infrastructure
The assessment covered 18 infrastructure components defined within the site layout. SRK applied an integrated methodological approach that combined satellite-based remote sensing, geospatial desktop analysis, and targeted field reconnaissance. Analytical tools included high-resolution optical imagery, digital elevation models (DEMs), and GIS-supported hazard mapping, which delineate geomorphological features, classify slope angles and orientations, and identify potential hazardous propagation corridors associated with gravitational processes. Field campaigns conducted in January 2025 validated remote interpretations, confirmed the spatial extent of active and relict hazard features, and refined the susceptibility models with field-verified observations.
Geohazard susceptibility was assessed using a structured Qualitative Risk Matrix adapted from the framework established by the Inter-American Development Bank (BID, 2019). This matrix incorporates six evaluative dimensions: occupational health and safety, environmental impact, structural damage to physical assets, financial implications, operational continuity, and reputational exposure. Each principal hazard type (rockfalls, landslides, and snow avalanches) was evaluated by integrating estimated likelihood of occurrence with the projected magnitude of consequence. The resulting risk scores were classified into discrete categories: Low (1–7), Medium (8–17), and High (18–25), supporting a risk-informed prioritization of mitigation strategies and guiding the optimization of infrastructure design.
Key Geohazard Findings
Several infrastructure components were classified within the high-risk category, most notably the Regeneration Camp, Embarrada Camp, Secondary Crusher, and the Truck Shop and Support Facilities (Table 4.1). These assets were situated within or immediately adjacent to active avalanche corridors and geomorphologically unstable slopes, resulting in consistently elevated risk scores across multiple hazard types. In contrast, other installations (such as access roads, operational pads, and ore stockpiles) exhibited a wider range of risk levels, primarily governed by local topographic variability, human occupancy patterns, and the degree of exposure to delineated hazard zones.
Table 4.1: Risk Assessment of Project Infrastructure using the Qualitative Risk Matrix | ||||
Infrastructure |
Landslides |
Rock Falls |
Avalanches |
|
Risk Assessment |
Risk Assessment |
Risk Assessment |
||
Secondary Crusher |
22 (H) |
22 (H) |
21 (H) |
|
Regeneration Camp |
19 (H) |
23 (H) |
21 (H) |
|
Truck Shop and Facilities |
19 (H) |
19 (H) |
21 (H) |
|
Embarrada Camp |
18 (H) |
18 (H) |
21 (H) |
|
Overland Conveyor |
17 (M) |
22 (H) |
17 (M) |
|
Primary Crusher |
17 (M) |
17 (M) |
21 (H) |
Diversion Channel Leach Pad |
8 (M) |
23 (H) |
8 (M) |
Main Electrical Substation |
14 (M) |
2 (L) |
21 (H) |
Final Leach Pad |
6 (L) |
13 (M) |
13 (M) |
PLS, emergency and refined Pond |
6 (L) |
9 (M) |
15 (M) |
Agglomeration Area |
10 (M) |
17 (M) |
1 (L) |
Leach Pad – Phase 1 |
6 (L) |
8 (M) |
13 (M) |
Overburden Stockpile |
4 (L) |
9 (M) |
11 (M) |
Los Azules Camp |
2 (L) |
15 (M) |
3 (L) |
Stockpile Primary |
2 (L) |
6 (L) |
11 (M) |
Mitigation measures and risk reduction
To mitigate geohazard risks, SRK recommended a combination of structural and non-structural measures. Where residual risks exceeded acceptable thresholds, particularly at Regeneration Camp and Embarrada Camp, strategic relocation was proposed, including the complete relocation of Regeneration Camp and the partial relocation of Embarrada Camp within its current footprint, a measure that has already been incorporated into the project layout. Likewise, the crushing systems were moved further from the areas of greatest impact into the Rio Embarada valley.
Structural interventions include dynamic rockfall barriers and snow control infrastructure covering approximately 280 hectares, distributed across various sectors of the project site. These systems comprise avalanche fences and diversion structures to mitigate mass movement hazards. Complementary measures included slope clearing, targeted earthworks, and drainage berms. In parallel, a monitoring system was proposed to provide early warning capabilities and support adaptive risk management. A post-mitigation reassessment confirmed that most infrastructure elements reached acceptable residual risk levels (Low to Medium), validating the proposed mitigation strategy (Table 4.2).
Table 4.2: Risk Reassessment of Project Infrastructure using the Qualitative Risk Matrix. | ||||
|---|---|---|---|---|
Infrastructure |
Landslides |
Rock Falls |
Avalanches |
|
Risk Assessment |
Risk Assessment |
Risk Assessment |
||
Regeneration Camp |
10 (M) |
18 (H) |
18 (H) |
|
Table 4.2: Risk Reassessment of Project Infrastructure using the Qualitative Risk Matrix. | ||||
|---|---|---|---|---|
Infrastructure |
Landslides |
Rock Falls |
Avalanches |
|
Risk Assessment |
Risk Assessment |
Risk Assessment |
||
Truck Shop y Facilities |
10 (M) |
10 (M) |
10 (M) |
|
Secondary Crusher |
6 (L) |
6 (L) |
10 (M) |
|
Embarrada Camp |
5 (L) |
6 (L) |
10 (M) |
|
Primary Crusher |
6 (L) |
6 (L) |
6 (L) |
|
Overland Conveyor |
6 (L) |
6 (L) |
3 (L) |
|
Leach Pad - Phase1 |
1 (L) |
1 (L) |
13 (M) |
|
Final Leach Pad |
1 (L) |
1 (L) |
13 (M) |
|
PLS, emergency and refined Pond |
1 (L) |
3 (L) |
10 (M) |
|
Ultimate Pit |
1 (L) |
1 (L) |
10 (M) |
|
Agglomeration Area |
1 (L) |
6 (L) |
1 (L) |
|
Diversion Channel Leach Pad |
1 (L) |
1 (L) |
8 (M) |
|
Stockpile Primary |
1 (L) |
1 (L) |
7 (L) |
|
Overburden Stockpile |
1 (L) |
1 (L) |
7 (L) |
|
Old Los Azules Camp |
1 (L) |
6 (L) |
1 (L) |
|
Main Electrical Substation |
1 (L) |
1 (L) |
6 (L) |
|
Low Grade Ore Stockpile |
1 (L) |
1 (L) |
2 (L) |
|
North Waste Rock Dump |
1 (L) |
1 (L) |
2 (L) |
|
Future work
Further refinement of mitigation strategies will be undertaken during the detailed engineering phase using quantitative modelling tools (such as RAMMS for dynamic snow avalanche simulation and RocFall for rockfall analysis). In parallel, SRK recommends the implementation of a dynamic geohazard risk management framework that integrates real-time monitoring data with formal hazard governance protocols.
This system will support continuous risk reassessment and contribute to the long-term safety, adaptability, and operational resilience of the Project.
Availability of Area for Mine and Processing Facilities
All facilities and permanent infrastructure considered in this Feasibility Study (FS) are located within areas where Andes Corporación Minera S.A. (ACMSA) holds both mining and surface rights or has secured the necessary easements. A mine rock storage facility is on mining rights and only partially on ACM controlled surface rights. Use of this surface for the facility is covered by a use agreement with the surface owner.
The proposed Site General Arrangement for key project facilities is presented below in Figure 4.1, and is further detailed in Sections 13 (Mining Methods), 14 (Processing & Recovery Methods), and 15 (Infrastructure).


Figure 4.1: Los Azules Project Site General Arrangement (SE, 2025)

History
Early Exploration
Prior to the 1980s, the western portion of San Juan Province, including the Cordillera Frontal, Andean Cordillera, and particularly the Los Azules region, remained largely unexplored from a geological and mineral potential perspective. The only active project at the time was El Pachón, a copper-molybdenum porphyry deposit located 100 km south of Los Azules, now owned by Glencore and in advanced exploration.
In the early 1980s, private and government initiatives, including airborne imagery surveys and mule-supported field reconnaissance, identified several color anomalies, indicative of hydrothermal metal-bearing alteration systems. Recognizing the region’s potential, the San Juan Government, through the Instituto Provincial de Exploraciones y Explotaciones Mineras (IPEEM), applied for several "Áreas de Reserva". These covered high-altitude areas of geological interest, including Rincones de Araya, Calderón, Calderoncito, El Altar-Río Cenicero, and Cerro Mercedario. These areas were later auctioned for mining exploration.
During the 1985-1986 field season, reconnaissance mapping and surface geochemical sampling by provincial authorities identified anomalous arsenic, silver, and copper values in the Rincones de Araya and La Coipa regions, west and south of Los Azules.
By 1994, following a Thematic Mapper (TM) imagery study, Battle Mountain Gold (BMG) and Minera Andes S.A. (MASA) applied for exploration concessions in the Los Azules region as part of their gold exploration programs. In March 1995, BMG initiated exploration, identifying several alteration zones associated with extrusive volcanics, lithocaps, and porphyry-type rock assemblages. Preliminary rock chip samples returned sporadic gold values of 0.3–0.5 g/t and anomalous copper values.
Between 1998 and 1999, BMG completed 24 drill holes totaling 5,681 meters, identifying widespread hydrothermal alteration. Geophysical work included magnetometry, induced polarization (IP), and resistivity surveys. No metallurgical testing was conducted during this period.
Discovery and exploration
Prior to the 1980s, the western portion of San Juan Province, including the Cordillera Frontal, Andean Cordillera, and particularly the Los Azules region, remained largely unexplored from a geological and mineral potential perspective. The only active project at the time was El Pachón, a copper-molybdenum porphyry deposit located 100 km south of Los Azules, now owned by Glencore and in advanced exploration.
In the early 1980s, private and government initiatives, including airborne imagery surveys and mule-supported field reconnaissance, identified several color anomalies, indicative of hydrothermal metal-bearing alteration systems. Recognizing the region’s potential, the San Juan Government, through the Instituto Provincial de Exploraciones y Explotaciones Mineras (IPEEM), applied for several "Áreas de Reserva". These covered high-altitude areas of geological interest, including Rincones de Araya, Calderón, Calderoncito, El Altar-Río Cenicero, and Cerro Mercedario.
These areas were later auctioned for mining exploration.
During the 1985-1986 field season, reconnaissance mapping and surface geochemical sampling by provincial authorities identified anomalous arsenic, silver, and copper values in the Rincones de Araya and La Coipa regions, west and south of Los Azules.
By 1994, following a Thematic Mapper (TM) imagery study, Battle Mountain Gold (BMG) and Minera Andes S.A. (MASA) applied for exploration concessions in the Los Azules region as part of their gold exploration programs. In March 1995, BMG initiated exploration, identifying several alteration zones associated with extrusive volcanics, lithocaps, and porphyry-type rock assemblages. Preliminary rock chip samples returned sporadic gold values of 0.3–0.5 g/t and anomalous copper values.
Between 1998 and 1999, BMG completed 24 drill holes totalling 5,681 meters, identifying widespread hydrothermal alteration. Geophysical work included magnetometry, induced polarization (IP), and resistivity surveys. No metallurgical testing was conducted during this period.
transition of Ownership and Consolidation
In 2005, MASA and Xstrata Copper (MIM’s successor) signed a Letter of Intent to consolidate their land positions. By 2007, an Option Agreement granted MASA exclusive rights to explore the Los Azules area, including Xstrata’s properties. By 2009, MASA exercised its option to acquire full ownership, with Xstrata electing not to retain a stake.
Between 2004 and 2011, MASA drilled 127 holes (34,270 m). Early metallurgical test work was conducted during this period at Plenge Laboratory (2008-2012) focused on evaluating flotation and acid leaching for copper recovery.
In 2012, Minera Andes merged with US Gold Corporation, forming McEwen Inc., which assumed all rights to Los Azules. A legal dispute with TNR Gold Corp. over northern property rights was settled in 2014, securing McEwen’s ownership in exchange for a 0.4% Net Smelter Return (NSR) royalty.
In December 2022, McEwen Copper successfully resolved legal challenges over peripheral properties and regained the rights to the Soberana property.
The company retains 100% control of Los Azules, including all associated land holdings, mineral concessions, and easements.
Between 2012 and May 2023, McEwen drilled 225 holes with a total of 70,261 m.
formation of mcewen copper and project structuring
In 2021, McEwen Copper Inc. was established as a wholly owned subsidiary of McEwen Inc., holding 100% interest in Los Azules and Elder Creek.
As part of its strategy, McEwen Copper has been working to consolidate 22 mining concessions into a single mining group, a process initiated in 2018. This structuring aligns the project’s deposits, access roads, electrical lines, geological targets, and mining infrastructure under a unified framework, optimizing economic feasibility and regulatory compliance.
The formation of a mining group offers several advantages:
Investment Optimization – investments can be strategically distributed across concessions, ensuring regulatory compliance without unnecessary costs.
Shared Infrastructure Justification – expenses for processing plants, access roads, and utilities can be allocated collectively, avoiding duplication.
Regulatory Compliance and Risk Mitigation – centralized management streamlines audits, environmental reporting, and investment commitments, reducing concession loss risks.
Importantly, the formation of a mining group is an administrative tool to optimize management. Its absence does not impact project execution but simplifies compliance with Article 217 of the Mining Code.
INVESTMENTS AND FINANCING
Since 2021, McEwen Copper raised over $453 million USD through private placements, with major investments from the following entities and their percentage of ownership:
McEwen Inc. – 46.4%
Stellantis N.V. – 18.3%
Nuton LLC (Rio Tinto Venture) – 17.2%
Evanchan (Robert R. McEwen) – 12.7%
These transactions granted investors specific product purchase rights and shareholder privileges.
RECENT DEVELOPMENTS
Completion of feasibility studies are ongoing.
Since May 2023, McEwen Copper has drilled an additional 446 holes and 81,504 meters. These holes include resource infill, geotechnical, hydrogeological, and exploration holes.
An aerial magneto-telluric survey was completed over the entire property during 2024.
McEwen announced a name change from “McEwen Mining Inc.” to “McEwen Inc.”, effective on July 7, 2025.
Historical Mineral Resource Estimates
The Los Azules Project has been subject to multiple technical studies and resource estimations since its initial discovery. Table 5.1 summarizes key historical resource estimates reported in previous Initial Assessment, Preliminary Economic Assessments (PEAs) and Technical Reports.
Table 5.1: Los Azules Historical Resource Estimates | ||||||
|---|---|---|---|---|---|---|
Year |
Resource Category |
Tonnage (Mt) |
Cu Grade (%) |
Contained Cu (Blbs) |
Cutoff Grade (%) |
Source |
2009 |
Inferred |
922 |
0.55 |
5.07 |
0.35 |
2009 PEA |
2010 |
Indicated |
137 |
0.73 |
2.20 |
0.35 |
2010 PEA |
2010 |
Inferred |
900 |
0.52 |
10.39 |
0.35 |
2010 PEA |
2013 |
Indicated |
389 |
0.63 |
5.39 |
0.35 |
2013 PEA |
2013 |
Inferred |
1,397 |
0.46 |
14.30 |
0.35 |
2013 PEA |
2017 |
Indicated |
962 |
0.48 |
10.20 |
0.20 |
2017 PEA |
2017 |
Inferred |
2,666 |
0.33 |
19.30 |
0.20 |
2017 PEA |
2023 |
Indicated |
1,235 |
0.40 |
10.94 |
NSR-based1 |
2023 IA |
2023 |
Inferred |
4,509 |
0.31 |
26.70 |
NSR-based1 |
2023 IA |
Note: For supergene and primary material going to the leach pile the cutoff was $2.74/t. For supergene material going to the mill the cutoff was $5.46/t and the cutoff for primary material going to the mill was $5.43/t. The resource was further constrained by a pit shell that demonstrates the reasonable prospects of eventual economic extraction (RPEEE) of this material.
The estimates presented in Table 5.1 are historical in nature and are not considered current mineral resources under S-K 1300 and should not be relied on by the reader. A qualified person has not done sufficient work to reclassify these historical estimates as current mineral resources or mineral reserves, except as included now in this updated Technical Report Summary. They are provided for reference purposes only. The current mineral resource estimate is presented in Section 11 of this report.
Historical Production
Los Azules has not been subject to historical production. No commercial-scale mining or processing has occurred on the property.
Geological Setting, Mineralization, and Deposit
The geological descriptions of the Los Azules deposit are based on observations from deposit logging. A detailed explanation of geological modelling techniques for mineral resource estimate is provided in Section 11.2 (after Mortimer, 2024).
Regional Geology
The Los Azules porphyry copper deposit is in western San Juan Province, Argentina, within the Cordillera Principal, the highest-altitude section of the Andean Cordillera along the Argentina-Chile border. The deposit sits at approximately 3,600 mASL in a region dominated by north-south mountain ranges that increase in elevation from east to west.
The Cordillera Principal comprises folded, faulted, and uplifted Paleozoic-Mesozoic sedimentary and volcanic rocks from the Gondwanide orogeny, overlain by Upper Miocene ignimbrites associated with the Andean orogeny (Figure 6.1). The region’s geological history includes:
Eocene to early Miocene (19-16 Mya): Volcaniclastic strata accumulated in an extensional basin, followed by plutonic intrusion and contractional deformation.
Middle to Late Miocene (16-7 Mya): Volcanic flows and pyroclastic units were deposited, with comagmatic plutons and porphyry systems forming between 12 Mya to 8 Mya.
Late Miocene (8-5 Mya): A compressional event caused significant crustal shortening, crustal thickening, and regional uplift (Sillitoe and Perello, 2005).
Figure 6.2 highlights the regional geology and the locations of other major mining projects in the area.

Figure 6.1: Physiographic features of San Juan Province, Argentina (Rojas 2010)

Figure 6.2: Regional geology of the Andean Cordillera of Argentina and Chile (Rojas 2010)
Property Geology
The Los Azules deposit has been mapped multiple times (Rojas, 2007; Zurcher, 2009; Almandoz, 2010; Pratt, 2010), with geological interpretations generally consistent but differing in detail. These variations were reconciled by Jemielita (2010). Due to thick scree and valley fill covering the area, geological interpretation relies heavily on drill hole data, with minimal surface exposure observed in shallow trenching on the La Ballena ridge. In 2024, a 3D structural model was completed, incorporating drill data and surface mapping.
Los Azules exhibits characteristics typical of Andean-style porphyry copper deposits. It consists of a barren leached zone, an underlying supergene enrichment zone, and hypogene mineralization extending at least 1,000 m in depth. The hydrothermal system spans 5 km by 4 km NNW along a structural corridor, with its ultimate extent concealed beneath volcanic cover to the north. Mineralization limits along strike and depth remain undefined, with some drill holes terminating in mineralized zones above the resource cut-off grade.
Key minerals include chalcopyrite, bornite, chalcocite-digenite and idaite. Copper sulfides rarely exceed 2% to 3% of rock volume, with hypogene copper grades typically ranging from 0.1% to 0.35%. Silver is present at approximately 1 gram/tonne, along with trace amounts of gold and molybdenum.
Supergene enrichment resulted from meteoric groundwater leaching primary sulfides and redepositing copper below the water table as chalcocite and covellite. The enrichment zone transitions into hypogene mineralization at depth, with intensity diminishing below major structures.
Geological models by Sillitoe (2014) and Vázquez (2015) highlight similarities between Los Azules and Miocene-Pliocene porphyry systems like Río Blanco-Los Bronces and Los Pelambres in Chile. Sillitoe identified an early mineralized porphyry dike (EMP) phase responsible for much of the hypogene and supergene mineralization and less mineralized “inter-mineral” dikes. Vázquez redefined the chronological sequence and spatial distribution of igneous and hydrothermal events, which includes intrusion of a dioritic stock, pervasive alteration, and supergene enrichment. Figure 6.3. illustrates the geological model, showing alteration zones and the deposit’s structural setting.

Figure 6.3: Model for Los Azules (pink: potassic alteration, green: chloritic alteration, blue: sericitic alteration, yellow: advanced argillic lithocap), (Sillitoe, 2014)
Lithology
Volcanic Country Rocks (host)
Los Azules is hosted within volcanic lithologies of the Choyoi group, believed to be of Triassic age. These rocks include rhyolite and crudely bedded pyroclastics, ranging from fine-grained tuffs to coarse breccias (Rojas, 2008; Pratt, 2010), as shown in Figure 6.4.

Figure 6.4: Geologic map of Los Azules (Pratt and Bolsover 2010)
Precursor Pluton
The precursor pluton at Los Azules intrudes the volcanic country rocks and is a calc-alkaline quartz diorite complex dated to 10.6-10.7 Mya (Zurcher, 2008b). The pluton is elongated in an NNW direction and spans at least 7 km in length and 2.5 km in width (Figure 6.5). The pluton comprises multiple phases, including fine-to-medium-grained diorite, monzodiorite, and quartz diorite, with some quartz monzonite and some porphyritic quartz diorites also present. Accessory magnetite is common throughout the pluton.
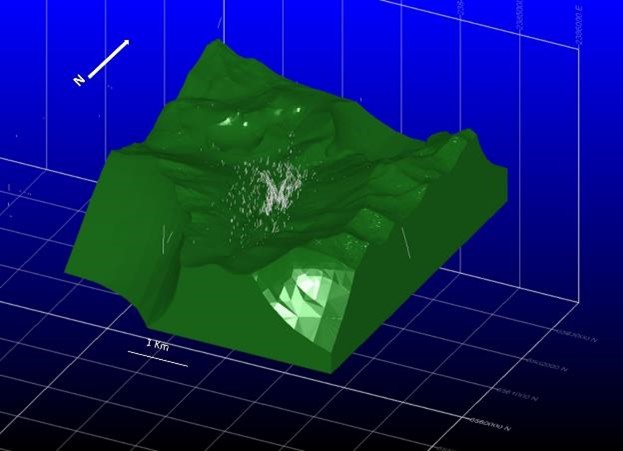
Figure 6.5: 3D block view of the Pre-mineral diorite pluton (PMP) in dark green. Drillhole traces are shown in grey. (McEwen Copper, 2024).
Early Mineralized Porphyry Dike (EMP)
The Early Mineralized Porphyry Dike (EMP) is a rhyodacite intrusion trending NNW and dipping steeply east (Zurcher, 2008a). It measures ~3.6 km in length and 20-400m in width (Figure 6.10), and it forms the prominent La Ballena ridge due to its resistance to erosion (Figure 6.6). The dike exhibits a “crowded” texture, with closely packed feldspar, hornblende, biotite, and quartz phenocrysts, the latter showing resorbed or cracked textures.
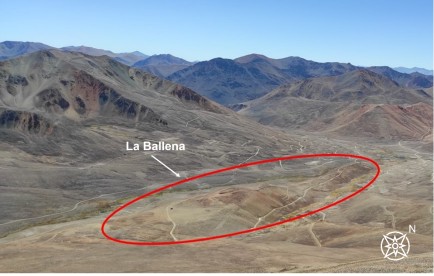
Figure 6.6: The La Ballena ridge is characterized by the relatively resistant Early Mineralized Porphyry Dike. Looking NW (McEwen 2025)
The EMP was emplaced during the final stages of magmatism (9.2 Mya) (Zurcher, 2008b and Vázquez, 2015) and underwent intense potassic alteration shortly after. This alteration introduced abundant type-A quartz veinlets (0.5-1 cm wide, Figure 6.7), containing pink quartz, pyrite and chalcopyrite, distinguishing the EMP from later intrusions. The classification of vein types follows the system of Gustafson and Hunt (1975). The EMP hosts the highest hypogene copper grades in the system, averaging 0.25%-0.35% Cu.

Figure 6.7: Early mineral porphyry with type-A quartz veinlets cut by type-D veinlets of pyrite replaced by supergene chalcocite. Pervasive sericite alteration. (Vásquez, 2015).
Inter-Mineral Porphyry Dikes (IMP)
Following the emplacement of the EMP, a series of dacitic porphyry dikes (IMP) intruded the diorite pluton, trending NNW and dipping steeply east. The most prominent IMP is located east of the EMP, measuring 1.9km in length and 20-70 m in width (Figure 6.8), with minor intrusive bodies west of the EMP.
The IMP features few type-A veinlets compared to the EMP (Figure 6.9) and lower hypogene copper grades, typically ranging from 0.1% to 0.2%, and the dikes are described as weakly enriched. Zurcher (2008b) dated the IMP at 8.2 Mya.

Figure 6.8: Inter-mineral Dikes (yellow) and their relationship to the EMP (red). The most prominent IMP is located on the East side of the EMP. (McEwen, 2024)

Figure 6.9: Inter-mineral Dikes with potassic alteration. (McEwen, 2024)
Magmatic – Hydrothermal Breccias
Breccias at Los Azules are predominantly magmatic-hydrothermal in origin and are associated with both the EMP and IMP. They occur as two types: early breccias related to the EMP and later breccias associated with the IMP. Both breccia types host hypogene mineralization, with early breccias generally exhibiting higher copper grades.
Early breccias are composed of fragments of porphyry and diorite in a quartz-cemented porphyritic matrix (Figure 6.10). They are generally characterized by potassic alteration with secondary biotite, potassium feldspar, magnetite, and anhydrite. The early breccias are found as small, high-grade zones along the edges and cupola zones of the EMP (Figure 6.11).

Figure 6.10: Magmatic-hydrothermal breccia with chalcopyrite and tourmaline in the breccia matrix. Clasts are partially sericitized (Hole AZ1297, 477 m) (Vázquez, 2015)

Figure 6.11: Early magmatic-hydrothermal breccia (green) along the edges and the cupola zones of the EMP (red) (McEwen 2024).
Later breccias related to the IMP are composed of crackle breccias with IMP or diorite in a tourmaline-rich matrix containing quartz, pyrite, chalcopyrite, and minor bornite. The alteration is dominantly sericite-quartz, with early type-A quartz veinlets restricted to clasts, and later veinlets of type C and D cutting both clasts and the matrix. These breccias occur primarily in the western deposit and are less abundant than early breccias (Figure 6.12).

Figure 6.12: Inter-mineral magmatic-hydrothermal breccia (red) occur along the western edges of the IMP (yellow) (McEwen Copper 2024).
Late Quartz-Sulfide Veins
Late-stage quartz-sulfide veins, located west of the EMP, consist of quartz, pyrite, chalcopyrite, sphalerite, and galena, with silver grades of 10-50 g/t. These veins are narrow (0.1-1m) and discontinuous, making them unsuitable exploration targets.
Hydrothermal alteration and Mineralization
Potassic, green sericite-chlorite, white sericite and Advanced Argillic Alteration
Potassic alteration includes widespread hydrothermal biotite replacing mafics, Early Halo veins (Early dark Micaceous, Pale Green Sericite veins and Grey Green sericite), potassium feldspar normally accompanied by quartz in veins, veinlets and pervasive replacements (aplites) and coarse-grained occurrences (pegmatites). Phengitic (Mg-rich) sericite is a common component of high temperature potassic alteration. It is present in Early Halo veins, miarolitic cavities, replacing mafics and normally growing with hydrothermal (secondary) biotite. Chalcopyrite dominates in these zones, with bornite appearing at greater depths and reaching a one-to-one ratio with chalcopyrite at 400-500 m (Figure 6.13, Figure 6.14, Figure 6.15).
The upward transition from potassic to green sericite-chlorite alteration has been observed in other Andean deposits, such as Río Blanco-Los Bronces (Sillitoe, 2014). This green sericite is of a lower temperature environment than that precipitated in the potassic–dominant environment. This alteration phase accounts for approximately 50% of hypogene copper mineralization, though grades are relatively low (0.05-0.35% Cu) (Vázquez, 2015).
White sericite alteration corresponds to a lower temperature environment than that precipitating potassic and subsequent green sericite. It was developed along highly fractured rocks that acted as conduits for hydrothermal fluid movement. White sericite is conceived as a grade destructive event and, therefore, is normally low grade. It is normally accompanied by quartz and pyrite.
Advanced argillic alteration overprinted previous assemblages along narrow structural zones carrying pyrophyllite-dickite. Although it is likely that small amounts of high sulfidation mineralization (bornite-pyrite-chalcocite) accompanied advanced argillic alteration, its volumetric significance is negligible. Advanced argillic alteration is also present as discontinuous outcrops at high topographic levels surrounding the main Los Azules deposit. These zones are believed to be the remnants of a now-eroded, well-developed lithocap located in the upper portions of the Los Azules system (Almandoz, 2010).

Figure 6.13: 3D block view showing green and white Sericite alteration in green with the deeper potassic alteration zone in purple. (McEwen 2024)

Figure 6.14: Typical drill core from Los Azules indicating the strongly fractured nature of the rock (Jemielita, 2010).

Figure 6.15: Diorite (precursor pluton) with potassic alteration cut by a quartz-chalcopyrite type-A veinlet (Vázquez, 2015).
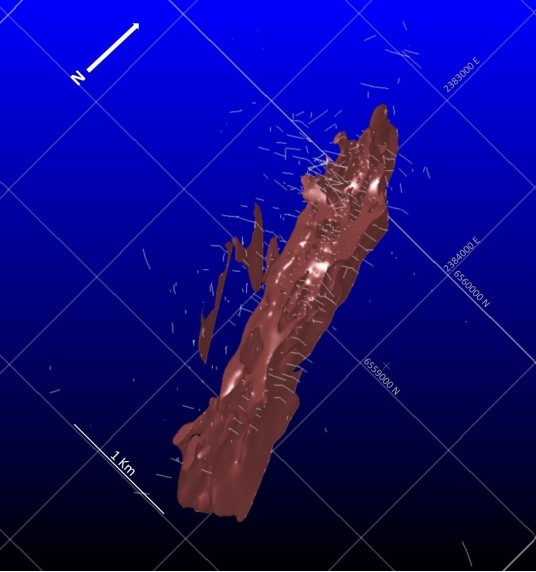
Figure 6.16: Early Mineralized Porphyry Dike (red). The entire dike is affected by potassic alteration. The dike is not yet constrained at depth by drilling (McEwen, 2024)

Figure 6.17: The White and Green Sericite alteration zone is shown in green. The sericite alteration affected the EMP, inter-mineral dikes, and surrounding quartz diorite rock (not shown). (McEwen Copper, 2024).
Supergene Enrichment
The supergene mineralization at Los Azules consists of a sub-horizontal chalcocite-covellite blanket that overlays hypogene sulfide mineralization. This enriched zone is capped by a leached oxidized layer with minimal copper content (<0.10%). The leached cap, ranging from 0 m to 260 m thick, is characterized by spots of jarosite, goethite, and hematite. Beneath this, a mixed sulfide-oxide zone transitions to the supergene blanket, where hypogene sulfides are replaced by chalcocite and minor covellite.
The supergene blanket extends approximately 4,400 meters north-south and up to 1,800 meters wide, with a thickness ranging from 60 m to 250 m, penetrating to over 400 m deep along structures. Copper grades in the enriched zone range from 0.4% to over 1.0% in the north-central area, tapering to 0.2 - 0.4% in the southern and peripheral zones.
This supergene mineralization is the most economically significant at Los Azules.
Figure 6.18 illustrates the spatial extent of the supergene enrichment zone. Cyanide-soluble copper data is used to delineate enriched mineralization zones, defined as having a soluble copper-to-total copper ratio exceeding 50%.

Figure 6.18: Supergene enrichment zone (yellow) superimposed on the potassic zone (purple). The supergene enrichment zone is defined as having a Soluble Cu ratio >50%. (McEwen, 2024)
Sulfate Front
The deposit is defined by a prominent supergene sulfate front, located 300-700 m below the surface. This front marks the transition where meteoric groundwater has removed anhydrite and gypsum (Figure 6.19). Gypsum lines fractures and cavities, particularly in breccias, and become progressively more abundant in depth, irrespective of alteration types.
The sulfate front also marks a noticeable increase in rock strength, reflected in higher RQD indices. Many drill cores from this zone reveal fractured rock coated with gypsum (Figure 6.20), suggesting a pervasive anhydrite stockwork in the original system that was later hydrated and dissolved (Jemielita, 2010).
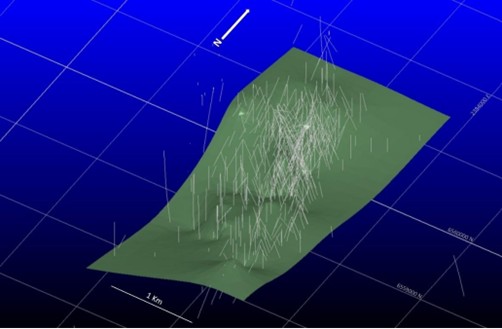
Figure 6.19: Sulphate front modeled using hyperspectral data (McEwen, 2024).

Figure 6.20: Typical drill core from Los Azules indicating the strongly fractured nature of the rock (Jemielita, 2010).
Structural Geology
In 2024, a detailed structural model of the Los Azules deposit was developed with assistance from structural consulting firm CIGEA. This included surface structural mapping, logging of key drill holes, and correlation with Televiewer acoustic data, culminating in a comprehensive 3D structural model.
The deposit lies within the hanging wall of the Santa Cruz reverse fault, a major NS-striking structure marking the eastern boundary of the Paleozoic-Triassic Choiyoi Group basement rocks. Within this structural block, NS to NNW-striking faults dominate (Figure 6.21) crosscut by a prominent NW-striking fault system disrupted by a late EW-striking joint system. Minor NE-striking faults are also present. The NS-striking La Ballena fault and its intersections with the NW-striking faults control the mineralization (Figure 6.22). NE-striking faults served as conduits for mineralization by permeability (CIGEA, 2024).

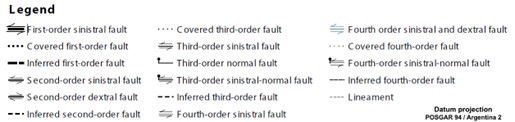
Figure 6.21: Surface Structural Map (CIGEA, 2024).

Figure 6.22: Schematic drawing of the principal faults and their relationship to mineralization. The principal compression directions are shown with red arrows and the principal extension directions are shown with blue arrows. (CIGEA, 2024)
Deformation occurred under a compressive to strike-slip tectonic regime with WNW-oriented maximum compression (σ1) and NNE-oriented extension (σ3). This stress field facilitated magma emplacement into NNW- to NS-striking reverse faults, while NW- to WNW-striking faults accommodated hybrid and extensional deformation. NE-striking faults acted as secondary slip systems. The intersections of these structures controlled early mineralization and magmatic activity, with later NW-striking faults contributing to subsequent magma emplacement and mineralization (CIGEA, 2024). Minor displacements, typically in the order of meters, occur along NW-striking faults. Key structural items include the Ballena, Piuquenes, Los Azules, Vega, Lagartija, and Filum faults (Figure 6.23).

Figure 6.23: First order faults modeled at Los Azules (CIGEA, 2024)
OTHER MINERALIZATION
In 1998-1999 Battle Mountain Gold explored the northwest area of Los Azules (La Hoya) for gold, drilling three holes in altered pyroclastic volcanic rocks within a pyrite-mineralized zone, but results proved unsuccessful. Exploration focused on hydrothermal breccias with kaolinite-illite-dickite-quartz-alunite alteration near feldspar porphyry dikes in the Cerros Centrales (Cerro Oeste) area.
Potential gold-silver mineralization near Los Azules includes late-stage, intermediate-sulfidation epithermal quartz veins, with minor sphalerite and galena, as described by Pratt (2010). Although precious metal deposits often occur around porphyry copper systems, the district remains largely unexplored for this style of mineralization.
At Los Azules, a leached cap and supergene chalcocite blanket indicate copper oxidation, dissolution, and vertical transportation, with subsequent redeposition within the system. Copper may have also been transported laterally and redeposited as “exotic” copper mineralization nearby (Sillitoe, 2010). However, no exploration for this style of mineralization has yet been undertaken in the vicinity of Los Azules.
Deposit Type
Los Azules is located within the Central Chile segment (400 km-long) of the Miocene-Early Pliocene porphyry copper belt (6,000 km-long) of the north and Central Andes (Figure 6.24). The figure also shows locations of the major porphyry copper and related epithermal deposits, along with the limits of the porphyry copper belt.
Porphyry copper deposits in this sub-belt are 23 to 3 Mya in age and include the world-class Los Pelambres (Cu-Mo), Rio Blanco-Los Bronces (Cu-Mo), and El Teniente (Cu-Mo) porphyry deposits in Chile, the Maricunga belt porphyries (Cu-Au) in Chile, and El Pachón (Cu) and Bajo de la Alumbrera (Cu-Au) in Argentina, as well as numerous other porphyry and related deposits (Sillitoe and Perello, 2005).
Mineralization at Los Azules is Andean-Cordilleran, late Miocene, (quartz-) diorite-hosted, oxidized porphyry copper style with a well-developed leached cap and supergene chalcocite-covellite blanket. Los Azules displays numerous features in common with other porphyry deposits, as described below.
Panteleyev (1995) describes the common features of porphyry deposits as large zones of hydrothermally altered rock containing quartz veins and stockworks, sulfide-bearing veinlets, fractures, and lesser disseminations in areas up to 10 km2 in size. These are commonly associated with hydrothermal and/or intrusion breccias and/or dike swarms.
Deposit boundaries are determined by economic factors that define mineralized zones located within larger areas of low-grade, often concentrically zoned mineralization. Important geological controls on porphyry mineralization include structures, igneous contacts, cupolas, and the uppermost, bifurcating parts of stocks and dike swarms. Intrusive and hydrothermal breccias and zones of intensely developed fracturing due to intersecting or parallel multiple mineralized fracture sets commonly coincide with the greatest metal concentrations.
Surface oxidation commonly modifies porphyry deposits in weathered environments. Low pH meteoric waters leach copper from the oxide zone, which is then transported and redeposited as secondary chalcocite and covellite, usually immediately below the water table, to form sub-horizontal, tabular zones of supergene copper enrichment. This process forms a copper-poor leached cap above a relatively thin but often high-grade zone of supergene copper enrichment that caps a thicker zone of often low to moderate-grade hypogene copper mineralization at depth.
Alternatively, or additionally, porphyry systems can exhibit hypogene enrichment related to the introduction of late hydrothermal, copper-enriched fluids along structurally prepared pathways, the leaching and redeposition of hypogene copper, or a combination of the two. Hypogene copper mineralogy, in this instance, comprises covellite and chalcocite, often with elevated hypogene copper grades.

Figure 6.24: Miocene - Early Pliocene porphyry copper belt (red) of the north and Central Andes. The Paleogene belt is orange (Piquer, et al, 2021).
Other deposit styles often spatially, temporally, and genetically associated with porphyry deposits include:
Exotic copper deposits formed by the lateral migration of copper-bearing fluids away from the main body of porphyry mineralization.
Mineralized breccia pipes, skarns, sedimentary replacements (mantos), and precious metals-bearing mesothermal-epithermal vein deposits located peripheral to and progressively distant (laterally and vertically) from the porphyry copper center as shown in Figure 6.25.
The figure shows the spatial relationships between a porphyry copper system and its surrounding environment including host rocks and peripheral styles of mineralization such as skarns, carbonate replacement (chimney-manto), sediment-hosted disseminated sulfides, mesothermal polymetallic veins and higher-level high/intermediate/low sulfidation epithermal gold-silver veins and disseminated deposits.

Figure 6.25: Diagram Showing Spatial Relationships between a Porphyry Copper System and the Surrounding Environment (Sillitoe 2010)
Exploration
exploration history
Exploration at Los Azules commenced in the mid-1990s and included various studies of geology, geophysics, and geochemistry, as well as drilling with both reverse circulation and diamond core drills, sampling and analysis of surface and drill core samples, and road construction. Exploration was conducted successively, and sometimes in cooperation, by Battle Mountain Gold (BMG), MIM-Xstrata, and Minera Andes/McEwen and McEwen Copper, principally by the latter company.
Geological Mapping and Studies
The most comprehensive and up-to-date geological map of Los Azules was produced by Pratt and Bolsover in 2010, as described in Section 6.2. An earlier detailed geological map, with cross sections, was compiled by Rojas (2007); Almandoz (2010b) produced a geological map at a 1:5000 scale, and Zürcher (2008a) made a detailed map of the central portion of the north-northwest-trending La Ballena ridge that focused on hydrothermal alteration and mineralization. The latter map shows no lithological boundaries, reflecting the difficulty of separating igneous lithologies in the mineralized zone, a problem also reported by Pratt (2010).
Surface and drill core samples have been analyzed since 2004 as part of a mineralogical study using a portable infrared spectrometer (PIMA; Lasry, 2005). Petrographic studies were made in Argentina after the 2006 exploration campaign (Sumay and Meissi, 2006).
Petrographic studies of polished sections collected by Zurcher from drill cores, and surface samples were initially studied by DePangher (2008) in Oregon, and then by GEOMAQ in Santiago de Chile (Rojas, 2010). Zurcher (2008b) reported a series of U-Pb age dates for the igneous intrusions.
In 2014, Sillitoe examined about 9,000 m (approximately 25% at the time) of the diamond drill core and proposed a revised geologic interpretation for Los Azules, which is described in Section 6.2. Sillitoe recognized the presence and importance of an early mineralized porphyry dike phase of igneous intrusion. Much of the hypogene mineralization and supergene mineralization is associated with this phase; later dikes are not as well mineralized.
In 2015 Vázquez relogged 44,000 m from 98 drill holes representing essentially all the drill core at the time. Vázquez confirmed Sillitoe’s interpretation, and he also refined the temporal sequence and spatial distribution of distinct alteration phases and mineralization zones as described in Section 6.2.
GEOPHYSICS
Various geophysical studies were conducted at Los Azules by Battle Mountain Gold and by MIM-Xstrata respectively in 1998-1999 and 2004 and for Minera Andes (by Quantec) in early 2010 and McEwen (Quantec) in 2012. Work done and results for these surveys are described in the following section. In late 2024 – early 2025, Expert Geophysics Ltd (EGL) conducted a helicopter-borne MobileMT electromagnetic & magnetic survey for McEwen Copper.
Battle Mountain Gold (1998-99)
GEODATOS, a Chilean geophysical company, conducted an airborne geophysical survey in early 1998. The survey covered a 20 km by 10 km area elongated east-west including the Los Azules and Paso de la Coipa areas. Lines were flown north-south at 200 m intervals and control lines were flown east-west at 1,000 m intervals. Instrument altitude was maintained at 20 m during flights.
Results suggested the existence of a structural corridor striking northwest and structures striking east- northeast associated with strong to moderate magnetic low signatures in the Los Azules mineralized body. A total field magnetic plot identified a magnetic high anomaly surrounding a central magnetic low that extended 6 km north-northwest, and 3 km northeast as shown in Figure 7.1. Battle Mountain Gold interpreted the magnetic low as altered rocks associated with the mineralized body.
Four lines of induced polarization (IP) were oriented east-west averaging two kilometers long and spaced at 600 m to 900 m apart. The lines were positioned to cross the locations of mineralized drill holes LA04-98, LA-06-98, and LA-08-98. One of the lines extended north to lithocap outcrops with anomalous copper (advanced argillic alteration possibly associated with gold mineralization and underlying porphyry copper mineralization). IP results indicated high chargeability and low resistivity corresponding with the location of the Los Azules porphyry copper deposit.
Two ground magnetic surveys totaling 103 km were conducted in the Los Azules mineralized porphyry and the nearby Sector Mantos, which is 1 km west of Cerro Oeste.
Lines were oriented east-west at 100 m spacing and 10 m stations. Results confirmed the existence of north-northwest- and north-northeast-striking structures as indicated by aeromagnetics. Results also confirmed the presence of a magnetic low anomaly in the vicinity of drill holes LA-98-04, LA-98-06 and LA-98-08 and suggested the presence of a magnetic low along the alteration system of La Ballena ridge as shown on Figure 7.1.

Figure 7.1: Magnetic Map of Los Azules (Reduced to Pole) and IP lines. (Rojas, 2008 after Xstrata, 2003). Note: Red box indicates the mag low across the Ballena Ridge.
MIM Xstrata (2003-2004)
During 2003-2004, MIM-Xstrata carried out a magnetic survey of approximately 70-line km at Los Azules. Lines were oriented east-west across the area controlled by the company at that time. In addition, MIM-Xstrata ran six east-west lines of MIMDas (MIM-Xstrata proprietary IP system) totaling 11.8 km. At the request of Minera Andes, MIM-Xstrata extended their geophysical lines south into Minera Andes ground, completing five additional lines for a total of 11.3 km in 2004. Total surveying by MIMDas was 23.1 km.
Magnetometry indicated a magnetic low beneath the Los Azules porphyry copper system and suggested that it extended north-northwest towards the La Hoya zone (Cerros Oeste and Este). The total field plot identified a magnetic high anomaly surrounding the magnetic low. The magnetic low extends 7 km to 8 km north-northwest and up to 2 km east-northeast confirming the interpretations made by Battle Mountain Gold.
The MIMDas IP survey indicated high resistivity in the north-northwest zones at Los Azules with much lower resistivity within the porphyry copper system. Chargeability is relatively low to the north but becomes much lower at the porphyry although it increases significantly in depth. These results reflect the occurrence of more superficial sulfides in the Lagunas area of the system (north of the porphyry deposit) and a thicker leached cap in the more altered part of the system.
Minera Andes TITAN 24 Survey (2010)
Titan-24 DCIP-MT data were acquired at Los Azules during April and May 2010 by Quantec Geoscience Ltd., on behalf of Minera Andes Inc. The Titan-24 system acquires three types of geophysical data– magnetotelluric resistivity (MT), direct current resistivity (DC), and induced polarization (IP). The survey consisted of twelve parallel lines (L58400 N to L62450 N). From L58400 N to L62000 N, the lines were 400m apart, L62550 N was 550 m north of L62000 N, and L63450 N was 900 m further north. Each line comprised one single spread of 3.6 km, except for L63450 N, which was 3.3 km long. Full MT tensor data was acquired in all the lines, and DCIP was collected in all but L59200 N and L59600 N. In total, ten spreads of DC and IP data were acquired, covering 35.7 km, and twelve spreads of MT covering 42.9 km. Grid azimuth was 90°, and the station interval was 150 m. These coordinate references are in Campo Inchauspe.
Over 130 IP anomalies were identified. Of these, 20 were classed as priority 1, 20 as priority 2, and 12 as priority 3. Priority 1 anomalies are larger targets, at least 200 m across, and described by Quantec as being consistent with the porphyry and near- porphyry mineralization model.
Two large deep resistivity anomalies, one high to the east, under the Los Azules mineralization, and one low to the west are well defined by the MT survey. The anomalies occur at depths-to-center ranging from 800 m to 1.5 km. Depth-to-top is rarely less than 500 m. The width of the anomalies is 800 m to 1 km for the resistivity low and 500 m to 800 m for the resistivity high. Quantec postulated that the deep anomalies are most likely related to conductive sulfides, perhaps in a disseminated pyrite/sulfide shell surrounding a concealed porphyry intrusion. These anomalies, which are referred to as the “Southwest Target”, are the targets that were tested in Hole T-01B in 2011 and Hole 1279 in 2012 (Figure 7.2).
Hole T-01B is located 200 m north of section 58,400N, and Hole 1279 is located 100 m south of the drill section. The section shows the limit of mineralization prior to the 2010 and 2011 drilling campaigns.
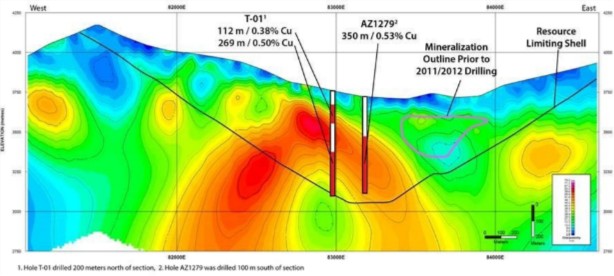
Figure 7.2: The 2010 survey Section 58,400N Showing 2D IP Inversion Anomaly (Southwest Target) (McEwen 2012). Note the Resource Limiting Shell is historic in nature (2012) and does not represent the current 2025 pitshell outline.
McEwen: Ground Magnetic Survey (2012)
During January 2012, Quantec Geoscience Argentina S.A. performed a ground magnetic survey on the southwest portion of the Project. The survey consisted of 37 lines ranging from 1.1 km to 2.5 km, for a total of 57.2 line-km. The objective of the survey was to identify anomalous magnetic signatures that might be related to copper porphyries. The survey was acquired on a “stop-and-go” configuration, collecting data at 10 m intervals. The data was presented as maps of the Total Magnetic Field, Reduction to the Pole transform, Analytic Signal, Tilt Derivative and First Vertical Derivative.
Figure 7.3 is the Total Magnetic Field map for the 2012 survey. The 2012 magnetic data shows a discontinuous north-northwest trending magnetic low southwest of and roughly parallel to the prominent magnetic low that corresponds to the location of the main Los Azules deposit.
Areas of high magnetic response indicate the presence of elevated levels of magnetic minerals such as magnetite, pyrrhotite and hematite, whereas areas of low magnetic response may be caused by alteration processes such as magnetite destruction or may simply indicate rock types that never had magnetic minerals. This anomaly was tested with one drill hole during the 2012 season and intersected only trace amounts of copper mineralization.

Figure 7.3: Total Magnetic Field Map of Los Azules. (Quantec, 2012). Note: Dashed red box indicates the location of the mag low across the Ballena Ridge seen in Fig 7.1 – the solid red box indicates the discontinuous mag low to the southwest.
McEwen Copper: Airborne Magnetic Survey (2024)
In late 2024, early 2025, Expert Geophysics Ltd (EGL) conducted a helicopter-borne MobileMT survey for McEwen Copper. Electromagnetic and magnetic geophysical data were acquired using EGL’s airborne MobileMT system. The purpose of the survey was mapping bedrock structure and lithology, including possible alteration and mineralization zones, observe apparent conductivity corresponding to different frequencies, inverting EM data to obtain the distribution of resistivity with depth, and using VLF EM and magnetic data to study properties of the bedrock units.
A total of 17 production flights were flown to complete 1920 line-kilometers of the survey over a 347 sq.km area.
Survey lines were oriented E-W (N 90° E) at 200 m spacing, while tie lines were oriented perpendicular to the survey lines and spaced at 2000 m. The geophysical survey results were presented in the form of digital databases, maps, grids, sections, elevation slices, and 3D voxels. Figure 7.4 shows a 3D view of the resistivity map.

Figure 7.4: Resistivity voxel in 3D view of the surveyed area. Top from surface, bottom from 2900 m ASL. The location of Los Azules is shown by a yellow star. (Expert 2025)
The Los Azules mineralization is spatially correlated with a magnetic low, shown in reduced to pole total magnetic intensity (RTP-TMI) data, and a conductivity high, evident in the apparent conductivity data. It is recommended to analyze all geophysical data (MobileMT EM, VLF and magnetic) in relation to an exploration model considered for the surveyed area and integrate these data with other available geological and geochemical information, for refining targets, follow-up groundwork and ultimately drilling planning.
SURVEYS AND INVESTIGATIONS
Mineral exploration at Los Azules has been carried out successively by Battle Mountain Gold, MIM-Xstrata and Minera Andes-McEwen, McEwen Copper and/or professional consultants or contractors employed by these companies.
Jemielita (2010) reviewed the exploration program and data and reported that “Mineral exploration at Los Azules appears to have been carried out in a competent manner and to accepted industry standards,” although he noted that he did not conduct a rigorous confirmation of the quality of exploration work.
In 2017, McEwen engaged consultant Rodrigo Diaz (Diaz, 2017) to conduct an evaluation of remote spectral geology (RSG) over a 17 km by 20 km area at Los Azules and later extended to include an area 38 km by 42 km. After numerous tests, spectral data of Landsat 8 (30-15 m pixel and 16-bit radiometric resolution), and for completing the analysis and interpretation, spectral data of Aster (30-15 m pixel and 8-bit radiometric resolution) were selected and used; additionally, spectral data of the Sentinel 2 (20-10 m pixel and 16-bit radiometric resolution) and Sentinel 1-Radar (10 m pixel) was also used.
Beginning in 2022, McEwen Copper undertook a program of continuous hyperspectral scanning and high-resolution core photography on the entire available archive of drill core completed in 2022 and previous programs stored at Calingasta. The scanning protocol continued during subsequent drilling campaigns and by April 2025, this represented some 133,640 m of scan logs, data and images available to augment completion of an updated geological model and support the design of the ongoing metallurgical program.
Also in 2022, McEwen Copper engaged the services of Murphy Geological Services (MGS) (Murphy, 2023) to complete a structural interpretation of Sentinel-2 and high-resolution imagery of the Los Azules property and immediate surrounding area. Sentinel-2 is a new earth observation sensor with 13 spectral bands having resolutions up to 10 m which was launched by the European Space Agency in June 2015 and is a significant improvement on the 15m resolution pan-sharpened Landsat-7 and ASTER data and allows more detailed structural analysis. An interpretation of a 45 km (E-W) by 35 km (N-S) Sentinel-2 extract centered on Los Azules was undertaken at up to 1:10,000 scale followed by a more detailed interpretation at up to 1:1,000 scale for a smaller area of 16 km (E-W) by 12 km (N-S) centered on Los Azules using WorldView 3 imagery.
The main aims of the study were to establish the structural framework and generate exploration targets for porphyry-related mineralization as well as possible high- and low-sulphidation epithermal targets using the interpretation results and alteration data derived from Sentinel-2, ASTER and WorldView-3 Superspectral data.
In January 2024, an onsite structural field analysis was undertaken by MGS (Murphy, 2024) in the Los Azules licence areas as a follow up to verify the proposed structural model and to examine and refine target areas identified from the satellite image interpretation. Bedrock exposure was limited and commonly obscured by extensive colluvium on the mountain slopes. Most outcrops were located along drill roads and on the margins of drill pads. The kinematics of many of the minor faults observed in the field substantiate the structural model proposed from the remote sensing study.
Twelve exploration targets were identified based on the results of the Sentinel-2 and WorldView-3 interpretation, alteration processing results and structural field analysis. These targets are based on several criteria including presence of major faults, major fault intersections, releasing bends along major faults, domal/circular features, linear resistant features, dacite/diorite porphyries, hydrothermal breccias, Sentinel-2, WorldView-3 and ASTER-derived alteration anomalies, argillic/advanced argillic alteration and silicification observed during the field analysis and anomalous copper and/or gold values from geochemical sampling.
Completion of the Diaz work in 2017 and Murphy work in 2022-2024 is foundational to designing and re-establishing more regional reconnaissance exploration at Los Azules.
FUTURE EXPLORATION
The goals of future exploration at Los Azules include the establishment of upside potential on the property, ongoing geological model refinements, deposit growth, resource category upgrades, and identification/discovery of new porphyry mineralization as extensions of the Los Azules deposit, as well as new porphyry systems.
It is becoming increasingly recognized that Los Azules is not just a single deposit, it is part of a porphyry district. Work continues to identify and discover new porphyry mineralization in the area. The recent 2024-2025 field season included initial assessment work on seven large targets with porphyry potential in the local area away from the main deposit including Mercedes, Tango and Porfido Norte. This work included ground reconnaissance, geophysical surveys described above, mapping, talus and outcrop sampling, and limited drilling.
At the Tango target preliminary drilling has confirmed oxide copper near surface, sulfide zones at depth, and early signs of a vertically zoned system. At Mercedes, moderate molybdenum-bearing B-type veining and intense hydrothermal alteration indicate proximity to a porphyry center, highlighting a compelling new porphyry target. This early work has produced encouraging early results to follow up in coming seasons.
Future exploration work programs should continue to carry out reconnaissance studies, field mapping and sampling, land and airborne based geophysical surveying, and core drilling to achieve target definition, refinement and testing. More specifically, these activities should include:
Field ground truthing and validation follow-up and possible update for the regional scale Spectral study for alteration definition, characterization of known mineralization and generation of new targets.
Continued reconnaissance geological mapping and geochemistry to increase geological and structural knowledge and understanding of the known mineralization, and identification or refinement of potential exploration target areas.
Evaluate the need for further core relogging and validation versus the hyperspectral scanning library and results to ensure a unified geological model of the deposit supported by all datasets from current and historic programs.
Reprocessing of the raw 2010 Quantec Titan Survey data, if warranted, to extract “new” data and targets from the previous study based on improved modern processing methods.
Review findings and recommendations in the 2025 Expert Geophysics survey report to support exploration work. Investigate the need and efficacy of completing alternative geophysical surveys over the license areas.
Strategic core drilling of interpreted Los Azules deposit extensions and over selective high-quality exploration targets to be generated on the property.
Continued infill core drilling where needed to upgrade priority portions of the resource and mine planning schedules based on outcomes of the Feasibility Study.
conclusions & adequacy
While improvements to the core handling processes can be improved, the QP believes that the sampling information provided for use in Mineral Resource and Reserve estimation does not introduce a material bias and is adequate for this purpose without qualification.
Current sampling protocols indicate that core to be sampled is split and a half core sent for analysis. An initial review of remaining core kept in the storage facility at Calingasta (from historic to recent) has identified occasional instances where portions of the largely unmineralized, older, (pre-McEwen) core in the enriched zone, were not sampled (i.e. intact core remains and was not assayed).
It is known that mineralized and/or “grading” portions of core in the enriched zone are characterized by low or zero RQD values, that are more easily segregated for representative sample assaying. The unsampled, more intact, portions of generally unmineralized core occur in older core which constitutes a smaller portion of the total data used for resource estimation which relied more on the recent drilling campaign samples from 2022 onwards. Any bias associated with this procedural oversight is not considered significant to the current Mineral Resource Estimate.
It is proposed that a study of the entire database and stored core be done to determine relationships between the age of drilling and sampling, RQD and grade.
Drilling
Drilling programs have been undertaken at Los Azules between 1998 and 2025 by five different mineral exploration companies including BMG, MIM Argentina (now Glencore), Minera Andes, McEwen and McEwen Copper. Early drilling programs included reverse circulation programs mostly for gold exploration and diamond drilling focusing on supergene and hypogene porphyry-style copper mineralization. In addition to continued exploration, resource and infill drilling, more recent campaigns by McEwen and McEwen Copper have included geotechnical, metallurgical, condemnation, site investigation and hydrogeological drilling programs. Descriptions of these programs are detailed in the following sections. Table 7.1 provides a summary of the drilling information.
Table 7.1: Exploration Drilling by Year and by Company | |||
|---|---|---|---|
Year |
Company |
No. of holes |
Meters |
1998 |
Battle Mountain Gold |
19 |
4,450 |
1999 |
Battle Mountain Gold |
8 |
2,043 |
2003 - 2004 |
Glencore Xstrata (MIM) |
13 |
2,930 |
2005 - 2006 |
Minera Andes |
12 |
2,953 |
2006 - 2007 |
Minera Andes |
21 |
4,241 |
2007 - 2008 |
Minera Andes |
16 |
4,836 |
2009 - 2010 |
Minera Andes |
30 |
10,942 |
2010 - 2011 |
Minera Andes |
48 |
9,287 |
2011 - 2012 |
McEwen |
39 |
14,398 |
2012 – 2013 |
McEwen |
7 |
5,768 |
2017 |
McEwen |
18 |
6,500 |
2018 |
McEwen |
79 |
4,274 |
2022 |
McEwen Copper |
105 |
24,254 |
2023 |
McEwen Copper |
226 |
56,559 |
2024 |
McEwen Copper |
316 |
52,625 |
2025 |
McEwen Copper |
12 |
2,900 |
Total |
|
969 |
208,960 |
This table includes all drilling that has occurred on the property. Some holes were redrilled due to drilling difficulties and are not included in the database. Not all holes were used in the estimation of mineral resources if they lay outside of the resource area or were not assayed or logged as needed. The drilling reflects all holes to the effective date of April, 2025.
The drill plan showing collar locations by the year drilled is shown in Figure 7.5.

Figure 7.5: Plan Showing Locations of drill holes at Los Azules (McEwen 2025). Note that not all drillholes are shown, only those in the immediate pit and resource areas.
DRILLING PROCEDURES AND CONDITIONS
Drilling by McEwen and McEwen Copper Inc. was contracted to various drilling companies including Ecominera Connors Drilling, Patagonia Drill Mining Services, Adviser Drilling, Boland Minera, Major Drilling, Foraco Argentina, HG Perforaciónes, Conosur, and Boart Longyear, Perforaciones Iglesianas. Drilling conditions have been particularly difficult especially in faulted intersections or in areas of unconsolidated surface scree/talus.
BATTLE MOUNTAIN GOLD (1998-99)
In 1998 and 1999 BMG drilled 27 reverse circulation (RC) holes for a total of 6,493 m during a gold exploration program. Chalcopyrite, chalcocite, and covellite mineralization were encountered in at least three drill holes (Rojas, 2010).
MIM-XSTRATA (2003 - 2004)
In 2003-04 MIM Argentina (now Glencore) drilled 13 RC holes (2,930 m) at Los Azules (MCI, 2025).
MINERA ANDES/MCEWEN (2004-2017)
Minera Andes/McEwen drilled 191 drill holes for a total 58,925 m in nine campaigns (2003-2004, 2005-2006, 2006-2007, 2007-2008, 2009-2010, 2010-2011, 2011-2012, 2012-2013 and 2017). Drilling concentrated on identifying a zone of secondary enrichment in a grid with holes spaced at 200 m along east-west lines spaced at 400 m. Infill diamond drill holes were drilled during the 2009-10 campaign with a target depth of 400 m, achieved or exceeded in seventeen holes, four of which exceeded 600 m in depth. During the 2009-2010 campaign three RC holes for hydrologic and geotechnical testing were completed. Drilling during the 2010-2011 campaign included 16 infill or step-out diamond drill holes, six diamond drill holes for hydrology and geotechnical testing and 20 RC holes for condemnation and hydrology testing. Drilling during the 2011-2012 campaign comprised 10 infill and step- out diamond drill holes. During the 2012-2013 campaign all 22 diamond drill holes were for the purposes of expanding the resource either to depth or laterally. The 2017 program included fourteen delineation holes in the northern part of the deposit plus three holes drilled for geotechnical purposes.
MCEWEN (2018)
A total of 79 holes and 4,274 m of drilling were completed in the 2018 program. This was made up of one new core hole of 450 m and 78 reverse circulation (RC) holes totaling 3,824 m. The activities performed were mainly technical site investigations and environmental base line monitoring work, to advance permitting efforts.
MCEWEN COPPER (2022-2025)
Over the period of four drilling seasons from January 2022 to March 2025, McEwen Copper completed 140,612 m of drilling in 738 holes:
The primary purpose (278 holes for 89,409m) of the core drilling was for improvements to the geological understanding and model interpretation, mineral resource upgrading of Inferred material to the Indicated category and from Indicated to the Measured category; holes were also drilled to upgrade previously unclassified material to the Inferred category.
A total of 19,425m in 50 holes were used for metallurgical purposes.
A further 327 holes for 26,198m drilled by RC, core and sonic drilling methods used for geotechnical, hydrogeological, condemnation and ground investigation work in the area.
Finally, seven exploration core holes for 2,472m were drilled in areas away from the main deposit at the Mercedes and Tango targets.
Figure 7.5 shows the location and distribution of Los Azules drill holes based on core and RC drilling methods. Note that some holes were used for dual purposes (resource, metallurgy and geotechnical) hence the sum of holes above may not appear to sum correctly.
LOGGING
Samples taken from drill holes at Los Azules are logged at the Project camp by geologists employed or contracted by McEwen Copper. Sampling procedures are described in Section 8.2. Emphasis is given to recording rock-types, alteration associations, types and distribution of mineralization and the presence of various types of veinlets and structures. These features are logged onsite (Figure 7.6) then transferred to a digital database.
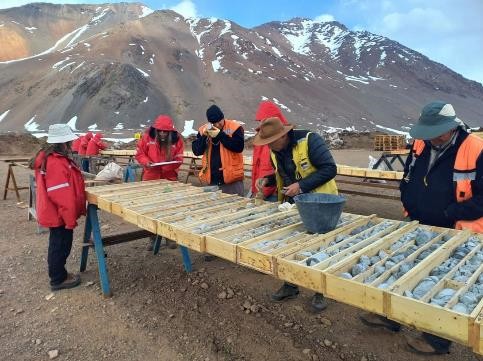
Figure 7.6: Logging and inspection of drill core (McEwen 2023)
Geotechnical observations and parameters are recorded including percentage of core recovery, RQD, Schmidt Hammer hardness determinations, point load testing, fracture density and angle relative to the length of the hole, as well as fracture fill material (Figure 7.7). This information is transferred to the digital database.


Figure 7.7: Geotechnical logging and data collection (McEwen 2023)
Log sheets are coded, and details recorded for interval depth, interval width, lithology, alteration types, alteration intensities, alteration minerals, structure, percentage vein quartz, percentage total disseminated sulfides, mineralization minerals, mineral zone (hypogene or supergene), jarosite, goethite, hematite, covellite, chalcocite, pyrite, chalcopyrite, bornite and other observations.
SURVEYS
Downhole surveying is done on drill holes by the drilling contractors using REFLEX and/or Sperry-Sun tools. A total of 7,731 drill core samples were used for density determinations. By the end of the 2024-25 campaign, a program of hyperspectral scanning of the entire available core archive was completed, some 133,640m in total.
DRILL HOLE RESULTS
There is a total of 969 drill holes in the entire Los Azules database with a cumulative length of 208,961m. A summary of significant drilling results is found in Table 7.2 for campaigns prior to 2022 and Table 7.3 for the January 2022 to December 2023 drilling campaigns.
Drilling has confirmed the presence of a hypogene porphyry copper deposit in a continuous body, as well as the presence and continuity of an overlying supergene chalcocite enrichment blanket. The extent of mineral resource measures approximately 4 km north-south by 1.5 km west-east. Many of the drill holes in the central and northern parts of the deposit have been terminated in mineralization exceeding 0.2%Cu (hypogene).
Drilling during the 2012-2013 campaign extended the depth of the mineralized system in the southwestern part of the deposit to at least 1,000 m.
Table 7.2: Examples of Significant Drilling Results Prior to 2022 | |||||
|---|---|---|---|---|---|
Drill Hole ID |
TD (m) |
Intersection |
Interval (m) |
Total Copper (%) |
|
From (m) |
To (m) |
|
|
||
AZ0401 |
195.0 |
130.0 |
195.0 |
65.0 |
0.62 |
Including |
150.0 |
192.0 |
42.0 |
0.82 |
|
AZ0402 |
330.5 |
164.0 |
304.0 |
140.0 |
0.38 |
Including |
164.0 |
190.0 |
26.0 |
0.47 |
|
Including |
230.0 |
304.0 |
74.0 |
0.42 |
|
AZ0404 |
300.8 |
162.0 |
282.0 |
120.0 |
0.54 |
Including |
162.0 |
202.0 |
40.0 |
0.59 |
|
Including |
236.0 |
282.0 |
46.0 |
0.64 |
|
AZ0407 |
168.8 |
96.0 |
152.0 |
56.0 |
0.44 |
Including |
126.0 |
152.0 |
26.0 |
0.58 |
|
AZ0610 |
261.4 |
174.0 |
261.4 |
87.4 |
0.83 |
AZ0611 |
270.7 |
112.0 |
270.7 |
158.7 |
0.51 |
AZ0614 |
224.6 |
132.0 |
180.0 |
48.0 |
1.13 |
Including |
136.0 |
158.0 |
22.0 |
1.40 |
|
AZ0617 |
183.5 |
66.0 |
183.5 |
117.5 |
0.63 |
Including |
66.0 |
124.0 |
58.0 |
0.84 |
|
AZ0619 |
299.4 |
78.3 |
299.4 |
221.2 |
1.62 |
Including |
78.3 |
116.0 |
37.8 |
2.22 |
|
Including |
134.0 |
146.0 |
12.0 |
3.94 |
|
AZ0620 |
253.3 |
80.0 |
226.0 |
146.0 |
1.10 |
Table 7.2: Examples of Significant Drilling Results Prior to 2022 | |||||
|---|---|---|---|---|---|
Drill Hole ID |
TD (m) |
Intersection |
Interval (m) |
Total Copper (%) |
|
From (m) |
To (m) |
|
|
||
Including |
80.0 |
106.0 |
26.0 |
1.54 |
|
AZ0722 |
271.2 |
119.0 |
155.0 |
36.0 |
0.99 |
AZ0724D |
278.2 |
124.0 |
160.0 |
36.0 |
0.79 |
AZ0729B |
226.9 |
130.0 |
214.0 |
84.0 |
0.73 |
Including |
172.0 |
204.0 |
32.0 |
0.94 |
|
AZ0730 |
342.6 |
123.0 |
323.8 |
200.8 |
0.89 |
Including |
140.0 |
253.0 |
113.0 |
1.04 |
|
AZ0832 |
420.0 |
80.0 |
140.0 |
60.0 |
0.78 |
AZ0833 |
387.8 |
73.0 |
313.0 |
240.0 |
0.94 |
AZ0837A |
541.0 |
326.0 |
516.0 |
190.0 |
0.82 |
AZ0841 |
400.2 |
241.0 |
285.0 |
44.0 |
1.83 |
AZ0843 |
176.0 |
67.0 |
131.0 |
64.0 |
0.69 |
AZ0946 |
469.4 |
110.0 |
469.4 |
359.4 |
0.63 |
Including |
115.0 |
260.0 |
145.0 |
1.08 |
|
AZ1047 |
493.1 |
74.0 |
493.1 |
419.1 |
0.50 |
Including |
102.0 |
182.0 |
80.0 |
0.92 |
|
AZ1048 |
466.1 |
105.0 |
466.1 |
361.1 |
0.77 |
Including |
123.0 |
339.0 |
216.0 |
1.01 |
|
AZ1049 |
491.2 |
62.0 |
491.2 |
429.2 |
0.75 |
Including |
62.0 |
298.0 |
236.0 |
1.05 |
|
AZ1050 |
408.5 |
94.0 |
408.5 |
314.5 |
0.30 |
Including |
94.0 |
132.0 |
38.0 |
0.68 |
|
620.2 |
69.0 |
620.2 |
551.2 |
0.35 |
|
Table 7.2: Examples of Significant Drilling Results Prior to 2022 | |||||
|---|---|---|---|---|---|
Drill Hole ID |
TD (m) |
Intersection |
Interval (m) |
Total Copper (%) |
|
From (m) |
To (m) |
|
|
||
AZ1051 |
|||||
Including |
363.5 |
426.0 |
62.5 |
1.12 |
|
AZ1052 |
425.0 |
103.0 |
425.0 |
322.0 |
0.42 |
AZ1053A |
650.0 |
48.9 |
650.0 |
601.1 |
0.54 |
Including |
122.0 |
230.0 |
108.0 |
1.03 |
|
AZ1055 |
408.5 |
116.0 |
408.5 |
292.5 |
0.55 |
AZ1056 |
295.3 |
70.0 |
295.3 |
225.3 |
0.47 |
Including |
192.0 |
223.0 |
31.0 |
0.88 |
|
AZ1057 |
503.6 |
173.0 |
503.6 |
330.6 |
0.43 |
Including |
173.0 |
225.0 |
52.0 |
0.84 |
|
Including |
255.0 |
293.0 |
38.0 |
0.83 |
|
AZ1058 |
451.8 |
70.0 |
451.8 |
381.8 |
0.52 |
Including |
96.0 |
181.0 |
85.0 |
0.99 |
|
AZ1059 |
656.4 |
88.0 |
656.4 |
568.4 |
0.47 |
Including |
330.0 |
404.0 |
74.0 |
0.90 |
|
AZ1060A |
402.5 |
116.0 |
402.5 |
286.5 |
0.50 |
Including |
130.0 |
170.0 |
40.0 |
0.69 |
|
AZ1061A |
293.4 |
71.0 |
293.4 |
222.4 |
0.90 |
Including |
71.0 |
250.0 |
179.0 |
1.04 |
|
AZ1062 |
280.0 |
130.0 |
280.0 |
150.0 |
0.64 |
Including |
130.0 |
248.0 |
118.0 |
0.70 |
|
AZ1063 |
427.1 |
94.0 |
427.1 |
333.1 |
0.72 |
Including |
94.0 |
232.0 |
138.0 |
0.81 |
|
Table 7.2: Examples of Significant Drilling Results Prior to 2022 | |||||
|---|---|---|---|---|---|
Drill Hole ID |
TD (m) |
Intersection |
Interval (m) |
Total Copper (%) |
|
From (m) |
To (m) |
|
|
||
AZ1064 |
170.1 |
136.0 |
170.1 |
34.1 |
0.47 |
AZ1064A |
404.4 |
120.0 |
248.0 |
128.0 |
0.75 |
And |
|
248.0 |
404.4 |
156.4 |
0.39 |
AZ 1168 |
569.3 |
148.0 |
569.3 |
421.3 |
0.66 |
AZ 1169 |
315.8 |
86.0 |
315.8 |
229.8 |
0.36 |
AZ 1170 |
349.3 |
112.0 |
349.3 |
237.3 |
0.63 |
AZ 1175 |
355.2 |
74.0 |
340.0 |
266.0 |
0.22 |
And |
340.0 |
355.2 |
15.2 |
0.72 |
|
AZ 1176 |
393.4 |
162.0 |
292.0 |
130.0 |
0.63 |
T-01B |
656.0 |
80.0 |
192.0 |
112.0 |
0.38 |
And |
387.0 |
656.0 |
269.0 |
0.50 |
|
AZ 1279 |
622.7 |
272.0 |
456.0 |
184.0 |
0.38 |
And |
456.0 |
622.7 |
166.7 |
0.71 |
|
AZ 1282 |
482.1 |
309.5 |
314.0 |
4.5 |
2.60 |
AZ 1289 |
367.0 |
220.0 |
367.0 |
147.0 |
0.44 |
AZ 1291 |
890.5 |
72.0 |
232.0 |
160.0 |
0.61 |
And |
562.0 |
790.0 |
228.0 |
0.40 |
|
And |
790.0 |
890.5 |
100.5 |
0.71 |
|
AZ 1294 |
861.9 |
62.2 |
74.0 |
11.8 |
0.53 |
And |
252.0 |
861.9 |
609.9 |
0.47 |
|
AZ 1295 |
1044.5 |
422.0 |
1044.5 |
622.5 |
0.51 |
Including |
580.0 |
618.0 |
38.0 |
1.07 |
|
Including |
720.0 |
744.0 |
24.0 |
1.16 |
|
Table 7.2: Examples of Significant Drilling Results Prior to 2022 | |||||
|---|---|---|---|---|---|
Drill Hole ID |
TD (m) |
Intersection |
Interval (m) |
Total Copper (%) |
|
From (m) |
To (m) |
|
|
||
Including |
970.0 |
1044.5 |
74.5 |
0.61 |
|
AZ 1296 |
523.2 |
156.0 |
244.0 |
88.0 |
0.92 |
AZ 1297 |
980.8 |
276.0 |
690.0 |
414.0 |
0.50 |
Including |
436.0 |
490.0 |
54.0 |
1.07 |
|
AZ 1299 |
1074.6 |
78.0 |
94.0 |
16.0 |
0.55 |
And |
546.0 |
1074.6 |
528.6 |
0.44 |
|
AZ 12101 |
237.0 |
168.0 |
237.0 |
69.0 |
0.87 |
AZ 12114 |
814.5 |
224.0 |
374.0 |
150.0 |
0.70 |
Source:Minera Andes press releases dated May 5, 2004, May 31, 2007, November 14, 2007, April 16, 2008, June 6, 2008, March 8, 2010, June 21, 2010, and June 27, 2011, and McEwen press releases dated May 10, 2012, January 17, 2013, and March 28, 2013. TD = total depth
Table 7.3: Examples of Significant Copper, Gold and Silver Drilling Results From January 2022 to December 2023 | ||||||||
|---|---|---|---|---|---|---|---|---|
Hole-ID |
Predominant Mineral Zone |
From (m) |
To (m) |
Length (m) |
Cu% |
Au (g/t) |
Ag (g/t) |
Comment |
AZ22137A |
Enriched |
133.0 |
342.0 |
209.0 |
0.49 |
0.03 |
0.02 |
|
AZ22138 |
Total |
138.0 |
660.1 |
522.1 |
0.42 |
0.06 |
1.88 |
|
incl |
Enriched |
138.0 |
348.0 |
210.0 |
0.60 |
0.06 |
2.18 |
incl. 28m of 0.87% Cu in Enriched |
and |
Primary |
348.0 |
660.1 |
312.1 |
0.30 |
0.07 |
1.68 |
|
AZ22140 |
Enriched |
117.4 |
314.0 |
196.6 |
0.16 |
0.03 |
1.17 |
|
AZ22141 |
Total |
183.1 |
551.0 |
367.9 |
0.50 |
0.07 |
1.54 |
|
incl |
Enriched |
183.1 |
360.0 |
176.9 |
0.50 |
0.04 |
1.44 |
|
and |
Primary |
360.0 |
551.0 |
191.0 |
0.50 |
0.09 |
1.63 |
|
AZ22142 |
Total |
92.0 |
511.1 |
419.1 |
0.79 |
0.15 |
3.51 |
Incl. 32m of 1.11% Cu & |
incl |
Enriched |
92.0 |
278.0 |
186.0 |
0.93 |
0.10 |
3.54 |
104m of 1.00% Cu in Enriched |
Table 7.3: Examples of Significant Copper, Gold and Silver Drilling Results From January 2022 to December 2023 | ||||||||
|---|---|---|---|---|---|---|---|---|
Hole-ID |
Predominant Mineral Zone |
From (m) |
To (m) |
Length (m) |
Cu% |
Au (g/t) |
Ag (g/t) |
Comment |
and |
Primary |
278.0 |
511.1 |
233.1 |
0.67 |
0.20 |
3.48 |
46m of 1.59% Cu in Primary |
AZ22143 |
Total |
92.5 |
403.0 |
310.5 |
0.20 |
0.02 |
0.88 |
|
incl |
Enriched |
92.5 |
266.0 |
173.5 |
0.22 |
0.02 |
0.99 |
|
and |
Primary |
266.0 |
403.0 |
137.0 |
0.18 |
0.01 |
0.75 |
|
AZ22144 |
Total |
58.0 |
506.6 |
448.6 |
0.30 |
0.02 |
0.84 |
|
incl |
Enriched |
58.0 |
204.0 |
146.0 |
0.31 |
0.01 |
0.52 |
|
and |
Primary |
204.0 |
506.6 |
302.6 |
0.29 |
0.02 |
1.00 |
incl 104.6m of 0.48% Cu |
AZ22145 |
Total |
76.0 |
257.0 |
181.0 |
0.18 |
0.02 |
1.90 |
|
incl |
Enriched |
76.0 |
194.0 |
118.0 |
0.16 |
0.03 |
2.25 |
|
and |
Primary |
194.0 |
257.0 |
63.0 |
0.21 |
0.01 |
1.26 |
|
AZ22146 |
Total |
91.0 |
421.5 |
330.5 |
0.83 |
0.11 |
2.30 |
|
incl |
Enriched |
91.0 |
394.0 |
303.0 |
0.86 |
0.11 |
2.26 |
incl. 103.4m of 1.31% Cu |
and |
Primary |
394.0 |
421.5 |
27.5 |
0.50 |
0.10 |
2.76 |
|
AZ22148 |
Total |
76.0 |
315.0 |
239.0 |
0.26 |
0.02 |
1.01 |
|
incl |
Enriched |
76.0 |
212.0 |
136.0 |
0.33 |
0.02 |
0.85 |
|
and |
Primary |
212.0 |
315.0 |
103.0 |
0.16 |
0.02 |
1.23 |
|
AZ22149 |
Total |
131.6 |
428.0 |
296.4 |
0.55 |
0.04 |
1.62 |
|
incl |
Enriched |
131.6 |
278.0 |
146.4 |
0.34 |
0.02 |
0.32 |
|
and |
Primary |
278.0 |
428.0 |
150.0 |
0.76 |
0.06 |
2.91 |
incl 54m of 1.38% Cu from 376m |
AZ22158 |
Enriched |
72.0 |
294.0 |
222.0 |
0.95 |
0.09 |
1.57 |
incl 44m of 1.38% Cu from 144m |
AZ22161 |
Enriched |
116.0 |
354.0 |
238.0 |
0.58 |
0.07 |
1.19 |
|
AZ22162 |
Enriched |
102.0 |
450.0 |
348.0 |
0.28 |
0.40 |
1.13 |
|
Table 7.3: Examples of Significant Copper, Gold and Silver Drilling Results From January 2022 to December 2023 | ||||||||
|---|---|---|---|---|---|---|---|---|
Hole-ID |
Predominant Mineral Zone |
From (m) |
To (m) |
Length (m) |
Cu% |
Au (g/t) |
Ag (g/t) |
Comment |
AZ22163 |
Enriched |
92.0 |
286.0 |
194.0 |
0.56 |
0.04 |
0.68 |
|
AZ22166 |
Enriched |
82.7 |
199.6 |
116.9 |
0.13 |
0.02 |
0.81 |
incl 53.6m of 0.25% Cu from 146m |
AZ22169 |
Total |
128.0 |
526.0 |
398.0 |
0.49 |
0.05 |
1.45 |
|
incl |
Enriched |
128.0 |
390.0 |
262.0 |
0.55 |
0.04 |
1.59 |
Incl. 74m of 0.93 % Cu |
and |
Primary |
390.0 |
526.0 |
136.0 |
0.36 |
0.05 |
1.19 |
Incl. 51m of 0.54 % Cu |
AZ22170 |
Total |
130.0 |
483.0 |
353.0 |
0.45 |
0.03 |
1.46 |
|
incl |
Enriched |
130.0 |
368.0 |
238.0 |
0.55 |
0.04 |
1.71 |
Incl. 28m of 1.14 % Cu |
and |
Primary |
368.0 |
483.0 |
115.0 |
0.24 |
0.02 |
0.94 |
|
AZ22171 |
Total |
94.0 |
470.2 |
376.2 |
0.51 |
0.04 |
1.41 |
|
incl |
Enriched |
94.0 |
435.0 |
341.0 |
0.53 |
0.03 |
1.37 |
Incl. 88m of 1.06 % Cu |
and |
Primary |
435.0 |
470.2 |
35.2 |
0.27 |
0.04 |
0.75 |
|
AZ22172 |
Total |
116.0 |
545.0 |
429.0 |
0.46 |
0.10 |
1.21 |
|
incl |
Enriched |
116.0 |
348.0 |
232.0 |
0.59 |
0.14 |
1.31 |
Incl. 32m of 1.19 % Cu |
and |
Primary |
348.0 |
545.0 |
197.0 |
0.31 |
0.06 |
1.09 |
|
AZ22173 |
Enriched |
94.0 |
331.2 |
237.2 |
1.05 |
0.09 |
1.19 |
Incl. 108m of 1.71 % Cu |
AZ22174 |
Total |
76.0 |
1128.0 |
1052.0 |
0.29 |
0.06 |
1.00 |
Incl. 480.0m of 0.42% Cu |
incl |
Enriched |
76.0 |
224.0 |
148.0 |
0.15 |
0.01 |
0.65 |
|
and |
Primary |
224.0 |
1128.0 |
904.0 |
0.31 |
0.06 |
1.05 |
Incl. 26.0m of 1.46% Cu |
AZ22175 |
Total |
70.0 |
274.0 |
204.0 |
0.72 |
0.05 |
1.17 |
|
incl |
Enriched |
70.0 |
260.0 |
190.0 |
0.80 |
0.06 |
1.30 |
Incl. 94m of 1.06 % Cu |
and |
Primary |
260.0 |
274.0 |
14.0 |
0.33 |
0.03 |
0.51 |
|
AZ22176 |
Total |
98.0 |
445.9 |
347.9 |
0.81 |
0.10 |
2.52 |
|
Table 7.3: Examples of Significant Copper, Gold and Silver Drilling Results From January 2022 to December 2023 | ||||||||
|---|---|---|---|---|---|---|---|---|
Hole-ID |
Predominant Mineral Zone |
From (m) |
To (m) |
Length (m) |
Cu% |
Au (g/t) |
Ag (g/t) |
Comment |
incl |
Enriched |
98.0 |
324.0 |
226.0 |
0.87 |
0.09 |
1.88 |
incl. 96m of 1.13 % Cu |
and |
Primary |
324.0 |
445.9 |
121.9 |
0.71 |
0.12 |
3.70 |
Incl. 56m of 0.89 % Cu |
AZ22177 |
Total |
102.0 |
413.0 |
311.0 |
0.48 |
0.05 |
1.04 |
|
incl |
Enriched |
102.0 |
334.0 |
232.0 |
0.51 |
0.04 |
0.92 |
Incl. 56m of 0.77 % Cu |
and |
Primary |
334.0 |
413.0 |
79.0 |
0.39 |
0.07 |
1.38 |
|
AZ22178 |
Total |
96.0 |
597.0 |
501.0 |
0.40 |
0.07 |
1.04 |
|
incl |
Enriched |
96.0 |
390.0 |
294.0 |
0.51 |
0.08 |
0.99 |
|
and |
Primary |
390.0 |
597.0 |
207.0 |
0.25 |
0.06 |
1.12 |
|
AZ22179 |
Total |
106.0 |
749.0 |
643.0 |
0.54 |
0.08 |
1.34 |
|
incl |
Enriched |
106.0 |
548.0 |
442.0 |
0.63 |
0.09 |
1.55 |
Incl. 96.0m of 1.13% Cu |
and |
Primary |
548.0 |
749.0 |
201.0 |
0.34 |
0.06 |
0.90 |
|
AZ22180 |
Total |
94.0 |
639.5 |
545.5 |
0.40 |
0.07 |
0.88 |
|
incl |
Enriched |
94.0 |
416.0 |
322.0 |
0.46 |
0.07 |
1.02 |
|
and |
Primary |
416.0 |
639.5 |
223.5 |
0.33 |
0.08 |
0.70 |
Incl. 46m of 0.51% Cu |
AZ22181 |
Total |
72.0 |
573.9 |
501.9 |
0.50 |
0.09 |
1.29 |
|
incl |
Enriched |
72.0 |
244.0 |
172.0 |
0.87 |
0.13 |
0.80 |
Incl. 52.0m of 1.46% Cu |
and |
Primary |
244.0 |
573.9 |
329.9 |
0.31 |
0.07 |
1.55 |
|
AZ22182A |
Total |
55.0 |
302.6 |
247.6 |
0.94 |
0.08 |
3.08 |
|
incl |
Enriched |
55.0 |
286.0 |
231.0 |
0.97 |
0.09 |
1.46 |
Incl. 188 m of 1.09% Cu |
and |
Primary |
286.0 |
302.6 |
16.6 |
0.55 |
0.03 |
25.57 |
Incl. 10 m of 0.71% Cu |
AZ22183 |
Total |
76.0 |
330.0 |
254.0 |
0.64 |
0.07 |
1.13 |
|
incl |
Enriched |
76.0 |
228.0 |
152.0 |
0.87 |
0.07 |
1.08 |
Incl. 54.0m of 1.18% Cu |
Table 7.3: Examples of Significant Copper, Gold and Silver Drilling Results From January 2022 to December 2023 | ||||||||
|---|---|---|---|---|---|---|---|---|
Hole-ID |
Predominant Mineral Zone |
From (m) |
To (m) |
Length (m) |
Cu% |
Au (g/t) |
Ag (g/t) |
Comment |
and |
Primary |
228.0 |
330.0 |
102.0 |
0.30 |
0.07 |
1.23 |
|
AZ22184A |
Total |
114.0 |
614.0 |
500.0 |
0.66 |
0.10 |
1.18 |
|
incl |
Enriched |
114.0 |
390.0 |
276.0 |
0.92 |
0.13 |
1.48 |
Incl. 76m of 1.40% Cu |
and |
Primary |
390.0 |
614.0 |
224.0 |
0.34 |
0.08 |
0.84 |
|
AZ22185 |
Enriched |
124.0 |
516.0 |
392.0 |
0.62 |
0.07 |
1.44 |
Incl. 72m of 1.32% Cu |
AZ22186 |
Enriched |
74.0 |
356.0 |
282.0 |
1.00 |
0.06 |
1.23 |
Incl. 172.0m of 1.40% Cu |
AZ22188 |
Total |
60.0 |
229.5 |
169.5 |
0.64 |
0.06 |
0.96 |
|
incl |
Enriched |
60.0 |
188.0 |
128.0 |
0.78 |
0.07 |
1.13 |
Incl. 26.0m of 1.34% Cu |
and |
Primary |
188.0 |
229.5 |
41.5 |
0.23 |
0.02 |
0.43 |
|
AZ23189 |
Enriched |
78.0 |
299.6 |
221.6 |
0.40 |
0.02 |
0.35 |
|
AZ23190 |
Enriched |
90.0 |
305.4 |
215.4 |
0.39 |
0.02 |
0.47 |
Incl. 30m of 0.73% Cu |
AZ23191 |
Enriched |
70.0 |
306.0 |
236.0 |
1.39 |
0.19 |
2.58 |
Incl. 42.0m of 2.78% Cu |
AZ23192 |
Enriched |
102.0 |
310.0 |
208.0 |
0.24 |
0.02 |
0.36 |
|
AZ23193 |
Enriched |
108.0 |
448.7 |
340.7 |
0.34 |
0.03 |
1.39 |
|
AZ23194 |
Total |
96.0 |
307.0 |
211.0 |
0.45 |
0.03 |
0.84 |
|
incl |
Enriched |
96.0 |
300.0 |
204.0 |
0.46 |
0.03 |
0.82 |
Incl. 20m of 1.09% Cu |
and |
Primary |
300.0 |
307.0 |
7.0 |
0.24 |
0.07 |
1.64 |
|
AZ23196 |
Total |
60.0 |
610.0 |
550.0 |
0.50 |
0.05 |
1.38 |
|
incl |
Enriched |
60.0 |
546.0 |
486.0 |
0.52 |
0.06 |
1.38 |
Incl. 216 m of 0.72% Cu |
and |
Primary |
546.0 |
610.0 |
64.0 |
0.38 |
0.03 |
1.36 |
Incl. 26 m of 0.48% Cu |
AZ23197 |
Enriched |
72.0 |
358.0 |
286.0 |
0.30 |
0.01 |
0.33 |
Incl. 2 m of 1.66% Cu |
AZ23198 |
Enriched |
61.0 |
469.0 |
408.0 |
0.56 |
0.08 |
2.54 |
Incl. 176 m of 0.8% Cu |
Table 7.3: Examples of Significant Copper, Gold and Silver Drilling Results From January 2022 to December 2023 | ||||||||
|---|---|---|---|---|---|---|---|---|
Hole-ID |
Predominant Mineral Zone |
From (m) |
To (m) |
Length (m) |
Cu% |
Au (g/t) |
Ag (g/t) |
Comment |
GTK2212 |
Total |
74.0 |
477.0 |
403.0 |
0.29 |
0.02 |
0.77 |
|
incl |
Enriched |
74.0 |
178.0 |
104.0 |
0.71 |
0.04 |
1.59 |
|
GTK2313 |
Enriched |
69.0 |
434.0 |
365.0 |
0.30 |
0.01 |
0.34 |
Incl. 40.0m of 0.62% Cu |
GTK2314A |
Enriched |
95.0 |
142.8 |
47.8 |
0.09 |
0.01 |
0.25 |
|
GTK2314B |
Total |
90.0 |
489.0 |
399.0 |
0.10 |
0.01 |
0.46 |
|
incl |
Enriched |
90.0 |
204.0 |
114.0 |
0.13 |
0.01 |
0.44 |
|
and |
Primary |
204.0 |
489.0 |
285.0 |
0.09 |
0.01 |
0.46 |
|
GTK2315MET |
Total |
69.0 |
521.2 |
452.2 |
0.29 |
0.05 |
1.09 |
|
incl |
Enriched |
69.0 |
260.0 |
191.0 |
0.45 |
0.04 |
0.86 |
Incl. 76.0m of 0.70% Cu |
and |
Primary |
260.0 |
521.2 |
261.2 |
0.18 |
0.05 |
1.26 |
|
GTK2316MET |
Enriched |
94.0 |
319.1 |
225.1 |
0.38 |
0.02 |
0.88 |
Incl. 48.0m of 0.64% Cu |
GTK2317MET |
Enriched |
156.0 |
326.0 |
170.0 |
0.42 |
0.02 |
2.15 |
Incl. 58.0m of 0.49% Cu |
GTK2318 |
Total |
154.0 |
466.3 |
312.3 |
0.22 |
0.01 |
0.46 |
|
incl |
Enriched |
154.0 |
398.0 |
244.0 |
0.25 |
0.01 |
0.48 |
|
and |
Primary |
398.0 |
466.3 |
68.3 |
0.13 |
0.01 |
0.38 |
|
GTK2319 |
Enriched |
110.5 |
494.0 |
383.5 |
0.50 |
0.07 |
1.64 |
Incl. 120m of 0.67% Cu |
GTK2320 |
Enriched |
126.0 |
512.0 |
386.0 |
0.66 |
0.05 |
1.95 |
Incl. 196m of 0.99% Cu |
AZ23199MET |
Enriched |
100.0 |
271.0 |
171.0 |
0.80 |
0.06 |
1.56 |
Incl. 156.0m of 0.85% Cu |
AZ23200MET |
Enriched |
94.0 |
394.5 |
300.5 |
0.43 |
0.04 |
2.89 |
Incl. 172.0m of 0.59% Cu |
AZ23201 |
Total |
84.0 |
464.5 |
380.5 |
0.56 |
0.05 |
1.14 |
|
incl |
Enriched |
84.0 |
270.0 |
186.0 |
0.52 |
0.04 |
0.62 |
Incl. 78 m of 0.64% Cu |
and |
Primary |
270.0 |
464.5 |
194.5 |
0.59 |
0.07 |
1.64 |
Incl. 96 m of 0.82% Cu |
Table 7.3: Examples of Significant Copper, Gold and Silver Drilling Results From January 2022 to December 2023 | ||||||||
|---|---|---|---|---|---|---|---|---|
Hole-ID |
Predominant Mineral Zone |
From (m) |
To (m) |
Length (m) |
Cu% |
Au (g/t) |
Ag (g/t) |
Comment |
AZ23202 |
Total |
64.5 |
329.7 |
265.2 |
0.43 |
0.07 |
1.72 |
|
incl |
Enriched |
64.5 |
186.0 |
121.5 |
0.48 |
0.05 |
1.37 |
Incl. 98 m of 0.59% Cu |
and |
Primary |
186.0 |
329.7 |
143.7 |
0.38 |
0.08 |
2.01 |
Incl. 28 m of 0.52% Cu |
AZ23203 |
Enriched |
138.0 |
313.9 |
175.9 |
0.52 |
0.04 |
0.59 |
Incl. 98 m of 0.56% Cu |
AZ23204MET |
Total |
116.0 |
312.0 |
196.0 |
0.50 |
0.12 |
1.83 |
|
incl |
Enriched |
116.0 |
275.5 |
159.5 |
0.54 |
0.13 |
1.87 |
Incl. 38.0m of 1.01% Cu |
and |
Primary |
275.5 |
312.0 |
36.5 |
0.34 |
0.07 |
1.67 |
|
AZ23205MET |
Total |
105.0 |
374.7 |
269.7 |
0.73 |
0.08 |
1.77 |
|
incl |
Enriched |
105.0 |
362.0 |
257.0 |
0.76 |
0.09 |
1.94 |
|
and |
Primary |
362.0 |
374.7 |
12.7 |
0.28 |
0.05 |
1.30 |
|
AZ23207A |
Total |
74.0 |
591.0 |
517.0 |
0.43 |
0.14 |
1.71 |
|
incl |
Enriched |
74.0 |
496.0 |
422.0 |
0.47 |
0.16 |
1.85 |
Incl. 176 m of 0.55% Cu |
and |
Primary |
496.0 |
591.0 |
95.0 |
0.27 |
0.03 |
1.08 |
|
AZ23208 |
Total |
88.0 |
308.0 |
220.0 |
0.31 |
0.01 |
0.28 |
|
incl |
Enriched |
88.0 |
260.0 |
172.0 |
0.34 |
0.01 |
0.25 |
Incl. 106 m of 0.41% Cu |
AZ23210MET |
Total |
110.0 |
415.0 |
305.0 |
0.64 |
0.07 |
1.62 |
|
incl |
Enriched |
110.0 |
352.0 |
242.0 |
0.73 |
0.07 |
1.59 |
|
and |
Primary |
352.0 |
415.0 |
63.0 |
0.28 |
0.06 |
1.73 |
|
AZ23211A |
Total |
110.0 |
446.0 |
336.0 |
0.30 |
0.03 |
0.89 |
|
incl |
Enriched |
110.0 |
348.0 |
238.0 |
0.28 |
0.03 |
0.58 |
|
and |
Primary |
348.0 |
446.0 |
98.0 |
0.35 |
0.03 |
1.64 |
|
AZ23216 |
Total |
108.0 |
530.0 |
422.0 |
0.52 |
0.08 |
1.84 |
|
Table 7.3: Examples of Significant Copper, Gold and Silver Drilling Results From January 2022 to December 2023 | ||||||||
|---|---|---|---|---|---|---|---|---|
Hole-ID |
Predominant Mineral Zone |
From (m) |
To (m) |
Length (m) |
Cu% |
Au (g/t) |
Ag (g/t) |
Comment |
incl |
Enriched |
108.0 |
446.0 |
338.0 |
0.58 |
0.09 |
2.07 |
Incl. 48m of 0.90% Cu |
and |
Primary |
446.0 |
530.0 |
84.0 |
0.27 |
0.06 |
0.94 |
|
AZ23218 |
Total |
62.0 |
301.2 |
239.2 |
0.59 |
0.04 |
1.21 |
|
incl |
Enriched |
62.0 |
264.0 |
202.0 |
0.63 |
0.05 |
1.35 |
|
and |
Primary |
264.0 |
301.2 |
37.2 |
0.39 |
0.03 |
0.47 |
|
AZ23220 |
Enriched |
80.0 |
478.0 |
398.0 |
0.75 |
0.05 |
1.00 |
Incl. 124m of 1.43% Cu |
AZ23223MET |
Enriched |
142.0 |
376.0 |
234.0 |
0.40 |
0.03 |
0.52 |
Incl. 76.0m of 0.57% Cu |
AZ23225 |
Total |
60.0 |
900.7 |
840.7 |
0.24 |
0.03 |
1.74 |
|
incl |
Enriched |
60.0 |
206.0 |
146.0 |
0.32 |
0.06 |
2.06 |
Incl. 16m of 0.51% Cu |
and |
Primary |
206.0 |
900.7 |
694.7 |
0.22 |
0.03 |
1.7 |
|
AZ23226AMET |
Enriched |
90.0 |
275.3 |
185.3 |
0.47 |
0.03 |
0.91 |
Incl. 38.0m of 0.66% Cu |
AZ23227MET |
Total |
69.0 |
334.0 |
265.0 |
0.68 |
0.07 |
1.27 |
|
incl |
Enriched |
69.0 |
284.0 |
215.0 |
0.73 |
0.06 |
1.30 |
Incl. 137.0m of 0.80% Cu |
and |
Primary |
284.0 |
334.0 |
50.0 |
0.44 |
0.09 |
1.13 |
Incl. 22.0m of 0.65% Cu |
AZ23228MET |
Total |
170.0 |
616.0 |
446.0 |
0.63 |
0.07 |
3.58 |
|
incl |
Enriched |
170.0 |
430.0 |
260.0 |
0.72 |
0.07 |
4.18 |
Incl. 76.0m of 0.92% Cu |
and |
Primary |
430.0 |
616.0 |
186.0 |
0.49 |
0.07 |
2.74 |
Incl. 52.0m of 0.80% Cu |
AZ23229MET |
Enriched |
92.0 |
262.4 |
170.4 |
0.46 |
0.04 |
1.80 |
Incl. 76.4m of 0.52% Cu |
AZ23230MET |
Total |
104.0 |
438.2 |
334.2 |
0.59 |
0.06 |
3.66 |
|
incl |
Enriched |
104.0 |
354.0 |
250.0 |
0.68 |
0.06 |
3.67 |
Incl. 192.0m of 0.83% Cu |
and |
Primary |
354.0 |
438.2 |
84.2 |
0.31 |
0.07 |
3.61 |
|
AZ23231 |
Total |
48.0 |
701.0 |
653.0 |
0.10 |
0.01 |
0.59 |
|
Table 7.3: Examples of Significant Copper, Gold and Silver Drilling Results From January 2022 to December 2023 | ||||||||
|---|---|---|---|---|---|---|---|---|
Hole-ID |
Predominant Mineral Zone |
From (m) |
To (m) |
Length (m) |
Cu% |
Au (g/t) |
Ag (g/t) |
Comment |
incl |
Enriched |
48.0 |
288.0 |
240.0 |
0.07 |
0.01 |
0.84 |
|
and |
Primary |
288.0 |
701.0 |
413.0 |
0.12 |
0.01 |
0.44 |
|
AZ23232MET |
Total |
94.0 |
464.0 |
370.0 |
0.40 |
0.04 |
0.95 |
|
incl |
Enriched |
94.0 |
414.0 |
320.0 |
0.44 |
0.05 |
1.02 |
Incl. 76.0m of 0.58% Cu |
AZ23233 |
Total |
70.0 |
510.0 |
440.0 |
0.47 |
0.06 |
1.93 |
|
incl |
Enriched |
70.0 |
444.0 |
374.0 |
0.50 |
0.07 |
1.99 |
Incl. 2m of 2.07% Cu |
and |
Primary |
444.0 |
510.0 |
66.0 |
0.35 |
0.05 |
1.62 |
|
AZ23236 |
Total |
88.0 |
417.7 |
329.7 |
0.23 |
0.01 |
0.83 |
|
incl |
Enriched |
88.0 |
374.0 |
286.0 |
0.23 |
0.01 |
0.87 |
Incl. 12m of 0.56% Cu |
and |
Primary |
374.0 |
417.7 |
43.7 |
0.22 |
0.01 |
0.58 |
|
AZ23237 |
Total |
110.0 |
446.0 |
336.0 |
0.66 |
0.07 |
1.86 |
|
incl |
Enriched |
110.0 |
418.0 |
308.0 |
0.69 |
0.07 |
1.86 |
Incl. 142m of 0.82% Cu |
and |
Primary |
418.0 |
446.0 |
28.0 |
0.37 |
0.09 |
1.82 |
Incl. 10m of 0.44% Cu |
DWT-1 |
Total |
56.0 |
318.0 |
262.0 |
0.37 |
0.05 |
1.12 |
|
incl |
Enriched |
56.0 |
228.0 |
172.0 |
0.12 |
0.04 |
0.92 |
|
and |
Primary |
228.0 |
318.0 |
90.0 |
0.83 |
0.08 |
1.52 |
Incl. 48m of 1.32% Cu |
AZ23238 |
Enriched |
102.0 |
201.0 |
99.0 |
1.02 |
0.07 |
2.75 |
|
AZ23239 |
Enriched |
48.0 |
225.5 |
177.5 |
0.61 |
0.07 |
1.61 |
Incl. 86.0m of 0.76% Cu |
AZ23240 |
Enriched |
104.0 |
224.5 |
120.5 |
0.98 |
0.11 |
1.53 |
Incl. 112.5m of 1.04% Cu |
AZ23241 |
Total |
18.0 |
740.0 |
722.0 |
0.11 |
0.01 |
0.63 |
|
incl |
Enriched |
18.0 |
300.0 |
282.0 |
0.07 |
0.01 |
0.60 |
|
and |
Primary |
538.0 |
740.0 |
202.0 |
0.20 |
0.01 |
0.72 |
Incl. 12.0m of 0.44% Cu |
Table 7.3: Examples of Significant Copper, Gold and Silver Drilling Results From January 2022 to December 2023 | ||||||||
|---|---|---|---|---|---|---|---|---|
Hole-ID |
Predominant Mineral Zone |
From (m) |
To (m) |
Length (m) |
Cu% |
Au (g/t) |
Ag (g/t) |
Comment |
AZ23242 |
Enriched |
86.0 |
200.0 |
114.0 |
0.92 |
0.08 |
1.77 |
|
AZ23243 |
Enriched |
82.0 |
150.0 |
68.0 |
0.53 |
0.04 |
1.26 |
|
AZ23244A |
Enriched |
92.0 |
230.3 |
138.3 |
0.54 |
0.05 |
1.66 |
Incl. 112.0m of 0.63% Cu |
AZ23245 |
Enriched |
86.0 |
220.7 |
134.7 |
0.99 |
0.06 |
1.74 |
|
AZ23246 |
Enriched |
123.0 |
235.1 |
112.1 |
1.04 |
0.11 |
2.34 |
Incl. 81.1m of 1.15% Cu |
AZ23248 |
Enriched |
98.0 |
227.0 |
129.0 |
0.87 |
0.08 |
1.71 |
Incl. 93.0m of 1.02% Cu |
AZ23249 |
Enriched |
88.0 |
219.6 |
131.6 |
0.37 |
0.05 |
1.08 |
Incl. 52.0m of 0.46% Cu |
AZ23250 |
Enriched |
114.0 |
210.0 |
96.0 |
0.69 |
0.06 |
1.05 |
|
AZ23251 |
Total |
82.0 |
430.8 |
348.8 |
0.37 |
0.05 |
1.65 |
|
incl |
Enriched |
82.0 |
198.0 |
116.0 |
0.40 |
0.03 |
1.10 |
Incl. 40.0m of 0.67% Cu |
and |
Primary |
198.0 |
430.8 |
232.8 |
0.36 |
0.06 |
1.93 |
|
AZ23252 |
Enriched |
86.0 |
172.1 |
86.1 |
0.52 |
0.07 |
1.22 |
|
AZ23253 |
Enriched |
96.0 |
290.0 |
194.0 |
0.29 |
0.01 |
0.36 |
|
AZ23254 |
Enriched |
147.5 |
200.0 |
52.5 |
0.27 |
0.05 |
2.23 |
Incl. 18.5m of 0.57% Cu |
AZ23255 |
Enriched |
120.5 |
253.7 |
133.2 |
0.55 |
0.04 |
1.36 |
Incl. 64.0m of 0.74% Cu |
AZ23257 |
Enriched |
87.0 |
202.0 |
115.0 |
0.28 |
0.04 |
1.50 |
Incl. 24.0m of 0.60% Cu |
AZ23258A |
Total |
62.0 |
347.0 |
285.0 |
0.50 |
0.05 |
0.95 |
|
incl |
Enriched |
62.0 |
300.0 |
238.0 |
0.56 |
0.06 |
0.87 |
Incl. 142.0m of 0.63% Cu |
and |
Primary |
300.0 |
347.0 |
47.0 |
0.22 |
0.03 |
1.34 |
|
AZ23259MET |
Enriched |
115.0 |
334.0 |
219.0 |
0.48 |
0.02 |
0.96 |
Incl. 114.0m of 0.73% Cu |
AZ23260 |
Enriched |
102.0 |
313.0 |
211.0 |
0.40 |
0.03 |
1.05 |
Incl. 56.0m of 0.71% Cu |
AZ23261 |
Enriched |
98.0 |
299.0 |
201.0 |
0.40 |
0.03 |
0.74 |
Incl. 20.0m of 0.81% Cu |
Table 7.3: Examples of Significant Copper, Gold and Silver Drilling Results From January 2022 to December 2023 | ||||||||
|---|---|---|---|---|---|---|---|---|
Hole-ID |
Predominant Mineral Zone |
From (m) |
To (m) |
Length (m) |
Cu% |
Au (g/t) |
Ag (g/t) |
Comment |
AZ23262 |
Enriched |
98.0 |
191.0 |
93.0 |
0.45 |
0.07 |
0.79 |
Incl. 46.0m of 0.59% Cu |
AZ23263 |
Total |
170.0 |
318.5 |
148.5 |
0.59 |
0.09 |
2.26 |
|
incl |
Enriched |
170.0 |
282.0 |
112.0 |
0.64 |
0.07 |
1.77 |
|
and |
Primary |
282.0 |
318.5 |
36.5 |
0.47 |
0.14 |
3.77 |
|
AZ23264 |
Total |
78.5 |
276.0 |
197.5 |
0.63 |
0.10 |
2.91 |
|
incl |
Enriched |
78.5 |
268.0 |
189.5 |
0.64 |
0.10 |
2.93 |
Incl. 64.0m of 0.91% Cu |
and |
Primary |
268.0 |
276.0 |
8.0 |
0.32 |
0.10 |
2.47 |
|
AZ23265 |
Enriched |
150.2 |
281.0 |
130.8 |
0.48 |
0.06 |
1.05 |
Incl. 77.8m of 0.57% Cu |
AZ23267 |
Enriched |
66.0 |
218.0 |
152.0 |
0.51 |
0.06 |
0.79 |
Incl. 110m of 0.63% Cu |
AZ23269 |
Enriched |
122.0 |
222.5 |
100.5 |
0.55 |
0.05 |
1.66 |
|
AZ23271 |
Enriched |
192.0 |
390.0 |
198.0 |
0.16 |
0.01 |
0.58 |
|
AZ23273 |
Enriched |
64.0 |
289.0 |
225.0 |
0.50 |
0.08 |
1.37 |
Incl. 120m of 0.77% Cu |
AZ23274 |
Enriched |
72.0 |
207.4 |
135.4 |
0.81 |
0.06 |
2.24 |
|
AZ23275 |
Total |
60.0 |
216.5 |
156.5 |
0.91 |
0.08 |
1.44 |
|
incl |
Enriched |
60.0 |
208.0 |
148.0 |
0.93 |
0.08 |
1.44 |
Incl. 78m of 1.19% Cu |
and |
Primary |
208.0 |
216.5 |
8.5 |
0.63 |
0.07 |
1.43 |
|
AZ23276 |
Enriched |
104.0 |
209.8 |
105.8 |
0.38 |
0.05 |
1.21 |
Incl. 58m of 0.57% Cu |
AZ23277 |
Total |
94.0 |
476.5 |
382.5 |
0.54 |
0.10 |
2.33 |
|
incl |
Enriched |
94.0 |
400.0 |
306.0 |
0.61 |
0.11 |
2.62 |
Incl. 74m of 0.86% Cu |
and |
Primary |
400.0 |
476.5 |
76.5 |
0.25 |
0.06 |
1.20 |
|
AZ23279 |
Enriched |
55.8 |
192.5 |
136.7 |
0.41 |
0.06 |
2.50 |
|
AZ23280 |
Enriched |
34.0 |
485.5 |
451.5 |
0.33 |
0.05 |
1.72 |
Incl. 80m of 0.56% Cu |
Table 7.3: Examples of Significant Copper, Gold and Silver Drilling Results From January 2022 to December 2023 | ||||||||
|---|---|---|---|---|---|---|---|---|
Hole-ID |
Predominant Mineral Zone |
From (m) |
To (m) |
Length (m) |
Cu% |
Au (g/t) |
Ag (g/t) |
Comment |
AZ23283 |
Enriched |
165.0 |
342.5 |
177.5 |
0.70 |
0.06 |
1.82 |
Incl. 112m of 0.91% Cu |
AZ23284 |
Total |
55.3 |
264.8 |
209.5 |
0.52 |
0.11 |
1.37 |
|
incl |
Enriched |
55.3 |
236.0 |
180.7 |
0.54 |
0.11 |
1.36 |
Incl. 112m of 0.67% Cu |
and |
Primary |
236.0 |
264.8 |
28.8 |
0.44 |
0.09 |
1.46 |
|
AZ23289 |
Enriched |
152.0 |
278.0 |
126.0 |
0.73 |
0.06 |
2.76 |
|
AZ23290 |
Enriched |
136.0 |
260.1 |
124.1 |
0.53 |
0.05 |
1.63 |
|
AZ23291 |
Enriched |
102.0 |
241.5 |
139.5 |
0.67 |
0.06 |
3.26 |
Incl. 60m of 0.89% Cu |
AZ23292 |
Enriched |
114.0 |
460.0 |
346.0 |
0.77 |
0.10 |
2.09 |
Incl. 232m of 0.86% Cu |
AZ23293 |
Total |
73.0 |
382.7 |
309.7 |
0.28 |
0.03 |
1.99 |
|
incl |
Enriched |
73.0 |
218.0 |
145.0 |
0.38 |
0.06 |
3.57 |
Incl. 56m of 0.66% Cu |
AZ23294 |
Enriched |
90.0 |
218.0 |
128.0 |
0.41 |
0.15 |
6.78 |
Incl. 16m of 0.74% Cu |
AZ23297A |
Enriched |
74.0 |
360.5 |
286.5 |
0.42 |
0.05 |
1.35 |
Incl. 26m of 0.73% Cu |
AZ23298 |
Total |
294.0 |
600.5 |
306.5 |
0.16 |
0.03 |
1.29 |
|
incl |
Enriched |
294.0 |
396.0 |
102.0 |
0.20 |
0.03 |
0.66 |
|
and |
Primary |
396.0 |
600.5 |
204.5 |
0.15 |
0.03 |
1.61 |
|
AZ23299B |
Total |
94.0 |
310.0 |
216.0 |
0.21 |
0.25 |
1.41 |
|
incl |
Enriched |
94.0 |
254.0 |
160.0 |
0.24 |
0.31 |
1.71 |
|
AZ23300 |
Enriched |
102.0 |
241.0 |
139.0 |
1.01 |
0.08 |
2.43 |
|
AZ23301 |
Enriched |
188.0 |
398.0 |
210.0 |
0.18 |
0.02 |
0.81 |
|
AZ23303 |
Total |
106.0 |
285.0 |
179.0 |
0.53 |
0.05 |
5.48 |
|
incl |
Enriched |
106.0 |
234.0 |
128.0 |
0.62 |
0.07 |
7.16 |
Incl. 92m of 0.78% Cu |
and |
Primary |
234.0 |
285.0 |
51.0 |
0.31 |
0.01 |
1.27 |
|
Table 7.3: Examples of Significant Copper, Gold and Silver Drilling Results From January 2022 to December 2023 | ||||||||
|---|---|---|---|---|---|---|---|---|
Hole-ID |
Predominant Mineral Zone |
From (m) |
To (m) |
Length (m) |
Cu% |
Au (g/t) |
Ag (g/t) |
Comment |
AZ23304 |
Enriched |
134.0 |
387.5 |
253.5 |
0.17 |
0.02 |
0.58 |
|
AZ23306 |
Enriched |
172.0 |
476.0 |
304.0 |
0.45 |
0.05 |
1.34 |
|
AZ23307 |
Enriched |
134.0 |
184.8 |
50.8 |
0.18 |
0.03 |
0.52 |
|
AZ23309 |
Total |
88.0 |
299.0 |
211.0 |
0.45 |
0.03 |
1.13 |
|
incl |
Enriched |
88.0 |
266.0 |
178.0 |
0.49 |
0.03 |
1.22 |
Incl. 26m of 0.92% Cu |
AZ23310 |
Enriched |
74.0 |
369.6 |
295.6 |
0.20 |
0.03 |
0.83 |
|
AZ23311 |
Total |
94.0 |
513.0 |
419.0 |
0.40 |
0.03 |
1.12 |
|
incl |
Enriched |
94.0 |
276.0 |
182.0 |
0.39 |
0.01 |
0.38 |
Incl. 52m of 0.54% Cu |
and |
Primary |
276.0 |
513.0 |
237.0 |
0.40 |
0.04 |
1.69 |
Incl. 66m of 0.79% Cu |
AZ23312 |
Total |
114.0 |
212.5 |
98.5 |
0.36 |
0.02 |
0.50 |
|
incl |
Enriched |
114.0 |
194.0 |
80.0 |
0.41 |
0.02 |
0.55 |
Incl. 26m of 0.74% Cu |
AZ23314 |
Total |
102.0 |
316.5 |
214.5 |
0.64 |
0.06 |
1.10 |
|
incl |
Enriched |
102.0 |
300.0 |
198.0 |
0.66 |
0.06 |
1.12 |
Incl. 84m of 0.89% Cu |
AZ23315 |
Enriched |
72.0 |
206.4 |
134.4 |
0.32 |
0.10 |
1.84 |
Incl. 72.4m of 0.57% Cu |
Source:McEwen and McEwen Copper press releases dated 4th May 2022, 23rd June 2022, 4th August 2022, 26th January 2023, 6th March 2023, 5th April 2023, 5th May 2023, 12th July 2023, 1st August 2023, 26th February 2024 and 16th May 2024.
TRUE THICKNESS OF MINERALIZATION
Supergene mineralization forms a sub-horizontal zone measuring over 5 km north-south by 1.5 km west-east. It is underlain by hypogene mineralization that extends to depths greater than 1 km below surface. The sub-vertical geometry of key deposit lithologies and structural elements, coupled with predominantly vertically oriented drill holes prior to 2022, effectively represent the true thickness of mineral zones, but lacked effective constraints on temporal relationships impacting grade. The use of inclined drill holes for resource delineation drilling beginning with the 2022 campaign has served to improve the interpretation of the constraining sub-vertical geological elements.
ADEQUACY STATEMENT ON SECTION 7
The QP believes that the quantity and quality of the lithological, collar and downhole survey data collected during the exploration and infill drill programs completed at Los Azules are acceptable to support Mineral Resource estimation Sample preparation, analyses, and security
Introduction
Consulting firm CRM-SA LLC visited Los Azules from February 29th to March 8th, 2024, to review sample collection, processing, and assaying procedures as part of data verification and to satisfy the Qualified Person site visit requirement for resource estimation. The review covered drilling practices, sample location definition, sample collection, logging, chain of custody, and assaying. CRM visited three locations: the Los Azules project site, the sample preparation and storage area in Calingasta, and Alex Stewart International Laboratory in Mendoza. CRM concluded that geological sampling and logging meet industry’s best practices (CRM, 2024), consistent with Stantec’s 2023 IA review (Stantec, 2022).
CRM reviewed logging, sampling, and Quality Assurance/Quality Control (QA/QC) practices during drilling. Sampling adhered to industry standards. Standard reference material (SRM) was certified by Alex Stewart laboratory in Mendoza, using local source rocks. Initially, blank material was “barren” quartz mixed with a small portion of leached material for anonymity purposes and was not completely sterile. After 2008, a new blank material source was used. “Coarse” duplicates from quarter-core splits were taken in 2008. Coarse reject duplicates were included in subsequent programs.
From 2009 onward, blank assay results met acceptable limits with silica sand replacing previous blank material. In 2021/22, coarse quartz from Alex Stewart Labs replaced earlier blank samples. Since 2013, all crushing, pulverizing, and assaying have been conducted at Alex Stewart Labs in Mendoza, with historical work at other accredited labs in Argentina and Chile.
Laboratories utilized by McEwen have incorporated internal QC samples in each assay batch. Each certificate includes drill sample results, duplicates, blanks, and reference standards to monitor precision, instrument drift, and accuracy. Anomalous values are routinely re-assayed. Monitored laboratory accuracy and precision are more than sufficient to meet project goals and objectives.
Sampling methods
Since 1998, drilling at Los Azules has used reverse circulation (RC) and diamond core (core) methods. BMG (1998-1999) and MIM (2004, now Glencore) drilled RC holes, while since 2004, Minera Andes/McEwen have primarily used core drilling. 98% of holes in the resource estimate are diamond drill core holes. Logging procedures are detailed in Section 7.
After geotechnical and geological logging (including mark-up of sample locations on the core), core boxes are transferred to a photo booth for standardized wet and dry photography using fixed focal length and lighting (Figure 8.1). Each image is labelled by hole ID, box number, and depth interval (Figure 8.2) and stored digitally for reference.

Figure 8.1: Dedicated static photo booth for consistent photography of core (McEwen 2023)

Figure 8.2: An example of the labelling of core boxes for photography (McEwen 2023)
Once photographed, 40-48 core boxes are stacked on pallets in downhole order, secured with plastic wrap and strapping (Figure 8.3), and stored in a locked, security-sealed sea container before shipment to Calingasta’s core warehouse.
Twice-weekly shipments are tracked via Chain of Custody paperwork to ensure secure delivery. Upon arrival, deliveries are checked for integrity against the Chain of Custody records before unloading into the warehouse.
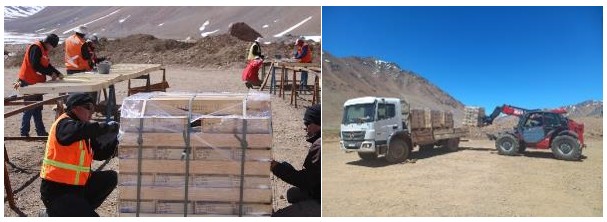
Figure 8.3: The securing and loading of the core boxes for shipment to Calingasta (McEwen 2023)
At the Calingasta facility, core is first processed using a GeoLOGr hyperspectral scanner (Figure 8.4), which captures short-wave infrared (SWIR) spectroscopy data to provide reflectance information. This information assists in the alteration model development for the 3D geological model described in Section 11. Two scanners were used, prioritizing freshly delivered core, with historical core scanned as time allowed. The scanner also takes high-resolution images for later correlation with hyperspectral data core logs. After scanning, core boxes are transferred via roller tables to the sample prep area.

Figure 8.4: The geoLOGr hyperspectral scanning unit (McEwen 2023)
McEwen staff use hydraulic guillotine splitters (Figure 8.5) to split intact core lengthwise, per the logging geologist instructions on the sampling sheet. Hydraulic splitters are used instead of diamond saws to prevent loss of sooty chalcocite from washing. Fractured or rubble-like core is divided with a trowel. Half of the core is retained in the box for future reference, while the sampled half is immediately placed in thick plastic bags labelled with unique ID codes and sealed with nylon zip ties. Three to seven samples are then placed in larger poly-woven bags, labelled, and secured with uniquely numbered tamper-proof security seals (Figure 8.5).

Figure 8.5: The hydraulic core splitter (McEwen 2025)
Sealed sample sacks are palletized and stored in a padlocked, security-sealed area (Figure 8.6) until weekly dispatch to the laboratory. CCTV and security lighting monitor the storage area. A detailed inventory of samples and security seals is maintained and checked against Chain of Custody paperwork when samples are dispatched and received.

Figure 8.6: Showing the sequence of bagging, tagging, sealing, and securing the samples for dispatch (McEwen 2023)
The secure and well-organized core facility ensures that Los Azules samples are appropriately handled, minimizing the potential for sample ID errors.
Sample Preparation and Analyses
Once bagged and dispatched from Calingasta, Alex Stewart International (ASI) manages all sample handling and preparation at their Mendoza laboratory. The security seals and sample inventory are verified upon arrival at the laboratory per Chain of Custody protocols.
ASI is independent of McEwen Copper and Andes Corporación Minera S.A.
ASI, accredited according to ISO 9001, 14001 and 17025 standards, provides geochemical, metallurgical, and analytical services to the global mining industry.
Sample preparation follows these steps:
Drying until the moisture content is within limits.
Crushing to 80% passing 2mm (10 mesh).
Splitting to obtain a 600g fraction, then pulverizing to 95% passing 105 microns (140 mesh).
Equipment cleaning with high-pressure air after every sample; granulometry tests conducted every 15 samples.
ASI performs the following assays:
Gold (Au4-30): Fire assay and AAS determination using a 30g sample.
Multi-element suite (ICP-AR 39): Aqua regia digestion; ICP-OES Radial determination.
Overlimit analysis (ICP-OES): 19-element ICP-OES Radial method.
Sequential Copper Analysis (LMC-140/Cu Sequential): Determines Acid Soluble Copper (CuAS), Cyanide Soluble Copper (CuCN), Residual Copper (CuRES), and Total Copper (CuT) via AAS.
Sequential copper determinations involve:
For acid-soluble copper, samples are subjected to a sequential leach to collect samples for cyanide-soluble copper (CuCN) and acid-soluble copper (CuAS).
Following leaching, residual copper (CuRES) in the sample (tails) is determined via a three-acid digestion and assay for total copper content.
Acid soluble and cyanide soluble assays are combined to determine soluble copper content (CuSOL) of each sample.
Total sequential copper is calculated from CuAS + CuCN + CuRES. This quantity can be compared with the direct (official) assay of total copper (CuT).
All four copper determinations (CuAS, CuCN, CuRES and CuT) are recorded in the drilling database, with final assay certificates electronically transmitted in Excel and PDF formats. If assays pass McEwen’s QA/QC protocols, they are entered into the Fusion (Datamine) database for interpretation, modelling, and resource estimation.
Since 2012, samples have been prepared and assayed at ASI Mendoza, with historical work conducted at ALS Chemex (Chile) and ACME Labs (Mendoza and Chile), all of which are ISO 9001:2000 certified.
A 2022-2023 re-assay program analyzed 159 drill holes (24,704 samples) using either remaining core, historical pulps, or rejects from Calingasta. The objectives for the reassaying program were to complete missing data, improve detection limits for deleterious elements (particularly arsenic), maintain consistent assay methodology using a single laboratory, and obtain sequential assay determinations for previously reported total copper grades.
In comparing the grades of re-assay and original assay pairs, the re-assay program found high bias for acid-soluble copper, suggesting oxidation in stored samples. Re-assayed CuAS data were excluded from the resource estimate.
For total copper (CuT), original samples from early sampling campaigns showed a minor bias (Figure 8.7) attributed to historical inter-laboratory variations.

Figure 8.7: Total Copper Assays vs Re-Assays (CRM 2023)
Cyanide soluble copper (CuCN) assays vs re-assays are shown in Figure 8.8. A strong correlation was observed for enriched zone samples (<4% high bias). For primary zone samples, poor correlation between the original and cyanide soluble re-assay values were observed.
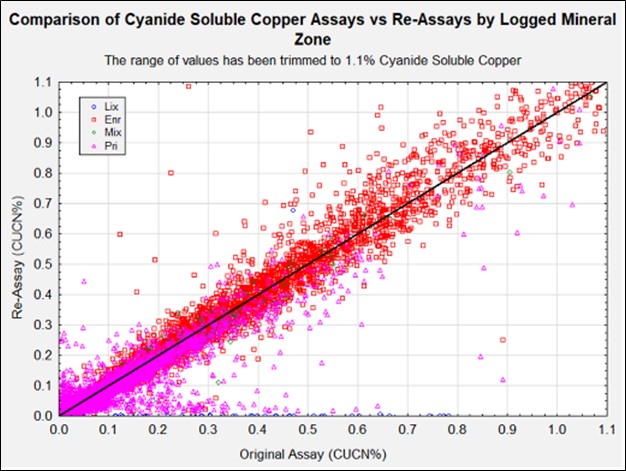
Figure 8.8: Cyanide Soluble Copper Assays vs Re-Assays (CRM 2023)
All available enriched zone samples lacking cyanide soluble copper grades were re-assayed. To avoid soluble-to-total copper ratio inconsistencies, re-assayed total and cyanide soluble grades were both used in the resource estimate.
QC Sample Insertion
Standards, blanks, and duplicates are inserted at regular intervals during bagging. In a sequence of forty samples, the following QC samples were inserted:
2 blanks
2 standards
1 duplicate
The density of QC samples is adequate for the current program.
ASI performs additional internal quality control checks, which are reported in the final certificates.
Chain of Custody
The custody chain process ensures that tampering or mix-ups are immediately evident upon sample arrival at the lab. Strict protocols ensure sample security from shipment through final analysis.
The Fusion database is protected by read/write permissions to prevent unauthorized access and regular back-ups.
control samples
Control samples include blanks, duplicates and standard reference materials (SRMs) to monitor contamination, precision and accuracy. These are inserted at regular intervals during sample bagging to ensure data integrity.
Standard Reference Materials (Standards)
Since 2007, SRMs were prepared from coarse rejects. Color was added to blanks using leached material for anonymity in sample sequences. Six SRMs were prepared with distinct copper and gold contents shown in Table 8.1.
Table 8.1: Sample Control Standards (2007-2008) | ||
Sample |
Total Cu% |
Au (ppm) |
STD B |
0.0047 |
0.0500 |
STD 01 |
0.1096 |
0.0470 |
STD 03 |
0.3135 |
0.0330 |
STD 06 |
0.5300 |
0.0260 |
STD 08 |
0.8830 |
0.0680 |
STD 20 |
1.9540 |
0.0670 |
Note: Values were obtained from statistical analysis received from Alex Stewart
For the 2009-2010 programs, Alex Stewart prepared standard material. Gold values were unreliable due to low concentration and detection limit effects, so gold standards were not used.
For the 2011 - 2022 programs, standard reference materials were prepared and certified by Acme Laboratories as shown in Table 8.2. The gold values were again affected by detection limit effects and were not used as SRM.
Table 8.2: Sample Control Standards (2011-2022) | ||
Sample |
Total Cu% |
Au (ppm) |
STD 01 |
0.101 |
0.014 |
STD 03 |
0.278 |
0.039 |
STD 10 |
1.030 |
0.059 |
Note: Values were obtained from statistical analysis received from Acme.
For the 2023 - 2025 field seasons, three Certified Reference Materials were purchased from OREAS, an accredited Reference Material Producer under ISO 17034. These new CRMs largely replaced the standard reference materials used previously. The expected, or certified, values are listed in Table 11.3.
Table 8.3: Sample Control Standards (2023-2024) | ||
Sample |
Total Cu% |
Au (ppm) |
501D |
0.272 |
0.232 |
504D |
1.10 |
1.46 |
507 |
0.622 |
0.176 |
The standard values largely cover the range of expected assay values.
Control Sample Performance
SRM performance is monitored using diagnostic charts, where outliers beyond ±3 standard deviations (SD) can be identified. Control charts monitor the consistency of performance at the lab, where 90% of the results must fall within ±10% of the mean value of the assays for the process to be “in control.”
McEwen consistently and routinely monitors the QC results received from the lab to ensure that outliers are identified as soon as possible. Outliers in a batch or distinct period will be flagged for re-assaying, with a bracket of 10 samples on either side of the standard resubmitted for repeat assays until the QC results are satisfactory.
Quality control data for sample collection campaigns prior to 2023 showed no deficiencies. This data is summarized in the 2023 IA report (McEwen, 2023). The results presented here focus on the 2023/2024 field program.
Copper plots for the 2023/2024 sampling program are presented in the below figures.

Figure 8.9: Diagnostic Charts for Standards Used at Los Azules 2023-2024, Standard 501d (McEwen 2025)

Figure 8.10: Diagnostic Charts for Standards Used at Los Azules 2023-2024, Standard 504d (McEwen 2025)

Figure 8.11: Diagnostic Charts for Standards Used at Los Azules 2023-2024, Standard 507 (McEwen 2025)
The expected assay value for a standard appears as a solid black horizontal line (middle line). Dashed lines above and below indicate ± 1,2, or 3 SD away from the expected value. The 2023/2024 results show no outliers beyond the 3 SD range.
To smooth the data and allow evaluation of laboratory drift over time, a 9-sample moving average is computed and smoothed (red lines). These lines show that the laboratory consistently reported low results before April 15, 2024, and slightly higher results later in the program. These small deviations (< 5%) compensated over time, maintaining long-term accuracy.
A bias check compared average quantifications with best values for all three standards. The regression line has a slope near one and an intercept near 0, confirming no systematic bias in laboratory assays (Figure 8.12).

Figure 8.12: Cu. Average of Std quantifications vs Best Value (McEwen 2025)
Duplicate Sample Performance
Duplicate samples check for assay precision by comparing two analyses of the same sample. Both coarse reject and pulp duplicates were analyzed, with precision failures flagged when relative differences exceeded 10%. Each duplicate pair’s relative difference was calculated, and the proportion of failures was tracked to ensure acceptable precision.

Figure 8.13: Coarse duplicate scatterplot 2023-2024 (McEwen 2025)

Figure 8.14: Pulp Duplicate Scatterplot 2023-2024 (McEwen 2025)
For coarse duplicates, the failure rate (relative absolute difference > 10%) was 0.77% (4 failures for 520 duplicates). For pulp duplicates, the failure rate was 0.47% (3 failures for 642 duplicates). These low failure rates show that laboratory precision is more than acceptable.
Blank Sample Performance
Blanks test for cross-contamination, particularly for gold. Scatterplots compared blank grades with the preceding sample to detect any possible contamination. Positive correlation between the grades of the blank and the previously analyzed sample is evidence of cross-contamination between samples (Figure 8.15).
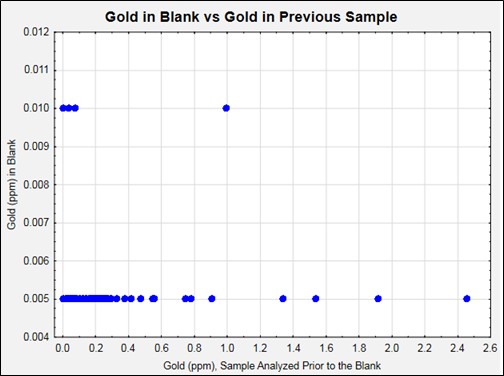
Figure 8.15: Gold in Blank vs Gold in Previous Sample (McEwen 2025)
Conclusions
In the opinion of the QP/QPs, the analysis of control samples confirms that copper and gold assay processes are under sufficient control, ensuring reliable data for resource estimation and reporting of drill hole results.
The Los Azules sampling and assaying program adheres to industry’s best practices, producing accurate and precise assay data. The control sample performance demonstrates that the assay results are trustworthy for resource estimation and suitable for disclosure on a drill hole-by-hole basis.
Data Verification
From February 29 to March 8, 2024, CRM-SA LLC conducted a site visit to the Los Azules project to observe and verify the sample collection, processing, and assaying procedures. The visit addressed data verification and site visit requirements for a Qualified Person (QP) responsible for resource estimation.
The primary objective of the visit was to evaluate key aspects of the drilling practices and sampling process, including:
Drilling practices
Sample location definition
Sample collection and logging
Chain of custody procedures
Assay protocols and laboratory quality control
To ensure a comprehensive assessment, the following locations were visited:
Los Azules project site
Drilling site
Core logging compound
Calingasta Sample Preparation and Storage Area
Alex Stewart International Laboratory in Mendoza
This verification process was conducted to confirm the accuracy and reliability of the data used in the resource estimation and to ensure that the industry’s best practices and regulatory standards were followed throughout the sampling and assaying workflow.
DRILL SITE INSPECTION, LOS AZULES
The Los Azules deposit is located at an elevation of 3,600 m in the Andes Mountains. Areas reviewed at the project were the drilling, sample collection, and geological logging.
Drilling Coordination and Oversight
During the site visit, there were 22 active drill rigs. Given the level of effort, organization, and coordination required for up to 7 drilling contractors, the drilling activities were a major undertaking and an important part of the review. The drilling coordination center was visited, and the systems for allocating drillholes to rigs, tracking performance through hourly communication, and ensuring that consumables were available at each rig. Daily coordination meetings among the drilling companies are held to discuss and resolve production and safety issues. The drill rig progress chart showing production per day and cumulative production, as well as the drillhole collar location map showing the current location of the various rigs, are shown in Figure 9.1.

Figure 9.1: Rig location tracking system (McEwen 2025)
Drill Site Observations
Core recovery and sample collection at an ongoing drill site was observed. An ACMSA rig geologist explained the procedure of placing the sample blocks and measuring the recovered length. No issues were detected.
Drill Hole Coordination and Collar Surveying
Each drill site is overseen by a McEwen Drill Hole Coordinator, responsible for:
Monitoring drilling operations,
Measuring core recovery upon extraction,
Placing the core into core boxes with hole ID and drill intervals, and
Preparing cores for transport to the logging area.
Collar Surveying and Monumentation
Considerable care is taken to ensure drill collar locations and drill site preparations are completed on a timely basis. A series of three surveyed and flagged stakes were set up in groups to indicate the azimuth of the proposed hole. The actual collar location is marked with a flagged and labelled stake that shows the hole number, azimuth, and dip.
The process of staking and surveying the hole collar was observed (Figure 9.2). After preparing the drilling platform, a small pile of rocks is created. A pre-labeled stake is placed, and the coordinates of the stake are surveyed. The hole ID and coordinates are digitally recorded. After the hole is completed, a permanent monument is created, and the final coordinates of the hole are determined. Since the hole ID and approximate (within 2m) collar location are defined before the start of drilling, mix-ups in the hole ID do not appear possible.

Figure 9.2: Stake and initial collar coordinates for hole IND59 (McEwen 2025)
CORE LOGGING COMPOUND
Core is logged near the Los Azules camp. Core is delivered from the drill site and is sorted and stacked by drill hole. When the entire hole is available, it is laid out on tables for logging.
Core Logging Process
Geologists perform detailed logging of each drill hole, recording:
Lithology
Mineralogy
Alteration
Visible proportion of copper minerals
Structural features
Additionally, sample intervals are selected for density testing and Rock Quality Designation (RQD). Point Load and Schmidt hammer tests were not observed during the visit. Following logging, core samples are photographed (both dry and wet) to document core appearance, and sample blocks are painted red and nailed to the core box to prevent movement during shipment.
Observations and Assessment
The entire process, from sample collection at the rig through core logging and preparation of the sample for shipment to Calingasta, is well-organized and efficient. No areas for improvement were noted.
CALINGASTA SAMPLE PREPARATION AND STORAGE AREA
The Calingasta sample preparation and storage facility is located approximately two hours west of San Juan and four hours east of the Project site. It serves as the primary hub for sample processing, including core scanning, splitting, storage, and shipment for assay analysis.
Reception and storage
Whole core, in labeled core boxes, arrives at Calingasta from the Los Azules project. The boxes are stacked on a pallet, which is wrapped in plastic and secured with steel strapping. The total number of pallets is checked against the shipping inventory. Bar codes are not used. After unpacking, boxes are stacked in designated areas in the open air. When rain is a possibility, the boxes are covered with plastic.
Sample Bagging and Security
Once samples are split and placed in trays, they are bagged, labeled both externally and internally, and tightly sealed with a zip strip. Each sample bag is labeled along the seal, and a labeled paper is placed inside for identification. Figure 9.3.

Figure 9.3: Bagged Samples (McEwen 2025)
Prior to shipment the bagged samples are stored in a locked container. An anti-tamper strip is attached to the door.
Core Retention and Storage
After logging, the core is returned to labeled boxes and moved to the new core storage area. Some core boxes are empty because samples were used for metallurgical testing. While not a fatal flaw, industry standards (CIM guidance, 2018) recommend that geological staff retain justification for core removal and develop a Core Retention Plan, documenting core usage decisions.
ALEX STEWART ASSAY LAB, MENDOZA
Alex Stewart International Laboratories (ASi) in Mendoza was visited on February 29th, 2024. CRM-SA LLC had a detailed discussion with Federico Henriquez, the Laboratory Manager, and his staff, plus a tour of all the steps in processing and analyzing the Los Azules samples.
Samples Reception and Security
Samples arrive from Calingasta on numbered pallets. The number of pallets shipped is communicated to ASi, and a manual check is made. Many operations utilize a barcode system to identify each pallet accurately. This type of system should be considered. Samples are unloaded and placed on the ground in a staging area in numerical order (Figure 9.4). The staging area is under cover and located in a fenced, guarded yard.

Figure 9.4: Sample Bags on Pallet (L) and Sample After Ordering (R) (McEwen 2025)
GLOBAL DATABASE MANAGER, DATABASE CURATOR & EXPLORATION MANAGER, SAN JUAN
Discussions with the Global Database Manager, Database Curator, and Exploration Manager included:
Historical logging interpretations and their impact on the geologic model.
Presentation of drilling results.
Effects of Dr. Richard Sillitoe’s 2014 site visit on interpretive work.
Use of multiple assay labs and the evolution of QA/QC protocols.
Findings from an initial database audit conducted by MTS.
Ongoing topographic surveys and discussions on the various national grid systems used.
The key takeaways are that historical logging discrepancies have been addressed through re-logging efforts and that database integrity has improved with the implementation of structured QA/QC processes.
geological modelling
The drill hole database used in geological modeling and subsequent mineral resource estimation consists of historical information and drill hole data collected by the Issuer.
The historical drill data were presented as a series of .csv data tables, which were imported into an MS Access database for review and verification. The drill hole data was then loaded into Leapfrog Geo software which provides standard checks for drill data integrity, considering a sequential ‘from’ and ‘to’ for the interval tables, the end of hole detailed in the collar table matching those in the interval tables, duplication of data, and checks for erroneous readings in survey deviation. There were no errors found in the historical drill hole data tables.
The drill hole data from the current drilling campaign was captured on site using Excel data sheets, which were then validated upon import into a Fusion X SQL data management system, ensuring the integrity of the data captured during the logging process. The assay data certificates were loaded directly into the database, importing the information contained therein in its entirety without any manual editing. The database manages assay data, utilizing a series of rules and profiles designed to export assay data from the optimal analytical method and convert any values below the detection limit to numeric data. The data tables, Collar, Survey, Lithology, Assay, Alteration, Mineralization, and Structure were extracted as a series of .csv files with their table structures set up for direct import in the Leapfrog Geo modelling platform. These data were combined with historical data, checked for drill hole data integrity, and presented as error-free data for use in geological modeling.
conclusions
In the opinion of the QP/QPs, the results of the data verification indicate that the database is sound and reliable for resource estimation. The key findings from reviewing the geological model are that the modelling workflow is robust, with detailed validation steps in place.
Mineral Processing and Metallurgical Testing
introduction
The metallurgical development of Los Azules feasibility was completed in three phases. The initial work completed the test work program outlined in the 2023 IA and is identified as the Phase 1 metallurgical testing program. The Phase 2 metallurgical test program utilized samples from the 2021-2022 exploration campaigns to grow the variability testing database from Phase 1 and expand the geometallurgical testing data set to include lithologic domains. The Phase 3 metallurgical test program utilized the 2022-2023 exploration campaigns to acquire metallurgical core samples to validate scale-up from the baseline 3-meter columns to the planned 9-m bench height of the heap leach pad and confirm extraction within the test programs. The Phase 3 master composites were built by lithologic domain and were pulled from within the pit shell for the first 5 years of operation. Cancha software was utilized to pick available drill hole intervals to create bulk master composites for the lithologic domains within the 5-year pit shell. Additional samples were collected from the 2023-2024 exploration campaign from holes drilled through vertically the vegas in zone of the deposit.
The 2022-2023 exploration campaigns conducted over two drilling seasons required extensive sample preparation resources to prepare all drill hole intervals for resource assays and then prepare sample for metallurgical testing. Drill core was sent to SGS and to ASMIN laboratories in Santiago, Chile. SGS was utilized for Phase 2 testwork and ASMIN for Phase 3 testwork. Both laboratories are reputable testing facilities with experience in the types of tests conducted for the Los Azules process scheme.
Results from the current metallurgical testwork program phases and analysis of the results for the feasibility study are contained in the following subsections.
historical testwork summary
The prior metallurgical work completed for the Los Azules project and reported in earlier Technical Reports. Historical testing for McEwen Copper (McEwen) was conducted on samples from the resource in several phases. C. H. Plenge Laboratory (Plenge) in Lima, Peru, performed several scoping level investigations from 2008 to 2012 to support a Preliminary Economic Assessment (PEA) by Samuel Engineering in 2009, 2010, and 2013. Additional samples from the resource were tested at the SGS Research Limited (SGS) to support a Preliminary Economic Assessment (PEA) by Hatch in 2017. A mineral liberation analysis (MLA) was completed at Thompson Creek Metals Company in Challis, Idaho; in 2012 on rougher flotation samples from the Plenge lock-cycle testing.
The historical work completed at both Plenge and SGS concentrated on evaluating sulfide resource processing options including flotation, pressure oxidation (POX) of flotation concentrate, and column leaching. The evaluation of the historical data in the PEA in 2009 and 2010 resulted in the selection of a flotation process to produce a copper concentrate. In 2013, a change in the PEA concepts resulted in a flotation concentrate being treated by a POX leach circuit and solvent extraction/electrowinning (SX/EW) to produce copper metal cathodes.
A summary of these programs and results were included in the 2023 IA for the Los Azules project and are not repeated here. The outcome of the 2023 IA was to pursue a bio-heap leach processing strategy at Los Azules and Phase 1 of the testing program was initiated on that basis to support that report.
A summary of the historical metallurgical test work conducted at Los Azules is presented in Table 10.1.
Table 10.1: Historical metallurgical test work programs | |||
Year/Period |
Institution/Laboratory |
Type of Study/Technique |
Main Objective/Outcome |
2008 – 2012 |
C.H. Plenge Laboratory (Lima, Peru) |
Scoping-level metallurgical investigations |
Supported PEAs by Samuel Engineering (2009, 2010, 2013). Included flotation, POX, and column leaching. |
2012 |
Thompson Creek Metals Company (Challis, Idaho) |
Mineral Liberation Analysis (MLA) on rougher flotation samples (Plenge lock-cycle testing) |
Detailed mineralogical characterization of flotation concentrates. |
2013 |
PEA by Samuel Engineering |
Conceptual change: flotation + POX circuit + SX/EW |
Objective: produce copper cathodes instead of concentrate only. |
2017 |
SGS Research Limited (SGS) |
Additional testing on resource samples |
Supported Hatch PEA (2017). Evaluated alternative sulfide processing routes. |
2023 |
Los Azules PEA/IA Technical Reports |
Synthesis of prior programs (Plenge, SGS, Hatch, Samuel) |
Defined bio-heap leach strategy. Phase 1 of the testing program initiated to support this approach. |
PHASE 1 METALLURGICAL TESTWORK RESULTS
Samuel Engineering prepared a Technical Report IA for Los Azules, effective date of 5/9/2023. Full detail of the testwork program can be reviewed in the previous technical report. Tables containing the finalized mass balanced column results are included for review. The column test series with a crush size of P100 -19mm is included in Table 10.2. The column test series with a crush size of P100 -12.5mm is included in Table 10.3.
Table 10.2: Phase 1 Column Results – 19mm | ||||||||||
|---|---|---|---|---|---|---|---|---|---|---|
Test |
Column Number |
Composite Type |
Column Size (mm) |
Calc'd Head (%) |
Tail Grade (%) |
CuT Ext. (%) |
CuSOL Ext. (%) |
Gross Acid Cons. (kg/t) |
Net Cons. (kg/t) |
Days Leached |
Comp 1 |
Col-1 |
Oxide Low |
152 DIA X 3 m H |
0.05 |
0.03 |
Waste Material - Column Discontinued |
39 |
|||
Comp 2 |
Col-2 |
Oxide Mid |
152 DIA X 3 m H |
0.02 |
0.02 |
Waste Material - Column Discontinued |
39 |
|||
Comp 3 |
Col-3 |
Oxide High |
152 DIA X 3 m H |
0.13 |
0.03 |
78.4 |
107.8 |
17.3 |
15.7 |
229 |
Comp 4 |
Col-4 |
Supergene Low |
152 DIA X 3 m H |
0.51 |
0.11 |
78.5 |
108.3 |
24.4 |
18.2 |
229 |
Comp 5 |
Col-5 |
Supergene Mid |
152 DIA X 3 m H |
0.43 |
0.1 |
76.6 |
105.2 |
18.2 |
13.1 |
229 |
Comp 6 |
Col-6 |
Supergene High |
152 DIA X 3 m H |
0.51 |
0.16 |
68.7 |
97 |
23.4 |
18.1 |
229 |
Comp 7 |
Col-7 |
Primary Low |
152 DIA X 3 m H |
0.26 |
0.22 |
18.5 |
191.7 |
14.7 |
14 |
229 |
Comp 8 |
Col-8 |
Primary Mid |
152 DIA X 3 m H |
0.35 |
0.25 |
32 |
135 |
16.1 |
14.3 |
229 |
Comp 9 |
Col-9 |
Primary High |
152 DIA X 3 m H |
0.59 |
0.28 |
54 |
109.7 |
22 |
17.1 |
229 |
AZ-1285 |
Col-10 |
Supergene Low |
152 DIA X 3 m H |
0.16 |
0.14 |
19.5 |
125.1 |
18 |
17.5 |
229 |
AZ-0946 |
Col-11 |
Primary High |
152 DIA X 3 m H |
1.01 |
0.43 |
58.6 |
105.8 |
20.6 |
11.5 |
228 |
Table 10.3: Phase 1 Column Results – 12.5mm | ||||||||||
Test |
Column Number |
Composite Type |
Column Size (mm) |
Calc'd Head (%) |
Tail Grade (%) |
CuT Ext. (%) |
CuSOL Ext. (%) |
Gross Acid Cons. (kg/t) |
Net Cons. (kg/t) |
Days Leached |
Comp 1 |
Col-12 |
Oxide Low |
102 DIA X 3 m H |
0.05 |
0.02 |
Waste Material - Column Discontinued |
39 |
|||
Comp 2 |
Col-13 |
Oxide Mid |
102 DIA X 3 m H |
0.02 |
0.01 |
Waste Material - Column Discontinued |
39 |
|||
Comp 3 |
Col-14 |
Oxide High |
102 DIA X 3 m H |
0.14 |
0.02 |
85.8 |
118 |
17.5 |
15.7 |
228 |
Comp 4 |
Col-15 |
Supergene Low |
102 DIA X 3 m H |
0.5 |
0.1 |
80.9 |
111.5 |
26.7 |
20.4 |
228 |
Comp 5 |
Col-16 |
Supergene Mid |
102 DIA X 3 m H |
0.41 |
0.08 |
81.3 |
111.5 |
24.8 |
19.7 |
228 |
Comp 6 |
Col-17 |
Supergene High |
102 DIA X 3 m H |
0.46 |
0.12 |
75.6 |
106.8 |
23.8 |
18.5 |
228 |
Comp 7 |
Col-18 |
Primary Low |
102 DIA X 3 m H |
0.25 |
0.21 |
19.9 |
206.8 |
15.7 |
15 |
228 |
Comp 8 |
Col-19 |
Primary Mid |
102 DIA X 3 m H |
0.36 |
0.24 |
34.7 |
146.1 |
17.7 |
15.7 |
228 |
Comp 9 |
Col-20 |
Primary High |
102 DIA X 3 m H |
0.55 |
0.24 |
58 |
117.9 |
20.1 |
15.2 |
228 |
AZ-1285 |
Col-21 |
Supergene Low |
102 DIA X 3 m H |
0.16 |
0.12 |
23.3 |
149.6 |
21.1 |
20.6 |
228 |
The results from the Phase 1 column test work indicate a potential increase in total copper extraction of at least 3% and could be as high as 4.5%. It is recommended that future metallurgical test programs focus on crush size at 19mm to maintain operational performance. Many heaps with a P100 crush size of 12mm or less have issues with fines that decrease hydraulic and pneumatic permeability and increase hold-up moisture. The increase in heap moisture hold-up is detrimental to geotechnical stability. Column drain down for the -19mm columns was 7.8% vs 10.0% vs the -12.5mm columns. Maintaining minimal moisture hold-up in the heap to maximize geotechnical stability in a high seismic region is paramount in minimizing the potential for geotechnical failure of the heap leach pad.
PHASE 2 METALLURGICAL TESTWORK RESULTS
The Los Azules Phase 2 metallurgical testwork program intent was to provide variable copper extraction data across varied lithologies, head grade, and range of copper mineralogy (soluble copper). Sequential copper assays were utilized to proxy copper mineralogy. Sequential copper assaying involves leaching a sample with sulfuric acid to determine acid soluble copper (CuAS). Then the same sample is leached with cyanide (CuCN) to determine secondary copper mineralogy that is leachable. The remaining copper (CuRES) is the remaining copper and typically determined to be primary copper. All metallurgical head assays and all exploration drill core assays have sequential copper assays following the same procedure. Soluble Copper (CuSOL) is a proxy for leachable copper in the deposit and equates to CuSOL = CuAS + CuCN. Details on Phase 2 sampling and composites are contained in Section 9.4.1.
The testwork program was executed at SGS Santiago in Santiago, Chile. The metallurgical test program was developed by Samuel Engineering and supervised by Samuel Engineering and McEwen Copper. Eugenio Iasillo from Process Engineering LLC in Tucson, AZ was contracted to support the testwork program. Eugenio reviewed testing protocols to confirm alignment with industry practice. Eugenio made multiple trips to SGS Santiago to validate test work procedure adherence. He witnessed sample preparation, column assembly, and column irrigation. Additionally, he assisted with data validation, data interpretation, and laboratory communication.
The Phase 2 Metallurgical test program focused on the following:
Head characterization (sequential copper, fire assay, sulfur speciation, carbon speciation, ICP-MS (50 elements), fluoride, chloride, and mercury)
Comminution test work by lithology (SPI, SMC, LEIT, BWi, Ai, SG, and bulk density)
Sulfuric acid bottle rolls by lithology
Composite sulfuric acid column leach by material type (15mm Ø x 3m and 300mm Ø x 9m)
Head sample mineralization (XRD, clay analysis, XRF, and TIMA-X PMA)
Acid Generation Prediction and Humidity Cell Testing
Table 10.4: Phase 2 Metallurgical Testwork Program Composites | ||||||
|---|---|---|---|---|---|---|
|
Test Composite |
Drill Hole ID |
From |
To |
Mineral Zone |
Historic Lithology |
Block Model Lithology |
Comp 10 |
AZ22151MET |
72 |
144 |
Oxide/ Supergene |
Diorite |
DIO |
Comp 11 |
AZ22153MET |
62 |
146 |
Oxide/ Supergene |
Diorite |
DIO |
Comp 12 |
AZ22153MET |
148 |
236 |
Supergene |
Diorite |
DIO |
Comp 13 |
AZ22152MET |
154 |
214 |
Supergene |
Dacite Porphyry |
EMP |
Comp 14 |
AZ22152MET |
216 |
290 |
Supergene |
Dacite Porphyry with Breccia |
EMP |
Comp 15 |
AZ22152MET |
36 |
152 |
Supergene |
Diorite |
DIO |
Comp 16 |
AZ22152MET |
290 |
388 |
Primary |
Diorite |
Early Mag Hyd Bx |
Comp 17 |
AZ22153MET |
236 |
298 |
Supergene |
Diorite |
DIO |
Comp 18 |
AZ22153MET |
300 |
360 |
Supergene |
Dacite Porphyry |
IMP |
Comp 19 |
AZ22153MET |
362 |
440 |
Primary |
Diorite |
DIO |
Comp 20 |
AZ22154MET |
115 |
289 |
Supergene |
Diorite |
DIO |
Comp 21 |
AZ22154MET |
63 |
115 |
LIX |
Diorite |
DIO |
Comp 22 |
AZ22154MET |
289 |
309 |
Supergene |
Diorite |
IMP |
Comp 23 |
AZ22154MET |
309 |
355 |
Supergene |
Diorite |
DIO |
Comp 24 |
AZ22154MET |
355 |
408.3 |
Primary |
Diorite |
DIO |
Table 10.4: Phase 2 Metallurgical Testwork Program Composites | ||||||
|---|---|---|---|---|---|---|
|
Test Composite |
Drill Hole ID |
From |
To |
Mineral Zone |
Historic Lithology |
Block Model Lithology |
Comp 25 |
AZ22156MET |
74 |
150 |
Supergene |
hyd |
Inter Mag Hyd Bx |
Comp 26 |
AZ22157MET |
50 |
102 |
LIX |
Diorite |
DIO |
Comp 27 |
AZ22157MET |
102 |
160 |
Supergene |
Diorite |
DIO |
Comp 28 |
AZ22157MET |
160 |
220 |
Primary |
Diorite |
DIO |
Comp 29 |
AZ22159MET |
91 |
221 |
Supergene |
Diorite with FBX |
DIO |
Comp 30 |
AZ22159MET |
221 |
319 |
Supergene |
hyd |
Inter Mag Hyd Bx |
Comp 31 |
AZ22159MET |
319 |
363 |
Primary |
hyd |
Inter Mag Hyd Bx |
Comp 32 |
AZ22159MET |
363 |
389 |
BN-CPY |
hyd |
Inter Mag Hyd Bx |
Comp 33 |
AZ22159MET |
389 |
427 |
BN-CPY |
Dacite Porphyry |
IMP |
Comp 34 |
AZ22159MET |
427 |
611 |
BN |
Diorite |
DIO |
Comp 35 |
AZ22160MET |
60 |
124 |
LIX |
Diorite |
DIO |
Comp 36 |
AZ22160MET |
128 |
258 |
Supergene |
hyd |
Early Mag Hyd Bx |
Comp 37 |
AZ22160MET |
262 |
480 |
Supergene |
Dacite Porphyry |
IMP |
Comp 38 |
AZ22160MET |
480 |
650 |
Primary |
Dacite Porphyry |
IMP |
Summary of Phase 2 Bio-leach Column Test Results
Based on the results from the Phase 1 testing, a nominal particle size of 100% 19MM was adopted for all subsequent testing. Testing at both 100% 19mm and 12.5mm size distribution tests did not show substantial benefit in crushing finer than the 100% 19mm.
The P100 19mm composite column leached in open circuit with a synthetic raffinate of five gram per liter (gpl) sulfuric acid, two gpl ferric iron, and pH between 1-3. The raffinate was applied at 6 L/hr/m2. Sulfuric acid was adjusted to maintain pH between 1.5 and 3. The column charges were agglomerated to between 4-6% moisture with the synthetic raffinate. The agglomerated columns were at rest for two (2) days before raffinate introduction. The inoculum was a standard inoculum continually cultured by SGS Santiago and fed to the column via the raffinate solution. No acid cure dosage was used in agglomeration to optimize acid consumption of the columns. No aeration was added during leaching. The operation was carried out at ambient temperature.
The total copper extractions ranged from 16 to 91% driven primarily by soluble copper of the head sample. The soluble copper extractions ranged from 48 to 132% with the low extraction column coming from a primary copper dominant composite. Column gross acid consumption ranged from 7 to 31 kg/t. The summary for Phase 2 columns is contained in Table 10.6. All results are mass balanced, and extractions calculated from the back calculated head grade.
Table 10.6: Phase 2 Column Results | ||||||||||
|---|---|---|---|---|---|---|---|---|---|---|
Test |
Column Number |
Block Model Lithology |
Column Size (mm) |
Calc. Head (%) |
Tail Grade (%) |
CuT Ext. (%) |
CuSOL Ext. (%) |
Gross Acid Cons. (kg/t) |
Net Acid Cons. (kg/t) |
Days Under Leach |
Comp 10 |
Col-28 |
DIO |
145 DIA X 3 m H |
0.215 |
0.039 |
82.9 |
98.9 |
17.86 |
14.96 |
276 |
Comp 11 |
Col-22 |
DIO |
145 DIA X 3 m H |
0.486 |
0.092 |
82.5 |
98.2 |
29.52 |
22.93 |
278 |
Comp 12 |
Col-23 |
DIO |
145 DIA X 3 m H |
0.517 |
0.177 |
67.3 |
108.5 |
23.64 |
18.12 |
278 |
Comp 13 |
Col-39 |
EMP |
145 DIA X 3 m H |
0.916 |
0.16 |
83.6 |
99.4 |
7.00 |
-5.48 |
249 |
Comp 14 |
Col-35 |
EMP |
145 DIA X 3 m H |
0.999 |
0.531 |
51.9 |
103.1 |
18.42 |
9.81 |
250 |
Table 10.6: Phase 2 Column Results | ||||||||||
|---|---|---|---|---|---|---|---|---|---|---|
Test |
Column Number |
Block Model Lithology |
Column Size (mm) |
Calc. Head (%) |
Tail Grade (%) |
CuT Ext. (%) |
CuSOL Ext. (%) |
Gross Acid Cons. (kg/t) |
Net Acid Cons. (kg/t) |
Days Under Leach |
Comp 15 |
Col-42 |
DIO |
145 DIA X 3 m H |
1.04 |
0.1 |
91 |
96.3 |
17.98 |
2.17 |
243 |
Comp 16 +32 |
Col-27 |
Early + Inter Mag Hyd Bx |
145 DIA X 3 m H |
0.721 |
0.395 |
43.4 |
108 |
25.65 |
21.12 |
262 |
Comp 17 |
Col-24 |
DIO |
145 DIA X 3 m H |
0.423 |
0.171 |
60.4 |
104.2 |
21.94 |
18 |
278 |
Comp 18 |
Col-25 |
IMP |
145 DIA X 3 m H |
0.575 |
0.273 |
54.7 |
108 |
23.09 |
18.13 |
278 |
Comp 19 |
Col-26 |
DIO |
145 DIA X 3 m H |
0.306 |
0.176 |
47.1 |
102 |
23.76 |
21.39 |
278 |
Comp 20 |
Col-47 |
DIO |
145 DIA X 3 m H |
0.601 |
0.066 |
72.9 |
80.2 |
31.22 |
21.98 |
228 |
Comp 21 |
Col-36 |
DIO |
145 DIA X 3 m H |
0.132 |
0.041 |
74 |
119.8 |
31.03 |
29.26 |
250 |
Comp 22 |
Col-38 |
IMP |
145 DIA X 3 m H |
0.361 |
0.103 |
75.3 |
97.8 |
12.38 |
7.68 |
235 |
Comp 23 |
Col-40 |
DIO |
145 DIA X 3 m H |
0.481 |
0.18 |
66.3 |
101.9 |
17.02 |
11.8 |
231 |
Comp 24 |
Col-41 |
DIO |
145 DIA X 3 m H |
0.131 |
0.047 |
68.3 |
107.3 |
15.27 |
13.73 |
231 |
Comp 25 |
Col-33 |
Inter Mag Hyd Bx |
145 DIA X 3 m H |
0.44 |
0.088 |
82.3 |
97.4 |
18.22 |
12.05 |
250 |
Comp 26 |
Col-32 |
DIO |
145 DIA X 3 m H |
0.088 |
0.027 |
72.6 |
90.2 |
22.93 |
21.85 |
250 |
Comp 27 |
Col-31 |
DIO |
145 DIA X 3 m H |
0.309 |
0.055 |
82.8 |
107.3 |
19.34 |
15.42 |
250 |
Table 10.6: Phase 2 Column Results | ||||||||||
|---|---|---|---|---|---|---|---|---|---|---|
Test |
Column Number |
Block Model Lithology |
Column Size (mm) |
Calc. Head (%) |
Tail Grade (%) |
CuT Ext. (%) |
CuSOL Ext. (%) |
Gross Acid Cons. (kg/t) |
Net Acid Cons. (kg/t) |
Days Under Leach |
Comp 28 |
Col-34 |
DIO |
145 DIA X 3 m H |
0.125 |
0.12 |
24.9 |
132.2 |
18.5 |
17.89 |
250 |
Comp 29 |
Col-44 |
DIO |
145 DIA X 3 m H |
0.51 |
0.234 |
57.9 |
101.8 |
25.31 |
20.56 |
228 |
Comp 30 |
Col-50 |
Inter Mag Hyd Bx |
300 DIA X 9 m H |
0.436 |
0.265 |
42.25 |
78.4 |
23.28 |
20.44 |
237 |
Comp 31 |
Col-29 |
Inter Mag Hyd Bx |
145 DIA X 3 m H |
0.89 |
0.397 |
58.5 |
81.3 |
26.77 |
18.93 |
276 |
Comp 33 |
Col-30 |
IMP |
145 DIA X 3 m H |
0.597 |
0.435 |
32.2 |
127.8 |
21.29 |
18.15 |
262 |
Comp 34 |
Col-45 |
DIO |
145 DIA X 3 m H |
0.437 |
0.361 |
35.1 |
115.3 |
22.42 |
20.52 |
228 |
Comp 35 |
Col-37 |
DIO |
145 DIA X 3 m H |
0.142 |
0.032 |
80 |
124.2 |
16.46 |
14.51 |
250 |
Comp 36 |
Col-46 |
Early Mag Hyd Bx |
145 DIA X 3 m H |
1.004 |
0.277 |
75.7 |
96.3 |
22.72 |
11.74 |
228 |
Comp 37 |
Col-43 |
IMP |
145 DIA X 3 m H |
0.576 |
0.207 |
67.1 |
106 |
16.91 |
10.64 |
229 |
Comp 38 |
Col-52 |
IMP |
300 DIA X 9 m H |
0.26 |
0.222 |
15.96 |
48.1 |
15.04 |
14.4 |
229 |
Kinetic Extraction and Acid Consumption Results
The kinetic leach column data is presented in the following figures. The soluble copper extractions are grouped by lithology with the diorite composites shown in Figure 10.1. The EMP composites are shown in Figure 10.2 and IMP composites are shown in Figure 10.3. The soluble copper extraction data converges towards 100% soluble copper extraction or better. The soluble copper extraction removes CuRES, or chalcopyrite from the extraction analysis indicating that chalcopyrite is driving the variability in total copper extraction data.
The same trend occurs across all lithology types. The results indicate that total recovery is correlative to the CuSOL/CuT ratio as shown in Figure 10.7.
Additionally, the kinetic extraction results show most of the copper is extracted in the first 90 days (75% on average) and the remaining copper is extracted over the next 180 – 270 days to reach ultimate extraction.
The net acid consumption kinetics results are presented in Figure 10.4 to Figure 10.6. The net acid consumption excludes the acid consumed by copper which is returned to the circuit after the copper is recovered in electrowinning. Net acid consumption denotes the acid production required from the acid plants to maintain the leaching system. The diorite composites in Figure 10.4 indicate net acid consumption from 2 to 29 kg/t with majority of composites ranging from 15 to 20 kg/t. The IMP (Figure 10.5) and EMP (Figure 10.6) composites indicate lower net acid consumption with IMP ranging from 8 to 21 kg/t averaging 15 kg/t and EMP ranging from -5 to 12 kg/t averaging 5 kg/t.

Figure 10.1: Phase 2 Soluble Copper Kinetic Extraction Results – Diorite Composites (SE 2025)

Figure 10.2: Phase 2 Soluble Copper Kinetic Extraction Results – EMP Composites (SE 2025)

Figure 10.3: Phase 2 Soluble Copper Kinetic Extraction Results – IMP Composites (SE 2025)

Figure 10.4: Phase 2 Net Acid Consumption Results – Diorite Composites (SE 2025)

Figure 10.5: Phase 2 Net Acid Consumption Results – IMP Composites (SE 2025)

Figure 10.6: Phase 2 Net Acid Consumption Results – EMP Composites (SE 2025)

Figure 10.7: Phase 2 column extraction results plotted from lowest CuSOL/CuT Ratio to highest (SE 2025)
PHASE 3 METALLURGICAL TESTWORK RESULTS
The Los Azules Phase 3 metallurgical testwork program targeted lithological composites comprising of drill hole intervals within the first 5 years of operation. Large lithological composites were generated to perform 3-meter columns in triplicate to determine copper extraction variance within one large composite. Additionally, for composites with sufficient mass, a 9-meter column was completed to validate 3-meter extraction results are valid to the planned 9-meter stacking height on the heap leach pad. Cancha geometallurgical software was utilized to identify core intervals within the year 5 pit shell, were above cut-off grade, and separated by lithology. The Phase 3 testwork program was executed at ASMIN Industrial Limitada and is part of the Alfred H Knight Group (AHK). ASMIN is an ISO 9001, 14001, and 45001 certified mineral and metallurgical testing facility. The metallurgical test program was developed by Samuel Engineering and supervised by Samuel Engineering and McEwen Copper.
Phase 3 testwork planning highlighted the importance of analytical consistency transitioning from SGS to ASMIN. The testwork program implemented SGS analytical procedures to ensure consistency. Additionally, all head samples assayed at ASMIN had a secondary sample sent to Alex Stewart International in Argentina to confirm copper sequential assays were accurate and analytical protocols were being followed at both laboratories to ensure reproducible results.
The Phase 3 testwork program followed similar sample preparation protocols and followed a similar testing protocol:
Head characterization (sequential copper, fire assay, sulfur speciation, carbon speciation, ICP-MS (50 elements), fluoride, chloride, and mercury)
Comminution test work by lithology (BWi, Ai, SG, and bulk density)
Sulfuric acid bottle rolls by lithology
Composite sulfuric acid column leach by material type (15mm Ø x 3m and 300mm Ø x 9m)
Head sample mineralization (XRD, clay analysis, XRF, and TIMA-X PMA)
Summary of Phase 3 Bio-leach Column Test Results
The P100 19mm composite columns leached in closed circuit with a starting synthetic raffinate of five gram per liter (gpl) sulfuric acid, two gpl ferric iron, and pH between 1-3. The raffinate was applied at 6 L/hr/m2. Sulfuric acid was adjusted to maintain pH between 1.5 and 3. The column charges were agglomerated to between 4-6% moisture with the synthetic raffinate and an initial acid dosage of 5 kg/t. The agglomerated columns were at rest for two (2) days before raffinate introduction. The microbial consortia used to inoculate the columns was formulated by the Biomining Laboratory of DICTUC (Pontificia Universidad Católica de Chile) and designed to operate across a thermal range encompassing mesophilic to moderately thermophilic conditions. These consortia included key species for the bio-oxidation of iron and sulfur, such as Acidithiobacillus ferrooxidans, Leptospirillum ferrooxidans, Acidiphilium spp., Acidithiobacillus caldus, and Sulfobacillus thermosulfidooxidans, thereby ensuring both the oxidation of mineral compounds and the removal of residual organic matter. The inoculum was fed to the column via the raffinate solution. A 5 kg/t acid dosage was added to agglomeration to quickly bring the column to a balanced state. The 5 kg/t acid dosage was calculated from Phase 2 columns indicated it took 5-10 kg/t acid addition before pH dropped to target operating levels of 1.5 – 3 pH. The process was carried out at ambient temperature, without forced aeration
The total copper extractions ranged from 31 to 87% driven primarily by soluble copper of the head sample. The soluble copper extractions ranged from 89 to 117%. Column gross acid consumption ranged from 12 to 44 kg/t. The summary for Phase 3 columns is contained in Table 10.6. All results are mass balanced, and extractions calculated from the back calculated head grade.
Table 10.6: Phase 3 Column Results | ||||||||||
Test |
Column Number |
Block Model Lithology |
Column Size (mm) |
Calc. Head (%) |
Tail Grade (%) |
CuT Ext. (%) |
CuSOL Ext. (%) |
Gross Acid Cons. (kg/t) |
Net Acid Cons. (kg/t) |
Days Under Leach |
Diorite Master Comp |
C1 |
DIO |
145 DIA X 3 m H |
0.629 |
0.117 |
82.24 |
93.2 |
25.48 |
17.57 |
223 |
Diorite Master Comp |
C2 |
DIO |
145 DIA X 3 m H |
0.611 |
0.108 |
84.18 |
95.4 |
25.08 |
17.26 |
223 |
Diorite Master Comp |
C3 |
DIO |
145 DIA X 3 m H |
0.615 |
0.11 |
83.57 |
93.7 |
25.08 |
17.25 |
223 |
Diorite Master Comp |
C4 |
DIO |
145 DIA X 9m H |
0.668 |
0.109 |
83.35 |
100.8 |
26.26 |
17.64 |
233 |
Emag Hyd Bx MC |
C5 |
Early Mag Hyd Bx |
145 DIA X 3 m H |
0.908 |
0.199 |
79.63 |
101.2 |
25.74 |
14.71 |
223 |
Emag Hyd Bx MC |
C6 |
Early Mag Hyd Bx |
145 DIA X 3 m H |
0.922 |
0.182 |
81.33 |
105.3 |
25.45 |
13.96 |
223 |
Emag Hyd Bx MC |
C7 |
Early Mag Hyd Bx |
145 DIA X 3 m H |
0.956 |
0.187 |
80.23 |
105.4 |
26.15 |
14.29 |
223 |
Emag Hyd Bx MC |
C8 |
Early Mag Hyd Bx |
145 DIA X 9 m H |
0.924 |
0.208 |
78.37 |
100.2 |
28.84 |
17.75 |
233 |
EMP Master Comp |
C9 |
EMP |
145 DIA X 3 m H |
0.484 |
0.093 |
82.12 |
91.7 |
17.11 |
11.08 |
223 |
EMP Master Comp |
C10 |
EMP |
145 DIA X 3 m H |
0.488 |
0.097 |
81.41 |
92.2 |
16.88 |
10.83 |
223 |
EMP Master Comp |
C11 |
EMP |
145 DIA X 3 m H |
0.483 |
0.107 |
79.6 |
89.2 |
16.63 |
10.81 |
223 |
EMP Master Comp |
C12 |
EMP |
145 DIA X 9 m H |
0.513 |
0.098 |
81.05 |
95.9 |
20.45 |
14.05 |
244 |
Imag Hyd Bx MC |
C13 |
Inter Mag Hyd Bx |
145 DIA X 3 m H |
0.704 |
0.093 |
87.17 |
101.6 |
20.93 |
11.49 |
244 |
Imag Hyd Bx MC |
C14 |
Inter Mag Hyd Bx |
145 DIA X 3 m H |
0.713 |
0.102 |
85.91 |
101.6 |
20.71 |
11.27 |
244 |
Imag Hyd Bx MC |
C15 |
Inter Mag Hyd Bx |
145 DIA X 3 m H |
0.7 |
0.092 |
87.26 |
100.9 |
20.43 |
11.05 |
244 |
IMP Master Comp |
C16 |
IMP |
145 DIA X 3 m H |
0.145 |
0.046 |
69.46 |
94 |
12.09 |
10.56 |
181 |
IMP Master Comp |
C17 |
IMP |
145 DIA X 3 m H |
0.144 |
0.044 |
70.81 |
94.6 |
12.98 |
11.44 |
181 |
IMP Master Comp |
C18 |
IMP |
145 DIA X 3 m H |
0.138 |
0.043 |
71.54 |
90.6 |
13.02 |
11.55 |
181 |
278MET2 |
C19 |
Inter Mag Hyd Bx |
145 DIA X 9 m H |
0.441 |
0.311 |
32.28 |
117 |
17.46 |
15.43 |
264 |
259MET1 |
C20 |
DIO |
145 DIA X 9 m H |
0.708 |
0.112 |
85.05 |
100.9 |
27.48 |
18.29 |
279 |
259MET2 |
C21 |
DIO |
145 DIA X 9 m H |
0.261 |
0.176 |
30.59 |
103.3 |
23.14 |
21.87 |
260 |
308MET1 |
C22 |
DIO |
145 DIA X 9 m H |
0.506 |
0.075 |
85.23 |
98.2 |
25 |
18.41 |
276 |
296MET1 |
C23 |
IMP |
145 DIA X 9 m H |
0.547 |
0.146 |
74.26 |
101 |
25.71 |
19.55 |
262 |
295MET1 |
C24 |
DIO |
145 DIA X 9 m H |
0.514 |
0.072 |
85.31 |
116.9 |
43.97 |
37.08 |
315 |
278MET1 |
C25 |
Inter Mag Hyd Bx |
145 DIA X 9 m H |
0.745 |
0.212 |
71.27 |
111.6 |
32.09 |
23.8 |
315 |
Sampling
The testwork composites were pulled from eight core holes drilled in 2023. The tables below contain the drill hole IDs, intervals, mineralized zone, and block model lithology. Intervals were selected to maintain a continuous composite prioritizing a consistent block model lithology and minimize blending of mineral zones. The eight core holes were broken down into 28 composites totaling 19,600 kg of material.
Table 10.7: Phase 2 Metallurgical Testwork Program Composites | |||||||||||
|
Test Composite |
Drill Hole ID |
From |
To |
Block Model Lithology |
Test Composite |
Drill Hole ID |
From |
To |
Block Model Lithology |
||
|
C1 C2 C3 C4 C1 - 3; 3m Columns C4; 9m Column |
AZ23199MET |
80 |
90 |
DIO |
C5 C6 C7 C8 C5 - 7; 3m Columns C8; 9m Column |
AZ23204MET |
106 |
116 |
EMag Hyd Bx |
||
AZ23199MET |
90 |
100 |
DIO |
AZ23204MET |
146 |
156 |
EMag Hyd Bx |
||||
AZ23205MET |
116 |
126 |
DIO |
AZ23209MET |
98 |
108 |
EMag Hyd Bx |
||||
AZ23205MET |
126 |
136 |
DIO |
AZ23209MET |
158 |
168 |
EMag Hyd Bx |
||||
AZ23205MET |
136 |
146 |
DIO |
AZ23213MET |
146 |
156 |
EMag Hyd Bx |
||||
AZ23205MET |
146 |
156 |
DIO |
AZ23213MET |
156 |
166 |
EMag Hyd Bx |
||||
AZ23205MET |
156 |
166 |
DIO |
AZ23215MET |
112 |
122 |
EMag Hyd Bx |
||||
AZ23210MET |
122 |
132 |
DIO |
AZ23219MET |
144 |
154 |
EMag Hyd Bx |
||||
AZ23210MET |
132 |
142 |
DIO |
AZ23219MET |
154 |
164 |
EMag Hyd Bx |
||||
AZ23210MET |
142 |
152 |
DIO |
AZ23221MET |
136 |
146 |
EMag Hyd Bx |
||||
AZ23212MET |
92 |
102 |
DIO |
AZ23221MET |
146 |
156 |
EMag Hyd Bx |
||||
AZ23212MET |
102 |
112 |
DIO |
AZ23221MET |
156 |
166 |
EMag Hyd Bx |
||||
AZ23229MET |
110 |
120 |
DIO |
AZ23227MET |
108 |
118 |
EMag Hyd Bx |
||||
AZ23229MET |
120 |
130 |
DIO |
AZ23227MET |
158 |
168 |
EMag Hyd Bx |
||||
AZ23229MET |
130 |
140 |
DIO |
AZ23227MET |
168 |
178 |
EMag Hyd Bx |
|||
AZ23229MET |
140 |
150 |
DIO |
AZ23234MET |
114 |
124 |
EMag Hyd Bx |
|||
AZ23229MET |
150 |
160 |
DIO |
AZ23234MET |
164 |
174 |
EMag Hyd Bx |
|||
AZ23232MET |
122 |
132 |
DIO |
AZ23235MET |
90 |
100 |
EMag Hyd Bx |
|||
AZ23232MET |
132 |
142 |
DIO |
AZ23235MET |
120 |
130 |
EMag Hyd Bx |
|||
AZ23232MET |
142 |
152 |
DIO |
|||||||
AZ23232MET |
152 |
162 |
DIO |
|||||||
Table 10.8: Phase 2 Metallurgical Testwork Program Composites | ||||||||||
|---|---|---|---|---|---|---|---|---|---|---|
Test |
Drill |
|
|
Block Model |
|
Test |
Drill |
|
|
Block Model |
Composite |
Hole ID |
From |
To |
Lithology |
Composite |
Hole ID |
From |
To |
Lithology |
|
C9 |
AZ23199MET |
130 |
140 |
EMP |
C13 |
GTK2315MET |
123.4 |
132 |
IMP |
|
AZ23199MET |
140 |
150 |
EMP |
C14 |
GTK2315MET |
132 |
140 |
IMP |
||
AZ23209MET |
68 |
78 |
EMP |
C15 |
AZ23222MET |
94 |
104 |
IMP |
||
AZ23209MET |
78 |
88 |
EMP |
C13 - 15; 3m Columns |
AZ23222MET |
124 |
129 |
IMP |
||
AZ23215MET |
132 |
142 |
EMP |
AZ23222MET |
135 |
137.2 |
IMP |
|||
AZ23215MET |
152 |
162 |
EMP |
|
||||||
AZ23223MET |
106 |
116 |
EMP |
AZ23228MET |
130 |
140 |
IMag HBx |
|||
Table 10.8: Phase 2 Metallurgical Testwork Program Composites | ||||||||||
|---|---|---|---|---|---|---|---|---|---|---|
Test |
Drill |
|
|
Block Model |
|
Test |
Drill |
|
|
Block Model |
Composite |
Hole ID |
From |
To |
Lithology |
Composite |
Hole ID |
From |
To |
Lithology |
|
AZ23223MET |
126 |
136 |
EMP |
C16 |
AZ23214MET |
138 |
148 |
IMag HBx |
||
AZ23226AMET |
102 |
112 |
EMP |
AZ23228MET |
140 |
150 |
IMag HBx |
|||
AZ23226AMET |
142 |
152 |
EMP |
AZ23214MET |
128 |
138 |
IMag HBx |
|||
AZ23226AMET |
162 |
172 |
EMP |
|
||||||
AZ23230MET |
140 |
150 |
EMP |
C19 |
AZ23278MET |
330 |
417 |
IMag HBx |
||
AZ23230MET |
170 |
180 |
EMP |
C20 |
AZ23259MET |
172 |
246 |
DIO |
||
AZ23230MET |
190 |
200 |
EMP |
C21 |
AZ23259MET |
258 |
332 |
DIO |
||
GTK2316MET |
108 |
118 |
EMP |
C22 |
AZ23308MET |
170 |
271.4 |
DIO |
||
GTK2316MET |
118 |
128 |
EMP |
C23 |
AZ23296MET |
240 |
284.8 |
IMP |
||
GTK2316MET |
128 |
138 |
EMP |
C24 |
AZ23295MET |
98.7 |
242 |
DIO |
||
GTK2316MET |
138 |
148 |
EMP |
C25 |
AZ23278MET |
160 |
312 |
IMag HBx |
||
GTK2316MET |
168 |
178 |
EMP |
|
||||||
Kinetic Extraction and Acid Consumption Results
The Diorite columns (3 and 9 meters) showed a sustained extraction trend reaching levels close to or above 82%, in line with theoretical potential. The tall column kinetics replicated the results of the shorter columns validating the scalability of all 3-meter column testwork to a full 9-meter stacking height on the heap.
The diorite column data is presented below. Soluble copper extraction is presented in Figure 10.8. The net acid consumption is presented in Figure 10.9.


Figure 10.8: Phase 3 Soluble Copper Kinetic Extraction Results – Diorite (SE 2025)

Figure 10.9: Phase 3 Net Acid Consumption Results – Diorite (SE 2025)
For the Early Magmatic-Hydrothermal Breccia (EMag Hyd Bx), the results were similar to Diorite. The kinetic extractions curves reflected a rapid initial extraction and final extractions above 78%. The consistency among the 3-meter columns reaffirms the repeatability of the test work and the 9-meter results show the direct scalability of all test work from 3-m to 9-m. The 9-meter did consume a bit more acid than the 3-meter columns.
The Eag Hyd Bx column data is presented below. Soluble copper extraction is presented in Figure 10.10. The net acid consumption is presented in Figure 10.11.

Figure 10.10: Phase 3 Soluble Copper Kinetic Extraction Results – EMAG Hydrothermal Breccia (SE 2025)

Figure 10.11: Phase 3 Net Acid Consumption Results – EMAG Hydrothermal Breccia (SE 2025)
The Early Mineral Porphyry (EMP) columns approached 80% total copper extraction for all columns. The EMP composite showed strong initial extraction kinetics achieving >50% extraction in the first 60 days. The extraction results for EMP composite are similar to the Diorite and EMag Hyd Bx composites with little variability between the 3-meter columns and directly comparable results between the 3-meter and 9-meter column results. The 9-meter column did exhibit slightly higher acid consumption.
The EMP column data is presented below. Soluble copper extraction is presented in Figure 10.12. The net acid consumption is presented in Figure 10.13.

Figure 10.12: Phase 3 Soluble Copper Kinetic Extraction Results – EMP (SE 2025)
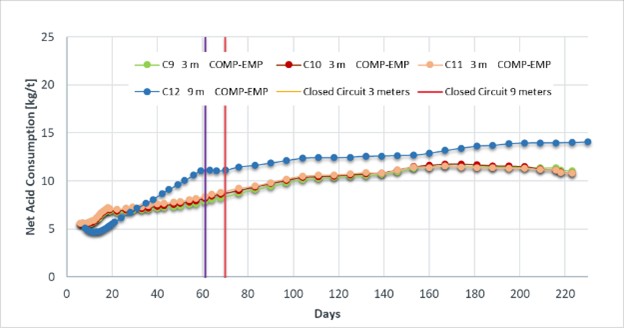
Figure 10.13: Phase 3 Net Acid Consumption Results – EMP (SE 2025)
The Intermediate Magmatic-Hydrothermal Breccia (IMag HBx) displayed excellent performance, with extraction exceeding 85% across all tested columns. A rapid response was observed in the early stages, achieving >50% total copper extraction in the first 60 days. The IMag HBx composite only tested 3-m columns as there were not enough IMag HBx ore in the available drill core to create an accompanying 9-meter column. The 3-meter column results show minimal variability across the three tests confirming repeatability.
The IMag HBx column data is presented below. Soluble copper extraction is presented in Figure 10.14. The net acid consumption is presented in Figure 10.15.

Figure 10.14: Phase 3 Soluble Copper Kinetic Extraction Results – IMAG Hydrated Breccia (SE 2025)

Figure 10.15: Phase 3 Net Acid Consumption Results – IMAG Hydrated Breccia (SE 2025)
The Inter Mineral Porphyry (IMP) columns approached 70% total copper extraction for all columns. The IMP composite showed strong initial extraction kinetics achieving >50% extraction in the first 60 days. The extraction results for IMP composite is similar to the Diorite, EMag Hyd Bx, and EMP composites with little variability between the 3-meter column results. Additionally, the acid consumption results were also very consistent across all three columns.
The IMP column data is presented below. Soluble copper extraction is presented in Figure 10.16. Net acid consumption is presented in Figure 10.17.

Figure 10.16: Phase 3 Soluble Copper Kinetic Extraction Results – IMP (SE 2025)

Figure 10.17: Phase 3 Net Acid Consumption Results – IMP (SE 2025)
The following figures are the summarized kinetic data for the full Phase 3 column test work program. The individual lithology data has been averaged to one curve for each lithology and the additional single hole composites are identified separately. Figure 10.18 contains soluble copper extraction results. Figure 10.19 contains the net acid consumption results.

Figure 10.18: Phase 3 Soluble Copper Kinetic Extraction Results (SE 2025)

Figure 10.19: Phase 3 Net Acid Consumption Results (SE 2025) (SE 2025)
Column Results Summary
The scale-up column results from 3m to 9m indicate no adverse effect on copper extraction and minimal effect on net acid consumption. Based on the results, a 9m lift height for the heap leach pad was recommended in the process design criteria. Increasing a heap leach bench has a net positive impact to the project by decreasing the surface area and reducing leach solution requirements. The reduced leach solution flow per tonne of ore reduces the SXEW size and the heap leach pad footprint needed to maintain the open area. The 9m lift height is comparable to industry benchmarks of El Abra operating at 8m and Zaldivar at 9m (Table 10.9). Analysis of kinetic leach data from Figure 10.18 and the Phase 2 CuSOL extraction data (Figure 10.1, Figure 10.2, Figure 10.3) indicates that 74% of the ultimate extraction is achieved in 90 days, 82% in 120 days, 91% in 180 days, and 100% in 360 days. The 120 initial leach cycle was chosen to target 65% extraction (~80% of the 82% extracted at 120 days). The 360-day ultimate extraction is met through two additional leach cycles as ore is stacked with each additional lift. The heap is modeled so extraction occurs from top three lifts only.
Table 10.9: Relevant Copper Leach Benchmarks | ||||||||
|---|---|---|---|---|---|---|---|---|
Mine |
Preparation |
P80 Crush Product Size |
Copper Mineralogy |
Leachable3 Copper (% of CuT) |
Initial Leach Cycle (days) |
Lift Height (m) |
Net Acid Cons. (kg acid/t ore) |
Total Copper Recovery |
|
Project Export (Los Azules) |
Crush-conveyor stacked |
19 mm |
Cc, Cv, Cpy |
68% |
120 |
9 |
13.2 |
71% |
Quebrada Blanca - Teck1 |
Crush-conveyor stacked |
12.5 mm |
Cc, Cv, Cpy |
65% |
210 |
7 |
10-12 |
80% |
FCX - El Abra2 |
Crush-conveyor stacked |
19 mm |
Chr, Bn, Cp |
64% |
300 |
8 |
17-21 |
78% |
FCX - Morenci2 |
Crush-conveyor stacked |
12.5 mm |
Cc, Cv |
60% |
173 |
6 |
8-9 |
78% |
Antofagasta - Zaldivar2 |
Crush-conveyor stacked |
12.5 mm |
Cc, Br, Chr |
80% |
300 |
9 |
23 |
78% |
KGHM - Franke2 |
Crush-conveyor stacked |
25.4 mm |
Ma, Chr, Acm |
80% |
100 |
4 |
40 |
72% |
BHP - Spence2 |
Crush-conveyor stacked |
25.4 mm |
Cc, Cv, Cpy |
92% |
450 |
7.5 |
NR |
70% |
Frontera - Piedras Verde2 |
Crush-conveyor stacked |
25.4 mm |
Mal, Chr, Cc |
50% |
250 |
5 |
4.3 |
54% |
FCX-Safford2 |
Crush-conveyor stacked |
25.4 mm |
Cc, Clays, Chr |
76% |
120-280 |
6 |
35-47 |
76% |
Table 10.9: Relevant Copper Leach Benchmarks | |||||||||
|---|---|---|---|---|---|---|---|---|---|
Mine |
Preparation |
P80 Crush Product Size |
Copper Mineralogy |
Leachable3 Copper (% of CuT) |
Initial Leach Cycle (days) |
Lift Height (m) |
Net Acid Cons. (kg acid/t ore) |
Total Copper Recovery |
|
FCX-Cerro Verde2 |
Crush-conveyor stacked |
13.5 mm |
Cc, Cv |
97% |
200 |
7 |
5.5 |
77% |
|
Note 1: Copper 1999; Recent changes to operating practices at Minera Quebrada Blanca; Henry Salomon-De-Friedberg; Compania Minera Quebrada Blanca S.A.
Note 2: All data taken from Washnock et al (2016) Copper Leaching: 2014-1015 Global Operating data, SME Preprint 16-041
Note 3: As reported, relative only and can vary by assay methodology used. Los Azules 2023 IA value.
Key: Acm = Atacamite; Chr = Chrysocolla; Br = Brochantite; Cc = Chalcocite; Cv = Covellite; Cpy = Chalcopyrite; Clays = copper in clays; Mal = Malachite. NR = Not Reported
COLUMN VS CRUSHER PREDICTED SIZE DISTRIBUTIONS
A screen analysis was completed on all column head samples and residue samples. The average column head sample particle size distribution (PSD) by lithology is presented in Figure 10.20. The modeled Los Azules crushing circuit product size is included to highlight the slight difference in tested PSD to the future expected crushed product PSD that will be placed on the heap leach pad. The modeled crushed product is expected to have a coarser size distribution than the column test work above 3.0 mm.

Figure 10.20: Average size distribution of column test work vs. Los Azules Crushing Circuit Model output. (SE 2025)
When evaluating ultimate extraction, it is important to confirm the difference in tested and the modeled PSD has on final ultimate extraction. When accounting for grade distribution and copper extraction by screen size, the difference in modeled ultimate final extraction is <1%.
METALLURGICAL PERFORMANCE
The 2023 Technical Report Summary IA for Los Azules utilized a recovery model of 100% of the CuSOL and 15% of the CuRES. The model was a reasonable interpretation of the test work given the metallurgical test work completed to that time. Numerous additional tests have been completed, allowing for further interpretation of the data.
Data points from the analysis are contained in Table 10.10. All columns represent a single testwork composite. Duplicated tests are removed from the dataset, and an average of the replicated data is utilized to represent the one extraction per one composite. Additionally, all results are normalized to a 360-day projected extraction. All kinetic column test results were extrapolated to 360-days via modeling copper decay in the column solutions. Additionally, the data set is visualized in Figure 10.21 with a bar chart showing CuSOL and CuRES for each column with the 360-day CuT extraction overlayed the bars.
The data set is sorted by CuSOL/CuT ratio so the ratio of orange to blue will be lowest on the left and highest on the right.
Table 10.10: Los Azules FS Extraction Data Set | |||||||||
|---|---|---|---|---|---|---|---|---|---|
|
Column # |
Lithology |
CuT % |
CuAS % |
CuCN % |
CuSOL % |
CuRes % |
Cu SOL/CuT |
CuT Ext. (360 Day) |
CuT Tail (360 Day) |
Col-3 |
DIO |
0.132 |
0.037 |
0.049 |
0.086 |
0.046 |
0.652 |
78.67 |
0.028 |
Col-4 |
DIO |
0.515 |
0.028 |
0.311 |
0.339 |
0.176 |
0.658 |
79.05 |
0.108 |
Col-5 |
DIO |
0.426 |
0.04 |
0.232 |
0.272 |
0.154 |
0.638 |
77.36 |
0.096 |
Col-6 |
EMP |
0.508 |
0.04 |
0.272 |
0.312 |
0.196 |
0.614 |
69.23 |
0.156 |
Col-7 |
DIO |
0.259 |
0.003 |
0.02 |
0.023 |
0.236 |
0.089 |
22.41 |
0.201 |
Col-8 |
DIO |
0.355 |
0.013 |
0.071 |
0.084 |
0.271 |
0.237 |
34.04 |
0.234 |
Col-9 |
DIO |
0.585 |
0.021 |
0.235 |
0.256 |
0.329 |
0.438 |
54.92 |
0.264 |
Col-10 |
DIO |
0.164 |
0.003 |
0.021 |
0.024 |
0.14 |
0.146 |
23.66 |
0.125 |
Col-11 |
DIO |
1.015 |
0.024 |
0.466 |
0.49 |
0.525 |
0.483 |
60.04 |
0.406 |
Col-22 |
DIO |
0.519 |
0.093 |
0.333 |
0.426 |
0.093 |
0.821 |
83.14 |
0.088 |
Col-23 |
DIO |
0.532 |
0.032 |
0.254 |
0.286 |
0.246 |
0.538 |
68.24 |
0.169 |
Col-24 |
DIO |
0.425 |
0.024 |
0.194 |
0.218 |
0.207 |
0.513 |
61.7 |
0.163 |
Col-25 |
IMP |
0.589 |
0.036 |
0.23 |
0.266 |
0.323 |
0.452 |
55.72 |
0.261 |
Col-26 |
DIO |
0.327 |
0.021 |
0.113 |
0.134 |
0.193 |
0.41 |
48.18 |
0.169 |
Col-27 |
EMP BX |
0.678 |
0.02 |
0.219 |
0.239 |
0.439 |
0.353 |
45.38 |
0.37 |
Col-28 |
DIO |
0.227 |
0.035 |
0.162 |
0.197 |
0.03 |
0.868 |
83.23 |
0.038 |
Col-29 |
IMP BX |
0.87 |
0.022 |
0.595 |
0.617 |
0.253 |
0.709 |
59.86 |
0.349 |
Col-30 |
IMP BX |
0.634 |
0.012 |
0.14 |
0.152 |
0.482 |
0.24 |
34.44 |
0.416 |
Col-31 |
DIO |
0.308 |
0.04 |
0.192 |
0.232 |
0.076 |
0.753 |
83.39 |
0.051 |
Col-32 |
DIO |
0.097 |
0.034 |
0.034 |
0.068 |
0.029 |
0.701 |
73.29 |
0.026 |
Table 10.10: Los Azules FS Extraction Data Set | |||||||||
|---|---|---|---|---|---|---|---|---|---|
|
Column # |
Lithology |
CuT % |
CuAS % |
CuCN % |
CuSOL % |
CuRes % |
Cu SOL/CuT |
CuT Ext. (360 Day) |
CuT Tail (360 Day) |
Col-33 |
IMP BX |
0.487 |
0.073 |
0.331 |
0.404 |
0.083 |
0.83 |
82.95 |
0.083 |
Col-34 |
DIO |
0.159 |
0.009 |
0.02 |
0.029 |
0.13 |
0.182 |
26.77 |
0.116 |
Col-35 |
EMP |
1.077 |
0.044 |
0.47 |
0.514 |
0.563 |
0.477 |
53.48 |
0.501 |
Col-36 |
DIO |
0.155 |
0.066 |
0.018 |
0.084 |
0.071 |
0.542 |
74.33 |
0.04 |
Col-37 |
DIO |
0.159 |
0.049 |
0.046 |
0.095 |
0.064 |
0.597 |
80.17 |
0.032 |
Col-38 |
IMP |
0.406 |
0.047 |
0.227 |
0.274 |
0.132 |
0.675 |
76.23 |
0.097 |
Col-39 |
EMP |
0.966 |
0.05 |
0.735 |
0.785 |
0.181 |
0.813 |
84.34 |
0.151 |
Col-40 |
DIO |
0.512 |
0.034 |
0.258 |
0.292 |
0.22 |
0.57 |
67.72 |
0.165 |
Col-41 |
DIO |
0.147 |
0.013 |
0.065 |
0.078 |
0.069 |
0.531 |
69.58 |
0.045 |
Col-42 |
DIO |
1.125 |
0.094 |
0.974 |
1.068 |
0.057 |
0.949 |
92.51 |
0.084 |
Col-43 |
IMP |
0.607 |
0.03 |
0.314 |
0.344 |
0.263 |
0.567 |
68.48 |
0.191 |
Col-44 |
DIO |
0.533 |
0.036 |
0.248 |
0.284 |
0.249 |
0.533 |
59.36 |
0.217 |
Col-45 |
DIO |
0.351 |
0.012 |
0.092 |
0.104 |
0.247 |
0.296 |
39.12 |
0.214 |
Col-46 |
EMP BX |
0.942 |
0.09 |
0.632 |
0.722 |
0.22 |
0.766 |
76.81 |
0.218 |
Col-47 |
DIO |
0.823 |
0.107 |
0.622 |
0.729 |
0.094 |
0.886 |
73.52 |
0.218 |
Col-48 |
DIO |
0.513 |
0 |
0.239 |
0.239 |
0.274 |
0.466 |
55.51 |
0.228 |
Col-49 |
DIO |
0.442 |
0.015 |
0.116 |
0.131 |
0.311 |
0.296 |
24.53 |
0.334 |
Col-50 |
IMP BX |
0.436 |
0.015 |
0.182 |
0.197 |
0.239 |
0.452 |
43.7 |
0.245 |
Col-51 |
IMP |
0.578 |
0.028 |
0.299 |
0.327 |
0.251 |
0.566 |
62.66 |
0.216 |
Col-52 |
IMP BX |
0.26 |
0.009 |
0.069 |
0.078 |
0.182 |
0.3 |
18.14 |
0.213 |
Col-53 |
EMP BX |
1.025 |
0.098 |
0.688 |
0.786 |
0.239 |
0.767 |
69.83 |
0.309 |
Ph3 Col-4 |
DIO |
0.668 |
0.052 |
0.522 |
0.574 |
0.094 |
0.859 |
84.94 |
0.101 |
Ph3 Col-8 |
EMP BX |
0.924 |
0.048 |
0.674 |
0.722 |
0.202 |
0.781 |
80.18 |
0.183 |
Table 10.10: Los Azules FS Extraction Data Set | |||||||||
|---|---|---|---|---|---|---|---|---|---|
|
Column # |
Lithology |
CuT % |
CuAS % |
CuCN % |
CuSOL % |
CuRes % |
Cu SOL/CuT |
CuT Ext. (360 Day) |
CuT Tail (360 Day) |
Ph3 Col-12 |
EMP |
0.513 |
0.038 |
0.393 |
0.431 |
0.082 |
0.84 |
82.03 |
0.092 |
Ph3 Col-14 |
IMP BX |
0.713 |
0.059 |
0.539 |
0.598 |
0.115 |
0.839 |
89.22 |
0.077 |
Ph3 Col-17 |
IMP |
0.144 |
0.017 |
0.086 |
0.103 |
0.041 |
0.715 |
70.66 |
0.042 |
Ph3 Col-19 |
IMP BX |
0.441 |
0.014 |
0.089 |
0.103 |
0.338 |
0.234 |
33.39 |
0.294 |
Ph3 Col-20 |
DIO |
0.708 |
0.045 |
0.532 |
0.577 |
0.131 |
0.815 |
92.44 |
0.054 |
Ph3 Col-21 |
DIO |
0.261 |
0.013 |
0.063 |
0.076 |
0.185 |
0.291 |
35.35 |
0.169 |
Ph3 Col-22 |
DIO |
0.506 |
0.028 |
0.389 |
0.417 |
0.089 |
0.824 |
89.34 |
0.054 |
Ph3 Col-23 |
IMP BX |
0.547 |
0.02 |
0.36 |
0.38 |
0.167 |
0.695 |
78.55 |
0.117 |

Figure 10.21: All column tests, 360-day total extraction data plotted with copper solubility with data sorted with increasing copper solubility. (SE 2025)
After correlating the dataset, a relationship is readily apparent primarily driven by the CuSOL/CuT ratio. The data was further broken down by lithology separating the IMP & IMP BX from the other lithologies, and separating DIO, EMP, and EMP BX into a low and high solubility regime. Material in the deposit with >50% CuSOL/CuT and having a DIO, EMP, and EMP BX constitutes 73% of the contained material in the LOM pit shell. This methodology best reflects the potential variability related to host rock materials and the expected variability related to copper grades, mineralogy, and recovery with a reasonable level of confidence. Final models are contained in Figure 10.22. The results of the extraction models applied to the material in the LOM pit shell are presented in Table 10.11.
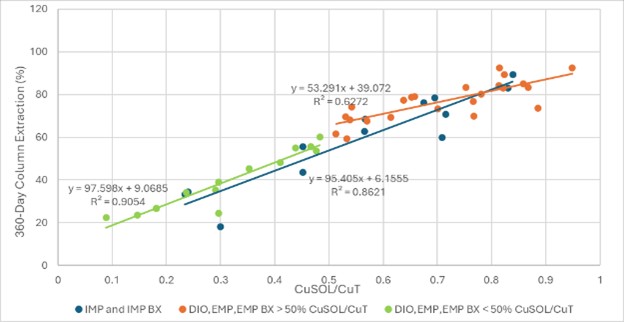
Figure 10.22: All 360-day column extraction data plotted as CuSOL/CuT ratio of the head grade broken out by lithology and ratios. (SE 2025)
The extraction models presented in Figure 10.22 was refined by removing any data points that were greater than three standard deviations indicating the data likely wasn’t in line with the population. Col-47 results were the outlier removed from the dataset. Additionally, the data points where the test results are >10% below the projected model all have mineralogy where the copper deportment is greater than 80% of chalcopyrite plus bornite (Col-29, Col-50, Col-52).
Table 10.11: Los Azules FS Extraction Modeled Through Orebody | ||||||||
LITHOM |
||||||||
IMP BX |
IMP |
DIO |
DIO |
EMP |
EMP |
EMP BX |
EMP BX |
|
> 50% CuSOL/CuT |
Average (Ext%) |
|
|
0.818 |
|
0.793 |
|
0.766 |
|
< 50% CuSOL/CuT |
Average (Ext%) |
|
|
|
0.412 |
|
0.425 |
|
0.499 |
IMP & IMP BX |
Average (Ext%) |
0.731 |
0.733 |
|
|
|
|
|
|
LITHOM Tons Distribution % |
% |
0% |
5% |
50% |
15% |
22% |
7% |
1% |
0% |
Average Copper Grade |
% |
0.42 |
0.30 |
0.36 |
0.28 |
0.63 |
0.50 |
0.71 |
0.69 |
DELETERIOUS ELEMENTS
Fluorine and chlorine were identified early in the project as possible deleterious elements for the project given that other projects in the Andes have had fluorine and chlorine issues. All metallurgical head assays have muti-element assays that included arsenic, fluorine and chlorine assays and all humidity cell testing included fluorine and chlorine assays in the muti-element analyses.
Columns 24 and Column 25 from the Phase 3 metallurgical testwork campaign indicated no biological activity in the column when the effluent mV remained < 600 after 75 days. indicated no or poor biological activity. The columns were re-inoculated and after ~30 days the PLS Eh increased to >750 mV as expected with the presence of ferric iron in solution as would be expected.
PLS solution was assayed for chlorine, fluorine, mercury, and nitrates to determine the cause for the loss of biological activity. Chlorine was <500 ppm, Fluorine < 110 ppm, nitrates < 50ppm, and no mercury. No potential elements deleterious to biological life were present in high enough concentrations to kill or impair the inoculum.
It was concluded that initial inoculation of column 24 and 25 was missed as those columns were started on a different day than the previous columns. The conclusion was supported by the quick response to re-inoculation.
CORE RECOVERY ANALYSIS
A statistical analysis of the core samples for metallurgical testwork was analyzed to understand the core recovery by mass to ensure significant mass loss didn’t occur during transportation, core handling, core scanning, core logging activities prior to testing. All core samples that were sent to SGS and ASMIN were weighed prior to shipment and when received.
Most of the core was PQ core. It was measured at an actual 83mm diameter v 85mm typical diameter. S.G. measurements were completed for most of the deposit. All PQ metallurgical drill core that was logged with 100% core recovery (by length) was calculated to be an average of 13.33 kg/m with the measure diameter and S.G. The measured weight for all the samples was 11.93 kg/m or 89.5% of the calculated mass per unit length.
The QP believes the core recovery is typical for the rock types and alterations encountered at Los Azules and that the unrecovered core (fines, fractured materials or minor in-situ voids) does not introduce a significant or meaningful bias in sampling. The clay content at Los Azules is also very low.
CONCLUSIONS AND RECOMMENDATIONS
The metallurgical work completed to date provides comprehensive understanding of the expected performance characteristics of the Los Azules deposit. The anticipated copper extractions by lithologic type shown in Figure 10.22 are utilized in the block model to calculate NSR value for each block in conjunction. Copper recovered to cathodes will consider a heap efficiency and inventory factor of 95% of the extractable copper based on general experience and reported industry practice (Marsden J. O., Botz M. M., (2017) Heap Leach Modeling – A Review of Approaches to Metal Production Forecasting).
The expected overall total copper recovery expected is approximately 71% and is distributed over a three-year timeframe from placement on the leach pad to account for timing of active leaching cycles as the pad is constructed. The copper extraction methodology best reflects the potential variability related to host rock materials and the expected variability related to copper grades, mineralogy and recovery that can be practically applied in the mining modeling. The breakdown of extraction by ore-type as applied to the deposit are contained in Table 10.11.
ADEQUACY OF DATA AND USE
In the opinion of the QP, the metallurgical test work and analysis support the metallurgical assumptions provided and used in the mineral reserve and resource estimation, the FS mine plans, and the economic analysis presented in this report.
Although Nuton has completed larger scale testing at several global project sites and has developed proprietary modeling techniques to predict leaching performance results, there are no commercial applications of the Nuton® Technology operating at the time of this report. A significant testing program, including broader column testing of the project resources, site-based scale-up work will be required to validate these preliminary estimates. As such, these results are not considered suitable for inclusion at this time in the initial project case presented and information included is a demonstration of the potential future opportunity.
Mineral Resource Estimates
This subsection was prepared by Jeff Sullivan, PhD (FAusIMM), and Silvia Satchwell (FAusIMM) of CRM-SA.
The mineral resource estimate (MRE) for Los Azules was prepared utilizing three-dimensional block models coded with geological interpretation. Copper (total, cyanide soluble, and acid soluble), gold, and silver grades are estimated using Ordinary Kriging (OK). Density is calculated using inverse distance squared weighting (IDW). Model blocks measure 20 x 20m in plan and 15m vertically. Block grade estimates are derived from composited drill hole sample results and the interpretation of the geologic model, which relates to the spatial distribution of copper, gold, and silver in the deposit. To ensure the reported resource exhibits reasonable prospects for eventual economic extraction (RPEEE), the stated mineral resource is constrained by a pit shell generated around economic values in blocks classified as either Measured Resources, Indicated Resources, or Inferred Resources.
The pit was evaluated using a Net Smelter Return (NSR) value to cover processing and downstream costs such as freight and refinery charges. The NSR is computed using grade and other factors defined for each block. The computed NSR block value is compared with the NSR cutoff to classify the block as ore or waste value.
It is essential to recognize that the surface mining parameters are used solely to test the “reasonable prospects for eventual economic extraction,” and do not represent an attempt to estimate mineral reserves, which are presented in Section 12. These preliminary evaluations are used to prepare a Mineral Resource Statement and to select appropriate reporting assumptions.
INTRODUCTION
The mineral resource estimate is a summary of documents presented in 2021, 2022, 2023, and 2024 detailing the items discussed here 1,2,3,4,5,6,7,8. The previous MRE reported in the June 2023 IA has now been updated to include additional data collected during the 2022/2023 and 2023/2024 field seasons.
1 CRM, February 2022, Re-estimation of Copper Grades, Los Azules Project, Argentina
2 CRM, May 2022, Estimation of Gold and Minor Elements, Los Azules Project, Argentina
3 CRM, August 2022, Soluble Copper Estimation, Model Notes, Los Azules Project, Argentina
4 McEwen Copper 2023, NI 43-101 Report
5 CRM, November 2023, Data Analysis Note 1
6 CRM, November 2023, Data Analysis Note 2
7 CRM, December 2023, Data Analysis Note 3
8 CRM, December 2023, Data Analysis Note 4
The resource estimation was performed by Jeff Sullivan, PhD, and Silvia Satchwell of CRM-SA LLC, who serve as the qualified persons (QP) for the resource estimate.
Resource Database and Geological Model Extent
The current database is sufficient for preparing a long-range model that will serve as a basis for modeling associated with completing the Feasibility Study. The extent of mineralization along strike exceeds three kilometers, and the distance across strike is approximately one kilometer. The deposit is open at depth. Over the approximately 2.5 km strike length where mineralization is strongest, the average drill spacing ranges from approximately 50 to more than 120m. The central core of the enriched zone is drilled at an approximate 50m spacing. The assay database considers 627 drillholes with 132,255.2m of assayed intervals. Resource estimation work was performed using Datamine Studio modeling software.
Summary of Controls on Mineralization
Mineralization shows strong continuity from south to north and vertically. Laterally, grades decrease moving away from an NNW striking central structure. The primary control on copper mineralization is the modeled mineral zone, which generally follows the typical zoning of a porphyry copper deposit. Below the unmineralized overburden, a low-grade leach unit is found, which overlies a well-developed zone of secondary enrichment that transitions into primary mineralization at depth. The model also contains a small oxide/sulfide mixed zone. There are only traces of copper oxide mineralization.
A secondary control on grade is provided by lithology. In terms of copper grade, the strongest mineralization is found in relatively low-volume hydrothermal breccia. The remaining lithologies are intrusive rocks that are modeled according to the age of mineralization. The background diorite rock is a pre-mineral pluton intruded by a relatively narrow early mineral porphyry (EMP) and inter-mineral porphyry (IMP) events. The EMP has elevated grades relative to the diorite and IMP. Detailed logging has identified a set of veins, “A-Veins”, associated with early mineralization. The presence of “A-Veins” in the diorite identifies portions of the pre-mineral lithology located within the early mineralization halo. Higher copper grades are found in the diorite when “A-Veins” are present; a model of the presence of “A-Veins” is used to separate the diorite into two estimation domains. Combinations of lithology, “A-Vein” presence, and mineral zone are used to control the estimation; however, the combinations are applied differently for the models of copper, gold, and silver.
Additional observed controls on grade are:
Within the enriched zone, copper solubility decreases with depth moving downward from the leached/enriched boundary toward the enriched/primary contact. This change in solubility is associated with a change in copper mineralogy from chalcocite to chalcopyrite.
The highest grades are observed along a central, sub-vertical, NNW striking structure/fault. The elevated grades are due to both a higher proportion of the higher-grade lithologic units (breccia and EMP) near the structure, along with an increase in fracturing of the host rock. These properties of mineralization generate a lateral grade trend (a reduction in grade with increasing distance from the structure). As a result, grades are more continuous, parallel, as opposed to perpendicular, to the structure.
Globally, copper grades are well behaved with low relative variability. Grades are also well-behaved at high percentiles, and little outlier capping is required. Gold and silver grades are more variable. There are narrow breccia and late quartz vein occurrences that carry elevated precious metal grades. To address these geological outliers, a local capping algorithm was applied to identify and manage outliers.
Over large volumes, there is some correlation between average grades of copper, gold, and silver due to the control exerted by the central structure. Locally, however, correlation can be poor. The correlation between soluble and total copper is strong within the enriched zone, but the strength of the correlation varies by depth in the enrichment profile.
At the contacts between estimation domains, a sharp change in grade is generally observed for copper, and sharing samples across estimation units is not allowed (i.e., hard boundaries were utilized).
Spatial Correlation
Spatial correlation was modeled by mineral zone using pairwise relative variograms. Modeled variograms show the expected NNW anisotropy.
Block Model Validation
Ordinary Kriging estimated copper, gold, and silver grades, while density was estimated using inverse distance squared weighting. The checks performed to validate the estimates included:
Comparison of drillhole data and model grades in plan and section views.
Comparison of global averages by estimation domain.
Comparison of model and data (nearest neighbor estimates) averages, by estimation domain, over slices through the model and over large blocks.
These checks showed that the model reproduced the major features of the data, while the match between the model and data averages was acceptable.
Resource Classification
The mineral resources have been classified according to guidelines and logic summarized in the Canadian Institute of Mining, Metallurgy and Petroleum (CIM 2019), Definitions referred to in National Instrument 43-101. Resources were classified as Measured, Indicated, or Inferred by considering geology, sampling, and grade estimation aspects of the model. For geology, consideration was given to the confidence in interpreting the lithologic domain boundaries and geometry. For sampling, consideration was given to the number and spacing of composites, the orientation of drilling, and the reliability of sampling. For the estimation results, consideration was given to the confidence with which grades were estimated as Measured by the quality of the match between the grades of the data and the model.
Resource Summary
The Measured, Indicated, and Inferred Resources for the enriched and primary zones are presented in Table 11.1 on a 100% ownership basis. Mineral resources are determined using an NSR cut-off value to cover the processing cost for each recovery methodology. The resource is further constrained by a pit shell that demonstrates the reasonable prospects of eventual economic extraction (RPEEE) of this material.
Table 11.1: Mineral Resources (Exclusive of Mineral Reserves) | |||||||||||
|---|---|---|---|---|---|---|---|---|---|---|---|
|
Million Tonnes (MT) |
Average Grade |
Contained Metal |
|||||||||
|
CuT % |
CuSol % |
Au (g/t) |
Ag (g/t) |
Cu (Blbs) |
Au (Moz) |
Ag (Moz) |
|||||
Measured |
Supergene Leach |
3.6 |
0.244 |
0.113 |
0.0 |
||||||
Supergene Mill or Nuton Leach* |
8.2 |
0.075 |
0.033 |
0.06 |
1.83 |
0.0 |
0.0 |
0.5 |
|||
Primary Mill or Nuton Leach* |
2.1 |
0.359 |
0.066 |
0.06 |
1.77 |
0.0 |
0.0 |
0.1 |
|||
Total Measured |
Supergene Leach & Mill or Nuton Leach* |
13.8 |
0.161 |
0.059 |
0.0 |
0.0 |
0.6 |
||||
Indicated |
Supergene Leach |
248.4 |
0.303 |
0.167 |
1.7 |
||||||
Supergene Mill or Nuton Leach* |
69.4 |
0.112 |
0.043 |
0.04 |
1.03 |
0.2 |
0.1 |
2.3 |
|||
Primary Mill or Nuton Leach* |
633.9 |
0.254 |
0.046 |
0.05 |
1.16 |
3.6 |
0.9 |
23.7 |
|||
Total Indicated |
Supergene Leach & Mill or Nuton Leach* |
951.7 |
0.257 |
0.078 |
5.4 |
1.0 |
26.0 |
||||
|
Total Measured & Indicated |
Supergene Leach |
251.9 |
0.303 |
0.167 |
1.7 |
||||||
Supergene Mill or Nuton Leach* |
77.6 |
0.108 |
0.042 |
0.04 |
1.11 |
0.2 |
0.1 |
2.8 |
|||
Primary Mill or Nuton Leach* |
635.9 |
0.255 |
0.046 |
0.05 |
1.17 |
3.6 |
0.9 |
23.8 |
|||
Total M&I |
Supergene Leach & Mill or Nuton Leach* |
965.5 |
0.255 |
0.077 |
5.4 |
1.0 |
26.6 |
||||
Inferred |
Supergene Mill or Nuton Leach* |
601.1 |
0.292 |
0.131 |
0.04 |
1.32 |
3.9 |
0.9 |
25.5 |
||
Primary Mill or Nuton Leach* |
3,638.2 |
0.201 |
0.027 |
0.04 |
1.06 |
16.1 |
4.9 |
124.5 |
|||
Table 11.1: Mineral Resources (Exclusive of Mineral Reserves) | ||||||||||
|---|---|---|---|---|---|---|---|---|---|---|
|
Million Tonnes (MT) |
Average Grade |
Contained Metal |
||||||||
|
CuT % |
CuSol % |
Au (g/t) |
Ag (g/t) |
Cu (Blbs) |
Au (Moz) |
Ag (Moz) |
||||
Total Inferred |
Leach & Mill or Nuton Leach* |
4,239.3 |
0.214 |
0.042 |
20.0 |
5.7 |
149.9 |
|||
*Note: For the purposes of Mineral Resource estimation, a proven commercial process with a convention mill and concentrator has been assumed as the basis for RPEEE. Precious metals recovery is appropriate in this application, and gold and silver grades are shown. Alternately, if the Nuton® technology can be applied in future, the precious metals values will not apply.
Additional Notes to Table 11.1:
The Qualified Person for the Mineral Resource estimate is Jeff Sullivan – CRM-SA, LLC. Mineral Resources have an effective date of September 3, 2025. Mineral Resources are reported on a 100% basis.
Mineral Resources, which are not Mineral Reserves, do not have demonstrated economic viability. The estimate of mineral resources may be materially affected by environmental, permitting, legal, title, socio-political, marketing, or other relevant factors.
The quantity and grade of reported inferred mineral resources in this estimation are uncertain in nature and there is insufficient exploration to define these inferred mineral resources as an indicated or measured mineral resource; it is expected that further infill drilling will result in upgrading the majority of this material to an indicated or measured classification.
Reasonable prospects of eventual economic extraction are demonstrated by using a calculated NSR value in each block to evaluate an open pit shell using Measured, Indicated and Inferred blocks in Geovia Whittle™ pit optimization software.
NSR was calculated using the following: metal prices of $4.80/lb for copper, $2,500/oz for gold and $32/oz for silver, processing costs of $4.91/t for supergene and $4.88/t for primary ores, total freight costs of $150/t for concentrate, selling costs of $0.02/lb for copper.
A marginal cut-off was used that was variable ranging from $4.79/t NSR to $7.23/t NSR based on extraction of the resource from the enriched zone using sulfuric acid bioleaching and SX/EW copper recovery; the recovery was calculated using the extractions shown in Table 15.2 and applying a 95% operational efficiency.
Supergene and primary material can potentially be treated in a mill/concentrator with NSR cut-offs of $5.13/t for supergene and $5.11/t for primary respectively. The mill has the added benefit of also recovering the gold and silver present in the resource.
Additional parameters are used for the NSR calculation for this scenario.
Depending on the potential depth of the pit, total pit slope angles ranged from 32° to 37° depending on the sector. Overburden slopes were set at 32°.
Composites of 2 m length were capped where needed; the capping strategy is based on the distribution of grade which varies by location (i.e. domain or proximity to controlling structures) and the associated potential metal removal. The resource estimate is based on uncapped copper grades; local capped grades are used for gold and silver.
Block grades were estimated using a combination of ordinary Kriging and inverse distance squared weighting depending on domain size.
Model blocks are 20 m x 20 m x 15 m in size.
Mineral Resources under the cryogenic geoforms are classified as inferred.
Mineral Resources under the cryogenic geoforms are at higher risk of being converted to Measured or Indicated Resources. Table 11.2 details the material in the environmentally sensitive area under the cryogenic geoforms that have been classified as Inferred Resources.
Table 11.2: Inferred Resources under the Cryogenic Geoforms (Exclusive of Mineral Reserves) | |||||||||
|---|---|---|---|---|---|---|---|---|---|
|
Million Tonnes (MT) |
Average Grade |
Contained Metal |
|||||||
|
CuT % |
CuSol % |
Au (g/t) |
Ag (g/t) |
Cu (Blbs) |
Au (Moz) |
Ag (Moz) |
|||
Total Inferred |
Leach & Mill or Nuton Leach* |
19.8 |
0.073 |
0.009 |
0.04 |
1.09 |
- |
- |
0.7 |
Resource Model Audit
A third-party review of the geologic and resource models was undertaken by the Snowden-Optiro4 group in October 2024. They provided a comprehensive review of the procedures, data, geological models, and the estimation processes leading to the Mineral Resource Estimate (MRE) for Los Azules. The conclusion is that the process has been carried out to reasonable industry standards, and no material issues were detected. The mineral resource work provides for a reliable model to be used as a basis for the Feasibility Study objectives. The key findings and recommendations are detailed in the following sub-sections.
Resource Estimate
Twenty-three domains, based on mineralization, lithology, and A-vein models, were established to control copper estimates. Snowden Optiro notes that the chosen units are geologically and statistically consistent and appropriate for copper estimation domaining.
The sample compositing and capping strategy for copper variables is appropriate.
The block estimation parameters and methodology have been carefully considered. Innovative methods were used to account for vertical trends related to the copper enrichment process, as well as to avoid inconsistencies related to a small proportion of lacking assays for some of the soluble copper components.
Verification exercises performed as part of this review delivered good results and did not detect any material issues with the final estimates. These included:
A check estimation model run by Snowden Optiro compared well to the official estimate
Comparison of the theoretical to the block model grade-tonnage curves shows some smoothing that can be expected given the wide spacing of the drill hole information. At the production stage, closely spaced blast hole information will be available for a more accurate local prediction of grades and the associated grade-tonnage relationship. The smoothing results in slightly higher tonnages and lower grades at selected low cut-off grades, compared to the theoretical estimate. The smoothing is expected to account for operational dilution factors in the eventual mining process.
Swath plots and visual comparisons between estimated block model grades and the underlying data show good correlations, providing supporting evidence for the reliability of the model.
Domain boundaries were based on 3D wireframe models that capture the geological boundaries precisely. On the other hand, the block model considers 15m mining benches. Consequently, bench dilution is not included in the model. This is only significant at the top of the enrichment zone, where an abrupt grade boundary is noted between leached and mixed dominant waste units and the underlying high-grade copper enriched unit. While this dilution will be confined to blocks falling on the geological boundary, the impact on the overall secondary enrichment unit is not significant. Moreover, the unavoidable smoothing in the block estimates is expected to have made more than sufficient allowances to cover dilution factors.
Available Data
Figure 11.1 is a plan map of the project area showing the collar location and year drilled for all holes used in this MRE. Some of the drilling conducted by the Battle Mountain Group in 2008 has been excluded due to the lack of lithologic logging and assay certificates. This excluded data represents a very small fraction of the total drilling.

Figure 11.1: Drill Hole Location Map (CRM 2025)
Copper grades are associated with specific structures. The most important of these is oriented at approximately N20W. For this reason, the deposit is drilled on oblique sections separated by 50m. Each section is assigned an identifier which is used when referring to the section in the text of the document. The section lines are presented in Figure 11.2.

Figure 11.2: Section Lines in Section Layout, Level 3500 (CRM 2025)
GEOLOGIC MODEL
Introduction
The following is a summary of understanding the genesis, interpretation criteria, and parameters used in the geological modelling of the Los Azules deposit, detailed in a report by Atticus Geoscience (Mortimer, 2024). The model will assist in ongoing exploration and is used as a base for the 2024 MRE model described herein. The 3D geological model was constructed using Leapfrog software.
Geological Evolution
The Los Azules deposit contains overprinting mineralization and alteration events, and it is necessary to understand the time and spatial relationships of these events to develop an integrated geological model.
A pre-mineral dioritic stock intruded the deposit area between 10.6 Mya and 10.7 Mya (Zurcher, 2008b). Shortly after the emplacement of this stock, the diorite was pervasively altered with chlorite-magnetite alteration that was accompanied by chalcopyrite mineralization in the upper levels of the pluton grading into potassic alteration with chalcopyrite and bornite mineralization at depth, around 9.2 Mya, a NNW-trending rhyodacite porphyry dike, which is referred to as the “Early Mineralized Porphyry Dike” (“EMP”). The dike is approximately 3.6 km long, 20 m to 400 m wide, and dips steeply to the east. The EMP was responsible for the best grade of hypogene mineralization, and it typically contains 0.25% to 0.35% hypogene copper. Early magmatic-hydrothermal breccias associated with the intrusion of the EMP occur along the edges and above the main dike.
Another NNW-trending porphyry dike intruded the sequence around 8.2 Mya. These dikes are dacitic in composition and dip steeply to the east. The dikes are referred to as Inter Mineral dikes (“IMP”) and tend to be more prevalent along the eastern edges of the EMP. These dikes are approximately 1.9 km long with widths ranging from 20 m to 70 m. Inter-mineral magmatic-hydrothermal breccias associated with the emplacement of these dikes occur along the edges of the dikes. Sericitic alteration began to form during the emplacement of the EMP and IMP, with a late sericite alteration that overprinted the underlying potassic alteration in the upper levels of the system and introduced additional pyrite and chalcopyrite. Late in the system's evolution, minor erratic quartz veins were emplaced that contained base and precious metals. As the system waned and shut down, supergene enrichment began and continues to the present day. A more detailed description of the geological evolution of the area is described in Chapter 7.
The development of all models, cross-cutting relationships, and construction sequences are based on the geological evolution and known events, the evidence for which comes from direct observations of cross-cutting relationships seen in the field and in the drill core.
Structural Model
The structural regime played a fundamental role in mineralization, alteration, mineral zonation, and the development of intrusive lithologies. Structures at Los Azules influenced the emplacement and geometry of the early mineral and inter-mineral porphyries. The same structures also had an impact on later overprinting of alteration and on the development of the supergene blanket.
A detailed structural model was developed by CIGEA in early 2024 using the combination of surface mapping, Televiewer data, and drill hole information. The model defined the location, extension, and hierarchy of the faults within the Los Azules deposit. Only fault surfaces defined in the CIGEA modeling were utilized in the modelling process. The CIGEA structural model is explained in more detail within the Structural Geology section in Chapter 6.
Within the Los Azules deposit, the faults listed in Table 11.3 have been recognized to have a controlling influence on the emplacement of the intrusions (Figure 11.3) and the mobilization of the fluids that have defined the alteration and mineralization solids (Mortimer, 2024):
Table 11.3: Principal Controlling Structures (Mortimer, 2024) | ||
Ballena |
Controls the development of the intrusion in the south, but acts a boundary north of the Largatija fault |
|
Largatija |
Controlling structure between the intersection of the Ballena & Vega |
|
Piuquenes |
The principal controlling structure of the deposit |
|
Emma |
Appears to be controlling, but also limiting |
|

Figure 11.3: The early mineral porphyry (red) and its relation to the Ballena, Largatija, Piuquenes, and Emma faults (grey). (CRM 2025)
Figure 14.4 shows the location of first and second order faults and their relationship to potassic and sericitic alteration. Potassic and sericitic alteration formed along NNW trends that coincide with the orientation of the early and inter-mineral porphyries and first and second order faulting.

Figure 11.4: First and second-order faulting and their relationship to potassic and sericitic alteration. Faults are shown in grey, potassic alteration in purple, and sericitic alteration in green. Oblique plan view. (CRM 2025)
In addition to the four faults controlling the porphyry emplacement, six faults have been recognized as acting as boundaries and having a controlling influence on the movement of blocks (Table 11.4 and Figure 11.5). The limiting parameter of a fault is not defined as an exact fault surface but more of a fault zone containing broken and fractured material (Mortimer, 2024):
Table 11.4: Principal boundary faults (Mortimer, 2024) | |
|---|---|
Fault |
Interpretation & Role in modelling |
Ballena |
Acts as a boundary north of the Largatija Fault, but controlling the intrusion further south |
Los Azules |
Acts as a boundary fault with uplift to the east |
Vega |
Acts as a boundary fault with uplift to the east |
Cairo |
Develops a boundary to the between the Ballena Laguna faults |
Emma |
Appears to be limiting, but also controlling |
Laguna |
Defines a large displacement and change in structural style |

Figure 11.5: Faults that act as boundaries to mineralization are labeled in plain view (block model copper grades level 3500m are also shown). (CRM 2025)
Despite recognizing certain faults as boundary faults, no structural blocks were defined as it was not possible to confidently measure a displacement across either side of any of these faults.
Lithology Model
Lithological contacts and solids have been constructed from integrating data from the lithology and alteration data input tables in the database. Potassic alteration has a close relationship with the location of the early and inter-mineral porphyries. Magmatic and hydrothermal breccias often formed along the edges and above these porphyries. The breccias formed due to over pressurization along the margins of the porphyries. These breccias are often more permeable than the surrounding rocks and thus often contain higher grades. The geological map was also used to define contacts for the volcanics and quaternary cover.
The lithology model is constructed using an event modeling concept, where each contact surface is built following geological chronology, and each unit is constructed in sequence. Table 11.5 describes the units that are modelled and their order in the event sequencing.

All surfaces within this model have been constructed using implicit modelling, interpolating between known contact points (drill holes intercepts) using a radial basis function (dual kriging) with interpolation parameters fitting with the geological interpretation of each surface and with subsequent editing guided by sectional and level plan interpretations. The volcanic-diorite contact surface is built using geological mapping interpretation lines. Only intrusive dikes that have a true width of greater than 10 m (half the width of a standard 20x20x15 m block) have been modeled. Figure 11.6 shows an example of the lithological model in plan and section views.


Figure 11.6: Level plan (3270 m) and section 37 of the lithological model. (CRM 2025)
Alteration Model
Alteration modeling has been developed by using a series of models to reflect the evolution of the deposit, the overprinting of the alteration types, and the telescoping or multiple-phase nature of the development of the porphyries (Mortimer, 2024). Only the reactive lithologies present at the time of porphyritic intrusions can be affected by the alteration, so the model only considers lithologies below the quaternary cover surface. Separate models were created for potassic alteration, phyllic-sericite alteration, phyllic-chlorite-sericite alteration, phyllic-sericite-kaolinite alteration, and argillic alteration. Contact surfaces and solids of the alteration model are based directly on drill data, constructed using integrated data from interval fields in the alteration, lithology, and assay data tables. Hyperspectral data was also used for all alteration models as an additional input. Alteration surfaces are built using implicit modelling, interpolating between known contact points (drill hole intercepts) with interpolation parameters fitting with the geological and structural interpretation.
Copper Mineral Zonation Model
The copper mineral zonation model surfaces and solids were constructed using interval selections from the assay, mineralogy, and lithology drill data tables. Interval selections are based primarily on the sequential copper assay data and mathematically defining the mineral zone category into oxide (‘OX’), mixed (‘MX’), supergene enriched (‘SG’), transition (‘TR’), and hypogene (‘HY’). Table 11.6 shows the criteria used to define each of these zones.
Table 11.6: Mineral Zonation Criteria. | |
Sequential Copper Assays (%) |
Category |
Acid Soluble Copper >= 30% |
OX: Oxide |
Cyanide Soluble Copper >= 50% |
SG: Supergene (Enriched) |
Residual Copper Content >= 80% |
HYP: Hypogene (Primary) |
Cyanide SolCu <= 50% AND Acid SolCu >= 15% |
MIX: Mixed |
Cyanide SolCu <= 50% AND Residual Cu <= 80% |
TR: Transition |
The leached zone (‘LX’) could not be defined from the sequential copper assay and was assigned based on a combination of geological logging, the absence of copper, and presence of iron oxides. Additional categories of primary bornite (‘BN’) and primary bornite-chalcopyrite (‘BN-CPY’) were assigned based on sequential copper assays below the base of the supergene surface and confirmed through logging and visual presence of bornite.
The mixed (‘MX’) category has undergone partial oxidation and/or partial leaching of the supergene zone and exhibits repeated fluctuation between oxide and supergene. The transition zone (‘TR’) is a region of primary copper mineralization that has undergone partial supergene enrichment through repeated fluctuation between hypogene and supergene. There is not enough material to define an oxide solid. True oxide material is rare and could not be modeled. Table 11.7 shows the sequence of geological events that have altered and affected the Los Azules deposit.
Table 11.7: Geologic Events Altering and Effecting the Los Azules Deposit | ||
Sequential |
Event |
MX Sub-model |
|
Erosion (Topography) |
|
|
Quaternary cover |
|
|
|
|
|
LX (Leached) |
|

|
MX (Mixed) |
SG |
|
SG (Supergene) |
OX |
|
TR (Transition) |
MX |
|
BN (Primary Bornite) |
PLX |
|
BN-CPY (Primary Bornite-Chalcopyrite) |
|
|
HYP (Hypogene) |
|
Estimation domains for the copper resource are the copper mineral zonation models, except that the transition surface is eliminated, and the definition of the base of the supergene has been defined using geological logging. Four sub-models for the Mixed zone (MX, OX, PLX, SG) were created to better define the components of this zone and are shown in Table 14.7. These sub-models are defined as: MX is within the Mixed zone and contains CuT% grades of ≥ 0.1. OX is within the Mixed or Oxide zone and contains CuT% grades of ≥ 0.1. PLX is within the Mixed zone and has CuT% grades of ≥0.05 to <0.1. Finally, SG is within the Mixed zone and the Supergene zone and has CuT% grades of ≥0.1.
The copper zonation models are built using implicit modelling, interpolating between known contact points (drill hole intercepts) fitting with the geological interpretation and with subsequent editing guided by sectional and plan interpretations. The structural regime considered to be active during the supergene weathering event is a component in the modelling, extending the SG and TR into the primary mineralization (Mortimer, 2024).
Conclusions and Recommendations
The construction methodology of the geological models is extremely robust. It breaks the deposit down into its component events and, by understanding each of the controls related to that event, yields a greater understanding of the deposit and a more robust series of interrelated models. The modelling is carried out in sequence: structure – lithology – alteration – mineralization – zonation, with iterative revision and reconstruction.
Modelling has benefited from the use of a robust structural model that has been a solid component in all model constructions.
Continued exploration and drilling, especially through angled holes, will help better define and improve confidence in the model going forward.
Overall, modelling shows that Los Azules is a large, structurally controlled porphyry deposit, open in several directions and at depth. The extensive supergene enriched zone has developed down structures that transition into primary sulfide mineralization. Modelling shows multiple bornite centers within the primary zone, highlighting exploration potential at depth and along the currently modelled structures.
DATA ANALYSIS - COPPER
The data are analyzed to determine the geological controls on grade, define estimation domains, and identify outliers. This information is key for the design of the estimation approach, including the search strategy.
Compositing
Composites are created from irregular length sample intervals to produce equal length grade data that can be directly compared. To avoid excessively averaging or smoothing the grade data, the composite length is linked to the sampling interval. For previous drilling campaigns, irregular sample lengths were sometimes used during the logging and sampling process; however, the most common sampling interval (over 90% of the assays) has been 2m. To preserve the details of the original logging and minimize the amount of grade smoothing, a 2m length was selected for compositing.
Composites are of equal length (without any splitting for changes in lithology or mineral zone) beginning at the first assayed interval. Within each 2m interval, the majority-logged geologic variable (lithology, mineral zone, vein type, vein intensity, etc.) over the interval is assigned to the composite. At the base of each drillhole, the composite length can range from 1 to 3m. Composites shorter than 1m are not considered. Random checks of the composited grades were performed, and no errors were detected.
Exploratory Data Analysis - Copper
The exploratory data analysis (EDA) is performed to determine the important controls on grades. Use of these controls during estimation will improve model quality and better define the spatial extent of high- and low-grade volumes. Statistical analysis is a key component of the EDA; however, statistical results are only valid over volumes where representative (non-clustered) sampling has been performed. For this reason, before statistical evaluation, an assessment of the behavior of grades in space and the consistency of the drill spacing is required.
Once the key controls on grade are determined, the deposit is sub-divided into volumes (domains) in which the statistical behavior of grades is consistent. Resource model blocks located within a domain are identified/coded and then estimated using a constant, domain-specific set of estimation parameters.
Spatial Declustering
Recent exploration drilling has focused on the central, higher-grade, portion of the deposit with the objective of defining a Measured Resource within the projected five-year pit. This focus of the central part of the pit results in an unequal spatial distribution of data and a relative oversampling of the higher-grade portions of the deposit. To remove this sampling bias, a volume of influence declustering weight is used in all statistical computations.
Basic Statistics
Major logging variables that impact copper grades are mineral zone and lithology. The spatial extent of these geologic variables was defined through the development of the 3D geologic model. The wireframes generated by the geologic model were used to code the regular 20x20x15m model blocks and the 2m composite data. The geologic codes used in data analysis are thus defined by the model rather than the actual logging of the composite.
The total volumes of the modeled mineral zones and lithology units are presented in Table 11.8.


Figure 11.7: Average Copper Grades by Lithology and Mineral Zone (CRM 2025)
Aside from elevated grades (from relatively few data) in the bornite (Bn) and bornite-chalcopyrite (Bn-CPy), the largest average copper grades are found in the enriched zone. The largest enriched zone grades are associated with the early mineralization lithologies (Early Mineral Porphyry (102) and Early Mineral Breccia (106)). A large number of data reports to the pre-mineral diorite which has relatively low grade.
Behavior of Grades in Space
Within the enriched mineral zone, the copper grades show a strong lateral trend moving away from the center of the deposit defined by important parallel NNW striking faults. The grade trend is illustrated for the enriched zone in Figure 11.8 which presents total copper 2m composites grades and a simplified representation of the central structure for level 3450.
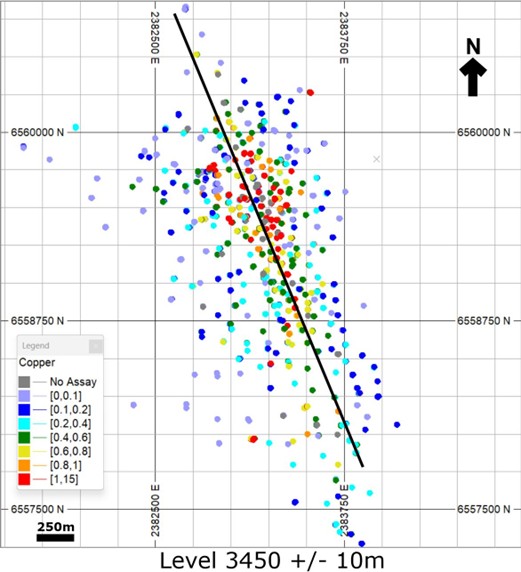
Figure 11.8: Level 3450 +/- 10m, Enriched Zone, 2m Composite Grades (CRM 2025)
Higher grade early mineralization (lithologies 102 and 106) is located near the central structure and contribute strongly to the grade distribution pattern. Additionally, grades in the pre-mineral diorite show an important lateral grade trend with distance from the central line (Figure 11.9).

Figure 11.9: Average Total Copper Grade by Distance to Central Line (CRM 2025)
As shown, average copper grades in the diorite decrease from about 0.6% (near the structure where early mineralization is present) to less than 0.2% at greater lateral distances from the deposit center. The number of 2m composites is important and reproduction of this grade trend will be a key objective of the resource model. A parallel structure is seen to the west of the main structure explaining the peak grades at distance -650m.
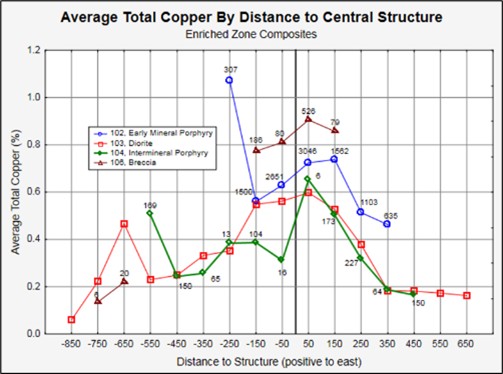
Figure 11.10: Copper grades as a function of distance for lithologies in addition to the diorite (CRM 2025)
The early mineral lithologies (breccia and porphyry) show relatively consistent grades and the number of observations for these lithologies is largest near the structure (distance 50). The plot indicates that there is an association between the presence of early mineralization and elevated grades in the diorite. The inter-mineral porphyry is most common to the east of the central structure and near the secondary peak at -550m. This lithology is uncommon within 50m of the central structure, but grades generally decrease with lateral distance.
Veining and Association with Grade
Vein type (mineralogy and/or relative age) and vein intensity/frequency were logged. The earliest set of veins (A-Veins) are key to defining the higher-grade, early mineralization (early porphyry and breccia). Based on this geological association, a relationship between logged vein type and copper grade was expected. Figure 11.11 presents a box plot of copper grades, by lithology, for the enriched zone after considering the primary vein type.

Figure 11.11: Box Plot by Primary Vein Type and Lithology (CRM 2025)
Across all lithologies, average copper grades are larger for composites with dominant logged A veins. As shown in the figure, “A-Veins” are by far the most commonly observed vein type for the lithologies associated with early mineralization (102 and 106; 88 and 96% A veins respectively). Lithology 104 (inter-mineral porphyry) contains a mixture of A, D, and other veins and does not easily fit into the early/late mineralization breakdown.
The most important distinction provided by the vein type is found in the pre-mineral diorite (103) where 50% of the data have logged A veins and about 25% of the data have logged D veins. Average and median grades decrease moving from the A vein group to the D vein group and finally to the “no vein” group. For this lithology, the presence of A veins appears to allow identification of pre-mineral material that has been mineralized during the early mineral intrusive event.
An A vein indicator block model was created to allow definition of a continuous volume of A vein presence. Blocks with an estimated “A-Vein” proportion greater than 50% were accepted as containing A veins and composites located within these blocks were defined as “A-Vein” dominant.
Since the veining pattern is vertically consistent throughout the deposit, the vein type coding was applied across all mineral zones. Box plots of total copper grade by lithology and vein-type are presented in Figure 11.12 for the enriched and hypogene zones.


Figure 11.12: Box plots of total copper grade by lithology and vein-type (CRM 2025)
Given the relatively small amount of data in the hypogene zone (and the resulting lack of control on grades during estimation), the presence of “A-Veins” is used to create separate estimation domains (“A-Veins” vs non “A-Veins) for all lithologies to laterally restrict the extent of elevated grades (reduce lateral grade smearing). For the enriched zone, a separation by vein type was only made within the diorite unit.
The enriched zone lateral grade pattern following separation of the diorite based on vein type is presented in Figure 11.13.

Figure 11.13: Average Copper by Distance to Central Structure and Lithology (CRM 2025)
As shown, the diorite with “A-Veins” (domain 1031) now presents a spatial pattern similar to that of the early mineral porphyry (lithology 102). Grades in the diorite without A veins show consistently low grades across the deposit. Grades in this domain are not clearly impacted by the (early?) mineralization associated with the central structure.
Relative Depth And Distance to Base of Enrichment
Within the enriched zone, there is a change in mineralogy moving from the top (chalcocite dominant) to the base of the zone (chalcopyrite dominant). Associated with this change in mineralogy is a change in copper grades and copper solubility (both cyanide and acid soluble). The base of the enriched zone is defined from grade-based ratio thresholds and is clearly not a hard boundary.
As a result, there are zones of higher solubility within the primary zone. Specifically, primary zone solubility is greatest at the selected base of the enriched zone and decreases in the primary zone as distance from the contact increases.
To model this solubility trend, two sets of transformed coordinates are defined:
In the enriched zone, relative depth is defined. The block model is used to define this quantity. For each column of enriched zone blocks (constant X and Y centroids) the total number of enriched blocks is determined, blocks are assigned a bottom-up sequence number (1 to the number of blocks in the column), and relative depth is defined as sequence number divided by total number in the column. The relative depth of the block is assigned to all composites located in the block.
In the primary zone, the blocks adjacent to the enriched/primary contact are assigned a distance of 7.5m below the contact. Working within the column of primary zone blocks, a distance of 22.5m is assigned to the second block below the contact, 37.5m is assigned to the third block below the contact and so on. Again, these distances are then assigned to all composite data falling within the block.
Average copper grades and the ratio of soluble to total copper grades in the enriched zone are presented in Figure 11.14. Grades as a function of relative depth are presented for two northing zones which roughly represent the southern single zone of mineralization and the more complex northern zone where several mineralized zones appear to be present.

Figure 11.14: Enriched Zone Composites, Average Grade and Solubility By Depth (CRM 2025)
For both location zones, copper grades and the solubility ratios clearly decrease with depth in the enriched zone. The resource model must capture this grade trend.
Vertical solubility trends are also observed in the hypogene zone (Figure 11.15).

Figure 11.15: Hypogene Zone Composites, Average Copper and Solubility Below Base of Enrichment (CRM 2025)
Average cyanide soluble copper grades decrease slightly but systematically with depth below the base of enrichment. Total copper grades are relatively stable with depth. Cyanide copper solubility decreases from about 27% near the base of the enrichment to 21% at about 50m below the base of the enriched zone. Depth below the enriched zone contact will be used to control estimation in the hypogene zone.
ESTIMATION DOMAINS – COPPER
The copper estimation domains are the same for the total, cyanide-soluble, and acid-soluble species. The domains, determined based on the data analysis presented, are identified in Table 11.9.
Table 11.9: Copper Estimation Domains |

Estimation domain 1000 is a small volume of narrow, high-grade, primary zone, mineralization intersected by two drillholes. This material is located outside of the main orebody associated with a NE oriented structural zone whose surface expression is one of the northern vegas (wetlands). To date oxide/enriched material has not been observed in this zone. Copper grades in this domain were assigned (2.2%) based on the average grade of the composites located within the wireframe of the domain.
The spatial distribution of the estimation domains and a comparison with the drillhole data is provided in Figure 11.16.

Figure 11.16: Spatial distribution of the estimation domains and a comparison with the drillhole data. Looking NW. (CRM 2025)
Basic statistics by domain are shown in Table 11.10, Table 11.11, and Table 11.12.
Table 11.10: Total Copper % Declustered Statistics by Estimation Domain | |||||||||||
|---|---|---|---|---|---|---|---|---|---|---|---|
|
Estimation Domain |
Number |
Average |
Standard Deviation |
Coef. Of Variation |
Minimum |
Percentile |
Maximum |
||||
25th |
50th |
75th |
95th |
98th |
|||||||
1 |
1,049 |
0.017 |
0.028 |
1.6 |
0.00 |
0.01 |
0.01 |
0.02 |
0.04 |
0.07 |
0.7 |
2 |
10,927 |
0.027 |
0.028 |
1.0 |
0.00 |
0.01 |
0.02 |
0.03 |
0.07 |
0.09 |
1.9 |
4 |
405 |
0.214 |
0.172 |
0.8 |
0.02 |
0.11 |
0.16 |
0.26 |
0.52 |
0.87 |
1.2 |
5 |
2,063 |
0.345 |
0.263 |
0.8 |
0.01 |
0.19 |
0.28 |
0.41 |
0.82 |
1.15 |
2.3 |
6 |
957 |
0.316 |
0.178 |
0.6 |
0.07 |
0.21 |
0.28 |
0.37 |
0.61 |
0.78 |
2.1 |
9 |
569 |
0.177 |
0.127 |
0.7 |
0.01 |
0.11 |
0.15 |
0.21 |
0.39 |
0.51 |
1.9 |
Table 11.10: Total Copper % Declustered Statistics by Estimation Domain | |||||||||||
|---|---|---|---|---|---|---|---|---|---|---|---|
|
Estimation Domain |
Number |
Average |
Standard Deviation |
Coef. Of Variation |
Minimum |
Percentile |
Maximum |
||||
25th |
50th |
75th |
95th |
98th |
|||||||
10 |
1,529 |
0.060 |
0.067 |
1.1 |
0.00 |
0.03 |
0.05 |
0.07 |
0.14 |
0.20 |
1.2 |
11 |
532 |
0.258 |
0.245 |
0.9 |
0.01 |
0.11 |
0.18 |
0.32 |
0.68 |
1.08 |
2.1 |
107 |
358 |
0.005 |
0.011 |
2.1 |
0.00 |
0.00 |
0.00 |
0.01 |
0.02 |
0.03 |
0.2 |
1000 |
29 |
2.552 |
2.117 |
0.8 |
0.23 |
0.88 |
2.28 |
2.91 |
6.55 |
9.21 |
9.2 |
3102 |
9,917 |
0.601 |
0.438 |
0.7 |
0.01 |
0.32 |
0.51 |
0.77 |
1.40 |
1.78 |
12.9 |
3104 |
1,921 |
0.313 |
0.241 |
0.8 |
0.01 |
0.16 |
0.26 |
0.40 |
0.73 |
0.91 |
3.5 |
3106 |
960 |
0.690 |
0.550 |
0.8 |
0.02 |
0.31 |
0.58 |
0.89 |
1.66 |
2.23 |
5.8 |
31031 |
6,583 |
0.491 |
0.354 |
0.7 |
0.01 |
0.26 |
0.41 |
0.63 |
1.14 |
1.47 |
8.2 |
31032 |
8,577 |
0.269 |
0.258 |
1.0 |
0.00 |
0.13 |
0.21 |
0.33 |
0.67 |
0.97 |
4.9 |
71021 |
3,574 |
0.400 |
0.296 |
0.7 |
0.01 |
0.23 |
0.32 |
0.48 |
0.91 |
1.26 |
3.8 |
71022 |
560 |
0.267 |
0.212 |
0.8 |
0.03 |
0.14 |
0.23 |
0.33 |
0.56 |
0.78 |
2.5 |
71031 |
3,392 |
0.307 |
0.258 |
0.8 |
0.01 |
0.15 |
0.24 |
0.38 |
0.73 |
1.12 |
4.4 |
71032 |
10,627 |
0.169 |
0.200 |
1.2 |
0.00 |
0.06 |
0.12 |
0.21 |
0.47 |
0.66 |
3.9 |
71041 |
497 |
0.209 |
0.122 |
0.6 |
0.02 |
0.13 |
0.18 |
0.25 |
0.42 |
0.53 |
1.1 |
71042 |
450 |
0.184 |
0.125 |
0.7 |
0.01 |
0.10 |
0.15 |
0.22 |
0.39 |
0.59 |
0.9 |
71061 |
116 |
0.688 |
0.260 |
0.4 |
0.26 |
0.55 |
0.65 |
0.78 |
1.25 |
1.43 |
2.3 |
71062 |
248 |
0.440 |
0.429 |
1.0 |
0.01 |
0.20 |
0.31 |
0.53 |
1.16 |
1.33 |
3.4 |
All Grps |
65,840 |
0.250 |
0.310 |
1.2 |
0.00 |
0.05 |
0.16 |
0.33 |
0.79 |
1.14 |
12.9 |
Total copper grades show relative variabilities less than 1.0, which is typical for porphyry copper deposits. Comparison of the 95th and 98th percentile grades with the observed maximum indicates that there are a small number of outlier grades. Generally, there are important differences in the average grades of domains within the same mineral zones. Importantly, the presence of “A-Veins” in the enriched diorite nearly doubles the average copper grade compared to diorite without the influence of the early mineralization (domains 31031 and 31032).
Table 11.11: Cyanide Soluble Copper(%), Declustered Statistics By Estimation Domain | |||||||||||
|---|---|---|---|---|---|---|---|---|---|---|---|
Estimation |
Number |
Average |
Standard |
Coef. Of |
Minimum |
Percentile |
Maximum |
||||
25th |
50th |
75th |
95th |
98th |
|||||||
1 |
1,048 |
0.002 |
0.014 |
7.8 |
0.00 |
0.00 |
0.00 |
0.00 |
0.00 |
0.00 |
0.4 |
2 |
10,694 |
0.004 |
0.016 |
4.6 |
0.00 |
0.00 |
0.00 |
0.00 |
0.01 |
0.03 |
1.6 |
4 |
391 |
0.067 |
0.070 |
1.1 |
0.00 |
0.02 |
0.05 |
0.09 |
0.18 |
0.26 |
0.6 |
5 |
2,062 |
0.090 |
0.104 |
1.2 |
0.00 |
0.03 |
0.06 |
0.10 |
0.25 |
0.39 |
1.1 |
6 |
957 |
0.175 |
0.124 |
0.7 |
0.02 |
0.10 |
0.15 |
0.22 |
0.39 |
0.47 |
1.4 |
9 |
562 |
0.058 |
0.078 |
1.3 |
0.00 |
0.01 |
0.04 |
0.09 |
0.17 |
0.22 |
1.5 |
10 |
1,509 |
0.021 |
0.049 |
2.3 |
0.00 |
0.00 |
0.01 |
0.03 |
0.07 |
0.12 |
1.0 |
11 |
521 |
0.174 |
0.194 |
1.1 |
0.00 |
0.06 |
0.11 |
0.20 |
0.50 |
0.78 |
1.6 |
107 |
358 |
0.001 |
0.003 |
2.7 |
0.00 |
0.00 |
0.00 |
0.00 |
0.00 |
0.01 |
0.0 |
1000 |
29 |
0.420 |
0.679 |
1.6 |
0.01 |
0.03 |
0.11 |
0.40 |
2.30 |
2.60 |
2.6 |
3102 |
9,911 |
0.391 |
0.339 |
0.9 |
0.00 |
0.17 |
0.30 |
0.51 |
1.04 |
1.36 |
7.2 |
3104 |
1,884 |
0.200 |
0.212 |
1.1 |
0.00 |
0.08 |
0.14 |
0.26 |
0.54 |
0.71 |
3.6 |
3106 |
956 |
0.430 |
0.418 |
1.0 |
0.00 |
0.13 |
0.34 |
0.58 |
1.19 |
1.57 |
5.0 |
31031 |
6,519 |
0.296 |
0.288 |
1.0 |
0.00 |
0.11 |
0.22 |
0.38 |
0.81 |
1.16 |
7.2 |
31032 |
8,550 |
0.166 |
0.197 |
1.2 |
0.00 |
0.06 |
0.11 |
0.21 |
0.49 |
0.71 |
3.6 |
71021 |
3,574 |
0.076 |
0.115 |
1.5 |
0.00 |
0.01 |
0.03 |
0.10 |
0.28 |
0.41 |
1.7 |
71022 |
560 |
0.027 |
0.044 |
1.7 |
0.00 |
0.01 |
0.01 |
0.03 |
0.10 |
0.17 |
0.4 |
71031 |
3,315 |
0.053 |
0.091 |
1.7 |
0.00 |
0.01 |
0.02 |
0.06 |
0.21 |
0.32 |
1.7 |
71032 |
10,471 |
0.018 |
0.052 |
2.8 |
0.00 |
0.00 |
0.01 |
0.02 |
0.07 |
0.11 |
2.6 |
71041 |
497 |
0.038 |
0.051 |
1.3 |
0.00 |
0.01 |
0.02 |
0.05 |
0.14 |
0.20 |
0.4 |
Table 11.11: Cyanide Soluble Copper(%), Declustered Statistics By Estimation Domain | |||||||||||
|---|---|---|---|---|---|---|---|---|---|---|---|
Estimation |
Number |
Average |
Standard |
Coef. Of |
Minimum |
Percentile |
Maximum |
||||
25th |
50th |
75th |
95th |
98th |
|||||||
71042 |
450 |
0.018 |
0.019 |
1.0 |
0.00 |
0.01 |
0.01 |
0.02 |
0.06 |
0.07 |
0.1 |
71061 |
116 |
0.166 |
0.219 |
1.3 |
0.01 |
0.02 |
0.06 |
0.24 |
0.62 |
0.93 |
1.0 |
71062 |
248 |
0.033 |
0.084 |
2.6 |
0.00 |
0.01 |
0.01 |
0.03 |
0.08 |
0.21 |
0.9 |
All Grps |
65,182 |
0.105 |
0.203 |
1.9 |
0.00 |
0.00 |
0.02 |
0.12 |
0.47 |
0.73 |
7.2 |
Compared with total copper, relative variability is larger for cyanide soluble copper grades. The poor solubility outside the enriched zone is clearly seen in the average grades. The differences between the high percentile grades and the maximum indicate that outliers are more important than for total copper.
Table 11.12: Acid Soluble Copper(%), Declustered Statistics By Estimation Domain | |||||||||||
|---|---|---|---|---|---|---|---|---|---|---|---|
Estimation |
Number |
Average |
Standard |
Coef. Of |
Minimum |
Percentile |
Maximum |
||||
25th |
50th |
75th |
95th |
98th |
|||||||
1 |
992 |
0.005 |
0.009 |
1.8 |
0.00023 |
0.001 |
0.002 |
0.01 |
0.02 |
0.03 |
0.2 |
2 |
8,961 |
0.007 |
0.009 |
1.2 |
0.00018 |
0.002 |
0.005 |
0.01 |
0.02 |
0.04 |
0.1 |
4 |
334 |
0.041 |
0.026 |
0.6 |
0.00304 |
0.024 |
0.035 |
0.05 |
0.09 |
0.12 |
0.2 |
5 |
2,061 |
0.017 |
0.012 |
0.7 |
0.00050 |
0.008 |
0.015 |
0.02 |
0.04 |
0.05 |
0.1 |
6 |
957 |
0.023 |
0.011 |
0.5 |
0.00400 |
0.015 |
0.020 |
0.03 |
0.04 |
0.06 |
0.1 |
9 |
565 |
0.069 |
0.058 |
0.8 |
0.00328 |
0.040 |
0.056 |
0.08 |
0.15 |
0.23 |
0.6 |
10 |
1,462 |
0.016 |
0.015 |
0.9 |
0.00051 |
0.007 |
0.013 |
0.02 |
0.04 |
0.06 |
0.2 |
11 |
532 |
0.046 |
0.035 |
0.8 |
0.00050 |
0.023 |
0.038 |
0.06 |
0.11 |
0.14 |
0.5 |
107 |
254 |
0.001 |
0.001 |
1.6 |
0.00050 |
0.001 |
0.001 |
0.00 |
0.00 |
0.00 |
0.0 |
Table 11.12: Acid Soluble Copper(%), Declustered Statistics By Estimation Domain | |||||||||||
|---|---|---|---|---|---|---|---|---|---|---|---|
Estimation |
Number |
Average |
Standard |
Coef. Of |
Minimum |
Percentile |
Maximum |
||||
1000 |
29 |
0.052 |
0.044 |
0.8 |
0.00553 |
0.023 |
0.045 |
0.06 |
0.10 |
0.21 |
0.2 |
Table 11.12: Acid Soluble Copper(%), Declustered Statistics By Estimation Domain | ||||||||||||||||||
|---|---|---|---|---|---|---|---|---|---|---|---|---|---|---|---|---|---|---|
Estimation |
Number |
Average |
Standard |
Coef. Of |
Minimum |
Percentile |
Maximum |
|||||||||||
25th |
50th |
75th |
95th |
98th |
||||||||||||||
3102 |
9,753 |
0.049 |
0.032 |
0.6 |
0.00007 |
0.030 |
0.043 |
0.06 |
0.10 |
0.13 |
0.9 |
|||||||
3104 |
1,903 |
0.036 |
0.023 |
0.7 |
0.00110 |
0.021 |
0.030 |
0.04 |
0.08 |
0.10 |
0.2 |
|||||||
3106 |
956 |
0.056 |
0.057 |
1.0 |
0.00160 |
0.030 |
0.048 |
0.07 |
0.12 |
0.18 |
0.7 |
|||||||
31031 |
6,395 |
0.044 |
0.030 |
0.7 |
0.00050 |
0.027 |
0.038 |
0.05 |
0.10 |
0.12 |
1.4 |
|||||||
31032 |
8,317 |
0.036 |
0.027 |
0.7 |
0.00009 |
0.019 |
0.030 |
0.05 |
0.08 |
0.10 |
0.5 |
|||||||
71021 |
3,544 |
0.018 |
0.015 |
0.9 |
0.00010 |
0.006 |
0.013 |
0.03 |
0.05 |
0.06 |
0.2 |
|||||||
71022 |
559 |
0.009 |
0.008 |
0.9 |
0.00050 |
0.003 |
0.006 |
0.01 |
0.03 |
0.04 |
0.1 |
|||||||
71031 |
3,231 |
0.014 |
0.013 |
1.0 |
0.00024 |
0.005 |
0.009 |
0.02 |
0.04 |
0.05 |
0.2 |
|||||||
71032 |
9,880 |
0.006 |
0.009 |
1.4 |
0.00003 |
0.002 |
0.004 |
0.01 |
0.02 |
0.03 |
0.4 |
|||||||
71041 |
453 |
0.013 |
0.011 |
0.8 |
0.00088 |
0.004 |
0.009 |
0.02 |
0.03 |
0.04 |
0.1 |
|||||||
71042 |
391 |
0.007 |
0.006 |
0.9 |
0.00050 |
0.003 |
0.005 |
0.01 |
0.02 |
0.03 |
0.0 |
|||||||
71061 |
116 |
0.024 |
0.019 |
0.8 |
0.00360 |
0.007 |
0.016 |
0.04 |
0.06 |
0.06 |
0.1 |
|||||||
71062 |
248 |
0.008 |
0.007 |
0.9 |
0.00050 |
0.004 |
0.006 |
0.01 |
0.02 |
0.03 |
0.1 |
|||||||
All Grps |
61,893 |
0.021 |
0.026 |
1.2 |
0.00003 |
0.004 |
0.012 |
0.03 |
0.07 |
0.09 |
1.4 |
|||||||
Acid-soluble grades are low throughout. Average grades are similar in the mixed and enriched zone. There are 3,947 less acid soluble composites than total copper composites and 3,289 less acid soluble composites than cyanide soluble copper composites. The reduced number of soluble copper composites is due to the lack of soluble copper assays during early/initial drilling campaigns. Soluble copper re-assays were performed when possible, but the acid soluble copper grades could not be used due to sample oxidation.
The proportion of missing assays by estimation domain is shown in Table 11.13.
Table 11.13: The Proportion of Missing Assays by Estimation Domain | ||
|---|---|---|
Copper Estimation Domain |
Copper Assays Missing |
|
Cyanide Soluble |
Acid Soluble |
|
1 |
0.1% |
5.4% |
2 |
2.1% |
18% |
4 |
3.5% |
17.5% |
5 |
0.0% |
0.1% |
6 |
0.0% |
0% |
9 |
1.2% |
0.7% |
10 |
1.3% |
4.4% |
11 |
2.1% |
0% |
107 |
0.0% |
29.1% |
1000 |
0.0% |
0% |
3102 |
0.1% |
1.7% |
3104 |
1.9% |
0.9% |
3106 |
0.4% |
0.4% |
31031 |
1.0% |
2.9% |
31032 |
0.3% |
3.0% |
71021 |
0.0% |
0.8% |
71022 |
0.0% |
0.2% |
71031 |
2.3% |
4.7% |
71032 |
1.5% |
7.0% |
71041 |
0.0% |
8.9% |
71042 |
0.0% |
13.1% |
71061 |
0.0% |
0% |
Table 11.13: The Proportion of Missing Assays by Estimation Domain | ||
|---|---|---|
Copper Estimation Domain |
Copper Assays Missing |
|
Cyanide Soluble |
Acid Soluble |
|
71062 |
0.0% |
0% |
All |
1.0% |
6.0% |
For some domains, (e.g. domain 11), the number of missing cyanide soluble composites exceeds the number of missing acid soluble composites. This occurs because during early drilling campaigns (e.g. 2004) samples were assayed for acid soluble but not cyanide soluble copper. Reject samples were not available for these campaigns so no re-assay was possible.
Behavior Near Contacts
Grades within specified estimation domains can vary as a function of distance to a contact when a halo of mineralization or other type of transition occurs between domains. When grades transition across domain boundaries, it may be appropriate to share samples across the boundary during estimation to preserve the transition in the model (a soft or firm boundary). If sharp changes in grade are observed across a contact, the sharing of samples is inappropriate (a hard boundary).
To observe whether grades near contacts are transitional, two types of analysis were performed. Firstly, large blocks that straddle the contact were defined and average grades on the two sides of the contact were compared. This analysis provides an evaluation of grades near the contact over the range of observed values and provides an indication of the grades that would likely be combined if there were free sharing of grades during estimation. The second check is more localized - the distance between each composite and the nearest model block (from a different domain) is determined. Average grades are then computed and plotted. Although more localized, this approach combines data over the entire deposit.
Based on a review of these results, all domain boundaries were treated as hard boundaries for the purposes of estimation. Transition zones were used, however, in domain 31031 (enriched zone, diorite, with “A-Veins”) across transverse faults that appear to limit the extent of strong mineralization.
Outlier Detection and Management
Identification and capping of copper grades was performed using a standard high percentile capping approach, whereby the lognormal distribution of grades was examined (per estimation domain) and the percentile where the data departed from the expected distribution was identified. Outlier values were set back to the identified percentile. An example of the capping approach for total copper in the enriched zone is provided in Figure 11.17.

Figure 11.17: Total Copper Grade Distribution (left) and after Capping (right) for Enriched Zone Domains (CRM 2025)
As shown, the distribution of copper grades is well-behaved with few apparent outliers. As a result, only a small proportion of copper grades were capped. The proportion of data capped and the computed metal removal per domain are presented in Table 11.14.
Table 11.14: Summary of Metal Removal Due to Capping, Copper | |||||||
|---|---|---|---|---|---|---|---|
|
Copper Estimation Domain |
Number of Total Copper Comps. |
Percent Of Comps. Capped |
Metal Removed Due to Capping |
||||
|
Total Copper |
Cyanide Soluble |
Acid Soluble |
Total Copper |
Cyanide Soluble |
Acid Soluble |
||
1 |
1,049 |
1.14% |
2.10% |
0.81% |
10.6% |
53% |
8% |
2 |
10,927 |
0.16% |
4.26% |
0.48% |
1.5% |
38% |
3% |
4 |
405 |
0.00% |
0.26% |
1.80% |
0.0% |
1% |
1% |
5 |
2,063 |
0.00% |
0.00% |
0.00% |
0.0% |
0% |
0% |
6 |
957 |
0.31% |
0.63% |
0.00% |
0.5% |
2% |
0% |
9 |
569 |
0.70% |
0.71% |
4.42% |
1.5% |
6% |
9% |
10 |
1,529 |
0.26% |
1.33% |
0.00% |
0.9% |
13% |
0% |
11 |
532 |
0.00% |
0.00% |
1.13% |
0.0% |
0% |
2% |
Table 11.14: Summary of Metal Removal Due to Capping, Copper | |||||||||||||
|---|---|---|---|---|---|---|---|---|---|---|---|---|---|
|
Copper Estimation Domain |
Number of Total Copper Comps. |
Percent Of Comps. Capped |
Metal Removed Due to Capping |
||||||||||
|
Total Copper |
Cyanide Soluble |
Acid Soluble |
Total Copper |
Cyanide Soluble |
Acid Soluble |
||||||||
107 |
358 |
0.84% |
2.79% |
1.97% |
7.4% |
31% |
14% |
||||||
1000 |
29 |
0.00% |
0.00% |
0.00% |
0.0% |
0% |
0% |
||||||
3102 |
9,917 |
0.12% |
0.11% |
0.14% |
0.3% |
0% |
1% |
||||||
3104 |
1,921 |
0.16% |
0.16% |
0.00% |
0.4% |
0% |
0% |
||||||
3106 |
960 |
0.00% |
0.21% |
3.24% |
0.0% |
0% |
10% |
||||||
31031 |
6,583 |
0.09% |
0.11% |
0.19% |
0.3% |
0% |
1% |
||||||
31032 |
8,577 |
0.06% |
0.13% |
3.09% |
0.3% |
0% |
3% |
||||||
71021 |
3,574 |
0.48% |
0.00% |
0.08% |
0.7% |
0% |
0% |
||||||
71022 |
560 |
1.07% |
0.00% |
0.00% |
2.8% |
0% |
0% |
||||||
71031 |
3,392 |
0.15% |
0.00% |
0.19% |
0.5% |
0% |
0% |
||||||
71032 |
10,627 |
0.14% |
0.17% |
0.15% |
0.6% |
4% |
1% |
||||||
71041 |
497 |
0.40% |
0.00% |
0.00% |
0.1% |
0% |
0% |
||||||
71042 |
450 |
0.00% |
0.00% |
0.00% |
0.0% |
0% |
0% |
||||||
71061 |
116 |
0.00% |
0.00% |
0.00% |
0.0% |
0% |
0% |
||||||
71062 |
248 |
0.00% |
0.00% |
7.26% |
0.0% |
0% |
8% |
||||||
All |
65,840 |
0.17% |
0.88% |
0.73% |
0.4% |
1% |
2% |
||||||
DATA ANALYSIS AND DOMAIN DEFINITION, GOLD, SILVER, AND DENSITY
The spatial distribution of precious metal grades is similar to that of copper in that grades are greatest near the central structure but the association between grade and mineral zone is much weaker. Additionally, gold and silver grades are elevated near assumed localized structures and veins (Late-Stage Quartz Veins identified in logging but not captured by the geologic model) that are independent of copper.
Density shows a weak association with mineral zone.
Gold Estimation Domains
A box plot of gold by mineral zone shows the similarity of average grades by mineral zone (Figure 11.18).

Figure 11.18: Box Plot of Gold by Mineral Zone (CRM 2025)
The spatial association between gold grades and the central structure associated with elevated copper grades is shown in Figure 11.19.
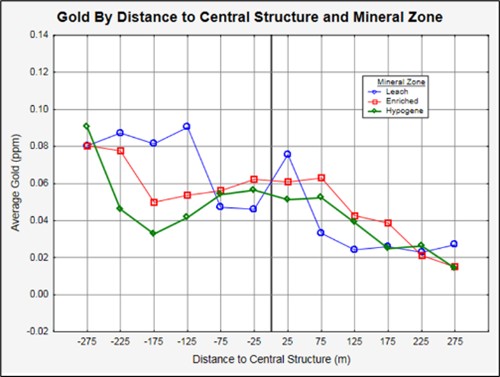
Figure 11.19: Gold by Distance to the Central Structure (CRM 2025)
Average gold grades are shown for the leach, enriched, and hypogene zones. Grades in the leach zone are similar to those in the enriched or hypogene zones, showing the lack of solubility/mobility of gold. Grades decrease to the east of the central structure, but the pattern is less clear to the west, where the un-modeled high-grade quartz veins are typically observed.
Lithology is a stronger control on gold grade than the mineral zone (Figure 11.20).
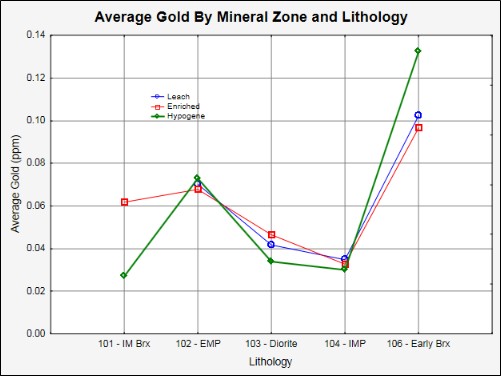
Figure 11.20: Gold by Mineral Zone and Lithology (CRM 2025)
The three lines, representing average grades in the three mineral zones, trace out a similar association between lithology and gold grade. The best grades are found in early mineralization (102-porphyry and 106-breccia).
The higher gold grades in the early mineral lithologies suggest that gold is also associated with the presence of “A-Veins.” Analysis of average grades showed that, as for copper, the diorite lithology should be split into “A-Vein” and non- “A-Vein” material for purposes of estimation.
Average gold grades per lithology and diorite sub-unit are examined as a function of elevation in Figure 11.21.

Figure 11.21: Gold by Elevation and Lithology / Vein type (CRM 2025)
Average gold grades generally show important differences among these lithology units used as the gold estimation domains. The mineral zone is not considered for purposes of gold estimation. Contact plots across mineral zones were examined, and no change in gold grade at mineral zone contacts was observed.
Detection and Management of Gold Outliers
Gold grades are capped locally by examining the contribution of each composite to the local mean grade. This contribution is determined by examining the average grades of the nearest 25 composites (surrounding the composite of interest) with and without the composite. If an individual composite changes the local average by more than a domain specific threshold (typically 30%), the composite grade responsible for the increase in the local mean was set back so that the change in the local mean was equal to the stated threshold. This process resulted in capping approximately 1% of the gold grades.
Comparisons of the capped and uncapped grades, for two estimation domains, are shown in Figure 11.22.

Note that the capping process produces a distribution tail that is similar to that of a lognormal distribution.
Figure 11.22: Example of Local Gold Capping Results for Domains 102 and 1031 (CRM 2025)
The metal removal associated with the capping is shown in Table 11.15.
Table 11.15: Gold Capping and Metal Removal | ||||||||||||
|
Gold Estimation Domain |
Number of Composites |
Uncapped Gold |
Capped Gold |
Metal Removal |
||||||||
Average |
Std. Dev. |
Percentile |
Max. |
Average |
Std. Dev. |
Percentile |
Max. |
|||||
95th |
98th |
95th |
98th |
|||||||||
101 |
214 |
0.037 |
0.06 |
0.17 |
0.22 |
0.54 |
0.036 |
0.06 |
0.17 |
0.22 |
0.37 |
2% |
102 |
18,893 |
0.071 |
0.14 |
0.17 |
0.24 |
12.67 |
0.068 |
0.07 |
0.16 |
0.24 |
1.75 |
5% |
104 |
3,601 |
0.033 |
0.06 |
0.09 |
0.15 |
1.74 |
0.031 |
0.04 |
0.09 |
0.14 |
0.61 |
6% |
106 |
1,516 |
0.102 |
0.27 |
0.23 |
0.35 |
9.16 |
0.092 |
0.08 |
0.22 |
0.34 |
0.85 |
10% |
1031 |
11,583 |
0.063 |
0.13 |
0.15 |
0.21 |
8.72 |
0.060 |
0.06 |
0.15 |
0.21 |
1.41 |
5% |
1032 |
28,627 |
0.033 |
0.15 |
0.10 |
0.16 |
17.29 |
0.028 |
0.05 |
0.10 |
0.15 |
2.56 |
15% |
All Grps |
64,434 |
0.051 |
0.15 |
0.14 |
0.21 |
17.29 |
0.047 |
0.06 |
0.14 |
0.20 |
2.56 |
8% |
Statistics by Estimation Domain
Declustered gold statistics by estimation domain are presented in Table 11.16.

Silver Estimation Domains
Silver grades are low throughout the deposit with average grades generally between 1 and 2 g/t. Important outliers, associated with large relative grade variability, are observed.
Silver Data Analysis
Box plots of silver grade by mineral zone and lithology are presented in Figure 11.23. For the diorite (103), composites are separated based on the presence/absence of “A-Veins”.

Figure 11.23: Box plots of Silver grade (CRM 2025)
Average silver grades in the leach (2) and enriched (3) zones are relatively low; however, enriched zone grades have elevated variability. Hypogene (7) and enriched zone grades are similar. By lithology, the largest average grades are found in the early breccia (106). Combinations of lithology and mineral zone were formed (after combining the four mixed mineral zones). Box plots for the new groups were compared Figure 11.24.

Figure 11.24: Silver Box Plots by Initial Groups (CRM 2025)
In this plot, the leach, mixed, and bornite mineral zones are kept separate while the enriched and hypogene zone data for the same lithology are plotted sided by side. Examining this plot, there is a strong similarity between the enriched and hypogene zone distribution of grades for lithology (plus vein type) groups 102, 104, 1031 and 1032. Differences are seen only for the early breccia lithology (106). Examining average grades as a function of elevation, breccia silver grades are largest at depth (distant from the enriched contact) while near the contact, breccia grades are similar for the two mineral zones. Based on these points, silver estimation domains consider mineral zone (all mixed zones combined) outside the enriched and hypogene zones. Within these two zones, the hypogene and enriched zone data are combined for each lithology i.e. material from 30102 (EMP, enriched) is combined with 70102 (EMP, hypogene). The numeric code 30102 is retained for the combined data.
Silver Grade Capping
The local capping algorithm described above for gold grades was used to identify and manage silver outliers. Due to the presence of high-grade veins, very large silver grades can be observed. Additionally, ten composites have grades of 200 ppm or larger (6 in domain 1032). Reviewing the assay data shows that for 9 of these samples the analytic upper limit of 200 ppm was reached and a re-assay was not performed. Based on this finding, the reported maximum value of 954 ppm (the only re-assayed sample)
was believed to be a true assay value. The MRE audit performed by Snowden-Optiro detected that the very large silver grades were associated with elevated grades of elements commonly found in steel rather than elements expected at deposits similar to Los Azules. Based on this observation, it is believed that contamination due to destruction of the drill bit is a likely explanation for the very large silver values. The local capping algorithm strongly reduces the grades of the strong outliers and, in the opinion of both the auditors and the QPs responsible for the resource estimation, failure to exclude the contaminated samples does not impact the resource estimate. Table 11.17 presents the results of silver local capping.
Table 11.17: Silver Local Capping Results | ||||||||||||
|
Silver Estimation Domain |
Number of Composites |
Uncapped Silver (ppm) |
Capped Silver (ppm) |
Metal Removal |
||||||||
Average |
Std. Dev. |
Percentile |
Max. |
Average |
Std. Dev. |
Percentile |
Max. |
|||||
95th |
98th |
95th |
98th |
|||||||||
2 |
10,927 |
0.86 |
2.84 |
2.30 |
3.90 |
200 |
0.78 |
1.00 |
2.30 |
3.50 |
23 |
10% |
4 |
3,035 |
1.49 |
2.87 |
4.90 |
9.50 |
64 |
1.40 |
2.07 |
4.90 |
8.60 |
23 |
6% |
5 |
2,069 |
1.86 |
3.31 |
5.00 |
8.40 |
57 |
1.79 |
2.86 |
5.00 |
7.92 |
57 |
3% |
6 |
957 |
1.57 |
1.23 |
3.90 |
4.80 |
13 |
1.56 |
1.18 |
3.90 |
4.80 |
11 |
1% |
30102 |
14,051 |
1.79 |
9.39 |
5.00 |
7.70 |
954 |
1.56 |
2.13 |
4.80 |
7.15 |
116 |
13% |
30104 |
3,080 |
1.13 |
1.97 |
3.40 |
5.70 |
52 |
1.07 |
1.34 |
3.40 |
5.60 |
14 |
6% |
30106 |
1,112 |
2.18 |
2.91 |
6.50 |
10.50 |
29 |
2.12 |
2.65 |
6.20 |
10.04 |
28 |
3% |
31031 |
9,977 |
1.72 |
4.54 |
5.00 |
7.70 |
200 |
1.57 |
2.21 |
4.90 |
7.40 |
61 |
9% |
31032 |
19,227 |
1.06 |
3.58 |
3.10 |
5.80 |
200 |
0.93 |
1.57 |
3.10 |
5.40 |
39 |
13% |
Examining the maximum capped value shows that the local capping algorithm has strongly capped the outlier grades. Those domains with maximum values of 200 ppm or more have the largest metal removals (9% or more). As seen by the change in the 95th percentile of the capped grades, more than 5% of the data are capped in some domains. This is a larger number of capped composites than normally observed (1 to 2%) due to the presence of the unlogged (discontinuous) veins, which introduce significant local variability.
To observe the impact of the local capping on the distribution of grades, lognormal probability plots are prepared (Figure 11.25) for domains with important levels of capping (30102 and 31031).

Figure 11.25: Silver Local Capping Results, Domains 30102 and 31031 (CRM 2025)
The shape of the uncapped silver distributions show the need for strong grade capping (and associated metal removal). The plots show that between the 95th and 99th percentiles (silver threshold of less than 10 ppm), a separate high-grade population is present. For domain 31031, the local capping algorithm reduces these high grades so that the capped grade distribution is close to lognormal. For domain 30102, the strongly elevated grade of 953 ppm is capped to 116 ppm. A value of 40 ppm would have been more appropriate given the shape of the capped grade distribution; however, no additional capping was performed.
Silver Statistics by Estimation Domain
Following capping, the final silver grade statistics by estimation domain are shown in Table 11.18.
Table 11.18: Silver, Basic Stats By Estimation Domain | |||||||||||
|
Estimation Domain |
Number |
Average |
Standard Deviation |
Coef. Of Variation |
Minimum |
Percentile |
Maximum |
||||
25th |
50th |
75th |
95th |
98th |
|||||||
2 |
10,927 |
0.78 |
1.00 |
1.29 |
0.10 |
0.25 |
0.50 |
0.80 |
2.30 |
3.50 |
23.3 |
4 |
3,035 |
1.40 |
2.07 |
1.47 |
0.15 |
0.25 |
0.70 |
1.50 |
4.90 |
8.60 |
23.5 |
5 |
2,069 |
1.79 |
2.86 |
1.59 |
0.15 |
0.60 |
1.10 |
2.00 |
5.00 |
7.92 |
57.2 |
6 |
957 |
1.56 |
1.18 |
0.75 |
0.25 |
0.80 |
1.20 |
2.00 |
3.90 |
4.80 |
10.6 |
30102 |
14,051 |
1.56 |
2.13 |
1.36 |
0.15 |
0.50 |
1.00 |
1.90 |
4.80 |
7.15 |
116.4 |
30104 |
3,080 |
1.07 |
1.34 |
1.25 |
0.25 |
0.25 |
0.60 |
1.30 |
3.40 |
5.60 |
14.3 |
30106 |
1,112 |
2.12 |
2.65 |
1.25 |
0.25 |
0.70 |
1.30 |
2.70 |
6.20 |
10.0 |
28.4 |
31031 |
9,977 |
1.57 |
2.21 |
1.41 |
0.15 |
0.50 |
0.90 |
1.80 |
4.90 |
7.40 |
60.8 |
31032 |
19,227 |
0.93 |
1.57 |
1.69 |
0.10 |
0.25 |
0.50 |
0.90 |
3.10 |
5.40 |
38.6 |
All Grps |
64,435 |
1.23 |
1.86 |
1.52 |
0.10 |
0.25 |
0.60 |
1.40 |
4.00 |
6.30 |
116.4 |
Bulk Density
Density was estimated using the 7,000 density data values collected over the project life. Density data is coded for lithology and mineral zone using the block model and a statistical analysis was performed. High and low density outliers were defined. Density values less than 2 g/cc were set to 2 g/cc (1 sample) and values larger than 2.9 g/cc were set to 2.9 g/cc (1 sample).
Density was estimated by mineral zone. Summary statistics are presented in Table 11.19.
Table 11.19: Basic statistics of Density by Mineral Zone | ||||||
Mineral Zone |
Minz |
Average SG |
Number of Records |
STD. |
Minumum SG |
Maximum SG |
Lix |
2 |
2.448 |
1,219 |
0.126 |
1.769 |
2.878 |
Sec. Enr. |
3 |
2.494 |
2,777 |
0.091 |
1.821 |
2.950 |
Mix |
4 |
2.486 |
45 |
0.143 |
1.952 |
2.638 |
Bn-Cpy |
5 |
2.595 |
239 |
0.068 |
2.383 |
2.977 |
Bn |
6 |
2.605 |
120 |
0.061 |
2.320 |
2.790 |
Hyp |
7 |
2.569 |
2,240 |
0.091 |
2.206 |
4.050 |
MxOx |
9 |
2.430 |
82 |
0.122 |
2.150 |
2.681 |
MxPlix |
10 |
2.457 |
190 |
0.115 |
2.040 |
2.730 |
MxSe |
11 |
2.452 |
62 |
0.125 |
2.100 |
2.831 |
Volcs |
107 |
2.599 |
26 |
0.134 |
2.210 |
2.890 |
All Grps |
2.514 |
7,000 |
0.111 |
1.769 |
4.050 |
|
Overburden density was not estimated since there are only 13 samples. The average density of these overburden samples differs for wet and dry samples. For dry overburden, an average value of 2.137 g/cc was assigned while 2.27 g/cc was assigned to wet overburden.
With the exception of the volcanics, blocks that could not be estimated were assigned the average value of the data shown in the above table. In the volcanics, there are 70 samples collected outside of the project volume. The average density of these 107 samples is 2.599 g/cc. This density value was assigned to un-estimated volcanics blocks since the unestimated blocks are distant from the data within the project volume and the average of the data outside of the project volume was believed to be more representative.
A lognormal probability plot was used to define an outlier capping threshold for density. In the leach zone the capping threshold was 2.75 g/cc. In other mineral zones, a capping threshold of 2.85 g/cc was used. Density values that exceeded the threshold were set back to the threshold. A total of 15 density values (0.2% of the data) were capped.
Density was estimated using the Inverse Distance Squared weighting method separately for each mineral zone. The search was anisotropic aligned parallel to the main structures (N20W) with radii of 150m along strike, 100 m across strike, and 100m vertically.
A minimum of 4 and a maximum of 10 samples were used with the additional restriction that a maximum of 3 samples per drillhole could be used. This restriction requires that data come from at least 2 drillholes to estimate a block. For un-estimated blocks, the search was expanded by a factor of 2 and then 3. Blocks that remained un-estimated were assigned the average density of the appropriate mineral zone.
VARIOGRAPHY
Experimental variograms were computed by mineral zone and lithology (where appropriate). Given the observed spatial grade trends, variability is expected to be dependent on direction and the variograms will show zonal anisotropy. To best show the anisotropy, variograms rather than correlograms are preferred. To reduce noise associated with local variability, pairwise relative variograms were computed and modeled.
Copper
Example experimental variogram data and fitted models are shown in Figure 11.26 and Figure 11.27 for domains 3102 (enriched, EMP) and 31031 (enriched, diorite with “A-Veins”).

Figure 11.26: Variogram for Domain 3102 (CRM 2025)

Figure 11.27: Variogram for Domain 31031 (CRM 2025)
The spatial correlation pattern for the higher grade early mineral porphyry and diorite with “A-Veins” shows clear zonal anisotropies due to the lateral decrease in grade in the direction perpendicular to the central structure. Variability is lowest parallel to the central structure (azimuth N15W or 165 in the figures). Perpendicular to this structure, the grade trend generates larger variability which increases the sill of the variogram. Vertical grade trends are also observed generating the elevated sill in the vertical direction. For the “A-Vein” diorite, the strongest correlation is within an ENE dipping plane as opposed to a vertical plane for domain 3102. This dip direction is seen in the outlines of the “A-Vein” presence model.
Gold
Gold experimental variograms were computed after local capping of outliers. Example experimental data and fitted models are provided in Figure 11.28 for domains 102 (EMP) and 1031 (diorite with “A-Veins).

Figure 11.28: Gold variograms for domains 102 and 1031 (CRM 2025)
As for copper, correlation is largest parallel to N15W. The strength of the vertical (or sub-vertical) correlation is lithology dependent.
Silver
Silver experimental variograms were computed after local capping of outliers. Example experimental data and fitted models are provided in Figure 11.29 for domains 30102 (EMP) and 31031 (diorite with “A-Veins”).
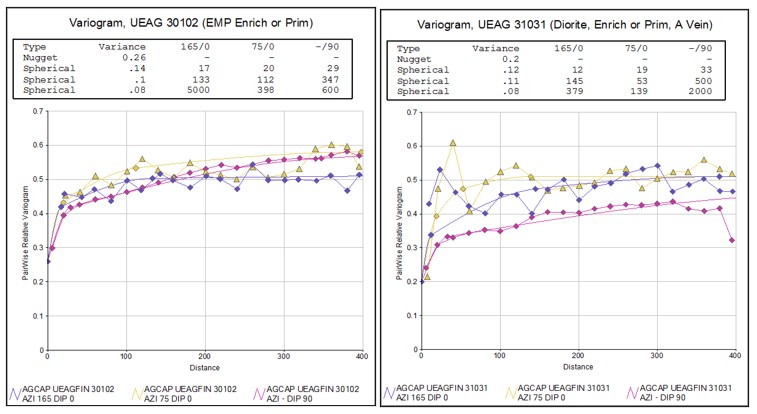
Figure 11.29: Silver variograms for domains 30102 and 31031 (CRM 2025)
For the major silver estimation domains, the strongest correlation is in the vertical direction, and the apparent horizontal anisotropy is greatly reduced.
Variogram Model Parameters
The variogram models used in estimation are presented in Table 11.20.
Table 11.20: Estimation variogram models | |||||||||||||||||
Los Azules Variogram Models | |||||||||||||||||
Trend/Plunge direction considers vertical downward | |||||||||||||||||
Due to sub-vertical orientation of ellipses, axes are labeled Major (strike), Minor (sub-horizontal - perpendicular to major/vertical plane), Vertical (sub-vertical) | |||||||||||||||||
|
Variogram ID For Estimation |
Description |
Trend/Plunge of Ellipse Axes |
Nugget Effect |
Spherical Structure 1 |
Spherical Structure 2 |
Spherical Structure 3 |
|||||||||||
Major |
Minor |
Vertical |
Range of Correlation |
C (Variance) |
Range of Correlation |
C (Variance) |
Range of Correlation |
C (Variance) |
|||||||||
Major |
Minor |
Vertical |
Major |
Minor |
Vertical |
Major |
Minor |
Vertical |
|||||||||
3102 |
Cu - EMP, Enrich |
165/0 |
75/30 |
255/60 |
0.14 |
20 |
41 |
43 |
0.08 |
500 |
125 |
216 |
0.08 |
5000 |
383 |
450 |
0.08 |
3104 |
Cu - IMP, Enrich |
75/0 |
165/30 |
345/60 |
0.08 |
113 |
76 |
66 |
0.1 |
152 |
340 |
407 |
0.04 |
368 |
379 |
600 |
0.03 |
3106 |
Cu - Early Brx |
0/0 |
90/0 |
0/90 |
0.15 |
20 |
20 |
20 |
0.1 |
55 |
55 |
55 |
0.05 |
|
|
|
|
31031 |
Cu - Diorite A Vein |
165/0 |
255/30 |
75/60 |
0.1 |
53 |
42 |
38 |
0.08 |
382 |
357 |
200 |
0.07 |
1800 |
382 |
343 |
0.07 |
31032 |
Cu - Diorite, other vein |
165/0 |
75/30 |
255/60 |
0.17 |
114 |
23 |
70 |
0.08 |
258 |
56 |
338 |
0.05 |
380 |
320 |
368 |
0.06 |
7102 |
Cu - Hypogene, EMP |
165/0 |
75/30 |
255/60 |
0.1 |
130 |
44 |
31 |
0.07 |
210 |
89 |
314 |
0.03 |
5000 |
5000 |
346 |
44 |
7103 |
Cu - Hypogene, Diorite |
165/0 |
75/30 |
255/60 |
0.13 |
182 |
135 |
29 |
0.1 |
340 |
321 |
349 |
0.12 |
5000 |
390 |
500 |
0.1 |
7104 |
Cu - Hypogene, IMP |
0/0 |
90/0 |
0/90 |
0.13 |
74 |
74 |
74 |
0.07 |
225 |
225 |
225 |
0.04 |
0 |
0 |
0 |
0 |
2 |
Cu - Leach |
165/0 |
255/30 |
75/60 |
0.1 |
332 |
67 |
74 |
0.11 |
384 |
254 |
407 |
0.09 |
5000 |
370 |
900 |
0.08 |
4 |
Cu - Mix |
0/0 |
90/0 |
0/90 |
0.17 |
180 |
180 |
180 |
0.03 |
224 |
224 |
224 |
0.05 |
|
|
|
|
6 |
Cu - Cpy-Bn + Bn |
0/0 |
90/0 |
0/90 |
0.12 |
95 |
95 |
95 |
0.1 |
290 |
290 |
290 |
0.07 |
|
|
|
|
4102 |
Au - EMP |
165/0 |
75/30 |
255/60 |
0.2 |
16 |
153 |
115 |
0.1 |
4000 |
391 |
242 |
0.05 |
5000 |
800 |
800 |
0.1 |
41032 |
Au - Diorite, other vein |
165/0 |
75/30 |
0/90 |
0.2 |
21 |
2 |
39 |
0.1 |
393 |
31 |
389 |
0.1 |
650 |
388 |
2000 |
0.1 |
41031 |
Au - Diorite, A Vein |
165/0 |
75/30 |
0/90 |
0.19 |
44 |
28 |
46 |
0.08 |
387 |
133 |
450 |
0.05 |
800 |
316 |
1400 |
0.19 |
4104 |
Au - IMP |
165/0 |
75/30 |
0/90 |
0.25 |
44 |
161 |
35 |
0.1 |
116 |
324 |
178 |
0.1 |
367 |
364 |
5000 |
0.1 |
530102 |
Ag - EMP (enr/prim) |
165/0 |
75/30 |
0/90 |
0.26 |
17 |
20 |
29 |
0.14 |
133 |
112 |
347 |
0.1 |
5000 |
398 |
600 |
0.08 |
531032 |
Ag - Dio other (enr/prim) |
165/0 |
75/30 |
0/90 |
0.2 |
18 |
19 |
32 |
0.1 |
59 |
47 |
500 |
0.1 |
133 |
200 |
700 |
0.04 |
531031 |
Ag - Dio A Vein (enr/prim) |
165/0 |
75/30 |
0/90 |
0.2 |
12 |
19 |
33 |
0.12 |
145 |
53 |
500 |
0.11 |
379 |
139 |
2000 |
0.08 |
530104 |
Ag - EMP (enr/prim) |
165/0 |
75/30 |
0/90 |
0.23 |
21 |
20 |
41 |
0.1 |
40 |
47 |
67 |
0.1 |
55 |
373 |
381 |
0.06 |
502 |
Ag - Leach |
165/0 |
75/30 |
0/90 |
0.16 |
16 |
17 |
30 |
0.08 |
48 |
32 |
500 |
0.08 |
284 |
54 |
600 |
0.06 |
504 |
Ag - Mixed |
165/0 |
75/30 |
0/90 |
0.25 |
64 |
35 |
93 |
0.15 |
152 |
87 |
1000 |
0.1 |
373 |
103 |
5000 |
0.08 |
505 |
Ag- Cpy-Bn |
0/0 |
90/0 |
0/90 |
0.24 |
90 |
90 |
90 |
0.15 |
200 |
200 |
200 |
0.05 |
|
|
|
|
506 |
Ag - Bn |
0/0 |
90/0 |
0/90 |
0.23 |
91 |
91 |
91 |
0.05 |
331 |
331 |
331 |
0.05 |
369 |
369 |
369 |
0.03 |
MODEL SETUP AND LIMITS
The resource block model was developed in DATAMINE Studio software. Table 11.21 presents the dimensions and limits of the model. The POSGAR 94 coordinate system was used. The block size of 20x20x15m is consistent with the typical selective mining unit (SMU) used for this type of copper deposit.
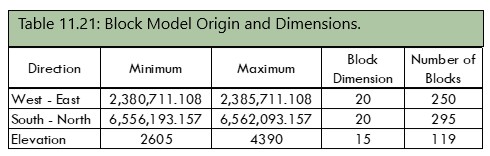
Model blocks are assigned lithology and mineral zone codes based on the block centroid and the wireframe models from the geologic model. Sub-blocks were not used. The model contains a field defining the percentage of the block below surface topography.
INTERPOLATION PARAMETERS
Copper
The block model grades were estimated using ordinary Kriging and inverse distance squared weighting. Inverse distance weighting was used for the smaller domains where a variogram model could not be developed (volcanics and overburden). The estimation search uses multiple passes with decreasing restrictions to allow estimation of a large proportion of the model blocks. The search pass where each block is estimated is stored in the model output file.
Different, but similar, searches were used for copper and precious metals. The first three search passes use an octant restriction requiring that four of the octants surrounding the block contain data. This greatly increases the likelihood that data will surround the block. If a block cannot be estimated in the first three passes, estimation based on a minimum number of drillholes near the block is performed. Three drillhole restriction search passes are considered, yielding a total of six estimation searches, the first three search passes with octants.
Table 11.22: Search Strategy for Copper Estimation, Pass 1 to 3 |
||||||||||||||
|
Search ID |
Description |
Initial Search Distance Per Ellipse Axis |
Octant Restriction |
Search Expansion 1 |
Search Expansion 2 |
|||||||||
|
Min. Octants Filled |
Min. Data Per Octant |
Max. Data Per Octant |
Expansion Factor |
Number of Data |
Expansion Factor |
Number of Data |
||||||||
N15W/0 |
N75E/0 |
Vertical |
Minimum |
Maximum |
Minimum |
Maximum |
||||||||
1 |
Cover |
100 |
100 |
100 |
4 |
1 |
7 |
2 |
15 |
30 |
3 |
8 |
20 |
|
2 |
Leach |
125 |
75 |
50 |
4 |
1 |
7 |
2 |
15 |
30 |
3 |
8 |
20 |
|
3 |
Enriched |
100 |
50 |
25 |
4 |
1 |
7 |
2 |
15 |
30 |
3 |
8 |
20 |
|
4 |
Mixed |
150 |
75 |
50 |
4 |
1 |
7 |
2 |
15 |
30 |
3 |
8 |
20 |
|
5 |
Bn-Cpy |
150 |
75 |
50 |
4 |
1 |
7 |
2 |
15 |
30 |
3 |
8 |
20 |
|
6 |
Bn |
150 |
75 |
50 |
4 |
1 |
7 |
2 |
15 |
30 |
3 |
8 |
20 |
|
7 |
Hyp |
150 |
75 |
50 |
4 |
1 |
7 |
2 |
15 |
30 |
3 |
8 |
20 |
|
The second three searches (search passes 4 through 6) are presented in Table 11.23.
Table 11.23: Search Strategy for Copper Estimation, Pass 4 to 6 |
||||||||||||||
|
Search ID |
Description |
Initial Search Distance Per Ellipse Axis |
Max Comps. Per Hole |
# of Composites |
Search Expansion 1 |
Search Expansion 2 |
||||||||
Minimum |
Maximum |
Expansion Factor |
Number of Data |
Expansion Factor |
Number of Data |
|||||||||
N15W/0 |
N75E/0 |
Vertical |
Minimum |
Maximum |
Minimum |
Maximum |
||||||||
10 |
Cover |
300 |
300 |
300 |
5 |
10 |
24 |
2 |
10 |
24 |
3 |
10 |
24 |
|
20 |
Leach |
375 |
225 |
150 |
8 |
12 |
24 |
2 |
12 |
24 |
3 |
12 |
24 |
|
30 |
Enriched |
300 |
150 |
100 |
8 |
12 |
24 |
2 |
12 |
24 |
3 |
12 |
24 |
|
40 |
Mixed |
450 |
225 |
150 |
8 |
12 |
24 |
2 |
12 |
24 |
3 |
12 |
24 |
|
50 |
Bn-Cpy |
300 |
150 |
100 |
8 |
12 |
24 |
2 |
12 |
24 |
3 |
12 |
24 |
|
60 |
Bn |
300 |
150 |
100 |
8 |
12 |
24 |
2 |
12 |
24 |
3 |
12 |
24 |
|
70 |
Hyp |
300 |
150 |
100 |
8 |
12 |
24 |
2 |
12 |
24 |
3 |
12 |
24 |
|
Anisotropic searches parallel to the major NNW structure are used outside of the overburden and leach. A smaller vertical search is used in the enriched zone due to the observed vertical trend in copper solubility.
Gold and Silver
The search strategies for gold and silver are presented in Table 11.24.
Table 11.24: Search parameters for gold and silver | |||||||||||||
Gold and Silver, Octant Control, Pass 1 to 3 | |||||||||||||
|
Initial Search Distance Per Ellipse Axis |
Octant Restriction |
Search Expansion 1 |
Search Expansion 2 |
||||||||||
|
Min. Octants Filled |
Min. Data Per Octant |
Max. Data Per Octant |
Expansion Factor |
Number of Data |
Expansion Factor |
Number of Data |
|||||||
N15W/0 |
N75E/0 |
Vertical |
Minimum |
Maximum |
Minimum |
Maximum |
|||||||
100 |
75 |
120 |
4 |
1 |
5 |
2 |
12 |
20 |
3 |
12 |
20 |
||
Gold and Silver, Drillhole Control, Pass 4 and 5 | |||||||||||||
|
Initial Search Distance Per Ellipse Axis |
Max. Samples Per Hole |
# of Composites |
Search Expansion 1 |
Search Expansion 2 |
|||||||||
Minimum |
Maximum |
Expansion Factor |
Number of Data |
Expansion Factor |
Number of Data |
||||||||
N15W/0 |
N75W/0 |
Vertical |
Minimum |
Maximum |
Minimum |
Maximum |
|||||||
300 |
200 |
360 |
8 |
12 |
24 |
2 |
12 |
24 |
0 |
|
|
||
For gold and silver, the same estimation search is used for all domains. Only five estimation search passes are considered rather than the six passes considered for copper.
COPPER GRADE ESTIMATION APPROACH
The same search strategy and variogram models were used for both total and soluble copper to avoid generating solubility artifacts in the estimates. Not all composites have both total and soluble copper grades since soluble copper assays were not performed in some of the past drilling campaigns. To account for the missing data, copper is estimated in two passes:
Estimate block grades (total and soluble copper) using only the composite data where both soluble and total copper assays exist to obtain an estimate of the local solubility ratio (soluble divided by total copper)
Estimate grades using all data with total copper grades (this is the final total copper estimate).
To obtain the final soluble copper grade, compute the ratio of soluble to total copper (from the first estimate), then multiply this ratio by the final total copper estimate.
In this approach there is an implicit assumption of solubility stationarity (invariability of the average in space). Within the enriched zone, solubility is clearly a function of proximity to the upper and lower contacts of the unit. To account for this natural change in mineralogy/solubility, the enriched zone copper estimates are restricted to relative depth bands, and the vertical search is reduced.
VALIDATION
To validate the model, comparisons of the estimated block grades with the grades of the composite samples are undertaken to assess whether the model honors the data. To remove spatial clustering and define the volume of influence of each composite, nearest neighbor models were created. The height of the model blocks is 15m while the composite length is 2m. If an NN model was created using this information, only every 7th or 8th composite would be nearest to a block centroid (i.e., most data would not participate in the validation). To address this issue, the resource model blocks were subdivided into 5x5x2.5m high sub-blocks for NN estimation. The estimated grades were then “re-blocked” or averaged to produce 20x20x15m NN block grade estimates.
The validation steps performed and described below were:
Visual inspection of model and data grades on section and plan
Comparison of average model and sample grades per estimation domain
Comparison of average model and sample grades over large blocks
Comparison of average model and sample grades over slices through the model (swath plots).
Visual Inspection
Visual inspection considers both the geological model and the estimated grades. The model check confirms that the model blocks are properly coded and that the domain codes of the data match those of the model. The check of grades compares the spatial pattern of grades seen in the composite samples with that of the estimated block grades. Important features observed in the samples such as the anisotropic correlation pattern parallel and perpendicular to the central structure, the decrease in grade moving away from the data, and the vertical decrease in solubility with depth in the enriched zone are reproduced in the model.
Furthermore, the grades seen in the drillholes match well with the estimated block grades.
An example section is provided as Figure 14.30. The full set of sections is presented in Appendix 14-C.

Figure 11.30: Example section comparing drillhole and block model grades. Fault lines are shown in blue. Looking NW. (CRM 2025)
Average Grades by Domain
As an overall check of the estimated grades, average model and NN grades are compared by domain and the distance between the nearest composite and the block centroid. This distance is used rather than the more typical search pass because the density of data and search passes are very different for the enriched and hypogene zones. For each comparison, the number of estimated blocks is shown along with the relative difference in the two estimated grades.
Average total, cyanide soluble, and acid soluble copper grades are compared. It is noted that for soluble copper the resource model used a two-stage estimation to account for the missing soluble copper data while the NN estimate is a simple estimate using only the available data.
Table 11.25: Comparison of Resource and NN Estimates in The Block Model. |
|||||||||||||
|
Distance, Block to Nearest Composite |
Description |
Domain Code |
Number Of Blocks |
Average Total Copper (%) |
Cyanide Soluble Copper (%) |
Acid Soluble Copper (%) |
|||||||
|
Resource Model |
NN Model (Data) |
Relative Difference |
Resource Model |
NN Model (Data) |
Relative Difference |
Resource Model |
NN Model (Data) |
Relative Difference |
|||||
<25m |
Early Min. Porph |
3102 |
5,688 |
0.679 |
0.671 |
1.2% |
0.456 |
0.451 |
1.1% |
0.0516 |
0.0516 |
0.0% |
|
<25m |
Int. Min. Porph. |
3104 |
740 |
0.358 |
0.361 |
-1.0% |
0.219 |
0.224 |
-2.5% |
0.0361 |
0.0365 |
-1.1% |
|
<25m |
Early Brx |
3106 |
397 |
0.824 |
0.834 |
-1.2% |
0.528 |
0.529 |
-0.2% |
0.0610 |
0.0605 |
0.8% |
|
<25m |
Diorite, A Veins |
31031 |
3,322 |
0.570 |
0.575 |
-0.8% |
0.353 |
0.357 |
-1.4% |
0.0474 |
0.0483 |
-1.9% |
|
<25m |
Diorite, Other Vein |
31032 |
4,786 |
0.299 |
0.302 |
-1.0% |
0.191 |
0.194 |
-1.8% |
0.0368 |
0.0375 |
-1.8% |
|
25 to 50m |
Early Min. Porph |
3102 |
8,809 |
0.638 |
0.623 |
2.3% |
0.418 |
0.409 |
2.0% |
0.0499 |
0.0499 |
-0.1% |
|
25 to 50m |
Int. Min. Porph. |
3104 |
722 |
0.347 |
0.363 |
-4.7% |
0.219 |
0.243 |
-10.9% |
0.0376 |
0.0392 |
-4.2% |
|
25 to 50m |
Early Brx |
3106 |
345 |
0.733 |
0.681 |
7.1% |
0.447 |
0.396 |
11.4% |
0.0531 |
0.0481 |
9.4% |
|
25 to 50m |
Diorite, A Veins |
31031 |
5,097 |
0.514 |
0.516 |
-0.4% |
0.311 |
0.314 |
-1.0% |
0.0446 |
0.0462 |
-3.6% |
|
25 to 50m |
Diorite, Other Vein |
31032 |
11,097 |
0.284 |
0.287 |
-1.0% |
0.178 |
0.182 |
-1.9% |
0.0357 |
0.0365 |
-2.2% |
|
50 to 75m |
Early Min. Porph |
3102 |
3,755 |
0.543 |
0.530 |
2.4% |
0.339 |
0.333 |
1.7% |
0.0454 |
0.0456 |
-0.4% |
|
50 to 75m |
Int. Min. Porph. |
3104 |
555 |
0.310 |
0.329 |
-6.4% |
0.197 |
0.226 |
-14.8% |
0.0360 |
0.0371 |
-3.2% |
|
50 to 75m |
Early Brx |
3106 |
118 |
0.425 |
0.371 |
12.7% |
0.240 |
0.201 |
16.4% |
0.0385 |
0.0360 |
6.5% |
|
50 to 75m |
Diorite, A Veins |
31031 |
3,159 |
0.434 |
0.434 |
0.0% |
0.246 |
0.249 |
-1.0% |
0.0401 |
0.0427 |
-6.5% |
|
50 to 75m |
Diorite, Other Vein |
31032 |
9,874 |
0.270 |
0.274 |
-1.6% |
0.165 |
0.169 |
-2.5% |
0.0348 |
0.0360 |
-3.5% |
Results for the enriched zone are compared for three different distances between data and block. For blocks within 25m of the nearest composite total copper model and data averages are within 1.2%. Almost all blocks are classified as measured. Differences increase somewhat for the more variable soluble copper species.
Larger differences in the two estimates of average grade are seen for blocks more distant from the nearest composite. The largest differences are seen in the volumetrically small early breccia and intermineral porphyry domains. For total and cyanide soluble copper, the observed difference in the larger domains is normally much less than 3%. For acid soluble copper, larger differences are seen.
The tabulated average grade estimates are shown graphically in Figure 11.31.

Figure 11.31: Average grade estimate comparison with drillhole data. Enriched zone. (CRM 2025)
The plot shows that when the nearest sample is close to a block (<25m) there is no observable difference between the data and model averages. Small differences emerge as data more distant from the block are considered. For the enriched zone, the differences between the data and model averages grades are acceptable. Outside of the enriched zone, average model and data averages are as shown in Figure 11.32.
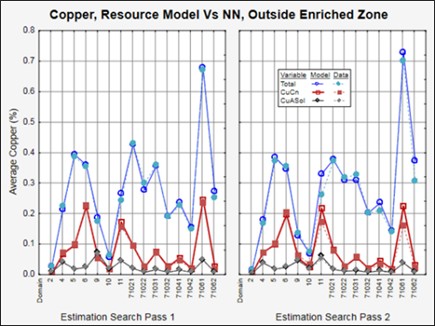
Figure 11.32: Average grade estimate comparison with drillhole data. Outside enriched zone. (CRM 2025)
As shown, model and data averages are similar over all estimation domains.
Average Grades Over Large Blocks
To check the comparison between model and data averages on a local basis, model and composite data (NN model) grades are averaged into large or validation blocks. Averaging block grades over a larger volume partially compensates for the difference in the variances of block and data grades and allows a local numerical comparison of the two estimates over the entire deposit. Groups of blocks with important differences in the two estimates can be identified in space and reviewed.
The size of the validation blocks is multiple of the 20x20x15m model blocks. As the size of the block increases, variance decreases, and the quality of the comparison should improve. Smaller blocks better show the local quality of the estimates. The appropriate block size is therefore dependent on the data density - densely sampled volumes should consider smaller blocks. The enriched zone is sampled more densely than the hypogene zone, therefore the selected block size for comparing the enriched zone model and data averages is 40x60x30m whilst for other mineral zones 60x120x60m blocks are considered. The larger dimension is north south which is sub-parallel to the NNW oriented structure providing the major control on copper grades. The last of the three dimensions is the vertical.
Figure 11.33 presents total copper validation scatterplots for domains 3102 (enriched, early mineral porphyry) and 31031 (enriched diorite with “A-Veins”). Separate plots are shown for blocks estimated in search pass 1 and search passes 1 and 2.


Figure 11.33: Total copper validation scatterplots for domains 3102 and 31031 (CRM 2025)
In all four plots, each point presents the NN and Kriged model grades for a validation block. The black line is Y=X. All points would fall on this line if the two estimates provided identical results. The magnitude of the spread of the points from this line is a measure of the similarity of the two estimates. The cloud of points will ideally be centered around the line over the entire range of grades. Systematic deviations from the line over a range of grades (conditional difference) should be explained.
In the plot above, the match between the model and data averages is better in domain 31031 as compared with domain 3102; however, both results are acceptable especially when considering the small size of the validation block. A vertical comparison of the scatterplots examines the impact of considering blocks estimated in search pass 2. As shown, the scatter of points increases as more distant data are considered in the estimation. At high and, to a lesser extent, low grades conditional differences are observed. These differences are generated by the larger variance of the NN estimates. The difference in variance causes the NN estimates to be larger at high grade and lower at low grades than the Kriged estimates. This smoothing of the Kriged estimates increases when search pass 2 estimated blocks are considered. For the scatterplots shown, the cause of the apparent smoothing is understood and the magnitude of the smoothing is not excessive.
The validation scatterplots for other domains also show strong similarity between the model and data averages indicating strong local agreement between the average model grades and the simple average grade of the data.
For gold and silver, average model and data grades also match well (Figure 11.34 and Figure 11.35).

Figure 11.34: Model and Data Average Gold Over Large Blocks (CRM 2025)

Figure 11.35: Model and Data Average Silver Over Large Blocks (CRM 2025)
Validations Over Slices/Swaths Through the Model
Slices with widths of 120m (NS), 60m (EW), and 60m (vertical) are cut through the resource model and average model and composite (NN) estimates were computed. The averages are then plotted and compared per slice centroid.
Example plots for total copper in the early mineral porphyry domain are presented (Figure 11.36).


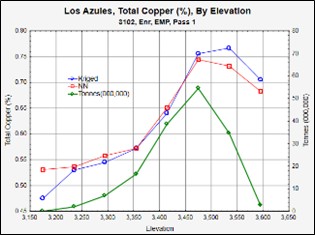
Figure 11.36: Swath plot validations in domain 3102 (CRM 2025)
Plots were prepared and reviewed for each estimation domain for total copper, cyanide soluble copper, acid soluble copper, gold and silver. Review of the plots found no significant discrepancies between the model and data averages.
Validation Considering Enriched Zone Relative Depth
The data analysis shows that the vertical distribution of grades in the enriched zone presents a vertical trend; both average copper and solubility decrease from the top to bottom of the enriched zone. To capture this trend, enriched zone grades were estimated using relative depth within the enriched zone rather than by elevation. For this reason, an additional model validation comparing model and data averages by relative depth is performed. Note that the data averages (by NN) are computed using elevation rather than relative depth as the vertical coordinate (Figure 14.37).
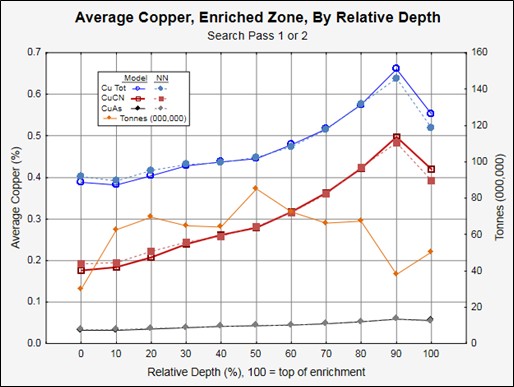
Figure 11.37: Comparison of Total Copper Model and Data Averages By Relative Depth (CRM 2025)
Both model and data average grades decrease similarly for total and soluble copper. Additionally, the total and CuCN lines show increasingly larger separation with depth (towards zero) due to the decrease in solubility. Generally, the model and data (NN) averages match well but at the greatest relative depths (near the leach contact, relative depth = 100) the model average exceeds the NN average. The reverse is true at the base of the enriched zone. This difference is expected because the relative depth methodology forces the estimator to follow the upper and lower surfaces of the enriched zone so the model better reproduces the actual grade trend without the vertical mixing that occurs when an estimator (such as the NN estimation) considers true elevation.
A more detailed validation of the model results is provided by considering results by lithology in addition to relative depth. Figure 11.38 presents results for model blocks estimated in model search pass 1.
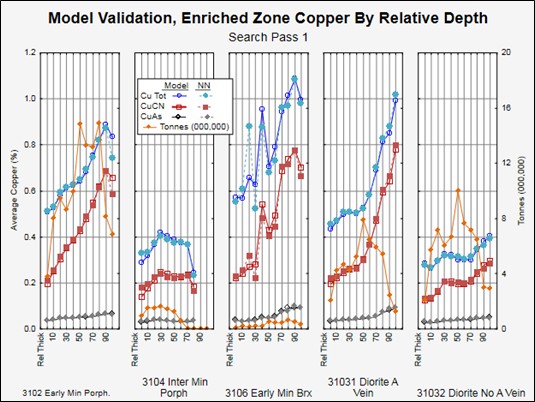
Figure 11.38: Model validation by lithology in enriched zone (CRM 2025)
There is very good agreement between the model and data averages for all lithologies. Small differences at the smallest and largest relative depths are observed. Except for the inter-mineral porphyry (domain 3104) grades and solubility clearly decrease approaching the base of the enriched zone. For domain 3104, copper grades are relatively constant (with low solubility) throughout the enriched zone indicating that, possibly, the physical properties of this porphyry are not conducive to the leaching and deposition of chalcocite. In the early breccia (domain 3106), random differences are seen between the two estimates. These differences are due to the small tonnage found in this domain and are not indicative of a systematic difference in the model and data averages.
Resource Classification
The mineral resources at the Los Azules deposit have been classified in accordance with the CIM Definition Standards for Mineral Resources and Mineral Reserves (May 2014). Studies supporting the 2017 PEA model (Hatch, 2017) found that drilling on a 150m grid was sufficient to define an Indicated Resource and that drilling on a 50 to 60m grid was sufficient to define Measured Resources.
This result was validated by CRM. Benchmarking performed as part of the resource model audit performed by Snowden-Optiro supports the definition of these thresholds for Measured and Indicated Resources based on an analysis of the classification approach followed for copper deposits similar to Los Azules.
The resource classification approach at Los Azules recognizes that the deposit is not drilled on a regular grid. To obtain a measure of the local drilling density, a block-by-block computation was performed for blocks located outside of the leached or overburden zones. For each block, the average distance to the nearest three drillholes was determined. Based on the studies performed and the resource audit benchmarking, where the average distance to the nearest three drillholes was less than 50m the block was defined as Measured Resource. When the average distance was between 50m and 120m the block was defined as indicated resource. Blocks with an average distance to the nearest three drillholes between 120m and 400m were considered inferred resource.
Following the initial classification, the image of classified blocks shows complicated boundaries and small isolated islands of differently classified blocks. To smooth the roughness of the initial image, a smoothing algorithm is applied. The algorithm proceeds as follows:
Define a random path for visiting each model block
Compare the resource class of the block with the most common class of the 26 contact blocks
The comparison considers the most common weighted adjacent block. The weight factors used are 9, 3, and 1 for face, edge and point contacts.
If the most common weighted classification differs from the class of the block and the weight exceeds 50% change the class of the block.
Tabulate the number of classification changes after visiting all blocks.
If the number of changes is larger than 10 select a new random path and repeat the procedure
The initial classification and the final smoothed classification are presented in Figure 11.39 for level 3500. The change in resource class from Indicated to Measured closely follows the change in drill spacing seen in plan.

Figure 11.39: Example of initial versus smoothed classification at Level 3500. (CRM 2025)
At zero cutoff, the enriched zone resource tonnage has increased due to an increase in the modeled volume of the enriched zone plus conversion of unclassified resource into inferred resource. These two factors increase the volume of low-grade enriched material and cause the drop in copper grades. Copper metal contained, however, has increased.
At a total copper cutoff of 0.2%, tonnage above cutoff is somewhat larger for the 2024 model but the quantity of copper of metal has decreased (about 1% for total copper) due to the decrease in average grades. These changes are due to the following factors:
Reduction in the volume of high-grade breccia following a re-interpretation of lithology
New drilling which showed a reduction in the modeled volume (lateral extent) of some pods of high-grade material near structures.
Some negative drilling surprises such as a sharp rise in the top of the primary zone locally reducing the volume of enrichment and discovering low-grade mineralization adjacent to generally mineralized structures.
These results are not uncommon when performing in-fill drilling at deposits where structural control on grade is strong.
Due to the infill drilling performed during the 2023/2024 field season, the current resource classification shows important increases in the tonnage of Measured and Indicated Resources in the enriched zone at zero cutoff. Table 11.26.
Table 11.26: Change in Potential Resource, Enriched Zone (July, 2024 Less March 2023 | ||||||||
Change in Potential Resource, Enriched Zone (July, 2024 Less March 2023) | ||||||||
|
Resource Class |
Absolute Change |
Relative Change |
||||||
|
Tonnes (000,000) |
Copper Metal, Mtonnes |
Tonnes (000,000) |
Copper Metal, Mtonnes |
|||||
Total |
Cyanide Soluble |
Acid Soluble |
Total |
Cyanide Soluble |
Acid Soluble |
|||
Measured |
205 |
1.393 |
0.934 |
0.110 |
- |
- |
- |
- |
Indicated |
228 |
-0.263 |
-0.261 |
0.005 |
32% |
7.5% |
12% |
1.3% |
Inferred |
-112 |
-0.901 |
-0.595 |
-0.091 |
-24% |
-56% |
-62% |
-47% |
Total |
321 |
0.229 |
0.079 |
0.023 |
27% |
4.5% |
2.5% |
4.2% |
The changes in the tonnage and quantity of copper metal reporting to each resource class are shown in both absolute and relative terms. The total line considers the total tonnage of the enriched zone. There is an important increase in the tonnage of the enriched zone due to changes in the geologic model plus the conversion of previously unclassified tonnage into inferred for the 2024 model. The added tonnage contains low copper grades as the change in the total copper metal has only increased by 4.5% despite a tonnage increase of 27%. Due to the conversion from inferred to indicated following the 2024 drilling, Inferred tonnage has been reduced by 24% but copper metal has reduced by 56% due to the focus on the more central (better mineralized) portion of the previously Inferred tonnage. Metal losses are also observed for the indicated resource despite an increase in tonnage. This occurs because the material converted from Indicated to Measured is high grade and the Inferred resource converted to indicated is relatively low grade.
Total Potential Resource, Primary Zone, Comparison with 2023 IA
The resource inventory for the primary zones (hypogene, bornite, and bornite-chalcopyrite mineral zones) is tabulated and compared with the equivalent resource defined for the 2023 IA model.
After inclusion of the 2023/2024 drilling information, a small, measured tonnage is defined. These tonnes of ore are located near the central structure and show elevated copper grades. Nearly 250 million tonnes of material were added to the indicated resource at zero cutoff. The grade of this Indicated Resource is less than that defined for the 2023 IA model due to the inclusion of lower grade material defined as Inferred in 2023 and the conversion of higher grade Indicated material to Measured Resources.
An important change in the primary zone modeling approach was initiated for the 2024 model: the lithological units were separated, per lithology, into sub-domains based on the presence or absence of “A Veins” which are associated with the higher-grade early mineralization. This change in the modeling approach was implemented to better restrict higher grades to the core of the deposit and prevent excessive spreading of higher grades over sparsely sampled volumes. The change in the estimated grades is shown in Figure 11.40.
The following plots show the local changes in the estimated primary zone total copper model grades due, primarily, to the changes in modeling approach. To allow for the known spatial grade trends average grades are presented as a function of distance to the central structure and depth below the enriched zone. Separate plots are prepared for blocks within and outside of the modeled volume of dominant “A-Veins”. To consider blocks that will potentially be considered as economic resources, the model blocks considered are located within the 2023 IA ultimate pit. Only blocks defined as hypogene (mineral zone code 7) in both the 2023 and 2024 models are considered.

Figure 11.40: Compares estimated average grades within the dominant “A-Vein” volume. (CRM 2025)
Within the “A-Vein” dominant volume, the 2023 and 2024 model average grades are very similar. The association between elevated copper grades and the central structure is clearly seen although the structure is present about 150m to the east of the structure location in the enriched zone.
Average grades for blocks outside of the “A-Vein” volume are shown in Figure 11.41.
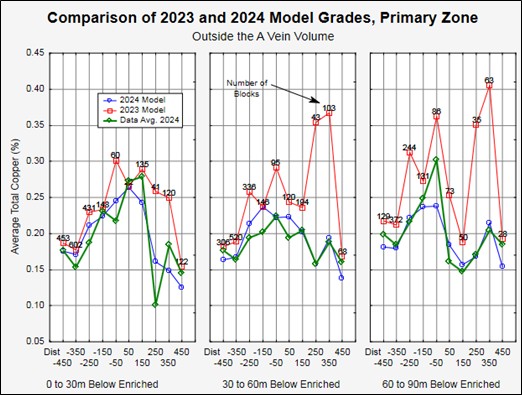
Figure 11.41: Average grades for blocks outside of the “A-Vein” volume (CRM 2025)
Outside of the “A-Vein” volume, average grades are lower in general and the 2023 model grades are larger than the 2024 model grades. The “data average” line (Nearest neighbor model controlled by “A-Vein” sub-domains) shows that the 2024 model grades honor the data used in the estimation. The larger grades in the 2023 model are associated with the lack of lateral controls on the high-grade “A-Vein” data that are present in the 2024 model. That is the elevated 2023 model grades are associated with “smearing” of grades associated with the high-grade early mineralization. Over the model volume considered in this analysis, removal of the grade smearing reduces the primary zone grade within the study volume (109 million tonnes) from 0.307% to 0.288% (6.2% reduction of grade at zero cutoff).
FACTORS AFFECTING THE MINERAL RESOURCES
Mineral Resources are subject to the types of risks common to open pit copper mining operations and include:
Metal price and exchange rate assumptions
Changes to the assumptions used to generate the cut-off grades
Changes in local interpretations of mineralization geometry and continuity of mineralized zones
Changes to geological and mineralization shapes, and geological and grade continuity assumptions
Density and domain assignments
Changes to geotechnical and hydrogeological design assumptions
Changes to mining and metallurgical recovery assumptions
Change to the input and design parameter assumptions that pertain to the open pit constraining the estimates
Assumptions as to product marketability, payability, and penalty terms
Assumptions as to the continued ability to access the site, retain mineral rights and obtain surface rights titles, obtain environment and other regulatory permits, and maintain the social license to operate.
ADEQUACY STATEMENT ON SECTION 11
The QP believes that the EDA, mineralogical wireframing, grade capping, and grade estimation methodologies used in the creation of this MRE followed sound standards and conforms to the requirements of an NI 43-101 Technical Report. The outlined resource has shown itself to be quite robust with recent added drilling having little effect on the tonnes and grade but improving confidence. Major factors affecting the MRE include the downgrading of resources affected by the identified cryogenic geoforms to Inferred for potential environmental concerns.
Mineral Reserve Estimates
SUMMARY
The Mineral Reserves for the Los Azules Project are based on the conversion of Measured and Indicated resources within the Los Azules open pit.
The Mineral Reserves are shown in Table 12.1. Some variation may exist due to rounding.
Table 12.1: Proven and Probable Reserves – September 3, 2025 | ||||
|
|
Grade |
Contained Metal |
|
Reserves |
Tonnage |
Cu Total |
Cu Soluble |
Cu |
Class |
kt |
% |
% |
Mlb |
Proven |
229,879 |
0.683 |
0.495 |
3,463 |
Probable |
793,173 |
0.386 |
0.259 |
6,754 |
Total |
1,023,052 |
0.453 |
0.312 |
10,217 |
Note:
The Qualified Person for the Mineral Reserve estimates is Gordon Zurowski P.Eng., an AGP employee. Mineral Reserves have an effective date of September 3, 2025. Mineral Reserves are reported on a 100% basis.
Mineral Reserves are estimated to be assuming open pit mining methods and include dilution. Pit slopes vary by sector and range from 32° to 37°. Cut-off is variable and ranges from $4.79/t NSR to $7.23/t NSR. The copper price used was $4.25/lb Cu. Cu recovery varies by lithology. Mining costs vary by bench with a minimum of $2.142/t and a maximum of $4.113/t. Processing costs are variable and range from $3.183/t to $5.620/t leached. The processing costs include: $1.607/t G&A, $0.433/t leached sustaining capital, and $0.15/t leached closure cost. Cu cathode sales cost is $0.02/lb Cu. Cu cathode was assumed to be sold FOB the mine site.
OVERVIEW
Mineral Reserves were classified in accordance with the 2014 CIM Definition Standards. Only Mineral Resources that were classified as Measured and Indicated were given economic attributes in the mine design and when demonstrating economic viability. Mineral Reserves incorporates appropriate mining dilution and mining recovery estimations for the open pit mining method.
The Mineral Reserve estimate for the Project is based on the April 2025 resource block model described in Section 14, other inputs to this report, and information generated by AGP based on earlier mining studies.
A Mineral Reserve is an estimate of the economically mineable part of a Measured and/or Indicated Mineral Resource. The reference point at which the Mineral Reserves are defined is the point where the ore is delivered to the processing plant. The Mineral Reserves include diluting materials and allowances for mine losses, which occur when the material is mined.
GEOTECHNICAL PIT SLOPE ASSESSMENT AND DESIGN GUIDANCE
E-Mining Technology, S.A. (EMT) updated the pit slope assessment in July 2025. Pit design parameters were defined for the pit geometry by design sector for each Geotechnical Unit, and reference overall slope angles were established, which could vary depending on the depth of the pit design. A more detailed description of the work carried out by EMT is included in Section 16.2.
Based on the analysis carried out and the integration of new geotechnical information, it is concluded that the design parameters provided are well aligned with the geotechnical characteristics and conditions, and that they support the geometric design of the final pit.
The adopted configuration, based on single benches of 15 meters and ramp widths of 40 meters, along with the established berms and angles, ensures a geometry compatible with technical, operational, and economic criteria.
MINING MODEL PREPARATION
The resource model for the Los Azules deposit was provided in ASCII format. This file was imported into the HxGN MinePlan™ software where geotechnical sectors and economic parameters were integrated into the block model.
Once the mining parameters were added to the block model, the HxGN MinePlan™ block model was exported to ASCII format and then imported to the Whittle™ software for pit optimization.
PIT OPTIMIZATION
The pit shells that define the ultimate pit limit, and serve as guide to design the internal phases, were derived using the Lerchs & Grossmann (LG) pit optimization algorithm. This process considers the information stored in the resource block model, the pit slope angles by geotechnical sector, the commodity prices, the mining and processing costs, the process recovery, and the sales cost for the metals produced. Primary optimization inputs are summarized in Table 12.2.
Table 12.2: Pit Optimization Inputs | ||
|---|---|---|
Parameter |
Unit |
Value |
Metal Prices | ||
Copper |
$/lb |
4.25 |
Discount Rate |
% |
8 |
Table 12.2: Pit Optimization Inputs | ||
|---|---|---|
Parameter |
Unit |
Value |
Processing Rate |
kt/a |
50,000 |
Dilution |
% |
Included in Resource Model |
Mining Losses |
% |
Included in Resource Model |
Cu Recoveries by Lithology |
|
|
IMP & IMP BX |
% |
(7.16 + (95.41 * CuSOL/CuT))/100 |
DIO, EMP, & IMP BX -CuSOL/CuT <= 50% |
% |
(10.07 + (97.60 * CuSOL/CuT))/100 |
DIO, EMP, & IMP BX-CuSOL/CuT > 50% |
% |
(37.81 + (-7.02*CuT) + (61.91 * CuSOL/CuT))/100 |
Mining Operating Cost |
|
|
LOM Average Mining Cost |
$/t |
2.61 |
Base Mining Cost |
$/t |
2.14 |
Uphill Incremental Cost |
$/t/bench below RL |
0.073 |
Downhill Incremental Cost |
$/t/bench above RL |
0.042 |
Reference Level (RL) |
Bench Elevation |
3565 |
Stockpile Reclaim Cost |
$/t |
1.61 |
Process Cost |
|
|
Base OPEX |
$/t leached |
1.77 |
Acid Consumption |
kg/t leached |
18 |
Acid Cost |
$/t leached |
(acid_consumption - acid_recv) * 0.3146 * acid_price |
Acid Recovered |
kg/t leached |
Recovered Cu kgs * 1.54 |
Acid Price |
$/t |
315 |
Sustaining cost |
$/t leached |
0.43 |
Table 12.2: Pit Optimization Inputs | ||
|---|---|---|
Parameter |
Unit |
Value |
G&A cost |
$/t leached |
1.61 |
Closure Cost |
$/t leached |
0.15 |
Royalties |
|
|
San Juan Province Royalty |
% NSR |
3.00 |
TNR Royalty |
% NSR |
0.40 |
McEwen Royalty |
% NSR |
1.25 |
Sales Cost |
|
|
Cu Cathode Sales Cost |
$/lb |
0.02 |
Freight Cost |
$/t Cu |
0.00 |
Insurance |
%NIV |
0.00 |
Overall Slope Angles (OSA) |
|
Per the design recommendations in Section 16.2 |
The optimization run included 47 pit shells defined according to different revenue factors from 0.18 to 1.10. Pit shell 42, revenue factor 1, is the breakeven pit shell at the base case metal price of $4.25/lb copper. Following optimization, AGP conducted a pit-by-pit analysis to evaluate the contribution of each incremental shell to NPV. Following this analysis, AGP selected pit shell 37 because the contributions of pit shells 37 to 41 were minimal. Pit shell 37 includes 1,100.3 Mt of mineralized material and 1,460.6 Mt of waste. As expected, when applying practical mining constraints to the pit shells, the ore tonnages decreased, and the waste tonnes increased as some areas within the optimized pit will not be mineable after applying pit designs. The pit-by-pit graph is shown in Figure 12.1. The selected pit shell contours are shown in Figure 12.2.

Figure 12.1: Pit-by-Pit Graph (AGP 2025)

Source: AGP 2025
Figure 12.2: Ultimate Pit Shell (AGP 2025)
Dilution and Ore Losses
The resource model includes dilution. No additional dilution or ore losses were considered due to the large size of the block model SMU.
Cut-off Grade Descriptor
A Net Sales Return (NSR) cut-off grade descriptor (cut-off) has been estimated according to the following formulas:
Economic Cut-off=(Mining Cost+Process Cost+G&A+Closure Cost)/((Revenue-Sales Cost)*Process Recovery)
Marginal Cut-off=(Process Cost+G&A+Closure Cost)/((Revenue-Sales Cost)*Process Recovery)
In pit optimization, the marginal cut-off is used to differentiate between ore and waste. It accounts for process, G&A and closure costs, thus reducing the operating expenditures but not generating revenue. To define Mineral Reserves, the reclaim cost is added to account for the stockpiling of low-grade material.
As the process cost varies by lithology, the marginal cut-off is variable ranging from $4.79/t NSR to $7.23/t NSR.
Mine Design
Based on the pit optimization outcomes and to support practical access to mineralized areas, pit designs for the ultimate pit and twelve interim phases were generated. To derive the ultimate pit design, the selected case pit shell (RF = 0.9) was used. The pit geometry has been developed in accordance with site-specific geotechnical design parameters and is configured to accommodate the operational requirements of ultra-class autonomous haulage systems. The interim phases were used to derive the mining sequence with the goal of maximizing feed grades in the early years of production, as well as balancing stripping requirements. The mine design parameters are shown in Table 12.3.
Table 12.3: Mine Design Parameters | ||
Item |
Units |
Description/Value |
Bench Height |
m |
15 |
Base Whittle Shell |
Revenue Factor 0.9 |
|
Ramp width | ||
In-Pit Double-lane Ramp |
m |
40 |
In-Pit Single-lane Ramp |
m |
30 |
Out-Pit Double-lane Ramp |
m |
48 |
Ramp Gradient |
% |
10 |
Minimum Mining Width |
m |
40 |
Minimum Layback Width |
m |
65 |
Design Layback Width |
m |
110 |
The ultimate pit design is shown in Figure 12.3. Sections shown from Figure 12.4 to Figure 12.6 display the ultimate pit design and the selected pit shell. The pit optimization vs. mine design comparison is shown in Table 12.4.
Table 12.4: Pit Optimization Versus Mine Design Comparison | |||||
|
Total Ore |
Waste |
Total Material |
||
Description |
Mt |
Cu (%) |
CuSOL (%) |
Mt |
Mt |
Mine Design |
|||||
Ore |
1,008.8 |
0.455 |
0.317 |
||
Marginal1 |
68.61 |
0.217 |
0.059 |
||
Total |
1,077.3 |
0.440 |
0.300 |
1,629.2 |
2,706.5 |
Pit Optimization |
1,100.3 |
0.442 |
0.300 |
1,460.6 |
2,560.9 |
Difference |
- 22.94 |
168.6 |
145.6 |
||
|
-2.09% |
11.54% |
5.69% |
Some low-grade ore will not be processed when applying the stockpile reclaim cost.

Source: AGP 2025
Figure 12.3: Ultimate Pit Design (AGP 2025)

Source: AGP 2025
Figure 12.4: Ultimate Pit Design and Selected Pit Shell – Section 1 (AGP 2025)
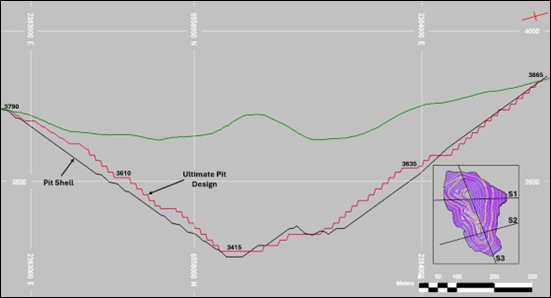
Source: AGP 2025
Figure 12.5: Ultimate Pit Design and Selected Pit Shell – Section 2 (AGP 2025)

Source: AGP 2025
Figure 12.6: Ultimate Pit Design and Selected Pit Shell – Section 3 (AGP 2025)
MINE SCHEDULE
The mining rate targets the crushing of a maximum 50 mtpa. There is an initial ramp-up period to allow the process plant to come online. Recovered copper capacity peaks at 256 kt in year 3, then decreases to 205 kt on average for the next 3 years.
Oxide and enriched material are sent to the crusher or to a stockpile to be processed later in the mine schedule. The material is crushed and then conveyed and stacked on the Heap Leach Facility.
Primary sulfide material is stored in a separate stockpile to the north of the Los Azules pit and not processed in the Feasibility nor considered as Mineral Reserves.
Total life of mine heap leach production will be 1.023 billion tonnes grading 0.453% copper. The overall mine waste will be 1.684 billion tonnes resulting in an overall mine strip ratio of 1.65:1 (waste : ore).
MINERAL RESERVES
As the mining cost varies with depth, and process cost varies by lithology, individual blocks captured within the final pit design were tagged as either ore or waste by applying the parameters shown in Table 12.2. Using the partial block percentages within the final pit design, the ore tonnage and average grade were calculated. The Mineral Reserves statement is shown in Table 12.5.
Table 12.5: Los Azules Mineral Reserves Statement, Effective Date 03 September 2025 | ||||
|
Grade |
Contained Metal |
||
Reserves |
Tonnage |
Cu Total |
Cu Soluble |
Cu |
Class |
kt |
% |
% |
Mlb |
Proven |
229,879 |
0.683 |
0.495 |
3,463 |
Probable |
793,173 |
0.386 |
0.259 |
6,754 |
Total |
1,023,052 |
0.453 |
0.312 |
10,217 |
Note:
The Qualified Person for the Mineral Reserve estimates is Gordon Zurowski P.Eng., an AGP employee. Mineral Reserves have an effective date of September 3, 2025. Mineral Reserves are reported on a 100% basis.
Mineral Reserves are estimated to be assuming open pit mining methods and include dilution. Pit slopes vary by sector and range from 32° to 37°. Cut-off is variable and ranges from $4.79/t NSR to $7.23/t NSR. The copper price used was $4.25/lb Cu. Cu recovery varies by lithology. Mining costs vary by bench with a minimum of $2.142/t and a maximum of $4.113/t. Processing costs are variable and range from $3.183 to $5.620/t leached. The processing costs include: $1.607/t G&A, $0.433/t leached sustaining capital, and $0.15/t leached closure cost. Cu cathode sales cost is $0.02/lb Cu. Cu cathode was assumed to be sold FOB the mine site.
FACTORS AFFECTING THE MINERAL RESERVES
The Mineral Reserves are subject to the types of risks common to open pit copper mining operations and include:
Metal price and exchange rate assumptions
Changes to the assumptions used to generate the cut-off grades
Changes in local interpretations of mineralization geometry and continuity of mineralized zones
Changes to geological and mineralization shapes, and geological and grade continuity assumptions
Density and domain assignments
Changes to geotechnical and hydrogeological design assumptions
Changes to mining and metallurgical recovery assumptions
Change to the input and design parameter assumptions that pertain to the open pit constraining the estimates
Assumptions as to product marketability, payability, and penalty terms
Assumptions as to the continued ability to access the site, retain mineral rights and obtain surface rights titles, obtain environment and other regulatory permits, and maintain the social license to operate.
ADEQUACY STATEMENT ON SECTION 12
The QP believes the design criteria, methodology, facilities and equipment selections and descriptions of the project areas are appropriate and consistent with other similar current operations and studies for similar projects. The information is suitable for use in establishing reasonable prospects for eventual economic extraction for the Mineral Reserves and Resources considered, the mine plans, cost estimates and financial analysis included in this Report and Mineral Reserves estimate presented.
Mining Methods
overview
The following section outlines the parameters and procedures used for the design of the mine as a conventional open pit, estimates the mineral reserves within the open pit mine plan, and establishes a practical mining schedule for the Los Azules Feasibility Study (FS). The mine plan is based on the Proven and Probable Mineral Reserves presented in Section 12 of this report.
PIT GEOTECHNICAL DESIGN CRITERIA
Based on information provided by Los Azules and previous studies, the geotechnical model was updated together with the rock mass properties.
The geotechnical model for the “Los Azules” deposit integrates three key components: rock mass characterization, structural domains and hydrogeological conditions, providing a comprehensive framework for pit design and slope stability analyses. This updated model allowed us to define and support design parameters for the open pit project.
Rock Mass Characterization
The update model incorporates new information from recent drilling campaigns, as well as detailed relogging of drill core by the Los Azules geology team, which allowed for a more comprehensive characterization of rock mass fracturing. The study included assessment of fracture intensity, intact rock strength testing, and integration of structural and geomorphological features.
The geotechnical sectors defined in previous studies were retained; however, a reinterpretation regarding to the weak zone was developed. This reinterpretation was focused in two main aspects: i) a geometric reinterpretation of the weak zone envelopes, and ii) a subdivision of Fault-Weakened Zone (FWZ) into two distinct domains. The final geotechnical units considered for pit slope design are detailed in Table 13.1.
Table 13.1: Rock Mass Characterization | ||||||||
|---|---|---|---|---|---|---|---|---|
Geotechnical Unit |
Description |
Rock Mass Quality (RMR 1989) |
Sci |
|||||
min |
mean |
max |
min |
mean |
max |
|||
Fault-Weakened Zone 1 |
FWZ1 |
Very highly fractured domain along major structural features (core and damage zones). Very poor to poor quality rock. |
25 |
30 |
35 |
20 |
25 |
30 |
Fault-Weakened Zone 2 |
FWZ2 |
Highly to very highly fractured zone adjacent to FWZ-1. Structural block defined by the "Los Azules, Ballena and Cairo fault system". Poor to fair quality rock. |
35 |
40 |
45 |
28 |
35 |
42 |
Table 13.1: Rock Mass Characterization | ||||||||
|---|---|---|---|---|---|---|---|---|
Geotechnical Unit |
Description |
Rock Mass Quality (RMR 1989) |
Sci |
|||||
min |
mean |
max |
min |
mean |
max |
|||
Sericitized Leached Cap |
SLC |
Leached zone with sericitic alteration. Rock mass of poor to fair quality. |
35 |
41 |
47 |
25 |
32 |
37 |
Non-Sericitized Leached Cap |
NSLC |
Leached zone without sericitic alteration. Rock mass of fair quality. |
38 |
44 |
49 |
43 |
59 |
66 |
Sericitized Supergene |
SS |
Supergene zone with sericitic alteration. Rock mass of poor to fair quality. |
36 |
43 |
50 |
42 |
51 |
56 |
Non-Sericitized Supergene |
NSS |
Supergene zone without sericitic alteration. Rock mass of poor to fair quality. |
37 |
47 |
55 |
49 |
67 |
82 |
Hypogene |
HG |
Hypogene rock mass of fair quality. |
43 |
51 |
57 |
72 |
90 |
108 |
Overburden |
OB |
Surficial Unit. Glacial moraines, debris, scree, and frost-shattered bedrock covering the deposit valley. |
Not applicable |
|||||
Structural Domains
The structural framework of the Los Azules deposit is controlled by major fault systems striking NNW and NE, which exerts strong control on the distribution of hydrothermal alteration and mineralization. Five structural domains were defined through stereographic analysis of drill core structural data, with major faults were considered as boundaries to delineate structural blocks. These domains represent the structural fabric of the rock mass and are designated as SD1 (North), SD2 (East), SD3 (Southeast), SD4 (SouthWest) and SD5 (West).
Groundwater Considerations
Six hydrogeological units (HU) were identified, including primary aquifers in surficial deposits (HU1 and HU2), the main secondary aquifer in dacitic porphyry, breccias and veins (HU3) controlling a significant portion of groundwater flow, aquitard and aquifuges in Miocene and pre-Cenozoic rocks (HU4 and HU6), and fault zones acting as a transmissive but low-storage secondary aquifers (HU5).
Piezometric monitoring (February 2024) indicates groundwater levels ranging from ~1 to 67 meters below natural terrain (mbnt), with artesian conditions locally observed in the southwestern pit area. Levels deepen progressively along the La Ballena axis and valley slopes with increasing elevation, while shallower levels (<10 mbnt) dominate the northeastern and southern low-lying sectors.
Pit Slope Design and Analysis
The pit slope design was developed based on geotechnical, structural, and hydrogeological characterization of the rock mass, supported by geotechnical core logging, laboratory testing, and complemented by an expert site visit to the geological core shed.
Analyses included kinematic stability and 2D limit equilibrium methods to evaluate rock mass stability. This approach ensured that the recommended slope geometries provide adequate stability under static and expected seismic conditions.
The ultimate pit was subdivided into eight design sectors: Northeast, East, Southeast, South, Southwest, West 1, West 2, and North. Each sector was further subdivided into subsectors according to the prevailing geotechnical environment, defined by variations in lithology, alteration, and structural domains. These geotechnical environments govern the recommended slope configurations and include the Hypogene (HG), Non-Sericitized and Sericitized Supergene/Leach Cap (NSSG/SSG/NSLC/SLC), Fault-Weakened Zone (FWZ), and Overburden (OB) units. The design parameters were defined for each geotechnical environment, according to the degree of fracturing and the relative competence of the rock mass.
The recommended design parameters by sector, subsector and geotechnical environment are presented in Table 13.2 and Figure 13.1.
Table 13.2: Recommended Pit Slope Design Criteria | |||||||||||
|---|---|---|---|---|---|---|---|---|---|---|---|
|
Pit Design Sector |
Sub-Sector |
Geotechnical Environment |
Sub Sector Boundary Elevation (Lower-upper) (m.a.s.l) |
Overall Slope Height (m) |
Bench Height (m) |
Bench Width (m) |
Bench Face Angle (°) |
Inter- Ramp Angle (°) |
Max Inter- Ramp Height (m) |
Step-outs width (m) |
Overall Slope Angle (°) |
Surface |
- |
OB |
Relative condition |
- |
15 |
4.0 |
37° |
32° |
60 |
25 |
- |
Northeast |
Upper |
NSSG/SSG/ NSLC/SLC |
3590 - surface |
520-580 |
15 |
12.1 |
75° |
43° |
120 |
25 |
37° |
Middle |
HG |
3400 - 3590 |
15 |
10.0 |
75° |
47° |
120 |
25 |
|||
Table 13.2: Recommended Pit Slope Design Criteria | |||||||||||
|---|---|---|---|---|---|---|---|---|---|---|---|
|
Pit Design Sector |
Sub-Sector |
Geotechnical Environment |
Sub Sector Boundary Elevation (Lower-upper) (m.a.s.l) |
Overall Slope Height (m) |
Bench Height (m) |
Bench Width (m) |
Bench Face Angle (°) |
Inter- Ramp Angle (°) |
Max Inter- Ramp Height (m) |
Step-outs width (m) |
Overall Slope Angle (°) |
Lower |
FWZ |
Bottom - 3400 |
15 |
15.2 |
70° |
36° |
60 |
30 |
|||
East |
Upper |
NSSG/SSG/ NSLC/SLC |
3760 - surface |
900-1000 |
15 |
12.1 |
75° |
43° |
120 |
25 |
36° |
Middle |
HG |
3565 - 3760 |
15 |
10.0 |
75° |
47° |
120 |
25 |
|||
Lower |
FWZ |
Bottom - 3565 |
15 |
15.2 |
70° |
36° |
60 |
30 |
|||
Southeast |
Upper |
NSSG/SSG/ NSLC/SLC |
3490 - surface |
460-510 |
15 |
12.1 |
75° |
43° |
120 |
25 |
37° |
Lower |
FWZ |
Bottom - 3490 |
15 |
15.2 |
70° |
36° |
60 |
30 |
|||
South |
- |
FWZ |
Bottom - surface |
420-500 |
15 |
15.2 |
70° |
36° |
60 |
30 |
30° |
Southwest |
Upper |
OB |
3685 - surface |
320-380 |
15 |
4.0 |
37° |
32° |
60 |
25 |
34° |
Middle |
NSSG/SSG/ NSLC/SLC |
3415 - 3685 |
15 |
12.1 |
75° |
43° |
120 |
25 |
|||
Lower |
FWZ |
Bottom - 3415 |
15 |
15.2 |
70° |
36° |
60 |
30 |
|||
West 1 |
Upper |
NSSG/SSG/ NSLC/SLC |
3625 - surface |
500-540 |
15 |
12.1 |
75° |
43° |
120 |
25 |
37° |
Middle |
HG |
3355 - 3625 |
15 |
10.0 |
75° |
47° |
120 |
25 |
|||
Lower |
FWZ |
Bottom - 3355 |
15 |
15.2 |
70° |
36° |
60 |
30 |
|||
West 2 |
Upper |
NSSG/SSG/ NSLC/SLC |
3550 - surface |
530-580 |
15 |
12.1 |
75° |
43° |
120 |
25 |
37° |
Table 13.2: Recommended Pit Slope Design Criteria | |||||||||||
|---|---|---|---|---|---|---|---|---|---|---|---|
|
Pit Design Sector |
Sub-Sector |
Geotechnical Environment |
Sub Sector Boundary Elevation (Lower-upper) (m.a.s.l) |
Overall Slope Height (m) |
Bench Height (m) |
Bench Width (m) |
Bench Face Angle (°) |
Inter- Ramp Angle (°) |
Max Inter- Ramp Height (m) |
Step-outs width (m) |
Overall Slope Angle (°) |
Middle |
HG |
3280 - 3550 |
15 |
10.0 |
75° |
47° |
120 |
25 |
|||
Lower |
FWZ |
Bottom - 3280 |
15 |
15.2 |
70° |
36° |
60 |
30 |
|||
North |
- |
FWZ |
Bottom - surface |
400-480 |
15 |
15.2 |
70° |
36° |
60 |
30 |
32° |

Figure 13.1: Recommended Design Parameters by Design Sector and Geotechnical Environment (EMT 2025)
The recommended pit slope configurations are as follows:
Hypogene (HG): A bench face angle of 75°, an inter-ramp angle (IRA) of 47°, and berm width of 10.0 m, with a maximum inter-ramp height of 120 m.
NSSG/SSG/NSLC/SLC: A bench face angle of 75°, an IRA of 43°, and berm width of 12.1 m, with a maximum inter-ramp height of 120 m.
Fault-Weakened Zone (FWZ): A bench face angle of 70°, an IRA of 36°, and berm width of 15.2 m, required to account for weaker rock mass conditions; maximum inter-ramp height limited to 60 m.
Overburden (OB): A bench face angle of 37°, an IRA of 32°, and berm width of 4.0 m, recommended for localized surficial deposits; maximum inter-ramp height should not exceed 60 m.
Operational Requirements
The implementation of the recommended slope designs requires:
Dewatering and Depressurization: Intensive pit dewatering through vertical pumping wells and horizontal drains to reduce pore pressures and enhance slope stability.
Controlled Blasting: Application of low damage blasting techniques and controlled excavation practices to preserve slope integrity.
Monitoring: Continuous and systematic slope monitoring throughout pit operations to ensure performance and safety.
HYDROGEOLOGICAL AND WATER MANAGEMENT CONSIDERATIONS
Hydrology and Pit Dewatering
Mining operations at the Los Azules Project will intersect the water table, requiring dewatering to maintain dry working conditions and allow safe mining access. A strategic dewatering plan is necessary to manage groundwater inflows throughout the Life of Mine (LOM).
During pit development, saturated overburden and Tertiary volcanics including porphyritic dacite, dacite, and rhyolite tuff will be encountered. Overburden consists of glacial outwash and colluvial and alluvial deposits, particularly in the northern pit sector, with thicknesses exceeding 80 m. These materials exhibit high permeability, though their spatial extent is limited based on borehole drilling and seismic investigations.
From 2022 to February 2025, B&W Hidrogeología y Medioambiente SRL (BW) conducted hydrogeological studies to assess large-scale dewatering requirements. The key activities comprised:
Water balance, integrating all the available climate data from the site.
Fractured aquifer characterization in the future Pit area, drilling three deep pumping wells (DWT) and four piezometers used as observation wells during pumping testing (OBS-DWT).
Overburden aquifer characterization in the future Pit area, using 21 shallow drillholes, including two pumping wells with its associated observation wells.
Development of a conceptual site model.
3D hydrogeological numerical modeling: supported by the hydrological and hydrogeological conceptual model, the model can simulate water inflows/outflows and predict dewatering requirements, optimizing dewatering well location, design, and number. As a benefit, the dewatering plan also provides an initial water supply for the process plant during the initial years of operation.
Characterization of surface hydrology.
A quantitative Water Balance was developed to estimate:
Available water from dewatering
The site hydrology to be incorporated as boundary conditions in the numerical groundwater modeling.
The water balance for the site was focused within the Río de las Salinas basin; this, in turn, is divided into six sub-basins covering a total of 128.02 km2 (Figure 13.2).
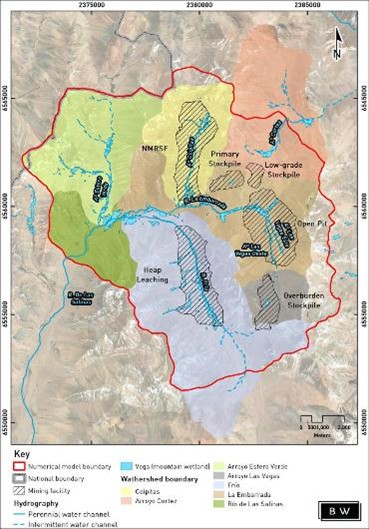
Figure 13.2: Mining Activities Related to the Main Hydrological Basins (BW 2025)
RECHARGE ESTIMATE
Assumptions, based on sensor data installed in boreholes and meteorological records from Los Azules and Calderon meteorological stations, indicate:
Winter (May-September): Basin covered in snow (Figure 13.3), negligible runoff and evapotranspiration rates, groundwater levels decline.
Spring-Summer (September-May): Snowmelt increases surface runoff and groundwater recharge.
El Calderon Meteorological Station from the San Juan Hydraulic Department is located 30 km from the project area; it provided critical snowmelt data (SWE - snow water equivalent), which completed records of sources of water in the project area since snow is the major source of recharge.

Figure 13.3: Los Azules Project Area, May 2024 (BW)
To estimate the recharge, the area was divided into four zones (I-IV) categorized by lithology, fracturing, and slope. (Figure 13.4).

Figure 13.4: Delineated Zones & Slopes Used for Recharge Estimate & its Associated Lithologies (BW, 2025)
Highly fractured zones (Zone IV) show direct recharge, while other areas contribute via interconnected fractures, forming localized aquifers that sustain valley wetlands.
The recharge estimate for each zone is shown in Table 13.3.
Table 13.3: Recharge Estimates for the Geological Environments of the Rio De Las Salinas Basin | ||||||||
|---|---|---|---|---|---|---|---|---|
|
Slope (%) |
% Recharge |
Recharge (hm3) |
% of Precipitation Recharged to the System* |
||||
Zone I |
Alluvial and Colluvial Sediment from the valleys |
0 - 5 |
13.7 |
0.1 |
8.9** |
|||
5-15 |
12.8 |
0.38 |
||||||
>15 |
12 |
0.76 |
||||||
Zone II |
Dacitic Porphyry and Breccias |
0 -5 |
12.1 |
0.002 |
||||
5-15 |
11.3 |
0.02 |
||||||
>15 |
10.9 |
0.17 |
||||||
Zone III |
Poorly fractured igneous rock |
0-5 |
8.9 |
0.01 |
||||
5-15 |
6.8 |
0.09 |
||||||
>15 |
5.9 |
1.24 |
||||||
Zone IV |
Areas highly fractured |
Independent |
16.5 |
0.02 |
||||
Annual precipitation:243.6 mm/yr
**Equivalent to 21.7 mm/yr or 2.8 hm³/yr.
SURFACE RUNOFF
As with recharge, the surface runoff occurs mainly during snowmelt periods. In winter, between May and September, groundwater is an important water source for rivers and streams of the area. It contributes to streamflow during times of no precipitation, causing streams to be gained.
The hydrological model used historical data from the downstream monitoring point of the Rio de las Salinas River. The average flow recorded at this point is 0.639 m³/s, equivalent to 0.055 hm³/day.
The annual runoff is estimated to be 12.7 hm³/yr. It is restricted to 230 days/yr (September to May) when the hydrological system is active. The streams gain water from the inflows of the saturated groundwater aquifer through the streambed, and 2.8 hm3/yr from the annual runoff is supplied by groundwater. Hence, the estimated runoff 9.9 hm3/yr, represents 31.7% of the total water from annual precipitation.
EVAPOTRANSPIRATION
The real evapotranspiration (EVTr) has been estimated to be 144.6 mm/yr (59.3% of the annual precipitation).
The potential evapotranspiration (EVTp) was estimated using the Hargreaves methodology. It is an empirical relationship since both net radiation and vapor pressure deficit must be related to temperature. The EVTp for this project was estimated to be 1293.7 mm/yr.
The water balance responds to the following equation.

Where:
P = Precipitation
I = Infiltration (Recharge)
Es = Surface Runoff
EVTr = Real Evapotranspiration
Hydrogeological Characterization
BW conducted a dedicated hydrogeological drilling program to complement hydrogeological data and refine dewatering strategies. Detailed results from this study can be found in BW’s report “Ampliación del Estudio de Evaluacion del Recurso Hidrico Subterraneo, Etapa de Factibilidad” (BW, 2025)
Flow Directions
Hydraulic gradients were established from 193 boreholes drilled for hydrogeological, geotechnical, and geological purposes. Data was collected by BW from February to March 2024. Equipotential mapping (Figure 13.5) indicates that streams receive groundwater inflows (gaining rivers).

Figure 13.5: Equipotential Lines from the Rio Salinas Watershed. (BW 2025)
Field trials
Figure 13.6 shows the location of the piezometers and pumping wells. Field dewatering assessments included:
Fractured Aquifer Tests: three deep wells (DWT-1, DWT-2, DWT-3) individually and simultaneously pumped for 21 days.
Overburden Aquifer Tests: two pumping wells (DWT-OBV-1 and DWT-OBV-2) assessed upper aquifer conditions.
Hydraulic Stress Tests pumping the three wells simultaneously: evaluated interconnections between faults and hydrogeological units.
The first approach to understanding the data flow dynamic over the future open pit area was testing the fractured aquifer and the overburden through constant rate pumping tests.
In the fractured aquifer, the pump testing was carried out one by one in the three existing wells, and later, the three wells were pumped simultaneously for 21 days to grasp the hydraulic response of the area to greater stress.
Figure 13.6 shows the location of the piezometers and pumping wells.

Figure 13.6: Piezometers and Pumping Wells Locations (BW 2025)
Before the longer test with a constant flow rate, a step test was conducted on each well to determine the well efficiency and the ideal flow rate for the constant flow rate test.
The pumping well DWT-1 was located northeast of the future pit, on a main structure of the study area, called the Las Lagunas fault, with a northeast-southwest strike. It was drilled at a final depth of 520 m. The lithology encountered up to 300 m was a dacitic porphyry with intercalations of diorites.
The pumping test at DWT-1 was carried out over seven days; the recovery was recorded over 27 days; it stopped when the initial static level was reached.
The observation well, OBS-MW-1 was drilled to 519 m deep, 92 m from DWT-1, and both wells are located over the same fault zone. The lithologies and resistivity records confirmed the presence of the main fractured aquifer between 40 and 380 m deep.
The pumping well DWT-2 was located north of the future open pit, on a structural area delimited in the north by the La Lagunas and El Cairo faults, at the east by the La Ballena fault, at the south by the Lagartija fault, and at the west by the Piuguenes fault. It was drilled at a final depth of 400 m. The lithologies encountered at up to 30 m correspond to colluvial/glacial sediments with very poor selection, varying from silty sandstone to gravelly clay. That lithology overlies diorites intruded by dacites and rhyodacites up to 400m depth.
During drilling, the first water occurrence was encountered at 12.5 m deep.
The pumping test at DWT-2 was carried out over 11.25 days, and the recovery was recorded over 1.17 days. The aquifer did not reach the initial static level.
The observation well, OBS-MW2, was drilled to 401 m deep, 40 m north of DWT-2. Both are located in the center of the future pit, within a zone with a high density of interconnected fractures or main aquifer.
The pumping well DWT-3 was drilled 546 m deep at the southern boundary of the future open pit; the intercepted lithology at up to 160 m corresponds to rhyodacites with varying degrees of oxidation. This lithology overlies a dacitic porphyry with intercalations of diorites encountered to the final depth of the well.
The pumping test at DWT-3 was carried out over 3.6 days. The recovery was recorded over 1.5 days. The aquifer did not reach the initial static level.
The observation well OBS-MW3 was drilled to 542 m deep, 100 m north of DWT-3. Both wells are located over “La Ballena”. The zone with a higher density of fractures than the other zones was encountered between 333 and 348 m deep.
The pumping test parameters before and after the pumping test, at a constant discharge rate, and the hydraulic parameters estimated for the fractured aquifer are shown in Table 13.4.
Table 13.4: Pumping Parameters and Hydraulic Parameters Estimated for Each DWT Well | |||||||||
Hole ID |
Distance to the pumping well (m) |
Static Level (m) |
Flow Rate (m3/h) |
Pumping time (hr.) |
Maximum Drawdown (m) |
Transmissivity (m2/d) |
K (m/d) |
Storage Coefficient (-) |
Analysis Solution Method |
DWT-1 |
0 |
13.57 |
82 |
168 |
38.11 |
59,3 |
0.16 |
Theis Recovery/Logan |
|
OB-MW-1 |
92 |
6.6 |
- |
- |
1.67 |
137.5 |
0.375 |
6.70E-02 |
Cooper- Jacob/Theis |
DWT-2 |
0 |
14.49 |
80 |
270 |
42.46 |
61.6 |
0.17 |
Theis Recovery/Logan |
|
OB-MW-2 |
40 |
11.12 |
- |
- |
8.67 |
81 |
0.22 |
6.70E-02 |
Cooper- Jacob/Theis |
DWT-3 |
0 |
67.53 |
63 |
88 |
55.45 |
33 |
0.09 |
Theis Recovery/Logan |
|
OB-MW-3 |
110 |
64.51 |
- |
- |
0.12 |
- |
- |
- |
- |
Before, during and after the tests, the water level was recorded in all the future open pit area wells.
During the test at DWT1, the cone of depression showed a good hydraulic connection to the northeast as observed in OBS-MW1, probably due to the influence of the La Laguna fault. Toward the north and south, the hydraulic connection was observed in the well BH22-MRSF-14 and PAG3/PAF3 located at 990 and 330 m from the DWT-1, respectively. The wells toward the west along the El Cairo fault did not show water level changes during the test.
During the test in DWT-2, the depression cone showed a preferential elongation in the NW-SE direction, aligning with the existing main faults. It is observed that the drawdown affects mainly the wells located between the Cairo and La Lagartija faults, while outside that area, there were no variations in piezometric levels. The surface wetlands did not show water level changes during the tests, evidencing no vertical connections between the wetlands and the groundwater aquifer.
During the test in DWT-3, the maximum drawdown was at DWT-3; the observation well OBS-MW showed 0.12 m of drawdown. The rest of the wells in the area did not respond to the pumping. It was not possible to define some preferable direction of interconnection between faults.
The simultaneous pumping test was conducted during 21 days, from November 22 to December 13, 2024, with a constant discharge rate of 80 m3/hr for DWT-1 and DWT-2, and 60 m3/hr for DWT-3.
Figure 13.7 shows the curve drawdown versus time for each pumping well and its observation well.

Figure 13.7: Curves Time- Drawdown During the Simultaneous Pumping Test at DWT-1, DWT-2 and DWT-3 (BW 2025)
During the testing time, steady state was not reached in any of the pumping and observation wells, suggesting that the source of the extracted water was from the aquifer storage and that the surface recharge did not have a significant influence, evidencing the poor vertical connection between surface and groundwater.
The simultaneous pumping test evidenced high structural connection between faults in the area between La Vega and La Ballena faults in NNW-SSE direction, coinciding with the area of the future OP.
Additionally, the test demonstrated that the study area has an interconnected NE-SW faulting trend: in the zone around the La Laguna fault, all the wells reacted to the hydraulic stress (Figure 13.8).

Figure 13.8: Maximum Water Level Changes Recorded in the Wells During the Simultaneous Pumping Test at DWT-1, DWT-2 and DWT-3 (BW 2025)
Key Findings
High structural connection between faults between La Vega and La Ballena faults in NNW-SSE direction.
Poor vertical connection between surface and groundwater in the wetlands zone.
Additionally, two pumping tests were conducted on the overburden in January 2025: DWT-OVB-1 and DWT-OBV-2.
The summary of the test and hydraulic parameters are detailed in Table 13.5.
Table 13.5: Pumping Parameters and Hydraulic Parameters Estimated for Each Overburden Well | |||||||||
Hole ID |
Distance to the pumping well (m) |
Static Level (m) |
Flow Rate (m3/h) |
Pumping time (hr) |
Maximum Drawdown (m) |
Transmissivity (m2/d) |
K (m/d) |
Sy (%) |
Analysis Solution Method |
DWT-OVB-1 |
0 |
35.88 |
13.4 |
120 |
0.92 |
--- |
--- |
--- |
Theis Recovery |
DWT-OVB-1 |
0 |
35.88 |
13.4 |
120 |
0.92 |
--- |
--- |
--- |
Logan |
DWT-OBV-2 |
0 |
21.23 |
13 |
55 |
30.39 |
82.9 |
1.48 |
--- |
Theis Recovery |
DWT-OBV-2 |
0 |
21.23 |
13 |
55 |
30.39 |
12.5 |
0.22 |
--- |
Logan |
OBS-OVB-MW-2 |
15 |
15.09 |
--- |
--- |
1.71 |
59.2 |
1.06 |
8.7E-02 |
Newman |
Conceptual Model
The hydrogeological conceptual model incorporates the geology, hydrology, and hydraulic properties of the six identified hydrogeological units (HGUs), which are detailed in Table 13.6.
Table 13.6: Summary of the Hydrogeologic Units | ||||||||
|---|---|---|---|---|---|---|---|---|
HGU |
Age |
Lithology |
Aquifer Type |
Thickness (m) |
Hydraulic Properties |
|||
|
Transmissivity (m2/d) |
Hydraulic Conductivity (m/d) |
Effective Porosity (%) |
Storage Coefficient (-) |
|||||
|
Alluvial Fluvial sediments Unit |
Pleistocene/Holocene |
Well-sorted sands and gravels, scarce fine sediments |
Main granular aquifer |
1 a 14 |
518 |
37 |
20 |
- |
Colluvial, Glacial Sediments Unit |
Pleistocene/Holocene |
Poorly sorted blocks and gravels |
Main granular aquifer |
1 to 100 |
111.3 |
6.3 |
… |
0.13 |
Dacitic Porphyry, Breccia and Veins Unit |
Miocene-Pliocene |
Dikes with a porphyritic texture and |
Main fractured aquifer |
365 |
108 |
0.39 |
- |
0.012 |
Predominantly dacitic composition, with rhyodacite presenting - |
||||||||
Rhyolitic sectors. Hydrothermally altered. |
||||||||
Table 13.6: Summary of the Hydrogeologic Units | ||||||||
|---|---|---|---|---|---|---|---|---|
HGU |
Age |
Lithology |
Aquifer Type |
Thickness (m) |
Hydraulic Properties |
|||
|
Transmissivity (m2/d) |
Hydraulic Conductivity (m/d) |
Effective Porosity (%) |
Storage Coefficient (-) |
|||||
Crossed by hydrothermal breccias, quartz veins and stockworks. (mineralized unit.) |
||||||||
Miocene Bedrock Unit* |
Miocene-Pliocene |
Fine grain rocks with porphyritic texture, dioritic |
Aquitard or aquifuge depending on the zone |
open at depth |
- |
0.008 |
- |
1x10⁻⁵ |
Composition, with sectors of rhyo-dacitic, (silty clay matrix) |
||||||||
Faulting Zone Outside the Pit Unit* |
Triasic, (reactivated in the Cenozoic) |
Breccias |
Fractured aquifer |
2 to 8 |
- |
5 |
- |
0.02 |
Pre-Cenozoic |
Permo-Triásic |
Vulcanites (rhyolites and |
Aquitard or aquifuge, |
open at depth |
- |
0.008 |
- |
1x10⁻⁶ |
Table 13.6: Summary of the Hydrogeologic Units | ||||||||
|---|---|---|---|---|---|---|---|---|
HGU |
Age |
Lithology |
Aquifer Type |
Thickness (m) |
Hydraulic Properties |
|||
|
Transmissivity (m2/d) |
Hydraulic Conductivity (m/d) |
Effective Porosity (%) |
Storage Coefficient (-) |
|||||
Igneous Rocks Unit* |
Andesites). Plutonites (granites, granodiorites and tonalites), crossed by younger basaltic-andesitic dikes. |
depending on the zone |
||||||
*Hydraulic parameters from bibliography (Custodio-Llamas, Hidrología subterránea, Edit. Omega, 1983)
Figure 13.9 Illustrates the Hydrological Conceptual Model at pre-mining conditions.

Figure 13.9: Schematic Conceptual Model for the Natural Hydrological System in the Zone of the Future Open Pit Area (Cross-Sectional View) (BW 2025)
Pit Dewatering Numerical Model
The dewatering system, mine water supply, and operational planning for the Los Azules Project were modelled using FeFlow V8.0. A finite element mesh was used to represent the conceptual model and its interaction with the geometry of all pit stages from 2027 to 2054.
To simulate the expected groundwater inflows and their management, mesh node locations were adjusted to align with the mine plan, with refinements in key mining and hydrogeological areas.
The model domain encompasses hydrogeologically significant areas and their potential zones of influence, based on open-pit progression. It includes the Río de las Salinas, La Embarrada, Frío, and Verde rivers and their main tributaries.
Figure 13.10 shows a 3D view of the model domain.

Figure 13.10. Hydrogeological Numerical Model Domain (BW 2025)
Boundary Conditions
The following boundary conditions were applied to the model domain:
No flow boundary: assigned to the watershed limits, which are considered impervious boundaries.
Dirichlet (first type) Boundary:
Seepage face: assigned to nodes in the northwest and southeast of the model domain, where groundwater exits the system, draining into adjacent sub-basins or discharging into surface runoff.
Fixed hydraulic head: applied nodes based on observed piezometric levels.
Groundwater Simulations
Steady–State Calibration
The groundwater flow model was calibrated to pre-pumping conditions (steady state) using 37 observation points, with 18 located within the planned Pit area.
Figure 13.11 shows simulated versus observed hydraulic heads following steady-state calibration.


Figure 13.11: Hydraulic Heads Observed Versus Simulated After the Steady-State Calibration (BW 2025)
Transient Simulations
Transient simulations were conducted to evaluate the dewatering strategy required to maintain dry conditions within the pit as mining progresses. The objective was to lower the water level to at least 10 m below the pit bottom.
Model results indicate that a total of 12 dewatering wells will be required to achieve target water levels throughout the life of the mine (LOM).
Table 13.7 summarizes the simulated dewatering wells, including total depth, pumping rates and operational timelines.
Table 13.7: Summary of the Simulated Dewatering Wells | |||||
|---|---|---|---|---|---|
|
Simulated DWT Well |
TD Total Depth (m) |
Pumping Start Year |
Pumping End Year |
Pumping Rate (L/s) |
|
P1 |
293 |
1 |
7 |
20 |
|
P2 |
490 |
1 |
7 |
20 |
|
P3 |
445 |
1 |
7 |
15 |
|
P5 |
598 |
1 |
28 |
20 |
|
Table 13.7: Summary of the Simulated Dewatering Wells | |||||
|---|---|---|---|---|---|
|
Simulated DWT Well |
TD Total Depth (m) |
Pumping Start Year |
Pumping End Year |
Pumping Rate (L/s) |
|
P6 |
400 |
1 |
7 |
15 |
|
P8 |
110 |
1 |
7 |
25 |
|
P9 |
250 |
1 |
7 |
15 |
|
P13 |
550 |
1 |
28 |
15 |
|
P15 |
600 |
6 |
28 |
20 |
|
P16 |
600 |
6 |
28 |
10 |
|
P17 |
600 |
6 |
28 |
20 |
|
P18 |
600 |
6 |
28 |
20 |
|
Simulated Dewatering Pumping Rates
Due to the limited recharge in the pit area, the yearly dewatering rates estimated required begin at 142 L/s and gradually decline to 75 L/s.
The pumping strategy facilitates controlled water table drawdown, mitigating the risk of groundwater inflows interfering with mining activities.
mine design
Pit Design
The Los Azules Project is designed as a conventional truck-shovel operation assuming 360 tonne trucks and electric shovels. The pit design includes twelve phases, starting from the central portion of the deposit and then alternating between the south and north portions. By alternating from north to south, the process feed is ensured, the initial stripping requirements are minimized, and the stripping and equipment requirements are balanced. Waste is hauled to the Mine Rock Storage Facility (MRSF).
The design parameters include a ramp width of 40 m, maximum road grades of 10%, bench height of 15 m, targeted mining width of 110 m, berm interval of 15 m, variable slope angles by sector, and a minimum mining width of 40m.
The smoothed final pit design contains approximately 1,037.6 mt of ore and 1,668.9 mt of waste. The limited quantity of low-grade material encountered during the first five years of production will not be processed, deferring the need for development of a stockpile facility until significant tonnages need to be stockpiled. The material included in the production schedule will be 1,023.1 mt of ore and 1,684.0 mt of waste for a resulting stripping ratio of 1.65:1 (waste:ore). Within the 1,023.1 mt of ore, the average metal grades are 0.453% Cu and 0.312% Cu soluble. Figure 13.12 shows the ultimate pit design. Figure 13.13 shows interim phases layout. The interim phases in sectional view are shown from Figure 13.14 to Figure 13.16.
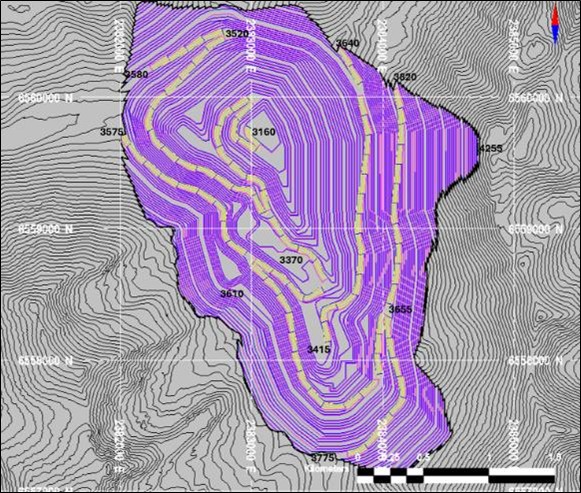
Figure 13.12: Ultimate Pit Design (AGP 2025)

Figure 13.13: Interim Phases Layout (AGP 2025)

Figure 13.14: Interim Phases – Section 1 (AGP 2025)

Figure 13.15: Interim Phases – Section 2 (AGP 2025)

Figure 13.16: Interim Phases – Section 3 (AGP 2025)
Stockpile Design
Two stockpiles will be required to store low-grade ore and primary material. Both stockpiles will be used after year 5. Before year 5, low-grade ore and primary material will be sent to the MRSF. Primary material will not be processed, and it will be stored for potential future use.
The stockpiles are designed using a 2H:1V inter-ramp angle of approximately 26.6⁰, a 35⁰ bench face angle, and 40 m ramps.
The low-grade stockpile will reach a maximum capacity of 24 mt in year 17, and it will be depleted in year 21. The low-grade stockpile design and balance are shown in Figure 13.17 and Figure 13.18, respectively.
The primary stockpile will reach a maximum capacity of approximately 179 mt at the end of the LOM. The primary stockpile design is shown in Figure 13.19.

Figure 13.17: Low-Grade Stockpile Design (AGP 2025)
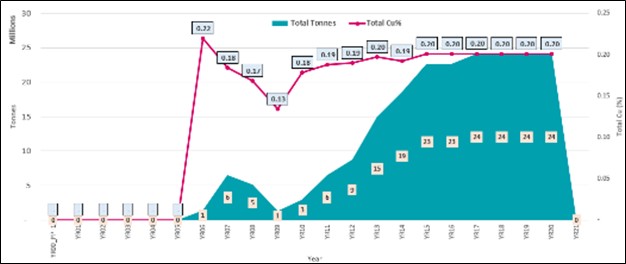
Figure 13.18: Low-Grade Stockpile Balance (AGP 2025)

Figure 13.19: Primary Stockpile Design (AGP 2025)
Mine Rock Storage Facility Design
The design and construction of the mine rock storage facilities (MRSF) should ensure physical and chemical stability during and after mining activities. To achieve this, the waste areas are designed to account for benching, drainage and geotechnical stability.
Two MRSFs be used during the LOM: the Northeast MRSF (NEMRSF) and the South MRSF (SMRSF).
The NEMRSF design criteria include 35 m berms every two lifts, 2.6H:1V inter-ramp slopes, and 15 m lifts. For the SMRSF, it was assumed that it could store mostly overburden and, as a result, a lift face angle of 30⁰ and 19-m berms every 15 m were used. A 30% swell factor for estimating volumes was used for both MRSFs. The overburden mined represents approximately 18% of the total waste and most of it is considered to be encapsulated within the NEMRSF waste rock and segregated as much as possible in the SMRSF. The top 20 mt of overburden are required to be segregated within the SMRSF to be used during closure. The NEMRSF and SMRSF designs are shown in Figure 13.20 and Figure 13.21, respectively.

Figure 13.20: Northeast Mine Rock Storage Facility Design (AGP 2025)

Figure 13.21: South Mine Rock Storage Facility Design (AGP 2025)
The locations of stockpiles and MRSFs in relation to the final pit are shown in Figure 13.22.

Figure 13.22: MRSF and Stockpile Location (AGP 2025)
Production Schedule
The detailed production schedule was developed quarterly up to year 5 and annually thereafter. The mining rate targets the crushing of a maximum 50 mtpa. There is an initial ramp-up period to allow the process plant to come online. Contained copper mined peaks at 256 kt in Year 3, then decreases to 205 kt on average for the next 3 years. Ore totaling 12.5 mt is placed in the leach pad during year -1 of preproduction, so leached solution will be available when the SE/EW plant starts operations in year 1.
Oxide and enriched material are sent to the crusher or to a stockpile to be processed later in the mine schedule. The material is crushed and then conveyed and stacked on the Heap Leach Facility. Ore totaling 993.3 mt is sent directly to the crusher, while 29.8 mt of ore is sent to the low-grade stockpile and later reclaimed.
The maximum stockpile capacity of 24 mt is reached in year 17. The low-grade stockpile is depleted beginning in year 21 at the end of the LOM.
A total of 178.9 mt of primary sulfide material is stored in a separate stockpile to the north of the Los Azules pit and is not processed in the Feasibility nor considered as Mineral Reserves.
The total LOM heap leach production will be 1.023 billion tonnes grading 0.453% copper and 0.312% soluble copper, representing 3,452 kt of copper cathode produced. The overall mine waste will be 1.684 billion tonnes, resulting in an overall mine strip ratio of 1.65:1 (waste : ore). The waste is made up of 277.3 mt of overburden and 1,227.8 mt of rock. The total material mined is 2.7 billion tonnes. Table 13.8 and Figure 13.23 summarize the production schedule in annual periods. Selected end-of-period maps are shown from Error! Reference source not found. to Error! Reference source not found.
Table 13.8: Summary Production Schedule | ||||||||||||
Period |
Tonnage (kt) |
Total Feed Grades |
Contained |
Mine to |
Waste |
Total Mined |
||||||
To Leach Pad |
Cu |
Cu Soluble |
Copper |
Stockpile |
Primary |
Overburden |
Rock |
Total |
||||
Direct |
Stockpile |
Total |
% |
% |
kt |
Kt |
kt |
kt |
kt |
kt |
kt |
|
PP-2 |
- |
- |
- |
- |
- |
- |
- |
- |
18,760 |
8,240 |
27,000 |
27,000 |
PP-1 |
12,500 |
- |
12,500 |
0.832 |
0.714 |
87 |
- |
- |
43,628 |
41,872 |
85,500 |
98,000 |
Year 1 |
25,000 |
- |
25,000 |
0.848 |
0.728 |
178 |
- |
- |
30,657 |
72,608 |
103,265 |
128,265 |
Year 2 |
37,500 |
- |
37,500 |
0.777 |
0.619 |
235 |
- |
- |
32,872 |
59,628 |
92,500 |
130,000 |
Year 3 |
50,000 |
- |
50,000 |
0.619 |
0.501 |
256 |
- |
- |
26,987 |
53,013 |
80,000 |
130,000 |
Year 4 |
50,000 |
- |
50,000 |
0.554 |
0.374 |
205 |
- |
- |
32,424 |
47,576 |
80,000 |
130,000 |
Year 5 |
50,000 |
- |
50,000 |
0.490 |
0.390 |
203 |
- |
- |
10,458 |
69,542 |
80,000 |
130,000 |
Year 6 |
50,000 |
- |
50,000 |
0.521 |
0.390 |
206 |
1,352 |
1,532 |
23,033 |
64,083 |
88,648 |
140,000 |
Year 7 |
50,000 |
- |
50,000 |
0.380 |
0.293 |
156 |
5,133 |
3,637 |
11,533 |
89,697 |
104,867 |
160,000 |
Year 8 |
48,314 |
1,686 |
50,000 |
0.490 |
0.350 |
187 |
260 |
1,771 |
5,145 |
117,824 |
124,740 |
173,314 |
Year 9 |
45,954 |
4,046 |
50,000 |
0.467 |
0.377 |
195 |
233 |
714 |
13,281 |
110,772 |
124,767 |
170,954 |
Year 10 |
50,000 |
- |
50,000 |
0.482 |
0.328 |
181 |
1,682 |
11,934 |
13,977 |
97,407 |
123,318 |
175,000 |
Year 11 |
50,000 |
- |
50,000 |
0.442 |
0.298 |
165 |
3,551 |
11,887 |
3,843 |
105,719 |
121,449 |
175,000 |
Year 12 |
50,000 |
- |
50,000 |
0.314 |
0.207 |
117 |
2,249 |
23,161 |
7,418 |
92,172 |
122,751 |
175,000 |
Year 13 |
50,000 |
- |
50,000 |
0.324 |
0.223 |
124 |
6,159 |
21,426 |
3,305 |
84,508 |
109,239 |
165,398 |
Year 14 |
50,000 |
- |
50,000 |
0.292 |
0.191 |
107 |
3,618 |
35,896 |
- |
55,487 |
91,382 |
145,000 |
Year 15 |
50,000 |
- |
50,000 |
0.400 |
0.243 |
137 |
4,143 |
22,748 |
- |
29,764 |
52,512 |
106,655 |
Year 16 |
50,000 |
- |
50,000 |
0.254 |
0.181 |
98 |
- |
11,309 |
- |
17,317 |
28,626 |
78,626 |
Year 17 |
50,000 |
- |
50,000 |
0.379 |
0.261 |
145 |
1,409 |
9,100 |
- |
7,935 |
17,035 |
68,444 |
Year 18 |
49,980 |
20 |
50,000 |
0.447 |
0.256 |
150 |
- |
8,791 |
- |
1,288 |
10,079 |
60,058 |
Year 19 |
50,000 |
- |
50,000 |
0.456 |
0.212 |
128 |
- |
8,515 |
- |
447 |
8,962 |
58,962 |
Year 20 |
50,000 |
- |
50,000 |
0.442 |
0.193 |
118 |
- |
3,389 |
- |
282 |
3,671 |
53,671 |
Year 21 |
24,018 |
24,034 |
48,052 |
0.314 |
0.123 |
73 |
- |
3,073 |
- |
602 |
3,674 |
27,692 |
Total |
993,265 |
29,787 |
1,023,052 |
0.453 |
0.312 |
3,452 |
29,787 |
178,883 |
277,322 |
1,227,782 |
1,683,987 |
2,707,039 |

Figure 13.23: Annual Production Schedule (AGP 2025)
Waste Material Handling
Waste will be hauled to the MRSFs using 360 tonne trucks. The construction sequence starts at the bottom of the dumps by dumping the material in 15 m lifts, leaving a 35 m berm every two lifts. The resulting overall slope angle of the dump face will be 2.6H:1V.
To facilitate the construction of water management facilities, as well as to balance haul distances in the first years of operations, the NEMRSF will be built in two stages. Stage 1 has a capacity of 195.8 M m3, while the total designed capacity is 1,028 M m3.
The SMRSF will start operations in year 6 while the southern phases close to it will be mined. This approach also facilitates the deferral of water management infrastructure development.
mine operations
Los Azules mine operations are based on operating a fleet of autonomous haul trucks and drills, and manned loading and support equipment. The mine is scheduled to operate 24 hours a day, seven days a week, utilizing four rotating crews working twelve-hour shifts. The crews rotate on a 2-week on, 2-week off schedule. During the day, there are two 12-hour shifts scheduled, consisting of a day shift and a night shift. During the year, approximately 10 days are lost due to inclement weather conditions including high winds.
Except for blasting, mine operations are self-performed, including mine maintenance. Blasting is contracted to a third party who is responsible for explosive supply, a down-the-hole explosive service, and blast initiation and monitoring. LA is responsible for shot design.
Blasting
Drilling and blasting designs are based on J. Floyd’s “Drilling and Blasting Feasibility Study” dated September 2024.
Blast pattern designs for waste below the first 15 meters of depth and ore are shown in Table 13.9 and Table 13.10.
Table 13.9: Waste Blast Designs (Blast Dynamics, 2024) | |||||
|
Overburden |
Weak |
Medium |
Strong |
|
Blasthole Length (m) |
15.0 |
15.0 |
15.8 |
16.4 |
|
Burden x Spacing (m) |
7.7 x 8.8 |
7.0 x 8.0 |
7.0 x 8.0 |
6.5 x 7.5 |
|
Powder Factor kg/t |
0.16 |
0.19 |
0.21 |
0.28 |
|
Estimated P80 (mm) |
|
131 |
192 |
222 |
|
Table 13.10: Ore Blast Designs (Blast Dynamics, 2024) | ||||
|
Weak |
Medium |
Cemented |
|
Blasthole Length (m) |
15.0 |
15.8 |
16.4 |
|
Burden x Spacing (m) |
7.6 x 8.7 |
7.1 x 8.2 |
6.6 x 7.6 |
|
Powder Factor kg/t |
0.23 |
0.30 |
0.28 |
|
Estimated P80 (mm) |
136 |
178 |
205 |
|
Key inputs and assumptions for the blast designs follow:
The overburden material requires light blasting
Due to the weak nature of the rock mass, pre-split is not required
Drill cuttings will be suitable for stemming the holes
All holes are assumed wet, and an emulsion is required
Each hole is double primed with one electronic detonator and one pyrotechnic detonator per Argentina requirements
To estimate explosive requirements, the modeled uniaxial compressive strength (UCS) was used to group material within seven blast groups:
Weak Waste with UCS less than 40 MPa
Medium Waste with UCS between 40 MPa and 80 MPa
Overburden
Weak Ore with UCS less than 40 MPa
Medium Ore with UCS between 40 MPa and 80 MPa
Strong Ore with UCS above 80 MPa
In addition to ore and waste designs, wall control designs were developed for weak, medium-strength, and relatively strong rock. Modified production blast designs are recommended for weak rock to minimize blast-induced reduction of in-situ rock mass integrity.
This modified blast design controls damage by simply offsetting the production blast away from the designed slope. Initially, it is recommended that a standard production blast be over-dug to define the blast disturbance zone and required offset from the slope.
Based on the rock mass data reviewed, it is assumed that a large percentage of the interim and final walls will be suitable for modified production blast designs.
It should be stressed that the zone between the production blast and undamaged rock mass will be more difficult to dig and reduced shovel productivity should be expected along the designed limits.
As the rock becomes stronger and more massive, it is recommended that conventional four-row trim blast designs be used.
Drilling
The FS drilling assumptions are based on operating electric autonomous drills with 270 mm bit diameters.
The autonomous operations include 110 minutes per day of operating standby time for shift change, blast delays, and fueling. Because the drills are semi-autonomous, 30 minutes per day (15 minutes per shift change) are required for the remote operators to shift change. The 40 minutes per day for blast delays assumes 2 hours of standby per blast and 5 blasts per week. The 2 hours accounts for drills walking off and then back on the drill patterns to clear the blast zones. Fueling is required once a day (40 minutes). The 40 minutes of fueling time accounts for the drills walking off the patterns to fuel. The drills take on water while they are fueled.
Due to winter operations, 36.5 minutes per day, which equates to 10 days per year, are scheduled for weather delays. Utilization for the semi-autonomous drills is based on 45 minutes of working time for every hour of operation (75%). Drills incur lower utilization due to time spent moving drills between patterns and drill pattern availability. Table 13.14 shows the semi-autonomous drill operating hours.
Mechanical availability for the drills is based on a 2024 internal study estimate of 81.7%. After adjusting the availability for supplier-excluded items, the average availability is 79.7%.
Based on the average uniaxial compressive strength (UCS) for Los Azules’ rock of 41.3 MPa, the estimated average instantaneous penetration rate for overburden, weak rock, and medium rock is 65 meters per hour.
To estimate the average penetration rate, 4 minutes of fixed time per hole are applied, which is made up of 2.25 minutes for hole-to-hole tram time and 0.75 minutes for sampling. The resulting average penetration rate is 40 meters per hour.
A redrill factor of 5% is applied to all drilled meters to account for redrilling of collapsed or damaged holes. Pre-split drilling is not required. Instead, the Epiroc FlexiROC D65 is used for pioneering work. One drill is required to support pioneering work over the LOM. Table 13.19 shows the number of production drills required.
Loading
A combination of electric hydraulic shovels and large loaders were selected to support the feasibility study. Electric hydraulic shovels were selected over cable shovels due to their substantially lower capital cost and enhanced operational versatility, particularly in variable digging conditions and maneuverability within confined pit geometries. To achieve the required 175 mtpa mining rate, the mix of loading units shown in Table 13.11 were selected.
Table 13.11: Loading Equipment | ||||
|---|---|---|---|---|
Loading Unit |
No. |
Production/Unit Estimated Mt/a |
Production/unit Planned Mt/a |
Total Fleet Production Planned Mt/a |
PC8000 Electric |
6 |
30.1 |
25 |
150 |
L 2350 |
2 |
16.7 |
12.5 |
25 |
Total |
175 |
|||
Loading units were derated from planning to allow flexibility in the mine plan and to ensure that the operation does not operate with limited shovels.
Operating Hours
Relief operators are used for the hydraulic shovels; consequently, the shovels are manned and operated during lunch and breaks. Conversely, the L2350 loaders do not utilize a relief operator and are on standby during lunch and breaks.
Utilization of productive time is estimated at 83% for all loading units. Truck availability to shovel availability, also referred to as shovel wait time, is assumed to be 77% for the shovels and 75% for the L2350 loaders. Shovel wait time is part of queuing theory that accounts for the random arrival of trucks to the shovel, because of bunching that occurs following shift change, blasting, breaks, and other shift disruptions. Table 13.14 shows the operating hours for the shovels.
Table 13.12 shows the productivity for a PC8000 E shovel loading a Komatsu 980E haul truck based on an average rock density of 2.55 and a swell factor of 1.4. The PC8000 E shovel can load a Komatsu 980E truck in 3 minutes with 5 passes, assuming 35 seconds per shovel pass. Shovel productivities are shown for the Net Operating Hours (NOH) and Gross Operating Hours (GOH) both with and without containing moisture.
Table 13.12: PC8000 E Productivity Estimate | ||
|---|---|---|
Item |
Units |
Value |
Loader |
PC8000E |
|
Truck |
Komatsu 980E |
|
Bucket Capacity |
m3 |
42 |
Bucket Capacity |
tonne |
75.6 |
Truck Capacity |
m3 |
220 |
Truck Capacity |
tonne |
360 |
In Situ Bulk Density |
t/m3 |
2.55 |
Bulk Factor |
1.4 |
|
Loose Density |
t/m3 |
1.82 |
Moisture & Carry Back |
% |
3.00% |
Fill Factor |
0.91 |
|
Effective Bucket Capacity |
m3 |
38.34 |
Wet/Loose Density |
t/m3 |
1.88 |
Tonnes/Pass |
tonne |
72.00 |
Theoretical Passes (Volume) |
5.74 |
|
Theoretical Passes (Weight) |
5.00 |
|
Actual Passes |
5 |
|
Table 13.12: PC8000 E Productivity Estimate | ||
|---|---|---|
Item |
Units |
Value |
Truck Load |
m3 |
191.7 |
Truck Load |
tonne |
360.0 |
Truck Fill % (Volume) |
87% |
|
Truck Fill % (Weight) |
100% |
|
Loader Cycle Time |
seconds |
35 |
Loader Spot Time |
seconds |
40 |
Load Time per Truck |
seconds |
180 |
Maximum Truck Loads per hour |
20 |
|
Maximum Productivity |
(wet t/adj. NOH) |
7,200 |
Maximum Productivity |
(wet t/NOH) |
5,544 |
Maximum Productivity |
(wet t/GOH) |
4,618 |
Maximum Productivity |
(dry t/GOH) |
4,480 |
Maximum Productivity |
(wt/yr) |
31,032,305 |
Maximum Productivity |
(wt/day) |
85,020 |
Maximum Productivity |
(dt/yr) |
30,101,336 |
Maximum Productivity |
(dt/day) |
82,469 |
Similar operating hours and productivity estimates for a L2350 front-end loader were carried out. The L2350 FEL can 6-pass load a Komatsu 980E truck in 4.8 minutes assuming 50 seconds per FEL pass.
Table 13.19 shows the number of loading units by period.
Hauling
The Komatsu 980E-5 truck operated autonomously was selected for the feasibility study. Additionally, Komatsu has advanced the timeline for battery development for the 360 tonne trucks, making the larger trucks a better choice given the expectation to convert the vehicles to battery power at engine replacement.
Supplier literature was referenced for each truck’s empty vehicle weight (EVW) and gross vehicle weight (GVW). The difference between the GVW and EVW is the payload before accounting for material moisture. After accounting for 3% moisture, the payload, in dry metric tonnes, is estimated according to Table 13.13. The Komatsu truck 980E-5 truck is fitted with Komatsu’s DTSA light weight body which allows it to achieve additional capacity over a standard truck.
Table 13.13: Truck Payload | ||
Item |
Units |
Komatsu 980E-5 |
Empty Vehicle Weight |
t |
265.1 |
Gross Vehicle Weight |
t |
641.0 |
Payload |
t |
380.0 |
less liner package |
t |
0.0 |
Less 3% moisture |
t |
11.4 |
Net Payload for Planning |
t |
368.6 |
Payload for Mine Planning |
369 |
|
Estimated truck hours for a Komatsu 980E-5 truck are shown in Table 13.14. Mechanical availability is shown at 88% but varies over the truck’s lifecycle in 6,000-hour increments for productivity calculations. Due to winter operations, 10 down days are assumed which equates to 240 hours of annual weather downtime per year. Because the trucks operate autonomously, utilization of operating time is estimated at 90% and the trucks are only required to break for 30 minutes per day to fuel and 40 minutes per day to account for blasting.
Table 13.14: Equipment Hours | |||
|---|---|---|---|
Epiroc |
Komatsu |
Komatsu |
|
Item |
PV 271 Electric Drill |
PC8000E Shovel |
980E-5 Truck |
Calendar Time | |||
Days |
365 |
365 |
365 |
Shifts per day |
2 |
2 |
2 |
Shift Length |
12 |
12 |
12 |
Calendar Time (hrs/year) |
8,760 |
8,760 |
8,760 |
Table 13.14: Equipment Hours | |||
|---|---|---|---|
Epiroc |
Komatsu |
Komatsu |
|
Available Time | |||
Availability |
79.70% |
85.6% |
89.70% |
Down Time (hrs/yr) |
1,778 |
1,261 |
902 |
Available Time (hrs/yr) |
6,982 |
7,499 |
7,858 |
Gross Operating Time | |||
Operating Standby – Internal (min/day) | |||
Autonomous Stand By |
- |
- |
13 |
Shift Change |
30 |
30 |
- |
Blast Delay |
40 |
40 |
40 |
Fueling |
40 |
30 |
30 |
Weather |
36.5 |
40 |
40 |
Operating Standby (hrs/yr) |
707 |
779 |
668 |
Gross Operating Hours (hrs/yr) |
6,275 |
6,720 |
7,190 |
Net Operating Time | |||
Utilization |
75% |
83% |
90% |
Operating Delay (hrs/yr) |
1,569 |
1,122 |
719 |
Net Operating Hours (hrs/yr) |
4,706 |
5,597 |
6,471 |
Net Operating Time | |||
Truck availability to shovel |
- |
77% |
- |
Shovel Wait for Truck |
- |
1,287 |
- |
Net Operating Hours (hrs/yr) |
- |
4,310 |
- |
The supplier performance curves were utilized to develop speeds for grades between -10% and +10% in 1% increments. To limit the truck’s average speed and to account for interference, traffic control, acceleration, and deceleration, top speeds were applied to hauls according to Table 13.15.
Table 13.15: Top Truck Speeds | ||
Gradient |
Loaded (kph) |
Empty (kph) |
Flat |
45 |
45 |
-10% |
20 |
30 |
Average speeds by segment for the Komatsu 980E-5 truck are shown in Table 13.16. A 2% rolling resistance was assumed in estimating truck speeds.
Table 13.16: Average 980E-5 Truck Speed | ||
|---|---|---|
Speeds (kph, adjusted) | ||
Gradient |
Loaded |
Unloaded |
-10 |
20.0 |
30.0 |
Flat |
45.0 |
45.0 |
+10 |
11.0 |
25.0 |
An average fuel burn rate of 238 liters per hour was used to estimate diesel consumption. This rate includes a 4% reduction for autonomous haulage systems.
Truck fixed times by loading unit are shown in Table 13.17.
Table 13.17: Fixed Times | ||
Item |
Fixed Times |
|
|
PC 8000E Time (min) |
L2350 Time (min) |
|
Dump |
1.5 |
1.5 |
Queue at Dump/Crusher |
0.5 |
0.5 |
Load |
3.0 |
4.8 |
Total Fixed Time |
5.0 |
6.8 |
Mechanical availability was provided by the equipment suppliers in 6,000-hour increments. Table 13.18 shows the availability applied for the truck estimates which is based on the supplier estimates adjusted downward by 3% to account for items excluded by the equipment suppliers.
Based on the supplier estimates, the autonomous trucks achieve 2.5% better mechanical availability than an equivalent manned truck (Table 13.18).
Table 13.18: Mechanical Availability | |
Year |
Mechanical Availability |
PP 1 |
90.5% |
Yr1 |
90.5% |
Yr2 |
89.5% |
Yr3 |
89.5% |
Yr4 |
88.5% |
Yr5 |
88.5% |
Yr6 + |
87.5% |
Hexagon MinePlan Schedule Optimizer (MPSO) was used to estimate the number of trucks required by period by setting up a haulage network within the software for all material sources and destinations. The outcome of the truck estimate is shown in Table 16.19.
Support Equipment
Support equipment includes track dozers, rubber-tired dozers (RTDs), front-end loaders (FELs), graders, water trucks, haul trucks, and excavators. The major tasks for the support equipment include:
Bench and road maintenance
Shovel support/clean-up
Blasting support/clean-up
MRSF maintenance
Stockpile construction/maintenance
Road building/maintenance
Pioneering and clearing work
A description of each support equipment type follows:
Large Track Dozer - 634 kW (Komatsu 475) – Two machines are estimated to be required primarily for MRSF and stockpile operations support. The large dozer is also ideally suited for concurrent reclamation activities later in the mine life.
Medium Track Dozer - 443 kW (Komatsu 375) – The number of dozers are estimated at 0.5 dozers per production blast hole drill and production shovel. The Komatsu 375 dozer fleet peaks at 6 machines starting in year 6. Their primary functions are to maintain pit floors, maintain dumps and stockpiles, build pit roads, and clean final pit walls.
Rubber-tired Dozer - 374 kW (Komatsu WD 900) requirements are estimated at approximately 0.5 RTD per shovel. Their primary function is to maintain shovel floors, provide drill pattern clean-up, clear rock spillage, and provide backup dump and stockpile maintenance. At peak, three WD 900s support six primary shovels and associated mining areas.
Motor Graders - 318 kW (Komatsu GD955-7) are estimated at approximately one grader per 7 trucks. Their primary function is to maintain roads, trolley ramps, dump areas, and pit areas. At peak, there are seven Komatsu GD955-7 graders that support a peak fleet of 40 Komatsu 980E-5 haul trucks. Grader numbers are relatively high due to extra grader effort required to support autonomous truck operations.
Water Trucks - 75,000 L (Komatsu 785) are estimated to be based on providing water to the drills and providing dust control for the shovel loading areas, dumping areas, and haul roads. During the winter season, from June to August, water trucks are lightly scheduled. They are primarily used for watering the drills and for fire patrol; nonetheless, even during the winter season roads become dusty. During December to February, when dust suppression requirements are at their highest, the water trucks are fully scheduled. At peak, the mine operates five water trucks.
Excavator - 120 tonne (Komatsu PC2000) – Two Komatsu PC2000 excavators are scheduled throughout the LOM. Its primary functions are to maintain haul roads, scale the pit walls as needed, pull shovel berms, excavate dewatering sumps, and provide backup to the Komatsu WA900-8 loader. Both these loading units can load the small 100 t haul trucks (Komatsu HD785-7).
Drill and Dozer Transporter – Due to limited mobility, the 74-tonne medium track dozers are transported between working areas using a 136-tonne capacity low-bed transport. The transport is also used to transport the 84-tonne PV271 drills and 115-tonne large track dozers.
Annual support equipment requirements are shown in Table 13.19. Table 13.20 outlines the mine personnel requirements during the preproduction phase and in Year 5 of operations.
Table 13.19: Equipment Numbers | |||||||||||||
Year |
PV 271 Electric Drill |
FlexiRoc D65 Drill |
PC8000E Shovel |
L2350 Loader |
980E-5 Truck |
475 Dozer |
375 Dozer |
WD900 RTD |
955-7R Grader |
785 Water Truck |
PC2000 Excavator |
WA900-8 Loader |
HD785-7 Truck |
PP-2 |
1 |
1 |
2 |
2 |
16 |
2 |
3 |
1 |
4 |
3 |
2 |
1 |
6 |
PP-1 |
3 |
1 |
4 |
2 |
20 |
2 |
5 |
2 |
5 |
3 |
2 |
2 |
6 |
Yr 1 |
4 |
1 |
4 |
2 |
22 |
2 |
5 |
2 |
5 |
3 |
2 |
2 |
6 |
Yr 2 |
4 |
1 |
4 |
2 |
25 |
2 |
5 |
2 |
6 |
4 |
2 |
2 |
6 |
Yr 3 |
4 |
1 |
4 |
2 |
30 |
2 |
5 |
2 |
6 |
4 |
2 |
2 |
6 |
Yr 4 |
4 |
1 |
4 |
2 |
32 |
2 |
5 |
2 |
7 |
4 |
2 |
2 |
6 |
Yr 5 |
4 |
1 |
4 |
2 |
32 |
2 |
5 |
2 |
7 |
4 |
2 |
2 |
6 |
Yr 6 |
4 |
1 |
5 |
2 |
36 |
2 |
6 |
3 |
7 |
5 |
2 |
2 |
6 |
Yr 7 |
5 |
1 |
6 |
2 |
37 |
2 |
6 |
3 |
7 |
5 |
2 |
2 |
6 |
Yr 8 |
5 |
1 |
6 |
2 |
38 |
2 |
6 |
3 |
7 |
5 |
2 |
2 |
6 |
Yr 9 |
5 |
1 |
6 |
2 |
38 |
2 |
6 |
3 |
7 |
5 |
2 |
2 |
6 |
Yr 10 |
5 |
1 |
6 |
2 |
40 |
2 |
6 |
3 |
7 |
5 |
2 |
2 |
6 |
Yr 11 |
5 |
1 |
6 |
2 |
36 |
2 |
6 |
3 |
7 |
5 |
2 |
2 |
6 |
Yr 12 |
5 |
1 |
6 |
2 |
33 |
2 |
6 |
3 |
7 |
4 |
2 |
2 |
6 |
Yr 13 |
5 |
1 |
6 |
2 |
33 |
2 |
6 |
3 |
7 |
4 |
2 |
2 |
6 |
Yr 14 |
5 |
1 |
5 |
2 |
33 |
2 |
6 |
3 |
7 |
4 |
2 |
2 |
6 |
Yr 15 |
3 |
1 |
4 |
2 |
27 |
2 |
5 |
2 |
6 |
4 |
2 |
2 |
6 |
Yr 16 |
3 |
1 |
3 |
1 |
18 |
2 |
4 |
2 |
4 |
3 |
2 |
2 |
6 |
Yr 17 |
2 |
1 |
2 |
2 |
19 |
2 |
4 |
1 |
5 |
3 |
2 |
2 |
6 |
Yr 18 |
2 |
1 |
2 |
2 |
18 |
2 |
3 |
1 |
4 |
3 |
2 |
2 |
6 |
Yr 19 |
2 |
1 |
2 |
2 |
16 |
2 |
3 |
1 |
4 |
3 |
2 |
2 |
6 |
Yr 20 |
2 |
1 |
2 |
2 |
15 |
2 |
3 |
1 |
4 |
3 |
2 |
2 |
6 |
Yr 21 |
1 |
1 |
2 |
2 |
13 |
2 |
3 |
1 |
4 |
2 |
2 |
2 |
6 |
Table 13.20: Mine Personnel | |||
Description |
Year -2 |
Year -1 |
Year 5 |
Salaried Personnel |
|
|
|
OP Management |
6 |
6 |
6 |
OP Operations O/H |
31 |
32 |
32 |
OP Engineering |
28 |
32 |
32 |
OP Geology |
14 |
24 |
24 |
OP Maintenance |
45 |
47 |
31 |
Total Salaried Personnel |
124 |
141 |
125 |
Hourly Personnel |
|||
OP Operations O/H |
24 |
24 |
24 |
OP Drilling |
10 |
10 |
10 |
OP Loading |
20 |
32 |
32 |
OP Hauling |
31 |
35 |
43 |
OP Services |
53 |
69 |
79 |
OP Maintenance |
133 |
169 |
214 |
Total Hourly Personnel |
271 |
339 |
402 |
TOTAL MINE EMPLOYEES |
395 |
480 |
527 |
Auxiliary Equipment
Ancillary equipment includes miscellaneous pieces of equipment to support maintenance, mining, and mine engineering/geology activities. Supported maintenance activities include:
Field shovel maintenance
Bed repair
Parts loading/unloading, transport and warehousing
Field equipment recovery
Field equipment service and repair Supported mine operation activities include:
Tire repair and rotation
Field drill support
Field shovel support
Breaking oversized rock
Support equipment and drill transport
Road maintenance
Crew transport
Equipment dispatching
Site engineering and geology support
Supported mine engineering and geology activities include:
Fleet management and automation
Short range and long range mine planning
Ore control
Mine geology
Surveying
Geotechnical monitoring
Table 13.21 provides the peak ancillary equipment requirements for the LOM.
Table 13.21: Auxiliary Equipment Requirements | ||
|---|---|---|
Fleet Number |
Type |
Peak Number |
Auxiliary Fleet 1 |
Mack 380 HP - 6x6 Boom Truck |
1 |
Auxiliary Fleet 2 |
Liebherr LR 1100 – 100 tonne crawler crane |
1 |
Auxiliary Fleet 3 |
Liebherr LTM 1120-4.1 crane - 120t mobile crane |
1 |
Auxiliary Fleet 4 |
Liebherr LR 1250.1 crane - 250t crawler crane |
1 |
Auxiliary Fleet 5 |
JLG 800 Series - Genie Mod. Z80-60 4WD boom lift |
2 |
Auxiliary Fleet 6 |
Fuel/Lube truck |
3 |
Table 13.21: Auxiliary Equipment Requirements | ||
|---|---|---|
Fleet Number |
Type |
Peak Number |
Auxiliary Fleet 7 |
Cat 236D3 skidsteer loader |
1 |
Auxiliary Fleet 8 |
Flatbed Truck |
1 |
Auxiliary Fleet 9 |
Cat TL1255 Telehandler |
1 |
Auxiliary Fleet 10 |
CAT 416 Backhoe |
1 |
Auxiliary Fleet 11 |
Komatsu PC360LC-11 excavator |
1 |
Auxiliary Fleet 12 |
136 t Lowboy and Freightliner Truck |
1 |
Auxiliary Fleet 13 |
CAT CS13GC Soil Compactor |
1 |
Auxiliary Fleet 14 |
Light Plant |
15 |
Auxiliary Fleet 15 |
Peterbuilt 348 water truck |
2 |
Auxiliary Fleet 16 |
Tire Handler Truck |
2 |
Auxiliary Fleet 17 |
Toyota Hilux 2.8 SR 4x4 |
27 |
Auxiliary Fleet 18 |
WA500-8 Cable Reeler |
3 |
Auxiliary Fleet 19 |
Mercedes Benz Sprinter 516 Cdi Minibus 4325 19+1 Con Cámara |
8 |
Auxiliary Fleet 20 |
Mechanic Truck |
3 |
Auxiliary Fleet 21 |
Field Welding Service Truck |
2 |
Auxiliary Fleet 22 |
Electric Forklift |
2 |
Table 13.21: Auxiliary Equipment Requirements | ||
|---|---|---|
Fleet Number |
Type |
Peak Number |
Auxiliary Fleet 23 |
Rough Terrain Scissor Lift |
3 |
Auxiliary Fleet 24 |
Rough Terrain Forklift 5t |
3 |
Auxiliary Fleet 25 |
Electric Industrial Sweeper |
1 |
Auxiliary Fleet 26 |
OTR Tire Handler Attachment & Tire Truck |
1 |
Auxiliary Fleet 27 |
Sampling Truck |
1 |
Auxiliary Fleet 28 |
Maintenance Software |
1 |
Auxiliary Fleet 29 |
Laser Scan and Radar |
2 |
Auxiliary Fleet 30 |
450 tph crusher |
1 |
Copper Grade Control
Blast holes will be regularly sampled for assaying in the Los Azules laboratory. All blast holes in anticipated ore zones will be sampled for grade control; a portion of the holes in waste will also be sampled.
In addition to sampling for grade control, waste holes will be sampled for geochemical assessment to identify non-acid generating (NAG) material for use in road construction and civil works.
Slope Stability
Pit slopes will be monitored from the start of operations utilizing a combination of lasers and radars. The annual geotechnical budget accounts for a laser scanner, 2 radars, spare parts, 50 prisms, and geotechnical software. The geotechnical department along with their consultants will analyze information from the monitoring program to remediate instabilities and to adjust pit slope designs. Areas of high instability risk are prioritized for monitoring. The monitoring program is supplemented by routine inspections by the geotechnical team of the benches and crests for tension cracks or other signs of instability. Figure 13.24 provides an overview of the open pit monitoring strategy.

Figure 13.24: Open Pit Monitoring Strategy (SRK 2023)
End of Period Plans
Plans representing the mine schedule end-of-period positions are shown in Figure 13.25 to Figure 13.34.

Figure 13.25: Pit Configuration at the End of Year -2 (AGP 2025)

Figure 13.26: Pit Configuration at the End of Year -1 (AGP 2025)

Figure 13.27: Pit Configuration at the End of Year 1 (AGP 2025)

Figure 13.28: Pit Configuration at the End of Year 2 (AGP 2025)

Figure 13.29: Pit Configuration at the End of Year 3 (AGP 2025)

Figure 13.30: Pit Configuration at the End of Year 4 (AGP 2025)

Figure 13.31: Pit Configuration at the End of Year 5 (AGP 2025)
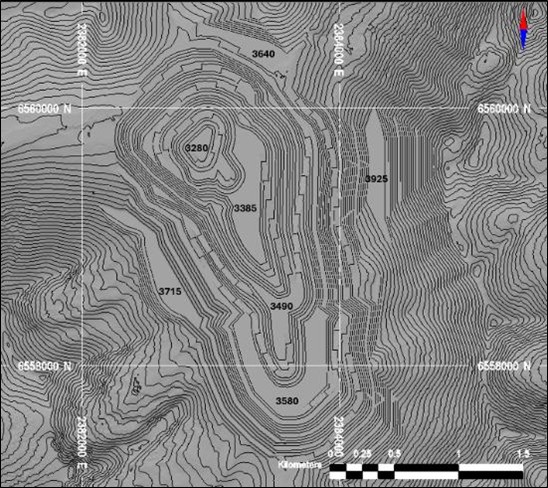
Figure 13.32: Pit Configuration at the End of Year 10 (AGP 2025)

Figure 13.33: Pit Configuration at the End of Year 15 (AGP 2025)

Figure 13.34: Pit Configuration at the End of Year 21 (AGP 2025)
Mine Decarbonization Strategy
McEwen Copper’s mission for the Los Azules Project is to become the world’s first carbon-positive copper mine, with a goal of achieving carbon neutrality by 2038. To meet this ambitious target, the operation must transition from diesel-powered equipment to electric alternatives, significantly reducing carbon emissions and minimizing the environmental impact of mining activities. The use of diesel currently contributes over 90% of the project GHG emissions footprint which makes this the main point of focus in meaningful reductions.
As part of the decarbonization strategy supporting the Los Azules 2025 Feasibility Study, AGP conducted a series of evaluations to identify the most effective material movement systems aligned with these goals. The initial focus was on loading equipment and blasthole drills, assessing commercially available and proven electric technologies as a low-risk path toward decarbonization. Following this, a series of trade-off studies were carried out, including:
A trolley trade-off utilizing 360-tonne class trucks.
A trade-off analysis of the Railveyor system was conducted following research into low-cost, low-carbon material handling solutions. While it emerged as a cost-effective and environmentally friendly option available, the decision to adopt it was ultimately deferred due to the high risk associated with being an early adopter of this emerging technology for large open pits.
A truck size, truck manufacturer, and manned vs. autonomous trade-off.
A trade-off analysis of conveyor haulage for waste from the pit.
Electrification Case
Electrifying the fleet presents the greatest opportunity to significantly reduce the project's carbon footprint by eliminating diesel use. Multiple trade-off analyses were conducted to assess the feasibility of electrifying blasthole drills and loading equipment. As a result, a substantial portion of the selected fleet has been electrified based on these evaluations.
Trolley Case
A screening evaluation was conducted to determine the optimal location and timing of trolley ramp segments throughout the project. The screening tool assessed each trolley line independently, based on the assumption that the haul trucks had already been converted to trolley.
As outlined in the 2023 Initial Assessment (2023 IA), trolley-assisted haulage can reduce the number of trucks required due to higher operating speeds on uphill grades and lower diesel consumption for the remaining fleet. Initial screening results indicated that implementing trolley systems could potentially reduce the haulage fleet’s carbon emissions by approximately one-third.
However, further evaluation of potential trolley routes was postponed until the detailed engineering phase, due to the time required for thorough analysis and screening. That said, recent advancements in trolley technology—such as side-connecting power systems introduced by several manufacturers are expected to simplify trolley relocation and reduce installation costs, thereby improving the overall economic viability of future implementations versus conventional overhead catenary power systems.
Railveyor Case
The Railveyor case study was based on a truck-and-shovel system delivering ore to an in-pit sizer, which then feeds material onto rail cars equipped with distributed drive systems for transport to the primary crusher. The proposed configuration required multiple interconnected systems and tracks operating in coordination, and the three subsystems were designed and analyzed as an integrated whole. However, due to the operational risks associated with deploying such a system on a greenfield project, combined with the limited number of large-scale installations and the scale required for Los Azules, this option was deferred for future consideration.
Truck Trade-off
Each of the prior cases is underpinned by a conventional truck-and-shovel operation, making the results of the truck fleet trade-off study applicable across all options. This study uses haul truck capital and operating costs based on data provided by equipment suppliers, along with insights into truck automation technologies.
The analysis focused on the largest available haul truck, the 360-tonne class, as well as the next two largest classes: 290-tonne and 230-tonne. Major suppliers, including Komatsu, Liebherr, and CAT, were asked to provide quotes for these three classes.
In addition to fuel consumption, the study considered the future potential of battery technology. While battery-electric haul trucks (BEHTs) are still in development, the 290-tonne class currently represents the largest viable option. However, production capacity for batteries with sufficient energy density, charge rates, and durability for haul truck applications is expected to take several years to mature. BEHT and or hybrid technologies are anticipated to evolve alongside growing support for trolley-assist systems, which would enable dynamic charging during operation.
Based on the trade-off analysis, the selected vehicle is a 360-tonne class truck equipped with automation. Automation is expected to enhance operational safety, improve fuel efficiency and tire life, and contribute to lower carbon emissions.
Conveyor Haulage of Waste
Samuel Engineering and AGP conducted an evaluation of conveyor haulage for transporting waste from the pit rim to the initial location of the North Mine Rock Storage Facility (MRSF). The study demonstrated that waste could be hauled to the rim, crushed using a large sizer to make it suitable for conveyor transport, and then conveyed to the waste dump, where it would be distributed using a truck and loader fleet. This approach showed significant potential for reducing operating costs and lowering carbon emissions.
Following the study, the MRSF location was shifted to a site northeast of the pit. As a result, further evaluation of conveyor haulage, including the potential integration of In-Pit Crushing and Conveying (IPCC) systems, was deferred to the detailed engineering phase.
Conclusion
Several opportunities remain to further reduce the carbon footprint of the Los Azules project and support the achievement of its sustainability goals. One such opportunity is the use of Hydrotreated Vegetable Oil (HVO), a drop-in replacement for fossil-based diesel. HVO can reduce carbon emissions from both stationary and mobile sources by up to 90%.
Conveyor haulage is another proven method for transporting material over long distances and steep gradients. Paired with in-pit crushing systems, there are viable locations within the pit where conveyors could be routed through bored tunnels to the processing facilities. This approach could significantly reduce the need for mobile equipment, operators, and associated carbon emissions.
Processing and Recovery Methods
introduction
The Los Azules Project will process copper ore from the Los Azules open pit mining operation at an annual throughput starting at 25 million tonnes of ore per year and increasing to 50 million tonnes of ore per year by Year 3 of the operation. The initial project phase and Reserves basis targets 1.023 billion tonnes of ore with an average total copper grade of 0.453% Cu with a soluble copper content of 0.312% Cu over a mining life of 20 years. The processing methodology selected for the project employs a hydrometallurgical recovery process which includes bio-heap leaching of crushed ore followed by solvent extraction/electrowinning (SX/EW) recovery of copper as LME Grade A cathodes for sale to industry.
The processing methodology selection process included several options considering the copper mineralization present at Los Azules and other factors. The deposit has very little copper oxide mineralization, however there is a high secondary copper mineralization (primarily chalcocite with some covellite and bornite) content found in the upper supergene portion of the deposit. The deposit also has a low content of potential by-products that are common with some copper deposits (gold, silver, molybdenum) with a small potential economic impact. Conventional milling and concentration (studies in the 2017 PEA) as well as emerging technologies for processing predominantly primary copper mineralized ore below the supergene layer (primarily chalcopyrite with some bornite) were considered. The assessment of these factors favors the bio-heap leaching methodology selected from an economic and capital intensity perspective.
The hydrometallurgical copper recovery approach also aligns most closely with the McEwen Copper environmental and social license strategies and objectives by lowering the project’s carbon footprint significantly across all scopes and reducing water usage by two-thirds or more compared to milling and concentrate production for downstream smelting to produce copper cathodes.
Bio-heap leaching is a mature technology for sulfide copper deposits with appropriate copper mineralogy, commercially practiced widely for over 50 years around the world and at sites like Los Azules in terms of altitude and climate. The most notable directly comparable larger commercial operations are Quebrada Blanca (Chile) and Zaldivar (Chile) which have successfully employed a similar processing strategy for several decades at high altitudes in the Chilean Andes.
A future Phase 2 project would target the longer-term, deeper and predominantly primary sulfide copper mineralization with the application of conventional sulfide milling and copper concentrate production for smelting (basis for Resource estimation as a suitable proven technology option) or use of Nuton® Technology (preliminary work and concepts are included in this study).
Nuton® Technology offers an opportunity to utilize the existing heap leaching process infrastructure and SX/EW facilities from the initial project and maintains the environmental and social advantages, which adds to the process selection rationale for the initial project.
Process design basis
The Processing Design Basis for the Los Azules Project is presented in Table 14.1 below.
Table 14.1: Process Design Basis | ||
|---|---|---|
Operating Design Basis Criteria |
Units |
Value |
Processing Operating Life |
yr |
22 |
Mining Operation |
yr |
20 |
Low Grade Stockpile Re-Handle |
yr |
21 |
Ore Feed |
|
|
Overall Mineable Deposit - Reserves |
|
|
Quantity |
Mt |
1,023 |
Grade (average) |
|
|
Total Copper |
% |
0.453 |
Soluble Copper (acid soluble + cyanide soluble) |
% |
0.312 |
Ore Throughput/Mine Schedule |
|
|
Year 1 |
|
|
Annual |
Mt/yr |
25 |
Daily (92% overall availability) |
t/day |
75,000 |
Year 2 |
|
|
Annual |
Mt/yr |
37.5 |
Daily (92% overall availability) |
t/day |
112,000 |
Year 3-LOM |
|
|
Annual |
Mt/yr |
50 |
Daily (92% overall availability) |
t/day |
150,000 |
Copper Recovery |
|
|
Recoverable Copper Mined (total copper basis) |
% |
74.5% |
|
kt |
3,452 |
Heap Leach Process Efficiency Factor |
% |
95% |
Copper Recovery to Cathode (total copper to cathodes) |
% |
70.8% |
Copper Cathode Production LOM |
kt |
3,279 |
Annual Copper Production to Cathodes |
|
|
Table 14.1: Process Design Basis | ||
|---|---|---|
Operating Design Basis Criteria |
Units |
Value |
Year 1-5 (average) |
t/yr |
204,789 |
Life of Mine (average) |
t/yr |
148,175 |
Maximum |
t/yr |
233,000 |
Design Factor (unless specified otherwise) |
1.15 x Nominal |
|
Process Overall Availability (unless specified otherwise) |
% |
92 |
Operating Days per Year |
day/yr |
365 |
Shifts per Day |
- |
2 |
Hours per Shift |
hr |
12 |
Operating Hours per Year, at availability |
hr/yr |
8,059 |
processing facilites and site layout
The Los Azules processing facilities include the following areas:
Three stage crushing, crushed ore stockpile & materials handling systems,
Agglomeration and ore stacking systems,
Heap leaching pad, solution distribution & recovery systems and solution management ponds,
SX/EW copper recovery plant and cathode handling,
Sulfuric acid plant, acid storage & distribution and sulfur storage & handling,
Offices, control room, maintenance shops & warehousing, and
Metallurgical laboratory for process control samples on-site
In addition, the associated contact and non-contact water management systems required for the processing areas are also included. The site layout considers McEwen Copper’s property ownership and mineral/surface rights and easements for permanent infrastructure.
Infrastructure related to processing includes temporary stockpiles for lower grade ore and primary copper mineralization materials are included.
Requirements for a future Phase 2 project have been considered, where practical to do so in terms of site planning, process design and layout in the initial project development phase. Where possible through the implementation of technology, on-site facilities and staffing has been minimized in favor of remote support.
A simplified Process Flow Diagram of the Los Azules Project is shown in Figure 17.1. The Processing Facilities Overall Layout is presented in Figure 17.2.
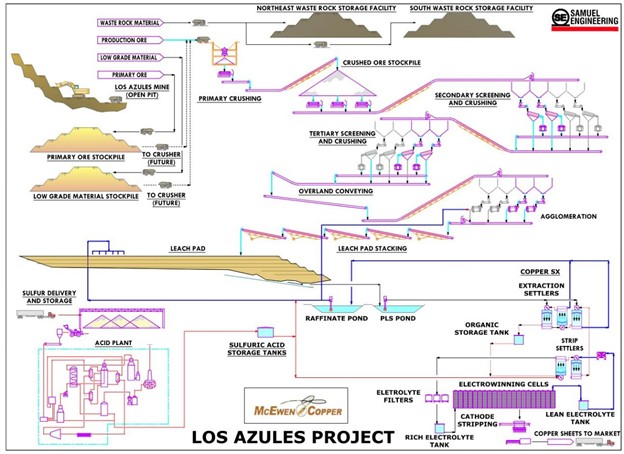
Figure 14.1: Simplified Process Flow Diagram (SE 2025)

Figure 14.2: Processing Facilities Layout (SE 2025)
process description & design basis
Copper Production Plan
Copper production is in the form of electrowon LME Grade A cathode. The copper production estimate is based on the metallurgical recovery estimates for each lithologic type in the Los Azules deposit to be mined (see Section 10) and the copper mineralogical grades (sequential assay fractions). Copper production also varies with the ore placement rate over the life of the mine. Soluble copper assays represent the oxide and secondary copper minerals (predominantly chalcocite/diginite with minor covellite) in the ore blocks. The incremental copper assay (portion of total copper assay that is not acid or cyanide soluble in the assaying technique) represents the primary copper mineralization (predominantly chalcopyrite with some bornite) present in the ore block. The combined assay is equal to the total copper assay for the block.
For the initial five years of operation, the soluble copper grade averages 0.650% Cu with a corresponding total copper grade of 0.770% Cu. The Life-of-Mine soluble copper grade averages 0.312% Cu with a corresponding total copper grade of 0.453% Cu.
Ore will be placed in Quarter 3 of Pre-production Year minus1 and leaching will commence by circulating PLS and generating leached copper in the PLS solution inventory copper tenor while the SX/EW plant construction is completed. Copper in solution inventory leached in Pre-production Year -1 will be produced in Year 1 of the operation. Copper recovery is based on a 3-year leaching period to recover copper in three active leaching cycles of 90-120 days.
The estimated Life-of-Mine copper production will average 148,175 tonnes per year and the initial five years of operation when ore grades are higher averages 204,789 tonnes per year. The estimated production maximum is achieved in Year 3 at 227,302 tonnes of copper cathode. The copper production profile for the Los Azules project is presented in Figure 14.3 below.

Figure 14.3: Mined Ore Grades to Leach Pad & Cathode Production (SE 2025)
Copper production in Operating Years 22 and 23 of the planned processing life is a result of the 3-year extended leaching time for all materials on the leach pad. Year 23 represents a partial year of operation.
Overall Process Description
The initial project focuses on conventional bio-heap leaching of the near-surface oxide and supergene copper mineralization using solvent extraction and electrowinning (SX/EW) to produce up to 235,000 tonnes of LME Grade A copper cathodes per year and varies depending on copper grades and ore throughput.
The project mining plan includes 21 years of operation and stockpile re-handling. Residual leaching continues for 22.3 total operating years. Ore throughput rates range from 25 million tonnes per year (75,000 t/day at ~92% availability) in the initial years up to 50 million tonnes per year (150,000 t/day at ~92% availability). The materials handling systems are designed to be expanded as throughput increases and deliver a crushed product feed to the leaching systems at a P80 of 19mm.
The Los Azules heap leaching pad will be developed over mine life in six (6) phases and is designed to hold up to 1.054 billion tonnes of ore. The initial Phase 1 pad and associated solution and water management ponds is designed for a capacity of 68.3 million tonnes of ore (approximately 2 years) before an expansion is required.
Sulfuric acid required for the leaching process and SXEW facility will be produced at the site in a packaged plant fed with imported elemental sulfur prill. The initial acid plant capacity will be approximately 372,000 tonnes per year of 98% sulfuric acid. The acid plant is also equipped with a steam turbine to cogenerate electric power from waste heat. As ore throughput increases, a second plant of similar size will be required.
The processing facilities are designed to produce 3,279 metric tonnes (7.23 billion lbs) of copper cathodes produced (~70.8% total copper recovery) over the project life. Cathode production varies annually based on ore grades and EW throughput is designed to accommodate a maximum of 240,000 t/yr.
Initial project development is expected to take 36 months. Initial ore processing will commence in Q3 of the final construction year (Year -1), with ore placed on the leach pad and leaching systems in operation. Approximately 12.5 million tonnes of ore will be placed in the six (6) months prior to project completion and EW plant start-up. This will necessitate the early commissioning of the crushing, stacking and leach pad areas along with the sulfuric acid plant. Leach solutions will be circulated to allow for a buildup of PLS solutions and grades prior to starting the SX circuit. Electrolyte solution copper tenor buildup is required prior to starting the electrowinning circuits and copper production by circulating electrolytes before starting the rectifier current ramp up.
Crushing, conveying and Ore Stacking Process
The three-stage crushing and screening system design and equipment supply considers a packaged design/supply delivery (excluding civil works) from Metso. Featured solutions in Metso’s Foresight™ family are the MP cones station and the Semi mobile primary gyratory (SMPG). Capacities range up to 15,000 tons per hour. These stations also bring top size control with a reduced plant footprint compared to similar crushing and screening plants. Material undergoes secondary/tertiary crushing and screening, then moves via overland conveyors to an agglomeration drum before stacking onto the heap leach pad.
The initial project construction expands crushing from 25 Mtpa (initial) to 50 Mtpa (Year 3). The general layout for the crushing systems is shown in Figure 14.4.

Figure 14.4: Crushing Systems General Layout (SE 2025)
Crushing and Screening Process
The Metso Foresight™ guiding design principle is to reduce concrete works to the largest degree and build a modular plant with a focus on ease of installation and associated site-activities, maximizing off-site work, as well as ease of relocation.
The SMPG station has a modular approach that focuses on a few different pillars to build an optimal station and minimize on-site installation requirements. The primary crushing process begins with haul trucks delivering blasted ore to the dump hopper, which discharges material onto an apron feeder. The dump hopper area is provided with a rock breaker for large material handling. The apron feeder delivers ore into the Superior MK-III 60’x110’ primary gyratory crusher at an F80 of ≈239 mm and a throughput of 8,754 mtph. The gyratory crusher reduces the material to a P80 of 145 mm, which is discharged onto the primary crusher discharge conveyor. The crushed material passes through a metal detector and magnet to remove any stray metal before being transferred via the stockpile feed conveyor to the crushed ore stockpile. The primary crushed ore stockpile is designed with a live capacity of eight (8) hours.
From the stockpile, three apron feeders each transfer 2,918 mtph of material to the secondary crushing feed conveyor. This conveyor delivers the full 8,754 mtph to two secondary crushing feed bins via the shuttle conveyor. Each bin is equipped with cut-off gates and apron feeders to regulate the flow of material to the downstream secondary screens.
Metso’s Foresight™ Secondary MP Cone Crusher Station. At the secondary screening stage, oversized material (P80 ≈ 171 mm) is directed to the two secondary cone crushers (Standard MP-1250), while undersized material (P80 ≈ 21 mm) reports to the first secondary undersize conveyor. The secondary cone crushers discharge material at a P80 of ≈39 mm, which combines with the screened undersize material on the tertiary crushing feed conveyor.
The tertiary crushing feed conveyor transfers 8,754 mtph of material to two tertiary crushing feed bins via the shuttle conveyor. From each bin, apron feeders deliver material to the tertiary screens. Oversized material (P80 ≈ 48 mm) is processed in the tertiary cone crushers (Short Head MP-1250), while undersized material (P80 ≈ 14 mm) reports to the tertiary undersize conveyor. Tertiary crusher product, discharged at a P80 of ≈20 mm, merges with the undersize material onto the tertiary product conveyor. From there, all tertiary circuit output is conveyed via an 1800m wide x 2km long overland conveyor to a transfer point and to the agglomeration feed bin indexing conveyor, which dispenses the ore feed into agglomerator bins. conveyors.
Agglomeration and Stacking Process
Crushed material is distributed from the agglomerator feed bins via dedicated feeders and conveyors to respective agglomerator drums. Ore agglomeration is initially conducted in two (2) rotary drum agglomerators w/ Gear Drive 4.6 m (15 ft) diameter by 15.2 m (50 ft) long.
Agglomerates are loosely balled fines attached to coarser material with acidified raffinate solution from the SX facility, without a binder. The agglomerate moisture target is 5%-8% with a feed ore moisture starting at ~3%. The acidified raffinate is generated at the SX raffinate pond and pumped to the agglomeration area. Acidified raffinate will include enough sulfuric acid to achieve a 6 kg acid/ore tonne initial cure addition as the ore is stacked onto the leach pad. The agglomerated ore is dispensed onto an 1800mm wide overland and then to an 1800mm x 1.8km long tripper conveyor running parallel to the leach pad area.
The stacking system is based on the commercially proven Terra Nova Technologies Standard Super Portable ® Conveyor 1800mm x 76m long portable stacking design and self-propelled components. Material from the overland tripper conveyor flows to a series of 30 self-driven mobile tracked conveyors, to an 1800mm x 33m long horizontal feed conveyor to a and ultimately reaching an indexing 1800mm x 85m long horizontal conveyor. The indexing conveyor delivers material to an 1800mm x 60m/69m telescoping radial stacking conveyor and retreats together as the layer of ore is placed for placement on the heap leach pad according to the stacking plan. As the indexing conveyor is fully retreated, one of the Super Portable conveyors is removed from the sequence (mobile power supply included) and the ore stacking process continues along a linear path.

Figure 14.5: Example Stacking System Operation (Terra Nova Technologies)
Future Expansion Plan
To support the planned increase in stacking capacity from 25 million tpa to 50 million tpa, expansions to initially installed systems will occur in two phases. Both the secondary and tertiary crushing circuits will see the addition of two feed bins, two screens, and two cone crushers. One set for each circuit will come online in Year 2 (to accommodate the increase to 37.5 million tpa) and then another in Year 3, with each system expanding to a total of four feed bins, screens, and cone crushers. The agglomeration system will similarly receive a duplication of key components including the feed bins, conveyors, and agglomerator drums by Year 3, totaling four of each piece of equipment in this circuit installed. Additional stacking conveyors are added over the life of mine to accommodate leach pad area expansions.
Heap Leaching Process
Heap leach processing will scale from 25 Mtpa (Year 1) to 50 Mtpa (Year 3), requiring periodic heap expansions and acid plant growth described in Section 15 of this report.
Heap leaching involves stacking crushed oxide and supergene material on a lined leach pad (~1,032 Mt capacity) in 9m to 10m lifts to a maximum 150m height over the lined area from the liner surface. The maximum overall height is restricted by geotechnical design to prevent the potential of liner failure due to deformation from excessive surface subsidence.
Sulfuric acid raffinate (5-10 g/L H2SO4) is applied, dissolving copper into pregnant leach solution (PLS), which is then processed through SX/EW to extract pure copper. The application rate is designed to be adjustable and averages 6 L/hr/m2 in the active leaching area. The system also allows for periodic rest cycles to help aerate the piles and minimize PLS dilution at the end of the planned leaching cycle.
Aeration to the leach pad is considered in the design. Initially, the ore layers are not sufficient to benefit significantly from aeration. In year 2-3, ten (10) high capacity aeration blowers (10,000 CFM or 17,000 m3/hr) low pressure air units packaged in containers for easy relocation to active leaching areas, are included. The air distribution system is the leach solution distribution piping left at each layer in the lift and new layers are added. Low pressure air is fed to the abandoned piping 2 or 3 layers below the top active layer. This design provides flexibility in the amount and locations where air is introduced. The design also minimizes aeration system compromises should piping collapse or become plugged experienced with permanent installations placed at the bottom area of the pads and inefficient distribution as the pile height increase over time. The system also allows for easy expansion and addition of units as required without major rework.
As the leach pad ore surface rises and expands in the valley, booster stations are required to maintain raffinate solution flow to the pad.
Solvent Extraction and Electrowinning (SX/EW)
Solvent extraction and electrowinning (SX/EW) is a two-stage hydrometallurgical process that first extracts and upgrades copper ions from low-grade leach solutions into a solvent containing a chemical that selectively reacts with and binds the copper in the solvent.
The copper is extracted from the solvent with strong aqueous acid which then deposits pure copper onto cathodes using an electrolytic procedure (electrowinning). Approximately 20% of the worldwide production of copper is produced with this methodology (S&P Global copper market data).

Figure 14.6: Processing Area Layout (SE 2025)
The Los Azules copper SX/EW plant operates 365 days per year at 99% overall nominal availability to extract copper from the heap leach PLS. The high availability value considers that entire areas of the plant are not required to be shut down for maintenance and service as well as a 15% over-design for catch-up and short-term variations in capacity as needed.
The total PLS flow from the heap leaching system is expected initially be 2,400 m3/hr and increases to 4,800 m3/hr at the 50 Mtpa ore throughput rate.
Solvent Extraction (SX)
Solvent extraction is designed to take place across three extraction stages, two in parallel, one in series, followed by two stripping stages. This configuration of mixer settlers are identical across each of the four trains, Trains A through D. The solvent extraction plant initially comes online with three trains to process a lower PLS flowrate with a higher copper grade until Year 3. Train D is added to the process in Year 3 with the PLS flowrate to each train averaging 1250 m3/h, with an average copper grade of 5.38 g/L.
The solvent extraction facility consists of four (4) process trains with each train’s base design flow configuration as Series Parallel extraction as two (2) extraction mixer/settler units operating in series (ES) with a parallel mixer/settler (EP) to process PLS and two (2) stripping (S) mixer/settlers to recover copper to the electrolyte for copper electrowinning (configuration notation as 2ES + 1EP x 2S).
Each SX train can process up to 1,821 m3/hr (2,094 m3/hr design) PLS flow in the base series parallel configuration. Organic solution (mixture of a copper extractant chemical dispersed in a carrier diluent for volume) is introduced to the extraction stages where copper in the PLC is chemically adsorbed (loaded) by ion exchange onto the extractant. Depending on the PLS grade (dependent on ore throughput and copper grade) and required extraction reagent concentration (a maximum of 18% extractant is considered), each SX train can be operated in the following configuration with the piping design:
Series:(2ES x 2S) = 911 m3/hr PLS
Series Parallel:(2E + 1EP x 2S) = 1821 m3/hr PLS
All Parallel:(1EP+1EP+1EP x 2S) = 2,732 m3/hr PLS
Piping around the mixture settlers allows for reconfiguration of the settlers as well as space allowance installation of a wash settler, in the event of the introduction of an impurity in the process. Each train is also equipped with raffinate after settlers to collect organic solutions prior to the return of raffinate to the raffinate pond. Train A and B, as well as Train C and D, share two loaded organic tanks, a filter feed tank, and a collection tank. These tanks are FRP construction for material compatibility with the process conditions for both the conventional leach and Nuton® Technology additions and modular/pre-assembly construction considerations of a remote site.
Initially, only two (2) SX trains will be required with a third train added in Year 1 and a fourth train added in year two (2) as PLS flows increase with ore throughput to the leach pad increases over the first three (3) years of operation.
Each SX train also includes raffinate organic recovery with an after settler in each train to receive and remove entrained organic prior to advancement to the raffinate pond and recycle back to the leaching system.
An organic washing stage is not considered necessary due to low chloride and other contaminant content in the PLS, however space to include one per train in future has been considered (may be relevant in applying Nuton or other leaching technology in future).
Electrowinning
There are four tankhouses in the electrowinning circuits (Tankhouse A-D). Each tankhouse is equipped with 80 cells constructed of polymer concrete and 55 anodes/54 cathodes per cell. Each cell possesses its own cell hood to capture acid mist, which then feeds off-gas scrubbers that utilize raffinate to neutralize the acid mist. The electrowinning cells are designed to be fed 1,220 m3/hr of rich electrolyte with a concentration of 47 g/L of copper. A direct current voltage of 2.2 V is applied across the electrodes with a nominal current density of 320 A/m2 (maximum 360 A/m2) to achieve the deposition rate of copper based on incoming PLS copper content to SX.
Once the copper deposits onto the cathode, the cathodes are harvested on a weekly cycle via overhead cranes and then mechanically stripped with automated cathode stripping machines, one for each pair of tankhouse circuits, before being corrugated, bundled into 2,000 kg to 2,005 kg stacks, and weighed.
This facility produces a nominal 210,000 tonnes of LME Grade A copper cathode per year with a design maximum of 240,000 tonnes achieved by increasing the rectifier current output and cathode current density from 320 amps per square meter of plating area to 360 amps per square meter.
Sulfuric Acid Production
The initial acid plant capacity will be approximately 372,000 tonnes per year of 98% sulfuric acid. The acid plant is also equipped with a steam turbine to cogenerate electric power from waste heat. As ore throughput increases, a second plant of similar size will be required.
Instead of trucking acid, onsite sulfuric acid plants will convert elemental sulfur into sulfuric acid (98% concentration). The Los Azules project requires commercially available elemental sulfur to produce sulfuric acid on-site, a critical component for the heap leaching process. Approximately one (1) tonne of sulfur will is required to produce three (3) tonnes of sulfuric acid (100% concentration basis).
The strategic approach to sourcing sulfur (see Section 14.5.1 below) reduces reliance on externally sourced sulfuric acid, streamlines supply chain costs, and minimizes transportation emissions, restrictions and safety concerns. Additionally, sulfuric acid production aligns with Los Azules' commitment to carbon neutrality, ensuring a highly efficient and sustainable footprint, as the conversion of sulfur to sulfuric acid creates a carbon-free energy source.
A small amount of sulfuric acid will be required to be delivered to site to start-up the acid plant initially and off-set small peaks in requirements in excess of the acid plant production capacity.
The technology provider considered for the acid plant is Ballestra S.p.A. on a design/supply basis. The sulfuric acid plant contemplated for Los Azules employs Elessent (previously DuPont) Clean Technologies MECS® sulfuric acid technology. The MECS® Double Contact Double Absorption (DCDA) MECS technology achieves up to 99.93% conversion and SO₂ emissions in line with the most stringent environmental regulations.
Sulfuric acid requirements are based on an average gross acid consumption of 18 kg of 100% acid/tonne ore leached. In the SX/EW process, 1.54 tonnes of sulfuric acid are regenerated for every tonne of copper produced, which directly off-sets a portion of the leaching acid requirements. The purchased acid requirements therefore vary with copper production. Table 14.2 shows the estimated annual net acid requirements at Los Azules.
Table 14.2: Estimated Annual Net Acid Requirements | |||
|---|---|---|---|
Operation Year |
Acid Required (98% H2SO4) tonnes/year |
Sulfur Required (≥95% S) tonnes/year |
Acid Plant Capacity |
-1 |
109,000 |
33,900 |
1 @ 370,000 tpa |
1 |
110,000 |
51,800 |
|
Table 14.2: Estimated Annual Net Acid Requirements | |||
|---|---|---|---|
Operation Year |
Acid Required (98% H2SO4) tonnes/year |
Sulfur Required (≥95% S) tonnes/year |
Acid Plant Capacity |
2 |
277,000 |
86,000 |
|
3 |
473,000 |
147,000 |
2 @ 370,000 tpa |
4 |
585,000 |
182,000 |
|
5 |
628,000 |
195,000 |
|
6 |
609,000 |
189,000 |
|
7 |
657,000 |
204,000 |
|
8 |
665,000 |
206,000 |
|
9 |
646,000 |
201,000 |
|
10 |
655,000 |
203,000 |
|
11 |
677,000- |
210,000 |
|
12 |
733,000 |
228,000 |
|
13 |
744,000 |
231,000 |
|
14 |
744,000 |
231,000 |
|
15 |
743,000 |
231,000 |
|
16 |
744,000 |
231,000 |
|
17 |
739,000 |
229,000 |
|
18 |
715,000 |
222,000 |
|
19 |
731,000 |
227,000 |
|
20 |
744,000 |
231,000 |
|
21 |
744,000 |
231,000 |
|
22 |
NA |
NA |
|
Acid required for start-up and make-up for annual requirements that exceed acid plant capacity. Up to 33,000 tonnes (Year 21) of acid in excess of the plant production capacity would be required in some years (4 years during the mine life) as imported from within Argentina, Chile and/or other sources.
The acid plant cogenerates steam for electric power up to approximately 13.6MW per acid plant module installation, offsetting 15-20% of site electricity demand.
Additionally, waste heat is recovered and used in the SX/EW process in the form of steam condensate for electrolyte and PLS solution is used for cooling water requirements to augment leaching solution temperature.
The acid plant design is specified to meet or exceed local and international standards for gaseous and mist type emissions. Acid plant emissions are regulated in Argentina under Federal Law 24051 – Fed. Decree 831/93 and San Juan Prov. Decree 1211/2007, Federal Law 24585 – Prov. Decree 1426/96 and Federal Law 24051 – Fed. Decree 831/93 and San Juan Prov. Decree 1211/2007. A summary of the applicable Standards is provided in Table 14.3 below.
Table 14.3: Acid Plant Emissions Standards Summary (various sources) | ||
|---|---|---|
Argentinian Legislation |
Units |
Value |
Ambient Air Quality Guideline Levels |
||
Acid (H2SO4) Mist Concentration |
mg/m3 |
0.006 |
Average Period |
min |
30 |
Acid (H2SO4) Mist Concentration |
mg/m3 |
0.002 |
Average Period |
min |
480 |
SO2 Concentration |
mg/m3 |
1,300 |
Average Period |
min |
120 |
Air Quality Guideline Levels |
||
SO2 Concentration |
ug/m3 |
850 |
Average Period |
hr |
1 |
SO2 Concentration |
ug/m3 |
400 |
Average Period |
hr |
24 |
SO2 Concentration |
ug/m3 |
80 |
Average Period |
yr |
1 |
Gaseous Emissions Standards |
||
Acid Mist (H2SO4) at Surface Level |
mg/s |
2.00 |
Table 14.3: Acid Plant Emissions Standards Summary (various sources) | ||
|---|---|---|
Acid Mist (H2SO4) at Chimney Height of 30m |
mg/s |
740.00 |
European Best Available Technology (BAT) Standards |
||
Emissions into air |
- |
|
SO2 |
kg/t* |
1.5-3.9 |
SO3 (Expressed as H2SO2) |
kg/t* |
0.1 |
H2SO4 |
kg/t* |
0.1 |
Nox (Expressed as NO2) |
mg/Nm3 |
< 30 |
CO2 |
%vol |
0 |
US EPA CFR Standards |
- |
|
§ 60.82 Standard for sulfur dioxide |
- |
|
SO2 Discharge into atmosphere |
kg/t* |
< 2 |
§ 60.83 Standard for acid mist |
- |
|
Acid mist (H2SO4) discharge |
kg/t* |
< 0.075 |
Mist Opacity |
% |
< 10 |
World Bank Standards |
||
Air Emission Levels for Sulfuric Acid Plants |
- |
|
SO2 |
mg/Nm3 |
450* |
SO3 |
mg/Nm3 |
60* |
H2S |
mg/Nm3 |
5 |
NOx |
mg/Nm3 |
200 |
PROCESSING REAGENTS
Significant reagents required for the various processing areas in sulfur for the acid plant feed, solvent extraction reagent loss make-up, and electrowinning copper quality control. These are summarized in the following Sections.
Sulfur
The expected sulfur requirements range from 60,000 tonnes per year initially to 237,000 tonnes per year depending on acid requirements that vary with copper production and ore throughput rates over the mine life (see Table 14.2 above).
Ellzey Zissos & Associates were contracted to analyze and recommend a sulfur supply strategy and pricing basis for elemental sulfur delivered to the Los Azules site. While sulfur is available in limited supply within Argentina from sour gas and refinery producers like YPF, the bulk of the requirements at Los Azules will be imported. The following information is from the marketing study completed by Ellzey Zissos & Associates and updated in August 2025.
Los Azules aims to establish a competitive advantage through an innovative sulfur supply strategy, the “Strategy”, prioritizing cost efficiency, advantaged & reliable supply, with an alignment on sustainability. This is important because, after years of balanced market conditions, the demand for sulfur is growing faster than the supply of sulfur, and the imbalance is projected to accelerate due to the energy transition. The world’s largest sulfur consumers are driven by agricultural economics and will leverage their buying power to secure resources, creating a disproportionate price and supply risk for smaller customers in the sulfur market.
A cornerstone of the Strategy is leveraging Canada’s vast and stable sulfur reserves, including 12 million tonnes of sulfur stored in blocks (sulfur blocks or block sulfur) to provide a reliable long-term supply. By combining the sulfur block reserves with other Canadian sulfur sources, including ongoing production operations, and leveraging the robust Canadian export infrastructure, Los Azules can mitigate risks associated with supply security, geopolitical instability and high sulfur price volatility. The ability to source sulfur at predictable and competitive rates addresses the Strategy’s mandate for cost efficiency and reliability.
Ellzey Zissos & Associates proposes that further enhancements may be achieved through co-purchasing synergies with other regional consumers. This requires further study and Ellzey Zissos is prepared to investigate this possibility for McEwen Copper.
To illustrate this, the entire supply chain from Fort McMurray to Los Azules was estimated and grouped into three categories. These categories are Remelt Supply Chain, Vessel Logistics, and Inland Argentine Supply Chain. The total supply chain costs from Fort McMurray to Vancouver are estimated at $197 USD/tonne. This means that when the Vancouver index reaches $197 USD/tonne, the blocks in Fort McMurray become competitive to the rest of the market. Logistical costs from Vancouver to Los Azules remain the same regardless of what product is purchased and as such are not part of this analysis.
Table 14.4: Sulfur Pricing Build-up (Ellzey Zissos & Associates August 2025) | ||||
|---|---|---|---|---|
|
Activity Fort McMurray Supply Chain to Los Azules |
Unit Cost USD/Tonne |
Category |
Category Cost, USD/Tonne |
Commentary |
Purchase Price of Block (Historically under short term contract) |
$20 |
Remelt Supply Chain |
$197 |
The cost from Fort McMurray to Vancouver sets the cutoff price for when sulfur from Fort McMurray is at parity with the market price. This occurs around $197USD/Tonne. |
Deblocking Cost and Loading to Trucks |
$13 |
|||
Trucking to Remelter |
$78 |
|||
Remelt Cost |
$24 |
|||
Prilling Costs |
$12 |
|||
Rail Freight To Vancouver |
$30 |
|||
Pacific Coast Terminals Cost (This Sum Up to this Point sets thee FOB Cost at Vancouver) |
$20 |
|||
Vessel Freight Vancouver to San Lorenzo |
$26 |
Vessel Logistics |
$29 |
Vessel Logistics are the same regardless of supply from Fort McMurray vs Vancouver |
Demurrage at Vancouver |
$3 |
|||
Port Unloading |
$15 |
Inland Argentina Supply Chain |
$89 |
Inland Argentine Logistics are the same regardless of supply from Fort McMurray vs Vancouver |
Demurrage at San Lorenzo |
$3 |
|||
|
Rail from San Lorenzo to Albardon |
$24 |
|||
Transload at Albardon to Trucks |
$26 |
|||
Trucking to Los Azules |
$21 |
|||
Total Cost, Fort McMurray Remelted Block Landed at Los Azules$315
For project assessment purposes, Ellzey Zissos & Associates proposes that McEwen Copper’s modelling uses a sulfur price of USD $315 per tonne, inclusive of transportation and handling costs to Los Azules. This pricing reflects a forecast based on current and historical market conditions, long-term Canadian supply agreements, and logistical efficiencies. Factoring in this cost ensures realistic financial modelling and highlights the strategic value of utilizing stable, block-sourced sulfur in the Strategy.
A Monte Carlo analysis estimates a statistical range for sulfur cost delivered to Los Azules. The input parameters, the range of their costs, and the expected values for all input parameters are summarized in Table 14.5 and the simulation results are presented in Figure 14.10.
Table 14.5: Elemental Sulfur Supply Mote Carlo Simulation of Landed Pricing Assumptions (Ellzey Zissos & Associates August 2025) | |||
|---|---|---|---|
Input Parameter |
Commentary |
Range Used (P10 - P90) USD/tonne |
Expected Value, USD/tonne |
Vancouver, FOB |
Based on historical 20-year data se |
$45 - $250 |
$138 |
Vessel Freight, 50kt Panamax |
Based on sailing days, freight indexes and vessel costs / day |
$14 - $40 |
$26 |
|
Demurrage Costs (Applied twice for both ports) |
Based on a low case of 1 to 3 day and a high case of 4 to 7 days for a 50kt vessel |
$2 - $4 |
$6 |
Offload Terminal San Lorenzo |
Includes stevedoring, port fees, storage and warehousing for 1 month |
$11 - $20 |
$15 |
Rail from San Lorenzo to Albardon |
Based on PSA Rate1 of $0.018USD/tonne/KM base case for 1,200km. |
$11 - $43 |
$24 |
Transload at Albardon |
Based on sulfur transloads located in US Gulf, includes regular operations as well as capital recovery |
$12 - $42 |
$26 |
Trucking from Albardon to Los Azules |
Based on PSA Rate1 of $0.063USD/tonne/KM base case for 1,200km for a route between 250 - 300km |
$11 - $31 |
$21 |
| |||
Table 14.5: Elemental Sulfur Supply Mote Carlo Simulation of Landed Pricing Assumptions (Ellzey Zissos & Associates August 2025) | |||
|---|---|---|---|
Input Parameter |
Commentary |
Range Used (P10 - P90) USD/tonne |
Expected Value, USD/tonne |
Expected Value |
The Sum of the of Simulation Outcomes / The Number of Simulations |
|
$256 (P61) |
| |||
P10 |
The value below which 10% of the simulated outcomes fall |
|
$169 |
P50 |
The value below which 50% of the simulated outcomes fall |
|
$236 |
P80 |
Recommended Value |
|
$315 |
P90 |
The value below which 90% of the simulated outcomes fall |
|
$385 |
As part of the recent work completed for McEwen Copper, the landed cost for sulfur was based on inland rates provided by PSA on December 11, 2024. These values were supplied for rail ($0.018USD/tonne/KM) and for trucking ($0.063USD/tonne/KM) and consider a return trip from source to destination. It should be noted that these rates are typically lower than comparable rates over comparable distances, and as such, a degree of caution was applied in their use in the model to account for this.
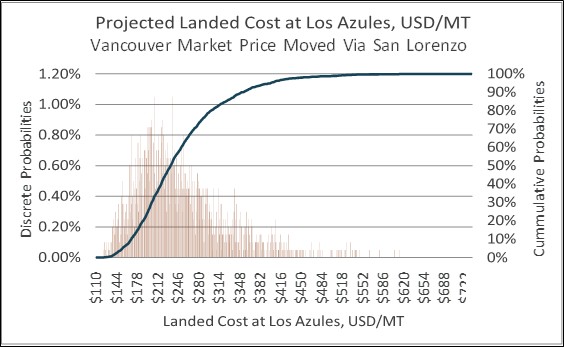
Figure 14.10: Sulfur Landed Costs Probability Assessment (Ellzey Zissos & Associates Aug 2025)
Solvent Extraction Reagents
SX Organic Diluent & Extractant Make-up
The solvent extraction process will have natural losses of the organic solutions (diluents and active extractant) because of entrained losses to the raffinate and electrolyte process streams. Modern solvent extraction mixing and settling technology design has been able to minimize but not eliminate the physical losses. Recovery of losses from the raffinate pond and electrolyte stream is considered in the facilities design which also help to reduce these losses.
The volume of losses is directly proportional to the SX PLS flowrate (and resulting raffinate discharged) processed. The net loss after recovery at Los Azules is expected to be 15ppm of organic solution. The make-up requirements for the project vary over time as ore throughput increases and SX capacity also increases. Average extractant concentration (Solvay M5640 or similar) also varies with copper transfer (production) from 18% in the early years where PLS flows are lower and copper grades are high to 16% when PLS flows are higher and copper grades are lower. SX diluent is Shell GTL G80 or a similar product.
Table 14.6 shows the annual average make-up requirements for the SX reagents over the project life span.
Table 14.6: Average SX Reagent & Diluent Make-up Requirements | ||||
Operation Years |
Number of SX Trains in Service |
Total SX Flowrate (m3/hr) |
Diluent Usage (m3/y) |
Extractant Usage (kg/y) |
1-2 |
2 |
2,400 |
325 |
70 |
3-LOM |
4 |
4,800 |
650 |
140 |
Organic Solution Clay Treatment
Montmorillonite clay or a similar product will be used in the clay treat system to process recovered organic and maintain separation kinetics in the SX plant. Expected usage is 1-2 kilograms per m3 of solution treated with an annual average usage of up to 5 tonnes of commercial grade montmorillonite clay or similar product to process 2,500 m3 of organic solution per year.
Electrowinning Reagents
Cobalt Sulfate
Cobalt sulfate is added to the electrowinning electrolyte to stabilize the lead anode corrosion layer and minimize flaking and spalling which causes lead impurities in the copper cathode product if uncontrolled. The usage is determined by losses from the electrolyte system bleed to maintain other deleterious components transferred from the SX operation (physically or chemically). Expected usage is described below.
Table 14.7: Cobalt Sulfate Usage | ||
Parameter |
Units |
Value |
Electrolyte Concentration Target (Co) |
ppm |
120 |
Electrolyte Bleed (per 4 SX trains) |
m3/hr |
20 |
Dosage (CoSO4 •7 H2O) |
kg/day |
19 |
Usage |
kg/yr |
6,935 |
Guar Gum
Guar gum is added to the electrowinning electrolyte solution as a smoothing agent for the copper plating onto the cathode surfaces and a short circuit inhibitor (dendritic preferential copper deposition growths that occur from contaminants occluded into the cathode. Excessive surface roughness and dendritic growths are sources of contamination from lead flakes, solution entrapment, and other contaminants present in the electrolyte solution. The expected usage for a well-operated facility is described below.
Table 14.8: Guar Gum Consumption Estimates | ||
Parameter |
Units |
Value |
Additive Rate |
gm/t Copper |
250 |
Usage (depending on cathode production) |
kg/day |
120 - 160 |
Annual Usage |
t/yr |
43.8 – 58.4 |
Guar gum is expected to be delivered in 20kg sacks on 1 tonne pallets.
Acid Mist Control Foaming Agent
Based on input from the electrowinning technology providers and the acid mist control system included in the cell and tank house design, a foaming agent may be required to ensure compliance with industrial hygiene and acid mist emissions standards. The surfactant foaming agent acts as a physical barrier on the surface of the electrowinning, trapping the electrolyte droplets within the foam bubbles. As the electrolyte drains from the foam back into the main solution, the acid mist is effectively suppressed.
Examples of foaming agents in commercial:
CAL FAX DBA-70: A mist suppressant often used in copper electrowinning.
Licorice and saponin: Examples of foaming agents used in zinc and copper electrowinning.
BASF Pluronic F67: A nonionic surfactant that has been shown to be effective in reducing sulfuric acid mist in copper electrowinning.
NOTE: 3M Acid Mist Suppressant FC-1100: Formerly was a commonly used foaming surfactant, but its production has been discontinued due to environmental concerns.
The Los Azules electrowinning system considers the use of licorice extract currently at a dosage rate to maintain a 3ppm concentration replacement for a usage of approximately 0.5 tonnes per year.
PROCESS STAFFING & LABOR
A comprehensive staffing plan for the process areas operations and maintenance was developed by McEwen Copper and compared to similar plants and operations in Chile during visits. A summary of the staffing plan from Pre-Production ramping up to the expected LOM is presented in the Table below.
Table 14.9: Process Operations & Maintenance Staffing Plan | |||||||||
|---|---|---|---|---|---|---|---|---|---|
PROCESS OPERATIONS STAFFING PLAN |
Schedule |
Pre-Production |
Operation |
||||||
AREA |
Category |
Days on/off |
Yr -3 |
Yr -2 |
Yr -1 |
Yr 1 |
Yr 2 |
Yr 3 |
LOM |
Admin |
Process Manager. |
8X6 |
- |
1 |
1 |
1 |
1 |
1 |
1 |
|
Process Assistant. |
8X6 |
- |
- |
1 |
1 |
1 |
1 |
1 |
|
Area Total |
|
- |
1 |
2 |
2 |
2 |
2 |
2 |
Acid Plant |
Acid Plant Superintendent |
8X6 |
- |
1 |
1 |
1 |
1 |
1 |
1 |
|
Head Of Acid Plant Operations |
8X6 |
- |
- |
- |
- |
- |
- |
- |
|
Acid Plant Process Engineer |
8X6 |
- |
- |
1 |
1 |
1 |
2 |
2 |
|
Chemical Analyst Acid Plant |
8X6 |
- |
- |
- |
- |
- |
- |
- |
|
Sr. Supervisor of Acid Plant Shift |
14X14 |
- |
- |
4 |
4 |
4 |
4 |
4 |
|
Acid Plant Control Room Specialist |
14X14 |
- |
- |
4 |
4 |
4 |
4 |
4 |
|
Plant Operator and Control Room |
14X14 |
- |
- |
4 |
4 |
4 |
8 |
8 |
|
Plant Operator / Acid Plant Boiler. |
14X14 |
- |
- |
2 |
2 |
2 |
4 |
4 |
|
Equipment Operator Acid Plant. |
14X14 |
- |
- |
4 |
4 |
4 |
8 |
8 |
|
Head Of Electrical Mtce and Instr |
8X6 |
- |
1 |
1 |
1 |
1 |
1 |
1 |
|
Eng. Mtce Automation and Control |
8X6 |
- |
- |
1 |
1 |
1 |
2 |
2 |
|
Sr. Supervisor Electrical and Instr |
14X14 |
- |
- |
2 |
2 |
2 |
2 |
2 |
|
Electrical And Instr Technician |
14X14 |
- |
- |
4 |
4 |
4 |
8 |
8 |
|
Head Of Mechanical Mtce and Planning |
8X6 |
- |
1 |
1 |
1 |
1 |
1 |
1 |
|
Supervisor Sr. Acid Plant Mechanic. |
14X14 |
- |
- |
- |
- |
- |
2 |
2 |
|
Special Technician Acid Plant Mechanic. |
14X14 |
- |
- |
4 |
4 |
4 |
8 |
8 |
Table 14.9: Process Operations & Maintenance Staffing Plan | |||||||||
|---|---|---|---|---|---|---|---|---|---|
PROCESS OPERATIONS STAFFING PLAN |
Schedule |
Pre-Production |
Operation |
||||||
|
Technician/Welder Acid Plant. |
14X14 |
- |
- |
2 |
2 |
2 |
2 |
2 |
|
Acid Plant Planning Engineer |
8X6 |
- |
- |
1 |
1 |
1 |
1 |
1 |
|
Area Total |
|
- |
3 |
36 |
36 |
36 |
58 |
58 |
Metallurgy |
Superintendent Metallurgy and Laboratory |
8X6 |
- |
1 |
1 |
1 |
1 |
1 |
1 |
|
Head Of Metallurgy and Laboratory. |
8X6 |
1 |
1 |
1 |
2 |
2 |
2 |
2 |
|
Metallurgical Engineer |
8X6 |
- |
- |
1 |
2 |
2 |
2 |
2 |
|
Metallurgy Supervisor. |
8X6 |
- |
- |
1 |
2 |
2 |
2 |
2 |
|
Metallurgy Operator |
14X14 |
- |
- |
4 |
8 |
8 |
8 |
8 |
|
Area Total |
|
1 |
2 |
8 |
15 |
15 |
15 |
15 |
Laboratory |
Chemical Laboratory Superintendent |
8X6 |
- |
1 |
1 |
1 |
1 |
1 |
1 |
|
Chemical Laboratory Supervisor. |
8X6 |
- |
1 |
2 |
2 |
2 |
2 |
2 |
|
Laboratory Specialist Chemist |
14X14 |
- |
- |
4 |
4 |
4 |
4 |
4 |
|
Laboratory Operator Chemist |
14X14 |
- |
- |
20 |
20 |
20 |
20 |
20 |
|
Area Total |
|
- |
2 |
27 |
27 |
27 |
27 |
27 |
Operations |
Process Operations Superintendent |
8X6 |
- |
1 |
1 |
1 |
1 |
1 |
1 |
Crushing |
Sr. Crush, Transport & Agglom Supervisor |
14X14 |
- |
- |
4 |
4 |
4 |
4 |
4 |
|
Plant Crush and Stacking Operator |
14X14 |
- |
- |
24 |
24 |
28 |
32 |
32 |
|
Specialist In Crush, Transport and Agglom |
14X14 |
- |
- |
4 |
4 |
4 |
4 |
4 |
Leaching |
Head Of Leaching |
8X6 |
- |
- |
2 |
2 |
2 |
2 |
2 |
|
Leaching Planner |
8X6 |
- |
- |
2 |
2 |
2 |
2 |
2 |
|
Jr. Leaching Supervisor. |
8X6 |
- |
- |
2 |
2 |
2 |
2 |
2 |
SX |
LIX Plant Operators. |
14X14 |
- |
- |
16 |
24 |
24 |
24 |
24 |
|
Supervisor Sr. SX |
8X6 |
- |
- |
- |
2 |
2 |
2 |
2 |
Table 14.9: Process Operations & Maintenance Staffing Plan | |||||||||
|---|---|---|---|---|---|---|---|---|---|
PROCESS OPERATIONS STAFFING PLAN |
Schedule |
Pre-Production |
Operation |
||||||
|
SX Plant Operator. |
14X14 |
- |
- |
- |
12 |
12 |
12 |
12 |
|
Control Room Specialist LIX-SX-EW |
14X14 |
- |
- |
- |
4 |
4 |
4 |
4 |
EW |
Supervisor Sr. EW And Cathode Yard |
8X6 |
- |
- |
- |
2 |
2 |
2 |
2 |
|
EW Plant Operator. |
14X14 |
- |
- |
- |
12 |
12 |
12 |
12 |
Ancillary |
Water Treatment Plant Supervisor |
8X6 |
- |
2 |
2 |
2 |
2 |
2 |
2 |
|
Plant Water Treatment Plant Operator. |
14X14 |
- |
4 |
4 |
4 |
4 |
4 |
4 |
|
Area Total |
|
- |
7 |
61 |
101 |
105 |
109 |
109 |
Process |
Process Maintenance Superintendent |
8X6 |
- |
1 |
1 |
1 |
1 |
1 |
1 |
Maintenance |
Head Of Electrical and Instrumentation. |
8X6 |
- |
1 |
1 |
2 |
2 |
2 |
2 |
|
Sr. Electrical Supervisor |
8X6 |
- |
- |
2 |
2 |
2 |
2 |
2 |
|
Supervisor Jr. Mtce Electrical Process. |
14X14 |
- |
- |
2 |
4 |
4 |
4 |
4 |
|
Electrical Technician Process. |
14X14 |
- |
- |
4 |
8 |
8 |
8 |
8 |
|
Sr. Supervisor Instrumentation and Control |
8X6 |
- |
- |
2 |
2 |
2 |
2 |
2 |
|
Process Control Technician. |
14X14 |
- |
- |
2 |
4 |
4 |
4 |
4 |
|
Head Of Mechanical Maintenance Planning. |
8X6 |
- |
1 |
1 |
2 |
2 |
2 |
2 |
|
Planning Engineering |
8X6 |
- |
- |
2 |
2 |
2 |
2 |
2 |
|
Sr. Mtce Mechanical Supervisor |
8X6 |
- |
- |
2 |
2 |
2 |
2 |
2 |
|
Jr. Mtce Mechanical Supervisor |
14X14 |
- |
- |
2 |
4 |
4 |
4 |
4 |
|
Process Mechanical Technician. |
14X14 |
- |
- |
8 |
12 |
16 |
20 |
20 |
|
Area Total |
|
|
3 |
29 |
45 |
49 |
53 |
53 |
|
STAFFING TOTAL |
|
1 |
18 |
163 |
226 |
234 |
264 |
264 |
PROCESS WATER REQUIREMENTS
Process water requirements for the processing areas is shown in Table 17.10 below. The peak water usage is 417.5 m3/hr (116 L/s).
The heap leach is the most significant water consumer in the processing area and varies with ore throughput to the leach pad. The leaching system requires freshwater make-up to account for ore moisture retention and evaporation losses. Water make-up to heap leach is designed to utilize contact water from the various contact water ponds around the site and mine dewatering pumped to the SX/EW raffinate pond, with fresh water addition as required. Values in Table 14.10 are also net of acid addition and precipitation/snow melt collection in the pad and pond area. The SX/EW bleed requirements are also directed to the raffinate pond and consumed in the leaching process, consequently net water requirements for leaching are reduced.
Table 14.10: Process Fresh Water Annual Consumption by Area | ||||
|---|---|---|---|---|
YEAR |
Leaching |
Acid Plant |
SX/EW |
Total |
m3/hr |
m3/hr |
m3/hr |
m3/hr |
|
-2 |
0.0 |
0 |
0 |
0.0 |
-1 |
85.6 |
12.5 |
12.5 |
110.6 |
1 |
171.2 |
25 |
12.5 |
208.7 |
2 |
256.8 |
25 |
25 |
306.8 |
3 |
342.5 |
25 |
25 |
392.5 |
4 |
342.5 |
50 |
25 |
417.5 |
5 |
342.5 |
50 |
25 |
417.5 |
6 |
342.5 |
50 |
25 |
417.5 |
7 |
342.5 |
50 |
25 |
417.5 |
8 |
342.5 |
50 |
25 |
417.5 |
9 |
342.5 |
50 |
25 |
417.5 |
10 |
342.5 |
50 |
25 |
417.5 |
11 |
342.5 |
50 |
25 |
417.5 |
12 |
342.5 |
50 |
25 |
417.5 |
13 |
342.5 |
50 |
25 |
417.5 |
14 |
342.5 |
50 |
25 |
417.5 |
Table 14.10: Process Fresh Water Annual Consumption by Area | ||||
|---|---|---|---|---|
YEAR |
Leaching |
Acid Plant |
SX/EW |
Total |
m3/hr |
m3/hr |
m3/hr |
m3/hr |
|
15 |
342.5 |
50 |
25 |
417.5 |
16 |
342.5 |
50 |
25 |
417.5 |
17 |
342.5 |
50 |
25 |
417.5 |
18 |
342.5 |
50 |
25 |
417.5 |
19 |
342.5 |
50 |
25 |
417.5 |
20 |
342.5 |
50 |
25 |
417.5 |
21 |
329.1 |
50 |
25 |
404.1 |
22 |
60.0 |
25 |
25 |
110.0 |
23 |
40.0 |
0 |
12.5 |
52.5 |
PROCESS POWER REQUIREMENTS
Processing Power Requirements
Process power requirements for crushing, leaching, acid plant and SX/EW plant are shown in Table 14.11 below. The electrowinning area is the most significant power consumer and varies with copper produced. Waste heat from the acid plant is used to generate power. Excess power is transmitted to the site distribution network for use where required.
Table 14.11: Processing Areas Annual Power Demand & Consumption | ||||||
|---|---|---|---|---|---|---|
YEAR |
Demand MW |
Consumption MWh |
||||
Processing |
Co-Gen* |
Total |
Processing |
Co-Gen* |
Total |
|
-2 |
0.0 |
0.0 |
0.0 |
0 |
0 |
0 |
-1 |
23.5 |
(3.4) |
20.1 |
171,348 |
(25,420) |
145,928 |
1 |
111.0 |
(13.6) |
97.4 |
786,705 |
(14,187) |
772,518 |
2 |
117.2 |
(13.6) |
103.6 |
924,841 |
(57,045) |
867,796 |
3 |
117.3 |
(13.6) |
103.7 |
881,187 |
(194,778) |
686,409 |
4 |
135.0 |
(27.2) |
107.8 |
853,603 |
(122,076) |
731,527 |
5 |
130.0 |
(27.2) |
102.8 |
851,224 |
(129,346) |
721,878 |
6 |
129.9 |
(27.2) |
102.7 |
793,568 |
(129,763) |
663,805 |
7 |
120.6 |
(27.2) |
93.4 |
803,704 |
(139,871) |
663,833 |
8 |
122.3 |
(27.2) |
95.1 |
825,461 |
(138,094) |
687,367 |
9 |
125.9 |
(27.2) |
98.7 |
884,203 |
(134,280) |
749,923 |
10 |
134.2 |
(27.2) |
107.0 |
857,921 |
(135,270) |
722,651 |
11 |
129.8 |
(27.2) |
102.6 |
791,423 |
(139,855) |
651,568 |
12 |
118.6 |
(27.2) |
91.4 |
772,940 |
(151,454) |
621,486 |
13 |
115.5 |
(27.2) |
88.3 |
752,444 |
(154,677) |
597,767 |
14 |
111.8 |
(27.2) |
84.6 |
779,667 |
(158,252) |
621,415 |
15 |
116.0 |
(27.2) |
88.8 |
748,877 |
(153,504) |
595,373 |
16 |
110.6 |
(27.2) |
83.4 |
784,622 |
(158,875) |
625,747 |
17 |
116.3 |
(27.2) |
89.1 |
812,919 |
(152,640) |
660,279 |
18 |
121.0 |
(27.2) |
93.8 |
794,092 |
(147,704) |
646,388 |
19 |
117.8 |
(27.2) |
90.6 |
770,574 |
(150,988) |
619,586 |
20 |
113.9 |
(27.2) |
86.7 |
691,064 |
(155,090) |
535,974 |
21 |
101.7 |
(27.2) |
74.5 |
98,265 |
(160,647) |
(62,382) |
Table 14.11: Processing Areas Annual Power Demand & Consumption | ||||||
|---|---|---|---|---|---|---|
YEAR |
Demand MW |
Consumption MWh |
||||
Processing |
Co-Gen* |
Total |
Processing |
Co-Gen* |
Total |
|
22 |
12.3 |
0.0 |
12.3 |
54,600 |
0 |
54,600 |
23 |
6.0 |
0.0 |
6.0 |
0 |
0 |
0 |
*Note: Co-Generation from acid plant waste heat recovery
Emergency Power
Backup 20 MW diesel generators ensure critical systems, primarily raffinate leach solution recirculation, and occupied buildings and offices remain operational. Diesel fuel storage for up to 72 hours is maintained on site, which can be extended with mining equipment fuel rationing or cessation.
The electrowinning rectifiers are equipped with trickle power diesel generators to maintain circuit polarity during short term outages. Longer term outages greater than 8 hours without re-fueling would require circuit shutdowns and electrode isolation.
The camp area has installed emergency diesel power generation for that area to assure occupied facilities, and human requirements are maintained in outages.
adequacy statement ON SECTION 14
The QP believes the design criteria, processing methodology, facilities and equipment selections and descriptions of the processing areas are appropriate and consistent with other similar current operations and studies for similar projects. Given the mature and commercially proven nature of the processing technologies considered, large scale piloting is not deemed to be meaningful or necessary.
Equipment selections are based on vendor proposals/consultations and appropriate process modeling. The information is suitable for use in establishing reasonable prospects for eventual economic extraction for the Mineral Reserves and Resources considered, the mine plans, cost estimates and financial analysis included in this Report.
infrastructure
introduction
The Los Azules Project is in San Juan Province, Argentina, in a remote, mountainous region of the Andes, at an elevation of approximately 3,600 meters above sea level (mASL). Given its isolated location, the development of infrastructure is critical for successful project execution.
This section covers key infrastructure components, including:
Access to Los Azules and Transportation (Road Networks & Logistics)
Power Supply to Los Azules (YPF Luz)
Mine Rock Storage Facility (MRSF), Low-grade Ore Stockpile, and Primary Ore Stockpile (KP)
Camp Facilities (by McLennan Design)
Water Supply (B&W)
Heap Leach Pad (KP)
Regional Connectivity and Infrastructure
The nearest major supply and service hub is Mendoza, located 275 km by road from Calingasta (Figure 15.1). Mendoza Serves as a logistic center for fuel, sulfur and industrial materials, and hosts Argentina’s largest international airport in the region (MDZ). The city also houses YPF’s Luján de Cuyo refinery, which processes 113,200 barrels per day of crude oil, including desulfuration and fuel production relevant for mining operations.
Other important regional centers include:
San Juan (UAQ): The provincial capital, a secondary regional airport and mining support hub.
Santiago, Chile: Located 270 km southwest (400 km by road from Calingasta), a key trade and transport link to Chilean ports.
The Los Azules project requires robust transport infrastructure for the movement of materials, equipment and final product (copper cathodes). The project’s export options include both Argentine and Chilean Ports:
Argentine Inland Port: Rosario (via road or rail transport through the Cañada Honda depot in San Juan)
Chilean Seaports: Valparaiso, Ventanas, San Antonio and Coquimbo in Chile.

Figure 15.1: Regional Infrastructure (Google 2025)

Figure 15.2: Overall Site Layout (SE 2025)
Logistics for Copper Cathode Transport
Copper cathodes will be transported south via RP 149 to Uspallata, and then to Chile over RN 7 towards one of the three major ports. The distances from RN 149-RN 153 junction (near Barreal) to these ports are:
Ventanas: 380 km
Valparaíso: 410 km
San Antonio: 440 km
Most of this distance is paved, except for 37 km of gravel road on RN 149 in Mendoza Province. This segment is passable year-round, and there is a high likelihood that it will be paved before the project is fully developed.
access to los azules
The Los Azules Project currently has two existing access roads.
Primary Access – Exploration Road: the main site access, upgraded for larger vehicles, but limited to seasonal use at present.
Secondary Access – Southern Road: a longer but lower-altitude alternative route, identified for year-round operations and requiring upgrades for operational logistics.
The Exploration Road will be upgraded further to allow for construction and operations use. Three Sections have been developed to allow concurrent improvement. Section 3 of the road follows a new route to avoid high mountain passes and glaciers along the current path.
Figure 15.3 provides an overview of the access routes and regional infrastructure.

Figure 15.3: Existing Access & Infrastructure (ACMSA, 2022)
Existing Access Roads
Los Azules Road (Main Site Access via Exploration Road)
This is the main access route, connecting Calingasta to the Project site via a 124 km gravel road. The Project is currently accessed from San Juan via National Route (RN) 40 for 58 km, turning west on Provincial Route (RP) 436, and continuing west along National Route (RN 149) to Calingasta. From there, the Exploration Road leads to the project site, crossing eight rivers and two high-altitude mountain passes, La Totora high pass (4,170 mASL) and Cabeza de Leon High Pass (4,300 mASL) before arriving at the Project location at 3,390 mASL.
The road follows the Calingasta and Frio River valleys, providing direct but challenging access to the project site. Due to its high elevation, switchbacks and exposure to extreme weather, access is limited to seasonal use.
In 2022-2023, upgrades were made to accommodate larger vehicle traffic, improving safety and efficiency. However, the route remains vulnerable to snowfall and weather disruptions, limited its suitability for year-round logistics. This road will continue to be maintained to provide seasonal site access for exploration, powerline infrastructure and emergency response, while a longer but more stable route will be used for continuous operations. Photos of the existing access are shown in Figure 15.4.


|
|
Figure 15.4: Existing Access Road Photos (McEwen, 2023)
Southern Road (Alternative, Year-Round Route)
The Southern Road is a longer alternative route (192 km from Barreal), that follows Provincial Routes 400 and 402 before reaching the project site. It runs through a lower elevation corridor, avoiding the extreme high-altitude passes of the Exploration Road, and making it more suitable as an alternate emergency route for emergency operations needs and critical materials and supplies.
Future Access Road
A new access route has been designed to further optimize transportation logistics and replacing the Northern Road project from the 2023 IA. This future road will integrate:
Existing provincial roads
Upgraded mining roads
New road sections
The road begins at Provincial Route No. 12 (RP12), located north of Calingasta, and bypasses the urban area to minimize local traffic impact. It then extends westward, crossing the Los Patos River and navigating through rolling terrain before reaching a complex section where it shifts south, crosses the Calingasta River, and resumes in an east-west direction until reaching the former La Alumbrera mine. This section, approximately 35 km long, is part of the public road network.
Beyond La Alumbrera, the road transitions into a private mining access road that continues through the rugged mountainous terrain of the Calingasta department. The route follows the Calingasta River valley, navigating steep slopes with active rockfall zones. To ensure safe passage, the road elevation remains above flood levels while alternating between riverbanks based on geological and design constraints.
The highest point of the route is near La Totora Pass (4,170 mASL), where a series of switchbacks will facilitate altitude gain. The road then descends along the Cerrado River valley before reaching the confluence of the Valle Hermoso and Cerrado rivers. From this point, it turns northwest, following the Valle Hermoso River, with additional switchbacks before finally turning southwest to connect with the internal mine road.
The road is optimized for mining logistic and heavy transport, and designed with geotechnical stability and drainage infrastructure, compliant with Argentine and international road safety standards.
Figure 15.5 shows the planned Future Access Road Alignment.
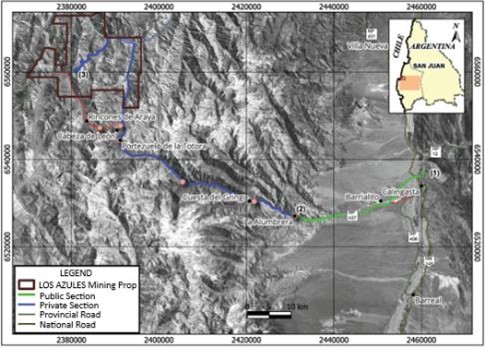
Figure 15.5: Future Access Road (McEwen, 2025)
POWER SUPPLY TO LOS AZULES
Power will be supplied from the Argentinian grid via the Calingasta Transformer Station (ET Calingasta) 500/220/132 kV. A double-circuit 220 kV overhead transmission line will extend 122 km long from ET Calingasta to the Los Azules Substation (ET Los Azules) 220/24.9 kV. At high altitudes, overhead transmission lines must be designed for a higher nominal voltage than their operating level (e.g., a 500 kV line operated at 220 kV). The reduced air density at elevation lowers the dielectric strength of air, increasing the risk of electrical breakdown. To mitigate this, phase-to-phase distances must be increased, which in turn raises the line reactance. Consequently, voltage drop becomes a critical design factor.
Initially, the project will require approximately 39/36 MW (gross/net demand), in year -1, increasing to a peak of 157/129 MW (gross/net demand) in year 10 as the processing facilities are expanded and mine power requirements increase over time.
System design considers gross demand; net load includes acid plant generation capability. The net calculated load over time, and co-generation from the acid plant waste heat turbines is shown in Figure 15.6. The calculated energy consumption for the project by major area is shown in Figure 15.7.

Figure 15.6: Calculated load over time. (SE 2025)

Figure 15.7: Annual Energy Consumption by Area (MWh) (SE 2025)
YPF Luz will expand the existing ET Rodeo 500/132 kV substation to interconnect with the 500 kV Rodeo-Calingasta transmission line, which currently operates at 132 kV but was originally designed for 500 kV. Figure 15.8 shows the regional infrastructure for electric power transmission to the Los Azules site and upgrades.

Figure 15.8: Regional Power Infrastructure and Proposed Upgrades/Construction (McEwen 2025)
The engineering phase for power supply infrastructure is ongoing. Power infrastructure will comply with Argentine (IRAM, IEC) and international electric standards. Engineering accounts for seismic risk, high-altitude conditions up to 4200 mASL, and extreme temperatures. The Environmental Impact Assessment (IIA) includes studies for electromagnetic field exposure, transmission corridor impact, and mitigation strategies. Permitting and regulatory approvals are in progress, with the need for a Sectorial Environmental Permit before construction begins.
YPF Luz and McEwen Copper completed a Memorandum of Understanding (MOU) outlining the intended terms to provide power for the Los Azules Project (YPF Luz, 2024). A rate of $0.064/kWh based on a minimum 15-year term is considered in this Feasibility Study based on the terms of this agreement reached in May 2025.
The MOU with YPF Luz also includes the installation of the sub-station at Calingasta and transmission line to the site. The investment cost recovery scheme has been agreed between YPF Luz and McEwen Copper in May 2025.
Backup power will be supplied to offices, camps, and transport systems within the Heap Leach Pad and Electrowinning circuit, as required to support area loads. There will be distributed backup generation at each project location as required.
Additionally, the on-site sulfuric acid plants will be outfitted with a steam cogeneration power plant for electricity generation from the heat and off-gasses. This will provide approximately 20% of the site requirements during operation. Two steam turbines will provide self-generation capacity of 13.1 MW each.
MINE ROCK STORAGE FACILITIES, LOW-GRADE STOCKPILE, AND PRIMARY MATERIAL STOCKPILE
Introduction
The Mine Rock Storage Facilities (MRSF) at Los Azules include the Northeast and South MRSF. The South MRSF is primarily designed to store pit overburden, while the Northeast MRSF will accommodate excess overburden and mined waste rock.
The low-grade ore stockpile will temporarily store low-grade copper ore, which will be processed when pit extraction does not meet plant feed requirements.
The Primary Material stockpile will hold ore designated for potential processing using a conventional mill or Nuton® Technology. If Nuton tests prove unviable, this stockpile will require management during mine closure.
The locations of the MRSFs and stockpiles were selected based on the mine layout, haulage distances, natural slope confinement, cryogenic geoforms, and offsets from critical infrastructure. No additional storage capacity expansions are planned unless future resource upgrades necessitate adjustments.
Between 2022 and 2025, Knight Piésold (KP) conducted geotechnical investigations to support the Feasibility Study (FS) level design, including field investigation and laboratory testing, borrow source characterization, and geotechnical reporting.
Design Criteria
KP developed key design parameters for the MRSFs and stockpiles (1029ENG-FS-0200-E00-DBD-0001, 2024), summarized in Table 15.1 below.
Table 15.1: MRSF’s and Stockpiles Design Parameters | |||||
|---|---|---|---|---|---|
Parameter |
Unit |
Northeast MRSF |
South MRSF |
Low-grade Ore Stockpile |
Primary Material Stockpile |
Storage Capacity |
m³ x 1.000 |
1.020000 |
123.400 |
28.03 |
185.952 |
Stacking Height |
m |
340 |
160 |
80 |
170 |
Local Slope |
H:1V |
1,42 |
1,73 |
1,42 |
1,42 |
Global Slope |
H:1V |
2,60 |
3,00 |
2,00 |
2,00 |
Bench Width |
m |
35,0 |
17,5 |
8,5 |
17,0 |
Lifts Height |
m |
30,0 |
15,0 |
15,0 |
30,0 |
Maximum Design Earthquake (MDE) return period/PGA |
years/g |
475/0,46 |
|||
Design Storm Recurrence Time |
years |
50 |
|||
Design Storm Duration |
h |
24 |
|||
Design Storm Precipitation |
mm |
57 |
|||
Hazard Classification
The Northeast MRSF is classified as a high-hazard facility mainly due to its greater height, while the South MRSF, Low-grade Ore Stockpile and Primary Material Stockpile are classified as moderate-hazard facilities, following the Guidelines for Mine Waste Dump and Stockpile Design (Hawley and Cunning, 2017).
Engineering Analyses
The stabilities of the MRSFs and stockpiles were assessed using limit equilibrium methods (static and pseudo-static) to evaluate overall slope stability under operational conditions. These analyses incorporated site-specific geotechnical data, including foundation conditions, seismic loading, and material strength parameters. The results confirm that all facilities meet FS-level stability criteria for long-term performance under international best practices.
Water management
The water management systems separate non-contact (surface runoff) from contact water (seepage water):
Non-contact water management
Perimeter Diversion Channels: Direct surface runoff to designated discharge points.
Contact water management
Underdrain systems: Collect seepage and subsurface flow via 200mm-450mm perforated double-walled HDPE pipes installed in aggregate-filled trenches.
Collection ponds: Store contact water collected from the underdrain system at the foot of the dumps and stockpiles.
Monitoring System
A monitoring and management program will ensure design compliance and operational safety. This system includes:
Visual inspections of stability and drainage performance.
Topographic monitoring with control points on and off the stacks to detect potential displacements or settlements.
Piezometers to monitor groundwater levels.
camp facilities
This subsection was prepared by Jason F. McLennan of McLennan Design, a Perkins & Will subsidiary.
Los Azules Master Plan
The current camp design for the initial camp is located adjacent to the existing 156 Camp site and was developed by McEwen Copper and Modular Homes as a baseline to be included in the Feasibility Study for the Los Azules project. The initial camp design includes construction sequencing and phasing to accommodate the required camp program and need for available beds, a proposed site layout, and a basis of estimate.
McLennan Design developed an overall master plan concept for the Los Azules mine (Figure 15.9). Following the completion of the feasibility study, alternate site locations and architectural modifications for the initial camp design will be evaluated in accordance with the master plan.

Figure 15.9: Los Azules Master Plan referencing an alternate camp location (McLennan 2025)
The master plan identified placement of the initial camp adjacent to the mine processing facilities and nearer to the Regenerative Camp location. The initial camp is designed as a campus supporting the Los Azules mine early works, construction activities, and eventual mining operations and logistics. The initial camp is named the Construction, Training and Logistics (CTL) Campus. The CTL Campus is described as follows:
Construction, Training, and Logistics (CTL) Campus
The Los Azules Project would initially rely on the existing modular 156 camp and additional phased modular camp facilities for eventual accommodation of up to 3,048 workers at a peak capacity in 2028.
The phased modular camp has been designed to optimize an efficient camp layout supporting the required number of beds and daily operations and logistics, providing an enhanced campus environment while improving living and working conditions for the construction and mine workers. The proposed concept will create a campus environment that will strengthen the McEwen Copper brand and position in the mining industry as a highly desirable place to work.

Figure 15.10: CTL Camp Exterior Perspective (McLennan 2025)
This modular CTL camp facility will consist of typical living units fabricated and delivered to the Los Azules site by a local manufacturer. It will be built in phases that correspond to workforce needs at the mine site.
Key amenities and facilities include:
Wind-protected courtyards supporting outdoor dining, recreation, and lounge spaces (Figure 15.11)
Social and recreation spaces along Main Street to foster engagement.
Sport court, dining hall, medical clinic, and security offices at the camp’s center.
Transport hubs at both ends for workers’ shuttles.
The new worker intake and orientation center is linked to the security office.

Figure 15.11: CTL Camp Courtyard Perspective (McLennan 2025)
CTL Camp Regenerative Design Goals. The CTL camp integrates energy-efficient systems, including:
High-performance windows, insulation, air sealing, and energy-efficient HVAC.
Extensive use of daylight, providing passive heating and nature views.
Solar panels on the roof for energy resiliency.
Water conservation, recycling, and waste management to meet regenerative design principles (Figure 15.12).

Figure 15.12: Section through CTL Camp ‘Main Street’ showing Passive and Active Energy and Water Treatment Systems (McLennan 2025)
Permanent Regenerative Camp
McEwen Copper has envisioned reinventing the copper mining industry, rethinking the copper mine and the processes, technologies, and equipment that produce copper cathodes.
The Regenerative Camp will be located high in the Andes Mountains and will be unlike any other workforce mining camp worldwide. This groundbreaking camp is designed to create the world's healthiest and most sustainable mining community, completely transforming the experience of the workers who live and work in remote mining locations. The camp experience consists of an entire village placed within a large biosphere as a closed ecological system to support and maintain human life. The biosphere will offer a comfortable environment within a microclimate that provides relief and respite for all that will live there. During winter seasons, the camp will support a near-tropical indoor environment, filled with greenery and plants to produce food, providing shelter and comfort when outside temperatures may be harsh and inhospitable. Camp inhabitants will be safe and supported by resiliency, uninterruptible power, water, and life support systems.
The regenerative camp is designed around the ‘sacred’ arc of the sun and is oriented to maximize solar exposure (Figure 15.13).
In addition, the specific layout and orientation have been selected to support passive design and solar energy generation, which are key considerations. The selected site is located near the operations, at an elevation of 3,400 meters. The camp conforms to the north slope of a valley, to ensure full sun exposure out of the shadow of other mountain peaks for most daylight hours. Being located on the other side of a ridge from mining operations will minimize sound, vibrations, and dust, thereby improving the workers’ comfort and safety.

Figure 15.13: Aerial Rendering representing CTL Campus and Regenerative Camp (McLennan 2025)

Figure 15.14: Regenerative Camp Rendering (McLennan 2025)
Passive and Renewable Energy Strategies. The Regenerative Camp is designed for energy efficiency and resilience, incorporating:
Passive solar heating, natural ventilation, earth tubes, stack ventilation, and thermal mass materials for climate control.
Super-insulated walls and airtight assemblies for high thermal performance.
On-site solar for net positive energy generation, integrating photovoltaic panels into the roof structure.
Battery energy storage systems to stabilize the microgrid and support net positive energy generation.
Off-grid resilience with 100% renewable energy from EPSE and YPF.
Electric microgrid serving the mine and camp, ensuring energy self-sufficiency while connecting to an external renewable grid for redundancy.
“Living Future” certification alignment (www.Living-Future.org) with net-positive energy goals.
Figure 15.15: Regenerative Camp Roof Plan indicating solar panels (McLennan 2025)
Material and Waste Management
The camp follows “Leave No Trace” principles, prioritizing:
Biodegradable and reusable materials.
Minimization of toxic construction materials.
Large span structural systems to reduce material use.
Disassembly and reusability at end-of-life to eliminate landfill waste.
Operational carbon analysis to measure global warming potential over the life of the facilities.
Greenhouses and additional spaces for growing food in a self-sustaining environment.
Waste-to-energy solution for organic waste processing.

Figure 15.16: Regenerative Camp Central Town Hall: Dining, Amenities, Services, and Offices (McLennan 2025)
Sanitary Wastewater Treatment. The camp’s water system integrates:
Rainwater and snowmelt capture for non-potable water supply.
On-site treatment and reuse using natural filtration systems and constructed wetlands.
Membrane bioreactor (MBR) to clarify and disinfect reclaimed water for flushing toilets in the camp.
“Living Future” certification alignment (www.living-future.org) with net-positive water goals.
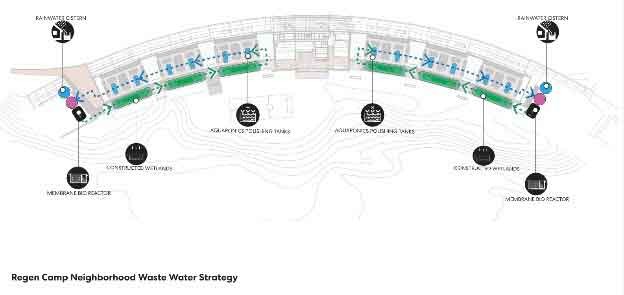
Figure 15.17: Regenerative Camp Wastewater Diagram (McLennan 2025)
Camp Demographics and Operations
To accommodate long-term staff demands, the permanent Regenerative Camp is designed for scalability and can be configured to house 1,500-1,700 employees and visitors in six neighborhood groupings organized in a linear fashion within the facility. Creating camp conditions that are exceptional will reduce absenteeism and help McEwen Copper maintain a productive, happy, and engaged workforce where jobs are coveted and retention high.
The current concept plan for the regenerative mine camp includes six individual camp neighborhoods consisting of 274 beds (124 double rooms and 26 VIP rooms) for each section.
In addition to the regular shift workforce, the camp can expect to receive frequent visitors, including Specialists, executives, and suppliers, who will be residing within the camp as well. Future estimates on visitor counts will determine the number of surplus accommodations being designed for both flex accommodation as well as visitors who wish to experience a once in a lifetime location.
The layout will facilitate operational flexibility, incorporating dedicated housing not only for employees, but also for contractors, specialists, and visitors. The projected camp staffing requirements are detailed in Table 15.2.
Table 15.2: Projected Camp Operations Staffing Requirements | ||
|---|---|---|
Site Camp Planning | ||
|
Initial |
Ultimate |
Table 15.2: Projected Camp Operations Staffing Requirements | ||
|---|---|---|
Site Camp Planning | ||
Mine |
248 |
1105 |
Process |
106 |
218 |
G&A Site Staff |
67 |
107 |
Contractors |
380 |
150 |
Camp Ops/Services |
94 |
560 |
Visitors/Executive |
40 |
50 |
Spares |
28 |
50 |
Total Rooms |
963 |
2240 |
Outdoor amenities include:
Sports field and lounges to support physical activity and relaxation (Figure 15.18).
Green spaces with self-sustaining food production.

Figure 15.18: Regenerative Camp exterior rendering (McLennan 2025)
Construction Timeline: The permanent camp will be phased in after the first years of operation. Further engineering and planning will refine the timing, specifications, ensuring alignment with safety, efficiency, and environmental regulations. Costs are not currently included in the sustaining capital.
IT AND OT COMMUNICATIONS INFRASTRUCTURE
As part of its commitment to become a global benchmark in sustainable and efficient copper mining, the Los Azules Project integrates a robust, secure, and high-availability digital infrastructure designed to support autonomous operations, reduce environmental impact, and enable data-driven decision-making across the value chain. At the core of this digital transformation is a secure IT/OT architecture built on segregated network domains, leveraging a multi-site SD-WAN fabric with clustered firewalls that ensure encrypted, resilient, and policy-based traffic management across critical mining systems. This design enables both on-site and remote connectivity, minimizing latency while ensuring cybersecurity compliance and industrial safety. A centralized Integrated Remote Operations Center (iROC) located in San Juan will serve as the brain of the mine, orchestrating remote drilling, autonomous hauling (AHS), plant operations, and real-time decision support. This strategic location facilitates talent retention, operational resilience, and effective oversight while reducing the need for permanent site-based staff. Connectivity is underpinned by a multi-tiered telecommunications backhaul, featuring:
A high-capacity fiber optic link buried alongside the access road.
An optical ground wire (OPGW) is deployed along the off-site power transmission line.
A microwave last-resort link shared with the Digital Mobile Radio (DMR) system to ensure operational continuity under failure conditions.
A dedicated DMR network provides geo-positioned voice communications across the access road and operational zones to enable real-time coordination and safety of mobile equipment and personnel. Furthermore, the mine will be supported by a private mission-critical LTE network, designed to deliver low-latency, high-bandwidth wireless coverage for AHS fleets, remote operations, video surveillance, and IoT sensors. This network forms the backbone of mobile data services, supporting automation, telemetry, and predictive maintenance. Site-level backhauling is implemented within the site using ADSS (All-Dielectric Self-Supporting) fiber along distribution power lines, providing robust intra-site communication between key processing and services areas. High-availability computing and data processing are ensured by three distributed data centers: one at the Process Plant, one at the Technical Services/Truck shop area, and a third within the iROC in San Juan. These data centers are designed for redundancy, load balancing, and disaster recovery, enabling uninterrupted operations and supporting the real-time demands of an intelligent, connected mining environment. This integrated digital infrastructure is not merely a technical backbone; it is a strategic enabler of operational excellence, sustainability, and resilience, directly aligned with the project’s regenerative design philosophy and its ambition to lead the next generation of copper mining.
Transportation
Transportation for employees between worksite locations at Los Azules will be provided by buses and light vehicles. During the construction phase, designated lunchroom facilities will be established at major work areas, with some employees having lunch on board mobile equipment as necessary.
For shift rotations, employees will travel between Los Azules and San Juan via bus service. This will be the primary mode of transport, ensuring a safe and reliable connection to regional infrastructure. Light vehicles will be available for management and operational personnel as required.
The proposed airstrip has been removed from the current project phase and is not part of the feasibility study. The project will rely on ground transportation for workforce movement, supplies, and emergency response. Future evaluations may assess alternative transport options, including fly-in-fly-out logistics, based on operational needs and economic feasibility. However, at this stage, the transportation plan prioritizes road-based solutions to ensure cost efficiency and logistical reliability for both construction and operations.
Water Consumption
Surface water is available on the property in adequate amounts for McEwen’s exploration activities. Numerical simulations conducted by BW indicate that by the beginning of year 5, operational water demand will reach 108 l/s, while mine dewatering is expected to supply 116 l/s. From that point until the year 28, the dewatering supply will gradually decline from 100 l/s to 64 l/s, eventually becoming insufficient to meet operational needs. Additional water will be sourced from groundwater reserves in the Rio de las Salinas and Embarrada sub-basins to compensate.
Net water consumption considers averaged annual precipitation expectations, available capture areas, evaporation losses and heap leach moisture retention. Key assumptions used in estimating water usages are shown in Table 15.3.
Table 15.3: Key Assumptions for Water Usage Estimates | |||
|---|---|---|---|
Water Assumptions |
Units |
Value |
Source |
Pond Area |
m2 |
219,632 |
Knight Piésold Design |
Minimum Annual Rainfall |
mm/year |
95 |
BW, 2024 Report |
Maximum Annual Rainfall |
mm/year |
500 |
BW, 2024 Report |
Irrigation Rate |
L/h/m2 |
6 |
Average |
Leach Material Feed Moisture |
% |
3% |
Average |
Terminal Moisture |
% |
9% |
FS Testwork estimate |
Irrigation Rate Losses - Losses, plant, etc. |
% |
1% |
Assumption |
Table 15.3: Key Assumptions for Water Usage Estimates | |||
|---|---|---|---|
Water Assumptions |
Units |
Value |
Source |
Evaporation Rate |
mm/year |
1,293.7 |
BW, 2024 Report |
Mine Dust Control |
L/s |
33.0 |
From AGP - averaged over the entire year |
Peak Site Water Use |
L/s |
244.2 |
|
Human Use |
L/s |
17.2 |
|
The estimated net water consumption for the project by usage source is presented in Figure 15.19 below.

Figure 15.19: Annual Water Consumption by Major Consumer (M3/hr) (KP 2025)
water supply
Supply from Dewatering
Numerical simulations to date indicate that the water supply from dewatering will cover the water process requirements only the initial years of mine operation. Thereafter, the water from dewatering will be supplemented with the groundwater from the Rio De las Salinas and Embarrada sub-basins
Groundwater
The water needed for the camp and administration offices, during both construction and operation, will be sourced from groundwater in the complementary supply areas of Embarrada and Salinas, which are currently in advanced stages of exploration. For the process plant, these areas will serve as backup after the initial stages of major dewatering activities. Figure 15.20 illustrates the location of these groundwater extraction sites in relation to key mining facilities.

Figure 15.20: Groundwater water supply sites (BW 2025)
Rio de las Salinas River Aquifer
The Río de las Salinas aquifer is located downstream of the Rio Salinas basin at the southwest end of the mining property. Its potential as a freshwater source was identified through a 2 km geophysical survey using Electrical Tomography (ET) and confirmed by drilling a pumping well with an associated observation well.
ET results indicate resistivities ranging from 9 to 575 Ω.m up to a depth of 80 m, suggesting the presence of a granular aquifer (Figure 15.21).

Figure 15.21: Electrical Tomography at the Río de las Salinas sub-basin. (BW 2025)
Two wells, DWT-OVB-3 and OBS-DWT-OVB-3, were drilled to a depth of 80 m, confirming poorly sorted sediments ranging from silts to coarse gravels. A five-day pumping test (January 12-17, 2025), was conducted at a constant discharge rate of 13 m³/h with recovery recorded for 24 hours. The static water level before pumping was fully restored 90 minutes after stopping the pump.
Table 15.4 presents the estimated hydraulic parameters for this aquifer.
Table 15.4. Hydraulic parameters estimated for DWT-OVB-3 at the Rio de las Salinas aquifer | |||||||||
Hole ID |
Distance to Pumping Well (m) |
Static Level (m) |
Flow Rate (m3/h) |
Pumping time (hr) |
Maximum Drawdown (m) |
Transmissivit (m2/d) |
Hydraulic Conductivity K (m/d) |
Specific Yield Sy (%) |
Analysis Method |
DWT-OVB-3 |
0 |
3.85 |
13 |
120 |
3.32 |
117 |
1.80 |
9.80E-03 |
Theis Recovery/Logan |
DWT-OVB-3 |
0 |
3.85 |
13 |
120 |
3.32 |
114 |
1.75 |
Logan |
|
OBS-OBV-3 |
15 |
3.9 |
- |
- |
1.2 |
178 |
2.74 |
Newman |
Field measurements Indicate slightly alkaline water (Ph 7.6 - 7.8) with electrical conductivity (EC) values ranging from 330 to 370 µS/cm.
Embarrada Aquifer
The Embarrada aquifer is located within the La Embarrada sub-basin. Its potential as a freshwater source was identified through a 2.27 km geophysical survey using ET and confirmed by drilling a pumping well with an associated observation well.
ET results indicate resistivities ranging from 95 to 450 Ω.m. Drilling confirmed the presence of a granular aquifer extending up to 35 m, overlaying a highly fractured aquifer, which does not exhibit significant resistivity variation (Figure 15.22).

Figure 15.22: Electrical Tomography at the Embarrada sub-basin. (BW 2025)
Two wells DWT-OVB-5 and OBS-DWT-OVB-5 were drilled to 70 m, revealing poorly sorted sediments ranging from sandy silts to coarse gravels for the first 35 m, underlain by fractured vulcanite. A 113-hour pumping test was conducted from January 28 to February 3rd, 2025, at a constant discharge rate of 14.8 m³/h, with recovery recorded for 24 hours.
The hydraulic parameters estimated for this zone are shown in Table 15.5.
Table 15.5: Hydraulic parameters for DWT-OVB-5 at the Embarrada aquifer | |||||||||
Hole ID |
Distance to pumping well (m) |
Static Level (m) |
Flow Rate (m3/h) |
Pumping time (hr) |
Maximum Drawdown (m) |
Transmissivity (m2/d) |
Hydraulic Conductivity K (m/d) |
Specific Yield Sy (%) |
Analysis Method |
DWT-OVB-5 |
0 |
9.05 |
14.8 |
113 |
1.09 |
946 |
22.3 |
3.2E-02 |
Theis Recovery |
DWT-OVB-5 |
0 |
9.05 |
- |
113 |
1.09 |
397 |
9.3 |
Logan |
|
OBS-OVB-MW-5 |
13 |
9.63 |
- |
- |
0.51 |
411 |
9.7 |
Newman |
|
Field measurements indicate pH values between 6.6 and 7.0, with EC ranging from 145 and 307 µS/cm.
Atutía Aquifer
The Atutía aquifer is located along Atutía river, within the Rio Castaño-basin. Its potential as a freshwater source was through a 1.6 km ET survey and confirmed by drilling of a pumping well with an associated observation well.
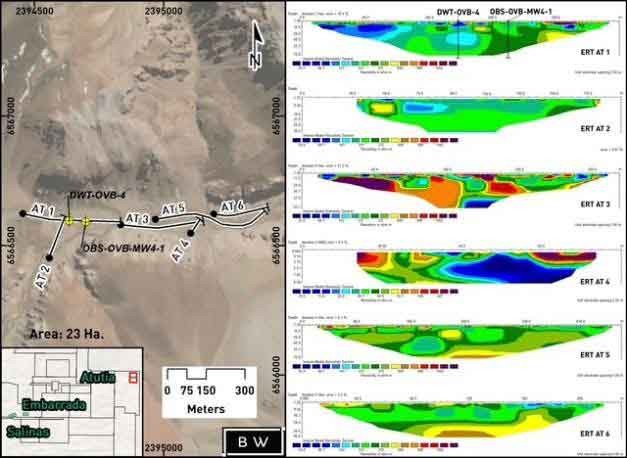
Figure 15.23: Electrical Tomographies at the Atutia River within the Río Castaño basin. (BW 2025)
Two wells DWT-OVB-4 y OBS-OVB-MW-4_1 were drilled to 80 m, confirming the presence of sediments ranging from sand to coarse gravels, with minor fine sediments. The bedrock was not reached. The ET results indicate maximum resistivities of 300 Ω.m and 370 Ω.m, respectively, at the selected locations (Figure 15.23).
The two pumping tests were conducted between January 5-8. 2025, lasting 12 and 29 hours, respectively. The static level was fully recovered within five hours after pumping stopped.
Table 15.6 presents the estimated hydraulic parameters for this aquifer.
Table 15.6: Hydraulic parameters estimated for OBS-OVB-MW-4_1 at the Atutia aquifer. | |||||||||
Hole ID |
Distance to Pumping well (m) |
Static Level (m) |
Flow Rate (m3/h) |
Pumping time (Hrs) |
Maximum Drawdown (m) |
Transmissivity (m2/d) |
Hydraulic Conductivity K (m/d) |
Specific Yield Sy (%) |
Analysis Method |
OBS-OVB-MW-4_1 |
0 |
8.54 |
|
13 |
14.14 |
14.5 |
0.18 |
3.47E-02 |
Theis Recovery |
OBS-OVB-MW-4_1 |
0 |
9.15 |
13 |
29 |
15.2 |
16.5 |
0.21 |
Theis Recovery |
|
DWT-OVB-4 |
60 |
8.80 |
- |
- |
3.69 |
11.4 |
0.14 |
Newman |
|
DWT-OVB-4 |
60 |
10.89 |
- |
- |
1.65 |
79.7 |
1.00 |
Newman |
Field measurements indicate slightly alkaline water (pH 7.5-7.8), with EC ranging from 780 and 820 µS/cm.
Key findings on Groundwater Supply Sustainability
A theoretical assessment of the sustainability of groundwater supply from the three aquifers was conducted using the Jacob derivative of Theis to estimate the long-term drawdown and the Sichartdt formula to determine the influience radius of each well.
Salinas aquifer: Sustainable extraction of 60 L/s from six pumping wells (each at at 10 L/s).
Maximum projected drawdown over 10 years:12.70 m.
Influence radius per well: 517 m.
La Embarrada Aquifer: Sustainable extraction of 50 L/s from five pumping wells (each at 10 L/s).
Maximum projected drawdown over 10 years: 3.2 m.
Iinfluence radius per well: 568 m.
Atutía Aquifer: Sustainable extraction of 40 L/s from four pumping wells, (each at 10 L/s).
Maximum projected drawdown over 10 years: 66.9 m.
Influence radius per well is 530 m.
HEAP LEACH PADS AND PONDS
Overview
The heap leach pad is designed to stack 1,032 Mt of crushed ore in 10-m lifts to a maximum height of 150 m over a 22-year life. Future pad expansion is unlikely unless additional resources are upgraded, and property limits to the south are expanded.
Between 2022 and 2025, Knight Piesold (KP) conducted geotechnical investigations to support the Feasibility Study (FS) level design. These studies included field investigation and laboratory testing, borrow sources characterization and geotechnical reporting. Geotechnical investigation work included the 2023-2024 and 2024-2025 seasons, to support a Feasibility Study (FS) level design.
Design Criteria
KP developed the key design parameters for the heap leach pad (KP 1006ENG-FS-0300-E00-DBD-0001, 2024), which are summarized in Table 15.7 below.
Table 15.7: Heap Leach Pad Design Parameters | ||
|---|---|---|
Parameter |
Unit |
Value |
Stacking Capacity |
Mt |
1032 |
Maximum Stacking Height |
m |
150 |
Lifts height |
m |
10 |
Minimum slope of the stack base |
% |
2.5 |
Local Slope |
H:1V |
2.0 |
Global Slope Downstream/Bench Width |
H:1V/m |
4.78/25 |
Global Slope Upstream/Bench Width |
H:1V/m |
4.22/20 |
Transversal Global Slope/Bench Width |
H:1V/m |
3.67/15 |
Operating basis earthquake (OBE) return period/PGA |
years/g |
475/0.463 |
Maximum design earthquake (MDE) return period/PGA |
years/g |
1485/0.725 |
Maximum Irrigation Area |
ha |
88.7 |
Maximum Irrigation Rate |
l/h/m2 |
6.1 |
Maximum Irrigation Flow |
m3/h |
6930 |
Design Storm Recurrence Time |
years |
1000 |
Design Storm Duration |
h |
24 |
Design Storm Precipitation |
mm |
74.1 |
Drain Down Time |
h |
96 |
Pump Stop |
h |
24 |
Engineering Analyses
The heap leach pad design parameters were developed by Knight Piésold and are based on geotechnical, slope stability, and hydrologic analyses. Static and seismic slope stability was evaluated using limit equilibrium methods, incorporating site-specific geotechnical properties, groundwater conditions, and potential failure mechanisms.
The design accounts for both operating basis earthquake (OBE) and maximum design earthquake (MDE) events to meet compliance with FS-level safety factors.
Hydrological modeling assessed surface and subsurface water management strategies to prevent excessive porewater pressures that could impact slope stability. The analysis supports the selected slope configurations and overall pad stability.
The Newfields Peer Review identified some optimizations and potential cost-saving opportunities. KP acknowledges these findings and will further analyze which can be incorporated into the design during future engineering phases.
Water Management
The water management systems separate non-contact and contact water:
Non-contact water: Perimeter diversion channels collect surface runoff and discharge it into the Frio River.
Contact water: Internal channels collect runoff from the stacking area and route it to the Major Event Pond.
Key water management components include:
Subsurface water management underdrain system: Prevents groundwater pressure build up beneath the liner.
Leakage Collection and Recovery System (LCRS): Captures and directs leaks to the LCRS pond.
Solution Collection System: A network of pipes transports the pregnant solution to the PLS Pond from where it is pumped to the process plant.
Stormwater management: Diversion and collection channels mitigate stormwater impacts.
Heap Leach Pad Design Features
The heap leach pad incorporates several critical components:
Material Stacking and Irrigation
Overland conveyors transport crushed ore to agglomeration drums, where raffinate solution increases ore moisture to 5%.
Portable conveyors and a telescoping radial stacker place the material on the pad in 10m lifts. Drip emitters irrigate the ore with dilute sulfuric acid and PLS drains into the collection system, which directs it to the PLS Pond, where the solution is pumped to the feed tank in the Process Plant for solvent extraction.
Underdrain System
Perforated HDPE pipes (200mm-450mm) placed in aggregate-filled trenches direct groundwater to the Underdrain Pond, preventing liner damage.
An integrated monitoring system collects water samples for physicochemical analysis.
Lining System
A 2mm HDPE geomembrane, installed over a 30 cm low permeability soil layer provides containment for the pad.
The LCRS collects leaks over the lining system and conveys them to the LCRS Pond, where they are then pumped to the PLS Pond.
Solution Collection System
A network of perforated HDPE drainage pipes collects PLS and directs it to the PLS Pond. A durable 80 cm layer of overliner protects the liner and enhances solution drainage.
Intermediate Collection Systems (Interlifts)
Installed every five lifts, interlifts optimize PLS collection, and shorten irrigation cycles. Pipes channel solution to the pad edges, where they connect with the primary collection system.
Pumping Systems
Pumps handle flow from the Raffinate, PLS, Major Events, and Underdrain Ponds, ensuring efficient water and solution management.
market studies and contracts
The FS for the Los Azules deposit is based on production of copper cathode from heap leaching over a period of 22 years. Potential recovery of gold and silver depends on the use of alternate leaching techniques from the copper leaching residues or flotation to produce concentrates.
Copper Market Outlook – Supply vs Demand
The global copper market remains constrained due to limited new copper orebodies in the project pipeline, while demand continues to grow. Historically, a new copper project takes between 15 to 20 years to transition from discovery to production, with an average 10-year timeline from feasibility study to full-scale operations, mainly due to technical, regulatory, and social challenges.
Key demand drivers
Copper consumption is expected to grow at a rate greater than the historical 3% per year.
The increasing adoption of renewable energy technologies (e.g., wind, solar, and battery storage) will significantly drive copper demand.
Electric vehicles (EVs) require 30-435 kg of copper per vehicle, compared to 24 kg in traditional internal combustion vehicles.
The International Energy Agency (IEA) emphasizes copper’s role in meeting global decarbonization goals. Construction and electricity networks remain the largest sources of copper demand, while EVs are the fastest-growing source of demand, increasing five-fold from 2% of global copper demand in 2024 to 10% in 2050.
Supply-Demand Projections
S&P Global (S&P Global, 2025) forecasts a refined copper supply deficit, beginning in 2027. Supply of copper from mines was lower than expected in 2024, exacerbated due to the shuttering of the Cobre Panama mine in Dec. 2023 (Reuters, 2024) and the recent Kakula-Kamoa mine in the DRC (Nasdaq, 2025).
The latest market forecast from S&P Global in August 2025 shows that the market will tend to deficit, beginning in 2027. The deficit will increase to over 1.4 Mt by 2030.
Preliminary data from the International Copper Study Group showed that refined copper production increased about 3.6 percent during the first half of 2025 (ICSG, 2025), but the apparent consumption of refined copper also grew by 4.8%. The forecast from April 2025 indicated that the refined copper production would increase by 2.9% in 2025 and only 1.5% in 2026 (ICSG, 2025).
Analysts at BHP believe that as existing mines age, their output will fall, reaching a 15% reduction from current levels (BHP, 2024), reinforced by the recent International Energy Agency report forecasting 2040 demand exceeding supply by approximately 10 Mt annually (IEA, 2025), with AI and data centers as the driving force behind the increase.
A graphical representation of supply, demand, and deficits are shown below in Figure 16.1 below.
|
|
Figure 16.1: Future Copper Market Supply and Demand Outlook (from S&P Global, Aug 2025)
copper market outlook - Prices
Projected copper prices for economic analysis consider consensus projections and economic modeling of long-run prices. The price recommendation for copper is based on a combination of the last 36 monthly average prices from June 2022 through June 2025; analysis of consensus pricing data is from several sources, including prices used by projects, analysts’ views of future market conditions, and professional judgment of the QP. A combination of 10% current spot + 30% 3-year average + 20% mean consensus + 40% project prices (from S&P Global) were used to estimate the prices used for Mineral Reserves and Cashflow. The source data used for the recommended prices are listed in the figures and tables below.
Market forecast projections over the next five years (2025-2029) range between $4.35 to $5.24 per pound, with a mean of $4.79 per pound. Table 16.1.
Analyst consensus ranges between $3.55 to $5.50 per pound with a mean of $4.42 per pound. These prices are displayed in Table 16.2
The selected price assumption for reserve estimation is $4.25 per pound.
The selected price assumption for financial modeling is $4.35 per pound.
Table 16.1: S&P Consensus Commodity Target Long-term Copper Pricing (US$/lb) (source: S&P Global, Sep 2025) | |||||||||||
|
2025f |
2026f |
2027f |
2028f |
2029f |
2030f |
2031f |
2032f |
2033f |
2034f |
2035f |
London Metal Exchange (3M) |
$4.35 |
$4.42 |
$4.49 |
$4.57 |
$4.63 |
$4.67 |
$4.78 |
$4.96 |
$5.06 |
$5.21 |
$5.47 |
Shanghai Futures Exchange |
$4.94 |
$5.02 |
$5.10 |
$5.19 |
$5.24 |
$5.29 |
$5.41 |
$5.62 |
$5.73 |
$5.90 |
$6.20 |
COMEX |
$4.62 |
$4.70 |
$4.78 |
$4.86 |
$4.91 |
$4.96 |
$5.07 |
$5.27 |
$5.37 |
$5.53 |
$5.80 |
Table 16.2: Consensus Long-term Copper Pricing (US$/lb) (source: CIBC, Oct 2025) | ||||||
|---|---|---|---|---|---|---|
Date |
Firm |
2025 |
2026 |
2027 |
2028 |
LT |
21-Sep-25 |
Deutsche Bank |
$4.35 |
$4.45 |
- |
- |
$4.54 |
19-Sep-25 |
UBS |
$4.24 |
$4.68 |
$5.00 |
$5.25 |
$5.00 |
19-Sep-25 |
JPMorgan |
$4.26 |
- |
- |
- |
$4.50 |
18-Sep-25 |
Macquarie |
$4.22 |
$4.14 |
$4.42 |
$4.99 |
$4.20 |
18-Sep-25 |
Barclays |
$4.29 |
$4.50 |
$4.90 |
$4.99 |
$5.00 |
17-Sep-25 |
Canaccord |
$4.45 |
$5.00 |
$5.50 |
$5.50 |
$4.50 |
17-Sep-25 |
HSBC |
$4.24 |
$4.15 |
$4.12 |
$4.15 |
$3.55 |
17-Sep-25 |
RBC |
$4.31 |
$4.50 |
$5.00 |
$5.00 |
$4.00 |
17-Sep-25 |
H.C. Wainwright |
$4.50 |
$4.50 |
$4.50 |
$4.50 |
$4.50 |
16-Sep-25 |
Stifel |
$4.29 |
$4.25 |
$4.25 |
$4.25 |
$4.25 |
15-Sep-25 |
BofA |
$4.34 |
- |
- |
- |
- |
15-Sep-25 |
Cantor |
$4.50 |
$4.50 |
$4.50 |
- |
- |
15-Sep-25 |
Desjardins |
$4.55 |
$4.42 |
$4.37 |
- |
$4.48 |
15-Sep-25 |
TD |
$4.34 |
$4.40 |
$4.75 |
$4.50 |
$4.25 |
14-Sep-25 |
National Bank |
$4.34 |
$4.40 |
$4.75 |
$4.75 |
$4.20 |
13-Sep-25 |
Jefferies |
$4.44 |
$4.75 |
$5.00 |
$5.50 |
$4.25 |
11-Sep-25 |
CIBC |
$4.39 |
$4.75 |
$4.00 |
$4.00 |
$4.00 |
10-Sep-25 |
Berenberg |
$4.39 |
$4.31 |
$4.42 |
$4.48 |
$3.86 |
10-Sep-25 |
Paradigm |
$4.33 |
$4.50 |
$4.50 |
$4.25 |
$4.25 |
09-Sep-25 |
Raymond James |
$4.34 |
$4.40 |
- |
- |
$4.25 |
08-Sep-25 |
Morgan Stanley |
$4.27 |
- |
- |
- |
$4.31 |
05-Sep-25 |
Cormark |
- |
$4.25 |
$4.25 |
$4.25 |
- |
05-Sep-25 |
Haywood |
$4.75 |
$4.50 |
$4.50 |
$4.50 |
- |
02-Sep-25 |
Scotia |
$4.35 |
$4.50 |
$4.50 |
$4.75 |
$5.00 |
Table 16.2: Consensus Long-term Copper Pricing (US$/lb) (source: CIBC, Oct 2025) | ||||||
|---|---|---|---|---|---|---|
Date |
Firm |
2025 |
2026 |
2027 |
2028 |
LT |
15-Aug-25 |
BMO |
$4.30 |
$4.44 |
$4.43 |
$4.60 |
$4.31 |
Average |
|
$4.37 |
$4.47 |
$4.58 |
$4.68 |
$4.34 |
Median |
|
$4.34 |
$4.47 |
$4.50 |
$4.55 |
$4.25 |
Max |
|
$4.75 |
$5.00 |
$5.50 |
$5.50 |
$5.00 |
Min |
|
$4.22 |
$4.14 |
$4.00 |
$4.00 |
$3.55 |

Figure 16.2: LME 3-Month Contract Copper Prices (US$/lb) 2020 to Present (source: https://www.lme.com/en/Metals/Non-ferrous/LME-Copper#Price+graphs, retrieved 1-Oct-2025)
Precious Metal Prices
Projected prices for gold and silver used in economic analysis are based on industry consensus projections. Prices for Gold and Silver are based on a conservative view of analyst consensus pricing forecasts due to other indices like peer reporting and trailing prices significantly lagging current prices.
Gold price estimates range between $1,900 and $4,100 per troy ounce, with a mean price of $3,063 per ounce.
Silver price estimates range between $23.00 and $43.00 per troy ounce, with a mean price of $33.81 per ounce.
The selected long-term price assumptions for financial modeling are:
Gold: $2,500 per troy ounce
Silver: $32 per troy ounce
Table 16.3: Analyst Consensus Gold Price Forecasts (US$/oz, CIBC, Oct 2025) | ||||||
|---|---|---|---|---|---|---|
Date |
Firm |
2025 |
2026 |
2027 |
2028 |
LT |
21-Sep-25 |
Deutsche Bank |
$3,138 |
$3,069 |
- |
- |
$3,000 |
19-Sep-25 |
UBS |
$3,230 |
$3,500 |
$3,250 |
$3,000 |
$2,800 |
19-Sep-25 |
JPMorgan |
$3,354 |
- |
- |
- |
$3,100 |
18-Sep-25 |
Macquarie |
$3,252 |
$2,850 |
$2,550 |
$2,650 |
$2,500 |
17-Sep-25 |
HSBC |
$3,215 |
$3,125 |
$2,925 |
$2,878 |
$2,350 |
17-Sep-25 |
Canaccord |
$3,216 |
$3,479 |
$3,614 |
$3,770 |
$3,858 |
17-Sep-25 |
Raymond James |
$3,237 |
$3,200 |
- |
- |
$2,700 |
17-Sep-25 |
RBC |
$3,266 |
$3,931 |
$4,100 |
$3,500 |
$2,600 |
17-Sep-25 |
Paradigm |
$3,138 |
$3,000 |
$2,750 |
$2,650 |
$2,650 |
16-Sep-25 |
Stifel |
$3,000 |
$3,100 |
$3,200 |
$3,100 |
$2,400 |
15-Sep-25 |
BofA |
$3,356 |
$3,659 |
$3,141 |
$2,927 |
$2,000 |
15-Sep-25 |
Desjardins |
$3,330 |
$3,537 |
$3,688 |
- |
- |
15-Sep-25 |
BMO |
$3,263 |
$3,500 |
$2,988 |
$2,700 |
$2,200 |
15-Sep-25 |
TD |
$3,231 |
$3,400 |
$3,300 |
$3,100 |
$3,000 |
Table 16.3: Analyst Consensus Gold Price Forecasts (US$/oz, CIBC, Oct 2025) | ||||||
|---|---|---|---|---|---|---|
Date |
Firm |
2025 |
2026 |
2027 |
2028 |
LT |
15-Sep-25 |
Cantor |
$3,300 |
$3,600 |
$3,000 |
- |
$3,000 |
15-Sep-25 |
BNP Paribas |
$3,223 |
$3,300 |
$3,000 |
- |
$2,000 |
14-Sep-25 |
National Bank |
$3,289 |
$3,500 |
$3,200 |
$3,000 |
$2,600 |
13-Sep-25 |
Jefferies |
$3,210 |
$3,400 |
$3,200 |
$3,000 |
$2,500 |
12-Sep-25 |
Berenberg |
$3,220 |
$3,300 |
$3,200 |
$3,000 |
- |
11-Sep-25 |
CIBC |
$3,336 |
$3,600 |
$3,300 |
$3,000 |
$2,750 |
08-Sep-25 |
Morgan Stanley |
$3,359 |
- |
- |
- |
$1,900 |
08-Sep-25 |
H.C. Wainwright |
$3,000 |
$3,000 |
$3,000 |
$3,000 |
$3,000 |
05-Sep-25 |
Cormark |
- |
$3,000 |
$3,000 |
$3,000 |
$3,000 |
05-Sep-25 |
Haywood |
$3,161 |
$3,250 |
$3,000 |
$3,000 |
$2,800 |
02-Sep-25 |
Scotia |
$3,250 |
$3,200 |
$2,800 |
$2,300 |
$2,300 |
08-Aug-25 |
Barclays |
$3,261 |
$3,250 |
$3,000 |
$2,750 |
$2,500 |
Average |
|
$3,233 |
$3,323 |
$3,146 |
$2,964 |
$2,646 |
Median |
|
$3,237 |
$3,300 |
$3,071 |
$3,000 |
$2,625 |
Max |
|
$3,359 |
$3,931 |
$4,100 |
$3,770 |
$3,858 |
Min |
|
$3,000 |
$2,850 |
$2,550 |
$2,300 |
$1,900 |
Table 16.4: Analyst Consensus Silver Price Forecasts (US$/oz, CIBC, Oct 2025) | ||||||
|---|---|---|---|---|---|---|
Date |
Firm |
2025 |
2026 |
2027 |
2028 |
LT |
21-Sep-25 |
Deutsche Bank |
$33.00 |
$33.00 |
- |
- |
$32.00 |
19-Sep-25 |
UBS |
$34.60 |
$39.30 |
$36.20 |
$33.10 |
$27.00 |
19-Sep-25 |
JPMorgan |
$36.90 |
- |
- |
- |
$28.00 |
18-Sep-25 |
Macquarie |
$34.12 |
$33.00 |
$30.00 |
$28.00 |
$26.00 |
17-Sep-25 |
HSBC |
$35.14 |
$33.96 |
$31.79 |
- |
$27.00 |
Table 16.4: Analyst Consensus Silver Price Forecasts (US$/oz, CIBC, Oct 2025) | ||||||
|---|---|---|---|---|---|---|
Date |
Firm |
2025 |
2026 |
2027 |
2028 |
LT |
17-Sep-25 |
Canaccord |
$34.97 |
$38.43 |
$39.89 |
$41.18 |
$41.72 |
17-Sep-25 |
RBC |
$35.35 |
$41.56 |
$43.00 |
$37.00 |
$30.00 |
16-Sep-25 |
Raymond James |
$35.67 |
$33.75 |
- |
- |
$30.00 |
16-Sep-25 |
Stifel |
$31.25 |
$33.50 |
$34.50 |
$33.50 |
$30.00 |
15-Sep-25 |
BofA |
$35.58 |
$42.68 |
$39.98 |
$38.32 |
$27.00 |
15-Sep-25 |
Desjardins |
$36.80 |
$38.70 |
$40.10 |
- |
$34.66 |
15-Sep-25 |
BMO |
$32.90 |
$31.50 |
$31.00 |
$31.00 |
$27.00 |
15-Sep-25 |
TD |
$35.39 |
$38.00 |
- |
- |
$33.50 |
15-Sep-25 |
Cantor |
$33.03 |
$36.00 |
$33.00 |
- |
$33.00 |
15-Sep-25 |
BNP Paribas |
$35.00 |
$35.00 |
$33.00 |
- |
$29.00 |
14-Sep-25 |
National Bank |
$34.89 |
$37.00 |
$35.50 |
$33.50 |
$29.00 |
12-Sep-25 |
Berenberg |
$34.84 |
$36.00 |
$35.50 |
$33.00 |
$23.00 |
11-Sep-25 |
CIBC |
$35.50 |
$42.00 |
$38.00 |
$35.00 |
$32.50 |
08-Sep-25 |
Morgan Stanley |
$36.10 |
- |
- |
- |
$25.30 |
08-Sep-25 |
H.C. Wainwright |
$33.00 |
$33.00 |
$33.00 |
$33.00 |
$30.00 |
05-Sep-25 |
Haywood |
$34.39 |
$36.00 |
$35.00 |
$35.00 |
- |
02-Sep-25 |
Scotia |
$34.50 |
$33.00 |
$30.00 |
$28.00 |
$28.00 |
15-Aug-25 |
Cormark |
$32.00 |
$32.00 |
$32.00 |
$32.00 |
$32.00 |
05-Aug-25 |
Barclays |
$35.14 |
$36.00 |
$33.00 |
- |
$28.00 |
Average |
|
$34.59 |
$36.06 |
$34.97 |
$33.69 |
$29.73 |
Median |
|
$34.93 |
$36.00 |
$34.50 |
$33.30 |
$29.00 |
Max |
|
$36.90 |
$42.68 |
$43.00 |
$41.18 |
$41.72 |
Min |
|
$31.25 |
$31.50 |
$30.00 |
$28.00 |
$23.00 |
payables, treatment and refining charges
Table 16.5: Market Assumptions for Mineral Resources shows the market assumptions that have been used for economic analysis.
Table 16.5: Market Assumptions for Mineral Resources | ||
|---|---|---|
Parameter |
Unit |
Value |
Copper Concentrate Grade - Secondary |
% |
28.53 |
Copper Concentrate Grade - Primary |
% |
31.96 |
Long Term Copper Price |
$/lb |
4.80 |
Long Term Gold Price |
$/oz |
2,500 |
Long Term Silver Price |
$/oz |
32 |
Payable Cu |
% |
96.5 |
Payable Au |
% |
90 |
Payable Ag |
% |
90 |
Treatment Charge |
$/t concentrate CIF |
55 |
Penalties for impurities |
$/t concentrate CIF |
0 (no penalties anticipated) |
Cu Refining Charge |
$/lb payable Cu |
0.08 |
Au Refining Charge |
$/oz payable Au |
8 |
Ag Refining Charge |
$/oz payable Ag |
0.5 |
Concentrate Transportation |
$/wmt concentrate |
150 |
Mineral Resource Estimate
The economic cutoff grade and mineable resource estimation were determined using long-term price assumptions of:
Copper: $4.80/lb
Gold: $2,500/oz
Silver: $32/oz
These assumptions provide flexibility in the resource estimation process and align with industry best practices.
marketing
The sellable product from the Los Azules Project is LME-grade copper cathode, which differs from copper concentrate in terms of marketability, pricing, and offtake arrangements. Unlike copper concentrate, which requires smelting and refining before reaching end users, cathode is a finished product and can be sold directly to a wide range of industrial buyers.
Due to this refined nature, a traditional concentrate market study typically assessing smelter availability, treatment and refining charges (TC/RCs), and impurities is not applicable. Instead, the marketability of Los Azules' copper cathode is analyzed based on:
Global Copper Demand & Supply: cathode demand is driven by industrial and technological growth, electrification, and renewable energy adoption.
Benchmark Pricing: sales are expected to be based on London Metal Exchange (LME) prices, with potential premiums for specific markets.
Logistics & Transportation: given its refined state, cathodes can be transported and stored efficiently without the need for intermediate processing.
Potential Buyers & Offtake Considerations: unlike concentrate, which requires negotiations with smelters and traders, cathode sales can be made to a diverse range of industrial consumers.
cathode or concentrate transportation
Cathode transportation details are covered in Section 16.7 – Logistics for Copper Cathode Transport. A transportation and insurance cost for cathodes was assumed at $88/t based on recommendations and estimates provided by Ulog Argentina.
Contracts
No contracts are in place related to the refining, handling, sales and hedging, transportation of supplies or products. Forward sales contracts are currently in place.
Both Stellantis and Rio Tinto have offtake options to purchase cathodes up to a percentage of annual cathode production from the project up to a maximum equal to their ownership percentages. The prices and delivery are subject to a future definitive agreement with each company.
There is no guarantee that sales will occur based on these options.
Environmental Studies, Permitting and Plans, Negotiations, or Agreements with Local Individuals or Groups
Sections 17.1, 17.3, 17.4, 17.5, and 17.6 were prepared by Knight Piésold Argentina Consultores S.A. (KP), based on available environmental and permitting data from 2012 to the present, with the support of the permits and sustainability team at ACMSA.
In 2024 the Los Azules Project secured the approval of its Environmental Impact Statement (DIA – Declaración de Impacto Ambiental) for the exploitation stage under resolution N° 805-MM-2024.
Baseline Studies and Environmental Setting
Environmental Baseline Studies
Environmental baseline studies for the Los Azules Project include surface and groundwater flow and quality, climate, flora, fauna, limnology, air quality, noise, archeology, geology, geomorphology, and glacier characterization. Data collection, except for meteorological monitoring, has been conducted during late spring, summer, and early fall, due to limited site access in winter months.
Baseline studies were documented in the Exploration Environmental Impact Report (Informe de Impacto Ambiental, IIA) in 2010. Followed by six biennial updates in 2012, 2014, 2016, 2018, 2020 and 2024. These baseline studies were complemented for the development of the Mine Exploitation Environmental Impact Report, which was submitted in 2023, and have been continued with ongoing monitoring efforts that are now being integrated into the first biennial update of the report.
The study area has been divided into two primary zones:
Mine Area: Includes the mineral deposit and the infrastructure to be developed.
Access Road: Covers the geological characteristics along the route from Calingasta to the v Río Frío valley.
Geology and Seismicity
The geological baseline study was conducted for both the Mine Area and Access Road.
The project area is within an active tectonic zone where the Nazca plate subducts beneath the South American plate, generating both deep and shallow seismic activity. The most active structures in the Western Precordillera include the Barreal-Las Peñas transpressional belt, the Jarillal-Ansilta fault, and the El Alcázar fault.
The convergence of the Nazca and South American plates generates numerous intermediate-depth earthquakes in the horizontal subduction zone. In contrast, a smaller number of earthquakes originate within the continental crust at depths ranging from 1 to 50 km. These shallower events tend to be more hazardous.
Several seismogenic sources were analyzed within a 100 km radius of the project. In the Mine Area, the Diagonal-La Ballena Fault is considered the most relevant, with the potential to generate earthquakes of magnitude 6.4 to 6.8.
The North and North Camp faults, being less than 5 km long, are unlikely to generate surface-rupturing earthquakes.
Geomorphology and Glacier Study
The study identified and characterized geoforms, landforms, and surface processes in both the Mine Area and the Access Road.
In the Mine Area, glacial activity during the Pleistocene was the dominant land-shaping force, forming deep valleys and fluvioglacial terraces, particularly in the Salinas River valley.
The Access Road crosses multiple geomorphological environments. It begins in Calingasta, at the confluence of the Calingasta and Los Patos Rivers, a fluvial-dominated environment. Further west, along the banks of the Totora River, it transitions into vega (wetland) areas, interspersed with steep-walled sections where mass-wasting processes actively reshape the slopes.
Cryogenic processes also influence the landscape. In the Mine Area and western Access Road, periglacial features, such as frost action, seasonal frozen soils, permafrost, and snow cover, are present. Since 2011, soil temperature gauges have been installed to study permafrost distribution. New deep sensors, installed in March 2024, will provide further insights into permafrost conditions at greater depths.
Climatology
The baseline study includes a characterization and description of the climate and meteorology, covering the Mine Area and Access Road.
Meteorological data for the Mine Area has been collected from 2010, revealing a high-altitude climate with tundra-like conditions. In this environment, temperature patterns closely follow the topographic contour lines ("topo-climatic” component). Average summer temperatures reach 9.21ºC, while winter temperatures drop to -3.64ºC, with extremes as low as -24.3ºC. The average annual temperature is 2.75 ºC.
In the Access Road area, two meteorological stations, El Polvo and Calingasta, provide climate data. El Polvo has an average temperature is 9.93 °C, while Calingasta records 16.3 °C.
In May 2023, two new weather stations, Antena and Norte, were installed in the Mine Area, further enhancing the climate monitoring. Temperature records from May 2023 to December 2024 show a range of -20.6°C to 19.5°C at Antena, and -19.0°C to 21.5°C at Norte.
Air Quality
Air quality measurements were conducted in the mine area and in the nearby localities of Barreal, Calingasta, Sorocayense, Tamberías, and Villa Nueva. These measurements followed the guidelines of the United States Environmental Protection Agency (US EPA) and the CFR 40 regulations. The monitored pollutants included PM10 particulate matter, metals, and gases such as SO₂, NO₂, and CO, utilizing calibrated equipment and various measurement methodologies.
Results were adjusted using standard calculations to ensure compliance with Argentine regulations, specifically Law No. 24.585.
Throughout 2022 and 2025, various monitoring instruments, including meteorological stations and constant-flow pumps, were utilized to ensure the collection of accurate and reliable air quality data.
The results indicate that, in most monitored locations, air quality parameters remained below the guideline levels established by Law No. 24.585, meeting regulatory limits. However, there were exceedances observed in various locations: respirable particulate matter (PM10) in Calingasta during all 2022 monitoring campaigns; settleable particulate matter in Barreal and Sorocayense in April 2025; lead levels in Calingasta and Sorocayense in 2022; and ozone concentrations in Sorocayense in September 2024. Within the Mine Area, most monitoring points showed pollutant concentrations below regulatory thresholds, with no significant exceedances observed.
Noise
Noise monitoring campaigns were conducted between 2022 and 2024 to assess ambient noise levels at Los Azules, and between 2022 and 2025 in nearby communities, including Barreal, Calingasta, Sorocayense, Tamberías, and Villa Nueva.
The results indicate that noise levels in these communities were generally classified as "Not Disturbing" according to applicable standards. However, in some monitoring campaigns conducted within the Mine Area, noise levels reached the "Disturbing" category, primarily influenced by personnel movement, vehicular traffic, and wind conditions.
Hydrology and Hydrogeology
Hydrological and hydrogeological baseline studies have been conducted since 2011, integrating flow measurements, water chemistry, and groundwater quality studies. Additionally, data is available on water tables, water chemistry, and hydraulic characteristics of aquifers. This information offers insights into their storage capacity, recharge rates, and groundwater flow directions, among other key parameters.
Surface water monitoring has been ongoing since 2012 in the Mine Area (covering La Ballena, Frío, La Embarrada, and Salinas River sub-basins) and Access Road (Calingasta river basin). By 2022, the network expanded to 33 monitoring points between the Mine Area and the Access Road.
For groundwater, seven piezometers monitor shallow and deep aquifers, with data from four wells dating back to 2012. Three additional monitoring wells were installed in 2022.
The data available for the water quality baseline includes field measurements, physicochemical laboratory results, major ions, and total metal concentrations. Bacteriological data are also available for surface water at some monitoring points. Data integration, processing, and hydrochemical characterization of the basins were conducted based on major ions, using Piper and Stiff diagrams (via Diagrammes and Aquachem 4.0 software). Concentrations over time have been analyzed to establish the water chemistry baseline for each monitoring point Biodiversity studies have been conducted since 2011 to characterize flora and fauna without Project intervention.
Water quality has been analyzed against multiple regulatory frameworks, including Argentine National Law N° 24.585 (1995), as well as reference values from the Argentine Food Code, World Health Organization (WHO, 2006), and Canadian Environmental Quality Guidelines (2003).
Surface and groundwater are classified as calcium-sulphate waters. Surface waters generally exceed guide levels for human drinking for aluminum, arsenic, copper, boron, and zinc at the highest part of the basin. Groundwater generally exceeds guide levels for human drinking for aluminum, lead, and manganese.
Flora and Fauna
118 species of plants have been identified in the Mine Area, predominantly from the Asteraceae, Poaceae, Cyperaceae and Juncaceae families. Vegas are ecologically significant but under pressure from overgrazing and climate-driven desiccation.
Key fauna in the project area includes:
Birds: Oressochen melanopterus, Merganetta armata, Vultur gryphus, and Phegornis mitchellii.
Mammals: Lycalopex culpaeus, Puma concolor, and Lama guanicoe (guanaco). European hare (Lepus europaeus), an invasive exotic species, is highly abundant in steppe and hillside environments.
Reptiles: Abundant population of Liolaemus fitzgeraldi (Aconcagua lizard), an indicator of ecological quality. Its absence could be an indicator of disturbances due to human activity.
Overgrazing by Chilean livestock herders is a primary driver of vega degradation. Restoration efforts will be required to maintain habitat quality.
Limnology, Ichthyology and Bioaccumulation
Limnology, ichthyology, and metal bioaccumulation in the Project area have been studied since 2007. Limnological organisms are used as a bioindicators representative of the environmental conditions at the time of the study.
Plankton and Benthic Organisms: phytoplankton and macroinvertebrate communities were surveyed in water bodies. Cold-water algae species were identified in La Ballena’s vegas, with a pH between 6-8. These are indicative of eutrophic (presence of nutrients) and polysaprobic (high degradation of organic matter) environments.
Fish: no native fish species have been recorded. Rainbow trout (Oncorhynchus mykiss), an introduced species, is present in multiple river systems and may be impacting native ecosystems. Additionally, the species Salvelinus fontinalis, another exotic trout species, was found in the Las Salinas River.
Bioaccumulation: Studies from 2022 to 2025 show metal accumulation in fish and aquatic plants, primarily Al, As, Ba, Co, Cu, Cr, Fe, Mn, Mo, Pb, Zn, Se, and Ni.
Edaphology
Soil characterization began in 2022 and is ongoing. Preliminary results indicate that Mine Area soils belong to the Entisols Order and the Acuentes, Fluventes and Ortentes Suborders, and generally did not exceed concentrations established by Argentine Law N° 24.585. In the Access Road area, soils belong to the Entisols Order, and the Acuentes and Ortentes suborders.
Archaeology
Archeologic baseline studies in the Mine Area and Access Road began in 2012, led by Dr. Catalina Teresa Michieli and Carlos E. Gómez O. Archaeological prospecting was conducted under the supervision of the Secretariat of Culture of the Ministry of Tourism and Culture of the Province of San Juan.
The studies confirm no significant pre-Hispanic sites, though isolated lithic artifacts were found. Two large rocks with petroglyphs can be found at the Access Road, in the Cuesta del Gringo.
Paleontology
Paleontological surveys identified no areas of high fossil significance within the project footprint.
Protected Areas
No interactions were identified between the project and protected/conservation interest zones defined by native forest criteria. No Ramsar sites, Biosphere Reserves, or other protected sites recognized in Argentina, the San Juan Province, or international treaties lie within the project area.
Demographics
The Calingasta department has a population of 11,034 residents (–2022 Census), with three main population centers: Villa Calingasta, Tamberías, and Barreal-Villa Pituil. The demographic structure is 51.79% male and 48.21% female (2010 Census). Age distribution follows a progressive pyramidal structure, with a notable percentage of the population aged 15 to 64 years.
Future Environmental and Social Work Plan
Baseline data collection will continue until project development begins. Upon execution approval, an Environmental and Social Management Plan (ESMP) will be implemented, ensuring sustainable development and regulatory compliance under Argentine Law N°24.585. Table 17.1: Summary of future environmental and social work plan lists the components of the ESMP to be considered and monitored over the life of the project.
Table 17.1: Summary of future environmental and social work plan | ||||
|---|---|---|---|---|
|
Environmental and/or social component |
Sub-component |
Project Stage |
||
Construction |
Operation |
Closure |
||
Geomorphology |
Control of active geological processes |
x |
x |
x |
Cryogenic geoforms |
x |
x |
x |
|
Water |
Water resources |
x |
x |
x |
Atmospheric conditions |
Greenhouse gas emissions |
x |
x |
x |
Meteorology and air quality |
x |
x |
x |
|
Noise and vibration |
x |
x |
x |
|
Soil |
Soil |
x |
x |
x |
Flora and fauna |
Terrestrial biota protection |
x |
x |
x |
Aquatic biota protection |
x |
x |
x |
|
Control of exotic species |
x |
x |
x |
|
Ecological processes |
Compensation of ecological impacts |
x |
x |
x |
Ecological restoration of disturbed areas |
x |
x |
x |
|
Socio-cultural environment |
Transport |
x |
x |
x |
Heritage protection |
x |
x |
|
|
Employment program |
x |
x |
x |
|
Training and education |
x |
x |
x |
|
Consultation and communication |
x |
x |
x |
|
Visual impact |
x |
x |
x |
|
Contribution to local development |
x |
x |
x |
|
Geochemistry
Geochemical characterization of the Los Azules Project rock materials was conducted to assess the potential for Acid Rock Drainage and Metal Leaching (ARDML). The study focused on evaluating contact water quality risks due to acid generating sulfide minerals and solute release including sulfate and metal(loid)s.
The geochemical assessment focused on the following mine components:
Open pit: dewatering water quality during operations and the pit lake chemistry at closure.
Heap Leach Pad: long-term drain down seepage composition post-closure.
Mine Rock Storage Facilities: the composition of waste rock contact water quality from the North Waste Rock Facility (North MRSF), the South Overburden Stockpile (SOVB), the Primary Stockpile and the Low-Grade Stockpile.
The study outcomes have been used to inform water management and monitoring strategies during operations and closure, as well as the anticipated mitigation strategies for closure.
Geochemical Characterization
A total of 259 samples of core and overburden materials and four samples of spent ore were collected and then analyzed using industry standard static testing methods, including Acid-Base Accounting (ABA), Net Acid Generation (NAG), and Multi-Element assay. A subset of samples underwent mineralogical analysis (Rietveld X-Ray Diffraction [XRD]) and kinetic testing (Humidity Cell Test [HCT]). The core materials were logged by lithology, alteration, and mineralization. The geochemical characterization results indicated that geochemical behavior was primarily associated with the mineralization classification; therefore, the geochemical test results have been presented based on mineralization. Table 17.2 presents a summary of the samples by mineralization and the tests that were undertaken.
Table 17.2: Summary of Samples and Testing by Mineralization | |||||
Mineralization Zone |
Code |
Number of Samples |
ABA, NAG, Multi element assay |
XRD |
HCT |
Overburden |
Ovb |
34 |
34 |
5 |
|
Volcanics |
Volcs |
6 |
6 |
||
Leached zone |
Lix |
60 |
60 |
23 |
9 |
Primary /hypogene |
Pri |
57 |
57 |
17 |
15 |
Enriched/ supergene |
Enr |
75 |
75 |
17 |
15 |
Mixed |
Mix |
21 |
21 |
8 |
2 |
Transition |
Trs |
5 |
5 |
||
Bornite-chalcopyrite |
Bn-Cpy |
1 |
1 |
||
Spent Ore |
Spent Ore |
4 |
4 |
4 |
|
Total |
263 |
263 |
65 |
50 |
|
Summary of Geochemical Static Testing
Mineralogy - Acid-forming minerals
The XRD analysis identified sulfide minerals in two-thirds of the samples. The main sulfide minerals identified were pyrite (mean abundance of 1%, maximum of 3.9%) and chalcopyrite (mean abundance also of 1% and maximum of 2.6%). Chalcocite was also found in smaller quantities (up to 1%) in 14 of the samples. The potential for acid generation is a function of the sulfide minerals present; copper sulfides (e.g. chalcopyrite, chalcocite, bornite, covellite) do not react as rapidly and are generally less acid generating than iron sulfides (e.g. pyrite, pyrrhotite, marcasite) and in the case of chalcocite and covellite do not generate acidity by mineral dissolution. The presence of copper sulfides may be the reason for relatively low acid generation in the HCTs (Section 17.2).
Jarosite minerals were also identified by the XRD analysis, with jarosite present in the four Spent Ore samples at concentrations around 2%. Jarosites are sulfate minerals that tend to form under acidic conditions. They do not oxidize to generate acid like sulfide minerals do; however, dissolution of jarosite minerals can generate acidity through hydrolysis of ferric iron.
Mineralogy – Bulk mineralogy and acid-neutralizing minerals
The bulk mineralogy was dominated by quartz and silicate minerals, with the most abundant silicate minerals being muscovite, albite, oligoclase, K-feldspar, and chlorite.
Reactive acid-neutralizing carbonate minerals were not abundant; calcite was present in two samples at 0.3%. Siderite was present in one sample at 0.7%, however, siderite is considered net neutral (it can release an equal amount of acid to the acidity consumed by dissolution). The most abundant and most reactive acid-consuming mineral would be chlorite, which is classed as having an intermediate weathering rate. Chlorite was present in around half of the samples (3.5% mean concentration, maximum 8.3%). The feldspars albite and oligoclase are classed as having slow weathering rates, but they are relatively abundant. They could provide a long-term (albeit slow-release) source of acid-neutralizing capacity.
Gypsum was identified in 7 samples at concentrations ranging from 0.3 to 7.7%. Gypsum and anhydrite have been recorded in the drillhole logs, particularly at depths greater than around 300 m. Anhydrite is a common alteration mineral in porphyry copper deposits, and gypsum likely forms as a hydration product. Gypsum and anhydrite are relatively soluble in contact waters, and their dissolution may result in elevated concentrations of sulfate, up to around the limit of gypsum saturation (around 2000 mg/L as sulfate with 500 mg/L calcium.
ABA (Acid/base accounting) and NAG (net acid generation) tests were undertaken on all samples to assess the potential for the samples to be net acid-generating. ABA results have been summarized in Table 17.3. The ABA tests calculated acid potential (AP) based on sulfide concentrations and neutralization potential (NP) based on modified Sobek test results. The Neutralization Potential Ratio (NPR) was calculated as NP/AP, where NPR values less than 1 were classed as Potentially Acid-Forming (PAF), values greater than 2 as Non-Acid-Forming (NAF) and between 1 and 2 as Uncertain.
NAG test results are summarized in Table 17.4, with samples classed as PAF if the NAG pH was less than pH 4.5 and the remaining samples classed as NAF.
Table 17.3: Summary of ABA Results1 | |||||||||||||||||||
|
Mineralization Code |
Number of Samples |
Acid Potential (kg as CaCO3/t) |
Neutralization Potential (kg as CaCO3/t) |
Neutralization Potential Ratio |
ABA Classification (No. of samples) |
||||||||||||||
Min. |
Mean |
Median |
Max. |
Standard Deviation |
Min. |
Mean |
Median |
Max. |
Standard Deviation |
Min. |
Mean |
Median |
Max. |
Standard Deviation |
PAF |
Uncertain |
NAF |
||
Ovb |
34 |
0.3 |
3.4 |
0.6 |
15 |
5.8 |
2.2 |
6.6 |
4.2 |
17 |
5.2 |
1.1 |
7.6 |
6.7 |
19 |
6.2 |
4 |
30 |
|
Volcs |
6 |
1.3 |
36 |
4.8 |
115 |
47 |
5.5 |
87 |
95 |
183 |
65 |
1.2 |
18 |
2.4 |
67 |
25 |
3 |
3 |
|
Lix |
60 |
0.3 |
1.9 |
0.9 |
38 |
5.2 |
1.4 |
5.6 |
3.6 |
30 |
5.6 |
0.08 |
9.7 |
4.0 |
96 |
15 |
4 |
12 |
44 |
Pri |
57 |
1.6 |
24 |
17 |
122 |
22 |
2.6 |
9.9 |
6.9 |
76 |
12 |
0.04 |
1.0 |
0.41 |
12 |
2.2 |
48 |
3 |
6 |
Enr |
75 |
0.6 |
30 |
22 |
346 |
41 |
1.2 |
5.1 |
4.7 |
13 |
2.4 |
0.006 |
0.52 |
0.25 |
6.3 |
0.89 |
64 |
6 |
5 |
Mix |
21 |
0.3 |
5.7 |
1.9 |
48 |
11 |
0.91 |
4.0 |
3.5 |
9.6 |
2.6 |
0.04 |
6.6 |
1.3 |
31 |
11 |
9 |
5 |
7 |
Trs |
5 |
8.4 |
20 |
23 |
30 |
8.1 |
2.8 |
5.3 |
4.3 |
8.9 |
2.3 |
0.10 |
0.40 |
0.18 |
1.06 |
0.37 |
4 |
1 |
|
BN-CPY |
1 |
6.9 |
9.0 |
1.3 |
1 |
||||||||||||||
Spent Ore |
4 |
0.6 |
0.7 |
0.63 |
0.94 |
0.13 |
1.3 |
2.0 |
1.7 |
3.6 |
0.91 |
2.0 |
3.0 |
2.2 |
5.7 |
1.6 |
4 |
||
Table 17.4: Summary of NAG pH Results2 | ||||||||
|
Number of Samples |
NAG pH |
No. of samples |
|||||
Min. |
Mean |
Median |
Max |
Standard Deviation |
PAF |
NAF |
||
Ovb |
34 |
3.7 |
5.1 |
5.3 |
6.1 |
0.84 |
3 |
31 |
Volcs |
6 |
4.7 |
8.7 |
9.6 |
11 |
2.51 |
6 |
|
Lix |
60 |
2.6 |
5.3 |
5.1 |
8.0 |
1.07 |
10 |
50 |
Pri |
57 |
2.1 |
3.6 |
3.3 |
7.9 |
1.28 |
50 |
7 |
Enr |
75 |
2.1 |
3.3 |
3 |
6.5 |
0.92 |
67 |
8 |
Mix |
21 |
2.2 |
4.5 |
4.4 |
6.4 |
1.14 |
11 |
10 |
Trs |
5 |
3.3 |
3.8 |
3.8 |
4.6 |
0.44 |
4 |
1 |
BN-CPY |
1 |
5.3 |
1 |
|||||
Spent Ore |
4 |
3.6 |
3.7 |
3.7 |
3.7 |
0.044 |
4 |
|
The results of the ABA and NAG tests are shown in Figure 17.1 with NAG pH plotted against NPR. Most of the Overburden, Leached (Lix) and Volcanics plot in the NAF portion of the graph, with most of the Primary (Pri), Enriched (Enr), Mix and Transition (Trs) samples plotting in the PAF portion of the graph.
Overall, the ABA and NAG results have been summarized as follows:
Materials that are Overburden, Leached or Volcanics are most likely to be NAF overall.
The remaining materials (Primary, Enriched, Mix and Transition) are likely to be PAF or Uncertain. A small portion may be NAF but for assessment purposes these materials have been considered as PAF.
The Spent Ore materials would be classed as PAF based on their NAG pH values.

Figure 17.1: Graph of NPR against NAG pH (SRK 2025)
Summary of Geochemical Kinetic Testing
A total of 50 samples were subject to kinetic testing. Thirteen of the HCTs were terminated after 40 weeks, 18 HCTs were terminated at 60 weeks, and 14 HCTs were terminated at 80 weeks. The final 5 HCTs were terminated at 100 weeks.
HCT leachate for the Overburden and Leached HCT materials typically ranged from pH 5.5 to 7. For the Enriched and Primary materials, the leachate pH decreased to around pH 5 to 6. Major ion concentrations were generally low for the Overburden and Lix HCTs and the release of metal solutes was lower than for the Enriched and Primary HCTs.
Static testing for the Primary and Enriched HCT samples classified them as PAF, due to the limited carbonate present. The reason for the HCT leachates not turning more acidic was not clear; it could have been due to slow reacting/low acid-generating copper sulfide minerals, or due to the presence of higher proportions of relatively slow reacting silicate minerals. The combination of these factors (slower acid release and abundant slow silicate buffering) could explain why the pH values for the Primary and Enriched HCTs did not decrease further.
Calculations of AP and NP depletion were completed for each HCT based on the ABA data and the leachate composition. The depletion calculations indicated that the overburden HCTs would be unlikely to turn into acid. Most of the Lix HCTs would also be unlikely to turn acidic, although three Lix HCTs with higher sulfide content had leachate pHs of 5 to 6 and were predicted to turn into acid. The depletion calculations indicated that the Primary and Enriched HCTs could ultimately generate acidity as the measured NP may be depleted before the AP, and therefore the pH of the contact water could tend towards acidic conditions. However, this does not take account of the potential for the AP to have been overestimated due to the presence of copper sulfide minerals that may not generate as much acid. Also, where the rate of acid generation is low and the more reactive silicate minerals (e.g. chlorite and biotite) are more abundant, the overall effect may be that there is sufficiently slow reacting NP and dilution with alkalinity in contact waters to largely counteract the slow and limited acid generation; this could result in a pH that may be mildly acidic (around pH 5 to 6) but may not substantially decrease to lower pH values.
For the Spent Ore HCTs, the leachate was initially around pH 3 due to residual acidity from the test columns. The pH increased to around pH 4.5 after 10 weeks and remained around pH 4.5 until around Week 60 and then showed a gradual increase to around pH 5 to 5.5 toward Week 100. The period of stable pH indicated an ongoing source of acidity, potentially from jarosite minerals or residual process solutions in the pores. The increase to around pH 5 or above indicated that the source of acidity was decreasing over time (after the sample had been rinsed 60 to 100 times).
Solute concentrations from the HCTs were high for copper, except for the Spent Ore HCTs. Copper for several of the Enriched and Primary HCTs were over 1 mg/L each week, with maximum concentrations around 20 mg/L. The high copper concentrations showed that copper was being released. They remained mobile in leachates that were around pH 5 to 6, and therefore, acidic conditions were not required for copper to stay in solution at elevated concentrations. Copper concentrations were typically lower (around 0.01 mg/L) for the Overburden and Lix HCTs except for the two Lix HCTs with sulfide or sulfur content greater than 0.1%. Other solute parameters that were released at elevated concentrations included fluoride, arsenic, cadmium, cobalt, lead, manganese, and zinc. The overall potential for specific solutes to be constituents of concern (CoC) will vary by mine component. It will depend on the overall release rates, water flows, and any attenuation processes.
Predictive numerical modeling assessments
Predictive numerical geochemical models were developed to estimate mine contact water quality for the following facilities:
Pit water: operational dewatering and pit lake water quality post-closure.
Mine Rock Storage Facilities (MRSFs): North MRSF, Overburden Stockpile (SOVB), Primary Stockpile and Low-Grade (LG) Stockpile
The potential drainage chemistry of the HLP was also evaluated but did not include numerical modelling.
Water quality compliance criteria
The Environmental Impact Report states that the Project will be committed to maintaining baseline water quality. Therefore, the mine will not result in increased concentrations of pollutants in water quality downgradient from the site during operations or post-closure.
To assess water quality, the study compared the predicted mine contact water quality results with the baseline water quality data for the proposed compliance location, specifically the Rio Salinas monitoring location at the downstream limit of the site boundary.
Pit water
During operations, the pit dewatering flows will be consumed by the process demands, and hence, no discharge of dewatering flows is expected during mine life. A pit water rebound assessment was undertaken that indicated a pit lake would form as a net sink; the lake would receive water from the surrounding area, but the lake level would remain below the level of the pit crest, and hence there would be no discharge of water from the pit lake to the environment.
Dewatering water quality will initially be comparable to the groundwater composition and will evolve through mine life with higher solute concentrations as solutes are released from the wall rock and talus.
The numerical model estimates of pit lake water quality indicated that the pit lake pH would be mildly alkaline (around pH 8) with moderate TDS concentrations (around 740 mg/L in year 5) that would increase over time (around 1100 mg/L at year 100) due to ongoing solute inflows and the effects of evaporative concentration. The main solutes present would be sulfate and calcium. Calcium and sulfate concentrations would be expected to increase until limited by gypsum solubility, which would occur at around 500 mg/L calcium with 2000 mg/L sulfate. Solute concentrations for most parameters generally increase over time, with the exceptions being calcium, barium, copper, and iron, which decrease due to associated mineral phase precipitation. Overall, the pit lake water would not be suitable for discharge or agricultural or domestic uses. The increasing solute concentrations over time (particularly sulfate and calcium) indicate a long-term tendency to become a brackish pit lake with elevated solute concentrations for several parameters.
The hydrogeological studies indicate the pit lake will be a net sink for water and will not interact with the local environment; therefore, it may be considered that the pit lake would be comparable to other isolated Andean water bodies, which are similarly of naturally poor quality relative to stream flows.
MRSF infiltration and seepage
Numerical estimates of the MRSF hydrology were completed based on estimates of the site climate, hydrology and particle size distribution of the MRSF materials. The climate and coarse nature of the MRSF materials indicate that there will be negligible runoff from the MRSFs, with virtually all water either evaporating/sublimating from the surface or percolating downwards through the rock mass.
The assessment indicated that seepage through the MRSFs would be predominantly driven by snow melt, with negligible contribution from rainfall during the summer. Snow derived infiltration into the rock mass would occur relatively quickly, with basal seepage from each of the facilities anticipated to occur within several years of the start of their construction.
Based on the North MRSF location and hydrology, it is expected that the seepage will mix with groundwater beneath the facility and will emerge as spring/stream flow at the toe of the facility or slightly downstream. The SOVB seepage is likely to migrate with groundwater and emerge in the Rio Frio catchment, which will then flow to the Rio Salinas. Seepage from the Primary Stockpile will be discharged into the Rio La Embarrada channel and then to Rio Salinas. Seepage from the Low-Grade Stockpile will migrate in groundwater towards the pit.
Base Case predictions
Numerical predictions of water quality were undertaken using a scaling approach to predict field-scale contact water quality from laboratory-derived HCT leachate quality. The estimates were completed for each of the MRSFs, and the results are summarized in Table 17.5. Separate calculations were then undertaken for the migration and mixing of North MRSF and SOVB contact waters with the Rio Salinas baseline water. The calculations were complete for the summer low flow rates to represent the period when the river composition could be most influenced by the MRSF seepage, and could occur for several months. The results of the Rio Salinas mixing predictive calculations are shown in Table 17.6.
The base case numerical estimates indicate that the contact water pH would be circum-neutral to mildly alkaline for each of the facilities (ranging from around pH 6 to 8.3). Total dissolved solids (TDS) would be up to around 2000 mg/L for the North MRSF. TDS concentrations for each of the MRSFs were predicted to be elevated relative to the Rio Salinas baseline conditions (up to 350 mg/L). Percolation of water through the rock mass was predicted to result in concentrations of most solute species being greater than the Rio Salinas baseline conditions. The exceptions were copper, barium, and iron, where concentrations were predicted to be limited by mineral solubility constraints.
The summer flow mixing calculations (Table 17.6) predicted lower solute concentrations because of mixing with groundwater and river water in the Rio La Embarrada, Rio Frio, and Rio Salinas. The calculations assumed that the Primary Stockpile and Low-Grade Stockpile would not contribute to the post-closure flow. The predicted Rio Salinas water quality post-closure was predicted to be comparable with regards to pH and TDS; however, several solute species were predicted to be greater than the Rio Salinas baseline conditions. Based on the Project commitment to maintain the baseline water quality conditions, this indicates that mitigation measures for the MRSFs would be required to achieve water quality composition near the baseline Rio Salinas composition.
Table 17.5: Summary of Outputs from Base Case Numerical Water Quality Models | ||||||||||||
Facility |
Total Tonnage (Mt) |
Footprint (Mm2) |
Estimated average seepage rate (L/s) |
pH range |
Maximum predicted base case concentration (mg/L) |
Parameters predicted to be greater than Rio Salinas baseline |
Comments |
|||||
|
TDS (mg/L) |
Sulfate (mg/L) |
Cadmium (mg/L) |
Copper (mg/L) |
Manganese (mg/L) |
Zinc (mg/L) |
|||||||
|
Rio Salinas baseline |
- |
- |
7.2-9.6 |
352 |
85 |
<0.0002 |
0.148 |
0.0093 |
0.049 |
- |
|
|
North MRSF |
1,200 |
5.6 |
21.3 |
7.9-8.1 |
2,100 |
1,200 |
0.14 |
0.006 |
6.79 |
11.6 |
TDS, alkalinity, Cl, F, SO4, P, Ca, Mg, K, Na, Ag, As, B, Cd, Co, Cr, Mn, Mo, Ni, Pb, Sb, Se, Sr, Tl, U, V, Zn |
North MRSF contact waters will ultimately enter the Rio Salinas flow. |
SOVB |
230 |
1.85 |
7.2 |
8.2-8.3 |
410 |
150 |
0.009 |
0.0055 |
1.01 |
1.58 |
TDS, alkalinity, Cl, F, SO4, P, Mg, K, Na, Ag, B, Ba, Cd, Co, Cr, Mn, Mo, Ni, Pb, Sb, Se, Sr, U, Zn |
SOVB contact waters will ultimately enter the Rio Salinas flow. |
|
Primary Stockpile |
88 |
0.7 |
3.4 |
6.0-8.0 |
855 |
521 |
0.17 |
0.0063 |
1.81 |
13.7 |
TDS, alkalinity, Cl, F, SO4, P, Ca, Mg, K, Na, Ag, B, Cd, Co, Cr, Mn, |
Primary Stockpile assumed to be removed by end of mine life. |
Mo, Ni, Pb, Sb, Se, Sr, Tl, U, Zn |
||||||||||||
|
Low-Grade Stockpile |
72 |
0.9 |
2.6 |
6.9-8.1 |
364 |
183 |
0.11 |
0.0057 |
1.71 |
3.7 |
TDS, alkalinity, F, SO4, P, Ca, Mg, K, Ag, B, Cd, Co, Cr, Mn, Mo, Ni, Pb, Sb, Se, Sr, U, Zn |
Low-Grade Stockpile will be removed by end of mine life. Seepage will flow to the pit. |
Table 17.6: Summary of Outputs from Base Case Numerical Water Quality Models for Rio Salinas | |||||||||
Facility |
pH |
TDS (mg/L) |
Sulfate (mg/L) |
Cadmium (mg/L) |
Copper (mg/L) |
Manganese (mg/L) |
Zinc (mg/L) |
Parameters predicted to be greater than Rio Salinas baseline |
Comments |
Rio Salinas baseline |
7.2-9.6 |
352 |
85 |
<0.0002 |
0.148 |
0.0093 |
0.049 |
- |
|
Predicted Rio Salinas |
7.9 |
353 |
174 |
0.015 |
0.0051 |
0.77 |
1.28 |
TDS, Cl, F, SO4, P, Ca, Mg, K, Na, Ag, B, Cd, Co, Cr, Mn, Mo, Ni, Pb, Sb, Se, Sr, Tl, U, V, Zn |
Calculations undertaken for mixing average base case seepage flows from North MRSF and SOVB with baseflow for Rio Salinas. |
In addition to solutes released by weathering of the rock materials, release of nitrogen species from the use of explosives can occur as a result of spillage, leaching, and incomplete combustion. Calculations indicated that potential nitrate concentrations may not be elevated relative to baseline concentrations; however, ammoniacal nitrogen may be elevated above baseline concentrations in seepage that could migrate to the Rio Salinas. The use of explosives will occur during active mining, and hence, there will be a finite source of residues that will deplete over time.
Heap Leach Pad
During operations, the HLP will be actively leached with sulfuric acid to leach the copper. During operations, there will be no discharge of contact water from the HLP or associated ponds or infrastructure to the environment.
At the end of mine life, Pregnant Leach Solution (PLS) will continue to drain from the HLP. This PLS will be processed for the copper content and then recirculated to the top of the HLP in a period of ‘inventory reduction’. After the PLS is no longer recirculated, the HLP will continue to generate seepage because of infiltration from rain and snow. The rates of solution discharging from the HLP will be lower than during operations, but could still average around 5 to 28 L/s. The long-term seepage has been predicted to be acidic (around pH 4 to 5), and the acidity will increase the mobility of metal solutes. Drain down of the residual acidity from the leach waters and jarosite minerals will require the leach pad to be flushed several times, which could take years to decades, depending on the flow rates. Therefore, drainage solution and runoff contact water from the HLP would likely need to be prevented from discharging or would require treatment prior to discharge.
20.2.5Contact Water Quality Management and Mitigation of Potential Impacts
Operational period
Contact water quality from the MRSFs, pit dewatering and HLP would not be suitable for discharge to the environment during the operational period. The water management system has been designed so that there will be no discharge of contact waters from the site; all contact waters will be captured and will be consumed within the process plant. Therefore, mitigation of environmental risks has been designed into the operational phase.
Post-closure period
The geochemical assessment and predictions of contact water quality have indicated that the post-closure contact water quality from the MRSFs will contain high solute concentrations relative to the Rio Salinas, and that after mixing with the local groundwater and river water, the resulting Rio Salinas water quality would exceed the baseline water quality and hence would not meet the environmental commitments.
At closure, sending water to the process plant will not be an option. Therefore, mitigation measures will therefore be required to reduce the potential for the post-closure water quality to increase concentrations above the baseline Rio Salinas water quality.
Closure Water Management Measures
The current closure plan focuses on capturing seepage flows from the HLP and North MRSF in evaporation ponds. The evaporation ponds would be sized to allow the complete removal of the seepage water by evaporation. This approach is applied globally at many mine sites and is highly dependent on the local climate, water balance, and pond sizing. Due to the climate and hydrology at Los Azules, there may be difficulties in sizing a pond with a suitable capacity to ensure all water would be evaporated during the summer. There could also be challenges with respect to the accumulation of salts that could reduce the evaporation rates, and the integrity of the pond liners to prevent seepage.
Based on the anticipated water quality and potential rates of seepage from the HLP and MRSFs from the geochemical assessment, further studies and assessments will be required to refine the closure water management plans to demonstrate that they can achieve the long-term goals.
The geochemical assessment report has set out several options that could be investigated further to determine the most pragmatic and cost-effective approach to preventing or reducing potential impacts to the surface water bodies. These include:
Covers: the MRSFs could be covered with lower permeability materials to encourage shedding of meltwater. The aim would be to shed as much of the snowmelt as possible as run-off from the surface of the MRSFs without contact with mine rock and reducing infiltration through the rock mass. Alternately, the top-most materials (or cover) could be comprised of fine-grained porous material that is designed to retain moisture in the uppermost materials, such that the moisture could be evaporated off during the summer (effectively a ‘store-and-release’ cover). Both approaches would act to reduce infiltration into the MRSFs, reducing the quantity of seepage and the overall solute load to the Rio Salinas.
Wetlands and attenuation processes: the construction of a wetland area within the Rio La Embarrada / Rio Frio area would offer a range of measures to attenuate and mitigate flows. Settlement ponds and vegetation can retain particulate matter. Organic matter and vegetation can attenuate solute species. Addition of limestone and/or limestone drains can add buffering capacity to retain high pH waters and facilitate precipitation of some solutes. Pebble beds can be established to remove redox-sensitive species such as iron and manganese.
These options would need to be assessed further to develop a final closure approach. The period prior to construction, and through operations to closure would allow for detailed studies to be undertaken to optimize the assessments and develop a robust closure strategy.
ENVIRONMENTAL MANAGEMENT AND MONITORING PLANS
Environmental management and monitoring plans are required to protect the biophysical and social environments of the Los Azules Projects. These plans are identified in the Sixth Update of IIA for the Exploration Stage, approved under Resolution N° 408-MM-2024 by the Provincial Mining Authority, and in the Exploitation IIA, which was granted its Environmental Impact Statement (DIA, in Spanish) through Resolution N° 805-MM-2024. The IIAs define protection measures for the following activities and operations:
Development and operation infrastructure: including primary and secondary access roads, drill platforms and camp facilities.
Flora and fauna conservation: to protect local vegetation and wildlife.
Water resource management: ensuring sustainable water use and maintaining water quality.
Cultural and natural heritage preservation: protection of archaeological and environmentally sensitive areas.
Machinery and equipment operation: implementing best practices to minimize environmental impact.
Soil disturbance control: measures to prevent erosion and land degradation.
Glacial geoform protection: compliance with environmental protection regulations related to cryogenic landforms.
project permitting
The development of the Los Azules Project requires various environmental and sectoral permits for different phases of the project, including those prior to construction, during construction, and throughout operation.
The required environmental permits include the Sectorial Environmental Permit for construction and the Environmental Impact Statement (DIA, in Spanish) for exploitation. Additionally, various sectoral permits must be obtained before construction can commence.
The permitting process for the Project has been progressing, and no major risks or delays have been identified.
Environmental Permits – Construction and Operation Stages
Table 17.7 below lists environmental permits required for the construction and operation phases. While many of these permits are initially issued for the construction stage, they must be periodically renewed to remain valid during operations.
Table 17.7: Environmental Permits – Construction/Operation Stage | |||||||||
# |
Name of permit |
Authority |
Estimated Processing time (*) |
Stage (**) |
Start date |
Date obtained |
Expiration date |
Frequency |
|
LA-P-002 |
Environmental Impact Report (IIA) - Exploitation Stage. |
Mining Ministry - San Juan. |
2 years |
Construction/ Operation |
--- |
Dec 3, 2024. |
Not Applicable. |
2 years |
|
LA-P-077 |
Environmental Permit ('Aviso de proyecto'). Calingasta Premises. |
State Secretariat for the Environment and Sustainable Development - San Juan. |
6 months |
Construction/ Operation |
--- |
Jun 6, 2023. |
June 6, 2026. |
3 years |
|
LA-P-192 |
General Manifest - Power Line and Substation System. |
State Secretariat for the Environment and Sustainable Development - San Juan. |
10 months |
Construction/ Operation |
--- |
-- |
-- |
3 years |
|
LA-P-204 |
General Manifest - Access Road Section I. |
State Secretariat for the Environment and Sustainable Development - San Juan. |
10 months |
Construction/ Operation |
--- |
-- |
-- |
3 years |
Notes: *Processing time: No legal timeframe is established for processing and obtaining permits. Estimates are based on experience in similar processes. **Stage: While many of these permits are required for construction stage, they must be renewed within the established period to remain valid for operations.
Sectorial Permits – Before Construction
The following Table 17.8 lists sectorial permits required before construction begins. These permits cover land use, water management, infrastructure approvals, and regulatory registrations.
Table 17.8: Sectorial Permits - Before Construction | ||||||||
|---|---|---|---|---|---|---|---|---|
# |
Name of permit |
Authority |
Estimated Processing time (*) |
Stage |
Start date |
Date obtained |
Expiration date |
Frequency |
LA-P-MISC. |
Soil Use Feasibility – Miscellaneous. |
Urban Planning and Development Department (DPDU) - San Juan. |
3 months |
Before Construction. |
--- |
-- |
-- |
3 years |
LA-P-MISC. |
Civil Works Design Project Approval. |
Urban Planning and Development Department (DPDU) - San Juan. |
3 months |
Before Construction. |
--- |
-- |
-- |
One time only |
Table 17.8: Sectorial Permits - Before Construction | ||||||||
|---|---|---|---|---|---|---|---|---|
# |
Name of permit |
Authority |
Estimated Processing time (*) |
Stage |
Start date |
Date obtained |
Expiration date |
Frequency |
LA-P-MISC. |
Fire Protection Service Project Authorization. |
Urban Planning and Development Department (DPDU) - San Juan. |
3 months |
Before Construction. |
--- |
-- |
Work completion. |
One time only |
LA-P-MISC. |
Municipal Construction Permits Fee. |
Municipality of Calingasta. |
15 days |
Before Construction. |
--- |
-- |
-- |
One time only |
LA-P-159 |
Authorization for Construction of Water Management Works and Heap Leach Pad and Phases. |
Water Department - San Juan. |
6 months |
Before Construction. |
--- |
-- |
-- |
One time only |
LA-P-190 |
Authorization of Water Management Works. Design Project Approval - Water Diversion and Management Channels. |
Water Department - San Juan. |
6 months |
Before Construction. |
--- |
-- |
-- |
One time only |
LA-P-093 |
Authorization of Water Management Works, Access Road Drainage System. |
Water Department - San Juan. |
6 months |
Before Construction. |
--- |
-- |
-- |
One time only |
LA-P-188 |
Authorization for Construction of Water Management |
Water Department - San Juan. |
6 months |
Before Construction. |
--- |
-- |
-- |
One time only |
Table 17.8: Sectorial Permits - Before Construction | ||||||||
|---|---|---|---|---|---|---|---|---|
# |
Name of permit |
Authority |
Estimated Processing time (*) |
Stage |
Start date |
Date obtained |
Expiration date |
Frequency |
Works, Mine Drainage System. |
||||||||
LA-P-172 |
Authorization for Construction of Water Management Works, Process Ponds. |
Water Department - San Juan. |
6 months |
Before Construction. |
--- |
-- |
-- |
One time only |
LA-P-MISC. |
Discharge Feasibility Certificate, Effluent Plants and Filter Fields. |
Water Department - San Juan. |
6 months |
Before Construction. |
--- |
-- |
-- |
One time only |
LA-P-MISC. |
Discharge Feasibility Certificate, Water Plant. |
Water Department - San Juan. |
6 months |
Before Construction. |
--- |
-- |
-- |
One time only |
LA-P-073 |
Interruption of Water Free Flow. |
Water Department - San Juan. |
4 months |
Before Construction. |
--- |
-- |
-- |
One time only |
LA-P-169 |
Quarry Concession on Provincial Fiscal Lands. |
Department of Mining Registry and Cadastre, within the Technical Secretariat of the Mining Ministry. |
1 year |
Before Construction. |
--- |
-- |
-- |
One time only |
LA-P-170 |
Registration of a Quarry on Private Land. |
Department of Mining Registry and Cadastre, within the Technical |
6 months |
Before Construction. |
--- |
-- |
-- |
One time only |
Table 17.8: Sectorial Permits - Before Construction | ||||||||
|---|---|---|---|---|---|---|---|---|
# |
Name of permit |
Authority |
Estimated Processing time (*) |
Stage |
Start date |
Date obtained |
Expiration date |
Frequency |
Secretariat of the Mining Ministry. |
||||||||
LA-P-202 |
Provincial Road Department (DPV) Authorization, Access Road. |
Provincial Road Department.
|
8 months |
Before Construction. |
--- |
-- |
-- |
One time only |
LA-P-203 |
National Road Department (DNV) Authorization, Access Road. |
National Road Department. |
8 months |
Before Construction. |
--- |
-- |
-- |
One time only |
LA-P-035 |
Electroduct Administrative Easement. |
National Electricity Regulatory Agency (ENRE). |
1 year |
Before Construction. |
--- |
-- |
-- |
One time only |
LA-P-157 |
Registration as a Wholesale Electricity Market Agent (MEM in Spanish) as a Large Major User (GUMA in Spanish). |
National Energy Secretariat. |
1 year |
Before Construction. |
--- |
-- |
-- |
One time only |
LA-P-158 |
Authorization for the Construction, Operation and Maintenance of a Power Line for Private Use. |
National Energy Secretariat. |
1 year |
Before Construction. |
--- |
-- |
-- |
One time only |
*Processing time: No legal timeframe is established for processing and obtaining permits. Estimates are based on experience in similar processes.
Community Engagement and Social Programs
The Los Azules Project has a Community Development Plan aimed at promoting the social and economic well-being of the local communities. This plan is managed by the company's Community Relations Department, which has a dedicated team based in Calingasta to address community needs, foster engagement and respond to concerns.
The Community Development Plan includes the following key programs:
Citizen Participation Program
Local Labor Program
Local Supplier Development Program
Community Training Program (Programa de Educacion a la Comunidad, PEC).
Strengthening of Civil Institutions Program.
Educational Institution Engagement Program
Contractor Partnership Plan
Infrastructure Contribution Plan.
Healthcare Institutions Engagement Plan.
Closure Plans
The Closure Plan (CP) is designed to establish the site's long-term physical, chemical, and hydrological stability while minimizing environmental and socioeconomic impacts. The plan includes two distinct stages:
Closure stage: implementation of closure measures and rehabilitation activities at the end of operations.
Post-Closure stage: long-term monitoring and maintenance to assess the effectiveness of closure measures and, if necessary, apply corrective actions. The primary project components requiring closure include:
Closure Components
Table 17.9: Project Facilities | |
Type of facility |
Facility/components |
Mine facilities |
Pit, Northeast, and South Waste Dumps |
Processing facilities |
Heap leach Crushing systems Process Plant |
Auxiliary facilities |
Embarrada Campsite Project roads Power lines and substations Maintenance and warehouse workshop Fuel tanks and loading facilities Services (water, sewage, etc.) |
Closure Plan Objectives
The primary objective of mine closure is to achieve long-term physical and chemical stability, with minimal maintenance, establishing a safe, stable, and predictable condition while ensuring compliance with environmental regulations. Key closure and post-closure objectives include:
Compliance with environmental laws, international standards, and best industry practices.
Rehabilitation of affected areas to achieve long-term stability, including revegetation with native species when possible.
Restoration of natural drainage surfaces in affected areas.
Minimization of socioeconomic impacts on a local and regional scale.
Optimization of closure and post-closure costs.
Standards and Regulations
San Juan province does not have specific mine closure legislation and does not adhere to National Regulation Res. 161/2021. Therefore, the applicable legal framework consists of:
National Law No. 24.585 on Environmental Protection for Mining Activities.
Provincial Law No. 6.571 on Environmental Impact Assessment, modified by Provincial Law No. 6.800
Additionally, the Closure Plan aligns with international standards (ICMM, 2025), McEwen policies, and industry best practices. The Plan is integrated into the Environmental Management Plan (EMP) within the project’s EIA, with final approval granted by the Ministry of Mining of San Juan.
Geo-Environmental Risk
The primary geoenvironmental risk at closure is the potential generation of acid rock drainage (ARD) and metal leaching (ML) from mine waste facilities. These risks and their associated management strategies include:
Mine Rock Storage Facilities (MRSFs): waste rock is expected to generate acidic drainage over time, requiring engineered contacted/non-contacted water management systems and potential cover systems to limit infiltration.
Open Pit: the pit will naturally flood post-closure, forming a pit lake. The water chemistry will depend on wall rock leaching and groundwater inflows, requiring monitoring and possible treatment if water quality degrades.
Heap Leach Pad (HLP): residual leach solutions may contain elevated metal and sulfate concentrations. The leach pad will undergo rinsing and drain down to stabilize the material before final closure.
Surface and Groundwater Protection: monitoring and predictive modeling will guide mitigation strategies to ensure compliance with water quality standards.
Closure Considerations and Criteria
Physical stability
Remaining mine facilities (pit, waste dumps, leach pad) will be designed to withstand long-term (post closure) conditions and meet international standards.
Chemical stability
Water, air, and soil quality post-closure will aim to match baseline conditions.
Contact water will be managed to prevent contamination through differential systems of contacted and non-contacted water.
Hydrological stability
Natural drainage patterns will be restored, when possible, with systems in place to manage contact water. Sanitation and rehabilitation efforts will follow the best engineering practices and meet environmental compliance requirements.
Pollution control
Revegetation
Native plant species will be used to promote natural revegetation in rehabilitated areas.
Landscape
The final landform will be designed to closely resemble the surrounding natural environment.
Waste Management
All waste will be disposed of properly, with chemical reagents either returned to the supplier or safely disposed of off-site. Temporary infrastructure will be removed and surfaces leveled.
Infrastructure and Equipment Decommissioning
End-of-life equipment will be managed as scrap and disposed of off-site.
Monitoring and Maintenance
A minimum 10-year post-closure monitoring period will be implemented.
Monitoring frequency will be adjusted as environmental conditions stabilize.
Closure Strategy
The closure plan consists of three key stages:
Progressive Closure Stage: implemented during mine operation for facilities that have reached the end of their useful life.
Final Closure Stage: executed after the end of operations and covering all remaining facilities.
Post-Closure Stage: monitoring and corrective actions to assess long-term environmental stability.
The closure plan will be updated in consultation with stakeholders, including government authorities and local communities, as established by international standards.
Key Assumptions
The Closure Plan is based on the following assumptions:
The closure period is estimated at three years, followed by a minimum 10-year post-closure period.
Progressive closure measures will require detailed engineering and additional studies.
The pit lake will reach equilibrium without groundwater outflow.
All ore stockpiles will be fully processed before closure.
The leach pad will be stabilized and will not generate residual effluents after draindown. Natural flooding to equilibrium level.
ARD from waste dumps will be managed through a contact/non-contact water management system.
Stored topsoil will be used for revegetation.
Decontaminated demolition debris will be disposed of in the waste dumps.
No infrastructure will be transferred to local communities.
Closure Measures
Pit
Removal of auxiliary infrastructure.
Installation of 2 m high berms to restrict access.
Scarification of roads to promote revegetation.
Low-grade Stockpile and Primary Material
Removal of base material and rehabilitation of the area.
Processing Plant and Crushing Systems
Disposal of chemical reagents off-site.
Decontamination and dismantling of equipment and facilities.
Scarification and leveling to promote natural revegetation.
Waste Dumps
Removal of auxiliary equipment.
Implementation of contacted/non-contacted water management systems.
Scarification of roads to facilitate natural revegetation.
Heap Leach Pad
Removal of infrastructure and pipelines.
Reconfiguration of contacted/non-contacted water management systems.
Draining and stabilization of the leach pad.
Auxiliary facilities (Campsite, Maintenance Workshop and Warehouse, Administration Offices, Substations, etc.)
Dismantling and decontamination of facilities.
Demolition of concrete structures with waste disposed in waste dumps.
Off-site disposal of hazardous waste.
Scarification and leveling to promote natural revegetation.
Fuel storage and supply facilities Scarification to promote natural revegetation.
Removal of infrastructure.
Remediation of contaminated areas.
Off-site disposal of hazardous waste.
Roads and Drainage Systems
Restoration of natural drainage patterns, with removal of culverts and diversion structures.
Closure costs
The total cost of the closure has been estimated at USD 385,783,322 which is made up as follows:
Table 17.10: Cost summary | |
Direct costs |
166,341,792 |
Complementary direct costs |
7,148,362 |
Indirect costs |
83,940,366 |
Contingency |
128,352,802 |
Total |
385,783,322 |
capital and operating costs
capital cost estimation
This section describes the capital cost basis for McEwen Copper’s Los Azules Project in the San Juan Province of Argentina. The Project includes the development of an open pit mine with muti-stage crushing and screening, a heap leach pad, and a copper solvent extraction-electrowinning facility with a nominal production capacity of 210,000 t/a copper cathodes (design maximum 240,000 t/a). There is also a sulfuric acid plant and other associated infrastructure to support the operations. In general, it includes the following facilities:
Mine development and associated infrastructure
Three (3) stage crushing, conveying, and agglomeration
Heap leach pads and mobile conveyor ore stacking systems
Solvent Extraction-Electrowinning (SX/EW) facility
Sulfuric acid plant & sulfur storage/handling
On-Site utilities and ancillary facilities including a construction/initial operations camp
Off-Site infrastructure including main offices, trans-modal logistics stations, and access road
The estimate is expressed in third quarter 2025 United States dollars and all references herein are in USD. No provision has been included to offset future escalation.
Most costs and equipment estimates were provided on a USD basis. Where source information was provided in other currencies, these amounts have been converted at the following rates:
1 USD = 1,459 Argentine Peso (ARS)
1 USD = 0.962 Euros (EUR)
1 USD = 985.02 Chilean Peso (CLP)
The project capital costs are based on various sources including unit rates provided by contractors, equipment and material quotations, in-house historical data, published databases, experience-based factors and estimators’ judgment (allowances). The capital costs for the project are summarized below and should be viewed with an expected level of accuracy for a feasibility analysis at ±15% consistent with AACE International Recommended Practice No. 47R‐11 Estimate Class 3. The initial project development capital costs for the Base and Alternative case options are summarized in Table 18.1.
Table 18.1: Initial Capital Cost Summary | |
|---|---|
Description |
Cost |
Direct On-Site Facilities |
|
Mine Facilities, Equipment, Pre-Production |
$805.9 |
Ore Storage & Handling |
$283.3 |
Heap Leach |
$331.6 |
SX-EW |
$188.5 |
Sulfuric Acid Plant |
$114.3 |
Ancillary Facilities |
$123.4 |
Site Development & Yard Utilities |
$101.6 |
Water Supply |
$29.6 |
Direct Off-Site Facilities |
|
Power Supply (contracted as OPEX cost) |
$- |
Local Support Facilities |
$16.4 |
Access Roads |
$93.6 |
Logistics Activities Zone (LAZ) |
$45,.6 |
Total Direct Cost |
$2,133.7 |
Project Indirects & Construction Services |
|
Contractor Indirect Cost |
$41.7 |
Catering, Camp Operations & Maintenance |
$94.6 |
Contracted Services |
$89.6 |
Construction Equipment, Tools & Supplies |
$14.6 |
Freight & Duties |
$59.3 |
Field Startup & Vendor Services |
$15.1 |
Spares, Initial Fills (incl. Mining) |
$65.5 |
Table 18.1: Initial Capital Cost Summary | |
|---|---|
Description |
Cost |
Project Indirect/ Project Management Labor |
|
EPCM Services |
$139.2 |
Owner's Cost |
|
Owner Project Team |
$7.6 |
Office Costs & Assets incl. vehicles |
$0.6 |
Owner Services Cost |
$28.8 |
Owner Preproduction G&A Costs |
$104.7 |
Opex During Ramp-up |
$34.8 |
Total Indirect Cost |
$691.0 |
Design Growth Allowances |
$44.3 |
Contingency |
$293.9 |
Total Capital Cost |
$3,167.9 |
Major equipment pricing sourced for this study estimate is listed in Table 18.2 below.
Table 18.2: Major Equipment Budget Cost Sources | ||
|---|---|---|
Mining Equipment –Shovels/Loaders |
Komatsu/LeTourneau |
|
Mining Equipment – Haul Trucks/Hydraulic Excavators |
Komatsu |
|
Primary Crusher Station |
Metso-Outotec |
|
Secondary Crushing & Screens |
Metso-Outotec |
|
Tertiary Crushing & Screens |
Metso-Outotec |
|
Overland Conveyors Package |
RBL-REI |
|
Heap Leach Stacking System |
Terra Nova Technologies |
|
Agglomeration Drums |
Westpro |
|
Table 18.2: Major Equipment Budget Cost Sources | ||
|---|---|---|
Solvent Extraction Plant Equipment Package |
Metalex |
|
Electrowinning Plant Equipment Package |
Metalex |
|
Sulfuric Acid Plant Package |
Ballestra |
|
Knight-Piesold provided costs for the heap leach pad, solution recovery and water management systems in the heap leaching area, as well as site water management. Costs were developed through unit price analysis, requests for quotes from material suppliers, and expert judgment.
Modular construction camp costs were sourced from Modular Homes (Argentina).
The incoming 220 kV powerline and substation upgrades at the existing Calingasta and Rodeo locations are provided by YPF Luz and are considered the main site substation as part of their provision of energy to the project. No capital is included in this estimate and the investment costs incurred by YPF are recovered as operating cost.
The estimate is built up by cost centers as defined by the project’s WBS for Area designations as well as by prime commodity accounts, which include earthwork, concrete, structural steel, buildings, mechanical equipment (including mine equipment), piping, electrical, and instrumentation. McEwen (Owner) provided costs include contracted construction services, such as construction camp operations and road maintenance, as well as traditional Owner’s Costs, including the Owner’s execution team and pre-production general and administrative (G&A) costs.
Equipment will be purchased by the Owner, or Owner’s Agent, without markup and will be provided (free issue) to the construction contractor(s) for installation. It is anticipated that construction contractors will supply most of the bulk materials.
Local and regional contractor rates and unit costs were sourced from contractors familiar with the region and Argentinian based costs. These were applied for mass earthwork, concrete, and steel, as well as installation labor.
Where labor costs are applied to various commodities, construction wages are base rates provided by Techint Ingenieria y Construccion (Techint). Due to record-high inflationary pressure on wages, rates reflect a 2020 wage for craft labor. All specialized craft labor is assumed to be sourced within Argentina, without consideration for international workers. Where “all-in” unit rates have been provided for items like mass earthwork, concrete, etc., labor is included as part of the subcontract rate.
The estimate assumes an Engineering, Procurement, and Construction Management (EPCM) execution strategy in which equipment and materials will be purchased on a competitive bid basis. Installation contracts will be awarded in defined packages on time and materials, unit price or lump sum basis. Engineering, purchasing, and construction management services, as well as some Owner costs for item costs such as management, transportation, and cost control have been reduced from a “typical” EPCM approach due to the significant contractor support included as part of Techint indirect costs.
These contractor costs include provision for project management, construction supervision, logistics, and field engineering.
Owner costs prepared by McEwen are included in the estimate. The major categories include the Project Management Team, Office Costs & Assets, Services Costs, Preproduction General and Administrative (G&A) Costs, and Operating Costs during ramp-up. In a complementary but non-overlapping role to the contractors and EPCM staff, the Los Azules Project Team will be present on-site. Owner costs include salaries, third party consultants/reviews, travel, training, communications, etc.
Specifically for G&A costs, monthly cost estimates were developed for each of McEwen’s departments. These costs are intended to include staffing costs as well as costs associated with each department’s Operational Readiness Plan (ORP). This includes the cost of people, systems, plans, programs, and procedures that must be developed during the construction period and be fully functional at the time of the start of operations. The estimate includes, for instance, consulting services, training, specialized equipment, and software required to prepare for operations.
To account for quantity variability when developing the capital cost, design growth allowances were applied to portions of the scope based on design maturity, geotechnical confidence, level of engineering completed, etc. These allowances provide a buffer to address scope definition, design optimization, and unforeseen complexities that will be encountered during detailed engineering. Examples of these growth allowances include increases in mass earthwork volume or changes in excavation requirements (e.g. common excavation vs. rock drill & blast), revisions to foundation designs, updates to site routing for overland infrastructure like pipelines and electrical distribution, etc.
An economic risk analysis was performed using Monte Carlo modeling to evaluate the potential cost and probability of overrunning/underrunning the estimated capital cost estimate of the Project. Estimates are a forecast for the future; they are likely either higher than or lower than reality due to uncertainties of what the future will bring. The risk analysis attempts to quantify the effects of uncertainty (risk) on the project by identifying risks, quantifying the probability of occurrence, and analyzing the potential severity of the impact.
Expert judgment and project data informed the analysis and simulation outcomes of project costs were used to determine an appropriate contingency. Key parameters considered by the project team included clear scope delineation and definition, technical uncertainties, extensiveness of the underlying design data, and impacts from potential schedule delays.
This robust approach balances financial goals with the flexibility needed to manage the large-scale complexities of the project.
Exclusions
Items not included in the capital estimates are as follows:
YPF Luz 220 kV power supply to site and system upgrades (powerline, related substations)
Land acquisition
Demolition
Taxes
Import duties
Sunk costs (costs prior to start of detailed design)
Disposal/clean-up of existing hazardous materials
Allowance for special incentives (schedule, safety, etc.)
Interest and financing cost
Escalation
Closure, reclamation, and salvage costs
Future risk due to force majeure occurrences
Sustaining Costs
Sustaining capital is the periodic addition of capital that is required for equipment purchases or construction of additional facilities required to maintain or expand operations, apart from the normal day-to-day operations and maintenance costs.
These capital costs, which will be incurred during years when the plant is operational, are not included in the initial capital cost estimate. They are included with the economic model in the years that the costs are anticipated to occur for the purpose of calculating the overall economic benefits of the project. Sustaining costs were developed on the same basis as initial capital.
The sustaining capital plan is presented below in Table 18.3.
Table 18.3: Sustaining Capital Plan | ||
|---|---|---|
Description |
Total Cost ($M) |
|
Mine Equipment |
$613.1 |
|
Heap Leach Pad |
$793.8 |
|
Water Management |
$135.3 |
|
Mobile Equipment & Vehicles |
$28.3 |
|
Table 18.3: Sustaining Capital Plan | ||
|---|---|---|
Description |
Total Cost ($M) |
|
Processing Facilities & Infrastructure |
|
|
Mine Facilities |
$76.7 |
|
Mine Dewatering |
$10.3 |
|
Crushing Expansion |
$101.7 |
|
Agglomeration Expansion |
$12.6 |
|
Stacking & Aeration System Expansion |
$113.2 |
|
SX-EW Expansion |
$54.8 |
|
Acid Plant Expansion |
$90.0 |
|
Utilities & Balance of Plant |
$0.0 |
|
Access Road |
$74.2 |
|
Offsite Facilities |
$26.9 |
|
Subtotal Process Facility & Infrastructure |
$560.3 |
|
SUBTOTAL SUSTAINING CAPITAL |
$2,130.9 |
|
Spares Parts |
$55.7 |
|
Closure Costs |
$385.8 |
|
TOTAL SUSTAINING COSTS |
$2,572.4 |
|
Mining Capital Costs
Basis of the Estimate
The mine capital estimate includes costs for:
Major mine equipment
Ancillary equipment
Autonomous installation and hardware costs Mine engineering, geotechnical engineering and geology equipment and supplies
Equipment spares
Mining Capital Costs items estimated by others and included in other WBS areas:
Preliminary work, or work completed prior to pre-production mining to establish initial mine roads, to construct laydown areas, and to strip the vegas.
Temporary mine facilities
Permanent mine facilities
WRF, ore stockpile, and overburden pile base preparation
Dewatering costs, including horizontal drains, pumps, and pipes
Pit power
Communication systems
Crushing and conveying systems
Capitalized operating costs
Reclamation and closure costs
Contingency (included in overall project contingency analysis)
Explosive facilities are constructed by the explosive provider.
The basis of estimate for the mine equipment capital, the ancillary equipment capital, the capital spares, and the fixed equipment capital is provided in the following sub-sections.
Summary – Mine Capital Costs
The initial and sustaining capital costs estimated for the mining aspects of the Los Azules project are shown in Table 18.4. They are broken into three categories: pre-production stripping, major equipment, and support equipment.
Table 18.4: Mine Capital Cost – Summary | |||
|---|---|---|---|
Mining Category |
Initial ($M) |
Sustaining ($M) |
Total ($M) |
Pre-Production Stripping |
326.7 |
- |
326.7 |
Major Equipment |
331.0 |
593.4 |
924.4 |
Support Equipment |
74.3 |
71.8 |
146.1 |
Table 18.4: Mine Capital Cost – Summary | |||
|---|---|---|---|
Mining Category |
Initial ($M) |
Sustaining ($M) |
Total ($M) |
Total Mine Capital |
732.0 |
665.2 |
1,397.2 |
Following preproduction, approximately $665.2 M in sustaining capital is required as the mine expands and deepens over time. Approximately $0.26 of sustaining capital is spent per tonne mined. Capital expenditure is restricted during the last three years of the project as the project, as currently scheduled, winds down.
Figure 18.1 provides a distribution of total capital expenditures by area of cost. Approximately 79% of the capital expenditure is used to purchase haul trucks and loading equipment.

Source: AGP 2025
Figure 18.1: Percentage of Total Capital by Cost Center (SE 2025)
Pre-production Stripping
The mine is scheduled to initiate mining in year -2. A total of 125.0 Mt total will be mined during the two years of pre-production, and the costs primarily capital. This pre-production stripping is expected to cost $326.7 M. This cost includes all associated management, drilling, blasting, loading, hauling, support, engineering and geology department labor, and grade control costs.
Major Equipment
The mining equipment is split into major and minor equipment. Major equipment includes drills, production loaders, electric hydraulic shovels, haulage trucks, dozers, and graders.
This estimate also includes the smaller truck fleet that will be used in predeveloping the benches at the start of each phase. This is particularly important on the slopes of the topography to develop sufficient bench width for larger equipment to be productive.
Support Equipment
Other equipment such as mechanics’ trucks, small excavators, water trucks, pump trucks, pickups, lowbed, etc. are part of the support equipment fleet cost. Capital spares such as spare truck beds or extra shovel buckets are included in this area as well.
Project Development Execution Plan And Schedule
The Los Azules project execution plan and schedule is based on an Engineering, Procurement & Construction Management (EPCM) execution approach allowing for multiple specialty and local contractors to be considered. Argentina has design and construction companies that have constructed significant industrial facilities and heap leach pads and that are familiar with the project location and environment.
The McEwen Copper’s (Owner’s) team will self-manage certain contracts: camp development, off-site infrastructure areas (administrative offices, trans modal handling areas Calingasta/San Juan), YPF design/supply power agreement for the grid upgrades and incoming transmission lines and site main transformers.
Project implementation is considered in three phases to accommodate funding and other requirements. These phases are:
Initial Works (approx. 12 months)
Detail Design & Construction (approx. 33 months)
Commissioning & Start-up (phased ramp up of systems to accommodate early leaching systems start 6-9 months prior to overall project completion)
Figure 18.2 presents a Level 1 Project Execution Schedule (from a more detailed Level 4 Schedule previously developed) based on regional contractor inputs and long-lead equipment and materials delivery assumptions provided by vendors. The schedule assumes that the Feasibility Study work is completed as described; finalization of the IIA/DIA permitting process and other necessary permits to begin work is completed during the proposed Feasibility Study; and preliminary timeframe and financing are in place to achieve the schedule milestones.
A detailed Project Execution Plan has been drafted to support the project staffing and schedule assumptions included. Key elements of the plan are described below. The project schedule includes a three month contingency for mechanical completion delays.

Figure 18.2: Conceptual Project Execution Schedule (McEwen 2025)
Initial Works
A twelve-month preliminary engineering and construction period is considered to finalize funding and prepare for long-lead equipment purchase and initial construction contracts. Early construction works will commence with access roads, site preparation, construction infrastructure, camp expansion and power line development, much of which is initially off-site, weather dependent, and without easy site access.
Initial Works considered will require early funding and consist of the following activities:
Finalization of permitting & project definition details
Complete geotechnical, surveying and other field work to support detail design development
Finalization of power supply agreements and design/supply/construct agreement
Technology package vendor selection, purchase agreements and design initiation (acid plant, modular crushing systems, stacking systems design, SX/EW technology equipment supply)
Basic Engineering and final equipment selection and purchase
Complete leaching technology PFS study (Nuton® Technology)
Detail design finalization for leach pad Phase 1, access road upgrades and power supply substations and transmission lines
RIGI compliance work:
Initial existing access road upgrades is discussed in Section 15
Completion of existing 156-person site camp facilities and ordering modules for next phase of expansion
Expand project and operations teams as required for next phase
Selection of EPCM lead and contractors for next phase of work
Control Level Initial Capital Estimate and Project Schedule
Project financing and decision to proceed
The field season for the remaining design inputs can only be completed between October and May each season, until the initial all-weather 156-person camp is completed.
The Owner’s project development team will manage the early construction activities.
Detail Design & Construction
Following the Initial Works phase, project financing, and Notice to Proceed, the initial project development is expected to take approximately 33 months to Mechanical Completion of the crushing, conveying, and process systems. Construction development will prioritize the initial leach pad and ponds, crushing and stacking systems to facilitate the placement of leach materials on the pad during mine pre-stripping and prior to starting construction of the rest of the facilities. Ramp-up to full leaching capacity is expected to take six to nine months from plant start-up, and placement of mineralized material on the pad. Commercial production of copper from the SX/EW plant is expected to be achieved approximately 12 months after the start of leaching. Finalization of the necessary permits to begin work is expected to be completed during the proposed feasibility study timeframe. Early works will commence, once project funding is available, with access road upgrades, site preparation, construction infrastructure, and power line development.
Engineering is considered in two phases. The initial phase is to confirm the lead time for equipment selection and preparation of purchase agreements with the equipment with long-lead times for immediate release upon Notice to Proceed, preliminary engineering design and development of early works contracting packages prior to project financing and execution decision leading to a formal Notice to Proceed milestone.
The unit processes and equipment considered for the Los Azules operation are well known and highly developed, however as an integrated facility a level of complexity is also understood. Vendors considered for the supply of the major equipment are well known in industry, regionally, and in the specific process plant applications. There are no similar plants in Argentina to draw experienced work forces from, although in neighboring Chile and Peru these types of facilities are common.
The second phase includes detailed engineering to support construction, selection, and procurement of the balance of the equipment and materials, and incorporation of equipment data into the design. The engineering plan considers a design/supply approach for the following major equipment packages:
Mine Equipment: will be supplied by two or three providers and include haul trucks, loading equipment, and drills. Support equipment will be purchased separately.
Sulfuric Acid Plant: detailed design for equipment and mechanical, piping, electrical and control systems engineering from the sulfur feed bin to the acid discharge to the storage tank. Civil, structural steel, and concrete engineering design will be completed by an Argentinian EPCM design firm. Scope for the acid plant technology provider does not include buildings or sulfur storage areas.
SX/EW Equipment: an integrated basic engineering design/supply of the solvent extraction and electrowinning systems. Scope for equipment supplier does not include civil engineering, concrete, piping, process tanks, pumps, structural steel, electrical or overall control systems. Electrical systems for the process buildings are included in the building supplier scope.
Crushing Systems: scope includes the design/supply of modular packages for the primary crushing, secondary crushing, and tertiary crushing systems. Scope includes electrical and controls. Scope does not include buildings, primary stockpile, or civil engineering and concrete design to be completed by an Argentinian EPCM design firm.
Stacking System: the mobile stacking system from overland tripper conveyor to stacking conveyor is a design supply package with all components and systems for operation.
In addition, approximately 70 additional major/minor equipment purchase orders are expected to be placed to support the balance of the plant.
Equipment is expected to be purchased nationally where practical and internationally otherwise. Materials will be sourced within Argentina regionally where available. International transportation, customs and importation, and logistical considerations will be required. Sources and ports in Argentina are expected to be the primary routes for Atlantic and European sourced materials and equipment, with some materials and equipment coming from Chilean ports from Pacific Rim suppliers.
A 90-day allowance for transport and importation has been included in equipment delivery time frames expressed by the likely suppliers based on FOB terms. A logistics plan has been developed for the project based on preliminary sourcing plans.
Table 18.5 provides the long-lead equipment delivery assumptions considered. As global impacts to supply chain constraints ease, these delivery times are expected to improve to more traditional timeframes.
Table 18.5: Long-lead Equipment Delivery Assumptions | ||
|---|---|---|
Long Lead Items |
Lead Time (months) |
|
Power sub-station transformers |
20-24 |
|
Sulfuric acid plant design/supply |
18-22 |
|
SX/EW plant design/supply equipment |
28-30 |
|
Initial SX train and Tankhouse A |
14-18 |
|
Second SX train B & Tankhouse B, C, D |
18-30 |
|
Mine shovels |
16-18 |
|
Stacking system & agglomerating drums |
18-20 |
|
Mine haul trucks |
12-14 |
|
Primary & Secondary Crushing Stations |
18-20 |
|
Tertiary Crushing plant equipment (tertiary crushers, feeders) |
18-20 |
|
Overland conveyor |
10-12 |
|
In-plant conveyors |
10-12 |
|
The envisioned construction approach will be a prime contractor supplemented by local and specialty contractors. Construction considers development of the necessary temporary infrastructure for the construction activities. The workforce is expected to peak at between 2,300 and 2,500 workers. Off-site pre-assembly and fabrication will be used to the extent possible to minimize the on-site staff in Calingasta and San Juan.
A total of 40 major contracts have been identified for the project development period. Sixteen major contracts, including the overall EPCM contract, will be managed by the McEwen Copper project team.
Site activities consider seasonal challenges during winter conditions starting in May/June of each year. Some activities, such as heap leach liner placement, will stop and recommence in September/October. Detailed planning and winterization will be required to ensure year-round construction activities can take place. Scheduling contingencies have not been considered at this level of study. Significant Owner-managed contracts include:
Purchased Power Agreement and Design/Supply/Erection of Power Supply & Transmission (YPF Luz)
Sulfur Supply Agreement
Initial Site Preparation Earthworks & Vegas Removal
Access Road Detail Design & Construction
Modular Camp Procurement & Erection
Camp Catering & Services Contractor
Heap Leach Pad Phase 1 Design and Installation
San Juan Offices Design & Erection
Calingasta Trans Modal & Staging Infrastructure
EPCM Contractor for Detail Design & Construction Management
Commissioning & Start-up
Ramp-up to full leaching tonnage capacity is expected to take nine to twelve months from plant start-up. In terms of a McNulty Curve consideration, it is expected that this facility would fall between a Class 1 and 2 facility for throughput related aspects; copper production expectations are directly tied to the expected leaching performance assumptions and feed ore copper grades. A sequence overview of the expected ramp-up of the facilities to operational status is shown below (in reference to Notice to Proceed) in Table 18.6.
Table 18.6: Start-up Plan from Notice to Proceed | |
|---|---|
Task Name |
Expected Ready Date |
Leach Pad Phase 1 75 ha Ready |
Month 18 |
Temporary Power Available |
Month 21 |
Leach Pad Pond & Pumping Systems Complete |
Month 22 |
Table 18.6: Start-up Plan from Notice to Proceed | |
|---|---|
Task Name |
Expected Ready Date |
Stacking Systems Complete |
Month 22 |
Acid Plant Complete |
Month 22 |
Crushing Systems Complete |
Month 23 |
Mining Production - Ore to Primary Crusher |
Month 24 |
Start Leaching Solution to Pad |
Month 25 |
Leach Pad Phase 1 Construction Complete |
Month 26 |
Solvent Extraction Plant Ready - Train A |
Month 26 |
Solvent Extraction Plant Full Flow |
Month 28 |
Electrowinning Plant Ready - Circuit A |
Month 29 |
First Cathode |
Month 30 |
Electrowinning Plant Full Capacity Available |
Month 32 |
Full Production Available |
Month 33 |
Commercial production is expected to be achieved in approximately 12 months as the leaching process matures through the one-year overall cycle time allowed in a 3-year span of operation.
Project Development Expenditure Plan
Depending on funding and permitting being available to support an early project develop path “Early Works” for initial infrastructure and engineering development, the potential annual project expenditure requirements for the project development to operations is shown in the Table below.
Table 18.7: Annual Project Expenditure Plan (USD 000's) | ||||
Early Works |
Year -3 |
Year -2 |
Year -1 |
Total |
$ 172,283 |
$ 360,943 |
$ 1,343,323 |
$ 1,291,401 |
$ 3,167,950 |
These values do not include other potential expenditures related to regional exploration activity unrelated to the immediate project development activities. The financial model does not consider an early start to activities prior to Year minus 3 and includes those expenditures in the Year minus 3 period.
OPERATING COST ESTIMATION
Operating costs for the project were estimated from first principles, detailed staffing plans with 2025 Argentine labor rates, commodity pricing for Q3 2025, a sulfur supply study for acid, and typical maintenance costs. Costs are based on Q3 2025 pricing estimates and do not include escalation or inflation.
Power costs were provided on a 100% renewable power basis by YPF Luz. Direct Costs include repayment of power infrastructure financed by YPF Luz. The YPF repayment adds $1,039 million ($1.03/tonne processed or $0.14/lb Cu) to the direct operating costs over the 15-year repayment schedule.
Selling and transportation/insurance costs to a Chilean port for distribution are included in the estimate. Transportation and insurance costs after export are not included and are compensated for in a selling premium per pound of copper typically included in off-take agreements.
LOM operating costs are presented in the table below as well as unit costs based on ore tonnes processed, and pounds of copper produced.
Table 18.8: Life of Mine Operating Cost Summary* | |||
Description |
LOM Cost ($000s) |
LOM Cost/tonne ore processed ($) |
LOM Cost/lb. Cu ($) |
Mining |
$ 6,286,000 |
$6.22 |
$0.87 |
Processing |
$ 3,872,000 |
$3.83 |
$0.54 |
General & Administrative |
$ 1,883,000 |
$1.86 |
$0.26 |
LOM Direct Operating Cost |
$ 12,041,000 |
$11.92 |
$1.67 |
Selling & Transportation |
$ 289,000 |
$0.29 |
$0.04 |
LOM C1 Cost |
$ 12,330,000 |
$12.20 |
$1.71 |
LOM C3 Cost |
$ 13,109,000 |
$12.97 |
$1.81 |
Sustaining Cost |
$ 2,131,000 |
$2.11 |
$0.29 |
LOM AISC |
$ 15,240,000 |
$15.08 |
$2.11 |
*Note: Excludes capitalized pre-production operating costs prior to Operating Year 1. Includes YPF power infrastructure financing repayment costs for Operating Years 1-15.
LOM mining costs per tonne mined (for both ore and waste) average $2.41/tonne (inclusive of YPF financing repayment).
Mining Operating Costs
Mine operating costs are estimated from first principles. Key inputs to the mine costs are fuel and labor. The diesel fuel cost is estimated using local vendor quotations for fuel delivered to site. A value of $1.12/L is used in this estimate.
Labor costs are based on a salary survey completed by McEwen Mining to obtain representative rates for the various positions expected across the mine, processing and other job categories.
Operating costs average $2.40 per primary tonne mined, and average $2.37 per total tonne moved over the life-of-mine (LOM). Total tonnes moved include 29.8 Mt of stockpile rehandle. During the preproduction period, the mining costs average $2.61/t. Following pre-production, mining costs remain relatively consistent until year 12 then begin to increase. Figure 18.3 provides an overview of the tonnage mined and the mine operating costs per tonne mined.

Figure 18.3: Tonnage Mined and Mine Operating Costs (AGP 2025)
Maintenance parts and supplies are the single largest cost item for the mine, followed by diesel fuel and then explosives. The other primary mining cost contributors shown in Figure 18.4 include personnel, contract services, tires, GET, and electrical power. All other costs make up 4.2% of the total costs.

Figure 18.4: Cost by Cost Item (AGP 2025)
On a cost-by-cost center basis, mine haulage accounts for 52% of the mine operating costs. Blasting accounts for 14% of the mine costs, followed by loading at 15%, support at 13%, engineering and supervision at 4%, drilling at 3%, and stockpile rehandle at 1%. This is shown in Figure 18.5.

Figure 18.5: Operating Cost by Cost Center (AGP 2025)
Mine costs increase as production increases. Over the two-year preproduction period, mining costs are $327.0 M. Starting in year 1, the mining cost rises to $266.4 M for that year, and the annual rate of tonnes mined increase to 128 Mt/a. Mining costs then peak at $383.1 M in year 8 when the mining rate peaks at 175 Mt/a. The mining rate is maintained over the following 4 years. Mining costs start to decline with declining production starting in year 14 until mining is completed in year 21.
Table 18.9 provides a summary of the annual mining costs and unit mining costs for both primary production and total material mined. The mining cost details have also been shown by category for a few representative years in Table 18.10.
Table 18.9: Annual Mine Expenditure | |||||
|---|---|---|---|---|---|
Period |
Mining Cost |
Primary Production |
Total Mined1 |
||
|
USD (000's) |
(kilotonnes) |
US$/tonne |
(kilotonnes) |
USD/tonne |
PP -2 |
115,741 |
27,000 |
4.29 |
27,000 |
4.29 |
Table 18.9: Annual Mine Expenditure | |||||
|---|---|---|---|---|---|
Period |
Mining Cost |
Primary Production |
Total Mined1 |
||
|
USD (000's) |
(kilotonnes) |
US$/tonne |
(kilotonnes) |
USD/tonne |
PP -1 |
210,924 |
98,000 |
2.15 |
98,000 |
2.15 |
Yr 1 |
266,415 |
128,265 |
2.08 |
128,265 |
2.08 |
Yr 2 |
290,176 |
130,000 |
2.23 |
130,000 |
2.23 |
Yr 3 |
318,018 |
130,000 |
2.45 |
130,000 |
2.45 |
Yr 4 |
317,664 |
130,000 |
2.44 |
130,000 |
2.44 |
Yr 5 |
310,078 |
130,000 |
2.39 |
130,000 |
2.39 |
Yr 6 |
347,233 |
140,000 |
2.48 |
140,000 |
2.48 |
Yr 7 |
374,428 |
160,000 |
2.34 |
160,000 |
2.34 |
Yr 8 |
383,082 |
173,314 |
2.21 |
175,000 |
2.19 |
Yr 9 |
377,770 |
170,954 |
2.21 |
175,000 |
2.16 |
Yr 10 |
375,360 |
175,000 |
2.14 |
175,000 |
2.14 |
Yr 11 |
358,639 |
175,000 |
2.05 |
175,000 |
2.05 |
Yr 12 |
342,939 |
175,000 |
1.96 |
175,000 |
1.96 |
Yr 13 |
343,613 |
165,398 |
2.08 |
165,398 |
2.08 |
Yr 14 |
329,236 |
145,000 |
2.27 |
145,000 |
2.27 |
Yr 15 |
286,437 |
106,655 |
2.69 |
106,655 |
2.69 |
Yr 16 |
207,157 |
78,626 |
2.63 |
78,626 |
2.63 |
Yr 17 |
201,459 |
68,444 |
2.94 |
68,444 |
2.94 |
Yr 18 |
196,398 |
60,058 |
3.27 |
60,079 |
3.27 |
Yr 19 |
190,026 |
58,962 |
3.22 |
58,962 |
3.22 |
Yr 20 |
184,327 |
53,671 |
3.43 |
53,671 |
3.43 |
Yr 21 |
156,729 |
27,692 |
5.66 |
51,727 |
3.03 |
Total |
6,483,847 |
2,707,039 |
2.40 |
2,736,826 |
2.37 |
1-Includes rehandle cost
Table 18.10: Open Pit Mining Costs ($/t Total Material) | ||||||
|---|---|---|---|---|---|---|
Open Pit Operating Category |
Unit |
Year -2 |
Year 1 |
Year 5 |
Year 8 |
LOM Average Cost |
General Mine and Engineering |
$/t |
0.32 |
0.09 |
0.08 |
0.06 |
0.09 |
Drilling |
$/t |
0.07 |
0.05 |
0.06 |
0.05 |
0.06 |
Blasting |
$/t |
0.32 |
0.31 |
0.32 |
0.32 |
0.32 |
Loading |
$/t |
0.60 |
0.33 |
0.36 |
0.31 |
0.35 |
Hauling |
$/t |
2.29 |
1.00 |
1.30 |
1.21 |
1.23 |
Stockpile Rehandle |
$/t |
- |
- |
- |
0.02 |
0.02 |
Support |
$/t |
0.68 |
0.31 |
0.26 |
0.22 |
0.30 |
Total |
$/t |
4.29 |
2.08 |
2.39 |
2.19 |
2.37 |
Processing Operating Costs
Process operating costs (OPEX) were determined from first principles, with the following basis:
Unit costs for consumables were provided by McEwen Copper, taken from vendor equipment quotations, or based on historical data or experience.
The exempt and non-exempt labor requirements were provided by McEwen Copper.
Copper Recovery and net acid consumption cost bases are detailed in Section 14.
Reagent and fuel pricing costs were obtained by McEwen Copper.
The electric power cost is the current rate obtained by McEwen Copper.
Wear part (liners, cladding) consumption for major equipment were taken from vendor recommendations where provided. Where vendor information was not obtained, a percentage of the equipment purchase price was applied to estimate the parts costs.
General maintenance supplies were estimated by applying a percentage of the total equipment purchase cost for a given area.
Sulfur pricing is based on recommended pricing from an external source at $315/tonne delivered to site (Ellzey Zissos & Associates).
Power generated by the acid plant was used to offset grid power. Additional details about power can be found in Section 14.
Additional details for sulfuric acid consumption can be found in Section 14.
The operating and maintenance unit supplies costs are summarized in Table 18.11.
Table 18.11: Unit Supply Assumptions | ||
|---|---|---|
Item |
Units |
$/unit |
General |
|
|
Crushing Operating Availability |
% |
75% |
SX/EW Operating Availability |
% |
98% |
Operating Days per Year |
day/yr |
365 |
Shifts per Day |
- |
2 |
Hours per Shift |
hr |
12 |
Operating Hours per Year, at availability, Crush/Stack |
hr/yr |
6570 |
Convert Tonnes to Pounds |
t/lb |
2204.6 |
Operating Hours per Year, at availability, SX/EW |
hr/yr |
8585 |
Power |
|
0 |
Electric Power |
$/kWhr |
$0.064 |
Crushing Power |
kWhr/t |
3.05 |
Heap Leach Power |
kWhr/t |
7.50 |
SX/TF Power/Utilities Usage |
kWhr/t |
1.07 |
EW Power |
kWhr/t Cu |
1900 |
Reagents |
|
|
Sulfuric Acid - Gross Consumption |
kg/t |
18 |
Elemental Sulfur |
$/t |
$315 |
Table 18.11: Unit Supply Assumptions | ||
|---|---|---|
Item |
Units |
$/unit |
Sulfuric Acid Cost – External Supply to Site |
$/t |
$200 |
Acid Plant Sulfuric Acid Cost – Site Production |
$/t |
$109.32 |
Cobalt (CoSO4-5H2O) |
$/lb Cu |
0.00185 |
Guar |
$/lb Cu |
0.000737 |
FC-1100 |
$/lb Cu |
0.0000318 |
Diluent |
gal/day |
435.88 |
|
$/gal |
3.91 |
Extractant |
gal/day |
81.89 |
|
$/gal |
33.41 |
Sulfuric Acid – SX/EW |
t/day |
2 |
Maintenance |
|
|
Heap Leach Pad Maintenance Cost |
$/t |
$0.13 |
Acid Plant Cost |
$/t Elemental Sulfur |
$25.00 |
SX/EW Maintenance Cost |
$/lb Cu |
$0.010 |
The process operating costs are summarized in Table 18.12 for life-of-mine (LOM) values on a cost per tonne processed and pound of copper produced basis.
Table 18.12: Life of Mine Operating Cost Summary | |||
|---|---|---|---|
Cost USD |
$/tonne* |
$/lb Cu |
|
Labor |
$ 270,444,328 |
$0.27 |
$0.04 |
Reagents |
$ 1,397,475,535 |
$1.38 |
$0.19 |
Power |
$ 874,214,157 |
$0.87 |
$0.12 |
YPF Repayment Distribution |
$ 892,093,179 |
$0.88 |
$0.12 |
Maintenance |
$ 368,287,305 |
$0.36 |
$0.05 |
Table 18.12: Life of Mine Operating Cost Summary | |||
|---|---|---|---|
Consumables |
$ 69,684,895 |
$0.07 |
$0.01 |
Total Processing Costs |
$ 3,872,199,400 |
$3.83 |
$0.54 |
*Per tonne processed, excluding capitalized preproduction material placement on leach pad costs
Labor costs are built up from preliminary staffing plans and include crushing, leaching, SX/EW, and acid plant staffing on 2-week rotation/12-hour shifts for operations and process maintenance staff including an allowance for absenteeism. Staffing extends from Plant General Manager level and below only.
Electric power requirements and costs are net of acid plant generation on site. YPF Luz power infrastructure financing costs are repaid in Years 1-15, value reflects proportional distribution based on the power consumed.
Maintenance costs include materials, consumables, and supplies only; maintenance labor costs are included in the Labor estimates.
Miscellaneous costs include the Power Provider Agreement (PPA) recoupment of the YPF Luz powerline and Calingasta substation investments, equivalent to approximately $0.0686/kWh increase on power costs during the payback term (15 years).
General & Administrative (G&A) Operating Costs
The General and Administrative (G&A) costs cover all costs associated with maintaining a regional office in San Juan, a Logistic area and camp for road construction at Calingasta, and necessary site administration and general services at the Los Azules mine site. Taxes and royalties are included in the financial model separately from G&A. Labor rates assume Korn Ferry October 2021 labor cost models data for Argentina and local burdens/on-costs converted to USD provided by McEwen on July 22nd, 2025 MEMO (doc. number 0000ADM-FS-0000-E13-MEM-0003).
The overall combined G&A cost estimated for these areas is approximately $88 million per year with category breakouts provided below in Table 18.13.
Table 18.13: Consolidated G&A (San Juan, Calingasta, Los Azules Site) | ||
|---|---|---|
|
Annual Costs |
Basis |
Building Maintenance |
$ 3,116,166 |
Location based allowances |
Consumable |
$ 123,000 |
Location based allowances |
Fuel |
$ 145,992 |
Based on light vehicles count @ 315lt of fuel by month |
Light Vehicle |
$ 1,152,000 |
Location based allowances |
Table 18.13: Consolidated G&A (San Juan, Calingasta, Los Azules Site) | ||
|---|---|---|
|
Annual Costs |
Basis |
PPEs (Personal Protective Equipment) |
$ 1,803,269 |
based on staffing count @310 $/month/person |
Salaries |
$ 12,135,874 |
Location based allowances |
Software |
$ 1,274,461 |
Location based allowances |
Support Equipment |
$ 608,228 |
Location based allowances |
Training |
$ 1,162,156 |
Location based allowances |
Transport |
$ 2,468,770 |
Based on staffing count, external and internal transport |
Energy |
$ 864,545 |
Location based allowances |
Rent |
$ 348,000 |
29.000 $ monthly for San Juan Office |
Equipment & Materials |
$ 625,627 |
Location based allowances |
Subcontracts |
|
|
Communications |
$ 314,000 |
Location based allowances |
Community |
$ 180,000 |
Location based allowances |
Emergency-ER |
$ 634,000 |
Location based allowances |
Environment - Monitoring |
$ 855,000 |
Location based allowances |
Finance |
$ 392,608 |
Location based allowances |
H&S |
$ 15,000 |
Location based allowances |
HHRR |
$ 366,872 |
Location based allowances |
Legal |
$ 436,400 |
Location based allowances |
Medical |
$ 4,205,000 |
Location based allowances |
Permits |
$ 78,800 |
Location based allowances |
Process |
$ 18,500 |
Location based allowances |
Road Maintenance |
$ 7,707,871 |
Location based allowances |
Table 18.13: Consolidated G&A (San Juan, Calingasta, Los Azules Site) | ||
|---|---|---|
|
Annual Costs |
Basis |
Waste Management |
$ 13,680,000 |
$1,140,000 monthly |
IT Services |
$ 7,244,330 |
Location based allowances |
Security |
$ 3,630,000 |
Location based allowances |
Camp operation |
$ 18,905,717 |
Based on staffing count @$48 /day/person |
HHRR Misc |
$ 1,212,036 |
Location based allowances |
T&S Cost Repayment SG&A * |
$ 1,539,000 |
Electrical connection repayment, Proportion of G&A energy consumption over the total annual energy |
Allowance |
$ 812,778 |
Location based allowances |
Total |
$ 88,056,000 |
|
*Annual value for year 2 onward as Electrical Connection repayment starts in Q3 Year 1. Variable according to the proportion of G&A energy consumption over the total annual energy.
Los Azules Site
Los Azules site costs refer to expenses not included in direct mining and processing operations, as well as labor costs related to essential administrative and site services (safety, security, purchasing and warehousing, and camp operations). The overall combined G&A cost estimated for this location is provided below in Table 18.14.
Table 18.14: Los Azules Site G&A | ||
|---|---|---|
Building Maintenance |
$ 2,427,567 |
Location based allowances |
Consumable |
$ 108,000 |
Location based allowances |
Fuel |
$ 145,992 |
Based on light vehicles count @ 315lt of fuel by month |
Energy |
$ 864,545 |
Location based allowances |
Light Vehicles |
$ 900,000 |
Location based allowances |
PPEs (Personal Protective Equipment) |
$ 1,803,269 |
based on staffing count @ $310 /month/person |
Table 18.14: Los Azules Site G&A | ||
|---|---|---|
Salaries |
$ 6,346,115 |
Location based allowances |
Software |
$ 1,274,461 |
Location based allowances |
Support Equipment |
$ 5,000 |
Location based allowances |
Training |
$ 118,674 |
Location based allowances |
Transport |
$ 987,129 |
Based on staffing count, internal transport @ $2,340 month/bus |
Equipment & Materials |
$ 625,627 |
Location based allowances |
Subcontracts |
|
Location based allowances |
Communications |
$ 314,000 |
Location based allowances |
Emergency-ER |
$ 619,000 |
Location based allowances |
Environment - Monitoring |
$ 855,000 |
Location based allowances |
Finance |
$ 392,608 |
Location based allowances |
H&S |
$ 15,000 |
Location based allowances |
Legal |
$ 436,400 |
Location based allowances |
Medical |
$ 4,205,000 |
Location based allowances |
Permits |
$ 78,800 |
Location based allowances |
Process |
$ 18,500 |
Location based allowances |
Waste Management |
$ 13,680,000 |
Location based allowances |
IT Services |
$ 6,923,330 |
Location based allowances |
Security |
$ 2,178,000 |
Location based allowances |
Camp operation |
$ 16,491,028 |
Based on staffing count @ $48 /day/person |
T&S Cost Repayment SG&A |
$ 1,539,000 |
Electrical connection repayment, Proportion of G&A energy consumption over the total annual energy |
Allowance |
$ 590,202 |
Location based allowances |
Los Azules Site G&A Sub-Total |
$ 63,942,247 |
|
Staffing levels were built up from typical staffing for similar types of operations by job type and include staffing above the area general manager levels for mining and processing. The Los Azules Site staffing plan only considers the necessary site activities, minimizing the on-site requirements in favor of locations at Calingasta or San Juan.
A G&A staffing plan for the Los Azules site contingent is shown in Table 18.15 below.
The Los Azules Camp Services are based on site staffing estimates and allowances for temporary workers, contractors, and direct staff, excluding the camp service staff that are included in the camp rate. Camp rates are based on current camp costs per person from regional remote camp data and current camp costs at Los Azules. Camp loading for the project on average is shown in Table 18.16 below.
Table 18.15: Site Camp Planning | |
|---|---|
Mine |
282 |
Process |
106 |
G&A Site Staff |
117 |
Contractors |
250 |
Camp Ops/Services |
94 |
Visitors/Executive |
40 |
Accommodation inefficiencies and allowance* |
28 |
Total Beds |
969 |
*Accommodation inefficiencies as 3%, allowance of 10%, both over the contractors’ beds
Table 18.16: Los Azules Site Based G&A Staffing and Cost | |||
|---|---|---|---|
|
No. Per Shift |
Total Personnel |
Gross Cost (Includes absenteeism) |
|
|
|
USD/Year |
Los Azules Site |
|
|
|
Contracts superintendent |
1 |
1 |
$ 124,459 |
Logistics superintendent |
1 |
1 |
$ 124,459 |
Procurement superintendent |
1 |
1 |
$ 124,459 |
Warehouse superintendent |
1 |
1 |
$ 124,459 |
Contracts head |
1 |
1 |
$ 84,720 |
Operation services head |
1 |
2 |
$ 169,439 |
Contracts analyst |
3 |
3 |
$ 137,805 |
Product exportation analyst |
1 |
1 |
$ 45,935 |
Supply chain analyst |
3 |
3 |
$ 137,805 |
Logistics analyst |
1 |
1 |
$ 35,156 |
Stock procurement analyst |
1 |
1 |
$ 35,156 |
Table 18.16: Los Azules Site Based G&A Staffing and Cost | |||
|---|---|---|---|
|
No. Per Shift |
Total Personnel |
Gross Cost (Includes absenteeism) |
|
|
|
USD/Year |
Construction/civil superintendent |
1 |
1 |
$ 124,459 |
Electromechanical superintendent |
1 |
1 |
$ 124,459 |
Road chief |
1 |
1 |
$ 84,720 |
Management control & ci. supervisor |
1 |
1 |
$ 66,188 |
Road supervisors |
2 |
4 |
$ 264,754 |
Geosynthetics supervisor |
1 |
2 |
$ 110,574 |
Mechanical supervisor |
1 |
2 |
$ 110,574 |
Security superintendent |
1 |
1 |
$ 124,459 |
Security chief |
1 |
1 |
$ 84,720 |
Security Sr supervisor |
1 |
2 |
$ 132,377 |
Security analyst |
2 |
4 |
$ 183,740 |
Human resources chief soft |
2 |
2 |
$ 169,439 |
HR Sr analyst |
2 |
2 |
$ 91,870 |
HR Jr analyst |
2 |
2 |
$ 70,311 |
IT chief |
2 |
2 |
$ 169,439 |
Network specialist |
2 |
2 |
$ 132,377 |
VHF Communication specialist |
1 |
2 |
$ 132,377 |
IT Sr. Analyst |
4 |
4 |
$ 183,740 |
IT Jr. Analyst |
4 |
4 |
$ 140,623 |
Superintendent of environment |
1 |
1 |
$ 124,459 |
Head of environment |
1 |
1 |
$ 84,720 |
Head of permits |
1 |
1 |
$ 84,720 |
Table 18.16: Los Azules Site Based G&A Staffing and Cost | |||
|---|---|---|---|
|
No. Per Shift |
Total Personnel |
Gross Cost (Includes absenteeism) |
|
|
|
USD/Year |
Sr. environmental management supervisor |
1 |
2 |
$ 132,377 |
Sr. supervisor monitoring |
1 |
2 |
$ 132,377 |
Waste technician |
1 |
2 |
$ 110,574 |
Monitoring technician |
1 |
2 |
$ 110,574 |
Superintendent of H&S |
1 |
1 |
$ 124,459 |
Head of security |
1 |
1 |
$ 84,720 |
Emergency brigade chief |
1 |
1 |
$ 84,720 |
H&S Supervisor |
3 |
6 |
$ 397,130 |
Brigade leader |
1 |
2 |
$ 132,377 |
Health supervisor |
1 |
2 |
$ 132,377 |
Obligations supervisor |
1 |
1 |
$ 66,188 |
Occupational hygienist |
1 |
2 |
$ 91,870 |
H&S coach |
1 |
2 |
$ 91,870 |
H&S analyst |
1 |
2 |
$ 91,870 |
Brigade member on site |
3 |
6 |
$ 275,610 |
Obligations technician |
1 |
1 |
$ 45,935 |
Project control manager |
1 |
1 |
$ 210,271 |
Management analyst |
1 |
2 |
$ 91,870 |
Calingasta Site
The Calingasta site will house logistics facilities that will support the transport of personnel and equipment to site. The G&A cost for the temporary camp for access road construction is considered here.
The location will also include accommodation for transient staff and staging areas for busing to the Los Azules site. Calingasta site G&A costs estimated for this location are provided below in. Table 18.17.
Table 18.17: Calingasta Site G&A | ||
|---|---|---|
Calingasta Site G&A |
Annual Costs |
Basis |
Salaries |
$ 805,418 |
Location based allowances |
Building Maintenance |
$ 216,316 |
Location based allowances |
Light Vehicle |
$ 192,000 |
Location based allowances |
Support Equipment |
$ 603,228 |
Location based allowances |
Training |
$ 204,000 |
Location based allowances |
Subcontracts |
|
|
Community |
$ 180,000 |
Location based allowances |
Emergency-ER |
$ 15,000 |
Location based allowances |
Road Maintenance |
$ 7,707,871 |
Location based allowances |
IT Services |
$ 240,000 |
Location based allowances |
Security |
$ 924,000 |
Location based allowances |
Camp Operation |
$ 2,414,689 |
Based on average of -1Y staffing count @62 $/day/person |
Allowance |
$ 125,793 |
Location based allowances |
Calingasta Site G&A Sub-Total |
$ 13,628,315 |
|
Staffing levels were built up from community-area-estimated projected future support requirements once a camp is in place.
A preliminary G&A Staffing plan for the Calingasta site contingent is shown in Table 18.18 below.
Table 18.18: Calingasta Staffing | |||
|---|---|---|---|
|
No. Per Shift |
Total Personnel |
Gross Cost (Includes absenteeism) |
|
|
|
USD/Year |
Calingasta Site |
|
|
|
Local content superintendent |
1 |
1 |
$ 124,459 |
Local content head |
1 |
1 |
$ 84,720 |
Local content analyst |
2 |
2 |
$ 70,311 |
ESG manager |
1 |
1 |
$ 210,271 |
Head of community relations |
1 |
1 |
$ 84,720 |
Community relations technician |
1 |
1 |
$ 45,935 |
Community relations technician |
2 |
2 |
$ 91,870 |
Community advisor (external) |
2 |
2 |
$ 46,566 |
Social worker |
2 |
2 |
$ 46,566 |
The Calingasta Camp Services are based on road maintenance and construction staffing, and allowances for temporary workers, contractors, and direct staff, excluding the camp service staff that are included in the camp rate. Camp rates are based on subcontractors’ estimates of costs per person. Camp loading for the project on average is expected to be approximately 50 permanent and temporary staff at any one time. The facilities will be constructed in advance of the start of the project to support exploration and mine site activities
ACMSA/McEwen Copper San Juan Regional Office
The San Juan Regional office will be the main administrative center for the Los Azules project operations and regional interests. All administrative tasks that do not need to be located at site on a full-time basis are included in this location. G&A costs estimated for this location are provided below in Table 18.19.
Table 18.19: San Juan Office G&A | ||
|---|---|---|
San Juan Office G&A |
|
|
Building Maintenance |
$ 472,283 |
Location based allowances |
Table 18.19: San Juan Office G&A | ||
|---|---|---|
Consumable |
$ 15,000 |
Location based allowances |
Light Vehicle |
$ 60,000 |
Location based allowances |
Salaries |
$ 4,984,341 |
Location based allowances |
Training |
$ 839,482 |
Location based allowances |
Rent |
$ 348,000 |
29.000 $ monthly for San Juan Office |
Transport |
$ 1,481,641 |
Based on staffing count, transport to Site @ $2,400 month/bus |
HR Subcontract |
$ 366,872 |
Location based allowances |
IT Services |
$ 81,000 |
Location based allowances |
Security |
$ 528,000 |
Location based allowances |
HHRR Misc |
$ 1,212,036 |
Location based allowances |
Allowance |
$ 96,783 |
Location based allowances |
Total general |
$ 10,485,438 |
|
Staffing levels were built up from projected future support requirements once a camp is in place.
A preliminary G&A Staffing plan for the San Juan Regional Office contingent is shown in Table 18.20 below.
Table 18.20: San Juan Office Staffing | |||
|---|---|---|---|
|
No. Per Shift |
Total Personnel |
Gross Cost (Includes absenteeism) |
|
USD/Year |
||
San Juan Offices |
|||
Project / construction director |
1 |
1 |
$ 210,271 |
Assistant |
1 |
1 |
$ 45,935 |
Finance manager |
1 |
1 |
$ 210,271 |
Table 18.20: San Juan Office Staffing | |||
|---|---|---|---|
|
No. Per Shift |
Total Personnel |
Gross Cost (Includes absenteeism) |
Finance chief |
1 |
1 |
$ 84,720 |
Budget and cost control chief |
1 |
1 |
$ 84,720 |
Tax coordinator |
1 |
1 |
$ 66,188 |
Treasurer and responsible for attention to suppliers |
1 |
1 |
$ 66,188 |
Finance sr. analyst |
3 |
3 |
$ 137,805 |
Enterprise resource planning analyst |
1 |
1 |
$ 45,935 |
Cost control and budget analyst |
3 |
3 |
$ 105,467 |
Accounts payable analyst |
2 |
2 |
$ 70,311 |
Management control superintendent |
1 |
1 |
$ 124,459 |
Management control supervisor |
1 |
1 |
$ 66,188 |
Continuous improvement analyst |
1 |
1 |
$ 45,935 |
Administration assistant |
1 |
1 |
$ 20,948 |
Admin & commercial manager |
1 |
1 |
$ 210,271 |
External commerce analyst |
1 |
1 |
$ 45,935 |
Administrative assistant |
1 |
1 |
$ 45,935 |
Senior procurement analyst |
1 |
1 |
$ 45,935 |
Engineering & construction manager |
1 |
1 |
$ 210,271 |
Infrastructure jr supervisor |
2 |
2 |
$ 110,574 |
Civil supervisor |
1 |
2 |
$ 110,574 |
Process engineering superintendent |
1 |
1 |
$ 124,459 |
Head of document control |
1 |
1 |
$ 84,720 |
Table 18.20: San Juan Office Staffing | |||
|---|---|---|---|
|
No. Per Shift |
Total Personnel |
Gross Cost (Includes absenteeism) |
Senior electrical engineer / lead electrical engineer |
1 |
1 |
$ 45,935 |
Senior control engineer / senior process control engineer |
1 |
1 |
$ 45,935 |
Process engineer |
1 |
1 |
$ 45,935 |
Cost control |
1 |
1 |
$ 45,935 |
HR & admin manager |
1 |
1 |
$ 210,271 |
HR superintendent SJ |
1 |
1 |
$ 124,459 |
IT/OT superintendent |
1 |
1 |
$ 124,459 |
Applications & OT leader (G&A, mining tech) |
1 |
1 |
$ 84,720 |
Infrastructure leader |
1 |
1 |
$ 84,720 |
IT project management |
1 |
1 |
$ 66,188 |
Administrative assistant |
1 |
1 |
$ 66,188 |
Comms Sr analyst |
1 |
1 |
$ 45,935 |
Logistics analyst |
1 |
1 |
$ 45,935 |
Comms Jr analyst |
1 |
1 |
$ 35,156 |
Health and safety manager, hygiene and permits |
1 |
1 |
$ 210,271 |
Permitting superintendent |
1 |
1 |
$ 124,459 |
Occupational medical |
1 |
2 |
$ 169,439 |
Permissions supervisor |
1 |
1 |
$ 66,188 |
Permits technician |
1 |
1 |
$ 45,935 |
Head of water resources |
1 |
1 |
$ 84,720 |
Water resources assistant |
1 |
1 |
$ 23,283 |
Table 18.20: San Juan Office Staffing | |||
|---|---|---|---|
|
No. Per Shift |
Total Personnel |
Gross Cost (Includes absenteeism) |
Legal and institutional affairs manager |
1 |
1 |
$ 210,271 |
Superintendent of institutional affairs |
1 |
1 |
$ 124,459 |
Legal superintendent |
1 |
1 |
$ 124,459 |
Legal senior |
2 |
2 |
$ 132,377 |
Geographic information systems technician |
1 |
1 |
$ 66,188 |
Legal junior |
2 |
2 |
$ 110,574 |
Institutional affairs analyst |
1 |
1 |
$ 45,935 |
economic analysis
CAUTIONARY statement
This Report contains forward-looking statements, including but not limited to: economic and study parameters; Mineral Reserve and Resource estimates; project costs and timelines; mining methods and recoveries; processing and production rates; metallurgical recovery projections; infrastructure needs; capital, operating, and sustaining cost estimates; life of mine projections; NPV, IRR, and capital payback period; future metal prices; environmental assessments; regulatory processes; stakeholder engagement; reclamation obligations; financing needs; environmental risks; and economic conditions.
These statements are based on opinions and estimates as of the report date and are subject to material risks and uncertainties beyond McEwen Inc’s control. Key assumptions include:
No significant disruptions to project development and operations.
Availability and pricing of consumables, services, labor, and materials as assumed.
Permitting and stakeholder arrangements proceeding as expected.
Timely receipt of all required approvals, licenses, and authorizations.
Applicable tax rates and allocations remain consistent.
Financing availability for planned activities.
Timelines for exploration and development proceed as projected.
Assumptions underpinning Mineral Reserve and Resource estimates and financial analysis remain valid, including geological interpretations, grades, commodity prices, mining recoveries, hydrology, hydrogeology, and cost estimates.
Economics are reported on a 100% basis.
The production schedules and financial analysis presented use conceptual years for illustrative purposes only. Further technical studies and project financing pathways may alter project assumptions and specific timelines.
This Feasibility Study (FS) supports a Mineral Reserve declaration, with the mine plan and financial analysis based on Proven and Probable Mineral Reserves as defined under NI 43-101 standards. The FS provides a higher level of confidence than previous studies, but like all forward-looking information, there is no guarantee that results, estimates, or projections will be realized as anticipated.
Methodology Used
Samuel Engineering conducted a discounted cash flow analysis for the Los Azules Project. The technical and cost inputs were developed by Samuel Engineering, with specific data provided by McEwen. These inputs were reviewed in detail and deemed reasonable.
The analysis was performed on a stand-alone project basis, using a combination of quarterly and annual cash flows discounted at 8% on a beginning of period basis for the first period and end-of-period basis for the remaining periods. The economic evaluation was conducted as of the start of construction (year -3), based on Q1 2025 US dollars.
Sunk costs (expenditures incurred before construction) are excluded from the economic analysis. The accuracy of this evaluation aligns with the capital cost estimate, with an expected range of -15% to +15%.
Financial Model Parameters
Technical-economic parameters used in the model are summarized in the following sections. Table 19.1 and Table 19.2 present the model inputs used in the economic analysis based on third quarter, 2025 US dollars.
Table 19.1: Common Model Inputs | |||
|---|---|---|---|
Area |
Description |
Units |
Values |
General |
Tonnes Processed |
Billion Tonnes |
1.02 |
Tonnes Waste Mined |
Billion Tonnes |
1.68 |
|
Strip Ratio |
|
1.65 |
|
Copper Production – LOM Cu Cathode |
t x 1,000 |
3,279 |
|
Nominal Cu Cathode Production - LOM |
TPY |
148,175 |
|
Construction Period |
Years |
3 |
|
Mine Life |
Years |
21 |
|
Operating Life |
Years |
22.1 |
|
Closure Duration |
Years |
13 |
|
Metal pricing |
Copper price |
US$/lb |
4.35 |
Cost criteria |
Estimate basis |
US$ |
third quarter 2025 |
Inflation/currency fluctuation |
|
None |
|
Leverage |
% Equity |
100% |
|
Income tax |
Argentina Corporate Income |
% Profit |
25% |
Table 19.1: Common Model Inputs | |||
|---|---|---|---|
Area |
Description |
Units |
Values |
Royalties / payments |
San Juan Province |
% “Mine Mouth” |
3% |
TNR Royalty |
% NSR |
0.4% |
|
McEwen Royalty |
% NSR |
1.25% |
|
Transportation, smelting, and refining charges |
Shipping (Point of Sale – Site) |
US$/tonne Copper |
$88.00 |
Brokerage Fee |
US$/lb Copper |
$0 |
|
Export Retentions |
Argentine Export Retention |
% NSR |
0% |
Capital Costs
The total life of mine capital cost is estimated at $5.70 billion, including $3.17 billion during preproduction, $345 million for working capital, and $2.19 billion in sustaining capital over the mine life. Table 19.2 summarizes the capital cost over the mine life.
Table 19.2: Life of Mine Capital Cost Summary ($000s) | |
|---|---|
Description |
Cost |
Mine |
|
Mining Equipment Spares |
47,778 |
Mine Services & Supplies |
0 |
Mining Equipment |
357,553 |
Pre-production Mining |
326,665 |
Heap Leach Pad |
|
Leach Pad Services & Supplies |
281,845 |
Process Plant |
|
Processing Equipment |
457,728 |
Processing Spare Parts/Consumables/First Fills |
17,678 |
Table 19.2: Life of Mine Capital Cost Summary ($000s) | |
|---|---|
Description |
Cost |
Plant Construction Materials |
66,396 |
Access Road Construction |
93,554 |
Processing Plant Services |
549,932 |
YPF Transmission Line & Substations Equipment |
0 |
YPF Transmission Line & Substations Infrastructure |
0 |
Pre-production Processing |
34,765 |
Pre-production G&A |
141,675 |
Plant Construction Balance |
792,380 |
Total Preproduction Capital |
3,167,950 |
Sustaining & Spare Parts |
2,186,687 |
Working Capital (Initial) |
345,351 |
Total LOM Capital Cost |
5,699,987 |
Operating Costs
The total LOM operating cost is estimated at $12.0 billion, or $11.92 per tonne of mineralized material processed. Over the life of operation, the direct operating cost per pound of copper produced is $1.67.

Figure 19.1: The percentage splits of each LOM operating cost component. (SE 2025)
Note that the processing cost is slightly higher in the economic evaluation than in the operating cost section of the report. In the economic evaluation, the repayment cost to YPF for the electrical substation and power line are included in the unit power rate. These costs come into operation during years 1 through 16 of the operating life.
Royalties
The Los Azules project is subject to multiple royalties paid on sales of copper:
Mine-mouth Royalty
Provincial (San Juan) Royalty: A 3% mine-mouth royalty on gross revenue less non-mining expenses. Capital expenditures benefiting the public, including the access road and the power transmission line, were used to offset up to 70% of the annual royalty fee.
NSR-Based Royalties:
TNR Royalty: 0.4% NSR
McEwen Royalty: 1.25% NSR
These royalties are calculated by deducting shipping, ocean freight, smelter treatment and refining charges, from total gross revenue.
The royalties paid over the life of operation are summarized in Table 19.3 below.
Table 19.3: Project Royalties | |||
|---|---|---|---|
Category |
UoM |
Annual Average |
LOM |
Mine-Mouth |
|||
Table 19.3: Project Royalties | |||
|---|---|---|---|
Category |
UoM |
Annual Average |
LOM |
San Juan Province |
US$ (000s) |
$10,789 |
$238,780 |
|
|
||
NSR |
|
|
|
TNR Royalty |
US$ (000s) |
$5,632 |
$124,642 |
MUX Royalty |
US$ (000s) |
$17,600 |
$389,506 |
|
|
||
Total Royalties |
US$ (000s) |
$34,021 |
$752,928 |
Taxes
On 27 June 2024, the Congress of Argentina passed Law No. 27742, known as the “Ley Bases” or RIGI (Incentive Regime for Large Investments). Among other provisions, the law offers several incentives:
Tax incentives: These include a fixed 25% income tax rate, asset amortization incentives, VAT payment incentives, the ability to carry forward losses, and reduced dividend taxes (7%, decreasing to 3.5% after seven years).
Exemptions from withholding income tax: These apply to international payments related to projects that qualify as "long-term strategic projects."
Import and export tax exemptions: These include the free import of goods and the export of products without local provider mandates.
Foreign exchange benefits: These include the unrestricted payment of dividends and interest in foreign currency, and partial exemptions from repatriating export proceeds (20% after two years, 40% after three years, 100% after four years, with earlier exemptions for strategic projects).
Free distribution of project products: This applies without local market preferences.
Stability guarantee: A 30-year stability period for the incentive regime, with the option to adopt more favorable future rules.
On February 11, 2025, ACM applied for RIGI admission as a Single Project Vehicle and has been formally accepted as of October 13, 2025 (McEwen Inc. Press release). With acceptance, the evaluation of project economics has included these incentives in the results.
The Los Azules project is subject to payment of various types of taxes over the life of operation. The rules for treatment and offsetting these taxes are summarized below:
Export Retention Tax: With the adoption of the RIGI (Incentive Regime for Large Investments) in Argentina, along with the 4.5% export tax on the value of metals at the point of export no longer applies to the Los Azules Project. This represents substantial savings to the project over the life of operation.
Value-Added Tax (VAT):
Capital Costs: 10.5% VAT on initial and sustaining capital.
Recovery Schedule:
Initial Capital: 99% recovered, split equally over the two years following expenditure.
Sustaining Capital: 99% recovered the year after expenditure.
Operating VAT: 21% VAT on all non-labor operating expenses, with 99% recovered.
A further operating VAT: 27% VAT on the energy portion of the electrical power expenses, also with a 99% recovery.
VAT for domestic sales is collected in the same year, while the remaining portion is recovered the following year.
Corporate Taxes and Banking Fees:
Corporate Profit Tax: 25%
Debit & Credit Bank Tax: 1.2% of gross in-country sales, recovered against corporate income tax in the same year
Operating Bank Tax: 1.2% on non-labor operating expenses, with 100% recovery in the same year, also against income tax.
Economic Results
This Feasibility Study (FS) supports a Mineral Reserve declaration, providing an advanced assessment of the project's economics. The study incorporates Proven and Probable Reserves, ensuring a higher level of confidence in mine planning and production schedules. All financial and operational estimates are based on FS-level engineering, permitting considerations, and economic modeling.
The Business Case for the Los Azules bioleach project, based on the copper price assumption of $4.35/lb, is summarized below in Table 19.4 below.
Table 19.4: Economic Results Summary | ||
|---|---|---|
Project Metric |
Unit |
Number |
Mine Life |
Years |
21 |
Tonnes Processed |
Billion tonnes |
1.023 |
Tonnes Waste Mined |
Billion tonnes |
1.684 |
Strip Ratio |
1.65 |
|
Total Copper Grade (CuT) |
% CuT |
0.453% |
Soluble Copper Grade (CuSOL) |
% CuSOL |
0.312% |
Total Copper Recovery |
% |
70.8% |
Copper Production (LOM avg.) |
tonnes/yr |
148,200 |
Copper Production (Yrs 1-5) |
tonnes/yr |
204,800 |
Copper Production – cathode Cu |
k |
3,279 |
Initial Capital Cost |
USD Millions |
$3,168 |
Sustaining Capital Cost |
USD Millions |
$2,131 |
Capital Intensity, based on average LOM production |
$/t Cu /yr |
$20,249 |
Capital Intensity, based on LOM capex & production |
$/t Cu |
$1,616 |
Closure Costs |
USD Millions |
$386 |
C1 Cost (Life of Mine) |
USD/lb Cu |
$1.71 |
All-in Sustaining Costs (AISC) |
USD/lb Cu |
$2.11 |
AISC Margin |
% |
52% |
Before Taxes |
||
Net Cumulative Cashflow |
USD Millions |
$12,723 |
Internal Rate of Return (IRR) |
% |
24.3% |
Net Present Value (NPV) @ 8% |
USD Millions |
$4,280 |
After Taxes |
||
Table 19.4: Economic Results Summary | ||
|---|---|---|
Project Metric |
Unit |
Number |
Net Cumulative Cashflow |
USD Millions |
$9,647 |
Internal Rate of Return (IRR) |
% |
19.8% |
Net Present Value (NPV) @ 8% |
USD Millions |
$2,940 |
Pay Back Period |
Years |
3.9 |
The project NPV at 8% discount rate breaks even at a copper price of $3.10 per pound.
The Project’s LOM cash flow results are summarized in Table 19.5.
Table 19.5: Detailed Cashflow


Note: Table 19.6 includes in the totals but does not show: (1) Mine closure and site monitoring costs ($259M) incurred in years 24-35; (2) Working Capital recapture ($123M) in year 24; and (3) IVA recapture ($6M) in year 24 Table 19.7 through Table 19.8 and Figure 19.2 through Figure 19.7 show the relative sensitivity of NPV and IRR as capital and operating costs and copper price change in the Base Case Cu economic model.
Sensitivity Analysis
The sensitivity analysis shows that the Project is the most sensitive to copper price changes. Operating and capital cost changes have a lower impact on Project NPV than the former variable.
Table 19.6: Copper Price Sensitivity | ||||||
|---|---|---|---|---|---|---|
Metal Pricing |
Pre-Tax |
Post-Tax |
||||
Copper Price |
NPV |
IRR |
Payback |
NPV |
IRR |
Payback |
Cu/lb |
$M |
% |
Years |
$M |
% |
Years |
$2.35 |
($2,083) |
0% |
36.00 |
($2,083) |
0% |
36.00 |
$2.55 |
($1,442) |
0% |
21.06 |
($1,457) |
0% |
21.21 |
$2.75 |
($760) |
4% |
10.94 |
($869) |
3% |
15.85 |
$2.95 |
($123) |
7% |
8.33 |
($364) |
6% |
8.99 |
$3.15 |
$509 |
10% |
6.34 |
$122 |
9% |
7.57 |
$3.35 |
$1,142 |
13% |
5.31 |
$596 |
11% |
6.31 |
$3.55 |
$1,771 |
16% |
4.68 |
$1,066 |
13% |
5.56 |
$3.75 |
$2,398 |
18% |
4.24 |
$1,534 |
15% |
5.01 |
$3.95 |
$3,025 |
20% |
3.70 |
$2,003 |
16% |
4.62 |
$4.15 |
$3,652 |
22% |
3.43 |
$2,471 |
18% |
4.30 |
$4.35 |
$4,280 |
24% |
3.22 |
$2,940 |
20% |
3.87 |
$4.55 |
$4,907 |
26% |
3.01 |
$3,408 |
21% |
3.61 |
$4.75 |
$5,532 |
28% |
2.86 |
$3,875 |
23% |
3.42 |
$4.95 |
$6,154 |
30% |
2.72 |
$4,339 |
24% |
3.27 |
$5.15 |
$6,775 |
32% |
2.60 |
$4,803 |
26% |
3.11 |
$5.35 |
$7,396 |
33% |
2.48 |
$5,267 |
27% |
2.98 |
$5.55 |
$8,016 |
35% |
2.37 |
$5,730 |
29% |
2.86 |
Table 19.6: Copper Price Sensitivity | ||||||
|---|---|---|---|---|---|---|
Metal Pricing |
Pre-Tax |
Post-Tax |
||||
Copper Price |
NPV |
IRR |
Payback |
NPV |
IRR |
Payback |
Cu/lb |
$M |
% |
Years |
$M |
% |
Years |
$5.75 |
$8,636 |
37% |
2.27 |
$6,193 |
30% |
2.76 |
$5.95 |
$9,256 |
38% |
2.16 |
$6,656 |
31% |
2.67 |
$6.15 |
$9,875 |
40% |
2.05 |
$7,118 |
32% |
2.58 |
$6.35 |
$10,493 |
41% |
1.96 |
$7,580 |
34% |
2.50 |
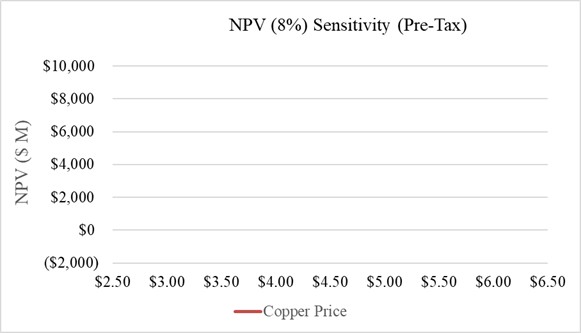
Figure 19.2: Copper Price per Pound Sensitivity on NPV @ 8% (Pre-tax) (SE 2025)

Figure 19.3: Copper Price per Pound Sensitivity on IRR (Pre-tax) (SE 2025)
Table 19.7: CAPEX Sensitivity (Initial + Sustaining) | ||||||
|
Sensitivity (%) /Item |
Pre-Tax |
Post-Tax |
||||
NPV |
IRR |
Payback |
NPV |
IRR |
Payback |
|
$M |
% |
Years |
$M |
% |
Years |
|
-50% |
$6,300 |
47% |
1.70 |
$4,605 |
39% |
2.12 |
-40% |
$5,896 |
41% |
1.99 |
$4,272 |
33% |
2.52 |
-30% |
$5,492 |
35% |
2.35 |
$3,939 |
29% |
2.84 |
-20% |
$5,088 |
31% |
2.64 |
$3,606 |
25% |
3.16 |
-10% |
$4,684 |
27% |
2.92 |
$3,273 |
22% |
3.48 |
0 |
$4,280 |
24% |
3.22 |
$2,940 |
20% |
3.87 |
10% |
$3,875 |
22% |
3.51 |
$2,606 |
18% |
4.41 |
20% |
$3,471 |
20% |
3.88 |
$2,273 |
16% |
4.78 |
30% |
$3,067 |
18% |
4.40 |
$1,940 |
14% |
5.21 |
40% |
$2,663 |
16% |
4.77 |
$1,607 |
13% |
5.67 |
50% |
$2,259 |
14% |
5.20 |
$1,274 |
12% |
6.15 |
Table 19.8: OPEX Sensitivity | ||||||
|---|---|---|---|---|---|---|
Sensitivity (%) |
Pre-Tax |
Post-Tax |
||||
NPV |
IRR |
Payback |
NPV |
IRR |
Payback |
|
$M |
% |
Years |
$M |
% |
Years |
|
-50% |
$6,852 |
31% |
2.66 |
$4,873 |
26% |
3.18 |
-40% |
$6,337 |
30% |
2.75 |
$4,487 |
24% |
3.29 |
-30% |
$5,823 |
29% |
2.85 |
$4,100 |
23% |
3.40 |
-20% |
$5,308 |
27% |
2.95 |
$3,713 |
22% |
3.52 |
-10% |
$4,794 |
26% |
3.07 |
$3,326 |
21% |
3.67 |
0 |
$4,280 |
24% |
3.22 |
$2,940 |
20% |
3.87 |
Table 19.8: OPEX Sensitivity | ||||||
|---|---|---|---|---|---|---|
Sensitivity (%) |
Pre-Tax |
Post-Tax |
||||
NPV |
IRR |
Payback |
NPV |
IRR |
Payback |
|
$M |
% |
Years |
$M |
% |
Years |
|
5% |
$4,022 |
24% |
3.29 |
$2,746 |
19% |
4.00 |
15% |
$3,508 |
22% |
3.44 |
$2,359 |
18% |
4.32 |
25% |
$2,993 |
20% |
3.61 |
$1,973 |
16% |
4.54 |
35% |
$2,479 |
19% |
3.86 |
$1,585 |
15% |
4.79 |
45% |
$1,964 |
17% |
4.29 |
$1,198 |
13% |
5.11 |

Figure 19.4: Multiple % Sensitivity on NPV @ 8% (Pre-tax) (SE 2025)

Figure 19.5: Multiple % Sensitivity on NPV @ 8% (Post-tax) (SE 2025)

Figure 19.6: Multiple % Sensitivity on IRR (Pre-tax) (SE 2025)

Figure 19.7: Multiple % Sensitivity on IRR (Post-tax) (SE 2025)
Mine Life and Capital Payback
The operating life of Los Azules Base Case is estimated at 21 years, assuming a nominal production rate of 50 million tonnes per year of ore feed. This excludes a 3-year construction and preproduction stripping period. At a copper price of $4.35 per pound, the initial capital pre-tax payback period is projected to be 3.2 years and 3.9 years post-tax, after the start of commercial mining.
adjacent properties
Disclaimer: McEwen Copper has not independently verified exploration results or technical reports for the adjacent properties. Any information provided regarding these properties is derived from publicly available sources and does not imply economic, legal, or operational interest by McEwen Copper.
The Los Azules project is surrounded by several mining properties, with two notable projects to the south:
Rincones de Araya (Fortescue Metals Group) – A copper exploration project owned by the Institute of Exploration and Mining Operations (IPEEM), an autonomous entity of the San Juan provincial government that promotes mining development in the province. IPEEM offers mining areas to third parties through risk contracts for exploration, with the option for exploitation, following regulated bidding processes. This project is located immediately south of Los Azules, with Fortescue Metals Group as the most recent exploration operator. Publicly available information on Fortescue's exploration activities and the resource potential in this area is limited (IPEEM, 2025).
Altar Project (Aldebaran Resources Inc.) – A copper-gold porphyry deposit located southeast of Los Azules, hosted within the same Miocene porphyry belt. The Altar project has undergone multiple exploration campaigns; Aldebaran has reported significant porphyry-style copper mineralization in recent technical disclosures. (Aldebaran Resources, 2025).
Public disclosures from Fortescue and Aldebaran indicate ongoing exploration in these areas; however, McEwen Copper has not independently verified their results or resource estimates, and such information is not necessarily indicative of mineralization on the Los Azules project. Given the potential for shared geological structures or hydrothermal systems between these projects Los Azules, further consideration may be warranted for regional exploration synergies.
Regional Property Boundaries
The western boundary of the Los Azules property is defined by the Chilean border.
other relevant data and information
UPSIDE POTENTIAL
Potential scenarios for future operations beyond the initial phase of the project described in the Feasibility Study information in this report considering the primary copper sulfide materials were developed. Two approaches were considered, one employing Nuton® Technology and secondly, a conventional copper concentrator, which are presented and discussed below. Mineral Resources (Inferred) and any Measured or Indicated classified material not included in the project basis in this report were considered in this analysis.
The conventional concentrator case was used to validate the Mineral Resource basis used in this report considering the current lack of commercial applications of the Nuton® Technology. As such, only the milling case is reported here. The Mineral Resources estimated were considered in the scenarios considered in this Section.
The information in this section is commensurate with an Initial Assessment level of study and considered to be at the exploration stage of investigation; consequently, this information is preliminary in nature and includes Inferred Mineral Resources in the conceptual mine plan and mine production schedules presented. Inferred Mineral Resources are considered too speculative geologically and in other technical aspects to enable them to be categorized as Mineral Reserves under the standards set forth in S-K 1300. There is no certainty that the estimates in this section will be realized.
CONVENTIONAL MILLING OPTION
As a basis for the Mineral Resource estimation the future Phase 2 project option employing a proven conventional copper concentrator that produces a copper concentrate as the final product for export was updated from the 2023 IA scenario developed for similar purposes. This option leverages the initial project crushing and screening operations in the leach system processing facilities, to process the predominantly primary copper mineralization material.
The milling facilities could be brought online in Year 23 at the completion of the current project Feasibility Study basis at a processing rate of 75 million tonnes per year (206,000 tonnes per day) through completion of the potential project in Year 56 adding up to 33 years to the Los Azules mine life. Crushing and stacking systems initially commissioned for use in the heap leaching process could be repurposed to provide ball mill feed and enable filtered tailings transport/storage options. Tailings storage management design would provide for a lined facility with filtered tailings (dry stacked) deposition for the applicable life of mine operations to minimize environmental impacts and freshwater usage.
A Filtered Tailings Storage Facility (FTSF) for the 2023 IA and the same concepts were used in this analysis. This section presents the conceptual design associated with the FTSF. The FTSF footprint is established based on the property limits of the Los Azules site and the surface mining limits identified. Alternatives within the property limits and outside the surface mining limits were identified in the alternatives evaluation and potentially provide additional capacity to the facility; however, for the purposes of the 2023 IA document, the entire facility considered is within the surface property and mining rights of the project.
The previous heap leach project will continue to drain down and go into closure over time. All stockpiled and newly mined Supergene material and Primary material will be fed directly to the copper. The conceptual mill will consist of three processing lines with two ball mills fed with minus P80 19mm crushed product produced by the existing crushing circuit expanded to 75,000 million tonnes per annum (206,000 tonnes per day) throughput. Each line is equipped with conventional rougher, cleaner and scavenger flotation circuits to process the material. Each line can process up to 70,000 tonnes or material per day.
The copper concentrator will produce grades and total recovery as prescribed in Table 21.10 matching lock-cycle testing reported in Section 10.
Table 21.1: Optimized Lock-cycle Flotation Results | |||||||
Composite |
Concentrate Wt. % Of Feed |
Copper Concentrate Grade |
Recovery % |
||||
Ag g/t |
Au g/t |
Cu % |
Ag |
Au |
Cu |
||
Primary |
1.45 |
97 |
3.79 |
31.96 |
68.8 |
62.9 |
93.2 |
Supergene |
2.1 |
28.6 |
3.58 |
28.53 |
54.0 |
65.6 |
89.3 |
The supergene and primary material can be treated in a float mill with NSR cutoffs of $5.13/t and $5.11/t, respectively. NSR values are based on a copper price of $4.80/lb, gold at $2,500/oz and silver at $32/oz where applicable. Variable pit slopes between 32° and 37° were applied depending on sector. Based on the Mineral Resource pit developed, mining physicals developed by Whittle Consulting using their proprietary Prober software (Run EVG4122B) product for the ~34 year mine life. The annual Mill feed rates and grades are shown in Figure 21.6 below.

Figure 21.6: Annual Mill Feed Tonnes and Grades Operating costs estimated for this option are summarized in Table 21.11 below per tonne processed and equivalent pound of copper (includes gold and silver by-product values).
Table 21.2: Mill Option Direct Operating Cost Summary | |||
OPEX |
|
|
|
Summary |
|
||
Mining OPEX |
LOM |
$ Millions |
$11,393 |
|
Annual Average |
$ Millions |
$352 |
|
Per ton ore |
$/t |
$4.69 |
|
Per Lb Cu |
$/lb Cu |
$0.93 |
Processing OPEX |
LOM |
$ Millions |
$11,016 |
|
Annual Average |
$ Millions |
$340 |
|
Per ton ore |
$/t |
$4.54 |
|
Per Lb Cu |
$/lb Cu |
$0.90 |
SG&A |
LOM |
$ Millions |
$2,812 |
|
Annual Average |
$ Millions |
$87 |
|
Per ton ore |
$/t |
$1.16 |
|
Per Lb Cu |
$/lb Cu |
$0.23 |
TOTAL OPEX |
LOM |
$ Millions |
$25,220 |
|
Annual Average |
$ Millions |
$779 |
|
Per ton ore |
$/t |
$10.39 |
|
Per Lb Cu |
$/lb Cu |
$2.06 |
|
|
|
|
Potential copper metal payable annual production from concentrate based on the inputs considered is shown Figure 21.7 below.

Figure 21.2: Mill Option Payable Copper Production Estimates
In addition to copper, gold and silver are recovered in the copper concentrates Payable gold over the life of the mill option is estimated to be 2.08 million ounces (approximately 64,060 ounces per year). Payable silver is estimated to be 64.2 million ounces (approximately 1.98 million ounces per year).
Capital costs were escalated from the 2023 IA basis and an additional crushing and milling line added to achieve the required throughput of 206,000 tonnes per day. Capital requirements are shown below in Table 21.12 for the 33-year project life. A four-year project development period was completed during the final four years of the Feasibility project basis mine life.
Table 21.3: Mill Option Capital Costs Summary | ||
Capital Expenditures |
|
|
Mining Fleet |
US$ |
1,540,816,000 |
Initial Capex |
US$ |
354,680,000 |
Sustaining Capex |
US$ |
1,186,136,000 |
|
|
|
Plant |
7,166,837,500 |
|
Initial Mill Capex |
US$ |
4,640,000,000 |
Sustaining Capex |
US$ |
2,526,838,000 |
Crushing Systems (replacement) |
US$ |
187,500,000 |
Regenerative Permanent Camp (future) |
US$ |
99,200,000 |
Tailings Sustaining (1,488Mt Capacity) |
US$ |
967,200,000 |
Mill/Other Sustaining |
US$ |
744,000,000 |
Infrastructure Sustaining (Incremental) |
US$ |
528,937,500 |
The financial summary for an option using a conventional mill and Mineral Resource metal pricing ($4.80/lb Cu; $2,500/oz Au; and $32.00/oz Ag) is presented in Table 21.13.
Table 21.4: Mill Option Economic Model Summary | ||
|---|---|---|
Project Metrics – Mill Case | ||
Project Metric |
Unit |
Value |
Mine Life |
Years |
33 |
Tonnes Processed |
Billion tonnes |
2,282 |
Tonnes Waste Mined |
Billion tonnes |
2,396 |
Strip Ratio |
1.05 |
|
Total Copper Grade (CuT) |
% CuT |
0.261% |
Total Copper Recovery |
% |
92.8% |
Payable Copper Production (LOM avg.) |
tonnes/yr |
170,324 |
Payable Copper Production – LOM |
kilotonnes |
5,515 |
Payable Gold Production (LOM avg.) |
Ounces/yr |
64,060 |
Payable Gold - LOM |
Million Ounces |
2.076 |
Payable Silver Production (LOM avg.) |
Million Ounces/yr |
1.98 |
Payable Silver - LOM |
Million Ounces |
64.2 |
Initial Capital Cost |
USD Millions |
$4,995 |
Sustaining Capital Cost |
USD Millions |
$3,486 |
Capital Intensity, based on average LOM production |
$/t Cu /yr |
$29,325 |
Table 21.4: Mill Option Economic Model Summary | ||
|---|---|---|
Project Metrics – Mill Case | ||
Project Metric |
Unit |
Value |
Capital Intensity, based on LOM capex & production |
$/t Cu |
$1,538 |
Closure Costs |
USD Millions |
$382 |
C1 Cost (Life of Mine) |
USD/lb Cu |
$2.54 |
All-in Sustaining Costs (AISC) |
USD/lb Cu |
$2.91 |
AISC Margin |
% |
46% |
Before Taxes |
|
|
Net Cumulative Cashflow |
USD Millions |
$24,754 |
Internal Rate of Return (IRR) |
% |
13.1% |
Net Present Value (NPV) @ 8% |
USD Millions |
$3,728 |
After Taxes |
|
|
Net Cumulative Cashflow |
USD Millions |
$18,790 |
Internal Rate of Return (IRR) |
% |
10.9% |
Net Present Value (NPV) @ 8% |
USD Millions |
$2,031 |
Pay Back Period |
Years |
7.0 |
CONCLUSIONS
The information in this section is at the exploration stage of investigation; consequently, this information is preliminary in nature and includes Inferred Mineral Resources in the conceptual mine plan and mine production schedules presented. Inferred Mineral Resources are considered too speculative geologically and in other technical aspects to enable them to be categorized as Mineral Reserves under the standards set forth in S-K 1300. There is no certainty that the estimates in this section will be realized.
The analysis does support the assumption that a Reasonable Prospect for Eventual Economic Extraction (RPEEE) as required by S-K 1300 is demonstrated with a conventional mill scenario.
interpretation and conclusions
The Technical Report is prepared in accordance with the standards and guidelines set forth by 17 CFR Part §229.1300 (S-K 1300) Standard Instructions for Regulation S-K subpart 1300 SEC S-K §229. 1304 and §229.601(b)(96) for the required disclosure of material information and in the opinion of the QPs in each area of responsibility and collectively, the information and analyses support the requirements for a feasibility level of study.
The contributing authors and QP’s have identified important interpretations, conclusions, and recommendations to advance the Project. A complete description of these is provided in the following sub-sections. These include what is believed to be the most significant risks and opportunities to the future development of the Los Azules project.
Overall Risks and Opportunities Summary
The work completed for the Los Azules Feasibility Study reported here is believed to meet all reasonable requirements for information and analysis that would be expected, at the direction of the respective QPs. As a feasibility study level of investigation, the information presented still includes the risks and opportunities for the technical and economic outcomes that should be expected for similar types of studies.
The project costs are expressed in constant Q3 2025 United States Dollars and foreign currency conversion without escalation or inflation. The inflation risk in Argentina is unique and has the potential to fluctuate differently than typical global macroeconomic factors would warrant. This volatility may positively or negatively impact on the expected economics shown.
Key Project Risks
Social license and political risks are acknowledged for the project. A social engagement strategy and actions are developed and being implemented. Regular interactions with local, Provincial and National government entities are an ongoing focus area. The project is believed to have local and regional support based on measured outcomes. National elections in late 2025 showed no potential for potential impacts to the current political climate.
Geotechnical risk in the open pit mine design and potential for pit slope failure has been studied and represents the most significant technical risk on the project. The suggested slopes for the pit are based on limited geotechnical information. The slope angles presented assume a low consequence of failure, with an associated target factor of safety of 1.2. Additional work and analyses are recommended to continue to refine the understanding of impacts and potential mitigation strategies as the mine develops over its life.
Geohazards (seismic, avalanche, rockfall) have been assessed at the project site and access route. Significant risks exist and design changes have been made to minimize personnel and facilities risks where severe or extreme risks were identified. These mitigations should be reviewed during the final design process and continued analysis over the life of the project is recommended.
Seismic and geotechnical risks in the heap leach pad area have been assessed, and significant risks are present at Los Azules. Design mitigations have been included to minimize impacts and potential environmental damage. Weather events have been considered in the containment strategy and process pond designs. These mitigations steps should be reviewed during the final design process and continued analysis over the life of the project is recommended.
Water management and conservation mitigations and strategies have been developed for the project to minimize the potential for ground water impact and contamination. Contact water potential has been minimized, and contact water and wastewater are reintroduced and used in the process to avoid discharges and minimize freshwater use. Non-contact water conservation and redirection into the existing aquifers have been a priority in site design development.
Glacier and geoforms studies have been conducted annually to assess potential ice or water containing structures. Site layouts and access routes have been developed to avoid contact or impact to these potential regional water sources.
The most significant risk in the processing area is the performance of the bio-heap leaching system as considered. The technology is well proven in multiple mine applications like Los Azules; however each site is unique in how the systems are designed and operated. Mitigation strategies have been considered for the Los Azules project to reduce potential performance variations.
Sulfur supply and cost for acid production are areas for potential fluctuations in the economics of the project. A confirmed supply source or sources will be required once a project development decision has been made to advance project implementation and production.
Key Project Opportunities
The Environmental Impact Assessment (EIA) for Los Azules was granted on December 3, 2024. This approval resulted in the issuance of the Environmental Impact Statement (Declaración de Impacto Ambiental, DIA), confirming that the project meets applicable environmental standards. The DIA represents a key permitting milestone and provides the regulatory foundation for advancing the project towards execution and future operations.
Los Azules was accepted into Argentina’s Large Investment Incentive Regime (RIGI) on September 26, 2025. The regime provides tax, foreign exchange and stability for 30 years. In addition, legal certainty has been provided along with foreign exchange regulations that allow leaving export proceeds abroad (that would reach 100% by the time the project is expected to start exports), and access to international arbitration in case of disputes.
The copper price used for Mineral Reserves estimation ($4.30/lb) and economic evaluation ($4.35/lb) are approximately 15% below the current LME market price at the report effective date and offer some upside of potential revenues (Press Release date October 7, 2025 LME 3-month forward contract $4.78/lb Cu from LME website). At $4.78/lb, project metrics would improve to:
Table 22.1: Financial Highlights @ $4.78/lb | ||
Pre-Tax | ||
LOM Cashflow |
$ Millions |
$15,737 |
LOM Net Present Value |
$ Millions |
$5,626 |
LOM IRR |
% |
28.4% |
Project Payback Period |
Years |
2.8 |
| ||
Post-Tax | ||
LOM Cashflow |
$ Millions |
$11,909 |
LOM Net Present Value |
$ Millions |
$3,945 |
LOM IRR |
% |
23.1% |
Project Payback Period |
Years |
3.4 |
The YPF repayment adds $1,039 million ($1.03/tonne processed or $0.14/lb Cu) to the direct operating costs over a 15-year period. The Los Azules project also bears all the costs for sub-station upgrades that would be useful for other mining projects in the area. An alternative means of financing this infrastructure and potential sharing of costs with other mining project interests in the region present a significant opportunity to reduce capital and operating costs as presented in this study.
Exploration has shown that there are multiple porphyry targets near to the Los Azules deposit that could provide further extension to mine life. Exploration of the newly identified targets will start in Q4 2025. High priority targets near to Los Azules include Tango, Porfido Norte, Franca, and Mercedes.
Metallurgy and Mineral Processing
Interpretation and Conclusions
The Los Azules Project will process copper ore from the Los Azules open pit mining operation over a mining life of 20 years with one additional year of low-grade stockpile reclaim and a processing life of just over 22 years. The processing methodology selected for the project employs a hydrometallurgical recovery process which includes bio-heap leaching of crushed ore followed by solvent extraction/electrowinning (SX/EW) recovery of copper as LME Grade A cathodes for sale to industry.
The recovery methodology is appropriate for the deposit type and copper mineralogy. Bio-heap leaching and SX/EW copper recovery is mature technology for similar copper deposits with appropriate copper mineralogy and commercially practiced widely for over 50 years around the world. The hydrometallurgical
copper recovery approach also aligns most closely with the McEwen Copper environmental and social license strategies and objectives to produce copper cathodes for sale.
Copper recovery is based on a 3-year leaching period to recover copper in three active leaching cycles of 90-120 days. Each cycle represents one layer of ore placed and then solution applied for the active period. Subsequent cycles are achieved as new layers are added over top. The total time required will vary with the leach pad shape and configuration and leaching cycles may occur more rapidly in practice.
Sulfuric acid requirements are based on an average gross acid consumption of 18 kg of 100% acid/tonne ore leached. In the SX/EW process, 1.54 tonnes of sulfuric acid are regenerated for every tonne of copper produced in electrowinning, which directly off-sets a portion of the leaching acid requirements. As grades and recoverable copper amounts vary over the life of mine, acid consumption will also vary.
Total calculated life-of-mine copper recovery ~70.8%, including a heap operational scale-up efficiency at 95% applied to the metallurgical extraction estimated from the testwork. A total of 3,279,329 tonnes (7.23 million pounds) of copper cathode is estimated to be produced over the life of the mine as currently understood.
Copper recovery is directly related to the amount of copper and types of copper mineralogy in each tonne of material mined. Actual recovery will vary as these parameters vary over time. Copper production predicted in the financial analysis relies on the block grades mined. The recovery predicted benchmarks well to similar copper bio-leach commercial operations that have publicly reported their recovery performance information. There are opportunities for improvement in both timing and actual recovery estimated as well as some downside risks, the rage of outcomes over time is expected to fall within +/-5%.
Variability has been sampled and tested for all significant geologic and mineralogic domains and has included parallel testing to validate the response. Adjustments to the expected crushing circuit product size distributions have also been considered.
A heap leach performance factor of 95% from the testing column results has been applied to account for inefficiencies in the heap solution flows and other factors.
Operating flexibility has been included in the agglomeration system, aeration system, and leach flow controls to allow for changing conditions.
Risks
The most significant risk in the processing area is the performance of the bio-heap leaching system as considered. Copper recovery is directly related to the amount of copper and copper mineralogy in each tonne of material mined. Actual recovery will vary as these parameters vary over time. Copper production predicted in the financial analysis relies on the block grades as mined.
The technology is well proven in multiple mine applications like Los Azules, however each site is unique in how the systems are operated. The following mitigation strategies have been considered:
Variability has been sampled and tested for all significant geologic and mineralogic domains and has included parallel testing to validate the response. Adjustments to the expected crushing circuit product size distributions have also been considered.
A heap leach performance factor of 95% from the testing column results has been applied to account for inefficiencies in the heap solution flows and other factors.
A three-year recovery period, extended from one year testing results, provides practical consideration of leaching cycles and timing of material placement and solution flows in a commercial operation.
Operating flexibility has been included in the agglomeration system, aeration system, and leach flow controls to allow for changing conditions.
The aeration system has been designed to be implemented at any time it could be required. Initially, this system is expected to be necessary after three lifts of ore have been placed, however the distribution piping will be included at each lift as the pads are built. The portable blowers can be purchased and brought online at any time. Blower delivery time is approximately 6 months.
A “thermofilm” polyethylene covering on active leaching areas is included in the design to minimize heat losses and water evaporation.
Potential power supply outages may be experienced given the high wind and sever weather potential at the site and along the routes. Mitigation measures included in the project design include:
On-site power generation from acid plant waste heat and solar installations at site provide a source not connected to the main supply transmission line. The acid plant cogenerates steam for electric power up to approximately 13.6MW per acid plant module installation, offsetting 15-20% of site electricity demand.
Backup (~20 MW) diesel generators ensure critical systems, primarily raffinate leach solution recirculation, and occupied buildings and offices remain operational. Diesel fuel storage for up to 72 hours is maintained on site, which can be extended with mining equipment fuel rationing or cessation.
The electrowinning rectifiers are equipped with trickle power diesel generators to maintain circuit polarity during short term outages. Longer term outages greater than 8 hours without re-fueling would require circuit shutdowns and electrode isolation.
Sulfur supply and cost are a potential risk to the economics of the project. A confirmed supply source or sources will be required once a project development decision has been made to advance the project into implementation and production.
Opportunities
Acid consumption in leaching is the largest single cost item for the processing areas. Continued work to optimize acid consumption by lithologic types may be possible and result in reduced acid requirements.
The current leach testing program has included some optimization testing with initially positive results in the following areas:
LixTRA™ surfactant leaching aide (BASF product) to support better ore wetting and more effective solution distribution in the pad. The benefits would be improved copper recovery and leach performance time.
Sulfur addition into the leach system at agglomeration. Sulfur can be introduced with the ore to support acid requirements and add in-situ heat to the leaching ore. The benefits would be improved copper recovery and leach performance time with temperature and reduction of acid plant capital. Power co-generated in the acid plant would be proportionally reduced.
As the heap matures and heat retention is improved, the cycle time for the copper extraction may be reduced and/or copper recovery may be increased.
The SX/EW facility produces a nominal 210,000 tonnes of LME Grade A copper cathode per year with a design maximum of 240,000 tonnes achieved by increasing the rectifier current output and cathode current density from 320 amps per square meter of plating area to 360 amps per square meter. The capacity allows for catch-up, and if additional copper is leached, it can be produced within this capacity limit.
Crushing plant and SX/EW plant final selections and commitments may allow for improved delivery time and design allowance reductions. Technology vendors have indicated the potential for a reduced delivery schedule and cost optimizations in the detailed design.
Nuton® Technology Opportunity
Nuton Technology offers a proprietary approach leveraging several existing technologies, operational practices, and modeling methods used in the copper bio-leaching industry into a tailored copper extraction solution based on each deposit’s unique geologic and mineralogic features.
The Nuton Technology, where possible, would use the existing processing facilities to support the operation, where the material would be leached on a new pad with Pregnant Leach Solution (PLS) pumped back to the existing Solvent Exchange & Electrowinning facility.
Applying Nuton Technology at Los Azules would also align well with the existing infrastructure, processing facilities, and extend the low-carbon footprint and minimize water consumption, the design basis for the project.
Several copper projects are currently investigating the potential for Nuton Technology, publicly reporting similar results. Some processes similar to the Nuton Technology have been commercially applied at operations in Zijinshan Copper Mine (China), Monywa Copper Mine (Myanmar), and at Cobre del Mayo (Mexico). A large-scale Nuton demonstration facility is currently under construction at the Gunnison Copper Corporation Johnson Camp Mine in Arizona, with start-up expected in late 2025 (https://nuton.tech/partnerships/johnson-camp-mine).
Based on the outcomes from the preliminary analysis the Nuton Case development is recommended to continue to be evaluated after the conclusion of the current Los Azules FS work to a pre-feasibility study level.
Additional sampling and testwork would be required to validate the current results. It is assumed that this PFS would be a standalone activity developed in parallel with the initial project execution.
If the PFS work remains positive, a future study at the Feasibility level would likely involve on-site piloting of the process on a large scale to ensure all aspects of the Los Azules opportunity could be considered. Materials would be obtained from early mining activities expected to encounter predominantly primary copper mineralization.
Pit Geotechnical
Interpretations and Conclusions
The suggested slopes for the pit are based on very limited geotechnical information. Drilling to date has focused on mineral resource and not the pit walls and has typically been within vertical holes, which is common at this stage of the study. Below-surface discontinuity and structural data are not available, so kinematic assessments and inclusion of structure behind the pit walls in rock mass stability assessments have not been possible.
Gaps in the knowledge base are anticipated to be addressed through investigation programs leading up to the feasibility study, including inclined holes oriented into the proposed pit walls, televiewing of holes, geotechnical logging, laboratory testing, triple tube coring, and hydrogeological investigations.
The slope angles presented assume a low consequence of failure, with an associated target factor of safety of 1.2. This assumption is based on the planned outwardly extending pit shell, which gives the opportunity to adapt the pit wall slope angles based on prior performance. The assumption is that pit wall failures may not sterilize significant processable materials, as failures can be excavated and post-failure pit walls adapted accordingly. Outwardly expanding walls can be replanned based on actual conditions encountered.
Risks
Investigations reveal that the rock (intact strength, rock mass strength, alteration, structure, weathering) influencing stability of the pit walls is worse than assumed, resulting in shallower design slopes.
Faults and other structures cause issues with some orientations of the pit walls.
The phreatic surface/pore pressure behind the pit walls is worse than assumed, due to regional hydrogeology or ineffective dewatering of the pit walls. This may result in potential for shallower slopes.
A seismic event triggers slope failure (seismic stability will be reviewed in feasibility once adequate information regarding the pit wall rock is available; however, an event larger than the design event could occur).
Slope failure due to structural or rock mass concerns, not identified during any investigations. Whilst impending slope failure may be identified through planned pit wall monitoring and performance reviews during operation, and therefore may not affect worker safety, instabilities can sterilize processable materials and/or slow down operations within the pit.
Natural geohazards, such as landslides, adversely affect the pit walls or interfere with safe pit operation. There has been some debate over the interpretation of natural slides or glacial features on the mountain forming the east wall.
Poor blasting techniques result in bench-scale issues.
Low consequences of failure are no longer appropriate, and a higher target factor of safety is required, resulting in shallower pit slopes.
Pit slope failure damages infrastructure. The latest infrastructure plan shows the primary crusher very close to the pit crest; this may not be accounted for in the agreed low consequence designation and associated target factor of safety. Regardless of the consequence classification, and FOS adopted, pit failures do occur in practice and factor of safety does not eliminate probability of failure. A pit failure at this location could impact the primary crusher.
Overburden is thicker than the average assumed by the pit designers. This would reduce the overall slope angles further. Overburden thickness is currently under investigation; estimates to date are largely based on commencement of coring rather than bedrock interface resulting in some uncertainty.
Waste rock facility (WRF) failure results in flow of waste rock into the pit impacting safety and production. The WRF run-out distance for the FS has been assumed to be an empirical average for dry slopes. Whilst there is some buffer off-set in addition to the predicted run-out zone, empirical data shows scatter and wet/partially wet conditions may exist which may increase run-out distance.
The WRF triggers pit wall instability. Stability analyses conducted by the WRF team indicate target FOS are achieved for WRF to pit failure.
The pit slopes are potentially very high, and the rock is poor quality. There is little globally published empirical performance data for similar rock conditions and pit slope heights, which is a risk for the project.
Opportunities
Investigations reveal the rock (intact strength, rock mass strength, alternation, structure, weathering) influencing stability of the pit walls is better than assumed, resulting in steeper design slopes. Pit wall rock may be less fractured and/or stronger than rock hosting the resource (investigated to date) and /or enhanced geotechnical investigations may promote better recovered rock quality.
Televiewer data indicates the structure is not adversely oriented and/or the rock is less fractured in-situ than recovered in core, allowing steeper slopes.
Laboratory testing reveals the intact rock is stronger than previously assumed. To date, there have only been 24 UCS tests and reliance for intact compressive strength has been on point load testing with the absence of a site-specific, unit-specific conversion to UCS.
Overburden is thinner than the average assumed by the pit designers. This would reduce the overall slope angles further. Overburden thickness is currently under investigation; estimates to date are largely based on commencement of coring rather than bedrock interface.
The phreatic surface/pore pressure behind the pit walls is lower than assumed, due to regional hydrogeology or more effective dewatering of the pit walls. This may result in potential for steeper slopes.
Investigations reveal the rock (intact strength, rock mass strength, alternation, structure, weathering) influencing stability of the pit walls is better that assumed, and further review by the WRF team reduces the run-out zone of the WRF, resulting in the potential to reduce the WRF offset to the pit.
MINE PLAN AND MINING METHODS
Interpretations and Conclusions
The conventional open-pit mining method was selected because of the deposit’s geometry, size, and proximity to surface. Based on the pit optimization outcomes and to support practical access to mineralized areas, pit designs for the ultimate pit and twelve interim phases were generated. The interim phases were used to derive the mining sequence with the goal of maximizing feed grades in the early years of production, as well as balancing stripping requirements. Los Azules is a single large open pit.
The mine schedule targets the crushing of a maximum 50 Mtpa of leach material with an initial ramp-up period to allow the process plant to come online. Oxide and enriched material are sent to the crusher or to a stockpile to be processed later in the mine schedule. The material is crushed and then conveyed and stacked on the Heap Leach Facility.
The mine plan assumes conventional truck-and-shovel operations. Waste and ore will be drilled and blasted, loaded by hydraulic shovels and loaders, and transported by haul trucks. The equipment fleet will be capable of mining up to approximately 175 Mt/a. The haul truck fleet will increase over time as haulage distances grow due to increasing depth of the pit and length of the waste storage facility. The mine production fleet currently assumes the use of electric shovels and drills, and diesel-powered autonomous haul trucks.
The planned open pit will operate for 21 years, and an additional two years of pre-production. Total life of mine heap leach production will be 1.023 billion tonnes grading 0.453% copper. The overall mine waste will be 1.684 billion tonnes resulting in an overall mine strip ratio of 1.65:1 (waste:ore). Mine waste will be stored in two waste rock storage facilities with the main one to the northeast of the Los Azules pit.
Proper management of groundwater will be important to maintaining pit slope stability; the east wall is sensitive to geotechnical parameters, and the adjustments to the parameters in the fault weakened zone should be evaluated.
PROJECT INFRASTRUCTURE
Access & Transportation
This is the main access route, connecting Calingasta to the Project site via a 124 km gravel road. The Project is currently accessed from San Juan via National Route (RN) 40 for 58 km, turning west on Provincial Route (RP) 436, and continuing west along National Route (RN 149) to Calingasta. From there, the Exploration Road leads to the project site, crossing eight rivers and two high-altitude mountain passes, La Totora high pass (4,170 mASL) and Cabeza de Leon High Pass (4,300 mASL) before arriving at the Project location at 3,390 mASL.
The Los Azules Project currently has two existing access roads.
Primary Access – Exploration Road: the main site access, upgraded for larger vehicles, but limited to seasonal use at present.
Secondary Access – Southern Road: a longer but lower-altitude alternative route, identified for year-round operations and requiring upgrades for operational logistics.
The Exploration Road is currently being designed and will be upgraded further to allow for construction and operations to be used early in the project development timeline. Three Sections have been developed to allow concurrent improvement. Section 3 follows a new route to avoid high mountain passes and glaciers along the current path.
The nearest major supply and service hub is Mendoza, located 275 km by road from Calingasta. Mendoza Serves as a logistic center for fuel, sulfur and industrial materials, and hosts Argentina’s largest international airport in the region (MDZ). The city also houses YPF’s Luján de Cuyo refinery, which processes 113,200 barrels per day of crude oil, including desulfuration and fuel production relevant for mining operations.
Other important regional centers include:
San Juan (UAQ): The provincial capital, a secondary regional airport and mining support hub.
Santiago, Chile: Located 270 km southwest (400 km by road from Calingasta), a key trade and transport link to Chilean ports.
The Los Azules project requires robust transport infrastructure for the movement of materials, equipment and final product (copper cathodes). The project’s export options include both Argentine and Chilean Ports.
Argentine Inland Port: Rosario (via road or rail transport through the Cañada Honda depot in San Juan)
Chilean Seaports: Valparaiso, Ventanas, San Antonio and Coquimbo in Chile.
Copper cathodes will be transported south via RP 149 to Uspallata, and then to Chile over RN 7 towards one of the three major ports. The distances from RN 149-RN 153 junction (near Barreal) to these ports are:
Ventanas: 380 km
Valparaíso: 410 km
San Antonio: 440 km
Most of this distance is paved, except for 37 km of gravel road on RN 149 in Mendoza Province. This segment is passable year-round, and there is a high likelihood that it will be paved before the project is fully developed.
Camp Facilities
The current camp design for the initial camp is located adjacent to the existing 156 Camp site and was developed by McEwen Copper and Modular Homes as a baseline to be included in the Feasibility Study for the Los Azules project. The initial camp design includes construction sequencing and phasing to accommodate the required camp program and need for available beds, a proposed site layout, and a basis of estimate.
The Los Azules Project would initially rely on the existing modular 156 camp and additional phased modular camp facilities for eventual accommodation of up to 3,048 workers at a peak capacity in 2028.
McLennan Design developed an overall master plan concept for the Los Azules mine (Figure 15.9). Following the completion of the feasibility study, alternate site locations and architectural modifications for the initial camp design will be evaluated in accordance with the master plan.
The master plan identified placement of the initial camp adjacent to the mine processing facilities. The initial camp is designed as a campus supporting the Los Azules mine early works, construction activities, and eventual mining operations and logistics. The ultimate camp size is designed for approximately 3,000 beds to accommodate the construction efforts and will be downsized once operations begin to initially accommodate approximately 1,000 site-based staff.
A conceptual Regenerative Camp facility has been developed by McLennan Design for long-term operations staff housing. This camp facility could be built later in the project life once a location, concepts, timing and costs are finalized. The current FS sustaining capital costs do not include this facility. This would be developed as a stand-alone project once adequate definition is completed.
Power Supply
The engineering phase for power supply infrastructure is ongoing. Power infrastructure will comply with Argentine (IRAM, IEC) and international electric standards. Engineering accounts for seismic risk, high-altitude conditions up to 4200 mASL, and extreme temperatures. The Environmental Impact Assessment (IIA) includes studies for electromagnetic field exposure, transmission corridor impact, and mitigation strategies. Permitting and regulatory approvals are in progress, with the need for a Sectorial Environmental Permit before construction begins.
YPF Luz and McEwen Copper entered a Memorandum of Understanding (MOU) outlining the intended terms to provide power for the Los Azules Project (YPF Luz, 2024). A rate of $0.064/kWh based on a minimum 15-year term is considered in this Feasibility Study based in the terms of an agreement reached in May 2025.
The MOU with YPF Luz also includes the installation of the sub-station at Calingasta and transmission line to the site. YPF Luz will also expand the existing ET Rodeo 500/132 kV substation to interconnect with the 500 kV Rodeo-Calingasta transmission line, which currently operates at 132 kV but was originally designed for 500 kV. The investment cost recovery scheme has been agreed between YPF Luz and McEwen Copper in May 2025.
Power will be supplied from the Argentinian grid via the Calingasta Transformer Station (ET Calingasta) 500/220/132 kV. A double-circuit 220 kV overhead transmission line will extend 122 km long from ET Calingasta to the Los Azules Substation (ET Los Azules) 220/24.9 kV. At high altitudes, overhead transmission lines must be designed for a higher nominal voltage than their operating level (e.g., a 500 kV line operated at 220 kV). The reduced air density at elevation lowers the dielectric strength of air, increasing the risk of electrical breakdown. To mitigate this, phase-to-phase distances must be increased, which in turn raises the line reactance. Consequently, voltage drop becomes a critical design factor.
Initially, the project will require approximately 39/36 MW (gross/net demand), in year -1, increasing to a peak of 157/129 MW (gross/net demand) in year 10 as the processing facilities are expanded and mine power requirements increase over time. System design considers gross demand; net load includes acid plant generation capability.
Water Supply
Hydrological and hydrogeological baseline studies have been conducted since 2011, integrating flow measurements, water chemistry, and groundwater quality studies. Additionally, data is available on water tables, water chemistry, and hydraulic characteristics of aquifers. This information offers insights into their storage capacity, recharge rates, and groundwater flow directions, among other key parameters.
Surface water monitoring has been ongoing since 2012 in the Mine Area (covering La Ballena, Frío, La Embarrada, and Salinas River sub-basins) and Access Road (Calingasta river basin). By 2022, the network expanded to 33 monitoring points between the Mine Area and the Access Road.
For groundwater, seven piezometers monitor shallow and deep aquifers, with data from four wells dating back to 2012. Three additional monitoring wells were installed in 2022.
Water quality has been analyzed against multiple regulatory frameworks, including Argentine National Law N° 24.585 (1995), as well as reference values from the Argentine Food Code, World Health Organization (WHO, 2006), and Canadian Environmental Quality Guidelines (2003).
Surface and groundwater are classified as calcium-sulphate waters. Surface waters generally exceed guide levels for human drinking for aluminum, arsenic, copper, boron, and zinc at the highest part of the basin. Groundwater generally exceeds guide levels for human drinking for aluminum, lead, and manganese.
Data collected confirms the availability of water to meet process requirements as outlined in this report:
Freshwater required for project development and operations will initially be sourced from mine dewatering wells, which will lower the groundwater table around the pit.
A total of 12 pit dewatering wells is planned to maintain dry working conditions throughout the Life of Mine
The water balance model incorporates meteorological data from the Los Azules and Calderon weather stations, including snow records adjusted for sublimation effects.
Snowmelt runoff may represent a significant contribution to water availability for processing and potable use.
Freshwater for project development and mining operations will initially be sourced from mine dewatering wells, designed to maintain the groundwater level approximately 10 meters below the pit floor.
Numerical groundwater simulations indicate that dewatering will fully meet operational water demand through Year 5. From Year 6 onward, dewatering supply will gradually decline and be supplemented by groundwater from the Río de las Salinas and La Embarrada sub-basins.
Groundwater from the Río de las Salinas and La Embarrada sub-basins will also supply camp and administrative facilities starting in Year 1.
MRSFs
To further reduce risks and optimize the MRSFs and Stockpiles, KP recommends the following:
Installing hydrometric stations to accurately calibrate hydrological models.
Groundwater monitoring to track water table fluctuations that support future designs.
Upgrading meteorological stations as recommended by KP´s gap analysis (1029ENG-FS-0000-E00-RPT-0006, 2024).
Measuring snow accumulation to refine water balance models and assess contingency systems.
ENVIRONMENTAL STUDIES, PERMITTING AND SOCIAL OR COMMUNITY IMPACT
Baseline Studies
Environmental baseline studies for the Los Azules Project include surface and groundwater flow and quality, climate, flora, fauna, limnology, air quality, noise, archeology, geology, geomorphology, and glacier characterization. Data collection, except for meteorological monitoring, has been conducted during late spring, summer, and early fall, due to limited site access in winter months.
Baseline studies were documented in the Exploration Environmental Impact Report (Informe de Impacto Ambiental, IIA) in 2010. Followed by six biennial updates in 2012, 2014, 2016, 2018, 2020 and 2024. These baseline studies were complemented for the development of the Mine Exploitation Environmental Impact Report, which was submitted in 2023, and have been continued with ongoing monitoring efforts that are now being integrated into the first biennial update of the report.
Baseline data collection will continue until project development begins. Upon execution approval, an Environmental and Social Management Plan (ESMP) will be implemented, ensuring sustainable development and regulatory compliance under Argentine Law N°24.585.
Geochemistry
Geochemical characterization of the Los Azules Project rock materials was conducted to assess the potential for Acid Rock Drainage and Metal Leaching (ARDML). The study focused on evaluating contact water quality risks due to acid generating sulfide minerals and solute release including sulfate and metal(loid)s.
The study outcomes have been used to inform water management and monitoring strategies during operations and closure, as well as the anticipated mitigation strategies for closure.
Overall, the ABA and NAG results have been summarized as follows:
Materials that are Overburden, Leached or Volcanics are most likely to be non-acid forming (NAF) overall.
The remaining materials (Primary, Enriched, Mix and Transition) are likely to be potentially acid forming (PAF) or Uncertain. A small portion may be NAF but for assessment purposes these materials have been considered as PAF.
The Spent Ore materials would be classed as PAF based on their NAG pH values.
The Environmental Impact Report states that the Project will be committed to maintaining baseline water quality. Therefore, the mine will not result in increased concentrations of pollutants in water quality downgradient from the site during operations or post-closure. Geochemical modeling predicts seepage from the MRSF would contain elevated TDS and solute concentrations greater than Rio Salinas baseline, and that Project commitments to maintain the baseline water quality in the river would require mitigation measures for the seepage.
During operations, the pit dewatering flows will be consumed by the process demands, and hence, no discharge of dewatering flows is expected during mine life. A pit water rebound assessment was undertaken that indicated a pit lake would form as a net sink; the lake would receive water from the surrounding area, but the lake level would remain below the level of the pit crest, and hence there would be no discharge of water from the pit lake to the environment.
Dewatering water quality will initially be comparable to the groundwater composition and will evolve through mine life with higher solute concentrations as solutes are released from the wall rock and talus.
The hydrogeological studies indicate the pit lake will be a net sink for water and will not interact with the local environment; therefore, it may be considered that the pit lake would be comparable to other isolated Andean water bodies, which are similarly of naturally poor quality relative to stream flows.
During operations, the HLP will be actively leached with sulfuric acid to leach the copper. During operations, there will be no discharge of contact water from the HLP or associated ponds or infrastructure to the environment.
At the end of mine life, Pregnant Leach Solution (PLS) will continue to drain from the HLP. This PLS will be processed for the copper content and then recirculated to the top of the HLP in a period of ‘inventory reduction’. After the PLS is no longer recirculated, the HLP will continue to generate seepage because of infiltration from rain and snow. The rates of the solution discharging from the HLP will be lower than during operations, but could still average around 5 to 28 L/s. The long-term seepage has been predicted to be acidic (around pH 4 to 5), and the acidity will increase the mobility of metal solutes. Drain down of the residual acidity from the leach waters and jarosite minerals will require the leach pad to be flushed several times, which could take years to decades, depending on the flow rates. Therefore, drainage solution and runoff contact water from the HLP would likely need to be prevented from discharging or would require treatment prior to discharge.
Permitting
The development of the Los Azules Project requires various environmental and sectoral permits for different phases of the project, including those prior to construction, during construction, and throughout operation.
The Environmental Impact Assessment (EIA) for Los Azules was granted for the exploitation stage under resolution N° 805-MM-2024 on December 3, 2024. This approval resulted in the issuance of the Environmental Impact Statement (Declaración de Impacto Ambiental, DIA), confirming that the project meets applicable environmental standards. The DIA represents a key permitting milestone and provides the regulatory foundation for advancing the project towards execution and future operations.
The required environmental permits include the Sectorial Environmental Permit for construction and the bi-annual updates to the Environmental Impact Statement for exploitation. Additionally, various sectoral permits must be obtained before construction can commence. While many of these permits are initially issued for the construction stage, they must be periodically renewed to remain valid during operations.
The permitting process for the Project has been progressing, and no major risks or delays have been identified.
Social License
The Los Azules Project has a Community Development Plan aimed at promoting the social and economic well-being of the local communities. This plan is managed by the company's Community Relations Department, which has a dedicated team based in Calingasta to address community needs, foster engagement and respond to concerns.
The Calingasta department has a population of 11,034 residents (–2022 Census), with three main population centers: Villa Calingasta, Tamberías, and Barreal-Villa Pituil. The demographic structure is 51.79% male and 48.21% female (2010 Census).
Age distribution follows a progressive pyramidal structure, with a notable percentage of the population aged 15 to 64 years.
The Community Development Plan includes the following key programs:
Citizen Participation Program
Local Labor Program
Local Supplier Development Program
Community Training Program (Programa de Educacion a la Comunidad, PEC).
Strengthening of Civil Institutions Program.
Educational Institution Engagement Program
Contractor Partnership Plan
Infrastructure Contribution Plan.
Healthcare Institutions Engagement Plan.
No major risks from social license have been identified.
Closure
The Closure Plan (CP) is designed to establish the site's long-term physical, chemical, and hydrological stability while minimizing environmental and socioeconomic impacts. The plan includes two distinct stages:
Closure stage: implementation of closure measures and rehabilitation activities at the end of operations.
The primary objective of mine closure is to achieve long-term physical and chemical stability, with minimal maintenance, establishing a safe, stable, and predictable condition while ensuring compliance with environmental regulations. Key closure and post-closure objectives include:
Compliance with environmental laws, international standards, and best industry practices.
Rehabilitation of affected areas to achieve long-term stability, including revegetation with native species when possible.
Restoration of natural drainage surfaces in affected areas.
Minimization of socioeconomic impacts on a local and regional scale.
Optimization of closure and post-closure costs.
The current closure plan focuses on capturing seepage flows from the HLP and North MRSF in evaporation ponds. The evaporation ponds would be sized to allow the complete removal of the seepage water by evaporation.
This approach is applied globally at many mine sites and is highly dependent on the local climate, water balance, and pond sizing. Due to the climate and hydrology at Los Azules, there may be difficulties in sizing a pond with a suitable capacity to ensure all water would be evaporated during the summer. There could also be challenges with respect to the accumulation of salts that could reduce the evaporation rates, and the integrity of the pond liners to prevent seepage.
Based on the anticipated water quality and potential rates of seepage from the HLP and MRSFs from the geochemical assessment, further studies and assessments will be required to refine the closure water management plans to demonstrate that they can achieve the long-term goals.
The Closure Plan is based on the following assumptions:
The closure period is estimated to be three years, followed by a minimum 10-year post-closure period.
Progressive closure measures will require detailed engineering and additional studies.
The pit lake will reach equilibrium without groundwater outflow.
All ore stockpiles will be fully processed before closure.
The leach pad will be stabilized and will not generate residual effluents after drain down.
ARD from waste dumps will be managed through a contact/non-contact water management system.
Stored topsoil will be used for revegetation.
Decontaminated demolition debris will be disposed of in the waste dumps.
No infrastructure will be transferred to local communities.
The geochemical assessment report has set out several options that could be investigated further to determine the most pragmatic and cost-effective approach to preventing or reducing potential impacts to the surface water bodies. These include:
Covers: the MRSFs could be covered with lower permeability materials to encourage shedding of meltwater. The aim would be to shed as much of the snowmelt as possible as run-off from the surface of the MRSFs without contact with mine rock and reducing infiltration through the rock mass. Alternately, the top-most materials (or cover) could be comprised of fine-grained porous material that is designed to retain moisture in the uppermost materials, such that the moisture could be evaporated off during the summer (effectively a ‘store-and-release’ cover). Both approaches would act to reduce infiltration into the MRSFs, reducing the quantity of seepage and the overall solute load to the Rio Salinas.
Wetlands and attenuation processes: the construction of a wetland area within the Rio La Embarrada /Rio Frio area would offer a range of measures to attenuate and mitigate flows. Settlement ponds and vegetation can retain particulate matter. Organic matter and vegetation can attenuate solute species. Addition of limestone and/or limestone drains can add buffering capacity to retain high pH waters and facilitate precipitation of some solutes.
Pebble beds can be established to remove redox-sensitive species such as iron and manganese.
These options would need to be assessed further to develop a final closure approach. The period prior to construction, and through operations to closure would allow for detailed studies to be undertaken to optimize the assessments and develop a robust closure strategy.
The total cost of the closure has been estimated at USD 385,783,322.
MINE ROCK STORAGE FACILITIES
Risks
The main risks that KP has encountered while developing the FS design of the MRSFs are the following:
There is a stability concern regarding the Primary Material Stockpile due to the closeness of its south foot to the final pit wall. This should be reviewed in future engineering stages.
The Northeast Waste Dump area does not have geotechnical characterization; therefore, its design has been developed considering the geotech of close infrastructure.
The Northeast Waste Dump was not included in the Geohazard Assessment that was developed in the FS.
No hydrogeology or flow measurements were executed in the Northeast Waste Dump area.
Opportunities
The main opportunities KP detected during the FS design of the MRSFs are the following:
To develop an advanced hydrogeological model of the MRSFs area to validate the existing designs or modify them as required, in preparation for the Detailed Engineering phase. A more precise groundwater understanding will allow for the optimization of foundation levels and underdrainage systems.
To develop a hydrological model tailored to the site’s natural conditions, enabling the precise and reliable definition of diversion channels and their associated structures.
To advance the understanding of the operation and stacking of the MRSFs to optimize and review the measures to be implemented regarding stability, monitoring systems, and safety.
recommendations
Overall recommendations
In the opinion of the QPs responsible for each area of work and collectively, the information and analyses support the standards and guidelines of 17 CFR Part §229.1300 (S-K 1300) for a feasibility level of study and reporting.
Based on the outcomes of the Los Azules feasibility study work completed, the demonstrated economic potential for the project and work plans proposed for the Los Azules Copper Project, it is recommended to continue to proceed to development and operation when the necessary permitting, project approvals, and financing requirements are obtained.
metallurgy and mineral processing
Metallurgical Optimization
Continue process optimization column testwork related to the following:
For a composite geometallurgical unit, three operating conditions were designed: replacement of cure acid with sulfur, use of the LixTra® reagent, and replacement of industrial sulfuric acid with acid produced via sulfur and bacteria (“bacterial acid”).
The average CuT recoveries from the column tests on the composite showed very similar results (approximately 85% total copper extraction), with a difference in net acid consumption: 13.8 kg/t for the columns with sulfur substitution, 14.6 kg/t for the columns with LixTra®, and 17.8 kg/t for the tests with bacterial acid.
Additional work with a broader range of geometallurgical composites is warranted and further work could produce an improved copper recovery and lowered acid requirements.
Incorporate new exploration information and materials if available. Exploration of the newly identified targets will start in Q4 2025. High priority targets near to Los Azules include Tango, Porfido Norte, Franca, and Mercedes.
Nuton® Technology Metallurgy and Mineral Processing
Continued and further metallurgical testing and modelling should be done to refine parameters for deployment of Nuton Technology at the Los Azules project and complete a next phase of work to support a pre-feasibility (PFS) level study. Additional work to optimize the process flowsheet and operating conditions would include:
Completion and analysis of the Phase II test program at Nuton’s lab facilities on small columns and large column performance.
Continue to refine the pyrite geologic model and validation of project requirements.
Completion of additional CFD modeling and engineering to support a trade-off analysis between addition of sulfur and/or pyrite.
Running additional columns to test blends of added pyrite and sulfur and deposit lithologic and mineralogic variability gaps.
Completion of additional CFD modeling of system responses when Nuton Technology is applied earlier in the mine life to determine updated Process Design Criteria.
Evaluation of alternative flowsheets for raffinate conditioning.
Completion of additional modeling and engineering to determine if the processing of any material type would economically benefit from Additive 2.
Running additional small columns sequentially to mimic performance from the 2nd and 3rd ‘passes’ as lifts would be added during operation.
Running additional small columns with similar contained pyrite as predicted average Life of Mine values.
Future larger scale pilot testing of Nuton Technology and selected parameters at the Los Azules site to demonstrate the process at altitude and under site conditions.
Additional engineering work to support a pre-feasibility level of study is recommended to include:
Update resource basis to maximize Measured and Indicated opportunity and support potential Reserves addition.
Update mining methods trade-off study to consider in-pit crushing and waste and/or ore conveying options. Determine optimal timing for Nuton Technology deployment. Update costs and mining plans accordingly.
Field work and design of leach pad for the Nuton Technology related materials. Update capital costs.
Optimization of Nuton Technology process facilities design and costs.
Optimize site plans and layouts based on outcomes for the above.
Consider alternative heap stacking methods and conduct a tradeoff study of alternatives.
Update operating and capital costs and project economics to PFS level.
Specific commercial terms relating to the above work have not been finalized between McEwen and Nuton LLC, but the costs for this work are expected to be managed with Nuton assuming the costs associated with technology development, including metallurgical testwork, proprietary CFD modeling, and engineering within agreed battery limits.
MINING
Mining Engineering
Review of the impact of additional drilling suggested for resource upgrading. The drilling would be targeted for detailing the first five years of production which has an impact on the initial mining sequence. Changes in classification and grade may alter the sequence and need to be assessed. Estimated cost for this review and update is $75,000.
Further examination of technology to decarbonize the mine:
Trolley Assist
Continue the evaluation of trolley assist as a technology to reduce diesel consumption and emissions
Work together with vendors on layouts, and capital and operating costs.
Estimated cost is $300,000 for study and vendor study fees
Side Power Transfer
Examine newer technology coming from Komatsu (Bluevein), Caterpillar (DEF) and Liebherr (Power Rail)
Work together with vendors on layouts, and capital and operating costs.
Estimated cost is $450,000 for study and vendor study fees
Battery Trucks
Battery trucks are in use in other mines and represent an opportunity on some hauls with downhill loaded configurations. Coupled with trolley or side power transfer systems may have greater operability.
Examine vendor offers and timing of potential implementation.
Estimated cost is $400,000
Inpit Crushing and Conveying
The mining sequence indicated a couple areas that may be stable locations for inpit crushing and conveying later in the mine life. This should be examined further to see the benefit and timing of such technology. This may be coupled with battery trucks.
Vendor studies will be required in addition to haulage simulations.
This is estimated at $400,000 to complete
Total mining recommendations cost is estimated at $1,550,000.
pit geotechnical
Geotechnical oriented drillholes
Execution of a dedicated open pit geotechnical drilling program, including inclined boreholes oriented towards proposed pit walls and major structural features. The current database is composed of 19 geotechnical drillholes from 2023 to 2025 campaigns.
A new 20 oriented geotechnical drillholes are suggested (6040 m). This new campaign aims to achieve the followings objectives:
Expand spatial coverage by increasing the density of drilling on all pit walls, especially in the upper part of the pit slopes.
Ensure data support for the first 5 years of operation and the final pit.
Improve support for geotechnical modeling, especially in the poor and very poor geotechnical quality zone (FWZ).
Strengthen the geotechnical and structural characterization of the geotechnical units.
A summary of the geotechnical drillings is shown in Table 23.1 and their spatial location is presented in Figure 26.1 Detailed geotechnical logging of drill cores, supported by televiewer surveys for fracture orientation analysis. Use triple-tube drilling and best-practice core handling techniques to maximize recovery, preserve core quality, and maintain structural integrity of rock samples. Also, 7 packer tests are suggested to improve characterization of groundwater conditions.
Table 23.1: Summary of proposed geotechnical drillholes | ||||||||
|---|---|---|---|---|---|---|---|---|
N° |
ID_Geotechnical Drillhole |
Azimuth |
Dip |
Length (m) |
East |
North |
Elevation |
Planned Tests |
1 |
GDH001 |
320 |
70 |
300 |
2382373,0 |
6559836,6 |
3583,4 |
Lab samples, Structural orientation |
2 |
GDH002 |
320 |
70 |
280 |
2382640,7 |
6560148,1 |
3592,7 |
Lab samples, Structural orientation, Packer test |
3 |
GDH003 |
57 |
65 |
350 |
2383569,2 |
6559913,1 |
3662,9 |
Lab samples, Structural orientation |
4 |
GDH004 |
15 |
75 |
300 |
2383215,7 |
6560434,4 |
3753,4 |
Lab samples, Structural orientation |
5 |
GHD005 |
40 |
60 |
400 |
2383735,0 |
6559434,5 |
3743,5 |
Lab samples, Structural orientation, Packer test |
6 |
GDH006 |
40 |
60 |
400 |
2383932,9 |
6559190,9 |
3803,55 |
Lab samples, Structural orientation |
7 |
GDH008 |
270 |
70 |
350 |
2384240,5 |
6558541,1 |
3824,8 |
Lab samples, Structural orientation |
Table 23.1: Summary of proposed geotechnical drillholes | ||||||||
|---|---|---|---|---|---|---|---|---|
N° |
ID_Geotechnical Drillhole |
Azimuth |
Dip |
Length (m) |
East |
North |
Elevation |
Planned Tests |
8 |
GDH009 |
135 |
70 |
300 |
2383858,5 |
6557634,4 |
3760,9 |
Lab samples, Structural orientation, Packer test |
9 |
GDH010 |
255 |
70 |
300 |
2384123,6 |
6558003,7 |
3784,5 |
Lab samples, Structural orientation, Packer test |
10 |
GDH012 |
220 |
70 |
280 |
2383425,7 |
6557766,6 |
3737,5 |
Lab samples, Structural orientation |
11 |
GDH013 |
250 |
70 |
300 |
2382800,0 |
6558670,4 |
3725,2 |
Lab samples, Structural orientation |
12 |
GDH014 |
90 |
65 |
400 |
2383570,6 |
6558889,4 |
3657,3 |
Lab samples, Structural orientation |
13 |
GDH015 |
225 |
70 |
320 |
2382819,6 |
6559312 |
3648,42 |
Lab samples, Structural orientation, Packer test |
14 |
GDH017 |
250 |
70 |
400 |
2384208,3 |
6559971,2 |
3899,5 |
Lab samples, Structural orientation |
15 |
GDH018 |
310 |
60 |
300 |
2384215,7 |
6559596,6 |
3925,8 |
Lab samples, Structural orientation, Packer test |
16 |
GDH019 |
90 |
75 |
180 |
2384457,5 |
6559617,3 |
4072,17 |
Lab samples, Structural orientation |
17 |
GDH020 |
320 |
75 |
200 |
2382211,1 |
6560545,9 |
3789,9 |
Lab samples, Structural orientation |
17 |
GDH021 |
95 |
75 |
200 |
2384175,1 |
6558336,4 |
3826,23 |
Lab samples, Structural orientation |
17 |
GDH022 |
130 |
75 |
180 |
2384147,9 |
6557574,4 |
3858,81 |
Lab samples, Structural orientation |
17 |
GDH023 |
130 |
60 |
300 |
2383135,7 |
6558548,8 |
3676,58 |
Lab samples, Structural orientation, Packer test |

Figure 23.1: Location of proposed geotechnical drillholes (EMT 2025)
Laboratory testing for intact rock and discontinuities:
Laboratory testing of intact rock and discontinuities across all geotechnical units, including uniaxial compressive strength (UCS), triaxial, indirect tensile tests and direct shear test to support an accurate geotechnical model. An especial plan to estimate rock mass properties of weak rock must be developed. In Table 26.2 is shown the proposed laboratory tests for samples collected from the drillholes campaign for all geotechnical units are presented.
Table 23.2: Proposed additional laboratory tests | |||||
|---|---|---|---|---|---|
Geotecnhical Unit |
UCS |
Triaxial |
Tensile Strength |
Direct Shear Test |
Slake test |
Hypogene |
10 |
30 |
15 |
10 |
- |
Non-Sericitized Leached Cap |
30 |
60 |
30 |
20 |
- |
Sericitized Leached Cap |
20 |
30 |
15 |
10 |
- |
Non - Sericitized Supergene |
20 |
30 |
15 |
10 |
- |
Sericitized Supergene |
20 |
30 |
15 |
10 |
- |
Fault-Weakened Zone |
- |
- |
- |
- |
10 |
Data analysis and geotechnical model update
All new data must be processed to update the geotechnical model to verify the design parameters and optimize the pit design. This process should include the followings tasks:
Integration of newly acquired geotechnical and hydrogeological data into pit slope analyses
Refinement of the structural model, with emphasis on incorporating major fault zones
Strengthening and validation of geotechnical domains
Review of potential failure mechanisms, both structurally controlled and rock mass failures across bench, inter-ramp and overall pit scales
Incorporation of hydrogeological modeling and assessment of pit dewatering requirements.
Development of a geotechnical risk register to document uncertainties and potential design impacts.
Assessment of waste dump loading effects on slope stability.
Review of overburden distribution, thickness, and geotechnical properties to refine slope design criteria.
Geohazard assessment of potential natural landslides or slope instabilities that could affect pit wall stability or infrastructure.
Review of acceptability criteria for open pit design that include operational considerations and practices to be implemented in the exploitation project, particularly in the acceptability criteria at bench scale.
Preparation of a geotechnical monitoring plan, including slope performance monitoring and groundwater level surveillance.
Monitoring plans
A comprehensive and robust slope monitoring system is necessary to incorporate for the slope risk management program. The purpose of the program should be both to ensure the safety of personnel and to validate the assumptions and criteria stablished during the design process. The following task must be included in the slope monitoring plan:
A surface displacement monitoring using prisms survey using automatic polar system and radar interferometry.
Piezometric and climatic monitoring to understand groundwater and environmental influences on slope stability.
Procedures for inspections and data review, comparing field observations with model predictions.
A framework for risk management including monitoring platform that integrates the monitoring data with the mining excavation. This will permit be prepared for early alert and understanding the rock mass behavior during the excavation process.
REFERENCES
AACE International Recommended Practice No. 47R‐11Cost Estimate Classification System- As Applied in Engineering, Procurement, and Construction for the Mining and Mineral Processing Industry, August 7, 202.
ALDEBARAN RESOURCES (2025). Altar Project Overview. https://aldebaranresources.com/projects/altar-copper-gold/overview/
ALMANDOZ, Guillermo, (2010). Summary Los Azules Project – Argentina.
ANDES CORPORACION MINERA S.A., (2016). 3rd Actualizacion biannual informe de impacto ambiental etapa de exploracion, expte no. 1100-0162-A-10, Proyecto Los Azules, Departamento Calingasta, Provincia de San Juan”, April 2016.
BATTLE MOUNTAIN GOLD, (1999), Los Azules Project, San Juan, Argentina. Informe Inédito.
BDP Internacional SRL., (2024). Informe de Factibilidad Logistica Proyecto “Los Azules”. October 2024.
BID, (2019). Metodología de evaluación del riesgo de desastres y cambio climático para proyectos del BID.
BW Hidrogeología y Medioambiente, (2024a). Proyecto Los Azules. Estudio de Evaluación del Recurso Hídrico Subterráneo. Etapa de Factibilidad. Document No. 1051ENG-FS-0000-E20-RPT-0012-0-BW-ACM-13-R01. July 2024.
BW Hidrogeología y Medioambiente, (2024b). Proyecto Los Azules. Estudio de Evaluación del Recurso Hídrico Subterráneo – Modelo Numérico. Document No. 1051ENG-FS-0000-E20-RPT-0012-0-BW-ACM-15-R01. July 2024.
BW Hidrogeología y Medioambiente, 2025. Proyecto Los Azules. Ampliación del Estudio de Evaluación del Recurso Hídrico Subterráneo. Etapa de Factibilidad. Document No. 1051ENG-FS-0000-E20-RPT-0016-0-BW-ACM-13-R01. March 2025.
Canadian Institute of Mining, Metallurgy and Petroleum (CIM), 2018. CIM Mineral Exploration Best Practice Guidelines. November 23.
CANADIAN NATIONAL INSTRUMENT 43-101, (2009). Technical Report in Support of the Preliminary Assessment on the Development of the Los Azules Project, San Juan Province Argentina prepared by Randolph P. Schneider, MAusIMM, Samuel Engineering, Inc. Greenwood Village, Colorado USA effective March 19, 2009.
CANADIAN NATIONAL INSTRUMENT, (2010). 43-101 Technical Report Updated Preliminary Assessment Los Azules Project, San Juan Province, Argentina prepared by Kathleen Altman, PhD, PE, Samuel Engineering, Inc. Greenwood Village, Colorado USA effective December 1, 2010.
CANADIAN NATIONAL INSTRUMENT 43-101, (2013). Technical Report Los Azules Porphyry Copper Project, San Juan Province, Argentina prepared by Samuel Engineering, Inc. Greenwood Village, Colorado USA effective August 1, 2013.
CANADIAN NATIONAL INSTRUMENT, (2017) 43-101 Technical Report Los Azules Porphyry Copper Project, San Juan Province, Argentina prepared Hatch effective September 1, 2017.
CANADIAN NATIONAL INSTRUMENT, (2023). 43-101 Technical Report Los Azules Porphyry Copper Project, San Juan Province, Argentina prepared by Samuel Engineering, Inc. Greenwood Village, Colorado USA effective May 9, 2023.
CANADIAN ENVIRONMENTAL QUALITY GUIDELINES (2003).
Canadian Institute of Mining, Metallurgy and Petroleum. CIM (2019). CIM Definition Standards for Mineral Resources & Mineral Reserves. May 19.
Consultores de Recursos Minerales (CRM-SA), LLC., (2024). Los Azules Site Visit Report. Review of Sample Collection, Geologic Logging and Sample Assaying. March 9. Unpublished report for McEwen Copper Inc.
Consultoria e Investigacion Geologico Ambiental Ltda. (CIGEA) (2024). Structural Model of Porphyry-Cu deposit: Los Azules – McEwan Copper Inc. Unpublished consultant report. May 2024.
DePANGHER, M., (2008), Spectrum Petrographics, Minera Andes Petrographic Report # URC, Unpublished Report.
DIAZ, R. (2017). Summary Technical Report. RSG Project-Integrated Interpretation-Target Definition-Generation Los Azules, San Juan, Argentina, McEwen.
DRUMMON., (2003), Los Azules Exploration Report.
ELLZEY ZISSOS & ASSOCIATES, Sulphur Strategy for McEwen Copper, August 15, 2025
EMMONS, W.H., (1940), The Principles of Economic Geology. McGraw-Hill.
GONZALEZ, E., y otros, (2005), Informe de Actividades de Exploraciones, Informe Técnico. Informe Inédito.
GORDILLO, D., (2009), Minera Andes base de datos Perforaciones Los Azules. Archivo inédito.
GUSTAFSON, L. and Hunt, P., (1975), The Porphyry copper deposit at El Salvador, Chile, Economic Geology, v.70, p 857-912.
HARGREAVES, G.H. and Samani, Z.A. (1985) Reference Crop Evapotranspiration from Temperature. Applied Engineering in Agriculture, 1, 96-99. http://dx.doi.org/10.13031/2013.26773.
HATCH (2017). NI 43-101 Technical Report-Preliminary Economic Assessment Update for the Los Azules Project, Argentina. H354895-00000-200-230-0001, Rev. 0. October 16, 2017.
ICMM. (2025). Integrated Mine Closure: Good Practice Guide. 3rd edition. February.
INDEC 2022 Census, Calingasta Department.
INSTITUTO DE INVESTIGACIONES HIDRAULICAS “Ing. Manuel S. Garcia Wimer”. (2022). Análisis Hidroquimica Campana de Monitoreo de Aguas, April 2022, Proyecto Minero “Los Azules”.
IPEEM (2025). Rincones de Araya Fortherescue SAU. https://web.sanjuan.gob.ar/ipeem/?page_id=196.
IZAP, LY, (2007), Estudio Petrográfico, November 2007.
JEMIELITA, R., (2010), Los Azules Porphyry Copper Deposit, San Juan Province, Argentina. Unpublished report for Minera Andes Inc.
JOHN D.A. et al (2010), Porphyry Copper Deposit Model, Chapter B of Mineral Deposit Models for Resource Assessment. United States Geological Survey Scientific Investigations Report 2010-5070-B. January.
JOURNEL and Huijbregts. (1978). Mining Geostatistics.
KNIGHT PIÉSOLD ACSA (2025). Proyecto Los Azules – Diseño de Factibilidad del Pad de Lixiviación Fase 1 – Informe de Ingeniería. Rev. B. Doc. No. 1006ENG-FS-0300-E00-RPT-B0001. October 29, 2025 4.
KNIGHT PIÉSOLD ACSA (2025). Proyecto Los Azules – Escombreras, Material Primario y de Baja Ley – Informe de Ingeniería Factibilidad. Rev. 0. Doc. No. 1029ENG-FS-0200-E00-RPT-0001. November 14, 2025.
KUTER, J., (2003), Data presentation of geophysics at Los Azules-Minera Andes: Xstrata and MIM Argentina Exploraciones S.A. Informe Inédito.
KUTER, J, (2003), Xstrata Los Azules Interpretación Geológica-Geofísica. Informe Inédito.
LASRY, A., (2005), Estudio de Alteración Hidrotermal. Rojas y Asociados-Minera Andes. Internal Report.
LOWELL, J.D., and GUILBERT, J.M., 1970, Lateral and vertical alteration-mineralization zoning in porphyry ore deposits: Economic Geology, v. 65, p. 373–408.
MARSDEN AND BOTZ, Heap Leach Modeling, A Review of Approaches to Metal Production Forecasting Minerals & Metallurgical Processing, 2017, Vol. 34, No. 2, pp. 53·64, An official publication of the Society for Mining, Metallurgy & Exploration Inc.
MEGLIOLI, A (2025), Identificación y Caracterización de Geoformas Glaciares y Peri-glaciares, Informe Anual, Proyecto Los Azules, San Juan, Argentina. Unpublished consultant report.
MORTIMER, S., (2024), Interpretation Criteria and Geological Modelling of the Los Azules Deposit. Unpublished consultant report. September.
Murphy, F. (2024) Structural field analysis of Los Azules project area, San Juan Province, Argentina
Murphy, F. (2023) Structural interpretation of Sentinel-2 & WorldView imagery for Los Azules project, San Juan Province, Argentina ORICA, (2016), Evaluacion Preliminar de Paramtros de Perforacion y Voladura, Proyecto Los Azules, Argentina, Technology Solutions Latin America, Summary presentation.
PANTELEYEV, A., (1995), Porphyry Cu+/-Mo+/-Au in Selected British Columbia Mineral Deposit Profiles, Volume 1 - Metallics and Coal, Lefebure, D.V. and Ray, G.E., Editors, British Columbia Ministry of Energy of Employment and Investment, Open File 1995-20, pages 87- 92.
PIQUER, J., SANCHEZ-ALFARO, P. and PEREZ-FLORES, P.; (2021). A new model for the optimal structural context for giant porphyry copper deposit formation. Geology 2021; 49 (5): 597–601. doi: https://doi.org/10.1130/G48287.1
PLENGE, Metallurgical Investigation No. 6976-6991/7026-7027 Minera Andes Incorporated Los Azules Copper Project Metallurgical Scoping Study, July 21, 2008.
PLENGE, Metallurgical Investigation No. 7028 Minera Andes Incorporated Los Azules Copper Project Composite No. 3, September 12, 2008.
PLENGE, Metallurgical Investigation No. 7652-54 Minera Andes Incorporated Los Azules Copper Project Copper Gold Project, 31 March 2010.
PLENGE, Metallurgical Investigation No. 9247-69 Minera Andes Incorporated Los Azules Copper Project Flotation Variability and Optimization, Copper Bioleaching HIPOX of Concentrate, November 30, 2012.
PRATT, W., (2010), Los Azules Porphyry Cu Project, San Juan, Argentina. Unpublished company report for Minera Andes, April, 2010. 26 p.
ROJAS, N., (2006), Los Azules Project, drilling completed in 2006: Geological report. Informe Inédito.
ROJAS, N., (2007), Plan De Exploraciones en Proyecto Los Azules, Provincia de San Juan, Argentina. Período 2007-2009. Unpublished report for Minera Andes Inc.
ROJAS, N, (2008), Technical Report on Los Azules Project Andean Cordillera Region, Calingasta Department, San Juan, Province, Argentina Informe Inédito.
ROJAS, N, (2010). Informe técnico proyecto Los Azules, temporadas 2007-2008. Provincia de San Juan, Argentina. Unpublished report for Minera Andes.
ROJAS, Nivaldo (February 2008), NI 43-101 Technical Report on Los Azules Project Andean Cordillera Region, Calingasta Department, San Juan Province, Argentina.
RUIZ Y ASOCIADOS CONSULTORAS SRL (RYAC)., (2023). Main Report Los Azules Project – Preliminary Capex South Access Road – Province of San Juan, Argentina. May 11.
SELMAR International Services LTDA (August 2016), Copper Concentrates Marketing Assumptions Input for a Scoping Study for the Los Azules Project in San Juan Province Argentina.
SGS Lakefield Flotation Test Results, Project 15832-001, August 2016. SGS Santiago SMC Test Report, JKTech Job No. 17004/P12, June 2017.
SIEYE, Hugo Gil Figueroa & Assoc (September 2008), Preliminary Feasibility Study, Electric Energy Supply Study –– Preliminary Report #2.
SILLITOE R., (2014), Los Azules Porphyry Copper Deposit, Argentina: Geological Model and Exploration Potential. Unpublished report for McEwen Inc.
SILLITOE, R., (2010), Porphyry Copper Systems Society of Economic Geologists, Inc., Economic Geology, v. 105, p 3–41.
SILLITOE, R. H. and PERELLO, J., (2005) Andean Copper Province: Tectonomagmatic Settings, Deposit types, Metallogeny, Exploration and Discovery. Economic Geology 100th Anniversary Volume. Pp. 845-890.
SIM, R. and DAVIS, B., (2015), Review of the New Geologic Interpretation at Los Azules. Unpublished report for McEwen Inc.
SNL Mine Economics Market Intelligence 2016 Data.
STANTEC CONSULTING, (2022). Los Azules Site Visit Report. November 3rd. Unpublished report for McEwen Inc.
SUMAY, C. and Meissi, E., (2006), Estudio petro-calcográfico: Examina, August 2006, San Juan, Argentina. Informe Inédito.
TSCHABRUN, D. B., Sim, R., Davis, B. (Revised January 8, 2009), NI 43-101 Technical Report, Los Azules Copper Project, San Juan Province, Argentina.
ULOG (OPERADOR LOGÍSTICO DE ULTRAMAR) and GRUPO MURCHISON, Revisión Consultoría - Los Azules PowerPoint presentación, September 2025.
ULRIKSEN, C., (2004), (2007), Los Azules drilling campaign. Geological Report, Rojas y Asociados, S.A. Informe Inédito.
ULRIKSEN, C., (2007), Geological Report-Los Azules (2007 campaign). Geological report: Rojas y Asociados, S.A. Informe Inédito.
U.S. SECURITY EXCHANGE COMMISSION (SEC), (2018). Modernization of Property Disclosures for Mining Registrants. October 31.
VARGAS & GALINDEZ., (2025). Incorporation and good standing status of Andes Corporacion Minera S.A. and of its mining rights. Letter. January 3rd.
VÀZQUEZ, P., (2015), Los Azules: Porphyry Copper Deposit – Geologic Model. Unpublished report for McEwen.
WORLD HEALTH ORGANIZATION (WHO), (2006). Guidelines for Drinking-water Quality.
XSTRATA COPPER, Antapaccay Project. Online presentation dated September 18, 2011. Accessed online at http://www.glencore.com/assets/media/doc/speeches_and_presentations/xstrata/2011/xcu- speech-201109184-analystvisitperu.en2.pdf
YPF Luz. (2024). Interconexión Proyecto Minero Los Azules. Memorandum of Understanding 08/2024. Target Budget and Price. Rev. 0. Document No. 061ENG-FS-2200-E00-MEM-0002-0. December 26.
YPF Luz. (2025), Interconexión al SADI del Proyecto Minero Los Azules. Informe de Factibilidad. Document No. 1061-ENG-FS-2200-E00-RPT-0002-B. January 27.
ZURCHER, L., (2008a), Geology of the Los Azules Porphyry Copper Project, San Juan, Argentina (Preliminary Progress Report): August 3 (revised August 25), 2008 internal Minera Andes, Inc. report, ESMI, Tucson, AZ, 12 pages.
ZURCHER, L., (2008b), Geochemistry of Rocks from the Los Azules Porphyry Deposit, San Juan, Argentina (Addendum to ESMI August 25, 2008 Report): October 27, 2008 internal Minera Andes, Inc. progress report, ESMI, Tucson, AZ, 14 pages.
ZURCHER, L., (2008c), U-Pb Geochronology of Rocks from the Los Azules Porphyry Deposit, San Juan, Argentina (Addendum to ESMI August 25, 2008 Report): October 30, 2008 internal Minera Andes, Inc. progress report, ESMI, Tucson, AZ, 8 pages.
ZURCHER, L., (2009), Interpretative Basement Geology (Map). Los Azules Project.
ZURCHER, L., Hall, D., Gordillo, D. and Valle, N., (2008), Geology of the Los Azules Porphyry Copper Project, San Juan, Argentina (PowerPoint Presentation): October 14, 2008, internal Minera Andes, Inc. report, ESMI, Tucson, AZ, 18 pages.
Reliance on information provided by the registrant
This Technical Report Summary was prepared by Samuel Engineering Inc. and other consultants in collaboration with McEwen between 2024 and 2025 to declare Mineral Reserves for the Los Azules Project. The FS results and the Los Azules property are material to McEwen.
The conclusions, interpretations, and estimates contained herein are based on:
Information available at the time of preparation,
Data supplied by the Registrant and other outside sources, and
Assumptions, conditions, and qualifications outlined in this report.
The exploration program, resource database management and drill core sampling, custody and control were self-performed by the Registrant and its subsidiary ACM. QP oversight, site visits, reviews and checks were completed to ensure appropriate methods and processes were in place to ensure data integrity and data analysis performed to ensure systematic biases were not demonstrated.
Information relating to property ownership and status of property rights was provided by the Registrant. The information included in this report is based on an external legal review and opinion obtained by ACM titled: “Incorporation and good standing status of Andes Corporación Minera S.A. (ACM) and its mining rights,” by attorney José Vargas Gei of Vargas & Galindez (V&G), dated July 21, 2025.
The permitting, government relations/compliance, and social license program management were managed and conducted by the Registrant and its subsidiary McEwen Copper/ACM. The status of these aspects of the project was provided by the Registrant.
The ownership structure for McEwen Copper Inc. was provided by the Registrant and is based on internal records, public notices and filings by McEwen, Inc.