UNITED STATES
SECURITIES AND EXCHANGE COMMISSION
Washington, D.C. 20549
FORM 8-K
CURRENT REPORT
Pursuant to Section 13 or 15(d) of the Securities Exchange Act of 1934
Date of Report (Date of earliest event reported): January 21, 2026

TE CONNECTIVITY PLC
(Exact name of registrant as specified in its charter)
Ireland |
|
98-1779916 |
(Jurisdiction of Incorporation) |
|
(IRS Employer Identification Number) |
001-33260
(Commission File Number)
Parkmore Business Park West
Parkmore, Ballybrit
Galway, H91VN2T, Ireland
(Address of Principal Executive Offices, including Zip Code)
+353 91 378 040
(Registrant’s telephone number, including Area Code)
Check the appropriate box below if the Form 8-K filing is intended to simultaneously satisfy the filing obligation of the registrant under any of the following provisions (see General Instruction A.2. below):
☐Written communications pursuant to Rule 425 under the Securities Act (17 CFR 230.425)
☐Soliciting material pursuant to Rule 14a-12 under the Exchange Act (17 CFR 240.14a-12)
☐Pre-commencement communications pursuant to Rule 14d-2(b) under the Exchange Act (17 CFR 240.14d-2(b))
☐Pre-commencement communications pursuant to Rule 13e-4(c) under the Exchange Act (17 CFR 240.13e-4(c))
Securities registered pursuant to Section 12(b) of the Act:
Title of each class |
|
Trading symbol |
|
Name of each exchange on which registered |
Ordinary Shares, Par Value $0.01 |
|
TEL |
|
New York Stock Exchange |
2.50% Senior Notes due 2028* |
TEL/28 |
New York Stock Exchange |
||
0.00% Senior Notes due 2029* |
|
TEL/29 |
|
New York Stock Exchange |
3.25% Senior Notes due 2033* |
|
TEL/33 |
|
New York Stock Exchange |
*Issued by Tyco Electronics Group S.A., an indirect wholly-owned subsidiary of TE Connectivity plc
Indicate by check mark whether the registrant is an emerging growth company as defined in Rule 405 of the Securities Act of 1933 (§230.405 of this chapter) or Rule 12b-2 of the Securities Exchange Act of 1934 (§240.12b-2 of this chapter).
Emerging growth company ☐
If an emerging growth company, indicate by check mark if the registrant has elected not to use the extended transition period for complying with any new or revised financial accounting standards provided pursuant to Section 13(a) of the Exchange Act. ☐
Item 2.02. Results of Operations and Financial Condition
On January 21, 2026, TE Connectivity plc (the “Company”) issued a press release reporting the Company’s first quarter results for fiscal 2026. A copy of the press release is furnished as Exhibit 99.1 to this report and incorporated by reference in this Item 2.02.
Item 7.01. Regulation FD Disclosure
The Company will hold a conference call and webcast on January 21, 2026 (see information in the press release attached hereto as Exhibit 99.1 under “Conference Call and Webcast”). A copy of the slide materials to be discussed at the conference call and webcast is being furnished pursuant to Regulation FD as Exhibit 99.2 and is incorporated herein by reference, and the slide materials also can be accessed at the “Investors” section of the Company’s website (www.te.com).
Item 9.01. Financial Statements and Exhibits
(d) Exhibits
Exhibit |
|
Description |
|
|
|
99.1 |
|
|
|
|
|
99.2 |
|
Presentation - TE Connectivity Q1 2026 Earnings Call (January 21, 2026) |
|
|
|
104 |
|
Cover Page Interactive Data File (embedded within the Inline XBRL document) |
SIGNATURES
Pursuant to the requirements of the Securities Exchange Act of 1934, the Registrant has duly caused this report to be signed on its behalf by the undersigned hereunto duly authorized.
Date: January 21, 2026 |
TE CONNECTIVITY PLC |
|
|
|
|
|
By: |
/s/ Heath A. Mitts Heath A. Mitts |
Exhibit 99.1
NEWS RELEASE

te.com
TE Connectivity announces first quarter results for fiscal year 2026
Exceeds guidance with 22% sales growth and over 30% EPS growth year over year
GALWAY, Ireland – Jan. 21, 2026 – TE Connectivity plc (NYSE: TEL) today reported results for the fiscal first quarter ended Dec. 26, 2025.
First Quarter Highlights
| ● | Net sales were $4.7 billion, an increase of 22% on a reported basis year over year, driven by growth in both the Industrial and Transportation segments, and 15% organically. |
| ● | GAAP diluted earnings per share (EPS) from continuing operations was $2.53, an increase of 45% year over year. Adjusted EPS was $2.72, an increase of 33% year over year. |
| ● | GAAP operating margin was 20.6%, an increase of 260 basis points year over year. Adjusted operating margin expanded 180 basis points year over year to 22.2%, driven by strong operational performance across both segments. |
| ● | Record orders of $5.1 billion, an increase of 28% year over year and 9% sequentially. |
| ● | Cash flow from operating activities was $865 million and free cash flow was $608 million, with $615 million returned to shareholders. |
“Our teams delivered strongly against our strategy, resulting in first quarter earnings growth over 30% and sales growth of more than 20%, both of which were above our guidance and driven by growth in both segments,” said CEO Terrence Curtin. “We continue to benefit from a broadening of growth from our investments in data and power connectivity in key applications such as AI, energy grid hardening and next generation vehicles that are driving our auto content growth above market. Our positioning and team execution resulted in record quarterly orders of over $5 billion, setting up TE for another year of strong growth and margin expansion.
“We expect double-digit sales and adjusted earnings growth again in our second quarter as our teams continue to innovate with our customers to ensure next generation technologies are brought to life.”

Second Quarter FY26 Outlook
For the second quarter of fiscal 2026, the company expects sales of approximately $4.7 billion, an increase of 13% on a reported basis and 6% organically year over year. Adjusted EPS is expected to be approximately $2.65, up 20% year over year. GAAP EPS from continuing operations is expected to be approximately $2.26.
Beginning in fiscal 2026, the company is excluding amortization expense on intangible assets and, if applicable, the related tax effects from its calculation of certain non-GAAP measures.
Information about TE Connectivity's use of non-GAAP financial measures is provided below. For reconciliations of these non-GAAP financial measures, see the attached tables.
Conference Call and Webcast
The company will hold a conference call for investors today beginning at 8:30 a.m. ET. The conference call may be accessed in the following ways:
About TE Connectivity
TE Connectivity plc (NYSE: TEL) is a global industrial technology leader creating a safer, sustainable, productive, and connected future. As a trusted innovation partner, our broad range of connectivity and sensor solutions enable the distribution of power, signal and data to advance next-generation transportation, energy networks, automated factories, data centers enabling artificial intelligence, and more. Our more than 90,000 employees, including 10,000 engineers, work alongside customers in approximately 130 countries. In a world that is racing ahead, TE ensures that EVERY CONNECTION COUNTS. Learn more at www.te.com and on LinkedIn, Facebook, WeChat and Instagram.
Non-GAAP Financial Measures
We present non-GAAP performance and liquidity measures as we believe it is appropriate for investors to consider adjusted financial measures in addition to results in accordance with accounting principles generally accepted in the U.S. (“GAAP”). These non-GAAP financial measures provide supplemental information and should not be considered replacements for results in accordance with GAAP. Management uses non-GAAP financial measures internally for planning and forecasting purposes and in its decision-making processes related to the operations of our company. We believe these measures provide meaningful information to us and investors because they enhance the understanding of our operating performance, ability to generate cash, and the trends of our business. Additionally, we believe that investors benefit from having access to the same financial measures that management uses in evaluating our operations. The primary limitation of these measures is that they exclude the financial impact of items that would otherwise either increase or decrease our reported results. This limitation is best addressed by using these non-GAAP financial measures in combination with the most directly comparable GAAP financial measures in order to better understand the amounts, character, and impact of any increase or decrease in reported amounts. These non-GAAP financial measures may not be comparable to similarly-titled measures reported by other companies.
The following provides additional information regarding our non-GAAP financial measures:
•Organic Net Sales Growth (Decline) – represents net sales growth (decline) (the most comparable GAAP financial measure) excluding the impact of foreign currency exchange rates, and acquisitions and divestitures that occurred in the preceding twelve months, if any. Organic Net Sales Growth (Decline) is a useful measure of our performance because it excludes items that are not completely under management’s control, such as the impact of changes in foreign currency exchange rates, and items that do not reflect the underlying growth of the company, such as acquisition and divestiture activity. This measure is a significant component in our incentive compensation plans.
•Adjusted Operating Income and Adjusted Operating Margin – represent operating income and operating margin, respectively, (the most comparable GAAP financial measures) before special items including restructuring and other charges, acquisition-related charges, amortization expense on intangible assets, impairment of goodwill, and other income or charges, if any. We utilize these adjusted measures in combination with operating income and operating margin to assess segment level operating performance and to provide insight to management in evaluating segment operating plan execution and market conditions. Adjusted Operating Income is a significant component in our incentive compensation plans.
•Adjusted Income Tax (Expense) Benefit and Adjusted Effective Tax Rate – represent income tax (expense) benefit and effective tax rate, respectively, (the most comparable GAAP financial measures) after adjusting for the tax effect of special items including restructuring and other charges, acquisition-related charges, amortization expense on intangible assets, impairment of goodwill, other income or charges, and certain significant tax items, if any.
•Adjusted Income from Continuing Operations – represents income from continuing operations (the most comparable GAAP financial measure) before special items including restructuring and other charges, acquisition-related charges, amortization expense on intangible assets, impairment of goodwill, other income or charges, and certain significant tax items, if any, and, if applicable, the related tax effects.
•Adjusted Earnings Per Share – represents diluted earnings per share from continuing operations (the most comparable GAAP financial measure) before special items including restructuring and other charges, acquisition-related charges, amortization expense on intangible assets, impairment of goodwill, other income or charges, and certain significant tax items, if any, and, if applicable, the related tax effects. This measure is a significant component in our incentive compensation plans.
•Free Cash Flow (FCF) – is a useful measure of our ability to generate cash. The difference between net cash provided by operating activities (the most comparable GAAP financial measure) and Free Cash Flow consists mainly of significant cash outflows and inflows that we believe are useful to identify. We believe Free Cash Flow provides useful information to investors as it provides insight into the primary cash flow metric used by management to monitor and evaluate cash flows generated from our operations. Free Cash Flow is defined as net cash provided by operating activities excluding voluntary pension contributions and the cash impact of special items, if any, minus net capital expenditures. Voluntary pension contributions are excluded from the GAAP financial measure because this activity is driven by economic financing decisions rather than operating activity. Certain special items, including cash paid (collected) pursuant to collateral requirements related to cross-currency swap contracts, are also excluded by management in evaluating Free Cash Flow. Net capital expenditures consist of capital expenditures less proceeds from the sale of property, plant, and equipment. These items are subtracted because they represent long-term commitments. In the calculation of Free Cash Flow, we subtract certain cash items that are ultimately within management’s and the Board of Directors’ discretion to direct and may imply that there is less or more cash available for our programs than the most comparable GAAP financial measure indicates. It should not be inferred that the entire Free Cash Flow amount is available for future discretionary expenditures, as our definition of Free Cash Flow does not consider certain non-discretionary expenditures, such as debt payments. In addition, we may have other discretionary expenditures, such as discretionary dividends, share repurchases, and business acquisitions, that are not considered in the calculation of Free Cash Flow.
Forward-Looking Statements
This release contains certain "forward-looking statements" within the meaning of the U.S. Private Securities Litigation Reform Act of 1995. These statements are based on management's current expectations and are subject to risks, uncertainty and changes in circumstances, which may cause actual results, performance, financial condition or achievements to differ materially from anticipated results, performance, financial condition or achievements. All statements contained herein that are not clearly historical in nature are forward-looking and the words "anticipate," "believe," "expect," "estimate," "plan," and similar expressions are generally intended to identify forward-looking statements. We have no intention and are under no obligation to update or alter (and expressly disclaim any such intention or obligation to do so) our forward-looking statements whether as a result of new information, future events or otherwise, except to the extent required by law. The forward-looking statements in this release include statements addressing our future financial condition and operating results. Examples of factors that could cause actual results to differ materially from those described in the forward-looking statements include, among others, the extent, severity and duration of business interruptions negatively affecting our business operations; business, economic, competitive and regulatory risks, such as conditions affecting demand for products in the automotive and other industries we serve; competition and pricing pressure; fluctuations in foreign currency exchange rates and commodity prices; natural disasters and political, economic and military instability in countries in which we operate, including continuing military conflict in certain parts of the world; developments in the credit markets; future goodwill impairment; compliance with current and future environmental and other laws and regulations; and the possible effects on us of changes in tax laws, tax treaties and other legislation.
More detailed information about these and other factors is set forth in TE Connectivity plc’s Annual Report on Form 10-K for the fiscal year ended Sept 26, 2025, as well as in our Quarterly Reports on Form 10-Q, Current Reports on Form 8-K and other reports filed by us with the U.S. Securities and Exchange Commission.
Contacts: |
Media Relations: Eric Mangan TE Connectivity 908-783-6629 Eric.Mangan@te.com |
Investor Relations: Sujal Shah TE Connectivity 610-893-9790 Sujal.Shah@te.com |
# # #
TE CONNECTIVITY PLC
CONSOLIDATED STATEMENTS OF OPERATIONS (UNAUDITED)
|
For the Quarters Ended |
||||
|
December 26, |
|
December 27, |
||
|
2025 |
|
2024 |
||
|
(in millions, except per share data) |
||||
Net sales |
$ |
4,669 |
|
$ |
3,836 |
Cost of sales |
|
2,930 |
|
|
2,476 |
Gross margin |
|
1,739 |
|
|
1,360 |
Selling, general, and administrative expenses |
|
538 |
|
|
427 |
Research, development, and engineering expenses |
|
225 |
|
|
188 |
Acquisition and integration costs |
|
3 |
|
|
5 |
Restructuring and other charges, net |
|
10 |
|
|
50 |
Operating income |
|
963 |
|
|
690 |
Interest income |
|
25 |
|
|
23 |
Interest expense |
|
(30) |
|
|
(6) |
Other income (expense), net |
|
3 |
|
|
(1) |
Income from continuing operations before income taxes |
|
961 |
|
|
706 |
Income tax expense |
|
(210) |
|
|
(178) |
Income from continuing operations |
|
751 |
|
|
528 |
Loss from discontinued operations, net of income taxes |
|
(1) |
|
|
— |
Net income |
$ |
750 |
|
$ |
528 |
|
|
|
|
|
|
Basic earnings per share: |
|
|
|
|
|
Income from continuing operations |
$ |
2.55 |
|
$ |
1.77 |
Loss from discontinued operations |
|
— |
|
|
— |
Net income |
|
2.55 |
|
|
1.77 |
|
|
|
|
|
|
Diluted earnings per share: |
|
|
|
|
|
Income from continuing operations |
$ |
2.53 |
|
$ |
1.75 |
Loss from discontinued operations |
|
— |
|
|
— |
Net income |
|
2.53 |
|
|
1.75 |
|
|
|
|
|
|
Weighted-average number of shares outstanding: |
|
|
|
|
|
Basic |
|
294 |
|
|
299 |
Diluted |
|
297 |
|
|
301 |
TE CONNECTIVITY PLC
CONSOLIDATED BALANCE SHEETS (UNAUDITED)
|
December 26, |
|
September 26, |
||
|
2025 |
|
2025 |
||
|
(in millions, except share data) |
||||
Assets |
|
|
|
|
|
Current assets: |
|
|
|
|
|
Cash and cash equivalents |
$ |
1,251 |
|
$ |
1,255 |
Accounts receivable, net of allowance for doubtful accounts of $48 and $44, respectively |
|
3,469 |
|
|
3,403 |
Inventories |
|
2,951 |
|
|
2,699 |
Prepaid expenses and other current assets |
|
697 |
|
|
609 |
Total current assets |
|
8,368 |
|
|
7,966 |
Property, plant, and equipment, net |
|
4,395 |
|
|
4,312 |
Goodwill |
|
7,162 |
|
|
7,126 |
Intangible assets, net |
|
2,177 |
|
|
2,227 |
Deferred income taxes |
|
2,429 |
|
|
2,507 |
Other assets |
|
1,021 |
|
|
943 |
Total assets |
$ |
25,552 |
|
$ |
25,081 |
Liabilities, redeemable noncontrolling interests, and shareholders' equity |
|
|
|
|
|
Current liabilities: |
|
|
|
|
|
Short-term debt |
$ |
852 |
|
$ |
852 |
Accounts payable |
|
2,149 |
|
|
2,021 |
Accrued and other current liabilities |
|
2,068 |
|
|
2,247 |
Total current liabilities |
|
5,069 |
|
|
5,120 |
Long-term debt |
|
4,856 |
|
|
4,842 |
Long-term pension and postretirement liabilities |
|
766 |
|
|
767 |
Deferred income taxes |
|
198 |
|
|
198 |
Income taxes |
|
441 |
|
|
414 |
Other liabilities |
|
1,086 |
|
|
1,010 |
Total liabilities |
|
12,416 |
|
|
12,351 |
Commitments and contingencies |
|
|
|
|
|
Redeemable noncontrolling interests |
|
149 |
|
|
145 |
Shareholders' equity: |
|
|
|
|
|
Preferred shares, $1.00 par value, 2 shares authorized, none outstanding |
|
— |
|
|
— |
Ordinary class A shares, €1.00 par value, 25,000 shares authorized, none outstanding |
|
— |
|
|
— |
Ordinary shares, $0.01 par value, 1,500,000,000 shares authorized, 303,796,785 and 302,889,075 shares issued, respectively |
|
3 |
|
|
3 |
Accumulated earnings |
|
14,543 |
|
|
13,932 |
Ordinary shares held in treasury, at cost, 10,086,721 and 8,330,931 shares, respectively |
|
(1,762) |
|
|
(1,356) |
Accumulated other comprehensive income |
|
203 |
|
|
6 |
Total shareholders' equity |
|
12,987 |
|
|
12,585 |
Total liabilities, redeemable noncontrolling interests, and shareholders' equity |
$ |
25,552 |
|
$ |
25,081 |
TE CONNECTIVITY PLC
CONSOLIDATED STATEMENTS OF CASH FLOWS (UNAUDITED)
|
For the Quarters Ended |
||||
|
December 26, |
|
December 27, |
||
|
2025 |
|
2024 |
||
|
(in millions) |
||||
Cash flows from operating activities: |
|
|
|
|
|
Net income |
$ |
750 |
|
$ |
528 |
Loss from discontinued operations, net of income taxes |
|
1 |
|
|
— |
Income from continuing operations |
|
751 |
|
|
528 |
Adjustments to reconcile income from continuing operations to net cash provided by operating activities: |
|
|
|
|
|
Depreciation and amortization |
|
259 |
|
|
186 |
Deferred income taxes |
|
77 |
|
|
98 |
Non-cash lease cost |
|
39 |
|
|
34 |
Provision for losses on accounts receivable and inventories |
|
43 |
|
|
41 |
Share-based compensation expense |
|
50 |
|
|
35 |
Other |
|
4 |
|
|
12 |
Changes in assets and liabilities, net of the effects of acquisitions and divestitures: |
|
|
|
|
|
Accounts receivable, net |
|
(79) |
|
|
146 |
Inventories |
|
(301) |
|
|
(118) |
Prepaid expenses and other current assets |
|
20 |
|
|
68 |
Accounts payable |
|
139 |
|
|
150 |
Accrued and other current liabilities |
|
(217) |
|
|
(295) |
Income taxes |
|
45 |
|
|
30 |
Other |
|
35 |
|
|
(37) |
Net cash provided by operating activities |
|
865 |
|
|
878 |
Cash flows from investing activities: |
|
|
|
|
|
Capital expenditures |
|
(258) |
|
|
(205) |
Proceeds from sale of property, plant, and equipment |
|
1 |
|
|
1 |
Acquisition of businesses, net of cash acquired |
|
— |
|
|
(325) |
Other |
|
3 |
|
|
(8) |
Net cash used in investing activities |
|
(254) |
|
|
(537) |
Cash flows from financing activities: |
|
|
|
|
|
Net increase in commercial paper |
|
— |
|
|
90 |
Proceeds from exercise of share options |
|
44 |
|
|
34 |
Repurchase of ordinary shares |
|
(405) |
|
|
(303) |
Payment of ordinary share dividends to shareholders |
|
(209) |
|
|
(189) |
Other |
|
(46) |
|
|
(27) |
Net cash used in financing activities |
|
(616) |
|
|
(395) |
Effect of currency translation on cash |
|
1 |
|
|
(11) |
Net decrease in cash, cash equivalents, and restricted cash |
|
(4) |
|
|
(65) |
Cash, cash equivalents, and restricted cash at beginning of period |
|
1,255 |
|
|
1,319 |
Cash, cash equivalents, and restricted cash at end of period |
$ |
1,251 |
|
$ |
1,254 |
|
|
|
|
|
|
Supplemental cash flow information: |
|
|
|
|
|
Income taxes paid, net of refunds |
|
88 |
|
|
49 |
TE CONNECTIVITY PLC
RECONCILIATION OF FREE CASH FLOW (UNAUDITED)
|
For the Quarters Ended |
||||
|
December 26, |
|
December 27, |
||
|
2025 |
|
2024 |
||
|
(in millions) |
||||
Net cash provided by operating activities |
$ |
865 |
|
$ |
878 |
Capital expenditures, net |
|
(257) |
|
|
(204) |
Free cash flow (1) |
$ |
608 |
|
$ |
674 |
|
|
|
|
|
|
(1) Free cash flow is a non-GAAP financial measure. See description of non-GAAP financial measures. | |||||
TE CONNECTIVITY PLC
SEGMENT DATA (UNAUDITED)
|
For the Quarters Ended |
|
|||||||||
|
December 26, |
|
|
December 27, |
|
||||||
|
2025 |
|
|
2024 |
|
||||||
|
($ in millions) |
||||||||||
|
Net Sales |
|
|
|
|
Net Sales |
|
|
|
||
Transportation Solutions |
$ |
2,467 |
|
|
|
|
$ |
2,243 |
|
|
|
Industrial Solutions |
|
2,202 |
|
|
|
|
|
1,593 |
|
|
|
Total |
$ |
4,669 |
|
|
|
|
$ |
3,836 |
|
|
|
|
|
|
|
|
|
|
|
|
|
|
|
|
|
|
|
|
|
|
|
|
|
|
|
|
Operating |
|
Operating |
|
|
Operating |
|
Operating |
|
||
|
Income |
|
Margin |
|
|
Income |
|
Margin |
|
||
Transportation Solutions |
$ |
501 |
|
20.3 |
% |
|
$ |
446 |
|
19.9 |
% |
Industrial Solutions |
|
462 |
|
21.0 |
|
|
|
244 |
|
15.3 |
|
Total |
$ |
963 |
|
20.6 |
% |
|
$ |
690 |
|
18.0 |
% |
|
|
|
|
|
|
|
|
|
|
|
|
|
|
|
|
|
|
|
|
|
|
|
|
|
Adjusted |
|
Adjusted |
|
|
Adjusted |
|
Adjusted |
|
||
|
Operating |
|
Operating |
|
|
Operating |
|
Operating |
|
||
|
Income (1) |
|
Margin (1) |
|
|
Income (1) |
|
Margin (1) |
|
||
Transportation Solutions |
$ |
523 |
|
21.2 |
% |
|
$ |
495 |
|
22.1 |
% |
Industrial Solutions |
|
513 |
|
23.3 |
|
|
|
289 |
|
18.1 |
|
Total |
$ |
1,036 |
|
22.2 |
% |
|
$ |
784 |
|
20.4 |
% |
|
|
|
|
|
|
|
|
|
|
|
|
(1) Adjusted operating income and adjusted operating margin are non-GAAP financial measures. See description of non-GAAP financial measures. | |||||||||||
TE CONNECTIVITY PLC
RECONCILIATION OF NET SALES GROWTH (DECLINE) (UNAUDITED)
|
Change in Net Sales for the Quarter Ended December 26, 2025 |
||||||||||||||||
|
versus Net Sales for the Quarter Ended December 27, 2024 |
||||||||||||||||
|
Net Sales |
|
|
Organic Net Sales |
|
|
|
|
|
||||||||
|
Growth |
|
|
Growth (Decline) (1) |
|
|
Translation (2) |
|
Acquisitions |
||||||||
|
($ in millions) |
||||||||||||||||
Transportation Solutions: |
|
|
|
|
|
|
|
|
|
|
|
|
|
|
|
|
|
Automotive |
$ |
163 |
|
9.5 |
% |
|
$ |
112 |
|
6.5 |
% |
|
$ |
51 |
|
$ |
— |
Commercial transportation |
|
58 |
|
18.6 |
|
|
|
51 |
|
16.3 |
|
|
|
7 |
|
|
— |
Sensors |
|
3 |
|
1.4 |
|
|
|
(5) |
|
(2.3) |
|
|
|
8 |
|
|
— |
Total Transportation Solutions |
|
224 |
|
10.0 |
|
|
|
158 |
|
7.0 |
|
|
|
66 |
|
|
— |
Industrial Solutions: |
|
|
|
|
|
|
|
|
|
|
|
|
|
|
|
|
|
Digital data networks |
|
294 |
|
71.2 |
|
|
|
288 |
|
69.7 |
|
|
|
6 |
|
|
— |
Automation and connected living |
|
70 |
|
14.6 |
|
|
|
55 |
|
11.6 |
|
|
|
14 |
|
|
1 |
Aerospace, defense, and marine |
|
47 |
|
14.1 |
|
|
|
36 |
|
10.9 |
|
|
|
11 |
|
|
— |
Energy |
|
190 |
|
88.0 |
|
|
|
32 |
|
14.6 |
|
|
|
7 |
|
|
151 |
Medical |
|
8 |
|
5.3 |
|
|
|
8 |
|
5.3 |
|
|
|
— |
|
|
— |
Total Industrial Solutions |
|
609 |
|
38.2 |
|
|
|
419 |
|
26.3 |
|
|
|
38 |
|
|
152 |
Total |
$ |
833 |
|
21.7 |
% |
|
$ |
577 |
|
15.0 |
% |
|
$ |
104 |
|
$ |
152 |
|
|
|
|
|
|
|
|
|
|
|
|
|
|
|
|
|
|
(1) Organic net sales growth (decline) is a non-GAAP financial measure. See description of non-GAAP financial measures. | |||||||||||||||||
(2) Represents the change in net sales resulting from changes in foreign currency exchange rates. | |||||||||||||||||
TE CONNECTIVITY PLC
RECONCILIATION OF NON-GAAP FINANCIAL MEASURES TO GAAP FINANCIAL MEASURES
For the Quarter Ended December 26, 2025
(UNAUDITED)
|
|
|
|
|
Adjustments |
|
|
|
|
|||||||
|
|
|
|
Acquisition- |
|
Restructuring |
|
|
|
|
|
|||||
|
|
|
|
Related |
|
and Other |
|
Amortization |
|
Adjusted |
|
|||||
|
U.S. GAAP |
|
|
Charges (1) |
|
Charges, Net (1) |
|
Expense (1) |
|
(Non-GAAP) (2) |
|
|||||
|
($ in millions, except per share data) |
|
||||||||||||||
Operating income: |
|
|
|
|
|
|
|
|
|
|
|
|
|
|
|
|
Transportation Solutions |
$ |
501 |
|
|
$ |
— |
|
$ |
4 |
|
$ |
18 |
|
$ |
523 |
|
Industrial Solutions |
|
462 |
|
|
|
6 |
|
|
6 |
|
|
39 |
|
|
513 |
|
Total |
$ |
963 |
|
|
$ |
6 |
|
$ |
10 |
|
$ |
57 |
|
$ |
1,036 |
|
|
|
|
|
|
|
|
|
|
|
|
|
|
|
|
|
|
Operating margin |
|
20.6 |
% |
|
|
|
|
|
|
|
|
|
|
|
22.2 |
% |
|
|
|
|
|
|
|
|
|
|
|
|
|
|
|
|
|
Income tax expense |
$ |
(210) |
|
|
$ |
(1) |
|
$ |
(3) |
|
$ |
(11) |
|
$ |
(225) |
|
|
|
|
|
|
|
|
|
|
|
|
|
|
|
|
|
|
Effective tax rate |
|
21.9 |
% |
|
|
|
|
|
|
|
|
|
|
|
21.8 |
% |
|
|
|
|
|
|
|
|
|
|
|
|
|
|
|
|
|
Income from continuing operations |
$ |
751 |
|
|
$ |
5 |
|
$ |
7 |
|
$ |
46 |
|
$ |
809 |
|
|
|
|
|
|
|
|
|
|
|
|
|
|
|
|
|
|
Diluted earnings per share from continuing operations |
$ |
2.53 |
|
|
$ |
0.02 |
|
$ |
0.02 |
|
$ |
0.15 |
|
$ |
2.72 |
|
|
|
|
|
|
|
|
|
|
|
|
|
|
|
|
|
|
(1) The tax effect of each non-GAAP adjustment is calculated based on the jurisdictions in which the expense (income) is incurred and the tax laws in effect for each such jurisdiction. |
|
|||||||||||||||
(2) See description of non-GAAP financial measures. |
|
|||||||||||||||
TE CONNECTIVITY PLC
RECONCILIATION OF NON-GAAP FINANCIAL MEASURES TO GAAP FINANCIAL MEASURES
For the Quarter Ended December 27, 2024
(UNAUDITED)
|
|
|
|
|
Adjustments |
|
|
|
|
||||||||||
|
|
|
|
Acquisition- |
|
Restructuring |
|
|
|
|
|
|
|
||||||
|
|
|
|
Related |
|
and Other |
|
Amortization |
|
|
|
Adjusted |
|
||||||
|
U.S. GAAP |
|
|
Charges (1) |
|
Charges, Net (1) |
|
Expense (1) |
|
Tax Items (2) |
|
(Non-GAAP) (3) |
|
||||||
|
($ in millions, except per share data) |
|
|||||||||||||||||
Operating income: |
|
|
|
|
|
|
|
|
|
|
|
|
|
|
|
|
|
|
|
Transportation Solutions |
$ |
446 |
|
|
$ |
— |
|
$ |
32 |
|
$ |
17 |
|
$ |
— |
|
$ |
495 |
|
Industrial Solutions |
|
244 |
|
|
|
5 |
|
|
18 |
|
|
22 |
|
|
— |
|
|
289 |
|
Total |
$ |
690 |
|
|
$ |
5 |
|
$ |
50 |
|
$ |
39 |
|
$ |
— |
|
$ |
784 |
|
|
|
|
|
|
|
|
|
|
|
|
|
|
|
|
|
|
|
|
|
Operating margin |
|
18.0 |
% |
|
|
|
|
|
|
|
|
|
|
|
|
|
|
20.4 |
% |
|
|
|
|
|
|
|
|
|
|
|
|
|
|
|
|
|
|
|
|
Income tax expense |
$ |
(178) |
|
|
$ |
(1) |
|
$ |
(9) |
|
$ |
(7) |
|
$ |
13 |
|
$ |
(182) |
|
|
|
|
|
|
|
|
|
|
|
|
|
|
|
|
|
|
|
|
|
Effective tax rate |
|
25.2 |
% |
|
|
|
|
|
|
|
|
|
|
|
|
|
|
22.8 |
% |
|
|
|
|
|
|
|
|
|
|
|
|
|
|
|
|
|
|
|
|
Income from continuing operations |
$ |
528 |
|
|
$ |
4 |
|
$ |
41 |
|
$ |
32 |
|
$ |
13 |
|
$ |
618 |
|
|
|
|
|
|
|
|
|
|
|
|
|
|
|
|
|
|
|
|
|
Diluted earnings per share from continuing operations |
$ |
1.75 |
|
|
$ |
0.01 |
|
$ |
0.14 |
|
$ |
0.11 |
|
$ |
0.04 |
|
$ |
2.05 |
|
|
|
|
|
|
|
|
|
|
|
|
|
|
|
|
|
|
|
|
|
(1) The tax effect of each non-GAAP adjustment is calculated based on the jurisdictions in which the expense (income) is incurred and the tax laws in effect for each such jurisdiction. |
|
||||||||||||||||||
(2) Represents income tax expense related to the revaluation of deferred tax assets as a result of a decrease in the corporate tax rate in a non-U.S. jurisdiction. |
|
||||||||||||||||||
(3) See description of non-GAAP financial measures. |
|
||||||||||||||||||
TE CONNECTIVITY PLC
RECONCILIATION OF NON-GAAP FINANCIAL MEASURES TO GAAP FINANCIAL MEASURES
For the Quarter Ended March 28, 2025
(UNAUDITED)
|
|
|
|
|
Adjustments |
|
|
|
|
||||||||||
|
|
|
|
Acquisition- |
|
Restructuring |
|
|
|
|
|
|
|
||||||
|
|
|
|
Related |
|
and Other |
|
Amortization |
|
|
|
Adjusted |
|
||||||
|
U.S. GAAP |
|
|
Charges (1) |
|
Charges, Net (1) |
|
Expense (1) |
|
Tax Items (2) |
|
(Non-GAAP) (3) |
|
||||||
|
($ in millions, except per share data) |
|
|||||||||||||||||
Operating income: |
|
|
|
|
|
|
|
|
|
|
|
|
|
|
|
|
|
|
|
Transportation Solutions |
$ |
445 |
|
|
$ |
— |
|
$ |
33 |
|
$ |
17 |
|
$ |
— |
|
$ |
495 |
|
Industrial Solutions |
|
303 |
|
|
|
12 |
|
|
12 |
|
|
24 |
|
|
— |
|
|
351 |
|
Total |
$ |
748 |
|
|
$ |
12 |
|
$ |
45 |
|
$ |
41 |
|
$ |
— |
|
$ |
846 |
|
|
|
|
|
|
|
|
|
|
|
|
|
|
|
|
|
|
|
|
|
Operating margin |
|
18.1 |
% |
|
|
|
|
|
|
|
|
|
|
|
|
|
|
20.4 |
% |
|
|
|
|
|
|
|
|
|
|
|
|
|
|
|
|
|
|
|
|
Income tax expense |
$ |
(742) |
|
|
$ |
(2) |
|
$ |
(11) |
|
$ |
(8) |
|
$ |
574 |
|
$ |
(189) |
|
|
|
|
|
|
|
|
|
|
|
|
|
|
|
|
|
|
|
|
|
Effective tax rate |
|
98.3 |
% |
|
|
|
|
|
|
|
|
|
|
|
|
|
|
22.2 |
% |
|
|
|
|
|
|
|
|
|
|
|
|
|
|
|
|
|
|
|
|
Income from continuing operations |
$ |
13 |
|
|
$ |
10 |
|
$ |
34 |
|
$ |
33 |
|
$ |
574 |
|
$ |
664 |
|
|
|
|
|
|
|
|
|
|
|
|
|
|
|
|
|
|
|
|
|
Diluted earnings per share from continuing operations |
$ |
0.04 |
|
|
$ |
0.03 |
|
$ |
0.11 |
|
$ |
0.11 |
|
$ |
1.91 |
|
$ |
2.21 |
|
|
|
|
|
|
|
|
|
|
|
|
|
|
|
|
|
|
|
|
|
(1) The tax effect of each non-GAAP adjustment is calculated based on the jurisdictions in which the expense (income) is incurred and the tax laws in effect for each such jurisdiction. |
|
||||||||||||||||||
(2) Represents income tax expense related to a net increase in the valuation allowance for certain deferred tax assets associated with a ten-year tax credit obtained by a Swiss subsidiary in fiscal 2024. |
|
||||||||||||||||||
(3) See description of non-GAAP financial measures. |
|
||||||||||||||||||
TE CONNECTIVITY PLC
RECONCILIATION OF NON-GAAP FINANCIAL MEASURES TO GAAP FINANCIAL MEASURES
For the Year Ended September 26, 2025
(UNAUDITED)
|
|
|
|
|
Adjustments |
|
|
|
|
||||||||||
|
|
|
|
Acquisition- |
|
Restructuring |
|
|
|
|
|
|
|
||||||
|
|
|
|
Related |
|
and Other |
|
Amortization |
|
|
|
Adjusted |
|
||||||
|
U.S. GAAP |
|
|
Charges (1) |
|
Charges, Net (1) |
|
Expense (1) |
|
Tax Items (2) |
|
(Non-GAAP) (3) |
|
||||||
|
($ in millions, except per share data) |
|
|||||||||||||||||
Operating income: |
|
|
|
|
|
|
|
|
|
|
|
|
|
|
|
|
|
|
|
Transportation Solutions |
$ |
1,818 |
|
|
$ |
— |
|
$ |
75 |
|
$ |
70 |
|
$ |
— |
|
$ |
1,963 |
|
Industrial Solutions |
|
1,393 |
|
|
|
57 |
|
|
51 |
|
|
120 |
|
|
— |
|
|
1,621 |
|
Total |
$ |
3,211 |
|
|
$ |
57 |
|
$ |
126 |
|
$ |
190 |
|
$ |
— |
|
$ |
3,584 |
|
|
|
|
|
|
|
|
|
|
|
|
|
|
|
|
|
|
|
|
|
Operating margin |
|
18.6 |
% |
|
|
|
|
|
|
|
|
|
|
|
|
|
|
20.8 |
% |
|
|
|
|
|
|
|
|
|
|
|
|
|
|
|
|
|
|
|
|
Income tax expense |
$ |
(1,361) |
|
|
$ |
(12) |
|
$ |
(13) |
|
$ |
(37) |
|
$ |
618 |
|
$ |
(805) |
|
|
|
|
|
|
|
|
|
|
|
|
|
|
|
|
|
|
|
|
|
Effective tax rate |
|
42.5 |
% |
|
|
|
|
|
|
|
|
|
|
|
|
|
|
22.5 |
% |
|
|
|
|
|
|
|
|
|
|
|
|
|
|
|
|
|
|
|
|
Income from continuing operations |
$ |
1,843 |
|
|
$ |
45 |
|
$ |
113 |
|
$ |
153 |
|
$ |
618 |
|
$ |
2,772 |
|
|
|
|
|
|
|
|
|
|
|
|
|
|
|
|
|
|
|
|
|
Diluted earnings per share from continuing operations |
$ |
6.16 |
|
|
$ |
0.15 |
|
$ |
0.38 |
|
$ |
0.51 |
|
$ |
2.07 |
|
$ |
9.27 |
|
|
|
|
|
|
|
|
|
|
|
|
|
|
|
|
|
|
|
|
|
(1) The tax effect of each non-GAAP adjustment is calculated based on the jurisdictions in which the expense (income) is incurred and the tax laws in effect for each such jurisdiction. |
|
||||||||||||||||||
(2) Represents income tax expense of $574 million related to a net increase in the valuation allowance for certain deferred tax assets associated with a ten-year tax credit obtained by a Swiss subsidiary in fiscal 2024 as well as income tax expense of $44 million related to an increase in the valuation allowance for certain U.S. tax loss and credit carryforwards. |
|
||||||||||||||||||
(3) See description of non-GAAP financial measures. |
|
||||||||||||||||||
TE CONNECTIVITY PLC
RECONCILIATION OF FORWARD-LOOKING NON-GAAP FINANCIAL MEASURES
TO FORWARD-LOOKING GAAP FINANCIAL MEASURES
As of January 21, 2026
(UNAUDITED)
|
Outlook for |
|
|
|
Quarter Ending |
|
|
|
March 27, |
|
|
|
2026 |
|
|
Diluted earnings per share from continuing operations |
$ |
2.26 |
|
Acquisition-related charges |
|
0.01 |
|
Restructuring and other charges, net |
|
0.23 |
|
Amortization expense |
|
0.15 |
|
Adjusted diluted earnings per share from continuing operations (1) |
$ |
2.65 |
|
|
|
|
|
|
|
|
|
Net sales growth |
|
13.4 |
% |
Translation |
|
(4.3) |
|
(Acquisitions) divestitures, net |
|
(2.9) |
|
Organic net sales growth (1) |
|
6.2 |
% |
|
|
|
|
(1) See description of non-GAAP financial measures. | |||
|
EVERY CONNECTION COUNTS TE Connectivity First Quarter 2026 Earnings January 21, 2026 |
|
Forward-Looking Statements and Non-GAAP Financial Measures 2 Forward-Looking Statements This presentation contains certain "forward-looking statements" within the meaning of the U.S. Private Securities Litigation Reform Act of 1995. These statements are based on management's current expectations and are subject to risks, uncertainty and changes in circumstances, which may cause actual results, performance, financial condition or achievements to differ materially from anticipated results, performance, financial condition or achievements. All statements contained herein that are not clearly historical in nature are forward-looking and the words "anticipate," "believe," "expect," "estimate," "plan," and similar expressions are generally intended to identify forward-looking statements. We have no intention and are under no obligation to update or alter (and expressly disclaim any such intention or obligation to do so) our forward-looking statements whether as a result of new information, future events or otherwise, except to the extent required by law. The forward-looking statements in this presentation include statements addressing our future financial condition and operating results. Examples of factors that could cause actual results to differ materially from those described in the forward-looking statements include, among others, the extent, severity and duration of business interruptions negatively affecting our business operations; business, economic, competitive and regulatory risks, such as conditions affecting demand for products in the automotive and other industries we serve; competition and pricing pressure; fluctuations in foreign currency exchange rates and commodity prices; natural disasters and political, economic and military instability in countries in which we operate, including continuing military conflict in certain parts of the world; developments in the credit markets; future goodwill impairment; compliance with current and future environmental and other laws and regulations; and the possible effects on us of changes in tax laws, tax treaties and other legislation. More detailed information about these and other factors is set forth in TE Connectivity plc's Annual Report on Form 10-K for the fiscal year ended Sept. 26, 2025, as well as in our Quarterly Reports on Form 10-Q, Current Reports on Form 8-K and other reports filed by us with the U.S. Securities and Exchange Commission. Non-GAAP Financial Measures Where we have used non-GAAP financial measures, reconciliations to the most comparable GAAP measure are provided, along with a disclosure on the usefulness of the non-GAAP financial measure, in this presentation. Effective for fiscal 2026, we exclude amortization expense on intangible assets and, if applicable, the related tax effects from our calculation of certain non-GAAP financial measures. |
|
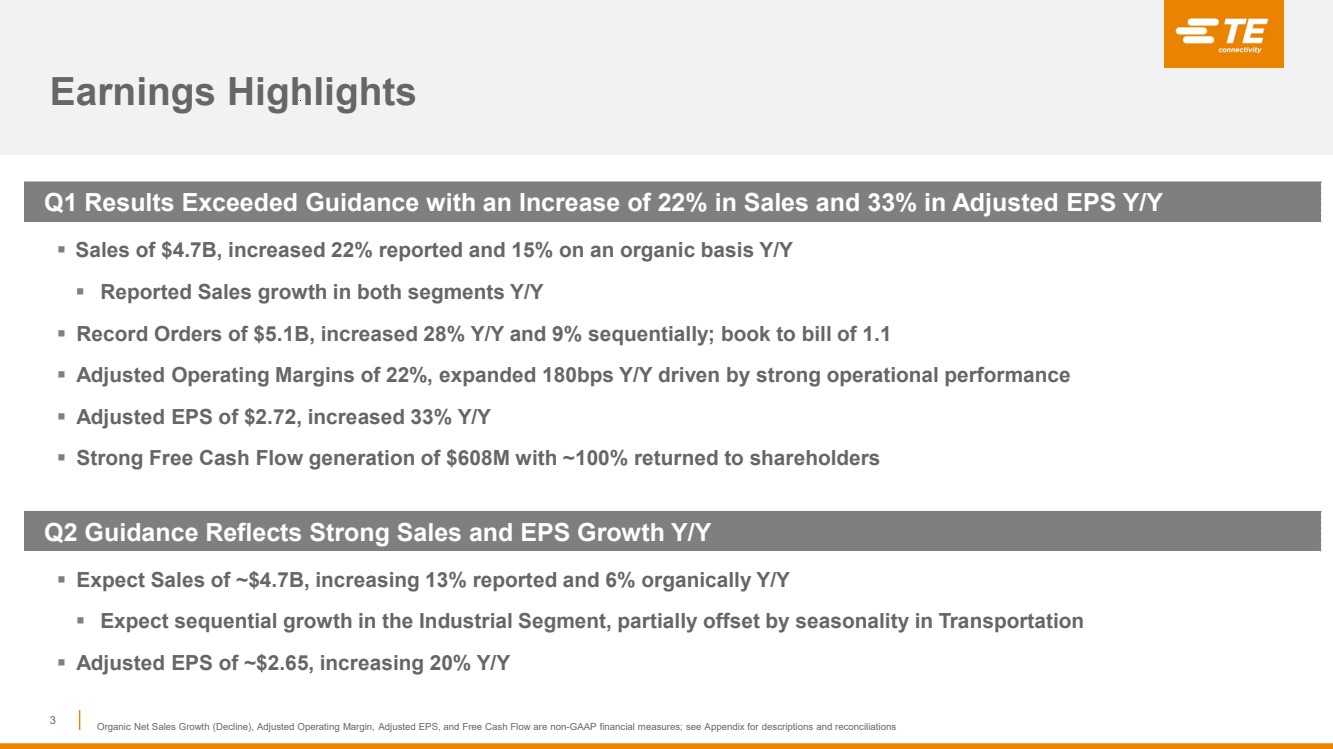
Q1 Results Exceeded Guidance with an Increase of 22% in Sales and 33% in Adjusted EPS Y/Y ▪ Sales of $4.7B, increased 22% reported and 15% on an organic basis Y/Y ▪ Reported Sales growth in both segments Y/Y ▪ Record Orders of $5.1B, increased 28% Y/Y and 9% sequentially; book to bill of 1.1 ▪ Adjusted Operating Margins of 22%, expanded 180bps Y/Y driven by strong operational performance ▪ Adjusted EPS of $2.72, increased 33% Y/Y ▪ Strong Free Cash Flow generation of $608M with ~100% returned to shareholders Earnings Highlights 3 Organic Net Sales Growth (Decline), Adjusted Operating Margin, Adjusted EPS, and Free Cash Flow are non-GAAP financial measures; see Appendix for descriptions and reconciliations Q2 Guidance Reflects Strong Sales and EPS Growth Y/Y ▪ Expect Sales of ~$4.7B, increasing 13% reported and 6% organically Y/Y ▪ Expect sequential growth in the Industrial Segment, partially offset by seasonality in Transportation ▪ Adjusted EPS of ~$2.65, increasing 20% Y/Y |
|
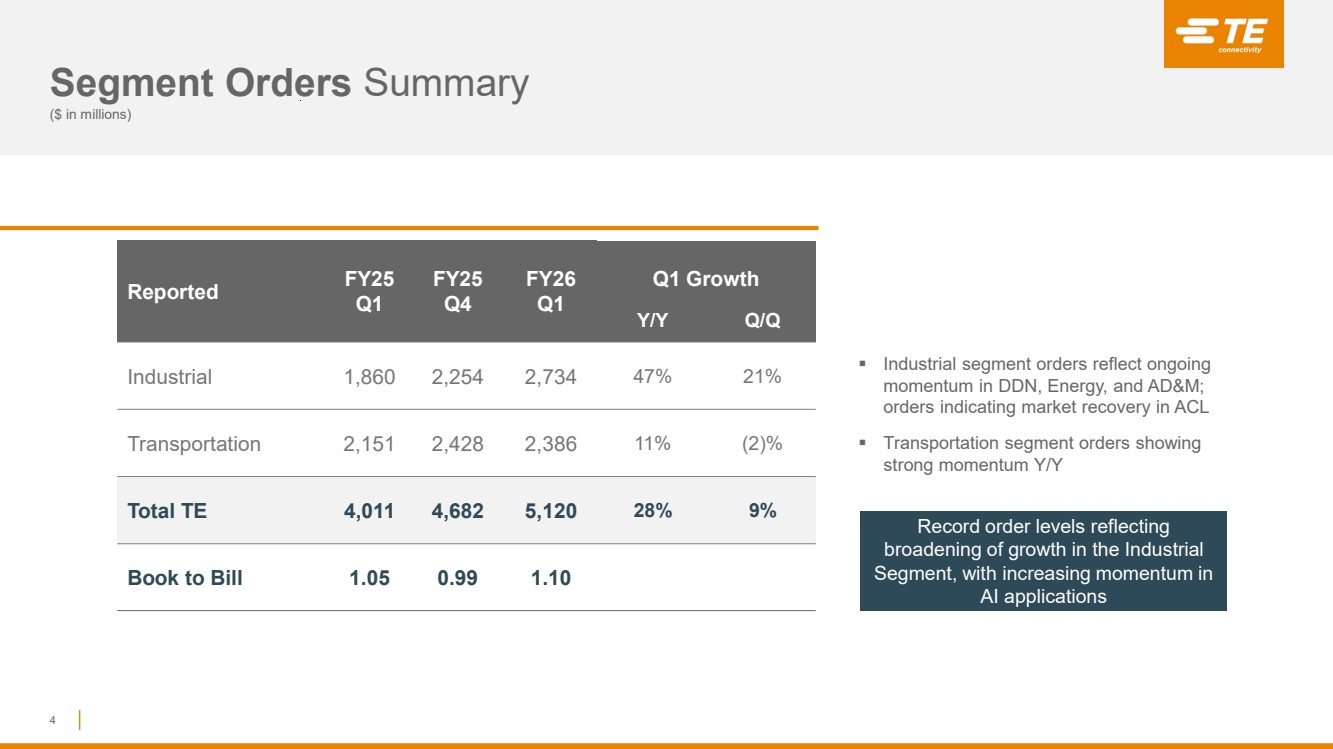
Reported FY25 Q1 FY25 Q4 FY26 Q1 Q1 Growth Y/Y Q/Q Industrial 1,860 2,254 2,734 47% 21% Transportation 2,151 2,428 2,386 11% (2)% Total TE 4,011 4,682 5,120 28% 9% Book to Bill 1.05 0.99 1.10 Segment Orders Summary ($ in millions) 4 ▪ Industrial segment orders reflect ongoing momentum in DDN, Energy, and AD&M; orders indicating market recovery in ACL ▪ Transportation segment orders showing strong momentum Y/Y Record order levels reflecting broadening of growth in the Industrial Segment, with increasing momentum in AI applications |
|
Industrial Solutions Q1 SALES Reported Up 38% Organic Up 26% Q1 ADJUSTED OPERATING MARGIN Margin expansion of 520bps driven by strong operational performance and benefits of higher volume Adjusted EBITDA Margin 21.4% 26.8% 5 Q1 BUSINESS PERFORMANCE Y/Y Growth Rates Reported Organic Digital Data Networks (DDN) $707 71% 70% Automation & Connected Living (ACL) 549 15% 12% Energy 406 88% 15% Aerospace, Defense and Marine (AD&M) 381 14% 11% Medical 159 5% 5% Industrial Solutions $2,202 38% 26% $ in Millions ▪ Digital Data Networks Strong growth driven by momentum in AI applications ▪ Automation & Connected Living Growth across all regions with improvement in Factory Automation applications ▪ Energy Organic growth driven by grid hardening & renewable applications ▪ AD&M Growth reflects ongoing strength in commercial air and defense markets ▪ Medical Sales growth Y/Y as expected $1,593 $2,202 Q1 2025 Q1 2026 18.1% 23.3% Q1 2025 Q1 2026 Continued momentum with all businesses growing Y/Y Organic Net Sales Growth (Decline), Adjusted Operating Margin, and Adjusted EBITDA Margin are non-GAAP financial measures; see Appendix for descriptions and reconciliations. |
|
Transportation Solutions Q1 SALES Reported Up 10% Organic Up 7% Q1 ADJUSTED OPERATING MARGIN Margin performance in line with expectations; delivered sequential margin improvement Adjusted EBITDA Margin 26.3% 26.3% 6 $2,243 $2,467 Q1 2025 Q1 2026 Q1 BUSINESS PERFORMANCE Y/Y Growth Rates Reported Organic Automotive $1,885 10% 7% Commercial Transportation 370 19% 16% Sensors 212 1% (2)% Transportation Solutions $2,467 10% 7% $ in Millions 22.1% 21.2% Q1 2025 Q1 2026 ▪ Automotive Sales increase driven by content growth in Asia and Europe ▪ Commercial Transportation Sales growth driven by Asia and Europe ▪ Sensors Sales growth in Asia with weakness in Western regions Organic Net Sales Growth (Decline), Adjusted Operating Margin, and Adjusted EBITDA Margin are non-GAAP financial measures; see Appendix for descriptions and reconciliations. Strong Auto content growth along with improvement in Commercial Transportation end markets |
|
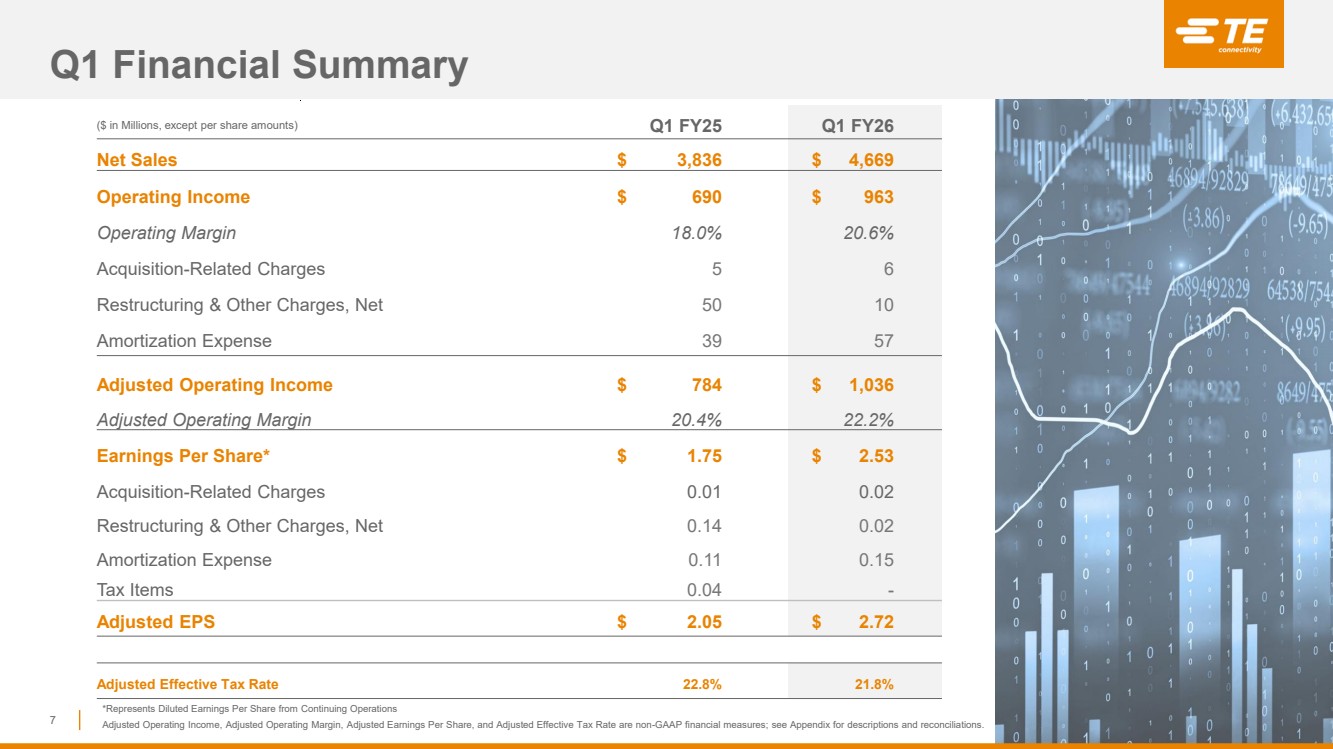
Q1 Financial Summary 7 ($ in Millions, except per share amounts) Q1 FY25 Q1 FY26 Net Sales $ 3,836 $ 4,669 Operating Income $ 690 $ 963 Operating Margin 18.0% 20.6% Acquisition-Related Charges 5 6 Restructuring & Other Charges, Net 50 10 Amortization Expense 39 57 Adjusted Operating Income $ 784 $ 1,036 Adjusted Operating Margin 20.4% 22.2% Earnings Per Share* $ 1.75 $ 2.53 Acquisition-Related Charges 0.01 0.02 Restructuring & Other Charges, Net 0.14 0.02 Amortization Expense 0.11 0.15 Tax Items 0.04 - Adjusted EPS $ 2.05 $ 2.72 Adjusted Effective Tax Rate 22.8% 21.8% *Represents Diluted Earnings Per Share from Continuing Operations Adjusted Operating Income, Adjusted Operating Margin, Adjusted Earnings Per Share, and Adjusted Effective Tax Rate are non-GAAP financial measures; see Appendix for descriptions and reconciliations. |
|
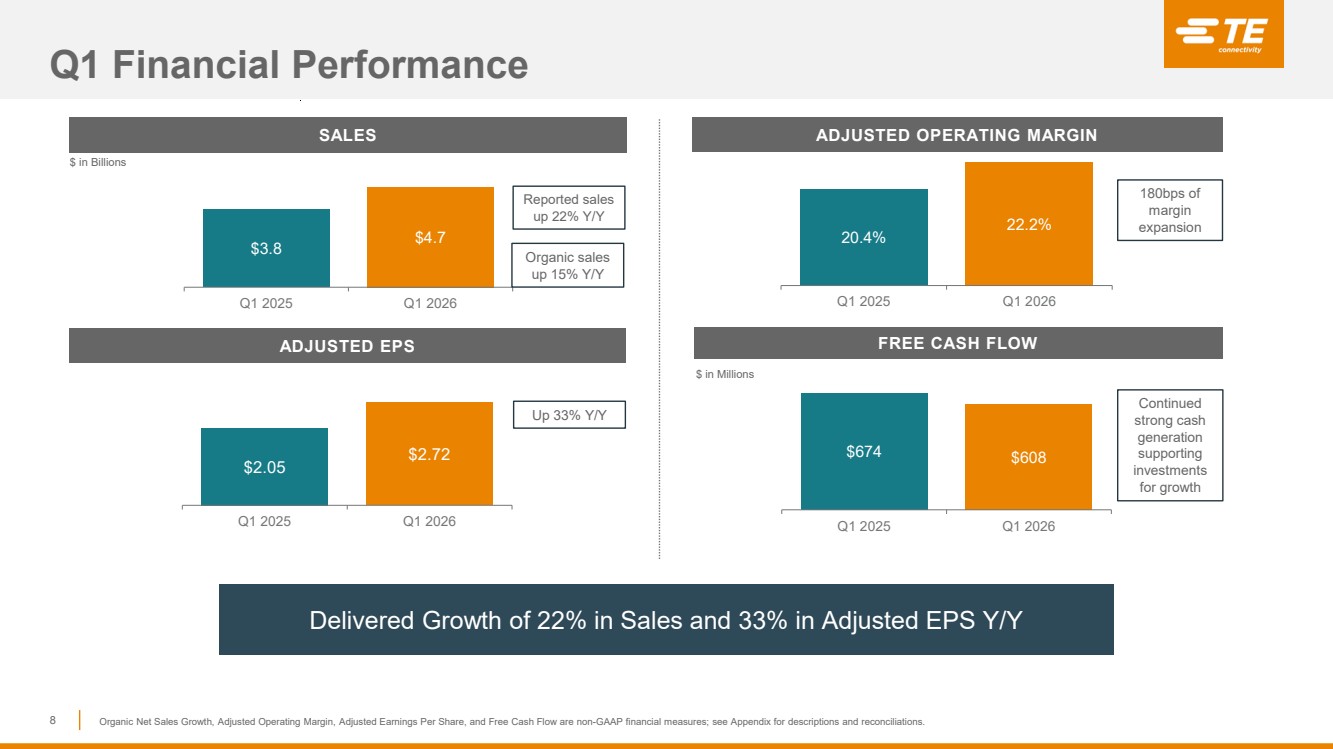
Q1 Financial Performance 8 20.4% 22.2% Q1 2025 Q1 2026 SALES ADJUSTED OPERATING MARGIN ADJUSTED EPS FREE CASH FLOW Delivered Growth of 22% in Sales and 33% in Adjusted EPS Y/Y $ in Billions $ in Millions Continued strong cash generation supporting investments for growth $674 $608 Q1 2025 Q1 2026 Up 33% Y/Y $3.8 $4.7 Q1 2025 Q1 2026 180bps of margin expansion Organic Net Sales Growth, Adjusted Operating Margin, Adjusted Earnings Per Share, and Free Cash Flow are non-GAAP financial measures; see Appendix for descriptions and reconciliations. Reported sales up 22% Y/Y $2.05 $2.72 Q1 2025 Q1 2026 Organic sales up 15% Y/Y ADJUSTED OPERATING MARGIN |
|
EVERY CONNECTION COUNTS Additional Information |
|
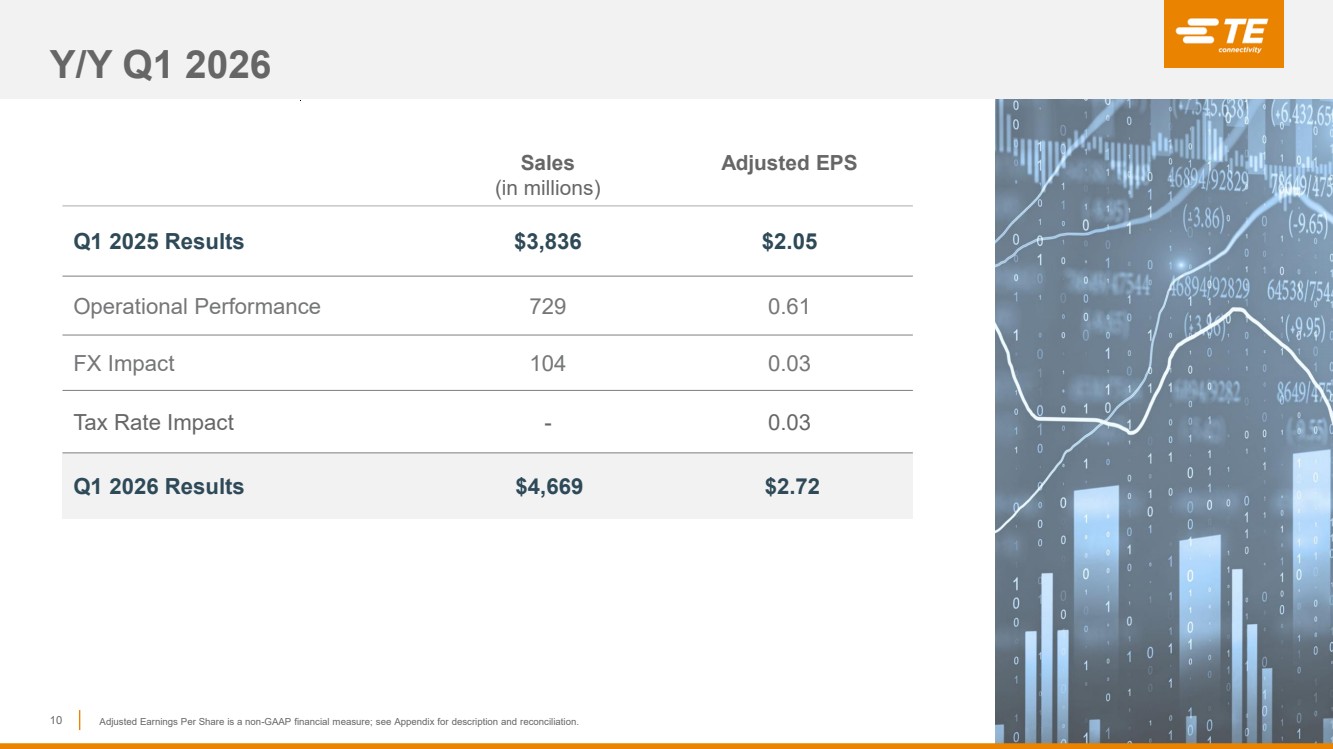
Y/Y Q1 2026 10 Sales (in millions) Adjusted EPS Q1 2025 Results $3,836 $2.05 Operational Performance 729 0.61 FX Impact 104 0.03 Tax Rate Impact - 0.03 Q1 2026 Results $4,669 $2.72 Adjusted Earnings Per Share is a non-GAAP financial measure; see Appendix for description and reconciliation. |
|
Y/Y Q2 2026 11 Sales (in millions) Adjusted EPS Q2 2025 Results $4,143 $2.21 Operational Performance 377 0.39 FX Impact 180 0.05 Tax Rate Impact - - Q1 2026 Guidance $4,700 $2.65 Adjusted Earnings Per Share is a non-GAAP financial measure; see Appendix for description and reconciliation. |
|
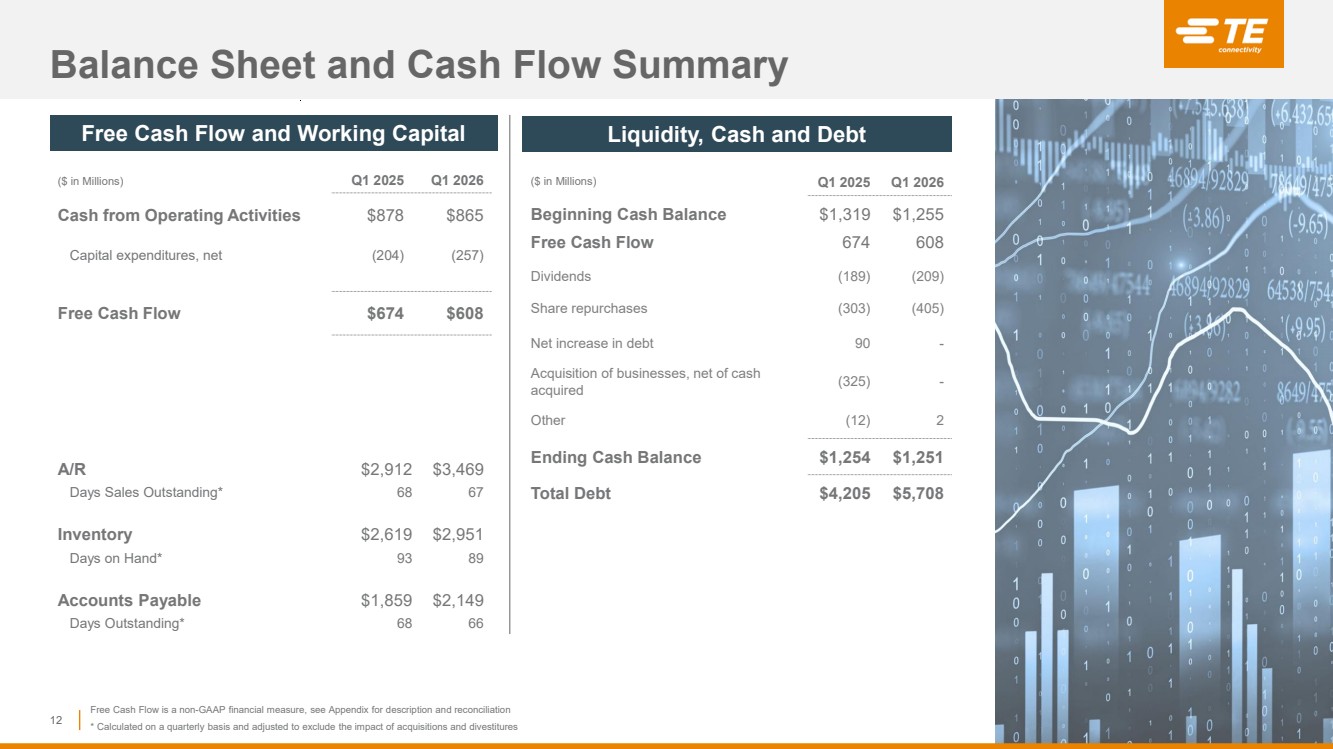
Balance Sheet and Cash Flow Summary 12 ($ in Millions) Q1 2025 Q1 2026 Beginning Cash Balance $1,319 $1,255 Free Cash Flow 674 608 Dividends (189) (209) Share repurchases (303) (405) Net increase in debt 90 - Acquisition of businesses, net of cash acquired (325) - Other (12) 2 Ending Cash Balance $1,254 $1,251 Total Debt $4,205 $5,708 A/R $2,912 $3,469 Days Sales Outstanding* 68 67 Inventory $2,619 $2,951 Days on Hand* 93 89 Accounts Payable $1,859 $2,149 Days Outstanding* 68 66 Free Cash Flow and Working Capital Liquidity, Cash and Debt ($ in Millions) Q1 2025 Q1 2026 Cash from Operating Activities $878 $865 Capital expenditures, net (204) (257) Free Cash Flow $674 $608 Free Cash Flow is a non-GAAP financial measure, see Appendix for description and reconciliation * Calculated on a quarterly basis and adjusted to exclude the impact of acquisitions and divestitures |
|
EVERY CONNECTION COUNTS Appendix |
|
We present non-GAAP performance and liquidity measures as we believe it is appropriate for investors to consider adjusted financial measures in addition to results in accordance with accounting principles generally accepted in the U.S. (“GAAP”). These non-GAAP financial measures provide supplemental information and should not be considered replacements for results in accordance with GAAP. Management uses non-GAAP financial measures internally for planning and forecasting purposes and in its decision-making processes related to the operations of our company. We believe these measures provide meaningful information to us and investors because they enhance the understanding of our operating performance, ability to generate cash, and the trends of our business. Additionally, we believe that investors benefit from having access to the same financial measures that management uses in evaluating our operations. The primary limitation of these measures is that they exclude the financial impact of items that would otherwise either increase or decrease our reported results. This limitation is best addressed by using these non-GAAP financial measures in combination with the most directly comparable GAAP financial measures in order to better understand the amounts, character, and impact of any increase or decrease in reported amounts. These non-GAAP financial measures may not be comparable to similarly-titled measures reported by other companies. The following provides additional information regarding our non-GAAP financial measures: ▪ Organic Net Sales Growth (Decline) – represents net sales growth (decline) (the most comparable GAAP financial measure) excluding the impact of foreign currency exchange rates, and acquisitions and divestitures that occurred in the preceding twelve months, if any. Organic Net Sales Growth (Decline) is a useful measure of our performance because it excludes items that are not completely under management’s control, such as the impact of changes in foreign currency exchange rates, and items that do not reflect the underlying growth of the company, such as acquisition and divestiture activity. This measure is a significant component in our incentive compensation plans. ▪ Adjusted Operating Income and Adjusted Operating Margin – represent operating income and operating margin, respectively, (the most comparable GAAP financial measures) before special items including restructuring and other charges, acquisition-related charges, amortization expense on intangible assets, impairment of goodwill, and other income or charges, if any. We utilize these adjusted measures in combination with operating income and operating margin to assess segment level operating performance and to provide insight to management in evaluating segment operating plan execution and market conditions. Adjusted Operating Income is a significant component in our incentive compensation plans. ▪ Adjusted Income Tax (Expense) Benefit and Adjusted Effective Tax Rate – represent income tax (expense) benefit and effective tax rate, respectively, (the most comparable GAAP financial measures) after adjusting for the tax effect of special items including restructuring and other charges, acquisition-related charges, amortization expense on intangible assets, impairment of goodwill, other income or charges, and certain significant tax items, if any. ▪ Adjusted Income from Continuing Operations – represents income from continuing operations (the most comparable GAAP financial measure) before special items including restructuring and other charges, acquisition-related charges, amortization expense on intangible assets, impairment of goodwill, other income or charges, and certain significant tax items, if any, and, if applicable, the related tax effects Non-GAAP Financial Measures 14 |
|
▪ Adjusted Earnings Per Share – represents diluted earnings per share from continuing operations (the most comparable GAAP financial measure) before special items including restructuring and other charges, acquisition-related charges, amortization expense on intangible assets, impairment of goodwill, other income or charges, and certain significant tax items, if any, and, if applicable, the related tax effects. This measure is a significant component in our incentive compensation plans. ▪ Adjusted EBITDA and Adjusted EBITDA Margin – represent net income and net income as a percentage of net sales, respectively, (the most comparable GAAP financial measures) before interest expense, interest income, income taxes, depreciation, and amortization, as adjusted for net other income (expense), income (loss) from discontinued operations, and special items including restructuring and other charges, acquisition-related charges, impairment of goodwill, and other income or charges, if any. ▪ Free Cash Flow (FCF) – is a useful measure of our ability to generate cash. The difference between net cash provided by operating activities (the most comparable GAAP financial measure) and Free Cash Flow consists mainly of significant cash outflows and inflows that we believe are useful to identify. We believe Free Cash Flow provides useful information to investors as it provides insight into the primary cash flow metric used by management to monitor and evaluate cash flows generated from our operations. Free Cash Flow is defined as net cash provided by operating activities excluding voluntary pension contributions and the cash impact of special items, if any, minus net capital expenditures. Voluntary pension contributions are excluded from the GAAP financial measure because this activity is driven by economic financing decisions rather than operating activity. Certain special items, including cash paid (collected) pursuant to collateral requirements related to cross-currency swap contracts, are also excluded by management in evaluating Free Cash Flow. Net capital expenditures consist of capital expenditures less proceeds from the sale of property, plant, and equipment. These items are subtracted because they represent long-term commitments. In the calculation of Free Cash Flow, we subtract certain cash items that are ultimately within management’s and the Board of Directors’ discretion to direct and may imply that there is less or more cash available for our programs than the most comparable GAAP financial measure indicates. It should not be inferred that the entire Free Cash Flow amount is available for future discretionary expenditures, as our definition of Free Cash Flow does not consider certain non-discretionary expenditures, such as debt payments. In addition, we may have other discretionary expenditures, such as discretionary dividends, share repurchases, and business acquisitions, that are not considered in the calculation of Free Cash Flow. Non-GAAP Financial Measures (cont.) 15 |
|
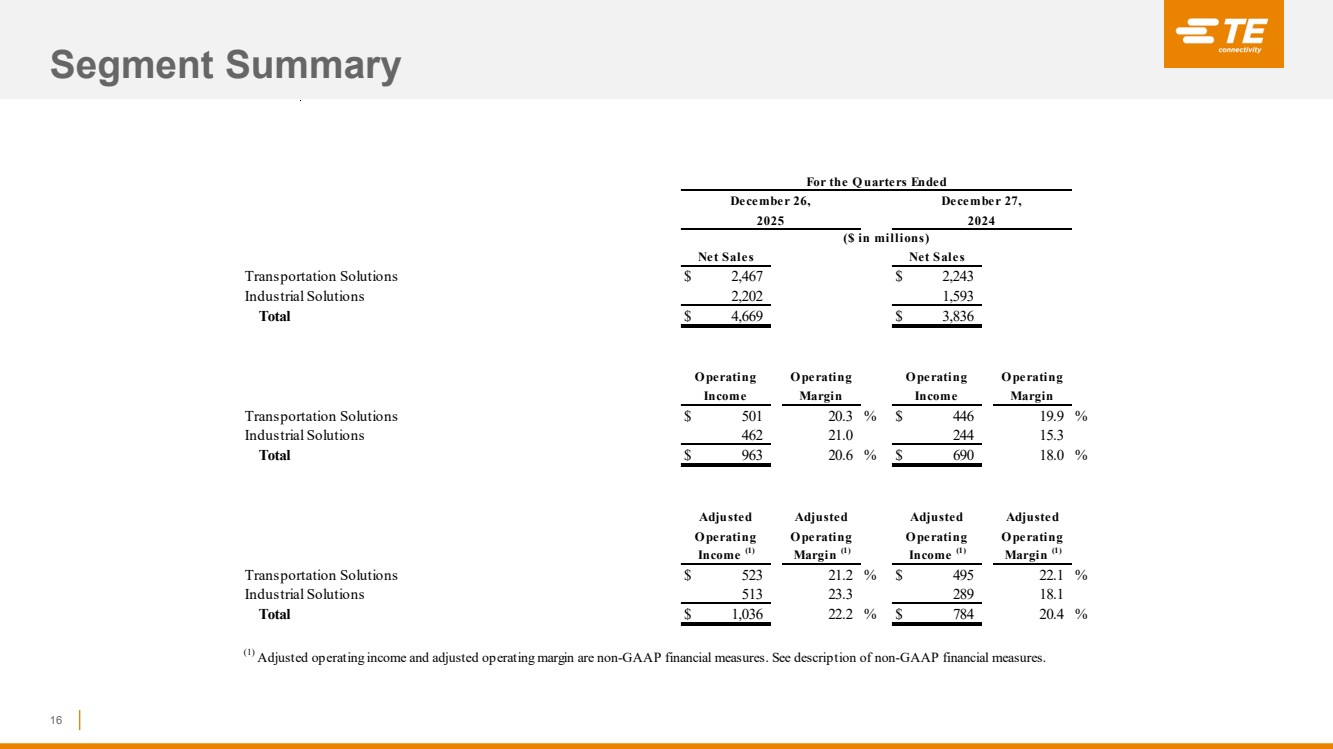
Segment Summary 16 Transportation Solutions $ 2,467 $ 2,243 Industrial Solutions 2,202 1,593 Total $ 4,669 $ 3,836 O perating O perating Margin Margin Transportation Solutions $ 501 20.3 % $ 446 19.9 % Industrial Solutions 462 21.0 244 15.3 Total $ 963 20.6 % $ 690 18.0 % Adjusted Adjusted O perating O perating Margin (1) Margin (1) Transportation Solutions $ 523 21.2 % $ 495 22.1 % Industrial Solutions 513 23.3 289 18.1 Total $ 1,036 22.2 % $ 784 20.4 % (1) Adjusted operating income and adjusted operating margin are non-GAAP financial measures. See description of non-GAAP financial measures. 2025 2024 ($ in millions) Adjusted O perating Net Sales Net Sales Income (1) Adjusted O perating Income (1) Income O perating O perating Income For the Q uarters Ended December 26, December 27, |
|
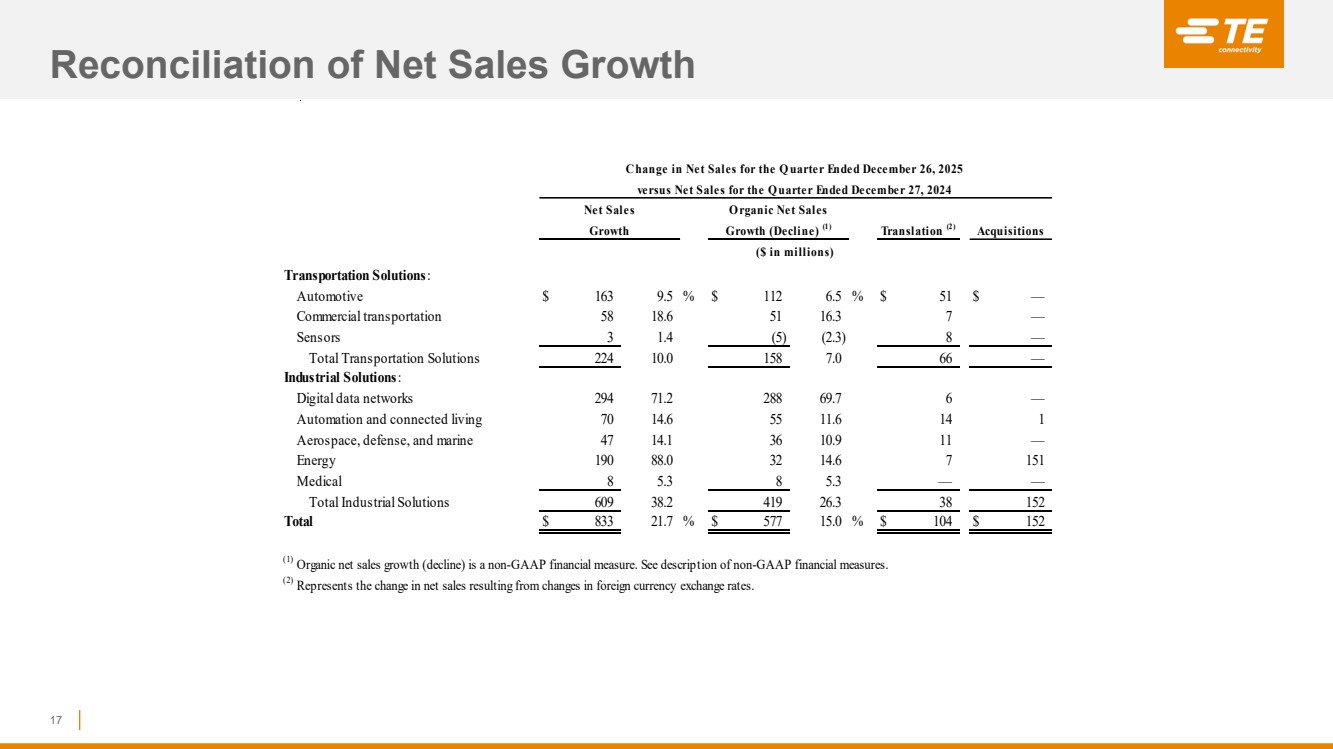
Reconciliation of Net Sales Growth 17 Transportation Solutions: Automotive $ 163 9.5 % $ 112 6.5 % $ 51 $ — Commercial transportation 58 18.6 51 16.3 7 — Sensors 3 1.4 (5) (2.3) 8 — Total Transportation Solutions 224 10.0 158 7.0 66 — Industrial Solutions: Digital data networks 294 71.2 288 69.7 6 — Automation and connected living 70 14.6 55 11.6 14 1 Aerospace, defense, and marine 47 14.1 36 10.9 11 — Energy 190 88.0 32 14.6 7 151 Medical 8 5.3 8 5.3 — — Total Industrial Solutions 609 38.2 419 26.3 38 152 Total $ 833 21.7 % $ 577 15.0 % $ 104 $ 152 ($ in millions) Translation (2) Acquisitions Net Sales Growth O rganic Net Sales Growth (Decline) (1) Change in Net Sales for the Q uarter Ended December 26, 2025 versus Net Sales for the Q uarter Ended December 27, 2024 (1) Organic net sales growth (decline) is a non-GAAP financial measure. See description of non-GAAP financial measures. (2) Represents the change in net sales resulting from changes in foreign currency exchange rates. |
|
Reconciliation of Non-GAAP Financial Measures to GAAP Financial Measures for the Quarter Ended December 26, 2025 18 Operating income: Transportation Solutions $ 501 $ — $ 4 $ 18 $ 523 Industrial Solutions 462 6 6 39 513 Total $ 963 $ 6 $ 10 $ 57 $ 1,036 Operating margin 20.6 % 22.2 % Income tax expense $ (210) $ (1) $ (3) $ (11) $ (225) Effective tax rate 21.9 % 21.8 % Income from continuing operations $ 751 $ 5 $ 7 $ 46 $ 809 Diluted earnings per share from continuing operations $ 2.53 $ 0.02 $ 0.02 $ 0.15 $ 2.72 Related and O ther Adjusted Acquisition- Restructuring Amortization Adjustments (2) See description of non-GAAP financial measures. (1) The tax effect of each non-GAAP adjustment is calculated based on the jurisdictions in which the expense (income) is incurred and the tax laws in effect for each such jurisdiction. U.S. GAAP Charges (1) (Non-GAAP) (2) Charges, Net (1) ($ in millions, except per share data) Expense (1) |
|
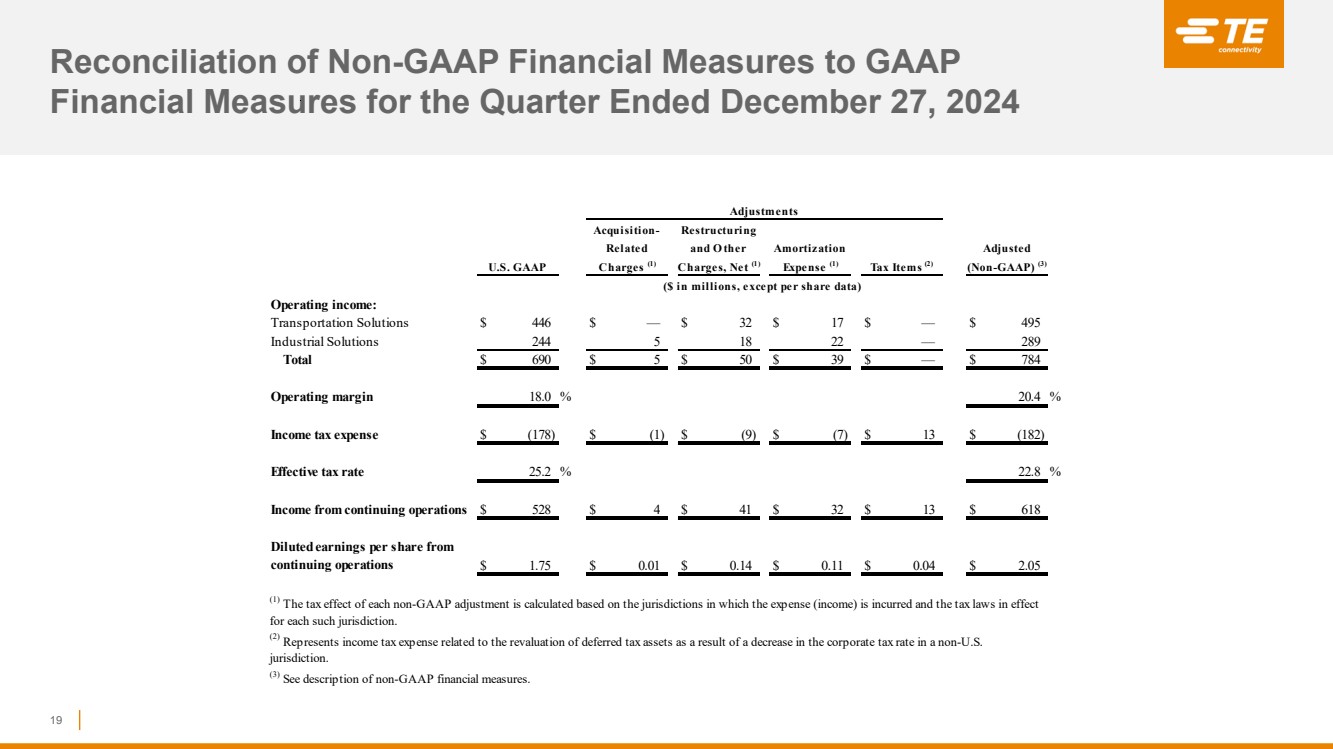
Reconciliation of Non-GAAP Financial Measures to GAAP Financial Measures for the Quarter Ended December 27, 2024 19 Operating income: Transportation Solutions $ 446 $ — $ 32 $ 17 $ — $ 495 Industrial Solutions 244 5 18 22 — 289 Total $ 690 $ 5 $ 50 $ 39 $ — $ 784 Operating margin 18.0 % 20.4 % Income tax expense $ (178) $ (1) $ (9) $ (7) $ 13 $ (182) Effective tax rate 25.2 % 22.8 % Income from continuing operations $ 528 $ 4 $ 41 $ 32 $ 13 $ 618 Diluted earnings per share from continuing operations $ 1.75 $ 0.01 $ 0.14 $ 0.11 $ 0.04 $ 2.05 (3) See description of non-GAAP financial measures. Adjusted (Non-GAAP) (3) ($ in millions, except per share data) (1) The tax effect of each non-GAAP adjustment is calculated based on the jurisdictions in which the expense (income) is incurred and the tax laws in effect for each such jurisdiction. Acquisition- Restructuring Expense (1) (2) Represents income tax expense related to the revaluation of deferred tax assets as a result of a decrease in the corporate tax rate in a non-U.S. jurisdiction. U.S. GAAP Charges (1) Adjustments Charges, Net (1) Tax Items (2) Related and O ther Amortization |
|
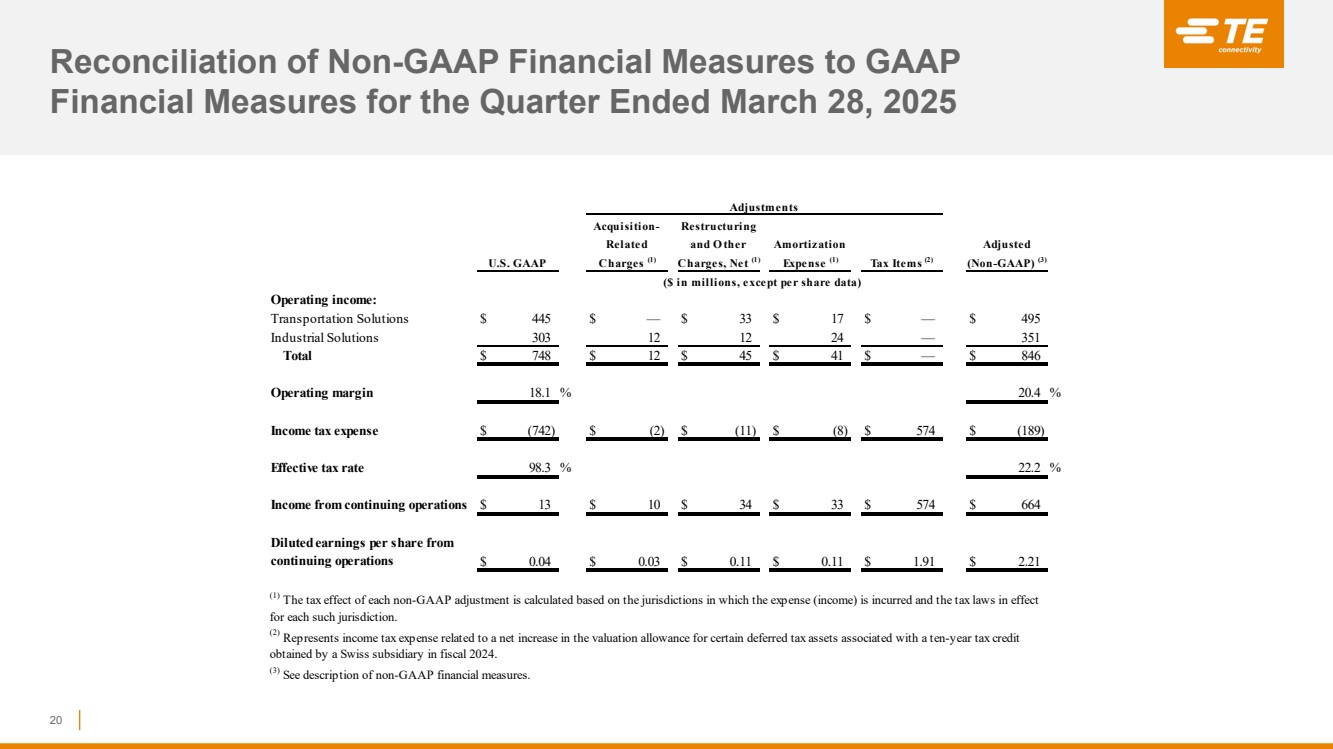
Reconciliation of Non-GAAP Financial Measures to GAAP Financial Measures for the Quarter Ended March 28, 2025 20 Operating income: Transportation Solutions $ 445 $ — $ 33 $ 17 $ — $ 495 Industrial Solutions 303 12 12 24 — 351 Total $ 748 $ 12 $ 45 $ 41 $ — $ 846 Operating margin 18.1 % 20.4 % Income tax expense $ (742) $ (2) $ (11) $ (8) $ 574 $ (189) Effective tax rate 98.3 % 22.2 % Income from continuing operations $ 13 $ 10 $ 34 $ 33 $ 574 $ 664 Diluted earnings per share from continuing operations $ 0.04 $ 0.03 $ 0.11 $ 0.11 $ 1.91 $ 2.21 Adjusted Tax Items (2) (Non-GAAP) (3) Adjustments U.S. GAAP Charges (1) Charges, Net (1) Expense (1) ($ in millions, except per share data) (1) The tax effect of each non-GAAP adjustment is calculated based on the jurisdictions in which the expense (income) is incurred and the tax laws in effect for each such jurisdiction. (2) Represents income tax expense related to a net increase in the valuation allowance for certain deferred tax assets associated with a ten-year tax credit obtained by a Swiss subsidiary in fiscal 2024. (3) See description of non-GAAP financial measures. Related and O ther Amortization Acquisition- Restructuring |
|
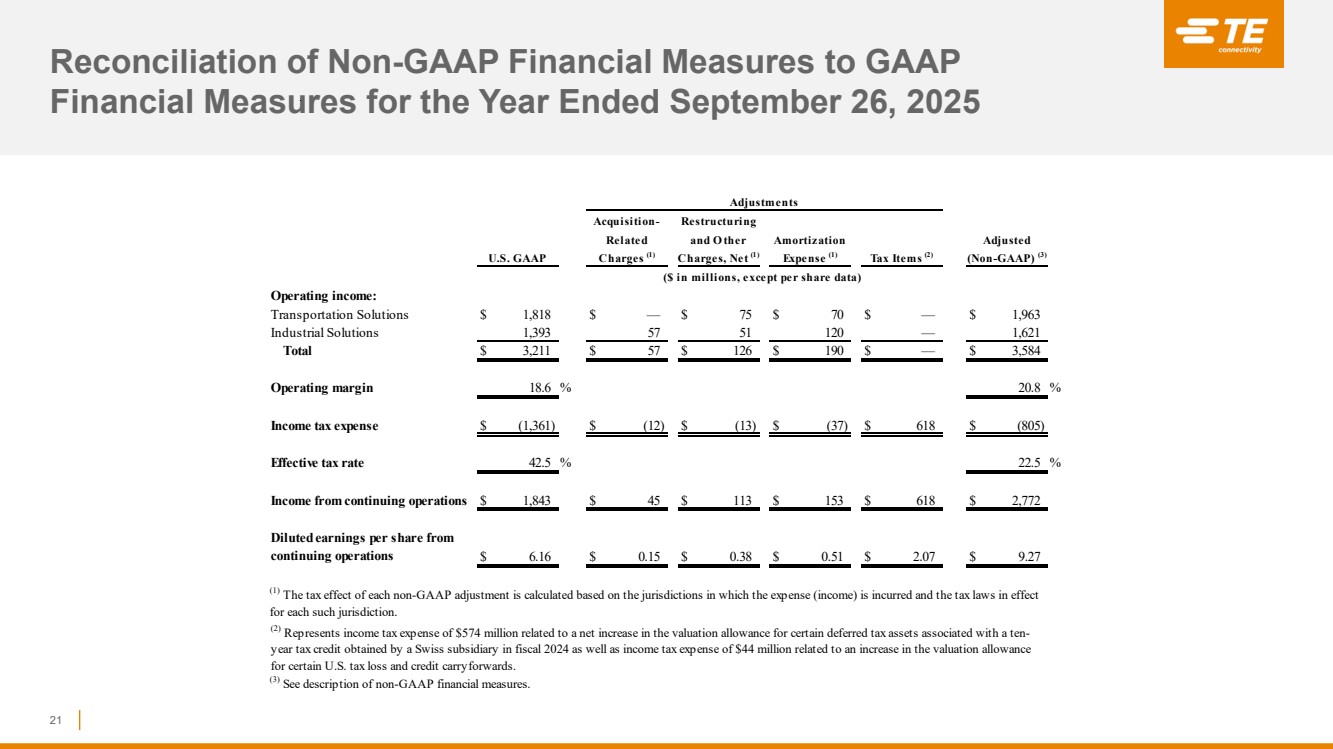
Reconciliation of Non-GAAP Financial Measures to GAAP Financial Measures for the Year Ended September 26, 2025 21 Operating income: Transportation Solutions $ 1,818 $ — $ 75 $ 70 $ — $ 1,963 Industrial Solutions 1,393 57 51 120 — 1,621 Total $ 3,211 $ 57 $ 126 $ 190 $ — $ 3,584 Operating margin 18.6 % 20.8 % Income tax expense $ (1,361) $ (12) $ (13) $ (37) $ 618 $ (805) Effective tax rate 42.5 % 22.5 % Income from continuing operations $ 1,843 $ 45 $ 113 $ 153 $ 618 $ 2,772 Diluted earnings per share from continuing operations $ 6.16 $ 0.15 $ 0.38 $ 0.51 $ 2.07 $ 9.27 Adjusted (Non-GAAP) (3) ($ in millions, except per share data) (1) The tax effect of each non-GAAP adjustment is calculated based on the jurisdictions in which the expense (income) is incurred and the tax laws in effect for each such jurisdiction. U.S. GAAP Charges (1) Charges, Net (1) Tax Items (2) Expense (1) Acquisition- Restructuring Adjustments (2) Represents income tax expense of $574 million related to a net increase in the valuation allowance for certain deferred tax assets associated with a ten-year tax credit obtained by a Swiss subsidiary in fiscal 2024 as well as income tax expense of $44 million related to an increase in the valuation allowance for certain U.S. tax loss and credit carryforwards. (3) See description of non-GAAP financial measures. Related and O ther Amortization |
|
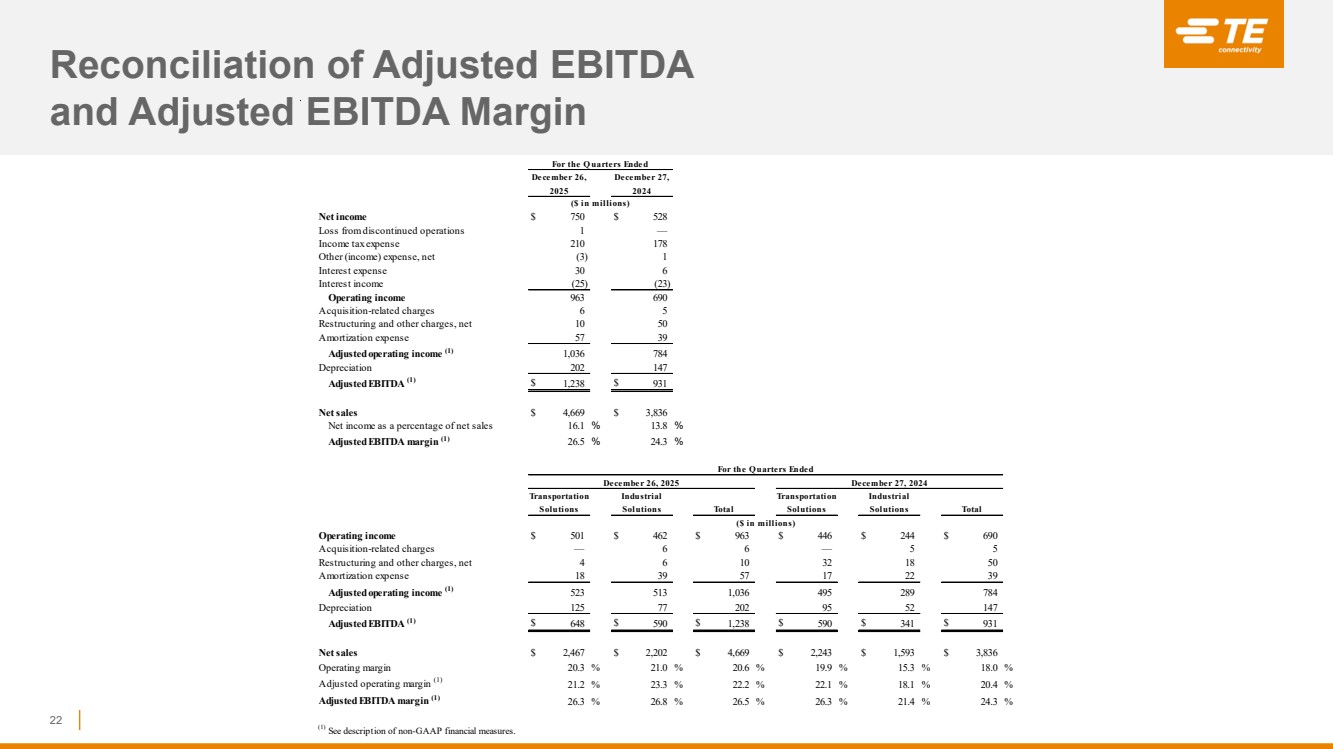
Reconciliation of Adjusted EBITDA and Adjusted EBITDA Margin 22 Net income $ 750 $ 528 Loss from discontinued operations 1 — Income tax expense 210 178 Other (income) expense, net (3) 1 Interest expense 30 6 Interest income (25) (23) Operating income 963 690 Acquisition-related charges 6 5 Restructuring and other charges, net 10 50 Amortization expense 57 39 Adjusted operating income (1) 1,036 784 Depreciation 202 147 Adjusted EBITDA (1) $ 1,238 $ 931 Net sales $ 4,669 $ 3,836 Net income as a percentage of net sales 16.1 % 13.8 % Adjusted EBITDA margin (1) 26.5 % 24.3 % Operating income $ 501 $ 462 $ 963 $ 446 $ 244 $ 690 Acquisition-related charges — 6 6 — 5 5 Restructuring and other charges, net 4 6 10 32 18 50 Amortization expense 18 39 57 17 22 39 Adjusted operating income (1) 523 513 1,036 495 289 784 Depreciation 125 77 202 95 52 147 Adjusted EBITDA (1) $ 648 $ 590 $ 1,238 $ 590 $ 341 $ 931 Net sales $ 2,467 $ 2,202 $ 4,669 $ 2,243 $ 1,593 $ 3,836 Operating margin 20.3 % 21.0 % 20.6 % 19.9 % 15.3 % 18.0 % Adjusted operating margin (1) 21.2 % 23.3 % 22.2 % 22.1 % 18.1 % 20.4 % Adjusted EBITDA margin (1) 26.3 % 26.8 % 26.5 % 26.3 % 21.4 % 24.3 % (1) See description of non-GAAP financial measures. ($ in millions) Transportation Industrial Solutions Solutions Total Solutions Solutions Total December 26, 2025 December 27, 2024 For the Q uarters Ended ($ in millions) December 26, 2025 December 27, 2024 Transportation Industrial For the Q uarters Ended |
|
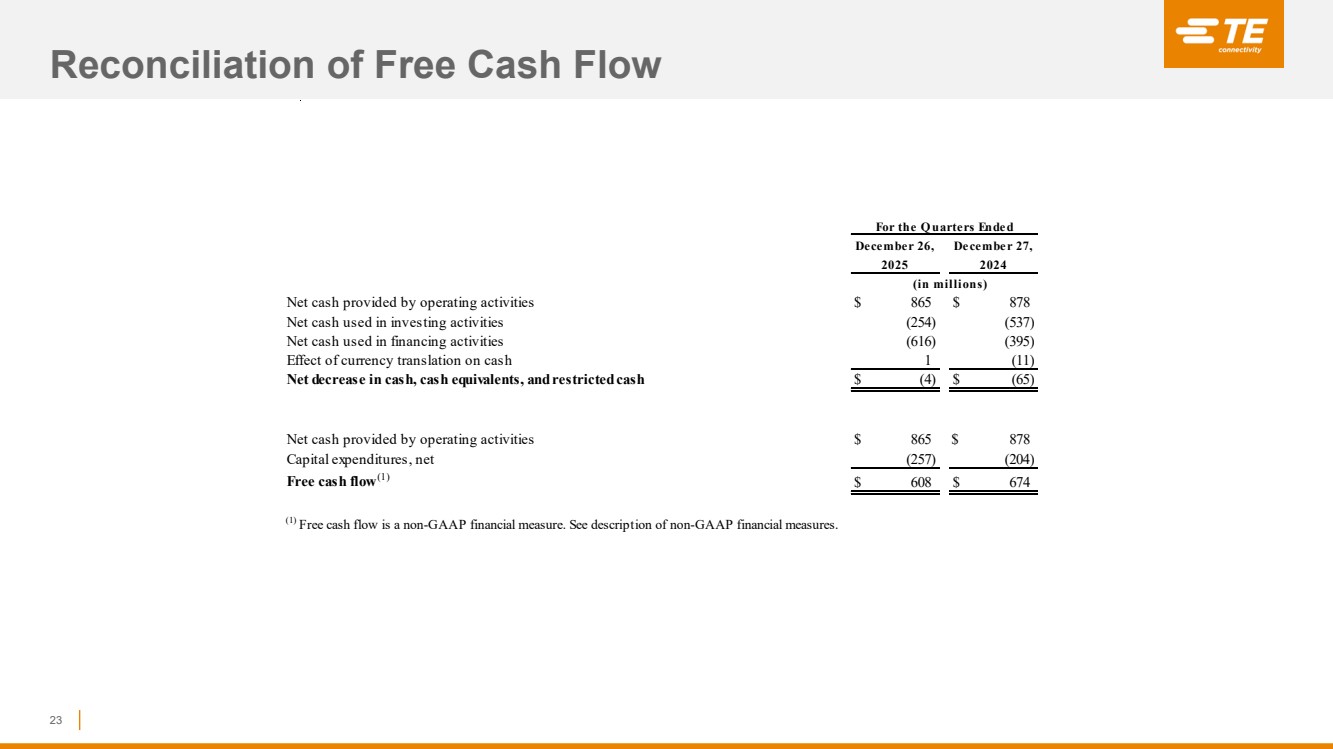
Reconciliation of Free Cash Flow 23 Net cash provided by operating activities $ 865 $ 878 Net cash used in investing activities (254) (537) Net cash used in financing activities (616) (395) Effect of currency translation on cash 1 (11) Net decrease in cash, cash equivalents, and restricted cash $ (4) $ (65) Net cash provided by operating activities $ 865 $ 878 Capital expenditures, net (257) (204) Free cash flow (1) $ 608 $ 674 (1) Free cash flow is a non-GAAP financial measure. See description of non-GAAP financial measures. 2025 2024 (in millions) For the Q uarters Ended December 26, December 27, |
|
Reconciliation of Forward-Looking Non-GAAP Financial Measures to Forward-Looking GAAP Financial Measures 24 Diluted earnings per share from continuing operations $ 2.26 Acquisition-related charges 0.01 Restructuring and other charges, net 0.23 Amortization expense 0.15 Adjusted diluted earnings per share from continuing operations (2) $ 2.65 Net sales growth 13.4 % Translation (4.3) (Acquisitions) divestitures, net (2.9) Organic net sales growth (2) 6.2 % Effective tax rate 21.9 % 22.8 % Effective tax rate adjustments (3) 0.1 (0.1) Adjusted effective tax rate (2) 22.0 % 22.7 % Q uarter Ending O utlook for 2026 (1) March 27, O utlook for Fiscal 2026 (1) (3) Includes adjustments for special tax items and the tax effect of acquisition-related charges and net restructuring and other charges, calculated based on the jurisdictions in which the expense (income) is incurred and the tax laws in effect for each such jurisdiction. (1) Outlook is as of January 21, 2026. (2) See description of non-GAAP financial measures. |