UNITED STATES
SECURITIES AND EXCHANGE COMMISSION
Washington, D.C. 20549
FORM 8-K
CURRENT REPORT
PURSUANT TO SECTION 13 OR 15(d) OF THE
SECURITIES EXCHANGE ACT OF 1934
Date of report (Date of earliest event reported): January 20, 2026
METROPOLITAN BANK HOLDING CORP.
(Exact Name of Registrant as Specified in Its Charter)
New York |
001-38282 |
13-4042724 |
(State or Other Jurisdiction of Incorporation or Organization) |
(Commission File No.) |
(I.R.S. Employer Identification No.) |
|
|
|
99 Park Avenue, New York, New York |
|
10016 |
(Address of Principal Executive Offices) |
|
(Zip Code) |
(212) 659-0600
(Registrant’s Telephone Number, Including Area Code)
N/A
(Former Name, Former Address and Former Fiscal Year, if Changed Since Last Report)
Check the appropriate box below if the Form 8-K filing is intended to simultaneously satisfy the filing obligation of the registrant under any of the following provisions (See General Instruction A.2. below):
☐Written communications pursuant to Rule 425 under the Securities Act (17 CFR 230.425)
☐Soliciting material pursuant to Rule 14a-12 under the Exchange Act (17 CFR 240.14a-12)
☐Pre-commencement communications pursuant to Rule 14d-2(b) under the Exchange Act (17 CFR 240.14d-2(b))
☐Pre-commencement communications pursuant to Rule 13e-4(c) under the Exchange Act (17 CFR 240.13e-4c)
Title of each class |
|
Trading Symbol(s) |
|
Name of each exchange on which registered |
Common Stock, par value $0.01 per share |
|
MCB |
|
New York Stock Exchange |
Indicate by check mark whether the registrant is an emerging growth company as defined in Rule 405 of the Securities Act of 1933 (17 CFR 230.405) or Rule 12b-2 of the Securities Exchange Act of 1934 (17 CFR 240.12b-2).
Emerging growth company ☐
If an emerging growth company, indicate by check mark if the registrant has elected not to use the extended transition period for complying with any new or revised financial accounting standards provided pursuant to Section 13(a) of the Exchange Act. ☐
Item 2.02Results of Operations and Financial Condition
On January 20, 2026, Metropolitan Bank Holding Corp. (the “Company”), the holding company for Metropolitan Commercial Bank (the “Bank”), issued a press release announcing its financial results for the fourth quarter and full year 2025. The press release containing the financial results is attached hereto as Exhibit 99.1 and shall not be deemed “filed” for any purpose, nor shall the information or Exhibit 99.1 be deemed incorporated by reference in any filings under the Securities Act of 1933, as amended.
Item 7.01Regulation FD Disclosure
The Company has also made available on its website presentation materials containing additional information about the Company’s financial results for the fourth quarter and full year 2025 (the “Presentation Materials”). The Presentation Materials are furnished herewith as Exhibit 99.2 and is incorporated by reference in this Item 7.01.
The information provided in Item 7.01 of this report, including Exhibit 99.2, shall not be deemed “filed” for any purpose, nor shall the information or Exhibit 99.2 be deemed incorporated by reference in any filings under the Securities Act of 1933, as amended.
Item 9.01.Financial Statements and Exhibits
(d) Exhibits.
Exhibit No. |
|
Description |
99.1 |
|
|
99.2 |
|
|
104 |
|
Cover Page Interactive Data File (formatted as inline XBRL and contained in Exhibit 101) |
SIGNATURES
Pursuant to the requirements of the Securities Exchange Act of 1934, the registrant has duly caused this report to be signed on its behalf by the undersigned, hereunto duly authorized.
METROPOLITAN BANK HOLDING CORP.
Dated: January 20, 2026By:/s/ Daniel F. Dougherty
Daniel F. Dougherty
Executive Vice President and
Chief Financial Officer
Exhibit 99.1

Release: |
4:05 P.M. January 20, 2026 |
212-365-6721
IR@MCBankNY.com
Metropolitan Bank Holding Corp. Reports Fourth Quarter and Full Year 2025 Results
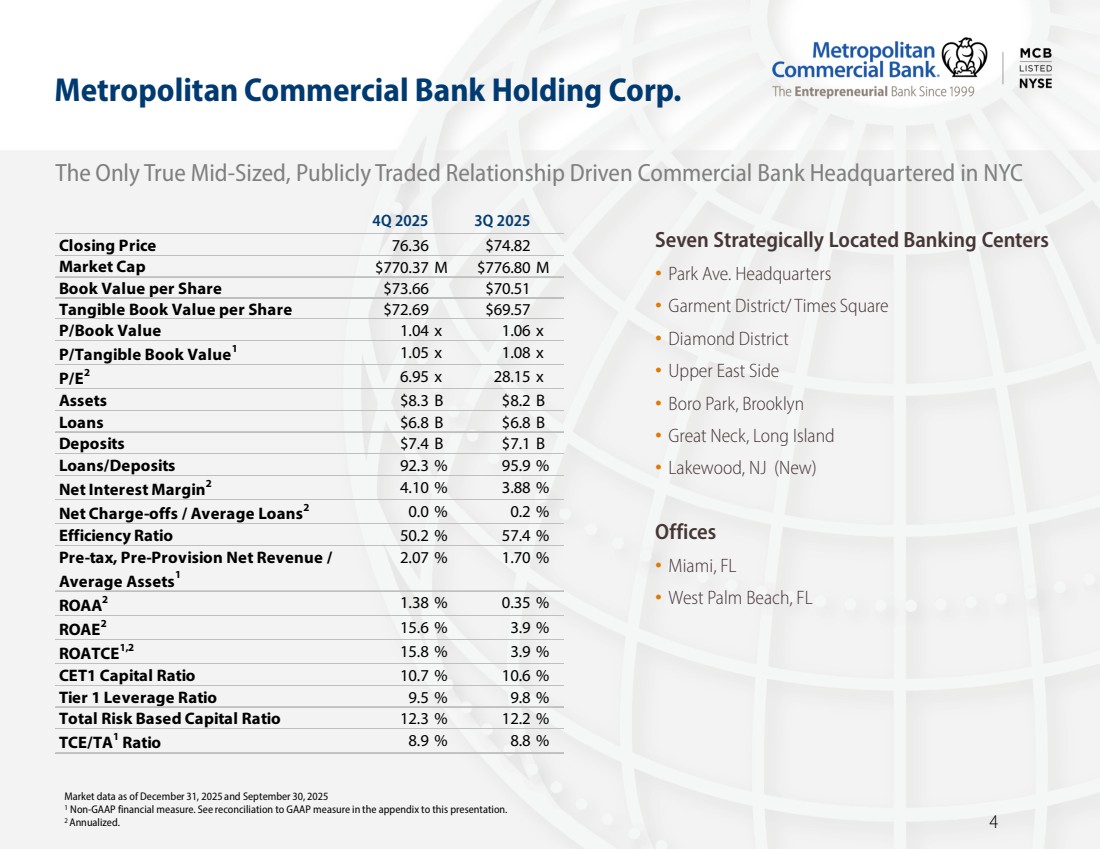
Quarterly Net Income of $28.9 Million Supported by Continued Margin Expansion to 4.10%
Achieved Quarterly Annualized ROAE of 15.6%
Financial Highlights
1 Non-GAAP financial measure. See Reconciliation of Non-GAAP Measures on page 13.
NEW YORK, January 20, 2026 ‒ Metropolitan Bank Holding Corp. (the “Company”) (NYSE: MCB), the holding company for Metropolitan Commercial Bank (the “Bank”), reported net income of $28.9 million, or $2.77 per diluted common share, for the fourth quarter of 2025 compared to $7.1 million, or $0.67 per diluted common share, for the third quarter of 2025, and $21.4 million, or $1.88 per diluted common share, for the fourth quarter of 2024.
1
Mark DeFazio, President and Chief Executive Officer, commented,
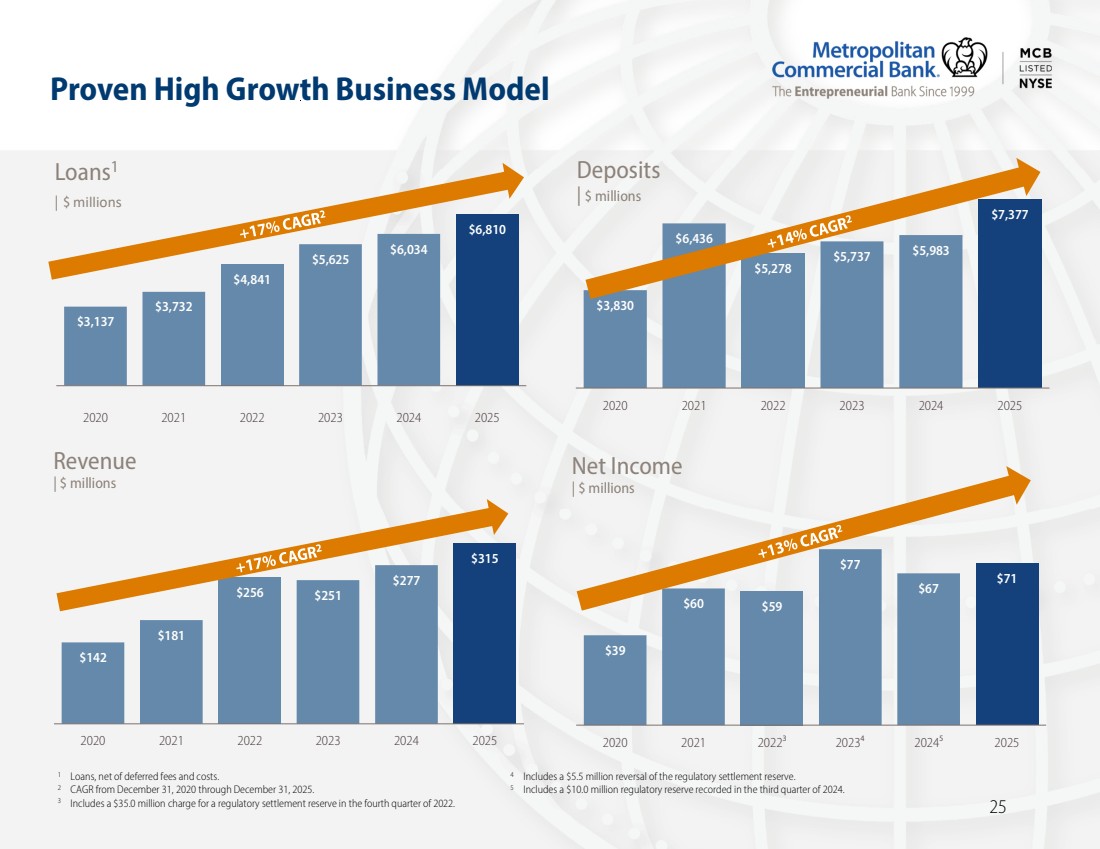
“We are pleased to report our financial performance for both the fourth quarter and the year. In 2025 we continued to execute on our organic growth strategy. Loan growth for the year was $776 million, or approximately 13%, funded entirely with deposit growth. In fact, for the year our deposit growth exceeded our exceptional loan growth by more than $600 million, affording us the ability to pay off all wholesale funding and close the year with a robust cash position. Our performance underscores our leading market position and our resilient business model. We continue to take the right steps to position the bank for above market growth, while balancing this with our acute focus on risk management. Displaying strong momentum in the fourth quarter we achieved a net interest margin of 4.10% and ROATCE of 15.8%.
“As we look ahead to 2026 we are committed to leveraging the success and momentum achieved in the fourth quarter. We are confident we can continue to deliver exceptional customer service and a compelling long-term value proposition to investors.”
Balance Sheet
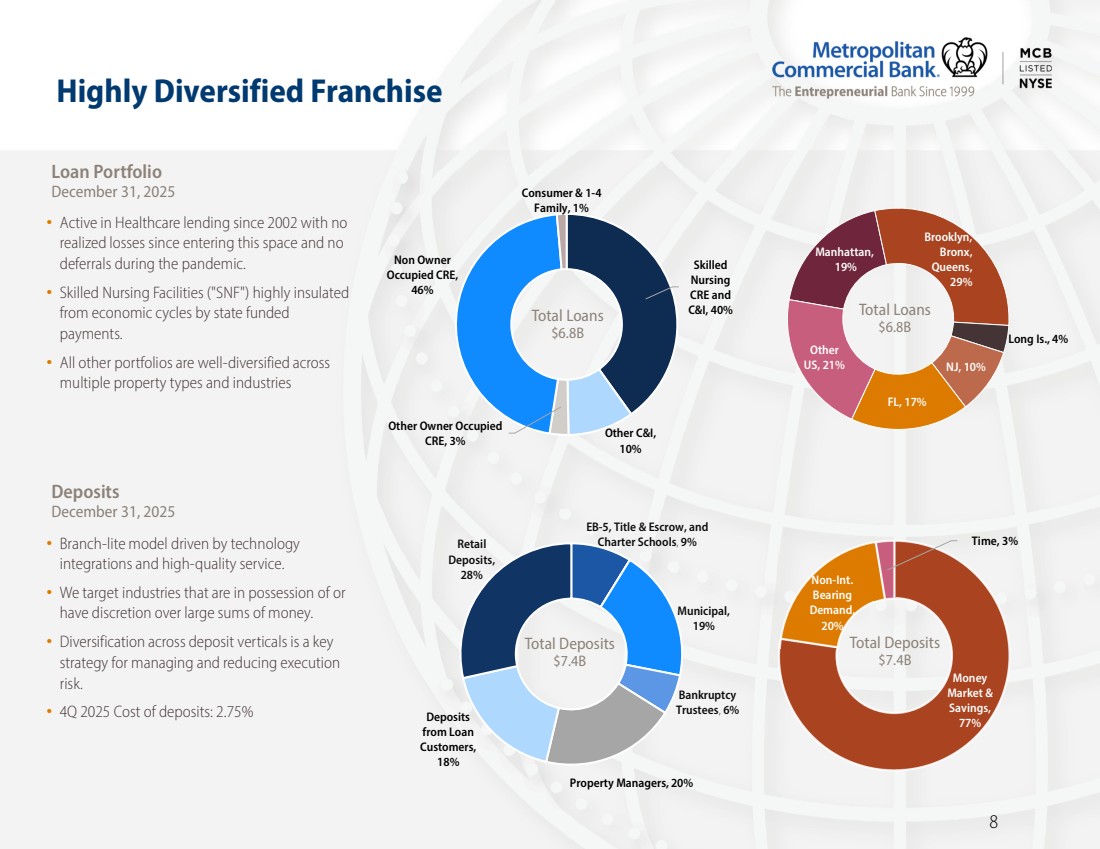
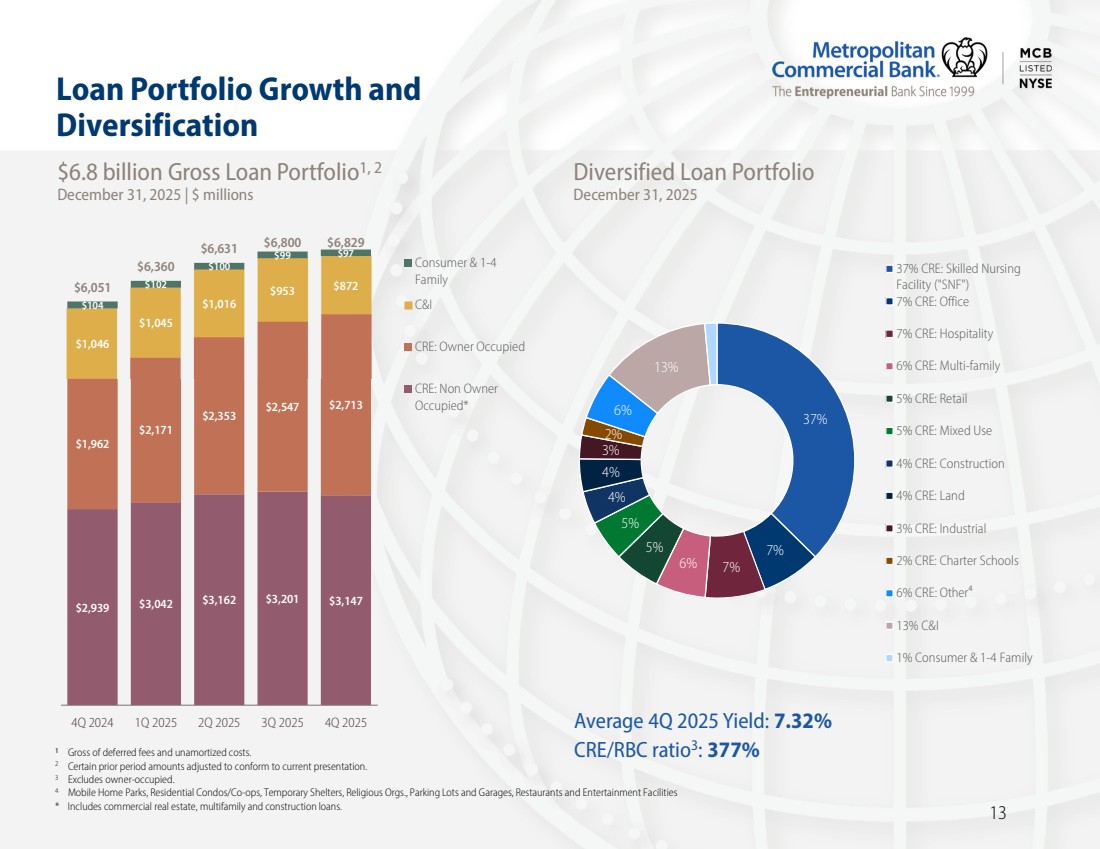
Total loans, net of deferred fees and unamortized costs, were $6.8 billion at December 31, 2025, an increase of $28.5 million, or 0.4%, from September 30, 2025, and an increase of $776.2 million, or 12.9%, from December 31, 2024. Loan production was $510.9 million for the fourth quarter of 2025 compared to $514.2 million for the prior linked quarter and $309.0 million for the prior year period. The increase in total loans from September 30, 2025, was due primarily to an increase of $131.4 million in commercial real estate (“CRE”) loans (including owner-occupied), partially offset by a decrease of $81.4 million in commercial and industrial (“C&I”) loans. The increase in total loans from December 31, 2024 was due primarily to an increase of $884.1 million in CRE loans (including owner-occupied), partially offset by a decrease of $174.5 million in C&I loans.
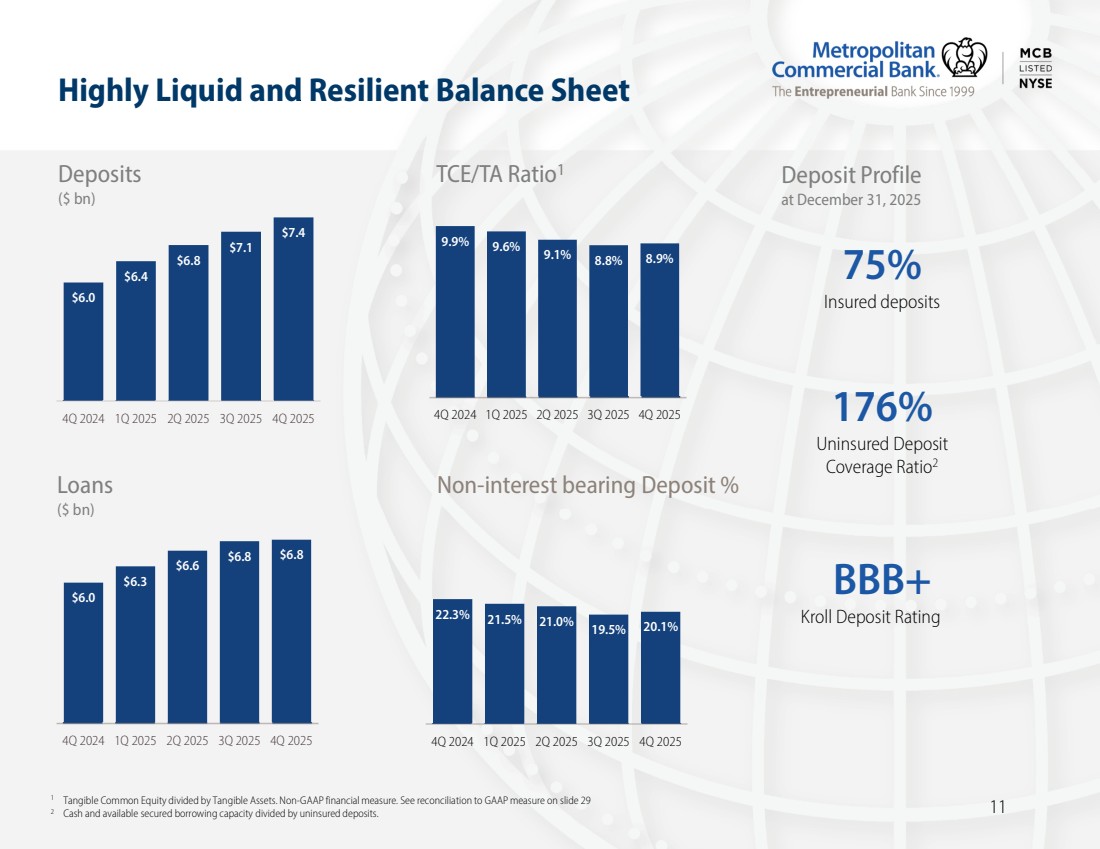
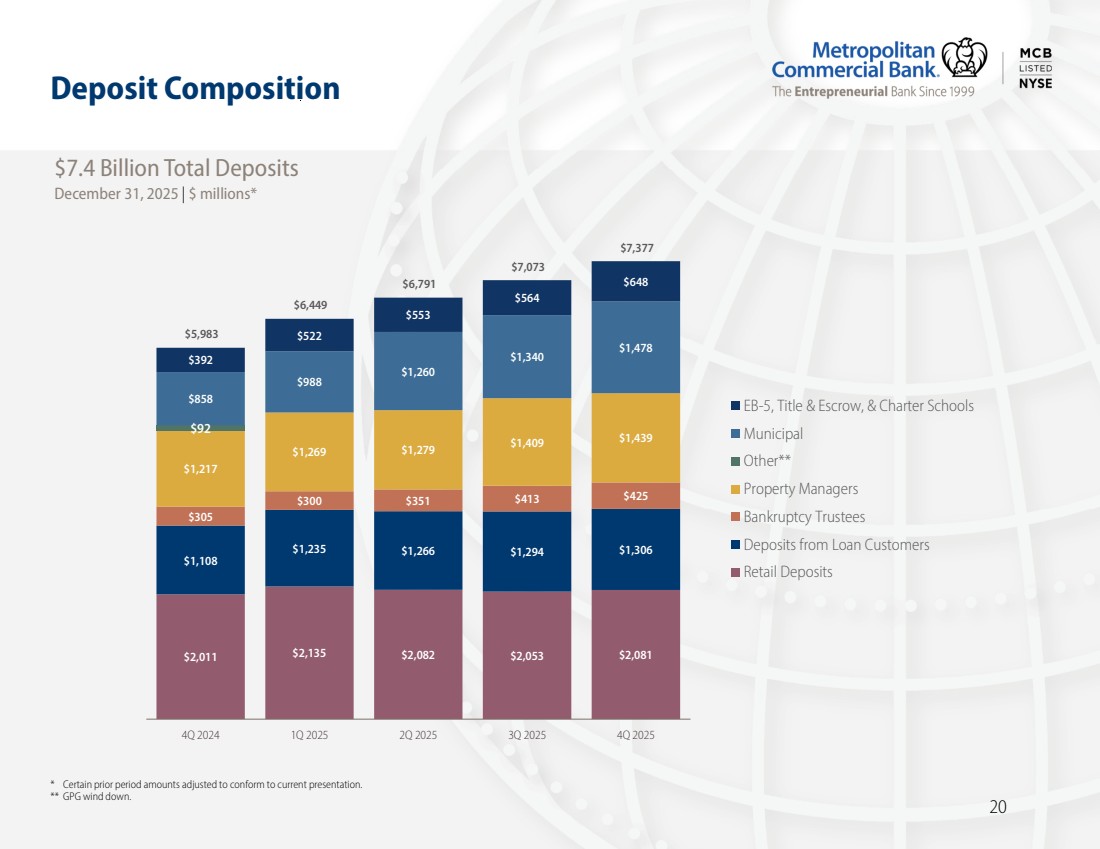
Total deposits were $7.4 billion at December 31, 2025, an increase of $304.4 million, or 4.3%, from September 30, 2025, and an increase of $1.4 billion, or 23.3%, from December 31, 2024. Deposit growth for the quarter and for the year was broadly distributed across the Bank’s various deposit verticals.
The Bank’s liquidity position remains robust. At December 31, 2025, cash on deposit with the Federal Reserve Bank of New York and available secured funding capacity totaled $3.3 billion, which represented 176% of our estimated uninsured deposits. Total cash and cash equivalents were $393.6 million at December 31, 2025.
The Company and Bank have total risk-based capital ratios well above regulatory minimums. The Bank is “well capitalized” under all applicable regulatory guidelines. During the fourth quarter of 2025, we repurchased approximately 293,000 shares of MCB common stock at a weighted average price of $68.09, or approximately 93.7% of year-end tangible book value per share. Total non-owner-occupied CRE loans were 376.5% of total risk-based capital at December 31, 2025, compared to 373.5% and 346.1% at September 30, 2025 and December 31, 2024, respectively. The increase in the CRE concentration ratio from December 31, 2024 was affected by the Company’s common stock repurchases in 2025, which were funded by dividends paid from the Bank to the Company.
2
Income Statement
Financial Highlights
|
|
Three months ended |
|
|
Year ended |
||||||||||||
|
|
Dec. 31, |
|
Sept. 30, |
|
Dec. 31, |
|
|
Dec. 31, |
|
Dec. 31, |
|
|||||
(dollars in thousands, except per share data) |
|
2025 |
|
2025 |
|
2024 |
|
|
2025 |
|
2024 |
|
|||||
Total revenues(1) |
|
$ |
88,408 |
|
$ |
79,838 |
|
$ |
71,004 |
|
|
$ |
315,106 |
|
$ |
276,913 |
|
Net income (loss) |
|
$ |
28,857 |
|
$ |
7,119 |
|
$ |
21,418 |
|
|
|
71,098 |
|
|
66,686 |
|
Diluted earnings (loss) per common share |
|
$ |
2.77 |
|
$ |
0.67 |
|
$ |
1.88 |
|
|
|
6.62 |
|
|
5.93 |
|
Return on average assets(2) |
|
|
1.38 |
% |
|
0.35 |
% |
|
1.16 |
% |
|
|
0.90 |
% |
|
0.91 |
% |
Return on average equity(2) |
|
|
15.6 |
% |
|
3.9 |
% |
|
11.8 |
% |
|
|
9.7 |
% |
|
9.6 |
% |
Return on average tangible common equity(2), (3), (4) |
|
|
15.8 |
% |
|
3.9 |
% |
|
12.0 |
% |
|
|
9.8 |
% |
|
9.7 |
% |
(1) |
Total revenues equal net interest income plus non-interest income. |
(2) |
For periods less than a year, ratios are annualized. |
(3) |
Non-GAAP financial measure. See Reconciliation of Non-GAAP Measures on page 13. |
(4) |
Net income divided by average tangible common equity. |
Net Interest Income
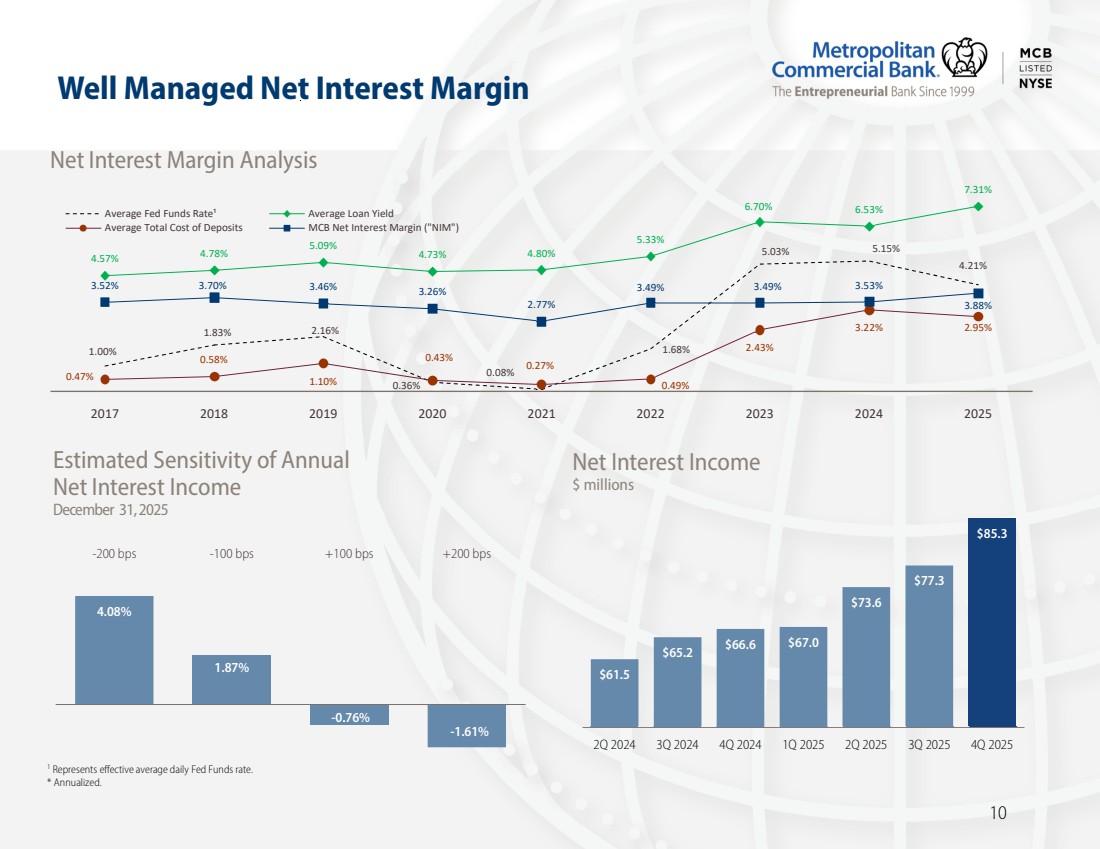
Net interest income for the fourth quarter of 2025 was $85.3 million compared to $77.3 million for the prior linked quarter and $66.6 million for the prior year period. The $8.0 million increase from the prior linked quarter was due primarily to an increase in the average balance of loans, and a decrease in the cost of funds, partially offset by an increase in the average balance of interest-bearing deposits. The $18.7 million increase from the prior year period was due primarily to an increase in the average balance of loans and a decrease in the cost of funds, partially offset by an increase in the average balance of interest-bearing deposits.
Net interest income for the year 2025 was $303.2 million compared to $253.1 million for the prior year. The $50.1 million increase from the prior year was due primarily to an increase in the average balance of loans and a decrease in the cost of funds.
Net Interest Margin
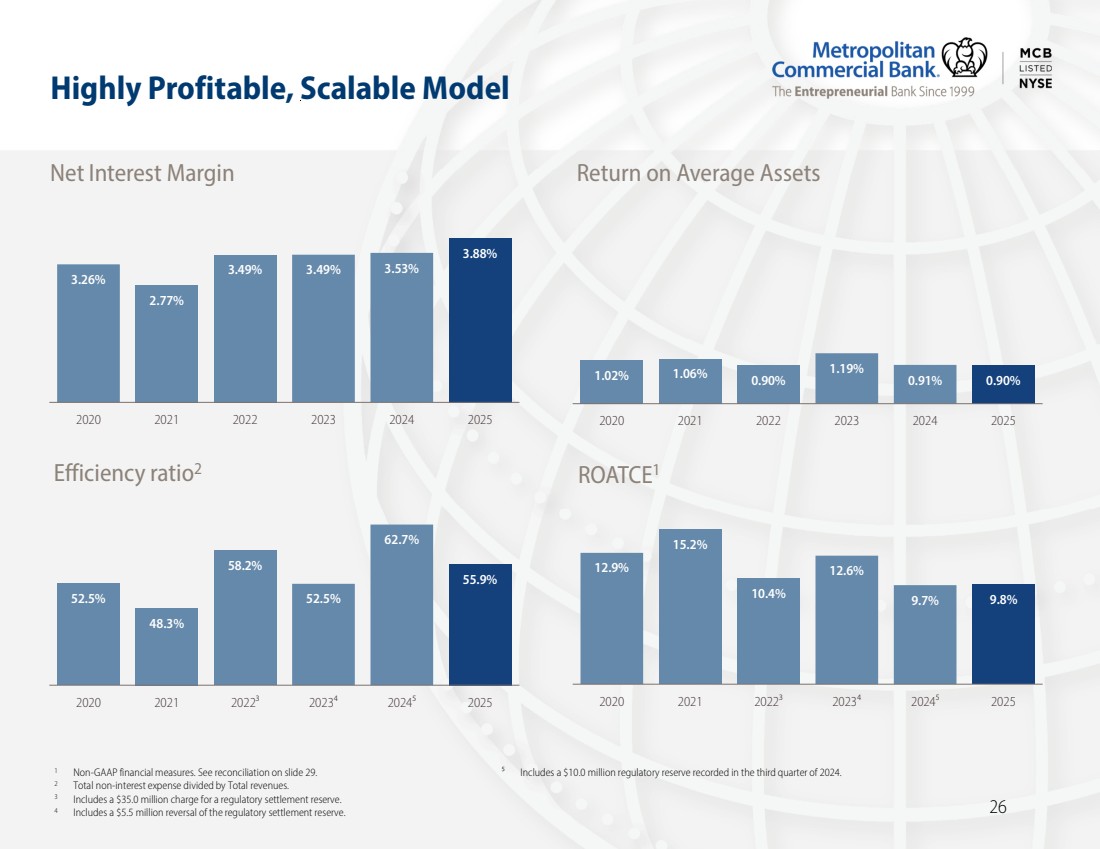
Net interest margin for the fourth quarter of 2025 was 4.10% compared to 3.88% and 3.66% for the prior linked quarter and prior year period, respectively. The Bank’s ability to expand its net interest margin compared to the prior-linked quarter and prior year period was supported by rigorous loan and deposit pricing initiatives and the recent decline in short-term interest rates.
Net interest margin for the year 2025 was 3.88% compared to 3.53% for the prior year, primarily driven by the decrease in the cost of funds and loan spread discipline.
The total cost of funds for the fourth quarter of 2025 was 279 basis points compared to 305 basis points and 325 basis points for the prior linked quarter and prior year period, respectively. The decrease from the prior linked quarter and prior year primarily reflects the reduction in short-term interest rates, changes in the deposit mix and hedging activities.
The total cost of funds for the year 2025 was 302 basis points compared to 332 basis points for the prior year. The decrease primarily reflects the reduction in short-term interest rates that favorably impacted our cost of deposits.
Non-Interest Income
Non-interest income was $3.1 million for the fourth quarter of 2025, an increase of $556,000 from the prior linked quarter and a decrease of $1.3 million from the prior year period. The increase from the prior linked quarter was due primarily to a $674,000 gain on the sale of securities in the fourth quarter of 2025. The decrease from the prior year period was driven primarily by the absence of $2.1 million in Banking-as-a-Service revenue, a business we exited in 2024.
3
Non-interest income was $11.9 million for the year 2025, a decrease of $12.0 million from the prior year. The decrease from the prior year was driven primarily by the absence of $13.4 million in Banking-as-a-Service revenue.
Non-Interest Expense
Non-interest expense was $44.4 million for the fourth quarter of 2025, a decrease of $1.4 million from the prior linked quarter and an increase of $6.2 million from the prior year period. The decrease from the prior linked quarter was primarily due to a decrease of $1.3 million in compensation and benefits. The $6.2 million increase from the prior year period was due primarily to a $4.0 million increase in technology costs and a $2.7 million increase in deposit program related fees, partially offset by a $1.4 million decrease in Federal Deposit Insurance Corporation (“FDIC”) assessments.
Non-interest expense was $176.0 million for the year 2025, an increase of $2.4 million from the prior year. The increase from the prior year was due primarily to a $7.2 million increase in deposit program fees, a $6.2 million increase in compensation and benefits related to the increase in the number and mix of employees, and a $6.1 million increase in technology costs related to the digital transformation initiatives, partially offset by a decrease of $9.5 million in the regulatory settlement reserve, a $6.4 million decrease in professional fees and a decrease of $2.2 million in FDIC assessments.
Income Tax Expense
The effective tax rate for the year 2025 was 30.0% compared to 31.3% for the prior year.
Asset Quality
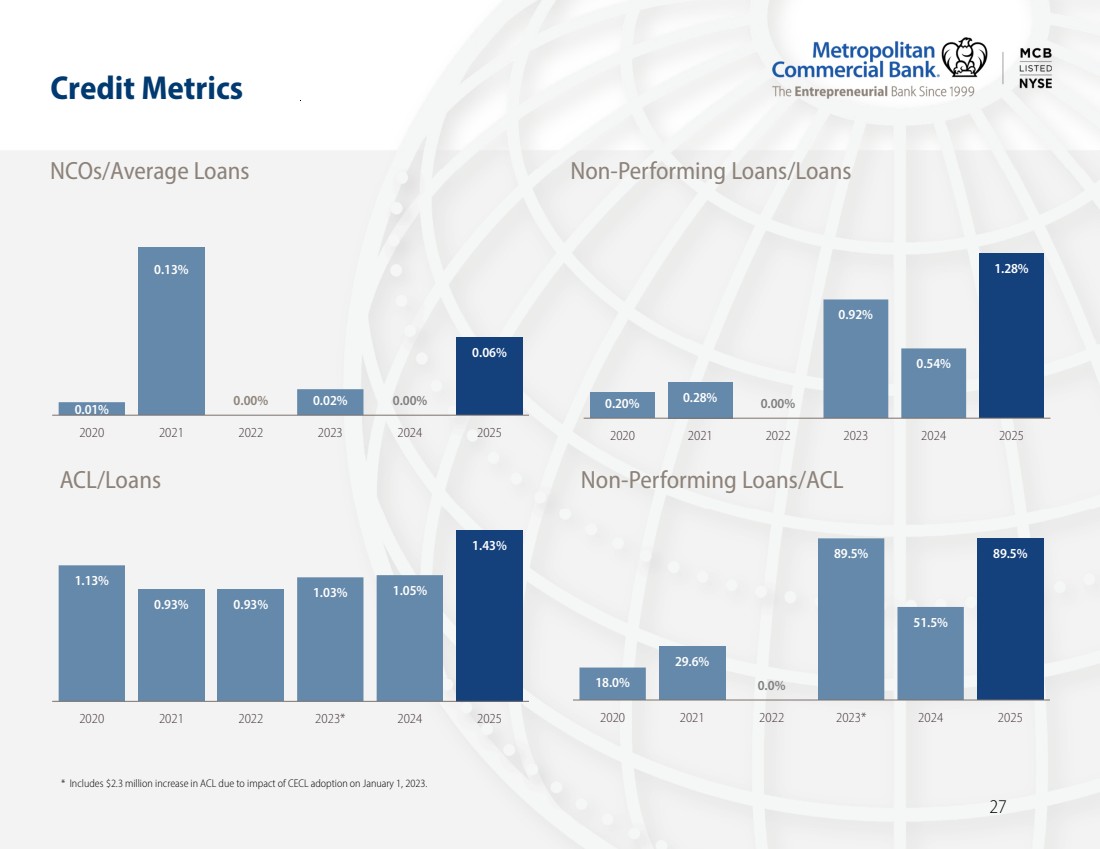
The ratio of non-performing loans to total loans was 1.28% at December 31, 2025 and 1.20% at September 30, 2025 and 0.54% at December 31, 2024. The increase in the non-performing loan ratio from the prior linked quarter primarily reflects the non-performing classification in the fourth quarter of 2025 of two multi-family loans totaling $5.3 million. The increase in the non-performing loan ratio from the prior year period is primarily attributable to a single out-of-market CRE multi-family loan relationship that was classified as non-performing in the third quarter of 2025.
The allowance for credit losses was $97.1 million at December 31, 2025, an increase of $2.9 million from September 30, 2025 and an increase of $33.8 million from December 31, 2024. The increase from December 31, 2024 primarily reflects an $18.7 million provision in the third quarter of 2025 related to single out-of-market CRE multi-family loan relationship and loan growth.
Conference Call
The Company will conduct a conference call at 9:00 a.m. ET on Wednesday, January 21, 2026, to discuss the results. To access the event by telephone, please dial 800-245-3047 (US), 203-518-9765 (INTL), and provide conference ID: MCBQ425 approximately 15 minutes prior to the start time (to allow time for registration).
The call will also be broadcast live over the Internet and accessible at MCB Quarterly Results Conference Call and in the Investor Relations section of the Company’s website at MCB News. To listen to the live webcast, please visit the site at least 15 minutes prior to the start time to register, download and install any necessary audio software.
For those unable to join for the live presentation, a replay of the webcast will also be available later that day accessible at MCB Quarterly Results Conference Call.
4
About Metropolitan Bank Holding Corp.
Metropolitan Bank Holding Corp. (NYSE: MCB) is the parent company of Metropolitan Commercial Bank (the “Bank”), a New York City based full-service commercial bank. The Bank provides a broad range of business, commercial and personal banking products and services to individuals, small businesses, private and public middle-market corporate enterprises and institutions, municipalities, and local government entities.
Metropolitan Commercial Bank was named one of Newsweek’s Best Regional Banks in 2024 and 2025. The Independent Community Bankers of America ranked the Bank as a top ten loan producer in 2024 among commercial banks with more than $1 billion in assets. Kroll affirmed a BBB+ (investment grade) deposit rating on January 29, 2025. For the fourth time, MCB has earned a place in the Piper Sandler Bank Sm-All Stars Class of 2024.
The Bank is a New York State chartered commercial bank, a member of the Federal Reserve System and the Federal Deposit Insurance Corporation, and an equal housing lender. For more information, please visit the Bank’s website at MCBankNY.com.
5
Forward-Looking Statement Disclaimer
This release contains “forward-looking statements” within the meaning of the Private Securities Litigation Reform Act of 1995. Examples of forward-looking statements include but are not limited to the Company’s future financial condition and capital ratios, results of operations and the Company’s outlook, business, share repurchases under the program, and dividend payments. Forward-looking statements are not historical facts. Such statements may be identified by the use of such words as “may,” “believe,” “expect,” “anticipate,” “plan,” “continue” or similar terminology. These statements relate to future events or our future financial performance and involve risks and uncertainties that are difficult to predict and are generally beyond our control and may cause our actual results, levels of activity, performance or achievements to differ materially from those expressed or implied by these forward-looking statements. Although we believe that the expectations reflected in the forward-looking statements are reasonable, we caution you not to place undue reliance on these forward-looking statements. Factors which may cause our forward-looking statements to be materially inaccurate include, but are not limited to the following: the interest rate policies of the Federal Reserve and other regulatory bodies; an unexpected deterioration in the performance of our loan or securities portfolios; changes in liquidity, including the size and composition of our deposit portfolio and the percentage of uninsured deposits in the portfolio; unexpected increases in our expenses; different than anticipated growth and our ability to manage our growth; global pandemics, or localized epidemics, could adversely affect the Company’s financial condition and results of operations; potential recessionary conditions, including the related effects on our borrowers and on our financial condition and results of operations; an unanticipated loss of key personnel or existing clients, or an inability to attract key employees; increases in competitive pressures among financial institutions or from non-financial institutions which may result in unanticipated changes in our loan or deposit rates; unanticipated increases in FDIC insurance premiums or future assessments; legislative, tax or regulatory changes or actions, which may adversely affect the Company’s business; impacts related to or resulting from regional and community bank failures and stresses to regional banks; changes in deposit flows, funding sources or loan demand, which may adversely affect the Company’s business; changes in accounting principles, policies or guidelines may cause the Company’s financial condition or results of operation to be reported or perceived differently; general economic conditions, including unemployment rates, either nationally or locally in some or all of the areas in which the Company does business, or conditions in the securities markets or the banking industry being less favorable than currently anticipated; inflation, which may lead to higher operating costs; declines in real estate values in the Company’s market area, which may adversely affect our loan production; an unexpected adverse financial, regulatory, legal or bankruptcy event experienced by our non-bank financial service clients or critical technology service providers; system failures or cybersecurity breaches of our information technology infrastructure and/or confidential information or those of the Company’s third-party service providers; emerging issues related to the development and use of artificial intelligence that could give rise to legal or regulatory action, damage our reputation or otherwise materially harm our business or clients; failure to maintain current technologies or technological changes that may be more difficult or expensive to implement than anticipated, and failure to successfully implement future information technology enhancements; the costs, including the possible incurrence of fines, penalties, or other negative effects (including reputational harm) of any adverse judicial, administrative, or arbitral rulings or proceedings, regulatory enforcement actions, or other legal actions to which we or any of our subsidiaries are a party, and which may adversely affect our results; the current or anticipated impact of military conflict, terrorism or other geopolitical events; the successful implementation or consummation of new business initiatives, which may be more difficult or expensive than anticipated; the timely and efficient development of new products and services offered by the Company or its strategic partners, as well as risks (including reputational and litigation) attendant thereto, and the perceived overall value and acceptance of these products and services by clients; changes in consumer spending, borrowing or savings habits; the risks associated with adverse changes to credit quality; an unexpected failure to successfully manage our credit risk and the sufficiency of our allowance for credit losses; credit and other risks from borrower and depositor concentrations (e.g., by geographic area and by industry); difficulties associated with achieving or predicting expected future financial results; and the potential impact on the Company’s operations and clients resulting from natural or man-made disasters, wars, acts of terrorism, cyberattacks and pandemics, as well as those discussed under the heading “Risk Factors” in our Annual Report on Form 10-K and Quarterly Reports on Form 10-Q which have been filed with the Securities and Exchange Commission under the Securities Exchange Act of 1934, as amended. Forward-looking statements speak only as of the date of this release. We do not undertake (and expressly disclaim) any obligation to update or revise any forward-looking statement, except as may be required by law.
6
Consolidated Balance Sheet (unaudited)
|
|
Dec. 31, |
|
Sept. 30, |
|
Jun. 30, |
|
Mar. 31, |
|
Dec. 31, |
|||||
(in thousands) |
|
2025 |
|
2025 |
|
2025 |
|
2025 |
|
2024 |
|||||
Assets |
|
|
|
|
|
|
|
|
|
|
|
|
|
|
|
Cash and due from banks |
|
$ |
12,086 |
|
$ |
13,109 |
|
$ |
13,577 |
|
$ |
18,572 |
|
$ |
13,078 |
Overnight deposits |
|
|
381,501 |
|
|
372,827 |
|
|
138,876 |
|
|
177,891 |
|
|
187,190 |
Total cash and cash equivalents |
|
|
393,587 |
|
|
385,936 |
|
|
152,453 |
|
|
196,463 |
|
|
200,268 |
Investment securities available-for-sale |
|
|
578,932 |
|
|
552,441 |
|
|
551,029 |
|
|
523,542 |
|
|
482,085 |
Investment securities held-to-maturity |
|
|
356,627 |
|
|
376,447 |
|
|
387,901 |
|
|
398,973 |
|
|
428,557 |
Equity investment securities, at fair value |
|
|
5,609 |
|
|
5,548 |
|
|
5,276 |
|
|
5,221 |
|
|
5,109 |
Total securities |
|
|
941,168 |
|
|
934,436 |
|
|
944,206 |
|
|
927,736 |
|
|
915,751 |
Other investments |
|
|
20,632 |
|
|
27,330 |
|
|
27,297 |
|
|
27,062 |
|
|
30,636 |
Loans, net of deferred fees and unamortized costs |
|
|
6,810,233 |
|
|
6,781,703 |
|
|
6,612,789 |
|
|
6,342,122 |
|
|
6,034,076 |
Allowance for credit losses |
|
|
(97,081) |
|
|
(94,239) |
|
|
(74,071) |
|
|
(67,803) |
|
|
(63,273) |
Net loans |
|
|
6,713,152 |
|
|
6,687,464 |
|
|
6,538,718 |
|
|
6,274,319 |
|
|
5,970,803 |
Other assets |
|
|
187,177 |
|
|
199,264 |
|
|
191,175 |
|
|
190,718 |
|
|
183,291 |
Total assets |
|
$ |
8,255,716 |
|
$ |
8,234,430 |
|
$ |
7,853,849 |
|
$ |
7,616,298 |
|
$ |
7,300,749 |
|
|
|
|
|
|
|
|
|
|
|
|
|
|
|
|
Liabilities and Stockholders' Equity |
|
|
|
|
|
|
|
|
|
|
|
|
|
|
|
Deposits |
|
|
|
|
|
|
|
|
|
|
|
|
|
|
|
Non-interest-bearing demand deposits |
|
$ |
1,479,420 |
|
$ |
1,382,345 |
|
$ |
1,427,439 |
|
$ |
1,384,524 |
|
$ |
1,334,054 |
Interest-bearing deposits |
|
|
5,897,758 |
|
|
5,690,414 |
|
|
5,363,867 |
|
|
5,064,768 |
|
|
4,648,919 |
Total deposits |
|
|
7,377,178 |
|
|
7,072,759 |
|
|
6,791,306 |
|
|
6,449,292 |
|
|
5,982,973 |
Federal funds purchased |
|
|
— |
|
|
125,000 |
|
|
50,000 |
|
|
125,000 |
|
|
210,000 |
Federal Home Loan Bank of New York advances |
|
|
— |
|
|
150,000 |
|
|
150,000 |
|
|
160,000 |
|
|
240,000 |
Trust preferred securities |
|
|
20,620 |
|
|
20,620 |
|
|
20,620 |
|
|
20,620 |
|
|
20,620 |
Secured and other borrowings |
|
|
10,975 |
|
|
17,355 |
|
|
17,366 |
|
|
17,403 |
|
|
7,441 |
Other liabilities |
|
|
103,831 |
|
|
116,656 |
|
|
101,589 |
|
|
106,137 |
|
|
109,888 |
Total liabilities |
|
|
7,512,604 |
|
|
7,502,390 |
|
|
7,130,881 |
|
|
6,878,452 |
|
|
6,570,922 |
|
|
|
|
|
|
|
|
|
|
|
|
|
|
|
|
Common stock |
|
|
113 |
|
|
113 |
|
|
113 |
|
|
113 |
|
|
112 |
Additional paid in capital |
|
|
405,565 |
|
|
403,708 |
|
|
401,055 |
|
|
398,823 |
|
|
400,188 |
Retained earnings |
|
|
450,639 |
|
|
423,338 |
|
|
417,782 |
|
|
399,015 |
|
|
382,661 |
Accumulated other comprehensive gain (loss), net of tax effect |
|
|
(39,739) |
|
|
(41,852) |
|
|
(45,455) |
|
|
(47,170) |
|
|
(53,134) |
Treasury stock, at cost |
|
|
(73,466) |
|
|
(53,267) |
|
|
(50,527) |
|
|
(12,935) |
|
|
— |
Total stockholders’ equity |
|
|
743,112 |
|
|
732,040 |
|
|
722,968 |
|
|
737,846 |
|
|
729,827 |
Total liabilities and stockholders’ equity |
|
$ |
8,255,716 |
|
$ |
8,234,430 |
|
$ |
7,853,849 |
|
$ |
7,616,298 |
|
$ |
7,300,749 |
7
Consolidated Statement of Income (unaudited)
|
|
Three months ended |
|
Year ended |
|||||||||||
|
|
Dec. 31, |
|
Sept. 30, |
|
Dec. 31, |
|
Dec. 31, |
|
Dec. 31, |
|||||
(dollars in thousands, except per share data) |
|
2025 |
|
2025 |
|
2024 |
|
2025 |
|
2024 |
|||||
Total interest income |
|
$ |
137,465 |
|
$ |
132,000 |
|
$ |
119,829 |
|
$ |
515,278 |
|
$ |
468,379 |
Total interest expense |
|
|
52,140 |
|
|
54,689 |
|
|
53,226 |
|
|
212,043 |
|
|
215,295 |
Net interest income |
|
|
85,325 |
|
|
77,311 |
|
|
66,603 |
|
|
303,235 |
|
|
253,084 |
Provision for credit losses |
|
|
2,846 |
|
|
23,862 |
|
|
1,500 |
|
|
37,592 |
|
|
6,257 |
Net interest income after provision for credit losses |
|
|
82,479 |
|
|
53,449 |
|
|
65,103 |
|
|
265,643 |
|
|
246,827 |
|
|
|
|
|
|
|
|
|
|
|
|
|
|
|
|
Non-interest income |
|
|
|
|
|
|
|
|
|
|
|
|
|
|
|
Service charges on deposit accounts |
|
|
2,037 |
|
|
2,047 |
|
|
2,177 |
|
|
8,388 |
|
|
8,269 |
Global Payments Group revenue |
|
|
— |
|
|
— |
|
|
2,100 |
|
|
— |
|
|
13,355 |
Other income |
|
|
1,046 |
|
|
480 |
|
|
124 |
|
|
3,483 |
|
|
2,205 |
Total non-interest income |
|
|
3,083 |
|
|
2,527 |
|
|
4,401 |
|
|
11,871 |
|
|
23,829 |
|
|
|
|
|
|
|
|
|
|
|
|
|
|
|
|
Non-interest expense |
|
|
|
|
|
|
|
|
|
|
|
|
|
|
|
Compensation and benefits |
|
|
20,361 |
|
|
21,674 |
|
|
19,615 |
|
|
84,029 |
|
|
77,859 |
Bank premises and equipment |
|
|
2,682 |
|
|
2,664 |
|
|
2,520 |
|
|
10,322 |
|
|
9,656 |
Professional fees |
|
|
2,857 |
|
|
3,506 |
|
|
3,687 |
|
|
14,932 |
|
|
21,320 |
Technology costs |
|
|
5,965 |
|
|
5,297 |
|
|
1,989 |
|
|
17,135 |
|
|
11,012 |
Deposit related program fees |
|
|
7,067 |
|
|
6,800 |
|
|
4,379 |
|
|
24,021 |
|
|
16,836 |
FDIC assessments |
|
|
1,610 |
|
|
1,972 |
|
|
2,980 |
|
|
9,548 |
|
|
11,780 |
Regulatory settlement reserve |
|
|
— |
|
|
— |
|
|
(537) |
|
|
— |
|
|
9,463 |
Other expenses |
|
|
3,839 |
|
|
3,881 |
|
|
3,528 |
|
|
16,018 |
|
|
15,649 |
Total non-interest expense |
|
|
44,381 |
|
|
45,794 |
|
|
38,161 |
|
|
176,005 |
|
|
173,575 |
|
|
|
|
|
|
|
|
|
|
|
|
|
|
|
|
Net income before income tax expense |
|
|
41,181 |
|
|
10,182 |
|
|
31,343 |
|
|
101,509 |
|
|
97,081 |
Income tax expense |
|
|
12,324 |
|
|
3,063 |
|
|
9,925 |
|
|
30,411 |
|
|
30,395 |
Net income (loss) |
|
$ |
28,857 |
|
$ |
7,119 |
|
$ |
21,418 |
|
$ |
71,098 |
|
$ |
66,686 |
|
|
|
|
|
|
|
|
|
|
|
|
|
|
|
|
Earnings per common share: |
|
|
|
|
|
|
|
|
|
|
|
|
|
|
|
Average common shares outstanding: |
|
|
|
|
|
|
|
|
|
|
|
|
|
|
|
Basic |
|
|
10,214,267 |
|
|
10,398,255 |
|
|
11,196,822 |
|
|
10,594,606 |
|
|
11,179,074 |
Diluted |
|
|
10,418,492 |
|
|
10,587,402 |
|
|
11,388,163 |
|
|
10,741,670 |
|
|
11,255,223 |
Basic earnings (loss) |
|
$ |
2.83 |
|
$ |
0.68 |
|
$ |
1.91 |
|
$ |
6.71 |
|
$ |
5.97 |
Diluted earnings (loss) |
|
$ |
2.77 |
|
$ |
0.67 |
|
$ |
1.88 |
|
$ |
6.62 |
|
$ |
5.93 |
8
Loan Production, Asset Quality & Regulatory Capital
|
|
Dec. 31, |
|
Sept. 30, |
|
Jun. 30, |
|
Mar. 31, |
|
Dec. 31, |
|
|||||
|
|
2025 |
|
2025 |
|
2025 |
|
2025 |
|
2024 |
|
|||||
LOAN PRODUCTION (in millions) |
|
$ |
510.9 |
|
$ |
514.2 |
|
$ |
492.0 |
|
$ |
409.8 |
|
$ |
309.0 |
|
|
|
|
|
|
|
|
|
|
|
|
|
|
|
|
|
|
ASSET QUALITY (in thousands) |
|
|
|
|
|
|
|
|
|
|
|
|
|
|
|
|
Non-performing loans: |
|
|
|
|
|
|
|
|
|
|
|
|
|
|
|
|
Commercial real estate |
|
$ |
75,408 |
|
$ |
70,122 |
|
$ |
28,480 |
|
$ |
25,087 |
|
$ |
25,087 |
|
Commercial and industrial |
|
|
8,989 |
|
|
8,989 |
|
|
8,989 |
|
|
8,989 |
|
|
6,989 |
|
One- to four- family |
|
|
2,450 |
|
|
2,451 |
|
|
2,469 |
|
|
446 |
|
|
452 |
|
Consumer |
|
|
37 |
|
|
— |
|
|
— |
|
|
22 |
|
|
72 |
|
Total non-performing loans |
|
$ |
86,884 |
|
$ |
81,562 |
|
$ |
39,938 |
|
$ |
34,544 |
|
$ |
32,600 |
|
Non-performing loans to total loans |
|
|
1.28 |
% |
|
1.20 |
% |
|
0.60 |
% |
|
0.54 |
% |
|
0.54 |
% |
Allowance for credit losses |
|
$ |
97,081 |
|
$ |
94,239 |
|
$ |
74,071 |
|
$ |
67,803 |
|
$ |
63,273 |
|
Allowance for credit losses to total loans |
|
|
1.43 |
% |
|
1.39 |
% |
|
1.12 |
% |
|
1.07 |
% |
|
1.05 |
% |
Charge-offs |
|
$ |
— |
|
$ |
(3,858) |
|
$ |
(112) |
|
$ |
(118) |
|
$ |
(106) |
|
Recoveries |
|
$ |
58 |
|
$ |
72 |
|
$ |
126 |
|
$ |
180 |
|
$ |
120 |
|
Net charge-offs/(recoveries) to average loans (annualized) |
|
|
— |
% |
|
0.22 |
% |
|
— |
% |
|
— |
% |
|
— |
% |
|
|
|
|
|
|
|
|
|
|
|
|
|
|
|
|
|
REGULATORY CAPITAL |
|
|
|
|
|
|
|
|
|
|
|
|
|
|
|
|
Tier 1 Leverage: |
|
|
|
|
|
|
|
|
|
|
|
|
|
|
|
|
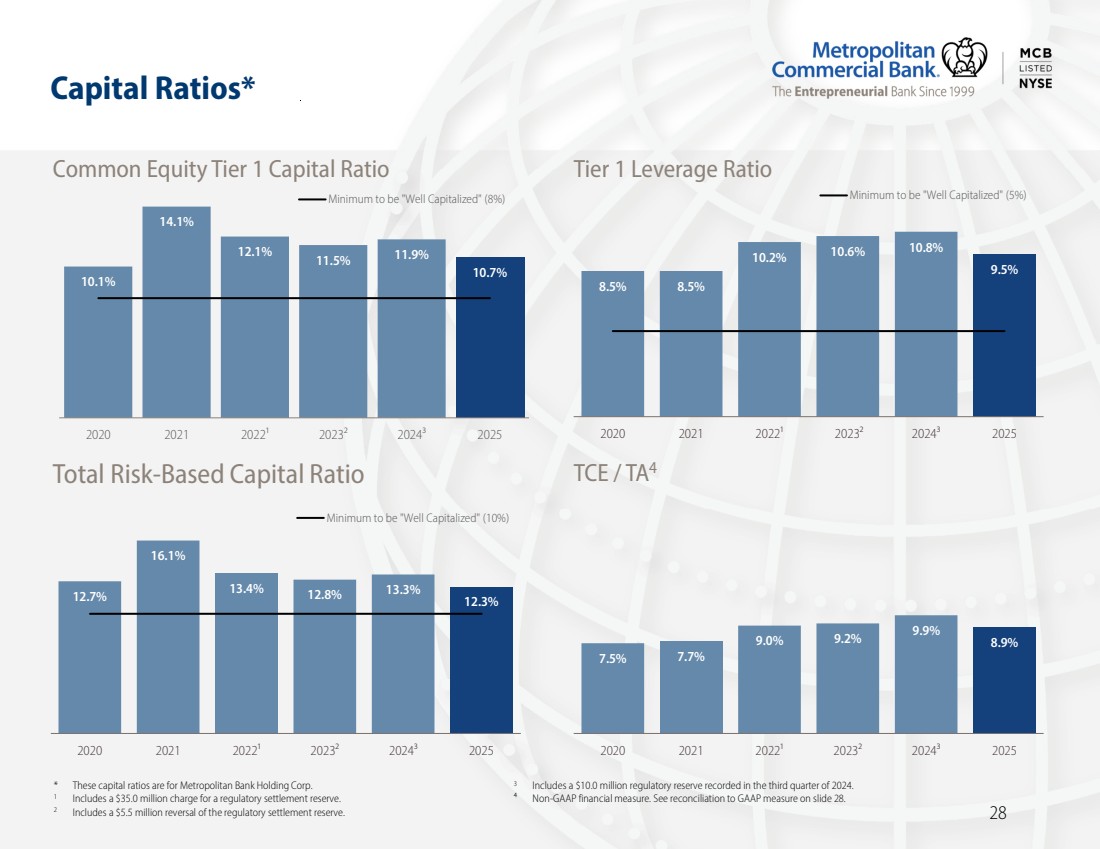
Metropolitan Bank Holding Corp. |
|
|
9.5 |
% |
|
9.8 |
% |
|
10.0 |
% |
|
10.7 |
% |
|
10.8 |
% |
Metropolitan Commercial Bank |
|
|
9.1 |
% |
|
9.4 |
% |
|
9.8 |
% |
|
10.1 |
% |
|
10.6 |
% |
|
|
|
|
|
|
|
|
|
|
|
|
|
|
|
|
|
Common Equity Tier 1 Risk-Based (CET1): |
|
|
|
|
|
|
|
|
|
|
|
|
|
|
|
|
Metropolitan Bank Holding Corp. |
|
|
10.7 |
% |
|
10.6 |
% |
|
10.8 |
% |
|
11.4 |
% |
|
11.9 |
% |
Metropolitan Commercial Bank |
|
|
10.5 |
% |
|
10.4 |
% |
|
10.9 |
% |
|
11.0 |
% |
|
12.0 |
% |
|
|
|
|
|
|
|
|
|
|
|
|
|
|
|
|
|
Tier 1 Risk-Based: |
|
|
|
|
|
|
|
|
|
|
|
|
|
|
|
|
Metropolitan Bank Holding Corp. |
|
|
11.0 |
% |
|
10.9 |
% |
|
11.1 |
% |
|
11.7 |
% |
|
12.3 |
% |
Metropolitan Commercial Bank |
|
|
10.5 |
% |
|
10.4 |
% |
|
10.9 |
% |
|
11.0 |
% |
|
12.0 |
% |
|
|
|
|
|
|
|
|
|
|
|
|
|
|
|
|
|
Total Risk-Based: |
|
|
|
|
|
|
|
|
|
|
|
|
|
|
|
|
Metropolitan Bank Holding Corp. |
|
|
12.3 |
% |
|
12.2 |
% |
|
12.2 |
% |
|
12.8 |
% |
|
13.3 |
% |
Metropolitan Commercial Bank |
|
|
11.7 |
% |
|
11.7 |
% |
|
12.0 |
% |
|
12.1 |
% |
|
13.0 |
% |
9
Performance Measures
|
|
Three months ended |
|
Year ended |
|
|||||||||||
|
|
Dec. 31, |
|
Sept. 30, |
|
Dec. 31, |
|
Dec. 31, |
|
Dec. 31, |
|
|||||
(dollars in thousands, except per share data) |
|
2025 |
|
2025 |
|
2024 |
|
2025 |
|
2024 |
|
|||||
Net income (loss) available to common shareholders |
|
$ |
28,857 |
|
$ |
7,119 |
|
$ |
21,418 |
|
$ |
71,098 |
|
$ |
66,686 |
|
|
|
|
|
|
|
|
|
|
|
|
|
|
|
|
|
|
Per common share: |
|
|
|
|
|
|
|
|
|
|
|
|
|
|
|
|
Basic earnings (loss) |
|
$ |
2.83 |
|
$ |
0.68 |
|
$ |
1.91 |
|
$ |
6.71 |
|
$ |
5.97 |
|
Diluted earnings (loss) |
|
$ |
2.77 |
|
$ |
0.67 |
|
$ |
1.88 |
|
$ |
6.62 |
|
$ |
5.93 |
|
Common shares outstanding: |
|
|
|
|
|
|
|
|
|
|
|
|
|
|
|
|
Period end |
|
|
10,088,617 |
|
|
10,382,218 |
|
|
11,197,625 |
|
|
10,088,617 |
|
|
11,197,625 |
|
Average fully diluted |
|
|
10,418,492 |
|
|
10,587,402 |
|
|
11,388,163 |
|
|
10,741,670 |
|
|
11,255,223 |
|
Return on:(1) |
|
|
|
|
|
|
|
|
|
|
|
|
|
|
|
|
Average total assets |
|
|
1.38 |
% |
|
0.35 |
% |
|
1.16 |
% |
|
0.90 |
% |
|
0.91 |
% |
Average equity |
|
|
15.6 |
% |
|
3.9 |
% |
|
11.8 |
% |
|
9.7 |
% |
|
9.6 |
% |
Average tangible common equity(2), (3) |
|
|
15.8 |
% |
|
3.9 |
% |
|
12.0 |
% |
|
9.8 |
% |
|
9.7 |
% |
Yield on average earning assets(1) |
|
|
6.60 |
% |
|
6.62 |
% |
|
6.58 |
% |
|
6.59 |
% |
|
6.53 |
% |
Total cost of deposits(1) |
|
|
2.75 |
% |
|
2.98 |
% |
|
3.15 |
% |
|
2.95 |
% |
|
3.22 |
% |
Net interest spread(1) |
|
|
3.16 |
% |
|
2.85 |
% |
|
2.28 |
% |
|
2.84 |
% |
|
1.94 |
% |
Net interest margin(1) |
|
|
4.10 |
% |
|
3.88 |
% |
|
3.66 |
% |
|
3.88 |
% |
|
3.53 |
% |
Net charge-offs as % of average loans(1) |
|
|
— |
% |
|
0.22 |
% |
|
— |
% |
|
0.06 |
% |
|
— |
% |
Efficiency ratio(4) |
|
|
50.2 |
% |
|
57.4 |
% |
|
53.7 |
% |
|
55.9 |
% |
|
62.7 |
% |
(1)For periods less than a year, ratios are annualized.
(2)Net income divided by average tangible common equity.
(3)Non-GAAP financial measure. See Reconciliation of Non-GAAP Measures on page 13.
(4)Total non-interest expense divided by total revenues.
10
Interest Margin Analysis
|
|
Three months ended |
|
||||||||||||||||||||||||
|
|
Dec. 31, 2025 |
|
|
Sept. 30, 2025 |
|
|
Dec. 31, 2024 |
|
||||||||||||||||||
|
|
Average |
|
|
|
|
Yield / |
|
|
Average |
|
|
|
|
Yield / |
|
|
Average |
|
|
|
|
Yield / |
|
|||
(dollars in thousands) |
|
Balance |
|
Interest |
|
Rate (1) |
|
|
Balance |
|
Interest |
|
Rate (1) |
|
|
Balance |
|
Interest |
|
Rate (1) |
|
||||||
Assets: |
|
|
|
|
|
|
|
|
|
|
|
|
|
|
|
|
|
|
|
|
|
|
|
|
|
|
|
Interest-earning assets: |
|
|
|
|
|
|
|
|
|
|
|
|
|
|
|
|
|
|
|
|
|
|
|
|
|
|
|
Loans (2) |
|
$ |
6,905,105 |
|
$ |
127,338 |
|
7.32 |
% |
|
$ |
6,690,695 |
|
$ |
123,521 |
|
7.32 |
% |
|
$ |
6,027,313 |
|
$ |
111,486 |
|
7.36 |
% |
Available-for-sale securities |
|
|
624,952 |
|
|
4,606 |
|
2.92 |
|
|
|
626,434 |
|
|
4,224 |
|
2.68 |
|
|
|
567,548 |
|
|
3,256 |
|
2.28 |
|
Held-to-maturity securities |
|
|
372,218 |
|
|
1,733 |
|
1.85 |
|
|
|
383,238 |
|
|
1,780 |
|
1.84 |
|
|
|
434,234 |
|
|
2,012 |
|
1.84 |
|
Equity investments |
|
|
5,830 |
|
|
44 |
|
3.02 |
|
|
|
5,751 |
|
|
43 |
|
2.94 |
|
|
|
5,477 |
|
|
39 |
|
2.81 |
|
Overnight deposits |
|
|
330,538 |
|
|
3,349 |
|
4.02 |
|
|
|
177,016 |
|
|
1,995 |
|
4.47 |
|
|
|
180,175 |
|
|
2,469 |
|
5.45 |
|
Other interest-earning assets |
|
|
24,553 |
|
|
396 |
|
6.41 |
|
|
|
27,564 |
|
|
437 |
|
6.29 |
|
|
|
30,255 |
|
|
567 |
|
7.46 |
|
Total interest-earning assets |
|
|
8,263,196 |
|
|
137,466 |
|
6.60 |
|
|
|
7,910,698 |
|
|
132,000 |
|
6.62 |
|
|
|
7,245,002 |
|
|
119,829 |
|
6.58 |
|
Non-interest-earning assets |
|
|
152,006 |
|
|
|
|
|
|
|
|
128,891 |
|
|
|
|
|
|
|
|
181,786 |
|
|
|
|
|
|
Allowance for credit losses |
|
|
(95,523) |
|
|
|
|
|
|
|
|
(74,877) |
|
|
|
|
|
|
|
|
(63,536) |
|
|
|
|
|
|
Total assets |
|
$ |
8,319,679 |
|
|
|
|
|
|
|
$ |
7,964,712 |
|
|
|
|
|
|
|
$ |
7,363,252 |
|
|
|
|
|
|
Liabilities and Stockholders' Equity: |
|
|
|
|
|
|
|
|
|
|
|
|
|
|
|
|
|
|
|
|
|
|
|
|
|
|
|
Interest-bearing liabilities: |
|
|
|
|
|
|
|
|
|
|
|
|
|
|
|
|
|
|
|
|
|
|
|
|
|
|
|
Money market and savings accounts |
|
$ |
5,727,076 |
|
|
48,925 |
|
3.39 |
|
|
$ |
5,340,340 |
|
|
49,856 |
|
3.70 |
|
|
$ |
4,459,792 |
|
|
47,581 |
|
4.24 |
|
Certificates of deposit |
|
|
171,784 |
|
|
1,707 |
|
3.94 |
|
|
|
126,600 |
|
|
1,321 |
|
4.14 |
|
|
|
116,062 |
|
|
1,254 |
|
4.30 |
|
Total interest-bearing deposits |
|
|
5,898,860 |
|
|
50,632 |
|
3.41 |
|
|
|
5,466,940 |
|
|
51,177 |
|
3.71 |
|
|
|
4,575,854 |
|
|
48,835 |
|
4.25 |
|
Borrowed funds |
|
|
119,532 |
|
|
1,509 |
|
5.01 |
|
|
|
289,518 |
|
|
3,512 |
|
4.81 |
|
|
|
350,892 |
|
|
4,391 |
|
4.98 |
|
Total interest-bearing liabilities |
|
|
6,018,392 |
|
|
52,141 |
|
3.44 |
|
|
|
5,756,457 |
|
|
54,689 |
|
3.77 |
|
|
|
4,926,746 |
|
|
53,226 |
|
4.30 |
|
Non-interest-bearing liabilities: |
|
|
|
|
|
|
|
|
|
|
|
|
|
|
|
|
|
|
|
|
|
|
|
|
|
|
|
Non-interest-bearing deposits |
|
|
1,409,271 |
|
|
|
|
|
|
|
|
1,354,163 |
|
|
|
|
|
|
|
|
1,586,005 |
|
|
|
|
|
|
Other non-interest-bearing liabilities |
|
|
156,294 |
|
|
|
|
|
|
|
|
122,811 |
|
|
|
|
|
|
|
|
128,995 |
|
|
|
|
|
|
Total liabilities |
|
|
7,583,957 |
|
|
|
|
|
|
|
|
7,233,431 |
|
|
|
|
|
|
|
|
6,641,746 |
|
|
|
|
|
|
Stockholders' equity |
|
|
735,722 |
|
|
|
|
|
|
|
|
731,281 |
|
|
|
|
|
|
|
|
721,506 |
|
|
|
|
|
|
Total liabilities and equity |
|
$ |
8,319,679 |
|
|
|
|
|
|
|
$ |
7,964,712 |
|
|
|
|
|
|
|
$ |
7,363,252 |
|
|
|
|
|
|
Net interest income |
|
|
|
|
$ |
85,325 |
|
|
|
|
|
|
|
$ |
77,311 |
|
|
|
|
|
|
|
$ |
66,603 |
|
|
|
Net interest rate spread (3) |
|
|
|
|
|
|
|
3.16 |
% |
|
|
|
|
|
|
|
2.85 |
% |
|
|
|
|
|
|
|
2.28 |
% |
Net interest margin (4) |
|
|
|
|
|
|
|
4.10 |
% |
|
|
|
|
|
|
|
3.88 |
% |
|
|
|
|
|
|
|
3.66 |
% |
Total cost of deposits (5) |
|
|
|
|
|
|
|
2.75 |
% |
|
|
|
|
|
|
|
2.98 |
% |
|
|
|
|
|
|
|
3.15 |
% |
Total cost of funds (6) |
|
|
|
|
|
|
|
2.79 |
% |
|
|
|
|
|
|
|
3.05 |
% |
|
|
|
|
|
|
|
3.25 |
% |
(1) |
Ratios are annualized. |
(2) |
Amount includes deferred loan fees and non-performing loans. |
(3) |
Determined by subtracting the annualized average cost of total interest-bearing liabilities from the annualized average yield on total interest-earning assets. |
(4) |
Determined by dividing annualized net interest income by total average interest-earning assets. |
(5) |
Determined by dividing annualized interest expense on deposits by total average interest-bearing and non-interest-bearing deposits. |
(6) |
Determined by dividing annualized interest expense by the sum of total average interest-bearing liabilities and total average non-interest-bearing deposits. |
11
|
|
Year ended |
|
|||||||||||||||
|
|
Dec. 31, 2025 |
|
|
Dec. 31, 2024 |
|
||||||||||||
|
|
Average |
|
|
|
|
Yield / |
|
|
Average |
|
|
|
|
Yield / |
|
||
(dollars in thousands) |
|
Balance |
|
Interest |
|
Rate |
|
|
Balance |
|
Interest |
|
Rate |
|
||||
Assets: |
|
|
|
|
|
|
|
|
|
|
|
|
|
|
|
|
|
|
Interest-earning assets: |
|
|
|
|
|
|
|
|
|
|
|
|
|
|
|
|
|
|
Loans (1) |
|
$ |
6,573,447 |
|
$ |
480,497 |
|
7.31 |
% |
|
$ |
5,842,570 |
|
$ |
429,748 |
|
7.36 |
% |
Available-for-sale securities |
|
|
609,162 |
|
|
16,128 |
|
2.65 |
|
|
|
576,040 |
|
|
12,917 |
|
2.24 |
|
Held-to-maturity securities |
|
|
391,642 |
|
|
7,304 |
|
1.87 |
|
|
|
450,048 |
|
|
8,369 |
|
1.86 |
|
Equity investments |
|
|
5,664 |
|
|
169 |
|
2.97 |
|
|
|
3,377 |
|
|
92 |
|
2.73 |
|
Overnight deposits |
|
|
211,880 |
|
|
9,347 |
|
4.41 |
|
|
|
269,472 |
|
|
15,013 |
|
5.57 |
|
Other interest-earning assets |
|
|
27,661 |
|
|
1,833 |
|
6.63 |
|
|
|
29,386 |
|
|
2,240 |
|
7.62 |
|
Total interest-earning assets |
|
|
7,819,456 |
|
|
515,278 |
|
6.59 |
|
|
|
7,170,893 |
|
|
468,379 |
|
6.53 |
|
Non-interest-earning assets |
|
|
137,373 |
|
|
|
|
|
|
|
|
182,936 |
|
|
|
|
|
|
Allowance for credit losses |
|
|
(76,069) |
|
|
|
|
|
|
|
|
(60,384) |
|
|
|
|
|
|
Total assets |
|
$ |
7,880,760 |
|
|
|
|
|
|
|
$ |
7,293,445 |
|
|
|
|
|
|
Liabilities and Stockholders' Equity: |
|
|
|
|
|
|
|
|
|
|
|
|
|
|
|
|
|
|
Interest-bearing liabilities: |
|
|
|
|
|
|
|
|
|
|
|
|
|
|
|
|
|
|
Money market and savings accounts |
|
$ |
5,238,150 |
|
$ |
193,079 |
|
3.69 |
|
|
$ |
4,298,166 |
|
$ |
195,695 |
|
4.55 |
|
Certificates of deposit |
|
|
139,676 |
|
|
5,731 |
|
4.10 |
|
|
|
57,227 |
|
|
2,318 |
|
4.05 |
|
Total interest-bearing deposits |
|
|
5,377,826 |
|
|
198,810 |
|
3.70 |
|
|
|
4,355,393 |
|
|
198,013 |
|
4.55 |
|
Borrowed funds |
|
|
274,672 |
|
|
13,233 |
|
4.82 |
|
|
|
336,364 |
|
|
17,282 |
|
5.14 |
|
Total interest-bearing liabilities |
|
|
5,652,498 |
|
|
212,043 |
|
3.75 |
|
|
|
4,691,757 |
|
|
215,295 |
|
4.59 |
|
Non-interest-bearing liabilities: |
|
|
|
|
|
|
|
|
|
|
|
|
|
|
|
|
|
|
Non-interest-bearing deposits |
|
|
1,360,516 |
|
|
|
|
|
|
|
|
1,788,170 |
|
|
|
|
|
|
Other non-interest-bearing liabilities |
|
|
135,135 |
|
|
|
|
|
|
|
|
119,364 |
|
|
|
|
|
|
Total liabilities |
|
|
7,148,149 |
|
|
|
|
|
|
|
|
6,599,291 |
|
|
|
|
|
|
Stockholders' equity |
|
|
732,611 |
|
|
|
|
|
|
|
|
694,154 |
|
|
|
|
|
|
Total liabilities and equity |
|
$ |
7,880,760 |
|
|
|
|
|
|
|
$ |
7,293,445 |
|
|
|
|
|
|
Net interest income |
|
|
|
|
$ |
303,235 |
|
|
|
|
|
|
|
$ |
253,084 |
|
|
|
Net interest rate spread (2) |
|
|
|
|
|
|
|
2.84 |
% |
|
|
|
|
|
|
|
1.94 |
% |
Net interest margin (3) |
|
|
|
|
|
|
|
3.88 |
% |
|
|
|
|
|
|
|
3.53 |
% |
Total cost of deposits (4) |
|
|
|
|
|
|
|
2.95 |
% |
|
|
|
|
|
|
|
3.22 |
% |
Total cost of funds (5) |
|
|
|
|
|
|
|
3.02 |
% |
|
|
|
|
|
|
|
3.32 |
% |
(1) |
Amount includes deferred loan fees and non-performing loans. |
(2) |
Determined by subtracting the average cost of total interest-bearing liabilities from the average yield on total interest-earning assets. |
(3) |
Determined by dividing annualized net interest income by total average interest-earning assets. |
(4) |
Determined by dividing annualized interest expense on deposits by total average interest-bearing and non-interest-bearing deposits. |
(5) |
Determined by dividing annualized interest expense by the sum of total average interest-bearing liabilities and total average non-interest-bearing deposits. |
12
Reconciliation of Non-GAAP Measures
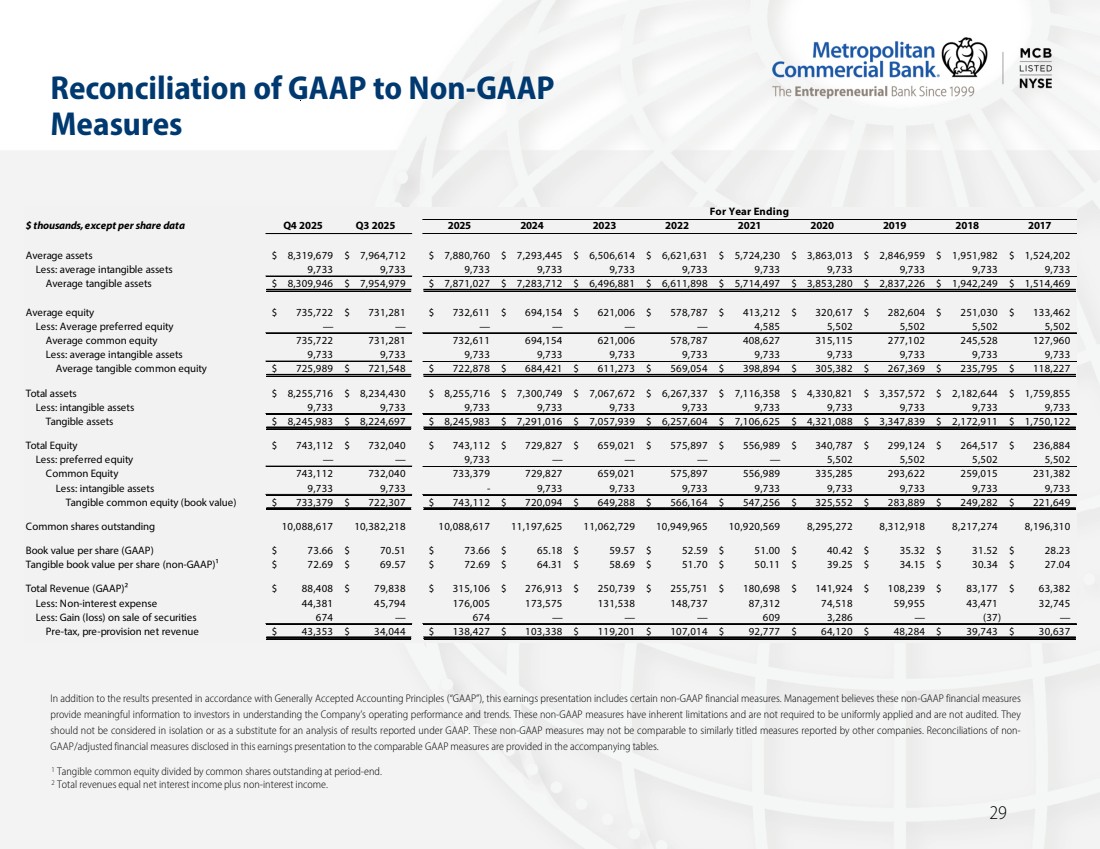
In addition to the results presented in accordance with Generally Accepted Accounting Principles (“GAAP”), this earnings release includes certain non-GAAP financial measures. Management believes these non-GAAP financial measures provide meaningful information to investors in understanding the Company’s operating performance and trends. These non-GAAP measures have inherent limitations and are not required to be uniformly applied and are not audited. They should not be considered in isolation or as a substitute for an analysis of results reported under GAAP. These non-GAAP measures may not be comparable to similarly titled measures reported by other companies. Reconciliations of non-GAAP/adjusted financial measures disclosed in this earnings release to the comparable GAAP measures are provided in the following tables:
|
|
Quarterly Data |
|
|
Year ended |
|
||||||||||||||||||||||
(dollars in thousands, |
|
Dec. 31, |
|
|
Sept. 30, |
|
|
Jun. 30, |
|
|
Mar. 31, |
|
|
Dec. 31, |
|
|
Dec. 31, |
|
|
Dec. 31, |
|
|||||||
except per share data) |
|
2025 |
|
|
2025 |
|
|
2025 |
|
|
2025 |
|
|
2024 |
|
|
2025 |
|
|
2024 |
|
|||||||
Average assets |
|
$ |
8,319,679 |
|
|
$ |
7,964,712 |
|
|
$ |
7,775,199 |
|
|
$ |
7,451,703 |
|
|
$ |
7,363,252 |
|
|
$ |
7,880,760 |
|
|
$ |
7,293,445 |
|
Less: average intangible assets |
|
|
9,733 |
|
|
|
9,733 |
|
|
|
9,733 |
|
|
|
9,733 |
|
|
|
9,733 |
|
|
|
9,733 |
|
|
|
9,733 |
|
Average tangible assets (non-GAAP) |
|
$ |
8,309,946 |
|
|
$ |
7,954,979 |
|
|
$ |
7,765,466 |
|
|
$ |
7,441,970 |
|
|
$ |
7,353,519 |
|
|
$ |
7,871,027 |
|
|
$ |
7,283,712 |
|
|
|
|
|
|
|
|
|
|
|
|
|
|
|
|
|
|
|
|
|
|
|
|
|
|
|
|
|
|
Average common equity |
|
$ |
735,722 |
|
|
$ |
731,281 |
|
|
$ |
723,974 |
|
|
$ |
738,224 |
|
|
$ |
721,506 |
|
|
$ |
732,611 |
|
|
$ |
694,154 |
|
Less: average intangible assets |
|
|
9,733 |
|
|
|
9,733 |
|
|
|
9,733 |
|
|
|
9,733 |
|
|
|
9,733 |
|
|
|
9,733 |
|
|
|
9,733 |
|
Average tangible common equity (non-GAAP) |
|
$ |
725,989 |
|
|
$ |
721,548 |
|
|
$ |
714,241 |
|
|
$ |
728,491 |
|
|
$ |
711,773 |
|
|
$ |
722,878 |
|
|
$ |
684,421 |
|
|
|
|
|
|
|
|
|
|
|
|
|
|
|
|
|
|
|
|
|
|
|
|
|
|
|
|
|
|
Total assets |
|
$ |
8,255,716 |
|
|
$ |
8,234,430 |
|
|
$ |
7,853,849 |
|
|
$ |
7,616,298 |
|
|
$ |
7,300,749 |
|
|
$ |
8,255,716 |
|
|
$ |
7,300,749 |
|
Less: intangible assets |
|
|
9,733 |
|
|
|
9,733 |
|
|
|
9,733 |
|
|
|
9,733 |
|
|
|
9,733 |
|
|
|
9,733 |
|
|
|
9,733 |
|
Tangible assets (non-GAAP) |
|
$ |
8,245,983 |
|
|
$ |
8,224,697 |
|
|
$ |
7,844,116 |
|
|
$ |
7,606,565 |
|
|
$ |
7,291,016 |
|
|
$ |
8,245,983 |
|
|
$ |
7,291,016 |
|
|
|
|
|
|
|
|
|
|
|
|
|
|
|
|
|
|
|
|
|
|
|
|
|
|
|
|
|
|
Common equity |
|
$ |
743,112 |
|
|
$ |
732,040 |
|
|
$ |
722,968 |
|
|
$ |
737,846 |
|
|
$ |
729,827 |
|
|
$ |
743,112 |
|
|
$ |
729,827 |
|
Less: intangible assets |
|
|
9,733 |
|
|
|
9,733 |
|
|
|
9,733 |
|
|
|
9,733 |
|
|
|
9,733 |
|
|
|
9,733 |
|
|
|
9,733 |
|
Tangible common equity (book value) (non-GAAP) |
|
$ |
733,379 |
|
|
$ |
722,307 |
|
|
$ |
713,235 |
|
|
$ |
728,113 |
|
|
$ |
720,094 |
|
|
$ |
733,379 |
|
|
$ |
720,094 |
|
|
|
|
|
|
|
|
|
|
|
|
|
|
|
|
|
|
|
|
|
|
|
|
|
|
|
|
|
|
Common shares outstanding |
|
|
10,088,617 |
|
|
|
10,382,218 |
|
|
|
10,421,384 |
|
|
|
11,066,234 |
|
|
|
11,197,625 |
|
|
|
10,088,617 |
|
|
|
11,197,625 |
|
Book value per share (GAAP) |
|
$ |
73.66 |
|
|
$ |
70.51 |
|
|
$ |
69.37 |
|
|
$ |
66.68 |
|
|
$ |
65.18 |
|
|
$ |
73.66 |
|
|
$ |
65.18 |
|
Tangible book value per share (non-GAAP) (1) |
|
$ |
72.69 |
|
|
$ |
69.57 |
|
|
$ |
68.44 |
|
|
$ |
65.80 |
|
|
$ |
64.31 |
|
|
$ |
72.69 |
|
|
$ |
64.31 |
|
| (1) | Tangible book value divided by common shares outstanding at period-end. |
Explanatory Note
Some amounts presented within this document may not recalculate due to rounding.
13
|
4Q 2025 Investor Presentation |
|
Contents 1 Page Disclosure 2 Performance Metrics 3 Differentiating Factors 7 Loans and Deposits 12 Modern Banking in Motion Digital Transformation 21 Selected Financial Information and Guidance 24 |
|
Disclosure 2 This presentation contains “forward-looking statements” within the meaning of the Private Securities Litigation Reform Act of 1995. Examples of forward-looking statements include but are not limited to the Company’s future financial condition and capital ratios, results of operations and the Company’s outlook , business, share repurchases under the program, and dividend payments. Forward-looking statements are not historical facts. Such statements may be identified by the use of such words as “may,” “believe,” “expect,” “anticipate,” “plan,” “continue” or similar terminology. These statements relate to future events or our future financial performance and involve risks and uncertainties that are difficult to predict and are generally beyond our control and may cause our actual results, levels of activity, performance or achievements to differ materially from those expressed or implied by these forward-looking statements. Although we believe that the expectations reflected in the forward-looking statements are reasonable, we caution you not to place undue reliance on these forward-looking statements. Factors which may cause our forward-looking statements to be materially inaccurate include, but are not limited to the following: a failure to successfully manage our credit risk and the sufficiency of our allowance for credit losses; changes in loan demand and declines in real estate values in the Company’s market area, which may adversely affect our loan production; borrower and depositor concentrations (e.g., by geographic area and by industry); the interest rate policies of the Federal Reserve and other regulatory bodies; general economic conditions, including unemployment rates, and potential recessionary and inflationary indicators, either nationally or locally, including the related effects on our borrowers and other clients, such as adverse changes to credit quality, and on our financial condition and results of operations; an unanticipated loss of key personnel or existing clients, or an inability to attract key employees; system failures or cybersecurity breaches of our information technology infrastructure and/or confidential information or those of the Company’s third-party service providers or those of our non-bank financial service clients for which we provide global payments infrastructure; failure to maintain current technologies or technological changes and enhancements that may be more difficult or expensive to implement than anticipated, and failure to successfully implement future information technology enhancements; emerging issues related to the development and use of artificial intelligence that could give rise to legal or regulatory action, damage our reputation or otherwise materially harm our business or clients; the timely and efficient development of new products and services offered by the Company, as well as risks (including reputational and litigation) attendant thereto, and the perceived overall value and acceptance of these products and services by clients; the successful implementation or consummation of new business initiatives, which may be more difficult or expensive than anticipated; an unexpected adverse financial, regulatory, legal or bankruptcy event experienced by our financial service clients; unexpected increases in our expenses; changes in liquidity, including funding sources, deposit flows and the size and composition of our deposit portfolio, and the percentage of uninsured deposits in the portfolio; an unexpected deterioration in the performance of our loan or securities portfolios and our inability to absorb the amount of actual losses inherent in the portfolio; difficulties associated with achieving or predicting expected future financial results; different than anticipated growth and our ability to manage our growth; increases in competitive pressures among financial institutions or from non-financial institutions which may result in unanticipated changes in our loan or deposit rates; unexpected adverse impact of future acquisitions or divestitures; impacts related to or resulting from regional and community bank failures and stresses to regional banks, or conditions in the securities markets or the banking industry being less favorable than currently anticipated; changes in accounting principles, policies or guidelines may cause the Company’s financial condition or results of operation to be reported or perceived differently; legislative, tax or regulatory changes or actions, including changes and the potential for changes to regulatory policy and the promulgation of new laws and regulations following the inauguration of a new presidential administration, may adversely affect the Company’s business; unanticipated increases in FDIC insurance premiums or future assessments; the costs, including the possible incurrence of fines, penalties, or other negative effects (including reputational harm) of any adverse judicial, administrative, or arbitral rulings or proceedings, regulatory enforcement actions, or other legal actions to which we or any of our subsidiaries are a party, and which may adversely affect our results; and the current or the potential impact on the Company’s operations, financial condition, and clients resulting from natural or man-made disasters, climate change, wars, military conflict, acts of terrorism, other geopolitical events, cyberattacks, and global pandemics, or localized epidemics as well as those discussed under the heading “Risk Factors” in our Annual Report on Form 10-K and Quarterly Reports on Form 10-Q which have been filed with the Securities and Exchange Commission under the Securities Exchange Act of 1934, as amended. Forward-looking statements speak only as of the date of this presentation. We do not undertake (and expressly disclaim) any obligation to update or revise any forward-looking statement, except as may be required by law. |
|
Performance Metrics 3 |
|
Metropolitan Commercial Bank Holding Corp. The Only True Mid-Sized, Publicly Traded Relationship Driven Commercial Bank Headquartered in NYC 4 Seven Strategically Located Banking Centers • Park Ave. Headquarters • Garment District/ Times Square • Diamond District • Upper East Side • Boro Park, Brooklyn • Great Neck, Long Island • Lakewood, NJ (New) Offices • Miami, FL • West Palm Beach, FL Market data as of December 31, 2025 and September 30, 2025 1 Non-GAAP financial measure. See reconciliation to GAAP measure in the appendix to this presentation. 2 Annualized. 4Q 2025 3Q 2025 Closing Price 76.36 $74.82 Market Cap $770.37 M $776.80 M Book Value per Share $73.66 $70.51 Tangible Book Value per Share $72.69 $69.57 P/Book Value 1.04 x 1.06 x P/Tangible Book Value1 1.05 x 1.08 x P/E2 6.95 x 28.15 x Assets $8.3 B $8.2 B Loans $6.8 B $6.8 B Deposits $7.4 B $7.1 B Loans/Deposits 92.3 % 95.9 % Net Interest Margin2 4.10 % 3.88 % Net Charge-offs / Average Loans2 0.0 % 0.2 % Efficiency Ratio 50.2 % 57.4 % Pre-tax, Pre-Provision Net Revenue / Average Assets1 2.07 % 1.70 % ROAA2 1.38 % 0.35 % ROAE2 15.6 % 3.9 % ROATCE1,2 15.8 % 3.9 % CET1 Capital Ratio 10.7 % 10.6 % Tier 1 Leverage Ratio 9.5 % 9.8 % Total Risk Based Capital Ratio 12.3 % 12.2 % TCE/TA1 Ratio 8.9 % 8.8 % |
|
Source: Bloomberg 1 Includes CNOB, DCOM, OCFC, PFS and VLY. 2 Cumulative shareholder return (change in stock price plus reinvested dividends). Outperformance versus Peers 50 100 150 200 250 300 350 3/30/2023 8/22/2023 1/14/2024 6/7/2024 10/30/2024 3/24/2025 8/16/2025 1/8/2026 Total Return Performance NYC Middle-Market Banks1, 2 KBW Regional Banking Index (“KRX”) Metropolitan Commercial Bank 149 156 322 5 |
|
Source: FactSet, S&P Global Market Intelligence. 1 CAGR from December 31, 2017 through September 30, 2025. 1* KRX and NYC Middle Market-Banks include growth resulting from acquisitions. 2 KRX Index represents median performance of the KBW Regional Banking Index constituents. 3 Includes CNOB, DCOM, OCFC, PFS and VLY. 4 Non-GAAP financial measure. See reconciliation to GAAP measure in the appendix to this presentation. 5 Performance since November 7, 2017 (MCB offering price of $35.00 per share) through January 8, 2026. Pre-tax, pre-provision net revenueĩ CAGR¹ 2017-2025Q3 Financial Performance Outpacing Peers Since 2017 IPO Deposits CAGR1 , 1* 2017–2025Q3 Loans CAGR1 , 1* 2017–2025Q3 23.2% 9.6% 14.3% MCB KRX Index² NYC Middle-Market Banks³ Share price performance since IPO5 November 7, 2017 Tangible book value per shareĩ CAGR¹ 2017–2025Q3 Earnings per share CAGR¹ 2017–2025Q3 13.0% 6.1% 4.8% MCB KRX Index² NYC Middle-Market Banks³ 20.2% 8.1% 12.1% MCB KRX Index² NYC Middle-Market Banks³ 22.4% 9.3% 13.5% MCB KRX Index² NYC Middle-Market Banks³ 12.3% 7.6% 0.1% MCB KRX Index² NYC Middle-Market Banks³ 132.5% 23.5% (11.2%) NYC Middle-Market Banks³ MCB KRX Index² 6 |
|
Differentiating Factors 7 |
|
Money Market & Savings, 77% Non-Int. Bearing Demand, 20% Time, 3% EB-5, Title & Escrow, and Charter Schools, 9% Municipal, 19% Bankruptcy Trustees, 6% Property Managers, 20% Deposits from Loan Customers, 18% Retail Deposits, 28% Skilled Nursing CRE and C&I, 40% Other C&I, 10% Other Owner Occupied CRE, 3% Non Owner Occupied CRE, 46% Consumer & 1-4 Family, 1% Highly Diversified Franchise Total Deposits $7.4B Manhattan, 19% Brooklyn, Bronx, Queens, 29% Long Is., 4% NJ, 10% FL, 17% Other US, 21% Loan Portfolio December 31, 2025 Total Loans $6.8B Total Deposits $7.4B Deposits December 31, 2025 Total Loans $6.8B • Active in Healthcare lending since 2002 with no realized losses since entering this space and no deferrals during the pandemic. • Skilled Nursing Facilities ("SNF") highly insulated from economic cycles by state funded payments. • All other portfolios are well-diversified across multiple property types and industries • Branch-lite model driven by technology integrations and high-quality service. • We target industries that are in possession of or have discretion over large sums of money. • Diversification across deposit verticals is a key strategy for managing and reducing execution risk. • 4Q 2025 Cost of deposits: 2.75% 8 |
|
Relationship Driven Commercial Bank with Strong Client Execution • Our Business Bankers have deep knowledge and expertise across multiple industries (e.g. law firms, resident healthcare, real estate property management, U.S. Trustee and Municipalities). • Full suite of retail financial service products targeting small and middle-market commercial businesses. • Commercial Lending group offers an array of commercial and industrial lending products providing our clients with custom lending solutions. • Commercial Real Estate ("CRE") Lending group has proven track record of successfully navigating today's complex real estate market. White-glove concierge service and a full suite of digital banking services allowing clients to easily manage their everyday banking needs. Modern Banking in Motion Digital Transformation supports future business expansion, drives efficiencies and enables better client experience. Our core competencies are: • Helping clients build and sustain generational wealth. • Offering a full range of banking and innovative financial servicesto businesses and individuals embracing an ever-evolving digital banking era. • Delivering enhanced client experiences through an innovative technology platform. • Providing modern and robust internal capabilities for our employees to support future business expansion and back-office efficiencies. 9 |
|
$61.5 $65.2 $66.6 $67.0 $73.6 $77.3 $85.3 2Q 2024 3Q 2024 4Q 2024 1Q 2025 2Q 2025 3Q 2025 4Q 2025 10 1 Represents effective average daily Fed Funds rate. * Annualized. Well Managed Net Interest Margin Net Interest Margin Analysis Estimated Sensitivity of Annual Net Interest Income December 31, 2025 Net Interest Income $ millions 1.00% 1.83% 2.16% 0.36% 0.08% 1.68% 5.03% 5.15% 4.21% 4.57% 4.78% 5.09% 4.73% 4.80% 5.33% 6.70% 6.53% 7.31% 0.47% 0.58% 1.10% 0.43% 0.27% 0.49% 2.43% 3.22% 2.95% 3.52% 3.70% 3.46% 3.26% 2.77% 3.49% 3.49% 3.53% 3.88% 2017 2018 2019 2020 2021 2022 2023 2024 2025 Average Fed Funds Rate¹ Average Loan Yield Average Total Cost of Deposits MCB Net Interest Margin ("NIM") 4.08% 1.87% -0.76% -1.61% -200 bps -100 bps +100 bps +200 bps |
|
22.3% 21.5% 21.0% 19.5% 20.1% 4Q 2024 1Q 2025 2Q 2025 3Q 2025 4Q 2025 $6.0 $6.4 $6.8 $7.1 $7.4 4Q 2024 1Q 2025 2Q 2025 3Q 2025 4Q 2025 9.9% 9.6% 9.1% 8.8% 8.9% 4Q 2024 1Q 2025 2Q 2025 3Q 2025 4Q 2025 Highly Liquid and Resilient Balance Sheet 75% Insured deposits Deposits ($ bn) TCE/TA Ratio1 Non-interest bearing Deposit % Deposit Profile at December 31, 2025 176% Uninsured Deposit Coverage Ratio2 BBB+ Kroll Deposit Rating 11 $6.0 $6.3 $6.6 $6.8 $6.8 4Q 2024 1Q 2025 2Q 2025 3Q 2025 4Q 2025 Loans ($ bn) 1 Tangible Common Equity divided by Tangible Assets. Non-GAAP financial measure. See reconciliation to GAAP measure on slide 29 2 Cash and available secured borrowing capacity divided by uninsured deposits. |
|
Loans and Deposits 12 |
|
13 1 Gross of deferred fees and unamortized costs. 2 Certain prior period amounts adjusted to conform to current presentation. 3 Excludes owner-occupied. 4 Mobile Home Parks, Residential Condos/Co-ops, Temporary Shelters, Religious Orgs., Parking Lots and Garages, Restaurants and Entertainment Facilities * Includes commercial real estate, multifamily and construction loans. Loan Portfolio Growth and Diversification $6.8 billion Gross Loan Portfolio1, 2 December 31, 2025 | $ millions Diversified Loan Portfolio December 31, 2025 37% 7% 6% 7% 5% 5% 4% 4% 3% 2% 6% 13% 37% CRE: Skilled Nursing Facility ("SNF") 7% CRE: Office 7% CRE: Hospitality 6% CRE: Multi-family 5% CRE: Retail 5% CRE: Mixed Use 4% CRE: Construction 4% CRE: Land 3% CRE: Industrial 2% CRE: Charter Schools $3& 0UIFSĩ 13% C&I 1% Consumer & 1-4 Family $2,939 $3,042 $3,162 $3,201 $3,147 $1,962 $2,171 $2,353 $2,547 $2,713 $1,046 $1,045 $1,016 $953 $872 $104 $102 $100 $99 $97 $6,051 $6,360 $6,631 $6,800 $6,829 4Q 2024 1Q 2025 2Q 2025 3Q 2025 4Q 2025 Consumer & 1-4 Family C&I CRE: Owner Occupied CRE: Non Owner Occupied* Average 4Q 2025 Yield: 7.32% CRE/RBC ratio3 : 377% |
|
19% 15% 11% 10% 8% 8% 4% 3% 22% 19% Bronx 15% Florida 11% Manhattan 10% New Jersey 8% Brooklyn 8% Long Island 4% Queens 3% Other NY 22% Other States 43% 8% 8% 7% 6% 6% 4% 3% 15% 43% Skilled Nursing Facilities 8% Office 8% Hospitality 7% Multifamily 6% Retail 6% Mixed Use 4% Land 3% Industrial 15% Other CRE Relationship-Based Commercial Real Estate Lending 14 Target Market • New York metropolitan area real estate entrepreneurs with a net worth in excess of $50 million • Primarily concentrated in the New York MSA • Well-diversified across multiple property types Key Metrics December 31, 2025 • Weighted average LTV of 62% • Owner occupied – 46% Composition by Type December 31, 2025 Composition by Region December 31, 2025 Vast majority of loans are originated through direct relationships or existing client referrals. Total CRE loans: $5.9 billion |
|
$273 $258 $246 $229 $219 $238 $249 $244 $237 $212 $159 $154 $170 $162 $140 $117 $116 $107 $104 $91 $69 $66 $77 $86 $75 $64 $67 $73 $65 $60 $29 $30 $30 $27 $26 $97 $105 $69 $43 $49 $1,046 $1,045 $1,016 $953 $872 4Q 2024 1Q 2025 2Q 2025 3Q 2025 4Q 2025 Other Manufacturing Wholesale Services Other Healthcare Individuals Skilled Nursing Facilities Finance & Insurance Expertise in Specific Verticals Drive Commercial & Industrial Lending 15 C&I Composition December 31, 2025 Target Market December 31, 2025 Total C&I Loans: $872mm • Middle market businesses with revenues up to $400 million • Well-diversified across industries Key Metrics • Strong historical credit performance - Pledged collateral and/or personal guarantees from high-net-worth individuals support most loans - Target borrowers have strong historical cash flows, and good asset coverage 25% 24% 16% 10% 9% 7% 3% 6% 25% Finance & Insurance 24% Skilled Nursing Facilities 16% Individuals 10% Other Healthcare 9% Services 7% Wholesale 3% Manufacturing 6% Other 1 Certain prior period amounts adjusted to conform to current presentation. C&I Portfolio1 December 31, 2025 | $ millions |
|
C&I Healthcare Composition | December 31, 2025 Diversified Healthcare Portfolio • Active in Healthcare lending since 2002 with no realized losses since entering this space and no deferrals during the pandemic. • Stabilized SNF – 61% of CRE SNF portfolio. Stabilized facilities provide cash flows adequate to support debt service and collateral value. Borrowers’ primary motive for acquisition of a stabilized property is for synergies with existing portfolio of SNFs. Weighted average debt service coverage ratio is 1.95x. • Transitional Non-stabilized SNF – are typically value-add opportunities that may have underlying issues that can be remediated. By implementing operational and management changes, enhancing the quality of care, improving the payor mix, and optimizing efficiency, experienced operators can increase the facility's profitability and value. Operators that have a strong market share in the region can negotiate higher reimbursement rates by working with payers, such as Medicare and Medicaid, to negotiate higher reimbursement rates for the services provided by the SNF. 70% 17% 10% 2% 70% SNF 17% Ambulatory Health Care Services 10% Medical Labs 2% Doctor Office 1% Ambulance Services CRE SNF $2.5 billion C&I SNF $212 mm C&I Other $91 mm Healthcare Composition | December 31, 2025 Total Healthcare loans: $2.8 billion 16 Total C&I Healthcare loans: $303mm Overview December 31, 2025 |
|
C&I Skilled Nursing Facility Exposure by State December 31, 2025 Geographically Diversified Skilled Nursing Facility Portfolio CRE Skilled Nursing Facility Exposure by State December 31, 2025 29% 25% 13% 8% 25% 29% Florida 25% New York 13% New Jersey 8% Indiana 25% Other States 46% 17% 12% 6% 6% 13% 46% Florida 17% New Jersey 12% New York 6% Indiana 6% Tennessee 13% Other 17 Total CRE SNF loans: $2.5 billion Total C&I SNF loans: $212mm • CRE – Skilled Nursing Facilities (“SNF”) – average LTV of 70%. • Highly selective regarding the quality of SNF Operators that we finance. • Borrowers are very experienced operators that typically have in excess of 1,000 beds under management and strong cash flows. Many further supported by vertically integrated related businesses. • Loans are made primarily in “certificate of need” states which limits the supply of beds and supports stable occupancy rates. • New York had Medicaid reimbursement rate increases of 4.4% and 6.5% in 2024 and 2023, respectively.1 • Florida had Medicaid reimbursement rate increase of 8.0% in 2024, with an additional 8% in 2025.1 Overview December 31, 2025 1 Source: Zimmet Healthcare Services Group LLC |
|
Conservatively Underwritten, Geographically Diversified CRE Office Portfolio 18 Office by Region December 31, 2025 46% 14% 5% 25% 8% 46% Manhattan 14% Brooklyn 5% Queens 2% Bronx 25% NY Metro Area (outside NYC) 8% Non NY Metro Area Overview December 31, 2025 • Total Office loans: $473mm • Weighted average LTV of 51% • Weighted average occupancy rate of 75%* • Weighted average debt service coverage ratio of 1.51x* • Manhattan loans originated since March 2022 is 100% • Owner-occupied is 9.1% • Varying levels of recourse on approximately 60% of loans * Excluding owner-occupied office properties. 1 Based on Outstanding Balance. 2 Single loan with "as is" LTV of 62%. Occupancy by Region December 31, 2025 Maturity Schedule December 31, 2025| $ millions 46% 78% 61% 42% 88% 80% Non NY Metro Area NY Metro Area (outside NYC) Bronx Queens² Brooklyn Manhattan 2026 2027 Thereafter Total Outstanding Balance $98 $243 $132 $473 Commitment Amount $102 $255 $132 $489 Avg. Commitment Size $7 $16 $7 $10 LTV1 46% 54% 50% 51% Nonperforming 8% 0% 0% 2% WAC 6.1% 6.0% 6.5% 6.2% |
|
19 Conservatively Underwritten Multi-family Portfolio Overview December 31, 2025 | $ millions Stabilized1 Maturity Schedule December 31, 2025 | $ millions Origination Vintage December 31, 2025 • Total Multi-family loans: $397mm • Weighted average LTV of 54% • Recourse on 54% of Total; recourse on 87% of Transitional • Rent regulated 45% of Total • Rent regulated have weighted average LTV of 45% • Stabilized weighted average debt service coverage ratio of 2.05x Transitional1 Maturity Schedule December 31, 2025 | $ millions 1 Stabilized facilities provide cash flows adequate to support debt service and collateral value. Transitional are value-add opportunities that may have historic underlying issues or challenges that can be addressed and improved upon. 2 Based on Outstanding Balance. 2% 15% 83% % of $397mm Outstanding Balance 2017 - 2019 2020 - 2021 2022 - 2025 2026 2027 Thereafter Total Outstanding Balance $48 $52 $0 $100 Commitment Amount $52 $60 $0 $112 Avg. Commitment Size $5 $18 $0 $8 LTV2 49% 75% 0% 62% Rent Regulated2 10% 0% 0% 5% With Recourse2 100% 75% 0% 87% Nonperforming 73% 0% 0% 35% WAC 4.9% 6.5% 0.0% 5.8% 2026 2027 Thereafter Total Outstanding Balance $134 $40 $123 $297 Commitment Amount $136 $40 $130 $306 Avg. Loan Size $4 $4 $5 $5 LTV2 66% 54% 34% 51% Rent Regulated2 61% 37% 62% 58% With Recourse2 71% 43% 28% 50% Nonperforming 6% 0% 0% 3% WAC 6.2% 5.1% 4.8% 5.5% |
|
$2,011 $2,135 $2,082 $2,053 $2,081 $1,108 $1,235 $1,266 $1,294 $1,306 $305 $300 $351 $413 $425 $1,217 $1,269 $1,279 $1,409 $1,439 $92 $858 $988 $1,260 $1,340 $1,478 $392 $522 $553 $564 $648 $5,983 $6,449 $6,791 $7,073 $7,377 4Q 2024 1Q 2025 2Q 2025 3Q 2025 4Q 2025 EB-5, Title & Escrow, & Charter Schools Municipal Other** Property Managers Bankruptcy Trustees Deposits from Loan Customers Retail Deposits $7.4 Billion Total Deposits December 31, 2025 | $ millions* Deposit Composition * Certain prior period amounts adjusted to conform to current presentation. ** GPG wind down. 20 |
|
Modern Banking in Motion Digital Transformation 21 |
|
2024 2025 2026 Service Description Partners Q1 Q2 Q3 Q4 Q1 Q2 Q3 Q4 Q1 Payments Hub (Wires) Payments Hub (ACH) Payments Hub (FedNow) Commercial Loans Servicing Enterprise Datawarehouse Digital Banking (Consumers) Digital Banking (Commercial) Fraud Risk Management Core Processing Contact Center / Core servicing Statements Processing and Rendering Teller System Project Phoenix N.A. Modern Banking in Motion Digital Transformation 22 Overview • The Bank is modernizing its core, payments and online banking systems to support continued growth. A modern stack will support future business expansion, drive efficiencies and enable a better client experience. • Digital transformation will provide extensive digital proficiencies, NextGen analytics capabilities, API-based extensibility, optimized back-office processes and efficient origination and loan servicing. • In 2024, the Bank launched project Phoenix to overhaul its infrastructure in line with its strategic growth and to enhance its disaster recovery capabilities. This project was completed in Q4'2025 and includes the redesign of the network, expansion of the datacenters, and increased system capacity. • Q4'25 digital transformation costs – $3.1 million • Full integration to be completed in Q1'26 • Total estimated project costs – $18 million (including 10% contingency) • Project costs expensed to date – $13.9 million Go live. N.A. – not applicable. |
|
Modern Banking in Motion Digital Transformation Partners 23 Partners Service Areas About Finzly provides a modern, cloud-based, API-enabled operating system that serves as a parallel payment processing platform to a bank's core. Finzly offers a wide range of turnkey banking solutions, including a multi-rail payment for traditional payments on ACH and wires, instant payments on FedNow and RTP, foreign exchange, trade finance, compliance, and commercial banking digital experiences. Payments Hub (wires) Payments Hub (ACH) Payments Hub (FedNow) AFS is the global leader in providing advanced commercial loan servicing solutions to lending institutions of all sizes. Solely dedicated to the commercial lending industry, AFS is uniquely positioned to support its client’s business and technology transformation. Commercial Loans Origination and Servicing Snowflake enables organizations to mobilize their data with Snowflake’s Data Cloud. Customers use the Data Cloud to unite siloed data, discover and securely share data, power data applications, and execute diverse AI/ML and analytic workloads. Enterprise Datawarehouse ebankIT enables banks to deliver humanized, personalized, and accessible digital experiences for their customers from mobile to web banking, from wearable gadgets to the metaverse and beyond. Digital Banking (Consumers & Commercial) Alloy helps banks and fintech companies make safe and seamless fraud, credit, and compliance decisions. Alloy's platform connects companies to more than 150 data sources of KYC/KYB, AML, credit, and compliance data through a single API to help create a future without fraud. MX Technologies, Inc. is a leader in actionable intelligence, enabling financial providers and consumers to do more with financial data. MX offers fast, secure solutions that helps streamline the account opening process while mitigating fraud and reducing risk. Fraud Risk Management & KYC To drive continued growth, the Bank is modernizing its core banking system with Finxact. Finxact, a gen-3 core, was built to be a full core banking solution providing MCB with the ability to develop and get to market with speed, with complete flexibility and control to adopt new capabilities. Gen 3 core solutions are geared towards banks who are looking to rapidly innovate utilizing new technologies to create unique customer experiences through a cloud-native / event driven architecture enabling highly automated real time access to bank data from modern APIs to all ancillary systems. Core Processing Savana provides a front-end servicing solution for the core processing system. Savana's platform is designed to orchestrate channels, products and processes to provide a unified ecosystem that streamlines operations between the core, back office and banker assisted channel. Contact Center / Core servicing A full-service, browser based, teller solution that is core agnostic. Dedicated to innovating cash and people across the branch network, offering cash management resources, cash planning tools, CTR, and Reg CC for the US market, a fully accessible electronic journal, and 27 other branch functions integrated directly to a Financial Institution's ecosystem. Statements Processing and Rendering Antuar is a financial technology company focused on branch innovation. Antuar's banking software solutions are designed to enable financial institutions to innovate the branch network, while reducing the overhead cost of servicing customers. Teller System |
|
Selected Financial Information 24 |
|
Proven High Growth Business Model Loans1 | $ millions $3,830 $6,436 $5,278 $5,737 $5,983 $7,377 2020 2021 2022 2023 2024 2025 Deposits | $ millions $142 $181 $256 $251 $277 $315 2020 2021 2022 2023 2024 2025 Revenue | $ millions $39 $60 $59 $77 $67 $71 2020 2021 2022³ ĩ Ī 2025 Net Income | $ millions 1 Loans, net of deferred fees and costs. 2 CAGR from December 31, 2020 through December 31, 2025. 3 Includes a $35.0 million charge for a regulatory settlement reserve in the fourth quarter of 2022. 4 Includes a $5.5 million reversal of the regulatory settlement reserve. 5 Includes a $10.0 million regulatory reserve recorded in the third quarter of 2024. $3,137 $3,732 $4,841 $5,625 $6,034 $6,810 2020 2021 2022 2023 2024 2025 25 |
|
Return on Average Assets Highly Profitable, Scalable Model 1 Non-GAAP financial measures. See reconciliation on slide 29. 2 Total non-interest expense divided by Total revenues. 3 Includes a $35.0 million charge for a regulatory settlement reserve. 4 Includes a $5.5 million reversal of the regulatory settlement reserve. Ī *ODMVEFT B NJMMJPO SFHVMBUPSZ SFTFSWF SFDPSEFE JO UIF UIJSE RVBSUFS PG Efficiency ratio2 12.9% 15.2% 10.4% 12.6% 9.7% 9.8% 2020 2021 2022³ ĩ Ī 2025 ROATCE1 52.5% 48.3% 58.2% 52.5% 62.7% 55.9% 2020 2021 2022³ ĩ Ī 2025 Net Interest Margin 3.26% 2.77% 3.49% 3.49% 3.53% 3.88% 2020 2021 2022 2023 2024 2025 26 1.02% 1.06% 0.90% 1.19% 0.91% 0.90% 2020 2021 2022 2023 2024 2025 |
|
0.20% 0.28% 0.00% 0.92% 0.54% 1.28% 2020 2021 2022 2023 2024 2025 Non-Performing Loans/Loans Credit Metrics NCOs/Average Loans ACL/Loans Non-Performing Loans/ACL 0.01% 0.13% 0.00% 0.02% 0.00% 0.06% 2020 2021 2022 2023 2024 2025 1.13% 0.93% 0.93% 1.03% 1.05% 1.43% 2020 2021 2022 2023* 2024 2025 18.0% 29.6% 0.0% 89.5% 51.5% 89.5% 2020 2021 2022 2023* 2024 2025 27 * Includes $2.3 million increase in ACL due to impact of CECL adoption on January 1, 2023. |
|
Capital Ratios* Common Equity Tier 1 Capital Ratio 10.1% 14.1% 12.1% 11.5% 11.9% 10.7% 2020 2021 2022¹ 2023² 2024³ 2025 Minimum to be "Well Capitalized" (8%) * These capital ratios are for Metropolitan Bank Holding Corp. 1 Includes a $35.0 million charge for a regulatory settlement reserve. 2 Includes a $5.5 million reversal of the regulatory settlement reserve. 3 Includes a $10.0 million regulatory reserve recorded in the third quarter of 2024. ĩ /PO(""1 GJOBODJBM NFBTVSF 4FF SFDPODJMJBUJPO UP (""1 NFBTVSF PO TMJEF Tier 1 Leverage Ratio 8.5% 8.5% 10.2% 10.6% 10.8% 9.5% 2020 2021 2022¹ 2023² 2024³ 2025 Minimum to be "Well Capitalized" (5%) 12.7% 16.1% 13.4% 12.8% 13.3% 12.3% 2020 2021 2022¹ 2023² 2024³ 2025 Minimum to be "Well Capitalized" (10%) Total Risk-Based Capital Ratio TCE / TA4 7.5% 7.7% 9.0% 9.2% 9.9% 8.9% 2020 2021 2022¹ 2023² 2024³ 2025 28 |
|
Reconciliation of GAAP to Non-GAAP Measures 1 Tangible common equity divided by common shares outstanding at period-end. 2 Total revenues equal net interest income plus non-interest income. In addition to the results presented in accordance with Generally Accepted Accounting Principles (“GAAP”), this earnings presentation includes certain non-GAAP financial measures. Management believes these non-GAAP financial measures provide meaningful information to investors in understanding the Company’s operating performance and trends. These non-GAAP measures have inherent limitations and are not required to be uniformly applied and are not audited. They should not be considered in isolation or as a substitute for an analysis of results reported under GAAP. These non-GAAP measures may not be comparable to similarly titled measures reported by other companies. Reconciliations of non-GAAP/adjusted financial measures disclosed in this earnings presentation to the comparable GAAP measures are provided in the accompanying tables. 29 $ thousands, except per share data Q4 2025 Q3 2025 2025 2024 2023 2022 2021 2020 2019 2018 2017 Average assets $ 8,319,679 $ 7,964,712 $ 7,880,760 $ 7,293,445 $ 6,506,614 $ 6,621,631 $ 5,724,230 $ 3,863,013 $ 2,846,959 $ 1,951,982 $ 1,524,202 Less: average intangible assets 9,733 9,733 9,733 9,733 9,733 9,733 9,733 9,733 9,733 9,733 9,733 Average tangible assets $ 8,309,946 $ 7,954,979 $ 7,871,027 $ 7,283,712 $ 6,496,881 $ 6,611,898 $ 5,714,497 $ 3,853,280 $ 2,837,226 $ 1,942,249 $ 1,514,469 Average equity $ 735,722 $ 731,281 $ 732,611 $ 694,154 $ 621,006 $ 578,787 $ 413,212 $ 320,617 $ 282,604 $ 251,030 $ 133,462 Less: Average preferred equity — — — — — — 4,585 5,502 5,502 5,502 5,502 Average common equity 735,722 731,281 732,611 694,154 621,006 578,787 408,627 315,115 277,102 245,528 127,960 Less: average intangible assets 9,733 9,733 9,733 9,733 9,733 9,733 9,733 9,733 9,733 9,733 9,733 Average tangible common equity $ 725,989 $ 721,548 $ 722,878 $ 684,421 $ 611,273 $ 569,054 $ 398,894 $ 305,382 $ 267,369 $ 235,795 $ 118,227 Total assets $ 8,255,716 $ 8,234,430 $ 8,255,716 $ 7,300,749 $ 7,067,672 $ 6,267,337 $ 7,116,358 $ 4,330,821 $ 3,357,572 $ 2,182,644 $ 1,759,855 Less: intangible assets 9,733 9,733 9,733 9,733 9,733 9,733 9,733 9,733 9,733 9,733 9,733 Tangible assets $ 8,245,983 $ 8,224,697 $ 8,245,983 $ 7,291,016 $ 7,057,939 $ 6,257,604 $ 7,106,625 $ 4,321,088 $ 3,347,839 $ 2,172,911 $ 1,750,122 Total Equity $ 743,112 $ 732,040 $ 743,112 $ 729,827 $ 659,021 $ 575,897 $ 556,989 $ 340,787 $ 299,124 $ 264,517 $ 236,884 Less: preferred equity — — 9,733 — — — — 5,502 5,502 5,502 5,502 Common Equity 743,112 732,040 733,379 729,827 659,021 575,897 556,989 335,285 293,622 259,015 231,382 Less: intangible assets 9,733 9,733 - 9,733 9,733 9,733 9,733 9,733 9,733 9,733 9,733 Tangible common equity (book value) $ 733,379 $ 722,307 $ 743,112 $ 720,094 $ 649,288 $ 566,164 $ 547,256 $ 325,552 $ 283,889 $ 249,282 $ 221,649 Common shares outstanding 10,088,617 10,382,218 10,088,617 11,197,625 11,062,729 10,949,965 10,920,569 8,295,272 8,312,918 8,217,274 8,196,310 Book value per share (GAAP) $ 73.66 $ 70.51 $ 73.66 $ 65.18 $ 59.57 $ 52.59 $ 51.00 $ 40.42 $ 35.32 $ 31.52 $ 28.23 Tangible book value per share (non-GAAP)¹ $ 72.69 $ 69.57 $ 72.69 $ 64.31 $ 58.69 $ 51.70 $ 50.11 $ 39.25 $ 34.15 $ 30.34 $ 27.04 Total Revenue (GAAP)² $ 88,408 $ 79,838 $ 315,106 $ 276,913 $ 250,739 $ 255,751 $ 180,698 $ 141,924 $ 108,239 $ 83,177 $ 63,382 Less: Non-interest expense 44,381 45,794 176,005 173,575 131,538 148,737 87,312 74,518 59,955 43,471 32,745 Less: Gain (loss) on sale of securities 674 — 674 — — — 609 3,286 — (37) — Pre-tax, pre-provision net revenue $ 43,353 $ 34,044 $ 138,427 $ 103,338 $ 119,201 $ 107,014 $ 92,777 $ 64,120 $ 48,284 $ 39,743 $ 30,637 For Year Ending |