UNITED STATES
SECURITIES AND EXCHANGE COMMISSION
Washington, D.C. 20549
FORM 8-K
CURRENT REPORT
PURSUANT TO SECTION 13 OR 15(d) OF THE SECURITIES EXCHANGE ACT OF 1934
Date of Report (Date of earliest event reported): January 14, 2026
UNITED COMMUNITY BANKS, INC.
(Exact name of registrant as specified in its charter)
| Georgia | 001-35095 | 58-1807304 | ||
| (State or other jurisdiction of incorporation) | (Commission file number) | (IRS Employer Identification No.) |
200 East Camperdown Way
Greenville, South Carolina 29601
(Address of principal executive offices)
Registrant's telephone number, including area code:
(800) 822-2651
Not applicable
(Former name or former address, if changed since last report)
Check the appropriate box below if the Form 8-K filing is intended to simultaneously satisfy the filing obligation of the registrant under any of the following provisions:
| ¨ | Written communications pursuant to Rule 425 under the Securities Act (17 CFR 230.425) |
| ¨ | Soliciting material pursuant to Rule 14a-12 under the Exchange Act (17 CFR 240.14a-12) |
| ¨ | Pre-commencement communications pursuant to Rule 14d-2(b) under the Exchange Act (17 CFR 240.14d-2(b)) |
| ¨ | Pre-commencement communications pursuant to Rule 13e-4(c) under the Exchange Act (17 CFR 240.13e-4(c)) |
Securities registered pursuant to Section 12(b) of the Act:
| Title of Each Class | Trading Symbol(s) | Name of Each Exchange on Which Registered |
| Common stock, par value $1 per share | UCB | New York Stock Exchange |
Indicate by check mark whether the registrant is an emerging growth company as defined in as defined in Rule 405 of the Securities Act of 1933 (§230.405 of this chapter) or Rule 12b-2 of the Securities Exchange Act of 1934 (§240.12b-2 of this chapter).
Emerging growth company ¨
If an emerging growth company, indicate by check mark if the registrant has elected not to use the extended transition period for complying with any new or revised financial accounting standards provided pursuant to Section 13(a) of the Exchange Act. ¨
| Item 2.02 | Results of Operations and Financial Condition. |
|
On January 14, 2026, United Community Banks, Inc. (“United Community”) issued a press release announcing financial results for its fourth fiscal quarter of 2025. The press release is furnished as Exhibit 99.1 to this Current Report on Form 8-K.
The information furnished pursuant to this Item 2.02, including Exhibit 99.1, shall not be deemed “filed” for purposes of Section 18 of the Securities Exchange Act of 1934 (the “Exchange Act”) or otherwise subject to the liabilities under Section 18 of the Exchange Act and shall not be deemed to be incorporated by reference into any filing of the Company under the Securities Act of 1933 or the Exchange Act. |
|
| Item 7.01 | Regulation FD Disclosure. |
|
On January 14, 2026, United Community will hold an earnings conference call and webcast at 9:00 a.m. (Eastern Time) to discuss financial results for its fourth fiscal quarter of 2025. The press release referenced above in Item 2.02 contains information about how to access the conference call and webcast. A copy of the slide presentation to be used during the earnings call and webcast is furnished as Exhibit 99.2 to this Current Report on Form 8-K. The slide presentation also will be available on our website, www.ucbi.com, under the “Investor Relations – Events and Presentations” section.
The information furnished pursuant to this Item 7.01, including Exhibit 99.2, shall not be deemed “filed” for purposes of Section 18 of the Exchange Act or otherwise subject to the liabilities under Section 18 of the Exchange Act and shall not be deemed to be incorporated by reference into any filing of the Company under the Securities Act of 1933 or the Exchange Act. |
|
| Item 9.01 | Financial Statements and Exhibits. |
| (d) Exhibits |
EXHIBIT INDEX
| Exhibit No. | Description | |
| 99.1 | United Community Banks, Inc. Press Release, dated January 14, 2026. | |
| 99.2 | Slide presentation to be used during January 14, 2026 earnings call. | |
| 104 | The cover page from this Current Report on Form 8-K, formatted in Inline XBRL. | |
SIGNATURES
Pursuant to the requirements of the Securities Exchange Act of 1934, the registrant has duly caused this report to be signed on its behalf by the undersigned hereunto duly authorized.
| UNITED COMMUNITY BANKS, INC. | ||
| By: | /s/ Jefferson L. Harralson | |
| Jefferson L. Harralson | ||
| Executive Vice President and | ||
| Chief Financial Officer | ||
| Date: January 14, 2026 | ||
Exhibit 99.1

For Immediate Release
For more information:
Jefferson Harralson
Chief Financial Officer
(864) 240-6208
Jefferson_Harralson@ucbi.com
United Community Banks, Inc. Reports Fourth Quarter Earnings
Further Margin Expansion Drove Revenue Growth
GREENVILLE, SC – January 14, 2026 – United Community Banks, Inc. (NYSE: UCB) (United) today announced net income for the fourth quarter of 2025 of $86.5 million and pre-tax, pre-provision income of $126.3 million. Diluted earnings per share of $0.70 for the quarter represented an increase of $0.09 from the fourth quarter a year ago and was flat to the third quarter. For the year of 2025, net income was $328 million and pre-tax, pre-provision income was $471 million compared with $252 million and $374 million, respectively, for 2024. Diluted earnings per share of $2.62 for 2025 increased $0.58 from $2.04 for 2024, driven by growth in revenue and the absence of a one-time loss on the sale of United’s manufactured housing loan portfolio.
On an operating basis, United’s diluted earnings per share of $0.71 increased 13% from the year-ago quarter. Strong revenue growth and positive operating leverage drove the year-over-year results. For the full year of 2025, diluted operating earnings per share were $2.71, an increase of $0.41, or 18%, from the $2.30 reported in 2024.
United’s return on assets was 1.21%, or 1.22% on an operating basis, up from 1.06% and 1.08%, respectively for the fourth quarter of 2024. Return on common equity was 9.5% and return on tangible common equity on an operating basis was 13.3%. On a pre-tax, pre-provision basis, operating return on assets was 1.78% for the quarter. At year-end, tangible common equity to tangible assets was 9.92%, up 21 basis points from the third quarter.
Chairman and CEO Lynn Harton stated, “The fourth quarter marks a great ending to a rewarding year. Our teams delivered healthy loan growth for all of 2025, leading to improvement in our earning asset mix. That improvement, combined with our focus on deposit pricing, drove a 36 basis points expansion in our net interest margin year over year, with four basis points of improvement coming in the fourth quarter. All our key performance metrics improved significantly when compared to 2024. Believing this performance will continue, we took the opportunity to repurchase one million common shares at an average price of $29.84 per share and redeem $35 million of senior debt in the fourth quarter.
Harton continued, “United is well-positioned for another great year in 2026. Economic conditions in our markets remain strong and our team continues to execute well in all our lines of business. I want to congratulate and thank them for outstanding results.”
Net charge-offs were $16.4 million or 0.34% annualized of average loans, compared with 0.21% for the fourth quarter of 2024 and 0.16% for the third quarter. Nonperforming assets were 0.33% of total assets, improved slightly from 0.35% for the third quarter. Provision for credit losses was $13.7 million for the fourth quarter, up from $11.4 million a year ago and $7.9 million for the third quarter. As of December 31, the allowance for credit losses represents 1.16% of loans, down slightly from 1.19% at September 30, reflecting the release of the remaining Hurricane Helene reserve.
Fourth Quarter 2025 Financial Highlights:
| • | EPS of $0.70 was up $0.09 on a GAAP basis compared to fourth quarter 2024, and EPS of $0.71 was up $0.08, or 13%, on an operating basis |
| • | Net income of $86.5 million and pre-tax, pre-provision income of $126.3 million, up $10.7 million and $18.5 million, respectively, from a year ago |
| • | Total revenue of $278.4 million improved $27.5 million, or 11%, from a year ago |
| • | Net interest margin of 3.62% increased by 36 basis points from a year ago and 4 basis points from the third quarter on a lower cost of funds and improving asset mix |
| • | Provision for credit losses was $13.7 million, up $2.3 million from a year ago and up $5.8 million from the third quarter; allowance for credit losses coverage down slightly to 1.16% of total loans; net charge-offs were $16.4 million, or 0.34% of average loans, annualized |
| • | Noninterest expenses were up $1.2 million compared to the third quarter on a GAAP basis and up $4.0 million on an operating basis, primarily driven by performance-based incentives |
| • | Efficiency ratio of 54.4% on a GAAP basis, or 54.2% on an operating basis, improved from a year ago |
| • | Strong loan production led to loan growth of $209 million, up 4.4% annualized, from the third quarter |
| • | Mortgage closings of $261 million compared to $246 million in fourth quarter 2024; mortgage rate locks of $319 million compared to $285 million in fourth quarter 2024 |
| • | Customer deposits were down $242 million from the third quarter |
| • | Return on assets of 1.21%, or 1.22% on an operating basis |
| • | Return on common equity and return on tangible common equity on an operating basis were 9.5% and 13.3%, respectively |
| • | Maintained strong capital ratios with preliminary Common Equity Tier 1 of 13.4% |
| • | Quarterly common dividend of $0.25 per share declared during the quarter, up 4% year-over-year |
| • | Repurchased 1.0 million shares of common stock in the fourth quarter at an average price of $29.84 per share |
2025 Financial Highlights:
| • | Net income of $328 million and pre-tax, pre-provision income of $471 million |
| • | GAAP diluted earnings per share of $2.62, increased 28% compared to $2.04 for 2024 |
| • | Operating diluted earnings per share of $2.71, increased 18% compared to $2.30 for 2024 |
| • | Total revenue of $1.06 billion, increased 12% over $952 million in 2024 |
| • | Book value per share and tangible book value per share increased 8% and 11% respectively over 2024 |
| • | Return on assets of 1.17%, or 1.20% on an operating basis |
| • | Pre-tax, pre-provision return on assets of 1.72% on an operating basis |
| • | Return on common equity of 9.12% compared with 7.07% for 2024 |
| • | Return on tangible common equity - operating of 13.3% compared with 11.4% for 2024 |
Conference Call
United will hold a conference call on Wednesday, January 14, 2026 at 9:00 a.m. ET to discuss the contents of this press release and to share business highlights for the quarter. Participants can pre-register for the conference call by navigating to https://dpregister.com/sreg/10205112/1008d91b050. Those without internet access or unable to pre-register may dial in by calling 1-844-676-1337. The conference call also will be webcast and can be accessed by selecting “Events and Presentations” under “News and Events” within the Investor Relations section of the company's website, ucbi.com.
| UNITED
COMMUNITY BANKS, INC. Selected Financial Information (in thousands, except per share data) |
||||||||||||||||||||||||||||||||||||
| 2025 | 2024 | Fourth Quarter 2025- 2024 |
For the Twelve Months Ended December 31, |
YTD 2025- 2024 |
||||||||||||||||||||||||||||||||
| Fourth Quarter |
Third Quarter |
Second Quarter |
First Quarter |
Fourth Quarter |
Change | 2025 | 2024 | Change | ||||||||||||||||||||||||||||
| INCOME SUMMARY | ||||||||||||||||||||||||||||||||||||
| Interest revenue | $ | 346,367 | $ | 353,850 | $ | 347,365 | $ | 335,357 | $ | 344,962 | $ | 1,382,939 | $ | 1,377,741 | ||||||||||||||||||||||
| Interest expense | 108,441 | 120,221 | 121,834 | 123,336 | 134,629 | 473,832 | 550,373 | |||||||||||||||||||||||||||||
| Net interest revenue | 237,926 | 233,629 | 225,531 | 212,021 | 210,333 | 13 | % | 909,107 | 827,368 | 10 | % | |||||||||||||||||||||||||
| Noninterest income | 40,462 | 43,219 | 34,708 | 35,656 | 40,522 | — | 154,045 | 124,756 | 23 | |||||||||||||||||||||||||||
| Total revenue | 278,388 | 276,848 | 260,239 | 247,677 | 250,855 | 11 | 1,063,152 | 952,124 | 12 | |||||||||||||||||||||||||||
| Provision for credit losses | 13,662 | 7,907 | 11,818 | 15,419 | 11,389 | 20 | 48,806 | 50,951 | (4 | ) | ||||||||||||||||||||||||||
| Noninterest expenses | 152,048 | 150,868 | 147,919 | 141,099 | 143,056 | 6 | 591,934 | 578,167 | 2 | |||||||||||||||||||||||||||
| Income before income tax expense | 112,678 | 118,073 | 100,502 | 91,159 | 96,410 | 422,412 | 323,006 | |||||||||||||||||||||||||||||
| Income tax expense | 26,223 | 26,579 | 21,769 | 19,746 | 20,606 | 94,317 | 70,609 | |||||||||||||||||||||||||||||
| Net income | 86,455 | 91,494 | 78,733 | 71,413 | 75,804 | 14 | 328,095 | 252,397 | 30 | |||||||||||||||||||||||||||
| Non-operating items | 606 | 3,468 | 4,833 | 1,297 | 2,203 | 10,204 | 40,268 | |||||||||||||||||||||||||||||
| Income tax benefit of non-operating items | (133 | ) | (751 | ) | (1,047 | ) | (281 | ) | (471 | ) | (2,212 | ) | (8,702 | ) | ||||||||||||||||||||||
| Net income - operating (1) | $ | 86,928 | $ | 94,211 | $ | 82,519 | $ | 72,429 | $ | 77,536 | 12 | $ | 336,087 | $ | 283,963 | 18 | ||||||||||||||||||||
| Pre-tax pre-provision income (5) | $ | 126,340 | $ | 125,980 | $ | 112,320 | $ | 106,578 | $ | 107,799 | 17 | $ | 471,218 | $ | 373,957 | 26 | ||||||||||||||||||||
| PERFORMANCE MEASURES | ||||||||||||||||||||||||||||||||||||
| Per common share: | ||||||||||||||||||||||||||||||||||||
| Diluted net income - GAAP | $ | 0.70 | $ | 0.70 | $ | 0.63 | $ | 0.58 | $ | 0.61 | 15 | $ | 2.62 | $ | 2.04 | 28 | ||||||||||||||||||||
| Diluted net income - operating (1) | 0.71 | 0.75 | 0.66 | 0.59 | 0.63 | 13 | 2.71 | 2.30 | 18 | |||||||||||||||||||||||||||
| Common stock cash dividends declared | 0.25 | 0.25 | 0.24 | 0.24 | 0.24 | 4 | 0.98 | 0.94 | 4 | |||||||||||||||||||||||||||
| Book value | 30.17 | 29.44 | 28.89 | 28.42 | 27.87 | 8 | 30.17 | 27.87 | 8 | |||||||||||||||||||||||||||
| Tangible book value (3) | 22.24 | 21.59 | 21.00 | 20.58 | 20.00 | 11 | 22.24 | 20.00 | 11 | |||||||||||||||||||||||||||
| Key performance ratios: | ||||||||||||||||||||||||||||||||||||
| Return on common equity - GAAP (2)(4) | 9.48 | % | 9.20 | % | 8.45 | % | 7.89 | % | 8.40 | % | 9.12 | % | 7.07 | % | ||||||||||||||||||||||
| Return on common equity - operating (1)(2)(4) | 9.53 | 9.83 | 8.87 | 8.01 | 8.60 | 9.44 | 7.97 | |||||||||||||||||||||||||||||
| Return on tangible common equity - operating (1)(2)(3)(4) | 13.31 | 13.56 | 12.34 | 11.21 | 12.12 | 13.34 | 11.42 | |||||||||||||||||||||||||||||
| Return on assets - GAAP (4) | 1.21 | 1.29 | 1.11 | 1.02 | 1.06 | 1.17 | 0.90 | |||||||||||||||||||||||||||||
| Return on assets - operating (1)(4) | 1.22 | 1.33 | 1.16 | 1.04 | 1.08 | 1.20 | 1.02 | |||||||||||||||||||||||||||||
| Return on assets -pre-tax pre-provision, excluding non-operating items (1)(4)(5) | 1.78 | 1.83 | 1.66 | 1.55 | 1.55 | 1.72 | 1.49 | |||||||||||||||||||||||||||||
| Net interest margin (fully taxable equivalent) (4) | 3.62 | 3.58 | 3.50 | 3.36 | 3.26 | 3.52 | 3.29 | |||||||||||||||||||||||||||||
| Efficiency ratio - GAAP | 54.40 | 54.30 | 56.69 | 56.74 | 56.05 | 55.46 | 60.24 | |||||||||||||||||||||||||||||
| Efficiency ratio - operating (1) | 54.19 | 53.05 | 54.84 | 56.22 | 55.18 | 54.51 | 57.15 | |||||||||||||||||||||||||||||
| Equity to total assets | 12.99 | 12.78 | 12.86 | 12.56 | 12.38 | 12.99 | 12.38 | |||||||||||||||||||||||||||||
| Tangible common equity to tangible assets (3) | 9.92 | 9.71 | 9.45 | 9.18 | 8.97 | 9.92 | 8.97 | |||||||||||||||||||||||||||||
| ASSET QUALITY | ||||||||||||||||||||||||||||||||||||
| Nonperforming assets (“NPAs”) | $ | 93,498 | $ | 97,916 | $ | 83,959 | $ | 93,290 | $ | 115,635 | (19 | ) | $ | 93,498 | $ | 115,635 | (19 | ) | ||||||||||||||||||
| ACL, loans | 210,429 | 215,791 | 216,500 | 211,974 | 206,998 | 2 | 210,429 | 206,998 | 2 | |||||||||||||||||||||||||||
| ACL, total | 225,520 | 228,276 | 228,045 | 223,201 | 217,389 | 4 | 225,520 | 217,389 | 4 | |||||||||||||||||||||||||||
| Net charge-offs | 16,418 | 7,676 | 8,225 | 9,607 | 9,517 | 41,926 | 57,690 | |||||||||||||||||||||||||||||
| ACL, loans to loans | 1.09 | % | 1.13 | % | 1.14 | % | 1.15 | % | 1.14 | % | 1.09 | % | 1.14 | % | ||||||||||||||||||||||
| ACL, total to loans | 1.16 | 1.19 | 1.21 | 1.21 | 1.20 | 1.16 | 1.20 | |||||||||||||||||||||||||||||
| Net charge-offs to average loans (4) | 0.34 | 0.16 | 0.18 | 0.21 | 0.21 | 0.22 | 0.32 | |||||||||||||||||||||||||||||
| NPAs to total assets | 0.33 | 0.35 | 0.30 | 0.33 | 0.42 | 0.33 | 0.42 | |||||||||||||||||||||||||||||
| AT PERIOD END ($ in millions) | ||||||||||||||||||||||||||||||||||||
| Loans | $ | 19,384 | $ | 19,175 | $ | 18,921 | $ | 18,425 | $ | 18,176 | 7 | $ | 19,384 | $ | 18,176 | 7 | ||||||||||||||||||||
| Investment securities | 5,988 | 6,163 | 6,382 | 6,661 | 6,804 | (12 | ) | 5,988 | 6,804 | (12 | ) | |||||||||||||||||||||||||
| Total assets | 28,003 | 28,143 | 28,086 | 27,874 | 27,720 | 1 | 28,003 | 27,720 | 1 | |||||||||||||||||||||||||||
| Deposits | 23,798 | 24,021 | 23,963 | 23,762 | 23,461 | 1 | 23,798 | 23,461 | 1 | |||||||||||||||||||||||||||
| Shareholders’ equity | 3,639 | 3,597 | 3,613 | 3,501 | 3,432 | 6 | 3,639 | 3,432 | 6 | |||||||||||||||||||||||||||
| Common shares outstanding (thousands) | 120,598 | 121,553 | 121,431 | 119,514 | 119,364 | 1 | 120,598 | 119,364 | 1 | |||||||||||||||||||||||||||
(1) Excludes non-operating items as detailed on Non-GAAP Performance Measures Reconciliation. (2) Net income less preferred stock dividends, divided by average common equity. (3) Excludes effect of acquisition related intangibles and associated amortization. (4) Annualized. (5) Excludes income tax expense and provision for credit losses.
| UNITED COMMUNITY BANKS, INC. | ||||||||||||||||||||||||||||
| Financial Highlights | ||||||||||||||||||||||||||||
| Loan Portfolio Composition at Period-End | ||||||||||||||||||||||||||||
| (in millions) | ||||||||||||||||||||||||||||
| 2025 | 2024 | Linked | Year over | |||||||||||||||||||||||||
| Fourth Quarter |
Third Quarter |
Second Quarter |
First
Quarter |
Fourth Quarter |
Quarter Change |
Year Change |
||||||||||||||||||||||
| LOANS BY CATEGORY | ||||||||||||||||||||||||||||
| Owner occupied commercial RE | $ | 3,852 | $ | 3,678 | $ | 3,563 | $ | 3,419 | $ | 3,398 | $ | 174 | $ | 454 | ||||||||||||||
| Income producing commercial RE | 4,883 | 4,534 | 4,548 | 4,416 | 4,361 | 349 | 522 | |||||||||||||||||||||
| Commercial & industrial | 2,696 | 2,593 | 2,516 | 2,506 | 2,428 | 103 | 268 | |||||||||||||||||||||
| Commercial construction and land | 1,245 | 1,734 | 1,752 | 1,681 | 1,656 | (489 | ) | (411 | ) | |||||||||||||||||||
| Equipment financing | 1,848 | 1,808 | 1,778 | 1,723 | 1,663 | 40 | 185 | |||||||||||||||||||||
| Total commercial | 14,524 | 14,347 | 14,157 | 13,745 | 13,506 | 177 | 1,018 | |||||||||||||||||||||
| Residential mortgage | 3,157 | 3,198 | 3,210 | 3,218 | 3,232 | (41 | ) | (75 | ) | |||||||||||||||||||
| Home equity lines of credit | 1,319 | 1,252 | 1,180 | 1,099 | 1,065 | 67 | 254 | |||||||||||||||||||||
| Residential construction and land | 191 | 178 | 174 | 171 | 178 | 13 | 13 | |||||||||||||||||||||
| Consumer | 188 | 192 | 191 | 183 | 188 | (4 | ) | — | ||||||||||||||||||||
| Other | 5 | 8 | 9 | 9 | 7 | (3 | ) | (2 | ) | |||||||||||||||||||
| Total loans | $ | 19,384 | $ | 19,175 | $ | 18,921 | $ | 18,425 | $ | 18,176 | $ | 209 | $ | 1,208 | ||||||||||||||
| LOANS BY STATE | ||||||||||||||||||||||||||||
| Georgia | $ | 4,635 | $ | 4,584 | $ | 4,551 | $ | 4,484 | $ | 4,447 | $ | 51 | $ | 188 | ||||||||||||||
| South Carolina | 2,971 | 2,926 | 2,872 | 2,821 | 2,815 | 45 | 156 | |||||||||||||||||||||
| North Carolina | 2,712 | 2,676 | 2,626 | 2,666 | 2,644 | 36 | 68 | |||||||||||||||||||||
| Tennessee | 1,913 | 1,902 | 1,881 | 1,880 | 1,799 | 11 | 114 | |||||||||||||||||||||
| Florida | 3,102 | 3,040 | 2,966 | 2,572 | 2,527 | 62 | 575 | |||||||||||||||||||||
| Alabama | 1,050 | 1,054 | 1,016 | 1,009 | 996 | (4 | ) | 54 | ||||||||||||||||||||
| Commercial Banking Solutions | 3,001 | 2,993 | 3,009 | 2,993 | 2,948 | 8 | 53 | |||||||||||||||||||||
| Total loans | $ | 19,384 | $ | 19,175 | $ | 18,921 | $ | 18,425 | $ | 18,176 | $ | 209 | $ | 1,208 | ||||||||||||||
| UNITED COMMUNITY BANKS, INC. | ||||||||||||
| Financial Highlights | ||||||||||||
| Credit Quality | ||||||||||||
| (in thousands) | ||||||||||||
| 2025 | ||||||||||||
| Fourth Quarter |
Third Quarter |
Second Quarter |
||||||||||
| NONACCRUAL LOANS | ||||||||||||
| Owner occupied RE | $ | 10,199 | $ | 10,275 | $ | 8,207 | ||||||
| Income producing RE | 11,488 | 10,884 | 14,624 | |||||||||
| Commercial & industrial | 18,294 | 25,754 | 15,422 | |||||||||
| Commercial construction and land | 984 | 3,198 | 1,368 | |||||||||
| Equipment financing | 10,383 | 9,716 | 11,731 | |||||||||
| Total commercial | 51,348 | 59,827 | 51,352 | |||||||||
| Residential mortgage | 32,423 | 28,978 | 22,597 | |||||||||
| Home equity | 5,247 | 5,234 | 4,093 | |||||||||
| Residential construction and land | 1,079 | 1,241 | 1,203 | |||||||||
| Consumer | 1,001 | 1,163 | 1,207 | |||||||||
| Total nonaccrual loans | 91,098 | 96,443 | 80,452 | |||||||||
| OREO and repossessed assets | 2,400 | 1,473 | 3,507 | |||||||||
| Total NPAs | $ | 93,498 | $ | 97,916 | $ | 83,959 | ||||||
| 2025 | ||||||||||||||||||||||||
| Fourth Quarter | Third Quarter | Second Quarter | ||||||||||||||||||||||
| (in thousands) | Net Charge- Offs |
Net Charge- Offs to Average Loans (1) |
Net Charge- Offs |
Net Charge- Offs to Average Loans (1) |
Net Charge- Offs |
Net Charge- Offs to Average Loans (1) |
||||||||||||||||||
| NET CHARGE-OFFS (RECOVERIES) BY CATEGORY | ||||||||||||||||||||||||
| Owner occupied RE | $ | 1,610 | 0.17 | % | $ | 2,497 | 0.28 | % | $ | 470 | 0.05 | % | ||||||||||||
| Income producing RE | (116 | ) | (0.01 | ) | (106 | ) | (0.01 | ) | 933 | 0.08 | ||||||||||||||
| Commercial & industrial | 7,557 | 1.15 | (1,132 | ) | (0.18 | ) | 1,027 | 0.16 | ||||||||||||||||
| Commercial construction and land | 1,484 | 0.35 | 491 | 0.11 | 89 | 0.02 | ||||||||||||||||||
| Equipment financing | 5,092 | 1.12 | 5,487 | 1.23 | 4,963 | 1.16 | ||||||||||||||||||
| Total commercial | 15,627 | 0.43 | 7,237 | 0.20 | 7,482 | 0.22 | ||||||||||||||||||
| Residential mortgage | 126 | 0.02 | (259 | ) | (0.03 | ) | 313 | 0.04 | ||||||||||||||||
| Home equity | (94 | ) | (0.03 | ) | 19 | 0.01 | (72 | ) | (0.03 | ) | ||||||||||||||
| Residential construction and land | 16 | 0.03 | 12 | 0.03 | (9 | ) | (0.02 | ) | ||||||||||||||||
| Consumer | 743 | 1.55 | 667 | 1.39 | 511 | 1.11 | ||||||||||||||||||
| Total | $ | 16,418 | 0.34 | $ | 7,676 | 0.16 | $ | 8,225 | 0.18 | |||||||||||||||
| (1) Annualized. |
UNITED COMMUNITY BANKS, INC.
Consolidated Balance Sheets (Unaudited)
(in thousands, except share and per share data)
| December 31, 2025 |
December 31, 2024 |
|||||||
| ASSETS | ||||||||
| Cash and due from banks | $ | 202,586 | $ | 296,161 | ||||
| Interest-bearing deposits in banks | 193,168 | 223,712 | ||||||
| Cash and cash equivalents | 395,754 | 519,873 | ||||||
| Debt securities available-for-sale | 3,750,863 | 4,436,291 | ||||||
| Debt securities held-to-maturity (fair value $1,918,426 and $1,944,126, respectively) | 2,237,356 | 2,368,107 | ||||||
| Loans held for sale | 39,381 | 57,534 | ||||||
| Loans and leases held for investment | 19,384,317 | 18,175,980 | ||||||
| Less allowance for credit losses - loans and leases | (210,429 | ) | (206,998 | ) | ||||
| Loans and leases, net | 19,173,888 | 17,968,982 | ||||||
| Premises and equipment, net | 393,714 | 394,264 | ||||||
| Bank owned life insurance | 364,184 | 346,234 | ||||||
| Accrued interest receivable | 83,557 | 85,616 | ||||||
| Net deferred tax asset | 75,861 | 96,982 | ||||||
| Derivative financial instruments | 35,313 | 46,883 | ||||||
| Goodwill and other intangible assets, net | 967,882 | 956,643 | ||||||
| Other assets | 484,801 | 442,849 | ||||||
| Total assets | $ | 28,002,554 | $ | 27,720,258 | ||||
| LIABILITIES AND SHAREHOLDERS’ EQUITY | ||||||||
| Liabilities: | ||||||||
| Deposits: | ||||||||
| Noninterest-bearing demand | $ | 6,252,252 | $ | 6,211,182 | ||||
| NOW and interest-bearing demand | 5,969,864 | 6,141,342 | ||||||
| Money market | 6,696,530 | 6,398,144 | ||||||
| Savings | 1,085,331 | 1,100,591 | ||||||
| Time | 3,619,189 | 3,441,424 | ||||||
| Brokered | 175,264 | 168,292 | ||||||
| Total deposits | 23,798,430 | 23,460,975 | ||||||
| Short-term borrowings | 85,000 | 195,000 | ||||||
| Long-term debt | 120,400 | 254,152 | ||||||
| Derivative financial instruments | 52,997 | 77,834 | ||||||
| Accrued expenses and other liabilities | 307,041 | 300,170 | ||||||
| Total liabilities | 24,363,868 | 24,288,131 | ||||||
| Shareholders' equity: | ||||||||
| Preferred stock, $1 par value: 10,000,000 shares authorized; 0 and 3,662 shares Series I issued and outstanding, respectively; $25,000 per share liquidation preference | — | 88,266 | ||||||
| Common stock, $1 par value; 200,000,000 shares authorized; 120,598,266 and 119,364,110 shares issued and outstanding, respectively | 120,598 | 119,364 | ||||||
| Capital surplus | 2,754,399 | 2,723,278 | ||||||
| Retained earnings | 914,261 | 714,138 | ||||||
| Accumulated other comprehensive loss | (150,572 | ) | (212,919 | ) | ||||
| Total shareholders’ equity | 3,638,686 | 3,432,127 | ||||||
| Total liabilities and shareholders’ equity | $ | 28,002,554 | $ | 27,720,258 | ||||
UNITED COMMUNITY BANKS, INC. |
Consolidated Statements of Income (Unaudited) |
(in thousands, except per share data) |
| Three Months Ended December 31, |
Twelve Months Ended December 31, |
|||||||||||||||
| 2025 | 2024 | 2025 | 2024 | |||||||||||||
| Interest revenue: | ||||||||||||||||
| Loans, including fees | $ | 293,008 | $ | 280,325 | $ | 1,153,277 | $ | 1,147,477 | ||||||||
| Investment securities, including tax exempt of $1,660, $1,701, $6,690 and $6,834 | 48,585 | 57,127 | 216,500 | 206,623 | ||||||||||||
| Deposits in banks and short-term investments | 4,774 | 7,510 | 13,162 | 23,641 | ||||||||||||
| Total interest revenue | 346,367 | 344,962 | 1,382,939 | 1,377,741 | ||||||||||||
| Interest expense: | ||||||||||||||||
| Deposits: | ||||||||||||||||
| NOW and interest-bearing demand | 31,871 | 42,012 | 141,267 | 175,534 | ||||||||||||
| Money market | 44,103 | 53,859 | 193,908 | 214,742 | ||||||||||||
| Savings | 486 | 652 | 3,208 | 2,717 | ||||||||||||
| Time | 30,747 | 34,601 | 125,369 | 142,526 | ||||||||||||
| Deposits | 107,207 | 131,124 | 463,752 | 535,519 | ||||||||||||
| Short-term borrowings | 18 | 44 | 1,233 | 131 | ||||||||||||
| Federal Home Loan Bank advances | — | — | 433 | — | ||||||||||||
| Long-term debt | 1,216 | 3,461 | 8,414 | 14,723 | ||||||||||||
| Total interest expense | 108,441 | 134,629 | 473,832 | 550,373 | ||||||||||||
| Net interest revenue | 237,926 | 210,333 | 909,107 | 827,368 | ||||||||||||
| Noninterest income: | ||||||||||||||||
| Service charges and fees | 10,674 | 10,622 | 41,731 | 40,994 | ||||||||||||
| Mortgage loan gains and related fees | 6,483 | 9,737 | 25,073 | 27,567 | ||||||||||||
| Wealth management fees | 5,248 | 4,658 | 18,870 | 23,695 | ||||||||||||
| Net (losses) gains from sale of other loans | 2,147 | 1,583 | 7,923 | (21,284 | ) | |||||||||||
| Other lending and loan servicing fees | 4,322 | 3,346 | 16,412 | 14,396 | ||||||||||||
| Securities gains (losses), net | 11 | (3,316 | ) | 352 | (3,316 | ) | ||||||||||
| Other | 11,577 | 13,892 | 43,684 | 42,704 | ||||||||||||
| Total noninterest income | 40,462 | 40,522 | 154,045 | 124,756 | ||||||||||||
| Total revenue | 278,388 | 250,855 | 1,063,152 | 952,124 | ||||||||||||
| Provision for credit losses | 13,662 | 11,389 | 48,806 | 50,951 | ||||||||||||
| Noninterest expenses: | ||||||||||||||||
| Salaries and employee benefits | 92,520 | 85,707 | 354,451 | 340,043 | ||||||||||||
| Occupancy | 11,602 | 10,840 | 44,968 | 44,306 | ||||||||||||
| Communications and equipment | 14,276 | 12,715 | 55,244 | 49,249 | ||||||||||||
| FDIC assessments and other regulatory charges | 4,754 | 3,942 | 18,987 | 20,978 | ||||||||||||
| Professional fees | 6,773 | 6,268 | 24,595 | 24,732 | ||||||||||||
| Lending and loan servicing expense | 2,014 | 2,311 | 8,759 | 8,379 | ||||||||||||
| Outside services - electronic banking | 3,565 | 3,540 | 13,441 | 13,703 | ||||||||||||
| Postage, printing and supplies | 2,859 | 2,491 | 10,650 | 9,867 | ||||||||||||
| Advertising and public relations | 2,790 | 2,145 | 9,605 | 8,546 | ||||||||||||
| Amortization of intangibles | 3,188 | 3,387 | 13,079 | 14,596 | ||||||||||||
| Merger-related and other charges | 606 | 2,203 | 10,204 | 8,623 | ||||||||||||
| Other | 7,101 | 7,507 | 27,951 | 35,145 | ||||||||||||
| Total noninterest expenses | 152,048 | 143,056 | 591,934 | 578,167 | ||||||||||||
| Net income before income taxes | 112,678 | 96,410 | 422,412 | 323,006 | ||||||||||||
| Income tax expense | 26,223 | 20,606 | 94,317 | 70,609 | ||||||||||||
| Net income | $ | 86,455 | $ | 75,804 | $ | 328,095 | $ | 252,397 | ||||||||
| Preferred stock dividends and deemed dividend at redemption | — | 1,574 | 7,994 | 6,293 | ||||||||||||
| Earnings allocated to participating securities | 565 | 503 | 1,918 | 1,478 | ||||||||||||
| Net income available to common shareholders | $ | 85,890 | $ | 73,727 | $ | 318,183 | $ | 244,626 | ||||||||
| Net income per common share: | ||||||||||||||||
| Basic | $ | 0.71 | $ | 0.61 | $ | 2.62 | $ | 2.04 | ||||||||
| Diluted | 0.70 | 0.61 | 2.62 | 2.04 | ||||||||||||
| Weighted average common shares outstanding: | ||||||||||||||||
| Basic | 121,672 | 119,924 | 121,309 | 119,783 | ||||||||||||
| Diluted | 121,831 | 120,111 | 121,437 | 119,900 | ||||||||||||
| Average Consolidated Balance Sheets and Net Interest Analysis |
| For the Three Months Ended December 31, |
| (dollars in thousands, fully taxable equivalent (FTE)) |
| 2025 | 2024 | |||||||||||||||||||||||
| Average Balance |
Interest | Average Rate |
Average Balance |
Interest | Average Rate |
|||||||||||||||||||
| Assets: | ||||||||||||||||||||||||
| Interest-earning assets: | ||||||||||||||||||||||||
| Loans, net of unearned income (FTE) (1)(2) | $ | 19,203,306 | $ | 292,907 | 6.05 | % | $ | 17,934,730 | $ | 279,938 | 6.21 | % | ||||||||||||
| Taxable securities (3) | 5,979,298 | 46,925 | 3.14 | 6,722,655 | 55,426 | 3.30 | ||||||||||||||||||
| Tax-exempt securities (FTE) (1)(3) | 349,292 | 2,221 | 2.54 | 359,569 | 2,276 | 2.53 | ||||||||||||||||||
| Federal funds sold and other interest-earning assets | 657,723 | 5,413 | 3.27 | 812,962 | 8,396 | 4.11 | ||||||||||||||||||
| Total interest-earning assets (FTE) | 26,189,619 | 347,466 | 5.27 | 25,829,916 | 346,036 | 5.33 | ||||||||||||||||||
| Noninterest-earning assets: | ||||||||||||||||||||||||
| Allowance for loan losses | (217,185 | ) | (208,788 | ) | ||||||||||||||||||||
| Cash and due from banks | 205,643 | 228,601 | ||||||||||||||||||||||
| Premises and equipment | 395,523 | 398,794 | ||||||||||||||||||||||
| Other assets (3) | 1,743,478 | 1,606,297 | ||||||||||||||||||||||
| Total assets | $ | 28,317,078 | $ | 27,854,820 | ||||||||||||||||||||
| Liabilities and Shareholders’ Equity: | ||||||||||||||||||||||||
| Interest-bearing liabilities: | ||||||||||||||||||||||||
| Interest-bearing deposits: | ||||||||||||||||||||||||
| NOW and interest-bearing demand | $ | 6,086,189 | 31,871 | 2.08 | $ | 6,313,325 | 42,012 | 2.65 | ||||||||||||||||
| Money market | 6,957,989 | 44,103 | 2.51 | 6,474,284 | 53,859 | 3.31 | ||||||||||||||||||
| Savings | 1,084,178 | 486 | 0.18 | 1,105,572 | 652 | 0.23 | ||||||||||||||||||
| Time | 3,653,500 | 30,272 | 3.29 | 3,472,161 | 34,030 | 3.90 | ||||||||||||||||||
| Brokered time deposits | 50,571 | 475 | 3.73 | 50,406 | 571 | 4.51 | ||||||||||||||||||
| Total interest-bearing deposits | 17,832,427 | 107,207 | 2.39 | 17,415,748 | 131,124 | 3.00 | ||||||||||||||||||
| Federal funds purchased and other borrowings | 1,413 | 18 | 5.05 | 3,859 | 44 | 4.54 | ||||||||||||||||||
| Long-term debt | 137,067 | 1,216 | 3.52 | 303,523 | 3,461 | 4.54 | ||||||||||||||||||
| Total borrowed funds | 138,480 | 1,234 | 3.54 | 307,382 | 3,505 | 4.54 | ||||||||||||||||||
| Total interest-bearing liabilities | 17,970,907 | 108,441 | 2.39 | 17,723,130 | 134,629 | 3.02 | ||||||||||||||||||
| Noninterest-bearing liabilities: | ||||||||||||||||||||||||
| Noninterest-bearing deposits | 6,393,693 | 6,275,493 | ||||||||||||||||||||||
| Other liabilities | 332,836 | 454,891 | ||||||||||||||||||||||
| Total liabilities | 24,697,436 | 24,453,514 | ||||||||||||||||||||||
| Shareholders’ equity | 3,619,642 | 3,401,306 | ||||||||||||||||||||||
| Total liabilities and shareholders’ equity | $ | 28,317,078 | $ | 27,854,820 | ||||||||||||||||||||
| Net interest revenue (FTE) | $ | 239,025 | $ | 211,407 | ||||||||||||||||||||
| Net interest-rate spread (FTE) | 2.88 | % | 2.31 | % | ||||||||||||||||||||
| Net interest margin (FTE) (4) | 3.62 | % | 3.26 | % | ||||||||||||||||||||
| (1) | Interest revenue on tax-exempt securities and loans includes a taxable-equivalent adjustment to reflect comparable interest on taxable securities and loans. The FTE adjustment totaled $1.10 million and $1.07 million, respectively, for the three months ended December 31, 2025 and 2024. The tax rate used to calculate the adjustment was 25%, reflecting the statutory federal income tax rate and the federal tax adjusted state income tax rate. |
| (2) | Included in the average balance of loans outstanding are loans on which the accrual of interest has been discontinued and loans that are held for sale. |
| (3) | Unrealized gains and losses on AFS securities, including those related to the transfer from AFS to HTM, have been reclassified to other assets. Pretax unrealized losses of $195 million in 2025 and $261 million in 2024 are included in other assets for purposes of this presentation. |
| (4) | Net interest margin is taxable equivalent net interest revenue divided by average interest-earning assets. |
| Average Consolidated Balance Sheets and Net Interest Analysis |
| For the Twelve Months Ended December 31, |
| (dollars in thousands, fully taxable equivalent (FTE)) |
| 2025 | 2024 | |||||||||||||||||||||||
| Average Balance |
Interest | Average Rate |
Average Balance |
Interest | Average Rate |
|||||||||||||||||||
| Assets: | ||||||||||||||||||||||||
| Interest-earning assets: | ||||||||||||||||||||||||
| Loans, net of unearned income (FTE) (1)(2) | $ | 18,776,288 | $ | 1,152,585 | 6.14 | % | $ | 18,124,179 | $ | 1,146,440 | 6.33 | % | ||||||||||||
| Taxable securities (3) | 6,354,276 | 209,810 | 3.30 | 6,172,942 | 199,789 | 3.24 | ||||||||||||||||||
| Tax-exempt securities (FTE) (1)(3) | 352,899 | 8,951 | 2.54 | 362,655 | 9,152 | 2.52 | ||||||||||||||||||
| Federal funds sold and other interest-earning assets | 481,507 | 15,701 | 3.26 | 623,426 | 26,652 | 4.28 | ||||||||||||||||||
| Total interest-earning assets (FTE) | 25,964,970 | 1,387,047 | 5.34 | 25,283,202 | 1,382,033 | 5.47 | ||||||||||||||||||
| Non-interest-earning assets: | ||||||||||||||||||||||||
| Allowance for loan losses | (217,084 | ) | (212,968 | ) | ||||||||||||||||||||
| Cash and due from banks | 208,922 | 215,411 | ||||||||||||||||||||||
| Premises and equipment | 396,923 | 394,127 | ||||||||||||||||||||||
| Other assets (3) | 1,664,206 | 1,611,405 | ||||||||||||||||||||||
| Total assets | $ | 28,017,937 | $ | 27,291,177 | ||||||||||||||||||||
| Liabilities and Shareholders’ Equity: | ||||||||||||||||||||||||
| Interest-bearing liabilities: | ||||||||||||||||||||||||
| Interest-bearing deposits: | ||||||||||||||||||||||||
| NOW and interest-bearing demand | $ | 6,023,746 | 141,267 | 2.35 | $ | 6,014,052 | 175,534 | 2.92 | ||||||||||||||||
| Money market | 6,775,187 | 193,908 | 2.86 | 6,188,579 | 214,742 | 3.47 | ||||||||||||||||||
| Savings | 1,120,753 | 3,208 | 0.29 | 1,146,305 | 2,717 | 0.24 | ||||||||||||||||||
| Time | 3,572,941 | 123,301 | 3.45 | 3,519,461 | 140,229 | 3.98 | ||||||||||||||||||
| Brokered time deposits | 50,509 | 2,068 | 4.09 | 50,359 | 2,297 | 4.56 | ||||||||||||||||||
| Total interest-bearing deposits | 17,543,136 | 463,752 | 2.64 | 16,918,756 | 535,519 | 3.17 | ||||||||||||||||||
| Federal funds purchased and other borrowings | 22,693 | 1,233 | 5.43 | 2,468 | 131 | 5.31 | ||||||||||||||||||
| Federal Home Loan Bank advances | 9,592 | 433 | 4.51 | 4 | — | — | ||||||||||||||||||
| Long-term debt | 195,686 | 8,414 | 4.30 | 319,163 | 14,723 | 4.61 | ||||||||||||||||||
| Total borrowed funds | 227,971 | 10,080 | 4.42 | 321,635 | 14,854 | 4.62 | ||||||||||||||||||
| Total interest-bearing liabilities | 17,771,107 | 473,832 | 2.67 | 17,240,391 | 550,373 | 3.19 | ||||||||||||||||||
| Noninterest-bearing liabilities: | ||||||||||||||||||||||||
| Noninterest-bearing deposits | 6,327,200 | 6,299,019 | ||||||||||||||||||||||
| Other liabilities | 345,832 | 409,547 | ||||||||||||||||||||||
| Total liabilities | 24,444,139 | 23,948,957 | ||||||||||||||||||||||
| Shareholders’ equity | 3,573,798 | 3,342,220 | ||||||||||||||||||||||
| Total liabilities and shareholders’ equity | $ | 28,017,937 | $ | 27,291,177 | ||||||||||||||||||||
| Net interest revenue (FTE) | $ | 913,215 | $ | 831,660 | ||||||||||||||||||||
| Net interest-rate spread (FTE) | 2.68 | % | 2.27 | % | ||||||||||||||||||||
| Net interest margin (FTE) (4) | 3.52 | % | 3.29 | % | ||||||||||||||||||||
| (1) | Interest revenue on tax-exempt securities and loans includes a taxable-equivalent adjustment to reflect comparable interest on taxable securities and loans. The FTE adjustment totaled $4.11 million and $4.29 million, respectively, for 2025 and 2024. The tax rate used to calculate the adjustment was 25%, reflecting the statutory federal income tax rate and the federal tax adjusted state income tax rate. |
| (2) | Included in the average balance of loans outstanding are loans on which the accrual of interest has been discontinued and loans that are held for sale. |
| (3) | Unrealized gains and losses on AFS securities, including those related to the transfer from AFS to HTM, have been reclassified to other assets. Pretax unrealized losses of $232 million in 2025 and $306 million in 2024 are included in other assets for purposes of this presentation. |
| (4) | Net interest margin is taxable equivalent net-interest revenue divided by average interest-earning assets. |
| UNITED
COMMUNITY BANKS, INC. Non-GAAP Performance Measures Reconciliation Selected Financial Information (in thousands, except per share data) |
||||||||||||||||||||||||||||
| 2025 | 2024 | Twelve
Months Ended December 31, |
||||||||||||||||||||||||||
| Fourth
Quarter |
Third
Quarter |
Second
Quarter |
First
Quarter |
Fourth
Quarter |
2025 | 2024 | ||||||||||||||||||||||
| Noninterest income reconciliation | ||||||||||||||||||||||||||||
| Noninterest income (GAAP) | $ | 40,462 | $ | 43,219 | $ | 34,708 | $ | 35,656 | $ | 40,522 | $ | 154,045 | $ | 124,756 | ||||||||||||||
| Loss on sale of manufactured housing loans | — | — | — | — | — | — | 27,209 | |||||||||||||||||||||
| Gain on lease termination | — | — | — | — | — | — | (2,400 | ) | ||||||||||||||||||||
| Noninterest income - operating | $ | 40,462 | $ | 43,219 | $ | 34,708 | $ | 35,656 | $ | 40,522 | $ | 154,045 | $ | 149,565 | ||||||||||||||
| Noninterest expense reconciliation | ||||||||||||||||||||||||||||
| Noninterest expenses (GAAP) | $ | 152,048 | $ | 150,868 | $ | 147,919 | $ | 141,099 | $ | 143,056 | $ | 591,934 | $ | 578,167 | ||||||||||||||
| Loss on sale of FinTrust, including goodwill impairment | — | — | — | — | — | — | (5,100 | ) | ||||||||||||||||||||
| FDIC special assessment | — | — | — | — | — | — | (1,736 | ) | ||||||||||||||||||||
| Merger-related and other charges | (606 | ) | (3,468 | ) | (4,833 | ) | (1,297 | ) | (2,203 | ) | (10,204 | ) | (8,623 | ) | ||||||||||||||
| Noninterest expenses - operating | $ | 151,442 | $ | 147,400 | $ | 143,086 | $ | 139,802 | $ | 140,853 | $ | 581,730 | $ | 562,708 | ||||||||||||||
| Net income to operating income reconciliation | ||||||||||||||||||||||||||||
| Net income (GAAP) | $ | 86,455 | $ | 91,494 | $ | 78,733 | $ | 71,413 | $ | 75,804 | $ | 328,095 | $ | 252,397 | ||||||||||||||
| Loss on sale of manufactured housing loans | — | — | — | — | — | — | 27,209 | |||||||||||||||||||||
| Gain on lease termination | — | — | — | — | — | — | (2,400 | ) | ||||||||||||||||||||
| Loss on sale of FinTrust, including goodwill impairment | — | — | — | — | — | — | 5,100 | |||||||||||||||||||||
| FDIC special assessment | — | — | — | — | — | — | 1,736 | |||||||||||||||||||||
| Merger-related and other charges | 606 | 3,468 | 4,833 | 1,297 | 2,203 | 10,204 | 8,623 | |||||||||||||||||||||
| Income tax benefit of non-operating items | (133 | ) | (751 | ) | (1,047 | ) | (281 | ) | (471 | ) | (2,212 | ) | (8,702 | ) | ||||||||||||||
| Net income - operating | $ | 86,928 | $ | 94,211 | $ | 82,519 | $ | 72,429 | $ | 77,536 | $ | 336,087 | $ | 283,963 | ||||||||||||||
| Net income to pre-tax pre-provision income reconciliation | ||||||||||||||||||||||||||||
| Net income (GAAP) | $ | 86,455 | $ | 91,494 | $ | 78,733 | $ | 71,413 | $ | 75,804 | $ | 328,095 | $ | 252,397 | ||||||||||||||
| Income tax expense | 26,223 | 26,579 | 21,769 | 19,746 | 20,606 | 94,317 | 70,609 | |||||||||||||||||||||
| Provision for credit losses | 13,662 | 7,907 | 11,818 | 15,419 | 11,389 | 48,806 | 50,951 | |||||||||||||||||||||
| Pre-tax pre-provision income | $ | 126,340 | $ | 125,980 | $ | 112,320 | $ | 106,578 | $ | 107,799 | $ | 471,218 | $ | 373,957 | ||||||||||||||
| Diluted income per common share reconciliation | ||||||||||||||||||||||||||||
| Diluted income per common share (GAAP) | $ | 0.70 | $ | 0.70 | $ | 0.63 | $ | 0.58 | $ | 0.61 | $ | 2.62 | $ | 2.04 | ||||||||||||||
| Loss on sale of manufactured housing loans | — | — | — | — | — | — | 0.18 | |||||||||||||||||||||
| Gain on lease termination | — | — | — | — | — | — | (0.02 | ) | ||||||||||||||||||||
| Loss on sale of FinTrust, including goodwill impairment | — | — | — | — | — | — | 0.03 | |||||||||||||||||||||
| FDIC special assessment | — | — | — | — | — | — | 0.01 | |||||||||||||||||||||
| Merger-related and other charges | 0.01 | 0.02 | 0.03 | 0.01 | 0.02 | 0.06 | 0.06 | |||||||||||||||||||||
| Deemed dividend on preferred stock redemption | — | 0.03 | — | — | — | 0.03 | — | |||||||||||||||||||||
| Diluted income per common share - operating | $ | 0.71 | $ | 0.75 | $ | 0.66 | $ | 0.59 | $ | 0.63 | $ | 2.71 | $ | 2.30 | ||||||||||||||
| Book value per common share reconciliation | ||||||||||||||||||||||||||||
| Book value per common share (GAAP) | $ | 30.17 | $ | 29.44 | $ | 28.89 | $ | 28.42 | $ | 27.87 | $ | 30.17 | $ | 27.87 | ||||||||||||||
| Effect of goodwill and other intangibles | (7.93 | ) | (7.85 | ) | (7.89 | ) | (7.84 | ) | (7.87 | ) | (7.93 | ) | (7.87 | ) | ||||||||||||||
| Tangible book value per common share | $ | 22.24 | $ | 21.59 | $ | 21.00 | $ | 20.58 | $ | 20.00 | $ | 22.24 | $ | 20.00 | ||||||||||||||
| Return on tangible common equity reconciliation | ||||||||||||||||||||||||||||
| Return on common equity (GAAP) | 9.48 | % | 9.20 | % | 8.45 | % | 7.89 | % | 8.40 | % | 9.12 | % | 7.07 | % | ||||||||||||||
| Loss on sale of manufactured housing loans | — | — | — | — | — | — | 0.61 | |||||||||||||||||||||
| Gain on lease termination | — | — | — | — | — | — | (0.05 | ) | ||||||||||||||||||||
| Loss on sale of FinTrust, including goodwill impairment | — | — | — | — | — | — | 0.11 | |||||||||||||||||||||
| FDIC special assessment | — | — | — | — | — | — | 0.04 | |||||||||||||||||||||
| Merger-related and other charges | 0.05 | 0.29 | 0.42 | 0.12 | 0.20 | 0.23 | 0.19 | |||||||||||||||||||||
| Deemed dividend on preferred stock redemption | — | 0.34 | — | — | — | 0.09 | — | |||||||||||||||||||||
| Return on common equity - operating | 9.53 | 9.83 | 8.87 | 8.01 | 8.60 | 9.44 | 7.97 | |||||||||||||||||||||
| Effect of goodwill and other intangibles | 3.78 | 3.73 | 3.47 | 3.20 | 3.52 | 3.90 | 3.45 | |||||||||||||||||||||
| Return on tangible common equity - operating | 13.31 | % | 13.56 | % | 12.34 | % | 11.21 | % | 12.12 | % | 13.34 | % | 11.42 | % | ||||||||||||||
| UNITED
COMMUNITY BANKS, INC. Non-GAAP Performance Measures Reconciliation Selected Financial Information (in thousands, except per share data) |
||||||||||||||||||||||||||||
| 2025 | 2024 | Twelve
Months Ended December 31, |
||||||||||||||||||||||||||
| Fourth
Quarter |
Third
Quarter |
Second
Quarter |
First
Quarter |
Fourth
Quarter |
2025 | 2024 | ||||||||||||||||||||||
| Return on assets reconciliation | ||||||||||||||||||||||||||||
| Return on assets (GAAP) | 1.21 | % | 1.29 | % | 1.11 | % | 1.02 | % | 1.06 | % | 1.17 | % | 0.90 | % | ||||||||||||||
| Loss on sale of manufactured housing loans | — | — | — | — | — | — | 0.08 | |||||||||||||||||||||
| Gain on lease termination | — | — | — | — | — | — | (0.01 | ) | ||||||||||||||||||||
| Loss on sale of FinTrust, including goodwill impairment | — | — | — | — | — | — | 0.02 | |||||||||||||||||||||
| FDIC special assessment | — | — | — | — | — | — | 0.01 | |||||||||||||||||||||
| Merger-related and other charges | 0.01 | 0.04 | 0.05 | 0.02 | 0.02 | 0.03 | 0.02 | |||||||||||||||||||||
| Return on assets - operating | 1.22 | % | 1.33 | % | 1.16 | % | 1.04 | % | 1.08 | % | 1.20 | % | 1.02 | % | ||||||||||||||
| Return on assets to return on assets- pre-tax pre-provision reconciliation | ||||||||||||||||||||||||||||
| Return on assets (GAAP) | 1.21 | % | 1.29 | % | 1.11 | % | 1.02 | % | 1.06 | % | 1.17 | % | 0.90 | % | ||||||||||||||
| Income tax expense | 0.37 | 0.38 | 0.31 | 0.29 | 0.30 | 0.34 | 0.26 | |||||||||||||||||||||
| Provision for credit losses | 0.19 | 0.11 | 0.17 | 0.23 | 0.16 | 0.17 | 0.19 | |||||||||||||||||||||
| Loss on sale of manufactured housing loans | — | — | — | — | — | — | 0.09 | |||||||||||||||||||||
| Gain on lease termination | — | — | — | — | — | — | (0.01 | ) | ||||||||||||||||||||
| Loss on sale of FinTrust, including goodwill impairment | — | — | — | — | — | — | 0.02 | |||||||||||||||||||||
| FDIC special assessment | — | — | — | — | — | — | 0.01 | |||||||||||||||||||||
| Merger-related and other charges | 0.01 | 0.05 | 0.07 | 0.01 | 0.03 | 0.04 | 0.03 | |||||||||||||||||||||
| Return on assets - pre-tax pre-provision, excluding non-operating items | 1.78 | % | 1.83 | % | 1.66 | % | 1.55 | % | 1.55 | % | 1.72 | % | 1.49 | % | ||||||||||||||
| Efficiency ratio reconciliation | ||||||||||||||||||||||||||||
| Efficiency ratio (GAAP) | 54.40 | % | 54.30 | % | 56.69 | % | 56.74 | % | 56.05 | % | 55.46 | % | 60.24 | % | ||||||||||||||
| Loss on sale of manufactured housing loans | — | — | — | — | — | — | (1.63 | ) | ||||||||||||||||||||
| Gain on lease termination | — | — | — | — | — | — | 0.15 | |||||||||||||||||||||
| Loss on sale of FinTrust, including goodwill impairment | — | — | — | — | — | — | (0.53 | ) | ||||||||||||||||||||
| FDIC special assessment | — | — | — | — | — | — | (0.18 | ) | ||||||||||||||||||||
| Merger-related and other charges | (0.21 | ) | (1.25 | ) | (1.85 | ) | (0.52 | ) | (0.87 | ) | (0.95 | ) | (0.90 | ) | ||||||||||||||
| Efficiency ratio - operating | 54.19 | % | 53.05 | % | 54.84 | % | 56.22 | % | 55.18 | % | 54.51 | % | 57.15 | % | ||||||||||||||
| Tangible common equity to tangible assets reconciliation | ||||||||||||||||||||||||||||
| Equity to total assets (GAAP) | 12.99 | % | 12.78 | % | 12.86 | % | 12.56 | % | 12.38 | % | 12.99 | % | 12.38 | % | ||||||||||||||
| Effect of goodwill and other intangibles | (3.07 | ) | (3.07 | ) | (3.10 | ) | (3.06 | ) | (3.09 | ) | (3.07 | ) | (3.09 | ) | ||||||||||||||
| Effect of preferred equity | — | — | (0.31 | ) | (0.32 | ) | (0.32 | ) | — | (0.32 | ) | |||||||||||||||||
| Tangible common equity to tangible assets | 9.92 | % | 9.71 | % | 9.45 | % | 9.18 | % | 8.97 | % | 9.92 | % | 8.97 | % | ||||||||||||||
About United Community Banks, Inc.
United Community Banks, Inc. (NYSE: UCB) is the financial holding company for United Community, a top 100 U.S. financial institution committed to building stronger communities and improving the financial health and well-being of its customers. United Community offers a full range of banking, mortgage and wealth management services. As of December 31, 2025, United Community Banks, Inc. had $28.0 billion in assets and operated 199 offices across Alabama, Florida, Georgia, North Carolina, South Carolina and Tennessee. The company also manages a nationally recognized SBA lending franchise and a national equipment finance subsidiary, extending its reach to businesses across the country. United Community is an 11-time winner of J.D. Power’s award for highest customer satisfaction among consumer banks in the Southeast and was named the most trusted bank in the region in 2025. United Community has also been recognized eight consecutive years by American Banker as one of the “Best Banks to Work For.” In commercial banking, United Community earned five 2025 Greenwich Best Brand awards, including national honors for middle market satisfaction. Forbes has consistently named United Community among the World’s Best and America’s Best Banks. Learn more at ucbi.com.
Non-GAAP Financial Measures
This press release, including the accompanying financial statement tables, contains financial information determined by methods other than in accordance with generally accepted accounting principles, or GAAP. This financial information includes certain operating performance measures, which exclude merger-related and other charges that are not considered part of recurring operations, such as “noninterest income – operating”, “noninterest expense - operating”, “operating net income,” “pre-tax, pre-provision income,” “operating net income per diluted common share,” “operating earnings per share,” “tangible book value per common share,” “operating return on common equity,” “operating return on tangible common equity,” “operating return on assets,” “return on assets - pre-tax, pre-provision - operating,” “return on assets - pre-tax, pre-provision,” “operating efficiency ratio,” and “tangible common equity to tangible assets.” These non-GAAP measures are included because United believes they may provide useful supplemental information for evaluating United’s underlying performance trends. These measures should be viewed in addition to, and not as an alternative to or substitute for, measures determined in accordance with GAAP, and are not necessarily comparable to non-GAAP measures that may be presented by other companies. To the extent applicable, reconciliations of these non-GAAP measures to the most directly comparable measures as reported in accordance with GAAP are included with the accompanying financial statement tables.
Caution About Forward-Looking Statements
This press release contains “forward-looking statements” within the meaning of Section 27A of the Securities Act of 1933, as amended, and Section 21E of the Securities Exchange Act of 1934, as amended. In general, forward-looking statements usually may be identified through use of words such as “may,” “believe,” “expect,” “anticipate,” “intend,” “will,” “should,” “plan,” “estimate,” “predict,” “continue” and “potential,” or the negative of these terms or other comparable terminology. Forward-looking statements are not historical facts and represent management’s beliefs, based upon information available at the time the statements are made, with regard to the matters addressed; they are not guarantees of future performance. Actual results may prove to be materially different from the results expressed or implied by the forward-looking statements. Forward-looking statements are subject to numerous assumptions, risks and uncertainties that change over time and could cause actual results or financial condition to differ materially from those expressed in or implied by such statements.
Factors that could cause or contribute to such differences include, but are not limited to general competitive, economic, political, regulatory and market conditions. Further information regarding additional factors which could affect the forward-looking statements contained in this press release can be found in the cautionary language included under the headings “Cautionary Note Regarding Forward-Looking Statements” and “Risk Factors” in United’s Annual Report on Form 10-K for the year ended December 31, 2024, and other documents subsequently filed by United with the United States Securities and Exchange Commission (“SEC”).
Many of these factors are beyond United’s ability to control or predict. If one or more events related to these or other risks or uncertainties materialize, or if the underlying assumptions prove to be incorrect, actual results may differ materially from the forward-looking statements. Accordingly, shareholders and investors should not place undue reliance on any such forward-looking statements. Any forward-looking statement speaks only as of the date of this communication, and United undertakes no obligation to update or revise any forward-looking statements, whether as a result of new information, future events or otherwise, except as required by law. New risks and uncertainties may emerge from time to time, and it is not possible for United to predict their occurrence or how they will affect United.
United qualifies all forward-looking statements by these cautionary statements.
# # #
Exhibit 99.2


8QLWHG&RPPXQLW\%DQN_ XFELFRP 4Q25 Investor Presentation -DQXDU\ 'LVFORVXUHV 2 CAUTIONARY STATEMENT This Investor Presentation contains “forward - looking statements” within the meaning of Section 27 A of the Securities Act of 1933 , as amended, and Section 21 E of the Securities Exchange Act of 1934 , as amended . In general, forward - looking statements usually may be identified through use of words such as “may,” “believe,” “expect,” “anticipate,” “intend,” “will,” “should,” “plan,” “estimate,” “predict,” “continue” and “potential,” or the negative of these terms or other comparable terminology . Forward - looking statements are not historical facts and represent management’s beliefs, based upon information available at the time the statements are made, with regard to the matters addressed; they are not guarantees of future performance . Actual results may prove to be materially different from the results expressed or implied by the forward - looking statements . Forward - looking statements are subject to numerous assumptions, risks and uncertainties that change over time and could cause actual results or financial condition to differ materially from those expressed in or implied by such statements . Factors that could cause or contribute to such differences include, but are not limited to general competitive, economic, political, regulatory and market conditions . Further information regarding additional factors which could affect the forward - looking statements contained in this Investor Presentation can be found in the cautionary language included under the headings “Cautionary Note Regarding Forward - Looking Statements” and “Risk Factors” in United’s Annual Report on Form 10 - K for the year ended December 31 , 2024 , and other documents subsequently filed by United with the United States Securities and Exchange Commission (“SEC”) . Many of these factors are beyond United’s ability to control or predict . If one or more events related to these or other risks or uncertainties materialize, or if the underlying assumptions prove to be incorrect, actual results may differ materially from the forward - looking statements . Accordingly, shareholders and investors should not place undue reliance on any such forward - looking statements . Any forward - looking statement speaks only as of the date of this communication, and United undertakes no obligation to update or revise any forward - looking statements, whether as a result of new information, future events or otherwise, except as required by law . New risks and uncertainties may emerge from time to time, and it is not possible for United to predict their occurrence or how they will affect United . United qualifies all forward - looking statements by these cautionary statements . 121 *$$3 0($685(6 7KLV ,QYHVWRU 3UHVHQWDWLRQ LQFOXGHV ILQDQFLDO LQIRUPDWLRQ GHWHUPLQHG E\ PHWKRGV RWKHU WKDQ LQ DFFRUGDQFH ZLWK JHQHUDOO\ DFFHSWHG DFFRXQWLQJ SULQFLSOHV *$$3 7KLV ILQDQFLDO LQIRUPDWLRQ LQFOXGHV FHUWDLQ RSHUDWLQJ SHUIRUPDQFH PHDVXUHV ZKLFK H[FOXGH PHUJHU UHODWHG DQG RWKHU FKDUJHV WKDW DUH QRW FRQVLGHUHG SDUW RI UHFXUULQJ RSHUDWLRQV VXFK DV QRQLQWHUHVW LQFRPH RSHUDWLQJ QRQLQWHUHVW H[SHQVH RSHUDWLQJ RSHUDWLQJ QHW LQFRPH SUH WD[ SUH SURYLVLRQ LQFRPH RSHUDWLQJ QHW LQFRPH SHU GLOXWHG FRPPRQ VKDUH RSHUDWLQJ HDUQLQJV SHU VKDUH WDQJLEOH ERRN YDOXH SHU FRPPRQ VKDUH RSHUDWLQJ UHWXUQ RQ FRPPRQ HTXLW\ RSHUDWLQJ UHWXUQ RQ WDQJLEOH FRPPRQ HTXLW\ RSHUDWLQJ UHWXUQ RQ DVVHWV UHWXUQ RQ DVVHWV SUH WD[ SUH SURYLVLRQ RSHUDWLQJ UHWXUQ RQ DVVHWV SUH WD[ SUH SURYLVLRQ RSHUDWLQJ HIILFLHQF\ UDWLR DQG WDQJLEOH FRPPRQ HTXLW\ WR WDQJLEOH DVVHWV 7KHVH QRQ *$$3 PHDVXUHV DUH LQFOXGHG EHFDXVH 8QLWHG EHOLHYHV WKH\ PD\ SURYLGH XVHIXO VXSSOHPHQWDO LQIRUPDWLRQ IRU HYDOXDWLQJ 8QLWHG ¶ V XQGHUO\LQJ SHUIRUPDQFH WUHQGV )XUWKHU 8QLWHG ¶ V PDQDJHPHQW XVHV WKHVH PHDVXUHV LQ PDQDJLQJ DQG HYDOXDWLQJ 8QLWHG ¶ V EXVLQHVV DQG LQWHQGV WR UHIHU WR WKHP LQ GLVFXVVLRQV DERXW 8QLWHG ¶ V RSHUDWLRQV DQG SHUIRUPDQFH 7KHVH PHDVXUHV VKRXOG EH YLHZHG LQ DGGLWLRQ WR DQG QRW DV DQ DOWHUQDWLYH WR RU VXEVWLWXWH IRU PHDVXUHV GHWHUPLQHG LQ DFFRUGDQFH ZLWK *$$3 DQG DUH QRW QHFHVVDULO\ FRPSDUDEOH WR QRQ *$$3 PHDVXUHV WKDW PD\ EH SUHVHQWHG E\ RWKHU FRPSDQLHV 7R WKH H[WHQW DSSOLFDEOH UHFRQFLOLDWLRQV RI WKHVH QRQ *$$3 PHDVXUHV WR WKH PRVW GLUHFWO\ FRPSDUDEOH PHDVXUHV DV UHSRUWHG LQ DFFRUGDQFH ZLWK *$$3 DUH LQFOXGHG ZLWK WKH DFFRPSDQ\LQJ ILQDQFLDO VWDWHPHQW WDEOHV %,//,21,1 727$/ $66(76 United Community Banks, Inc. Note: See Glossary located at the end of this presentation for reference on certain acronyms (1) 4Q25 regulatory capital ratio is preliminary 8&%,%DQNLQJ2IILFHV Regional Full - Service Branch Network National Navitas and SBA Markets Company Overview %,//,21,1 727$/ '(326,76 %,//,21,1 $80 13.4% CET1 RBC (1) $19.4 BILLION IN TOTAL LOANS 48$57(5/< &20021 ',9,'(1' %$1.,1*2)),&(6 $&52667+( 6287+($67 #1 IN CUSTOMER SATISFACTION with Consumer Banking in the Southeast in 2025 Plus #1 in Trust and People - J.D. Power BEST BANK AWARDS 5 awards for outstanding performance in small business and middle market banking in 2025 - Coalition Greenwich %(67%$1.672:25.)25 LQ IRUWKHQLQWKFRQVHFXWLYH\HDU $PHULFDQ%DQNHU 3UHPLHU6RXWKHDVW5HJLRQDO%DQN &HOHEUDWLQJ <HDUVRI([FHSWLRQDO6HUYLFH Metro - focused branch network with locations in the fastest - growing MSAs in the Southeast 189 branches, 10 LPOs, and 5 MLOs across six Southeast states; Top 10 deposit market share in GA and SC Extended Navitas and SBA Markets 1DYLWDVVXEVLGLDU\LVDWHFKQRORJ\ HQDEOHGVPDOO WLFNHWHVVHQWLDO XVHFRPPHUFLDOHTXLSPHQWILQDQFLQJSURYLGHU 6%$EXVLQHVVKDVERWKLQ IRRWSULQWDQGQDWLRQDOEXVLQHVV VSHFLILFYHUWLFDOV

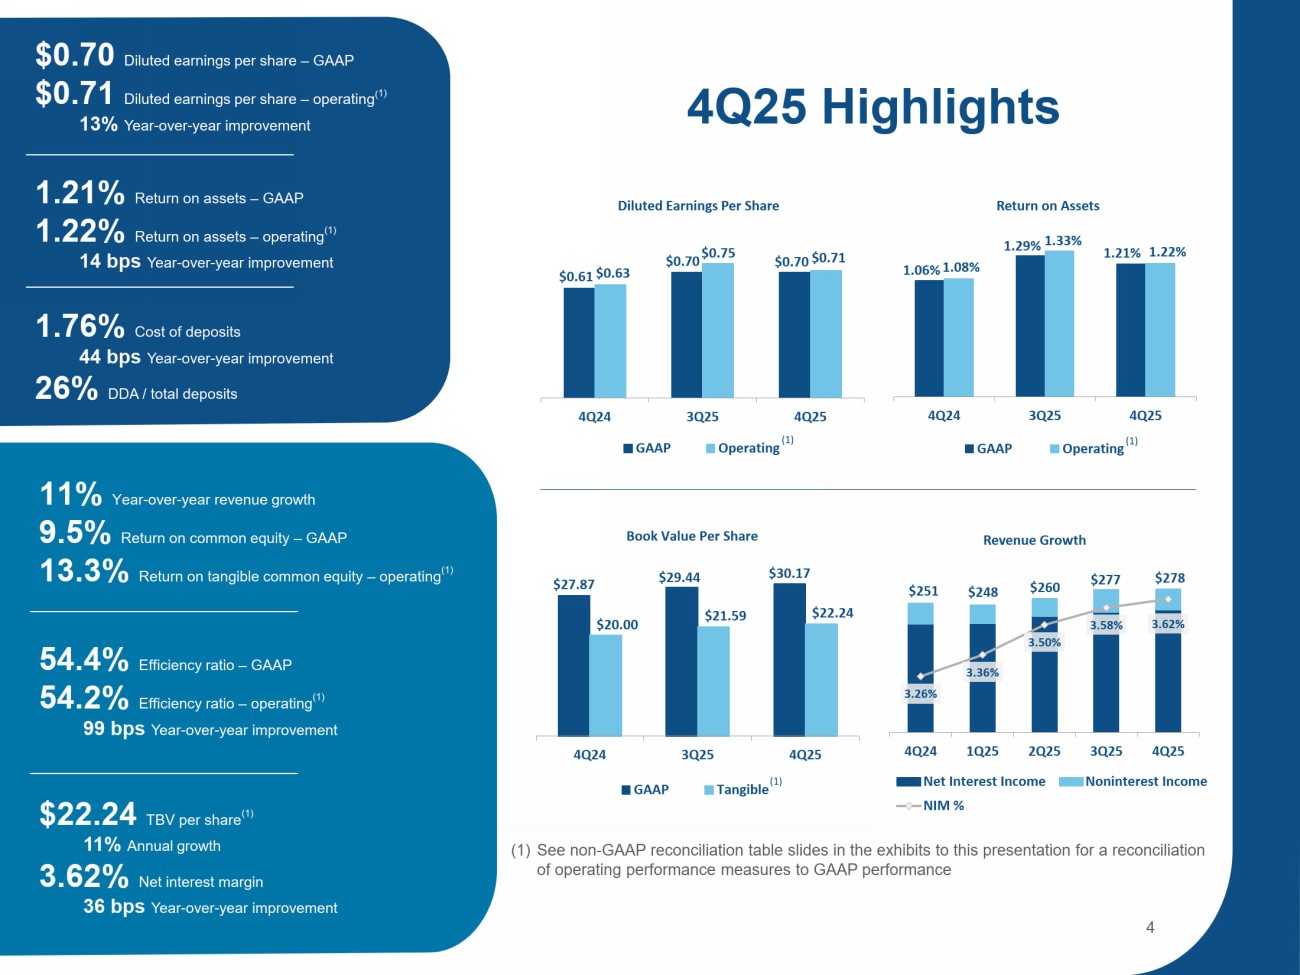
1.06% 1.29% ϭ͘Ϯϭ й ϭ͘Ϭϴ й ϭ͘ϯϯ й 1.22% 4Q24 3Q25 4Q25 Return on Assets GAAP Operating Ψ Ϭ͘ϲϭ $0.70 $0.70 Ψ Ϭ͘ϲϯ Ψ Ϭ͘ϳϱ Ψ Ϭ͘ϳϭ 4Q24 3Q25 4Q25 Diluted Earnings Per Share GAAP Operating $27.87 Ψ Ϯϵ͘ϰϰ $30.17 $20.00 Ψ Ϯϭ͘ϱϵ Ψ ϮϮ͘Ϯϰ 4Q24 3Q25 4Q25 ŽŽŬsĂůƵĞWĞƌ^ŚĂƌĞ GAAP Tangible 1.01% Return on assets – operating (1) 4Q25 Highlights 6HHQRQ *$$3UHFRQFLOLDWLRQWDEOHVOLGHVLQWKHH[KLELWVWRWKLVSUHVHQWDWLRQIRUDUHFRQFLOLDWLRQ RIRSHUDWLQJSHUIRUPDQFHPHDVXUHVWR*$$3SHUIRUPDQFH $251 $248 Ψ ϮϲϬ Ψ Ϯϳϳ Ψ Ϯϳϴ 3.26% 3.36% ϯ͘ϱϬ й 3.58% 3.62% 4Q24 1Q25 2Q25 3Q25 4Q25 ZĞǀĞŶƵĞ'ƌŽǁƚŚ Net Interest Income Noninterest Income NIM % ; ϭ Ϳ (1) $0.70 Diluted earnings per share – GAAP $0.71 Diluted earnings per share – operating ( 1) 13% Year - over - year improvement 5HWXUQRQDVVHWV *$$3 5HWXUQRQDVVHWV RSHUDWLQJ ESV <HDU RYHU \HDULPSURYHPHQW 1.76% Cost of deposits 44 bps Year - over - year improvement 26% DDA / total deposits 11% Year - over - year revenue growth 9.5% Return on common equity – GAAP 13.3% Return on tangible common equity – operating (1) (IILFLHQF\UDWLR *$$3 (IILFLHQF\UDWLR RSHUDWLQJ ESV <HDU RYHU \HDULPSURYHPHQW 7%9SHUVKDUH $QQXDOJURZWK 1HWLQWHUHVWPDUJLQ ESV <HDU RYHU \HDULPSURYHPHQW ; ϭ Ϳ Ϭ͘ϲϴ й 0.90% 1.17% Ϭ͘ϵϰ й ϭ͘ϬϮ й ϭ͘ϮϬ й 2023 2024 2025 Return on Assets GAAP Operating $1.54 Ψ Ϯ͘Ϭϰ $2.62 $2.11 Ψ Ϯ͘ϯϬ Ψ Ϯ͘ϳϭ 2023 2024 2025 ŝůƵƚĞĚĂƌŶŝŶŐƐWĞƌ^ŚĂƌĞ GAAP Operating $26.52 $27.87 Ψ ϯϬ͘ϭϳ $18.39 $20.00 Ψ ϮϮ͘Ϯϰ 2023 2024 2025 ŽŽŬsĂůƵĞWĞƌ^ŚĂƌĞ GAAP Tangible 5HWXUQRQDVVHWV RSHUDWLQJ Annual Highlights (1) See non - GAAP reconciliation table slides in the exhibits to this presentation for a reconciliation of operating performance measures to GAAP performance Ψ ϴϵϯ $952 $1,063 ϯ͘ϯϱ й ϯ͘Ϯϵ й ϯ͘ϱϮ й 2023 2024 2025 Revenue Growth Net Interest Income Noninterest Income NIM % 5 ; ϭ Ϳ (1) $2.62 Diluted earnings per share – GAAP $2.71 Diluted earnings per share – operating ( 1) 18% Year - over - year improvement 5HWXUQRQDVVHWV *$$3 5HWXUQRQDVVHWV RSHUDWLQJ ESV <HDU RYHU \HDULPSURYHPHQW &RVWRIGHSRVLWV ESV <HDU RYHU \HDULPSURYHPHQW ''$WRWDOGHSRVLWV <HDU RYHU \HDUUHYHQXHJURZWK 5HWXUQRQFRPPRQHTXLW\ *$$3 5HWXUQRQWDQJLEOHFRPPRQHTXLW\ RSHUDWLQJ 55.5% Efficiency ratio – GAAP 54.5% Efficiency ratio – operating (1) 264 bps Year - over - year improvement $22.24 TBV per share (1) 11% Annual growth 3.52% Net interest margin 23 bps Year - over - year improvement ; ϭ Ϳ


5.26% 5.25% ϱ͘ϭϴ й 4.58% 4.25% ϰ͘Ϯϱ й ϰ͘Ϯϭ й ϯ͘ϳϳ й 2.03% 2.35% Ϯ͘ϯϱ й 2.20% 2.05% Ϯ͘Ϭϭ й ϭ͘ϵϳ й ϭ͘ϳϲ й 4Q23 2Q24 3Q24 4Q24 1Q25 2Q25 3Q25 4Q25 Fed Target Average Lower Bound United Cost of Deposits Outstanding Deposit Franchise Deposit Costs Improved 21 bps in 4Q25 Customer Deposit Growth On an end of period basis, customer deposits declined by $242 million, or 4.1% annualized, from 3Q25 On an average basis, customer deposits grew by $302 million, or 5.1% annualized, from 3Q25 Public funds of $3.1 billion were up $293 million from 3Q25, primarily driven by seasonality On an end of period basis, noninterest - bearing DDA declined $192 million from 3Q25. On an average basis, noninterest - bearing DDA grew $27 million from 3Q25 Consistent Deposit Portfolio Growth ϴ͕ϱϴϴ ϴ͕ϴϰϰ ϵ͕ϭϮϮ 9,220 8,770 ϭϭ͕ϰϱϵ 11,597 11,758 ϭϭ͕ϳϵϳ ϭϭ͕ϳϭϯ ϭϲϴ 161 156 ϭϱϲ 175 3,246 ϯ͕ϭϲϬ Ϯ͕ϵϮϳ Ϯ͕ϴϰϴ 3,140 4Q24 1Q25 2Q25 3Q25 4Q25 Commercial Consumer Brokered Public Funds $ in millions 'HSRVLW&RVWV&RQWLQXHWR7UHQG'RZQ &XPXODWLYHQRQ PDWXULW\,%GHSRVLWEHWDRI WKURXJK 4 7LPHGHSRVLWVUDQRIIDW ZKLOHQHZYROXPHFDPH RQDW LQ 4 40% Cumulative Total Deposit Beta Ψ ϭϴ͕ϭϳϲ Ψ ϭϴ͕ϰϮϱ $18,921 $19,175 Ψ ϭϵ͕ϯϴϰ 4Q24 1Q25 2Q25 3Q25 4Q25 Loans Excl.

Acquired Acquired Loans (ANB) Consistent Loan Portfolio Growth /RDQ*URZWK Quarter Highlights Loan growth of $209 million or 4.4% annualized from 3Q25 Strong loan growth in targeted segments HELOC growth of $67 million, or 21% annualized, in 4Q25 C&I growth was 13% annualized in 4Q25, including $94 million, or 10% annualized, in Owner Occupied CRE (1) and $103 million, or 16% annualized, in all other C&I Construction and CRE ratios as a percentage of total RBC were 46% and 198%, respectively Annual Highlights Loans grew $1.2 billion or 6.6% from 4Q24 Excluding the impact of acquired ANB balances, loans grew 5.0% from 4Q24 Growth was balanced across products, with Commercial & Industrial, Owner Occupied CRE (1) , and Equipment Finance all up 11% year over year 4 7RWDO/RDQV %LOOLRQ 6% 1% ϭ й 43% Ϯϱ й 16% ϳ й & , Commercial Construction CRE 2WKHU&RQVXPHU Residential Mortgage +RPH (TXLW\ Residential Construction LQPLOOLRQV 1RWH& ,LQFOXGHV&RPPHUFLDO ,QGXVWULDODQG2ZQHU2FFXSLHG&5( &RQVXPHULQFOXGHV0RUWJDJH+(/2&DQG2WKHU&RQVXPHU +7% (1) 4Q25 included a preliminary reclass from Commercial Construction to Investor CRE ($400 million) and Owner Occupied CRE ($ 80 million). Growth rates presented above are adjusted for the reclassification.
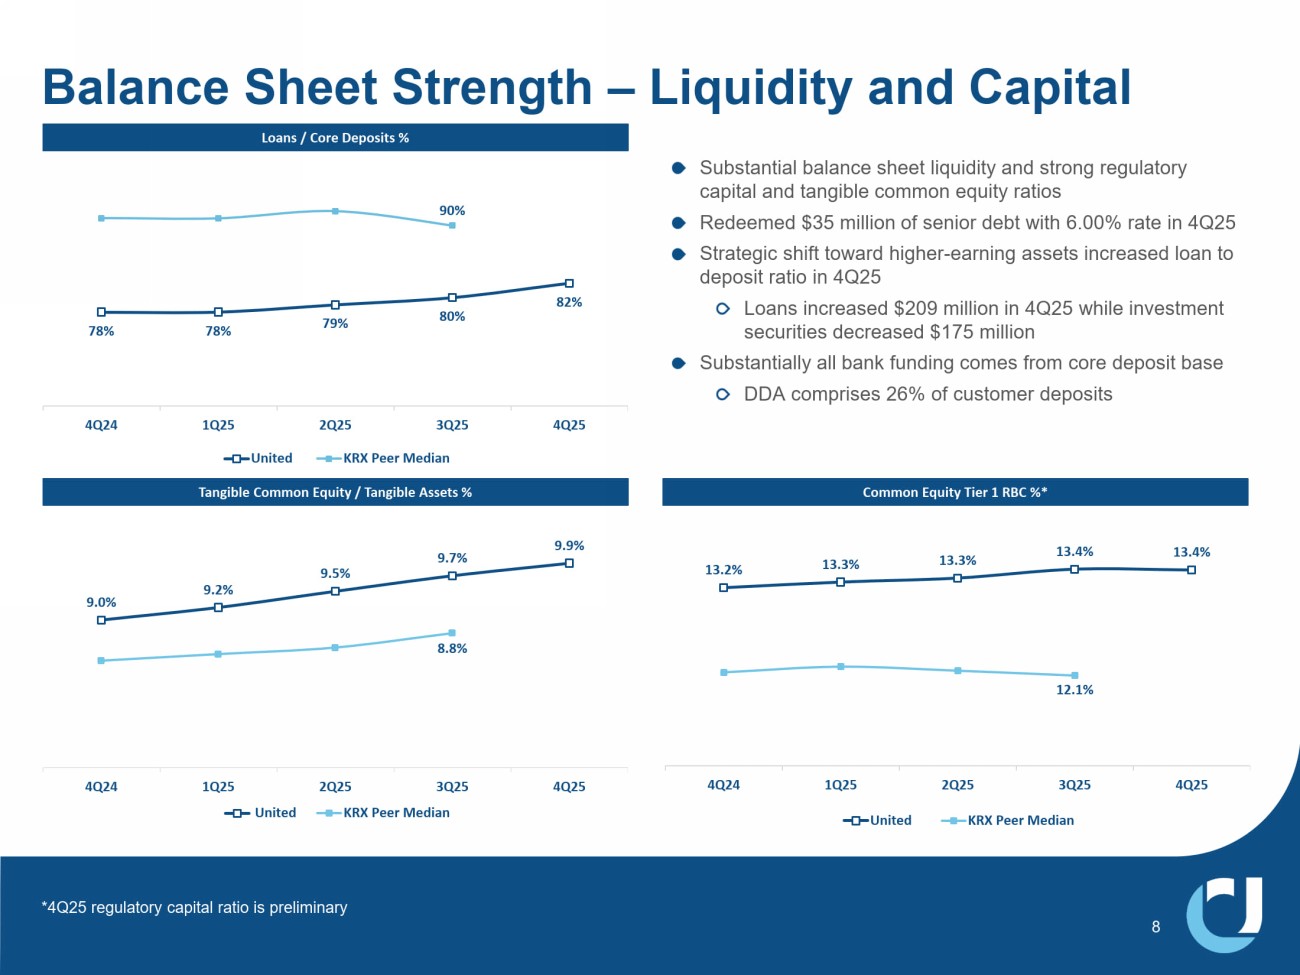
78% ϳϴ й 79% ϴϬ й 82% ϵϬ й 4Q24 1Q25 2Q25 3Q25 4Q25 United KRX Peer Median 6XEVWDQWLDOEDODQFHVKHHWOLTXLGLW\DQGVWURQJUHJXODWRU\ FDSLWDODQGWDQJLEOHFRPPRQHTXLW\UDWLRV 5HGHHPHG PLOOLRQRIVHQLRUGHEWZLWK UDWHLQ 4 6WUDWHJLFVKLIWWRZDUGKLJKHU HDUQLQJDVVHWVLQFUHDVHGORDQWR GHSRVLWUDWLRLQ 4 /RDQVLQFUHDVHG PLOOLRQLQ 4 ZKLOHLQYHVWPHQW VHFXULWLHVGHFUHDVHG PLOOLRQ 6XEVWDQWLDOO\DOOEDQNIXQGLQJFRPHVIURPFRUHGHSRVLWEDVH ''$FRPSULVHV RIFXVWRPHUGHSRVLWV 9.0% 9.2% ϵ͘ϱ й 9.7% ϵ͘ϵ й 8.8% 4Q24 1Q25 2Q25 3Q25 4Q25 United KRX Peer Median Loans / Core Deposits % Tangible Common Equity / Tangible Assets % ŽŵŵŽŶƋƵŝƚLJdŝĞƌ ϭ ZйΎ 13.2% ϭϯ͘ϯ й 13.3% ϭϯ͘ϰ й ϭϯ͘ϰ й 12.1% 4Q24 1Q25 2Q25 3Q25 4Q25 United KRX Peer Median Balance Sheet Strength – Liquidity and Capital *4Q25 regulatory capital ratio is preliminary ZŝƐŬ Ͳ ĂƐĞĚĂƉŝƚĂůZĂƚŝŽƐ Tangible Book Value Per Share 4 $FWLRQV 5HSXUFKDVHG PLOOLRQRIFRPPRQVWRFN PLOOLRQVKDUHVLQ 4 DWDYHUDJHSULFHRI SHUVKDUH %RDUGDSSURYHGFRPPRQVKDUHUHSXUFKDVH DXWKRUL]DWLRQRI PLOOLRQIRU 4XDUWHUO\FRPPRQGLYLGHQGRI SHUVKDUH XS YVSULRU\HDU &DSLWDO5DWLRV &(7 UHPDLQVDERYHSHHUVDW /HYHUDJHUDWLRLQFUHDVHG ESVWR DV FRPSDUHGWR 4 7&(RI LQFUHDVHG ESVIURP 4 DQG ESVIURP 4 ϭϯ͘Ϯ й ϭϯ͘ϯ й 13.3% 13.4% 12.1% ϭϯ͘ϰ й 0.5% Ϭ͘ϰ й Ϭ͘ϰ й Ϭ͘ϳ й 1.5% 1.4% 1.4% ϭ͘ϰ й 2.0% ϭ͘ϯ й ϭϱ͘ϭ й ϭϱ͘ϭ й 15.1% 14.8% 14.8% ϭϰ͘ϴ й 4Q24 1Q25 2Q25 3Q25 3Q25 KRX Peer Median 4Q25* CET1 Additional Tier 1 Tier 2 &DSLWDO5DWLRV Ψ ϮϮ͘Ϯϰ Ψ Ϯϭ͘ϱϵ $0.70 ( $0.25 ) ( $0.07 ) Ψ Ϭ͘ϭϭ $0.16 3Q25 TBV GAAP Earnings Dividends Share Repurchases Change in AOCI Other 4Q25 TBV 4 UHJXODWRU\FDSLWDOUDWLRVDUHSUHOLPLQDU\ 'HSOR\PHQW


$210.3 $212.0 $225.5 Ψ Ϯϯϯ͘ϲ Ψ Ϯϯϳ͘ϵ 3.26% ϯ͘ϯϲ й ϯ͘ϱϬ й 3.58% 3.62% $100.0 $120.0 $140.0 $160.0 $180.0 $200.0 $220.0 $240.0 3.00% 3.10% 3.20% 3.30% 3.40% 3.50% 3.60% 3.70% 3.80% 4Q24 1Q25 2Q25 3Q25 4Q25 Net Interest Revenue Net Interest Margin 3.62% ϯ͘ϱϴ й Ϭ͘Ϭϵ й ( 0.01% ) ; Ϭ͘ϬϮ й Ϳ ; Ϭ͘ϬϮ й Ϳ 3Q25 NIM Rate Mix Accretion Other 4Q25 NIM Net Interest Revenue & Net Interest Margin 4Q25 NIM Up 4 bps Net interest revenue increased $4.3 million from 3Q25. Net interest revenue for full year 2025 was up 10% compared to full year 2024 Net interest margin of 3.62% was up 4 bps from 3Q25, primarily due to improved funding costs Purchased loan accretion totaled $3.9 million and contributed 6 bps to the margin, down 2 bps from 3Q25 Back book repricing of assets below current market pricing continues to be a tailwind.

Over the next 12 months, $1.4 billion in fixed - rate assets with an average rate of 4.90% will contractually reprice or mature Short CD duration, with 39% of the $3.7 billion book maturing in the next 3 months at 3.32% average rate 1HW,QWHUHVW5HYHQXH0DUJLQ Yields & Costs ϲ͘Ϯϭ й ϲ͘ϭϬ й 6.19% 6.21% 6.05% ϯ͘Ϯϲ й ϯ͘ϯϲ й 3.50% ϯ͘ϱϴ й ϯ͘ϲϮ й 3.02% 2.83% 2.76% Ϯ͘ϲϵ й Ϯ͘ϯϵ й 4Q24 1Q25 2Q25 3Q25 4Q25 Loan Yield NIM Cost of IBL (1) Net interest margin is calculated on a fully taxable equivalent basis $ in millions +36 bps Ψ ϭϬ͘ϲ $9.5 Ψ ϭϬ͘ϭ Ψ ϭϭ͘ϰ $10.7 Ψ ϵ͘ϳ $6.1 $5.4 Ψ ϳ͘ϭ $6.5 Ψ ϰ͘ϳ Ψ ϰ͘ϱ $4.4 Ψ ϰ͘ϴ $5.2 $1.6 Ψ ϭ͘ϰ $2.0 Ψ Ϯ͘ϰ Ψ Ϯ͘ϭ $13.9 Ψ ϭϰ͘ϭ $12.8 $17.6 Ψ ϭϱ͘ϵ 4Q24 1Q25 2Q25 3Q25 4Q25 Service Charges Mortgage Brokerage / Wealth Mgmt Loan Sale Gains Other Linked Quarter Noninterest income decreased $2.8 million from 3Q25 Mortgage fees decreased, primarily due to a positive MSR mark of $0.3 million in 4Q25 vs. a positive MSR mark of $0.8 million in 3Q25 Loan sale gains of $2.1 million decreased $0.3 million from 3Q25 Sold $14.4 million of SBA loans and $41.6 million of Navitas loans Other income decreased $1.7 million, primarily due to the absence of elevated unrealized equity investment gains that occurred in the prior quarter Year - over - Year Noninterest income is flat compared to 4Q24 Mortgage fees decreased, primarily due to a positive MSR mark of $0.3 million in 4Q25 vs.

a positive MSR mark of $3.5 million in 4Q24 Wealth Management increased $0.6 million driven by higher brokerage fees Loan sale gains increased $0.6 million Other income increased $2.0 million, including a $0.9 million increase in customer swap income, $0.5 million higher Treasury Management income, and $0.5 million higher BOLI income Ψ ϰϬ͘ϱ Noninterest Income Ψ ϯϱ͘ϳ $ in millions $34.7 Ψ ϰϯ͘Ϯ $40.5 Ψ ϭϰϯ͘ϭ $141.1 $147.9 Ψ ϭϱϬ͘ϵ Ψ ϭϱϮ͘Ϭ $140.9 Ψ ϭϯϵ͘ϴ $143.1 Ψ ϭϰϳ͘ϰ $151.4 4Q24 1Q25 2Q25 3Q25 4Q25 GAAP Operating Noninterest Expense 4 RSHUDWLQJHIILFLHQF\UDWLRRI 2SHUDWLQJHIILFLHQF\UDWLRLPSURYHG ESVIURP 4 ZLWK LPSURYHPHQWGULYHQE\SRVLWLYHRSHUDWLQJOHYHUDJH ĨĨŝĐŝĞŶĐLJZĂƚŝŽ Noninterest Expense ϱϲ͘ϭ й 56.7% ϱϲ͘ϳ й 54.3% 54.4% ϱϱ͘Ϯ й ϱϲ͘Ϯ й 54.8% ϱϯ͘ϭ й 54.2% 4Q24 1Q25 2Q25 3Q25 4Q25 GAAP Operating *$$3QRQLQWHUHVWH[SHQVHLQFUHDVHG PLOOLRQFRPSDUHGWR WKHSULRUTXDUWHU 2SHUDWLQJQRQLQWHUHVWH[SHQVHLQFUHDVHG PLOOLRQFRPSDUHG WRWKHSULRUTXDUWHULQFOXGLQJ PLOOLRQLQKLJKHUJURXS LQVXUDQFHFRVWV *$$3QRQLQWHUHVWH[SHQVHLQFUHDVHG PLOOLRQ\HDURYHU\HDU 2SHUDWLQJQRQLQWHUHVWH[SHQVHLQFUHDVHG PLOOLRQ\HDURYHU \HDUSULPDULO\GULYHQE\D PLOOLRQLQFUHDVHLQFRPSHQVDWLRQ H[SHQVHLQFOXGLQJKLJKHUYDULDEOHFRPSHQVDWLRQUHIOHFWLQJ VWURQJEXVLQHVVSHUIRUPDQFHDQGVPDOOHULQFUHDVHVLQYDULRXV RWKHUH[SHQVHFDWHJRULHV 12 (1) See non - GAAP reconciliation table slides in the exhibits to this presentation for a reconciliation of operating performance meas ures to GAAP performance LQPLOOLRQV (1)

4 QHWFKDUJH RIIVRI PLOOLRQRU RIDYHUDJH ORDQVXS PLOOLRQIURP 4 ,QFUHDVHSULPDULO\GULYHQE\WZR& ,FUHGLWVRIZKLFK PLOOLRQZDVDOUHDG\VSHFLILFDOO\UHVHUYHG $QQXDOQHWFKDUJH RIIVRI PLOOLRQRU RIDYHUDJH ORDQVLPSURYHGIURP PLOOLRQRU RIDYHUDJHORDQV LQWKHSULRU\HDU 1RQSHUIRUPLQJDVVHWVLPSURYHG PLOOLRQGXULQJWKHTXDUWHU DQGZHUH RIWRWDOORDQVGRZQ ESVIURP 4 3DVWGXHORDQVZHUH RIWRWDOORDQVIODWWR 4 +LJKHU ULVNORDQVGHILQHGDVVSHFLDOPHQWLRQSOXVVXEVWDQGDUG DFFUXLQJZHUH XSVOLJKWO\IURP 4 Credit Quality Net Charge - Offs as % of Average Loans EŽŶƉĞƌĨŽƌŵŝŶŐƐƐĞƚƐΘWĂƐƚƵĞ>ŽĂŶƐĂƐĂйŽĨdŽƚĂů>ŽĂŶƐ 0.58% Ϭ͘ϲϰ й Ϭ͘ϲϰ й 0.64% Ϭ͘ϱϭ й 0.44% 0.51% Ϭ͘ϰϴ й 0.28% Ϭ͘Ϯϲ й Ϭ͘ϭϵ й 0.17% Ϭ͘Ϯϭ й 0.14% 0.23% Ϭ͘Ϯϯ й 1Q24 2Q24 3Q24 4Q24 1Q25 2Q25 3Q25 4Q25 NPAs (%) Past Dues (%) 1.6% ϭ͘ϯ й ϭ͘ϯ й 1.4% ϭ͘Ϯ й 1.4% 1.5% ϭ͘ϴ й 1.3% ϭ͘ϱ й ϭ͘ϳ й 1.8% ϭ͘ϵ й 1.8% 1.5% ϭ͘ϯ й 1Q24 2Q24 3Q24 4Q24 1Q25 2Q25 3Q25 4Q25 Special Mention (%) Substandard Accruing (%) Special Mention & Substandard Accruing Loans as a % of Total Loans Ϭ͘Ϯϴ й 0.26% Ϭ͘ϱϮ й 0.21% 0.21% Ϭ͘ϭϴ й 0.16% Ϭ͘ϯϰ й Ϭ͘ϭϲ й 0.15% Ϭ͘ϰϱ й 0.08% 0.11% Ϭ͘Ϭϴ й 0.05% Ϭ͘Ϯϲ й 1Q24 2Q24 3Q24 4Q24 1Q25 2Q25 3Q25 4Q25 United United Excl. Navitas ,QFOXGHV EDVLVSRLQWVRIH[SHFWHGOLIHWLPHORVVHVUHODWHGWRWKH 4 VDOHRIPDQXIDFWXUHGKRXVLQJORDQV (1)

Allowance for Credit Losses Allowance for Credit Losses (ACL) by Product Allowance for Credit Losses (ACL) Provision of $13.7 million, up $5.8 million from 3Q25 Hurricane - related special reserve fully released in 4Q25, down from $1.9 million in 3Q25 Allowance coverage of 1.16%, down slightly from prior quarter Baseline economic scenario in 4Q25 has a generally similar outlook from the prior quarter $207 $212 $217 $216 $210 $10 $11 $12 $12 $15 1.20% 1.21% 1.21% 1.19% 1.16% 0.65% 0.75% 0.85% 0.95% 1.05% 1.15% 1.25% 1.35% 1.45% 1.55% $50 $70 $90 $110 $130 $150 $170 $190 $210 $230 4Q24 1Q25 2Q25 3Q25 4Q25 ACL - Loans ACL - Unfunded ACL - Allowance for Credit Losses / Loans % 14 $ in millions 4 3Q25 4 ACL / Loans Reserve Amount ACL / Loans Reserve Amount $&//RDQV Reserve Amount LQWKRXVDQGV 0.60% 23,044 0.56 % 20,659 0.58 % 19,873 Owner Occupied CRE 0.88% 42,878 1.02 % 46,211 0.95 % 41,427 Income Producing CRE 1.60% 43,269 1.72 % 44,481 1.46 % 35,441 Commercial & Industrial 0.91% 11,323 0.80 % 13,841 0.99 % 16,370 Commercial Construction 2.48% 45,852 2.49 % 45,104 2.85 % 47,415 Equipment Financing 0.93% 29,241 0.98 % 31,273 1.00 % 32,259 Residential Mortgage 0.90% 11,849 0.91 % 11,356 1.06% 11,247 Home Equity 0.94% 1,799 0.99 % 1,767 0.94 % 1,672 Residential Construction -- -- -- -- 26.12 % 450 Manufactured Housing (1) 0.63% 1,174 0.57 % 1,099 0.45 % 844 Consumer 1.09% 210,429 1.13 % 215,791 1.14 % 206,998 ACL - Loans 15,091 12,485 10,391 ACL - Unfunded 1.16% $225,520 1.19 % $228,276 1.20 % $217,389 Total ACL (1) In 2025, manufactured housing loans were included in consumer loans 0HPEHU)',& 8QLWHG&RPPXQLW\%DQN_ XFELFRP 4 Q25 INVESTOR PRESENTATION Exhibits

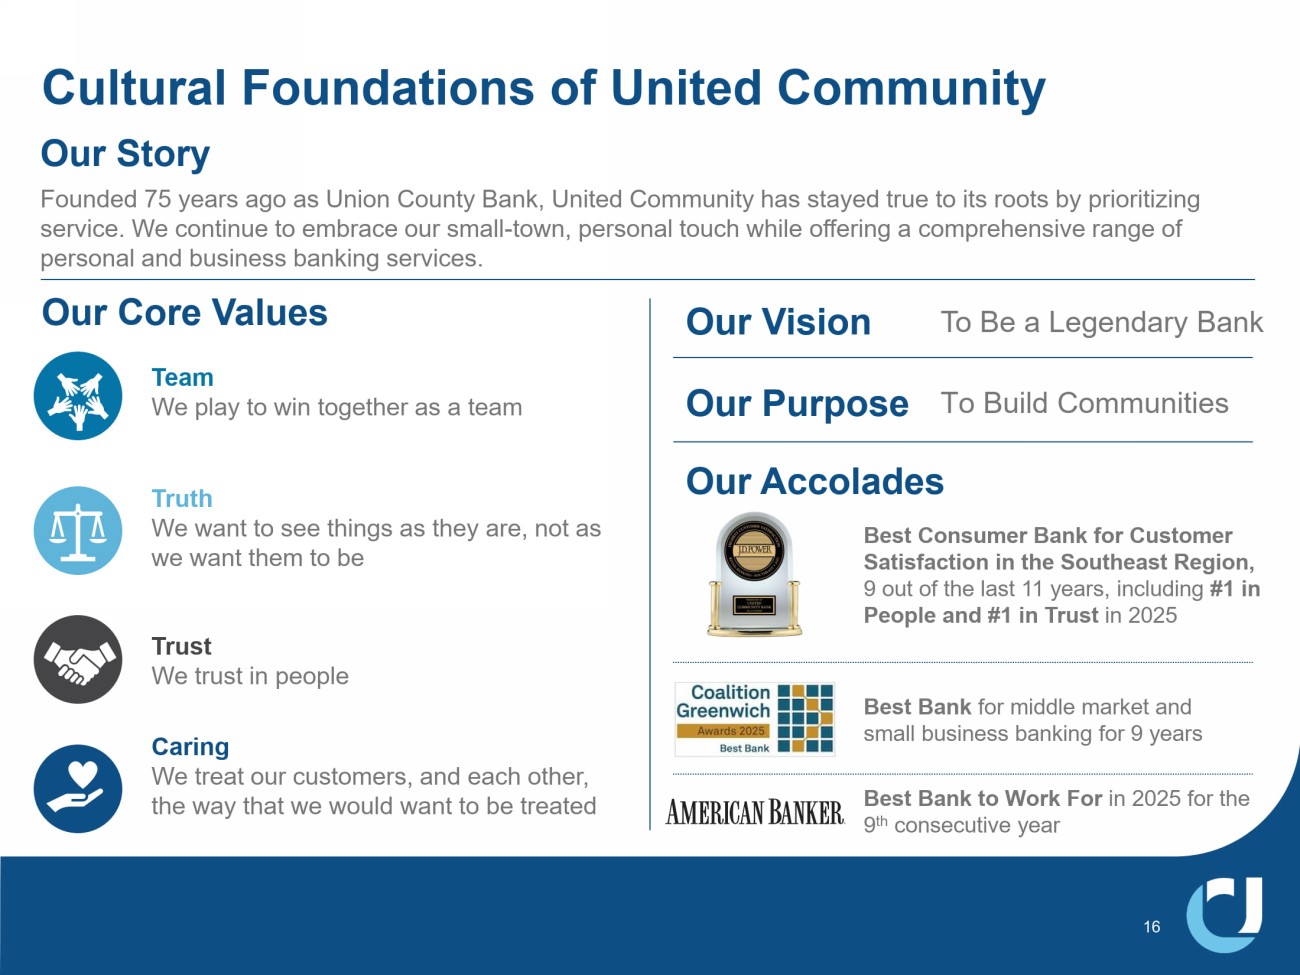
&XOWXUDO)RXQGDWLRQVRI8QLWHG&RPPXQLW\ 16 Our Story Founded 75 years ago as Union County Bank, United Community has stayed true to its roots by prioritizing service. We continue to embrace our small - town, personal touch while offering a comprehensive range of personal and business banking services. Team We play to win together as a team Truth We want to see things as they are, not as we want them to be Trust We trust in people Caring We treat our customers, and each other, the way that we would want to be treated %HVW%DQNWR:RUN ) RU LQ IRUWKH WK FRQVHFXWLYH\HDU Best Consumer Bank for Customer Satisfaction in the Southeast Region, 9 out of the last 11 years, including #1 in People and #1 in Trust in 2025 Best Bank for middle market and small business banking for 9 years To Be a Legendary Bank Our Vision Our Core Values Our Accolades Our Purpose 7R%XLOG&RPPXQLWLHV Average Deposit Costs 17 4Q25 3Q25 2Q25 1Q25 4Q24 $ in billions; rates annualized Average Rate Average Balance Average Rate Average Balance Average Rate Average Balance Average Rate Average Balance Average Rate Average Balance N/A $6.4 N/A $6.4 N/A $6.4 N/A $6.2 N/A $6.3 DDA 2.08% $6.1 2.39% $5.8 2.45% $6.1 2.47% $6.1 2.65% $6.3 NOW 2.51% $7.0 2.91% $6.9 2.99% $6.6 3.05% $6.6 3.31% $6.5 MMDA 0.18% $1.1 0.23% $1.1 0.49% $1.2 0.23% $1.1 0.23% $1.1 Savings 3.29% $3.7 3.43% $3.7 3.47% $3.5 3.63% $3.4 3.90% $3.5 Time 2.39% $17.8 2.68% $17.5 2.73% $17.5 2.79% $17.3 3.00% $17.4 Total Interest - Bearing 1.76% $24.2 1.97% $23.9 2.01% $23.8 2.05% $23.5 2.20% $23.7 Total Deposits


Navitas Portfolio Net Charge - Offs & Weighted Average FICO Scores Navitas represents 9.5% of total loans Navitas ACL / Loans of 2.48% Navitas net charge - offs of $5.1 million, or 1.11% annualized, in 4Q25 Of the $5.1 million in NCOs, $0.9 million came from the Long Haul Trucking segment as the book shrank to just $15 million Excluding Long Haul Trucking losses, Navitas losses were 0.91% of total Navitas loans 1DYLWDV3HUIRUPDQFH $1,447 $1,510 $1,534 $1,543 $1,544 $1,581 $1,603 Ψ ϭ͕ϲϲϯ $1,722 $1,778 $1,808 $1,848 8.99% 9.12% 9.25% ϵ͘ϯϬ й 9.43% 9.58% 9.64% 9.68% 9.70% 9.71% 9.70% ϵ͘ϳϬ й 1Q23 2Q23 3Q23 4Q23 1Q24 2Q24 3Q24 4Q24 1Q25 2Q25 3Q25 4Q25 Navitas Loans $ Portfolio Yield % 18 0.93% 0.69% 1.62% 2.05% 1.66% 1.42% ϭ͘ϯϰ й 1.43% 1.20% 1.14% 1.22% 1.11% 752 754 ϳϱϱ 756 757 758 759 760 761 761 ϳϲϮ 762 1Q23 2Q23 3Q23 4Q23 1Q24 2Q24 3Q24 4Q24 1Q25 2Q25 3Q25 4Q25 NCOs % - Navitas Weighted Average FICO - Total Portfolio $ in millions Navitas Portfolio Concentrations by State 11% 11% 10% 6% 58% CA TX FL NY NJ Other States Rate locks were $319 million, down $58 million from 3Q25, primarily driven by seasonality Sold $171 million of loans in 4Q25, approximately flat to 3Q25 76% of locked loans were fixed - rate mortgages, which were either sold in 4Q25 or are contemplated to be sold once closed Mortgage Locks & Sales Mortgage Funded Volume Mortgage Activity Trends $285 Ψ ϯϯϬ $359 $377 $319 $163 $141 $175 $175 Ψ ϭϳϭ 3.0% 2.9% 2.9% 2.6% 2.9% 4Q24 1Q25 2Q25 3Q25 4Q25 Mortgage Locks $ Loans Sold $ Gain on Sale % $195 $129 Ψ ϭϵϲ $185 $181 $50 $58 $89 $97 $80 4Q24 1Q25 2Q25 3Q25 4Q25 HFS Funded $ HFI Funded $ Surpassed $1 billion in funded mortgage volume in 2025 At 78% of funded volume, purchases remained the primary driver of mortgage activity, compared to 22% refinance volume $ in millions $ in millions


(1) Includes MSAs with a population greater than 1,000,000 (2) Includes MSAs with a population between 500,000 and 1,000,000 Footprint Focused on High - Growth Southeast MSAs 20 22.3% 8.4% ϱ͘ϵ й 4.7% 3.9% 3.4% 2.8% 2.1% 2.1% 2.0% ƚůĂŶƚĂ͕' Greenville, SC Nashville, TN Miami, FL Raleigh, NC Gainesville, GA Knoxville, TN Orlando, FL ZŽŵĞ͕' Myrtle Beach, SC Top 10 MSAs - % of Total Deposits UCBI's % of Total Deposits ’26 – ’31 Proj. Pop. Growth % ’26 – ’31 Proj. HHI. Growth % 1) Jacksonville, FL 0.78% 8.79 9.73 2) Orlando, FL 2.11% 8.32 14.57 3) Raleigh, NC 3.92% 8.28 13.27 4) Charlotte, NC 1.72% 7.18 13.18 5) Tampa, FL 0.09% 6.74 14.76 6) Greenville, SC 8.44% 6.65 14.29 7) Nashville, TN 4.67% 5.72 14.70 8) Miami, FL 5.90% 5.67 17.49 9) Atlanta, GA 22.30% 4.21 11.42 10) Richmond, VA -- 3.99 11.92 11) Washington, DC -- 2.80 8.79 12) Louisville, KY -- 2.61 11.07 Fastest Growing Major Southeast MSAs (1) United MSA Presence UCBI's % of Total Deposits ’26 – ’31 Proj. Pop. Growth % ’26 – ’31 Proj. HHI. Growth % 1) Winter Haven, FL -- 10.89 16.49 2) Port St. Lucie, FL 0.16% 10.15 16.41 3) Sarasota, FL 0.15% 9.84 13.25 4) Daytona Beach, FL -- 8.49 14.36 5) Fort Myers, FL -- 8.45 13.51 6) Melbourne, FL 0.16% 7.93 13.21 7) Huntsville, AL 1.29% 7.91 8.85 8) Fayetteville, AR -- 7.73 12.74 9) Charleston, SC 1.25% 7.48 13.25 10) Pensacola, FL -- 7.10 14.38 11) Durham, NC -- 5.11 12.79 12) Columbia, SC 0.22% 4.81 11.86 13) Knoxville, TN 2.77% 4.76 13.09 14) Winston-Salem, NC 0.00% 4.17 10.64 15) Chattanooga, TN 0.21% 3.75 10.20 Fastest Growing Mid-Sized Southeast MSAs (2)
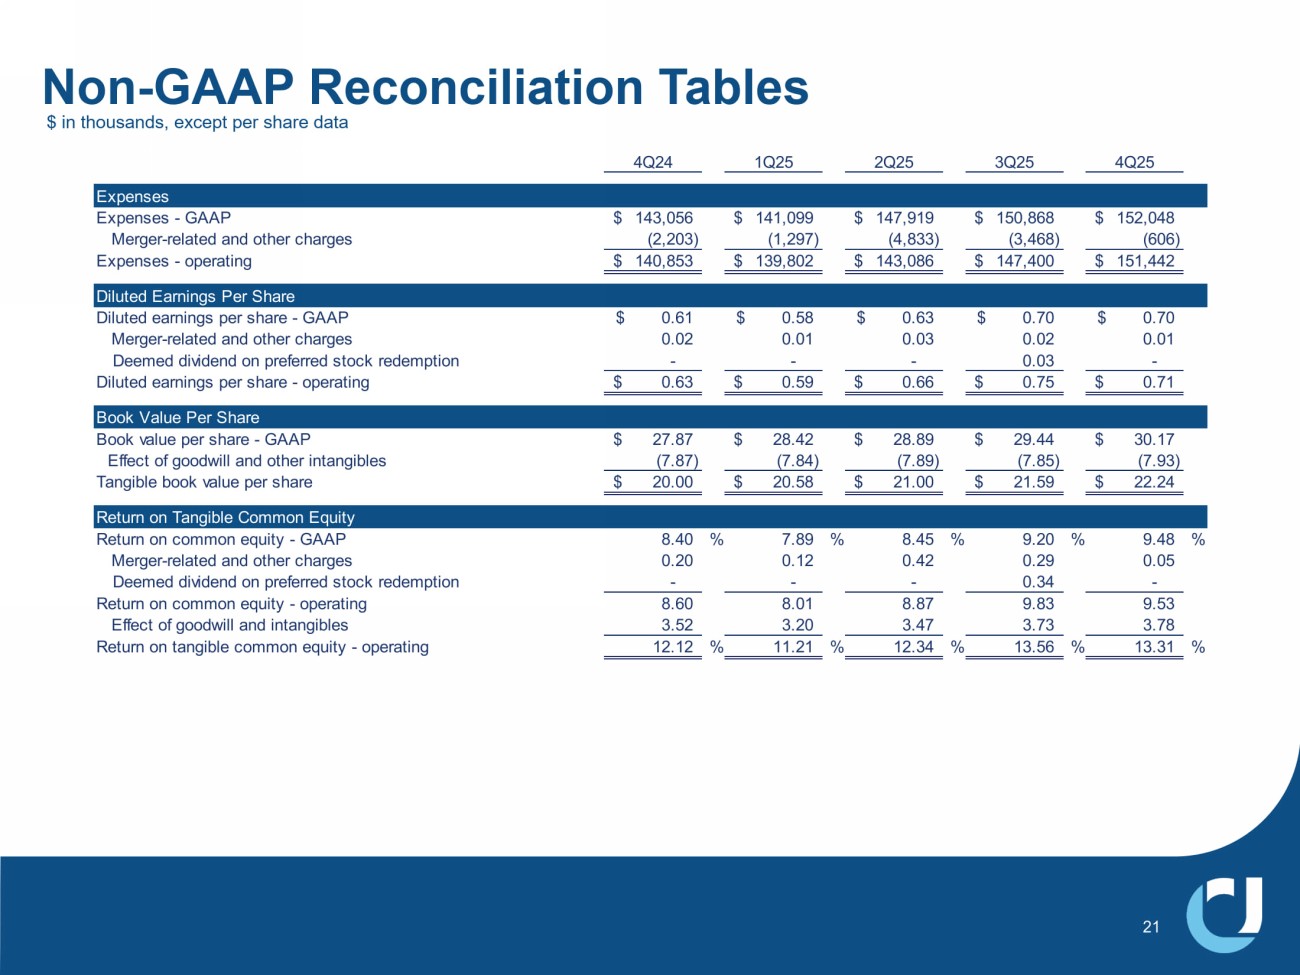
Non - GAAP Reconciliation Tables 21 4Q24 1Q25 2Q25 3Q25 4Q25 Expenses Expenses - GAAP 143,056$ 141,099$ 147,919$ 150,868$ 152,048$ Merger-related and other charges (2,203) (1,297) (4,833) (3,468) (606) Expenses - operating 140,853$ 139,802$ 143,086$ 147,400$ 151,442$ Diluted Earnings Per Share Diluted earnings per share - GAAP 0.61$ 0.58$ 0.63$ 0.70$ 0.70$ Merger-related and other charges 0.02 0.01 0.03 0.02 0.01 Deemed dividend on preferred stock redemption - - - 0.03 - Diluted earnings per share - operating 0.63$ 0.59$ 0.66$ 0.75$ 0.71$ Book Value Per Share Book value per share - GAAP 27.87$ 28.42$ 28.89$ 29.44$ 30.17$ Effect of goodwill and other intangibles (7.87) (7.84) (7.89) (7.85) (7.93) Tangible book value per share 20.00$ 20.58$ 21.00$ 21.59$ 22.24$ Return on Tangible Common Equity Return on common equity - GAAP 8.40 % 7.89 % 8.45 % 9.20 % 9.48 % Merger-related and other charges 0.20 0.12 0.42 0.29 0.05 Deemed dividend on preferred stock redemption - - - 0.34 - Return on common equity - operating 8.60 8.01 8.87 9.83 9.53 Effect of goodwill and intangibles 3.52 3.20 3.47 3.73 3.78 Return on tangible common equity - operating 12.12 % 11.21 % 12.34 % 13.56 % 13.31 % $ in thousands, except per share data Non - GAAP Reconciliation Tables 4Q24 1Q25 2Q25 3Q25 4Q25 Return on Assets Return on assets - GAAP 1.06 % 1.02 % 1.11 % 1.29 % 1.21 % Merger-related and other charges 0.02 0.02 0.05 0.04 0.01 Return on assets - operating 1.08 % 1.04 % 1.16 % 1.33 % 1.22 % Return on Assets to Return on Assets - Pre-Tax, Pre-Provision Return on assets - GAAP 1.06 % 1.02 % 1.11 % 1.29 % 1.21 % Income tax expense 0.30 0.29 0.31 0.38 0.37 Provision for credit losses 0.16 0.23 0.17 0.11 0.19 Return on assets - pre-tax, pre-provision 1.52 1.54 1.59 1.78 1.77 Merger-related and other charges 0.03 0.01 0.07 0.05 0.01 Return on assets - pre-tax, pre-provision - operating 1.55 % 1.55 % 1.66 % 1.83 % 1.78 % Efficiency Ratio Efficiency ratio - GAAP 56.05 % 56.74 % 56.69 % 54.30 % 54.40 % Merger-related and other charges (0.87) (0.52) (1.85) (1.25) (0.21) Efficiency ratio - operating 55.18 % 56.22 % 54.84 % 53.05 % 54.19 % Tangible Common Equity to Tangible Assets Equity to assets ratio - GAAP 12.38 % 12.56 % 12.86 % 12.78 % 12.99 % Effect of goodwill and intangibles (3.09) (3.06) (3.10) (3.07) (3.07) Effect of preferred equity (0.32) (0.32) (0.31) - - Tangible common equity to tangible assets 8.97 % 9.18 % 9.45 % 9.71 % 9.92 %
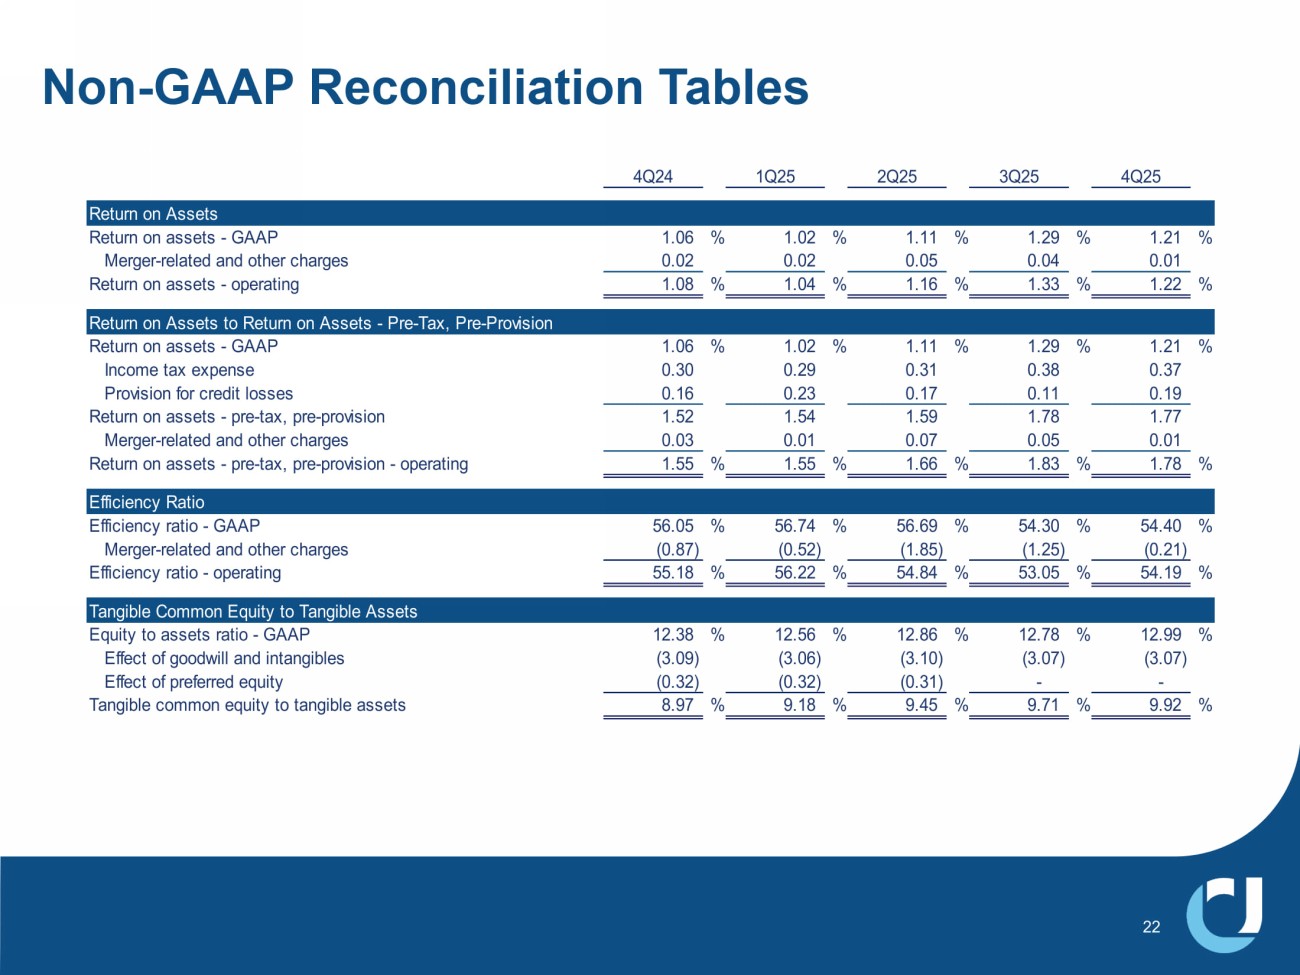
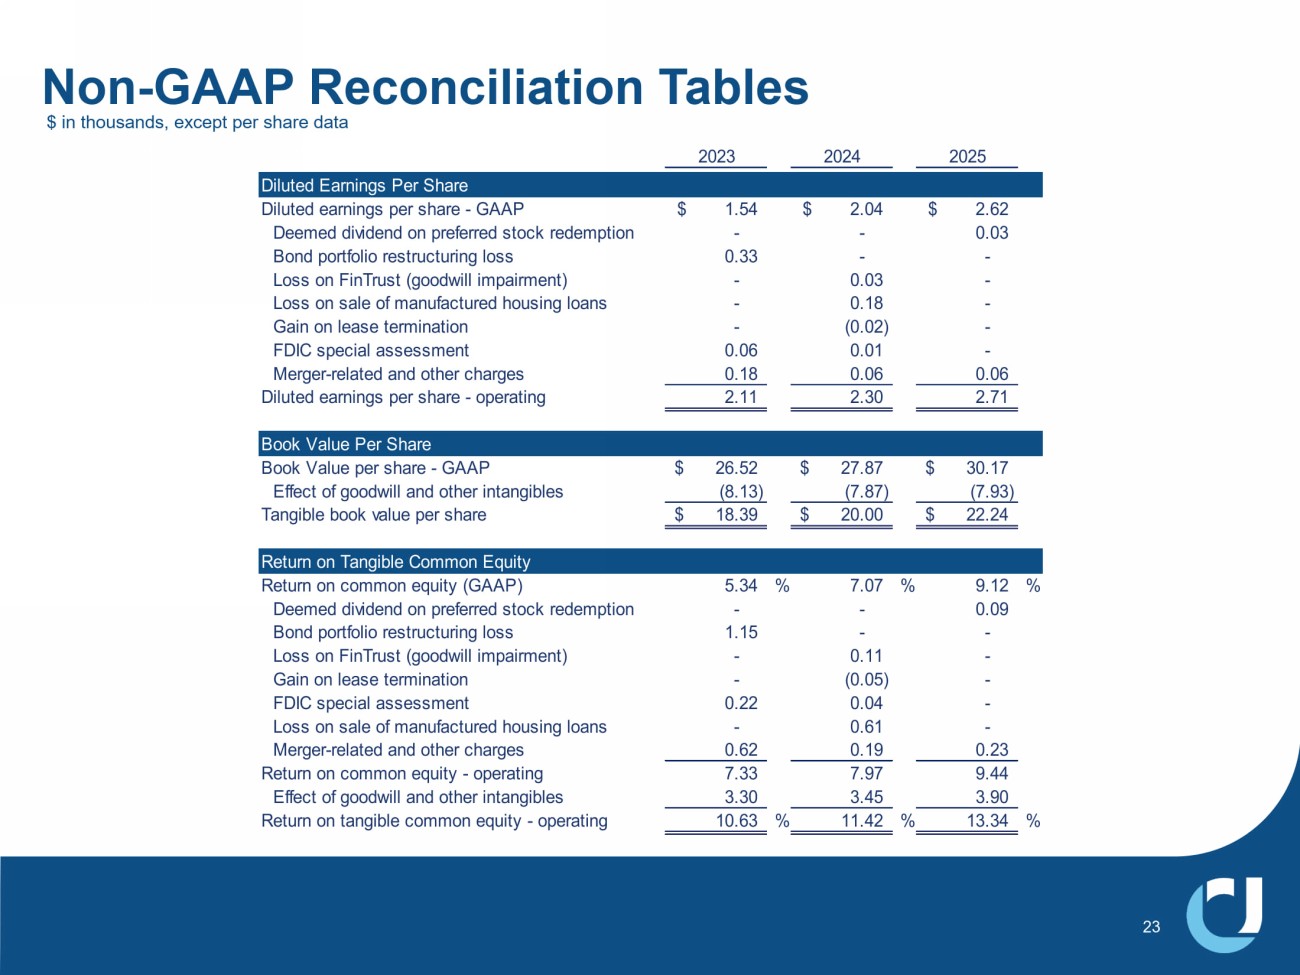
Non - GAAP Reconciliation Tables 23 2023 2024 2025 Diluted Earnings Per Share Diluted earnings per share - GAAP 1.54$ 2.04$ 2.62$ Deemed dividend on preferred stock redemption - - 0.03 Bond portfolio restructuring loss 0.33 - - Loss on FinTrust (goodwill impairment) - 0.03 - Loss on sale of manufactured housing loans - 0.18 - Gain on lease termination - (0.02) - FDIC special assessment 0.06 0.01 - Merger-related and other charges 0.18 0.06 0.06 Diluted earnings per share - operating 2.11 2.30 2.71 Book Value Per Share Book Value per share - GAAP 26.52$ 27.87$ 30.17$ Effect of goodwill and other intangibles (8.13) (7.87) (7.93) Tangible book value per share 18.39$ 20.00$ 22.24$ Return on Tangible Common Equity Return on common equity (GAAP) 5.34 % 7.07 % 9.12 % Deemed dividend on preferred stock redemption - - 0.09 Bond portfolio restructuring loss 1.15 - - Loss on FinTrust (goodwill impairment) - 0.11 - Gain on lease termination - (0.05) - FDIC special assessment 0.22 0.04 - Loss on sale of manufactured housing loans - 0.61 - Merger-related and other charges 0.62 0.19 0.23 Return on common equity - operating 7.33 7.97 9.44 Effect of goodwill and other intangibles 3.30 3.45 3.90 Return on tangible common equity - operating 10.63 % 11.42 % 13.34 % $ in thousands, except per share data Non - GAAP Reconciliation Tables 24 2023 2024 2025 Return on Assets Return on assets (GAAP) 0.68 % 0.90 % 1.17 % Bond portfolio restructuring loss 0.15 - - Loss on FinTrust (goodwill impairment) - 0.02 - Gain on lease termination - (0.01) - FDIC special assessment 0.03 0.01 - Loss on sale of manufactured housing loans - 0.08 - Merger-related and other charges 0.08 0.02 0.03 Return on assets - operating 0.94 % 1.02 % 1.20 % Efficiency Ratio Efficiency ratio (GAAP) 60.09 % 60.24 % 55.46 % Gain on lease termination - 0.15 - Loss on FinTrust (goodwill impairment) - (0.53) - FDIC special assessment (1.05) (0.18) - Loss on sale of manufactured housing loans - (1.63) - Merger-related and other charges (2.87) (0.90) (0.95) Efficiency ratio - operating 56.17 % 57.15 % 54.51 %

Glossary ACL – Allowance for Credit Losses MH – Manufactured Housing ALLL – Allowance for Loan Losses MLO – Mortgage Loan Office AOCI – Accumulated Other Comprehensive Income (Loss) MMDA – Money Market Deposit Account AUM – Assets Under Management MTM – Marked-to-Market BPS – Basis Points MSA – Metropolitan Statistical Area C&I – Commercial and Industrial MSR – Mortgage Servicing Rights Asset C&D – Construction and Development NCO – Net Charge-Offs CECL – Current Expected Credit Losses NIM – Net Interest Margin CET1 – Common Equity Tier 1 Capital NOW – Negotiable Order of Withdrawal CRE – Commercial Real Estate NPA – Non-Performing Asset DDA – Demand Deposit Account OO CRE – Owner Occupied Commercial Real Estate EOP – End of Period PCD – Loans Purchased with Credit Deterioration EPS – Earnings Per Share PTPP – Pre-Tax, Pre-Provision Earnings FTE – Fully-Taxable Equivalent RBC – Risk Based Capital GAAP – Accounting Principles Generally Accepted in the USA ROA – Return on Assets HELOC – Home Equity Line of Credit SBA – United States Small Business Administration IBL – Interest-Bearing Liabilities TCE – Tangible Common Equity KRX – KBW Nasdaq Regional Banking Index USDA – United States Department of Agriculture LPO – Loan Production Office YOY – Year over Year 25