UNITED STATES
SECURITIES AND EXCHANGE COMMISSION
WASHINGTON, D.C. 20549
FORM 8-K
CURRENT REPORT
Pursuant to Section 13 or 15(d)
of the Securities Exchange Act of 1934
Date of report (Date of earliest event reported): December 11, 2025

(Exact name of registrant as specified in its charter)
Delaware |
|
001-35720 |
|
45-3052669 |
|
(State or other jurisdiction of incorporation) |
|
(Commission File Number) |
|
(I.R.S. Employer Identification No.) |
15 Koch Road, Corte Madera, California 94925
(Address of principal executive offices) (Zip Code)
Registrant’s telephone number, including area code: (415) 924-1005
N/A
(Former name or former address, if changed since last report.)
Check the appropriate box below if the Form 8-K filing is intended to simultaneously satisfy the filing obligation of the registrant under any of the following provisions (see General Instruction A.2. below):
☐ |
Written communications pursuant to Rule 425 under the Securities Act (17 CFR 230.425) |
☐ |
Soliciting material pursuant to Rule 14a-12 under the Exchange Act (17 CFR 240.14a-12) |
☐ |
Pre-commencement communications pursuant to Rule 14d-2(b) under the Exchange Act (17 CFR 240.14d-2(b)) |
☐ |
Pre-commencement communications pursuant to Rule 13e-4(c) under the Exchange Act (17 CFR 240.13e-4(c)) |
Securities registered pursuant to Section 12(b) of the Act:
Title of each class |
|
Trading symbol |
|
Name of each exchange on which registered |
Common Stock, $0.0001 par value |
|
RH |
|
New York Stock Exchange |
Indicate by check mark whether the registrant is an emerging growth company as defined in Rule 405 of the Securities Act of 1933 (§230.405 of this chapter) or Rule 12b-2 of the Securities Exchange Act of 1934 (§240.12b-2 of this chapter).
Emerging growth company ☐
If an emerging growth company, indicate by check mark if the registrant has elected not to use the extended transition period for complying with any new or revised financial accounting standards provided pursuant to Section 13(a) of the Exchange Act. ☐
Item 2.02. Results of Operations and Financial Condition.
On December 11, 2025, RH released its financial results for the third quarter ended November 1, 2025 in a letter to shareholders that is available on the investor relations section of its website. Copies of the press release announcing the release of financial results and the letter to shareholders are attached hereto as Exhibits 99.1 and 99.2, respectively, and are incorporated herein by reference.
The information provided in this Item 2.02, including Exhibits 99.1 and 99.2, is intended to be “furnished” and shall not be deemed “filed” for purposes of Section 18 of the Securities Exchange Act of 1934, as amended (the “Exchange Act”), or otherwise subject to the liabilities of that section, nor shall it be deemed incorporated by reference into any other filing under the Securities Act of 1933, as amended (the “Securities Act”), or the Exchange Act, except as expressly set forth by specific reference in such a filing.
RH is also disclosing that it may use the rh.com, restorationhardware.com, and ir.rh.com websites as means of disclosing material non-public information and for complying with its disclosure obligations under Regulation FD.
Item 9.01. Financial Statements and Exhibits.
(d) |
Exhibits. |
Exhibit |
|
Description |
99.1 |
|
Press Release dated December 11, 2025 announcing the release of third quarter 2025 results. |
|
|
|
99.2 |
|
RH third quarter 2025 financial results and shareholder letter dated December 11, 2025. |
|
|
|
104 |
|
Cover Page Interactive Data File––the cover page XBRL tags are embedded within the Inline XBRL document. |
SIGNATURES
Pursuant to the requirements of the Securities Exchange Act of 1934, as amended, the registrant has duly caused this report to be signed on its behalf by the undersigned hereunto duly authorized.
|
||
|
|
|
Dated: December 11, 2025 |
By: |
/s/ Jack Preston |
|
Jack Preston |
|
|
Chief Financial Officer |
|
Exhibit 99.1
RH REPORTS THIRD QUARTER FISCAL 2025 RESULTS
CORTE MADERA, Calif.--(BUSINESS WIRE)—December 11, 2025--RH (NYSE: RH) has released its financial results for the third quarter ended November 1, 2025, in a shareholder letter from Chairman and Chief Executive Officer Gary Friedman, available on the Investor Relations section of its website at ir.rh.com.
As previously announced, RH leadership will host a live conference call and audio webcast at 2:00 pm Pacific Time (5:00 pm Eastern Time) today. The live conference call may be accessed by dialing 800.715.9871 or 646.307.1963 for international callers (conference ID: 8284432). The call and replay can also be accessed via audio webcast at ir.rh.com.
ABOUT RH
RH (NYSE: RH) is a global curator of design, taste and style in the luxury lifestyle market. Operating across the United States, Canada, the United Kingdom and Europe, the Company offers collections through its retail galleries, sourcebooks and online at RH.com, RHModern.RH.com, RHBabyandChild.RH.com, RHTEEN.RH.com and Waterworks.com, with integrated hospitality experiences in galleries throughout the United States and internationally.
CONTACTS
PRESS CONTACT
truthgroup@RH.com
INVESTOR RELATIONS CONTACT
Allison Malkin, 203.682.8225, allison.malkin@icrinc.com
1
Exhibit 99.2

THIRD QUARTER 2025 FINANCIAL RESULTS AND SHAREHOLDER LETTER RH REPORTS THIRD QUARTER 2025 REVENUES INCREASED 9%, NET INCOME INCREASED 9% AND FREE CASH FLOW OF $83M

A LETTER FROM OUR CHAIRMAN AND CEO
THIRD QUARTER 2025 HIGHLIGHTS
GAAP Net Revenues Increased 9% to $884M
GAAP Net Income Increased 9% to $36M
GAAP Operating Margin of 12.0%, Adjusted Operating Margin of 11.6%
EBITDA Margin of 16.2%, Adjusted EBITDA Margin of 17.6%
Free Cash Flow of $83M
Please see the tables below for reconciliations of all GAAP to non-GAAP measures referenced in this press release.
There are no adjustments to GAAP net revenues presented in this press release.
TO OUR PEOPLE, PARTNERS AND SHAREHOLDERS
We continued to generate industry leading growth with revenue increasing 9% in the third quarter, and up 18% on a two-year basis demonstrating the disruptive nature of our brand despite the worst housing market in almost 50 years, and the polarizing impact of tariffs.
Adjusted operating margin of 11.6% was below the 12.5% mid-point of our guidance due to higher than forecasted tariff expense on prior period special order and back order sales delivered in the quarter and higher than expected Paris opening expenses.
Adjusted EBITDA was 17.6% and we generated $83 million of free cash flow in Q3. Year-to-date free cash flow reached $198 million and we are on track to achieve our outlook range of $250M to $300M for the year.
Net debt at the end of the quarter was $2.427 billion, down $85M from Q2. We ended Q3 with real estate assets that we believe have an estimated equity value of approximately $500 million that we plan to monetize opportunistically as market conditions warrant. Additionally, we are making progress on our goal of reducing excess inventory, estimated at $300 million, with inventory down 11% versus last year, and down $82 million versus the second quarter.
1 |
THIRD QUARTER 2025 FINANCIAL RESULTS AND SHAREHOLDER LETTER |
||
While a meaningful portion of our market share gains are coming from the fragmented To-The-Trade design showrooms, regional high-end furniture stores, and local independent boutiques, we are also gaining share from the better furniture-based national brands as you can see from the table below.
RH CONTINUED TO GENERATE INDUSTRY LEADING GROWTH AND GAIN SIGNIFICANT MARKET SHARE IN THE THIRD QUARTER ON BOTH A ONE AND TWO-YEAR BASIS
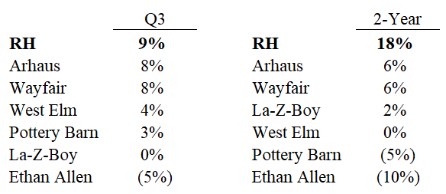
I would point out that our share gains on a two-year basis range from a low of 12 points to a high of 28 points. We find it fascinating that the market chooses to reward companies that set remarkably low expectations and slightly beat them, versus setting high expectations, as we do, and at times miss them, while still meaningfully outperforming our industry.
OUTLOOK
We are providing the following updated financial outlook, reflecting our year-to-date performance and our current trends:
Fourth Quarter 2025
Revenue Growth of 7% to 8%
Adjusted Operating Margin of 12.5% to 13.5%
Adjusted EBITDA Margin of 18.7% to 19.6%
The above outlook includes an approximate negative 200 basis point operating margin impact from investments and startup costs to support our international expansion and a 170 basis point impact from tariffs, net of mitigations.
Fiscal Year 2025
Revenue Growth of 9.0% to 9.2%
Adjusted Operating Margin of 11.6% to 11.9%
Adjusted EBITDA Margin of 17.6% to 18.0%
Free Cash Flow of $250M to $300M
The above outlook includes an approximate negative 210 basis point operating margin impact from investments and startup costs to support our international expansion and a 90 basis point impact from tariffs, net of mitigations.
2 |
THIRD QUARTER 2025 FINANCIAL RESULTS AND SHAREHOLDER LETTER |
||
IN THE SHORT RUN, THE MARKET IS A VOTING MACHINE, BUT IN THE LONG RUN, IT IS A WEIGHING MACHINE. – Benjamin Graham
We are a company that is playing the long game, historically innovating and investing during uncertain times.
We also believe post this high investment cycle and historically low housing market, the weighing machine, as it has done over our 25-year history, will accurately reward us for the truly unique, high-performance brand we are building.
On the other hand, there is no denying what an unusual time it is in our industry, and we also believe…
NOT A TIME TO UNDERESTIMATE RISK - WE ARE IN THE THIRD YEAR OF THE WORST HOUSING MARKET IN ALMOST 50 YEARS
In 1978 there were 4.09 million existing homes sold when the U.S. had a population of 223M.
We are on track to average 4.07 million existing homes sold from 2023 to 2025 with a U.S. population of 341 million, or 53% higher than 1978.
This is a market we’ve never seen before.
NOT A TIME TO UNDERESTIMATE RISK - TARIFFS ARE DISRUPTING SUPPLY CHAINS AND DRIVING HIGHER PRICES
There have been 16 different tariff announcements over the past 10 months that have resulted in significant resourcing, product delays, out of stocks, and driven multiple rounds of price negotiations and increases.
Despite the chaos, we continue to demonstrate our ability to gain meaningful market share while aggressively investing in strategies that we believe will create long term strategic separation.
WHILE NOT A TIME TO UNDERESTIMATE RISK - ALSO NOT A TIME TO RUN FROM IT
It’s important to separate the signal from the noise, and remember, necessity is the mother of invention.
Our most important innovations were birthed during the most challenging and uncertain times.
OUR STRATEGIC SEPARATION IS THE RESULT OF INNOVATING AND INVESTING DURING THOSE UNCERTAIN TIMES, AND THIS TIME IS NO DIFFERENT
Launching the most prolific product transformation in the history of our industry and believe the launch of our new concept in the Spring of next year will reaccelerate our growth and create another step change in our business.
Building an iconic global selling platform that will likely never be duplicated in our lifetimes. Construction costs post COVID have doubled across the industry, making it very difficult to emulate our immersive platform. At the same time, we have created new equally immersive physical experiences that are massively more capital efficient that we plan to unveil on our call next quarter.
We just opened what might be the most beautiful and talked about retail experience in the world, in arguably the most important city in the world, especially if your vision is to build a global luxury brand. You know which one I’m talking about. RH Paris, you have to see it to believe it.
3 |
THIRD QUARTER 2025 FINANCIAL RESULTS AND SHAREHOLDER LETTER |
||
Developing a global hospitality business that generates significant brand awareness and cash flow. We have built a powerful restaurant company that is seamlessly integrated into our core business that will generate operating income that represents, on average 65% of the aggregate Galleries rent they reside in. The RH Ocean Grill at RH Newport Beach is our first $20 million plus restaurant that we believe will reach the mid-twenties in its second full year, and its cash flow next year might cover the rent for the entire 90,000 square foot Gallery.
Establishing a global Interior Design Firm that is moving the brand beyond presenting and selling products to conceptualizing and selling spaces. We opened our first freestanding RH Interior Design Office in Palm Desert, California, with no product except for two small sitting areas in front of our designers’ offices. It’s a real freestanding, customer facing Design Firm, and it’s generating a million dollars a month in design business in 3,000 square feet, with rent of $200 thousand a year. You can do the math.
All of which is resulting in building a brand with no peer while generating industry leading growth with high teens adjusted EBITDA margin.
Imagine what our performance will look like in a robust housing market as we cycle and leverage these investments?
Never underestimate the power of a few good people who don’t know what can’t be done.
Especially these people.
Carpe Diem,

Gary Friedman
Chairman & Chief Executive Officer
4 |
THIRD QUARTER 2025 FINANCIAL RESULTS AND SHAREHOLDER LETTER |
||
Footnote to Q3 Revenue Growth table:
Information presented in this table is derived from the quarterly net revenues, net sales, or sales data, as applicable, disclosed in each company’s most recently ended fiscal quarter filing, as well as the comparable filing from the prior year for each company. West Elm and Pottery Barn are brands of Williams-Sonoma, Inc. and net revenues for these brands are derived from the segment reporting footnote included in Williams-Sonoma, Inc.’s filings. Our measure of revenues and net revenues are not necessarily comparable to other similarly titled captions for other companies due to different methods of calculation.
Note:
Demand is an operating metric that we use in reference to the dollar value of orders placed (orders convert to net revenue upon a customer obtaining control of the merchandise) and excludes exchanges, shipping fees and cancellations. Demand represents the demand generated from all of our businesses including RH Interiors, RH Modern, RH Contemporary, RH Outdoor, RH Baby & Child, RH TEEN, RH Contract, Membership, Dmitriy & Co, Joseph Jeup and Waterworks, as well as sales from RH Hospitality and RH Outlet.
Gallery demand included in this press release represents merchandise orders placed in the Gallery, as well as hospitality sales at the Gallery, if applicable, and includes Membership.
RH England online demand included in this press release represents merchandise orders placed by customers via our website with a shipping address within the United Kingdom, and includes Membership.
Comparable Galleries represent locations that have been open for at least 12 consecutive months as of the end of the reporting period and did not change square footage by more than 20% between periods.
5 |
THIRD QUARTER 2025 FINANCIAL RESULTS AND SHAREHOLDER LETTER |
||
NON-GAAP FINANCIAL MEASURES
To supplement our consolidated financial statements, which are prepared and presented in accordance with Generally Accepted Accounting Principles (“GAAP”), we use the following non-GAAP financial measures: adjusted net revenues, adjusted operating income, adjusted net income, adjusted diluted net income per share, free cash flow, adjusted free cash flow, adjusted gross profit, adjusted gross margin, adjusted selling, general and administrative expenses, adjusted selling, general and administrative expenses margin, adjusted operating margin, adjusted capital expenditures, EBITDA, adjusted EBITDA, EBITDA margin, adjusted EBITDA margin, trailing twelve months EBITDA and trailing twelve months adjusted EBITDA (collectively, “non-GAAP financial measures”). We compute these measures by adjusting the applicable GAAP measures to remove the impact of certain recurring and non-recurring charges and gains and to adjust for the impact of income tax items related to such adjustments to our GAAP financial statements. The presentation of this financial information is not intended to be considered in isolation or as a substitute for, or superior to, the financial information prepared and presented in accordance with GAAP. We use these non-GAAP financial measures for financial and operational decision making and as a means to evaluate period-to-period comparisons. We believe that they provide useful information about operating results, enhance the overall understanding of past financial performance and future prospects, and allow for greater transparency with respect to key metrics used by senior leadership in its financial and operational decision making. The non-GAAP financial measures we use in this release may be different from the non-GAAP financial measures, including similarly titled measures, used by other companies. For more information on the non-GAAP financial measures, please see the Reconciliation of GAAP to non-GAAP financial measures tables in this release. These accompanying tables include details on the GAAP financial measures that are most directly comparable to non-GAAP financial measures and the related reconciliations between these financial measures.
6 |
THIRD QUARTER 2025 FINANCIAL RESULTS AND SHAREHOLDER LETTER |
||
FORWARD-LOOKING STATEMENTS
This release contains forward-looking statements within the meaning of the federal securities laws, including without limitation, our expectations regarding adjusted EBITDA margin and free cash flow, including our outlook for the full year; statements regarding progress on our goal of reducing excess inventory; our expectations regarding market share gains; our beliefs regarding the impact of the current high-investment, historically low housing market and our view that, over time, the market will appropriately reward the unique, high-performance brand we are building; our expectations regarding the impact of tariffs, the housing market and demand trends, market volatility, inflation risk, and global discord; our expectations regarding market share gains, our growth trajectory and the positioning of RH’s brand in 2025 and beyond; our plans regarding global expansion and the expected impact on our business including over the next decade; our beliefs around the desirability of the RH brand globally; our belief that aggressive investing during a downturn positions us to capitalize on certain long-term opportunities, and that such opportunities have begun to materialize; our expectations around the impact of monetary and foreign policy, and geopolitical instability on the housing market; our belief that our investments will create meaningful long-term value for our shareholders; our belief that our product transformation plans represent the most prolific product transformation and platform expansion in the history of our industry; our belief that we are creating the most desirable and distinguished brand in our industry; our beliefs in our ability to make appropriate investments to continue our industry leading growth, while significantly reducing debt and lowering interest expense; our beliefs and expectations around the impact of our Sourcebook mailing strategy in elevating our brand and business; our plans to capitalize on certain demand trends in connection with our Sourcebook mailing strategy; our beliefs and expectations regarding our new brand extension in Spring 2026; our belief that our platform expansion plans represent a multi-billion dollar opportunity; our plans and expectations regarding the acceleration of platform expansion, including with respect to the openings of new Galleries, Design Studios, Outdoor Galleries and New Concept Galleries; our estimates of the equity value of our real estate assets; our plans and other statements relating to our global expansion efforts in Europe and the United Kingdom by opening Galleries in 2025 and 2026, including our expectations for growth in RH England and for inflection in our international business; our plans and expectations for RH England, RH Madrid, RH Paris, RH London and RH Milan; our expectations regarding business conditions for the remainder of 2025 and beyond; our plans and beliefs around our online platform and website strategies, including the timing of such updates and intentions to file design patents on user interface and product presentation designs; our beliefs and plans to monetize our assets based upon market conditions and to convert excess inventory into cash; our beliefs around the risks associated with uncertainty surrounding trade policy, including our expectations regarding the potential effect of increased tariffs on our operations and financial condition; our plans to reposition our supply chain, including the timing of shifting sourcing out of China; our plans and expectations regarding our manufacturing capacity in the U.S. and abroad, including our projections for 2025; our plans and expectations regarding production of products in the U.S. and sourcing of products from production facilities located in the U.S.; our views and projections regarding inflation in the U.S. and its effect; our forecasts and outlook for fiscal 2025 including among other matters increased backlog, investments and startup costs to support our international expansion, demand growth, revenue growth, adjusted operating margin, adjusted EBITDA margin, free cash flow, and adjusted capital expenditures; our plan to open Design Galleries in every major market, generating revenues of $5 to $6 billion in North America, and $20 to $25 billion globally; our beliefs with respect to the RH brand and our products; our strategy to move the brand beyond curating and selling product to conceptualizing and selling spaces by building an ecosystem of Products, Places, Services and Spaces that establishes the RH brand as a global thought leader, taste and place maker; our beliefs regarding the impact of our Galleries, interior design services, and hospitality experiences on our products; our plans and expectations regarding our hospitality efforts, including RH Guesthouses, RH Paris, RH Yountville, RH One and RH Two, our private jets, and RH Three, our luxury yacht; our beliefs regarding the performance of our restaurant platform, including our view that it is an integrated component of our core business that we expect to generate approximately 65% of the aggregate rent of associated galleries and our expectations regarding the performance of The RH Ocean Grill at RH Newport Beach, including revenue and cash flow projections; our goal to create a new market for travelers seeking privacy and luxury in the $200 billion North American hotel industry; our long-term strategy of building the world’s first consumer-facing architecture, interior design and landscape architecture services platform inside our Galleries; our plans and expectations regarding the launch of RH Residences; the entirety of our strategy coming to life digitally with The World of RH; our plans and expectations regarding the introduction of RH Media; our belief that our global expansion plans multiplies the market opportunity to $7 to $10 trillion; our belief that no one is better positioned than RH to create an ecosystem that makes taste inclusive, and by doing so, elevating and rendering our way of life more valuable; and any statements or assumptions underlying any of the foregoing.
You can identify forward-looking statements by the fact that they do not relate strictly to historical or current facts. These statements may include words such as “anticipate,” “estimate,” “expect,” “project,” “plan,” “intend,” “believe,” “may,” “will,” “short-term,” “non-recurring,” “one-time,” “unusual,” “should,” “likely” and other words and terms of similar meaning in connection with any discussion of the timing or nature of future operating or financial performance or other events. Forward-looking statements are subject to risk and uncertainties that may cause actual results to differ materially from those that we expected. We derive many of our forward-looking statements from our operating budgets and forecasts, which are based upon many detailed assumptions. While we believe that our assumptions are reasonable, we caution that it is very difficult to predict the impact of known factors and it is impossible for us to anticipate all factors that could affect our actual results. Matters that we identify as “short-term,” “non-recurring,” “unusual,” “one-time,” or other words and terms of similar meaning may, in fact, not be short term and may recur in one or more future financial reporting periods. We cannot assure you that we will realize the results or developments we expect or anticipate or, even if substantially realized, that they will result in the consequences or affect us or our operations in the way we expect, or that future developments affecting us will be those that we have anticipated. Our expectations around operating metrics
7 |
THIRD QUARTER 2025 FINANCIAL RESULTS AND SHAREHOLDER LETTER |
||
and our outlook for future financial periods are inherently subject to risks, uncertainties, and changes in circumstances that could cause actual results to differ materially from projections. All discussions of new developments are subject to inherent uncertainty as to timing and the manner in which a new development may ultimately be launched including that certain new concepts may be canceled prior to introduction. Important risks and uncertainties that could cause actual results to differ materially from our expectations include, among others, risks related to our dependence on key personnel and any changes in key personnel; negative publicity; successful implementation of our growth strategy; uncertainties in the current and long-term performance of our business including a range of risks related to our operations as well as external economic factors; general economic conditions and the impact on consumer confidence and spending; changes in customer demand for our products; decisions concerning the allocation of capital including the extent to which we repurchase additional shares of our common stock which will affect shares outstanding and EPS; factors affecting our outstanding indebtedness; our ability to anticipate consumer preferences and buying trends, and maintain our brand promise to customers; changes in consumer spending based on weather and other conditions beyond our control; risks related to the number of new business initiatives we are undertaking including international expansion, our real estate and Gallery development strategy and our expansion into new business areas such as hospitality; strikes and work stoppages affecting port workers and other industries involved in the transportation of our products; our ability to obtain our products in a timely fashion or in the quantities required; risks related to our sourcing and supply chain including our dependence on imported products produced by foreign manufacturers and risks related to importation of such products; risks related to the operations of our vendors; risks related to tariffs; and those other risks and uncertainties disclosed under the sections entitled “Risk Factors” and “Management’s Discussion and Analysis of Financial Condition and Results of Operations” in RH’s Annual Report on Form 10-K most recently filed with the Securities and Exchange Commission (“SEC”), and similar disclosures in subsequent reports filed with the SEC, which are available on our investor relations website at ir.rh.com and on the SEC website at www.sec.gov. You should not place undue reliance on these forward-looking statements. Any forward-looking statement made by us in this release speaks only as of the date on which we made it. RH expressly disclaims any obligation or undertaking to release publicly any updates or revisions to such forward-looking statements to reflect any change in its expectations with regard thereto, whether as a result of new information or any changes in the events, conditions or circumstances on which any such forward-looking statement is based except as required by law. All forward-looking statements attributable to us, or persons acting on our behalf, are expressly qualified in their entirety by these cautionary statements, as well as other cautionary statements. You should evaluate all forward-looking statements made in this release in the context of these risks and uncertainties.
8 |
THIRD QUARTER 2025 FINANCIAL RESULTS AND SHAREHOLDER LETTER |
||
CONDENSED CONSOLIDATED STATEMENTS OF INCOME
(Unaudited)
|
|
THREE MONTHS ENDED |
|
NINE MONTHS ENDED |
|
|
|||||||||||||||||||
|
|
NOVEMBER 1, |
|
% OF NET |
|
NOVEMBER 2, |
|
% OF NET |
|
NOVEMBER 1, |
|
% OF NET |
|
NOVEMBER 2, |
|
% OF NET |
|
||||||||
|
|
2025 |
|
REVENUES |
|
2024 |
|
REVENUES |
|
2025 |
|
REVENUES |
|
2024 |
|
REVENUES |
|
||||||||
|
|
(dollars in thousands, except per share amounts) |
|
||||||||||||||||||||||
Net revenues |
|
$ |
883,810 |
|
100.0 |
% |
|
$ |
811,732 |
|
100.0 |
% |
|
$ |
2,596,913 |
|
100.0 |
% |
|
$ |
2,368,347 |
|
100.0 |
% |
|
Cost of goods sold |
|
|
494,074 |
|
55.9 |
|
|
|
450,392 |
|
55.5 |
|
|
|
1,442,585 |
|
55.5 |
|
|
|
1,316,212 |
|
55.6 |
|
|
Gross profit |
|
|
389,736 |
|
44.1 |
|
|
|
361,340 |
|
44.5 |
|
|
|
1,154,328 |
|
44.5 |
|
|
|
1,052,135 |
|
44.4 |
|
|
Selling, general and administrative expenses |
|
|
283,806 |
|
32.1 |
|
|
|
259,872 |
|
32.0 |
|
|
|
863,611 |
|
33.3 |
|
|
|
799,877 |
|
33.7 |
|
|
Operating income |
|
|
105,930 |
|
12.0 |
|
|
|
101,468 |
|
12.5 |
|
|
|
290,717 |
|
11.2 |
|
|
|
252,258 |
|
10.7 |
|
|
Other expenses |
|
|
|
|
|
|
|
|
|
|
|
|
|
|
|
|
|
|
|
|
|
|
|
|
|
Interest expense—net |
|
|
57,152 |
|
6.5 |
|
|
|
57,590 |
|
7.1 |
|
|
|
171,113 |
|
6.6 |
|
|
|
173,624 |
|
7.4 |
|
|
Other (income) expense—net |
|
|
694 |
|
0.1 |
|
|
|
27 |
|
0.0 |
|
|
|
(3,533) |
|
(0.1) |
|
|
|
529 |
|
0.0 |
|
|
Total other expenses |
|
|
57,846 |
|
6.6 |
|
|
|
57,617 |
|
7.1 |
|
|
|
167,580 |
|
6.5 |
|
|
|
174,153 |
|
7.4 |
|
|
Income before taxes and equity method investments |
|
|
48,084 |
|
5.4 |
|
|
|
43,851 |
|
5.4 |
|
|
|
123,137 |
|
4.7 |
|
|
|
78,105 |
|
3.3 |
|
|
Income tax expense |
|
|
11,625 |
|
1.3 |
|
|
|
9,256 |
|
1.1 |
|
|
|
33,784 |
|
1.3 |
|
|
|
10,882 |
|
0.5 |
|
|
Income before equity method investments |
|
|
36,459 |
|
4.1 |
|
|
|
34,595 |
|
4.3 |
|
|
|
89,353 |
|
3.4 |
|
|
|
67,223 |
|
2.8 |
|
|
Share of equity method investments (income) loss—net |
|
|
194 |
|
0.0 |
|
|
|
1,427 |
|
0.2 |
|
|
|
(6,659) |
|
(0.3) |
|
|
|
8,728 |
|
0.3 |
|
|
Net income |
|
$ |
36,265 |
|
4.1 |
% |
|
$ |
33,168 |
|
4.1 |
% |
|
$ |
96,012 |
|
3.7 |
% |
|
$ |
58,495 |
|
2.5 |
% |
|
Weighted-average shares used in computing basic net income per share |
|
|
18,760,088 |
|
|
|
|
|
18,534,815 |
|
|
|
|
|
18,742,109 |
|
|
|
|
|
18,439,159 |
|
|
|
|
Basic net income per share |
|
$ |
1.93 |
|
|
|
|
$ |
1.79 |
|
|
|
|
$ |
5.12 |
|
|
|
|
$ |
3.17 |
|
|
|
|
Weighted-average shares used in computing diluted net income per share |
|
|
19,807,541 |
|
|
|
|
|
19,981,011 |
|
|
|
|
19,819,369 |
|
|
19,960,108 |
|
|
|
|||||
Diluted net income per share |
|
$ |
1.83 |
|
|
|
|
$ |
1.66 |
|
|
|
|
$ |
4.84 |
|
|
|
|
$ |
2.93 |
|
|
|
|
T-1 |
THIRD QUARTER 2025 FINANCIAL RESULTS AND SHAREHOLDER LETTER |
|
CONDENSED CONSOLIDATED BALANCE SHEETS
(Unaudited)
|
|
NOVEMBER 1, |
|
FEBRUARY 1, |
|
||
|
|
2025 |
|
2025 |
|
||
|
|
(in thousands) |
|||||
ASSETS |
|
|
|
|
|
|
|
Cash and cash equivalents |
|
$ |
43,086 |
|
$ |
30,413 |
|
Merchandise inventories |
|
|
874,914 |
|
|
1,019,591 |
|
Other current assets |
|
|
206,400 |
|
|
241,327 |
|
Total current assets |
|
|
1,124,400 |
|
|
1,291,331 |
|
Property and equipment—net |
|
|
2,175,433 |
|
|
1,883,176 |
|
Operating lease right-of-use assets |
|
|
726,556 |
|
|
617,103 |
|
Goodwill and intangible assets—net |
|
|
223,463 |
|
|
217,061 |
|
Equity method investments |
|
|
121,404 |
|
|
126,909 |
|
Other non-current assets |
|
|
422,485 |
|
|
419,109 |
|
Total assets |
|
$ |
4,793,741 |
|
$ |
4,554,689 |
|
LIABILITIES AND STOCKHOLDERS’ EQUITY (DEFICIT) |
|
|
|
|
|
|
|
Liabilities |
|
|
|
|
|
|
|
Accounts payable and accrued expenses |
|
$ |
376,628 |
|
$ |
413,406 |
|
Deferred revenue and customer deposits |
|
|
348,932 |
|
|
291,815 |
|
Other current liabilities |
|
|
220,687 |
|
|
199,905 |
|
Total current liabilities |
|
|
946,247 |
|
|
905,126 |
|
Asset based credit facility |
|
|
65,000 |
|
|
200,000 |
|
Term loan B—net |
|
|
1,890,567 |
|
|
1,903,144 |
|
Term loan B-2—net |
|
|
467,483 |
|
|
468,019 |
|
Real estate loans—net |
|
|
15,280 |
|
|
15,524 |
|
Non-current operating lease liabilities |
|
|
658,328 |
|
|
573,468 |
|
Non-current finance lease liabilities |
|
|
721,613 |
|
|
630,655 |
|
Other non-current liabilities |
|
|
25,877 |
|
|
22,342 |
|
Total liabilities |
|
|
4,790,395 |
|
|
4,718,278 |
|
Stockholders’ equity (deficit) |
|
|
3,346 |
|
|
(163,589) |
|
Total liabilities and stockholders’ equity (deficit) |
|
$ |
4,793,741 |
|
$ |
4,554,689 |
|
T-2 |
THIRD QUARTER 2025 FINANCIAL RESULTS AND SHAREHOLDER LETTER |
|
CONDENSED CONSOLIDATED STATEMENTS OF CASH FLOWS
(Unaudited)
|
|
NINE MONTHS ENDED |
|
||||
|
|
NOVEMBER 1, |
|
NOVEMBER 2, |
|
||
|
|
2025 |
|
2024 |
|
||
|
|
(in thousands) |
|||||
CASH FLOWS FROM OPERATING ACTIVITIES |
|
|
|
|
|
|
|
Net income |
|
$ |
96,012 |
|
$ |
58,495 |
|
Adjustments to reconcile net income to net cash provided by operating activities: |
|
|
|
|
|
|
|
Non-cash operating lease cost and finance lease interest expense |
|
|
106,933 |
|
|
95,434 |
|
Depreciation and amortization |
|
|
108,241 |
|
|
96,082 |
|
Stock-based compensation expense |
|
|
35,315 |
|
|
33,757 |
|
Asset impairments |
|
|
5,883 |
|
|
20,535 |
|
Share of equity method investments (income) loss—net |
|
|
(6,659) |
|
|
8,728 |
|
Distribution of return on equity method investment |
|
|
4,630 |
|
|
— |
|
Other non-cash items |
|
|
6,544 |
|
|
11,928 |
|
Change in assets and liabilities: |
|
|
|
|
|
|
|
Merchandise inventories |
|
|
155,251 |
|
|
(224,244) |
|
Prepaid expense and other assets |
|
|
(21,507) |
|
|
13,084 |
|
Landlord assets under construction—net of tenant allowances |
|
|
(64,691) |
|
|
(33,032) |
|
Accounts payable and accrued expenses |
|
|
(30,070) |
|
|
43,812 |
|
Deferred revenue and customer deposits |
|
|
52,313 |
|
|
25,065 |
|
Other changes in assets and liabilities |
|
|
(92,020) |
|
|
(113,775) |
|
Net cash provided by operating activities |
|
|
356,175 |
|
|
35,869 |
|
CASH FLOWS FROM INVESTING ACTIVITIES |
|
|
|
|
|
|
|
Capital expenditures |
|
|
(158,387) |
|
|
(179,897) |
|
Acquisition of business |
|
|
(32,119) |
|
|
— |
|
Equity method investments |
|
|
(374) |
|
|
(9,620) |
|
Distribution of return of equity method investment |
|
|
7,916 |
|
|
— |
|
Other investing activities |
|
|
904 |
|
|
— |
|
Net cash used in investing activities |
|
|
(182,060) |
|
|
(189,517) |
|
CASH FLOWS FROM FINANCING ACTIVITIES |
|
|
|
|
|
|
|
Net borrowings (repayments) under asset based credit facility |
|
|
(135,000) |
|
|
190,000 |
|
Repayments under term loans |
|
|
(18,750) |
|
|
(18,750) |
|
Debt issuance costs |
|
|
(2,997) |
|
|
— |
|
Repayments of convertible senior notes |
|
|
— |
|
|
(41,904) |
|
Principal payments under finance lease agreements—net of tenant allowances |
|
|
(7,789) |
|
|
(19,609) |
|
Repurchases of common stock—inclusive of excise taxes paid |
|
|
— |
|
|
(11,988) |
|
Proceeds from exercise of stock options |
|
|
2,201 |
|
|
19,241 |
|
Other financing activities |
|
|
(309) |
|
|
(232) |
|
Net cash provided by (used in) financing activities |
|
|
(162,644) |
|
|
116,758 |
|
Effects of foreign currency exchange rate translation on cash |
|
|
1,202 |
|
|
214 |
|
Net increase (decrease) in cash and cash equivalents |
|
|
12,673 |
|
|
(36,676) |
|
Cash and cash equivalents |
|
|
|
|
|
|
|
Beginning of period |
|
|
30,413 |
|
|
123,688 |
|
End of period |
|
$ |
43,086 |
|
$ |
87,012 |
|
T-3 |
THIRD QUARTER 2025 FINANCIAL RESULTS AND SHAREHOLDER LETTER |
|
CALCULATION OF FREE CASH FLOW
(Unaudited)
|
|
THREE MONTHS ENDED |
|
NINE MONTHS ENDED |
|
||||||||
|
|
NOVEMBER 1, |
|
NOVEMBER 2, |
|
NOVEMBER 1, |
|
NOVEMBER 2, |
|
||||
|
|
2025 |
|
2024 |
|
2025 |
|
2024 |
|
||||
|
|
(in thousands) |
|||||||||||
Net cash provided by (used in) operating activities |
|
$ |
131,856 |
|
$ |
(31,437) |
|
$ |
356,175 |
|
$ |
35,869 |
|
Capital expenditures |
|
|
(48,822) |
|
|
(64,557) |
|
|
(158,387) |
|
|
(179,897) |
|
Free cash flow(1) |
|
$ |
83,034 |
|
$ |
(95,994) |
|
$ |
197,788 |
|
$ |
(144,028) |
|
| (1) | Free cash flow is a supplemental measure of financial performance that is not required by, or presented in accordance with, GAAP. We define free cash flow as net cash provided by (used in) operating activities less capital expenditures. Free cash flow is included in this shareholder letter because we believe that this measure provides useful information to our senior leadership team and investors in understanding the strength of our liquidity and our ability to generate additional cash from our business operations. Free cash flow should not be considered in isolation or as an alternative to cash flows from operations calculated in accordance with GAAP and should be considered alongside our other liquidity performance measures that are calculated in accordance with GAAP, such as net cash provided by operating activities and our other GAAP financial results. Our senior leadership team uses this non-GAAP financial measure in order to have comparable financial results for the purpose of analyzing changes in our underlying business from quarter to quarter. Our measure of free cash flow is not necessarily comparable to other similarly titled measures for other companies due to different methods of calculation. |
T-4 |
THIRD QUARTER 2025 FINANCIAL RESULTS AND SHAREHOLDER LETTER |
|
CALCULATION OF ADJUSTED CAPITAL EXPENDITURES
(Unaudited)
|
|
THREE MONTHS ENDED |
|
NINE MONTHS ENDED |
|
||||||||
|
|
NOVEMBER 1, |
|
NOVEMBER 2, |
|
NOVEMBER 1, |
|
NOVEMBER 2, |
|
||||
|
|
2025 |
|
2024 |
|
2025 |
|
2024 |
|
||||
|
|
(in thousands) |
|||||||||||
Capital expenditures |
|
$ |
48,822 |
|
$ |
64,557 |
|
$ |
158,387 |
|
$ |
179,897 |
|
Landlord assets under construction—net of tenant allowances |
|
|
18,205 |
|
|
15,571 |
|
|
64,691 |
|
|
33,032 |
|
Adjusted capital expenditures(1)(2) |
|
$ |
67,027 |
|
$ |
80,128 |
|
$ |
223,078 |
|
$ |
212,929 |
|
| (1) | Adjusted capital expenditures is a supplemental measure of financial performance that is not required by, or presented in accordance with, GAAP. We define adjusted capital expenditures as capital expenditures from investing activities and cash outflows of capital related to construction activities to design and build landlord-owned leased assets, net of tenant allowances received during the construction period. Adjusted capital expenditures is included in this shareholder letter because our senior leadership team believes that adjusted capital expenditures provides meaningful supplemental information for investors regarding the performance of our business and facilitates a meaningful evaluation of operating results on a comparable basis with historical results. Our senior leadership team uses this non-GAAP financial measure in order to have comparable financial results to analyze changes in our underlying business from quarter to quarter. Our measure of adjusted capital expenditures is not necessarily comparable to other similarly titled measures for other companies due to different methods of calculation. |
| (2) | Landlord tenant allowances received subsequent to lease commencement are reflected as a reduction to principal payments under finance lease agreements—net of tenant allowances within financing activities on the condensed consolidated statements of cash flows and are excluded from our calculation of adjusted capital expenditures. We received landlord tenant allowances subsequent to lease commencement of $9.1 million and $15 million in the three and nine months ended November 1, 2025, respectively. We did not receive any such tenant allowances in the three or nine months ended November 2, 2024. |
T-5 |
THIRD QUARTER 2025 FINANCIAL RESULTS AND SHAREHOLDER LETTER |
|
RECONCILIATION OF GAAP NET INCOME TO ADJUSTED NET INCOME
(Unaudited)
|
|
THREE MONTHS ENDED |
|
NINE MONTHS ENDED |
|
||||||||
|
|
NOVEMBER 1, |
|
NOVEMBER 2, |
|
NOVEMBER 1, |
|
NOVEMBER 2, |
|
||||
|
|
2025 |
|
2024 |
|
2025 |
|
2024 |
|
||||
|
|
(in thousands) |
|
||||||||||
GAAP net income |
|
$ |
36,265 |
|
$ |
33,168 |
|
$ |
96,012 |
|
$ |
58,495 |
|
Adjustments (pre-tax): |
|
|
|
|
|
|
|
|
|
|
|
|
|
Cost of goods sold: |
|
|
|
|
|
|
|
|
|
|
|
|
|
Asset impairments(1) |
|
|
— |
|
|
— |
|
|
2,584 |
|
|
— |
|
Product recall(2) |
|
|
— |
|
|
— |
|
|
1,424 |
|
|
— |
|
Selling, general and administrative expenses: |
|
|
|
|
|
|
|
|
|
|
|
|
|
Reorganization related costs(3) |
|
|
— |
|
|
— |
|
|
1,233 |
|
|
— |
|
Asset impairments(1) |
|
|
— |
|
|
19,545 |
|
|
1,013 |
|
|
19,545 |
|
Non-cash compensation(4) |
|
|
— |
|
|
861 |
|
|
851 |
|
|
3,669 |
|
Product recall(2) |
|
|
— |
|
|
— |
|
|
489 |
|
|
— |
|
Contract termination settlement—net(5) |
|
|
(3,375) |
|
|
— |
|
|
(3,375) |
|
|
— |
|
Legal settlements—net(6) |
|
|
— |
|
|
— |
|
|
— |
|
|
(9,375) |
|
Subtotal adjusted items |
|
|
(3,375) |
|
|
20,406 |
|
|
4,219 |
|
|
13,839 |
|
Impact of income tax items(7) |
|
|
883 |
|
|
(5,652) |
|
|
799 |
|
|
(5,576) |
|
Share of equity method investments (income) loss—net(8) |
|
|
194 |
|
|
1,427 |
|
|
(6,659) |
|
|
8,728 |
|
Adjusted net income(9) |
|
$ |
33,967 |
|
$ |
49,349 |
|
$ |
94,371 |
|
$ |
75,486 |
|
| (1) | The adjustment to cost of goods sold in the nine months ended November 1, 2025 represents inventory impairment. The adjustment to selling, general and administrative expenses in the nine months ended November 1, 2025 represents property and equipment impairment, primarily associated with Galleries under construction. The adjustment in the three and nine months ended November 2, 2024 includes $19 million of long-lived asset impairment for our two Design Galleries in Germany. The adjustment also includes impairment of pre-acquisition costs related to an unsuccessful joint venture arrangement of $1.0 million. |
| (2) | Represents costs and inventory charges associated with a product recall initiated in the second quarter of fiscal 2025. |
| (3) | Represents severance costs and related payroll taxes associated with a reorganization. |
| (4) | Represents the amortization of the non-cash compensation charge related to an option grant made to Mr. Friedman in October 2020. |
| (5) | Represents a favorable contract termination settlement of $3.8 million, partially offset by costs related to the early termination. |
| (6) | Represents favorable legal settlements received of $10 million, partially offset by costs incurred in connection with one of the matters. |
| (7) | We exclude the GAAP tax provision and apply a non-GAAP tax provision based upon (i) adjusted pre-tax net income, (ii) the projected annual adjusted tax rate and (iii) the exclusion of material discrete tax items that are unusual or infrequent. The adjustments for the three months ended November 1, 2025 and November 2, 2024 are based on adjusted tax rates of 24.0% and 23.2% respectively. The adjustments for the nine months ended November 1, 2025 and November 2, 2024 are based on adjusted tax rates of 25.9% and 17.9%, respectively. |
| (8) | Represents our proportionate share of the net (income) loss of our equity method investments. The adjustment in the nine months ended November 1, 2025 includes a capital distribution of $7.9 million from an Aspen LLC. |
T-6 |
THIRD QUARTER 2025 FINANCIAL RESULTS AND SHAREHOLDER LETTER |
|
| (9) | Adjusted net income is a supplemental measure of financial performance that is not required by, or presented in accordance with, GAAP. We define adjusted net income as consolidated net income, adjusted for the impact of certain non-recurring and other items that we do not consider representative of our underlying operating performance. Adjusted net income is included in this shareholder letter because our senior leadership team believes that adjusted net income provides meaningful supplemental information for investors regarding the performance of our business and facilitates a meaningful evaluation of operating results on a comparable basis with historical results. Our senior leadership team uses this non-GAAP financial measure in order to have comparable financial results to analyze changes in our underlying business from quarter to quarter. Our measure of adjusted net income is not necessarily comparable to other similarly titled measures for other companies due to different methods of calculation. |
T-7 |
THIRD QUARTER 2025 FINANCIAL RESULTS AND SHAREHOLDER LETTER |
|
RECONCILIATION OF DILUTED NET INCOME PER SHARE TO
ADJUSTED DILUTED NET INCOME PER SHARE
(Unaudited)
|
|
THREE MONTHS ENDED |
|
NINE MONTHS ENDED |
|
||||||||
|
|
NOVEMBER 1, |
|
NOVEMBER 2, |
|
NOVEMBER 1, |
|
NOVEMBER 2, |
|
||||
|
|
2025 |
|
2024 |
|
2025 |
|
2024 |
|
||||
Diluted net income per share(1)(2) |
|
$ |
1.83 |
|
$ |
1.66 |
|
$ |
4.84 |
|
$ |
2.93 |
|
Pro forma diluted net income per share(1)(2)(3) |
|
$ |
1.83 |
|
$ |
1.67 |
|
$ |
4.84 |
|
$ |
2.95 |
|
Per share impact of adjustments (pre-tax)(4): |
|
|
|
|
|
|
|
|
|
|
|
|
|
Asset impairments |
|
|
— |
|
|
0.98 |
|
|
0.18 |
|
|
0.99 |
|
Product recall |
|
|
— |
|
|
— |
|
|
0.10 |
|
|
— |
|
Reorganization related costs |
|
|
— |
|
|
— |
|
|
0.06 |
|
|
— |
|
Non-cash compensation |
|
|
— |
|
|
0.04 |
|
|
0.04 |
|
|
0.18 |
|
Contract termination settlement—net |
|
|
(0.17) |
|
|
— |
|
|
(0.17) |
|
|
— |
|
Legal settlements—net |
|
|
— |
|
|
— |
|
|
— |
|
|
(0.47) |
|
Subtotal adjusted items |
|
|
(0.17) |
|
|
1.02 |
|
|
0.21 |
|
|
0.70 |
|
Impact of income tax items(4) |
|
|
0.04 |
|
|
(0.28) |
|
|
0.04 |
|
|
(0.28) |
|
Share of equity method investments (income) loss—net(4) |
|
|
0.01 |
|
|
0.07 |
|
|
(0.33) |
|
|
0.44 |
|
Adjusted diluted net income per share(2)(5) |
|
$ |
1.71 |
|
$ |
2.48 |
|
$ |
4.76 |
|
$ |
3.81 |
|
| (1) | During the three and nine months ended November 2, 2024, we incurred dilution for the principal of the convertible senior notes assuming the if-converted method. For non-GAAP purposes, our adjusted diluted shares outstanding calculation excludes the dilutive impact of the principal value of the convertible senior notes since we have the intent and ability to settle the principal value of such notes in cash. |
| (2) | For the three and nine months ended November 1, 2025, the diluted share count used to calculate our diluted net income per share, pro forma diluted net income per share and adjusted diluted net income per share is the same due to the convertible senior notes maturing in the third quarter of fiscal 2024. |
| (3) | Pro forma diluted net income per share for the three months ended November 2, 2024 is calculated based on GAAP net income and pro forma diluted weighted-average shares of 19,909,594, which excludes dilution of 71,417 shares related to the 2024 Notes. Pro forma diluted net income per share for the nine months ended November 2, 2024 is calculated based on GAAP net income and pro forma diluted weighted-average shares of 19,831,761, which excludes dilution of 128,347 shares related to the 2024 Notes. |
| (4) | Refer to table titled “Reconciliation of GAAP Net Income to Adjusted Net Income” and the related footnotes for additional information. |
| (5) | Adjusted diluted net income per share is a supplemental measure of financial performance that is not required by, or presented in accordance with, GAAP. We define adjusted diluted net income per share as consolidated net income, adjusted for the impact of certain non-recurring and other items that we do not consider representative of our underlying operating performance divided by our diluted share count. Adjusted diluted net income per share is included in this shareholder letter because our senior leadership team believes that adjusted diluted net income per share provides meaningful supplemental information for investors regarding the performance of our business and facilitates a meaningful evaluation of operating results on a comparable basis with historical results. Our senior leadership team uses this non-GAAP financial measure in order to have comparable financial results to analyze changes in our underlying business from quarter to quarter. Our measure of adjusted diluted net income per share is not necessarily comparable to other similarly titled measures for other companies due to different methods of calculation. |
T-8 |
THIRD QUARTER 2025 FINANCIAL RESULTS AND SHAREHOLDER LETTER |
|
RECONCILIATION OF GROSS PROFIT TO
ADJUSTED GROSS PROFIT
(Unaudited)
|
|
THREE MONTHS ENDED |
|
NINE MONTHS ENDED |
|
||||||||
|
|
NOVEMBER 1, |
|
NOVEMBER 2, |
|
NOVEMBER 1, |
|
NOVEMBER 2, |
|
||||
|
|
2025 |
|
2024 |
|
2025 |
|
2024 |
|
||||
|
|
(dollars in thousands) |
|
||||||||||
Gross profit |
|
$ |
389,736 |
|
$ |
361,340 |
|
$ |
1,154,328 |
|
$ |
1,052,135 |
|
Asset impairments(1) |
|
|
— |
|
|
— |
|
|
2,584 |
|
|
— |
|
Product recall(1) |
|
|
— |
|
|
— |
|
|
1,424 |
|
|
— |
|
Adjusted gross profit(2) |
|
$ |
389,736 |
|
$ |
361,340 |
|
$ |
1,158,336 |
|
$ |
1,052,135 |
|
Net revenues |
|
$ |
883,810 |
|
$ |
811,732 |
|
$ |
2,596,913 |
|
$ |
2,368,347 |
|
Gross margin(3) |
|
|
44.1 |
% |
|
44.5 |
% |
|
44.5 |
% |
|
44.4 |
% |
Adjusted gross margin(3) |
|
|
44.1 |
% |
|
44.5 |
% |
|
44.6 |
% |
|
44.4 |
% |
| (1) | Refer to table titled “Reconciliation of GAAP Net Income to Adjusted Net Income” and the related footnotes for additional information. |
| (2) | Adjusted gross profit is a supplemental measure of financial performance that is not required by, or presented in accordance with, GAAP. We define adjusted gross profit as consolidated gross profit, adjusted for the impact of certain non-recurring and other items that we do not consider representative of our underlying operating performance. Adjusted gross profit is included in this shareholder letter because our senior leadership team believes that adjusted gross profit provides meaningful supplemental information for investors regarding the performance of our business and facilitates a meaningful evaluation of operating results on a comparable basis with historical results. Our senior leadership team uses this non-GAAP financial measures in order to have comparable financial results to analyze changes in our underlying business from quarter to quarter. |
| (3) | We define gross margin as gross profit divided by net revenues. We define adjusted gross margin as adjusted gross profit divided by net revenues and use this non-GAAP financial measure for the same reasons we use adjusted gross profit. |
T-9 |
THIRD QUARTER 2025 FINANCIAL RESULTS AND SHAREHOLDER LETTER |
|
RECONCILIATION OF SELLING, GENERAL AND ADMINISTRATIVE EXPENSES TO
ADJUSTED SELLING, GENERAL AND ADMINISTRATIVE EXPENSES
(Unaudited)
|
|
THREE MONTHS ENDED |
|
NINE MONTHS ENDED |
|
||||||||
|
|
NOVEMBER 1, |
|
NOVEMBER 2, |
|
NOVEMBER 1, |
|
NOVEMBER 2, |
|
||||
|
|
2025 |
|
2024 |
|
2025 |
|
2024 |
|
||||
|
|
(dollars in thousands) |
|
||||||||||
Selling, general and administrative expenses |
|
$ |
283,806 |
|
$ |
259,872 |
|
$ |
863,611 |
|
$ |
799,877 |
|
Reorganization related costs(1) |
|
|
— |
|
|
— |
|
|
(1,233) |
|
|
— |
|
Asset impairments(1) |
|
|
— |
|
|
(19,545) |
|
|
(1,013) |
|
|
(19,545) |
|
Non-cash compensation(1) |
|
|
— |
|
|
(861) |
|
|
(851) |
|
|
(3,669) |
|
Product recall(1) |
|
|
— |
|
|
— |
|
|
(489) |
|
|
— |
|
Contract termination settlement—net(1) |
|
|
3,375 |
|
|
— |
|
|
3,375 |
|
|
— |
|
Legal settlements—net(1) |
|
|
— |
|
|
— |
|
|
— |
|
|
9,375 |
|
Adjusted selling, general and administrative expenses(2) |
|
$ |
287,181 |
|
$ |
239,466 |
|
$ |
863,400 |
|
$ |
786,038 |
|
Net revenues |
|
$ |
883,810 |
|
$ |
811,732 |
|
$ |
2,596,913 |
|
$ |
2,368,347 |
|
Selling, general and administrative expenses margin(3) |
|
|
32.1 |
% |
|
32.0 |
% |
|
33.3 |
% |
|
33.7 |
% |
Adjusted selling, general and administrative expenses margin(3) |
|
|
32.5 |
% |
|
29.5 |
% |
|
33.2 |
% |
|
33.2 |
% |
| (1) | Refer to table titled “Reconciliation of GAAP Net Income to Adjusted Net Income” and the related footnotes for additional information. |
| (2) | Adjusted selling, general and administrative expenses is a supplemental measure of financial performance that is not required by, or presented in accordance with, GAAP. We define adjusted selling, general and administrative expenses as consolidated selling, general and administrative expenses, adjusted for the impact of certain non-recurring and other items that we do not consider representative of our underlying operating performance. Adjusted selling, general and administrative expenses is included in this shareholder letter because our senior leadership team believes that adjusted selling, general and administrative expenses provides meaningful supplemental information for investors regarding the performance of our business and facilitates a meaningful evaluation of operating results on a comparable basis with historical results. Our senior leadership team uses this non-GAAP financial measure in order to have comparable financial results to analyze changes in our underlying business from quarter to quarter. Our measure of adjusted selling, general and administrative expenses is not necessarily comparable to other similarly titled measures for other companies due to different methods of calculation. |
| (3) | We define selling, general and administrative expenses margin as selling, general and administrative expenses divided by net revenues. We define adjusted selling, general and administrative expenses margin as adjusted selling, general and administrative expenses divided by net revenues and use this non-GAAP financial measure for the same reasons we use adjusted selling, general and administrative expenses. |
T-10 |
THIRD QUARTER 2025 FINANCIAL RESULTS AND SHAREHOLDER LETTER |
|
RECONCILIATION OF NET INCOME TO OPERATING INCOME
AND ADJUSTED OPERATING INCOME
(Unaudited)
|
|
THREE MONTHS ENDED |
|
NINE MONTHS ENDED |
|
||||||||
|
|
NOVEMBER 1, |
|
NOVEMBER 2, |
|
NOVEMBER 1, |
|
NOVEMBER 2, |
|
||||
|
|
2025 |
|
2024 |
|
2025 |
|
2024 |
|
||||
|
|
(dollars in thousands) |
|||||||||||
Net income |
|
$ |
36,265 |
|
$ |
33,168 |
|
$ |
96,012 |
|
$ |
58,495 |
|
Interest expense—net |
|
|
57,152 |
|
|
57,590 |
|
|
171,113 |
|
|
173,624 |
|
Other (income) expense—net |
|
|
694 |
|
|
27 |
|
|
(3,533) |
|
|
529 |
|
Income tax expense |
|
|
11,625 |
|
|
9,256 |
|
|
33,784 |
|
|
10,882 |
|
Share of equity method investments (income) loss—net |
|
|
194 |
|
|
1,427 |
|
|
(6,659) |
|
|
8,728 |
|
Operating income |
|
|
105,930 |
|
|
101,468 |
|
|
290,717 |
|
|
252,258 |
|
Asset impairments(1) |
|
|
— |
|
|
19,545 |
|
|
3,597 |
|
|
19,545 |
|
Product recall(1) |
|
|
— |
|
|
— |
|
|
1,913 |
|
|
— |
|
Reorganization related costs(1) |
|
|
— |
|
|
— |
|
|
1,233 |
|
|
— |
|
Non-cash compensation(1) |
|
|
— |
|
|
861 |
|
|
851 |
|
|
3,669 |
|
Contract termination settlement—net(1) |
|
|
(3,375) |
|
|
— |
|
|
(3,375) |
|
|
— |
|
Legal settlements—net(1) |
|
|
— |
|
|
— |
|
|
— |
|
|
(9,375) |
|
Adjusted operating income(2) |
|
$ |
102,555 |
|
$ |
121,874 |
|
$ |
294,936 |
|
$ |
266,097 |
|
Net revenues |
|
$ |
883,810 |
|
$ |
811,732 |
|
$ |
2,596,913 |
|
$ |
2,368,347 |
|
Operating margin(3) |
|
|
12.0 |
% |
|
12.5 |
% |
|
11.2 |
% |
|
10.7 |
% |
Adjusted operating margin(3) |
|
|
11.6 |
% |
|
15.0 |
% |
|
11.4 |
% |
|
11.2 |
% |
| (1) | Refer to table titled “Reconciliation of GAAP Net Income to Adjusted Net Income” and the related footnotes for additional information. |
| (2) | Adjusted operating income is a supplemental measure of financial performance that is not required by, or presented in accordance with, GAAP. We define adjusted operating income as consolidated operating income, adjusted for the impact of certain non-recurring and other items that we do not consider representative of our underlying operating performance. Adjusted operating income is included in this shareholder letter because our senior leadership team believes that adjusted operating income provides meaningful supplemental information for investors regarding the performance of our business and facilitates a meaningful evaluation of operating results on a comparable basis with historical results. Our senior leadership team uses this non-GAAP financial measure in order to have comparable financial results to analyze changes in our underlying business from quarter to quarter. Our measure of adjusted operating income is not necessarily comparable to other similarly titled measures for other companies due to different methods of calculation. |
| (3) | We define operating margin as operating income divided by net revenues. We define adjusted operating margin as adjusted operating income divided by net revenues and use this non-GAAP financial measure for the same reasons we use adjusted operating income. We are not able to provide a reconciliation of our adjusted operating margin financial guidance or other non-GAAP financial guidance to the corresponding GAAP measure without unreasonable effort because of the uncertainty and variability of the nature and amount of the non-recurring and other items that are excluded from such non-GAAP financial measures. Such adjustments in future periods are generally expected to be similar to the kinds of charges excluded from such non-GAAP financial measures in prior periods. The exclusion of these charges and costs in future periods could have a significant impact on our non-GAAP financial measures. |
T-11 |
THIRD QUARTER 2025 FINANCIAL RESULTS AND SHAREHOLDER LETTER |
|
RECONCILIATION OF NET INCOME TO EBITDA AND ADJUSTED EBITDA
(Unaudited)
|
|
THREE MONTHS ENDED |
|
NINE MONTHS ENDED |
|
||||||||
|
|
NOVEMBER 1, |
|
NOVEMBER 2, |
|
NOVEMBER 1, |
|
NOVEMBER 2, |
|
||||
|
|
2025 |
|
2024 |
|
2025 |
|
2024 |
|
||||
|
|
(dollars in thousands) |
|
||||||||||
Net income |
|
$ |
36,265 |
|
$ |
33,168 |
|
$ |
96,012 |
|
$ |
58,495 |
|
Depreciation and amortization |
|
|
38,376 |
|
|
32,998 |
|
|
108,241 |
|
|
96,082 |
|
Interest expense—net |
|
|
57,152 |
|
|
57,590 |
|
|
171,113 |
|
|
173,624 |
|
Income tax expense |
|
|
11,625 |
|
|
9,256 |
|
|
33,784 |
|
|
10,882 |
|
EBITDA(1) |
|
|
143,418 |
|
|
133,012 |
|
|
409,150 |
|
|
339,083 |
|
Non-cash compensation(2) |
|
|
11,308 |
|
|
11,684 |
|
|
35,315 |
|
|
33,757 |
|
Capitalized cloud computing amortization(3) |
|
|
3,571 |
|
|
2,852 |
|
|
9,727 |
|
|
8,017 |
|
Asset impairments(4) |
|
|
— |
|
|
19,545 |
|
|
3,597 |
|
|
19,545 |
|
Product recall(4) |
|
|
— |
|
|
— |
|
|
1,913 |
|
|
— |
|
Reorganization related costs(4) |
|
|
— |
|
|
— |
|
|
1,233 |
|
|
— |
|
Share of equity method investments (income) loss—net(4) |
|
|
194 |
|
|
1,427 |
|
|
(6,659) |
|
|
8,728 |
|
Other (income) expense—net(5) |
|
|
694 |
|
|
27 |
|
|
(3,533) |
|
|
529 |
|
Contract termination settlement—net(4) |
|
|
(3,375) |
|
|
— |
|
|
(3,375) |
|
|
— |
|
Legal settlements—net(4) |
|
|
— |
|
|
— |
|
|
— |
|
|
(9,375) |
|
Adjusted EBITDA(1) |
|
$ |
155,810 |
|
$ |
168,547 |
|
$ |
447,368 |
|
$ |
400,284 |
|
Net revenues |
|
$ |
883,810 |
|
$ |
811,732 |
|
$ |
2,596,913 |
|
$ |
2,368,347 |
|
Net income margin(6) |
|
|
4.1 |
% |
|
4.1 |
% |
|
3.7 |
% |
|
2.5 |
% |
EBITDA margin(7) |
|
|
16.2 |
% |
|
16.4 |
% |
|
15.8 |
% |
|
14.3 |
% |
Adjusted EBITDA margin(7) |
|
|
17.6 |
% |
|
20.8 |
% |
|
17.2 |
% |
|
16.9 |
% |
| (1) | EBITDA and adjusted EBITDA are supplemental measures of financial performance that are not required by, or presented in accordance with, GAAP. We define EBITDA as consolidated net income before depreciation and amortization, interest expense—net and income tax expense. Adjusted EBITDA reflects further adjustments to EBITDA to eliminate the impact of non-cash compensation, as well as certain non-recurring and other items that we do not consider representative of our underlying operating performance. EBITDA and adjusted EBITDA are included in this shareholder letter because our senior leadership team believes that these metrics provide meaningful supplemental information for investors regarding the performance of our business and facilitate a meaningful evaluation of operating results on a comparable basis with historical results. Our senior leadership team uses these non-GAAP financial measures in order to have comparable financial results to analyze changes in our underlying business from quarter to quarter. Our measures of EBITDA and adjusted EBITDA are not necessarily comparable to other similarly titled captions for other companies due to different methods of calculation. |
| (2) | Represents non-cash compensation related to equity awards granted to employees, including the non-cash compensation charge related to an option grant made to Mr. Friedman in October 2020. |
| (3) | Represents amortization associated with capitalized cloud computing costs. |
| (4) | Refer to table titled “Reconciliation of GAAP Net Income to Adjusted Net Income” and the related footnotes for additional information. |
T-12 |
THIRD QUARTER 2025 FINANCIAL RESULTS AND SHAREHOLDER LETTER |
|
| (5) | Amounts consisted of the following in each period: |
|
|
THREE MONTHS ENDED |
|
NINE MONTHS ENDED |
|
||||||||
|
|
NOVEMBER 1, |
|
NOVEMBER 2, |
|
NOVEMBER 1, |
|
NOVEMBER 2, |
|
||||
|
|
2025 |
|
2024 |
|
2025 |
|
2024 |
|
||||
|
|
(in thousands) |
|
||||||||||
Foreign exchange from transactions(a) |
|
$ |
398 |
|
$ |
673 |
|
$ |
(335) |
|
$ |
1,811 |
|
Foreign exchange from remeasurement of intercompany loans(b) |
|
|
296 |
|
|
(646) |
|
|
(3,198) |
|
|
(1,282) |
|
Other (income) expense—net |
|
$ |
694 |
|
$ |
27 |
|
$ |
(3,533) |
|
$ |
529 |
|
| (a) | Represents net foreign exchange gains and losses related to exchange rate changes affecting foreign currency denominated transactions, primarily between the U.S. dollar as compared to the euro and pound sterling. |
| (b) | Represents remeasurement of intercompany loans with subsidiaries in Switzerland and the United Kingdom. |
| (6) | We define net income margin as net income divided by net revenues. |
| (7) | We define EBITDA margin as EBITDA divided by net revenues. We define adjusted EBITDA margin as adjusted EBITDA divided by net revenues. We use these non-GAAP financial measures for the same reasons we use EBITDA and adjusted EBITDA. We are not able to provide a reconciliation to the corresponding GAAP measure without unreasonable effort because of the uncertainty and variability of the nature and amount of the non-recurring and other items that are excluded from such non-GAAP financial measures. Such adjustments in future periods are generally expected to be similar to the kinds of charges excluded from such non-GAAP financial measures in prior periods. The exclusion of these charges and costs in future periods could have a significant impact on our non-GAAP financial measures. |
T-13 |
THIRD QUARTER 2025 FINANCIAL RESULTS AND SHAREHOLDER LETTER |
|
RECONCILIATION OF TRAILING TWELVE MONTHS NET INCOME
TO TRAILING TWELVE MONTHS EBITDA AND
TRAILING TWELVE MONTHS ADJUSTED EBITDA
(Unaudited)
|
|
|
TRAILING TWELVE MONTHS |
|
|
|
|
NOVEMBER 1, 2025 |
|
|
|
|
(in thousands) |
|
Net income |
|
$ |
109,929 |
|
Depreciation and amortization |
|
|
142,350 |
|
Interest expense—net |
|
|
228,090 |
|
Income tax expense—net |
|
|
27,701 |
|
EBITDA(1) |
|
|
508,070 |
|
Non-cash compensation(2) |
|
|
45,743 |
|
Asset impairments(3) |
|
|
20,123 |
|
Capitalized cloud computing amortization(4) |
|
|
12,727 |
|
Reorganization related costs(5) |
|
|
5,656 |
|
Product recall(6) |
|
|
1,913 |
|
Share of equity method investments income—net(7) |
|
|
(4,007) |
|
Contract termination fee—net(8) |
|
|
(3,375) |
|
Other income—net(9) |
|
|
(667) |
|
Adjusted EBITDA(1) |
|
$ |
586,183 |
|
| (1) | Refer to footnote (1) within table titled “Reconciliation of Net Income to EBITDA and Adjusted EBITDA.” |
| (2) | Represents non-cash compensation related to equity awards granted to employees, including the non-cash compensation charge related to an option grant made to Mr. Friedman in October 2020. |
| (3) | Includes $18 million of asset impairment for property and equipment of Galleries under construction and $2.6 million of inventory impairment. |
| (4) | Represents amortization associated with capitalized cloud computing costs. |
| (5) | Represents severance costs and related payroll taxes associated with reorganizations. |
| (6) | Represents costs and inventory charges associated with a product recall initiated in the second quarter of fiscal 2025. |
| (7) | Represents our proportionate share of the net income of our equity method investments, inclusive of a capital distribution of $7.9 million from an Aspen LLC received in the first quarter of fiscal 2025. |
| (8) | Represents a favorable contract termination settlement of $3.8 million, partially offset by costs related to the early termination. |
| (9) | Represents exchange rate changes affecting foreign currency denominated transactions and from the remeasurement of intercompany loans with subsidiaries in Switzerland and the United Kingdom. |
T-14 |
THIRD QUARTER 2025 FINANCIAL RESULTS AND SHAREHOLDER LETTER |
|
CALCULATION OF TOTAL DEBT, TOTAL NET DEBT
AND RATIO OF TOTAL NET DEBT TO TRAILING TWELVE MONTHS ADJUSTED EBITDA
(Unaudited)
|
|
NOVEMBER 1, |
|
INTEREST |
|
|
|
|
2025 |
|
RATE(1) |
|
|
|
|
(dollars in thousands) |
|
|
|
|
Asset based credit facility |
|
$ |
65,000 |
|
5.83% |
|
Term loan B(2) |
|
|
1,920,000 |
|
6.58% |
|
Term loan B-2(2) |
|
|
485,000 |
|
7.31% |
|
Notes payable for share repurchases |
|
|
315 |
|
4.14% |
|
Total debt(3) |
|
|
2,470,315 |
|
|
|
Cash and cash equivalents |
|
|
(43,086) |
|
|
|
Total net debt(3) |
|
$ |
2,427,229 |
|
|
|
Trailing twelve months adjusted EBITDA(4) |
|
$ |
586,183 |
|
|
|
Ratio of total net debt to trailing twelve months adjusted EBITDA(4) |
|
|
4.1 |
|
|
|
| (1) | Interest rates for the Term loan B and Term loan B-2 are as of November 1, 2025. Interest rates for the asset based credit facility and notes payable for share repurchases represent the weighted-average interest rate as of November 1, 2025. |
| (2) | Amounts exclude discounts upon original issuance and third-party offering and debt issuance costs. |
| (3) | Excludes non-recourse real estate loans of $18 million, which are secured by specific real estate assets and the associated creditors do not have recourse against RH’s general assets. |
| (4) | The ratio of total net debt to trailing twelve months adjusted EBITDA is calculated by dividing total net debt by trailing twelve months adjusted EBITDA. Refer to table titled “Reconciliation of Net Income to EBITDA and Adjusted EBITDA” and the related footnotes for definitions of EBITDA and adjusted EBITDA. |
T-15 |
THIRD QUARTER 2025 FINANCIAL RESULTS AND SHAREHOLDER LETTER |
|