UNITED STATES
SECURITIES AND EXCHANGE COMMISSION
WASHINGTON, D.C. 20549
FORM 6-K
REPORT OF FOREIGN PRIVATE ISSUER
PURSUANT TO RULE 13a-16 OR 15d-16 UNDER
THE SECURITIES EXCHANGE ACT OF 1934
For the month of November 2025
Commission File Number: 001-39601
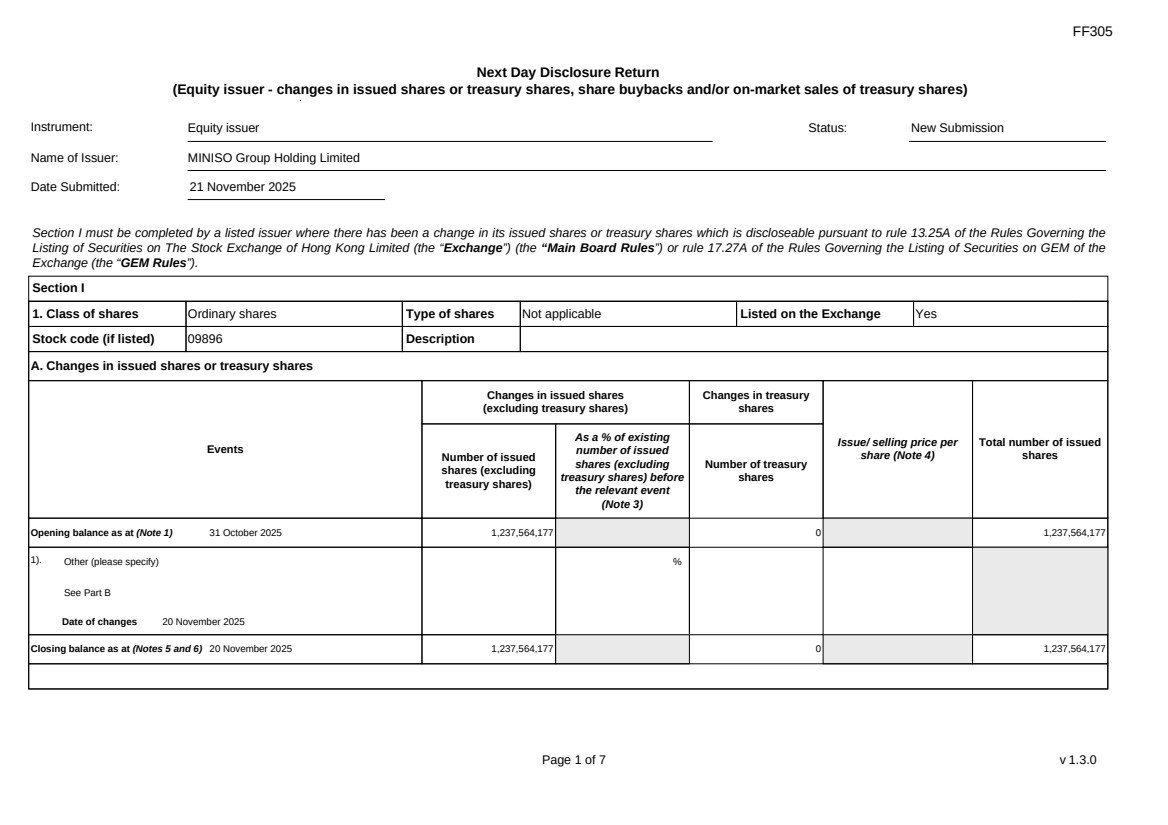
MINISO Group Holding Limited
8F, M Plaza, No. 109, Pazhou Avenue
Haizhu District, Guangzhou 510000, Guangdong Province
The People’s Republic of China
(Address of principal executive offices)
Indicate by check mark whether the registrant files or will file annual reports under cover of Form 20-F or Form 40-F.
Form 20-F x Form 40-F ¨
Exhibit Index
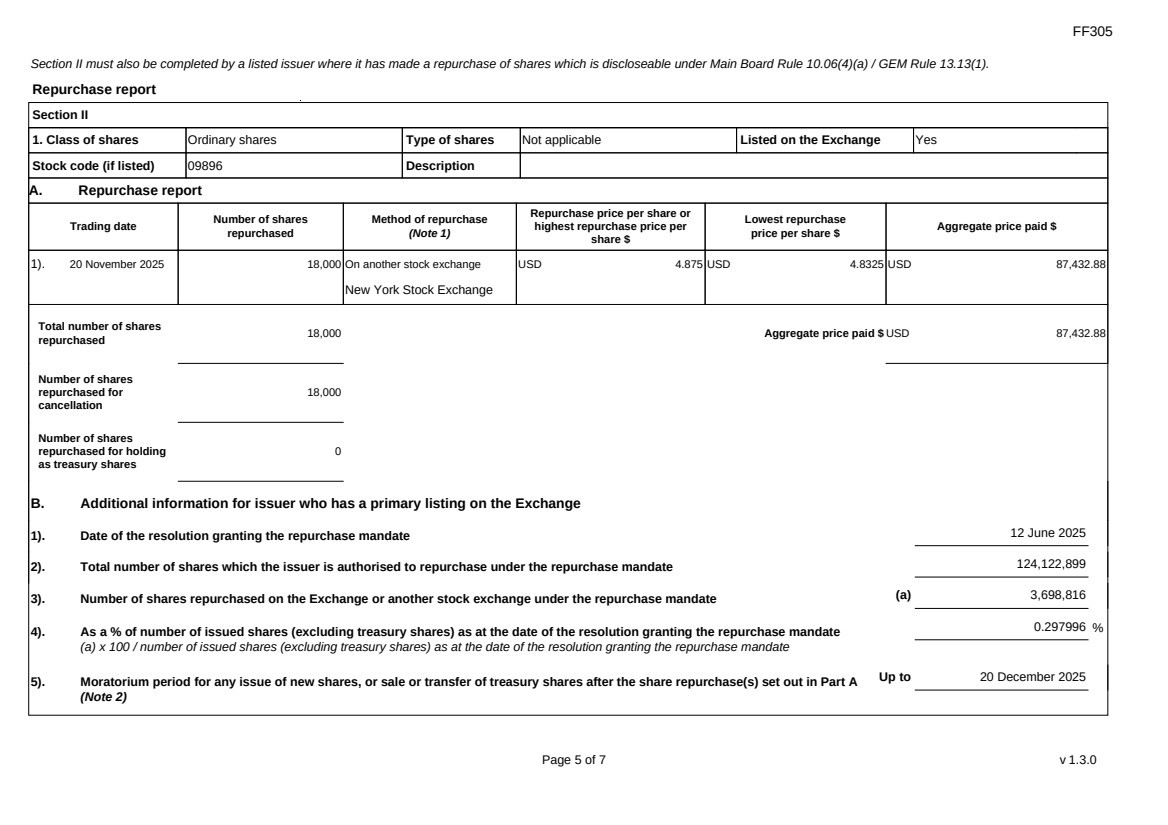
Exhibit 99.3 — Next Day Disclosure Return Dated November 21, 2025
Exhibit 99.4 — Next Day Disclosure Return Dated November 23, 2025
SIGNATURES
Pursuant to the requirements of the Securities Exchange Act of 1934, the registrant has duly caused this report to be signed on its behalf by the undersigned, thereunto duly authorized.
| MINISO Group Holding Limited | |||
| By | : | /s/ Jingjing Zhang | |
| Name | : | Jingjing Zhang | |
| Title | : | Chief Financial Officer | |
Date: November 24, 2025
Exhibit 99.1
MINISO Group Announces September Quarter and First Nine Months of 2025 Unaudited Financial Results
MINISO Group Momentum Further Accelerated: Same-Store GMV(1) Increased Mid-single Digit in September Quarter; Revenue Increased 28.2%; Adjusted Operating Profit Increased 14.8%;
MINISO Brand Added 102 Net New Stores in Mainland China with Strong Same-Store GMV(1) Growth (“SSSG”) of High-single Digit for September Quarter;
TOP TOY Brand Revenue(2) Increased 111.4%, another New Quarterly Growth Record
MINISO Group Achieved the Milestone of 8,000 Stores Globally with Quarterly Revenue Surpassed RMB5 Billion for the First Time
GUANGZHOU, China, November 20, 2025 /PRNewswire/ -- MINISO Group Holding Limited (NYSE: MNSO; HKEX: 9896) (“MINISO”, “MINISO Group” or the “Company”), a global value retailer offering a variety of trendy lifestyle products featuring IP design, today announced its unaudited financial results for the three months and the nine months ended September 30, 2025 (the “September Quarter” and the “First Nine Months”, respectively).
Financial Highlights for the September Quarter
| · | Revenue increased 28.2% year over year to RMB5,796.6 million (US$814.3 million), above the high end of the Company’s previous guidance range of 25%-28%. |
| · | All three of the Company’s operating segments delivered an upward momentum in SSSG during the September Quarter, lifting group-level SSSG to a mid-single digit level. |
| · | MINISO Brand’s SSSG was mid-single digit year over year, underpinned by (i) an exceptional high-single-digit growth in mainland China, and (ii) a low-single-digit growth in overseas markets. |
| · | TOP TOY Brand’s SSSG advanced at a mid-single digit rate year over year. |
| · | Gross profit increased 27.6% year over year to RMB2,590.1 million (US$363.8 million). |
| · | Gross margin was 44.7%, compared to 44.9% in the same period last year. |
| · | Operating profit was RMB846.6 million (US$118.9 million), compared to RMB852.6 million in the same period last year. |
| · | Adjusted operating profit(3) increased 14.8% year over year to RMB1,022.3 million (US$143.6 million), with adjusted operating margin of 17.6%. |
| · | Profit for the period was RMB443.2 million (US$62.3 million), compared to RMB648.3 million in the same period last year. |
| · | Adjusted net profit(3) increased 11.7% year over year to RMB766.8 million (US$107.7 million). |
| · | Adjusted net margin(3) was 13.2%, compared to 15.2% in the same period last year. |
| · | Adjusted EBITDA(3) increased 18.8% year over year to RMB1,353.8 million (US$190.2 million). |
| · | Adjusted EBITDA margin(3) was 23.4%, compared to 25.2% in the same period last year. |
| · | Adjusted basic and diluted earnings per ADS(3) were both RMB2.48 (US$0.35), increased by 12.7% year over year. |
| · | Net cash from operating activities was RMB1,299.6 million (USD182.6 million) in the September Quarter, with an operating cash flow to adjusted net profit ratio of 1.7. Capital expenditure was RMB330.3 million (US$46.4 million) and free cash flow was RMB969.3 million (US$136.2 million) for the September Quarter. |
Financial Highlights for the First Nine Months
| · | Revenue increased 23.7% year over year to RMB15,189.8 million (US$2,133.7 million). |
| · | Gross profit increased 24.5% year over year to RMB6,747.0 million (US$947.7 million). |
| · | Gross margin was 44.4%, compared to 44.1% in the same period last year. |
| · | Operating profit was RMB2,392.5 million (US$336.1 million), compared to RMB2,347.4 million in the same period last year. |
| · | Adjusted operating profit(3) increased 6.5% year over year to RMB2,608.8 million (US$366.5 million), with adjusted operating margin of 17.2%. |
| · | Profit for the period was RMB1,349.2 million (US$189.5 million), compared with RMB1,825.7 million in the same period last year. |
| · | Adjusted net profit(3) increased 6.1% year over year to RMB2,045.5 million (US$287.3 million), compared with RMB1,928.1 million in the same period last year. |
| · | Adjusted net margin(3) was 13.5%, compared to 15.7% in the same period last year. |
| · | Adjusted EBITDA(3) increased 14.0% year over year to RMB3,540.6 million (US$497.3 million). |
| · | Adjusted EBITDA margin(3) was 23.3%, compared to 25.3% in the same period last year. |
| · | Adjusted basic earnings per ADS(3) increased 7.8% year over year to RMB6.64 (US$0.93). |
| · | Adjusted diluted earnings per ADS(3) increased 8.5% year over year to RMB6.64 (US$0.93). |
| · | Cash Position(4) was RMB7,766.2 million (US$1,090.9 million) as of September 30, 2025, compared to RMB6,698.1 million as of December 31, 2024. |
| · | Net cash from operating activities was RMB2,313.8 million (US$325.0 million). Capital expenditure was RMB765.0 million (US$107.5 million) and free cash flow was RMB1,548.8 million (US$217.6 million) for the First Nine Months. |
Operational Highlights
| · | Total number of stores on group level was 8,138 as of September 30, 2025, achieving the milestone of 8,000 stores, with a year-over-year increase of 718 net new stores. |
| · | Number of MINISO stores was 7,831 as of September 30, 2025, representing a year-over-year increase of 645 net new stores. |
| · | Number of MINISO stores in mainland China was 4,407 as of September 30, 2025, representing a year-over-year increase of 157 net new stores. |
| · | Number of MINISO stores in overseas markets reached 3,424 as of September 30, 2025, representing a year-over-year increase of 488 net new stores. |
| · | Number of TOP TOY stores was 307 as of September 30, 2025, representing a year-over-year increase of 73 net new stores. |
Notes:
| (1) | “Same-store GMV” refers to the GMV generated by those stores that opened prior to the beginning of the comparative periods and remained open as of the end of the comparative periods and closed for less than 30 days during both comparative periods. “SSSG” refers to the year-over-year growth of same-store GMV. |
| (2) | Represents only revenue generated from external parties. |
| (3) | See the sections titled “Non-IFRS Financial Measures” and “Reconciliation of Non-IFRS Financial Measures” in this press release for more information. |
| (4) | “Cash position” refers to the combined balance of the Company’s cash and cash equivalents, restricted cash, term deposits with original maturity over three months, and other investments recorded as current assets. |
The following table provides a breakdown of the Company’s store network and its changes on a year-over-year basis. The number of directly operated stores reached 700 on group level. 75.7% of new MINISO stores in the past twelve months were located in overseas markets.
| As of |
|
|||||||||||
|
September 30, 2024 |
September 30, 2025 |
YoY | ||||||||||
| Number of stores on group level | 7,420 | 8,138 | 718 | |||||||||
| Number of MINISO stores | 7,186 | 7,831 | 645 | |||||||||
| Mainland China | 4,250 | 4,407 | 157 | |||||||||
| —Directly operated stores | 29 | 21 | (8 | ) | ||||||||
| —Stores operated under MINISO Retail Partner model | 4,196 | 4,358 | 162 | |||||||||
| —Stores operated under distributor model | 25 | 28 | 3 | |||||||||
| Overseas | 2,936 | 3,424 | 488 | |||||||||
| —Directly operated stores | 422 | 637 | 215 | |||||||||
| —Stores operated under MINISO Retail Partner model | 372 | 429 | 57 | |||||||||
| —Stores operated under distributor model | 2,142 | 2,358 | 216 | |||||||||
| Number of TOP TOY stores | 234 | 307 | 73 | |||||||||
| —Directly operated stores | 29 | 42 | 13 | |||||||||
| —Stores operated under TOP TOY Retail Partner model(1) | 205 | 258 | 53 | |||||||||
| —Stores operated under distributor model | - | 7 | 7 | |||||||||
Note:
| (1) | TOP TOY Retail Partner model is a hybrid store operation model similar to MINISO Retail Partner model, taking advantageous elements from the franchise store model and the directly operated chain store model, both of which are industry norms. |
Mr. Guofu Ye, Founder, Chairman, and CEO of MINISO, commented, “We are thrilled to see two significant milestones achieved by MINISO Group in the September Quarter: quarterly revenue surpassed RMB 5 billion for the first time, and MINISO Group's global store counts exceeded 8,000. In the September Quarter, MINISO mainland China delivered an exceptional performance, with over 100 net new stores on a quarterly basis and a high-single-digit level SSSG in this quarter. Both net store expansion and SSSG demonstrated sequential acceleration. Against the backdrop of a highly competitive physical retail environment in domestic market, MINISO mainland China’s outstanding results further underscored our ability to respond agilely, execute effectively, and leverage the resilience of our business model. SSSG in MINISO mainland China from year to date reached low-single digit. We are steadily progressing toward our goal of achieving full-year positive SSSG for MINISO mainland China in 2025."
"MINISO overseas had also shown sequential improvement in its same-store GMV, with growth accelerating to low-single digit in the September Quarter. Our strategic markets, such as North America and Europe, continued to deliver outstanding SSSG. We expected to see more momentum from SSSG in the growth of overseas markets, signaling a higher-quality growth that is more sustainable and carries lower operational risk. Meanwhile, we were thrilled to see that the operating margin of MINISO overseas directly operated business has year-over-year improvement, which demonstrated continuous and steady improvement in MINISO's fundamental operational strengths. Notably, TOP TOY achieved a remarkable 111.4% year-over-year revenue increase in the September Quarter, significantly exceeding our expectations and demonstrating its strong market leadership and growth potential in the pop toy industry." Mr. Ye continued.
Mr. Eason Zhang, CFO of MINISO, commented, “The year-over-year revenue growth on group level reached 28.2%, above our previous guidance. Adjusted operating profit increased 14.8% year over year. Adjusted operating margin was 17.6%, with year-over-year margin contraction sequentially narrowing from previous quarters, both in line with our previous guidance. Adjusted EBITDA increased 18.8% year over year, with a trend of sequential quarterly acceleration in year-over-year growth. Adjusted EBITDA margin reached 23.4%.”
" Net cash from operating cash flow was RMB1,299.6 million in this quarter, with an operating cash flow to adjusted net profit ratio of 1.7. As of September 30, our cash position reached RMB7.77 billion. Net cash from operating cash flow for the First Nine Months reached 2,313.8 million, surpassing adjusted net profit in the same period. It demonstrated our solid financial position, high-quality profitability and efficient management ability in working capital, and further underscored the resilience and robust operational cash flow generation of our business that will fuel our future high-quality growth.” Mr. Zhang concluded.
Operational Updates
October 2025: According to the Company’s preliminary estimates, the SSSG for MINISO mainland China reached a low-teens level for the whole month of October.
Financial Results for the September Quarter
Revenue was RMB5,796.6 million (US$814.3 million), representing an increase of 28.2% year over year.
Revenue from MINISO brand increased by 22.9% year over year to RMB5,221.5 million (US$733.5 million), including (i) an increase of 19.3% in revenue from MINISO brand in mainland China, accelerating sequentially by quarters in 2025, and (ii) an increase of 27.7% in revenue from MINISO brand in overseas markets. Overseas revenue contributed to 44.3% of revenue from MINISO brand.
Revenue from TOP TOY brand(1) increased by 111.4% to RMB574.5 million (US$80.7 million).
For more information on the composition and year-over-year change of revenue, please refer to the “Unaudited Additional Information” in this press release.
Cost of sales was RMB3,206.6 million (US$450.4 million), representing an increase of 28.6% year over year.
Gross profit was RMB2,590.1 million (US$363.8 million), representing an increase of 27.6% year over year.
Gross margin was 44.7%, compared to 44.9% in the same period last year.
Selling and distribution expenses were RMB1,429.9 million (US$200.9 million), representing an increase of 43.5% year over year. Excluding share-based compensation expenses, selling and distribution expenses were RMB1,333.9 million (US$187.4 million), representing an increase of 36.5% year over year. The year-over-year increase was mainly attributable to the Company’s investments into directly operated stores to pursue the future success of the Company’s business, especially in strategic overseas markets such as the U.S. market. As of September 30, 2025, total number of directly operated stores on the group level was 700, compared to 480 as of September 30, 2024. In the September Quarter, revenue from directly operated stores increased 69.9%, while related expenses including rental and related expenses, depreciation and amortization expenses together with payroll excluding share-based compensation expenses increased 40.7%, decelerating from the year-over-year increase of 71.4% and 56.3% in March and June quarter of 2025, respectively. Promotion and advertising expenses increased 43.3%, as a percentage of revenue stabilizing at around 3% in both comparative periods. Licensing expenses increased 20.8%, as a percentage of revenue stabilizing at around 3% in both comparative periods as well. Logistics expenses increased 23.3% year over year.
General and administrative expenses were RMB343.8 million (US$48.3 million), representing an increase of 45.6% year over year. Excluding share-based compensation expenses, general and administrative expenses were RMB264.0 million (US$37.1 million), representing an increase of 21.4% year over year. The year-over-year increase was primarily due to the increase of personnel-related expenses in relation to the growth of the Company’s business. The increase in equity-settled share-based payment expenses was mainly related to TOP TOY brand.
Other net income was RMB34.3 million (US$4.8 million), compared to RMB36.8 million in the same period last year. The year-over-year decrease was mainly due to a larger net foreign exchange loss compared with the same period last year, partially offset by an increase in investment income from wealth management products.
Operating profit was RMB846.6 million (US$118.9 million), compared with RMB852.6 million in the same period last year.
Adjusted operating profit(2) was RMB1,022.3 million (US$143.6 million), representing an increase of 14.8% year over year, with adjusted operating margin of 17.6%. The year-over-year contraction in adjusted operating margin has narrowed sequentially from 4.2 percentage points in the March quarter, to 2.3 percentage points in the June quarter and further narrowed down to 2.1 percentage points in the September Quarter.
Net finance cost was RMB104.5 million (US$14.7 million), compared to net finance income of RMB7.8 million in the same period last year. The year-over-year increase in finance cost was due to (i) increased interest expenses in relation to the equity linked securities issued by the Company in January 2025 ( the “Equity Linked Securities”) and the bank loans used for the acquisition of the equity interest of Yonghui Superstores Co., Ltd*(永輝超市股份有限公司) (“Yonghui”), both of which have been excluded in non-IFRS financial measures(2), and (ii) increased interest expenses on lease liabilities corresponding to the Company’s investment in directly operated stores.
Share of loss of equity-accounted investees, net of tax was RMB145.1 million (US$20.4 million), compared to share of profit of RMB2.0 million in the same period last year. The year-over-year change was mainly attributable to share of loss in Yonghui, which has been excluded in non-IFRS financial measures(2).
Other gain was RMB73.2 million (US$10.3 million), mainly attributable to gain from fair value change of derivatives under mark-to-market impact, which was in relation to the Equity Linked Securities and has been excluded in non-IFRS financial measures(2).
Effective tax rate was 33.9%, compared to 24.8% in the same period last year.
Adjusted effective tax rate(2) was 22.8%, which excluded the impact on effective tax rate as a result of adjusted items, compared to 23.8% in the same period last year.
Profit for the period was RMB443.2 million (US$62.3 million), compared to RMB648.3 million in the same period last year.
Adjusted net profit(2) was RMB766.8 million (US$107.7 million), increased by 11.7% year over year.
Adjusted net margin(2) was 13.2%, compared to 15.2% in the same period last year.
Adjusted EBITDA(2) was RMB1,353.8 million (US$190.2 million), representing an increase of 18.8% year over year.
Adjusted EBITDA margin(2) was 23.4%, compared to 25.2% in the same period last year.
Basic and diluted earnings per ADS were both RMB1.44 (US$0.20) in the September Quarter, compared with RMB2.08 in the same period last year.
Adjusted basic and diluted earnings per ADS(2) were both RMB2.48 (US$0.35) in the September Quarter, representing an increase of 12.7% year over year from RMB2.20 in the same period last year.
Net cash from operating activities was RMB1,299.6 million (USD182.6 million) in the September Quarter, with an operating cash flow to adjusted net profit ratio of 1.7. Capital expenditure was RMB330.3 million (US$46.4 million) and free cash flow was RMB969.3 million (US$136.2 million) for the September Quarter.
Financial Results for the First Nine Months
Revenue was RMB15,189.8 million (US$2,133.7 million), representing an increase of 23.7% year over year.
Revenue from MINISO brand increased by 19.8% to RMB13,870.5 million (US$1,948.4 million), including (i) an increase of 14.1% in revenue from MINISO brand in mainland China, and (ii) an increase of 28.7% in revenue from MINISO brand in overseas markets. The overseas revenue contributed to 42.1% of revenue from MINISO brand, compared to 39.2% in the same period last year.
Revenue from TOP TOY brand(1) increased by 87.9% to RMB1,316.6 million (US$184.9 million).
For more information on the composition and year-over-year change of revenue, please refer to the “Unaudited Additional Information” in this press release.
Cost of sales was RMB8,442.8 million (US$1,185.9 million), representing an increase of 23.0% year over year.
Gross profit was RMB6,747.0 million (US$947.7 million), representing an increase of 24.5% year over year.
Gross margin reached 44.4%, representing a year-over-year increase of 0.3 percentage point.
Selling and distribution expenses were RMB3,610.9 million (US$507.2 million), increased by 43.4% year over year. Excluding share-based compensation expenses, selling and distribution expenses were RMB3,501.0 million (US$491.8 million), increased by 42.4% year over year.
General and administrative expenses were RMB847.5 million (US$119.0 million), increased by 29.4% year over year. Excluding share-based compensation expenses, general and administrative expenses were RMB741.1 million (US$104.1 million), increased by 20.9% year over year.
Other net income was RMB132.5 million (US$18.6 million), compared to RMB78.5 million in the same period last year. The year-over-year increase was mainly due to (i) a net foreign exchange gain compared with a net foreign exchange loss in the same period last year, and (ii) an increase in investment income from wealth management products.
Operating profit was RMB2,392.5 million (US$336.1 million), compared to RMB2,347.4 million in the same period last year.
Adjusted operating profit(2) was RMB2,608.8 million (US$366.5 million), representing an increase of 6.5% year over year.
Net finance cost was RMB232.9 million (US$32.7 million), compared to net finance income of RMB41.9 million in the same period last year. The year-over-year increase in finance cost was due to (i) increased interest expenses in relation to the Equity Linked Securities and the bank loans used for the acquisition of the equity interest of Yonghui, both of which have been excluded in non-IFRS financial measures(2), and (ii) increased interest expenses on lease liabilities corresponding to the Company’s investment in directly operated stores.
Share of loss of equity-accounted investees, net of tax was RMB284.1 million (US$39.9 million), compared with share of profit of RMB2.3 million in the same period last year. The year-over-year change was mainly attributable to share of loss in Yonghui, which has been excluded in non-IFRS financial measures(2).
Other expenses was RMB11.2 million (US$1.6 million), mainly attributable to loss from fair value change of derivatives under mark-to-market impact and issuance cost of derivatives, which were in relation to the Equity Linked Securities and have been excluded in non-IFRS financial measures(2).
Effective tax rate was 27.6%, compared to 23.7% in the same period last year.
Adjusted effective tax rate(2) was 20.1%, which excluded the impact on effective tax rate as a result of adjusted items, compared to 22.7% in the same period last year.
Profit for the period was RMB1,349.2 million (US$189.5 million), compared to RMB1,825.7 million in the same period last year.
Adjusted net profit(2) was RMB2,045.5 million (US$287.3 million), compared to RMB1,928.1 million in the same period last year.
Adjusted net margin(2) was 13.5%, compared to 15.7% in the same period last year.
Adjusted EBITDA(2) increased 14.0% year over year to RMB3,540.6 million (US$497.3 million).
Adjusted EBITDA margin(2) was 23.3%, compared to 25.3% in the same period last year.
Basic earnings per ADS was RMB4.40 (US$0.62), compared to RMB5.84 in the same period last year.
Diluted earnings per ADS was RMB4.36 (US$0.61), compared to RMB5.80 in the same period last year.
Adjusted basic earnings per ADS(2) increased 7.8% year over year to RMB6.64 (US$0.93), compared to RMB6.16 in the same period last year.
Adjusted diluted earnings per ADS(2) increased 8.5% year over year to RMB6.64 (US$0.93), compared to RMB6.12 in the same period last year.
Cash position, which was the combined balance of the Company’s cash and cash equivalents, restricted cash, term deposits, and other investments recorded as current assets was RMB7,766.2 million (US$1,090.9 million) as of September 30, 2025, compared to RMB6,698.1 million as of December 31, 2024.
Net cash from operating activities was RMB2,313.8 million (US$325.0 million). Capital expenditure was RMB765.0 million (US$107.5 million) and free cash flow was RMB1,548.8 million (US$217.6 million) for the First Nine Months.
Notes:
(1) Revenue from TOP TOY brand only represents revenue generated from external parties.
(2) See the sections titled “Non-IFRS Financial Measures” and “Reconciliation of Non-IFRS Financial Measures” in this press release for more information.
Conference Call
The Company’s management will hold an earnings conference call at 4:00 A.M. Eastern Time on Friday, November 21, 2025 (5:00 P.M. Beijing Time on the same day) to discuss the financial results. Simultaneous interpretation in English will be provided during the conference call. The conference call can be accessed via the following methods:
Access 1
Join Zoom meeting.
Zoom link: https://zoom.us/j/97158482833?pwd=msvkC9gwjBFY7o1WCnQWqSJ4cpKEAD.1
Meeting Number: 971 5848 2833
Meeting Passcode: 9896
Access 2
Listeners of the meeting may access the call by dialing the following numbers and using the same meeting number and passcode as access 1.
| United States: | +1 689 278 1000 (or +1 719 359 4580) |
| Hong Kong, China: | +852 5803 3730 (or +852 5803 3731) |
| United Kingdom: | +44 203 481 5237 (or +44 131 460 1196) |
| France: | +33 1 7037 9729 (or +33 1 7037 2246) |
| Singapore: | +65 3158 7288 (or +65 3165 1065) |
| Canada: | +1 438 809 7799 (or +1 204 272 7920) |
Access 3
Listeners of the meeting can also access the call through the Company’s investor relations website at https://ir.miniso.com/.
The replay will be available approximately two hours after the conclusion of the live event at the Company’s investor relations website at https://ir.miniso.com/.
About MINISO Group
MINISO Group is a global value retailer offering a variety of trendy lifestyle products featuring IP design. The Company serves consumers primarily through its large network of MINISO stores, and promotes a relaxing, treasure-hunting and engaging shopping experience full of delightful surprises that appeals to all demographics. Aesthetically pleasing design, quality and affordability are at the core of every product in MINISO’s wide product portfolio, and the Company continually and frequently rolls out products with these qualities. Since the opening of its first store in China in 2013, the Company has built its flagship brand “MINISO” as a globally recognized retail brand and established a massive store network worldwide. For more information, please visit https://ir.miniso.com/.
Exchange Rate
The U.S. dollar (US$) amounts disclosed in this press release, except for those transaction amounts that were actually settled in U.S. dollars, are presented solely for the convenience of the readers. The conversion of Renminbi (RMB) into US$ in this press release is based on the exchange rate set forth in the H.10 statistical release of the Board of Governors of the Federal Reserve System as of September 30, 2025, which was RMB7.1190 to US$1.0000. The percentages stated in this press release are calculated based on the RMB amounts.
Non-IFRS Financial Measures
In evaluating the business, MINISO considers and uses adjusted operating profit, adjusted operating margin, adjusted effective tax rate, adjusted net profit, adjusted net margin, adjusted EBITDA, adjusted EBITDA margin, adjusted basic and diluted net earnings per share and adjusted basic and diluted net earnings per ADS as supplemental measures to review and assess its operating performance. The presentation of these non-IFRS financial measures is not intended to be considered in isolation or as a substitute for the financial information prepared and presented in accordance with IFRS. MINISO defines adjusted operating profit as operating profit for the period excluding equity-settled share-based payment expenses. MINISO calculates adjusted operating margin by dividing adjusted operating profit by revenue for the same period. MINISO defines adjusted effective tax rate as the effective tax rate excluding the tax impact of adjusted items under non-IFRS financial measures. MINISO defines adjusted net profit as profit for the period excluding equity-settled share-based payment expenses, gain or loss from fair value change of derivatives, issuance cost of derivatives and interest expenses related to the Equity Linked Securities, interest expenses related to the bank loans used for acquisition of the equity interest in Yonghui, and share of profit or loss of Yonghui, net of tax. MINISO calculates adjusted net margin by dividing adjusted net profit by revenue for the same period. MINISO defines adjusted EBITDA as adjusted net profit plus depreciation and amortization, finance costs excluding interest expenses related to the Equity Linked Securities and interest expenses related to the bank loans used for acquisition of the equity interest in Yonghui and income tax expense. Adjusted EBITDA margin is computed by dividing adjusted EBITDA by revenue for the period. MINISO computes adjusted basic and diluted net earnings per ADS by dividing adjusted net profit attributable to the equity shareholders of the Company by the number of ADSs represented by the number of ordinary shares used in the basic and diluted earnings per share calculation on an IFRS basis. MINISO computes adjusted basic and diluted net earnings per share in the same way as it calculates adjusted basic and diluted net earnings per ADS, except that it uses the number of ordinary shares used in the basic and diluted earnings per share calculation on an IFRS basis as the denominator instead of the number of ADSs represented by these ordinary shares.
MINISO presents these non-IFRS financial measures because they are used by the management to evaluate its operating performance and formulate business plans. These non-IFRS financial measures enable the management to assess its operating results without considering the impacts of the aforementioned non-cash and other adjustment items that MINISO does not consider to be indicative of its operating performance in the future. Accordingly, MINISO believes that the use of these non-IFRS financial measures provides useful information to investors and others in understanding and evaluating its operating results in the same manner as the management and board of directors.
These non-IFRS financial measures are not defined under IFRS and are not presented in accordance with IFRS. These non-IFRS financial measures have limitations as analytical tools. One of the key limitations of using these non-IFRS financial measures is that they do not reflect all items of income and expense that affect MINISO’s operations. Further, these non-IFRS financial measures may differ from the non-IFRS information used by other companies, including peer companies, and therefore their comparability may be limited.
These non-IFRS financial measures should not be considered in isolation or construed as alternatives to profit, net profit margin, basic and diluted earnings per share and basic and diluted earnings per ADS, as applicable, or any other measures of performance or as indicators of MINISO’s operating performance. Investors are encouraged to review MINISO’s historical non-IFRS financial measures in light of the most directly comparable IFRS measures, as shown below. The non-IFRS financial measures presented here may not be comparable to similarly titled measures presented by other companies. Other companies may calculate similarly titled measures differently, limiting the usefulness of such measures when analyzing MINISO’s data comparatively. MINISO encourages you to review its financial information in its entirety and not rely on a single financial measure.
For more information on the non-IFRS financial measures, please see the table captioned “Reconciliation of Non-IFRS Financial Measures” set forth at the end of this press release.
Safe Harbor Statement
This announcement contains forward-looking statements. These statements are made under the “safe harbor” provisions of the U.S. Private Securities Litigation Reform Act of 1995. These forward-looking statements can be identified by words or phrases such as “may”, “will”, “expect”, “anticipate”, “aim”, “estimate”, “intend”, “plan”, “believe”, “is/are likely to”, “potential”, “continue” or other similar expressions. Among other things, the quotations from management in this announcement, as well as MINISO’s strategic and operational plans, contain forward-looking statements. MINISO may also make written or oral forward-looking statements in its periodic reports to the U.S. Securities and Exchange Commission (the “SEC”) and The Stock Exchange of Hong Kong Limited (the “HKEX”), in its annual report to shareholders, in press releases and other written materials and in oral statements made by its officers, directors or employees to third parties. Statements that are not historical facts, including statements about MINISO’s beliefs and expectations, are forward-looking statements. Forward-looking statements involve inherent risks and uncertainties. A number of factors could cause actual results to differ materially from those contained in any forward-looking statement, including but not limited to the following: MINISO’s mission, goals and strategies; future business development, financial conditions and results of operations; the expected growth of the retail market and the market of branded variety retail of lifestyle products in China and globally; expectations regarding demand for and market acceptance of MINISO’s products; expectations regarding MINISO’s relationships with consumers, suppliers, MINISO Retail Partners, local distributors, and other business partners; competition in the industry; proposed use of proceeds; and relevant government policies and regulations relating to MINISO’s business and the industry. Further information regarding these and other risks is included in MINISO’s filings with the SEC and the HKEX. All information provided in this press release and in the attachments is as of the date of this press release, and MINISO undertakes no obligation to update any forward-looking statement, except as required under applicable law.
Investor Relations Contact:
MINISO Group Holding Limited
Email: ir@miniso.com
Phone: +86 (20) 36228788 Ext.8039
MINISO GROUP HOLDING LIMITED
UNAUDITED CONDENSED CONSOLIDATED STATEMENTS OF FINANCIAL POSITION
(Expressed in thousands)
| As at | As at | |||||||||||
| December 31, 2024 | September 30, 2025 | |||||||||||
| (Audited) | (Unaudited) | |||||||||||
| RMB’000 | RMB’000 | US$’000 | ||||||||||
| ASSETS | ||||||||||||
| Non-current assets | ||||||||||||
| Property, plant and equipment | 1,436,939 | 1,919,666 | 269,654 | |||||||||
| Right-of-use assets | 4,172,083 | 5,008,473 | 703,536 | |||||||||
| Intangible assets | 8,802 | 98,185 | 13,792 | |||||||||
| Goodwill | 21,418 | 225,840 | 31,724 | |||||||||
| Deferred tax assets | 181,948 | 216,410 | 30,399 | |||||||||
| Other investments | 123,399 | 147,944 | 20,782 | |||||||||
| Trade and other receivables | 341,288 | 149,312 | 20,974 | |||||||||
| Term deposits | 140,183 | - | - | |||||||||
| Financial derivative assets | - | 1,108,926 | 155,770 | |||||||||
| Interests in equity-accounted investees | 38,567 | 6,030,265 | 847,066 | |||||||||
| 6,464,627 | 14,905,021 | 2,093,697 | ||||||||||
| Current assets | ||||||||||||
| Other investments | 100,000 | 4,396,781 | 617,612 | |||||||||
| Inventories | 2,750,389 | 3,287,721 | 461,823 | |||||||||
| Trade and other receivables | 2,207,013 | 2,709,889 | 380,656 | |||||||||
| Cash and cash equivalents | 6,328,121 | 3,099,079 | 435,325 | |||||||||
| Restricted cash | 1,026 | 7,138 | 1,003 | |||||||||
| Term deposits | 268,952 | 263,182 | 36,969 | |||||||||
| 11,655,501 | 13,763,790 | 1,933,388 | ||||||||||
| Total assets | 18,120,128 | 28,668,811 | 4,027,085 | |||||||||
MINISO GROUP HOLDING LIMITED
UNAUDITED CONDENSED CONSOLIDATED STATEMENTS OF FINANCIAL POSITION (CONTINUED)
(Expressed in thousands)
| As at | As at | |||||||||||
| December 31, 2024 | September 30, 2025 | |||||||||||
| (Audited) | (Unaudited) | |||||||||||
| RMB’000 | RMB’000 | US$’000 | ||||||||||
| EQUITY | ||||||||||||
| Share capital | 94 | 94 | 13 | |||||||||
| Additional paid-in capital | 4,683,577 | 2,902,595 | 407,725 | |||||||||
| Other reserves | 1,329,126 | 2,204,724 | 309,696 | |||||||||
| Retained earnings | 4,302,177 | 5,636,230 | 791,717 | |||||||||
| Equity attributable to equity shareholders of the Company | 10,314,974 | 10,743,643 | 1,509,151 | |||||||||
| Non-controlling interests | 40,548 | 84,197 | 11,827 | |||||||||
| Total equity | 10,355,522 | 10,827,840 | 1,520,978 | |||||||||
| LIABILITIES | ||||||||||||
| Non-current liabilities | ||||||||||||
| Contract liabilities | 35,145 | 23,271 | 3,269 | |||||||||
| Loans and borrowings | 4,310 | 5,622,289 | 789,758 | |||||||||
| Other payables | 59,842 | 71,585 | 10,055 | |||||||||
| Lease liabilities | 1,903,137 | 2,308,889 | 324,328 | |||||||||
| Financial derivative liabilities | - | 1,464,479 | 205,714 | |||||||||
| Deferred income | 34,983 | 33,294 | 4,677 | |||||||||
| 2,037,417 | 9,523,807 | 1,337,801 | ||||||||||
MINISO GROUP HOLDING LIMITED
UNAUDITED CONDENSED CONSOLIDATED STATEMENTS OF FINANCIAL POSITION (CONTINUED)
(Expressed in thousands)
| As at | As at | |||||||||||
| December 31, 2024 | September 30, 2025 | |||||||||||
| (Audited) | (Unaudited) | |||||||||||
| RMB’000 | RMB’000 | US$’000 | ||||||||||
| Current liabilities | ||||||||||||
| Contract liabilities | 323,292 | 287,242 | 40,349 | |||||||||
| Loans and borrowings | 566,955 | 1,886,022 | 264,928 | |||||||||
| Trade and other payables | 3,943,988 | 4,292,129 | 602,913 | |||||||||
| Lease liabilities | 635,357 | 1,168,637 | 164,157 | |||||||||
| Deferred income | 5,376 | 1,294 | 182 | |||||||||
| Current taxation | 252,221 | 252,315 | 35,442 | |||||||||
| Redemption liabilities arising from preferred shares | - | 429,525 | 60,335 | |||||||||
| 5,727,189 | 8,317,164 | 1,168,306 | ||||||||||
| Total liabilities | 7,764,606 | 17,840,971 | 2,506,107 | |||||||||
| Total equity and liabilities | 18,120,128 | 28,668,811 | 4,027,085 | |||||||||
MINISO GROUP HOLDING LIMITED
UNAUDITED CONDENSED CONSOLIDATED STATEMENTS OF PROFIT OR LOSS AND OTHER COMPREHENSIVE INCOME
(Expressed in thousands, except for per ordinary share and per ADS data)
| Three months ended September 30, | Nine months ended September 30, | |||||||||||||||||||||||
| 2024 | 2025 | 2024 | 2025 | |||||||||||||||||||||
| (Unaudited) | (Unaudited) | (Unaudited) | (Unaudited) | |||||||||||||||||||||
| RMB’000 | RMB’000 | US$’000 | RMB’000 | RMB’000 | US$’000 | |||||||||||||||||||
| Revenue | 4,522,577 | 5,796,645 | 814,250 | 12,281,320 | 15,189,757 | 2,133,693 | ||||||||||||||||||
| Cost of sales | (2,492,601 | ) | (3,206,573 | ) | (450,425 | ) | (6,861,558 | ) | (8,442,767 | ) | (1,185,948 | ) | ||||||||||||
| Gross profit | 2,029,976 | 2,590,072 | 363,825 | 5,419,762 | 6,746,990 | 947,745 | ||||||||||||||||||
| Other income | 5,327 | 3,549 | 499 | 18,025 | 8,919 | 1,253 | ||||||||||||||||||
| Selling and distribution expenses | (996,461 | ) | (1,429,853 | ) | (200,850 | ) | (2,518,549 | ) | (3,610,875 | ) | (507,217 | ) | ||||||||||||
| General and administrative expenses | (236,208 | ) | (343,802 | ) | (48,294 | ) | (654,781 | ) | (847,458 | ) | (119,042 | ) | ||||||||||||
| Other net income | 36,758 | 34,280 | 4,815 | 78,454 | 132,519 | 18,615 | ||||||||||||||||||
| Reversal of credit loss/(credit loss) on trade and other receivables | 13,170 | (7,678 | ) | (1,079 | ) | 9,564 | (21,128 | ) | (2,968 | ) | ||||||||||||||
| Impairment loss on non-current assets | - | - | - | (5,104 | ) | (16,450 | ) | (2,311 | ) | |||||||||||||||
| Operating profit | 852,562 | 846,568 | 118,916 | 2,347,371 | 2,392,517 | 336,075 | ||||||||||||||||||
| Finance income | 25,067 | 20,276 | 2,848 | 99,673 | 86,112 | 12,096 | ||||||||||||||||||
| Finance costs | (17,227 | ) | (124,805 | ) | (17,531 | ) | (57,822 | ) | (319,041 | ) | (44,815 | ) | ||||||||||||
| Net finance income/(cost) | 7,840 | (104,529 | ) | (14,683 | ) | 41,851 | (232,929 | ) | (32,719 | ) | ||||||||||||||
| Share of profit/(loss) of equity-accounted investees, net of tax | 2,009 | (145,105 | ) | (20,383 | ) | 2,310 | (284,051 | ) | (39,900 | ) | ||||||||||||||
| Other gain/(expenses) | - | 73,214 | 10,284 | - | (11,198 | ) | (1,573 | ) | ||||||||||||||||
| Profit before taxation | 862,411 | 670,148 | 94,134 | 2,391,532 | 1,864,339 | 261,883 | ||||||||||||||||||
| Income tax expense | (214,090 | ) | (226,950 | ) | (31,879 | ) | (565,832 | ) | (515,151 | ) | (72,363 | ) | ||||||||||||
| Profit for the period | 648,321 | 443,198 | 62,255 | 1,825,700 | 1,349,188 | 189,520 | ||||||||||||||||||
| Attributable to: | ||||||||||||||||||||||||
| Equity shareholders of the Company | 641,765 | 440,539 | 61,881 | 1,811,867 | 1,346,569 | 189,152 | ||||||||||||||||||
| Non-controlling interests | 6,556 | 2,659 | 374 | 13,833 | 2,619 | 368 | ||||||||||||||||||
| Earnings per share for ordinary shares | ||||||||||||||||||||||||
| -Basic | 0.52 | 0.36 | 0.05 | 1.46 | 1.10 | 0.15 | ||||||||||||||||||
| -Diluted | 0.52 | 0.36 | 0.05 | 1.45 | 1.09 | 0.15 | ||||||||||||||||||
| Earnings per ADS | ||||||||||||||||||||||||
| (Each ADS represents 4 ordinary shares) | ||||||||||||||||||||||||
| -Basic | 2.08 | 1.44 | 0.20 | 5.84 | 4.40 | 0.62 | ||||||||||||||||||
| -Diluted | 2.08 | 1.44 | 0.20 | 5.80 | 4.36 | 0.61 | ||||||||||||||||||
MINISO GROUP HOLDING LIMITED
UNAUDITED CONDENSED CONSOLIDATED STATEMENTS OF PROFIT OR LOSS AND OTHER
COMPREHENSIVE INCOME (CONTINUED)
(Expressed in thousands)
| Three months ended September 30, | Nine months ended September 30, | |||||||||||||||||||||||
| 2024 | 2025 | 2024 | 2025 | |||||||||||||||||||||
| (Unaudited) | (Unaudited) | (Unaudited) | (Unaudited) | |||||||||||||||||||||
| RMB’000 | RMB’000 | US$’000 | RMB’000 | RMB’000 | US$’000 | |||||||||||||||||||
| Profit for the period | 648,321 | 443,198 | 62,255 | 1,825,700 | 1,349,188 | 189,520 | ||||||||||||||||||
| Items that may be reclassified subsequently to profit or loss: | ||||||||||||||||||||||||
| Exchange differences on translation of financial statements of foreign operations | 8,863 | (17,451 | ) | (2,451 | ) | 15,708 | (5,776 | ) | (811 | ) | ||||||||||||||
| Other comprehensive income/(loss) for the period | 8,863 | (17,451 | ) | (2,451 | ) | 15,708 | (5,776 | ) | (811 | ) | ||||||||||||||
| Total comprehensive income for the period | 657,184 | 425,747 | 59,804 | 1,841,408 | 1,343,412 | 188,709 | ||||||||||||||||||
| Attributable to: | ||||||||||||||||||||||||
| Equity shareholders of the Company | 645,096 | 425,972 | 59,836 | 1,823,139 | 1,343,373 | 188,704 | ||||||||||||||||||
| Non-controlling interests | 12,088 | (225 | ) | (32 | ) | 18,269 | 39 | 5 | ||||||||||||||||
MINISO GROUP HOLDING LIMITED
RECONCILIATION OF NON-IFRS FINANCIAL MEASURES
(Expressed in thousands, except for percentages)
| Three months ended September 30, | Nine months ended September 30, | |||||||||||||||||||||||
| 2024 | 2025 | 2024 | 2025 | |||||||||||||||||||||
| (Unaudited) | (Unaudited) | (Unaudited) | (Unaudited) | |||||||||||||||||||||
| RMB’000 | RMB’000 | US$’000 | RMB’000 | RMB’000 | US$’000 | |||||||||||||||||||
| Reconciliation of operating profit for the period to adjusted operating profit | ||||||||||||||||||||||||
| Operating profit | 852,562 | 846,568 | 118,916 | 2,347,371 | 2,392,517 | 336,075 | ||||||||||||||||||
| Add back: | ||||||||||||||||||||||||
| Equity-settled share-based payment expenses | 37,883 | 175,728 | 24,684 | 102,390 | 216,314 | 30,385 | ||||||||||||||||||
| Adjusted operating profit | 890,445 | 1,022,296 | 143,600 | 2,449,761 | 2,608,831 | 366,460 | ||||||||||||||||||
| Adjusted operating margin | 19.7 | % | 17.6 | % | 17.6 | % | 19.9 | % | 17.2 | % | 17.2 | % | ||||||||||||
MINISO GROUP HOLDING LIMITED
RECONCILIATION OF NON-IFRS FINANCIAL MEASURES (CONTINUED)
(Expressed in percentages)
| Three months ended September 30, | Nine months ended September 30, | |||||||||||||||
| 2024 | 2025 | 2024 | 2025 | |||||||||||||
| (Unaudited) | (Unaudited) | (Unaudited) | (Unaudited) | |||||||||||||
| Reconciliation of effective tax rate to adjusted effective tax rate: | ||||||||||||||||
| Effective tax rate | 24.8 | % | 33.9 | % | 23.7 | % | 27.6 | % | ||||||||
| Impact on effective tax rate as a result of adjusted items | (1.0 | )% | (11.1 | )% | (1.0 | )% | (7.5 | )% | ||||||||
| Adjusted effective tax rate | 23.8 | % | 22.8 | % | 22.7 | % | 20.1 | % | ||||||||
MINISO GROUP HOLDING LIMITED
RECONCILIATION OF NON-IFRS FINANCIAL MEASURES (CONTINUED)
(Expressed in thousands, except for per share, per ADS data and percentages)
| Three months ended September 30, | Nine months ended September 30, | |||||||||||||||||||||||
| 2024 | 2025 | 2024 | 2025 | |||||||||||||||||||||
| (Unaudited) | (Unaudited) | (Unaudited) | (Unaudited) | |||||||||||||||||||||
| RMB’000 | RMB’000 | US$’000 | RMB’000 | RMB’000 | US$’000 | |||||||||||||||||||
| Reconciliation of profit for the period to adjusted net profit: | ||||||||||||||||||||||||
| Profit for the period | 648,321 | 443,198 | 62,255 | 1,825,700 | 1,349,188 | 189,520 | ||||||||||||||||||
| Add back: | ||||||||||||||||||||||||
| Equity-settled share-based payment expenses | 37,883 | 175,728 | 24,684 | 102,390 | 216,314 | 30,385 | ||||||||||||||||||
| Gain from fair value change of derivatives(1) | - | (73,214 | ) | (10,284 | ) | - | (33,466 | ) | (4,701 | ) | ||||||||||||||
| Issuance cost of derivatives(2) | - | - | - | - | 44,664 | 6,274 | ||||||||||||||||||
| Interest expenses related to the Equity Linked Securities and the bank loans used for acquisition of the equity interest in Yonghui | - | 75,306 | 10,578 | - | 203,657 | 28,608 | ||||||||||||||||||
| —Interest expenses related to the Equity Linked Securities(3) | - | 51,092 | 7,177 | - | 140,977 | 19,803 | ||||||||||||||||||
| —Interest expenses related to the bank loans used for acquisition of the equity interest in Yonghui | - | 24,214 | 3,401 | - | 62,680 | 8,805 | ||||||||||||||||||
| Share of loss of Yonghui, net of tax | - | 145,804 | 20,481 | - | 265,139 | 37,244 | ||||||||||||||||||
| Adjusted net profit | 686,204 | 766,822 | 107,714 | 1,928,090 | 2,045,496 | 287,330 | ||||||||||||||||||
| Adjusted net margin | 15.2 | % | 13.2 | % | 13.2 | % | 15.7 | % | 13.5 | % | 13.5 | % | ||||||||||||
| Attributable to: | ||||||||||||||||||||||||
| Equity shareholders of the Company | 679,461 | 763,224 | 107,209 | 1,913,891 | 2,041,853 | 286,818 | ||||||||||||||||||
| Non-controlling interests | 6,743 | 3,598 | 505 | 14,199 | 3,643 | 512 | ||||||||||||||||||
| Adjusted net earnings per share(4) | ||||||||||||||||||||||||
| -Basic | 0.55 | 0.62 | 0.09 | 1.54 | 1.66 | 0.23 | ||||||||||||||||||
| -Diluted | 0.55 | 0.62 | 0.09 | 1.53 | 1.66 | 0.23 | ||||||||||||||||||
| Adjusted net earnings per ADS (Each ADS represents 4 ordinary shares) | ||||||||||||||||||||||||
| -Basic | 2.20 | 2.48 | 0.35 | 6.16 | 6.64 | 0.93 | ||||||||||||||||||
| -Diluted | 2.20 | 2.48 | 0.35 | 6.12 | 6.64 | 0.93 | ||||||||||||||||||
MINISO GROUP HOLDING LIMITED
RECONCILIATION OF NON-IFRS FINANCIAL MEASURES (CONTINUED)
(Expressed in thousands, except for percentages)
| Three months ended September 30, | Nine months ended September 30, | |||||||||||||||||||||||
| 2024 | 2025 | 2024 | 2025 | |||||||||||||||||||||
| (Unaudited) | (Unaudited) | (Unaudited) | (Unaudited) | |||||||||||||||||||||
| RMB’000 | RMB’000 | US$’000 | RMB’000 | RMB’000 | US$’000 | |||||||||||||||||||
| Reconciliation of adjusted net profit for the period to adjusted EBITDA: | ||||||||||||||||||||||||
| Adjusted net profit | 686,204 | 766,822 | 107,714 | 1,928,090 | 2,045,496 | 287,330 | ||||||||||||||||||
| Add back: | ||||||||||||||||||||||||
| Depreciation and amortization | 222,259 | 310,554 | 43,623 | 555,390 | 864,570 | 121,445 | ||||||||||||||||||
| Finance costs excluding interest expenses related to the Equity Linked Securities and the bank loans used for acquisition of the equity interest in Yonghui | 17,227 | 49,499 | 6,953 | 57,822 | 115,384 | 16,207 | ||||||||||||||||||
| Income tax expense | 214,090 | 226,950 | 31,879 | 565,832 | 515,151 | 72,363 | ||||||||||||||||||
| Adjusted EBITDA | 1,139,780 | 1,353,825 | 190,169 | 3,107,134 | 3,540,601 | 497,345 | ||||||||||||||||||
| Adjusted EBITDA margin | 25.2 | % | 23.4 | % | 23.4 | % | 25.3 | % | 23.3 | % | 23.3 | % | ||||||||||||
Notes:
| (1) | The gain or loss from fair value change of derivatives was a non-cash gain or expense that was related to the fair value of the Equity Linked Securities and call spread. It was determined primarily by movements in the underlying share price. |
| (2) | The issuance cost of derivatives was a one-off expense that was related to the Equity Linked Securities. |
| (3) | For the three months ended September 30, 2025, the RMB51.1 million interest expenses related to the Equity Linked Securities included RMB46.2 million non-cash portion and RMB4.9 million cash expense. |
For the nine months ended September 30, 2025, the RMB141.0 million interest expenses related to the Equity Linked Securities included RMB127.0 million non-cash portion and RMB14.0 million cash expense.
| (4) | Adjusted basic and diluted net earnings per share are computed by dividing adjusted net profit attributable to the equity shareholders of the Company by the number of ordinary shares used in the basic and diluted earnings per share calculation on an IFRS basis. |
MINISO GROUP HOLDING LIMITED
UNAUDITED ADDITIONAL INFORMATION
(Expressed in thousands, except for percentages)
| Three months ended September 30, | Nine months ended September 30, | |||||||||||||||||||||||||
| 2024 | 2025 | YoY | 2024 | 2025 | YoY | |||||||||||||||||||||
| RMB’000 | RMB’000 | US$’000 | RMB’000 | RMB’000 | US$’000 | |||||||||||||||||||||
| Revenue | ||||||||||||||||||||||||||
| MINISO Brand | 4,249,307 | 5,221,476 | 733,456 | 22.9 | % | 11,573,972 | 13,870,480 | 1,948,375 | 19.8 | % | ||||||||||||||||
| -Mainland China | 2,438,555 | 2,909,171 | 408,648 | 19.3 | % | 7,031,354 | 8,024,158 | 1,127,147 | 14.1 | % | ||||||||||||||||
| -Overseas | 1,810,752 | 2,312,305 | 324,808 | 27.7 | % | 4,542,618 | 5,846,322 | 821,228 | 28.7 | % | ||||||||||||||||
| TOP TOY Brand | 271,797 | 574,523 | 80,703 | 111.4 | % | 700,717 | 1,316,581 | 184,939 | 87.9 | % | ||||||||||||||||
| Others(1) | 1,473 | 646 | 91 | (56.1 | )% | 6,631 | 2,696 | 379 | (59.3 | )% | ||||||||||||||||
| 4,522,577 | 5,796,645 | 814,250 | 28.2 | % | 12,281,320 | 15,189,757 | 2,133,693 | 23.7 | % | |||||||||||||||||
Note:
(1) “Others” refers to revenue generated from other operating segments such as “WonderLife”, which was a secondary brand targeting on lower-tier cities in mainland China, aggregated and presented as “others”. As the MINISO brand increasingly penetrated into lower-tier cities in mainland China, “WonderLife” has become marginalized.
MINISO GROUP HOLDING LIMITED
UNAUDITED ADDITIONAL INFORMATION
NUMBER OF MINISO STORES IN MAINLAND CHINA
| As of | ||||||||||||
|
September 30, 2024 |
September 30, 2025 |
YoY | ||||||||||
| By City Tiers | ||||||||||||
| First-tier cities | 563 | 584 | 21 | |||||||||
| Second-tier cities | 1,771 | 1,817 | 46 | |||||||||
| Third- or lower-tier cities | 1,916 | 2,006 | 90 | |||||||||
| Total | 4,250 | 4,407 | 157 | |||||||||
MINISO GROUP HOLDING LIMITED
UNAUDITED ADDITIONAL INFORMATION
NUMBER OF MINISO STORES IN OVERSEAS MARKETS
| As of | ||||||||||||
|
September 30, 2024 |
September 30, 2025 |
YoY | ||||||||||
| By Regions | ||||||||||||
| Asia excluding China | 1,572 | 1,748 | 176 | |||||||||
| North America | 294 | 421 | 127 | |||||||||
| Latin America | 598 | 684 | 86 | |||||||||
| Europe | 260 | 337 | 77 | |||||||||
| Others | 212 | 234 | 22 | |||||||||
| Total | 2,936 | 3,424 | 488 | |||||||||
*For identification purpose only
Exhibit 99.2
Hong Kong Exchanges and Clearing Limited and The Stock Exchange of Hong Kong Limited take no responsibility for the contents of this announcement, make no representation as to its accuracy or completeness and expressly disclaim any liability whatsoever for any loss howsoever arising from or in reliance upon the whole or any part of the contents of this announcement.
MINISO Group Holding Limited
名 創 優 品 集 團 控 股 有 限 公 司
(A company incorporated in the Cayman Islands with limited liability)
(Stock Code: 9896)
INSIDE INFORMATION
UNAUDITED FINANCIAL RESULTS
FOR THE THREE MONTHS AND NINE MONTHS ENDED
SEPTEMBER 30, 2025
This announcement is issued pursuant to Rule 13.09 of the Rules Governing the Listing of the Securities on The Stock Exchange of Hong Kong Limited and under Part XIVA of the Securities and Futures Ordinance (Cap. 571).
MINISO Group Holding Limited (“MINISO” or the “Company”) is pleased to announce the unaudited condensed consolidated results of the Company and its subsidiaries for the three months and nine months ended September 30, 2025.
The Company is pleased to announce the unaudited condensed consolidated results of the Company and its subsidiaries for the three months and nine months ended September 30, 2025 published in accordance with applicable rules of the U.S. Securities and Exchange Commission (the “SEC”).
Attached hereto as Schedule I is the full text of the press release issued by the Company on November 21, 2025 (Eastern Standard Time), in relation to the unaudited financial results for the three months and nine months ended September 30, 2025, some of which may constitute material inside information of the Company.
This announcement contains forward-looking statements. These statements are made under the “safe harbor” provisions of the U.S. Private Securities Litigation Reform Act of 1995. These forward-looking statements can be identified by words or phrases such as “may,” “will,” “expect,” “anticipate,” “aim,” “estimate,” “intend,” “plan,” “believe,” “is/are likely to,” “potential,” “continue” or other similar expressions. Among other things, the quotations from management in this announcement, as well as MINISO’s strategic and operational plans, contain forward-looking statements. MINISO may also make written or oral forward-looking statements in its periodic reports to the SEC and The Stock Exchange of Hong Kong Limited (the “HKEX”), in its annual report to shareholders, in press releases and other written materials and in oral statements made by its officers, directors or employees to third parties. Statements that are not historical facts, including statements about MINISO’s beliefs and expectations, are forward-looking statements. Forward-looking statements involve inherent risks and uncertainties. A number of factors could cause actual results to differ materially from those contained in any forward-looking statement, including but not limited to the following: MINISO’s mission, goals and strategies; future business development, financial conditions and results of operations; the expected growth of the retail market and the market of branded variety retail of lifestyle products in China and globally; expectations regarding demand for and market acceptance of MINISO’s products; expectations regarding MINISO’s relationships with consumers, suppliers, MINISO Retail Partners, local distributors, and other business partners; competition in the industry; proposed use of proceeds; and relevant government policies and regulations relating to MINISO’s business and the industry. Further information regarding these and other risks is included in MINISO’s filings with the SEC and the HKEX. All information provided in this announcement and in the attachments is as of the date of this announcement, and MINISO undertakes no obligation to update any forward-looking statement, except as required under applicable law.
The Company’s shareholders and potential investors are advised not to place undue reliance on the unaudited financial results for the three months and nine months ended September 30, 2025 and to exercise caution in dealing in securities in the Company.
| By Order of the Board | |
| MINISO Group Holding Limited | |
| Mr. YE Guofu | |
| Executive Director and Chairman |
Hong Kong, November 21, 2025
As of the date of this announcement, the board of directors of the Company comprises Mr. YE Guofu as executive Director, Ms. XU Lili, Mr. ZHU Yonghua and Mr. WANG Yongping as independent non-executive Directors.
SCHEDULE I
MINISO Group Announces September Quarter and First Nine Months of 2025
Unaudited Financial Results
MINISO
Group Momentum Further Accelerated: Same-Store GMV(1) Increased Mid-single Digit in
September Quarter; Revenue Increased 28.2%; Adjusted Operating Profit Increased 14.8%;
MINISO
Brand Added 102 Net New Stores in Mainland China with Strong Same-Store GMV(1)
Growth (“SSSG”) of High-single Digit for September Quarter;
TOP
TOY Brand Revenue(2) Increased 111.4%, another New Quarterly Growth Record
MINISO Group Achieved the Milestone of 8,000 Stores Globally with Quarterly Revenue
Surpassed RMB5 Billion for the First Time
GUANGZHOU, China, November 21, 2025/PRNewswire/- MINISO Group Holding Limited (NYSE: MNSO; HKEX: 9896) (“MINISO”, “MINISO Group” or the “Company”), a global value retailer offering a variety of trendy lifestyle products featuring IP design, today announced its unaudited financial results for the three months and the nine months ended September 30, 2025 (the “September Quarter” and the “First Nine Months”, respectively).
Financial Highlights for the September Quarter
| · | Revenue increased 28.2% year over year to RMB5,796.6 million (US$814.3 million), above the high end of the Company’s previous guidance range of 25%-28%. |
| · | All three of the Company’s operating segments delivered an upward momentum in SSSG during the September Quarter, lifting group-level SSSG to a mid-single digit level. |
| · | MINISO Brand’s SSSG was mid-single digit year over year, underpinned by (i) an exceptional high-single-digit growth in mainland China, and (ii) a low-single-digit growth in overseas markets. |
| · | TOP TOY Brand’s SSSG advanced at a mid-single digit rate year over year. |
| · | Gross profit increased 27.6% year over year to RMB2,590.1 million (US$363.8 million). |
| · | Gross margin was 44.7%, compared to 44.9% in the same period last year. |
| · | Operating profit was RMB846.6 million (US$118.9 million), compared to RMB852.6 million in the same period last year. |
| · | Adjusted operating profit(3) increased 14.8% year over year to RMB1,022.3 million (US$143.6 million), with adjusted operating margin of 17.6%. |
| · | Profit for the period was RMB443.2 million (US$62.3 million), compared to RMB648.3 million in the same period last year. |
| · | Adjusted net profit(3) increased 11.7% year over year to RMB766.8 million (US$107.7 million). |
| · | Adjusted net margin(3) was 13.2%, compared to 15.2% in the same period last year. |
| · | Adjusted EBITDA(3) increased 18.8% year over year to RMB1,353.8 million (US$190.2 million). |
| · | Adjusted EBITDA margin(3) was 23.4%, compared to 25.2% in the same period last year. |
| · | Adjusted basic and diluted earnings per ADS(3) were both RMB2.48 (US$0.35), increased by 12.7% year over year. |
| · | Net cash from operating activities was RMB1,299.6 million (USD182.6 million) in the September Quarter, with an operating cash flow to adjusted net profit ratio of 1.7. Capital expenditure was RMB330.3 million (US$46.4 million) and free cash flow was RMB969.3 million (US$136.2 million) for the September Quarter. |
Financial Highlights for the First Nine Months
| · | Revenue increased 23.7% year over year to RMB15,189.8 million (US$2,133.7 million). |
| · | Gross profit increased 24.5% year over year to RMB6,747.0 million (US$947.7 million). |
| · | Gross margin was 44.4%, compared to 44.1% in the same period last year. |
| · | Operating profit was RMB2,392.5 million (US$336.1 million), compared to RMB2,347.4 million in the same period last year. |
| · | Adjusted operating profit(3) increased 6.5% year over year to RMB2,608.8 million (US$366.5 million), with adjusted operating margin of 17.2%. |
| · | Profit for the period was RMB1,349.2 million (US$189.5 million), compared with RMB1,825.7 million in the same period last year. |
| · | Adjusted net profit(3) increased 6.1% year over year to RMB2,045.5 million (US$287.3 million), compared with RMB1,928.1 million in the same period last year. |
| · | Adjusted net margin(3) was 13.5%, compared to 15.7% in the same period last year. |
| · | Adjusted EBITDA(3) increased 14.0% year over year to RMB3,540.6 million (US$497.3 million). |
| · | Adjusted EBITDA margin(3) was 23.3%, compared to 25.3% in the same period last year. |
| · | Adjusted basic earnings per ADS(3) increased 7.8% year over year to RMB6.64 (US$0.93). |
| · | Adjusted diluted earnings per ADS(3) increased 8.5% year over year to RMB6.64 (US$0.93). |
| · | Cash Position(4) was RMB7,766.2 million (US$1,090.9 million) as of September 30, 2025, compared to RMB6,698.1 million as of December 31, 2024. |
| · | Net cash from operating activities was RMB2,313.8 million (US$325.0 million). Capital expenditure was RMB765.0 million (US$107.5 million) and free cash flow was RMB1,548.8 million (US$217.6 million) for the First Nine Months. |
Operational Highlights
| · | Total number of stores on group level was 8,138 as of September 30, 2025, achieving the milestone of 8,000 stores, with a year-over-year increase of 718 net new stores. |
| · | Number of MINISO stores was 7,831 as of September 30, 2025, representing a year-over-year increase of 645 net new stores. |
| · | Number of MINISO stores in mainland China was 4,407 as of September 30, 2025, representing a year-over-year increase of 157 net new stores. |
| · | Number of MINISO stores in overseas markets reached 3,424 as of September 30, 2025, representing a year-over-year increase of 488 net new stores. |
| · | Number of TOP TOY stores was 307 as of September 30, 2025, representing a year-over-year increase of 73 net new stores. |
Notes:
| (1) | “Same-store GMV” refers to the GMV generated by those stores that opened prior to the beginning of the comparative periods and remained open as of the end of the comparative periods and closed for less than 30 days during both comparative periods. “SSSG” refers to the year-over-year growth of same-store GMV. |
| (2) | Represents only revenue generated from external parties. |
| (3) | See the sections titled “Non-IFRS Financial Measures” and “Reconciliation of Non-IFRS Financial Measures” in this press release for more information. |
| (4) | “Cash position” refers to the combined balance of the Company’s cash and cash equivalents, restricted cash, term deposits with original maturity over three months, and other investments recorded as current assets. |
The following table provides a breakdown of the Company’s store network and its changes on a year-over-year basis. The number of directly operated stores reached 700 on group level. 75.7% of new MINISO stores in the past twelve months were located in overseas markets.
| As of | ||||||||||||
| September 30, | September 30, | |||||||||||
| 2024 | 2025 | YoY | ||||||||||
| Number of stores on group level | 7,420 | 8,138 | 718 | |||||||||
| Number of MINISO stores | 7,186 | 7,831 | 645 | |||||||||
| Mainland China | 4,250 | 4,407 | 157 | |||||||||
| – Directly operated stores | 29 | 21 | (8 | ) | ||||||||
| – Stores operated under MINISO Retail Partner model | 4,196 | 4,358 | 162 | |||||||||
| – Stores operated under distributor model | 25 | 28 | 3 | |||||||||
| Overseas | 2,936 | 3,424 | 488 | |||||||||
| – Directly operated stores | 422 | 637 | 215 | |||||||||
| – Stores operated under MINISO Retail Partner model | 372 | 429 | 57 | |||||||||
| – Stores operated under distributor model | 2,142 | 2,358 | 216 | |||||||||
| Number of TOP TOY stores | 234 | 307 | 73 | |||||||||
| – Directly operated stores | 29 | 42 | 13 | |||||||||
| – Stores operated under TOP TOY Retail Partner model(1) | 205 | 258 | 53 | |||||||||
| – Stores operated under distributor model | – | 7 | 7 | |||||||||
Note:
| (1) | TOP TOY Retail Partner model is a hybrid store operation model similar to MINISO Retail Partner model, taking advantageous elements from the franchise store model and the directly operated chain store model, both of which are industry norms. |
Mr. Guofu Ye, Founder, Chairman, and CEO of MINISO, commented, “We are thrilled to see two significant milestones achieved by MINISO Group in the September Quarter: quarterly revenue surpassed RMB 5 billion for the first time, and MINISO Group’s global store counts exceeded 8,000. In the September Quarter, MINISO mainland China delivered an exceptional performance, with over 100 net new stores on a quarterly basis and a high-single-digit level SSSG in this quarter. Both net store expansion and SSSG demonstrated sequential acceleration. Against the backdrop of a highly competitive physical retail environment in domestic market, MINISO mainland China’s outstanding results further underscored our ability to respond agilely, execute effectively, and leverage the resilience of our business model. SSSG in MINISO mainland China from year to date reached low-single digit. We are steadily progressing toward our goal of achieving full-year positive SSSG for MINISO mainland China in 2025.”
“MINISO overseas had also shown sequential improvement in its same-store GMV, with growth accelerating to low-single digit in the September Quarter. Our strategic markets, such as North America and Europe, continued to deliver outstanding SSSG. We expected to see more momentum from SSSG in the growth of overseas markets, signaling a higher-quality growth that is more sustainable and carries lower operational risk. Meanwhile, we were thrilled to see that the operating margin of MINISO overseas directly operated business has year-over-year improvement, which demonstrated continuous and steady improvement in MINISO’s fundamental operational strengths. Notably, TOP TOY achieved a remarkable 111.4% year-over-year revenue increase in the September Quarter, significantly exceeding our expectations and demonstrating its strong market leadership and growth potential in the pop toy industry.” Mr. Ye continued.
Mr. Eason Zhang, CFO of MINISO, commented, “The year-over-year revenue growth on group level reached 28.2%, above our previous guidance. Adjusted operating profit increased 14.8% year over year. Adjusted operating margin was 17.6%, with year-over-year margin contraction sequentially narrowing from previous quarters, both in line with our previous guidance. Adjusted EBITDA increased 18.8% year over year, with a trend of sequential quarterly acceleration in year-over-year growth. Adjusted EBITDA margin reached 23.4%.”
“Net cash from operating cash flow was RMB1,299.6 million in this quarter, with an operating cash flow to adjusted net profit ratio of 1.7. As of September 30, our cash position reached RMB7.77 billion. Net cash from operating cash flow for the First Nine Months reached 2,313.8 million, surpassing adjusted net profit in the same period. It demonstrated our solid financial position, high-quality profitability and efficient management ability in working capital, and further underscored the resilience and robust operational cash flow generation of our business that will fuel our future high-quality growth.” Mr. Zhang concluded.
Operational Updates
October 2025: According to the Company’s preliminary estimates, the SSSG for MINISO mainland China reached a low-teens level for the whole month of October.
Financial Results for the September Quarter
Revenue was RMB5,796.6 million (US$814.3 million), representing an increase of 28.2% year over year.
Revenue from MINISO brand increased by 22.9% year over year to RMB5,221.5 million (US$733.5 million), including (i) an increase of 19.3% in revenue from MINISO brand in mainland China, accelerating sequentially by quarters in 2025, and (ii) an increase of 27.7% in revenue from MINISO brand in overseas markets. Overseas revenue contributed to 44.3% of revenue from MINISO brand.
Revenue from TOP TOY brand(1) increased by 111.4% to RMB574.5 million (US$80.7 million).
For more information on the composition and year-over-year change of revenue, please refer to the “Unaudited Additional Information” in this press release.
Cost of sales was RMB3,206.6 million (US$450.4 million), representing an increase of 28.6% year over year.
Gross profit was RMB2,590.1 million (US$363.8 million), representing an increase of 27.6% year over year.
Gross margin was 44.7%, compared to 44.9% in the same period last year.
Selling and distribution expenses were RMB1,429.9 million (US$200.9 million), representing an increase of 43.5% year over year. Excluding share-based compensation expenses, selling and distribution expenses were RMB1,333.9 million (US$187.4 million), representing an increase of 36.5% year over year. The year-over-year increase was mainly attributable to the Company’s investments into directly operated stores to pursue the future success of the Company’s business, especially in strategic overseas markets such as the U.S. market. As of September 30, 2025, total number of directly operated stores on the group level was 700, compared to 480 as of September 30, 2024. In the September Quarter, revenue from directly operated stores increased 69.9%, while related expenses including rental and related expenses, depreciation and amortization expenses together with payroll excluding share-based compensation expenses increased 40.7%, decelerating from the year-over-year increase of 71.4% and 56.3% in March and June quarter of 2025, respectively. Promotion and advertising expenses increased 43.3%, as a percentage of revenue stabilizing at around 3% in both comparative periods. Licensing expenses increased 20.8%, as a percentage of revenue stabilizing at around 3% in both comparative periods as well. Logistics expenses increased 23.3% year over year.
General and administrative expenses were RMB343.8 million (US$48.3 million), representing an increase of 45.6% year over year. Excluding share-based compensation expenses, general and administrative expenses were RMB264.0 million (US$37.1 million), representing an increase of 21.4% year over year. The year-over-year increase was primarily due to the increase of personnel-related expenses in relation to the growth of the Company’s business. The increase in equity-settled share-based payment expenses was mainly related to TOP TOY brand.
Other net income was RMB34.3 million (US$4.8 million), compared to RMB36.8 million in the same period last year. The year-over-year decrease was mainly due to a larger net foreign exchange loss compared with the same period last year, partially offset by an increase in investment income from wealth management products.
Operating profit was RMB846.6 million (US$118.9 million), compared with RMB852.6 million in the same period last year.
Adjusted operating profit(2) was RMB1,022.3 million (US$143.6 million), representing an increase of 14.8% year over year, with adjusted operating margin of 17.6%. The year-over-year contraction in adjusted operating margin has narrowed sequentially from 4.2 percentage points in the March quarter, to 2.3 percentage points in the June quarter and further narrowed down to 2.1 percentage points in the September Quarter.
Net finance cost was RMB104.5 million (US$14.7 million), compared to net finance income of RMB7.8 million in the same period last year. The year-over-year increase in finance cost was due to (i) increased interest expenses in relation to the equity linked securities issued by the Company in January 2025 (the “Equity Linked Securities”) and the bank loans used for the acquisition of the equity interest of Yonghui Superstores Co., Ltd* (永輝超市股份有限公司) (“Yonghui”), both of which have been excluded in non-IFRS financial measures(2), and (ii) increased interest expenses on lease liabilities corresponding to the Company’s investment in directly operated stores.
Share of loss of equity-accounted investees, net of tax was RMB145.1 million (US$20.4 million), compared to share of profit of RMB2.0 million in the same period last year. The year-over-year change was mainly attributable to share of loss in Yonghui, which has been excluded in non-IFRS financial measures(2).
Other gain was RMB73.2 million (US$10.3 million), mainly attributable to gain from fair value change of derivatives under mark-to-market impact, which was in relation to the Equity Linked Securities and has been excluded in non-IFRS financial measures(2).
Effective tax rate was 33.9%, compared to 24.8% in the same period last year.
Adjusted effective tax rate(2) was 22.8%, which excluded the impact on effective tax rate as a result of adjusted items, compared to 23.8% in the same period last year.
Profit for the period was RMB443.2 million (US$62.3 million), compared to RMB648.3 million in the same period last year.
Adjusted net profit(2) was RMB766.8 million (US$107.7 million), increased by 11.7% year over year.
Adjusted net margin(2) was 13.2%, compared to 15.2% in the same period last year.
Adjusted EBITDA(2) was RMB1,353.8 million (US$190.2 million), representing an increase of 18.8% year over year.
Adjusted EBITDA margin(2) was 23.4%, compared to 25.2% in the same period last year.
Basic and diluted earnings per ADS were both RMB1.44 (US$0.20) in the September Quarter, compared with RMB2.08 in the same period last year.
Adjusted basic and diluted earnings per ADS(2) were both RMB2.48 (US$0.35) in the September Quarter, representing an increase of 12.7% year over year from RMB2.20 in the same period last year.
Net cash from operating activities was RMB1,299.6 million (USD182.6 million) in the September Quarter, with an operating cash flow to adjusted net profit ratio of 1.7. Capital expenditure was RMB330.3 million (US$46.4 million) and free cash flow was RMB969.3 million (US$136.2 million) for the September Quarter.
Financial Results for the First Nine Months
Revenue was RMB15,189.8 million (US$2,133.7 million), representing an increase of 23.7% year over year.
Revenue from MINISO brand increased by 19.8% to RMB13,870.5 million (US$1,948.4 million), including (i) an increase of 14.1% in revenue from MINISO brand in mainland China, and (ii) an increase of 28.7% in revenue from MINISO brand in overseas markets. The overseas revenue contributed to 42.1% of revenue from MINISO brand, compared to 39.2% in the same period last year.
Revenue from TOP TOY brand(1) increased by 87.9% to RMB1,316.6 million (US$184.9 million).
For more information on the composition and year-over-year change of revenue, please refer to the “Unaudited Additional Information” in this press release.
Cost of sales was RMB8,442.8 million (US$1,185.9 million), representing an increase of 23.0% year over year.
Gross profit was RMB6,747.0 million (US$947.7 million), representing an increase of 24.5% year over year.
Gross margin reached 44.4%, representing a year-over-year increase of 0.3 percentage point.
Selling and distribution expenses were RMB3,610.9 million (US$507.2 million), increased by 43.4% year over year. Excluding share-based compensation expenses, selling and distribution expenses were RMB3,501.0 million (US$491.8 million), increased by 42.4% year over year.
General and administrative expenses were RMB847.5 million (US$119.0 million), increased by 29.4% year over year. Excluding share-based compensation expenses, general and administrative expenses were RMB741.1 million (US$104.1 million), increased by 20.9% year over year.
Other net income was RMB132.5 million (US$18.6 million), compared to RMB78.5 million in the same period last year. The year-over-year increase was mainly due to (i) a net foreign exchange gain compared with a net foreign exchange loss in the same period last year, and (ii) an increase in investment income from wealth management products.
Operating profit was RMB2,392.5 million (US$336.1 million), compared to RMB2,347.4 million in the same period last year.
Adjusted operating profit(2) was RMB2,608.8 million (US$366.5 million), representing an increase of 6.5% year over year.
Net finance cost was RMB232.9 million (US$32.7 million), compared to net finance income of RMB41.9 million in the same period last year. The year-over-year increase in finance cost was due to (i) increased interest expenses in relation to the Equity Linked Securities and the bank loans used for the acquisition of the equity interest of Yonghui, both of which have been excluded in non-IFRS financial measures(2), and (ii) increased interest expenses on lease liabilities corresponding to the Company’s investment in directly operated stores.
Share of loss of equity-accounted investees, net of tax was RMB284.1 million (US$39.9 million), compared with share of profit of RMB2.3 million in the same period last year. The year-over-year change was mainly attributable to share of loss in Yonghui, which has been excluded in non-IFRS financial measures(2).
Other expenses was RMB11.2 million (US$1.6 million), mainly attributable to loss from fair value change of derivatives under mark-to-market impact and issuance cost of derivatives, which were in relation to the Equity Linked Securities and have been excluded in non-IFRS financial measures(2).
Effective tax rate was 27.6%, compared to 23.7% in the same period last year.
Adjusted effective tax rate(2) was 20.1%, which excluded the impact on effective tax rate as a result of adjusted items, compared to 22.7% in the same period last year.
Profit for the period was RMB1,349.2 million (US$189.5 million), compared to RMB1,825.7 million in the same period last year.
Adjusted net profit(2) was RMB2,045.5 million (US$287.3 million), compared to RMB1,928.1 million in the same period last year.
Adjusted net margin(2) was 13.5%, compared to 15.7% in the same period last year.
Adjusted EBITDA(2) increased 14.0% year over year to RMB3,540.6 million (US$497.3 million).
Adjusted EBITDA margin(2) was 23.3%, compared to 25.3% in the same period last year.
Basic earnings per ADS was RMB4.40 (US$0.62), compared to RMB5.84 in the same period last year.
Diluted earnings per ADS was RMB4.36 (US$0.61), compared to RMB5.80 in the same period last year.
Adjusted basic earnings per ADS(2) increased 7.8% year over year to RMB6.64 (US$0.93), compared to RMB6.16 in the same period last year.
Adjusted diluted earnings per ADS(2) increased 8.5% year over year to RMB6.64 (US$0.93), compared to RMB6.12 in the same period last year.
Cash position, which was the combined balance of the Company’s cash and cash equivalents, restricted cash, term deposits, and other investments recorded as current assets was RMB7,766.2 million (US$1,090.9 million) as of September 30, 2025, compared to RMB6,698.1 million as of December 31, 2024.
Net cash from operating activities was RMB2,313.8 million (US$325.0 million). Capital expenditure was RMB765.0 million (US$107.5 million) and free cash flow was RMB1,548.8 million (US$217.6 million) for the First Nine Months.
Notes:
| (1) | Revenue from TOP TOY brand only represents revenue generated from external parties. |
| (2) | See the sections titled “Non-IFRS Financial Measures” and “Reconciliation of Non-IFRS Financial Measures” in this press release for more information. |
Conference Call
The Company’s management will hold an earnings conference call at 4:00 A.M. Eastern Time on Friday, November 21, 2025 (5:00 P.M. Beijing Time on the same day) to discuss the financial results. Simultaneous interpretation in English will be provided during the conference call. The conference call can be accessed via the following methods:
Access 1
Join Zoom meeting.
Zoom link: https://zoom.us/j/97158482833?pwd=msvkC9gwjBFY7o1WCnQWqSJ4cpKEAD.1
Meeting Number: 971 5848 2833
Meeting Passcode: 9896
Access 2
Listeners of the meeting may access the call by dialing the following numbers and using the same meeting number and passcode as access 1.
| United States: | +1 689 278 1000 (or +1 719 359 4580) |
| Hong Kong, China: | +852 5803 3730 (or +852 5803 3731) |
| United Kingdom: | +44 203 481 5237 (or +44 131 460 1196) |
| France: | +33 1 7037 9729 (or +33 1 7037 2246) |
| Singapore: | +65 3158 7288 (or +65 3165 1065) |
| Canada: | +1 438 809 7799 (or +1 204 272 7920) |
Access 3
Listeners of the meeting can also access the call through the Company’s investor relations website at https://ir.miniso.com/.
The replay will be available approximately two hours after the conclusion of the live event at the Company’s investor relations website at https://ir.miniso.com/.
About MINISO Group
MINISO Group is a global value retailer offering a variety of trendy lifestyle products featuring IP design. The Company serves consumers primarily through its large network of MINISO stores, and promotes a relaxing, treasure-hunting and engaging shopping experience full of delightful surprises that appeals to all demographics. Aesthetically pleasing design, quality and affordability are at the core of every product in MINISO’s wide product portfolio, and the Company continually and frequently rolls out products with these qualities. Since the opening of its first store in China in 2013, the Company has built its flagship brand “MINISO” as a globally recognized retail brand and established a massive store network worldwide. For more information, please visit https://ir.miniso.com/.
Exchange Rate
The U.S. dollar (US$) amounts disclosed in this press release, except for those transaction amounts that were actually settled in U.S. dollars, are presented solely for the convenience of the readers. The conversion of Renminbi (RMB) into US$ in this press release is based on the exchange rate set forth in the H.10 statistical release of the Board of Governors of the Federal Reserve System as of September 30, 2025, which was RMB7.1190 to US$1.0000. The percentages stated in this press release are calculated based on the RMB amounts.
Non-IFRS Financial Measures
In evaluating the business, MINISO considers and uses adjusted operating profit, adjusted operating margin, adjusted effective tax rate, adjusted net profit, adjusted net margin, adjusted EBITDA, adjusted EBITDA margin, adjusted basic and diluted net earnings per share and adjusted basic and diluted net earnings per ADS as supplemental measures to review and assess its operating performance. The presentation of these non-IFRS financial measures is not intended to be considered in isolation or as a substitute for the financial information prepared and presented in accordance with IFRS. MINISO defines adjusted operating profit as operating profit for the period excluding equity-settled share-based payment expenses. MINISO calculates adjusted operating margin by dividing adjusted operating profit by revenue for the same period. MINISO defines adjusted effective tax rate as the effective tax rate excluding the tax impact of adjusted items under non-IFRS financial measures. MINISO defines adjusted net profit as profit for the period excluding equity-settled share-based payment expenses, gain or loss from fair value change of derivatives, issuance cost of derivatives and interest expenses related to the Equity Linked Securities, interest expenses related to the bank loans used for acquisition of the equity interest in Yonghui, and share of profit or loss of Yonghui, net of tax. MINISO calculates adjusted net margin by dividing adjusted net profit by revenue for the same period. MINISO defines adjusted EBITDA as adjusted net profit plus depreciation and amortization, finance costs excluding interest expenses related to the Equity Linked Securities and interest expenses related to the bank loans used for acquisition of the equity interest in Yonghui and income tax expense. Adjusted EBITDA margin is computed by dividing adjusted EBITDA by revenue for the period. MINISO computes adjusted basic and diluted net earnings per ADS by dividing adjusted net profit attributable to the equity shareholders of the Company by the number of ADSs represented by the number of ordinary shares used in the basic and diluted earnings per share calculation on an IFRS basis. MINISO computes adjusted basic and diluted net earnings per share in the same way as it calculates adjusted basic and diluted net earnings per ADS, except that it uses the number of ordinary shares used in the basic and diluted earnings per share calculation on an IFRS basis as the denominator instead of the number of ADSs represented by these ordinary shares.
MINISO presents these non-IFRS financial measures because they are used by the management to evaluate its operating performance and formulate business plans. These non-IFRS financial measures enable the management to assess its operating results without considering the impacts of the aforementioned non-cash and other adjustment items that MINISO does not consider to be indicative of its operating performance in the future. Accordingly, MINISO believes that the use of these non-IFRS financial measures provides useful information to investors and others in understanding and evaluating its operating results in the same manner as the management and board of directors.
These non-IFRS financial measures are not defined under IFRS and are not presented in accordance with IFRS. These non-IFRS financial measures have limitations as analytical tools. One of the key limitations of using these non-IFRS financial measures is that they do not reflect all items of income and expense that affect MINISO’s operations. Further, these non-IFRS financial measures may differ from the non-IFRS information used by other companies, including peer companies, and therefore their comparability may be limited.
These non-IFRS financial measures should not be considered in isolation or construed as alternatives to profit, net profit margin, basic and diluted earnings per share and basic and diluted earnings per ADS, as applicable, or any other measures of performance or as indicators of MINISO’s operating performance. Investors are encouraged to review MINISO’s historical non-IFRS financial measures in light of the most directly comparable IFRS measures, as shown below. The non-IFRS financial measures presented here may not be comparable to similarly titled measures presented by other companies. Other companies may calculate similarly titled measures differently, limiting the usefulness of such measures when analyzing MINISO’s data comparatively. MINISO encourages you to review its financial information in its entirety and not rely on a single financial measure.
For more information on the non-IFRS financial measures, please see the table captioned “Reconciliation of Non-IFRS Financial Measures” set forth at the end of this press release.
Safe Harbor Statement
This announcement contains forward-looking statements. These statements are made under the “safe harbor” provisions of the U.S. Private Securities Litigation Reform Act of 1995. These forward-looking statements can be identified by words or phrases such as “may”, “will”, “expect”, “anticipate”, “aim”, “estimate”, “intend”, “plan”, “believe”, “is/are likely to”, “potential”, “continue” or other similar expressions. Among other things, the quotations from management in this announcement, as well as MINISO’s strategic and operational plans, contain forward-looking statements. MINISO may also make written or oral forward-looking statements in its periodic reports to the U.S. Securities and Exchange Commission (the “SEC”) and The Stock Exchange of Hong Kong Limited (the “HKEX”), in its annual report to shareholders, in press releases and other written materials and in oral statements made by its officers, directors or employees to third parties. Statements that are not historical facts, including statements about MINISO’s beliefs and expectations, are forward-looking statements. Forward-looking statements involve inherent risks and uncertainties. A number of factors could cause actual results to differ materially from those contained in any forward-looking statement, including but not limited to the following: MINISO’s mission, goals and strategies; future business development, financial conditions and results of operations; the expected growth of the retail market and the market of branded variety retail of lifestyle products in China and globally; expectations regarding demand for and market acceptance of MINISO’s products; expectations regarding MINISO’s relationships with consumers, suppliers, MINISO Retail Partners, local distributors, and other business partners; competition in the industry; proposed use of proceeds; and relevant government policies and regulations relating to MINISO’s business and the industry. Further information regarding these and other risks is included in MINISO’s filings with the SEC and the HKEX. All information provided in this press release and in the attachments is as of the date of this press release, and MINISO undertakes no obligation to update any forward-looking statement, except as required under applicable law.
Investor Relations Contact:
MINISO Group Holding Limited
Email: ir@miniso.com
Phone: +86 (20) 36228788 Ext.8039
MINISO GROUP HOLDING LIMITED
UNAUDITED CONDENSED CONSOLIDATED STATEMENTS OF FINANCIAL POSITION
(Expressed in thousands)
| As at | As at | |||||||||||
| December 31, 2024 | September 30, 2025 | |||||||||||
| (Audited) | (Unaudited) | |||||||||||
| RMB’000 | RMB’000 | US$’000 | ||||||||||
| ASSETS | ||||||||||||
| Non-current assets | ||||||||||||
| Property, plant and equipment | 1,436,939 | 1,919,666 | 269,654 | |||||||||
| Right-of-use assets | 4,172,083 | 5,008,473 | 703,536 | |||||||||
| Intangible assets | 8,802 | 98,185 | 13,792 | |||||||||
| Goodwill | 21,418 | 225,840 | 31,724 | |||||||||
| Deferred tax assets | 181,948 | 216,410 | 30,399 | |||||||||
| Other investments | 123,399 | 147,944 | 20,782 | |||||||||
| Trade and other receivables | 341,288 | 149,312 | 20,974 | |||||||||
| Term deposits | 140,183 | – | – | |||||||||
| Financial derivative assets | – | 1,108,926 | 155,770 | |||||||||
| Interests in equity-accounted investees | 38,567 | 6,030,265 | 847,066 | |||||||||
| 6,464,627 | 14,905,021 | 2,093,697 | ||||||||||
| Current assets | ||||||||||||
| Other investments | 100,000 | 4,396,781 | 617,612 | |||||||||
| Inventories | 2,750,389 | 3,287,721 | 461,823 | |||||||||
| Trade and other receivables | 2,207,013 | 2,709,889 | 380,656 | |||||||||
| Cash and cash equivalents | 6,328,121 | 3,099,079 | 435,325 | |||||||||
| Restricted cash | 1,026 | 7,138 | 1,003 | |||||||||
| Term deposits | 268,952 | 263,182 | 36,969 | |||||||||
| 11,655,501 | 13,763,790 | 1,933,388 | ||||||||||
| Total assets | 18,120,128 | 28,668,811 | 4,027,085 | |||||||||
MINISO GROUP HOLDING LIMITED
UNAUDITED CONDENSED CONSOLIDATED STATEMENTS OF FINANCIAL POSITION (CONTINUED)
(Expressed in thousands)
| As at | As at | |||||||||||
| December 31, 2024 | September 30, 2025 | |||||||||||
| (Audited) | (Unaudited) | |||||||||||
| RMB’000 | RMB’000 | US$’000 | ||||||||||
| EQUITY | ||||||||||||
| Share capital | 94 | 94 | 13 | |||||||||
| Additional paid-in capital | 4,683,577 | 2,902,595 | 407,725 | |||||||||
| Other reserves | 1,329,126 | 2,204,724 | 309,696 | |||||||||
| Retained earnings | 4,302,177 | 5,636,230 | 791,717 | |||||||||
| Equity attributable to equity shareholders of the Company | 10,314,974 | 10,743,643 | 1,509,151 | |||||||||
| Non-controlling interests | 40,548 | 84,197 | 11,827 | |||||||||
| Total equity | 10,355,522 | 10,827,840 | 1,520,978 | |||||||||
| LIABILITIES | ||||||||||||
| Non-current liabilities | ||||||||||||
| Contract liabilities | 35,145 | 23,271 | 3,269 | |||||||||
| Loans and borrowings | 4,310 | 5,622,289 | 789,758 | |||||||||
| Other payables | 59,842 | 71,585 | 10,055 | |||||||||
| Lease liabilities | 1,903,137 | 2,308,889 | 324,328 | |||||||||
| Financial derivative liabilities | – | 1,464,479 | 205,714 | |||||||||
| Deferred income | 34,983 | 33,294 | 4,677 | |||||||||
| 2,037,417 | 9,523,807 | 1,337,801 | ||||||||||
MINISO GROUP HOLDING LIMITED
UNAUDITED CONDENSED CONSOLIDATED STATEMENTS OF FINANCIAL POSITION (CONTINUED)
(Expressed in thousands)
| As at | As at | |||||||||||
| December 31, 2024 | September 30, 2025 | |||||||||||
| (Audited) | (Unaudited) | |||||||||||
| RMB’000 | RMB’000 | US$’000 | ||||||||||
| Current liabilities | ||||||||||||
| Contract liabilities | 323,292 | 287,242 | 40,349 | |||||||||
| Loans and borrowings | 566,955 | 1,886,022 | 264,928 | |||||||||
| Trade and other payables | 3,943,988 | 4,292,129 | 602,913 | |||||||||
| Lease liabilities | 635,357 | 1,168,637 | 164,157 | |||||||||
| Deferred income | 5,376 | 1,294 | 182 | |||||||||
| Current taxation | 252,221 | 252,315 | 35,442 | |||||||||
| Redemption liabilities arising from preferred shares | – | 429,525 | 60,335 | |||||||||
| 5,727,189 | 8,317,164 | 1,168,306 | ||||||||||
| Total liabilities | 7,764,606 | 17,840,971 | 2,506,107 | |||||||||
| Total equity and liabilities | 18,120,128 | 28,668,811 | 4,027,085 | |||||||||
MINISO GROUP HOLDING LIMITED
UNAUDITED CONDENSED CONSOLIDATED STATEMENTS OF PROFIT OR LOSS
AND OTHER COMPREHENSIVE INCOME
(Expressed in thousands, except for per ordinary share and per ADS data)
| Three months ended September 30, | Nine months ended September 30, | |||||||||||||||||||||||
| 2024 | 2025 | 2024 | 2025 | |||||||||||||||||||||
| (Unaudited) | (Unaudited) | (Unaudited) | (Unaudited) | |||||||||||||||||||||
| RMB’000 | RMB’000 | US$’000 | RMB’000 | RMB’000 | US$’000 | |||||||||||||||||||
| Revenue | 4,522,577 | 5,796,645 | 814,250 | 12,281,320 | 15,189,757 | 2,133,693 | ||||||||||||||||||
| Cost of sales | (2,492,601 | ) | (3,206,573 | ) | (450,425 | ) | (6,861,558 | ) | (8,442,767 | ) | (1,185,948 | ) | ||||||||||||
| Gross profit | 2,029,976 | 2,590,072 | 363,825 | 5,419,762 | 6,746,990 | 947,745 | ||||||||||||||||||
| Other income | 5,327 | 3,549 | 499 | 18,025 | 8,919 | 1,253 | ||||||||||||||||||
| Selling and distribution expenses | (996,461 | ) | (1,429,853 | ) | (200,850 | ) | (2,518,549 | ) | (3,610,875 | ) | (507,217 | ) | ||||||||||||
| General and administrative expenses | (236,208 | ) | (343,802 | ) | (48,294 | ) | (654,781 | ) | (847,458 | ) | (119,042 | ) | ||||||||||||
| Other net income | 36,758 | 34,280 | 4,815 | 78,454 | 132,519 | 18,615 | ||||||||||||||||||
| Reversal of credit loss/(credit loss) on trade and other receivables | 13,170 | (7,678 | ) | (1,079 | ) | 9,564 | (21,128 | ) | (2,968 | ) | ||||||||||||||
| Impairment loss on non-current assets | – | – | – | (5,104 | ) | (16,450 | ) | (2,311 | ) | |||||||||||||||
| Operating profit | 852,562 | 846,568 | 118,916 | 2,347,371 | 2,392,517 | 336,075 | ||||||||||||||||||
| Finance income | 25,067 | 20,276 | 2,848 | 99,673 | 86,112 | 12,096 | ||||||||||||||||||
| Finance costs | (17,227 | ) | (124,805 | ) | (17,531 | ) | (57,822 | ) | (319,041 | ) | (44,815 | ) | ||||||||||||
| Net finance income/(cost) | 7,840 | (104,529 | ) | (14,683 | ) | 41,851 | (232,929 | ) | (32,719 | ) | ||||||||||||||
| Share of profit/(loss) of equity-accounted investees, net of tax | 2,009 | (145,105 | ) | (20,383 | ) | 2,310 | (284,051 | ) | (39,900 | ) | ||||||||||||||
| Other gain/(expenses) | – | 73,214 | 10,284 | – | (11,198 | ) | (1,573 | ) | ||||||||||||||||
| Profit before taxation | 862,411 | 670,148 | 94,134 | 2,391,532 | 1,864,339 | 261,883 | ||||||||||||||||||
| Income tax expense | (214,090 | ) | (226,950 | ) | (31,879 | ) | (565,832 | ) | (515,151 | ) | (72,363 | ) | ||||||||||||
| Profit for the period | 648,321 | 443,198 | 62,255 | 1,825,700 | 1,349,188 | 189,520 | ||||||||||||||||||
| Attributable to: | ||||||||||||||||||||||||
| Equity shareholders of the Company | 641,765 | 440,539 | 61,881 | 1,811,867 | 1,346,569 | 189,152 | ||||||||||||||||||
| Non-controlling interests | 6,556 | 2,659 | 374 | 13,833 | 2,619 | 368 | ||||||||||||||||||
| Earnings per share for ordinary shares | ||||||||||||||||||||||||
| – Basic | 0.52 | 0.36 | 0.05 | 1.46 | 1.10 | 0.15 | ||||||||||||||||||
| – Diluted | 0.52 | 0.36 | 0.05 | 1.45 | 1.09 | 0.15 | ||||||||||||||||||
| Earnings per ADS (Each ADS represents 4 ordinary shares) | ||||||||||||||||||||||||
| – Basic | 2.08 | 1.44 | 0.20 | 5.84 | 4.40 | 0.62 | ||||||||||||||||||
| – Diluted | 2.08 | 1.44 | 0.20 | 5.80 | 4.36 | 0.61 | ||||||||||||||||||
MINISO GROUP HOLDING LIMITED
UNAUDITED CONDENSED CONSOLIDATED STATEMENTS OF PROFIT OR LOSS
AND OTHER COMPREHENSIVE INCOME (CONTINUED)
(Expressed in thousands)
| Three months ended September 30, | Nine months ended September 30, | |||||||||||||||||||||||
| 2024 | 2025 | 2024 | 2025 | |||||||||||||||||||||
| (Unaudited) | (Unaudited) | (Unaudited) | (Unaudited) | |||||||||||||||||||||
| RMB’000 | RMB’000 | US$’000 | RMB’000 | RMB’000 | US$’000 | |||||||||||||||||||
| Profit for the period | 648,321 | 443,198 | 62,255 | 1,825,700 | 1,349,188 | 189,520 | ||||||||||||||||||
| Items that may be reclassified subsequently to profit or loss: | ||||||||||||||||||||||||
| Exchange differences on translation of financial statements of foreign operations | 8,863 | (17,451 | ) | (2,451 | ) | 15,708 | (5,776 | ) | (811 | ) | ||||||||||||||
| Other comprehensive income/(loss) for the period | 8,863 | (17,451 | ) | (2,451 | ) | 15,708 | (5,776 | ) | (811 | ) | ||||||||||||||
| Total comprehensive income for the period | 657,184 | 425,747 | 59,804 | 1,841,408 | 1,343,412 | 188,709 | ||||||||||||||||||
| Attributable to: | ||||||||||||||||||||||||
| Equity shareholders of the Company | 645,096 | 425,972 | 59,836 | 1,823,139 | 1,343,373 | 188,704 | ||||||||||||||||||
| Non-controlling interests | 12,088 | (225 | ) | (32 | ) | 18,269 | 39 | 5 | ||||||||||||||||
MINISO GROUP HOLDING LIMITED
RECONCILIATION OF NON-IFRS FINANCIAL MEASURES
(Expressed in thousands, except for percentages)
| Three months ended September 30, | Nine months ended September 30, | |||||||||||||||||||||||
| 2024 | 2025 | 2024 | 2025 | |||||||||||||||||||||
| (Unaudited) | (Unaudited) | (Unaudited) | (Unaudited) | |||||||||||||||||||||
| RMB’000 | RMB’000 | US$’000 | RMB’000 | RMB’000 | US$’000 | |||||||||||||||||||
| Reconciliation of operating profit for the period to adjusted operating profit | ||||||||||||||||||||||||
| Operating profit | 852,562 | 846,568 | 118,916 | 2,347,371 | 2,392,517 | 336,075 | ||||||||||||||||||
| Add back: | ||||||||||||||||||||||||
| Equity-settled share-based payment expenses | 37,883 | 175,728 | 24,684 | 102,390 | 216,314 | 30,385 | ||||||||||||||||||
| Adjusted operating profit | 890,445 | 1,022,296 | 143,600 | 2,449,761 | 2,608,831 | 366,460 | ||||||||||||||||||
| Adjusted operating margin | 19.7 | % | 17.6 | % | 17.6 | % | 19.9 | % | 17.2 | % | 17.2 | % | ||||||||||||
MINISO GROUP HOLDING LIMITED
RECONCILIATION OF NON-IFRS FINANCIAL MEASURES (CONTINUED)
(Expressed in percentages)
| Three months ended September 30, | Nine months ended September 30, | |||||||||||||||
| 2024 | 2025 | 2024 | 2025 | |||||||||||||
| (Unaudited) | (Unaudited) | (Unaudited) | (Unaudited) | |||||||||||||
| Reconciliation of effective tax rate to adjusted effective tax rate: | ||||||||||||||||
| Effective tax rate | 24.8 | % | 33.9 | % | 23.7 | % | 27.6 | % | ||||||||
| Impact on effective tax rate as a result of adjusted items | (1.0 | )% | (11.1 | )% | (1.0 | )% | (7.5 | )% | ||||||||
| Adjusted effective tax rate | 23.8 | % | 22.8 | % | 22.7 | % | 20.1 | % | ||||||||
MINISO GROUP HOLDING LIMITED
RECONCILIATION OF NON-IFRS FINANCIAL MEASURES (CONTINUED)
(Expressed in thousands, except for per share, per ADS data and percentages)
| Three months ended September 30, | Nine months ended September 30, | |||||||||||||||||||||||
| 2024 | 2025 | 2024 | 2025 | |||||||||||||||||||||
| (Unaudited) | (Unaudited) | (Unaudited) | (Unaudited) | |||||||||||||||||||||
| RMB’000 | RMB’000 | US$’000 | RMB’000 | RMB’000 | US$’000 | |||||||||||||||||||
| Reconciliation of profit for the period to adjusted net profit: | ||||||||||||||||||||||||
| Profit for the period | 648,321 | 443,198 | 62,255 | 1,825,700 | 1,349,188 | 189,520 | ||||||||||||||||||
| Add back: | ||||||||||||||||||||||||
| Equity-settled share-based payment expenses | 37,883 | 175,728 | 24,684 | 102,390 | 216,314 | 30,385 | ||||||||||||||||||
| Gain from fair value change of derivatives(1) | – | (73,214 | ) | (10,284 | ) | – | (33,466 | ) | (4,701 | ) | ||||||||||||||
| Issuance cost of derivatives(2) | – | – | – | – | 44,664 | 6,274 | ||||||||||||||||||
| Interest expenses related to the Equity Linked Securities and the bank loans used for acquisition of the equity interest in Yonghui | – | 75,306 | 10,578 | – | 203,657 | 28,608 | ||||||||||||||||||
| – Interest expenses related to the Equity Linked Securities(3) | – | 51,092 | 7,177 | – | 140,977 | 19,803 | ||||||||||||||||||
| – Interest expenses related to the bank loans used for acquisition of the Yonghui equity interest in | – | 24,214 | 3,401 | – | 62,680 | 8,805 | ||||||||||||||||||
| Share of loss of Yonghui, net of tax | – | 145,804 | 20,481 | – | 265,139 | 37,244 | ||||||||||||||||||
| Adjusted net profit | 686,204 | 766,822 | 107,714 | 1,928,090 | 2,045,496 | 287,330 | ||||||||||||||||||
| Adjusted net margin | 15.2 | % | 13.2 | % | 13.2 | % | 15.7 | % | 13.5 | % | 13.5 | % | ||||||||||||
| Attributable to: | ||||||||||||||||||||||||
| Equity shareholders of the Company | 679,461 | 763,224 | 107,209 | 1,913,891 | 2,041,853 | 286,818 | ||||||||||||||||||
| Non-controlling interests | 6,743 | 3,598 | 505 | 14,199 | 3,643 | 512 | ||||||||||||||||||
| Adjusted net earnings per share(4) | ||||||||||||||||||||||||
| – Basic | 0.55 | 0.62 | 0.09 | 1.54 | 1.66 | 0.23 | ||||||||||||||||||
| – Diluted | 0.55 | 0.62 | 0.09 | 1.53 | 1.66 | 0.23 | ||||||||||||||||||
| Adjusted net earnings per ADS (Each ADS | ||||||||||||||||||||||||
| represents 4 ordinary shares) | ||||||||||||||||||||||||
| – Basic | 2.20 | 2.48 | 0.35 | 6.16 | 6.64 | 0.93 | ||||||||||||||||||
| – Diluted | 2.20 | 2.48 | 0.35 | 6.12 | 6.64 | 0.93 | ||||||||||||||||||
MINISO GROUP HOLDING LIMITED
RECONCILIATION OF NON-IFRS FINANCIAL MEASURES (CONTINUED)
(Expressed in thousands, except for percentages)
| Three months ended September 30, | Nine months ended September 30, | |||||||||||||||||||||||
| 2024 | 2025 | 2024 | 2025 | |||||||||||||||||||||
| (Unaudited) | (Unaudited) | (Unaudited) | (Unaudited) | |||||||||||||||||||||
| RMB’000 | RMB’000 | US$’000 | RMB’000 | RMB’000 | US$’000 | |||||||||||||||||||
| Reconciliation of adjusted net profit for the period to adjusted EBITDA: | ||||||||||||||||||||||||
| Adjusted net profit | 686,204 | 766,822 | 107,714 | 1,928,090 | 2,045,496 | 287,330 | ||||||||||||||||||
| Add back: | ||||||||||||||||||||||||
| Depreciation and amortization | 222,259 | 310,554 | 43,623 | 555,390 | 864,570 | 121,445 | ||||||||||||||||||
| Finance costs excluding interest expenses related to the Equity Linked Securities and the bank loans used for acquisition of the equity interest in Yonghui | 17,227 | 49,499 | 6,953 | 57,822 | 115,384 | 16,207 | ||||||||||||||||||
| Income tax expense | 214,090 | 226,950 | 31,879 | 565,832 | 515,151 | 72,363 | ||||||||||||||||||
| Adjusted EBITDA | 1,139,780 | 1,353,825 | 190,169 | 3,107,134 | 3,540,601 | 497,345 | ||||||||||||||||||
| Adjusted EBITDA margin | 25.2 | % | 23.4 | % | 23.4 | % | 25.3 | % | 23.3 | % | 23.3 | % | ||||||||||||
Notes:
| (1) | The gain or loss from fair value change of derivatives was a non-cash gain or expense that was related to the fair value of the Equity Linked Securities and call spread. It was determined primarily by movements in the underlying share price. |
| (2) | The issuance cost of derivatives was a one-off expense that was related to the Equity Linked Securities. |
| (3) | For the three months ended September 30, 2025, the RMB51.1 million interest expenses related to the Equity Linked Securities included RMB46.2 million non-cash portion and RMB4.9 million cash expense. |
For the nine months ended September 30, 2025, the RMB141.0 million interest expenses related to the Equity Linked Securities included RMB127.0 million non-cash portion and RMB14.0 million cash expense.
| (4) | Adjusted basic and diluted net earnings per share are computed by dividing adjusted net profit attributable to the equity shareholders of the Company by the number of ordinary shares used in the basic and diluted earnings per share calculation on an IFRS basis. |
MINISO GROUP HOLDING LIMITED
UNAUDITED ADDITIONAL INFORMATION
(Expressed in thousands, except for percentages)
| Three months ended September 30, | Nine months ended September 30, | |||||||||||||||||||||||||||||||
| 2024 | 2025 | YoY | 2024 | 2025 | YoY | |||||||||||||||||||||||||||
| RMB’000 | RMB’000 | US$’000 | RMB’000 | RMB’000 | US$’000 | |||||||||||||||||||||||||||
| Revenue | ||||||||||||||||||||||||||||||||
| MINISO Brand | 4,249,307 | 5,221,476 | 733,456 | 22.9 | % | 11,573,972 | 13,870,480 | 1,948,375 | 19.8 | % | ||||||||||||||||||||||
| – Mainland China | 2,438,555 | 2,909,171 | 408,648 | 19.3 | % | 7,031,354 | 8,024,158 | 1,127,147 | 14.1 | % | ||||||||||||||||||||||
| – Overseas | 1,810,752 | 2,312,305 | 324,808 | 27.7 | % | 4,542,618 | 5,846,322 | 821,228 | 28.7 | % | ||||||||||||||||||||||
| TOP TOY Brand | 271,797 | 574,523 | 80,703 | 111.4 | % | 700,717 | 1,316,581 | 184,939 | 87.9 | % | ||||||||||||||||||||||
| Others(1) | 1,473 | 646 | 91 | (56.1 | )% | 6,631 | 2,696 | 379 | (59.3 | )% | ||||||||||||||||||||||
| 4,522,577 | 5,796,645 | 814,250 | 28.2 | % | 12,281,320 | 15,189,757 | 2,133,693 | 23.7 | % | |||||||||||||||||||||||
Note:
| (1) | “Others” refers to revenue generated from other operating segments such as “WonderLife”, which was a secondary brand targeting on lower-tier cities in mainland China, aggregated and presented as “others”. As the MINISO brand increasingly penetrated into lower-tier cities in mainland China, “WonderLife” has become marginalized. |
MINISO GROUP HOLDING LIMITED
UNAUDITED ADDITIONAL INFORMATION
NUMBER OF MINISO STORES IN MAINLAND CHINA
| As of | ||||||||||||
| September 30, | September 30, | |||||||||||
| 2024 | 2025 | YoY | ||||||||||
| By City Tiers | ||||||||||||
| First-tier cities | 563 | 584 | 21 | |||||||||
| Second-tier cities | 1,771 | 1,817 | 46 | |||||||||
| Third- or lower-tier cities | 1,916 | 2,006 | 90 | |||||||||
| Total | 4,250 | 4,407 | 157 | |||||||||
MINISO GROUP HOLDING LIMITED
UNAUDITED ADDITIONAL INFORMATION
NUMBER OF MINISO STORES IN OVERSEAS MARKETS
| As of | ||||||||||||
| September 30, | September 30, | |||||||||||
| 2024 | 2025 | YoY | ||||||||||
| By Regions | ||||||||||||
| Asia excluding China | 1,572 | 1,748 | 176 | |||||||||
| North America | 294 | 421 | 127 | |||||||||
| Latin America | 598 | 684 | 86 | |||||||||
| Europe | 260 | 337 | 77 | |||||||||
| Others | 212 | 234 | 22 | |||||||||
| Total | 2,936 | 3,424 | 488 | |||||||||
* For identification purpose only
|
FF305 Page 1 of 7 v 1.3.0 Next Day Disclosure Return (Equity issuer - changes in issued shares or treasury shares, share buybacks and/or on-market sales of treasury shares) Instrument: Equity issuer Status: New Submission Name of Issuer: MINISO Group Holding Limited Date Submitted: 21 November 2025 Section I must be completed by a listed issuer where there has been a change in its issued shares or treasury shares which is discloseable pursuant to rule 13.25A of the Rules Governing the Listing of Securities on The Stock Exchange of Hong Kong Limited (the “Exchange”) (the “Main Board Rules”) or rule 17.27A of the Rules Governing the Listing of Securities on GEM of the Exchange (the “GEM Rules”). Section I 1. Class of shares Ordinary shares Type of shares Not applicable Listed on the Exchange Yes Stock code (if listed) 09896 Description A. Changes in issued shares or treasury shares Events Changes in issued shares (excluding treasury shares) Number of issued shares (excluding treasury shares) As a % of existing number of issued shares (excluding treasury shares) before the relevant event (Note 3) Changes in treasury shares Number of treasury shares Issue/ selling price per share (Note 4) Total number of issued shares Opening balance as at (Note 1) 31 October 2025 1,237,564,177 0 1,237,564,177 1). Other (please specify) See Part B Date of changes 20 November 2025 % Closing balance as at (Notes 5 and 6) 20 November 2025 1,237,564,177 0 1,237,564,177 |
|
FF305 Page 2 of 7 v 1.3.0 B. Shares redeemed or repurchased for cancellation but not yet cancelled as at the closing balance date (Notes 5 and 6) 1). Shares repurchased for cancellation but not yet cancelled Date of changes 20 November 2025 18,000 0.0015 % USD 4.8574 |
|
FF305 Page 3 of 7 v 1.3.0 Confirmation Pursuant to Main Board Rule 13.25C / GEM Rule 17.27C, we hereby confirm to the best knowledge, information and belief that, in relation to each issue of shares or sale or transfer of treasury shares as set out in Section I, it has been duly authorised by the board of directors of the listed issuer and carried out in compliance with all applicable listing rules, laws and other regulatory requirements and, insofar as applicable: (Note 7) (i) all money due to the listed issuer in respect of the issue of shares, or sale or transfer of treasury shares has been received by it; (ii) all pre-conditions for the listing imposed by the Main Board Rules / GEM Rules under "Qualifications of listing" have been fulfilled; (iii) all (if any) conditions contained in the formal letter granting listing of and permission to deal in the securities have been fulfilled; (iv) all the securities of each class are in all respects identical (Note 8); (v) all documents required by the Companies (Winding Up and Miscellaneous Provisions) Ordinance to be filed with the Registrar of Companies have been duly filed and that compliance has been made with all other legal requirements; (vi) all the definitive documents of title have been delivered/are ready to be delivered/are being prepared and will be delivered in accordance with the terms of issue, sale or transfer; (vii) completion has taken place of the purchase by the issuer of all property shown in the listing document to have been purchased or agreed to be purchased by it and the purchase consideration for all such property has been duly satisfied; and (viii) the trust deed/deed poll relating to the debenture, loan stock, notes or bonds has been completed and executed, and particulars thereof, if so required by law, have been filed with the Registrar of Companies. Notes to Section I: 1. Please insert the closing balance date of the last Next Day Disclosure Return published pursuant to Main Board Rule 13.25A / GEM Rule 17.27A or Monthly Return pursuant to Main Board Rule 13.25B / GEM Rule 17.27B, whichever is the later. 2. Please set out all changes in issued shares or treasury shares requiring disclosure pursuant to Main Board Rule 13.25A / GEM Rule 17.27A together with the relevant dates of changes. Each category will need to be disclosed individually with sufficient information to enable the user to identify the relevant category in the listed issuer's Monthly Return. For example, multiple issues of shares as a result of multiple exercises of share options under the same share option scheme or of multiple conversions under the same convertible note must be aggregated and disclosed as one category. However, if the issues resulted from exercises of share options under 2 share option schemes or conversions of 2 convertible notes, these must be disclosed as 2 separate categories. 3. The percentage change in the number of issued shares (excluding treasury shares) of the listed issuer is to be calculated by reference to the opening balance of the number of issued shares (excluding treasury shares) being disclosed in this Next Day Disclosure Return. |
|
FF305 Page 4 of 7 v 1.3.0 4. In the case of a share repurchase or redemption, the “issue/ selling price per share” shall be construed as “repurchase price per share” or “redemption price per share”. Where shares have been issued/ sold/ repurchased/ redeemed at more than one price per share, a volume-weighted average price per share should be given. 5. The closing balance date is the date of the last relevant event being disclosed. 6. For repurchase or redemption of shares, disclosure is required when the relevant event has occurred (subject to the provisions of Main Board Rules 10.06(4)(a), 13.25A and 13.31 / GEM Rules 13.13(1), 17.27A and 17.35), even if the repurchased or redeemed shares have not yet been cancelled. If repurchased or redeemed shares are to be cancelled upon settlement of such repurchase or redemption after the closing balance date, they shall remain part of the issued shares as at the closing balance date in Part A. Details of these repurchased or redeemed shares shall be disclosed in Part B. 7. Items (i) to (viii) are suggested forms of confirmation. The listed issuer may amend the item(s) that is/are not applicable to meet individual cases. 8. “Identical” means in this context: - the securities are of the same nominal value with the same amount called up or paid up; - they are entitled to dividend/interest at the same rate and for the same period, so that at the next ensuing distribution, the dividend/interest payable per unit will amount to exactly the same sum (gross and net); and - they carry the same rights as to unrestricted transfer, attendance and voting at meetings and rank pari passu in all other respects. |
|
FF305 Page 5 of 7 v 1.3.0 Section II must also be completed by a listed issuer where it has made a repurchase of shares which is discloseable under Main Board Rule 10.06(4)(a) / GEM Rule 13.13(1). Repurchase report Section II 1. Class of shares Ordinary shares Type of shares Not applicable Listed on the Exchange Yes Stock code (if listed) 09896 Description A. Repurchase report Trading date Number of shares repurchased Method of repurchase (Note 1) Repurchase price per share or highest repurchase price per share $ Lowest repurchase price per share $ Aggregate price paid $ 1). 20 November 2025 18,000 On another stock exchange New York Stock Exchange USD 4.875 USD 4.8325 USD 87,432.88 Total number of shares repurchased 18,000 Aggregate price paid $ USD 87,432.88 Number of shares repurchased for cancellation 18,000 Number of shares repurchased for holding as treasury shares 0 B. Additional information for issuer who has a primary listing on the Exchange 1). Date of the resolution granting the repurchase mandate 12 June 2025 2). Total number of shares which the issuer is authorised to repurchase under the repurchase mandate 124,122,899 3). Number of shares repurchased on the Exchange or another stock exchange under the repurchase mandate (a) 3,698,816 4). As a % of number of issued shares (excluding treasury shares) as at the date of the resolution granting the repurchase mandate (a) x 100 / number of issued shares (excluding treasury shares) as at the date of the resolution granting the repurchase mandate 0.297996 % 5). Moratorium period for any issue of new shares, or sale or transfer of treasury shares after the share repurchase(s) set out in Part A (Note 2) Up to 20 December 2025 |
|
FF305 Page 6 of 7 v 1.3.0 We hereby confirm that the repurchases made on the Exchange set out in Part A above were made in accordance with the Main Board Rules / GEM Rules and that there have been no material changes to the particulars contained in the Explanatory Statement dated ................24 April 2025.......................... which has been filed with the Exchange. We also confirm that any repurchases made on another stock exchange set out in Part A above were made in accordance with the domestic rules applying to repurchases on that other stock exchange. Remarks: Repurchase of 4,500 ADSs (representing 18,000 ordinary shares) on the NYSE on November 20, 2025 U.S. time pursuant to a 10b5-1 repurchase program entered by the Company. Notes to Section II: 1. Please state whether the repurchase was made on the Exchange, on another stock exchange (stating the name of the exchange), by private arrangement or by general offer. 2. Subject to the carve-out set out in Main Board Rule 10.06(3)(a)/ GEM Rule 13.12, an issuer may not (i) make a new issue of shares, or a sale or transfer of any treasury shares; or (ii) announce a proposed new issue of shares, or a sale or transfer of any treasury shares, for a period of 30 days after any purchase by it of shares, whether on the Exchange or otherwise, without the prior approval of the Exchange. |
|
FF305 Page 7 of 7 v 1.3.0 Section III must also be completed by a listed issuer where it has made a sale of treasury shares on the Exchange or any other stock exchange on which the issuer is listed which is discloseable under Main Board Rule 10.06B / GEM Rule 13.14B. Report of on-market sale of treasury shares Not applicable Submitted by: Ye Guofu (Name) Title: Director (Director, Secretary or other Duly Authorised Officer) |
|
FF305 Page 1 of 7 v 1.3.0 Next Day Disclosure Return (Equity issuer - changes in issued shares or treasury shares, share buybacks and/or on-market sales of treasury shares) Instrument: Equity issuer Status: New Submission Name of Issuer: MINISO Group Holding Limited Date Submitted: 23 November 2025 Section I must be completed by a listed issuer where there has been a change in its issued shares or treasury shares which is discloseable pursuant to rule 13.25A of the Rules Governing the Listing of Securities on The Stock Exchange of Hong Kong Limited (the “Exchange”) (the “Main Board Rules”) or rule 17.27A of the Rules Governing the Listing of Securities on GEM of the Exchange (the “GEM Rules”). Section I 1. Class of shares Ordinary shares Type of shares Not applicable Listed on the Exchange Yes Stock code (if listed) 09896 Description A. Changes in issued shares or treasury shares Events Changes in issued shares (excluding treasury shares) Number of issued shares (excluding treasury shares) As a % of existing number of issued shares (excluding treasury shares) before the relevant event (Note 3) Changes in treasury shares Number of treasury shares Issue/ selling price per share (Note 4) Total number of issued shares Opening balance as at (Note 1) 20 November 2025 1,237,564,177 0 1,237,564,177 1). Other (please specify) See Part B Date of changes 21 November 2025 % Closing balance as at (Notes 5 and 6) 21 November 2025 1,237,564,177 0 1,237,564,177 |
|
FF305 Page 2 of 7 v 1.3.0 B. Shares redeemed or repurchased for cancellation but not yet cancelled as at the closing balance date (Notes 5 and 6) 1). Shares repurchased for cancellation but not yet cancelled Date of changes 21 November 2025 48,412 0.0039 % USD 4.8001 |
|
FF305 Page 3 of 7 v 1.3.0 Confirmation Pursuant to Main Board Rule 13.25C / GEM Rule 17.27C, we hereby confirm to the best knowledge, information and belief that, in relation to each issue of shares or sale or transfer of treasury shares as set out in Section I, it has been duly authorised by the board of directors of the listed issuer and carried out in compliance with all applicable listing rules, laws and other regulatory requirements and, insofar as applicable: (Note 7) (i) all money due to the listed issuer in respect of the issue of shares, or sale or transfer of treasury shares has been received by it; (ii) all pre-conditions for the listing imposed by the Main Board Rules / GEM Rules under "Qualifications of listing" have been fulfilled; (iii) all (if any) conditions contained in the formal letter granting listing of and permission to deal in the securities have been fulfilled; (iv) all the securities of each class are in all respects identical (Note 8); (v) all documents required by the Companies (Winding Up and Miscellaneous Provisions) Ordinance to be filed with the Registrar of Companies have been duly filed and that compliance has been made with all other legal requirements; (vi) all the definitive documents of title have been delivered/are ready to be delivered/are being prepared and will be delivered in accordance with the terms of issue, sale or transfer; (vii) completion has taken place of the purchase by the issuer of all property shown in the listing document to have been purchased or agreed to be purchased by it and the purchase consideration for all such property has been duly satisfied; and (viii) the trust deed/deed poll relating to the debenture, loan stock, notes or bonds has been completed and executed, and particulars thereof, if so required by law, have been filed with the Registrar of Companies. Notes to Section I: 1. Please insert the closing balance date of the last Next Day Disclosure Return published pursuant to Main Board Rule 13.25A / GEM Rule 17.27A or Monthly Return pursuant to Main Board Rule 13.25B / GEM Rule 17.27B, whichever is the later. 2. Please set out all changes in issued shares or treasury shares requiring disclosure pursuant to Main Board Rule 13.25A / GEM Rule 17.27A together with the relevant dates of changes. Each category will need to be disclosed individually with sufficient information to enable the user to identify the relevant category in the listed issuer's Monthly Return. For example, multiple issues of shares as a result of multiple exercises of share options under the same share option scheme or of multiple conversions under the same convertible note must be aggregated and disclosed as one category. However, if the issues resulted from exercises of share options under 2 share option schemes or conversions of 2 convertible notes, these must be disclosed as 2 separate categories. 3. The percentage change in the number of issued shares (excluding treasury shares) of the listed issuer is to be calculated by reference to the opening balance of the number of issued shares (excluding treasury shares) being disclosed in this Next Day Disclosure Return. |
|
FF305 Page 4 of 7 v 1.3.0 4. In the case of a share repurchase or redemption, the “issue/ selling price per share” shall be construed as “repurchase price per share” or “redemption price per share”. Where shares have been issued/ sold/ repurchased/ redeemed at more than one price per share, a volume-weighted average price per share should be given. 5. The closing balance date is the date of the last relevant event being disclosed. 6. For repurchase or redemption of shares, disclosure is required when the relevant event has occurred (subject to the provisions of Main Board Rules 10.06(4)(a), 13.25A and 13.31 / GEM Rules 13.13(1), 17.27A and 17.35), even if the repurchased or redeemed shares have not yet been cancelled. If repurchased or redeemed shares are to be cancelled upon settlement of such repurchase or redemption after the closing balance date, they shall remain part of the issued shares as at the closing balance date in Part A. Details of these repurchased or redeemed shares shall be disclosed in Part B. 7. Items (i) to (viii) are suggested forms of confirmation. The listed issuer may amend the item(s) that is/are not applicable to meet individual cases. 8. “Identical” means in this context: - the securities are of the same nominal value with the same amount called up or paid up; - they are entitled to dividend/interest at the same rate and for the same period, so that at the next ensuing distribution, the dividend/interest payable per unit will amount to exactly the same sum (gross and net); and - they carry the same rights as to unrestricted transfer, attendance and voting at meetings and rank pari passu in all other respects. |
|
FF305 Page 5 of 7 v 1.3.0 Section II must also be completed by a listed issuer where it has made a repurchase of shares which is discloseable under Main Board Rule 10.06(4)(a) / GEM Rule 13.13(1). Repurchase report Section II 1. Class of shares Ordinary shares Type of shares Not applicable Listed on the Exchange Yes Stock code (if listed) 09896 Description A. Repurchase report Trading date Number of shares repurchased Method of repurchase (Note 1) Repurchase price per share or highest repurchase price per share $ Lowest repurchase price per share $ Aggregate price paid $ 1). 21 November 2025 48,412 On another stock exchange New York Stock Exchange USD 4.875 USD 4.67 USD 232,383.61 Total number of shares repurchased 48,412 Aggregate price paid $ USD 232,383.61 Number of shares repurchased for cancellation 48,412 Number of shares repurchased for holding as treasury shares 0 B. Additional information for issuer who has a primary listing on the Exchange 1). Date of the resolution granting the repurchase mandate 12 June 2025 2). Total number of shares which the issuer is authorised to repurchase under the repurchase mandate 124,122,899 3). Number of shares repurchased on the Exchange or another stock exchange under the repurchase mandate (a) 3,747,228 4). As a % of number of issued shares (excluding treasury shares) as at the date of the resolution granting the repurchase mandate (a) x 100 / number of issued shares (excluding treasury shares) as at the date of the resolution granting the repurchase mandate 0.301897 % 5). Moratorium period for any issue of new shares, or sale or transfer of treasury shares after the share repurchase(s) set out in Part A (Note 2) Up to 21 December 2025 |
|
FF305 Page 6 of 7 v 1.3.0 We hereby confirm that the repurchases made on the Exchange set out in Part A above were made in accordance with the Main Board Rules / GEM Rules and that there have been no material changes to the particulars contained in the Explanatory Statement dated ................24 April 2025.......................... which has been filed with the Exchange. We also confirm that any repurchases made on another stock exchange set out in Part A above were made in accordance with the domestic rules applying to repurchases on that other stock exchange. Remarks: Repurchase of 12,103 ADSs (representing 48,412 ordinary shares) on the NYSE on November 21, 2025 U.S. time pursuant to a 10b5-1 repurchase program entered by the Company. Notes to Section II: 1. Please state whether the repurchase was made on the Exchange, on another stock exchange (stating the name of the exchange), by private arrangement or by general offer. 2. Subject to the carve-out set out in Main Board Rule 10.06(3)(a)/ GEM Rule 13.12, an issuer may not (i) make a new issue of shares, or a sale or transfer of any treasury shares; or (ii) announce a proposed new issue of shares, or a sale or transfer of any treasury shares, for a period of 30 days after any purchase by it of shares, whether on the Exchange or otherwise, without the prior approval of the Exchange. |
|
FF305 Page 7 of 7 v 1.3.0 Section III must also be completed by a listed issuer where it has made a sale of treasury shares on the Exchange or any other stock exchange on which the issuer is listed which is discloseable under Main Board Rule 10.06B / GEM Rule 13.14B. Report of on-market sale of treasury shares Not applicable Submitted by: Ye Guofu (Name) Title: Director (Director, Secretary or other Duly Authorised Officer) |