UNITED STATES
SECURITIES AND EXCHANGE COMMISSION
Washington, D.C. 20549
FORM 6-K
REPORT OF FOREIGN PRIVATE ISSUER
PURSUANT TO RULE 13a-16 OR 15d-16
UNDER THE SECURITIES EXCHANGE ACT OF 1934
For the month of November 2025
Commission File Number: 001-13184
TECK RESOURCES LIMITED
(Exact name of registrant as specified in its charter)
Suite 3300 – 550 Burrard Street
Vancouver, British Columbia V6C 0B3
(Address of principal executive offices)
Indicate by check mark whether the registrant files or will file annual reports under cover of Form 20-F or Form 40-F.
Form 20-F ¨ Form 40-F x Pursuant to the requirements of the Securities Exchange Act of 1934, the registrant has duly caused this report to be signed on its behalf by the undersigned, thereunto duly authorized.
EXHIBIT INDEX
| Exhibit Number |
Description | |
| 99.1 | NI 43-101 Technical Report, Collahuasi Copper Mine, Tarapacá Region, Chile; November 3, 2025 |
SIGNATURE
| Teck Resources Limited | ||
| (Registrant) | ||
| Date: November 10, 2025 | By: | /s/ Amanda R. Robinson |
| Amanda R. Robinson | ||
| Corporate Secretary | ||
Exhibit 99.1
NI 43-101 TECHNICAL REPORT, COLLAHUASI COPPER MINE, TARAPACÁ REGION, CHILE
Prepared for
Anglo American Plc
Effective Date: 31 December 2024
Issue Date: 03 November 2025
Prepared by Qualified Persons
Tim Lucks, Corporate Consultant (Project Evaluation), AusIMM(CP)
Martin Pittuck, Corporate Consultant (Resource Geology), CEng, FGS, MIMMM(QMR)
Max Brown, Principal Consultant (Geotechnics), CEng, MIMMM
Francois Taljaard, Principal Consultant (Mining Engineering), Pr.Eng
John Willis, Principal Consultant (Mineral Processing), MAusIMM(CP)
Richard Martindale, Principal Consultant (Geotechnical/ Tailings Engineering), CEng, MIMMM
James Bellin, Principal Consultant (Water), CGeol FGS
Colin Chapman, Principal Consultant (Infrastructure), CEng, MIMMM(QMR)
Project Number: UK32812
SRK Consulting (UK) Limited

| SRK Consulting (UK) Limited | Mineral Resources and Mineral Reserves, Collahuasi Copper Mine - Details |
NI 43-101 TECHNICAL REPORT, COLLAHUASI COPPER MINE, TARAPACÁ REGION, CHILE
Issuer:
Anglo American Plc
17 Charterhouse Street
London
EC1N 6RA
United Kingdom
Effective Date: 31 December 2024
Issue Date: 03 November 2025
Project Number: UK32812
Technical Report Author:
Qualified Persons
Employees of SRK Consulting (UK) Limited
5th Floor Churchill House
17 Churchill Way
Cardiff, CF10 2HH
Wales, United Kingdom
Other SRK Experts:
Emily Harris, Principal Consultant (Sustainability), CEnv, MISEP
SRK Peer Reviewers:
Iestyn Humphreys, Corporate Consultant (Due Diligence)
| November 2025 |
| SRK Consulting (UK) Limited | Mineral Resources and Mineral Reserves, Collahuasi Copper Mine - Table of Contents |
Table of Contents
| ITEM 1 | SUMMARY | 1 |
| 1.1 | Introduction | 1 |
| 1.2 | Property Description | 2 |
| 1.3 | History | 3 |
| 1.4 | Geology Setting, Mineralisation and Deposit Type | 6 |
| 1.5 | Exploration, Drilling, Sampling, Analysis and Data Verification | 6 |
| 1.6 | Mineral Processing and Metallurgical Testwork | 8 |
| 1.7 | Mineral Resource and Mineral Reserve Estimates | 8 |
| 1.8 | Mining Operations | 15 |
| 1.9 | Processing and Recovery Operations | 15 |
| 1.10 | Infrastructure, Power, Permitting and Compliance | 16 |
| 1.11 | Development Projects | 18 |
| 1.12 | Production, Capital and Operating costs | 19 |
| 1.13 | Exploration Potential | 20 |
| 1.14 | Conclusions and Recommendations | 21 |
| ITEM 2 | INTRODUCTION | 30 |
| 2.1 | Terms of Reference | 31 |
| 2.2 | Qualified Persons | 31 |
| 2.3 | Personal Inspection of the Collahuasi Property | 32 |
| 2.4 | Forward-Looking Statements | 34 |
| ITEM 3 | RELIANCE ON OTHER EXPERTS | 34 |
| 3.1 | Legal Title | 34 |
| 3.2 | Environmental, Social and Governance | 34 |
| 3.3 | Taxation | 34 |
| ITEM 4 | PROPERTY DESCRIPTION AND LOCATION | 35 |
| 4.1 | Property Description and Ownership | 35 |
| 4.2 | Location | 35 |
| 4.3 | Mineral Rights | 37 |
| 4.3.1 | Regulatory framework | 37 |
| 4.3.2 | Concession status | 38 |
| 4.3.3 | Surface rights | 40 |
| 4.3.4 | Water rights | 40 |
| 4.4 | Property Boundaries and Mine Site Layout | 41 |
| 4.5 | Environmental Approvals | 43 |
| 4.5.1 | Regulatory framework | 43 |
| 4.5.2 | Permitting Status | 44 |
| 4.5.3 | Compliance | 46 |
| 4.6 | Environmental Liabilities | 46 |
| ITEM 5 | ACCESSIBILITY, CLIMATE, LOCAL RESOURCES, INFRASTRUCTURE AND PHYSIOGRAPHY | 47 |
| 5.1 | Accessibility | 47 |
| 5.2 | Infrastructure and Facilities | 47 |
| 5.3 | Environmental and Social Setting | 47 |
| 5.3.1 | Mine site | 47 |
| 5.3.2 | Pipeline and port | 53 |
| November 2025 | ||
| Page |
| SRK Consulting (UK) Limited | Mineral Resources and Mineral Reserves, Collahuasi Copper Mine – Table of Contents |
| ITEM 6 | HISTORY | 55 |
| ITEM 7 | GEOLOGICAL SETTING AND MINERALIZATION | 62 |
| 7.1 | Regional Geology | 62 |
| 7.2 | Local Geology | 64 |
| 7.2.1 | Lithology | 64 |
| 7.2.2 | Mineralisation | 65 |
| 7.2.3 | Alteration | 67 |
| ITEM 8 | DEPOSIT TYPES | 69 |
| ITEM 9 | EXPLORATION | 70 |
| 9.1 | Pre-Mining | 70 |
| 9.2 | Early Mining | 70 |
| 9.3 | Expansion and Mine Studies | 70 |
| ITEM 10 | DRILLING | 71 |
| 10.1 | Introduction | 71 |
| 10.2 | Historical Drilling | 74 |
| 10.3 | Early Operations | 74 |
| 10.4 | Post 2010 Drill-out | 74 |
| 10.5 | Drilling Since MRE Cutoff Date | 74 |
| 10.6 | Summary Drill History | 75 |
| 10.7 | Blast Hole Drilling | 77 |
| 10.8 | Down Hole Survey | 77 |
| 10.9 | Topographic Survey | 77 |
| ITEM 11 | SAMPLE PREPARATION, ANALYSES AND SECURITY | 78 |
| 11.1 | Core Transport | 78 |
| 11.2 | Database Management | 78 |
| 11.3 | Core Logging | 78 |
| 11.4 | Sampling | 79 |
| 11.5 | Sample Preparation | 79 |
| 11.6 | Assaying | 80 |
| 11.7 | Quality Control | 81 |
| 11.7.1 | Historical Results | 82 |
| 11.8 | Summary | 82 |
| ITEM 12 | DATA VERIFICATION | 84 |
| 12.1 | Independent Peer Review | 84 |
| 12.2 | Quality Control and Library Records | 84 |
| 12.3 | Site Visit Inspection | 85 |
| 12.4 | Data Entry Checks | 87 |
| 12.5 | Block Model Estimation Data Assessment | 88 |
| 12.5.1 | Core Recovery | 88 |
| 12.5.2 | RC vs DD Comparison | 88 |
| 12.5.3 | Ujina Old vs New Drilling Comparison | 89 |
| 12.5.4 | Rosario Resource Model Reconciliation | 89 |
| ITEM 13 | MINERAL PROCESSING AND METALLURGICAL TESTING | 93 |
| 13.1 | Historical Metallurgical Domaining | 93 |
| 13.2 | Geometallurgical Modelling – Rosario, Rosario West | 94 |
| 13.3 | Geometallurgical Modelling - Ujina | 101 |
| November 2025 | ||
| Page |
| SRK Consulting (UK) Limited | Mineral Resources and Mineral Reserves, Collahuasi Copper Mine – Table of Contents |
| ITEM 14 | MINERAL RESOURCE ESTIMATES | 102 |
| 14.1 | Introduction | 102 |
| 14.2 | Resource Estimation Procedures | 102 |
| 14.3 | The Resource Database | 103 |
| 14.4 | Geological Modelling | 104 |
| 14.4.1 | Structural model | 104 |
| 14.4.2 | Lithological model | 105 |
| 14.4.3 | Alteration model | 106 |
| 14.4.4 | Cu Mineralogy model | 117 |
| 14.4.5 | Cu and Mo Grade shells | 108 |
| 14.4.6 | Additional models | 110 |
| 14.4.7 | Final estimation domains | 110 |
| 14.5 | Data Conditioning | 112 |
| 14.5.1 | Compositing | 112 |
| 14.5.2 | High-grade distance restrictions | 113 |
| 14.6 | Statistical Analysis | 116 |
| 14.6.1 | Copper | 116 |
| 14.6.2 | Molybdenum | 118 |
| 14.6.3 | Density | 120 |
| 14.7 | Grade Continuity Analysis | 120 |
| 14.7.1 | Rosario | 121 |
| 14.7.2 | Rosario West | 121 |
| 14.7.3 | Ujina | 121 |
| 14.8 | Block Model Definition | 121 |
| 14.9 | Grade Interpolation | 122 |
| 14.9.1 | Rosario | 122 |
| 14.9.2 | Rosario West | 123 |
| 14.9.3 | Ujina | 124 |
| 14.10 | Validation of Block Model Estimates | 124 |
| 14.10.1 | Visual validation | 124 |
| 14.10.2 | Swath plots and histograms | 125 |
| 14.10.3 | Global statistics | 127 |
| 14.10.4 | Validation summary | 128 |
| 14.11 | Resource Classification | 128 |
| 14.11.1 | Rosario | 129 |
| 14.11.2 | Rosario West | 129 |
| 14.11.3 | Ujina | 129 |
| 14.12 | Dilution Considerations | 130 |
| 14.13 | Reasonable Prospects for Eventual Economic Extraction | 130 |
| 14.14 | Stockpiles | 132 |
| 14.15 | Mineral Resource Statement | 133 |
| 14.16 | Comparison with Previous Mineral Resource Estimate | 135 |
| 14.17 | Grade and Tonnage Sensitivity | 136 |
| ITEM 15 | MINERAL RESERVE ESTIMATES | 138 |
| 15.1 | Mineral Reserve Estimation Approach | 138 |
| 15.2 | Mineral Reserve Assumptions | 138 |
| 15.2.1 | Block models and surfaces | 138 |
| November 2025 | ||
| Page |
| SRK Consulting (UK) Limited | Mineral Resources and Mineral Reserves, Collahuasi Copper Mine – Table of Contents |
| 15.2.2 | Open pit geotechnical design criteria | 139 |
| 15.2.3 | Rosario pit | 139 |
| 15.2.4 | Ujina pit | 140 |
| 15.3 | Re-blocking, Dilution and Ore Loss | 141 |
| 15.4 | Metallurgical Considerations | 142 |
| 15.5 | Economic Parameters | 142 |
| 15.6 | Pit Optimisation Results | 145 |
| 15.6.1 | Rosario optimisation results | 145 |
| 15.6.2 | Ujina optimisation results | 147 |
| 15.7 | Pit Design | 149 |
| 15.7.1 | Rosario open pit | 150 |
| 15.7.2 | Ujina open pit | 152 |
| 15.7.3 | Waste Rock Dumps | 154 |
| 15.7.4 | Waste Rock Dump design | 154 |
| 15.8 | Mineral Reserve Statement | 155 |
| 15.9 | Comparison with Previous Mineral Reserve Estimate | 157 |
| ITEM 16 | MINING METHODS | 158 |
| 16.1 | Pit Dewatering and Depressurisation | 158 |
| 16.1.1 | Rosario | 158 |
| 16.1.2 | Ujina | 163 |
| 16.2 | Open Pit Geotechnical Engineering | 163 |
| 16.2.1 | Geotechnical data | 163 |
| 16.2.2 | Geological model | 165 |
| 16.2.3 | Large-scale structural model | 165 |
| 16.2.4 | Rock mass model | 166 |
| 16.2.5 | Hydrogeological model | 169 |
| 16.2.6 | Slope design geometry | 169 |
| 16.2.7 | Slope design implementation and pit wall performance | 170 |
| 16.2.8 | Slope displacement monitoring | 171 |
| 16.2.9 | Stability assessment of Rosario slope design (five-year plan) | 174 |
| 16.2.10 | Stability assessment of Rosario LoM slope design | 175 |
| 16.2.11 | Ujina LoM slope design stability assessment | 178 |
| 16.2.12 | Geotechnical sustaining process | 180 |
| 16.2.13 | Geotechnical governance and assurance | 181 |
| 16.3 | Life of Mine Plan | 182 |
| 16.4 | Mine Planning Process | 183 |
| 16.5 | Mining Equipment | 184 |
| 16.6 | Equipment Operating Hours | 185 |
| 16.7 | Haulage Analysis | 187 |
| 16.8 | Equipment Requirements and Replacement | 189 |
| 16.8.1 | Truck Fleet | 190 |
| 16.8.2 | Loading Fleet | 191 |
| 16.8.3 | Drill Requirements | 192 |
| 16.8.4 | Support equipment requirements | 192 |
| 16.9 | Mining Production Schedule | 193 |
| November 2025 | ||
| Page |
| SRK Consulting (UK) Limited | Mineral Resources and Mineral Reserves, Collahuasi Copper Mine – Table of Contents |
| 16.10 | Production Scheduling Results | 194 |
| 16.11 | Mill Feed Scheduling Results | 196 |
| ITEM 17 | RECOVERY METHODS | 201 |
| 17.1 | Concentrator | 201 |
| 17.2 | Expansion / De-bottlenecking Projects | 203 |
| 17.2.1 | 185 ktpd | 203 |
| 17.2.2 | 210 ktpd | 203 |
| 17.2.3 | ACP Growth Phase 370 ktpd | 204 |
| 17.2.4 | Throughput recovery relationship | 204 |
| 17.3 | Production Statistics | 204 |
| 17.3.1 | Historical | 204 |
| 17.3.2 | Forecast | 206 |
| ITEM 18 | PROJECT INFRASTRUCTURE | 211 |
| 18.1 | Introduction | 211 |
| 18.2 | Waste Rock Dumps | 211 |
| 18.2.1 | Location | 211 |
| 18.2.2 | Waste rock geochemistry | 212 |
| 18.2.3 | Ground investigations & slope stability | 212 |
| 18.3 | Tailings Storage & Management | 214 |
| 18.3.1 | Introduction | 214 |
| 18.3.2 | TSF design, construction, and raising strategy | 215 |
| 18.3.3 | Geotechnical characterisation | 217 |
| 18.3.4 | Facility capacity, tailings deposition and expansion | 218 |
| 18.3.5 | Water management | 218 |
| 18.3.6 | Monitoring systems and performance assessment | 219 |
| 18.3.7 | Dam breach assessment and consequence classification | 220 |
| 18.3.8 | Oversight, permitting and regulatory compliance | 221 |
| 18.3.9 | Dam safety review (December 2023 / May 2024) | 223 |
| 18.3.10 | Expansion options assessment | 224 |
| 18.4 | Water Supply | 226 |
| 18.4.1 | Water balance | 226 |
| 18.4.2 | Water demand | 226 |
| 18.4.3 | Groundwater supply | 227 |
| 18.4.4 | C20+ Project | 228 |
| 18.4.5 | Water supply up to 210 ktpd | 228 |
| 18.4.6 | Expansion scenarios beyond 210 ktpd | 229 |
| 18.5 | Surface Water Management | 230 |
| 18.6 | Power Supply | 231 |
| 18.7 | Site Infrastructure | 232 |
| 18.8 | Concentrate Logistics | 233 |
| 18.9 | Construction Projects – Capex / Progress | 236 |
| 18.9.1 | Overview | 236 |
| 18.9.2 | C20+ Project: desalination and pipeline | 236 |
| 18.9.3 | Capacity 185 ktpd (Project No. P333 / PG3A) | 237 |
| 18.9.4 | Capacity 210 ktpd (Project No. PG210) | 237 |
| 18.9.5 | ACP Growth Project | 238 |
| November 2025 | ||
| Page |
| SRK Consulting (UK) Limited | Mineral Resources and Mineral Reserves, Collahuasi Copper Mine – Table of Contents |
| ITEM 19 | MARKET STUDIES AND CONTRACTS | 239 |
| 19.1 | Introduction | 239 |
| 19.2 | Historical Performance | 241 |
| 19.3 | Commodity Pricing | 244 |
| 19.4 | Concentrate Markets | 247 |
| 19.4.1 | Copper Concentrate | 247 |
| 19.4.2 | Molybdenum Concentrate | 253 |
| 19.5 | Off-take Agreements | 255 |
| 19.5.1 | Copper Concentrate Agreement | 255 |
| 19.5.2 | Molybdenum Concentrate | 256 |
| 19.6 | LoMp Summary | 256 |
| ITEM 20 | ENVIRONMENTAL STUDIES, PERMITTING AND SOCIAL OR COMMUNITY IMPACT | 261 |
| 20.1 | Introduction | 261 |
| 20.2 | Environmental and Social Management | 261 |
| 20.2.1 | Status of assessments and studies | 261 |
| 20.2.2 | Management and monitoring | 262 |
| 20.2.3 | Stakeholder engagement | 263 |
| 20.3 | ESG Factors | 263 |
| 20.3.1 | Permitting and compliance | 264 |
| 20.3.2 | Mine waste management | 265 |
| 20.3.3 | Potential water impacts | 266 |
| 20.3.4 | Community relations | 267 |
| 20.3.5 | Decarbonisation | 267 |
| 20.3.6 | Closure planning and provisions | 269 |
| ITEM 21 | CAPITAL AND OPERATING COSTS | 273 |
| 21.1 | Introduction | 273 |
| 21.2 | Capital Costs | 277 |
| 21.2.1 | Project capital | 277 |
| 21.2.2 | Sustaining capital | 277 |
| 21.3 | Operating Costs | 278 |
| 21.3.1 | Direct operating costs | 278 |
| 21.3.2 | Realisation costs | 279 |
| 21.3.3 | C1 Cash cost and all in sustaining cost | 281 |
| 21.4 | Reserves Reporting Assessment | 281 |
| ITEM 22 | ECONOMIC ANALYSIS | 282 |
| ITEM 23 | ADJACENT PROPERTIES | 282 |
| ITEM 24 | OTHER RELEVANT DATA AND INFORMATION | 282 |
| ITEM 25 | INTERPRETATION AND CONCLUSIONS | 282 |
| ITEM 26 | RECOMMENDATIONS | 291 |
| ITEM 27 | REFERENCES | i |
| November 2025 | ||
| Page |
| SRK Consulting (UK) Limited | Mineral Resources and Mineral Reserves, Collahuasi Copper Mine – Table of Contents |
List of Tables
| Table 1-1: | Historical production and costs 2019-2024, 2025 (actuals to September) | 4 |
| Table 1-2: | CMDIC Exclusive Mineral Resources for the Rosario, Rosario West and Ujina deposits, and associated stockpiles as at 31 December 2024 | 9 |
| Table 1-3: | CMDIC Mineral Reserves for the Rosario, Rosario West and Ujina deposits, and associated stockpiles as at 31 December 2024 | 13 |
| Table 1-4: | Life of Mine and 2025-2029 production, operating and capital costs (5-year increments) on a 100% attributable basis | 19 |
| Table 2-1: | Qualified Persons | 32 |
| Table 4-1: | Summary of CMDIC mining concessions | 38 |
| Table 4-2: | Concession name and surface area | 39 |
| Table 4-3: | Surface Rights for CMDIC infrastructure and mine lots | 40 |
| Table 4-4: | CMDIC Water Rights | 41 |
| Table 6-1: | CMDIC Mineral Resources 2024, Anglo American Plc (Source: Ore Reserves and Mineral Resources 2024 Report) | 56 |
| Table 6-2: | CMDIC Mineral Reserves 2024, Anglo American Plc (Source: Ore Reserves and Mineral Resources 2024 Report) | 57 |
| Table 6-3: | Historical production and costs 2019-2024, 2025 (actuals to September) | 59 |
| Table 10-1: | Drilling summary for data supporting CMDIC resource models | 76 |
| Table 11-1: | Mechanical preparation procedure | 80 |
| Table 12-1: | Production Reconciliation | 91 |
| Table 13-1: | CMDIC metallurgical domains | 93 |
| Table 14-1: | Final Estimation Domain Matrix for Cu | 111 |
| Table 14-2: | Final Estimation Domain Matrix for Mo | 112 |
| Table 14-3: | Rosario West CuT(%) and MoT(%) Capping and High-Yield threshold values | 115 |
| Table 14-4: | CuT(%) and MoT(%) Capping and High-Yield Threshold values for Ujina. | 116 |
| Table 14-5: | Rosario Cu Estimation Domains raw 6 m CuT Composite Statistics | 117 |
| Table 14-6: | Rosario West Cu Estimation Domains Raw and Capped 2 m CuT Composite Statistics | 118 |
| Table 14-7: | Ujina Cu Estimation Domains Raw and Capped 2 m CuT Composite Statistics | 118 |
| Table 14-8: | Rosario Mo Estimation Domain Raw 6 m MoT Composite Statistics and Rosario West and Ujina in Mo Estimation Domains Raw 2 m MoT Composite Statistics | 119 |
| Table 14-9: | Rosario, Rosario West and Ujina in Density Estimation Domains Density Statistics | 120 |
| Table 14-10: | Rosario and Rosario West Sub-Block Models Block Extents and Dimensions | 122 |
| Table 14-11: | Rosario and Rosario West Regularized Model Block Extents and Dimensions | 122 |
| Table 14-12: | Ujina Block Model Block Extents and Dimensions | 122 |
| Table 14-13: | Global Mean and CoV for Cu Estimates versus Composites | 128 |
| Table 14-14: | CMDIC Exclusive Mineral Resources for the Rosario, Rosario West and Ujina deposits, and associated stockpiles as at 31 December 2024 | 133 |
| Table 15-1: | Rosario Economic Parameters | 143 |
| November 2025 | ||
| Page |
| SRK Consulting (UK) Limited | Mineral Resources and Mineral Reserves, Collahuasi Copper Mine – Table of Contents |
| Table 15-2: | Ujina Economic Parameters | 144 |
| Table 15-3: | Summary of Final Pit Results for Rosario and Ujina | 145 |
| Table 15-4: | Mine Design Parameters | 149 |
| Table 15-5: | Rosario Phase Inventories | 152 |
| Table 15-6: | Ujina Phase Inventories | 153 |
| Table 15-7: | Rosario and Ujina WRD Capacities | 154 |
| Table 15-8: | CMDIC Mineral Reserves for Rosario and Ujina deposit as at 31 December 2024 | 155 |
| Table 16-1: | Summary of drill hole meters by geotechnical unit (CMDIC, 2024) | 164 |
| Table 16-2: | Rosario main geotechnical units descriptions (WSP Golder, 2024) | 165 |
| Table 16-3: | Rosario Alteration Codes, Mineral Zones and Lithology nomenclature (WSP Golder, 2024) | 165 |
| Table 16-4: | Rosario GU GSI statistics (WSP Golder, 2024) | 169 |
| Table 16-5: | Rosario GU geomechanical properties (Karzulovic & Associates, 2020) | 169 |
| Table 16-6: | Rosario LoM 2024 stability analysis mitigation proposal measures (WSP Golder, 2024) | 176 |
| Table 16-7: | Ujina geotechnical cross section summary (WSP Golder, 2024) | 179 |
| Table 16-8: | Summary of LoMP Totals for Rosario and Ujina | 184 |
| Table 16-9: | Effective Time Applied | 187 |
| Table 16-10: | Summary of Main Haulage Inputs | 188 |
| Table 16-11: | Assumed Useful Life per Equipment | 190 |
| Table 16-12: | LoM Support Equipment Requirements | 193 |
| Table 16-13: | LoM Mining Schedule | 199 |
| Table 16-14: | LoM Processing Schedule | 200 |
| Table 17-1: | Historical Processing Statistics | 205 |
| Table 18-1: | Predicted make-up water demand (L/s) according to GoldSim water balance, excluding recirculation from TSF and capture wells (Source: Asesorías en Recursos Hídricos, 2025) | 226 |
| Table 18-2: | Licensed abstractions from key water supply sources in L/s (CMDIC Lombook, 2024) | 228 |
| Table 18-3: | Predicted water demand and supply capacity aligned to the 210ktpd production scenario (adapted from CMDIC Lombook, 2024) | 228 |
| Table 18-4: | Summary of main water supply sources for key mine plan scenarios | 230 |
| Table 18-5: | Estimated increase in power demand (Port and Mine) | 231 |
| Table 18-6: | Project No. P333 / PG3A Project Progress to the end of August 2025 (August Monthly Exhibit, 2025) | 237 |
| Table 18-7: | Project No. PG210 Balance Project Progress to the end of August 2025 (August Monthly Exhibit, 2025) | 238 |
| Table 19-1: | Historical Concentrate Sales (Physicals): 2020 through 2025 Q3 YTD | 241 |
| Table 19-2: | Historical Concentrate Sales (Sales Revenue and Concentrate Charges): 2020 through 2025 Q3 YTD | 243 |
| Table 19-3: | Copper Concentrate Benchmark Quality Assessment | 250 |
| Table 19-4: | Typical copper concentrate physical recovery calculations for a (28%Cu concentrate grade) | 252 |
| Table 19-5: | LoMp Concentrate Sales: 2025 through 2059 | 258 |
| Table 19-6: | LoMp Concentrate Sales: 2060 through 2094 | 259 |
| November 2025 | ||
| Page |
| SRK Consulting (UK) Limited | Mineral Resources and Mineral Reserves, Collahuasi Copper Mine – Table of Contents |
| Table 21-1: | Life of Mine production, operating and capital costs (5-year increments) | 274 |
| Table 21-2: | TC/RC, Freight | 279 |
List of Figures
| Figure 4-1: | CMDIC location map (SRK, 2025) | 36 |
| Figure 4-2: | CMDIC mining concessions (SRK, 2025) | 40 |
| Figure 4-3: | CMDIC mining operation layout (SRK, 2025) | 42 |
| Figure 4-4: | Currently permitted footprint (purple) and unpermitted expanded footprint for future ACP Growth Project (SRK, 2025) | 46 |
| Figure 5-1: | Communities and land use around mine site (Arcadis, 2018) | 48 |
| Figure 5-2: | Local hydrological features (SRK, 2025) | 52 |
| Figure 5-3: | Protected areas (pipeline and port) (Arcadis, 2018) | 54 |
| Figure 6-1: | Historical monthly mining production (2019-September 2025) | 61 |
| Figure 6-2: | Historical monthly ore mined v plant feed (2019-September 2025) | 61 |
| Figure 6-3: | Historical monthly plant feed, direct v stockpile (2019-September 2025) | 61 |
| Figure 6-4: | Historical monthly plant feed grade v copper recovery (2019-September 2025) | 61 |
| Figure 6-5: | Historical monthly copper concentrate production (2019-September 2025) | 61 |
| Figure 6-6: | Historical monthly direct operating costs (2019 – September 2025 | 61 |
| Figure 7-1: | Regional schematic showing Eocene-Oligocene porphyry copper belt (Xstrata, 2012) | 62 |
| Figure 7-2: | Regional schematic W-E geological section of CMDIC district showing distribution major mineralised systems (Xstrata, 2012) | 63 |
| Figure 7-3: | Collahuasi area district schematic geology (Xstrata, 2012) | 64 |
| Figure 7-4: | Typical mineralisation cross section of Rosario at 20NE, looking to NW (Xstrata, 2012) | 66 |
| Figure 7-5: | Typical mineralisation cross section of Ujina at 128NE, looking to NE (Xstrata, 2012) | 67 |
| Figure 7-6: | Typical alteration cross section of Rosario at 20NE, looking to NW (Xstrata,2012, after CMDIC internal presentation) | 68 |
| Figure 7-7: | Typical alteration cross section of Ujina at 128NE, looking to NE (Xstrata, 2012) | 68 |
| Figure 10-1: | Rosario and Rosario West Drillhole Collars used for 2024 MRE (SRK, 2025) | 72 |
| Figure 10-2: | Ujina Drillhole Collars used for 2012 MRE and more recent collars (SRK, 2025) | 73 |
| Figure 11-1: | Pozo Almonte Core Logging Facility (October 2025) | 79 |
| Figure 12-1: | Core Storage Racks (October 2025) | 85 |
| Figure 12-2: | Drillcore for inspection at mine site (October 2025) | 86 |
| Figure 12-3: | Drill rig on DDH 1155 (October 2025) | 87 |
| Figure 12-4: | Ujina new drilling (thick trace lines) vs old (thin trace lines) (SRK, 2025) | 89 |
| Figure 13-1: | Geomet domain illustration (SRK, 2025) | 94 |
| Figure 13-2: | Geomet model database growth: rougher tests (CMDIC, 2025) | 95 |
| Figure 13-3: | Geomet model database growth: sample locations (CMDIC, 2025) | 96 |
| Figure 13-4: | Comparison between model and plant: 2020-24 Cu recovery (CMDIC, 2024) | 98 |
| November 2025 | ||
| Page |
| SRK Consulting (UK) Limited | Mineral Resources and Mineral Reserves, Collahuasi Copper Mine – Table of Contents |
| Figure 13-5: | Comparison between model and plant: 2020-24 Cu concentrate grade (CMDIC, 2024) | 98 |
| Figure 13-6: | Comparison between model and plant: 2020-24 Mo selective recovery (CMDIC, 2024) | 98 |
| Figure 13-7: | UGM 23 Cu Soluble versus Recovery for Measured and Indicated material with Mineral Reserve pit (SRK, 2025) | 99 |
| Figure 13-8: | CuSol/CuT distribution (SRK, 2025) | 100 |
| Figure 13-9: | Cross Section illustrating Muscovite+Illite distribution within the Rosario and Rosario West domains (SRK, 2025) | 101 |
| Figure 14-1: | Rosario Deposit plan view of available CuT (%) drilling data (SRK, 2025) | 103 |
| Figure 14-2: | Rosario West Deposit plan view of available CuT (%) drilling data (SRK, 2025) | 103 |
| Figure 14-3: | Ujina Deposit plan view of available CuT (%) drilling data (SRK, 2025) | 104 |
| Figure 14-4: | Rosario and Rosario West Structural Model plan view at 4320 m elevation; overlaid blast hole samples coloured by CuT% grade (SRK, 2025) | 105 |
| Figure 14-5: | Rosario and Rosario West Lithological Model cross-section looking NW; Section A-A’ location inset left (SRK, 2025) | 105 |
| Figure 14-6: | Ujina Lithological Model cross-section looking NW; Section B-B’ location inset left (SRK, 2025) | 106 |
| Figure 14-7: | Rosario and Rosario West Alteration Model cross-section looking NW; Section A-A’ location inset left (SRK, 2025) | 106 |
| Figure 14-8: | Ujina Alteration Model cross-section looking NW; Section B-B’ location inset left (SRK, 2025) | 107 |
| Figure 14-9: | Rosario and Rosario West Cu Mineralogy Model cross-section looking NW; Section A-A’ location inset left (SRK, 2025) | 108 |
| Figure 14-10: | Ujina Cu Mineralogy Model cross-section looking NW; Section A-A’ location inset left (SRK, 2025) | 108 |
| Figure 14-11: | Rosario and Rosario West Cu Grade Shell Model cross-section looking NW; Section A-A’ location inset left | 109 |
| Figure 14-12: | Rosario Bornite Grade Shell Model cross-section looking NW; Section A-A’ location inset left (SRK, 2025) | 109 |
| Figure 14-13: | Rosario Chalcopyrite Grade Shell Model cross-section looking NW; Section A-A’ location inset left (SRK, 2025) | 109 |
| Figure 14-14: | Rosario Mo Grade Shell Model cross-section looking NW; Section A-A’ location inset left (SRK, 2025) | 110 |
| Figure 14-15: | Rosario and Rosario West As Grade Shell Model cross-section looking NW; Section A-A’ location inset left (SRK, 2025) | 110 |
| Figure 14-16: | Rosario and Rosario West (left) and Ujina (right) histogram of sample length (SRK, 2025) | 113 |
| Figure 14-17: | Cumulative log-probability plots of CuT in raw samples (black) and 6 m Composites (red) for Secondary Zone samples (left) and Primary Zone samples (right) (SRK, 2025) | 113 |
| Figure 14-18: | Rosario histograms of background CuT (grey) composites and vein CuT (red) in UGCUT domain 50 (Primary) and 30 (Secondary) (SRK, 2025) | 114 |
| Figure 14-19: | Rosario model Indicator (IVT) values cross-section looking NW (SRK, 2025) | 114 |
| Figure 14-20: | Rosario West log-histogram and Cumulative probability plots of CuT for UGCUT 13; | 115 |
| November 2025 | ||
| Page |
| SRK Consulting (UK) Limited | Mineral Resources and Mineral Reserves, Collahuasi Copper Mine – Table of Contents |
| Figure 14-21: | Rosario Cu Estimation domain 3 histogram and cumulative log-probability plot of CuT | 117 |
| Figure 14-22: | Rosario Cu Estimation domain 5 histogram and cumulative log-probability plot of CuT | 117 |
| Figure 14-23: | Rosario Mo Estimation domain 3 histogram and cumulative log-probability plot of MoT | 119 |
| Figure 14-24: | Rosario Mo Estimation domain 4 histogram and cumulative log-probability plot of MoT | 119 |
| Figure 14-25: | Rosario and Rosario West Block Model cross-section looking NW coloured by estimation domain with search ellipse orientations shown in pink (Rosario) and blue (Rosario West); Section A-A’ location inset left (SRK, 2025) | 123 |
| Figure 14-26: | Rosario Block Model cross-section looking NW, composites coloured by CuT; Section A-A’ location inset left (SRK, 2025) | 124 |
| Figure 14-27: | Rosario West Block Mode cross-section looking NW l, composites coloured by CuT; Section A-A’ location inset right (SRK, 2025) | 125 |
| Figure 14-28: | Ujina Block Model cross-section looking NW, composites coloured by CuT; Section A-A’ location inset left (SRK, 2025) | 125 |
| Figure 14-29: | Rosario Domain 3 Swath Plots at 45 and 135 strike and by elevation; log-histogram of Cu composites (orange), sub-block estimates (black), regularized blocks (grey) | 126 |
| Figure 14-30: | Rosario West Domain 14Swath Plots at 45 and 135 strike, and by elevation; log-histogram of Cu composites (orange), sub-block estimates (black), regularized blocks (grey) | 126 |
| Figure 14-31: | Ujina Domain 80 (Primary) Swath Plots at 45 and 135 strike, and by elevation; log-histogram of Cu composites (orange), block estimates (black) | 127 |
| Figure 14-32: | Rosario and Rosario West Block model cross-section looking NW coloured by classification; Section A-A’ location inset left (SRK, 2025) | 130 |
| Figure 14-33: | Ujina Block model cross-section looking NW coloured by classification; Section A-A’ location inset left (SRK, 2025) | 130 |
| Figure 14-34: | Rosario and Rosario West Block Model cross-section looking NW coloured by Mineral Resource category with LoMP Design shell and Exclusive Resource Reporting Shell; Section A-A’ location inset left (SRK, 2025) | 131 |
| Figure 14-35: | Ujina Block Model cross-section looking NW coloured by Mineral Resource category with LOMP Design shell and Exclusive Resource Reporting Shell; Section A-A’ location inset left (SRK, 2025) | 132 |
| Figure 14-36: | Plan View of the Rosario Mineralized Stockpiles (Green) with stockpile drill sampling locations in black. (SRK, 2025) | 132 |
| Figure 14-37: | Rosario and Rosario West Grade Tonnage Curve for Measured & Indicated category material | 136 |
| Figure 14-38: | Rosario and Rosario West Grade Tonnage Curve for Inferred category material | 137 |
| Figure 14-39: | Ujina Grade Tonnage Curve for Measured & Indicated category material | 137 |
| Figure 14-40: | Ujina Grade Tonnage Curve for Inferred category material | 137 |
| Figure 15-1: | Rosario global pit slope angle for Whittle optimisation (Collahuasi CPR, 2023) | 140 |
| Figure 15-2: | Ujina global pit slope angle for Whittle optimisation (Collahuasi CPR, 2023) | 141 |
| Figure 15-3: | Rosario pit-by-pit graph (Measured and Indicated) | 146 |
| Figure 15-4: | Rosario Horizontal Section View (SRK, 2025) | 146 |
| November 2025 | ||
| Page |
| SRK Consulting (UK) Limited | Mineral Resources and Mineral Reserves, Collahuasi Copper Mine – Table of Contents |
| Figure 15-5: | Ujina pit-by-pit graph (Measured and Indicated) | 147 |
| Figure 15-6: | Ujina Horizontal Section View (SRK, 2025) | 147 |
| Figure 15-7: | Rosario Section A-A (SRK, 2025) | 148 |
| Figure 15-8: | Ujina Section A-A (SRK, 2025) | 148 |
| Figure 15-9: | Rosario and Ujina Pushback Phases and Mining Sequence (CMDIC, 2024) | 149 |
| Figure 15-10: | Rosario Final Pit Layout (CMDIC, 2024) | 151 |
| Figure 15-11: | Ujina Final Pit Layout (CMDIC, 2024) | 153 |
| Figure 15-12: | General WRD and LG SP Layout (SRK, 2025) | 154 |
| Figure 16-1: | Rosario Dewatering wells and July 2025 status (CDMIC, 2025) | 159 |
| Figure 16-2: | Rosario pit: Example depressurisation section; target in dotted blue line, actual in solid blue line, and zone where full depressurisation is required in maroon (CDMIC, 2025) | 161 |
| Figure 16-3: | Modelled total dewatering volume (red, y1 axis) and dewatering wells (blue, y2 axis) for the LoM “Case 3” allowing for horizontal drain holes in fault zones (Itasca, 2024) | 162 |
| Figure 16-4: | Example of block model displaying Geological Strength Index (GSI) (SRK, 2025) | 164 |
| Figure 16-5: | Rosario Pit : Model showing extent of geotechnical units projected onto 2025 design (left): CMDIC Instrumentation and Geotechnical Monitoring Report Background of Instabilities in Rosario Pit (2021- 2025), August 2025; cross sections (right) (CMDIC internal presentation) | 165 |
| Figure 16-6: | Rosario principal fault structures (Golder Associates, 2014) | 166 |
| Figure 16-7: | Rosario GU cumulative frequency histogram and uniaxial compression diagram (WSP Golder, 2024) | 168 |
| Figure 16-8: | Rosario: kinematic design zones superimposed on 2026 and 2029 pit geometries of current 5-year plan (WSP Golder, 2025) | 170 |
| Figure 16-9: | Rosario Pit: Location of historic instabilities and projected areas of weakness via low GSI, argillic alteration (CMDIC, 2025) | 171 |
| Figure 16-10: | Rosario Pit: Location of key slope monitoring equipment and infrastructure (CMDIC, 2025) | 172 |
| Figure 16-11: | Rosario Pit: Example showing location of topographic prisms and surface displacement trends (cm/day) (CMDIC, 2025) | 172 |
| Figure 16-12: | Rosario stability risk classification and matrix (CMDIC, 2025) | 173 |
| Figure 16-13: | Rosario 2025 mining plan geotechnical risk analysis (CMDIC, 2025) | 174 |
| Figure 16-14: | Rosario Pit: Main areas of risks associated with development of Phases 14 to 17 (WSP Golder, 2025) | 175 |
| Figure 16-15: | Rosario slopes LoM 2024 stability analysis: plan view (left) and deterministic analysis results for static scenario (right), red dotted line approximate position of recommended mitigation proposals for long-term operation (WSP Golder, 2024) | 176 |
| Figure 16-16: | Rosario LoM 2024 stability analysis: evaluated mitigation proposals for geotechnical design Sections 1 (NE wall), 3 (south wall) and 6 (north wall) (WSP Golder, 2024) | 177 |
| Figure 16-17: | Ujina LoM 2024 stability analysis: plan view (left) and deterministic analysis results for the static scenario (right) (WSP Golder, 2024) | 180 |
| Figure 16-18: | Rosario geotechnical sustaining process (CMDIC, 2025) | 181 |
| Figure 16-19: | CMDIC Operating Time Model (CMDIC internal file) | 185 |
| November 2025 | ||
| Page |
| SRK Consulting (UK) Limited | Mineral Resources and Mineral Reserves, Collahuasi Copper Mine – Table of Contents |
| Figure 16-20: | Weighted Average Haulage Distance and Cycle Time | 189 |
| Figure 16-21: | Total Material Moved and Required Fleet Hours | 189 |
| Figure 16-22: | LoM Truck Fleet Requirements | 190 |
| Figure 16-23: | LoM Rope Shovel Requirements | 191 |
| Figure 16-24: | LoM FEL Requirements | 191 |
| Figure 16-25: | LoM Production Drill Requirements | 192 |
| Figure 16-26: | LoM Buffer Drill Requirements | 192 |
| Figure 16-27: | Rosario and Ujina LoM Total Material Movement | 194 |
| Figure 16-28: | Total LoM Material Movement Split by Mine | 195 |
| Figure 16-29: | Rosario LoM Material Movement | 195 |
| Figure 16-30: | Ujina LoM Material Movement | 195 |
| Figure 16-31: | LoM Process Feed and Grade | 196 |
| Figure 16-32: | LoM Process Feed per Ore Classification | 197 |
| Figure 16-33: | LoM Ore Feed contribution per UGM Zone | 197 |
| Figure 16-34: | LoM Ore Mined and Grade vs Process Feed | 197 |
| Figure 16-35: | LoM Stockpile Balance | 198 |
| Figure 17-1: | Simplified Flowsheet Block Diagram (CMDIC,2020) | 201 |
| Figure 17-2: | LoM Forecast Production Plant Feed and Feed Cu Grade | 206 |
| Figure 17-3: | LoM Forecast Production: Plant Feed Cu Grade and Cu Recovery | 207 |
| Figure 17-4: | LoM Forecast Production: Copper Concentrate Production | 207 |
| Figure 17-5: | LoM Forecast Production: Molybdenum Concentrate Production | 208 |
| Figure 17-6: | LoM Forecast Production: Mill feed, direct v stockpile | 209 |
| Figure 17-7: | LoM Forecast Production: Total Mill feed by deposit | 209 |
| Figure 17-8: | LoM Forecast Production: Total Mill feed tonnage by domain | 210 |
| Figure 17-9: | LoM Forecast Production: Total Mill feed grade by domain | 210 |
| Figure 18-1: | Reserves case LoM plan tailings production (5-year increments) | 215 |
| Figure 18-2: | Pampa Pabellón Tailings Storage Facility project to 2041 (WSP, 2022) | 216 |
| Figure 18-3: | Pampa Pabellón Tailings Storage Facility (2041 permitted design); construction methodology and cross section of main embankment (WSP, 2023) | 217 |
| Figure 18-4: | Pampa Pabellón Tailings Storage Facility (2041 permitted design); construction methodology and cross section of NW auxiliary embankment (WSP, 2023) | 217 |
| Figure 18-5: | Footprint of hypothetical tailings runout in central section of TSF main wall; numerical model under normal condition (1) and extreme hydrological condition (2) (Wood, 2020) | 221 |
| Figure 18-6: | Expanded footprint of TSF for 5.7 Bt storage capacity including environmentally sensitive areas around and within footprint boundary (WSP, 2024) | 222 |
| Figure 18-7: | Expanded footprint of TSF for 5.7 Bt storage capacity (black outline) (WSP, 2024) | 225 |
| Figure 18-8: | Schematic section showing TSF expansion by conventional downstream raising (blue) or by modified downstream raising (red) (WSP, 2024) | 226 |
| Figure 18-9: | Copper concentrate export (dmt) | 233 |
| Figure 18-10: | Port schematic flow sheet (CDMIC, 2025) | 235 |
| Figure 18-11: | View of berth and shiploader (2025) | 236 |
| Figure 19-1: | Historical Copper Price nominal and real (1 October) statistics for historical data through 15 October 2025 and forecast (consensus) to 2024 | 245 |
| November 2025 | ||
| Page |
| SRK Consulting (UK) Limited | Mineral Resources and Mineral Reserves, Collahuasi Copper Mine – Table of Contents |
| Figure 19-2: | Historical Molybdenum Price nominal and real (1 October) statistics for historical data through 15 October 2025 and forecast (consensus) to 2024 | 245 |
| Figure 19-3: | Historical Silver Price nominal and real (1 October) statistics for historical data through 15 October 2025 and forecast (consensus) to 2024 | 246 |
| Figure 19-4: | Historical Gold Price nominal and real (1 October) statistics for historical data through 15 October 2025 and forecast (consensus) to 2024 | 246 |
| Figure 19-5: | Historical Copper Concentrate terms: 1982 through October 2025 | 252 |
| Figure 19-6: | Historical Copper Concentrate terms (copper price relative): 1982 through October 2025 | 253 |
| Figure 19-7: | Historical Molybdenum pricing (2022 through 2025): SMM | 255 |
| Figure 21-1: | Sustaining capital costs | 278 |
| Figure 21-2: | Direct operating costs | 279 |
| Figure 21-3: | Arsenic penalty in copper concentrate | 280 |
| Figure 21-4: | Copper concentrate realisation costs | 280 |
| Figure 21-5: | C1 Cash Cost and All in Sustaining Cost | 281 |
| November 2025 | ||
| Page |
 |
SRK Consulting (UK) Limited |
| 5th Floor Churchill House | |
| 17 Churchill Way | |
| Cardiff CF10 2HH | |
| Wales, United Kingdom | |
| E-mail: enquiries@srk.co.uk | |
| URL: www.srk.com | |
| Tel: + 44 (0) 2920 348 150 |
NI 43-101 TECHNICAL REPORT, COLLAHUASI COPPER MINE, TARAPACÁ REGION, CHILE
| ITEM 1 | SUMMARY |
| 1.1 | Introduction |
SRK Consulting (UK) Limited (SRK) is an associate company of the international group holding company, SRK Consulting (Global) Limited (the SRK Group). SRK has been requested by Anglo American plc (Anglo American, or the Company or the Client) to prepare a Technical Report on the Mineral Assets comprising the Doña Inés de Collahuasi copper mine (Collahuasi), located in the Tarapacá Region of northern Chile, in accordance with the CIM Definitions Standards (2014).
Compañía Minera Doña Inés de Collahuasi (CMDIC) is owned by subsidiaries of Anglo American plc (44%), subsidiaries of Glencore plc (44%) and a consortium of Japanese companies led by Mitsui & Co Ltd (12%).
CMDIC’s mining operations correspond to a cluster of open pit mines located in the Tarapacá Region Region of Chile, about 225 km by road SE of the city of Iquique at elevations between 4,200 and 4,800 masl. The main pit in operation is the Rosario pit. The original pit where the operations started, Ujina, is not currently in production but is part of the Life of Mine (LoM) plan (LoMP).
The Mineral Resources and Mineral Reserves estimates dated 31 December 2024 were prepared by CMDIC personnel and were reviewed by a multidisciplinary team of qualified persons from SRK. The estimates were reviewed in detail including parameters, assumptions, supporting factual data, procedures and electronic files. SRK carried out a site visit to the operation in October 2025 and has reviewed reconciliation results between production data and the estimates.
This report and the Mineral Resources and Mineral Reserves estimates have been prepared in compliance with the disclosure and reporting requirements set forth in the current Canadian Securities Administrator’s National Instrument 43-101, Companion Policy 43-101CP, and Form 43-101F1.
The Effective Date of the Mineral Resources and Mineral Reserves reported herein is 31 December 2024 (Effective Date). This Technical Report discloses the results of the Mineral Resource and Mineral Reserve updates carried out by CMDIC as part of their annual planning cycle, audited by SRK.
 |
Registered Address: 21 Gold Tops, City and County of Newport, NP20 4PG, Wales, United Kingdom. SRK Consulting (UK) Limited Reg No 01575403 (England and Wales) |
Group Offices: Africa Asia Australia Europe North America South America |
| SRK Consulting (UK) Limited | Mineral Resources and Mineral Reserves, Collahuasi Copper Mine - Main Report |
| 1.2 | Property Description |
Collahuasi is located in the Tarapacá Region of Chile, in the Andean cordillera, approximately 5 to 10 km from the border with Bolivia, 185 km SE of Iquique at elevations between 4,200 and 4,800 masl. The mine, associated infrastructure, and port facilities are all accessed via tarmacked highway.
The Collahuasi mining property consists of 841 groups of current exploitation concessions, covering 230,152 hectares, and 98 exploration concessions covering 43,500 hectares. In addition, there are 38 SCM Michincha exploitation concessions (50% Collahuasi and 50% Quebrada Blanca) covering 22,820 hectares. The exploitation and exploration concessions are located in the municipalities of Iquique, Pica, Pozo Almonte, and Calama.
The reported Mineral Resources and Mineral Reserves are located within CMDIC mining concessions. The mining concessions have no expiry and remain valid through annual payments. Surface rights for the operating infrastructure are predominantly held through land ownership and easements for linear infrastructure. CMDIC owns water rights to use underground water in the Coposa Salar basin and Minchincha Salar basin.
Collahuasi is subject to a mining royalty which consists of: 1) a 1% ad valorem component on copper revenue; and 2) a profit based component ranging from 8% to 26% on adjusted operating profits (this is capped so the overall effective tax rate for royalties, corporate tax and dividend withholding tax does not exceed 46.5%). A corporate tax rate of 27% on taxable profits is applicable to CMDIC.
The operation has environmental approvals in place and is monitoring compliance with associated commitments. The main environmental approval for the current phase of operation is Resolucion Extenta (Res. Ex.) No. 20219900112 (2021 RCA) that was obtained in December 2021 for a period of 20 years. Activities permitted through this approval include continuation of operations and extension of the Rosario pit and waste rock dumps, increased production capacity from 170 ktpd to 210 ktpd, expansion of the Pampa Pabellón tailing storage facility (TSF) to a total capacity of 2,329 Mt and installation of a desalination plant and water pipeline from the coast. This approval expires in 2041.
Mining from the Ujina pit was not included in the 2021 approval and is permitted through Res. Ex. No. 027/2018 which expires in 2027. An application to mine waste from Ujina for construction of the tailings facility walls is in progress through an Environmental Impact Declaration (DIA) which is due to be submitted in Q1 2026 with approval anticipated in Q1 2027.
CMDIC is preparing an Environmental Impact Assessment (EIA) to permit operations beyond 2041 (including mining at Rosario and Ujina) for submission in 2027. Approval for an extended operational period is anticipated to be in place by 2030.
The latest Mine Closure Plan was submitted in 2021 and the valuation of the plan was approved in March 2023 (Res. Ex. No. 0324). This closure plan is an update of the previous plan, approved in 2015 and includes all existing activities across the mine, pipeline and port as well as the new activities approved in the 2021 RCA. The closure cost was estimated at UF17,272,965 (as of 23 August 2021) which equated to USD656,136,544. The quantum of financial guarantee was calculated in line with legal requirements and CMDIC provides annual contributions via a combination of permitted instruments which are selected at the time that each provision is made.
| November 2025 | ||
| Page |
| SRK Consulting (UK) Limited | Mineral Resources and Mineral Reserves, Collahuasi Copper Mine - Main Report |
| 1.3 | History |
The Collahuasi region was initially explored in 1880, with various periods of activity leading up to the discovery of a series of Cu deposits through various geophysical and reconnaissance activities in the early 1990s. Feasibility and environmental impact studies for the Collahuasi project were approved in 1995, with the operations commencing in 1998. Operations have ramped up through a series of phases of expansion from the initial production rate of 60 ktpd, to the current processing capacity of 170 ktpd (mill feed).
Table 1-1 presents a summary of the annual production and cost statistics for the period 2019-2024 and 2025 to date (9 months to end-September 2025). Contained copper in sold copper concentrate has varied between 549 kt and 631 kt per annum up to 2024 and overall copper recovery to concentrate has varied between 81.1% and 90.6% over this period with lower recoveries seen in 2023 and 2024. Contained copper in sold copper concentrate to end-September 2025 was 303 kt. Recovery to end-September 2025 has been lower, at 73.5%. It is noted that during 2024 and 2025 to date, notably less ore has been mined than fed to the processing plant with the operations drawing from lower grade stockpiles to supplement the plant feed.
Total direct operating costs (mining, including deferred stripping costs, processing and indirects) have varied between USD1,087m and USD1,522m per annum or between USD19.5/t and USD26.5/t milled in total over the period 2019 to 2024 with higher unit costs seen between 2022 and 2024 (USD777m-USD1,404m excluding deferred stripping, or between USD13.9/t and USD24.5/t milled in total). During 2025, actual costs to end-September 2025 including deferred stripping were USD1,194m or USD27.0/t processed (USD993m or USD22.5/t processed excluding deferred stripping). Capital costs (project, sustaining and deferred stripping) have varied between USD720m and USD1,990m per annum between 2019 and 2024 with significant project capital expenditure being incurred in 2023 and 2024. Capital costs to end-September 2025 were USD1,213m. Sustaining capital expenditure (excluding deferred stripping costs) has varied between USD300-500m per annum over the period 2019 to 2024.
C1 Cash Costs are presented in Table 1-1 in USD terms and unit costs per pound payable copper production with direct mining costs adjusted to exclude capitalised deferred stripping costs. Realisation costs include TC/RC, impurity penalties (As in concentrate), metallurgical deductions and freight. By-product credits include revenue from sale of molybdenum concentrate (credits for gold and silver payable in concentrate are excluded). C1 All in Sustaining Costs are also included in Table 1-1 include stock movements, other costs (including closure costs), deferred stripping and sustaining capital costs and are presented before and after the impact of royalties.
Between 2019 and 2024 actual C1 Cash Costs (after by-product credits) have varied between USD0.70 and USD1.45/lb payable copper but have increased to USD1.83/lb during 2025 (9 months to September) due to lower copper production. C1 All in Sustaining Costs have varied between USD1.21/lb and USD1.86/lb between 2019 and 2024 before royalties (USD1.31/lb to USD2.18/lb including royalties) but have increased to USD2.71/lb during 2025 to date (USD2.89/lb including royalties).
| November 2025 | ||
| Page |
| SRK Consulting (UK) Limited | Mineral Resources and Mineral Reserves, Collahuasi Copper Mine - Main Report |
Table 1-1: Historical production and costs 2019-2024, 2025 (actuals to September)
| Description | Units | 2019 | 2020 | 2021 | 2022 | 2023 | 2024 |
2025 Actual |
| Mining | ||||||||
| Ore mined | kt | 86,644 | 71,898 | 101,611 | 81,789 | 58,865 | 48,412 | 30,916 |
| Copper grade | %CuT | 0.96% | 1.10% | 0.91% | 1.00% | 1.17% | 1.28% | 1.12% |
| Contained copper | Cu kt | 836 | 787 | 925 | 821 | 689 | 618 | 347 |
| Waste mined | kt | 149,925 | 157,530 | 139,301 | 172,563 | 207,314 | 213,247 | 148,694 |
| Total material mined | kt | 236,569 | 229,428 | 240,913 | 254,352 | 266,178 | 261,659 | 179,610 |
| Strip ratio | w:o | 1.73 | 2.19 | 1.37 | 2.11 | 3.52 | 4.40 | 4.81 |
| Processing | ||||||||
| Ore processed | kt | 54,133 | 55,832 | 55,681 | 57,316 | 57,352 | 60,048 | 44,209 |
| Copper grade | %CuT | 1.19% | 1.24% | 1.25% | 1.11% | 1.17% | 1.15% | 0.92% |
| Contained copper | Cu kt | 645 | 694 | 696 | 637 | 670 | 692 | 405 |
| Molybdenum grade | ppm | 206 | 313 | 292 | 322 | 256 | 233 | 177 |
| Contained Mo | Mo kt | 11 | 18 | 16 | 18 | 15 | 14 | 8 |
| Copper concentrate (pre-Moly & Filter plant) | kt | 2,119 | 2,357 | 2,362 | 2,135 | 2,296 | 2,394 | 1,346 |
| Copper grade | %CuT | 26.75% | 26.66% | 26.63% | 26.75% | 25.15% | 23.43% | 22.13% |
| Contained copper | Cu kt | 567 | 628 | 629 | 571 | 577 | 561 | 298 |
| Contained copper | Cu klb | 1,249,638 | 1,385,102 | 1,386,417 | 1,258,925 | 1,273,165 | 1,236,293 | 656,495 |
| Overall copper recovery | % | 87.87% | 90.59% | 90.32% | 89.71% | 86.17% | 81.09% | 73.50% |
| Molybdenum concentrate | kt | 10 | 13 | 13 | 16 | 12 | 7 | 4 |
| Molybdenum grade | %Mo | 28.83% | 29.31% | 35.94% | 41.66% | 39.66% | 28.69% | 26.91% |
| Contained molybdenum | Mo kt | 3 | 4 | 5 | 7 | 5 | 2 | 1 |
| Overall molybdenum recovery | % | 26.24% | 21.39% | 28.80% | 36.49% | 31.11% | 14.55% | 12.65% |
| Product Sales | ||||||||
| Copper concentrate | kt | 2,170 | 2,366 | 2,338 | 2,178 | 2,244 | 2,347 | 1,395 |
| Copper grade | %CuT | 26.58% | 26.67% | 26.55% | 26.66% | 25.12% | 23.41% | 21.75% |
| Contained copper | Cu kt | 577 | 631 | 621 | 581 | 564 | 549 | 303 |
| Contained copper | Cu klb | 1,271,609 | 1,391,172 | 1,368,485 | 1,280,210 | 1,243,017 | 1,211,040 | 668,826 |
| Molybdenum concentrate | kt | 10 | 13 | 13 | 16 | 12 | 7 | 3 |
| Molybdenum grade | %Mo | 29.62% | 29.11% | 35.95% | 41.46% | 40.58% | 29.00% | 26.87% |
| November 2025 | ||
| Page |
| SRK Consulting (UK) Limited | Mineral Resources and Mineral Reserves, Collahuasi Copper Mine - Main Report |
| Description | Units | 2019 | 2020 | 2021 | 2022 | 2023 | 2024 |
2025 Actual |
| Contained molybdenum | Mo kt | 3 | 4 | 5 | 7 | 5 | 2 | 1 |
| Direct operating costs | ||||||||
| Mining (incl. deferred stripping) | USDm | 545 | 495 | 543 | 699 | 766 | 731 | 556 |
| Deferred stripping | USDm | -235 | -310 | -383 | -31 | -118 | -134 | -201 |
| Mining (excl. deferred stripping) | USDm | 310 | 185 | 161 | 668 | 647 | 597 | 355 |
| Unit mining cost (per tonne mined) | USD/t | 2.30 | 2.16 | 2.25 | 2.75 | 2.88 | 2.79 | 3.09 |
| Processing & Port | USDm | 436 | 442 | 490 | 522 | 571 | 572 | 501 |
| Unit processing cost (per tonne processed) | USD/t | 8.05 | 7.91 | 8.81 | 9.10 | 9.96 | 9.53 | 11.34 |
| G&A | USDm | 147 | 150 | 177 | 169 | 185 | 177 | 137 |
| Unit G&A cost (per tonne processed) | USD/t | 2.72 | 2.70 | 3.17 | 2.95 | 3.23 | 2.95 | 3.09 |
| Total Direct Operating Cost (excl. deferred stripping) | USDm | 893 | 777 | 827 | 1,358 | 1,404 | 1,346 | 993 |
| Total Unit cost (per tonne processed) | USD/t | 16.50 | 13.92 | 14.86 | 23.70 | 24.48 | 22.42 | 22.45 |
| Capital costs | ||||||||
| Project capital | USDm | 52 | 102 | 216 | 402 | 1,385 | 1,373 | 696 |
| Stay in Business capital (excl deferred stripping) | USDm | 454 | 308 | 340 | 315 | 363 | 483 | 316 |
| Deferred stripping | USDm | 235 | 310 | 383 | 31 | 118 | 134 | 201 |
| Total Capital Costs | USDm | 740 | 720 | 939 | 749 | 1,866 | 1,990 | 1,213 |
| C1 Cash Cost | ||||||||
| Production - payable | Cu klb | 1,204,808 | 1,340,463 | 1,342,472 | 1,216,035 | 1,221,318 | 1,190,268 | 633,130 |
| Direct production cost (excl deferred stripping, incl stockpile inventories) | USDm | 945 | 829 | 873 | 1,139 | 1,430 | 1,416 | 1,115 |
| Realisation costs | USDm | 433 | 373 | 449 | 449 | 477 | 485 | 167 |
| C1 cash cost before credits | USDm | 1,378 | 1,202 | 1,322 | 1,588 | 1,907 | 1,901 | 1,282 |
| By product credits | USDm | (138) | (260) | (368) | (417) | (357) | (296) | (123) |
| C1 cash cost after credits | USDm | 1,239 | 942 | 954 | 1,171 | 1,550 | 1,605 | 1,159 |
| Direct production cost (excl deferred stripping, incl stockpile inventories) | USD/lb Cu | 0.78 | 0.62 | 0.65 | 0.94 | 1.17 | 1.19 | 1.76 |
| Realisation costs | USD/lb Cu | 0.36 | 0.28 | 0.33 | 0.37 | 0.39 | 0.41 | 0.26 |
| C1 cash cost before credits | USD/lb Cu | 1.14 | 0.90 | 0.98 | 1.31 | 1.56 | 1.60 | 2.02 |
| By product credits | USD/lb Cu | (0.11) | (0.19) | (0.27) | (0.34) | (0.29) | (0.25) | (0.19) |
| C1 cash cost after credits | USD/lb Cu | 1.03 | 0.70 | 0.71 | 0.96 | 1.27 | 1.35 | 1.83 |
| C1 All in Sustaining Cost | ||||||||
| All in Sustaining cost (excl royalty) | USDm | 1,904 | 1,621 | 1,724 | 1,606 | 2,069 | 2,211 | 1,716 |
| Royalty | USDm | 75 | 141 | 427 | 173 | 203 | 383 | 116 |
| All in Sustaining cost (incl royalty) | USDm | 1,979 | 1,762 | 2,151 | 1,780 | 2,272 | 2,594 | 1,832 |
| All in Sustaining cost (excl royalty) | USD/lb Cu | 1.58 | 1.21 | 1.28 | 1.32 | 1.69 | 1.86 | 2.71 |
| Royalty | USD/lb Cu | 0.06 | 0.10 | 0.32 | 0.14 | 0.17 | 0.32 | 0.18 |
| All in Sustaining cost (excl royalty) | USD/lb Cu | 1.64 | 1.31 | 1.60 | 1.46 | 1.86 | 2.18 | 2.89 |
| November 2025 | ||
| Page |
| SRK Consulting (UK) Limited | Mineral Resources and Mineral Reserves, Collahuasi Copper Mine - Main Report |
| 1.4 | Geology Setting, Mineralisation and Deposit Type |
Collahuasi forms part of the cluster that includes several porphyry Cu-Mo and Cu vein deposits within a Permo-Triassic uplifted block, which is part of the NS Tertiary porphyry belt, controlled by the north-south trending West Fissure fault system.
The host rocks in the area are continental to shallow marine volcanic and sedimentary rocks of the Permo-Triassic Collahuasi Formation. The mineralisation at Collahuasi is related to various Permian to Oligocene porphyry intrusives, including the Ines porphyry, the Collahuasi porphyry, the Rosario porphyry and the Inca porphyry.
Porphyry copper deposits at Rosario and Ujina and a high sulphidation epithermal deposit at Rosario West consist of primary sulphide mineralisation beneath secondary enriched sulphides and overlying oxides near surface. Whilst some oxide heap leaching occurred historically (ceased production in 2017), with relatively minor amounts of oxide mineralisation remaining, the operations have principally focused on copper sulphide mineralization which is mainly represented by chalcocite, chalcopyrite and bornite and molybdenum mineralisation primarily represented as molybdenite.
| 1.5 | Exploration, Drilling, Sampling, Analysis and Data Verification |
Historical exploration consisted of a combination of remote sensing and geophysical activities which progressed to reconnaissance drilling. Since the start of the operations at Collahuasi, CMDIC has carried out infill drilling campaigns aimed at updating resource classification as well as exploration drilling to expand its resource base.
The drilling database that supports the Mineral Resource estimate reported herein is based on a substantial amount of drilling data, inclusive of:
| · | Rosario and Rosario West: 3,610 drillholes for a total length of 1,093 km; |
| · | Ujina: 882 drillholes for a total length of 219 km. |
Reverse Circulation (RC) and Diamond Drill Hole (DDH) have been drilled for infill and exploration purposes. Grade control drilling is also included to inform the geological interpretation. The drilling tasks are performed by external contractors, following CMDIC internal procedures.
Drill core in secure boxes and RC sample splits are currently delivered to the CMDIC dedicated logging facility in Pozo Almonte, some 150 km NW of the mine and some 40 km east of Iquique; this facility came into use in 2018. Prior to this, when the majority of drilling was conducted on the Rosario, Rosario West and Ujina deposits, logging and sample dispatch were conducted on the mine site under contract by SGS SA (SGS) and Geoanalitica SA (Geoanalitica).
| November 2025 | ||
| Page |
| SRK Consulting (UK) Limited | Mineral Resources and Mineral Reserves, Collahuasi Copper Mine - Main Report |
The logging of data from drill core includes geological, geotechnical and physical attributes, RC samples are also logged for geology. Currently, these data are captured digitally in the core shed using predefined standards and protocols. Drill core is halved before being sampled. RC and DDH samples are both sampled predominately at 2 m intervals, with the DDH samples additionally separated at lithology, mineralisation and/or alteration contacts. Density samples are also taken routinely. A similar sampling and logging strategy has been in place for at least 10 years, digital data capture and use of the acQuireTM (acQuire) database software was initiated in 2007 prior to which conventional paper logging was routine.
Samples dispatched from the Pozo Almonte facility are securely bagged with sample identity bar code markers; since 2017 these have been sent to the Bureau Veritas (BV) Cesmec laboratory in Alto Hospicio, where they are dried, crushed, sieved, and subdivided to prepare pulps for analysis following standard industry practices. Assaying for the main metals of interest is also conducted at BV using assay method AAS0025, comprising a 3-acid digest followed by atomic absorption spectrometry. Assay certificates are issued digitally and these are imported directly into the AcQuire database.
Prior to 2017, samples were sent to other well established laboratories in Chile such as SGS, Geoanalitica and CIMM Tecnologías y Servicios S.A (CIMM).
For all drilling programs developed by CMDIC, the process of sample preparation, assaying, analytical, and quality control procedures have always followed established internal protocols based on industry standard practices at the time they were conducted.
A QAQC programme has been in place for all the drilling, although the documentation and reporting of results is variable; and reportedly not available for work conducted before 2006 (some 20% of Rosario data and some 80% of Ujina data). The approach has included the insertion of:
| · | standard reference material (standards are generated using material from the mine) to monitor accuracy; |
| · | coarse blank material to monitor contamination and sample mix-ups; and |
| · | field, coarse and pulp duplicates to monitor precision. |
SRK considers that sample preparation and assay laboratory performance has been monitored thoroughly using an industry standard approach and that results indicate generally reliable laboratory performance giving good confidence in the data collected since 2007. This gives good QAQC coverage for Rosario but not for Ujina; therefore other verification methods have been used to augment Mineral Resource estimation confidence, inclusive of a limited amount of twin drilling at Ujina and production reconciliation between 2020-2024.
Since 2007, all data are entered in an acQuire database designed to store the geological, collar topography, survey and chemical assay information of the drill-holes, where the data are captured and validated within the software.
CMDIC operate a governance process where the data supporting the estimates themselves have been audited many times as the data, geological models and grade estimates have evolved over 30 years; the most recent being 2022 for Rosario and Rosario West and 2012 for Ujina.
| November 2025 | ||
| Page |
| SRK Consulting (UK) Limited | Mineral Resources and Mineral Reserves, Collahuasi Copper Mine - Main Report |
| 1.6 | Mineral Processing and Metallurgical Testwork |
CMDIC has developed a geometallurgical (geomet) model which is integrated into the mine and processing planning activities. The geomet model incorporates testwork data collected from geomet drilling focused on the next 5 years of operation and plant data incorporated and used to calibrate the model through machine learning approaches.
The geomet model subdivides the deposit into a series of domains which reflect lithology, alteration, primary and secondary mineralisation, and classification according to certain mineral processing parameters derived from the testwork. One of the key aspects of the geomet model is the incorporation of the clay model which attempts to differentiate the clay species in the different sectors of the deposit (particularly for Rosario West) which has an impact on process performance and operating parameters.
The overall processing recovery forecast over the LoM is projected to be 84.7% in the aggregate (86.3% Rosario; 80.8% Rosario West; 82.6% Ujina) and 84.2% over the next five years (2025-2029). Where material has been sourced from the low grade stockpiles, an adjustment has been applied to reflect partial oxidation of the material at surface.
| 1.7 | Mineral Resource and Mineral Reserve Estimates |
Mineral Resources
Geological models have been developed on a combined basis for Rosario and Rosario West, and separately for Ujina.
The distribution of Cu and Mo mineralization at the Rosario, Rosario West, and Ujina deposits is controlled by a combination of lithological, structural, geochemical and hydrothermal processes. In order to suitably characterize the Cu and Mo distribution, the following models have been prepared:
| · | Lithological Model: Including key intrusive phases and host volcanic stratigraphy. |
| · | Structural Model: Including syn-mineralization features, major post-mineralization structures which offset the stratigraphy and intrusives, as well as late structures associated with supergene enrichment. |
| · | Alteration Model: Including key differentiation between alteration assemblages indicative of Cu mineralization (Potassic and Phyllic versus Argillic). |
| · | Cu Mineralogy Model: Including differentiation between primary and secondary Cu sulphide assemblages and Cu Oxide assemblages. |
| · | Cu and Mo Grade Shells: Indicative of (hydrothermal) zonation of Cu and Mo mineralization intensity, particularly within the primary sulphide zone. |
Cu and Mo estimation domains for Rosario, Rosario West, and Ujina deposits have been developed using a combination of the above models to establish geologically and statistically reasonable volumes within which to estimate block grades.
| November 2025 | ||
| Page |
| SRK Consulting (UK) Limited | Mineral Resources and Mineral Reserves, Collahuasi Copper Mine - Main Report |
The block grade estimates include total copper, soluble copper, molybdenum, and arsenic. Grade estimation was carried out using Ordinary Kriging (OK) for the majority of estimation domains. Multiple estimation passes were defined reflecting the ranges established as part of the correlogram modelling. Mineral Resources at the Rosario, Rosario West, and Ujina deposits are classified in the Measured, Indicated, and Inferred categories based on considerations of data density and relative geological complexity.
The grade estimation was validated using standard industry techniques, prior to the models being re-blocked to a regular block size for the purpose of mine planning and Mineral Resource reporting.
Stockpile inventories reflect the closing balances at 31 December 2024 of the sulphide stockpiles. Validation drilling and sampling conducted on a portion of the low-grade stockpiles (“SBL”) has confirmed that the grades assumed for the reported stockpile balances is reasonable.
Table 1-2 summarizes the Mineral Resource figures, reported on an exclusive basis, for the in situ deposits (Rosario, Rosario West, Ujina) and the stockpiles, respectively.
| Table 1-2: | CMDIC Exclusive Mineral Resources for the Rosario, Rosario West and Ujina deposits, and associated stockpiles as at 31 December 2024 |
| Material type |
Category | Tonne (Mt) | Grade CuT (%) |
Grade MoT (ppm) |
Metal CuT (kt) |
Metal Mo (kt) |
| Rosario | ||||||
| In situ Sulphide Cut-off 0.3% Copper Total (CuT) |
Measured | 32 | 0.79 | 295 | 254 | 9 |
| Indicated | 1,100 | 0.79 | 317 | 8,681 | 348 | |
| Total Measured and Indicated | 1,132 | 0.79 | 316 | 8,935 | 357 | |
| Inferred | 2,272 | 0.68 | 257 | 15,430 | 584 | |
| Stockpiles (Sulphide) Cut-off 0.3% CuT |
Measured | |||||
| Indicated | ||||||
| Total Measured and Indicated | ||||||
| Inferred | ||||||
| Total Rosario Main | Measured | 32 | 0.79 | 295 | 254 | 9 |
| Indicated | 1,100 | 0.79 | 317 | 8,681 | 348 | |
| Total Measured and Indicated | 1,132 | 0.79 | 316 | 8,935 | 357 | |
| Inferred | 2,272 | 0.68 | 257 | 15,430 | 584 | |
| Rosario West | ||||||
| In situ Sulphide Cut-off 0.3% CuT |
Measured | 10 | 0.94 | 11 | 92 | 0 |
| Indicated | 102 | 0.90 | 8 | 914 | 1 | |
| Total Measured and Indicated | 112 | 0.90 | 8 | 1,006 | 1 | |
| Inferred | 1,971 | 0.78 | 7 | 15,356 | 15 | |
| November 2025 | ||
| Page |
| SRK Consulting (UK) Limited | Mineral Resources and Mineral Reserves, Collahuasi Copper Mine - Main Report |
| Material type |
Category | Tonne (Mt) | Grade CuT (%) |
Grade MoT (ppm) |
Metal CuT (kt) |
Metal Mo (kt) |
| Stockpiles (Sulphide) Cut-off 0.3% CuT |
Measured | |||||
| Indicated | ||||||
| Total Measured and Indicated | ||||||
| Inferred | ||||||
| Total Rosario West | Measured | 10 | 0.94 | 11 | 92 | 0 |
| Indicated | 102 | 0.90 | 8 | 914 | 1 | |
| Total Measured and Indicated | 112 | 0.90 | 8 | 1,006 | 1 | |
| Inferred | 1,971 | 0.78 | 7 | 15,356 | 15 | |
| Ujina | ||||||
| In situ Sulphide Cut-off 0.3% CuT |
Measured | 5 | 0.52 | 69 | 24 | 0 |
| Indicated | 248 | 0.64 | 162 | 1,590 | 40 | |
| Total Measured and Indicated | 253 | 0.64 | 160 | 1,614 | 40 | |
| Inferred | 748 | 0.67 | 160 | 4,976 | 120 | |
| Stockpiles (Sulphide) Cut-off 0.3% CuT |
Measured | |||||
| Indicated | ||||||
| Total Measured and Indicated | ||||||
| Inferred | ||||||
| Total Ujina | Measured | 5 | 0.52 | 69 | 24 | 0 |
| Indicated | 248 | 0.64 | 162 | 1,590 | 40 | |
| Total Measured and Indicated | 253 | 0.64 | 160 | 1,614 | 40 | |
| Inferred | 748 | 0.67 | 160 | 4,976 | 120 | |
| Total | Measured | 47 | 0.80 | 193 | 370 | 9 |
| Indicated | 1,450 | 0.77 | 268 | 11,185 | 389 | |
| Total Measured and Indicated | 1,497 | 0.77 | 266 | 11,555 | 398 | |
| Inferred | 4,990 | 0.72 | 144 | 35,762 | 719 | |
| November 2025 | ||
| Page |
| SRK Consulting (UK) Limited | Mineral Resources and Mineral Reserves, Collahuasi Copper Mine - Main Report |
Important information regarding the Mineral Resources disclosed in Table 1-2:
| · | Martin Pittuck (CEng, FGS, MIMMM, QMR) of SRK Consulting (UK) Ltd, has reviewed the geology and Mineral Resource estimate reported herein and takes responsibility for the 31 December 2024 Resource Estimate. Mr Pittuck is a qualified person and independent for the purposes of National Instrument 43-101. |
| · | The Measured and Indicated Mineral Resources are exclusive of those Mineral Resources modified to produce the Mineral Reserves. |
| · | Mineral Resources have been defined within an optimised pit shell using Measured, Indicated and Inferred Mineral Resources, based on input parameters: copper price of USD4.76/lb, a selling cost of USD0.51/lb Cu, and a molybdenum price of USD14.00/lb Mo. Average LoM mining operating costs are estimated at USD3.19/t (total) for Rosario and USD2.65/t (total) for Ujina. Processing costs (including G&A) have been applied on a material-specific basis, resulting in average costs of USD15.02/t of ore for Rosario and USD14.63/t of ore for Ujina. Processing recoveries are based on the defined Geometallurgical Units and range from 80.3% to 84.3% for copper and from 26.3% to 46.8% for molybdenum. No allowance for royalty is included in the optimisation parameters, where this would account for USD0.30/lb at the copper price of USD4.76/lb for the given inventory. The optimisation process relied on for constraining the reporting of Mineral Resources is conditional on the assumed relocation/redesign of LoM waste rock dump and low grade stockpiles located on the western side of the pit, including appropriate standoffs. |
| · | Estimates were depleted against the topography as at 31 December 2024. |
| · | Stockpiles inventories reflecting closing balances 31 December 2024 of the sulphide stockpiles. Discounted process recoveries are applied to stockpile material with average LoM values of 77%. All stockpile material is converted to Mineral Reserves. |
| · | Mineral Resources are reported based on a regularised block size of 20 x20 x15 m. The Mineral Resources are thereafter reported at a Cut-off grade of 0.3%CuT for in situ material and 0.3%CuT for stockpile material (aligned to the stockpiling strategy). |
| · | All tonnages are reported on a dry basis. |
| · | Mineral Resource tonnages have been rounded to reflect the accuracy of the estimate, and numbers may not add due to rounding. |
| · | Mineral Resources are estimated and reported on 100% attributable basis. |
Mineral Reserves
CMDIC operates a series of high-altitude open-pit mines in northern Chile, with current production sourced primarily from the Rosario Pit, with future contributions derived from the neighbouring Ujina pit as part of the LoMP. Sulphide ore is processed, through a 170 ktpd flotation plant, with the scheduled expansion to 210 ktpd due to be fully ramped up by 2028. Concentrate is transported via a 203 km pipeline to the Port of Patache. Oxide and mixed ore are excluded from current production, and cathode production ceased in 2017.
Block models were estimated using OK, with the block size aligned to 15 m benches. Historical reconciliation confirms that kriging-derived smoothing reflects expected dilution and recovery, so no additional dilution factors were applied in Mineral Reserve conversion.
| November 2025 | ||
| Page |
| SRK Consulting (UK) Limited | Mineral Resources and Mineral Reserves, Collahuasi Copper Mine - Main Report |
Mineral Reserves are reported within engineered pit designs supported by detailed schedules and financial analysis. The final pit design, incorporating haul road geometry and geotechnical parameters such as inter-ramp and overall slope angles, batter angles and berm widths, all varied by azimuth and depth based on geotechnical domains.
Pit optimisation was completed in Whittle Four-X (Whittle) using the Lerchs-Grossmann algorithm, with appropriate cost, price, recovery, and slope parameters. Inferred Mineral Resources were excluded from optimisation and scheduling.
The final pit design defines the Mineral Reserve, and subsequently, the LoM production schedule/cashflows. Hence, pit optimisation is the first step in developing any LoMP. In addition to defining the ultimate size of the open pit, the pit optimisation process also indicates possible mining pushbacks. These intermediate mining stages allow the pit to be developed practically and incrementally while at the same time targeting high-grade ore and deferring waste stripping.
LoM cut-off grade and cutback sequencing were optimised in COMET using Lane’s methodology with an NPV objective function. Operational constraints included equipment utilisation, development rates, pit geometry and processing capacities. Mining costs were based on recent actuals and aligned with CMDIC five-year budget.
| November 2025 | ||
| Page |
| SRK Consulting (UK) Limited | Mineral Resources and Mineral Reserves, Collahuasi Copper Mine - Main Report |
Table 1-3 summarizes the CMDIC Mineral Reserve estimates for the insitu deposits at Rosario, Rosario West and Ujina, respectively and associated stockpiles as at December 31, 2024:
| Table 1-3: | CMDIC Mineral Reserves for the Rosario, Rosario West and Ujina deposits, and associated stockpiles as at 31 December 2024 |
| Material type | Category | Tonnes | Grade | Grade | Metal | Metal |
| Mt | % CuT | Mo ppm | kt CuT | kt Mo | ||
| Rosario | ||||||
| Sulphide | Proven | 566 | 0.83 | 204 | 4,687 | 115 |
| Cut-off 0.30% CuT | Probable | 1,658 | 0.82 | 314 | 13,531 | 521 |
| Total Sulphide | Total | 2,224 | 0.82 | 286 | 18,218 | 637 |
| Stockpiles (Sulphide) | Proven | |||||
| Cut-off 0.30% CuT | Probable | 312 | 0.54 | 140 | 1,695 | 44 |
| Total Stockpile | Total | 312 | 0.54 | 140 | 1,695 | 44 |
| Proven | 566 | 0.83 | 204 | 4,687 | 115 | |
| Total Rosario Main | Probable | 1,970 | 0.77 | 287 | 15,226 | 565 |
| Total | 2,536 | 0.79 | 268 | 19,913 | 680 | |
| Rosario West | ||||||
| Sulphide | Proven | 129 | 1.11 | 7 | 1,437 | 1 |
| Cut-off 0.30% CuT | Probable | 503 | 0.95 | 7 | 4,807 | 3 |
| Total Sulphide | Total | 633 | 0.99 | 7 | 6,244 | 4 |
| Stockpiles (Sulphide) | Proven | |||||
| Cut-off 0.30% CuT | Probable | |||||
| Total Stockpile | Total | |||||
| Proven | 129 | 1.11 | 7 | 1,437 | 1 | |
| Total Rosario West | Probable | 503 | 0.95 | 7 | 4,807 | 3 |
| Total | 633 | 0.99 | 7 | 6,244 | 4 | |
| Proven | 696 | 0.88 | 167 | 6,124 | 116 | |
| Sub-total Rosario | Probable | 2,473 | 0.81 | 230 | 20,033 | 568 |
| Total | 3,169 | 0.83 | 216 | 26,157 | 685 | |
| UJINA | ||||||
| Sulphide | Proven | 336 | 0.69 | 163 | 2,333 | 55 |
| Cut-off 0.30% CuT | Probable | 597 | 0.66 | 151 | 3,944 | 90 |
| Total Sulphide | Total | 933 | 0.67 | 156 | 6,276 | 145 |
| Stockpiles (Sulphide) | Proven | |||||
| Cut-off 0.30% CuT | Probable | 4.58 | 0.55 | 221 | 25 | 1 |
| Total Stockpile | Total | 4.58 | 0.55 | 221 | 25 | 1 |
| Proven | 336 | 0.69 | 163 | 2,333 | 55 | |
| Sub-total UJINA | Probable | 602 | 0.66 | 152 | 3,969 | 91 |
| Total | 938 | 0.67 | 156 | 6,302 | 146 | |
|
Total Mineral Reserves |
Proven | 1,032 | 0.82 | 166 | 8,457 | 171 |
| Probable | 3,075 | 0.78 | 215 | 24,002 | 660 | |
| Total | 4,107 | 0.79 | 202 | 32,458 | 831 |
Important information regarding the Mineral Reserves disclosed in Table 1-3:
| · | Francois Taljaard (BEng (Hons) IND, SAIMM, Pr.Eng) of SRK Consulting (UK) Ltd, has reviewed the mining approach and Mineral Reserve estimate reported herein and takes responsibility for the 31 December 2024 Resource Estimate. Mr Taljaard is a qualified person and independent for the purposes of National Instrument 43-101. |
| · | Pit inventories were constrained by the 2024 LoM pit designs and depleted against the topography as at 31 December 2024. |
| November 2025 | ||
| Page |
| SRK Consulting (UK) Limited | Mineral Resources and Mineral Reserves, Collahuasi Copper Mine - Main Report |
| · | Mineral Reserves are reported based on a regularised block size of 20 x 20 x 15 m. No additional dilution or recovery factors have been applied. |
| · | The Mineral Reserves are reported at a Cut-off grade of 0.3%CuT for in situ material and 0.3%CuT for stockpile material (aligned to the stockpiling strategy). |
| · | Mineral Reserves have been defined within LoM pit designs guided by pit shells optimised using Measured and Indicated Mineral Resources only, based on input parameters: copper price of USD3.90/lb, a selling cost of USD0.51/lb Cu, and a molybdenum price of USD14.00/lb Mo. Average LoM mining operating costs are estimated at USD3.19/t (total) for Rosario and USD2.65/t (total) for Ujina. Processing costs (including G&A) have been applied on a material-specific basis, resulting in average costs of USD15.02/t of ore for Rosario and USD14.63/t of ore for Ujina. Processing recoveries are based on the defined Geometallurgical Units and range from 80.3% to 84.3% for copper and from 26.3% to 46.8% for molybdenum. No allowance for royalty is included in the optimisation parameters, where this would account for USD0.20/lb at the copper price of USD3.90/lb for the given inventory. |
| · | Stockpiles inventories reflect closing balances 31 December 2024 of the sulphide stockpiles. Discounted process recoveries are applied to stockpile material with average LoM values of 77%. |
| · | All tonnages are reported on a dry basis. |
| · | Mineral Reserves have demonstrated economic viability. |
| · | The Mineral Reserve comprises a mine life inclusive of stockpile feed of 59 years. |
| · | Mineral Reserve tonnages have been rounded to reflect the estimation accuracy; therefore, totals may not sum precisely due to rounding. All figures are reported in metric units. |
| · | Mineral Reserves are derived solely from Measured and Indicated Mineral Resources |
| · | Mineral Reserve are estimated and reported on 100% attributable basis. |
As of 31 December 2024 CMDIC has the legal right to mine and extract minerals from the Rosario deposit to 2041 and Ujina to 2027 (mining assumed to recommence 2043). The portion of Mineral Reserves constrained by this period represents approximately 30% of the current total. CMDIC’s right to extract minerals from the Rosario and Ujina pits beyond 2041 requires the completion of the necessary technical studies and associated impact assessments, to inform an updated EIA, to be submitted in 2027. The scope of the updated EIA is presently focused on a potential expansion to achieve a production rate of 370 ktpd, with approval anticipated in 2030. Should the expansion case to 370 ktpd be deferred, a revised application for an environment permit will be required to support the right to extract Mineral Reserves beyond 2041.
Other than that stated above, to the QP’s knowledge as informed by Anglo American, there are no known environmental, legal, title, taxation, socioeconomic, marketing, political, or other relevant factors that are expected to materially impact the Mineral Reserve estimates stated above.
| November 2025 | ||
| Page |
| SRK Consulting (UK) Limited | Mineral Resources and Mineral Reserves, Collahuasi Copper Mine - Main Report |
SRK has reported the Mineral Reserves above a cut-off grade of 0.3%CuT, which is consistent with the strategy for scheduling ore in the current LoM plan and operating practice, above which all material is either fed to the plant or the low-grade stockpile. In converting Mineral Resource to Mineral Reserves SRK does not consider it appropriate to apply any modification to classification, which would result in translating Measured Mineral Resources into Probable Mineral Reserves. SRK understands that historically when translating Measured Mineral Resources to Mineral Reserves CMDIC has converted a portion of low-grade material destined for the low-grade stockpile to Probable which reflected historical selective mining practices defined by cut-off grade bins. More recently, the scheduling approach has been amended to incorporate detailed geometallurgical modelling and dynamic cut-off grade scheduling thereby obviating the need for selective reporting. Furthermore, SRK notes that the mine schedule applies further metallurgical recovery discounts to all material which is recovered from the stockpiles thereby accounting for the impact of further oxidation over time.
| 1.8 | Mining Operations |
The mining method applied for the whole LoM is conventional truck and shovel open pit mining from the Rosario and Ujina pits. The disclosed Mineral Reserves above 0.30% CuT are sufficient to sustain the operations through to 2084.
Total material movement is 815 ktpd (ore plus waste), which aligns with the permitted limit of 300 Mtpa. Material is mined using 11 electric rope shovels (Bucyrus and P&H, 11 × 73 yd³ capacity) and hauled by a fleet of 105 Komatsu 930-class haul trucks (>300 t class). A well-maintained network of haul and access roads links the pits to key operational areas, including run of mine (RoM) pads, stockpiles, waste dumps, tailings, the camp and processing facilities.
Material with CuT grades between the breakeven cut-off grade and the variable operating cut-off grade is classified as low-grade and stockpiled for future processing and to maintain mill throughput as required.
| 1.9 | Processing and Recovery Operations |
The mine site process infrastructure consists of primary crushing located adjacent to the Rosario pit; crushed ore is then transported by conveyor to the Ujina plant for milling (three SAG mills and five ball mills) and flotation (rougher, two stage cleaner, cleaner scavenger), to produce a copper concentrate, also containing molybdenum. The current production capacity of 170 ktpd was achieved consistently from 2024 with the installation of the fifth ball mill (processing crushed SAG mill pebbles) and additional rougher flotation cells.
The concentrate is transported via two pipelines to the port at Punta Patache, where up to 4200 tpd passes through the molybdenum concentrate plant. The concentrates are filtered and stockpiled, and either loaded to ocean going vessels for international sales or into trucks for sales in-country.
The process infrastructure is currently the subject of a debottlenecking programme which seeks to increase the production rate to 185 ktpd (2026-2027) termed the PG3A Project, and 210 ktpd termed the Ujina Growth Project (2028 onwards).
| November 2025 | ||
| Page |
| SRK Consulting (UK) Limited | Mineral Resources and Mineral Reserves, Collahuasi Copper Mine - Main Report |
As part of the debottlenecking program, the capacity of the pipeline and ship loading facilities (with the exception of concentrate stockpile capacities, which are being upgraded as part of the 210 ktpd Ujina Growth project) are understood to have been independently assessed and found to be of sufficient capacity.
| 1.10 | Infrastructure, Power, Permitting and Compliance |
Collahuasi is an operating mine in production since 1999. As such, all the required infrastructure is in place and operational, and able to facilitate mine and concentrate production at the current 170 ktpd milling capacity.
The onsite infrastructure (excluding the processing facility) includes:
| · | Workshops, warehousing and maintenance facilities. |
| · | Accommodation/camp and welfare facilities to support operational and constructional activities. |
| · | Water supply and water management infrastructure, inclusive of groundwater extraction wells and pit dewatering wells. |
| · | Power distribution backup power, services and utilities. |
| · | Tailings storage facility. |
In addition to the processing infrastructure at the port at Punta Patache described above, the facilities also include office and administration and further camp facilities to support the construction programme for the desalination plant and pipeline project (also referred to as the “C20+ project”)
The mine is connected to the national grid via two double circuit 220 kV transmission lines understood to have a maximum carrying capacity of approximately 521 MW. This configuration allows CMDIC to maintain continuity of power supply in the event of foreseen maintenance or unplanned failure on either line. The two existing transmission lines have sufficient capacity for the 210 ktpd, pending the proposed modification works included in the Ujina Growth project. Additional transmission lines would likely be required to support any future fleet electrification or trolley assist initiatives to avoid any reductions in the redundancy current present in the system. CMDIC is understood to have procured power purchase agreements covering 100% of the required supply.
The mine site water supply is currently sourced from a combination of:
| · | groundwater wellfields operated by the mine in the Coposa and Michincha basins which provide more than 50% of the current demand; |
| · | ultrafiltered (UF) seawater conveyed to site via a recently constructed pipeline (currently undergoing commissioning) owned and operated by CMDIC; |
| · | pit dewatering activities; and |
| · | desalinated water delivered from the neighbouring Quebrada Blanca via pipeline. |
| November 2025 | ||
| Page |
| SRK Consulting (UK) Limited | Mineral Resources and Mineral Reserves, Collahuasi Copper Mine - Main Report |
The Pampa Pabellón TSF is a large-scale, engineered impoundment currently permitted for storage of up to 2,329 Mt of tailings, with estimated remaining capacity of 1,240 Mt at the end of 2024 (sufficient to support deposition to 2041). The facility is formed by a main embankment, incrementally raised via a downstream method and constructed primarily of Ujina waste rock, with auxiliary saddle dams, filter zones, and locally lined sections of the saddle dams in the areas of designed water ponding/supernatant water management to control seepage.
Future development strategy is focused on supporting mine expansion, targeting an increase to the existing TSF storage total capacity to 5,700 Mt, through a modified downstream raising methodology, which results in an expanded footprint when compared to the current permitted TSF. Scoping/PFS-level expansion design assessments have confirmed that available waste rock and borrow material volumes are adequate for embankment growth, and that the selected site and design (Pampa Pabellón with an optimised tailings distribution system and environmental footprint minimized by saddle dams and modified downstream raises) provides the most favourable technical, economic, and social outcome. The current permitting supports the storage requirements to 2041, beyond this the TSF will require expansion, with associated engineering studies, validation analyses and updated permits secured to continue to support the Mineral Reserves case.
The initial environmental approval for the operation was issued in 1995. Further Environmental Impact Declarations (DIA) and Environmental Impact Assessments (EIA) were submitted to secure approval of expansions and associated increases in processing capacities, namely: 110 ktpd in 2001, 133 ktpd in 2003, 170 ktpd in 2010, and 210 ktpd in 2021. The current environmental approval (RCA) for the operation was issued in 2021 and expires in 2041.
CMDIC obtains and manages the necessary sectoral environmental permits for the operation. The sectoral permits required following the Resolución Extenta No. 20219900112 (2021 RCA) are in progress and are due to be in place by end of 2027. Compliance with environmental commitments resulting from primary and sectoral environmental authorisations are actively managed and monitored. A Compliance Programme, approved by the Environmental Superintendent Authority (SMA) in 2022 following issues raised by local communities, is due to be completed by end of 2025.
Through the permitting process, CMDIC has conducted extensive environmental and social studies on impacts from the operation. The most recent EIA was submitted in 2019. A key area of impact from the current activities relates to water extraction from well fields in the Coposa and Minchincha basins, and dewatering of the Rosario open pit. Reduction in groundwater and surface water levels, particularly from pit dewatering activities, have the potential to impact sensitive features (springs), biodiversity of conservation importance, grazing areas and related cultural practices of local communities and indigenous groups. Through the 2021 RCA, CMDIC has committed mitigation measures that include restoring flows in the streams surrounding the Rosario pit during operation and closure. This adds to similar commitments made in previous approvals to restore flows in Jachucoposa spring, Michincha spring, and Huinquintipa stream. The operation also implements Early Warning Plans for abstraction wellfields to reduce or cease pumping from boreholes in the event alert thresholds are triggered.
CMDIC undertakes regular engagement with the range of stakeholders interested in or affected by its activities. Collaboration or framework agreements are in place to formalise these relationships. The communications and complaints mechanism ensures that complaints are received, investigated and actioned appropriately.
| November 2025 | ||
| Page |
| SRK Consulting (UK) Limited | Mineral Resources and Mineral Reserves, Collahuasi Copper Mine - Main Report |
Social investment programmes are implemented within the Tarapacá region focussing on economic development, social development, environmental initiatives and educational programmes. The CMDIC Sustainability Report 2024 provides more detail on these investments and their outcomes.
| 1.11 | Development Projects |
CMDIC has defined a three-stage long term strategy for the development of the Collahuasi operation reflecting: 1) stabilisation; 2) optimisation; and 3) growth. The operation is currently perceived to be in the optimisation phase, where the operation has achieved the 170 ktpd target and the projects required to achieve and sustain the operation at 210 ktpd have been approved. The next phase of development is termed the “ACP Growth” phase where CMDIC has aspirations of maximising the value of its substantial resource base through the development of the operations to achieve a production rate of 370 ktpd. The ACP Growth phase is currently under review by CMDIC and does not form part of the production schedule presented in this Technical Report.
In order to increase water supply capacity required to support planned future expansion as well as to reduce reliance on water extraction from continental water sources adjacent to the mine, CMDIC is executing the C20+ desalination project, which pumps desalinated water from the Punta Patache Port, via a pipeline (constructed) to the reservoir pools at the Ujina plant for use in the processing operations. The filtration and desalination plant are currently under construction and are scheduled to start providing desalinated water (via reverse osmosis) from mid-2026. The initial design will have a maximum capacity of 1,050 L/s to provide approximately 70% of the projected mine water demand for the 210 ktpd case, reducing the contribution from continental water from 56% to 21%. In addition, CMDIC has the option to expand capacity to 2,200 L/s by installing and commissioning additional reverse osmosis modules and pumping stations. This would support expansion beyond 210 ktpd or if further reductions in continental water usage are required.
CMDIC is in the process of executing a construction project to expand milling capacity known as the “Ujina Growth Project - PG210”. The Ujina Growth Project seeks to increase the average treatment capacity of the Ujina Concentrator Plant to 210 ktpd and is being delivered in phases under two main incremental project packages (PG):
| · | PG3A: Relocating a refurbished and upgraded Primary Crusher #3 to Rosario pit to achieve 185 ktpd (in latter stages of execution). |
| · | PG210 Package (Project Balance): A large package of works across the processing plants and port facility to achieve 210 ktpd Project. |
In addition, all the infrastructure, services, and auxiliary equipment necessary for the implementation of the projects are included as part of the scope of works.
The project controls monthly reports indicate both projects are currently trending on budget and schedule with PG3A at circa 50% progress and PG210 at 10% progress.
The “ACP Growth” phase to increase the production rate to 370 ktpd consists of a separate process plant to account for the additional capacity. This ACP Growth Phase is not included in the current LoMP.
| November 2025 | ||
| Page |
| SRK Consulting (UK) Limited | Mineral Resources and Mineral Reserves, Collahuasi Copper Mine - Main Report |
| 1.12 | Production, Capital and Operating costs |
Table 1-4 presents the forecast physical production, operating costs and capital costs over the full reserve case LoM and the 5-year totals for 2025-2029. Over the LoM, some 4,107 Mt of ore will be processed at an average of 0.79% copper, recovering a total of 27,499 kt of copper to copper concentrate with an average LoM plant recovery of 84.7%. Some 710 kt of molybdenum concentrate is also forecast to be produced containing 226 kt of molybdenum with an overall recovery of 26.4%. LoM total direct operating costs (mining, excluding deferred striping costs, processing and indirects) total USD92,923m or some USD22.6/t processed. Project capital costs are forecast to be USD1,874m (incurred 2025-2029) with LoM stay in business capital forecast to be USD22,877m and capitalized deferred stripping costs of USD6,331m over the LoM.
| Table 1-4: | Life of Mine and 2025-2029 production, operating and capital costs (5-year increments) on a 100% attributable basis |
| Description | Units | LoM | 2025-2029 |
| Mining | |||
| Ore mined (excl. oxide, mixed) | kt | 3,790,208 | 361,016 |
| Copper grade | %CuT | 0.81% | 0.88% |
| Contained copper | Cu kt | 30,738 | 3,191 |
| Waste mined | kt | 9,998,308 | 1,092,342 |
| Total material mined | kt | 13,788,516 | 1,453,358 |
| Strip ratio | w:o | 2.64 | 3.03 |
| Processing | |||
| Ore processed | kt | 4,107,031 | 346,362 |
| Copper grade | %CuT | 0.79% | 0.92% |
| Contained copper | Cu kt | 32,458 | 3,174 |
| Molybdenum grade | ppm | 209 | 217 |
| Contained Mo | Mo kt | 856 | 75 |
| Copper concentrate (pre-Moly & Filter plant) | kt | 100,121 | 10,253 |
| Copper grade | %CuT | 27.47% | 26.07% |
| Contained copper | Cu kt | 27,499 | 2,673 |
| Contained copper | Cu klb | 60,624,709 | 5,892,518 |
| Overall copper recovery | % | 84.72% | 84.21% |
| Molybdenum concentrate | kt | 710 | 80 |
| Molybdenum grade | %Mo | 31.86% | 31.97% |
| Contained molybdenum | Mo kt | 226 | 26 |
| Overall molybdenum recovery | % | 26.43% | 33.88% |
| Product Sales | |||
| Copper concentrate | kt | 99,468 | 10,173 |
| Copper grade | %CuT | 27.64% | 26.25% |
| Contained copper | Cu kt | 27,493 | 2,671 |
| Contained copper | Cu klb | 60,612,303 | 5,887,945 |
| Molybdenum concentrate | kt | 711 | 80 |
| Molybdenum grade | %Mo | 31.84% | 31.97% |
| Contained molybdenum | Mo kt | 226 | 26 |
| Gross Revenue | |||
| Copper revenue (after deductions) | USDm | 227,793 | 22,088 |
| Copper price | USD/lb | 3.90 | 3.90 |
| November 2025 | ||
| Page |
| SRK Consulting (UK) Limited | Mineral Resources and Mineral Reserves, Collahuasi Copper Mine - Main Report |
| Description | Units | LoM | 2025-2029 |
| Molybdenum revenue (after deductions) | USDm | 5,312 | 598 |
| Molybdenum price | USD/lb | 14.00 | 14.00 |
| Direct operating costs | |||
| Mining (incl. deferred stripping) | USDm | 44,620 | 4,063 |
| Deferred stripping | USDm | -6,331 | -1,261 |
| Mining (excl. deferred stripping) | USDm | 38,289 | 2,802 |
| Unit mining cost (per tonne mined) | USD/t | 3.24 | 2.80 |
| Processing & Port | USDm | 43,848 | 3,598 |
| Unit processing cost (per tonne processed) | USD/t | 10.68 | 10.39 |
| G&A | USDm | 10,785 | 1,021 |
| Unit G&A cost (per tonne processed) | USD/t | 2.63 | 2.95 |
| Total Direct Operating Cost (excl. deferred stripping) | USDm | 92,923 | 7,420 |
| Unit cost (per tonne processed) | USD/t | 22.63 | 21.42 |
| Capital costs | |||
| Project capital | USDm | 1,874 | 1,874 |
| Stay in Business capital (excl deferred stripping) | USDm | 22,877 | 2,352 |
| Deferred stripping | USDm | 6,331 | 1,261 |
| Total Capital Costs | USDm | 31,082 | 5,487 |
| C1 Cash Cost | |||
| Production – copper payable | Cu klb | 58,396,264 | 5,663,666 |
| Production - molybdenum payable | Mo kt | 172 | 19 |
| Direct production cost (excl deferred stripping, incl stockpile inventories) | USDm | 93,129 | 7,579 |
| Realisation costs | USDm | 17,060 | 1,716 |
| C1 cash cost before credits | USDm | 110,189 | 9,294 |
| By-product credits (Molybdenum only) | USDm | (3,784) | (427) |
| C1 cash cost after credits | USDm | 106,405 | 8,868 |
| Direct production cost (excl deferred stripping, incl stockpile inventories) | USD/lb Cu | 159 | 1.34 |
| Realisation costs | USD/lb Cu | 0.29 | 0.30 |
| C1 cash cost before credits | USD/lb Cu | 1.89 | 1.64 |
| By-product credits (Molybdenum only) | USD/lb Cu | (0.06) | (0.08) |
| C1 cash cost after credits | USD/lb Cu | 1.82 | 1.57 |
| C1 All in Sustaining Cost | |||
| All in Sustaining Cost (excl royalty) | USDm | 137,116 | 12,565 |
| Royalty | USDm | 12,602 | 1,310 |
| All in Sustaining Cost (incl royalty) | USDm | 149,718 | 13,875 |
| All in Sustaining Cost (excl royalty) | USD/lb Cu | 2.35 | 2.22 |
| Royalty | USD/lb Cu | 0.22 | 0.23 |
| All in Sustaining Cost (excl royalty) | USD/lb Cu | 2.56 | 2.45 |
| 1.13 | Exploration Potential |
The Rosario porphyry copper mineralisation remains open at depth, dipping towards the south-west. The limited drilling that intersects the current pit applied for reporting Mineral Resources indicates intersections in excess of 1% copper over sufficient widths to warrant further investigation into whether these could potentially form an underground target.
CMDIC is not actively exploring outside of the current operating pits.
| November 2025 | ||
| Page |
| SRK Consulting (UK) Limited | Mineral Resources and Mineral Reserves, Collahuasi Copper Mine - Main Report |
| 1.14 | Conclusions and Recommendations |
The Collahuasi asset has the potential to form a long-life operation, which is following a structured plan to deliver increasing value. Through the developments planned in 2025 and 2026, the operation should achieve its objectives of the “optimisation phase” that will realise production rates in the order of 210 ktpd, coupled with steps to deliver more sustainable practices, including the reduction of its reliance on groundwater sources. Thereafter, the opportunity for achieving the goals of the ACP Growth phase and further increased production still needs to be tested.
Operational challenges in recent years, dating back to the COVID-19 pandemic period, have led to certain constraints with the mine and plant, which CMDIC is actively trying to mitigate. These challenges will likely lead to similar production figures being achieved in 2025 and 2026, which if not addressed may impact the short-term plan further.
SRK has reviewed the underlying data and technical studies completed to support the derivation of Mineral Resources and Mineral Reserves and in doing so is satisfied that the work completed is sufficient to support the technical viability of the operation for the base case, Mineral Reserves only, LoM plan.
SRK notes that certain elements of the operation have focused on the period up to 2041, which is aligned with the current period of the EIA. It is SRK’s recommendation that to support future life of asset planning that the level of design detail for the period beyond 2041 be brought in line with the medium-term planning that currently supports the period 2030-2041.
SRK recommends that CMDIC reinstates a full mine to mill reconciliation process to monitor the performance of the long-term models and operating processes. In parallel to this process, CMDIC should validate the outputs of the geomet recovery models to the core input data.
In presenting the Mineral Resources and Mineral Reserves for the Collahuasi operation SRK notes the following risks and opportunities:
Risks
| · | Summary documentation, inclusive of several independent audit reports, indicates that the geological data have been collected in a manner which is generally comprehensive by industry standards, with no significant issues being flagged. Notwithstanding this observation, there are various gaps in the source raw data which have not been possible to validate. |
| · | There is some uncertainty around the quality of data available for the Ujina deposit. The last phase of infill drilling for the Ujina deposit was conducted in 2007-2008, and mining there ceased in 2004. Historical records associated with data quality and pit operations are limited or no longer available, and available records do not align with the level of information available for the Rosario pit. Up to the cessation of mining, a total of approximately 46 Mt of oxide and 213 Mt of sulphide material was extracted from the Ujina pit. Some limited twin drilling has recently been completed as part of a programme of work to better understand and characterise the deposit; however, further work is required to validate the models and design parameters that were established circa 10-15 years previously. |
| November 2025 | ||
| Page |
| SRK Consulting (UK) Limited | Mineral Resources and Mineral Reserves, Collahuasi Copper Mine - Main Report |
| · | The Rosario West deposit is characterised by minerals associated with higher arsenic content (e.g. enargite), consequently, as the proportion of ore feed derived from the Rosario West deposit increases, there is greater potential for As to report to the Cu concentrate and risk that greater quantities of out-of-specification concentrate be produced, which in turn could lead to selling price penalties/reductions. |
| · | Stockpile balances are principally based on dispatch data and end or period surveys, and historical block model grade estimates. Given the period of time over which these have been accumulated, the confidence in historical production data has not been possible to validate beyond the volumes covered by the recent drilling and trenching exercises which account for circa 80-100 Mt of material. |
| · | Recent pit inspections noted the occurrence of extensive areas of poor ground over multiple benches, in which ravelling/rockfall were observed adjacent to an active ramp (in Rosario Cut 14). The poor ground may be associated with persistent faulting/argillic alteration, and/or a result of overspill from a vertically coincident mining phase. Irrespective, mining in the Rosario pit will continue to require access to adjacent production phases where there may be an elevated risk of rockfalls interacting with contiguous phases. Flexibility in mine planning allied with appropriate operational procedures and geotechnical slope monitoring will be necessary to detect, manage, and mitigate such risks, particularly where access is constrained. To control this risk CMDIC implements a 24/7 slope monitoring programme with immediately alerts operators in case of failure acceleration. Mine design practices also include several ramp accesses points to mitigate the impact of disruptions associated to minor slope failure. |
| · | More detailed geotechnical characterisation of the ground conditions beyond the medium-term planning horizon is required. Studies should focus on structural geological conditions, including mechanical characterisation of the principal fault structures, as well as the smaller scale defects that control bench and inter-ramp stability. The definition of geological and alteration boundaries, particularly zones of low- and very low-quality rock and their associated engineering properties, will be critical for accurate prediction of slope stability to the LoM pit boundaries. Furthermore, although geotechnical stability assessments for the five-year plan horizon are relatively detailed incorporating 3D analysis and pore water pressure grid inputs from 3D numerical groundwater modelling, the analysis at the LoM scale is far more simplistic and limited to simple 2D limit equilibrium analysis with simple 2D phreatic surface inputs for groundwater, which cannot accurately reflect the complexity of the complex dewatering system required. |
| November 2025 | ||
| Page |
| SRK Consulting (UK) Limited | Mineral Resources and Mineral Reserves, Collahuasi Copper Mine - Main Report |
| · | Achieving pit depressurisation targets is challenging due to the scale of the in-pit dewatering operations. The ultimate LoM pit depth is forecast to achieve a crest to toe height of circa 1000 m with a planned sink rate of greater than180 m per year. Although dewatering targets have largely been achieved over a relatively long period of time (the dewatering system has operated for at least 20 years), the system will need to continue to expand to meet the future production scenarios, with some of the potential long-term dewatering scenarios include over 200 dewatering wells, with up to 26 new wells being drilled per year to depths of over 800 m, as well as drilling and operation of up to 33, 200 m long horizontal drain holes. Furthermore, there are some gaps in the current hydrogeological understanding with respect to hydrogeological properties to the full depth of the LoM pit as well as pore water pressure responses across some problematic units which may be slow to drain, which add uncertainty to the LoM dewatering plan. Achieving slope depressurisation targets is critical to ensure stable slopes, with little margin for error. Development of this large open pit at the high sink rates planned in the LoM will pose significant technical and logistical challenges, in particular where the rock mass is considered poor relating to the presence of complex structural, geological and hydrogeological conditions. |
| · | To provide the necessary independent technical overview and scrutiny, CMDIC should re-establish the Geotechnical Assessment Board (GAB) which last reported in 2019. The GAB should be reconstituted on a frequency commensurate with the risks associated with the planned depth of mining and complexity of the geotechnical circumstances. The GAB should comprise recognised international experts in geotechnical engineering, structural geology and hydrogeology. |
| · | For the Rosario West deposit, an alternative approach should be sought to better represent mining dilution and recovery modifying factors that are applied to estimate extraction from the structurally controlled geological units found in Rosario West, if they can be aligned with the adapted mining practices being used there. Currently, the modifying factors used are the same as those applied for the bulk porphyry style mineralisation that predominates at Collahuasi, whereas the Rosario West deposit is an epithermal high sulphidation system that is structurally controlled resulting in more discrete grade distributions. |
| · | To sustain the planned plant throughput, an average pit sinking rate of approximately 12 benches per annum is required. CMDIC has previously demonstrated the capability to achieve, and in some instances exceed, this rate during selected periods between 2021 and 2024; however, this rate is considered high relative to typical industry benchmarks of 8 to 10 benches per annum. Failure to maintain the required mining rates would delay access to higher-grade ore, and result in an increased reliance on the historical low-grade stockpiles at various stages throughout the LoM. The lower grades, coupled with the uncertainty regarding the plant performance of the old low-grade stockpiles at elevated feed rates, would further exacerbate these impacts and compound production losses. |
| November 2025 | ||
| Page |
| SRK Consulting (UK) Limited | Mineral Resources and Mineral Reserves, Collahuasi Copper Mine - Main Report |
| · | The impact of permitting delays that stemmed from the COVID-19 pandemic has hindered advance stripping activities, resulting in sub-optimal operating conditions. Initial efforts to accelerate ore access through smaller cutbacks reduced productivity, subsequently leading to a shift towards larger phases with higher strip ratios to improve operating efficiencies. Until deeper bulk ore is reached, the operation must rely more heavily on low-grade stockpiles, which reduces concentrate production rates and increases demand for process water. This delay to accessing primary ore is expected to cause a temporary decline in concentrate production rates, with the lower production targets in 2026 being similar to those achieved in 2025 to date on an annualised basis, and, if unmanaged, may impact performance over the next five years. |
| · | The waste dump slope geometry and profile as defined in the 2040 case geotechnical studies have been applied to the designs for the Mineral Reserves case LoM waste rock dump (WRD) (100 m high lifts; 60o inclination face; 60 m wide berms); however, no revised assessments have been completed to validate that the (presumed) higher slopes and foundation mitigation measures are appropriate to present acceptable factors of safety. Further analyses are therefore required, which should be informed by sufficient and appropriate ground investigation and laboratory testing, and consider representative drained and undrained shear strengths with particular emphasis on strength models applied to weak/sensitive/low-strength/low density/saturated foundation soil units. |
| · | Closure/final WRD outer slopes will need to be significantly lower in inclination than those proposed in the 2040 design validation studies to facilitate safe and effective closure. The LoM slope designs are typically approximately 30° inclination overall; however, closure slopes are more typically 18° overall which will necessitate expansion of footprint and potentially significant reprofiling if done at closure rather than if considered progressively as part of the dump development. |
| · | The expansion programme underway to increase the mine’s production rate to 210 ktpd is at varying stages of development. Delivery of the construction projects to align with resolution of the various operational challenges being faced needs careful management to mitigate possible delays to achieving the targeted production rate of 210 ktpd. |
| · | The energy project related capital expenditure (including “Stay in Business” (SIB) capital) needs to be reviewed to ensure the costs included in the financial model align to the selected energy infrastructure improvements to meet the needs at Collahuasi. Similarly, the information provided regarding the estimate at completion for the various project also needs to be checked as the financial model has a USD130m shortfall between the model input and the current P50 estimate at completion of the C20+ project. |
| · | CMDIC implements a comprehensive geometallurgical process, which is focused on short term planning and performance of the process plant. LoM projections are based on findings from these assessments as applied to the interpreted oxidation state, lithology, and alteration style of mineralisation that is planned for extraction over the long term; however, there is limited testwork to support geometallurgical interpretation for later phases of mine production planned at depth, to the SW and for the Ujina deposit. In addition, the ability to audit the geomet outputs against the input data is challenged by the complexity of the approach and multi-variable relationships. It is recommended that CMDIC supplements their processes with routines to validate the geomet outputs against the key input criteria. |
| November 2025 | ||
| Page |
| SRK Consulting (UK) Limited | Mineral Resources and Mineral Reserves, Collahuasi Copper Mine - Main Report |
| · | Comparisons of the short term and budget model reconciliation indicates a decrease in total molybdenum content recovered over recent years. The basis for this decreasing trend is not yet fully explained; however, as more material is sourced from the Rosario West deposit, which has a naturally lower molybdenum content, this trend might continue and potentially worsen. |
| · | Stockpiles of low-grade sulphide material historically accounts for some 316 Mt. Risk to concentrate recovery and production output from greater reliance on low grade stockpile material to maintain plant feed rates is compounded by lower processing recoveries resulting from this material being partially oxidised, as shown by recent operational experience. The mine plan has sought to incorporate this factor, but the potential for the material to oxidise further over time, could result in lower concentrate recovery and production outputs. |
| · | There is a risk to achieving the higher copper concentrate grades assumed in the latter years of the LoM plan which would result in higher freight costs and treatment charges if lower concentrate grades were produced than assumed. |
| · | The balance of water availability and water requirements is stressed by operating conditions. As operations progress to extract Rosario West at depth there is potential for higher concentrations of deleterious clay materials to be incorporated in the mill feed, which requires more water to achieve planned process recoveries. In addition, monitoring data are flagging the requirement for groundwater extraction rates to be constrained in some areas to comply with abstraction license conditions and mitigate any potential impacts to groundwater receptors through activation of the Early Warning Plan (PAT/EWP), a situation which is likely to become increasing challenging as groundwater levels continue to decline. Until the C20+ desalination plant is fully commissioned in June 2026, operations are using filtered seawater pumped to site through the new desalination pipeline. The ability to deliver the required long-term water supply depends on timely commissioning of the new seawater intake and reverse osmosis plants. During this commissioning period, the water supply system operates with minimal redundancy, with potential for short-term water deficits and reduced concentrate production if any source underperforms, infrastructure commissioning is delayed, or if any regulatory triggers (PAT) require curtailment. |
| · | The continued abstraction of continental/groundwater proximal to the mine site, whilst currently permitted, is sensitively balanced and likely to come under increasing stakeholder and regulatory pressure to be reduced in the future beyond current plans, as has been the case for other operators in the region. The water pipeline has been sized to support a potential higher production rate (of up to 390 ktpd), with the associated infrastructure designed to allow modular upgrades. Notwithstanding this potential capacity expansion (and associated capital cost and scheduling implications), any reduction in continental water extraction would increase the water requirement from alternative sources. Accordingly, the LoMP and any further production expansion case should consider this risk as part of a continual water balance assessment and be incorporated into future permitting processes. |
| November 2025 | ||
| Page |
| SRK Consulting (UK) Limited | Mineral Resources and Mineral Reserves, Collahuasi Copper Mine - Main Report |
| · | CDMIC has several ongoing environmental obligations related to spring and stream flow management in its operational area. For example, at the Jachucoposa and Michincha springs, CDMIC must maintain flows by supplementing natural discharge with water pumped in from other areas. At the Huinquintipa stream, ongoing interception and quality monitoring of seepage and runoff from the Rosario WRD is carried out, with flow compensation required where water quality is not suitable for discharge. The PAT/EWP required in the 2021 RCA, sets threshold-based triggers for springs, Coposito, Border, and the TSF, activating mitigation actions if thresholds are breached, such as reducing abstraction or additional water injection. Although current measures are well managed, maintaining these commitments poses operational and reputational risks, especially if mitigation actions reduce water availability for production or if water quality controls fail to protect downstream users. Furthermore, mitigations at the springs and Huinquintipa stream are planned to continue until 12 years post closure and it is not currently clear how CMDIC plans to meet this commitment after 12 years if post-closure monitoring suggests that these controls continue to be required. CMDIC is studying alternative solutions and will update the closure plan as these studies progress, but the current plan does not account for this potential requirement or associated cost. |
| · | The current Pampa Pabellón TSF expansion plan is currently limited to a scoping and pre-feasibility study level of detail. Consequently, a greater level of design detail and associated studies are required; in particular, to support robust and explicit assessment of capital and operating costs; to consider potential environmental impacts associated with seepage and downstream geochemistry; and make further assessment of environmental and social impact for the expanded TSF footprint which will include sensitive grazing areas. Additionally, further planning for the availability and suitability of construction fill for future embankment raises is required, noting geotechnical uncertainties with foundation soils and variable material quality from the mine waste source(s). Continuous improvement in monitoring, governance, and engineering validation is also recommended to help comply with Global Industry Standard on Tailings Management (GISTM) (an ongoing project) and to ensure that identified risks are effectively managed, and a substantiated, reliable basis for future design, cost, and risk estimates is established. |
| · | Waste rock and tailings materials have been classified as potentially acid generating. Therefore, runoff and seepage of contact waters from the WRD, stockpiles, and TSF could degrade water quality at downstream receptors and for associated water users. This risk particularly impacts the streams and receptors that drain to the west and south-west of the Rosario pit and associated facilities and is compounded by limited long-term understanding of solute transport pathways and the absence of fully developed mitigation measures. The future project expansion will increase footprint area of the TSF and WRD, necessitating progressive expansion of seepage monitoring, capture and pumping infrastructure, and potentially requiring infrastructure in new locations/areas. The current closure plan includes the construction and operation of seepage collection and treatment systems for the 12 year active closure phase. CMDIC has not yet defined whether treatment beyond this period is anticipated, and if so, what potential solutions may be required. |
| November 2025 | ||
| Page |
| SRK Consulting (UK) Limited | Mineral Resources and Mineral Reserves, Collahuasi Copper Mine - Main Report |
| · | There is risk that delays to permitting at the Ujina deposit delays future production. In the short-term there is a requirement to mine waste from the Ujina pit to support the expansion of the TSF dam wall. A permit application for this activity (DIA) is in progress and is scheduled for submission in Q1 2026 and approval in Q1 2027. The permitting schedule will need to be aligned with the planned construction programme to mitigate any impacts on production. Longer-term, extraction of ore from the Ujina deposit is scheduled to recommence in 2044, following a hiatus of circa 40 years. The environmental permit for Ujina pit expires in 2027 and therefore, in advance of restarting mining activities at Ujina, a permitting programme, inclusive of EIA, will need to be enacted and approved before mining can recommence. |
| · | As described in the CMDIC strategic development plan, the operation is in the second phase of a three-phase development plan. The current environmental approval for the operation was issued in 2021 and expires in 2041. The operation permitted via this approval is smaller in scale and duration than the Mineral Reserves case. This is common practice in Chile where the duration of environmental approvals are often limited to between 20 and 25 years. CMDIC plans to submit an EIA for the ACP Growth project in 2027 ahead of an approval anticipated in 2030. Until the approval is secured, there is no environmental permit for mining after 2041, which accounts for 30% of the current Mineral Reserves. Factors that could present risks to this approval being obtained include: material changes to the operation (other than expansion of current facilities); continued need for groundwater abstraction beyond 2041; anticipated carbon emissions; status of stakeholder relationships prior to and during the permitting process; and disturbance to sensitive features in the future TSF footprint, including archaeological sites, grazing areas used by indigenous groups and areas of protected vegetation. |
| · | Between October 2023 and April 2024, several indigenous communities from the Tarapacá region in northern Chile filed lawsuits challenging the 2021 environmental approval of the operation. The claimants alleged that the environmental evaluation process did not properly assess the impact on affected indigenous communities and their livelihoods process, and that their rights were not adequately assessed as a result. An additional legal proceeding was launched by indigenous communities, Wilamasi and Chanavaya, located on the coast to the south of Puerto Patache. This lawsuit relates to alleged contamination and impact on seawater, sediments and marine fauna from discharge of copper. Because these cases involve the same claimants, the cases were merged and are now being managed as a single lawsuit. The claim for environmental damage filed before the First Environmental Court of Antofagasta was rejected by the Court in July 2025. The ruling stated that there is insufficient evidence to prove environmental damage as alleged by the plaintiff. In addition, the plaintiff was ordered to pay the costs of the trial. The plaintiffs appealed the decision and the case will be moved to the Second Environmental Court of Antofagasta. |
| November 2025 | ||
| Page |
| SRK Consulting (UK) Limited | Mineral Resources and Mineral Reserves, Collahuasi Copper Mine - Main Report |
| · | As part of the operation’s environmental commitments, CMDIC is committed to replacing water flows in certain springs and streams surrounding the mine during operational and closure phases, and for as long as necessary until the spring's natural flow is restored. This commitment will be fulfilled using water from dewatering and water supply pumping activities that are planned to continue until 12 years post closure; however, it is not currently clear how CMDIC plans to meet this commitment after 12 years if post-closure monitoring suggests that flow augmentation continues to be required. CMDIC is studying alternative solutions and will update the closure plan as these studies progress, but the current plan does not account for this potential requirement or associated cost. |
| · | The undiscounted cost of closure in the LoM financial model is USD473m. The undiscounted closure cost estimate for planned closure in the approved 2021 closure plan is USD656m. The costs based on the conditions foreseen at the end of the mine life are likely to be underestimated in the context of the requirements of the life of mine Mineral Reserve case. Firstly, the estimate is based on a project description approved by the 2021 RCA, which does not reflect the ultimate extents of the operations or quantities, extracted, processed and placed in waste facilities. Secondly, the unit rates used in the estimate are derived from a previous (2016) version of the closure cost estimate and are outdated and not reflective of a base date of 2025. Considering these factors, the closure cost estimate for the Life of Mine case is likely to exceed USD1,000m, which would potentially double the costs reflected in the life of mine plan. This estimate is based on the principal of local regulatory compliance, if the estimate were to be brought in line with best international practices then the increase could be substantially higher than the revised estimate presented above. |
| · | The wider implications of plans that are being developed to meet CMDIC decarbonisation targets are being assessed, which adds uncertainty to LoM projections. CMDIC annually reports carbon emissions and has made a voluntary commitment to achieve carbon neutrality by 2040 in Scope 1 and Scope 2 emissions. The voluntary target aligns with decarbonisation goals in Chile’s National Mining Policy. The operation’s decarbonisation strategy outlines potential emission reduction opportunities to support this target and pilot projects are in progress to determine the most viable solutions. Some technologies, such as installation of trolley systems to electrify sections of the pit for truck haulage, would require changes to the current mine plan and design. At present, carbon emission reduction projects have not been fully defined and are therefore not considered in the financial model. Chile’s carbon tax does not yet apply to the operation but may do so in the future in accordance with Chile’s long term climate strategy. |
Opportunities
| · | The Rosario porphyry copper mineralisation remains open at depth, dipping towards the south-west. The limited drilling that intersects the current pit and which is applied for reporting Mineral Resources, indicates intersections in excess of 1% copper over sufficient widths to warrant further investigation of a potential target for extraction by underground mining. |
| · | Whilst not the focus of current operations or development plans, there is a sizable amount of oxide material located both in situ and in stockpiles, which could be incorporated into future development plans if it were demonstrated to have economic value. |
| November 2025 | ||
| Page |
| SRK Consulting (UK) Limited | Mineral Resources and Mineral Reserves, Collahuasi Copper Mine - Main Report |
| · | CMDIC has defined in their strategic plan for the operations, the opportunity to expand operations through the ACP growth phase to a production rate of 370 ktpd. The ACP Growth project would require significant investment to expand current infrastructure and operations, but in doing so would bring forward the realisation of potential revenues in the life of the operations. In planning for the current optimisation phase, certain infrastructure (for example, the desalination water pipeline) have been sized to support the ACP Growth phase, demonstrating a forward looking commitment. |
| · | Dependent on the outcomes of the assessment of future production rates under the ACP Growth plan, the additional capacity incorporated in the desalination pipeline infrastructure provides opportunity to remove the mine’s dependency on groundwater as a source of water supply. |
| · | Through inter-company arrangements with nearby operations CMDIC might seek opportunity to optimise regional operational factors such as water stewardship for the benefit of participating companies and to local stakeholders. |
| November 2025 | ||
| Page |
| SRK Consulting (UK) Limited | Mineral Resources and Mineral Reserves, Collahuasi Copper Mine - Main Report |
| ITEM 2 | INTRODUCTION |
SRK Consulting (UK) Limited (SRK) is an associate company of the international group holding company, SRK Consulting (Global) Limited (the SRK Group). SRK has been requested by be Anglo American plc (Anglo American, or the Company or the Client) to prepare a Technical Report on the Mineral Assets of the Company comprising the Doña Inés de Collahuasi copper mine (Collahuasi), located in the Tarapacá Region of northern Chile, in accordance with the CIM Definitions Standards (2014).
Compañía Minera Doña Inés de Collahuasi (CMDIC) is owned by subsidiaries of Anglo American plc (44%), subsidiaries of Glencore plc (44%) and a consortium of Japanese companies led by Mitsui & Co. Ltd. (12%).
The Collahuasi mining operations correspond to a cluster of open pit mines located in the Region I of Chile, about 225 km by road SE of the city of Iquique, at elevations between 4,200 and 4,800 masl. The main mine in operation is the Rosario pit. The original pit where the operations started, Ujina, is not currently in production but is part of the Life of Mine (LoM) plan (LoMP).
The Effective Date of the Mineral Resources and Mineral Reserves reported herein is 31 December 2024 (Effective Date). The Mineral Resources and Mineral Reserves estimates dated 31 December 2024 were prepared by CMDIC personnel and were reviewed by a multidisciplinary team of qualified persons from SRK. The estimates were reviewed in detail including parameters, assumptions, supporting factual data, procedures and electronic files. SRK has carried out a site visit to the operation and has reviewed reconciliation results between production data and the estimates.
The signature date of this report is 4 November 2025.
This report and the Mineral Resources and Mineral Reserves estimates have been prepared in compliance with the disclosure and reporting requirements set forth in the current Canadian Securities Administrator’s National Instrument 43-101, Companion Policy 43-101CP, and Form 43-101F1.
In preparing this report, SRK has relied on information shared by CMDIC and Anglo American, various reports, maps, and technical papers listed in the References section at the conclusion of this report and on experience gained from similar deposits.
All measurement units used in this Report are metric unless stated otherwise, and currency is expressed in US dollars (USD), with the exception of commodity prices which are presented in USD or US cents per pound (lb) and equipment sizing which is presented in square yards,.
| November 2025 | ||
| Page |
| SRK Consulting (UK) Limited | Mineral Resources and Mineral Reserves, Collahuasi Copper Mine - Main Report |
| 2.1 | Terms of Reference |
SRK has been informed that Teck Resources Limited (Teck) and Anglo American (jointly hereinafter the Merger Parties), have subject to satisfying various regulatory requirements and other conditions (reported in both of the respective Merger Parties press release dated September 9, 2025) agreed to a combination (the Merger) of the Merger Parties to form the Anglo Teck Group (Anglo Teck). The Merger Parties have entered into an arrangement agreement (the Arrangement Agreement) to effect the Merger by way of a plan of arrangement under the Canada Business Corporations Act and Anglo Teck plc will be listed on the Toronto Stock Exchange (TSX), London Stock Exchange (the LSE), New York Stock Exchange (NYSE) and Johannesburg Stock Exchange (JSE), subject to the necessary approvals.
SRK has been informed by Anglo American that the Merger, inter alia, is subject to attaining approval by vote of the shareholders of Teck, at a special meeting of shareholders (the Meeting). The plan of arrangement will also require customary court approval in Canada. In support of this process, meeting materials will be filed under Teck’s profile on SEDAR+ at www.sedarplus.ca comprising a management proxy circular (the Circular) and other materials to be mailed by Teck to Teck shareholders in connection with the Meeting to approve the transaction (the Meeting Materials).
SRK understands that extracts and/or summaries of the Collahuasi 2025 Technical Report will be included by reference in the Circular and the full and complete Collahuasi 2025 Technical Report will be filed under Teck’s profile on SEDAR+.
Anglo American commissioned SRK to conduct an independent audit of the Mineral Resources and Mineral Reserves and prepare the Collahuasi 2025 Technical Report (the Technical Report), and to review the technical detail presented in the Circular to confirm it aligns with the content of the Technical Report.
| 2.2 | Qualified Persons |
The Qualified Persons (QPs) responsible for the “NI 43-101 Technical Report on the Mineral Assets of the Company comprising the Doña Inés de Collahuasi copper mine”, issued on 4 November 2025, and their respective areas of responsibility are presented in Table 2-1.
| November 2025 | ||
| Page |
| SRK Consulting (UK) Limited | Mineral Resources and Mineral Reserves, Collahuasi Copper Mine - Main Report |
| Table 2-1: | Qualified Persons |
| Category | Author | Responsible Items |
| Co-author of the report and responsible for the overall coordination of the Technical Report |
Timothy Lucks PhD, MAusIMM(CP) |
1.1 – 1.3, 1.9,
1.12, 1.14
|
| Geology and Mineral Resource estimation | Martin
Pittuck MSc, CEng, FGS, MIMMM (QMR) |
1.4 – 1.7, 1.13 7 – 12, 14
|
| Metallurgy and processing | Dr
John Willis MAusIMM(CP) |
1.9 13 Contributions to 1.14, 21, 25 and 26
|
| Mining engineering | Francois
Taljaard BEng Mining, BEng (Hons) IND, SAIMM, Pr.Eng |
1.7, 1.8 15 16 (excluding 16.1 and 16.2 Contributions to 1.14, 21, 25 and 26
|
| Geotechnical engineering | Max
Brown CEng, MSc, BSc, MCSM |
16.2 Contributions to 1.14, 21, 25 and 26
|
| Hydrology and hydrogeology, dewatering and site water management, water supply, water stewardship | James
Bellin MSc, CGeol, FGS |
Contributions to 1.10, 1.14, 5.3 16.1 18.4,18.5 Contributions to 20.3, 21, 25 and 26
|
| Infrastructure | Colin
Chapman MSc, CEng, MIMMM |
1.10, 1.11 18.1: 18.6-18.9 Contributions to 21, 25 and 26
|
| Waste management | Richard
Martindale BSc, MSc, CEng, MIMMM |
Contributions 1.10, 1.14 18.2, 18.3 Contributions to 21, 25 and 26
|
| 2.3 | Personal Inspection of the Collahuasi Property |
Site visits to Collahuasi operations were undertaken between 7-8 October 2025 by the following representatives of SRK:
| · | Martin Pittuck (CEng, FGS, MIMMM(QMR)), in relation to the geology and Mineral Resources of the Rosario, Rosario West and Ujina deposits |
| · | Colleen MacDougall (P.Eng, Principal Mining Engineer), in relation to the mining operations, providing input into the review open pit operations led by Francois Taljaard. |
| · | Carla Guzman (BSc, Senior Civil Engineer/Hydrologist), in relation to the water management operations and infrastructure associated to the mine, processing and port facilities. |
| November 2025 | ||
| Page |
| SRK Consulting (UK) Limited | Mineral Resources and Mineral Reserves, Collahuasi Copper Mine - Main Report |
| · | Nicolas Zegpi (MSc, Senior Geotechnical Engineer), in relation to the open pit geotechnics providing input into the geotech review led by Max Brown. |
| · | Jose Luis Quiroga M.Sc., Principal Civil Engineer), in relation to the tailings infrastructure providing input into the Tailings management review led by Richard Martindale. |
| · | Alex Flores (Senior Civil Geographer Engineer), in relation to the environmental, social and governance aspects, visiting both the mine, processing and port facilities. |
| · | Tim Lucks (Ph.D, MAusIMM(CP)) overall Project Review. |
| 2.4 | Forward-Looking Statements |
This Technical Report contains “forward-looking information” or “forward-looking statements” that involve several risks and uncertainties. Forward-looking information and forward-looking statements include, but are not limited to, statements with respect to the future prices of metals, the estimation of Mineral Resources and Mineral Reserves, the realisation of mineral estimates, the timing and amount of estimated future production, costs of production, capital expenditures, costs and timing of the development of new mineral deposits, success of exploration activities, permitting time lines, LoM, rates of production, annual revenues, currency fluctuations, requirements for additional capital, and government regulation of mining operations.
Often, but not always, forward-looking statements can be identified by the use of words such as “plans”, “expects”, or “does not expect”, “is expected”, “budget”, “scheduled”, “estimates”, “forecasts”, “intends”, “anticipates”, or “does not anticipate”, or “believes”, or variations of such words and phrases or state that certain actions, events or results “may”, “could”, “would”, “might” or “will” be taken, occur or be achieved. Forward-looking statements are based on the opinions, estimates and assumptions of contributors to this report. Certain key assumptions are discussed in more detail herein.
Forward-looking statements involve known and unknown risks, uncertainties and other factors which may cause actual results, performance or achievements to be materially different from any other future results, performance or achievements expressed or implied by the forward-looking statements.
Such factors include, among others: fluctuations in metal prices, risks arising from an inflationary environment and the impact on operating costs and other financial metrics, including risks of recession; the commencement, continuation or escalation of geopolitical crises, changes in tax, tariff and royalty regimes, operations, or financial condition; operational risks inherent in the mining industry; the speculative nature of mineral exploration, development and production, including changes in mineral production performance, exploitation and exploration results; dependence on continually developing, replacing and expanding its Mineral Reserves; risks that quantities or grades of Mineral Reserves will be diminished, and that Mineral Resources may not be converted to Mineral Reserves; competition in the mining industry; risks related to the financial results of operations, changes in interest rates, and the ability to finance operations; risks related to managing environmental and social matters, including risks and obligations related to closure of the asset; fluctuations in foreign exchange rates; possible inaccurate estimates relating to future production, operating costs and other costs for operations; as well as those risk factors discussed or referred to in this report.
| November 2025 | ||
| Page |
| SRK Consulting (UK) Limited | Mineral Resources and Mineral Reserves, Collahuasi Copper Mine - Main Report |
| ITEM 3 | RELIANCE ON OTHER EXPERTS |
| 3.1 | Legal Title |
The QPs have relied on CMDIC for the information relating to the relevant permits and surface rights disclosure, where it is not available in the public domain.
| 3.2 | Environmental, Social and Governance |
The QP taking responsibility for ITEM 4, ITEM 5 and ITEM 20 has relied upon Ms Harris (MSc, CEnv, MIEMA) to prepare the parts of ITEM 4, ITEM 5 and ITEM 20, that relate to legal and environmental matters. Ms Harris is a Chartered Environmental professional with 18 years experience in the mining industry.
| 3.3 | Taxation |
The QP relied on CMDIC for all matters relating to taxation and how it is applied in the economic analysis used to support the declaration of Mineral Reserves. Changes or inaccuracies in taxation may impact the profitability of the operation, however it is not considered material to the declaration of Mineral Reserves.
| November 2025 | ||
| Page |
| SRK Consulting (UK) Limited | Mineral Resources and Mineral Reserves, Collahuasi Copper Mine - Main Report |
| ITEM 4 | PROPERTY DESCRIPTION AND LOCATION |
| 4.1 | Property Description and Ownership |
CMDIC is owned by subsidiaries of Anglo American (44%), subsidiaries of Glencore plc (44%) and a consortium of Japanese companies led by Mitsui & Co. Ltd. (12%).
CMDIC’s mining and processing operations consist of a cluster of high-altitude open pit mines, processing and tailings facilities located at 4,400 masl. The office and camp sites are located a short distance from the mine at 3,800 masl. The main mine in operation is the Rosario pit. The original pit where the operations started, Ujina, is not currently in production but is part of the Life of Mine (LoM) plan (LoMP).
The mine site processing infrastructure consists of a primary crushing facility located adjacent to the Rosario pit. Crushed ore is then transported by conveyor to the Ujina plant for milling and flotation, to produce a copper concentrate, which also contains molybdenum. The current production capacity of 170 ktpd was achieved in 2018 with the installation of the fifth ball mill (processing crushed SAG mill pebbles) and additional rougher flotation cells.
The concentrate is transported via two pipelines to the port at Punta Patache, and processed through the molybdenum concentrate plant. The concentrates are filtered and stockpiled, and either loaded to ocean going vessels for international sales or into trucks for sales in-country.
| 4.2 | Location |
Collahuasi is located in the Tarapacá Region of Chile (Figure 4-1), in the Andean cordillera, approximately 5 to 10 km from the border with Bolivia, 185 km SE of Iquique.
The port facilities, including the molybdenum recovery plant, copper concentrate filter plant, concentrate storage facilities and marine terminal, are located at Punta Patache approximately 80 km south of Iquique and are nominally at sea level.
| November 2025 | ||
| Page |
| SRK Consulting (UK) Limited | Mineral Resources and Mineral Reserves, Collahuasi Copper Mine - Main Report |
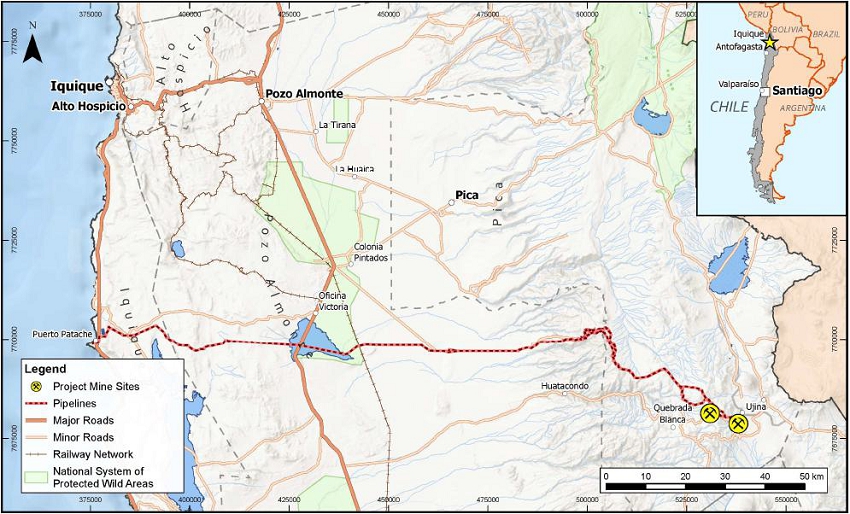
Figure 4-1: CMDIC location map (SRK, 2025)
| November 2025 | ||
| Page |
| SRK Consulting (UK) Limited | Mineral Resources and Mineral Reserves, Collahuasi Copper Mine - Main Report |
| 4.3 | Mineral Rights |
| 4.3.1 | Regulatory framework |
The main legal instruments governing mineral resources in Chile are:
| · | Political Constitution of Chile (Supreme Decree No. 100), 1980 (rev. 2021) |
| · | Constitutional Organic Law on Mining Concessions (Law No 18,097 of January 1982) |
| · | Chilean Mining Code (1983) amended by Law No. 21,420 of February 2022 and by Law No. 21,649 of December 2023) |
The Constitution grants the State absolute and exclusive ownership of minerals. The Law on Mining Concessions establishes two types of mineral concessions; exploration concessions and exploitation concessions. Exploration concessions are issued up to four years and, following recent changes to the law, these concessions can be renewed once for a further four-year term following the submission of geological reports or evidence from the Environmental Impact Assessment System. Exploitation concessions have no time limit. Concession owners maintain validity of the concessions by paying annual patents to the state. There is no depth limit to concessions. The National Geology and Mining Service (SERNAGEOMIN) is the regulatory authority for mining-related activities.
The mineral rights conveyed by concessions are independent from property rights over surface tenements. Mining concession holders have preferred rights to request mining easements to gain access over surface land to establish surface facilities relevant to the exploration or exploitation activities. The easements can either be negotiated and agreed-upon with the surface landowner or granted by Court if no agreement is reached. The Courts grant the easement and set the compensation amount.
The Mining Code states that owners of mining concessions have the right to use waters found within the concession to the extent necessary for exploration or exploitation activities. In addition, other waters are subject to provisions in the Water Code (1981) as amended by Law No 21,435 of April 2022 and regulated by the General Directorate of Water (DGA). The DGA is responsible for granting new water rights (consumptive and non-consumptive) for the supervision of water users and the approval of major hydraulic works. Recent reform has introduced the concept of ‘public interest’ being a requirement for granting new water rights, and also that water rights are subject to termination through harm to the sustainability of the source.
In parallel with legislative requirements, Chile's National Mining Policy (Política Nacional Minera 2050, or PNM 2050) is a strategic framework designed to guide the development of the mining sector in Chile through 2050. It was officially launched in January 2022 and aims to ensure that mining contributes to sustainability, promoting responsible mining practices, reducing greenhouse gas emissions, improving water efficiency and managing waste effectively. The policy also aims to strengthen Chile's position as a leading mining country by fostering innovation, technology adoption, and investment in research and development, while also promoting social inclusion and economic growth.
The policy sets specific sustainability goals to be achieved by 2050, including:
| · | Achieving carbon neutrality in the mining sector; |
| November 2025 | ||
| Page |
| SRK Consulting (UK) Limited | Mineral Resources and Mineral Reserves, Collahuasi Copper Mine - Main Report |
| · | Reducing water consumption by 50%; |
| · | Increasing the use of seawater in mining operations; and |
| · | Enhancing recycling and circular economy practices for mining waste. |
The policy also emphasizes collaboration among government agencies, mining companies, local communities, Indigenous groups, and environmental organizations and promotes transparency and accountability.
| 4.3.2 | Concession status |
The Collahuasi mining property consists of 681 current exploitation concessions, covering 230,129 hectares and 98 exploration concessions covering 43,000 hectares. In addition, there are 38 SCM Michincha exploitation concessions (50% CMDIC and 50% Quebrada Blanca) covering 22,800 hectares. All of these exploitation and exploration concessions are located in the municipalities of Iquique, Pica, Pozo Almonte, and Calama.
Table 4-1: Summary of CMDIC mining concessions
| Property | No. of concessions | Surface Area (ha) |
| Mine Site | 32 | 32,542 |
| Calama: Infrastructure | 1 | 2,495 |
| Iquique: Infrastructure | 19 | 2,609 |
| Pozo Almonte: Infrastructure | 179 | 56,234 |
| Pozo Almonte: Future Infrastructure | 13 | 2,532 |
| Pozo Almonte: Environmental Compensation | 2 | 1,202 |
| Calama | 16 | 3,955 |
| Iquique | 16 | 2,276 |
| Pozo Almonte | 403 | 126,284 |
| Total CMDIC rights | 681 | 230,129 |
| Exploration Concessions | 96 | 43,000 |
| SCM Michincha (50% ownership) | 38 | 22,800 |
| Total | 295,929 |
The reported Mineral Resources and Mineral Reserves are located within CMDIC mining concessions (Figure 4-2). CMDIC holds the necessary mining licences and title deeds required by Chilean law.
Figure 4-2 shows the general layout of CMDIC mining claims. The mining concessions for these areas were granted on 20 December 2001. Figure 4-2 presents the surface area for each mining concession.
To the knowledge of the authors, the mining concessions listed are in good standing and constitute all of the mineral rights that are required to permit exploitation of the deposit for which Mineral Reserves and Mineral Resources are being stated in this report.
| November 2025 | ||
| Page |
| SRK Consulting (UK) Limited | Mineral Resources and Mineral Reserves, Collahuasi Copper Mine - Main Report |
Table 4-2: Concession name and surface area
| Concession name | Surface Area (ha) |
Year | Resources | Reserves | Deposit |
| ALEMANIA 1/10 | 10 | 1994 | |||
| ARGELIA 1/448 | 448 | 1994 | |||
| AUSTRIA 1/391 | 782 | 1994 | |||
| ALBANIA 1/413 | 702 | 1994 | |||
| BULGARIA 1/364 | 725 | 1994 | X | X | Rosario |
| BRASIL 1/225 | 364 | 1994 | |||
| BAHAMAS 1/150 | 750 | 1994 | |||
| BIRMANIA 1/150 | 750 | 1994 | X | X | Rosario |
| BERMUDAS 1/150 | 750 | 1994 | |||
| BELGICA 1/152 | 760 | 1994 | |||
| CANADA 1/180 | 900 | 1994 | X | X | Rosario |
| CEILAN 1/180 | 900 | 1994 | X | X | Rosario |
| COREA 1/180 | 900 | 1994 | X | X | Rosario - Rosario Sur |
| CHINA 1/180 | 900 | 1994 | X | Rosario | |
| SALVADOR 1/194 | 970 | 1994 | |||
| SIRIA 1/200 | 1,000 | 1994 | X | X | Ujina |
| SOMALIA 1/200 | 1,000 | 1994 | X | X | Ujina |
| SUIZA 1/200 | 1,000 | 1994 | X | Ujina | |
| SUMATRA 1/200 | 1,000 | 1994 | |||
| SUECIA 1/192 | 960 | 1994 | |||
| BAMBINO 1-377 | 1,796 | 1984 | X | X | Rosario |
| TRINIDAD II 1-168 | 1,018 | 1984 | X | Rosario | |
| AGUILUCHO 1-909 | 4,522 | 1984 | |||
| CHIGLIA 1-100 | 500 | 1984 | |||
| COMINCO 1-284 | 1,418 | 1984 | |||
| GIAN 1-20 | 200 | 1984 | |||
| MARIA ANGELICA II 1-1864 | 2,597 | 1984 | |||
| MARIA PAZ 1-864 | 4,320 | 1984 | |||
| OROPEL 1-10 | 100 | 1984 | |||
| OROPEL 11-30 | 200 | 1984 | |||
| OROPEL 31-40 | 100 | 1984 | |||
| PIETRO 1-20 | 200 | 1984 | |||
| TOTAL | 32,542 |
| November 2025 | ||
| Page |
| SRK Consulting (UK) Limited | Mineral Resources and Mineral Reserves, Collahuasi Copper Mine - Main Report |
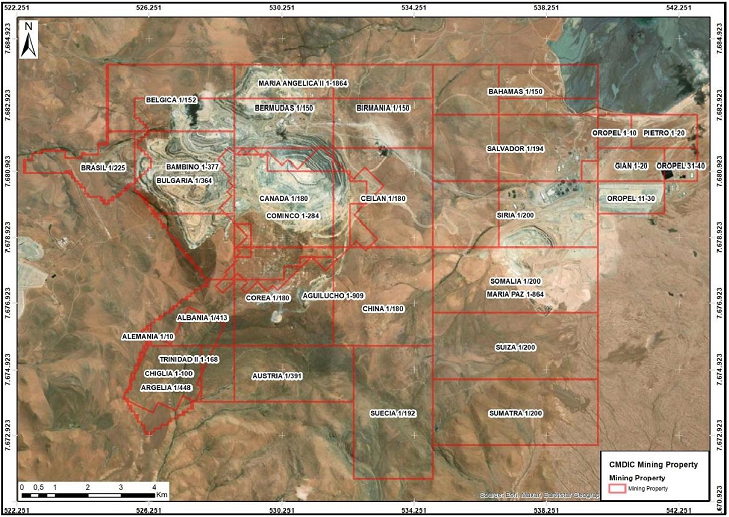
Figure 4-2: CMDIC mining concessions (SRK, 2025)
| 4.3.3 | Surface rights |
CMDIC is the owner of a series of superficial rights that cover a surface of 15,303.63 hectares. These rights cover the areas of the Ujina and Rosario deposits, the tailings storage facility (TSF), the current mine infrastructure, the evaporation ponds, the port area, the dissipation stations for the concentrate pipeline and other areas that relate to water extraction areas in Huasco and Quebrada Caya. These areas are located within the municipalities of Pica and Pozo Almonte and their surface areas are presented in Table 4-3. CMDIC also rents state owned areas that cover a surface area of 29.26 hectares which incorporates telecommunication installations and access roads for the operation.
Table 4-3: Surface Rights for CMDIC infrastructure and mine lots
| Sector | Surface Area (ha) |
| Mine area | 14,191.28 |
| Evaporation and forestation pools | 225.24 |
| Port area | 122.39 |
| Dissipation stations for concentrate pipeline | 10.31 |
| Huasco area | 223.00 |
| Quebrada Caya area | 531.41 |
| 4.3.4 | Water rights |
Water rights have been issued to CMDIC via 20 permissions covering a total of 1,212.9 L/s of water from the Coposa basin and Michincha basin (Table 4-4). The permissions are permanent and do not expire; however, in accordance with the Water Code, they can be withdrawn by the regulatory authority under certain conditions.
| November 2025 | ||
| Page |
| SRK Consulting (UK) Limited | Mineral Resources and Mineral Reserves, Collahuasi Copper Mine - Main Report |
CMDIC owns rights to use 867 L/s of underground water in the Coposa basin and 345.9 L/s from the Michincha basin. These volumes are sufficient to support the permitted abstraction volumes from the relevant water supply wells (Section 18.4).
Table 4-4: CMDIC Water Rights
| Company | DGA Resolution | Well ID | Basin | Authorised quantity (L/s) |
| CMDIC | Resolución_DGA_N°_592 | CWP-11 | Coposa | 125 |
| CMDIC | Resolución_DGA_N°_844 | CWP-8A | Coposa | 127 |
| CMDIC | Resolución_N°387 | CWP-2 | Coposa | 70 |
| CMDIC | Resolución_N°388 | CWP-3 | Coposa | 66 |
| CMDIC | Resolución_N°389 | CWP-12 | Coposa | 12 |
| CMDIC | Resolución_N°389 | CWP-14 | Coposa | 55 |
| CMDIC | Resolución_N°390 | CWP-10 | Coposa | 109 |
| CMDIC | Resolución_N°390 | CWP-13 | Coposa | 130 |
| CMDIC | Resolución_N°391 | CWP-5 | Coposa | 80 |
| CMDIC | Resolución_N°391 | CWP-6 | Coposa | 13 |
| CMDIC | Resolución_N°392 | CWP-7 | Coposa | 80 |
| CMDIC | Vicepres_Legal-#265-v1-Resolución_DGA_N°_1 | M-10 (P6) | Michincha | 135 |
| CMDIC | Vicepres_Legal-#265-v1-Resolución_DGA_N°_1 | S1 (P2) | Michincha | 50 |
| CMDIC | Vicepres_Legal-#265-v1-Resolución_DGA_N°_1 | S2 (M2) | Michincha | 39.4 |
| CMDIC | Vicepres_Legal-#265-v1-Resolución_DGA_N°_1 | S3 (P1) | Michincha | 50 |
| CMDIC | Vicepres_Legal-#265-v1-Resolución_DGA_N°_1 | S4 (P4) | Michincha | 50 |
| CMDIC | Vicepres_Legal-#265-v1-Resolución_DGA_N°_1 | S5 (M12) | Michincha | 4.1 |
| CMDIC | Vicepres_Legal-#265-v1-Resolución_DGA_N°_1 | S7 (M20) | Michincha | 12.1 |
| CMDIC | Vicepres_Legal-#265-v1-Resolución_DGA_N°_1 | S8 (M17) | Michincha | 5.3 |
| Total | 1,212.9 |
| 4.4 | Property Boundaries and Mine Site Layout |
The property boundaries were located based on extensive surface mapping and geophysical survey, identifying the extent of the mineralized areas. Condemnation drilling was also conducted to define facilities sites.
Figure 4-3 is a satellite image showing the area of operations including the open pits, the tailings storage facility, the waste dumps, the concentrator, the leach pads and the SX-EW plant.
| November 2025 | ||
| Page |
| SRK Consulting (UK) Limited | Mineral Resources and Mineral Reserves, Collahuasi Copper Mine - Main Report |
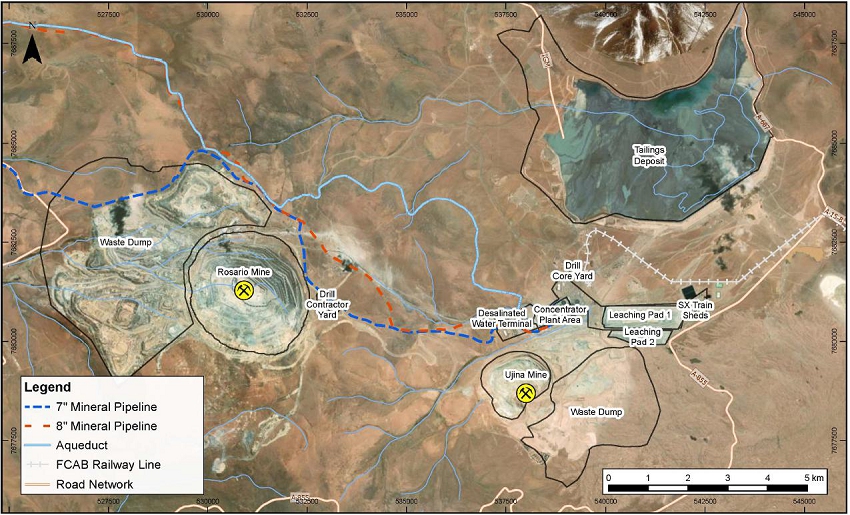
Figure 4-3: CMDIC mining operation layout (SRK, 2025)
| November 2025 | ||
| Page |
| SRK Consulting (UK) Limited | Mineral Resources and Mineral Reserves, Collahuasi Copper Mine - Main Report |
| 4.5 | Environmental Approvals |
| 4.5.1 | Regulatory framework |
Chile has a comprehensive regulatory framework governing environmental approvals. The key legislation pertinent to environmental approvals are:
| · | The Environmental Framework Law (Law No 19,300 of 1994), as amended. |
| · | Environmental Impact Assessment System Regulation (Supreme decree No 40/2012) |
The main agencies overseeing environmental issues are the Ministry of Environment, Environmental Evaluation Service (Servicio de Evaluación Ambiental or SEA) which evaluates and approves new projects, and the Superintendence of the Environment (Superintendencia del Medio Ambiente or SMA) which enforces compliance with environmental regulations.
Environmental Permits
The Environmental Impact Evaluation System (Sistema de Evaluación de Impacto Ambiental, or SEIA) was established in 1994 with the enactment of Law 19.300 and is administered by the SEA. Projects in Chile are subject to environmental review by the SEA and can be approved via three mechanisms, as follows:
The SEIA was established in 1994 with the enactment of Law 19.300. The implementing regulations have been amended more than once since then as the system has evolved. The SEIA isand is administered by the Environmental Evaluation Service (Servicio de Evaluación Ambiental, or SEA).
Projects in Chile are subject to environmental review by the SEA and can be approved via three mechanisms, as follows:
| · | A Consulta de Pertinencia de Ingreso (or Pertinencia) is a document prepared for small projects or minor modifications to existing projects, which demonstrates that the effects of the proposed action are below the threshold requiring formal environmental review. |
| · | An Environmental Impact Declaration (Declaración de Impacto Ambiental, or DIA) is required to be submitted by the proponent for projects or project modifications that are significant enough to warrant environmental review, but which are not expected to result in ‘significant’ environmental impacts, as legally defined. |
| · | An Environmental Impact Study (Estudio de Impacto Ambiental, or EIA) is required to be submitted by the proponent for projects or project modifications where significant environmental impacts are expected to occur, and where specific measures for impact avoidance, mitigation or compensation will need to be agreed upon. |
In the case of EIA (and some DIA), the SEA conducts formal public consultation on the application to inform the decision of approval. Following review, the SEA provides approval by issuing an Environmental Qualification Resolution (Resolución de Calificación Ambiental, RCA). RCA can run to several hundred pages in length for complex projects and usually contain numerous conditions of approval related to both environmental and social aspects of project development that must be adhered to by the project proponent during all phases of the project life cycle.
| November 2025 | ||
| Page |
| SRK Consulting (UK) Limited | Mineral Resources and Mineral Reserves, Collahuasi Copper Mine - Main Report |
The processing times are 90 working days for a DIA and 180 working days for an EIA; however, suspensions to the timeline are introduced for companies to respond to questions from the authorities, therefore, the total timelines will depend on the length of the suspension periods. Pertinencias do not have a fixed time but commonly take two to three months.
Sectoral permits
Following issue of the RCA, there are several environmental sectoral permits (PAS) that a project will require. The Environmental Impact Assessment Regulation (S.D. N°40/2013) defines two types of sectoral permits:
| · | Permits relating to environmental matters: These permits are approved with the RCA. The proponent needs to show the correspondent sectoral public agency the RCA, and the agency must give the permit approval. |
| · | Permits relating to both environmental and non-environmental matters: For these permits, the RCA guarantees that the project complies with the environmental requirements of the permit. The non-environmental requirements can be submitted to the correspondent sectoral public agency during the SEIA process but cannot be granted until the RCA is in place. |
Importantly, once the project has been approved by SEA and issued with an RCA, no PAS may be denied for environmental reasons. The sectoral public agencies are not entitled to review the RCA environmental conditions or reject a PAS due to the infringement of environmental requirements. The PAS may, notwithstanding, be denied for non-environmental reasons, such as the noncompliance of technical, engineering or safety standards, etc.
On 29 September 2025, the Sectoral Authorization Framework Law (LMAS) officially entered into force in Chilean law. This legislation constitutes a structural reform intended to modernize the management of sectoral permits and expedite the execution of investment projects in the country. One of the main objectives is to reduce wait times by 30% to 70% without compromising regulatory standards or environmental requirements, facilitating the realization of public and private investment projects. The law introduces a timeframe for issuing various relevant regulatory instruments and project owners with a favorable RCA will be provided with a stable regulatory regime of up to 8 years. This guarantees that the regulatory conditions in force at the time of entry into the SEIA will be maintained, unless there is a modification for reasons of urgent public interest.
| 4.5.2 | Permitting status |
Following the submission of an initial EIA, the first environmental approval for the operation was issued in 1995. Since this approval a further three EIA and 28 DIA have been submitted to secure approval for expansions and associated increases in processing capacities, namely: 110 ktpd in 2001, 133 ktpd in 2003, 170 ktpd in 2010, and most recently 210 ktpd in 2021.
| November 2025 | ||
| Page |
| SRK Consulting (UK) Limited | Mineral Resources and Mineral Reserves, Collahuasi Copper Mine - Main Report |
An EIA was submitted in 2019 to inform the current primary environmental approval for the operation. Resolución Extenta No. 20219900112 (‘2021 RCA’) was issued in 2021 and expires in 2041. The approval includes the continued mining of Rosario pit and expansion of waste rock dump to 6,328 Mt total capacity, construction of Rosario South waste rock dump of 377 Mt capacity, increase in processing capacity to 210 ktpd and expansion of Pampa Pabellón TSF to 2,329 Mt. In addition, the approval includes the construction and operation of a desalination plant and pipeline from the coast to the mine to transport desalinated seawater as an alternative water supply, leading to a reduction in water abstraction from continental groundwater aquifers. A pipeline to convey water from Quebrada Blanca to Collahuasi is also permitted.
The approval document describes the permitted project, the anticipated impacts and several hundred conditions, or commitments, that must be adhered to. The commitments represent: mitigation and compensation measures arising from the EIA process, mainly in relation to water management, biodiversity and archaeology; social commitments made with indigenous associations and community groups; monitoring requirements; legal requirements that apply to the project; and voluntary environmental commitments made by the operator.
CMDIC obtains and manages more than 350 sectoral environmental permits for the operation. The 2021 RCA provided several sectoral permits for the planned activities. The remaining required permits are in the process of being obtained and are due to be in place by end of 2027.
Since the 2021 RCA was issued, CMDIC has conducted two further DIA for amendments to the operation and received approvals in 2023 and 2024. A third DIA is in progress to modify electricity lines, roads and pipelines within the site and to permit the mining of waste from Ujina pit for the construction of the tailings facility walls. This latter activity is necessary as mining from the Ujina pit was not included in the application for the 2021 RCA. Mining at Ujina is permitted through Res. Ex. No. 027/2018, which expires in 2027. The new DIA is scheduled for submission in Q1 2026 with approval anticipated in Q1 2027.
CMDIC is also preparing for a subsequent EIA for the future ACP growth phase of the operation, as shown in Figure 4-4. The ACP Growth project includes mining from Rosario and Ujina pits beyond 2041 (black outline), expansion of waste rock facilities for Rosario and Ujina (orange outlines), an increased production rate of 370 ktpd and further expansion of the Pampa Pabellón tailings facility to 5,700 Mt (yellow outline). The EIA is in progress, in parallel with project engineering, and is scheduled for completion in Q2 2027 with approval anticipated to be in place by 2030. SRK notes that that even without the ACP Growth phase project being implemented, the TSF will still require expansion (with associated engineering studies, validation analyses and updated permits) to continue to support the Mineral Reserves case.
| November 2025 | ||
| Page |
| SRK Consulting (UK) Limited | Mineral Resources and Mineral Reserves, Collahuasi Copper Mine - Main Report |
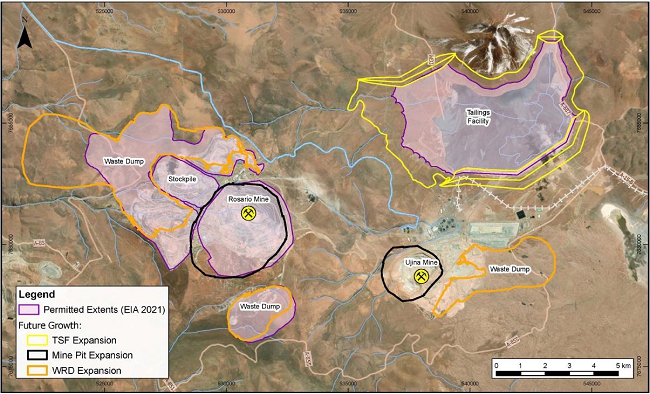
Figure 4-4: Currently permitted footprint (purple) and unpermitted expanded footprint for future ACP Growth Project (SRK, 2025)
| 4.5.3 | Compliance |
Compliance with commitments resulting from primary and sectoral environmental authorisations are recorded in a register and are actively managed and monitored. As of August 2025, the operation was managing 7,224 commitments, of which 2,976 were auditable. Of the auditable commitments, CMDIC reported that 71% were in compliance and 28% were under revision and 1% were non-compliant.
Environmental monitoring and verification mechanisms are in place, with an emphasis on participatory monitoring with local communities, online platforms shared with the authorities, and ecological restoration measures. Internal audits, most recently completed in June 2025, continue to identify non-compliances and corrective actions plans are established to address the non-compliances.
CMDIC is progressing with a Compliance Programme approved by the SMA in 2022 following the identification of 14 charges against the operation and 66 action points that required addressing. Progress with the Compliance Programme is reported to SMA on a quarterly basis and was 98% completed at the end of 2024. The programme is due to be completed by the end of 2025. Through implementation of the compliance programme, CDMIC has been collaborating with the Coposa community to strengthen the participatory monitoring programme and transparency relating to the results of environmental monitoring programmes.
| 4.6 | Environmental Liabilities |
The latest Mine Closure Plan was submitted in 2021 and the valuation of the plan was approved in March 2023 (Res. Ex. No. 0324). This closure plan is an update of the previous plan, approved in 2015 and includes all existing activities across the mine, pipeline and port as well as the new activities approved in the 2021 RCA. The closure cost was estimated at UF17m 1 (as of 23 August 2021) which equated to USD656m. The quantum of financial guarantee was calculated in line with legal requirements and CMDIC provides annual contributions via a combination of permitted instruments which are selected at the time that each provision is made.
1 UF (Unidad de Fomento) is a Chilean Unit of Account. It is not a physical currency but an inflation-indexed unit that adjusts daily based on the Consumer Price Index. Source: https://www.instarem.com/currencies/clf-chilean-unit-of-account
| November 2025 | ||
| Page |
| SRK Consulting (UK) Limited | Mineral Resources and Mineral Reserves, Collahuasi Copper Mine - Main Report |
| ITEM 5 | ACCESSIBILITY, CLIMATE, LOCAL RESOURCES, INFRASTRUCTURE AND PHYSIOGRAPHY |
| 5.1 | Accessibility |
The Collahuasi mining activities are located approximately 185 km SE of Iquique in Northern Chile at elevations between 4,200 and 4,800 masl.
The site can be accessed by national roads or via air. Typically, personnel will arrive to Iquique and be transported to site by road (approximately 3 hours) or will be flown into Coposa Airport (IATA: CPP, ICAO: SCKP) which also serves the Pica commune in the Tarapacá Region of Chile and is 25 km from Collahuasi. The privately operated, narrow gauge Antofagasta (Chili) & Bolivia Railway (or FCAB) reaches Collahuasi via a spur but is not used.
| 5.2 | Infrastructure and Facilities |
Collahuasi is an operating mine. The mine site facilities include two open pits (Ujina, and Rosario), an oxide treatment plant and heap leach (planned to be decommissioned), sulphide concentrator and comprehensive infrastructure including a permanent camp.
The complex includes two concentrate slurry pipelines with 203 km in length and diameters of 8” and 7”. The port facilities, including the molybdenum recovery plant, copper concentrate filter plant, concentrate storage facilities and marine terminal are located at Punta Patache which is approximately 80 km south of Iquique, nominally at sea level.
The operation has completed the construction of a water pipeline, which is currently under commissioning, with construction of a desalination plant at the port of Punta Patache due to be operational by June 2026, to transport water from the coast to the mine.
| 5.3 | Environmental and Social Setting |
| 5.3.1 | Mine site |
The mine site is in a topographic depression between the Western Cordillera range to the east, a chain of active and extinct volcanoes that form the international border with Bolivia, and the Precordillera range to the west. The Precordillera acts as a hydrological boundary, separating the streams that drain eastward into the endorheic (closed) Coposa and Michincha basins, and those that drain westward into the Intermediate Depression.
The mine is at the southern extent of the Tarapacá Region, in the Tamarugal Province and Pica Commune. The social setting of the mine is rural in nature and comprises of three areas; the Salar del Huasco settlement and land use by several indigenous groups to the north of the operation, settlements associated with the Huatacondo Ravine located to the west and SW including Chiglla, Copaquire, Huatacondo, and Tamentica, and settlements from the Ollagüe commune (Antofagasta Region) located to SE of the operation (Figure 5-1).
| November 2025 | ||
| Page |
| SRK Consulting (UK) Limited | Mineral Resources and Mineral Reserves, Collahuasi Copper Mine - Main Report |
The inhabitants of Salar del Huasco are members of the Laguna del Huasco Aymara Indigenous Association, the Alca Indigenous Community, and the Hijos de Willq'e Indigenous Association. Member of other indigenous groups visit the Cordillera region to participate in traditional activities (such as livestock grazing) but do not reside there. These groups include Yabricollita and Caya Aymara Indigenous Association, Naciente Collahuasi Aymara Indigenous Association and Salar de Coposa Aymara Indigenous Association. Areas of community land use are shown on Figure 5-1.
Archaeological sites of importance have been identified in areas impacted by current or planned operations. Mitigation plans have been developed to excavate, study and document the most important sites and protection measures (e.g. fences) have been installed to protect significant sites within a 50 m buffer of activities.
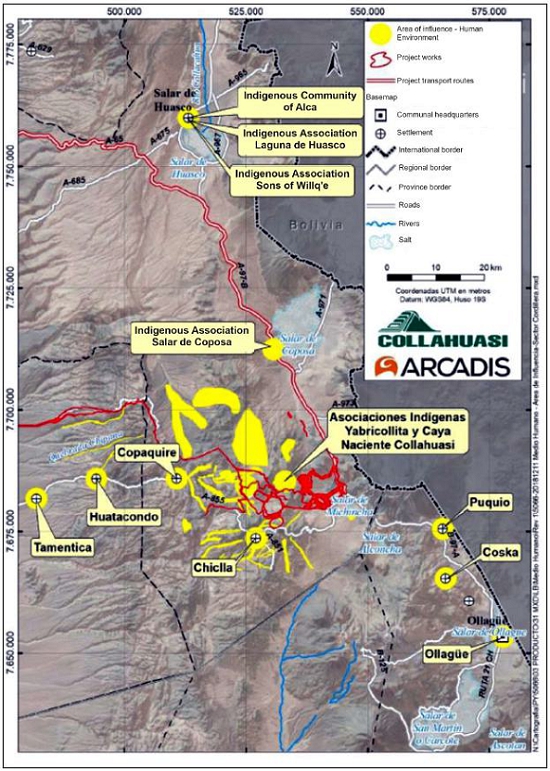
Figure 5-1: Communities and land use around mine site (Arcadis, 2018)
| November 2025 | ||
| Page |
| SRK Consulting (UK) Limited | Mineral Resources and Mineral Reserves, Collahuasi Copper Mine - Main Report |
Climate
The Collahuasi mine site area encompasses high Andean (Altiplanic) basins, characterized by arid to semi-arid climate. Average temperatures vary with altitude; at the highest elevations near Rosario pit the range is from 3.8°C in January to -1.7°C in June with temperatures increasing as the elevation decreases. The prevailing wind direction is generally from the west.
Precipitation is concentrated in the austral summer months (December to March). Annual precipitation varies with elevation, ranging from almost zero at the port to between 150 and 200 mm in the basins surrounding the mine. Most rainfall occurs as intense, short-duration convective storms. Evaporation rates are high, with annual potential evaporation in the Cordillera sector around 1500 to 1700 mm/year, exceeding precipitation by almost an order of magnitude. Maximum daily precipitation (24-hour events) for a 10-year return period is about 40 mm in the Cordillera sector with the highest recorded 24-hour precipitation at Ujina being 60 mm.
Climate change projections under the RCP 8.5, worst-case scenario, suggest a possible reduction in annual precipitation of 2% for the near future (2020-2035) to 6% for the intermediate future (2035-2050) compared to the 1985–2005 baseline, with some models indicating up to a 20% decrease; however, the trend is not robust across all models, and some predict slight increases. Temperature is expected to rise, by an average of 1.4°C for the period 2023–2100 compared to the period of 1993–2020. Evaporation and recharge have been estimated under climate change projections for the same periods, indicating an increase in evaporation of up to 7% and a decrease in recharge ranging of around 16-17% for the Coposa and Michincha basins.
Water resources
The principal catchments in the Collahuasi area are the endorheic (closed) Coposa and Michincha basins, and a set of exorheic (open) sub-basins draining west and south collectively referred to as the Pacific Slope basins. Surface water flows in the region are generally ephemeral, with most streams dry for much of the year, and permanent or semi-permanent flows restricted to certain streams (quebradas) and groundwater-fed wetlands (vegas and bofedales). Peak flows occur during the austral summer (December to March), with flash floods possible during intense convective storms. Various springs and wetlands represent the only sources of perennial water in the area, increasing their importance for water dependent ecosystems and local communities for traditional cultural and pastoral activities.
The hydrogeology of the Coposa and Michincha basins comprises a deep aquifer in fractured ignimbrite and associated volcanosedimentary and evaporitic units, overlain by a shallow aquifer of unconsolidated alluvial and evaporitic sediments. The deep aquifer can exhibit high permeability (over 100 m/d) in fractured zones and along faults (notably the Pabellón and Michincha faults); but lower permeabilities in the order of 0.01 m/d elsewhere (Arcadis, 2018). The shallow aquifer has variable, generally lower permeability and is hydraulically connected to surface features. The Pacific Slope sub-basins are dominated by structurally complex fractured Paleozoic volcanic and intrusive basement rocks, overlain by local alluvial aquifers of limited extent and thickness (generally <20 m). Groundwater flow is primarily through the fractured bedrock, with local springs and wetlands (vegas and bofedales) sustained by upwelling along faults. Ecologically sensitive wetlands have been mapped along several of the watercourses.
| November 2025 | ||
| Page |
| SRK Consulting (UK) Limited | Mineral Resources and Mineral Reserves, Collahuasi Copper Mine - Main Report |
Several groundwater aquifers are protected by the DGA as they feed floodplains and wetlands that sustain agricultural and livestock activities. In the project’s area of influence, these aquifers include Jachucoposa, Coposito and Chusquina in the Coposa basin; and Yabricollita, Ujina, Represa, Mal Paso, and Michincha in the Michincha basin. Groundwater exploration or groundwater use rights cannot be established in these areas without a prior favourable environmental assessment. Protected aquifers and associated springs and wetlands are recognised as environmentally sensitive areas (see ‘Biodiversity and Protected Areas’). In cases where impacts have occurred or are anticipated, mitigation measures are required, including artificial recharge and flow maintenance commitments to protect the aquifers and associated springs and wetlands.
Coposa basin
Runoff in the Coposa basin is centrally inwards to the Salar de Coposa. On the south-western corner of the salar, the Jachucoposa groundwater fed spring and perennial stream feed into the Laguna Jachucoposa, a protected wetland. The mine site is not located within the Coposa basin. However, groundwater is abstracted by CMDIC from several wellfields across the Coposa basin, in the south at Coposa Sur, Portezuelo and Falla Pabellón, and in the north at Coposa Norte. The Coposa basin receives groundwater inflow from the Michincha basin to the south, as well as minor inflows from the east. Outflow mainly occurs via evaporation from the salar, and from water supply abstraction by the mine to a much lesser extent.
Groundwater salinity is generally less than 1000 mg/L total dissolved solids (TDS) in the south around the Pabellón fault (where groundwater from the fresher, deeper aquifer is known to be upwelling) and at the Jachucoposa spring, but rises to over 30,000 mg/L in the north around the Salar de Coposa and north towards the border with Bolivia, due to the influence of evaporite deposits. Surface water TDS can reach 70,000 mg/L in the north of the basin. Sulphate and other major ions mirror this salinity distribution as do some metals. Conversely, the lower-salinity Coposa waters around the Pabellón fault and Jachucoposa spring generally meet common drinking-water benchmarks. Water at the immediate outflow of Jachucoposa spring, which is understood to be recharged from deeper groundwater, is typically within national drinking water quality standards for major ions and metals, albeit salinity is close to the WHO palatability threshold of 1000 mg/L.
Michincha basin
The Ujina pit, the processing plant and TSF are located in the Michincha basin. Runoff in the Michincha basin is approximately west to east to the Salar de Michincha although it is highly modified by mine infrastructure and the TSF. Groundwater in the Michincha basin flows northward toward the Coposa basin and southward toward the Loa basin, with additional outflow westward toward the Pacific slope sub-basins. Besides rainfall, infiltration from the TSF is also considered to be a material source of recharge in the Michincha. The basin is also subject to significant dewatering operations at Ujina pit.
| November 2025 | ||
| Page |
| SRK Consulting (UK) Limited | Mineral Resources and Mineral Reserves, Collahuasi Copper Mine - Main Report |
In the Michincha basin, median groundwater concentrations are for the most part relatively fresh (up to 650 mg/L TDS) but strong evaporative concentration in the lagoons has resulted in surface water salinities of up to 80,000 mg/L. Water quality in the Michincha basin has been altered by seepage from the TSF, WRD and other mine infrastructure. Groundwater wells around the TSF and process ponds have showed a progressive increase in TDS and sulphate since 2007 and show a Na-Cl signature that reflects the tailings and process water (distinct to the natural groundwater across the rest of the basin). During the 2018 baseline update (Arcadis, 2018), groundwater around the TSF was found to be relatively elevated in molybdenum and zinc, compared with concentrations further downgradient. Groundwater around the plant and process ponds shows a similar chemistry, with elevated molybdenum, manganese, copper and zinc in some wells.
Pacific slope basins
The Pacific slope basins include the Huinquintipa and Sallihuinca streams which drain west, as well as the Chiclla, Ceusis, Mal Paso streams draining south. The Rosario open pit and majority of associated WRD are in the Huinquintipa catchment, although part of the WRD extends north and drains into the Sallihuinca. The Huinquintipa and Sallihuinca flow west and merge into the Huatacondo approximately 10 km west of the Rosario WRD. The Quebrada Huinquintipa is the most significant watercourse in the area immediately surrounding the mine in terms of flow, with other streams such as Chiclla and Sallihuinca displaying lower and more variable flows. The sub-basins receive groundwater inflow from Michincha and discharge via surface and subsurface flows to the west.
Water is abstracted by local communities from the Huatacondo river downstream of the mine at the settlement of Copaquire. The water is mainly used for irrigation and agriculture, although one location is used for both irrigation and human consumption. Further downstream again, the settlement of Huatacondo has various water capture, diversion and abstraction infrastructure including ponds and pumps for both irrigation and potable use.
The Quebrada Blanca mine (operated by Teck) is located in the Quebrada Blanca river basin, immediately SW of the Huinquintipa basin, and draining to the south to the Chiclla river. Although the mine sources the majority of its make-up water via a pipeline from a desalination plant on the coast, the mine abstracts groundwater via pit dewatering.
Of the Pacific Slope sub-basins, the Ceusis, Chiclla and Sallihuinca basins are lower salinity (typically up to 400 mg/L TDS) than the Huinquintipa and Mal Paso which are more mineralised (up to 1,400 mg/L), with the Huatacondo downstream showing TDS of up to 2,100 mg/L. Trace solutes are generally low to moderate across most of the sub-basins.
| November 2025 | ||
| Page |
| SRK Consulting (UK) Limited | Mineral Resources and Mineral Reserves, Collahuasi Copper Mine - Main Report |
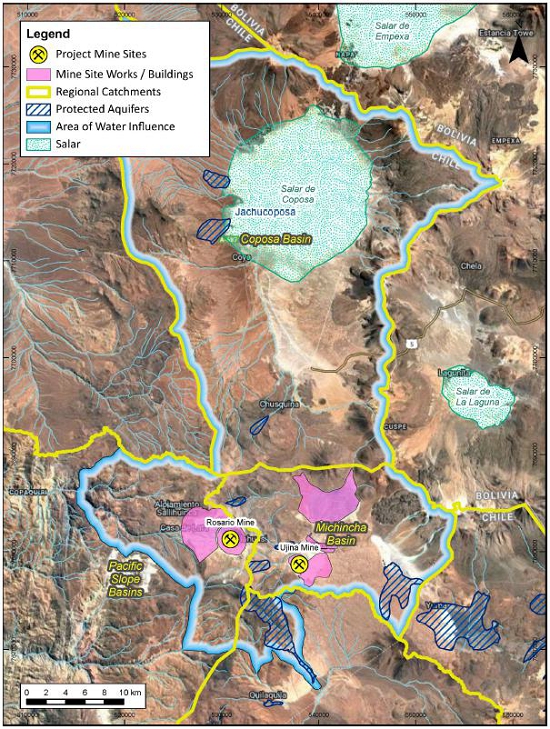
Figure 5-2: Local hydrological features (SRK, 2025)
| November 2025 | ||
| Page |
| SRK Consulting (UK) Limited | Mineral Resources and Mineral Reserves, Collahuasi Copper Mine - Main Report |
Biodiversity and protected areas
Within the project’s area of influence, vegetation is representative of the desert and high Andean steppe region with strong stratification associated with altitude and water availability. The vegetation in the Cordillera sector is relatively homogeneous, represented mainly by grassland formations (pajonales), scrublands and, to a lesser extent, forests (queñoales). Azonal vegetation (wetlands) are found in streams and around the edges of the Michincha and Coposa salares. Bofedales, a type of wetland characteristic of high Andean ecosystems dominated by cushion plants, are of high environmental significance and located in streams to the west of Rosario pit (Huinquintipa, Sallihuinca, Chiclla, Ceusis, and Mal Paso).
The Salar de Michincha and Salar de Coposa are considered priority sites for conservation (2nd priority) through the Regional Biodiversity Strategy of the Tarapacá region. The Salar de Michincha is recognised for species representative of Andean salt flats and the Salar de Coposa is recognised for being a fragile ecosystem, especially home to various species of wild birds and part of the biological corridor for flamingos and other species characteristic of the area. The strategy also recognises that the water balance and functioning of both salt flats is sensitive to the abstraction of water associated with the mining operation.
| 5.3.2 | Pipeline and port |
The settlements located in proximity to the pipeline are Victoria, Colonia Pintados and Cahuiza, which are within the Pozo Almonte commune of the Tamarugal Province. The pipeline route follows a road that crosses Reserva Nacional Pampa Tamarugal. This corridor is designated as a Special Use Zone and is governed by management plans that regulate activities in this area and promote alignment of linear infrastructure along existing impact areas.
The closest communities to Puerto Patache include Caramucho, Chanavayita, Cáñamo, and Chanavaya. These communities are located along the Route 1 coastal highway which is the primary access route to Puerto Patache. This route is also used for transporting copper and molybdenum concentrate and other materials.
The community of La Negra, 400 km to the south in the Antofagasta Region, is also considered to be within the project’s area of influence due to the transportation of copper concentrate through this area to the Alto Norte smelter.
Puerto Patache is located in a desert coastal region with extreme aridity and minimal precipitation. The climatic conditions are characterized by stable hydrodynamic conditions throughout the year, with limited seasonal variation in oceanographic parameters.
The land around Puerto Patache is primarily used for industrial purposes and is devoid of terrestrial vegetation due to the harsh desert conditions; however, the port is adjacent to Punta Patache, a priority conservation site for coastal biodiversity in the Tarapacá region. The coastal area of Punta Patache is justified as a priority site due to its great diversity of local and migratory seabirds, many of which nest in the area, such as the Humboldt Penguin. The offshore area is also important for the presence of marine mammals, as it is an upwelling zone with high primary productivity which allows the coexistence of a significant number of species. The set of physical and environmental attributes allows this area to combine a wide diversity of ecosystems and species, which give it a distinctive and unique value at a regional level (Arcadis, 2018).
| November 2025 | ||
| Page |
| SRK Consulting (UK) Limited | Mineral Resources and Mineral Reserves, Collahuasi Copper Mine - Main Report |
The area surrounding Puerto Patache includes natural attractions of local importance including Playa Cáñamo, Playa Chauca and Playa La Sal, and Lobera Punta Patache which is a site of regional importance. These sites are recognized for their scenic and recreational value, contributing to the region's tourism potential (Arcadis, 2018).
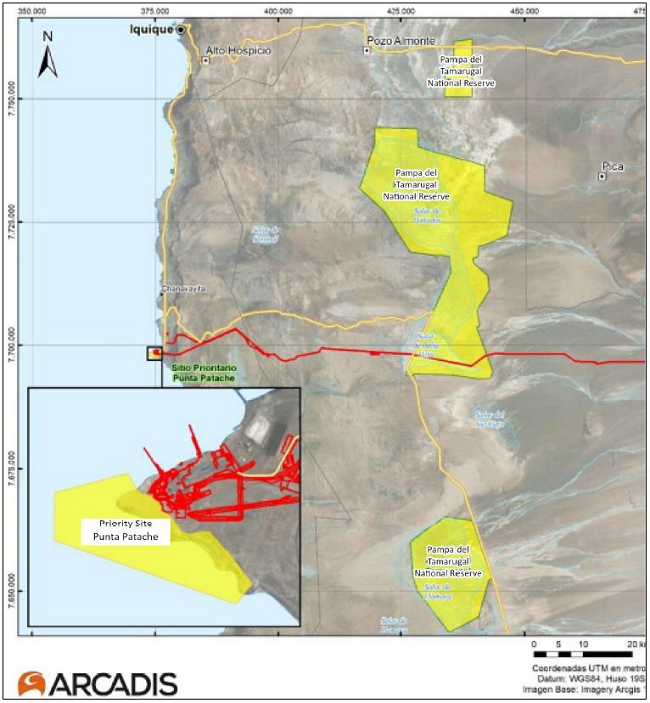
Figure 5-3: Protected areas (pipeline and port) (Arcadis, 2018)
| November 2025 | ||
| Page |
| SRK Consulting (UK) Limited | Mineral Resources and Mineral Reserves, Collahuasi Copper Mine - Main Report |
| ITEM 6 | HISTORY |
The Collahuasi region was initially explored in 1880, with various periods of activity leading up to the discovery of a series of Cu deposits through various geophysical and reconnaissance activities in the early 1990s. Feasibility and environmental impact studies for the Collahuasi project were approved in 1995, with the operations commencing in 1998. Operations have ramped up through a series of phases of expansion from the initial production rate of 60 ktpd, to the current processing capacity of 170 ktpd (mill feed).
Historically the processing of copper mineralisation included both oxide and sulphide process streams, up until the cessation of production from the oxide circuit in Q1 2017, after which only sulphide material has been processed.
The oxide circuit consisted of: three-stage crushing, agglomeration of the ore with sulphuric acid and water before being conveyed to the leach pads, recovery of the pregnant leach solution to the solvent-extraction plant where the copper was stripped using organic solutions; the strip solution was then cleaned using dilute acid and flotation, filtered prior to the electro-winning phase, where the copper was plated onto electrolysis cathodes, before being stripped by the Kidd process on a seven-day cycle. The cathode copper was then transported by road to Iquique for export. In 2005, cathode production accounted for sum 60,700 KtCu, progressively decreasing thereafter to 4,800 KtCu in 2016. In 2014 CMDIC obtained approval to extend the closure of the heap leach facility until 2024. CMDIC currently has no plans to process oxide material.
The sulphide process flowsheet is described in ITEM 17.
Table 6-1 and Table 6-2 presents the latest Mineral resources and Mineral reserves reported for CMDIC, by Anglo American, included in the Anglo American Ore Reserves and Mineral Resources 2024 Report. The Ore Reserve and Mineral Resource estimates are reported in accordance with the Australasian Code for Reporting of Exploration Results, Mineral Resources and Ore Reserves (the JORC Code, 2012). The reported estimates represent 100% of the Ore Reserves and Mineral Resources, of which Anglo American holds 44%.
| November 2025 | ||
| Page |
| SRK Consulting (UK) Limited | Mineral Resources and Mineral Reserves, Collahuasi Copper Mine - Main Report |
Table 6-1: CMDIC Mineral Resources 2024, Anglo American Plc (Source: Ore Reserves and Mineral Resources 2024 Report)
| Item | Tonnage | Grade | Content | ||
| (Mt) | (%TCu) | (%Mo) | (ktTCu) | (ktMo) | |
| Measured | |||||
| Oxide-Mixed Leach | 40.4 | 0.68 | - | 274 | - |
| Sulphide-DF | 34.9 | 0.91 | 0.029 | 319 | 10 |
| Sulphide-LG | 11.4 | 0.48 | 0.015 | 55 | 2 |
| Sulphide-LG s/p | - | - | - | - | - |
| Subtotal | 86.7 | 0.75 | 0.014 | 648 | 12 |
| Indicated | |||||
| Oxide-Mixed Leach | 37.5 | 0.74 | 279 | - | |
| Sulphide-DF | 1,016.5 | 0.90 | 0.033 | 9,133 | 330 |
| Sulphide-LG | 428.8 | 0.47 | 0.014 | 2,019 | 59 |
| Sulphide-LG s/p | - | - | - | - | - |
| Subtotal | 1,482.8 | 0.77 | 0.026 | 11,431 | 389 |
| Measured and Indicated | |||||
| Oxide-Mixed Leach | 77.9 | 0.71 | - | 553 | - |
| Sulphide-DF | 1,051.4 | 0.90 | 0.032 | 9,452 | 340 |
| Sulphide-LG | 440.2 | 0.47 | 0.014 | 2,074 | 61 |
| Sulphide-LG s/p | - | - | - | - | - |
| Subtotal | 1,569.5 | 0.77 | 0.026 | 12,079 | 401 |
| Inferred | |||||
| Oxide ML: in LoM | - | - | - | - | - |
| Oxide ML: ex LoM | 108.2 | 0.51 | - | 554 | - |
| Sulphide-DF: in LoM | 441.8 | 0.96 | 0.007 | 4,251 | 30 |
| Sulphide-DF: ex LoM | 2,422.5 | 0.89 | 0.020 | 21,567 | 490 |
| Sulphide-LG: in LoM | 445.0 | 0.43 | 0.003 | 1,898 | 13 |
| Sulphide-LG: ex LoM | 1,671.8 | 0.48 | 0.011 | 7,983 | 186 |
| Sulphide-LG s/p | - | - | - | - | - |
| Subtotal | 5,089.3 | 0.71 | 0.014 | 36,253 | 719 |
|
Copper Mineral Resources: An optimised pit shell is used as the basis for the test of RPEEE. Mineralised material outside the optimised pit shell is not included in the Mineral Resource statement. Mineral Resources are quoted above the following cut-off grades (%TCu): Collahuasi (sulphide) – 0.60%, Collahuasi (oxide and mixed) – 0.35%, Collahuasi (low-grade sulphide) – 0.30%. DF= Direct Feed, Sulphide-LG = Low-grade sulphide flotation, Sulphide-LG s/p= Low-grade sulphide flotation stockpile, in LOM = Included in LoM plan, ex LoM = excluded or outside of LoM plan. Mineral Resource estimates are reported in accordance with the Australasian Code for Reporting of Exploration Results, Mineral Resources and Ore Reserves (the JORC Code, 2012) |
|||||
| November 2025 | ||
| Page |
| SRK Consulting (UK) Limited | Mineral Resources and Mineral Reserves, Collahuasi Copper Mine - Main Report |
Table 6-2: CMDIC Mineral Reserves 2024, Anglo American Plc (Source: Ore Reserves and Mineral Resources 2024 Report)
| Item | Tonnage | Grade | Content | ||
| (Mt) | (%TCu) | (%Mo) | (ktTCu) | (ktMo) | |
| Proved | |||||
| Sulphide-DF | 673.3 | 1.00 | 0.023 | 6,709 | 156 |
| Sulphide-LG | 124.8 | 0.51 | 0.013 | 634 | 16 |
| Sulphide-LG s/p | - | - | - | - | - |
| Subtotal | 798.1 | 0.92 | 0.022 | 7,343 | 172 |
| Probable | |||||
| Sulphide-DF | 1,983.2 | 0.95 | 0.027 | 18,851 | 542 |
| Sulphide-LG | 1,031.6 | 0.46 | 0.010 | 4,718 | 107 |
| Sulphide-LG s/p | 345.5 | 0.57 | 0.013 | 1,957 | 45 |
| Subtotal | 3,360.3 | 0.76 | 0.021 | 25,526 | 694 |
| Ore Reserves | |||||
| Sulphide-DF | 2,656.5 | 0.96 | 0.026 | 25,560 | 698 |
| Sulphide-LG | 1,156.4 | 0.46 | 0.011 | 5,352 | 123 |
| Sulphide-LG s/p | 345.5 | 0.57 | 0.013 | 1,957 | 45 |
| Total | 4,158.4 | 0.79 | 0.021 | 32,869 | 866 |
|
Copper Ore Reserves: Ore Reserves are directly linked to the LoAP derived from value-based mine planning utilising reasonable legal, environmental, technical and financial assumptions. The consideration of these factors ensures that the most value-accretive ore is sent to the processing plants and underpins the Ore Reserve declarations. Collahuasi – Sulphide flotation: Ore Reserves decrease slightly, primarily due to production. Reserve Life has been reduced as a result of increased annual plant feed following the implementation of the plant expansion project. The average planned plant recovery is 86.0%. Collahuasi – Low-grade sulphide flotation: The average plant recoveries are 84.0% (low-grade sulphide) and 70.0% (low-grade sulphide stockpile). DF= Direct Feed, Sulphide-LG = Low-grade sulphide flotation, Sulphide-LG s/p= Low-grade sulphide flotation stockpile. Ore Reserve estimates are reported in accordance with the Australasian Code for Reporting of Exploration Results, Mineral Resources and Ore Reserves (the JORC Code, 2012) |
|||||
| November 2025 | ||
| Page |
| SRK Consulting (UK) Limited | Mineral Resources and Mineral Reserves, Collahuasi Copper Mine - Main Report |
Table 6-3 presents a summary of the annual production and cost statistics for the period 2019-2024, 2025 to date (9 months to September).
Contained copper in sold copper concentrate has varied between 549 kt and 631 ktpa up to 2024 and overall copper recovery to concentrate has varied between 81.1% and 90.6% over this period, with lower recoveries seen in 2023 and 2024. Contained copper in sold copper concentrate to end-September 2025 was 303 kt.
Figure 6-1 illustrates the total mining of ore and waste (and corresponding strip ratio) between 2019 and September 2025 on a monthly basis which shows a notable increase in the strip ratio from 2023.
It is also noted that during 2024 and 2025 to date notably less ore has been mined than fed to the processing plant with the operations drawing from lower grade stockpiles to supplement the plant feed. This is illustrated in Figure 6-2 which shows the monthly tonnage and copper grade of ore mined compared to plant feed on a monthly basis from 2019 to September 2025 and Figure 6-3 which shows the split of direct feed and stockpile feed to the plant copper recovered to concentrate has been relatively consistent between 2019-2024 but has decreased 2025 to date (end September). There is a notable decrease in copper concentrate grade from mid-2023 with a corresponding decrease in copper concentrate grade which also corresponds with lower copper recoveries (see Figure 6-4 which shows copper feed grade and recovery).
Direct operating costs (mining, including deferred stripping costs, processing and indirects) have varied between USD1,087m and USD1,522m per annum or between USD19.5/t and USD26.5/t milled over the period 2019 to 2024 with higher unit costs seen between 2022 and 2024 (USD777m-USD1,404m excluding deferred stripping, or between USD13.9/t and USD24.5/t milled). During 2025, actual costs to end September including deferred stripping were USD1,194m or USD27.0/t processed (USD993m or USD22.5/t processed excluding deferred stripping).
These costs and unit costs, including deferred stripping costs are illustrated in Figure 6-6 on a monthly basis between 2019 and September 2025 which shows the monthly costs for mining, processing and indirects and unit costs expressed as USD/t mined for mining costs and USD/t processed for processing and indirect costs.
Capital costs (project, sustaining and deferred stripping) have varied between USD720m and USD1,990m per annum between 2019 and 2024 with significant project capital expenditure being incurred in 2023 and 2024. Capital costs to end-September 2025 were USD1,213m. Sustaining capital expenditure (excluding deferred stripping costs) has varied between USD300-500m per annum over the period 2019 to 2024.
C1 Cash Costs are presented in Table 6-3 in USD terms and unit costs per pound payable copper production with direct mining costs adjusted to exclude capitalised deferred stripping costs. Realisation costs include TC/RC, impurity penalties (As in concentrate), metallurgical deductions and freight. By-product credits include revenue from sale of molybdenum concentrate (credits for gold and silver payable in concentrate are excluded). C1 All in Sustaining Costs are also included in Table 6-3 and include stock movements, other costs (including closure costs), deferred stripping and sustaining capital costs and are presented before and after the impact of royalties.
Between 2019 and 2024 C1 Cash Costs (after by-product credits) have varied between USD0.70 and USD1.45/lb payable copper but have increased to USD1.83/lb during 2025 (9 months to September) due to lower copper production. C1 All in Sustaining Costs have varied between USD1.21/lb and USD1.86/lb between 2019 and 2024 before royalties (USD1.31/lb to USD2.18/lb including royalties) but have increased to USD2.71/lb during 2025 to date (USD2.89/lb including royalties).
| November 2025 | ||
| Page |
| SRK Consulting (UK) Limited | Mineral Resources and Mineral Reserves, Collahuasi Copper Mine - Main Report |
Table 6-3: Historical production and costs 2019-2024, 2025 (actuals to September)
| Description | Units | 2019 | 2020 | 2021 | 2022 | 2023 | 2024 |
2025 Actual 9month |
| Mining | ||||||||
| Ore mined | kt | 86,644 | 71,898 | 101,611 | 81,789 | 58,865 | 48,412 | 30,916 |
| Copper grade | %CuT | 0.96% | 1.10% | 0.91% | 1.00% | 1.17% | 1.28% | 1.12% |
| Contained copper | Cu kt | 836 | 787 | 925 | 821 | 689 | 618 | 347 |
| Waste mined | kt | 149,925 | 157,530 | 139,301 | 172,563 | 207,314 | 213,247 | 148,694 |
| Total material mined | kt | 236,569 | 229,428 | 240,913 | 254,352 | 266,178 | 261,659 | 179,610 |
| Strip ratio | w:o | 1.73 | 2.19 | 1.37 | 2.11 | 3.52 | 4.40 | 4.81 |
| Processing | ||||||||
| Ore processed | kt | 54,133 | 55,832 | 55,681 | 57,316 | 57,352 | 60,048 | 44,209 |
| Copper grade | %CuT | 1.19% | 1.24% | 1.25% | 1.11% | 1.17% | 1.15% | 0.92% |
| Contained copper | Cu kt | 645 | 694 | 696 | 637 | 670 | 692 | 405 |
| Molybdenum grade | ppm | 206 | 313 | 292 | 322 | 256 | 233 | 177 |
| Contained Mo | Mo kt | 11 | 18 | 16 | 18 | 15 | 14 | 8 |
| Copper concentrate (pre-Moly & Filter plant) | kt | 2,119 | 2,357 | 2,362 | 2,135 | 2,296 | 2,394 | 1,346 |
| Copper grade | %CuT | 26.75% | 26.66% | 26.63% | 26.75% | 25.15% | 23.43% | 22.13% |
| Contained copper | Cu kt | 567 | 628 | 629 | 571 | 577 | 561 | 298 |
| Contained copper | Cu klb | 1,249,638 | 1,385,102 | 1,386,417 | 1,258,925 | 1,273,165 | 1,236,293 | 656,495 |
| Overall copper recovery | % | 87.87% | 90.59% | 90.32% | 89.71% | 86.17% | 81.09% | 73.50% |
| Molybdenum concentrate | kt | 10 | 13 | 13 | 16 | 12 | 7 | 4 |
| Molybdenum grade | %Mo | 28.83% | 29.31% | 35.94% | 41.66% | 39.66% | 28.69% | 26.91% |
| Contained molybdenum | Mo kt | 3 | 4 | 5 | 7 | 5 | 2 | 1 |
| Overall molybdenum recovery | % | 26.24% | 21.39% | 28.80% | 36.49% | 31.11% | 14.55% | 12.65% |
| Product Sales | ||||||||
| Copper concentrate | kt | 2,170 | 2,366 | 2,338 | 2,178 | 2,244 | 2,347 | 1,395 |
| Copper grade | %CuT | 26.58% | 26.67% | 26.55% | 26.66% | 25.12% | 23.41% | 21.75% |
| Contained copper | Cu kt | 577 | 631 | 621 | 581 | 564 | 549 | 303 |
| Contained copper | Cu klb | 1,271,609 | 1,391,172 | 1,368,485 | 1,280,210 | 1,243,017 | 1,211,040 | 668,826 |
| Molybdenum concentrate | kt | 10 | 13 | 13 | 16 | 12 | 7 | 3 |
| Molybdenum grade | %Mo | 29.62% | 29.11% | 35.95% | 41.46% | 40.58% | 29.00% | 26.87% |
| Contained molybdenum | Mo kt | 3 | 4 | 5 | 7 | 5 | 2 | 1 |
| November 2025 | ||
| Page |
| SRK Consulting (UK) Limited | Mineral Resources and Mineral Reserves, Collahuasi Copper Mine - Main Report |
| Description | Units | 2019 | 2020 | 2021 | 2022 | 2023 | 2024 |
2025 Actual 9month |
| Direct operating costs | ||||||||
| Mining (incl. deferred stripping) | USDm | 545 | 495 | 543 | 699 | 766 | 731 | 556 |
| Deferred stripping | USDm | -235 | -310 | -383 | -31 | -118 | -134 | -201 |
| Mining (excl. deferred stripping) | USDm | 310 | 185 | 161 | 668 | 647 | 597 | 355 |
| Unit mining cost (per tonne mined) | USD/t | 2.30 | 2.16 | 2.25 | 2.75 | 2.88 | 2.79 | 3.09 |
| Processing & Port | USDm | 436 | 442 | 490 | 522 | 571 | 572 | 501 |
| Unit processing cost (per tonne processed) | USD/t | 8.05 | 7.91 | 8.81 | 9.10 | 9.96 | 9.53 | 11.34 |
| G&A | USDm | 147 | 150 | 177 | 169 | 185 | 177 | 137 |
| Unit G&A cost (per tonne processed) | USD/t | 2.72 | 2.70 | 3.17 | 2.95 | 3.23 | 2.95 | 3.09 |
| Total Direct Operating Cost (excl. deferred stripping) | USDm | 893 | 777 | 827 | 1,358 | 1,404 | 1,346 | 993 |
| Total Unit cost (per tonne processed) | USD/t | 16.50 | 13.92 | 14.86 | 23.70 | 24.48 | 22.42 | 22.45 |
| Capital costs | ||||||||
| Project capital | USDm | 52 | 102 | 216 | 402 | 1,385 | 1,373 | 696 |
| Stay in Business capital (excl deferred stripping) | USDm | 454 | 308 | 340 | 315 | 363 | 483 | 316 |
| Deferred stripping | USDm | 235 | 310 | 383 | 31 | 118 | 134 | 201 |
| Total Capital Costs | USDm | 740 | 720 | 939 | 749 | 1,866 | 1,990 | 1,213 |
| C1 Cash Cost | ||||||||
| Production - payable | Cu klb | 1,204,808 | 1,340,463 | 1,342,472 | 1,216,035 | 1,221,318 | 1,190,268 | 633,130 |
| Direct production cost (excl deferred stripping, incl stockpile inventories) | USDm | 945 | 829 | 873 | 1,139 | 1,430 | 1,416 | 1,115 |
| Realisation costs | USDm | 433 | 373 | 449 | 449 | 477 | 485 | 167 |
| C1 cash cost before credits | USDm | 1,378 | 1,202 | 1,322 | 1,588 | 1,907 | 1,901 | 1,282 |
| By product credits | USDm | (138) | (260) | (368) | (417) | (357) | (296) | (123) |
| C1 cash cost after credits | USDm | 1,239 | 942 | 954 | 1,171 | 1,550 | 1,605 | 1,159 |
| Direct production cost (excl deferred stripping, incl stockpile inventories) | USD/lb Cu | 0.78 | 0.62 | 0.65 | 0.94 | 1.17 | 1.19 | 1.76 |
| Realisation costs | USD/lb Cu | 0.36 | 0.28 | 0.33 | 0.37 | 0.39 | 0.41 | 0.26 |
| C1 cash cost before credits | USD/lb Cu | 1.14 | 0.90 | 0.98 | 1.31 | 1.56 | 1.60 | 2.02 |
| By product credits | USD/lb Cu | (0.11) | (0.19) | (0.27) | (0.34) | (0.29) | (0.25) | (0.19) |
| C1 cash cost after credits | USD/lb Cu | 1.03 | 0.70 | 0.71 | 0.96 | 1.27 | 1.35 | 1.83 |
| C1 All in Sustaining Cost | ||||||||
| All in Sustaining cost (excl royalty) | USDm | 1,904 | 1,621 | 1,724 | 1,606 | 2,069 | 2,211 | 1,716 |
| Royalty | USDm | 75 | 141 | 427 | 173 | 203 | 383 | 116 |
| All in Sustaining cost (incl royalty) | USDm | 1,979 | 1,762 | 2,151 | 1,780 | 2,272 | 2,594 | 1,832 |
| All in Sustaining cost (excl royalty) | USD/lb Cu | 1.58 | 1.21 | 1.28 | 1.32 | 1.69 | 1.86 | 2.71 |
| Royalty | USD/lb Cu | 0.06 | 0.10 | 0.32 | 0.14 | 0.17 | 0.32 | 0.18 |
| All in Sustaining cost (excl royalty) | USD/lb Cu | 1.64 | 1.31 | 1.60 | 1.46 | 1.86 | 2.18 | 2.89 |
| November 2025 | ||
| Page |
| SRK Consulting (UK) Limited | Mineral Resources and Mineral Reserves, Collahuasi Copper Mine - Main Report |
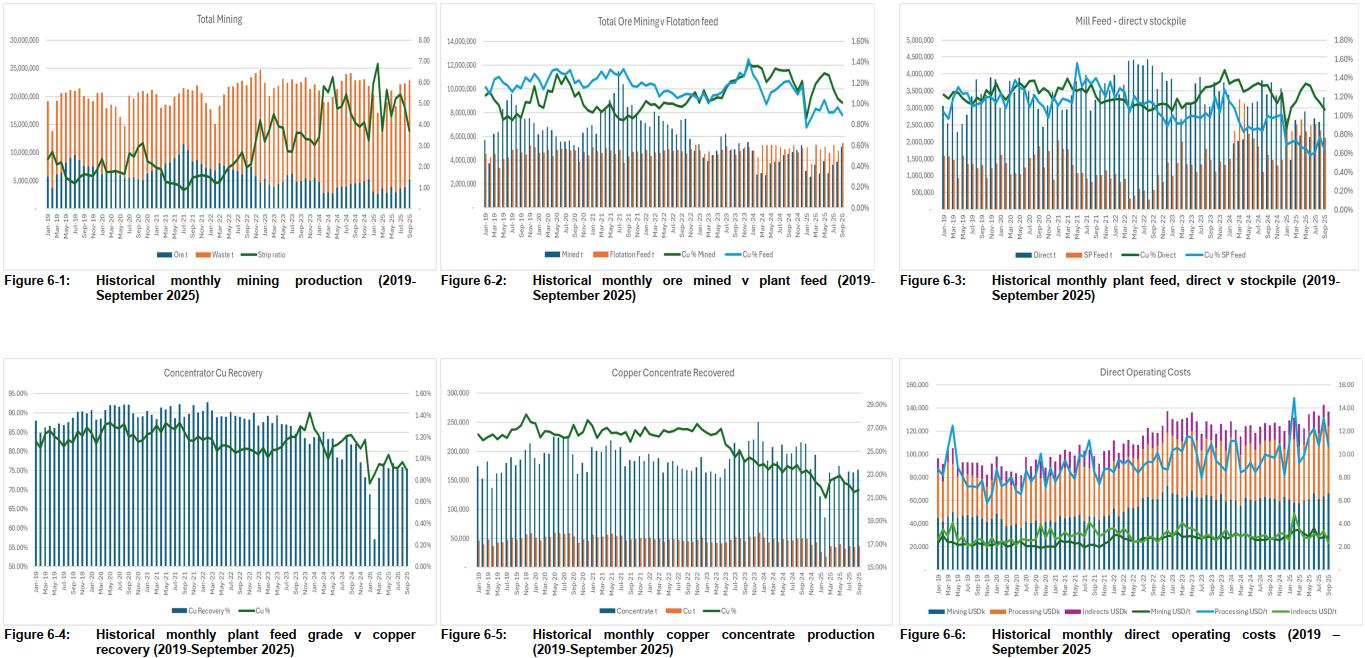
| November 2025 | ||
| Page |
| SRK Consulting (UK) Limited | Mineral Resources and Mineral Reserves, Collahuasi Copper Mine - Main Report |
| ITEM 7 | GEOLOGICAL SETTING AND MINERALIZATION |
| 7.1 | Regional Geology |
Collahuasi is a cluster of porphyry copper deposits with high sulphidation epithermal overprinting and significant structural control at the Rosario system. Rosario, Rosario West and Ujina are the major deposits, consisting of primary and secondary enriched sulphides and oxides. A series of small exotic oxide deposits are located to the west (Capella) and south (Rosario Sur) of Rosario. Copper sulphide mineralization is mainly represented by chalcocite, chalcopyrite and bornite. Oxide mineralisation occurs mainly as chrysocolla with minor brochantite, native copper, and copper-iron-manganese oxides and hydroxides.
Collahuasi forms part of the cluster that includes several porphyry Cu-Mo and Cu vein deposits, from east to west are: Ujina, Rosario and Quebrada Blanca as shown in Figure 7-2. This cluster is part of the NS Tertiary porphyry belt, controlled by the north-south trending West Fissure fault system. This system controls many of the world-class Chilean porphyry copper deposits, such as Escondida, Chuquicamata and El Abra, see Figure 7-1.
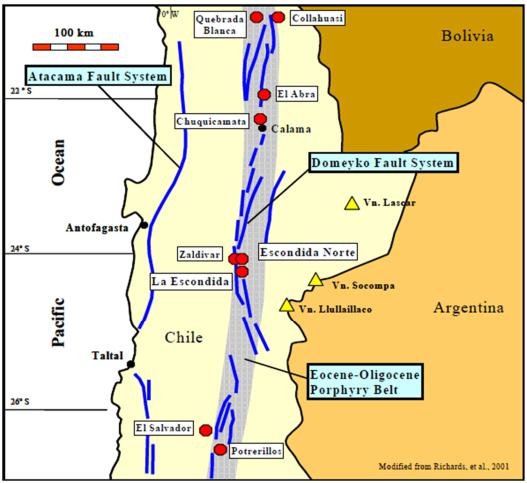
| Figure 7-1: | Regional schematic showing Eocene-Oligocene porphyry copper belt (Xstrata, 2012) |
| November 2025 | ||
| Page |
| SRK Consulting (UK) Limited | Mineral Resources and Mineral Reserves, Collahuasi Copper Mine - Main Report |
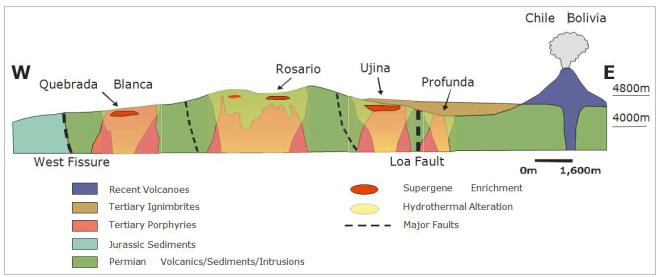
| Figure 7-2: | Regional schematic W-E geological section of CMDIC district showing distribution major mineralised systems (Xstrata, 2012) |
Collahuasi is situated within a Permo-Triassic uplifted block that is limited to the east by the Loa fault and to the west by the Domeyko fault, which is part of the West Fissure system. The host rocks in the area are continental to shallow marine volcanic and sedimentary rocks of the Permo-Triassic Collahuasi Formation. It is overlaid unconformably by the Jurassic Quehuita Formation, which is composed of a folded sequence of deep to shallow marine sedimentary rocks, and by the Cretaceous Cerro Empexa Formation, which is composed of continental volcano-sedimentary rocks. Collahuasi is intruded by a series of granitic plutons dated as Permian (231 to 262 Ma). The oldest portion of the volcanic sequence is Permian or older, supported by new age dates collected from rhyodacite units (Masterman, 2003). The mineralisation at Collahuasi is related to various Permian to Oligocene porphyry intrusives, including the Ines porphyry, the Collahuasi porphyry, the Rosario porphyry and the Inca porphyry. In the northern part of the district, a thick Cenozoic ignimbrite covers most of this basement (Masterman, et al,. 2004; Masterman, et al,. 2005).
Tertiary tectonic movements associated to the West Fissure system caused the development of conjugated set of NW-NE faults. These faults acted as controls to the intrusion of porphyries associated to Rosario and Ujina deposits. Figure 7-3 shows a schematic geological map of the Collahuasi district.
Structures have special significance because they control the distribution of mineralisation and lithologies in Rosario West. The main structures are NE. There are two NW and NNW structural trends guidelines which are associated to the NE trending structures according to the model proposed.
| November 2025 | ||
| Page |
| SRK Consulting (UK) Limited | Mineral Resources and Mineral Reserves, Collahuasi Copper Mine - Main Report |
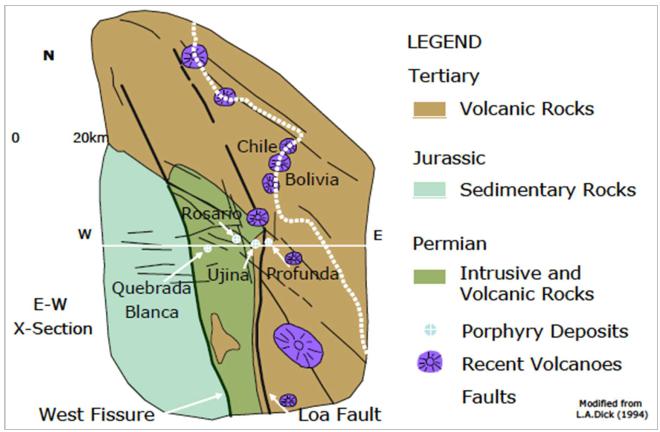
| Figure 7-3: | Collahuasi area district schematic geology (Xstrata, 2012) |
| 7.2 | Local Geology |
| 7.2.1 | Lithology |
The Rosario deposit is hosted within the La Grande unit, which forms the lower sequence of the Collahuasi formation. The La Grande unit is approximately 2,700 m thick and comprises of interbedded rhyolite, rhyodacite, dacite and andesite. The unit strikes NW and dips from 20 to 45° NE. Andesites thin to the SW across the Rosario deposit and the sequence becomes dominated by rhyolite. Volcaniclastic rocks and limestones of the Capella Unit, approximately 1,700 m thick, overlie the La Grande Unit on the northeastern side of the Rosario deposit. The rhyolitic Condor Unit outcrops to the west of the Rosario deposit. Both the Capella and Condor units are considered to have Triassic or Jurassic ages (Münchmeyer, et al, 1984).
Emplacement of the porphyries appears to have been controlled by the Rosario fault system resulting in a north-westerly trend to both porphyries, with some influence from lithology and bedding contacts.
Two major porphyries intrude Rosario; the Permian Collahuasi porphyry has a granodioritic composition, and is between 50 to 300 m wide and up to 100 m long, this is intruded by the Rosario porphyry, which is 300 to 500 m wide and up to 1,500 m long. The Rosario porphyry is thought to be the centre of hydrothermal alteration and hypogene mineralisation at Rosario. A third intrusion, the dacitic Ines porphyry, is interpreted as predating Rosario and contains some hypogene mineralisation.
The host rocks in Ujina are broadly correlative to those at Rosario being hosted within the Collahuasi formation which is intruded by several intrusions, including the Ujina porphyry; igneous breccias, Doña Inés porphyry and Inca porphyry.
| November 2025 | ||
| Page |
| SRK Consulting (UK) Limited | Mineral Resources and Mineral Reserves, Collahuasi Copper Mine - Main Report |
| 7.2.2 | Mineralisation |
Primary mineralisation at Rosario and Ujina is mainly associated with sulphide disseminations and veinlets in Rosario and Ujina, with packages of high sulphidation Cu-Ag-As veins in Rosario and Rosario West including the NNE trending Montezuma and La Grande vein systems and the NW-trending Rosario and Poderosa vein systems.
The two deposits have typical profiles of hypogene primary sulphide mineralisation overlain by secondary sulphides representing a supergene enrichment process which in turn over covered by oxidised mineralisation comprising a leach cap and an oxidised to transitional / mixed oxidation zone. To the west of Rosario is located Capella, which is an exotic copper deposit with copper oxides associated to gravels, probably derived from the Rosario porphyry.
The Rosario deposit is characterized by a dome-shaped zone of copper mineralization centred on the Rosario and Collahuasi porphyries (see Figure 7-4). The centre of the mineralised zone contains bornite, chalcopyrite, and primary chalcocite and generally lacks pyrite. Copper mineralization occurs as both disseminations and fracture-controlled veinlets. The deposit contains a thin, erratically developed secondary enrichment blanket underlain by a relatively high-grade primary chalcopyrite zone. The lack of a well-developed secondary enrichment blanket is due to both presence of structures and level of oxidization. In addition, the secondary zone is offset and developed along crosscutting faults, resulting in erratic and locally deep oxidization. Oxide mineralisation is concentrated mostly in the northeast portion of the deposit. The oxide consists of chrysocolla, malachite and brochantite in a strongly limonitic matrix. Cuprite, tenorite and native Cu are also locally present.
Molybdenite is found within the primary hypogene mineralisation zone, peripheral to the Rosario porphyry. Molybdenum is enriched at depth, where grades are above 0.03% Mo. Molybdenum mineralization is predominantly restricted to within quartz veins with no significant alteration halo.
Mineralisation at Rosario West denotes two major episodes of hypogene mineralization both responsible for extensive volumes of rock with copper and molybdenum mineralization type "porphyry copper". These events are represented by high sulphidation "veins" with copper mineralization (arsenic - silver - gold). The spatial distribution of the mineralisation is controlled by movement of structural blocks. Events of secondary enrichment occur along structures and lithological horizons.
The cross sections in Figure 7-4 and Figure 7-5 use a common colour scheme and codes to denote mineralisation as follows:
| · | Overburden |
| o | FRH unmineralised Tertiary Ignimbrite |
| · | Oxidised mineralisation |
| o | LIX leached oxide |
| o | OXI oxidised material |
| o | MIX mixed oxidised / transitional material |
| November 2025 | ||
| Page |
| SRK Consulting (UK) Limited | Mineral Resources and Mineral Reserves, Collahuasi Copper Mine - Main Report |
| · | Secondary sulphide mineralisation |
| o | SEC mainly chalcocite, covellite |
| o | SECP mainly chalcocite, covellite, pyrite |
| o | SECD mainly chalcocite, covellite + primary sulphides |
| o | SECDP mainly chalcocite, covellite, pyrite + primary sulphides |
| · | Primary / Hypogene zones |
| o | BNCP bornite > chalcopyrite |
| o | CP-BN chalcopyrite > bornite |
| o | CP-PY chalcopyrite > pyrite |
| o | PRIPY pyrite dominated with pyrophyllite |
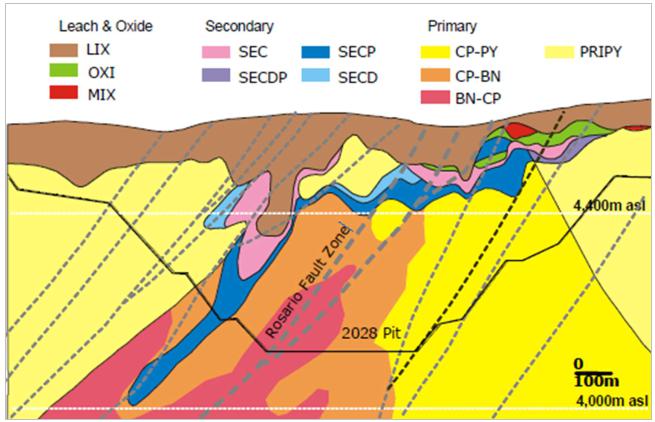
| Figure 7-4: | Typical mineralisation cross section of Rosario at 20NE, looking to NW (Xstrata, 2012) |
At Ujina, the hypogene mineralization is spatially related to the Ujina porphyry (see Figure 7-5). It is associated to a low sulphide core with chalcopyrite and pyrite, that grades outward to a pyritic shell. The high-grade zones correspond to the contact between Ujina and Collahuasi porphyries. Deep oxidization has produced significant tonnages of secondary enriched copper sulphide and oxide minerals that overlie the primary chalcopyrite material.
| November 2025 | ||
| Page |
| SRK Consulting (UK) Limited | Mineral Resources and Mineral Reserves, Collahuasi Copper Mine - Main Report |
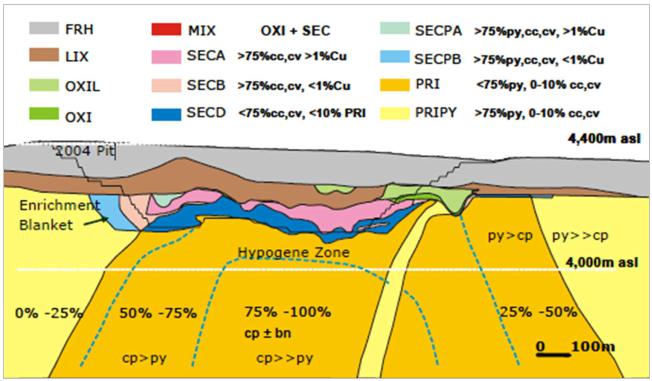
| Figure 7-5: | Typical mineralisation cross section of Ujina at 128NE, looking to NE (Xstrata, 2012) |
There are two smaller deposits identified as Capella Sur and Capelle Este which are represented by secondary and oxide mineral assemblages. The Capella Sur and Capelle Este deposits do not form part of the Mineral Resources considered as part of this Technical Report.
| 7.2.3 | Alteration |
Hydrothermal alteration at Rosario and Ujina is characterized by the typical alteration zonation of porphyry deposits in northern Chile (see Figure 7-6 and Figure 7-7). It consists of a central potassic alteration, largely related to the porphyry intrusions, and propylitic alteration at the periphery of the deposit. The area is overprinted by strong pervasive quartz-sericite (phyllic) alteration. Late argillic alteration is found locally with an abundance of kaolinite focused within fracture zones related to supergene alteration.
Hydrothermal alteration at Rosario comprises four overprinting alteration stages.
| 1. | barren magnetite dissemination and veinlets |
| 2. | quartz-biotite-albite and quartz-K-feldspar veins that are associated with biotite-albite-K-feldspar alteration |
| 3. | A transitional stage is characterised by the presence of quartz-molybdenite veins and an intermediate stage characterised by quartz-pyrite-chalcopyrite veins with an illite-chlorite halo enveloping the veins. |
| 4. | high-sulphidation veins exploiting the Rosario faults with associated alteration including |
| a. | quartz-alunite-pyrite close to the veins overprinted by |
| b. | pyrophyllite- dickite passing through to |
| c. | muscovite-quartz-pyrite and outwards to |
| d. | illite-smectite envelopes. |
| November 2025 | ||
| Page |
| SRK Consulting (UK) Limited | Mineral Resources and Mineral Reserves, Collahuasi Copper Mine - Main Report |
Hydrothermal alteration at Ujina shows two main hypogene stages characterised by a K-feldspar core grading into biotite alteration; a second stage alteration halo comprises white mica-quartz-chlorite. Kaolinite and smectite across the top of Ujina indicates weak supergene alteration close to the surface.
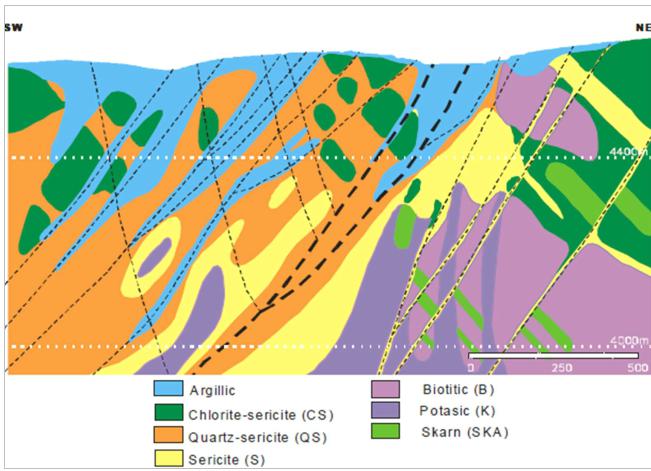
| Figure 7-6: | Typical alteration cross section of Rosario at 20NE, looking to NW (Xstrata,2012, after CMDIC internal presentation) |
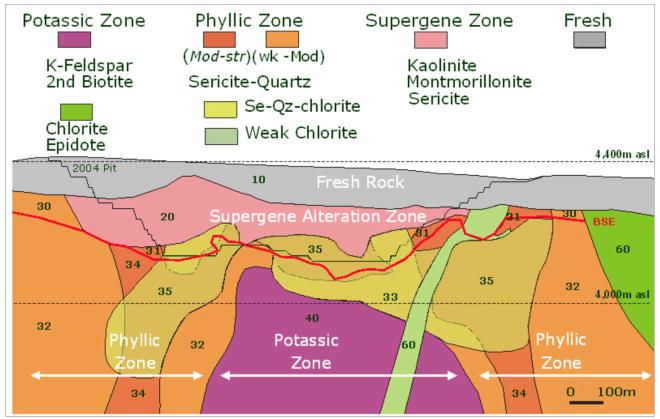
| Figure 7-7: | Typical alteration cross section of Ujina at 128NE, looking to NE (Xstrata, 2012) |
| November 2025 | ||
| Page |
| SRK Consulting (UK) Limited | Mineral Resources and Mineral Reserves, Collahuasi Copper Mine - Main Report |
| ITEM 8 | DEPOSIT TYPES |
Ujina and Rosario are two world class Cu - Mo porphyry deposits. Ujina has a classic supergene profile with an upper leached zone that covers oxide and mixed copper mineralized bodies and a well defined blanket of high-grade secondary copper sulphide that contains chalcocite and covellite. A large zone of primary sulphide including chalcopyrite, is present below this horizon in a concentric arrangement. Currently, most of secondary sulphides have been mined and the mineral resources and mineral reserves stated in this report are mainly related to primary mineralization.
Copper mineralization at Rosario is associated with a series of northwest-trending faulting that controls Cu–Mo porphyry set-up with subsequent hydrothermal events. Over 95 percent of the deposit is related to hypogene mineralization.
Rosario West, located SW of Rosario, comprises a large complex of high sulphidation pyrite-bornite-chalcopyrite-chalcocite-enargite Ag-Au veins some of which have been leached, oxidized, and enriched, forming bodies of high-grade secondary copper sulphides mineralization and smaller proportions of copper oxides. These veins are closely linked to a series of NNW, NS, and NE structures, with sub vertical dip. The ore corresponds largely to secondary copper sulphides; chalcocite and bornite associated with pyrite, which are found in veins, veinlets, and to a lesser extent spread in structures. Small quantities of tenantite-tetrahedrite and enargite are founded within the suite of primary sulphides.
Oxide copper minerals are also found in small copper deposits named Capella and Rosario Sur complex (I, II & III). The deposits of Capella (Sur & Este) constitute near-surface exotic oxide copper deposits located between the Rosario and Huinquintipa mines, while Rosario Sur complex is located to the south of Rosario West and corresponds to copper oxides related to local fault – veins. The copper oxides are mainly chrysocolla and minor black oxides. The Capella and Rosario Sur deposits are not included in the Mineral Resources reported herein.
| November 2025 | ||
| Page |
| SRK Consulting (UK) Limited | Mineral Resources and Mineral Reserves, Collahuasi Copper Mine - Main Report |
| ITEM 9 | EXPLORATION |
| 9.1 | Pre-Mining |
Before CMDIC’s open pit operations began, historical mining on the property had been established with relatively small-scale oxide ore production. Exploration campaigns were implemented by CMDIC using geophysical methods to define the limits of the Rosario and Ujina mineralized porphyry systems, as well as to search for possible additional mineralized systems. Historical exploration consisted of a combination of remote sensing and geophysical activities which eventually progressed to reconnaissance drilling. A summary of the geophysical surveys conducted between 1991 and 1993 over the Collahuasi deposits is summarised as:
| · | Various IP/resistivity campaigns by Quantec Geofísica Limitada, consisting of 31 lines using a 300 m dipole-dipole array, with survey lines generally spaced very widely at either an 800 m or 1,000 m separation. |
| · | A helicopter magnetic survey was completed in 1991 which covered an area measuring 14 km EW by 14 km NS, centred over the Rosario and Ujina deposits, with a line spacing of approximately 300 m. |
| · | In 1993, limited Transient Electromagnetic (TEM) and gravity surveys were completed to the east and NE of Ujina. |
| 9.2 | Early Mining |
During the period between August 2004 and September 2005, a 200 m moving in-loop TEM survey was completed by Quantec Geofísica Limitada over the greater Rosario mineralized system, south of the operating pit. Readings were taken every 50 m, on lines spaced at 200 m, which provided a very high density of data.
During the period of November 2008 to February 2009, 9 additional IP/resistivity survey lines were completed by Quantec Geofísica Limitada in an effort to extend the historical coverage of the 1991-93 IP/resistivity surveys to the Collahuasi property boundaries.
During the period of 2010 to 2011, GRS Chile completed a MIMDAS survey along NS and EW lines over parts of Ujina, Rosario, and Rosario West. This system was effective in defining depth continuity of the mineralized systems.
| 9.3 | Expansion and Mine Studies |
Currently, CMDIC has a 20-strong in-house geology team which coordinates with a number of contractors tasked with collecting geological information, including Geovest, who undertakes quarterly updates to the site geological mapping.
Much of the drilling conducted in recent years has expanded the Rosario deposit to the SW into the Rosario West epithermal deposit.
| November 2025 | ||
| Page |
| SRK Consulting (UK) Limited | Mineral Resources and Mineral Reserves, Collahuasi Copper Mine - Main Report |
| ITEM 10 | DRILLING |
| 10.1 | Introduction |
Diamond coring drillholes (DDH) and Reverse Circulation drillholes (RC) have been used throughout the drilling history to define and expand the Mineral resources associated to each of the deposits.
Since operations began, there has also been blasthole (BH) drilling where cuttings are sampled by spear scoops and bagged and tagged for assay. The assay turnaround time is currently reported to be one day, which allows this to be used as grade control (GC) data to fine tune the dig lines that are laid out on the pit benches to guide separate mining of different mineralisation types.
Currently and for many years, the drilling tasks are performed by external contractors, following CMDIC internal procedures. For the surface and in-pit exploration drilling, Geotech Boyles is currently engaged with 25 DD and RC drill rigs at site with associated workshops, staff and office space; 14 rigs were operational at the time of SRK’s site visit in October 2025. Boart Longyear also provides additional drilling services where required. Elecon, a separate contractor, ensures timely preparation of drill pads.
Most drillholes start with HQ or HWT core size and may reduce down if necessary to NQ at depth.
Drillhole coverage, colour coded by period, is shown for Rosario Pit and Ujina Pit in Figure 10-1 and Figure 10-2 respectively.
| November 2025 | ||
| Page |
| SRK Consulting (UK) Limited | Mineral Resources and Mineral Reserves, Collahuasi Copper Mine - Main Report |
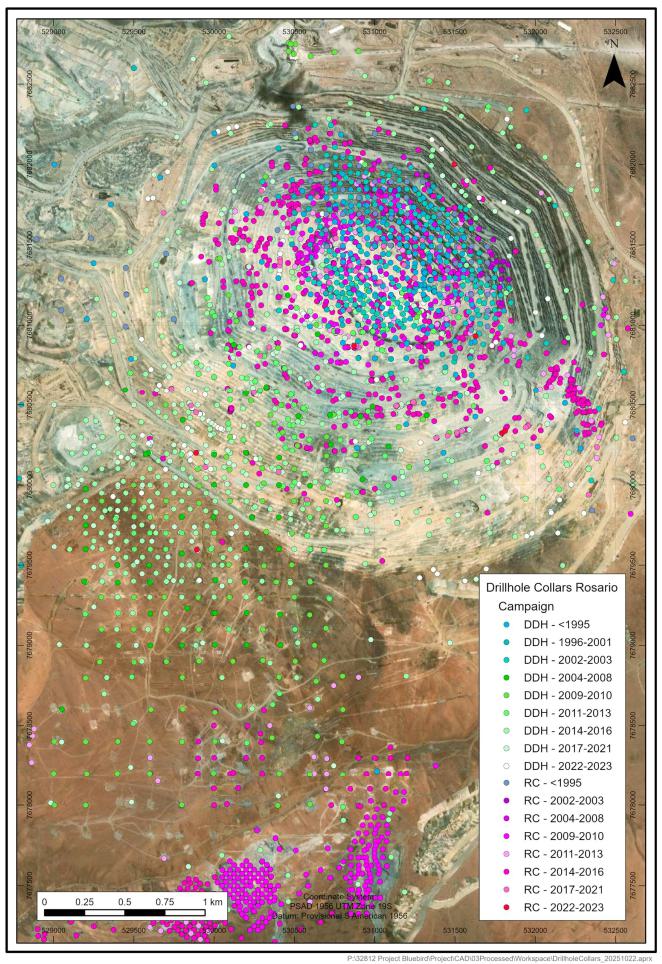
| Figure 10-1: | Rosario and Rosario West Drillhole Collars used for 2024 MRE (SRK, 2025) |
| November 2025 | ||
| Page |
| SRK Consulting (UK) Limited | Mineral Resources and Mineral Reserves, Collahuasi Copper Mine - Main Report |
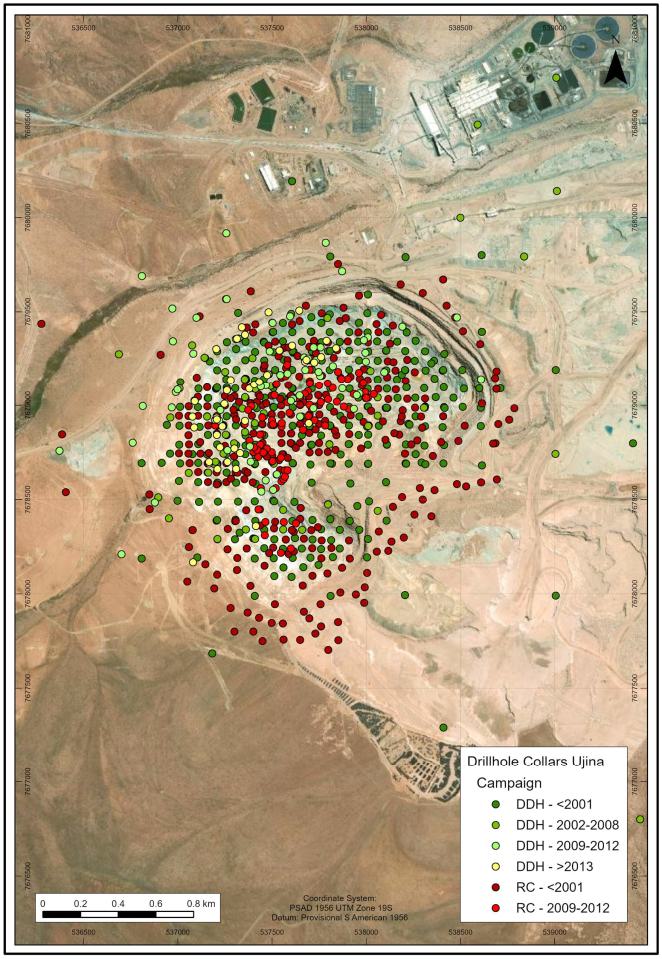
| Figure 10-2: | Ujina Drillhole Collars used for 2012 MRE and more recent collars (SRK, 2025) |
| November 2025 | ||
| Page |
| SRK Consulting (UK) Limited | Mineral Resources and Mineral Reserves, Collahuasi Copper Mine - Main Report |
| 10.2 | Historical Drilling |
Drilling on and around the property was started in the 1980s by Amoco Minerals and later by Anglo American who began the delineation of the large-scale copper bodies. In the 1990s, drilling continued under the management of CMDIC.
Since the start of the operations, CMDIC has carried out infill resource definition drilling campaigns aimed at improving Mineral Resource classification as well as undertaking drilling to expand its Mineral Resource base.
| 10.3 | Early Operations |
Up to 2008, some 383 km of drilling had been completed, approximately 52% at Rosario and 48% at Ujina. The majority of drilling, some 82%, was DDH. Drilling was collared at surface over the central to northeastern part of the current Rosario Pit and over the entirety of the current Ujina Pit with some RC drilling collared in the Ujina Pit at around half the current pit depth.
By 2010, the amount of drilling had increased to 563 km, which comprised 62% at Rosario and 38% at Ujina. Greater RC drilling activity began in this time, reducing DDH to 73% of total drilled metres. Most of DDH at surface infilled the pre-existing pattern over Rosario Pit and Ujina Pit, with RC drilling from inside the Rosario pit at around the 4,500mRL elevation.
| 10.4 | Post 2010 Drill-out |
In the period leading up to 2016, there was a pronounced uplift in drilling activity, surface DDH coverage extended over Rosia West area up to approximately 3 km south of the pit at the time. There was tight spaced RC drilling on the oxide deposits to the west and south of Rosia. There was a combination of RC and DDH collared in the Rosario Pit, which at that time had deepened to reach nearly 4,000 masl. Some RC drilling took place in the base of Ujina Pit down to an elevation of 4,100 masl. This brought the total drilling at Ujina to 931 drillholes for 219 km (73% comprising DDH) which was used for the 2012 MRE (reflected in the 2024 MRE presented herein).
At this stage, 80% of drilled metres was in the Rosario Pit, Rosario West and surrounding oxide deposits. Whilst two thirds of the drillholes were RC, these were typically shorter than the DDH. The proportion of DDH by meterage during this significant drill-out period was 62%, bringing the running total for the project to some 1,080 km drilling, comprising 70% DDH.
More recently, surface DDH has continued to infill coverage over the southwestern part of the Rosario Pit and further to the SW into the Rosario West area; in-pit drilling at all elevations down to 4,000 masl has been completed to more thoroughly inform the volume some 200-400 m beneath the current pit, taking accumulated total of drilling at Rosario and Rosario West to some 3,895 drillholes for 1,093 km (71% comprising DDH) which was used for the 2024 MRE presented herein.
| 10.5 | Drilling Since MRE Cutoff Date |
SRK is aware that a series of drilling activities has taken place since the data cut off for the 2024 MRE.
| November 2025 | ||
| Page |
| SRK Consulting (UK) Limited | Mineral Resources and Mineral Reserves, Collahuasi Copper Mine - Main Report |
There has been RC drilling and trenching to verify the grades and the amount of oxidation affecting the materials on low grade stockpiles, covering a relatively small part of the SBL stockpile. Drill spacing is variable, approximately 25 m in a core area, 50 m in an adjacent area, and wider elsewhere. The drilling amounts to 193 RC drillholes for a total of 12.3 km drilling; these are not included in Table 10-1 below.
Within the main Rosario pit there has also been continued in-pit infill drilling from western, southwestern and southern parts of the pit, collared down to an elevation of approximately 3,900 masl. Some 115 DDH and 19 RC drillholes have been drilled for a total of 54 km. SRK has completed a cursory review of these and can confirm that the new drillholes typically agree with the block model used for the 2024 MRE. These have not been included in Table 10-1 below.
At Ujina, 46 DDH for 10 km have been completed in recent years collared from the haul road and pit floor. These are variably spaced, often closer than 80 m and mostly closer than 200 m apart, covering the northwest and west sectors of the pit where the more substantial primary mineralisation is located. These drillholes provide important support for the historical drilling in Ujina which otherwise has only anecdotal commentary regarding drilling, sampling and assaying quality control. These drillholes are included in Table 10-1 below but they have not been incorporated in the Ujina Mineral Resource block model which dates from the 2012 MRE.
| 10.6 | Summary Drill History |
Table 10-1 summarises the drillhole count and meterage which was provided to SRK in several digital data tranches at the time of reporting. The equivalent totals are very slightly different from the totals reported for the Rosario and Ujina MRE reports, respectively, due to area code boundaries changing over time. Compared with the statements in the MRE reports reviewed by SRK, the data supplied by CMDIC and compiled by SRK result in subtotals which differ by less than 1% which SRK considers to be a negligible difference.
Table 10-1 also includes some drilling information collected after the respective MRE data cut off dates relating to some of the 2023-2024 drilling at Rosario and Ujina, where the information was available.
| November 2025 | ||
| Page |
| SRK Consulting (UK) Limited | Mineral Resources and Mineral Reserves, Collahuasi Copper Mine - Main Report |
Table 10-1: Drilling summary for data supporting CMDIC resource models
| Rosario Drilling History (to 2024 MRE) | Ujina Drilling History (to 2012 MRE) | |||||||||||||||
| Period | Diamond Core | Reverse Circulation |
Total Drilling | Milestone | Period | Diamond Core | Reverse Circulation |
Total Drilling |
Milestone | |||||||
| N | (km) | N | (km) | N | (km) | N | (km) | N | (km) | N | (km) | |||||
| <1995 | 225 | 61 | 62 | 11 | 287 | 72 | - | - | ||||||||
| 1996-2001 | 71 | 31 | - | - | 71 | 31 |
<2001
|
330 | 116 | 316 | 47 | 646 | 162 | |||
| Feasibility Study (Magri&NCL) | ||||||||||||||||
| Start of Mining | ||||||||||||||||
| MRDI Review | Maptek Review | |||||||||||||||
| 2002-2003 | 245 | 50 | 24 | 3 | 269 | 53 | 2002-2008 | 74 | 20 | - | - | 74 | 20 | |||
| AMEC Review | ||||||||||||||||
| 2004-2008 | 53 | 35 | 71 | 9 | 124 | 44 | ||||||||||
| Golder Review | Golder Review | |||||||||||||||
| 2009-2010 | 129 | 79 | 418 | 71 | 547 | 150 | 2009-2012 | 69 | 19 | 93 | 11 | 162 | 30 | |||
| Golder Review | ||||||||||||||||
| 2011-2013 | 125 | 85 | 246 | 35 | 371 | 120 | Golder Review | |||||||||
| Golder Review | 2012 MRE | |||||||||||||||
| 2013-2022 | - | - | - | - | - | - | ||||||||||
| 2014-2016 | 588 | 248 | 955 | 150 | 1,543 | 397 | ||||||||||
| Snowden Review | ||||||||||||||||
| 2017-2021 | 199 | 87 | 57 | 13 | 256 | 100 | ||||||||||
| Geoinnova Review | ||||||||||||||||
| 2022 | 135 | 57 | 7 | 1 | 142 | 58 | SRK Review | |||||||||
| 2023-2024 | 90 | 37 | 146 | 18 | 236 | 55 | 2023-2024 | |||||||||
| 2024 MRE | 46 | 10 | 46 | 10 | Verification | |||||||||||
| Total | 1,860 | 769 | 1,986 | 313 | 3,846 | 1,082 | Total | 519 | 165 | 409 | 57 | 928 | 223 | |||
| November 2025 | ||
| Page |
| SRK Consulting (UK) Limited | Mineral Resources and Mineral Reserves, Collahuasi Copper Mine - Main Report |
| 10.7 | Blast Hole Drilling |
Unlike DDH and RC drilling, the assay information from the blast hole (BH) drilling is not used in the Mineral Resource estimation that underpins the life mine plan, its primary use in in short term planning and grade control; however, the BH assay data are used to update the grade delivered to stockpiles which form part of the Mineral Resource presented herein.
| 10.8 | Down Hole Survey |
Prior to 2005, down hole survey at Collahuasi was measured with the Single Shot or Multi Shot systems. Since 2005, down hole survey is measured with Gyroscope. The down hole survey measurements are taken at 10 m intervals to the end of hole. The measurements are taken by CMDIC technicians and directly entered into the drilling database.
| 10.9 | Topographic Survey |
All topography surveying is conducted by CMDIC personnel and based on a local grid system. Prior to 2007, all topographic surveying was carried out using total station system. Since 2007, a high definition GPS has been used. The QA procedure implies a second and independent measure for 5% of the collars.
| November 2025 | ||
| Page |
| SRK Consulting (UK) Limited | Mineral Resources and Mineral Reserves, Collahuasi Copper Mine - Main Report |
| ITEM 11 | SAMPLE PREPARATION, ANALYSES AND SECURITY |
| 11.1 | Core Transport |
Drill core is currently transported from the drill rig in boxes with lids secured by cable ties. Core boxes and RC sample splits are handed over to an exploration services contractor who takes responsibility for the secure transportation of samples to the CMDIC dedicated logging facility in Pozo Almonte, some 150 km NW of the mine and some 40 km east of Iquique. This facility came into use since 2018 and is capable of processing 4,000 m drillcore per week. Prior to 2018, when the majority of drilling was conducted on the Rosario, Rosario West and Ujina deposits, logging and sample preparation were conducted on the mine site under contract by Geoanalitica SA until 2011 and subsequently by SGS SA.
| 11.2 | Database Management |
CMDIC uses a Geoscientific Information Management System (acQuire) to centralize the drill hole information. This database contains all the geological information acquired since February 2007. The data acquired prior to that date are recorded on a Microsoft Access database.
Importing data to the official database is done through standard data entry procedures. The entries of information into the database, as well as modifying authorization, are regulated by strict permissions set by a nominated database administrator.
All assay data obtained after 2005 is fully supported by assay certificates; however, for previous campaigns, especially between 1981 and 1983, some of the data does not have the supporting assay certificates.
| 11.3 | Core Logging |
Drillcore is first laid out, cleaned and photographed wet and dry in a constant light environment. It is then marked up for sample intervals including a splitting line to ensure symmetrical distribution of mineralisation between core halves. Sample numbers are established in the acQuire system and tags are issued and placed in the core boxes at this stage.
The logging of data from drill core includes core recovery, geological, geotechnical and physical attributes. RC samples are logged for geology under a binocular microscope.
Geological logging considers lithology, hydrothermal alteration type and intensity, mineralisation style, sulphides, weathering, vein types, textures and structures according to CMDIC logging procedures that guide the geologists in the identification and description of the different geological attributes. X-Ray fluorescence and PIMA (infra red device to determine clay species) equipment is used to support logging. Each drillhole log is checked by a Senior Geologist.
As part of the geotechnical logging total core recovery, rock quality designation (RQD), Point Load Test (PLT) and fracture counts are routinely recorded.
These data are recorded using predefined standards and protocols. Figure 11-1 shows the core logging facility.
| November 2025 | ||
| Page |
| SRK Consulting (UK) Limited | Mineral Resources and Mineral Reserves, Collahuasi Copper Mine - Main Report |
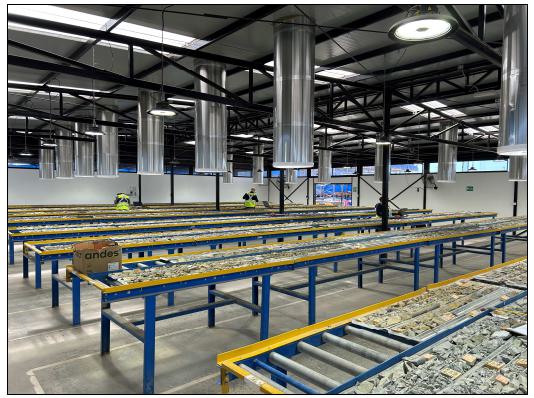
| Figure 11-1: | Pozo Almonte Core Logging Facility (October 2025) |
| 11.4 | Sampling |
Density samples at least 10cm in length are routinely taken from drillcore currently every 10m down the hole, every 20m before 2016. The density of the are determined using a wax immersion water displacement method.
Drill core is halved using a hydraulic splitter before being sampled. Assay samples are then securely bagged along with the sample identity bar code markers and dispatched to the Bureau Veritas (BV) Cesmec laboratory in Alto Hospicio.
A similar sampling and logging strategy has been in place for at least 10 years, digital data capture and use of the acQuire database software was initiated in 2007 prior to which conventional paper logging was routine and data was housed in MS Access.
| 11.5 | Sample Preparation |
Whilst SRK has reviewed reports where QAQC results in part monitor the performance of the sample preparation laboratories, SRK has not seen or undertaken any dedicated sample preparation laboratory review.
Since 2017, samples have been prepared at BV, where they are dried, crushed, sieved and subdivided to prepare pulps for analysis following standard industry practices.
Prior to BV, between 2012 and 2017, sample preparation was conducted at a facility at the mine site run by SGS; this was reviewed by Snowden Mining Industry Consultants (Snowden) in 2016 and was noted to be clean and well organised; bar coded sample tags were also noted to be in use.
| November 2025 | ||
| Page |
| SRK Consulting (UK) Limited | Mineral Resources and Mineral Reserves, Collahuasi Copper Mine - Main Report |
Between 2007 and 2012, sample preparation was conducted at a facility at the mine site run by Geoanalitica.
The mechanical preparation procedure is summarized in Table 11-1.
Table 11-1: Mechanical preparation procedure
| STAGES | DESCRIPTION |
|
RECEPTION |
Creation of batch |
| Sample label with bar code | |
| Weight determination of each batch | |
|
DRYING |
Drying on electric oven 105°C during 4-8 h |
| Each 30 m, register dry weight and determine humidity | |
| Clean tray | |
|
CRUSHER |
Sieve the sample to <10 mesh |
| Crush the fraction > 10 mesh | |
| Granulometric control 95% a < 10 mesh, one each 30 m | |
| Weigh granulometric sample | |
| Coarse blank, one each 30 samples | |
| Clean machines between samples | |
|
SPLIT |
Splitting of the sample until obtaining 0,8 kg. approximately |
| Generate coarse duplicate, one each 30 m | |
| Granulometric control < 10 mesh, one each 30 m | |
| Clean machines between samples | |
| DRYING | Dry in electric oven 105°C for 1 hour approximately |
| Clean tray | |
|
PULVERIZATION |
Pulverise to < 150 mesh |
| Granulometric control 95% < 150 mesh | |
| Generate pulp duplicate one each 30 m | |
| Clean between samples | |
|
PACKING |
Three samples of +- 150 g each |
| Pack in cases | |
| Check sample identification |
| 11.6 | Assaying |
Assaying for the main metals of interest is currently conducted at BV in Alto Hospicio who run a Laboratory Information Management System (LIMS) to continue the automated sample number tracking process. BV uses their assay method AAS0025 comprising a 3-acid digest followed by atomic absorption spectrometry for
| · | total copper (CuT) |
| · | total molybdenum (MoT) |
| · | arsenic and silver (As & Ag) |
The laboratory also runs a sulphuric acid digest assay to determine a soluble copper assay (CuS).
| November 2025 | ||
| Page |
| SRK Consulting (UK) Limited | Mineral Resources and Mineral Reserves, Collahuasi Copper Mine - Main Report |
The assay methods used by SGS Antofagasta between 2012 and 2016 and Geoanalitica between 2007 and 2011 are similar to the BV methods. Assay methods before 2007 are assumed to be industry standard and therefore compatible with more recent assay methods. Any risk associated with poor documentation of early data is largely mitigated by the additional verification checks described in ITEM 12.
Assay certificates are issued digitally and these import directly into CMDIC’s acQuire database.
| 11.7 | Quality Control |
A QAQC programme has been in place for all of the drilling used in the MRE; however, the documentation and reporting of results is variable. Reportedly, data and documentation are not available for work conducted before 2007, this affects some 20% of Rosario data and some 80% of Ujina data.
Currently, for a regular 35 sample batch, the following QAQC samples are typically included totalling a submission rate of 17%:
| · | 2 samples in every 35 regular samples submitted (2/35) or (5.7%) standard reference material (standards are generated using material from the mine and are assigned certified values in a round robin assay process) these monitor accuracy of laboratory results over time at a suitable range of grades |
| · | 1/35 (2.9%) coarse blank material to monitor contamination and sample mix-ups, and duplicates to monitor precision, expressed as half the absolute relative difference (HARD) at the consecutive sample reduction stages |
| o | 1/35 (2.9%) field duplicate (FD) comprising a second RC split or the second half of the core |
| o | 1/35 (2.9%) coarse crush duplicate (CD) and |
| o | 1/35 (2.9%) pulp duplicate (PD) or sometimes a laboratory replicate |
A similar method has reportedly been in place throughout the data collection programmes back to 2007 although some reports suggest minor differences in certain submission rates, it appears that a similar level of effort has been paid to QAQC for most of the data collection period.
AcQuire software is used to monitor the results of QAQC samples. Assay values of CuT, CuS, Mo, and As are routinely checked to determine whether a batch is approved or rejected. Any batches with excessive standard deviation compared with the certified standard deviation are rejected, they are not included in the database, instead the pulps are sent for re-analysis.
CMDIC operate a governance process where the data supporting the estimates and the estimates themselves have been audited many times as the data, geological models and grade estimates have evolved over 30 years; the most recent being 2022 for Rosario and Rosario Oueste and 2012 for Ujina; see Section 12.1.
SRK presents a summary of CMDIC internal QAQC reports and external reviewers’ reports below; no raw data analysis has been completed by SRK.
| November 2025 | ||
| Page |
| SRK Consulting (UK) Limited | Mineral Resources and Mineral Reserves, Collahuasi Copper Mine - Main Report |
| 11.7.1 | Historical results |
Prior to 2001
All analysis prior to 2001 was done in a Santiago laboratory run by CIMM Tecnologías y Servicios S.A, (CIMM). All the QAQC data from this period was reviewed by MRDI (MRDI, 2001) who concluded that the results for CuT were acceptable and that data was suitable be used for estimate purposes.
2001 to 2006
All analysis in this period was done by CIMM; QAQC results reported in the 2002 and 2003 resource model reports indicated acceptable performance for CuT, a low batch failure rate (<10%) and no evidence of bias. QAQC data from between 2004 and 2006 were not found.
2007 to 2011
Assaying during this period was undertaken by Geoanalitica SA using their laboratories in Antofagasta and Coquimbo. Overall, eight different standard samples were used made from material taken from the deposit that had been homogenised and assigned means and standard deviations for grades of interest following a round robin assay process. They demonstrated an acceptable level of laboratory accuracy for all the main metals of interest and blanks indicated absence of contamination.
RC second split field duplicates (FD) had HARD values approaching 30% indicating suboptimal splitting practice at the RC drill rig and some loss of fine material in the cyclone, this persisted over several years although was seen to improve towards the end of this period.
Second half core FD indicated an acceptable level of precision on an improving trend with CuT HARD values of 12% becoming 8% with time.
Coarse and pulp duplicates showed adequate results. CD HARD values were 1.5% - 4.0%.
There were minor concerns raised that As MoT and CuS assays were noticeably less precise likely due to being close to assay method lower detection limit and or acid dissolution rates. It was also noted that RC FD had higher HARD values than DDH FD; RC drilling made up approximately 40% of the drilled meterage in this period.
| 11.8 | Summary |
SRK considers that sample preparation and assay laboratory performance have been monitored thoroughly using an industry standard approach and that results indicate generally reliable laboratory performance giving good confidence in the data collected since 2007. This gives good QAQC coverage for Rosario but not for Ujina; therefore other verification methods have been used to augment MRE confidence at Ujina as described in Section 12.5.3.
The QAQC results here are a compilation of several internal and external reports, there has been no attempt to consolidate and present a holistic analysis of the QAQC data; however, the reports do show that there has been a substantial QAQC monitoring effort particularly since 2007.
| November 2025 | ||
| Page |
| SRK Consulting (UK) Limited | Mineral Resources and Mineral Reserves, Collahuasi Copper Mine - Main Report |
Some of the QAQC showed there to be quite poor repeatability where RC cyclone first and second split often had CuT assay that differed by 10, 20,30% which raises a slight concern that there may have been inadequate split weights or insufficient care taken with subsequent sample reduction steps. Low precision is not such a concern when many samples are grouped by compositing or are considered as a neighbourhood, it is only a serious risk if relying on individual assay values. The RC results, however, have also been shown to be biased with respect to DDH data in the near-surface oxide and mixed mineralisation. This was identified by Snowden and subsequently studied by CMDIC who confirmed the issue but importantly also demonstrated that the issue is not convincingly detectable in primary mineralisation which is the future mining target considered herein, see Section 12.5.2.
| November 2025 | ||
| Page |
| SRK Consulting (UK) Limited | Mineral Resources and Mineral Reserves, Collahuasi Copper Mine - Main Report |
| ITEM 12 | DATA VERIFICATION |
| 12.1 | Independent Peer Review |
The resource model and underlying sampling data have evolved over three decades.
In recent years at least, the estimation has been done in-house and the geological data capture, geometallurgical domaining methods have become increasingly detailed in response to operational planning needs. Data quality has been routinely assessed internally and externally although reporting detail varies.
SRK has been supplied with a number of audit and review reports mainly prepared by independent consulting groups, most of whom are well known in the industry, the scope and detail in these vary; however, the existence of these does demonstrate historical and ongoing commitment to independent peer review. Several earlier reports are alluded to which have not been supplied to SRK for review and the scope of these is not clear.
The following were not supplied for SRK’s review:
| · | 1990s Magri Concultores Ltda |
| · | 1995 Magri Concultores Ltda and NCL contributed to the Feasibility Study |
| · | 2000s Kevin Olschevsky |
| · | 2001 Maptek Pty Ltd (Ujina) and MRDI (Rosario) |
| · | 2003 AMEC plc (Rosario) |
| · | 2008 Golder Associates Inc (Rosario and Ujina) |
The following were supplied for review:
| · | 2012 Golder Associates Inc (Rosario and Ujina) |
| · | 2016 Snowden (Rosario) |
| · | 2021 GeoInnova Consultores (Rosario) |
| · | 2022 SRK Consulting (Chile) (Rosario) |
| 12.2 | Quality Control and Library Records |
Data verification has been an integral part of all CMDIC drilling campaigns and resource estimation. The quality control programme and results are described in Section 11.7.1
As part of the drilling and sampling protocols, the half core, coarse rejects, and pulp samples are appropriately stored in racks located on site in three areas especially dedicated to this purpose, occupying an area of approximately 200 m by 600 m located 1 km north of the processing plant, as shown in Figure 12-1.
Many of the recent drilling samples are currently stored in pallets, on racks, at the Pozo Almonte logging facility, awaiting return to site, where one quarter of the core laydown area is ready to receive it. SRK also observed an RC chip tray storage room at Pozo Almonte.
| November 2025 | ||
| Page |
| SRK Consulting (UK) Limited | Mineral Resources and Mineral Reserves, Collahuasi Copper Mine - Main Report |
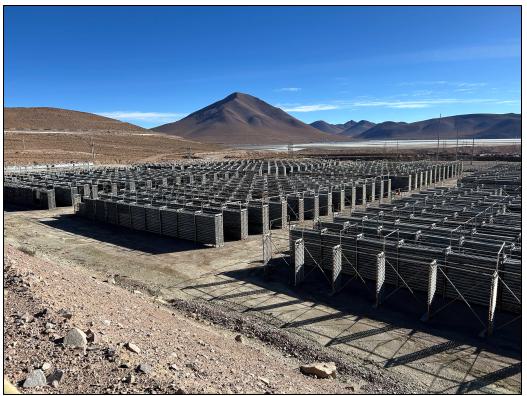
| Figure 12-1: | Core Storage Racks (October 2025) |
| 12.3 | Site Visit Inspection |
As part of the October 2025 site visit SRK inspected drillcore in the covered facility near the core storage area on site. Parts of DDH664 and DDH580 were laid out for inspection, representing drillhole from Rosario and Rosario West respectively; the nature of the mineralisation and associated alteration was observed.
SRK visited the Pozo Almonte logging facility but was unable to visit the sample preparation and assay facility during the QP site visit.
SRK visited a working drill site south of the haul road which runs along the southwestern perimeter of Rosario Pit where a track mounted Atlas Copco surface diamond coring rig was drilling DDH 1155 (Figure 12-3). NQ core from a depth of 345 m was observed in two boxes in which disseminated and veinlet hosted pyrite and chalcopyrite mineralisation were observed along with a 20 cm vein of high sulphidation mineralisation.
SRK visited the Ujina and Rosario open pit workings, observed mineralisation in hand specimen and the broader context of the orebody geometry though direct observation.
| November 2025 | ||
| Page |
| SRK Consulting (UK) Limited | Mineral Resources and Mineral Reserves, Collahuasi Copper Mine - Main Report |
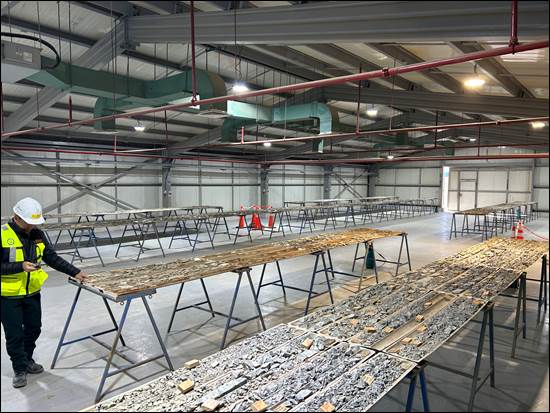
| Figure 12-2: | Drillcore for inspection at mine site (October 2025) |
| November 2025 | ||
| Page |
| SRK Consulting (UK) Limited | Mineral Resources and Mineral Reserves, Collahuasi Copper Mine - Main Report |
| Figure 12-3: | Drill rig on DDH 1155 (October 2025) |
| 12.4 | Data Entry Checks |
As part of the resource audits performed by Golder in 2012, to ensure the information registered on the logging sheets is correctly transferred into the database, 5% of drillholes in the database were selected and analysed to check for consistency. The comparison of the logging sheets against the database showed generally good consistency, especially in more recent drilling campaigns. Also during the audits, core from several drillholes were examined and compared to drill logs and assay certificates. No material discrepancies were noted during these checks.
| November 2025 | ||
| Page |
| SRK Consulting (UK) Limited | Mineral Resources and Mineral Reserves, Collahuasi Copper Mine - Main Report |
| 12.5 | Block Model Estimation Data Assessment |
The grades and other geometallurgical variables estimated in the long-term block model described in ITEM 14 are based on drilling, sampling and assaying which has been collected over 30 years. The reports that comment on the quality and reliability of the data vary in detail and the underling QAQC data have not been analysed by SRK from first principals; these reports and the drilling data supplied by CMDIC do not allow a detailed assessment of core and RC sample recovery data to be made.
SRK was supplied with core recovery data representing only the most recent drilling which leaves a question over the core recovery and RC sample weights belonging to the data informing the 2024 MRE block model. Sample recovery is a key data quality attribute which SRK has been unable to review satisfactorily.
Given some of the limitations on SRK’s review of the data quality, SRK has drawn on additional sources of support for the underlying data. The older drilling data prevalent in Ujina have been assessed using comparisons with recent drilling which has comprehensive and well documented sample preparation and laboratory QAQC. SRK has also used production records to provide a meaningful alternative source of verification of the Rosario model and by extension, the reliability of the data informing the model.
| 12.5.1 | Core recovery |
Core quality was noted on site to be generally quite broken, often shattered and unable to retain core cylinder shape. A limited amount of core recovery logging data were made available by CMDIC for review by SRK. There is normally low or no core recovery in the tops of drillholes where collared in pit on broken ground. Some drillholes have consistently good core recovery whilst others have multiple short or occasional long intervals of very low recovery values. SRK checked for a correlation of low core recovery values with high copper grades and is satisfied that there is no clear relationship between these variables.
| 12.5.2 | RC vs DD comparison |
In 2016 Snowden undertook an independent review comparing the RC vs the DD drilling results, which concluded that RC samples appeared to be negatively biased, likely due to loss of fines of a systematic partitioning of heavy particles away from the sample. Snowden noted piles of fine material deposited near RC drill rig cyclones based on video footage and images supplied at the time by CMDIC.
CMDIC undertook a study, as recommended, and agreed this effect was detectable when RC is compared to DD in the near surface oxide and mixed zone but there is no detectable effect in the primary material deeper down which is the future mine target.
SRK undertook a similar exercise using check estimates in the block model and found that in Rosario primary mineralisation the RC grade data is 1-2% lower than DDH whilst in secondary and oxide/mixed mineralisation there is a more significant difference of 30-50%. This suggests significant loss of mineralised fines by the RC drilling in softer rock types (however, these rock types make up only a small proportion of the future mine plan). In Ujina primary mineralisation the RC grades are 8% lower than DDH which may suggest poor RC sampling control at that time (RC meterage is about 25% of total meterage at Ujina and the 8% bias will be mitigated by the majority of samples being from DDH).
| November 2025 | ||
| Page |
| SRK Consulting (UK) Limited | Mineral Resources and Mineral Reserves, Collahuasi Copper Mine - Main Report |
| 12.5.3 | Ujina old vs new drilling comparison |
The recent drilling at Ujina has been reviewed by SRK in terms of total copper grade. There are three twin pairs which compare very well visually; however, greater emphasis is placed on SRK’s review of cross sections on which the new drilling data can be visually compared with grade contours derived from older data. The distribution of high, medium and low grade zones in the historical data, quite closely matches the new drilling which suggests the 3D grade block model at Ujina is robust and reflective of both datasets. The 10 m composited grades are also seen to be very similar where drillholes are close to each other.
Figure 12-4 is an example of a cross section showing the comparison described above, the new drillholes are plotted with thicker drillhole traces than the old drillholes.
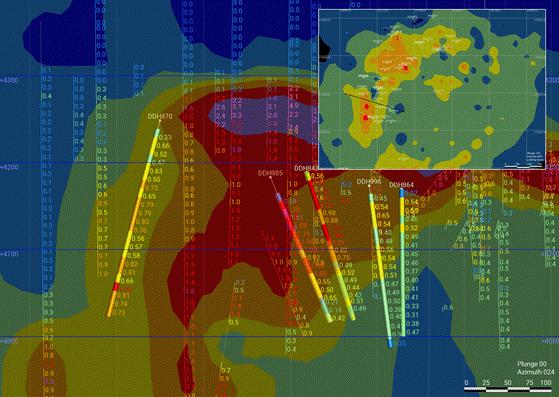
| Figure 12-4: | Ujina new drilling (thick trace lines) vs old (thin trace lines) (SRK, 2025) |
| 12.5.4 | Rosario resource model reconciliation |
Annual production records have been extracted from CMDIC M.1, M.2, and P.1 Exhibit reports which provide a monthly account of tonnage and copper grade determined by various methods:
| · | Run of mine (RoM) tonnage derived from the truck counts and onboard truck balance weight records: |
| o | extracted from the pit delivered to the crusher; |
| o | extracted from the pit and delivered to stockpiles; |
| · | removed from stockpiles and delivered to the crusher; |
| · | RoM grade leaving the pit based on the grade control (short term planning) model which incorporates blasthole sampling; and |
| November 2025 | ||
| Page |
| SRK Consulting (UK) Limited | Mineral Resources and Mineral Reserves, Collahuasi Copper Mine - Main Report |
| · | grade removed from stockpile and delivered to the crusher based on a dedicated stockpile block model informed by a combination of loading records and stockpile sampling. |
In addition to estimates of crushed tonnage delivered to the processing plant, there are records of tonnage and grade which passed through the processing plant based on in-line instrumentation ahead of the flotation circuit. This provides a check on the estimated tonnage and grade of the ore delivered to the crusher according to truck counts which after accounting for metallurgical recovery ties into copper accounted for in concentrate sales.
SRK has generated reports from the long-term regularised resource block model (Resource BM or LTBM) between end of year pit survey surfaces which provides annual estimates of the in-situ tonnage and grade, split into grade bins of:
| · | 0.3% - 0.6% total copper (material expected to go to the low-grade stockpile); and |
| · | >0.6% total copper (material expected to go directly to the processing plant). |
Annual summaries for 2020 through 2024 inclusive are shown in Table 12-1.
| November 2025 | ||
| Page |
| SRK Consulting (UK) Limited | Mineral Resources and Mineral Reserves, Collahuasi Copper Mine - Main Report |
| Table 12-1: | Production Reconciliation |
| 2020 | 2021 | 2022 | 2023 | 2024 | 2020-2024 inclusive | |||||
| SRK
Report from Long Term Block Model (LTBM) |
Total Ore > 0.3% Cu | Tonnage Estimate | Ore (Mt) | 74 | 101 | 83 | 71 | 58 | Resource BM | 387.1 |
| Cu Metal (t) | 7,857 | 9,091 | 8,026 | 6,980 | 6,220 | 38,174 | ||||
| Grade Estimate | Cu Grade (%) | 1.06% | 0.90% | 0.96% | 0.99% | 1.08% | 0.01% | |||
| HG > 0.6% Cu | Tonnage Estimate | Ore (Mt) | 56.6 | 61.7 | 75.1 | 54.6 | 46.1 | HG | 294.1 | |
| Cu Metal (t) | 705,767 | 727,301 | 764,410 | 626,267 | 566,142 | 3,389,888 | ||||
| Grade Estimate | Cu Grade (%) | 1.25% | 1.18% | 1.02% | 1.15% | 1.23% | 1.15% | |||
| LG 0.3-0.6% Cu | Tonnage Estimate | Ore (Mt) | 17.6 | 39.0 | 8.0 | 13.1 | 6.2 | LG | 84.0 | |
| Cu Metal (t) | 79,955 | 180,806 | 36,757 | 56,326 | 25,512 | 379,357 | ||||
| Grade Estimate | Cu Grade (%) | 0.45% | 0.46% | 0.46% | 0.43% | 0.41% | 0.45% | |||
| Production Report M.2 | Pit direct to Crusher | Truck Balance | Ore (Mt) | 39.5 | 40.7 | 48.5 | 40.8 | 36.7 | direct to crusher | 206.2 |
| Cu Metal (t) | 503,057 | 507,680 | 539,567 | 502,195 | 472,377 | 2,524,875 | ||||
| GCBM | Cu Grade (%) | 1.27% | 1.25% | 1.11% | 1.23% | 1.29% | 1.22% | |||
| Stockpiles to Crusher | Truck Balance | Ore (Mt) | 16.3 | 15.0 | 8.8 | 16.6 | 23.3 | stockpile unloading | 80.0 | |
| Cu Metal (t) | 190,497 | 187,989 | 96,552 | 168,527 | 219,506 | 863,071 | ||||
| GCBM | Cu Grade (%) | 1.17% | 1.26% | 1.10% | 1.02% | 0.94% | 1.08% | |||
| Pit to Stockpiles | Truck Balance | Ore (Mt) | 32.2 | 60.9 | 33.1 | 17.7 | 11.4 | stockpile loading | 155.2 | |
| Cu Metal (t) | 281,805 | 416,885 | 279,367 | 182,109 | 141,883 | 1,302,050 | ||||
| GCBM | Cu Grade (%) | 0.88% | 0.68% | 0.84% | 1.03% | 1.25% | 0.84% | |||
| Total Ore Mined ex Pit | Truck Balance | Ore (Mt) | 71.7 | 101.6 | 81.6 | 58.5 | 48.1 | RoM ex pit | 361.5 | |
| Cu Metal (t) | 784,862 | 924,566 | 818,934 | 684,303 | 614,260 | 3,826,924 | ||||
| GCBM | Cu Grade (%) | 1.09% | 0.91% | 1.00% | 1.17% | 1.28% | 1.06% | |||
| Total to Crusher | Truck Balance | Ore (Mt) | 55.8 | 55.6 | 57.3 | 57.4 | 60.1 | Crush M.2 | 286.2 | |
| Cu Metal (t) | 693,554 | 695,669 | 636,119 | 670,722 | 691,882 | 3,387,945 | ||||
| GCBM | Cu Grade (%) | 1.24% | 1.25% | 1.11% | 1.17% | 1.15% | 1.18% | |||
| Stockpile Movement | Truck Balance | Ore (Mt) | 15.9 | 45.9 | 24.3 | 1.1 | -12.0 | net stockpile movement | 75.3 | |
| Cu Metal (t) | 91,308 | 228,897 | 182,815 | 13,581 | -77,623 | 438,979 | ||||
| GCBM | Cu Grade (%) | 0.57% | 0.50% | 0.75% | 1.23% | 0.65% | 0.58% | |||
| Reconciliation Factors | Tonnage (RoM / LTBM) | 0.97 | 1.01 | 0.98 | 0.83 | 0.83 | 0.93 | |||
| Metal (RoM / LTBM) | 99.89 | 101.70 | 102.03 | 98.03 | 98.76 | 100.25 | ||||
| Grade (RoM / LTBM) | 1.03 | 1.01 | 1.04 | 1.19 | 1.19 | 107.35 | ||||
| Tonnage (Crusher Feed / RoM) | 0.78 | 0.55 | 0.70 | 0.98 | 1.25 | 0.79 | ||||
| Metal (Crusher Feed / RoM) | 0.88 | 0.75 | 0.78 | 0.98 | 1.13 | 0.89 | ||||
| Grade (Crusher Feed / RoM) | 1.14 | 1.37 | 1.11 | 1.00 | 0.90 | 1.12 | ||||
| November 2025 | ||
| Page |
| SRK Consulting (UK) Limited | Mineral Resources and Mineral Reserves, Collahuasi Copper Mine - Main Report |
The four year reconciliation shows that the estimate of RoM leaving the pit is 7% lower in tonnage and 7% higher in grade than the equivalent in situ material estimated in the long term resource block model; the net result is that copper content in the estimates compares well.
Whilst the reconciliation provides good support for the long term block model, it indicates to SRK a number of possibilities which are worthy of further investigation, some or all of the points below may be happening:
| · | The 15 m regularisation in the resource block model (LTBM) may be too coarse, presenting an over-diluted version of the in situ mineralisation, compared with smaller scale and geometrically more suitable selective mining shapes used for dig line delineation. |
| · | Density maybe over-estimated in the resource block model, possibly reflecting sampling bias due to preferential sampling of solid core rather than broken clay-rich core. |
| · | Grade may be under-estimated in the resource block model, possibly reflecting a negative bias due to: |
| o | loss of high grade fines at the RC drill rig (not considered significant in the primary mineralisation); |
| o | core loss in fractured and soft altered rock associated with mineralised zones; and/or |
| o | excessive restriction of high grades in the block model grade estimation strategy. |
| November 2025 | ||
| Page |
| SRK Consulting (UK) Limited | Mineral Resources and Mineral Reserves, Collahuasi Copper Mine - Main Report |
| ITEM 13 | MINERAL PROCESSING AND METALLURGICAL TESTING |
| 13.1 | Historical Metallurgical Domaining |
In Collahuasi’s early history, a number of metallurgical domains (unidades geometalúrgicas or UGM) were identified for Rosario, Rosario West, and Ujina, based on variations in weathering, lithology, alteration, etc. These domains, and their distinguishing features, are shown in Table 13-1 and illustrated in Figure 13-1. Geomet domains are assigned to the block model through a calculation, referencing the coded geological domains. Lithology coding, Mineral Zone coding (redox state/cu mineralogy), and alteration coding are used in combination to assign the geomet domains. The Lithology, Mineral Zone and Alteration coding is assigned originally into the sub-cell model from wireframe triangulations, then regularized into the reporting model using a 'majority' coding approach.
| Table 13-1: | CMDIC metallurgical domains |
| Orebody | UGM | Mineral Zone | Alteration | Lithology |
| Rosario | 1 | Primary / primary pyritic | Argillic / Chlorite-Sericite | Porphyry and Hydrothermal Breccias |
| 2 | Primary / primary pyritic | Argillic / Chlorite-Sericite | Host Rock | |
| 3 | Primary / primary pyritic | Quartz Sericite / Potassic / Propylitic | Porphyry and Hydrothermal Breccias | |
| 4 | Primary / primary pyritic | Quartz Sericite / Potassic / Propylitic | Host Rock | |
| 5 | Secondary | Argillic / Chlorite-Sericite | all | |
| 6 | Secondary | Quartz Sericite / Potassic / Propylitic | all | |
| Rosario West | 21 | Leached / oxide / mixed | all | all |
| 22 | Secondary | all | Andesite / Sedimentary | |
| 23 | Secondary | all | Porphyry / Breccias / Acid Rocks | |
| 24 | Primary | all | all | |
| Ujina | 11 | Primary | Argillic-Phyllic-Chlorite + Sericite | Porphyry |
| 12 | Primary | Propylitic + Potassic | Porphyry | |
| 13 | Primary | all | all | |
| 14 | Secondary | all | all |
| November 2025 | ||
| Page |
| SRK Consulting (UK) Limited | Mineral Resources and Mineral Reserves, Collahuasi Copper Mine - Main Report |
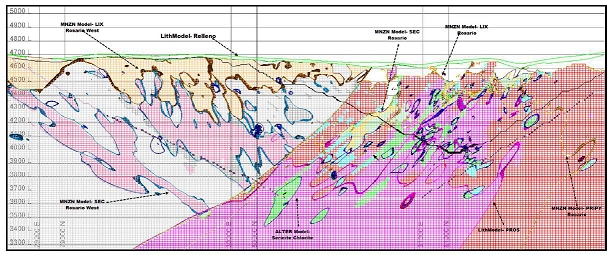
| Figure 13-1: | Geomet domain illustration (SRK, 2025) |
| 13.2 | Geometallurgical Modelling – Rosario, Rosario West |
Apart from aggregating and reporting purposes, the UGM for Rosario and Rosario West have largely been superseded by a geometallurgical model that was initially developed for comminution in around 2006-07 and which was subsequently expanded starting in 2020 to incorporate flotation behaviour.
The model is updated on an annual basis. Samples are selected and the following analysis and testwork conducted:
| · | Chemical assay. |
| · | Comminution tests: SMC Test, Bond Ball Mill Work Index. |
| · | Mineralogy: SEM analysis (QEMSCAN/TIMA) for sulphides, including a liberation analysis, XRD (on interval samples) / NIR (downhole) for clay speciation. |
| · | Flotation rougher kinetic tests, at different grind sizes and residence times. |
The results of the laboratory rougher flotation tests are compared to historical plant operating data, and a scale-up is developed to relate the laboratory rougher results to a full circuit response.
| November 2025 | ||
| Page |
| SRK Consulting (UK) Limited | Mineral Resources and Mineral Reserves, Collahuasi Copper Mine - Main Report |
As an illustration of the growth of the geomet database, Figure 13-2 shows the number of rougher tests added to the database each year since 2019, and Figure 13-3 shows the spatial location (in plan view) of the samples added each year.
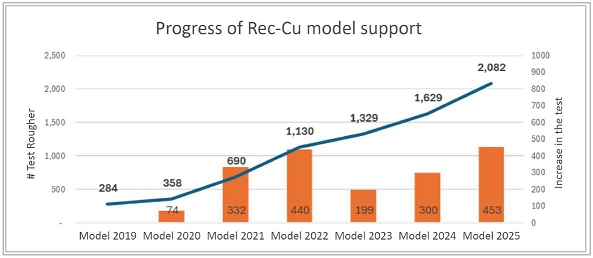
| Figure 13-2: | Geomet model database growth: rougher tests (CMDIC, 2025) |
| November 2025 | ||
| Page |
| SRK Consulting (UK) Limited | Mineral Resources and Mineral Reserves, Collahuasi Copper Mine - Main Report |
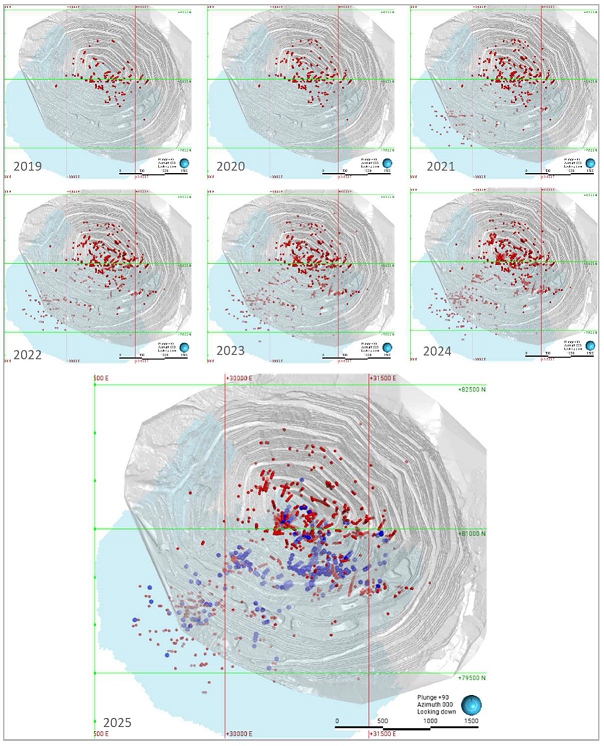
| Figure 13-3: | Geomet model database growth: sample locations (CMDIC, 2025) |
The comminution test parameters are used as inputs to simulations of the circuit using JKSimMet to determine the specific comminution energy for a selected grind size (P80), and these parameters are then related to the chemical and mineralogical properties of the sample tested. This allows the block model to be populated with an estimate of the throughput for that block to the target grind size, and/or a check that the block will meet plant capacity to the target grind size. At 170 ktpd and 185 ktpd, this latter condition is typically met; however, at 210 ktpd there will be instances where the throughput estimate for some blocks is expected to fall short of that figure.
| November 2025 | ||
| Page |
| SRK Consulting (UK) Limited | Mineral Resources and Mineral Reserves, Collahuasi Copper Mine - Main Report |
A process of simultaneous linear multiple regressions is used to generate equations that relate flotation circuit outcomes to the underlying model parameters. As an example, the updated equation for copper recovery is:
| Equation 13-1: | Cu recovery = 114.5864 – 8.6406 * CuT – 127.6718 * CuS – 0.004 * MoT + 0.0026 * As + 4.9181 * Cpy + 12.8606 * Bo + 14.9654 * Cc + 0.293 * Py + 0.4512 * Kao – 1.8471 * Pir – 0.0163 * muscill – 0.0206 * BWi – 0.3281* Recc |
where: CuT = % total Cu by assay
CuS = %acid soluble Cu by assay
MoT = % Mo by assay
As = % As by assay
Cpy = % chalcopyrite by mineralogy
Bo = % bornite by mineralogy
Cc = % chalcocite by mineralogy
Py = % pyrite by mineralogy
Kao = % kaolinite by mineralogy
Pir = % pyrophyllite by mineralogy
muscill = % muscovite + illite by mineralogy
BWi = Bond Work Index
Recc = scaled recovery
Similar relationships have been developed for Cu concentrate grade, Mo recovery (both to collective concentrate and to final Mo concentrate), and Mo concentrate grade.
The recovery equation is then modified to reflect factors derived for production rates of 185 ktpd and 210 ktpd, represented by a decrease of 2.3 and 4.0%, respectively.
The recovery equation is thereafter capped by domain between 88.4% and 90.6% for the 210 ktpd scenario.
Figure 13-4 shows a comparison of the model predicted Cu recovery and the plant results over the period 2020-24. Figure 13-5 shows a comparison of the model and actual Cu concentrate grade over the same period. Figure 13-6 shows a comparison of the model and actual Mo selective recovery over the period 2020-24.
| November 2025 | ||
| Page |
| SRK Consulting (UK) Limited | Mineral Resources and Mineral Reserves, Collahuasi Copper Mine - Main Report |
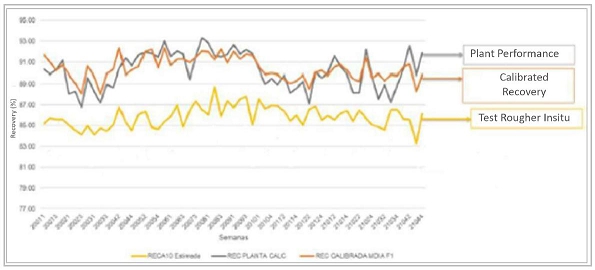
| Figure 13-4: | Comparison between model and plant: 2020-24 Cu recovery (CMDIC, 2024) |
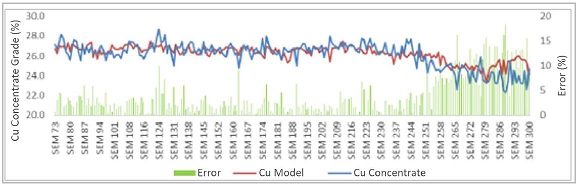
| Figure 13-5: | Comparison between model and plant: 2020-24 Cu concentrate grade (CMDIC, 2024) |
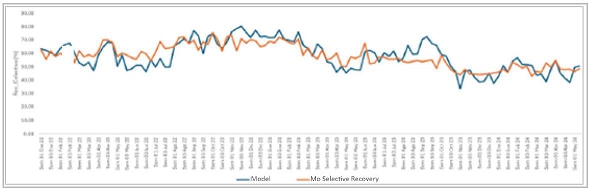
| Figure 13-6: | Comparison between model and plant: 2020-24 Mo selective recovery (CMDIC, 2024) |
The greater error in the Cu concentrate grade predictions is likely a function of the greater proportion of low-grade stockpile material that has been fed into the plant in recent months.
Regarding stockpiled material, the Cu recovery estimates generated by the geometallurgical model for this material is discounted by 5% to reflect the impact of weathering of this material.
Within these relationships, there are certain components which present stronger correlations; for example, the CuSol relationship versus recovery for the Rosario West UGM 23 (Figure 13-7). The distribution of copper soluble mineralisation can in turn be linked to the different Geomet domains, reflective of the different distributions observed in Rosario and Rosario West (Figure 13-8).
| November 2025 | ||
| Page |
| SRK Consulting (UK) Limited | Mineral Resources and Mineral Reserves, Collahuasi Copper Mine - Main Report |
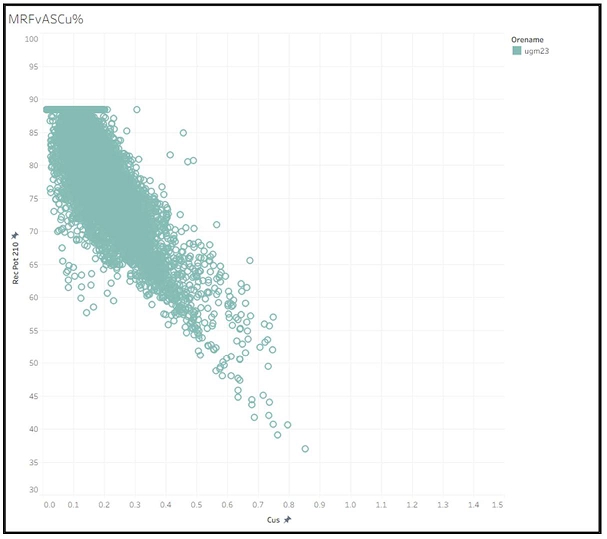
| Figure 13-7: | UGM 23 Cu Soluble versus Recovery for Measured and Indicated material with Mineral Reserve pit (SRK, 2025) |
| November 2025 | ||
| Page |
| SRK Consulting (UK) Limited | Mineral Resources and Mineral Reserves, Collahuasi Copper Mine - Main Report |
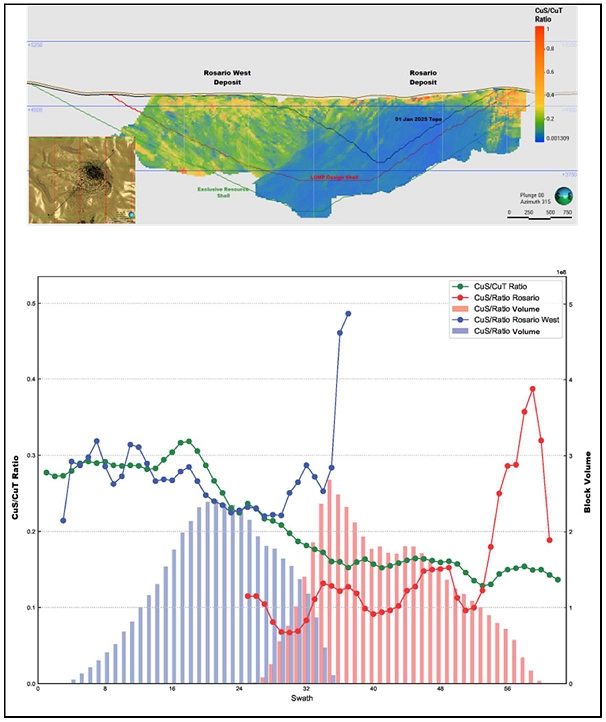
| Figure 13-8: | CuSol/CuT distribution (SRK, 2025) |
Production experience has linked the clay content (specifically muscovite+illite) to throughput constraints, which is recognised as a negative impact in the recovery relationship. The distribution of the clay minerals can be observed in Figure 13-9.
| November 2025 | ||
| Page |
| SRK Consulting (UK) Limited | Mineral Resources and Mineral Reserves, Collahuasi Copper Mine - Main Report |
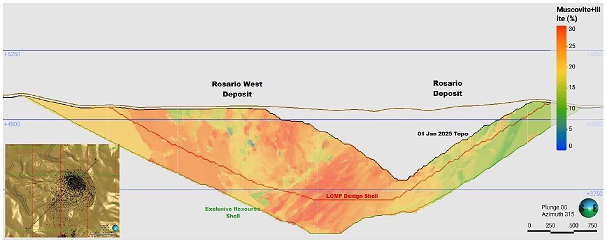
| Figure 13-9: | Cross Section illustrating Muscovite+Illite distribution within the Rosario and Rosario West domains (SRK, 2025) |
| 13.3 | Geometallurgical Modelling - Ujina |
In 2025, CMDIC commissioned GeoInnova Consultores SPA (GeoInnova), who developed the geometallurgical model for Rosario/Rosario West, to develop a model for Ujina. Having reviewed the available data, GeoInnova identified weaknesses with the available data:
| · | the available drillhole data were concentrated in the north-west area of the pit, and was therefore not representative of the deposit; |
| · | significant occurrences of secondary copper mineralisation (chalcocite) were recorded in domains (UGM) otherwise identified as Primary; |
| · | recovery in Primary zones was strongly influenced by iron; however, the occurrence and distribution of Fe minerals was not well understood; and |
| · | there was an absence of NIR mineralogy data to identify and quantify the influence of clay minerals. |
GeoInnova therefore recommended that CMDIC implement a formal geometallurgical sampling policy for Ujina.
In the absence of a geometallurgical model for Ujina, recovery and grade predictions for Ujina are based on the UGM level values that were developed historically.
| November 2025 | ||
| Page |
| SRK Consulting (UK) Limited | Mineral Resources and Mineral Reserves, Collahuasi Copper Mine - Main Report |
| ITEM 14 | MINERAL RESOURCE ESTIMATES |
| 14.1 | Introduction |
The Mineral Resource Statement presented herein represents the latest in a series of Mineral Resource estimates starting in 1995. The most recent estimate for Ujina is based on data available and modelling completed when mining ceased soon after 2012. The data and model have been substantially verified by drilling completed relatively recently although the model has not yet been updated to incorporate this.
The most recent estimate for the Rosario and Rosario West deposits was completed in 2024 building on an ongoing resource definition drilling programme and geological knowledge gained from mining.
This section describes the Mineral Resource estimation methodology and summarizes the key assumptions considered by CMDIC in preparing the resource estimate. In the opinion of SRK, the estimates reported herein are a sound representation of the copper and molybdenum Mineral Resources found on the Collahuasi property at the current level of sampling. The Mineral Resources have been estimated in conformity with generally accepted CIM “Estimation of Mineral Resource and Mineral Reserves Best Practices” guidelines.
SRK is of the opinion that the current drilling information is sufficiently reliable to interpret with confidence the boundaries for porphyry and high sulphidation copper mineralization and that the assay data are sufficiently reliable to support Mineral Resource estimation of Cu and Mo.
CMDIC used Leapfrog ® Geo and Maptek Vulcan to review, verify, and design the resource estimation domains, prepare assay data for geostatistical analysis, construct the block model, estimate metal grades, and tabulate Mineral Resources.
The following sections describe the data, methodology and procedures related to the construction of the geological models and block grade estimates carried out for the different deposits considered in this Technical Report.
| 14.2 | Resource Estimation Procedures |
The resource estimation methodology involved the following procedures:
| · | database compilation and verification; |
| · | design and construction of wireframe geological models; |
| · | definition of estimation domains; |
| · | data Conditioning including compositing and high-grade outlier analysis; |
| · | geostatistical analysis and grade continuity modelling (variography); |
| · | block modelling and grade interpolation; |
| · | validation of block estimates; |
| · | resource classification; |
| · | assessment of “reasonable prospects for economic extraction” and selection of appropriate cu-off grades; and |
| November 2025 | ||
| Page |
| SRK Consulting (UK) Limited | Mineral Resources and Mineral Reserves, Collahuasi Copper Mine - Main Report |
| · | preparation of the Mineral Resource statement. |
| 14.3 | The Resource Database |
The Mineral Resource database, upon which the models and estimates are based, comprises 3,895 drillholes totalling 1,093 km for Rosario and Rosario West, and 931 drillholes totalling 219 km for Ujina. Further details are given in ITEM 10.
The Rosario deposit is typically drilled on a 50 x 50 m grid, and locally up to 20 x 20 , with holes typically drilled at 45° or 225°, perpendicular to the main mineralised trend (Figure 14-1). Drillhole density decreases with depth, with spacings typically around 150 x 150 m below the 31 December 2024 pit survey.
The Rosario West deposit is typically drilled on a 100 x 100 m, locally up to 50 x 50 m, in the northern part of the deposit, close to the southern extent of Rosario. Drill spacings increase in the south to between 150 m and 200 m (Figure 14-2). Drill sections through Rosario West are aligned at 90° or 270°, roughly perpendicular to the main mineralised trends.
The Ujina deposit is typically drilled on 70 x 70 m grid, locally up to 30 x 30 m. A large number of drillholes are vertical, while inclined sections are usually at 315° or 135° (Figure 14-3).
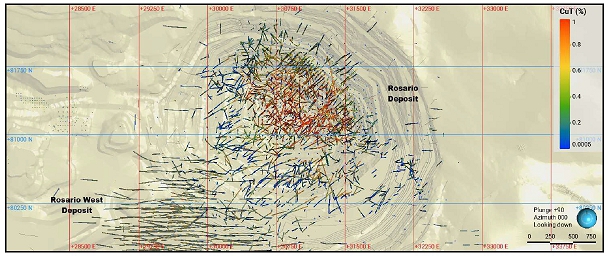
| Figure 14-1: | Rosario Deposit plan view of available CuT (%) drilling data (SRK, 2025) |
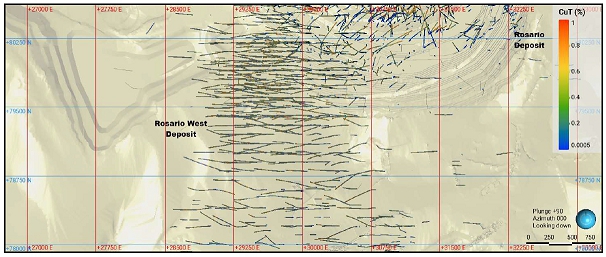
| Figure 14-2: | Rosario West Deposit plan view of available CuT (%) drilling data (SRK, 2025) |
| November 2025 | ||
| Page |
| SRK Consulting (UK) Limited | Mineral Resources and Mineral Reserves, Collahuasi Copper Mine - Main Report |
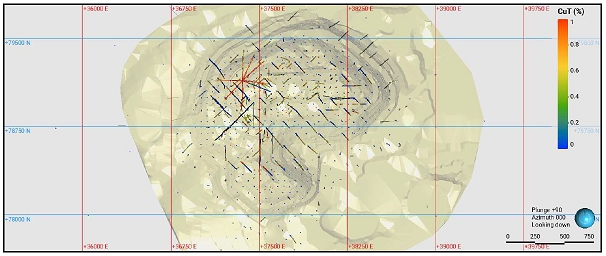
| Figure 14-3: | Ujina Deposit plan view of available CuT (%) drilling data (SRK, 2025) |
| 14.4 | Geological Modelling |
The distribution of Cu and Mo mineralization at the Rosario, Rosario West, and Ujina deposits is controlled by a combination of lithological, structural, geochemical, and hydrothermal processes. Geological models have been developed on a combined basis for Rosario and Rosario West, and there is a separate model for Ujina.
To suitably characterize the Cu and Mo distribution, the following models have been prepared:
| · | Structural Model: including syn-mineralization features, major post-mineralization structures which offset the stratigraphy and intrusives, as well as late structures associated with supergene enrichment. |
| · | Lithological Model: including key intrusive phases and host volcanic stratigraphy. |
| · | Alteration Model – Including key differentiation between alteration assemblages indicative of Cu mineralization (Potassic and Phyllic versus Argillic). |
| · | Cu Mineralogy Model: including differentiation between primary and secondary Cu sulphide assemblages and Cu Oxide assemblages. |
| · | Cu and Mo Grade Shells: indicative of (hyrdrothermal) zonation of Cu and Mo mineralization intensity, particularly within the primary sulphide zone. |
In all cases, CMDIC has used the available information (drill logging, field maps, aerial photos, etc) to develop the models using Leapfrog ® Geo. These models have been used to define the final estimation domains employed in the grade estimation.
| 14.4.1 | Structural model |
The distribution of Cu and Mo mineralisation and lithological units at Rosario and Rosario West are strongly influenced by structures, most significantly the NW trending Rosario and Ponderosa vein systems and then N-NE trending Montezuma and La Grande vein systems. Surficial mapping, core logging, and grade data have been used to model key structures. Most notably, blast hole grades have been used to trace significant grade controlling features at a high level of detail. Importantly, the orientation of these features are considered during grade estimation to locally align search volumes (Figure 14-4). Observed age relationships have been incorporated into the structural interpretation and particular structures have been used to offset the lithological model. In total, 311 structures are modelled at Rosario and Rosario West.
| November 2025 | ||
| Page |
| SRK Consulting (UK) Limited | Mineral Resources and Mineral Reserves, Collahuasi Copper Mine - Main Report |
Structural influence on the distribution of Cu and Mo mineralisation at Ujina is interpreted to be less important than Rosario and Rosario West. Structural data are also limited, and the structural model has been based entirely on pit mapping and topographical characteristics. A total of 50 structures are modelled at Ujina.
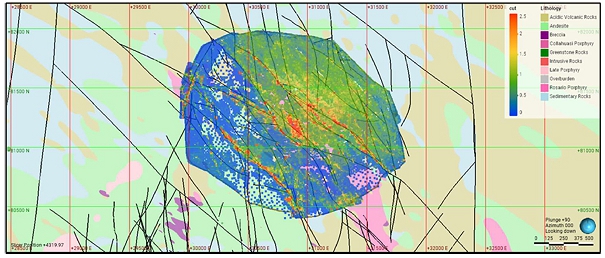
| Figure 14-4: | Rosario and Rosario West Structural Model plan view at 4320 m elevation; overlaid blast hole samples coloured by CuT% grade (SRK, 2025) |
| 14.4.2 | Lithological model |
The host rocks at Rosario, Rosario West, and Ujina comprise volcano-sedimentary stratigraphy intruded by several granodioritic and monzonite plutons, most significantly the Oligocene Rosario Porphyry, Collahuasi Porphyry and the Ujina Porphyry. At Ujina, a Cenozoic (post-mineralization) ignimbrite unconformably overlies the basement sequence and the mineralisation.
Surficial mapping and lithological logging from drilling have been used to develop models of the most significant lithological units at Rosario, Rosario West, and Ujina (Figure 14-5 and Figure 14-16). The lithological models consider any known significant structural offsets.
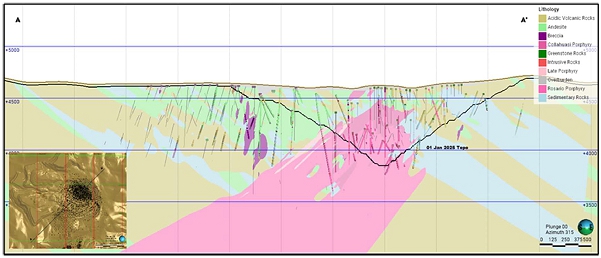
| Figure 14-5: | Rosario and Rosario West Lithological Model cross-section looking NW; Section A-A’ location inset left (SRK, 2025) |
| November 2025 | ||
| Page |
| SRK Consulting (UK) Limited | Mineral Resources and Mineral Reserves, Collahuasi Copper Mine - Main Report |
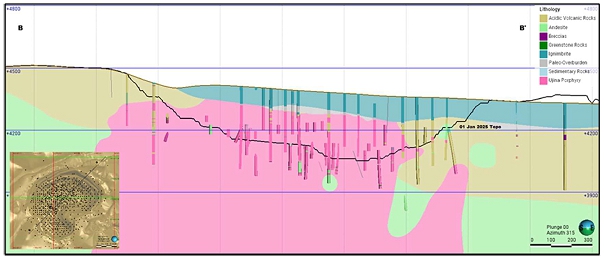
| Figure 14-6: | Ujina Lithological Model cross-section looking NW; Section B-B’ location inset left (SRK, 2025) |
| 14.4.3 | Alteration model |
Rosario, Rosario West, and Ujina deposits are characterized by zoned alteration assemblages that are typical of Cu-Mo porphyry systems. There is a well-established framework used to understand the spatial distribution of hydrothermal alteration minerals around porphyritic intrusions. Core logging mineralogical information, in conjunction with this framework, were used to develop the alteration models.
At Rosario and Rosario West, a potassic alteration assemblage is centred on the Rosario Porphyry and locally surrounded by a phyllic alteration assemblage. Propylitic alteration occurs distal to the porphyry. An argillic alteration assemblage occurs above the Rosario porphyry but this extends through Rosario West, where the Rosario fault system controls the emplacement of high-sulphidation veins (Figure 14-7).
At Ujina, similar zonation is observed centred on the Ujina porphyry, although the deposit is capped by an unaltered (fresh) ignimbrite (Figure 14-8).
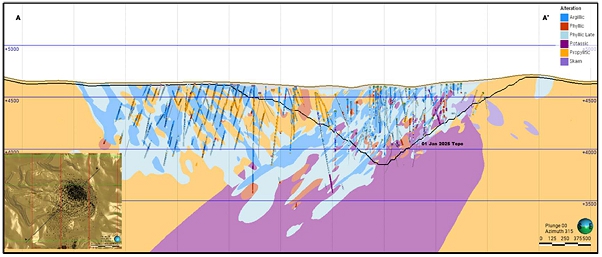
| Figure 14-7: | Rosario and Rosario West Alteration Model cross-section looking NW; Section A-A’ location inset left (SRK, 2025) |
| November 2025 | ||
| Page |
| SRK Consulting (UK) Limited | Mineral Resources and Mineral Reserves, Collahuasi Copper Mine - Main Report |
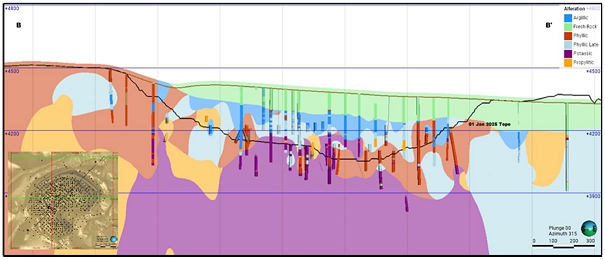
| Figure 14-8: | Ujina Alteration Model cross-section looking NW; Section B-B’ location inset left (SRK, 2025) |
| 14.4.4 | Cu Mineralogy model |
Similar to alteration, there is a well-established framework used to understand the spatial distribution of copper (and molybdenum) mineralization around the porphyritic intrusions. Core logging mineralogical information, in conjunction with this framework, were used to develop the Cu mineralogy models.
At Rosario, primary sulphide mineralization (diginite, bornite, chalcopyrite, pyrite and molybdenite) is centred on the Rosario porphyry, surrounded by pyrite coincident with the propylitic alteration zone. Molybdenite appears associated with the early stages of deposit development and is located mainly in the centre of the deposit. The alteration and mineralization zones developed early in the deposit are overlain by a late vein system of high-grade copper and arsenic, compatible with the high-sulphidisation type (Figure 14-9).
The Rosario Fault system also controls a supergene event that leached the upper part of the deposit and generated secondary enrichment zones. The oxide and mixed bodies (chrysocolla, malachite, and brochantite), in turn, are very poorly developed and are characterized by small bodies that appear at shallow depths relative to the current surface.
At Ujina, primary sulphide mineralization (chalcopyrite and pyrite) is spatially related to the Ujina porphyry, surrounded by a distal pyritic zone. The high-grade zones correspond to the contact between Ujina and Collahuasi porphyries. Deep weathering has produced significant tonnages of secondary enriched copper sulphide and oxide minerals that overlie the primary chalcopyrite material. At Ujina, the ignimbrite which overlies the deposit is barren (Figure 14-10).
| November 2025 | ||
| Page |
| SRK Consulting (UK) Limited | Mineral Resources and Mineral Reserves, Collahuasi Copper Mine - Main Report |
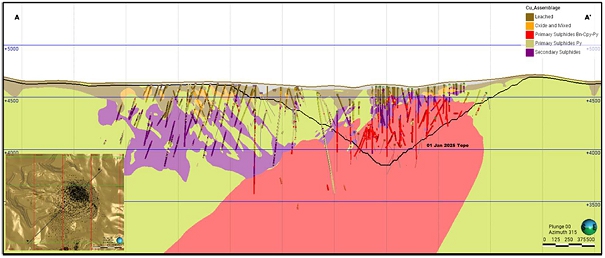
| Figure 14-9: | Rosario and Rosario West Cu Mineralogy Model cross-section looking NW; Section A-A’ location inset left (SRK, 2025) |
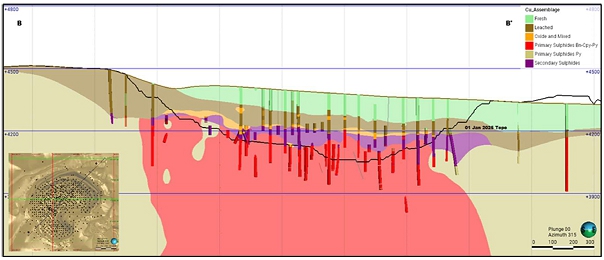
| Figure 14-10: | Ujina Cu Mineralogy Model cross-section looking NW; Section A-A’ location inset left (SRK, 2025) |
| 14.4.5 | Cu and Mo grade shells |
As noted in Section 14.4.4, Cu and Mo mineralization at Rosario and Rosario West is zoned and locally increases in intensity associated with major structures, where hydrothermal fluids have been focussed. Late secondary (supergene) mineralization is typically zoned and focussed on these structures as well. High copper grades are found in the mixed oxide, secondary sulphide, and primary sulphide zones, while the leached and primary pyritic zones contain low Cu grades (Figure 14-11).
CMDIC has modelled Cu and Mo grade shells based on sample assays and chalcopyrite and bornite proportion contour shells based on visual logging data, which represent zoning of grade and mineralogy characteristic of primary sulphide mineralization (Figure 14-12, Figure 14-13, and Figure 14-14). Cut-offs employed to define the extent of the shells represent statistical breaks as well as interpreted localisation of grade change. These grade shells have been guided in geometry and anisotropy by the modelled structures known to exert local influence.
| November 2025 | ||
| Page |
| SRK Consulting (UK) Limited | Mineral Resources and Mineral Reserves, Collahuasi Copper Mine - Main Report |
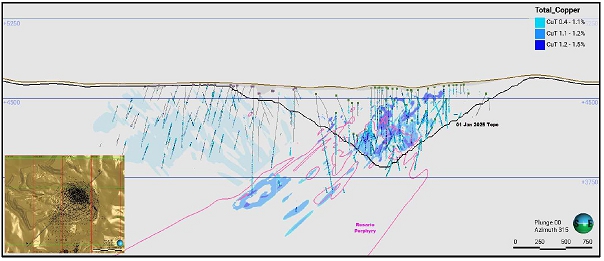
| Figure 14-11: | Rosario and Rosario West Cu Grade Shell Model cross-section looking NW; Section A-A’ location inset left |
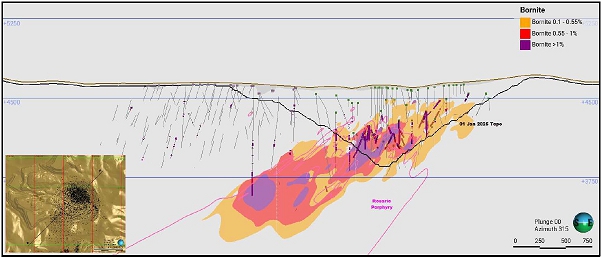
| Figure 14-12: | Rosario Bornite Grade Shell Model cross-section looking NW; Section A-A’ location inset left (SRK, 2025) |
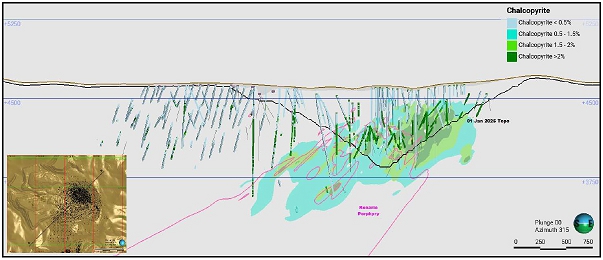
| Figure 14-13: | Rosario Chalcopyrite Grade Shell Model cross-section looking NW; Section A-A’ location inset left (SRK, 2025) |
| November 2025 | ||
| Page |
| SRK Consulting (UK) Limited | Mineral Resources and Mineral Reserves, Collahuasi Copper Mine - Main Report |
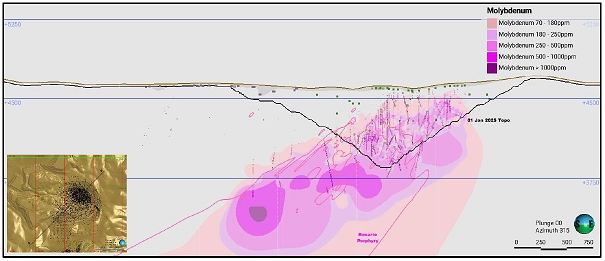
| Figure 14-14: | Rosario Mo Grade Shell Model cross-section looking NW; Section A-A’ location inset left (SRK, 2025) |
| 14.4.6 | Additional models |
CMDIC has modelled additional sub-domains to characterize the distribution of other elements at the project, including Au, Ag, and As. For example, As is largely associated with enargite mineralization which is localized in structures characteristic of high-sulphidation epithermal veining predominantly in Rosario West, in the hangingwall of the Rosario Fault (Figure 14-15).
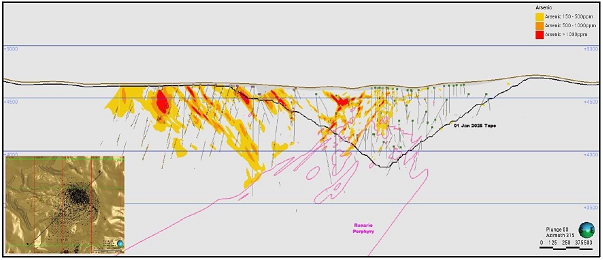
| Figure 14-15: | Rosario and Rosario West As Grade Shell Model cross-section looking NW; Section A-A’ location inset left (SRK, 2025) |
| 14.4.7 | Final estimation domains |
All models are coded with unique identifiers into the combined Rosario and Rosario West block model and the Ujina block model as well as the drillhole databases. The final estimation domain model for Cu and Mo is based on the lithology, alteration, Cu mineralogy, and grade shell models. The description of each domain and the equivalent coded value are listed in Table 14-1 and Table 14-2 for Cu and Mo, respectively.
Final density estimation domains are similarly established, but are more simplified due to the relatively low variance of informing data.
| November 2025 | ||
| Page |
| SRK Consulting (UK) Limited | Mineral Resources and Mineral Reserves, Collahuasi Copper Mine - Main Report |
| Table 14-1: | Final Estimation Domain Matrix for Cu |
| Deposit | Estimation
Domain (UGCuT) |
Lithology Model | Alteration Model | Cu
Mineralogy |
Cu Grade |
Bornite Grade |
Chalcopyrite Grade |
| Rosario | 0 | Overburden | |||||
| 1 | Leached | ||||||
| 2 | Oxide/Mixed | ||||||
| 3 | Secondary | ||||||
| 4 | Primary | >1.1% | |||||
| 5 | 0 - 0.55% | 0 - 1.5% | |||||
| 6 | >1.5% | ||||||
| 7 | >0.55% | ||||||
| 8 | Primary Pyrite | ||||||
| Rosario West | 0 | Overburden | |||||
| 11 | Leached | ||||||
| 12 | Oxide/Mixed | ||||||
| 13 | Secondary | >0,4% | |||||
| 14 | |||||||
| 15 | Argillic, Phyllic | ||||||
| 16 | Propylitc, Potassic | ||||||
| Ujina | 1 | Leached | |||||
| 2 | Oxide | ||||||
| 3 | Mixed | ||||||
| 4 | Porphyry, Volcanics | Secondary | |||||
| 5 | Andesite | Argillic, Phyllic, Potassic | |||||
| 6 | Porphyry, Volcanics | Phyllic, Propylitic | |||||
| 7 | Argillic, Phyllic,Potassic | ||||||
| 8 | Argillic, Phyllic | Primary | |||||
| 9 | Phyllic, Prop, Potassic | ||||||
| 10 | Andesite | Potassic | |||||
| 11 | Acidic, Porphyry | Phyllic | |||||
| 12 | Porphyry, Volcanics | Primary Pyrite | |||||
| 13 | Acidic, Porphyry |
| November 2025 | ||
| Page |
| SRK Consulting (UK) Limited | Mineral Resources and Mineral Reserves, Collahuasi Copper Mine - Main Report |
| Table 14-2: | Final Estimation Domain Matrix for Mo |
| Deposit | Estimation Domain (UGMoT) |
Lithology | Alteration | Cu
Mineralogy |
Mo
Grade |
Bornite Grade |
Chalcopyrite Grade |
| Rosario | 0 | Overburden | |||||
| 1 | >180ppm | ||||||
| 2 | <0.55% | <0.5% | |||||
| 3 | >0.5% | ||||||
| 8 | >0.55% | ||||||
| Rosario West | 0 | Overburden | |||||
| 11 | Leached | ||||||
| 12 | Oxide/Mixed | ||||||
| 13 | Breccia, Porphyry | Secondary | |||||
| 14 | Volcanic, Sediments | ||||||
| 15 | Breccia, Porphyry | Primary, Primary Pyrite | |||||
| 16 | Volcanic, Sediments | ||||||
| Ujina | 1 | Leached | |||||
| 2 | Oxide | ||||||
| 3 | Mixed | ||||||
| 4 | Porphyry, Volcanics | Argillic, Phyllic, Potassic | Secondary | ||||
| 5 | Phyllic, Propylitic | ||||||
| 6 | All | ||||||
| 7 | Argillic | ||||||
| 8 | Excluding Argillic | Primary | |||||
| 9 | Acidic Volcanics | ||||||
| 10 | Porphyry, Volcanics | Potassic | |||||
| 11 | Phyllic |
| 14.5 | Data Conditioning |
| 14.5.1 | Compositing |
Most of the samples inside mineralized estimation domains at Rosario, Rosario West, and Ujina were collected at 2 m intervals (Figure 14-16). For resource estimation, all assays were composited to 6 m lengths for Rosario, and 2 m for Rosario West and Ujina. CMDIC completed a sample support study for Rosario and found that 6 m composites retained the distribution shape reasonably well (Figure 14-17), while at Rosario West and Ujina, 2 m was used to enable better definition of contacts associated to modelled, sometimes quite narrow and variable units.
| November 2025 | ||
| Page |
| SRK Consulting (UK) Limited | Mineral Resources and Mineral Reserves, Collahuasi Copper Mine - Main Report |
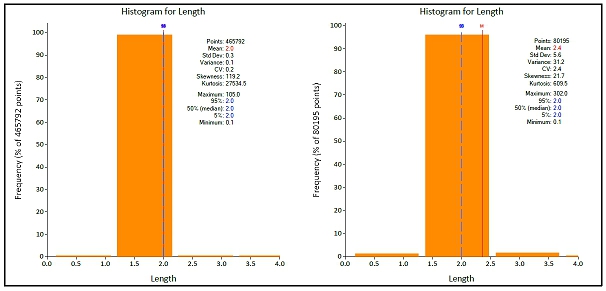
| Figure 14-16: | Rosario and Rosario West (left) and Ujina (right) histogram of sample length (SRK, 2025) |
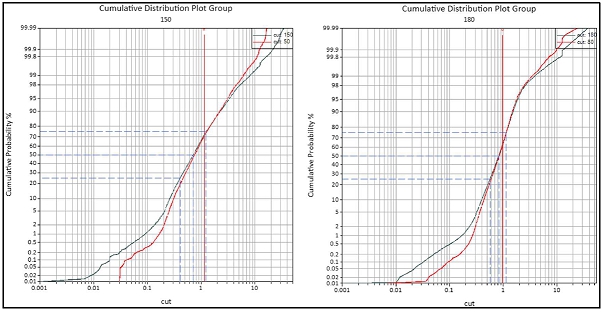
| Figure 14-17: | Cumulative log-probability plots of CuT in raw samples (black) and 6 m Composites (red) for Secondary Zone samples (left) and Primary Zone samples (right) (SRK, 2025) |
| 14.5.2 | High-grade distance restrictions |
Cu and Mo High-Grade outliers at Rosario, Rosario West, and Ujina have been evaluated and treated with methods specific to the zone of interest.
Rosario
At Rosario, the high-grade Cu and Mo mineralization is associated with marked structural control (veins), although high grades also appear associated with disseminated zones in the porphyry. CuT, MoT, Chalcopyrite and Bornite grade shells have been developed and implemented in defining the estimation domains which adds a level of control of the influence of outliers on the grade estimates. In addition to this, an indicator approach has been employed, where Cu and Mo values are compared to neighbouring samples, and local outliers are flagged as ‘veins’ (example in Figure 14-18). Indicator Kriging is then employed to estimate the probability of the block containing the high-grade veins (see IVT values in Figure 14-19).
| November 2025 | ||
| Page |
| SRK Consulting (UK) Limited | Mineral Resources and Mineral Reserves, Collahuasi Copper Mine - Main Report |
A CuT and MoT vein estimate and a CuT and MoT background estimate is then completed and the final CuT and MoT value for the block is assigned according to the probability value from the indicator kriging step (see Section 14.9.1).
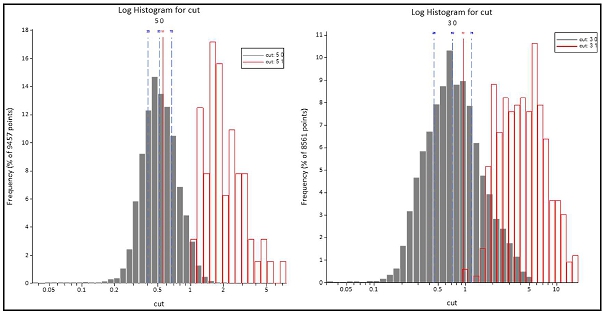
| Figure 14-18: | Rosario histograms of background CuT (grey) composites and vein CuT (red) in UGCUT domain 50 (Primary) and 30 (Secondary) (SRK, 2025) |
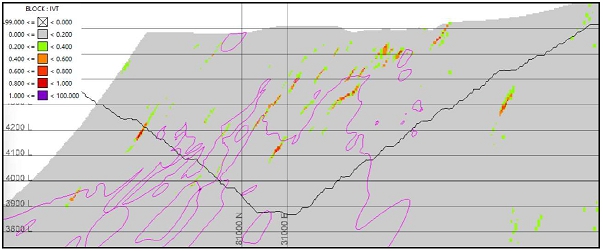
| Figure 14-19: | Rosario model Indicator (IVT) values cross-section looking NW (SRK, 2025) |
Rosario West
At Rosario West, high-grade outliers of Cu and Mo were investigated using histograms and cumulative probability plots (example in Figure 14-20) where high-yield (98%) and Cap level are indicated in light-blue on the log-probability plot. Capping levels were established for each domain for Cu, and high-yield thresholds were established for Cu and Mo determined roughly by the 98th percentile of each estimation unit (Table 4-3).
For samples above the high-yield thresholds, distance restrictions are set to roughly 2 blocks distance, or typically 40 to 50 m maximum interpolation distance for composites above the threshold.
| November 2025 | ||
| Page |
| SRK Consulting (UK) Limited | Mineral Resources and Mineral Reserves, Collahuasi Copper Mine - Main Report |
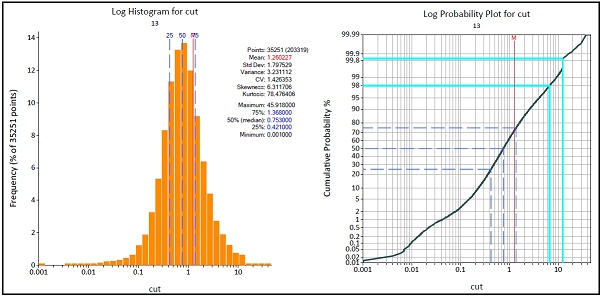
| Figure 14-20: | Rosario West log-histogram and Cumulative probability plots of CuT for UGCUT 13; |
| Table 14-3: | Rosario West CuT(%) and MoT(%) Capping and High-Yield threshold values |
| Deposit | Estimation Domain (UGCuT) |
CuT (%) | MoT (%) | ||
| Cap | High-Yield
Threshold |
Cap | High-Yield
Threshold |
||
| Rosario West | 11 | 2.70 | 2.00 | NA | 80.00 |
| 12 | 7.00 | 6.00 | 45.00 | ||
| 13 | 12.50 | 10.00 | 170.00 | ||
| 14 | 2.00 | 1.30 | 100.00 | ||
| 15 | 10.00 | 6.00 | 95.00 | ||
| 16 | 4.50 | 3.00 | 130.00 | ||
Ujina
At Ujina, high-grade outliers of Cu and Mo were investigated using histograms and cumulative probability plots. High-yield thresholds were established for Cu and Mo determined roughly by the 98th percentile of each estimation unit (Table 14-4). No capping was applied.
For samples above the high-yield thresholds distance restrictions are set to roughly 2 blocks distance, or typically 40 to 50 m maximum interpolation distance for composites above the threshold.
| November 2025 | ||
| Page |
| SRK Consulting (UK) Limited | Mineral Resources and Mineral Reserves, Collahuasi Copper Mine - Main Report |
| Table 14-4: | CuT(%) and MoT(%) Capping and High-Yield Threshold values for Ujina. |
| Deposit | Estimation
Domain (UGCuT) |
CuT (%) | Estimation Domain (UGMoT) |
MoT (%) | ||
| Cap | High-Yield Threshold |
Cap | High-Yield Threshold |
|||
| Ujina | Leached | NA | 0.70 | 1 | NA | 630.00 |
| Mixed | 5.00 | 2 | 600.00 | |||
| Oxide | 6.00 | 3 | 449.00 | |||
| Secondary | 9.00 | 4 | 869.00 | |||
| Primary | 3.00 | 5 | 849.00 | |||
| Primary Pyrite | 2.00 | 6 | 589.00 | |||
| 7 | 994.00 | |||||
| 8 | 920.00 | |||||
| 9 | 608.00 | |||||
| 10 | 199.00 | |||||
| 11 | 270.00 | |||||
Density
Density samples are not capped, although density values above 3.7 t/m3 are restricted in the distances over which they are interpolated. The distance restriction on these samples is applied similarly to the Cu estimates.
| 14.6 | Statistical Analysis |
The global statistical characteristics of the Cu, Mo and Density composites were reviewed for each of the applicable estimation domains. Where applicable, capped and raw composites were reviewed and assessed for metal losses.
| 14.6.1 | Copper |
Cu grade distributions in the main Cu bearing units at Rosario, Rosario West, and Ujina are generally approaching log-normal with right-skew (examples in Figure 14-21 and Figure 14-22). The coefficient of variation, an indication of the skewness, is relatively low (less than 1) in the Primary Sulphide domains, while it is higher (between 1 and 2) in the Secondary and Mixed/Oxide domains (Table 14-5, Table 14-6, and Table 14-7). This is expected as the nature of the mineralization in the Secondary and Mixed/Oxide material is more variable than the Primary Sulphide.
| November 2025 | ||
| Page |
| SRK Consulting (UK) Limited | Mineral Resources and Mineral Reserves, Collahuasi Copper Mine - Main Report |
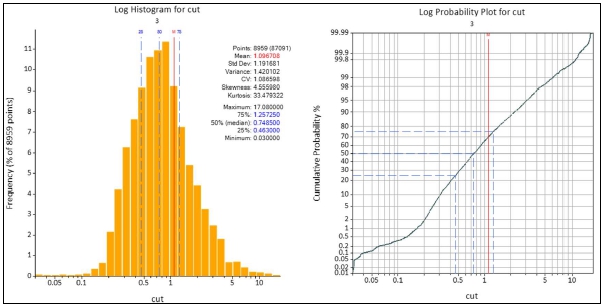
| Figure 14-21: | Rosario Cu Estimation domain 3 histogram and cumulative log-probability plot of CuT |
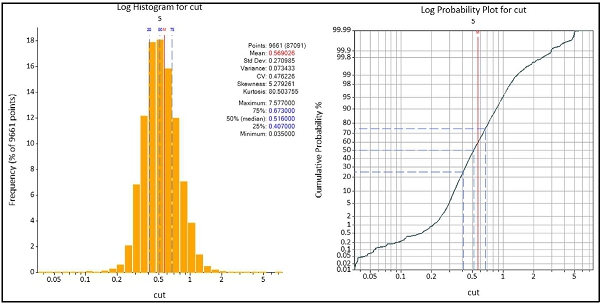
| Figure 14-22: | Rosario Cu Estimation domain 5 histogram and cumulative log-probability plot of CuT |
| Table 14-5: | Rosario Cu Estimation Domains raw 6 m CuT Composite Statistics |
| Deposit | Estimation Domain (CuT) |
Count | Mean | Min | Max | CoV |
| Rosario | 0 | 1,132 | 0.25 | 0.00 | 37.40 | 1.61 |
| 1 | 8,191 | 0.09 | 0.00 | 4.06 | 2.10 | |
| 2 | 1,497 | 1.12 | 0.00 | 5.86 | 2.04 | |
| 3 | 8,890 | 1.10 | 0.03 | 37.40 | 1.61 | |
| 4 | 11,368 | 1.55 | 0.03 | 17.08 | 1.09 | |
| 5 | 9,521 | 0.57 | 0.01 | 35.31 | 0.78 | |
| 6 | 11,336 | 0.80 | 0.04 | 7.58 | 0.48 | |
| 7 | 7,826 | 0.84 | 0.14 | 12.78 | 0.32 | |
| 8 | 27,203 | 0.16 | 0.01 | 6.21 | 0.36 |
| November 2025 | ||
| Page |
| SRK Consulting (UK) Limited | Mineral Resources and Mineral Reserves, Collahuasi Copper Mine - Main Report |
| Table 14-6: | Rosario West Cu Estimation Domains Raw and Capped 2 m CuT Composite Statistics |
| Deposit | Estimation Domain (CuT) | Count | Type | Mean | Min | Max | CoV | |
| Rosario West | 11 | 54,790 | Raw | 0.08 | 0.00 | 12.5 | 2.62 | |
| Capped | 0.07 | 0.00 | 7.5 | 2.03 | ||||
| 12 | 20,503 | Raw | 0.45 | 0.00 | 13.0 | 1.50 | ||
| Capped | 0.45 | 0.00 | 13.0 | 1.46 | ||||
| 13 | 35,251 | Raw | 1.26 | 0.00 | 45.9 | 1.43 | ||
| Capped | 1.25 | 0.00 | 12.5 | 1.30 | ||||
| 14 | 9,221 | Raw | 0.29 | 0.00 | 4.5 | 0.84 | ||
| Capped | 0.29 | 0.00 | 2.7 | 0.80 | ||||
| 15 | 34,543 | Raw | 0.17 | 0.00 | 24.5 | 3.40 | ||
| Capped | 0.17 | 0.00 | 12.5 | 3.18 | ||||
| 16 | 46,295 | Raw | 0.10 | 0.00 | 12.5 | 3.19 | ||
| Capped | 0.10 | 0.00 | 12.5 | 2.97 |
| Table 14-7: | Ujina Cu Estimation Domains Raw and Capped 2 m CuT Composite Statistics |
| Deposit | Estimation Domain (CuT) |
Count | Mean | Min | Max | CoV |
| Ujina | Overburden | 1,765 | 0.02 | 0.00 | 1.11 | 3.25 |
| Leached | 5 | 0.44 | 0.15 | 1.30 | 1.12 | |
| Oxi/Mixed | 4,562 | 0.91 | 0.01 | 12.89 | 1.11 | |
| Primary | 29,473 | 0.69 | 0.00 | 14.18 | 0.62 | |
| Primary Pyrite | 8,664 | 0.12 | 0.00 | 2.94 | 1.20 | |
| Secondary | 14,722 | 1.48 | 0.00 | 29.77 | 0.81 |
| 14.6.2 | Molybdenum |
Similar to Cu, Mo grade distributions in the main Cu bearing units at Rosario, Rosario West, and Ujina are generally approaching log-normal with right-skew (examples in Table 14-8, Figure 14-23 and Figure 14-24). The coefficient of variation, an indication of the skewness, is relatively low (less than 1) in the Primary Sulphide domains, while it is higher (between 1 and 3) in the Secondary and Mixed/Oxide domains. The variability in the Mo grades at Rosario West is particularly high due largely to the generally very low Mo grade of the deposit.
| November 2025 | ||
| Page |
| SRK Consulting (UK) Limited | Mineral Resources and Mineral Reserves, Collahuasi Copper Mine - Main Report |
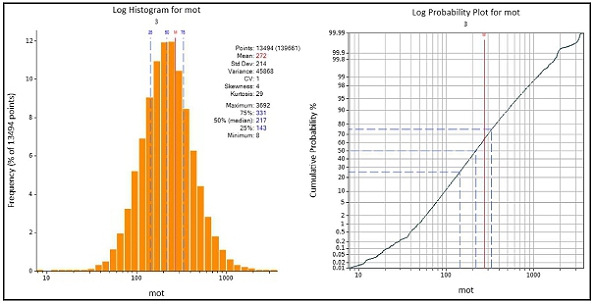
| Figure 14-23: | Rosario Mo Estimation domain 3 histogram and cumulative log-probability plot of MoT |
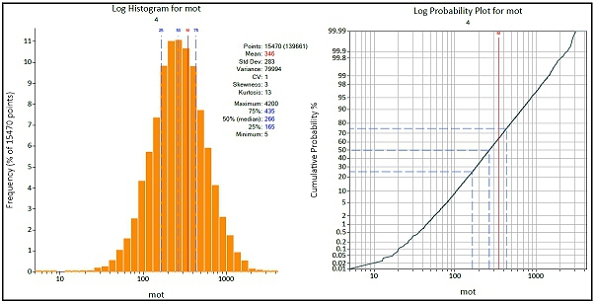
| Figure 14-24: | Rosario Mo Estimation domain 4 histogram and cumulative log-probability plot of MoT |
| Table 14-8: | Rosario Mo Estimation Domain Raw 6 m MoT Composite Statistics and Rosario West and Ujina in Mo Estimation Domains Raw 2 m MoT Composite Statistics |
| Deposit | Estimation Domain (MoT) |
Count | Mean | Min | Max | CoV |
| Rosario | 1 | 40,131 | 18 | 1 | 1029 | 1.43 |
| 2 | 14,541 | 177 | 1 | 3050 | 0.95 | |
| 3 | 13,329 | 272 | 8 | 3692 | 0.79 | |
| 4 | 15,246 | 346 | 7 | 4200 | 0.81 | |
| Rosario West | 1 | 44,741 | 7 | 1 | 3203 | 2.60 |
| 2 | 10,926 | 6 | 1 | 271 | 1.30 | |
| 3 | 2,089 | 20 | 1 | 536 | 1.68 | |
| 4 | 40,855 | 8 | 1 | 824 | 2.42 | |
| 5 | 4,101 | 15 | 1 | 931 | 1.78 |
| November 2025 | ||
| Page |
| SRK Consulting (UK) Limited | Mineral Resources and Mineral Reserves, Collahuasi Copper Mine - Main Report |
| Deposit | Estimation Domain (MoT) |
Count | Mean | Min | Max | CoV |
| 6 | 60,311 | 7 | 1 | 1214 | 2.13 | |
| Ujina | Overburden | 1,429 | 17 | 1 | 550 | 2.39 |
| Leached | 5 | 141 | 23 | 210 | 0.52 | |
| Oxi/Mixed | 3,855 | 99 | 1 | 1600 | 1.27 | |
| Primary | 28,996 | 175 | 1 | 7278 | 1.13 | |
| Primary Pyrite | 7,591 | 37 | 1 | 2592 | 1.87 | |
| Secondary | 12,961 | 139 | 1 | 4916 | 1.29 |
| 14.6.3 | Density |
Density samples are measured on irregular lengths of core, typically longer than 0.1 m. For the statistical review and estimation, density samples are not composited and are treated as equal weight, regardless of the measured lengths. Despite density not being recorded on every hole, the sampling density is reasonable considering the low variance observed in the estimation domains. As noted in section 14.5.2, Density samples above 3.7 t/m3 were distance restricted in the estimates.
| Table 14-9: | Rosario, Rosario West and Ujina in Density Estimation Domains Density Statistics |
| Deposit | Estimation
Domain (Density) |
Count | Mean | Min | Max | CoV |
| Rosario | 1 | 191 | 2.58 | 1.45 | 4.62 | 0.11 |
| 2 | 365 | 2.59 | 1.96 | 4.06 | 0.07 | |
| 3 | 1,808 | 2.59 | 1.99 | 4.04 | 0.05 | |
| 4 | 1,666 | 2.67 | 1.90 | 4.47 | 0.05 | |
| 5 | 918 | 2.58 | 1.46 | 4.50 | 0.10 | |
| Rosario West | 1 | 1,885 | 2.42 | 1.41 | 4.52 | 0.09 |
| 2 | 5,665 | 2.58 | 1.34 | 5.89 | 0.09 | |
| 3 | 3,715 | 2.66 | 1.63 | 4.79 | 0.05 | |
| Ujina | 1 | 10 | 2.29 | 1.76 | 2.58 | 0.10 |
| 2 | 22 | 2.49 | 2.30 | 2.69 | 0.04 | |
| 3 | 1 | 2.52 | 2.52 | 2.52 | NA | |
| 4 | 142 | 2.54 | 2.20 | 2.82 | 0.04 | |
| 5 | 95 | 2.61 | 1.89 | 4.21 | 0.09 | |
| 6 | 64 | 2.61 | 2.21 | 2.90 | 0.05 |
| 14.7 | Grade Continuity Analysis |
Grade continuity of Cu, Mo and density at Rosario and Rosario West were investigated using experimental variograms. Cu and Mo grade continuity was investigated using experimental variograms at Ujina. Correlograms and semi-variograms were created by element and domain and theoretical models created using Isatis software.
Downhole correlogram/semi-variograms were used to model nugget effects; i.e., assay variability at very close distance. Directional correlogram/semi-variograms, supported by variogram maps, were used to model grade continuities for larger distances. The variograms were calculated without considering the samples marked as outliers and were modelled using generally two and three structures, with spherical and exponential models.
| November 2025 | ||
| Page |
| SRK Consulting (UK) Limited | Mineral Resources and Mineral Reserves, Collahuasi Copper Mine - Main Report |
| 14.7.1 | Rosario |
For Cu, Mo and density, the resulting variograms are generally characterized by high levels of continuity, with maximum ranges between 150 and 200 m and nugget effects between 20% and 30% of the variance. These model characteristics are typical for porphyry copper systems.
| 14.7.2 | Rosario West |
For Cu, the resulting variograms are generally characterized by moderate levels of continuity, with maximum ranges between 100 and 200 m, but with the majority of variance at shorter distances. The nugget effects were modelled between 30% and 45% of the variance. The increased variance observed is expected considering the different nature of the mineralization at Rosario west.
For Mo, the resulting variograms are generally characterized by high levels of continuity, with maximum ranges between 200 and 500 m and nugget effects between 30% and 60% of the variance.
For density, a high degree of spatial correlation is observed in all units, with its maximum expressions in the directions of greatest geological continuity. Generally, the nugget effect of the variograms does not exceed 40%, and the maximum continuity varies from 200 to 400 m
| 14.7.3 | Ujina |
For Cu, the resulting variograms are generally characterized by high levels of continuity, with maximum ranges in some cases greater than 1,500 meters and nugget effects between 10% and 40% of the variance. These model characteristics are typical for porphyry copper systems.
For Mo, the resulting variograms are generally characterized by high levels of continuity, with maximum ranges between 80 and 200 m and nugget effects between 10% and 60% of the variance.
No variograms were modelled for density.
| 14.8 | Block Model Definition |
Resource estimation was completed within two model areas; one encompassing the Rosario and Rosario West deposits and another encompassing the Ujina deposit. For Rosario and Rosario West, the estimation process itself is completed in a series of sub-blocked models, one for each estimated element. These sub-block models are then coalesced and regularized into one final block model used for reporting.
The block model geometry and extents of the models are presented in Table 14-10, Table 14-11, and Table 14-12.
| November 2025 | ||
| Page |
| SRK Consulting (UK) Limited | Mineral Resources and Mineral Reserves, Collahuasi Copper Mine - Main Report |
Table 14-10: Rosario and Rosario West Sub-Block Models Block Extents and Dimensions
| Deposit | Dimension | East (X) | North (Y) | Elevation (Z) | |
| Rosario and Rosario West |
Origin | 29939.339 | 75,503 | 3205 | |
| Rotation Bearing | 45 | ||||
| Parent Block | 10 | 10 | 15 | ||
| Number of Blocks | 734 | 584 | 115 | ||
| Sub-Block | 5 | 5 | 5 | ||
Table 14-11: Rosario and Rosario West Regularized Model Block Extents and Dimensions
| Deposit | Dimension | East (X) | North (Y) | Elevation (Z) | |
| Rosario and Rosario West |
Origin | 29939.339 | 75,503 | 3205 | |
| Rotation Bearing | 45 | ||||
| Parent Block | 20 | 20 | 15 | ||
| Number of Blocks | 367 | 292 | 115 | ||
| Sub-Block | NA | NA | NA | ||
Table 14-12: Ujina Block Model Block Extents and Dimensions
| Deposit | Dimension | East (X) | North (Y) | Elevation (Z) | |
| Ujina | Origin | 34909.214 | 76,346 | 3610 | |
| Rotation Bearing | NA | ||||
| Parent Block | 20 | 20 | 15 | ||
| Number of Blocks | 262 | 250 | 74 | ||
| Sub-Block | NA | NA | NA | ||
| 14.9 | Grade Interpolation |
Grade and density interpolation have been completed using Ordinary Kriging (OK), Indicator Kriging (IK) and Inverse Distance (IDW) methods, depending on the element and domain.
| 14.9.1 | Rosario |
Cu and Mo grade estimates at Rosario are completed using IK, while density is completed using OK. The interpolation plan for Rosario can be summarized as follows:
| · | Four successive (nested) search passes for all elements in all domains. The search radii are determined specifically per domain according to the data density and geometry of the domains. |
| o | Pass 1: Minimum 6 and maximum 12 Samples, with maximum 4 per hole. |
| o | Pass 2: Minimum 6 and maximum 18 Samples, with maximum 4 per hole. |
| o | Pass 3&4: Minimum 4 and maximum 24 Samples, with maximum 3 per hole. |
| · | Seach ellipse orientations are controlled by locally-varying anisotropy (LVA). Blocks are coded with local orientations informed by interpreted structural controls on the local grade continuity (Figure 14-25). |
| November 2025 | ||
| Page |
| SRK Consulting (UK) Limited | Mineral Resources and Mineral Reserves, Collahuasi Copper Mine - Main Report |
| · | ‘Background’ Cu and Mo estimates completed using OK on all blocks in all domains, excluding composites identified as ‘vein’ composites. In the Cu estimate, background composites are limited by a high-yield threshold set at 0.5% Cu to maximum 80 m distance in all passes. |
| · | Density estimated using OK. |
| · | IK used to estimate the probability of ‘vein’ presence in each block. |
| · | ‘Vein’ Cu and Mo estimates completed using OK on all blocks with ‘vein’ presence. |
Final Cu and Mo values are calculated according to Equation 14-1: Final Grade Calculation.
| · | Block discretization set at 4x4x3 for all estimates. |
Equation 14-1: Final Grade Calculation
Final Grade = (Vein Probability * Vein Grade) + ((1 – Vein Probability)*Background Grade)
| 14.9.2 | Rosario West |
Cu and Mo grade and Density estimates are completed using OK. The interpolation approach for Rosario West can be summarized as follows:
| · | Four successive (nested) search passes for all elements in all domains. The search radii are determined specifically per domain according to the data density and geometry of the domains. A minimum of 8 to 12 composites and a maximum of 12 to 24 composites are required for estimation depending on the pass and domain. A minimum of two drillholes is required for all estimates. |
| · | Seach ellipse orientations are controlled by LVA. Blocks are coded with local orientations informed by interpreted structural controls on the local grade continuity (Figure 14-25). |
| · | In the Cu and Mo estimate, composites are limited by a high-yield threshold to a maximum of 50 m distance in all passes. |
| · | Block discretization set at 4x4x3 for all estimates. |

Figure 14-25: Rosario and Rosario West Block Model cross-section looking NW coloured by estimation domain with search ellipse orientations shown in pink (Rosario) and blue (Rosario West); Section A-A’ location inset left (SRK, 2025)
| November 2025 | ||
| Page |
| SRK Consulting (UK) Limited | Mineral Resources and Mineral Reserves, Collahuasi Copper Mine - Main Report |
| 14.9.3 | Ujina |
Cu and Mo grade estimates are completed using OK and density completed using IDW. The interpolation approach for Ujina can be summarized as follows:
| · | Two or three successive (nested) search passes for all elements in all domains. The search radii are determined specifically per domain according to the data density and geometry of the domains. A minimum of two to five composites and a maximum of 8 to 16 composites are required for estimation depending on the pass and domain. A minimum of two drillholes is required for all estimates. |
| · | Seach ellipse orientations are set to an optimum orientation per estimation domain. |
| · | In the Cu and Mo estimate, composites are limited by a high-yield threshold to a maximum of 20 m distance in all passes. |
| · | Block discretization set at 3 x 3 x 3 for all estimates. |
| 14.10 | Validation of Block Model Estimates |
Cu, Mo and density were validated by completing visual inspections of composites versus estimates, as well as using swath plots, histograms and global statistics.
| 14.10.1 | Visual validation |
Block estimates are compared on sections and plans versus composites to investigate the local correlation between the two. Examples of these are presented in Figure 14-26, Figure 14-27, and Figure 14-28 for Cu in Rosario, Rosario West and Ujina, respectively.
The visual validation process confirms that the Cu, Mo and density estimates are a reasonable representation of the input composites. It is evident that areas with relatively high-grade Cu and Mo composites are being restricted, as designed in the interpolation plans.
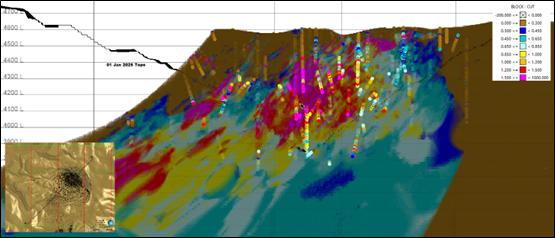
Figure 14-26: Rosario Block Model cross-section looking NW, composites coloured by CuT; Section A-A’ location inset left (SRK, 2025)
| November 2025 | ||
| Page |
| SRK Consulting (UK) Limited | Mineral Resources and Mineral Reserves, Collahuasi Copper Mine - Main Report |
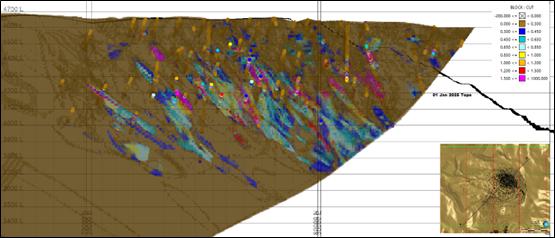
| Figure 14-27: | Rosario West Block Mode cross-section looking NW l, composites coloured by CuT; Section A-A’ location inset right (SRK, 2025) |
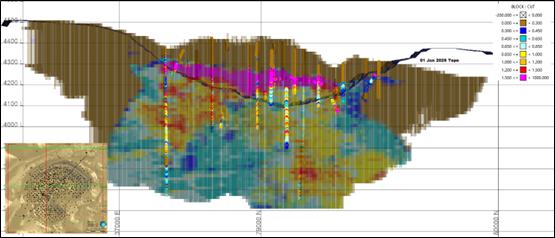
Figure 14-28: Ujina Block Model cross-section looking NW, composites coloured by CuT; Section A-A’ location inset left (SRK, 2025)
| 14.10.2 | Swath plots and histograms |
As part of the validation process, the capped estimation composite grades are compared to the block model grades within principal direction swaths. The results of which are then displayed on charts to check for visual discrepancies between grades. Histograms are also reviewed which assist with visualising the level of smoothing in the estimates. Examples are presented in Figure 14-29, Figure 14-30, and Figure 14-31.
In general, the mean composite grades and the mean estimated block grades follow similar trends in all directions. As demonstrated by the histograms, the estimates are somewhat smoother than the composite grades, particularly where there are limited samples or very high-grade composite samples and/or the estimated block grades have been impacted by the distance restriction thresholds or the indicator kriging (as is the case at Rosario).
| November 2025 | ||
| Page |
| SRK Consulting (UK) Limited | Mineral Resources and Mineral Reserves, Collahuasi Copper Mine - Main Report |
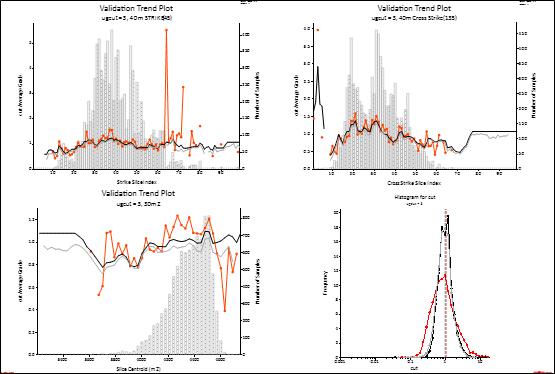
| Figure 14-29: | Rosario Domain 3 Swath Plots at 45 and 135 strike and by elevation; log-histogram of Cu composites (orange), sub-block estimates (black), regularized blocks (grey) |
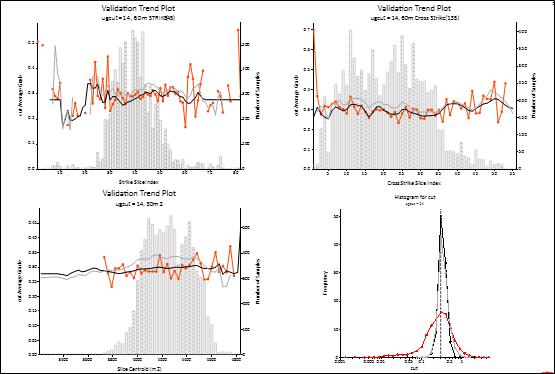
| Figure 14-30: | Rosario West Domain 14Swath Plots at 45 and 135 strike, and by elevation; log-histogram of Cu composites (orange), sub-block estimates (black), regularized blocks (grey) |
| November 2025 | ||
| Page |
| SRK Consulting (UK) Limited | Mineral Resources and Mineral Reserves, Collahuasi Copper Mine - Main Report |
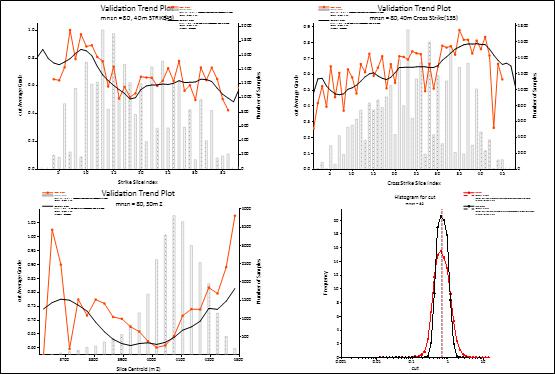
| Figure 14-31: | Ujina Domain 80 (Primary) Swath Plots at 45 and 135 strike, and by elevation; log-histogram of Cu composites (orange), block estimates (black) |
| 14.10.3 | Global statistics |
Composite mean grade and coefficient of variation (CoV) were compared domain by domain against block estimate mean grade and coefficient of variation.
For Cu, mean grade from estimates are typically less than 10% difference from the input composites, except where high-yield threshold restrictions are employed (for example, Rosario domain 2, or Rosario West domain 12) where the estimated grade is up to 34% less than the input composites. This is an expected adjustment considering the distances to which high-yield samples are restricted in informing the estimates. It is noted that the significant difference observed for the Ujina leached domain is due to a very small number of informing composites, and this is not a significant domain.
For Mo, the key mineralised domains are the Primary Sulphide at Rosario and Ujina, where the Mo estimates are -6% and -3%, respectively, compared to the input composites. In all other domains, Mo is relatively low and the estimates are more impacted by the use of distance restrictions to control zones of higher grades.
For density, the estimated means are very close to the mean of the input composites as expected.
| November 2025 | ||
| Page |
| SRK Consulting (UK) Limited | Mineral Resources and Mineral Reserves, Collahuasi Copper Mine - Main Report |
Table 14-13: Global Mean and CoV for Cu Estimates versus Composites
| Deposit | Estimation Domain (ugcut) | Composite Cu | Estimate Cu | Difference Mean | |||
| Mean (%) | CoV | Mean (%) | CoV | Absolute | % | ||
| Rosario | 1 | 0.09 | 1.61 | 0.09 | 1.10 | 0.00 | 3% |
| 2 | 1.12 | 2.10 | 0.80 | 0.85 | -0.32 | -29% | |
| 3 | 1.10 | 2.04 | 0.94 | 0.53 | -0.15 | -14% | |
| 4 | 1.55 | 1.61 | 1.41 | 0.25 | -0.14 | -9% | |
| 5 | 0.57 | 1.09 | 0.58 | 0.15 | 0.01 | 1% | |
| 6 | 0.80 | 0.78 | 0.82 | 0.18 | 0.02 | 2% | |
| 7 | 0.84 | 0.48 | 0.87 | 0.18 | 0.02 | 3% | |
| 8 | 0.16 | 0.32 | 0.14 | 0.46 | -0.02 | -10% | |
| Rosario West | 11 | 0.08 | 2.62 | 0.08 | 0.88 | 0.00 | 2% |
| 12 | 0.45 | 1.50 | 0.30 | 0.59 | -0.16 | -34% | |
| 13 | 1.26 | 1.43 | 0.99 | 0.44 | -0.28 | -22% | |
| 14 | 0.29 | 0.84 | 0.31 | 0.32 | 0.02 | 6% | |
| 15 | 0.17 | 3.40 | 0.16 | 0.85 | -0.02 | -10% | |
| 16 | 0.10 | 3.19 | 0.09 | 0.37 | -0.01 | -10% | |
| Ujina | Leached | 0.44 | 1.12 | 0.06 | 1.42 | -0.37 | -85% |
| Oxi/Mixed | 0.91 | 1.11 | 0.78 | 0.77 | -0.13 | -15% | |
| Primary | 0.69 | 0.62 | 0.66 | 0.34 | -0.03 | -5% | |
| Primary Pyrite | 0.12 | 1.20 | 0.11 | 0.54 | -0.01 | -5% | |
| Secondary | 1.48 | 0.81 | 1.22 | 0.64 | -0.26 | -17% | |
| 14.10.4 | Validation summary |
SRK is satisfied that the estimates of Cu, Mo and density are a reasonable representation of the input composites at the current level of sampling and that no global biases have been introduced within the grade estimation. The grade estimates are characterised by a reasonable level of smoothing and areas of relatively high-grade Cu and Mo composites have been restricted to a reasonable level considering the interpretation of the nature of these zones.
| 14.11 | Resource Classification |
Mineral Resource classification is typically a subjective concept; industry best practices suggest that resource classification should consider the confidence in the geological continuity of the mineralized structures, the quality and quantity of exploration data supporting the estimates, and the geostatistical confidence in the tonnage and grade estimates. Appropriate classification criteria should aim at integrating these concepts to delineate regular areas at similar resource classification.
SRK is satisfied that the geological and alteration modelling honours the current geological information and knowledge. The location of the samples and the assay data are sufficiently reliable to support resource estimation.
Mineral Resources at the Rosario, Rosario West, and Ujina deposits are classified in the Measured, Indicated, and Inferred categories based on considerations of data density and relative geological complexity (in the case of Rosario, see Section 14.11.1). In practice, these criteria are used to interpolate into the block model using IDW. The classification candidates are then smoothed to ensure that the resulting classified zones are contiguous.
| November 2025 | ||
| Page |
| SRK Consulting (UK) Limited | Mineral Resources and Mineral Reserves, Collahuasi Copper Mine - Main Report |
| 14.11.1 | Rosario |
| · | Measured Resources*: >=3 drillholes within a 50 x 50 x 30 m search envelope for oxide, mixed and secondary sulphide domains. >=3 drillholes within a 75 x 75 x 45 m search envelope for primary sulphide domains. |
| · | Indicated Resources: >=3 drillholes within a 100 x 100 x 50 m search envelope for oxide, mixed and secondary sulphide domains. >=3 drillholes within a 160 x 160 x 60 m search envelope for primary sulphide domains. |
| · | Inferred Resources: >=2 drillholes within a 250 x 250 x 100 m search envelope for oxide, mixed and secondary sulphide domains. >=2 drillholes within a 250 x 250 x 140 m search envelope for primary sulphide domains. |
*Measured blocks <30 m from high grade Cu primary bornite domains are downgraded to Indicated. Measured blocks <10 m from high grade Cu primary sulphide domains are downgraded to Indicated. This adjustment is completed to consider the relative geological complexity of these areas.
| 14.11.2 | Rosario West |
| · | Measured Resources: >=3 drillholes within a 40 x 60 x 40 m search envelope for oxide, mixed, primary and secondary sulphide domains. |
| · | Indicated Resources: >=3 drillholes within a 70 x 110 x 70 m search envelope for oxide, mixed, primary and secondary sulphide domains. |
| · | Inferred Resources: >=3 drillholes within a 270 x 270 x 270 m search envelope for oxide, mixed, primary and secondary sulphide domains. |
| 14.11.3 | Ujina |
| · | Measured Resources: >=3 drillholes within a 50 x 50 x 30 m search envelope for oxide, mixed and secondary sulphide domains. >=3 drillholes within a 75 x 75 x 45 m search envelope for primary sulphide domains. |
| · | Indicated Resources: >=3 drillholes within a 100 x 100 x 50 m search envelope for oxide, mixed and secondary sulphide domains. >=3 drillholes within a 150 x 150x 60 m search envelope for primary sulphide domains. |
| · | Inferred Resources: >=2 drillholes within a 250 x 250 x 75 m search envelope for oxide, mixed and secondary sulphide domains. >=2 drillholes within a 250 x 250 x 100 m search envelope for primary sulphide domains. |
| November 2025 | ||
| Page |
| SRK Consulting (UK) Limited | Mineral Resources and Mineral Reserves, Collahuasi Copper Mine - Main Report |
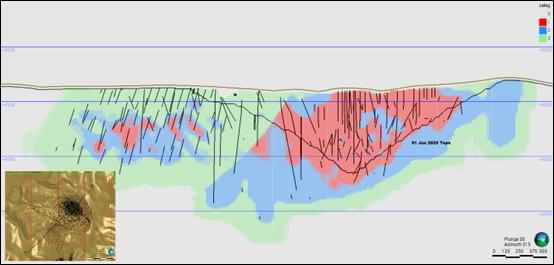
| Figure 14-32: | Rosario and Rosario West Block model cross-section looking NW coloured by classification; Section A-A’ location inset left (SRK, 2025) |
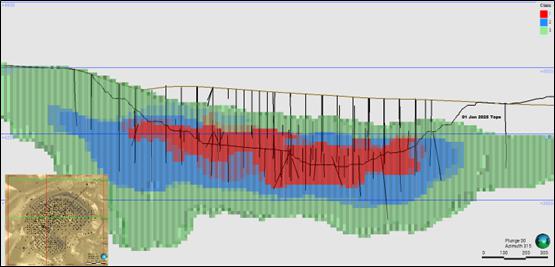
Figure 14-33: Ujina Block model cross-section looking NW coloured by classification; Section A-A’ location inset left (SRK, 2025)
| 14.12 | Dilution Considerations |
For the combined Rosario and Rosario West block model, the sub-blocked model is regularized, after grade interpolation, into a 20 x 20 x 15 m block model (as described in Section 14.8). The regularisation process records the majority of the geological domain coding into the resulting regularised block model. The block grade dilution related to the geological boundaries is incorporated to the final block grades by considering the proportion of each geological population within each block.
| 14.13 | Reasonable Prospects for Eventual Economic Extraction |
In assessing Reasonable Prospects for Eventual Economic extraction (RPEEE), SRK has only considered primary mineralisation. This is following the cessation of the leaching operations in 2017 and the current plan for the associated infrastructure to be prepared for closure, with no current plan in place to process this material in the future.
| November 2025 | ||
| Page |
| SRK Consulting (UK) Limited | Mineral Resources and Mineral Reserves, Collahuasi Copper Mine - Main Report |
| · | Mineral Resources at Rosario, Rosario West and Ujina are stated above cut-offs of 0.30% CuT for sulphides, aligned with the parameters applied to the Mineral Reserve reporting (Section 15.5). |
| · | Mineral Resources are depleted to the 31 December 2024 topographic surfaces for Rosario, Rosario West and Ujina deposits. |
| · | Mineral Resources are reported on an Exclusive of Reserves basis. |
| · | Mineral Resources are enclosed within pit shells that were optimized using Measured, Indicated and Inferred resources. The technical and economic input parameters applied for the pit optimisation are aligned with those used for the Mineral Reserve assessment, see Section 15.5, with the exception of the application of a copper price of USD4.76/lb. |
| · | Mineral Resources are reported based on a regularised block size of 20 x 20 x15 m. |
| · | Stockpile inventories reflecting closing balances 31 December 2024 of the sulphide stockpiles. Discounted process recoveries are applied to stockpile material with average LoM values of 77%. |
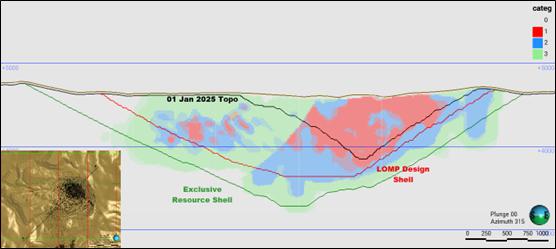
Figure 14-34: Rosario and Rosario West Block Model cross-section looking NW coloured by Mineral Resource category with LoMP Design shell and Exclusive Resource Reporting Shell; Section A-A’ location inset left (SRK, 2025)
| November 2025 | ||
| Page |
| SRK Consulting (UK) Limited | Mineral Resources and Mineral Reserves, Collahuasi Copper Mine - Main Report |
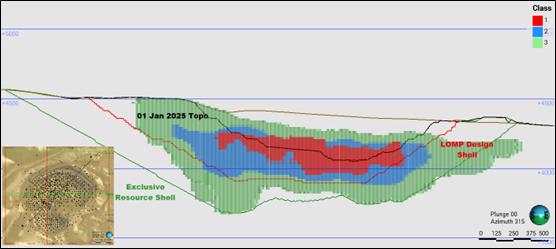
Figure 14-35: Ujina Block Model cross-section looking NW coloured by Mineral Resource category with LOMP Design shell and Exclusive Resource Reporting Shell; Section A-A’ location inset left (SRK, 2025)
| 14.14 | Stockpiles |
Stockpile inventories reflect the closing balances at 31 December 2024 of the sulphide stockpiles. Discounted process recoveries are applied to stockpile material with average LoM values of 77% recovery.
SRK has independently reviewed the 31 December 2024 stockpile surveys and confirmed the volume and tonnage balances reported by CMDIC. In this process, SRK created volumes for each of the reported stockpiles and compared to the 2024 end of year balances. Stockpile density of 2.0 t/m3 is considered for all stockpile material (Figure 14-36). SRK’s independent tonnage estimate was within 1.5% and 2.0% of the CMDIC balance for Rosario and Ujina stockpiles respectively.
SRK have also reviewed the historic stockpile drilling/sampling and confirmed that the CuT% assumed for the reported stockpile balances is reasonable. SRK has also reviewed the historic stockpile drilling/sampling and confirmed that the CuT% assumed for the reported stockpile balances is reasonable.

Figure 14-36: Plan View of the Rosario Mineralized Stockpiles (Green) with stockpile drill sampling locations in black. (SRK, 2025)
| November 2025 | ||
| Page |
| SRK Consulting (UK) Limited | Mineral Resources and Mineral Reserves, Collahuasi Copper Mine - Main Report |
| 14.15 | Mineral Resource Statement |
SRK has reviewed the methodology applied and the results obtained for the 2024 Mineral Resource Estimation completed by CMDIC. The Mineral Resources have an effective date of 31 December 2024. SRK is satisfied that the current drilling information is sufficiently reliable to interpret with confidence the copper and molybdenum mineralization and that the assay data are sufficiently reliable to support Mineral Resource estimation. SRK has reviewed the estimation process, and conducted sufficient validation to accept the estimate as presented along with the application of Mineral Resource classification and RPEEE, sufficient to support the reporting of Mineral Resources in the Measured, Indicated and Inferred categories.
Table 14-14 summarizes the Mineral Resource figures, reported on an exclusive basis, for the in situ deposits (Rosario, Rosario West, Ujina) and the stockpiles, respectively, in compliance with the disclosure requirements for Mineral Reserves as defined under National Instrument 43-101.
Table 14-14: CMDIC Exclusive Mineral Resources for the Rosario, Rosario West and Ujina deposits, and associated stockpiles as at 31 December 2024
| Material type | Category | Tonne (Mt) | Grade CuT (%) | Grade MoT (ppm) | Metal CuT (kt) | Metal Mo (kt) |
| Rosario | ||||||
| In situ Sulphide Cut-off 0.3% CuT |
Measured | 32 | 0.79 | 295 | 254 | 9 |
| Indicated | 1,100 | 0.79 | 317 | 8,681 | 348 | |
| Total Measured and Indicated | 1,132 | 0.79 | 316 | 8,935 | 357 | |
| Inferred | 2,272 | 0.68 | 257 | 15,430 | 584 | |
| Stockpiles (Sulphide) Cut-off 0.3% CuT |
Measured | |||||
| Indicated | ||||||
| Total Measured and Indicated | ||||||
| Inferred | ||||||
| Total Rosario Main | Measured | 32 | 0.79 | 295 | 254 | 9 |
| Indicated | 1,100 | 0.79 | 317 | 8,681 | 348 | |
| Total Measured and Indicated | 1,132 | 0.79 | 316 | 8,935 | 357 | |
| Inferred | 2,272 | 0.68 | 257 | 15,430 | 584 | |
| Rosario West | ||||||
| In situ Sulphide Cut-off 0.3% CuT |
Measured | 10 | 0.94 | 11 | 92 | 0 |
| Indicated | 102 | 0.90 | 8 | 914 | 1 | |
| Total Measured and Indicated | 112 | 0.90 | 8 | 1,006 | 1 | |
| Inferred | 1,971 | 0.78 | 7 | 15,356 | 15 | |
| November 2025 | ||
| Page |
| SRK Consulting (UK) Limited | Mineral Resources and Mineral Reserves, Collahuasi Copper Mine - Main Report |
| Material type | Category | Tonne (Mt) | Grade CuT (%) | Grade MoT (ppm) | Metal CuT (kt) | Metal Mo (kt) |
| Stockpiles (Sulphide) Cut-off 0.3% CuT |
Measured | |||||
| Indicated | ||||||
| Total Measured and Indicated | ||||||
| Inferred | ||||||
| Total Rosario West | Measured | 10 | 0.94 | 11 | 92 | 0 |
| Indicated | 102 | 0.90 | 8 | 914 | 1 | |
| Total Measured and Indicated | 112 | 0.90 | 8 | 1,006 | 1 | |
| Inferred | 1,971 | 0.78 | 7 | 15,356 | 15 | |
| Ujina | ||||||
| In situ Sulphide Cut-off 0.3% CuT |
Measured | 5 | 0.52 | 69 | 24 | 0 |
| Indicated | 248 | 0.64 | 162 | 1,590 | 40 | |
| Total Measured and Indicated | 253 | 0.64 | 160 | 1,614 | 40 | |
| Inferred | 748 | 0.67 | 160 | 4,976 | 120 | |
| Stockpiles (Sulphide) Cut-off 0.3% CuT |
Measured | |||||
| Indicated | ||||||
| Total Measured and Indicated | ||||||
| Inferred | ||||||
| Total Ujina | Measured | 5 | 0.52 | 69 | 24 | 0 |
| Indicated | 248 | 0.64 | 162 | 1,590 | 40 | |
| Total Measured and Indicated | 253 | 0.64 | 160 | 1,614 | 40 | |
| Inferred | 748 | 0.67 | 160 | 4,976 | 120 | |
| Total | Measured | 47 | 0.80 | 193 | 370 | 9 |
| Indicated | 1,450 | 0.77 | 268 | 11,185 | 389 | |
| Total Measured and Indicated | 1,497 | 0.77 | 266 | 11,555 | 398 | |
| Inferred | 4,990 | 0.72 | 144 | 35,762 | 719 | |
Important information regarding the Mineral Resources disclosed in Table 14-14:
| · | Martin Pittuck (CEng, FGS, MIMMM, QMR) of SRK Consulting (UK) Ltd, has reviewed the geology and Mineral Resource estimate reported herein and takes responsibility for the 31 December 2024 Resource Estimate. Mr Pittuck is a qualified person and independent for the purposes of National Instrument 43-101. |
| · | The Measured and Indicated Mineral Resources are exclusive of those Mineral Resources modified to produce the Mineral Reserves. |
| November 2025 | ||
| Page |
| SRK Consulting (UK) Limited | Mineral Resources and Mineral Reserves, Collahuasi Copper Mine - Main Report |
| · | Mineral Resources have been defined within an optimised pit shell using Measured, Indicated and Inferred Mineral Resources, based on input parameters: copper price of USD4.76/lb, a selling cost of USD0.51/lb Cu, and a molybdenum price of USD14.00lb Mo. Average LoM mining operating costs are estimated at USD3.19/t (total) for Rosario and USD2.65/t (total) for Ujina. Processing costs (including G&A) have been applied on a material-specific basis, resulting in average costs of USD15.02/t of ore for Rosario and USD14.63/t of ore for Ujina. Processing recoveries are based on the defined Geometallurgical Units and range from 80.3% to 84.3% for copper and from 26.3% to 46.8% for molybdenum. No allowance for royalty is included in the optimisation parameters, where this would account for USD0.30/lb at the copper price of USD4.76/lb for the given inventory. The optimisation process relied on for constraining the reporting of Mineral resources is conditional on the assumed relocation/redesign of LoM waste rock dump and low grade stockpiles located on the western side of the pit, including appropriate standoffs. |
| · | Estimates were depleted against the topography as at 31 December 2024. |
| · | Stockpiles inventories reflect closing balances 31 December 2024 of the sulphide stockpiles. Discounted process recoveries are applied to stockpile material with average LoM values of 77%. All stockpile material is converted to Mineral Reserves. |
| · | Mineral Resources are reported based on a regularised block size of 20 x20 x15 m. The Mineral Resources are thereafter reported at a Cut-off grade of 0.3%CuT for in situ material and 0.3%CuT for stockpile material (aligned to the stockpiling strategy). |
| · | All tonnages are reported on a dry basis. |
| · | Mineral Resource tonnages have been rounded to reflect the accuracy of the estimate, and numbers may not add due to rounding. |
| · | Mineral Resources are estimated and reported on 100% attributable basis. |
Mineral Resources which are not Mineral Reserves do not have demonstrated economic viability. The estimate of Mineral Resources may be materially affected by environmental, permitting, legal, title, taxation, sociopolitical, marketing, or other relevant issues.
The quantity and grades of the reported Inferred Mineral Resources in this estimate have had insufficient exploration to define these as Indicated Mineral Resources. It is reasonably expected, but not certain, that the majority of the Inferred Mineral Resources could be upgraded to Indicated Mineral Resources with continued exploration.
| 14.16 | Comparison with Previous Mineral Resource Estimate |
The most recent Mineral Resource estimate presented for CMDIC by Anglo American is included in the annual Ore Reserves and Mineral Resources report 2024 (Anglo American, 2024), as summarised in Table 6-1.
| November 2025 | ||
| Page |
| SRK Consulting (UK) Limited | Mineral Resources and Mineral Reserves, Collahuasi Copper Mine - Main Report |
In reporting the Mineral Resources herein, SRK has made two notable changes:
| · | The Mineral Resources in the Anglo American 2024 report included estimates relating to oxide and mixed material; these material types have been excluded from the Mineral Resources reported herein, as the oxide circuit ceased production in 2017 and there is no current plan to process this material. This difference accounts for 77.9Mt of material at a grade of 0.71% Cu in the Measured and Indicated categories and 108.2Mt at 0.51% Cu of Inferred material. |
| · | The Mineral Resources reported herein are based on actual pit depletion surfaces for 31 December 2024 and stockpile balances calculated for the same date, whereas the Anglo American 2024 estimates were based on a 9 month actual plus 3 month projection basis. Consequently there are slight differences in the quantum of material reported between in-situ resources and stockpiles based on the actual production rate and the split between the direct feed and stockpile feed relating to the 4th quarter 2024. |
When considering the adjustments applied SRK does not consider the differences between the two estimates, when considered above a cut-off grade above 0.3%TCu to reflect a material change.
| 14.17 | Grade and Tonnage Sensitivity |
The Mineral Resources are sensitive to the selection of the reporting cut-off grade. To illustrate this sensitivity, the block model quantities and grade estimates within the Exclusive Resource volumes used to constrain the Mineral Resources are presented in Figure 14-37 to Figure 14-40 at different Cu% cut-off values. The reader is cautioned that the figures presented in these tables should not be misconstrued with a Mineral Resource Statement. The figures are only presented to show the sensitivity of the block model estimates to the selection of the Cu% cut-off value.
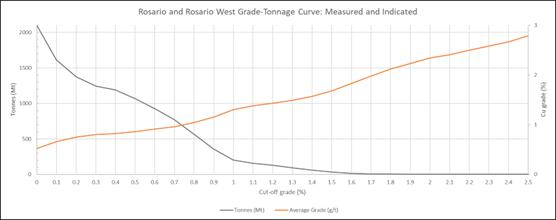
Figure 14-37: Rosario and Rosario West Grade Tonnage Curve for Measured & Indicated category material
| November 2025 | ||
| Page |
| SRK Consulting (UK) Limited | Mineral Resources and Mineral Reserves, Collahuasi Copper Mine - Main Report |
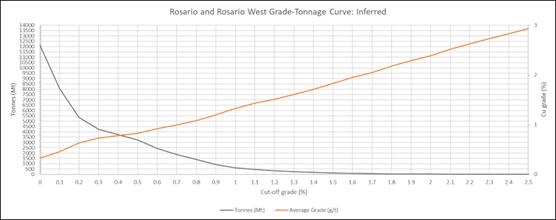
Figure 14-38: Rosario and Rosario West Grade Tonnage Curve for Inferred category material
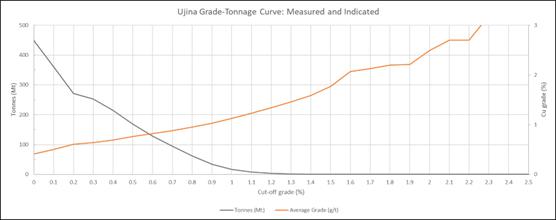
Figure 14-39: Ujina Grade Tonnage Curve for Measured & Indicated category material
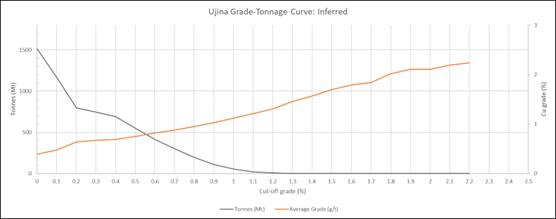
Figure 14-40: Ujina Grade Tonnage Curve for Inferred category material
| November 2025 | ||
| Page |
| SRK Consulting (UK) Limited | Mineral Resources and Mineral Reserves, Collahuasi Copper Mine - Main Report |
| ITEM 15 | MINERAL RESERVE ESTIMATES |
| 15.1 | Mineral Reserve Estimation Approach |
CMDIC operates a series of high-altitude open-pit mines at Collahuasi in northern Chile, with current production sourced primarily from the Rosario Pit, with future contributions derived from the neighbouring Ujina pit as part of the LoMP. Ore is classified as oxide, mixed, or sulphide; only sulphide ore is processed, through a 170 ktpd (expanding to 210 ktpd by 2028) flotation plant. Concentrate is transported via a 203 km pipeline to the Port of Patache. Oxide and mixed ore are excluded from current production, and cathode production ceased in 2017.
Block models were estimated using OK, with the block size aligned to 15 m benches. Historical reconciliation confirms that kriging-derived smoothing reflects expected dilution and recovery, so no additional dilution factors were applied in Mineral Reserve conversion.
Mineral Reserves are reported within engineered pit designs supported by detailed schedules and financial analysis. The final pit design, incorporating haul road geometry and geotechnical parameters such as inter-ramp and overall slope angles, batter angles and berm widths, all varied by azimuth and depth based on geotechnical domains.
Pit optimisation was completed in Whittle Four-X (Whittle) using the Lerchs-Grossmann algorithm, with appropriate cost, price, recovery, and slope parameters. Inferred Mineral Resources were excluded from optimisation and scheduling.
The final pit design defines the Mineral Reserve, and subsequently, the LoM production schedule/cashflows, hence pit optimisation is the first step in developing any LoMP. In addition to defining the ultimate size of the open pit, the pit optimisation process also indicates possible mining pushbacks. These intermediate mining stages allow the pit to be developed practically and incrementally while at the same time targeting high-grade ore and deferring waste stripping.
The optimised shells formed the basis for final pit design, incorporating haul road geometry and geotechnical parameters, such as inter-ramp and overall slope angles, batter angles, and berm widths, all varied by azimuth and depth based on geotechnical domains.
LoM cut-off grade and cutback sequencing were optimised in COMET using Lane’s methodology with an NPV objective function. Operational constraints included equipment utilisation, development rates, pit geometry and processing capacities. Mining costs were based on recent actuals and aligned with CMDIC five-year budget.
| 15.2 | Mineral Reserve Assumptions |
| 15.2.1 | Block models and surfaces |
Multiple model versions are in use, incorporating additional data fields such as geometallurgical information, which are utilised at various stages of the planning process; however, all versions are derived from the same underlying models.
The geologic block models used in the Mineral Reserve estimation are:
| · | rosmb_240524_rbk.bmf |
| · | ujimb_mar12rbk_v2.bmf |
| November 2025 | ||
| Page |
| SRK Consulting (UK) Limited | Mineral Resources and Mineral Reserves, Collahuasi Copper Mine - Main Report |
The block model includes all typical attributes such as grades, rock type, weathering (oxidation) status, ‘resource’ confidence categories (Measured, Indicated, and Inferred), and density values. The block model was depleted with the topography as of 31 December 2024.
| 15.2.2 | Open pit geotechnical design criteria |
| 15.2.3 | Rosario pit |
The Rosario open pit currently reaches a depth of approximately 770 m and is planned to extend to around 1,000 m. The pit has benefited from extensive geotechnical investigation to understand its complex geological, structural, hydrogeological, and rock mass conditions. Groundwater is actively managed through continuous pumping from strategically located in-pit and ex-pit wells. In parallel, a comprehensive slope displacement monitoring network is in place to support safe operations.
Recent predictive numerical analyses by WSP Golder Associates (February 2025), undertaken in support of the 2025–2029 plan, indicate that most slopes remain within acceptable design criteria; however, areas where poor to very poor rock mass conditions are exposed exhibit safety factors below target levels. Separately, two-dimensional limit equilibrium analyses for the final LoM pit (WSP Golder Associates, December 2024), assuming drained slope conditions, confirm that overall stability meets current criteria, although localised modifications will be required.
No fatal flaws have been identified for the planned LoM pit expansion. Nevertheless, mining to a depth of 1,000 m represents a significant geotechnical undertaking. Several key risks will require ongoing investigation, control, and governance:
| 1. | Slope Depressurisation: Achieving drained conditions in the deepest sectors is critical. Depressurisation must keep pace with the planned sink rate (approximately 200 m per year). Given variable rock mass response and hydrogeological complexity, contingency measures (e.g. targeted drain holes) will be required to address isolated groundwater compartments. |
| 2. | Geotechnical Characterisation and Validation: Continued drilling and data collection are essential to define structural controls, fault mechanics, lithological and alteration boundaries, and low-quality rock zones. Accurate characterisation remains fundamental for slope stability prediction. |
| 3. | Monitoring Infrastructure: Sustained investment in slope performance monitoring systems is necessary to maintain full pit coverage. |
| 4. | Operational Controls: Ongoing refinement of slope implementation practices and management procedures will be required to maintain safe working conditions. |
| 5. | Technical Governance: CMDIC should reinstate the Geotechnical Assessment Board (GAB), inactive since 2019, to provide independent oversight and peer review. |
| 6. | Design Validation: Recent structural re-domaining (GeoInnova, 2023) has resulted in revised batter–berm configurations (WSP Golder Associates, February 2025). These updates must be validated at inter-ramp and overall slope scale before finalising slope design criteria. |
Figure 15-1 illustrates the various geotechnical zones and their corresponding overall slope angles applied to Rosario and Rosario West during the pit optimisation process.
| November 2025 | ||
| Page |
| SRK Consulting (UK) Limited | Mineral Resources and Mineral Reserves, Collahuasi Copper Mine - Main Report |
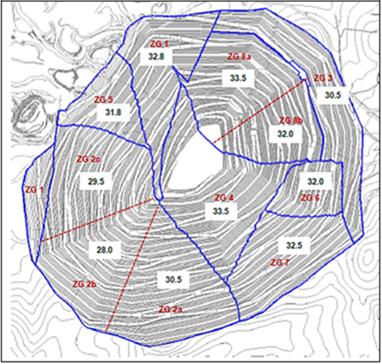
Figure 15-1: Rosario global pit slope angle for Whittle optimisation (Collahuasi CPR, 2023)
| 15.2.4 | Ujina pit |
Mining of ore from the Ujina open pit was suspended in 2004 at a depth of approximately 345 m. Operations are not expected to resume until 2044, and the final LoM depth is planned to reach around 690 m. Given the long pause in activity and the significant deepening required, it is essential that Ujina follows international best practice for geotechnical data collection, evaluation and slope design.
The development of a robust geotechnical model will be central to determining suitable slope configurations. This model should incorporate geological, structural, rock mass and hydrogeological information.
Figure 15-2 illustrates the various geotechnical zones and their corresponding overall slope angles applied to Ujina during the pit optimisation process.
| November 2025 | ||
| Page |
| SRK Consulting (UK) Limited | Mineral Resources and Mineral Reserves, Collahuasi Copper Mine - Main Report |
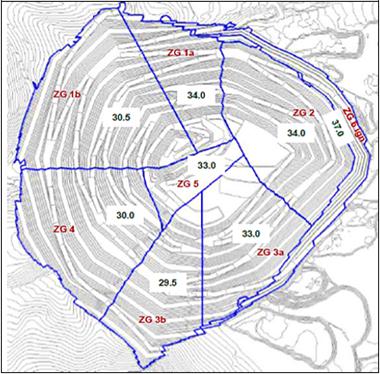
Figure 15-2: Ujina global pit slope angle for Whittle optimisation (Collahuasi CPR, 2023)
| 15.3 | Re-blocking, Dilution and Ore Loss |
The Mine Planning department receives a regularised block model from the Geology department, which already incorporates dilution and losses on a block-by-block basis through regularisation to the minimum mining unit. The Rosario Mineral Resource Model has been regularised from a Mineral Resource sub-cell model with blocks at 5 x 5 x 5 m (x,y,z) to a block size of 20 x 20 x 15 m, which is defined as the minimum Selective Mining Unit (SMU).
The use of a regularised SMU block model is considered an appropriate method for accounting for dilution and losses at a local scale, given the selectivity achievable with the current mining fleet (73 yd³ rope shovel).
Reconciliation for the period 2020–2024 indicates that mined ore tonnages were 4% lower than forecast in the long-term Resource model, while copper grades were 6% higher. As a result, total metal production was 2% higher than predicted. This suggests that the operation is likely achieving better selectivity than initially planned.
The current modifying factors applied through block regularisation assume, at a cut-off grade of 0.3% Cu, an overall loss of 2% and dilution of 5% across the full LoM inventory. Short-term variability remains well within the acceptable range of ±5-10%.
No sub-cell model for Ujina is currently available and, as such, the inherent dilution and mining losses could not be quantified. Furthermore, there is a lack of reliable reconciliation data from the last period during which Ujina was mined. Consequently, by correlating the Ujina deposit with the current observations at Rosario and considering the SMU (20 x 20 x 15 m) block size applied, it was deemed that an acceptable level of dilution and losses is already embedded within the current estimate. It is recommended that this assumption be revisited once an updated Ujina model, incorporating all the proposed recommendations, becomes available.
| November 2025 | ||
| Page |
| SRK Consulting (UK) Limited | Mineral Resources and Mineral Reserves, Collahuasi Copper Mine - Main Report |
| 15.4 | Metallurgical Considerations |
The overall Cu recovery is coded into the individual blocks based on the recovery equation Equation 13-1, where this takes into account a combination of the grades, mineralogy and metallurgical parameters. Throughput is predicted per block based on the grinding parameters. The associated processing costs are then incorporated with consideration of the geometallurgical properties/UGM that the block corresponds to. Table 15-1 presents the average parameters per UGM domain.
Production rate is further considered during the production scheduling, where the Cu recoveries are factored from the base case 170 ktpd, through the application of a constant resulting in reduced recoveries for production rates of 185 ktpd and 210 ktpd.
| 15.5 | Economic Parameters |
Economic input parameters were derived from the 2024 actuals and aligned with the five-year forecast budget plan. Freight and other sales-related costs were estimated in USD/dmt (dry metric tonne of concentrate) and subsequently converted to USD/lb of payable copper, based on the corresponding concentrate grade for each UGM.
The metal price assumptions applied for the Mineral Reserve evaluation were USD3.90/lb for copper and USD14.00/lb for molybdenum, representing a credit of USD0.11/lb Cu.
Average LoM mining operating costs are estimated at USD3.19/t (total) and USD2.65/t (total) for Rosario and Ujina, respectively. Processing costs, including G&A, have been applied on a material-specific basis, resulting in average costs of USD15.02/t of ore and USD14.63/t of ore for Rosario and Ujina, respectively.
Processing recoveries as descried in Section 15.4 range from 80.3% to 84.3% for copper and from 26.3% to 46.8% for molybdenum.
The breakeven cut-off grade accounts for in-pit mining, processing, G&A, and selling costs. For ease of implementation and to ensure stability, the breakeven cut-off grade was rounded and standardised at 0.30% CuT across all UGM.
The economic parameters reported per UGM zone used for the Rosario and Ujina pit optimisations are presented in Table 15-1 and Table 15-2, respectively.
Constraints
With respect to the final pit in the Rosario deposit, the maximum depth of this open pit was restricted to 1,150 metres on the southern slope (with the bottom bench at elevation 3,640 metres). This is not due to any design criteria but rather a limit being applied to the final wall height. Further Geotechnical studies are ongoing to identify potential opportunities to increase the final pit depth.
| November 2025 | ||
| Page |
| SRK Consulting (UK) Limited | Mineral Resources and Mineral Reserves, Collahuasi Copper Mine - Main Report |
Table 15-1: Rosario Economic Parameters
| TECHNICAL & ECONOMICAL PARAMETERS | ROSARIO | ||||||||
| UGM1 | UGM2 | UGM3 | UGM4 | UGM5 | UGM6 | UGM22 | UGM23 | ||
| CuT Head Grade | % | 0.94% | 0.70% | 0.88% | 0.70% | 0.86% | 0.78% | 0.89% | 0.85% |
| Mo Head Grade | ppm | 349 | 150 | 412 | 201 | 79 | 87 | 9 | 8 |
| As Head Grade | ppm | 152 | 223 | 63 | 59 | 218 | 135 | 223 | 190 |
| Mining Cost | |||||||||
| Ore to Mill extraction Cost | USD/t | 3.07 | 3.07 | 3.07 | 3.07 | 3.07 | 3.07 | 3.07 | 3.07 |
| Waste extraction Cost | USD/t | 3.24 | 3.24 | 3.24 | 3.24 | 3.24 | 3.24 | 3.24 | 3.24 |
| Ore Rehandling Cost | USD/t | 1.01 | 1.01 | 1.01 | 1.01 | 1.01 | 1.01 | 1.01 | 1.01 |
| Processing Parameters | |||||||||
| Mill Throughput | tph | 7,246 | 6,551 | 7,306 | 6,038 | 6,565 | 6,383 | 6,222 | 6,566 |
| Mill Utilization | % | 91.0% | 91.00% | 91.00% | 91.00% | 91.00% | 91.00% | 91.00% | 91.00% |
| Average Cu Recovery | % | 87.4% | 81.6% | 89.3% | 83.9% | 75.3% | 84.3% | 81.8% | 80.1% |
| Average Mo Recovery | % | 41.4% | 51.2% | 49.4% | 49.8% | 42.3% | 50.8% | 2.7% | 2.9% |
| Average As Recovery | 28 | 28 | 28 | 28 | 28 | 28 | 28 | 28 | |
| Cu-Mo Concentrate Grade | % | 32.5% | 23.5% | 29.9% | 26.3% | 36.1% | 46.8% | 39.5% | 40.5% |
| Mo Concentrate Grade | % | 45.7% | 44.1% | 46.6% | 45.8% | 43.0% | 45.1% | 18.6% | 17.8% |
| As Concentrate Grade | ppm | 4,253 | 6,238 | 1,767 | 1,640 | 6,106 | 3,776 | 6,232 | 5,322 |
| Plant Cost | |||||||||
| Mill Variable Cost | USD/t | 9.16 | 9.28 | 9.27 | 9.62 | 9.34 | 9.29 | 9.29 | 9.13 |
| Mill Fixed Cost | USD/h | 9,650 | 9,650 | 9,650 | 9,650 | 9,650 | 9,650 | 9,650 | 9,650 |
| Mill Fixed Cost | USD/t | 1.46 | 1.62 | 1.45 | 1.76 | 1.62 | 1.66 | 1.70 | 1.62 |
| G&A Cost | USD/h | 25,440 | 25,440 | 25,440 | 25,440 | 25,440 | 25,440 | 25,440 | 25,440 |
| G&A Cost | USD/t | 3.86 | 4.27 | 3.83 | 4.63 | 4.26 | 4.38 | 4.49 | 4.26 |
| Total Processing Cost | USD/t | 14.48 | 15.17 | 14.54 | 16.01 | 15.21 | 15.34 | 15.49 | 15.00 |
| Mo Plant cost | |||||||||
| Total Cost Molybdenum Plant | USD/tconcol | 8.02 | 8.02 | 8.02 | 8.02 | 8.02 | 8.02 | 8.02 | 8.02 |
| Total Cost Molybdenum Plant | USD/lbCu | 0.012 | 0.016 | 0.013 | 0.014 | 0.010 | 0.008 | 0.010 | 0.009 |
| Financial Parameters | |||||||||
| Copper Price | USD/lb | 3.90 | 3.90 | 3.90 | 3.90 | 3.90 | 3.90 | 3.90 | 3.90 |
| Molybdenum Price | USD/lb | 14.00 | 14.00 | 14.00 | 14.00 | 14.00 | 14.00 | 14.00 | 14.00 |
| TC | USD/dmt | 95.00 | 95.00 | 95.00 | 95.00 | 95.00 | 95.00 | 95.00 | 95.00 |
| RC | USD/lb | 0.095 | 0.095 | 0.095 | 0.095 | 0.095 | 0.095 | 0.095 | 0.095 |
| Selling Cost | |||||||||
| Cu Selling Cost before credits | USD/lbCu | 0.52 | 0.61 | 0.55 | 0.60 | 0.48 | 0.43 | 0.46 | 0.46 |
| Mo Selling Cost | USD/lbMo | 4.22 | 4.23 | 4.21 | 4.22 | 4.24 | 4.22 | 4.74 | 4.78 |
| Mo Total Cost (including cost plant) | USD/lbMo | 4.96 | 5.58 | 4.76 | 5.16 | 6.51 | 5.56 | 321.05 | 317.42 |
| Mo Credits | USD/lbCu | 0.14 | 0.10 | 0.21 | 0.14 | 0.03 | 0.05 | 0.00 | 0.00 |
| Selling Cost after credits | USD/lbCu | 0.38 | 0.51 | 0.34 | 0.46 | 0.44 | 0.38 | 0.46 | 0.46 |
| COG incl. Mo credits | |||||||||
| MILL Marginal Cut-off | % | 0.21% | 0.25% | 0.20% | 0.25% | 0.26% | 0.23% | 0.25% | 0.24% |
| MILL Breakeven Cut-off | % | 0.26% | 0.30% | 0.25% | 0.30% | 0.32% | 0.28% | 0.30% | 0.30% |
| COG not including Mo credits | |||||||||
| MILL Marginal Cut-off | % | 0.22% | 0.25% | 0.22% | 0.26% | 0.27% | 0.24% | 0.25% | 0.24% |
| MILL Breakeven Cut-off | % | 0.27% | 0.31% | 0.27% | 0.31% | 0.32% | 0.29% | 0.30% | 0.30% |
| November 2025 | ||
| Page |
| SRK Consulting (UK) Limited | Mineral Resources and Mineral Reserves, Collahuasi Copper Mine - Main Report |
Table 15-2: Ujina Economic Parameters
| TECHNICAL & ECONOMICAL PARAMETERS | UJINA | ||||
| UGM11 | UGM12 | UGM13 | UGM14 | ||
| CuT Head Grade | % | 0.59% | 0.58% | 0.80% | 0.81% |
| Mo Head Grade | ppm | 163 | 165 | 173 | 58 |
| As Head Grade | ppm | 22 | 19 | 21 | 29 |
| Mining Cost | |||||
| Ore to Mill extraction Cost | USD/t | 2.57 | 2.57 | 2.57 | 2.57 |
| Waste extraction Cost | USD/t | 2.69 | 2.69 | 2.69 | 2.69 |
| Ore Rehandling Cost | USD/t | 1.01 | 1.01 | 1.01 | 1.01 |
| Processing Parameters | |||||
| Mill Throughput | tph | 7,170 | 7,300 | 7,516 | 7,369 |
| Mill Utilization | % | 91.00% | 91.00% | 91.00% | 91.00% |
| Average Cu Recovery | % | 83.6% | 83.2% | 80.3% | 84.3% |
| Average Mo Recovery | % | 44.6% | 46.8% | 46.3% | 26.3% |
| Average As Recovery | 28 | 28 | 28 | 28 | |
| Cu-Mo Concentrate Grade | % | 32.4% | 35.7% | 33.7% | 33.7% |
| Mo Concentrate Grade | % | 44.9% | 45.7% | 44.4% | 35.8% |
| As Concentrate Grade | ppm | 624 | 526 | 589 | 803 |
| Plant Cost | |||||
| Mill Variable Cost | USD/t | 9.39 | 9.37 | 9.37 | 9.35 |
| Mill Fixed Cost | USD/h | 9,650 | 9,650 | 9,650 | 9,650 |
| Mill Fixed Cost | USD/t | 1.48 | 1.45 | 1.41 | 1.44 |
| G&A Cost | USD/h | 25,440 | 25,440 | 25,440 | 25,440 |
| G&A Cost | USD/t | 3.90 | 3.83 | 3.72 | 3.79 |
| Total Processing Cost | USD/t | 14.76 | 14.65 | 14.50 | 14.58 |
| Mo Plant cost | |||||
| Total Cost Molybdenum Plant | USD/tconcol | 8.02 | 8.02 | 8.02 | 8.02 |
| Total Cost Molybdenum Plant | USD/lbCu | 0.012 | 0.011 | 0.011 | 0.011 |
| Financial Parameters | |||||
| Copper Price | USD/lb | 3.90 | 3.90 | 3.90 | 3.90 |
| Molybdenum Price | USD/lb | 14.00 | 14.00 | 14.00 | 14.00 |
| TC | USD/dmt | 95.00 | 95.00 | 95.00 | 95.00 |
| RC | USD/lb | 0.09500 | 0.09500 | 0.09500 | 0.09500 |
| Selling Cost | |||||
| Cu Selling Cost before credits | USD/lbCu | 0.53 | 0.50 | 0.52 | 0.52 |
| Mo Selling Cost | USD/lbMo | 4.23 | 4.22 | 4.23 | 4.32 |
| Mo Total Cost (including cost plant) | USD/lbMo | 5.12 | 4.95 | 5.24 | 9.91 |
| Mo Credits | USD/lbCu | 0.12 | 0.13 | 0.10 | 0.01 |
| Selling Cost after credits | USD/lbCu | 0.41 | 0.37 | 0.42 | 0.51 |
| COG incl. Mo credits | |||||
| MILL Marginal Cut-off | % | 0.23% | 0.22% | 0.23% | 0.23% |
| MILL Breakeven Cut-off | % | 0.27% | 0.27% | 0.28% | 0.27% |
| COG not including Mo credits | |||||
| MILL Marginal Cut-off | % | 0.24% | 0.23% | 0.24% | 0.23% |
| MILL Breakeven Cut-off | % | 0.28% | 0.28% | 0.29% | 0.27% |
| November 2025 | ||
| Page |
| SRK Consulting (UK) Limited | Mineral Resources and Mineral Reserves, Collahuasi Copper Mine - Main Report |
| 15.6 | Pit Optimisation Results |
A critical component of Mineral Reserve estimation is the definition of an appropriate pit shell upon which to base the ultimate pit design. At Collahuasi, this is achieved through optimisation using Whittle software. To facilitate this process, a mining model is developed from the Mineral Resource model by incorporating key operational variables and modifying factors. These include ore type classifications, geotechnical slope zones to control pit slope angles, and geometallurgical attributes that inform process performance and recovery. The model is then constrained to the current surface topography. Once all parameters have been applied, the dataset is exported for use within Whittle for pit optimisation.
For the LoMP, the Whittle models were optimised for a series of revenue factors, and the ultimate pits were selected based on the maximum Discounted Case Flow (DCF) while also taking into account minimum cut-back width of 150 m. Table 15-3 presents a summary of the revenue factor 1 pit shells representing the inventories at USD3.9/lb Cu.
Table 15-3: Summary of Final Pit Results for Rosario and Ujina
| Item | Rosario | Ujina |
| Cu Price (USD/lb) | 3.9 | 3.9 |
| Block Model | rosmb_240524_rbk.bmf | ujimb_mar12rbk_v2.bmf |
| Topography | 31 December 2024 | 31 January 2025 |
| Pit Number | 50 | 50 |
| Pit Size (Mt) | 28,680 | 3,414 |
| Mill Feed (Mt) | 4,462 | 1,153 |
| Stripping Ratio | 5.43 | 1.96 |
| CuT (%) | 0.81 | 0.67 |
| Cu Recovery (%) | 0.88 | 82.36 |
| Mo (ppm) | 238 | 156 |
| Mo Recovery | 0.36 | 0.45 |
| 15.6.1 | Rosario optimisation results |
Figure 15-3 presents the Rosario pit-by-pit graph summarising the split between ore, ore below cut-off grade, and waste. Three distinct phase transitions are evident, followed by extended flat areas with incremental changes as the copper price increases. These step changes indicate that the Rosario pit is sensitive to phase definition and will benefit from a phased mining approach. This is supported by the specified DCF cashflow trending closer to the best-case scenario, whereas the worst-case scenario rapidly pushes the DCF into negative when only the final shell is mined without intermediate phasing.
Figure 15-4 and Figure 15-7 present sectional views through the current topography, the current LoM pit design, the optimised reserve pit shell (Measured and Indicated, MI) at a copper price of USD3.9/lb, and the resource pit shell (including Inferred, MII) at a copper price of USD4.7/lb. It is evident that the current reserve pit is smaller than the optimised shell in most directions and is constrained at approximately the 3,640 mRL. When this depth constraint is removed and Inferred material is monetised, the MII pit shell at USD3.9/lb extends towards the resource shell limits. This demonstrates that the resource shell is primarily constrained by classification, and that both reserves and resources are limited by classification boundaries or physical constraints rather than cost.
| November 2025 | ||
| Page |
| SRK Consulting (UK) Limited | Mineral Resources and Mineral Reserves, Collahuasi Copper Mine - Main Report |
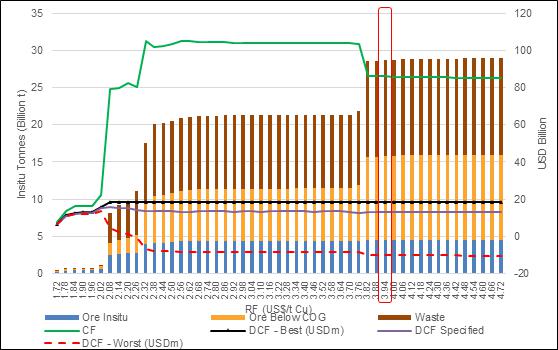
Figure 15-3: Rosario pit-by-pit graph (Measured and Indicated)
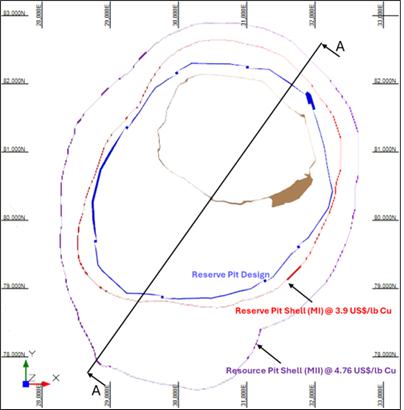
Figure 15-4: Rosario Horizontal Section View (SRK, 2025)
| November 2025 | ||
| Page |
| SRK Consulting (UK) Limited | Mineral Resources and Mineral Reserves, Collahuasi Copper Mine - Main Report |
| 15.6.2 | Ujina optimisation results |
Figure 15-5 presents the Ujina pit-by-pit graph and sectional views (Figure 15-6 and Figure 15-8), which display a similar outcome to Rosario. The current reserve pit is smaller than the optimised shell and remains constrained by both classification and physical limits. When Inferred material is monetised under the MII scenario, the resulting shell extends to the full resource envelope, consistent with the behaviour observed at Rosario.
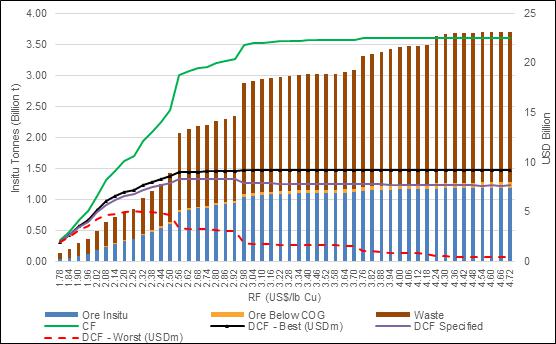
Figure 15-5: Ujina pit-by-pit graph (Measured and Indicated)
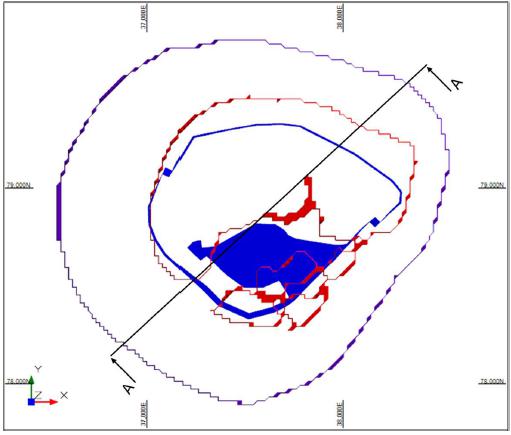
Figure 15-6: Ujina Horizontal Section View (SRK, 2025)
| November 2025 | ||
| Page |
| SRK Consulting (UK) Limited | Mineral Resources and Mineral Reserves, Collahuasi Copper Mine - Main Report |
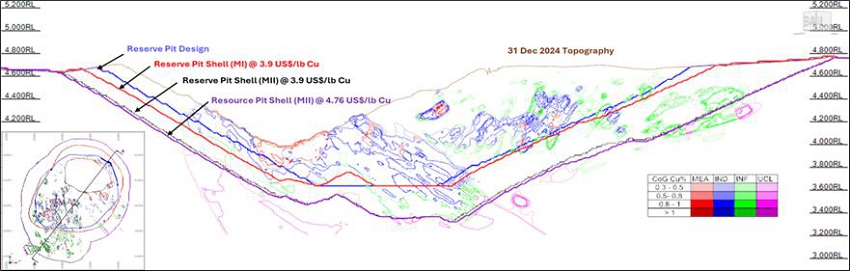
Figure 15-7: Rosario Section A-A (SRK, 2025)
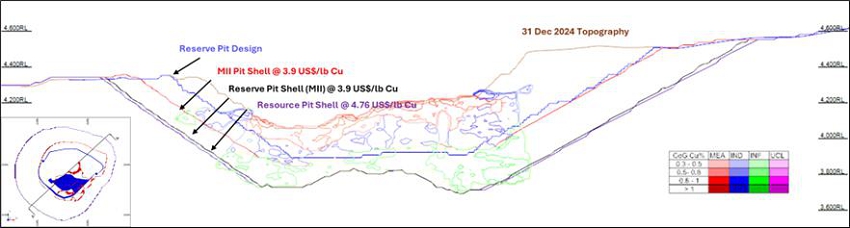
Figure 15-8: Ujina Section A-A (SRK, 2025)
| November 2025 | ||
| Page |
| SRK Consulting (UK) Limited | Mineral Resources and Mineral Reserves, Collahuasi Copper Mine - Main Report |
| 15.7 | Pit Design |
In accordance with the CIM Definition Standards, the ultimate pit designs are guided by the pit optimisation analyses, which consider all Inferred Mineral Resources as waste.
The mine design process focuses on developing practical open-pit design phases suitable for detailed scheduling. The Whittle shells are used as a guide for developing the phase design. Two or more shells may have to be joined to allow a phase width minimum of 150 m. The base parameters for mine design are summarised in Table 15-4.
Table 15-4: Mine Design Parameters
| Item | Value |
| Phase Width | 150 - 200 m |
| Phase Length | 1,500 m |
| Minimum mining width | 60 m |
| Bench Height | 15 m |
| Ramp Width | 38 m |
| Geotechnical Berm Width | 25-40 m |
| Ramp gradient | 10% |
| Maximum Stack Hight | 60 m |
The Rosario pit comprises 26 independent phases, while the Ujina pit consists of 10 phases. All mining phases have been designed to maintain a minimum phase width of 150 m and a minimum phase length of 1,500 m to accommodate an independent ramp system. Previous mining phases were designed with narrower pushbacks and higher sink rates to expedite ore access; however, this strategy was subsequently revised due to its adverse impact on equipment productivity.
Multiple phases are mined concurrently, providing more than one access point into the pit. Not all ramps are able to exit close to the waste dumps and stockpiles that are positioned to the west of the pit (which is thereafter factored into the haulage analysis).
Figure 15-9 illustrates the pushback phases and mining sequence for Rosario and Ujina pits.
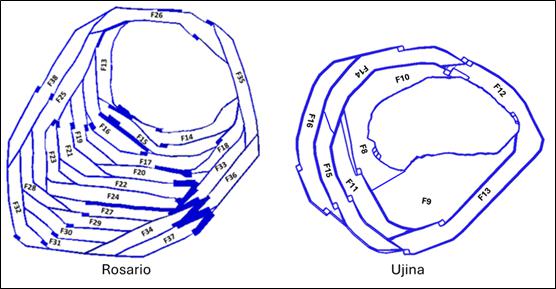
Figure 15-9: Rosario and Ujina Pushback Phases and Mining Sequence (CMDIC, 2024)
| November 2025 | ||
| Page |
| SRK Consulting (UK) Limited | Mineral Resources and Mineral Reserves, Collahuasi Copper Mine - Main Report |
Haul Road Gradient
A haul road gradient of 1:10 (10% or 5.71°) has been adopted throughout the full depth of the mine. This selection aligns with industry best practice and is optimised for the proposed truck fleet.
A reduction in haul road gradient significantly increases a vehicle’s attainable uphill speed while simultaneously decreasing haulage cycle times, fuel consumption, and mechanical stress. Consequently, this reduction leads to lower maintenance costs.
Haul Road Width
Haul road width is determined by the size of the operating truck fleet. The current operation utilises ultra-class Komatsu 930 haul trucks (>300 t class), each with a width of 9.6 m. According to standard design guidelines, the minimum road width for double-lane traffic should be 3.5 times the vehicle operating width. Accordingly, the current haul roads are designed at 38 m, which exceeds the guideline by 4.4 m. This additional width enhances operational safety, particularly with respect to the ramp length required to access the pit bottom.
| 15.7.1 | Rosario open pit |
The final open pit at Rosario is planned to reach a diameter of approximately 4.5 km and a final depth of 1.2 km. At this depth, it is estimated that a loaded haul truck will require 45 to 60 minutes to travel from the pit floor to surface.
Based on the phase progression shown in Figure 15-10 and the inventory data provided in Table 15-5, the following observations are noted:
| · | ore grades generally decrease towards the north; |
| · | the strip ratio increases towards the south and SE; and |
| · | the preferred mining direction is towards the SW. |
The current phase configuration, consisting of multiple independent mining stages, presents sequencing challenges in maintaining ramp access to active areas concurrently. Further design refinement is required to optimise ramp alignment and continuity between phases.
| November 2025 | ||
| Page |
| SRK Consulting (UK) Limited | Mineral Resources and Mineral Reserves, Collahuasi Copper Mine - Main Report |
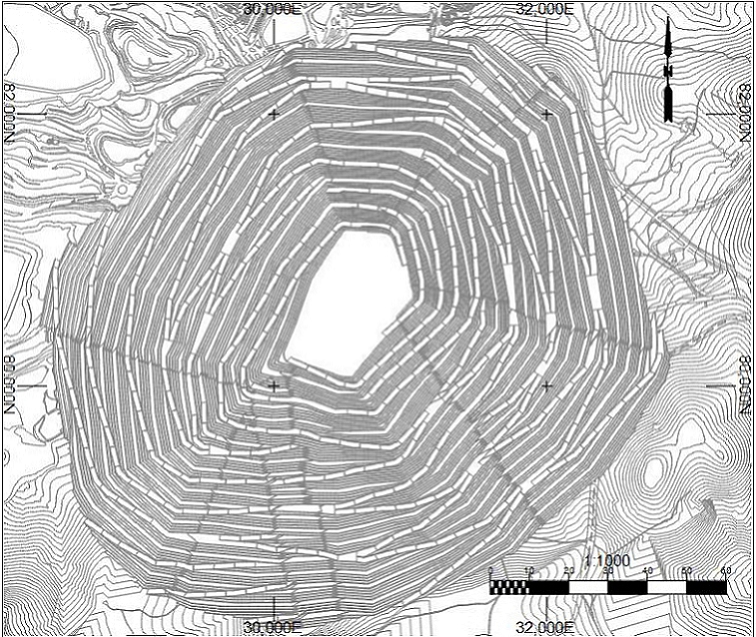
Figure 15-10: Rosario Final Pit Layout (CMDIC, 2024)
| November 2025 | ||
| Page |
| SRK Consulting (UK) Limited | Mineral Resources and Mineral Reserves, Collahuasi Copper Mine - Main Report |
Table 15-5: Rosario Phase Inventories
| Rosario | Total Tonnes | Waste
+ Oxide Tonnes |
Strip Ratio | Sulp.
Ore Tonnes |
Grade | Metal |
| Phase | (Mt) | (Mt) | (t:t) | (Mt) | (Cu%) | (kt Cu) |
| F13 | 3 | 0 | 0.0 | 3 | 0.79 | 22 |
| F14 | 209 | 91 | 0.8 | 118 | 1.00 | 1,181 |
| F15 | 267 | 166 | 1.6 | 102 | 0.88 | 896 |
| F16 | 404 | 268 | 2.0 | 136 | 0.84 | 1,142 |
| F17 | 600 | 448 | 2.9 | 152 | 0.83 | 1,268 |
| F18 | 379 | 281 | 2.9 | 98 | 0.92 | 897 |
| F19 | 311 | 259 | 5.0 | 52 | 0.79 | 408 |
| F20 | 546 | 404 | 2.9 | 142 | 0.81 | 1,146 |
| F21 | 299 | 253 | 5.5 | 46 | 1.04 | 480 |
| F22 | 624 | 501 | 4.1 | 123 | 0.83 | 1,030 |
| F23 | 272 | 238 | 7.1 | 34 | 1.14 | 384 |
| F24 | 624 | 482 | 3.4 | 142 | 0.82 | 1,162 |
| F25 | 617 | 458 | 2.9 | 159 | 0.89 | 1,413 |
| F26 | 561 | 320 | 1.3 | 241 | 0.74 | 1,792 |
| F27 | 446 | 322 | 2.6 | 124 | 0.83 | 1,031 |
| F28 | 311 | 253 | 4.3 | 58 | 1.09 | 637 |
| F29 | 425 | 327 | 3.4 | 97 | 0.86 | 841 |
| F30 | 477 | 358 | 3.0 | 119 | 0.93 | 1,103 |
| F31 | 321 | 272 | 5.5 | 49 | 1.06 | 521 |
| F32 | 540 | 367 | 2.1 | 172 | 0.78 | 1,343 |
| F33 | 326 | 281 | 6.2 | 45 | 0.98 | 444 |
| F34 | 531 | 309 | 1.4 | 222 | 0.78 | 1,739 |
| F35 | 536 | 439 | 4.6 | 97 | 0.93 | 901 |
| F36 | 419 | 329 | 3.7 | 90 | 0.77 | 695 |
| F37 | 470 | 368 | 3.6 | 102 | 0.86 | 880 |
| F38 | 670 | 537 | 4.0 | 133 | 0.83 | 1,106 |
| Sub-Totals | 11,188 | 8,331 | 2.9 | 2,857 | 0.86 | 24,462 |
| 15.7.2 | Ujina open pit |
The planned final open pit at Ujina will have a diameter of approximately 2.6 km and reach a final depth of around 700 m.
Based on the phase sequencing illustrated in Figure 15-11 and the inventory data provided in Table 15-6, the following key observations are made:
| · | The central phases, located around the current pit, tend to exhibit lower strip ratios. |
| · | Strip ratios progressively increase towards the western side, particularly as phase 16 expands into areas of higher topography. |
| · | The Ujina deposit is currently not permitted for mining operations beyond 2027, and the planned pit intersects a watercourse within the northwestern corner. Mining from this pit after 2027 will necessitate obtaining additional environmental and operational permits, representing a project risk which will need to be managed appropriately. |
| November 2025 | ||
| Page |
| SRK Consulting (UK) Limited | Mineral Resources and Mineral Reserves, Collahuasi Copper Mine - Main Report |
| · | The Ujina pit has remained inactive for about twenty years, and will not be mined until 2044. Slope control and geotechnical monitoring will be required when mining resumes, with the mining sequence predominantly following a top-down approach, progressing from the surface to the pit bottom. |
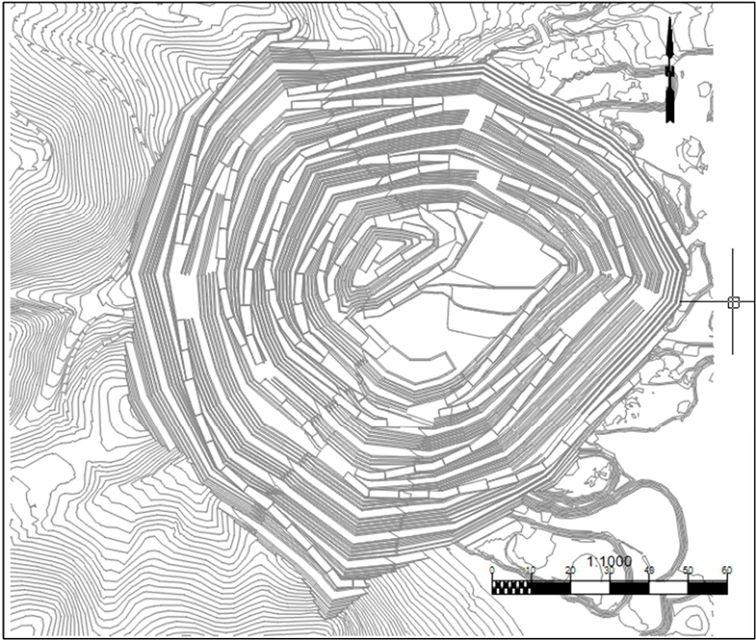
Figure 15-11: Ujina Final Pit Layout (CMDIC, 2024)
Table 15-6: Ujina Phase Inventories
| Ujina | Total Tonnes | Waste Tonnes |
Strip Ratio | Ore Tonnes | Grade | Metal |
| Phase | (Mt) | (Mt) | (t:t) | (Mt) | (Cu%) | (kt Cu) |
| F07 | 17 | 2 | 0.1 | 15 | 0.75 | 114 |
| F08 | 286 | 179 | 1.7 | 107 | 0.77 | 818 |
| F09 | 311 | 142 | 0.8 | 169 | 0.70 | 1,194 |
| F10 | 170 | 106 | 1.6 | 64 | 0.67 | 432 |
| F11 | 366 | 189 | 1.1 | 178 | 0.60 | 1,068 |
| F12 | 126 | 72 | 1.3 | 54 | 0.65 | 350 |
| F13 | 284 | 155 | 1.2 | 129 | 0.57 | 737 |
| F14 | 304 | 231 | 3.2 | 73 | 0.69 | 500 |
| F15 | 351 | 262 | 2.9 | 89 | 0.69 | 620 |
| F16 | 384 | 330 | 6.0 | 55 | 0.81 | 443 |
| Sub-Totals | 2,601 | 1,668 | 1.8 | 933 | 0.67 | 6,276 |
| November 2025 | ||
| Page |
| SRK Consulting (UK) Limited | Mineral Resources and Mineral Reserves, Collahuasi Copper Mine - Main Report |
| 15.7.3 | Waste Rock Dumps |
Waste rock dump design considerations are discussed in ITEM 18, whilst waste rock geochemistry is addressed in ITEM 20.
| 15.7.4 | Waste Rock Dump design |
Rosario currently utilises two primary WRD located to the north-west and south of the open pit, as well as a single Low-Grade Stockpile (LG SP), as illustrated in Figure 15-12. Table 15-7 summarises the total design capacities in comparison to the LoM material movement requirements. All WRD possess sufficient volumetric capacity to accommodate the forecast LoM waste material.
SRK notes that, at present, all Inferred (INF) material is also being routed to the WRD. Should the Inferred material within the pit ultimately be converted to Ore, an increased volume of low-grade material will require stockpiling, as the Inferred material would take processing precedence due to its comparatively higher grades. This scenario may result in additional LG SP capacity requirements.
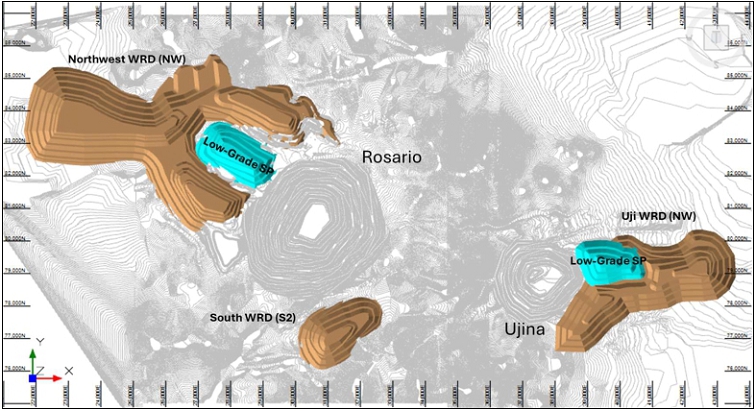
Figure 15-12: General WRD and LG SP Layout (SRK, 2025)
Table 15-7: Rosario and Ujina WRD Capacities
| Parameter | Units | Rosario | Unjina |
| Capacity Requirement | Mt | 8,328 | 1,668 |
| Mm3 | 4,245 | 892 | |
| In situ Density | t/m3 | 2.55 | 2.43 |
| Density | t/lcm | 1.96 | 1.87 |
| Swell and Re-compaction Factor | m3:m3 | 1.3 | 1.3 |
| WRD Design Volume | Mm3 | 5,083 | 976 |
| Additional Capacity | Mm3 | 837 | 84 |
| % | 20 | 9 | |
| Surface Area | Mm2 | 58 | 15 |
| Maximum Height | m | 540 | 420 |
| November 2025 | ||
| Page |
| SRK Consulting (UK) Limited | Mineral Resources and Mineral Reserves, Collahuasi Copper Mine - Main Report |
| 15.8 | Mineral Reserve Statement |
The QP has reviewed the methodology applied and the results obtained for the 2024 Mineral Reserve Estimation completed by CMDIC. The Mineral Reserves have an effective date of 31 December 2024. The QP is satisfied that the conversion of Mineral Resources to Mineral Reserves was undertaken using appropriate mine design and planning practices. Dilution and mining recovery assumptions are supported by historical operational data and are modelled through industry-standard block regularisation to a minimum mining width, determined by the largest loading equipment in use. Tonnages and grades have been reported using an economically justified cut-off grade based on documented cost and price assumptions.
The reported figures have been validated and are considered suitable for public disclosure. The Mineral Reserves provide a reasonable forecast of the material expected to be mined. Only material classified as Measured and Indicated Mineral Resources has been converted to Mineral Reserves. The results are presented in Table 15-8. All figures are expressed to an appropriate level of precision and fully comply with the disclosure requirements for Mineral Reserves as defined under National Instrument 43-101.
Table 15-8: CMDIC Mineral Reserves for Rosario and Ujina deposit as at 31 December 2024
| Material type | Category | Tonnes | Grade | Grade | Metal | Metal |
| Mt | % CuT | Mo ppm | kt CuT | kt Mo | ||
| Rosario Main | ||||||
| Sulphide | Proven | 566 | 0.83 | 204 | 4,687 | 115 |
| Cut-off 0.30% CuT | Probable | 1,658 | 0.82 | 314 | 13,531 | 521 |
| Total Sulphide | Total | 2,224 | 0.82 | 286 | 18,218 | 637 |
| Stockpiles (Sulphide) | Proven | |||||
| Cut-off 0.30% CuT | Probable | 312 | 0.54 | 140 | 1,695 | 44 |
| Total Stockpile | Total | 312 | 0.54 | 140 | 1,695 | 44 |
| Proven | 566 | 0.83 | 204 | 4,687 | 115 | |
| Total Rosario Main | Probable | 1,970 | 0.77 | 287 | 15,226 | 565 |
| Total | 2,536 | 0.79 | 268 | 19,913 | 680 | |
| Rosario West | ||||||
| Sulphide | Proven | 129 | 1.11 | 7 | 1,437 | 1 |
| Cut-off 0.30% CuT | Probable | 503 | 0.95 | 7 | 4,807 | 3 |
| Total Sulphide | Total | 633 | 0.99 | 7 | 6,244 | 4 |
| Stockpiles (Sulphide) | Proven | |||||
| Cut-off 0.30% CuT | Probable | |||||
| Total Stockpile | Total | |||||
| Proven | 129 | 1.11 | 7 | 1,437 | 1 | |
| Total Rosario West | Probable | 503 | 0.95 | 7 | 4,807 | 3 |
| Total | 633 | 0.99 | 7 | 6,244 | 4 | |
| Proven | 696 | 0.88 | 167 | 6,124 | 116 | |
| Sub-total Rosario | Probable | 2,473 | 0.81 | 230 | 20,033 | 568 |
| Total | 3,169 | 0.83 | 216 | 26,157 | 685 | |
| UJINA |
| November 2025 | ||
| Page |
| SRK Consulting (UK) Limited | Mineral Resources and Mineral Reserves, Collahuasi Copper Mine - Main Report |
| Material type | Category | Tonnes | Grade | Grade | Metal | Metal |
| Mt | % CuT | Mo ppm | kt CuT | kt Mo | ||
| Sulphide | Proven | 336 | 0.69 | 163 | 2,333 | 55 |
| Cut-off 0.30% CuT | Probable | 597 | 0.66 | 151 | 3,944 | 90 |
| Total Sulphide | Total | 933 | 0.67 | 156 | 6,276 | 145 |
| Stockpiles (Sulphide) | Proven | |||||
| Cut-off 0.30% CuT | Probable | 4.58 | 0.55 | 221 | 25 | 1 |
| Total Stockpile | Total | 4.58 | 0.55 | 221 | 25 | 1 |
| Proven | 336 | 0.69 | 163 | 2,333 | 55 | |
| Sub-total UJINA | Probable | 602 | 0.66 | 152 | 3,969 | 91 |
| Total | 938 | 0.67 | 156 | 6,302 | 146 | |
| Total Mineral Reserves | Proven | 1,032 | 0.82 | 166 | 8,457 | 171 |
| Probable | 3,075 | 0.78 | 215 | 24,002 | 660 | |
| Total | 4,107 | 0.79 | 202 | 32,458 | 831 |
Important information regarding the Mineral Reserves disclosed in Table 15-8:
| · | Francois Taljaard (Pr.Eng - 20150469) of SRK Consulting (UK) Ltd, has reviewed the mining approach and Mineral Reserve estimate reported herein and takes responsibility for the 31 December 2024 Reserve Estimate. Mr Taljaard is a qualified person and independent for the purposes of National Instrument 43-101 |
| · | Pit inventories were constrained by the 2024 LoM pit designs and depleted against the topography as at 31 December 2024. |
| · | Mineral Reserves are reported based on a regularised block size of 20 x 20 x 15 m. No additional dilution or recovery factors have been applied. |
| · | The Mineral Reserves are reported at a cut-off grade of 0.3%CuT for in situ material and 0.3%CuT for stockpile material (aligned to the stockpiling strategy). |
| · | Mineral Reserves have been defined within LoM pit designs guided by pit shells optimised using Measured and Indicated Mineral Resources only, based on input parameters: copper price of USD3.90/lb, a selling cost of USD0.51/lb Cu, and a molybdenum price of USD14.00/lb Mo. Average LoM mining operating costs are estimated at USD3.19/t (total) for Rosario and USD2.65/t (total) for Ujina. Processing costs (including G&A) have been applied on a material-specific basis, resulting in average costs of USD15.02/t of ore for Rosario and USD14.63/t of ore for Ujina. Processing recoveries are based on the defined Geometallurgical Units and range from 80.3% to 84.3% for copper and from 26.3% to 46.8% for molybdenum. No allowance for royalty is included in the optimisation parameters, where this would account for USD0.20/lb at the copper price of USD3.90/lb for the given inventory. |
| · | Stockpiles inventories reflect closing balances 31 December 2024 of the sulphide stockpiles. Discounted process recoveries are applied to stockpile material with average LoM values of 77%. |
| · | All tonnages are reported on a dry basis. |
| · | Mineral Reserves have demonstrated economic viability. |
| · | The Mineral Reserve comprises a mine life inclusive of stockpile feed of 59 years. |
| November 2025 | ||
| Page |
| SRK Consulting (UK) Limited | Mineral Resources and Mineral Reserves, Collahuasi Copper Mine - Main Report |
| · | Mineral Reserve tonnages have been rounded to reflect the estimation accuracy; therefore, totals may not sum precisely due to rounding. All figures are reported in metric units. |
| · | Mineral Reserve are estimated and reported on 100% attributable basis. |
As of 31 December 2024, CMDIC has the legal right to mine and extract minerals from the Rosario deposit to 2041 and Ujina to 2027 (mining assumed to recommence 2043). The portion of Mineral Reserves constrained by this period represents approximately 30% of the current total. CMDIC’s right to extract minerals from the Rosario and Ujina pits beyond 2041 (Rosario pit) requires the completion of the necessary technical studies and associated impact assessments, to inform an updated EIA, to be submitted in 2027. The scope of the updated EIA is presently focused on a potential expansion to achieve a production rate of 370 ktpd, with approval anticipated in 2030. Should the expansion case to 370 ktpd be deferred, a revised application for an environment permit will be required to support the right to extract Mineral Reserves beyond 2041.
Other than that stated above, to the QP’s knowledge as informed by Anglo American, there are no known environmental, legal, title, taxation, socioeconomic, marketing, political, or other relevant factors that are expected to materially impact the Mineral Reserve estimates stated above.
SRK has reported the Mineral Reserves above a cut-off grade of 0.3%CuT, which is consistent with the strategy for scheduling ore in the current LoM plan and operating practice, above which all material is either fed to the plant or the low-grade stockpile. In converting Mineral Resource to Mineral Reserves SRK does not consider it appropriate to apply any modification to classification, which would result in translating Measured Mineral Resources into Probable Mineral Reserves. SRK understands that historically when translating Measured Mineral Resources to Mineral Reserves CMDIC has converted a portion of low-grade material destined for the low-grade stockpile to Probable which reflected historical selective mining practices defined by cut-off grade bins. More recently, the scheduling approach has been amended to incorporate detailed geometallurgical modelling and dynamic cut-off grade scheduling thereby obviating the need for selective reporting. Furthermore, SRK notes that the mine schedule applies further metallurgical recovery discounts to all material which is recovered from the stockpiles thereby accounting for the impact of further oxidation over time.
| 15.9 | Comparison with Previous Mineral Reserve Estimate |
The most recent Mineral Reserve estimate for CMDIC, prepared by Anglo American, is included in the Annual Ore Reserves and Mineral Resources Report 2024, as summarised in Table 6-2.
In reporting the Mineral Reserves herein, SRK has utilised the actual end-of-period topography as at 31 December 2024 to constrain the inventories within the engineered pit design. The stated Total Mineral Reserves presented in Table 15-8 are within less than 2% of those previously reported by Anglo American. This minor variance is primarily attributed to the earlier estimate having been based on a forecasted end-of-year position that included approximately three months of planned production.
A difference in classification approach related to the translation of Measured Mineral Resources to either Proven or Probable Mineral Reserves is discussed in Section 15.8 above.
| November 2025 | ||
| Page |
| SRK Consulting (UK) Limited | Mineral Resources and Mineral Reserves, Collahuasi Copper Mine - Main Report |
ITEM 16 MINING METHODS
The mining method applied for the whole LoM is conventional truck and shovel open pit mining from the Rosario and Ujina pits. Currently, only sulphide ore is processed through a 170 ktpd (expanding to 210 ktpd by 2028) flotation plant. The disclosed Mineral Reserves above 0.30% CuT are sufficient to sustain the operations for 59 years (2084).
Total material movement currently stands at 815 ktpd (ore plus waste), aligning with the permitted limit of 300 Mtpa. Material is mined using 11 electric rope shovels (Bucyrus and P&H, 11 × 73 yd³ capacity) and hauled by a fleet of 105 Komatsu 930-class haul trucks (>300 t class). A well-maintained network of haul and access roads links the pits to key operational areas, including RoM pads, stockpiles, waste dumps, tailings, the camp, and processing facilities.
Material with grades between the breakeven cut-off and the variable operating cut-off is classified as low-grade and stockpiled for future processing or to maintain mill throughput as required.
| 16.1 | Pit Dewatering and Depressurisation |
| 16.1.1 | Rosario |
Hydrogeological setting
The general hydrogeology of the mine area is described in Section 5.3.1. The near-pit hydrogeology of the Rosario pit is characterized by a fractured-rock aquifer system, where groundwater flow is strongly influenced by fault structures and their connectivity. Hydraulic conductivities in the main fractured-rock units typically range from 10⁻6 to 1 m/d, with higher values (>10 m/d) in fault zones and lower values in less fractured host rocks. Specific yield is generally low. The system is highly heterogeneous with groundwater perched in areas and often compartmentalised across structures. Rosario’s slopes include bands of altered, low-permeability, clay-rich argillic or sericitic zones associated with faults and which are critical, but difficult, to drain. From a geotechnical perspective, these poorly draining bands are a known risk for slope instability, as they can maintain high pore pressures that reduce effective stress and provide a failure surface.
Current dewatering operations
Due to the relatively low permeability of the pit walls and surrounding host rock, pit water management focuses on depressurisation of pore water pressures in the pit slopes in order to maintain pit slope stability, rather than management of inflows which are low.
| November 2025 | ||
| Page |
| SRK Consulting (UK) Limited | Mineral Resources and Mineral Reserves, Collahuasi Copper Mine - Main Report |
Depressurisation of pit slopes is achieved through a dense network of pumping wells. As of July 2025, approximately 60 dewatering wells (see Figure 16-1) were operating in and around the Rosario pit installed to depth of between 200 and 700 m and pumping at rates of between 0.5 and 13 L/s, totalling on average around 110 L/s. Although pore water pressure recovery at many locations is generally slow, this is not the case at all locations. Therefore, all pumping wells are connected to permanent electrical power and critical wells are also supplied by a backup generator in case of power outage. Wells pump to booster pumping stations which pump the water to the pit perimeter and into the site water circuit. Pads and dedicated access for each well are incorporated into the final pit design such that access is maintained throughout the well life. Wells are lost and redrilled with each new pushback, requiring around 20 to 25 new wells to be designed, access built and drilled each year. The capital costs for drilling and equipping such a large-scale dewatering network are high (over USD30m) per year as are the operating costs.
No horizontal drainholes are currently installed in the open pit, although numerical modelling studies have suggested that this might improve depressurisation of problematic areas such as the major fault zones.
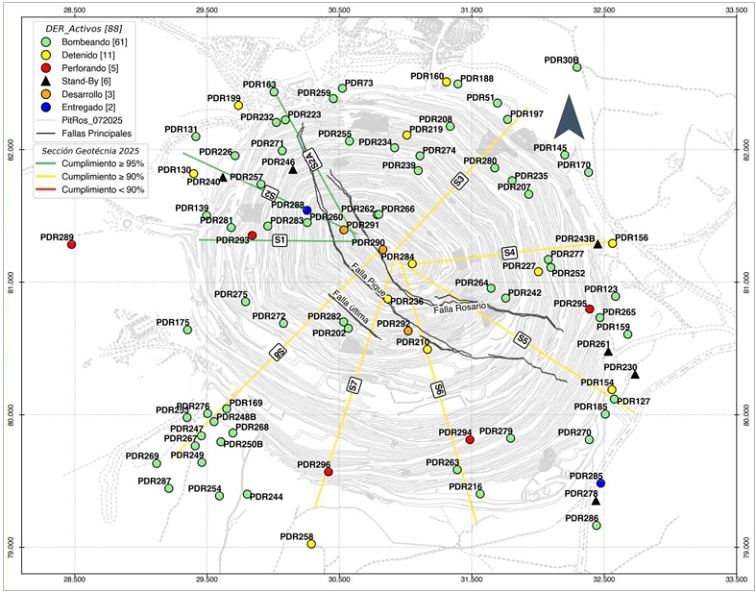
Figure 16-1: Rosario Dewatering wells and July 2025 status2 (CDMIC, 2025)
2 Pumping well status: Green = pumping, yellow = stopped, red = being drilled, black = on stand-by, orange = developed, blue = delivered. Section status: Green = >95% compliance, yellow = >90% compliance, red = <90% compliance.
| November 2025 | ||
| Page |
| SRK Consulting (UK) Limited | Mineral Resources and Mineral Reserves, Collahuasi Copper Mine - Main Report |
Monitoring and targets
A calibrated numerical groundwater model (Itasca, December 2024) has been used to simulate and optimise various dewatering well configurations for the Rosario pit (see below). The pore water pressure results from this model have been inputted into the geotechnical stability assessments (see Section 16.2.9) which, in turn, have been used to generate specific operational pore water pressure targets. The overall geotechnical target at Rosario pit is to maintain the phreatic surface at least 50 m below the slopes in all areas, with the exception of a few key areas near the pit base and along key barrier faults such as the Pabellón fault.
The current status of wells (pumping, inoperative or awaiting drilling/equipping) is reported monthly (see Figure 16-1). Pore water pressures are monitored against target via a network of vibrating wire piezometers (VWP) and data are also reconciled and reported on a monthly basis against targets for eight key geotechnical sections (shown on Figure 16-1, example in Figure 16-2). Sections are graded green, amber or red depending on their compliance with targets. The actual dewatering target used is below the minimum depressurisation requirements defined by the slope stability assessment in order to ensure a buffer. As of July 2025, some sections were amber with slightly elevated water levels due to delays in drilling, but no sections were red. In general, dewatering targets have been largely achieved over a relatively long period of time with the dewatering system having operated for around 20 years.
| November 2025 | ||
| Page |
| SRK Consulting (UK) Limited | Mineral Resources and Mineral Reserves, Collahuasi Copper Mine - Main Report |
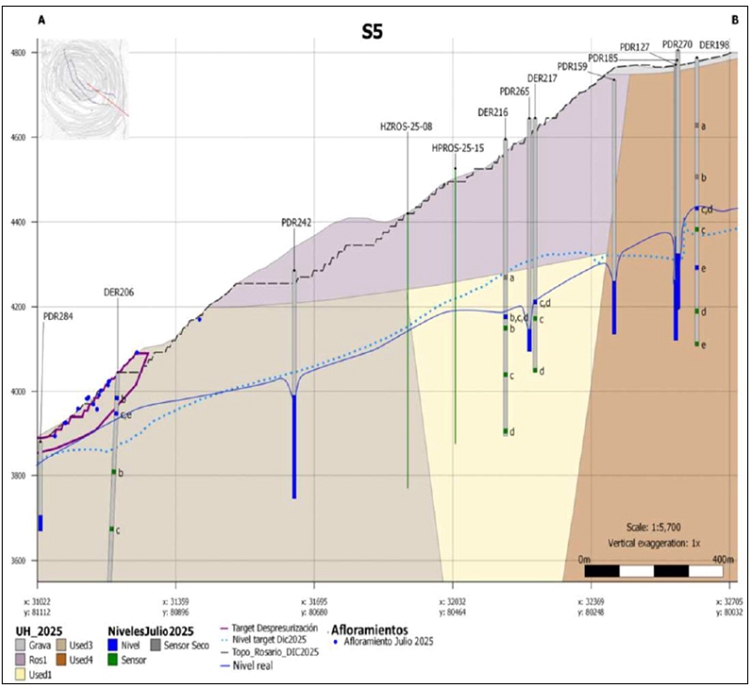
| Figure 16-2: | Rosario pit: Example depressurisation section; target in dotted blue line, actual in solid blue line, and zone where full depressurisation is required in maroon (CDMIC, 2025) |
Dewatering planning
Numerical modelling of the current five-year plan (210 ktpd) shows the required number of active dewatering wells increasing to between 117 and 127 wells (depending on the scenario) pumping at between 199 and 266 L/s by 2029. Between 19 and 25 new wells are predicted to be required each year throughout the five-year plan.
Beyond the current five-year plan, a number of scenarios have been developed which are predicted to enable the full LoMP. The modelling shows that between 21 and 26 new wells will be required per year, with the total number of operating wells (see Figure 16-3) predicted to rise to over 200 at some points in the mine life e.g. 2043 (versus 60 wells currently operational). The modelling suggests that this should be supplemented with up to 33 horizontal drain holes (200 m long) to improve depressurisation of the major fault zones, such as the Pabellón fault. Pumping rates for the LoM dewatering plan reach over 220 L/s (see Figure 16-3) but generally stay around 150 L/s (versus current dewatering rates of around 110 L/s).
| November 2025 | ||
| Page |
| SRK Consulting (UK) Limited | Mineral Resources and Mineral Reserves, Collahuasi Copper Mine - Main Report |
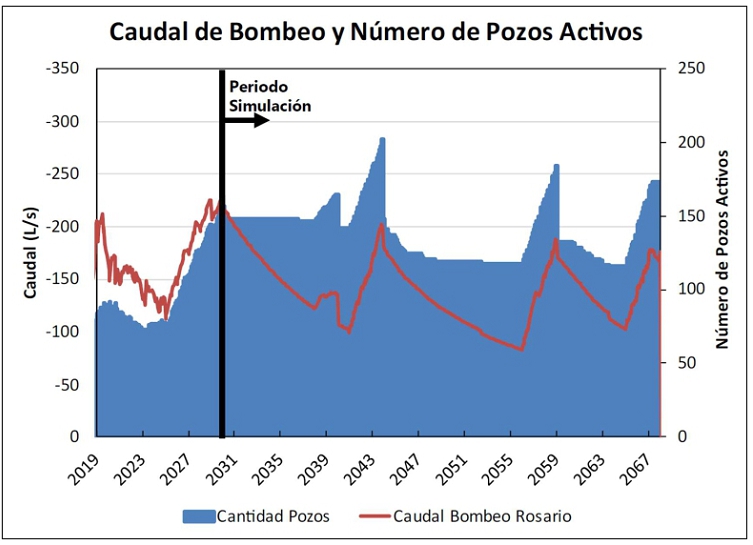
| Figure 16-3: | Modelled total dewatering volume (red, y1 axis) and dewatering wells (blue, y2 axis) for the LoM “Case 3” allowing for horizontal drain holes in fault zones (Itasca, 2024) |
Capital and operating costs for wells and drains at Rosario pit have been included in the financial model to 2067, but only allows for 20 new wells per year which is lower than the 21 to 26 wells per year predicted by the numerical modelling.
The potential for directional drilled wells has been evaluated at a high level although no firm plans have been modelled or costed at this stage. A directionally drilled well would cost more to install, but could offer two key advantages: (a) it could access and pump groundwater from areas of the pit that are currently hard to reach due to surface access limitations, improving the reach and effectiveness of the dewatering system; and (b) a single directionally drilled well might be able to pump groundwater from zones that currently require multiple wells to service, reducing congestion and the cost of planning and maintaining access in the pit.
Current Uncertainties
Although the general hydrogeological understanding of the near-pit hydrogeology is relatively well developed, there remain some uncertainties that present risks to the effectiveness of ongoing dewatering and depressurisation operations, as follows:
| · | Existing dewatering wells and pump tests in Rosario pit reach depths of up to 750 m below ground surface but the hydrogeology at the full depth of the pit (1000 m) is based on modelling rather than field test data. Without deeper wells and testing to the full base of the pit, the effectiveness of deep depressurisation (and the presence of any deeper high-pressure groundwater zones) remains an uncertainty. |
| November 2025 | ||
| Page |
| SRK Consulting (UK) Limited | Mineral Resources and Mineral Reserves, Collahuasi Copper Mine - Main Report |
| · | Some areas of the pit and/or specific geological units do not show a depressurisation response as expected, which suggests they may be hydraulically isolated or compartmentalised from current dewatering activities. However, the current distribution of piezometers is not sufficient to fully understand this behavior leading to some uncertainty in terms of understanding both current and future depressurisation effectiveness. |
| 16.1.2 | Ujina |
At Ujina, groundwater flow is also primarily through fractures and controlled by structures. The local hydrogeology is defined by four main hydrogeological units with permeabilities generally ranging from between 10⁻⁴ and 1 m/d; ignimbrites in the east with higher permeability, acid volcanic rocks and andesites in the west and central areas with variable permeability, and a central porphyry unit with intense faulting and secondary porosity with lower permeability.
Although no mining is being undertaken at Ujina pit until around 2044, 10 dewatering wells are currently operating (total pumping volume of around 25 L/s) to maintain pit slope stability until mining recommences. Pit dewatering targets are also derived from a calibrated three-dimensional numerical groundwater model (Itasca, October 2024). VWP data are reconciled on a monthly basis across six sections, with all sections currently within target.
Capital and operating costs for 1-2 new wells every few years have been included in the financial model. Although the Ujina pit is smaller and will initially be developed at a slower vertical rate than Rosario, such a comparatively low number of dewatering wells does not appear to be realistic. SRK has therefore tested the sensitivity of the financial model to account for this potential underestimate of capital and operating costs from 2044 onwards.
| 16.2 | Open Pit Geotechnical Engineering |
| 16.2.1 | Geotechnical data |
In the document entitled Geotechnical Baseline Project 4th Line Collahuasi, Rajo Rosario”, CMDIC (2024) reported on the available geotechnical information upon which to create a geotechnical baseline for the Rosario pit. Within the report, several geotechnical documents dating back to 2021 are referenced and a summary of contents provided.
To inform the rock mass model, the geotechnical properties from 327, 848 m of drill holes were analysed. Table 16-1 presents the quantum of geotechnical drilling within each defined geotechnical unit. Reference is made to strength testing campaigns to define shear envelopes for the geotechnical domains forming the Rosario open pit. This consists of 510 uniaxial compression tests, 712 triaxial tests and 529 tensile strength tests.
Whilst SRK has not been provided with any raw geotechnical data, including the geotechnical drill hole database, a block model has been provided that contains a number of geotechnical parameters. Figure 16-4 presents a SE – NW cross section through the block model showing geological Strength Index (GSI). The information within the block model appears to honour the rock mass characteristics, for example, lower GSI values follow the trends of the major faults and higher GSI values present within the northwest section of the pit; however, it is unclear what data sources have been used to inform the block model. The information within the block model appears to honour the rock mass characteristics, for example, lower GSI values follow the trends of the major faults and higher GSI values present within the NW section of the pit; however, it is unclear what data sources have been used to inform the block model
| November 2025 | ||
| Page |
| SRK Consulting (UK) Limited | Mineral Resources and Mineral Reserves, Collahuasi Copper Mine - Main Report |
Table 16-1: Summary of drill hole meters by geotechnical unit (CMDIC, 2024)
| UG | Total Drill Meters | High Fracturing Zone | Drilling Meters |
| RLX | 7,305 | Inside the zone | 2,953 |
| Out of zone | 4,352 | ||
| ARGI | 6,655 | Inside the zone | 4,396 |
| Out of zone | 2,259 | ||
| ARGM | 31,121 | Inside the zone | 14,073 |
| Out of zone | 17,049 | ||
| ANQS | 17,825 | Inside the zone | 4,962 |
| Out of zone | 12,863 | ||
| USQS | 8,208 | Inside the zone | 2,551 |
| Out of zone | 5,657 | ||
| RAQS | 43,141 | Inside the zone | 11,171 |
| Out of zone | 31,970 | ||
| PQS | 47,901 | Inside the zone | 12,383 |
| Out of zone | 35,517 | ||
| ANPK | 67,874 | Inside the zone | 18,245 |
| Out of zone | 49,629 | ||
| USPK | 28,272 | Inside the zone | 6,897 |
| Out of zone | 21,375 | ||
| RAPK | 40,647 | Inside the zone | 8,530 |
| Out of zone | 32,117 | ||
| PPK | 20,585 | Inside the zone | 4,156 |
| Out of zone | 16,430 | ||
| RAPK+ | 8,316 | Inside the zone | 1,688 |
| Out of zone | 6,628 |
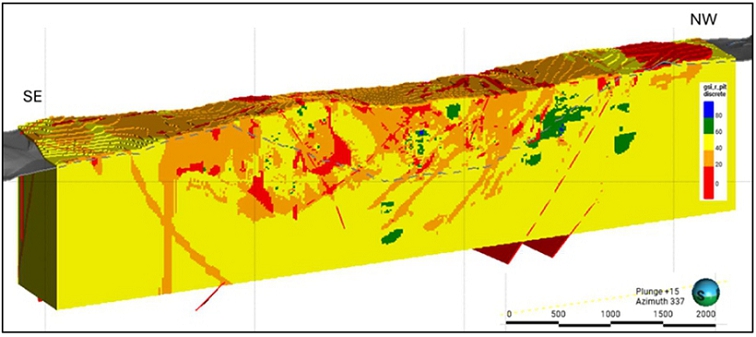
Figure 16-4: Example of block model displaying Geological Strength Index (GSI) (SRK, 2025)
| November 2025 | ||
| Page |
| SRK Consulting (UK) Limited | Mineral Resources and Mineral Reserves, Collahuasi Copper Mine - Main Report |
| 16.2.2 | Geological model |
The Rosario porphyry deposit geometry comprises a well-documented stratified sequence of acidic volcanic rocks and andesites, with intercalations of sedimentary rocks of Permo-Triassic age (the Collahuasi Formation). This sequence has been intruded by the Collahuasi porphyry, which corresponds to a granodiorite of Triassic age. The Rosario Porphyry, a quartziferous monzonite of Eocene-Oligocene age, is the latest intrusion event in the district.
The stratified Collahuasi Formation has a general NW strike with a dip direction of approximately 40° to the NE. Intrusive porphyritic rocks are accommodated between the stratified sequence by a series of NW striking faults, the Rosario Fault system (Figure 16-5). Extensive alteration haloes are recognised: an early suite of potassium, propylitic and chlorite-sericite alterations are often obliterated due to the superimposition of late pervasive alteration which include phyllic, sericitic and, importantly, argillic phases.
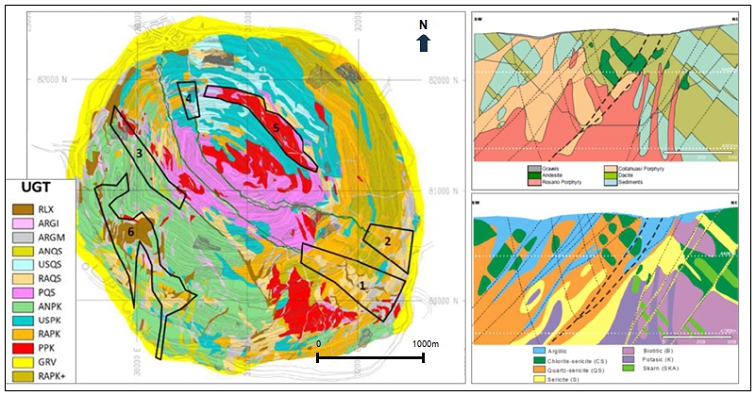
| Figure 16-5: | Rosario Pit : Model showing extent of geotechnical units projected onto 2025 design (left): CMDIC Instrumentation and Geotechnical Monitoring Report Background of Instabilities in Rosario Pit (2021- 2025), August 2025; cross sections (right) (CMDIC internal presentation) |
| 16.2.3 | Large-scale structural model |
The Rosario fault system is complex but well-documented within the pit. It comprises three named major faults called the Rosario, Pique and Ultima faults which collectively strike in a NW direction and dip at approximately 45° SW (Figure 16-6). Although segmented and comprising numerous smaller and less continuous dislocations, these major structures present a continuous expression on the surface of the Rosario pit. These major faults focused the alteration events and control the distribution and grades of Cu, Mo and Fe.
| November 2025 | ||
| Page |
| SRK Consulting (UK) Limited | Mineral Resources and Mineral Reserves, Collahuasi Copper Mine - Main Report |
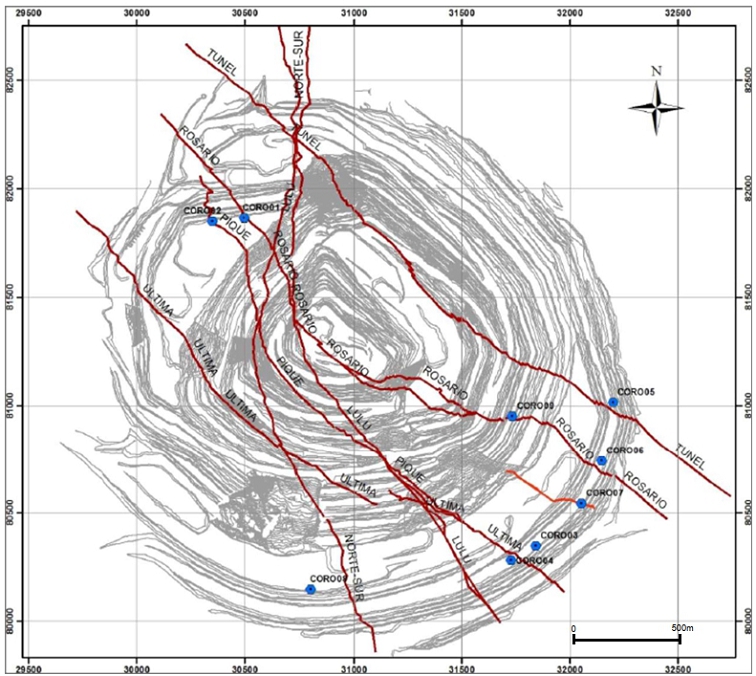
Figure 16-6: Rosario principal fault structures (Golder Associates, 2014)
Mechanical characterisation of the faults has previously been undertaken (Golder Associates, 2014) which included observations, measurements and laboratory testing of fault materials. It is understood the CMDIC Geotechnical team have engaged external consultants to carry out ongoing bench mapping to further advance engineering knowledge on the Rosario structural regime. Other faults which intersect the mine are oriented in a north-south direction and broadly align with the interpreted regional dislocations.
The regional map also confirms a series of antiform and synform fold traces with irregular orientations (Geotechnical Advisory Board, June 2019); however, the precise occurrence and attitude of the folding expressed in the pit is not clear. Observations of foliation (Geotechnical Advisory Board, June 2019) attest to a strong structural control, although the extent, nature and impact of this on slope performance is not clear.
| 16.2.4 | Rock mass model |
Significant efforts have been made to define and characterise the basic geotechnical units at Collahuasi. Thirteen basic geotechnical units (GU) were initially identified for the Rosario open pit (Table 16-2).
According to historical studies, the most influential variables impacting the geotechnical quality of the rock are lithology, alteration and mineral zone. The broad relationship between these variables is shown in Table 16-3.
| November 2025 | ||
| Page |
| SRK Consulting (UK) Limited | Mineral Resources and Mineral Reserves, Collahuasi Copper Mine - Main Report |
Table 16-2: Rosario main geotechnical units descriptions (WSP Golder, 2024)
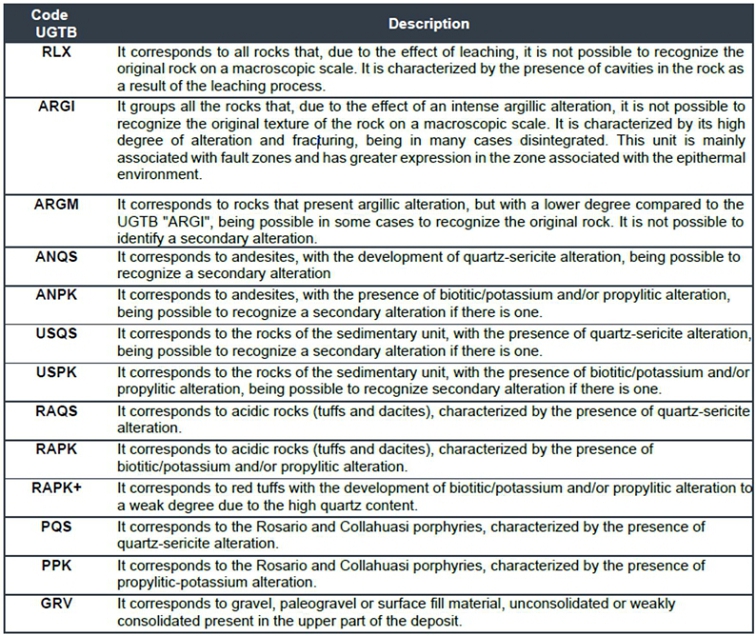
Table 16-3: Rosario Alteration Codes, Mineral Zones and Lithology nomenclature (WSP Golder, 2024)
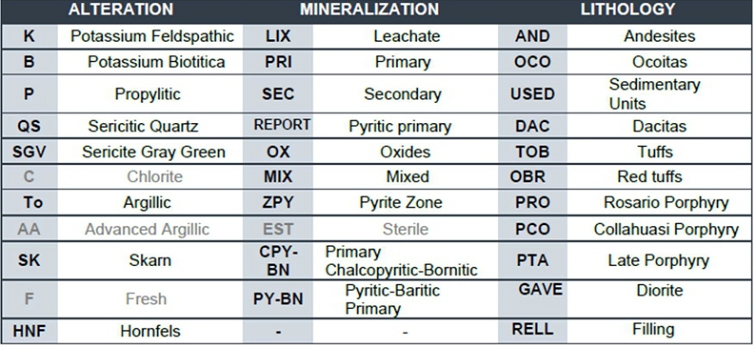
A relatively large and mature laboratory testing database has been developed, although this has focused principally on the strong rocks (i.e., R3 to R5). Weak rock units, such as ARGI (R0 to R2) are not well represented as these have not been routinely tested in the laboratory. Given the evident influence of this type of alteration on slope stability, this deficiency should be corrected.
| November 2025 | ||
| Page |
| SRK Consulting (UK) Limited | Mineral Resources and Mineral Reserves, Collahuasi Copper Mine - Main Report |
The influence of alteration and mineralisation on the Rosario lithologies makes it challenging to observe clearly differentiable units in terms of intact rock properties and other rock mass parameters. Figure 16-7 illustrates the available data and shows that, apart from ARGM (argillic alteration) and RXL (unrecognisable lithology due to intense leaching/alteration), broadly speaking, only relatively minor statistical differences exist between the main GU.
In terms of Geological Strength Index (GSI), mean values indicate the Rosario rock mass typically straddles the boundary between Poor to Fair categories (Table 16-4), although the range of minimum GSI values confirms that significant zones of Very Poor to Poor rock mass occur.
UCS and GSI values combined and presented as shear strength curves generate resistance envelopes that are also broadly similar to each other. The deduced geomechanical properties (Karzulovic & Associates, 2020) of the intact rock and rock mass are summarised in Table 16-5.
Subsequent efforts have been made to simplify the complexity and deduce a set of basic GU for geotechnical analysis. Investigations concluded that the type of alteration affecting individual units was the key factor in determining the intact strength and shear resistance of the individual lithological units. On this basis, it has been possible to define four basic GU: AQS1, AQS2, PK1 and PK2. The ARGI (argillically altered rocks) units are an additional category representing zones of comparative weakness.
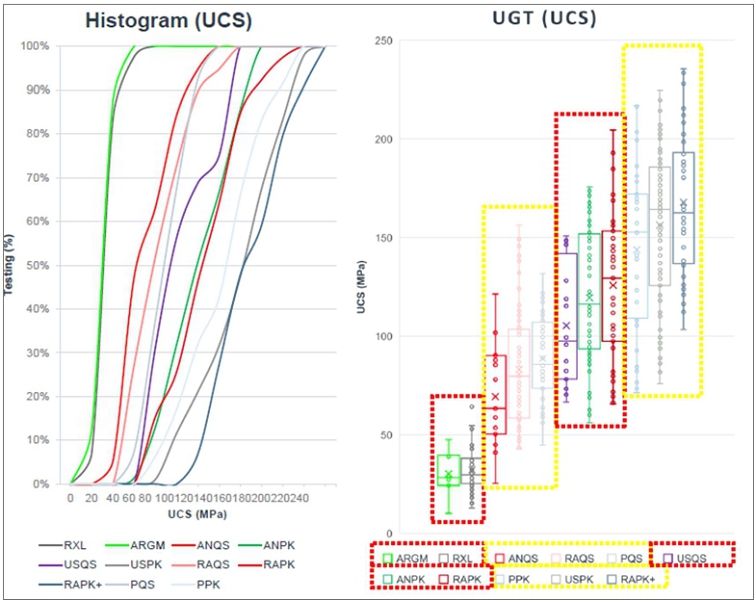
Figure 16-7: Rosario GU cumulative frequency histogram and uniaxial compression diagram (WSP Golder, 2024)
| November 2025 | ||
| Page |
| SRK Consulting (UK) Limited | Mineral Resources and Mineral Reserves, Collahuasi Copper Mine - Main Report |
Table 16-4: Rosario GU GSI statistics (WSP Golder, 2024)
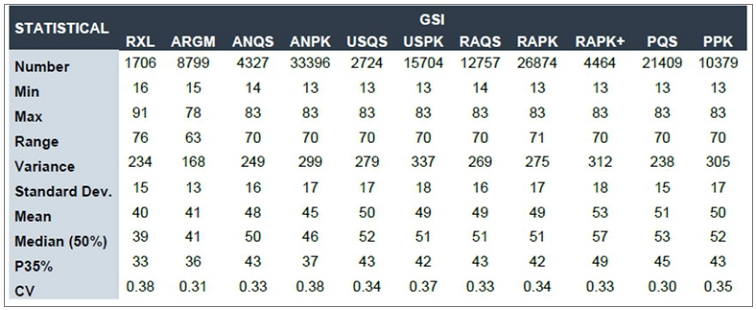
Table 16-5: Rosario GU geomechanical properties (Karzulovic & Associates, 2020)
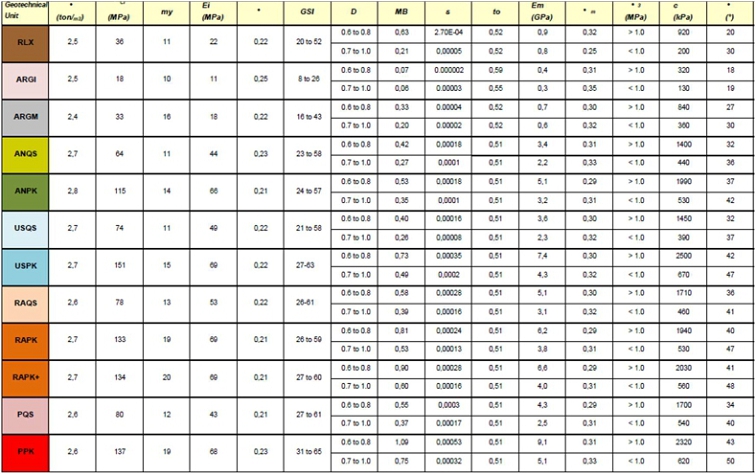
| 16.2.5 | Hydrogeological model |
See Section 16.1.
| 16.2.6 | Slope design geometry |
WSP Golder Associates has recently (February 2025) carried out a detailed re-evaluation of the kinematic circumstances to provide updated recommendations for the batter-berm design for the Rosario pit (for the extraction period 2026 and 2029). These recommendations apply the latest structural modelling and domaining carried out by GeoInnova (2023). Analysis is based solely on kinematic control at bench scale, so a subsequent validation of the inter-ramp and overall slope configurations using the revised batter-berm geometries will be necessary before finalising applicable slope design criteria.
| November 2025 | ||
| Page |
| SRK Consulting (UK) Limited | Mineral Resources and Mineral Reserves, Collahuasi Copper Mine - Main Report |
In terms of acceptability criteria, the kinematic recommendations provided in Read & Stacey (2009) are adopted. The proposed criterion establishes an acceptable probability of occurrence (PO) of 30%; that is, the BFA is chosen such that the number of unstable wedges/planes for a given kinematic sector does not exceed 30% of the total potential wedges/planes. Likewise, the catch berm width must ensure a retention capacity of at least 70% (30% excess) of spills resulting from block falls, considering berm losses due to structural and operational overbreak.
The updated kinematic design zones developed from this updated evaluation are shown in Figure 16-8.
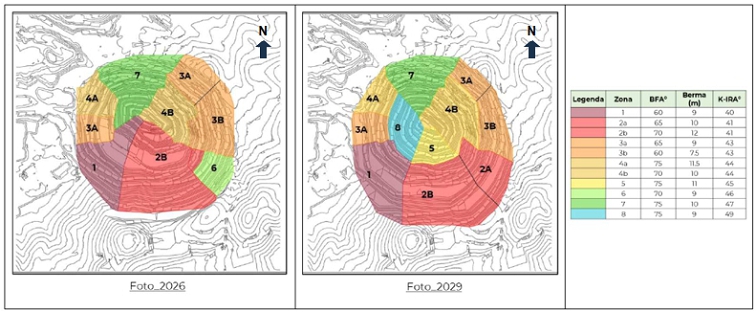
Figure 16-8: Rosario: kinematic design zones superimposed on 2026 and 2029 pit geometries of current 5-year plan (WSP Golder, 2025)
| 16.2.7 | Slope design implementation and pit wall performance |
The Rosario open pit is characterised by two geological environments: a porphyry copper type massif in the northern sector of the pit and an epithermal type superimposed in the southwest sector of the pit. From a geotechnical point of view, the epithermal environment tends to comprise poor to very poor-quality rock (associated with faults and altered rocks), whilst the porphyry environment presents a more competent massif, with reduced presence of argillic alterations and fault zones with reduced persistence.
In relation to implementation, site inspections and anecdotal reports suggest that, historically, slope design conformance has been variable, but has improved over time as efforts have been made to refine limits blasting and scaling operations. It is understood that pre-shear/pre-split blasting is not applied, with the operation preferring to adopt a combination of controlled trim and modified production shots depending on design sector and lithology.
In respect of wall stability, reports (CMDIC, August 2025) confirm the Rosario open pit has experienced multi-bench/inter-ramp instabilities across all wall sectors since mining commenced. The bulk of the unstable zones are associated with the main fault structures, particularly where these coincide with poor-quality rock mass (increased fracturing and/or argillic alteration haloes, such as rock units ARGI and ARGM; see Figure 16-9).
Recent pit inspections confirmed a range of wall stability conditions across the Rosario open pit. In general stability conditions are judged to be ‘fair’ (stability and safety against wall related hazards are adequate from mining purposes) to ‘poor’ (instability has occurred and there is potential for further large-scale ground movement).
| November 2025 | ||
| Page |
| SRK Consulting (UK) Limited | Mineral Resources and Mineral Reserves, Collahuasi Copper Mine - Main Report |
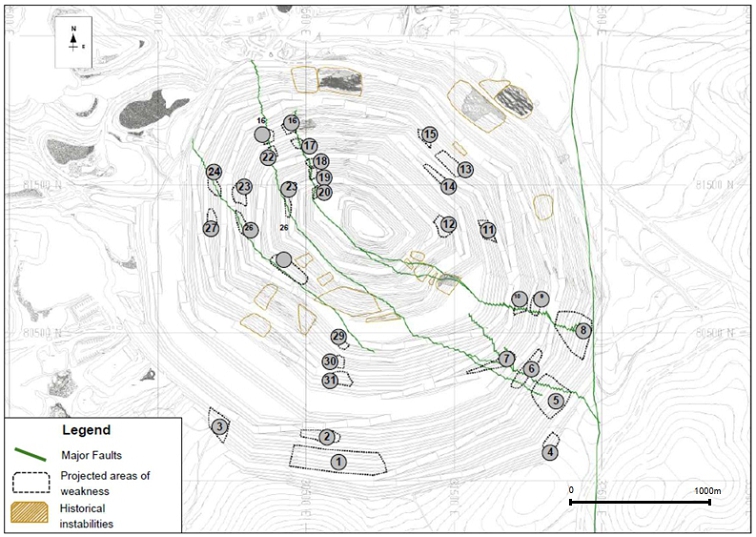
Figure 16-9: Rosario Pit: Location of historic instabilities and projected areas of weakness via low GSI, argillic alteration (CMDIC, 2025)
| 16.2.8 | Slope displacement monitoring |
To ensure the timely detection of adverse movement trends, CMDIC has established an extensive system of continuous slope monitoring in the Rosario pit. A surface displacement network comprising radar interferometry, prism topographic, near-surface extensometry and inclinometry, a piezometric network, and an array of geophones for ground vibration control is in place.
The Rosario slope monitoring network currently comprises the following instrumentation and equipment:
| · | 8 no. radar (located to deliver a combination of both tactical and strategic monitoring and operational risk control). |
| · | 6 no. topographic total stations |
| · | 1070 no. prisms |
| · | 5 no. in-pit cameras |
| · | 6 no. inclinometers |
| · | 2 no. extensometers |
| · | 9 no. geophones |
| · | 46 no. vibrating wire piezometers |
| · | Associated hardware and functionality to support the above, including in-pit cameras and monitoring booths, solar panels, generators, etc. |
| November 2025 | ||
| Page |
| SRK Consulting (UK) Limited | Mineral Resources and Mineral Reserves, Collahuasi Copper Mine - Main Report |
Figure 16-10 shows the location of the slope displacement monitoring network. Figure 16-11 shows the current distribution of topographic prisms with an example illustration showing trends of the surface behaviour of the slopes.
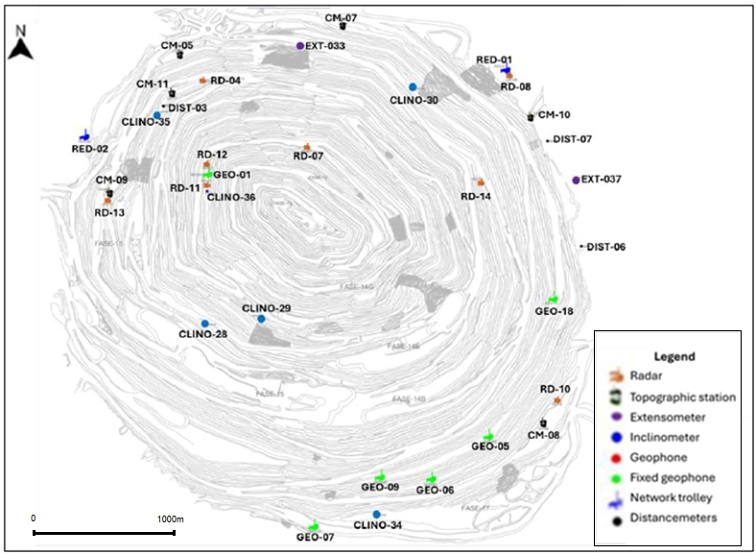
Figure 16-10: Rosario Pit: Location of key slope monitoring equipment and infrastructure (CMDIC, 2025)
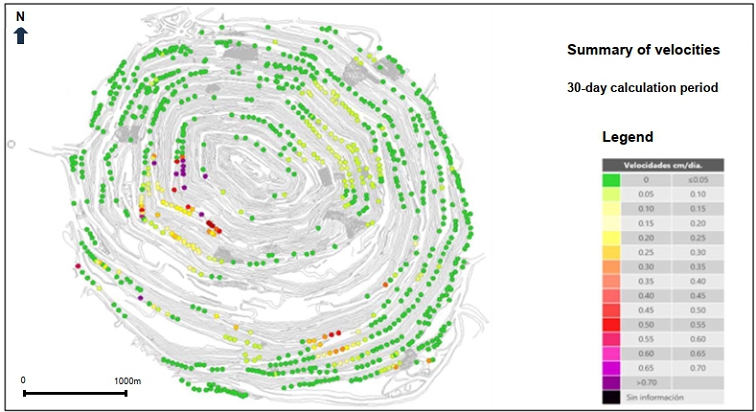
Figure 16-11: Rosario Pit: Example showing location of topographic prisms and surface displacement trends (cm/day) (CMDIC, 2025)
| November 2025 | ||
| Page |
| SRK Consulting (UK) Limited | Mineral Resources and Mineral Reserves, Collahuasi Copper Mine - Main Report |
CMDIC has a dedicated WiFi network system, server farm and 24 x 7 manned Monitoring Office enabling real-time visualisation of all slope monitoring information. The current frequency of radar data capture is every 2 minutes. Specialist consultants are contracted to undertake continuous analysis and interrogation of radar monitoring trends (remotely from Viña Del Mar). Prism monitoring reading frequency is between 2 to 6 hours, depending on the number of prisms associated with each total station. Vibrating wire piezometers typically read every 60 minutes.
In the northern sector (porphyry copper rock mass) of the pit, where geotechnical behaviour is generally considered satisfactory with less presence of argillic alteration and fault zones, deformations of 0.5 mm/day are typically experienced; in the southern sector (epithermal rock mass) where poorer quality geotechnical conditions are encountered, deformations of 2 to 4 mm/day are experienced, although within unstable zones increased deformation magnitudes up to 15 mm/day have been recorded (although typically exhibit regressive behaviour over time).
Due to the significant deformations and strain that are often experienced before collapse occurs, slope movement thresholds are not calibrated by velocity Trigger Action Response Plans (TARPs). Rather, assessment and management are undertaken by detecting changes in the rate of movement, carrying out an estimation of the likelihood of instability, and assessing the impact such movement would have on the surrounding infrastructure and/or operational continuity of the pit. In this way, the level of criticality can be established so that appropriate mitigation measures can be determined (Figure 16-12 and Figure 16-13).
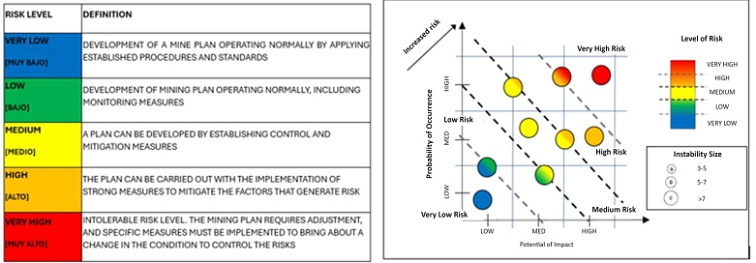
Figure 16-12: Rosario stability risk classification and matrix (CMDIC, 2025)
| November 2025 | ||
| Page |
| SRK Consulting (UK) Limited | Mineral Resources and Mineral Reserves, Collahuasi Copper Mine - Main Report |
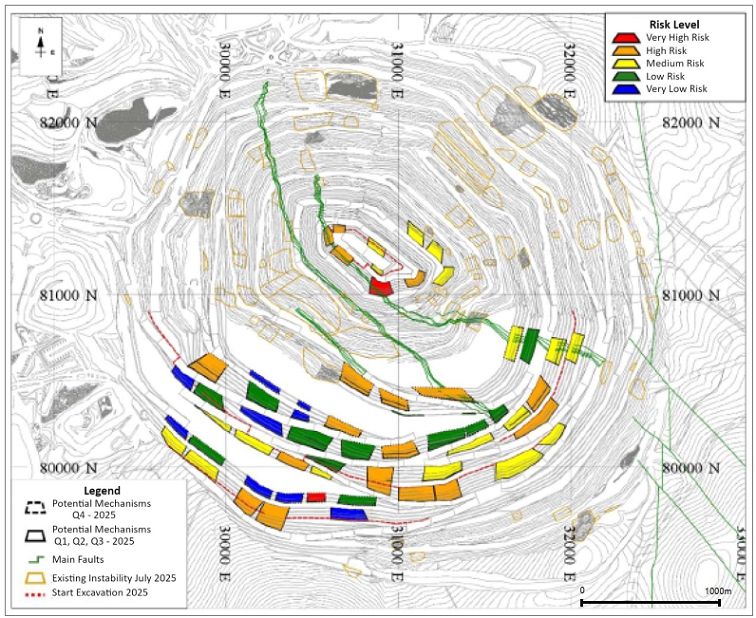
Figure 16-13: Rosario 2025 mining plan geotechnical risk analysis (CMDIC, 2025)
| 16.2.9 | Stability assessment of Rosario slope design (five-year plan) |
Extensive slope stability studies have been undertaken over several years comprising both two-dimensional limit equilibrium analyses, as well as construction of complex three-dimensional numerical models to capture large-scale failure mechanisms associated with features of inter-ramp to overall slope scale. Groundwater conditions were defined from 3D pore pressure grids obtained from the latest pit scale numerical hydrogeological modelling undertaken by Itasca.
3DEC stability analysis undertaken by WSP Golder Associates (February 2025) for the five-year plan period from 2025-2029 concludes that most planned slopes meet design acceptability criteria. Calculations confirm, however, that where there is a coincidence of obliquely orientated faulting and poor rock mass quality with argillic alteration haloes, predicted safety factors fall below the required levels. The most immediate critical area is the SW elbow slope on Phase 13, where Phase 15 and 16 will be developed, and at the bottom of Phase 14 (Figure 16-14).
Stability simulations apply modelled pore pressure gradients within the slope. Failure to deliver the required depressurisation will require mitigation options to minimise the attendant risks, including reconfiguration of slope geometries to suit local geotechnical conditions.
| November 2025 | ||
| Page |
| SRK Consulting (UK) Limited | Mineral Resources and Mineral Reserves, Collahuasi Copper Mine - Main Report |
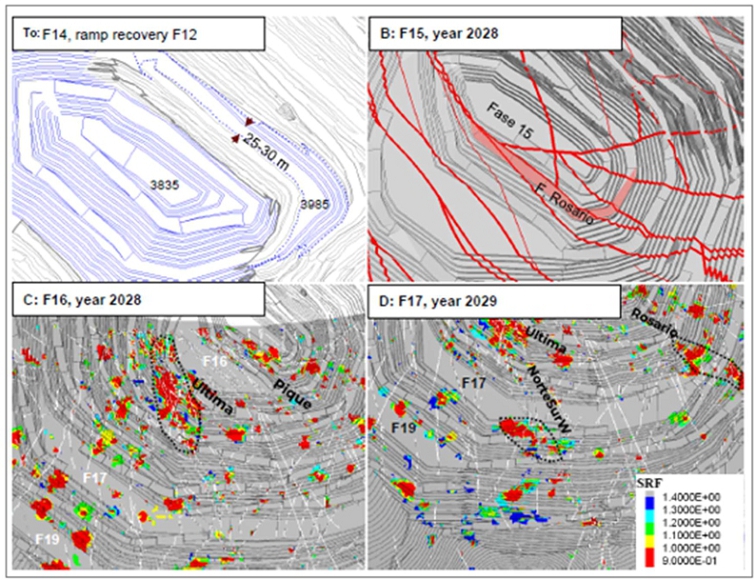
Figure 16-14: Rosario Pit: Main areas of risks associated with development of Phases 14 to 17 (WSP Golder, 2025)
| 16.2.10 | Stability assessment of Rosario LoM slope design |
For the Rosario LoM pit, the most recent set of stability simulations conducted by WSP Golder Associates (December 2024) comprise anisotropic limit equilibrium analyses carried out in Slide2. These have been developed from seven cross sections orientated through a range of slope azimuths around the circumference of the planned Rosario LoM pit (Figure 16-15).
This work has been based on an update of the geological-geotechnical model which included the following:
| · | Re-definition and characterisation of the basic geotechnical units, specifically the resistance of intact rock complemented with updated values of GSI to develop updated Hoek-Brown rock mass parameters (WSP, 2023), |
| · | New model of geological-geotechnical blocks including variables for the definition of GU and other areas of low geotechnical quality (GeoInnova, 2024c), |
| · | Review and update of the 3D fault model for Rosario to include fault surfaces for 64 major faults and 22 intermediate faults (GeoInnova, 2024a), |
| · | Extension of the 3D structural domain model volumes to enable modelling to LoM pit extents (GeoInnova, 2024b), |
| November 2025 | ||
| Page |
| SRK Consulting (UK) Limited | Mineral Resources and Mineral Reserves, Collahuasi Copper Mine - Main Report |
| · | Groundwater conditions represented by a phreatic water surface and hydrostatic conditions. In general, for the analysed stability scenarios, the modelled phreatic surface is well below the minimum (credible) rupture surface to effectively present drained slope conditions (modelled groundwater drawdown is sufficient to deliver dry slopes for the areas of concern). |
Stability of the LoM 2024 pit design geometry was assessed by obtaining estimates for the minimum FoS and the maximum probability of failure (PF%) for the minimum rupture surface. Analyses were undertaken both deterministically and probabilistically to assess inter-ramp (IR), multi-batter/inter-ramp (MIR) and global/overall slope scales for each of the seven defined sections.
Stability analysis indicates that the final Rosario LoM pit meets current acceptability criteria at all scales; however, in some cases, the presence of less competent units such as ARGI, AQS1 and AQS2 (argillic and quartz-sericitic alteration), and even in some competent units, analyses yields FoS below the design acceptance criteria. In such cases, Sections 1 (northeast wall), 3 (south wall), and 6a (north wall), modifications are required; proposed mitigation options have been evaluated aimed at meeting the acceptability criteria defined for the long-term operation of Rosario (Figure 16-15). Mitigation proposals generally contemplated increasing the width of decoupling berms contained in the LoM 2024 design to confine less competent rock units or isolate modelled rupture surfaces to limit them to single inter-ramp stacks (Figure 16-16). All future design updates should ensure this design consideration is incorporated.
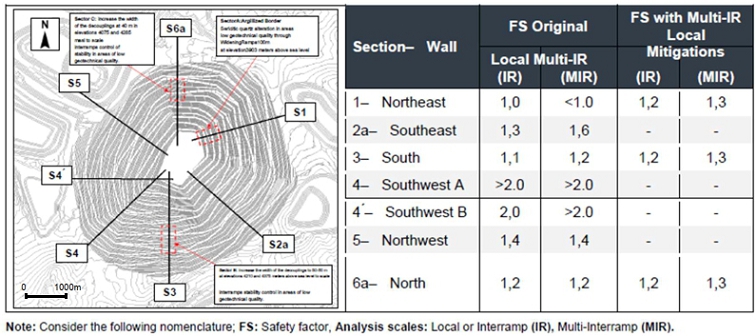
| Figure 16-15: | Rosario slopes LoM 2024 stability analysis: plan view (left) and deterministic analysis results for static scenario (right), red dotted line approximate position of recommended mitigation proposals for long-term operation (WSP Golder, 2024) |
| Table 16-6: | Rosario LoM 2024 stability analysis mitigation proposal measures (WSP Golder, 2024) |
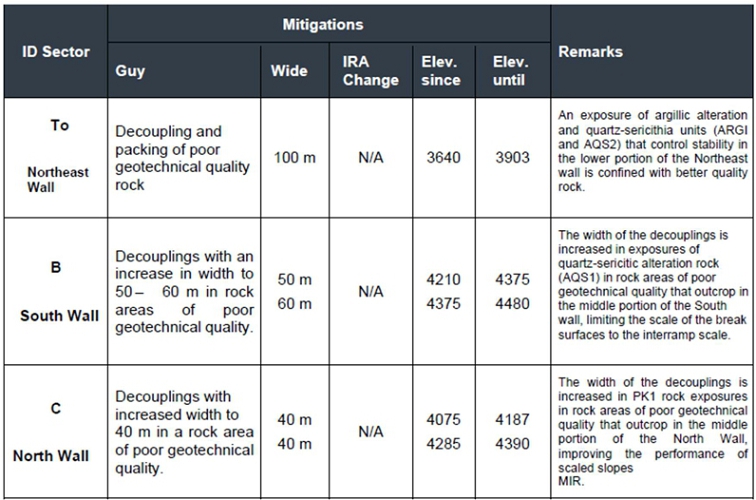
| November 2025 | ||
| Page |
| SRK Consulting (UK) Limited | Mineral Resources and Mineral Reserves, Collahuasi Copper Mine - Main Report |
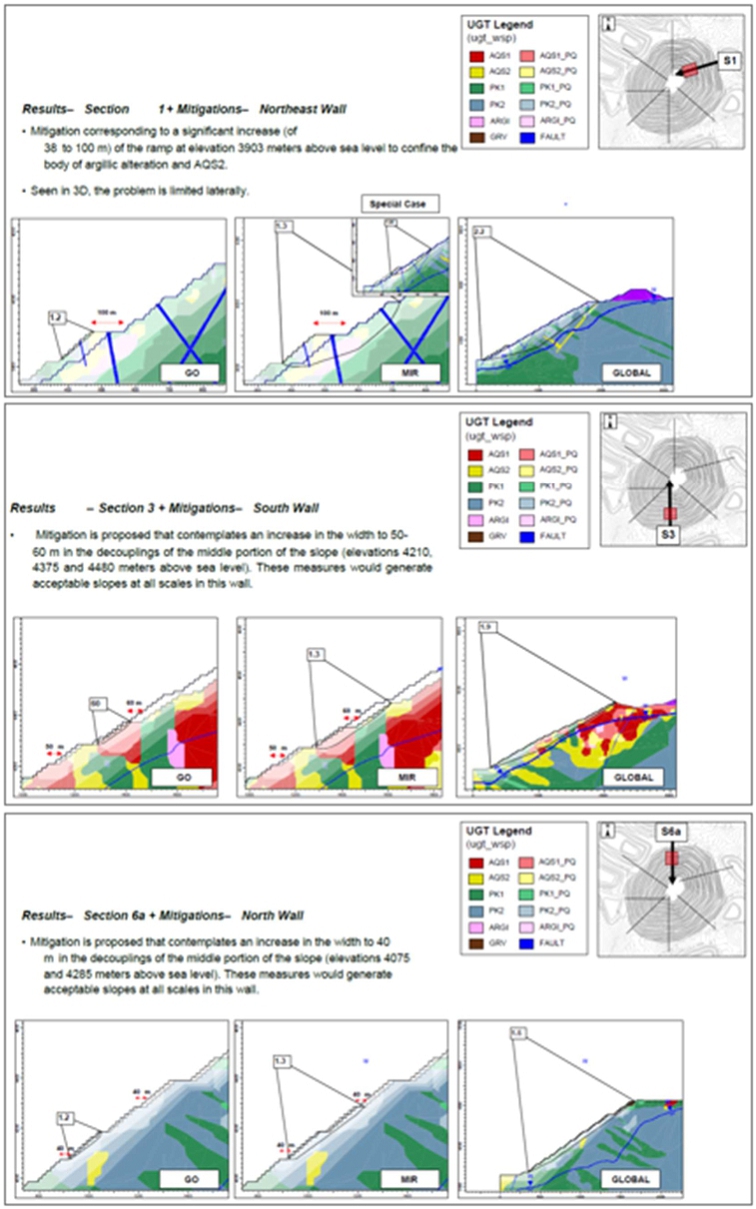
| Figure 16-16: | Rosario LoM 2024 stability analysis: evaluated mitigation proposals for geotechnical design Sections 1 (NE wall), 3 (south wall) and 6 (north wall) (WSP Golder, 2024) |
| November 2025 | ||
| Page |
| SRK Consulting (UK) Limited | Mineral Resources and Mineral Reserves, Collahuasi Copper Mine - Main Report |
In relation to the LoM stability modelling, the following comments are noted:
| · | Given the mitigation proposals outlined above, all cross sections generate the required FoS design acceptance criteria across all slope scales. |
| · | Apart from cross sections 4 (SW A and SW B) which yield IR and MIR FoS >2, no other sections are significantly above the required slope design acceptance criteria (FoS between 1.2 to 1.6; that is, at or marginally above the required safety levels). |
| · | It is emphasised that modelled Factors of Safety are predicated on drained slope conditions arising from effective dewatering (depressurised slopes within the credible zone of potential rupture). |
| · | Given the evident sensitivity of the slope geometries, the assumption of drained slopes is highlighted as a risk. Notwithstanding the extensive dewatering infrastructure that has been established and which has successfully delivered pit-wide drawdown to date, significant ongoing efforts will be required to ensure drained conditions to the depths demanded by the LoM profile. |
| · | The evidential basis for defining the extent and geometry of the individual geological units into the LoM pit are not clearly stated. |
| · | The basis of the extension of the structural model volume to cover the LoM extent is not clearly stated. |
| · | Groundwater is included in the models as a phreatic surface with an assumed hydrostatic gradient. This is rudimentary and does not account for potential variations in vertical and lateral pore pressure gradients arising from the complex flow dynamics surrounding a large open pit. |
| · | Geotechnical modelling only considers force equilibria on 2D sections. Given the scale and shape of planned mining, the complexity of the various inputs, and the changing pore pressure distributions over time, more sophisticated (staged) 3D numerical modelling is required to accurately simulate the evolving strain and displacements. |
| · | The geotechnical sections on which the preliminary 2D LoM stability analysis have been undertaken do not coincide with the current hydrogeological sections on which drawdown is being monitored. As mining advances, the geotechnical-hydrogeological sections should be redefined and aligned through the most critically sensitive wall azimuths. |
| · | The mitigation design requirements to ensure appropriate DAC are met, do not appear to have been considered in the LoM pit design. |
| 16.2.11 | Ujina LoM slope design stability assessment |
For the Ujina LoM pit, the most recent set of stability simulations conducted by WSP Golder (July 2024) comprise anisotropic limit equilibrium analyses carried out in Slide2. These have been developed from seven geotechnical cross sections orientated through a range of slope azimuths around the circumference of the planned Rosario LoM pit (Table 16-7 and Figure 16-17). Cross sections were chosen to represent the highest slope heights and areas of the pit comprising the least competent rock units.
The work is based on the structural and geotechnical characterisation undertaken by Golder; 2014; Golder, 2015).
| November 2025 | ||
| Page |
| SRK Consulting (UK) Limited | Mineral Resources and Mineral Reserves, Collahuasi Copper Mine - Main Report |
Stability of the LoM 2024 pit design geometry was assessed by obtaining estimates for the minimum FoS and the maximum probability of failure (PoF%) for the minimum rupture surface. Analyses were undertaken both deterministically and probabilistically to assess IR, MIR, and global/overall slope scales for each of the seven defined sections.
Groundwater conditions were represented by a phreatic water surface and hydrostatic conditions. In general, for the analysed stability scenarios, the modelled phreatic surface is well below the minimum (credible) rupture surface to effectively present drained slope conditions (modelled groundwater drawdown is sufficient to deliver dry slopes for the areas of concern).
Small-scale structures were accounted for in the anisotropic strength and where present, large-scale structures (faults) were included in the analyses if they were within the sub-parallel range (± 30°) to the slope orientation.
In all cross sections analysed, the FoS and PoF exceed the proposed acceptance criteria. It is noted, however, that the LoM pit used within the analyses does not match the latest LoM pit. This is especially relevant in cross-sections F and G, where the latest LoM pit is approximately 200 m deeper in the region of cross-section F, and approximately 150 m deeper in the region of cross-section G. It should be noted that the overall slope angle in both these sections has been reduced from the angle stated in the WSP Golder (July 2024) report. The overall slope angle for cross-section F has reduced from 33° to 31° and cross-section G from 36° to 33°.
Table 16-7: Ujina geotechnical cross section summary (WSP Golder, 2024)
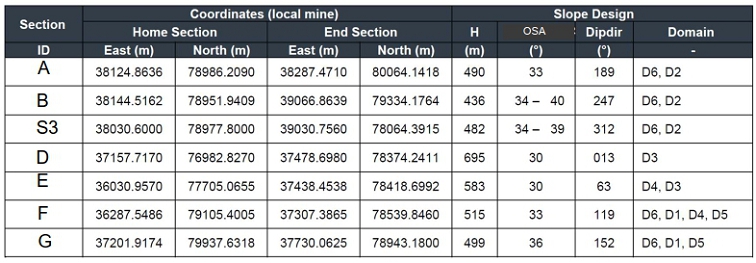
| November 2025 | ||
| Page |
| SRK Consulting (UK) Limited | Mineral Resources and Mineral Reserves, Collahuasi Copper Mine - Main Report |
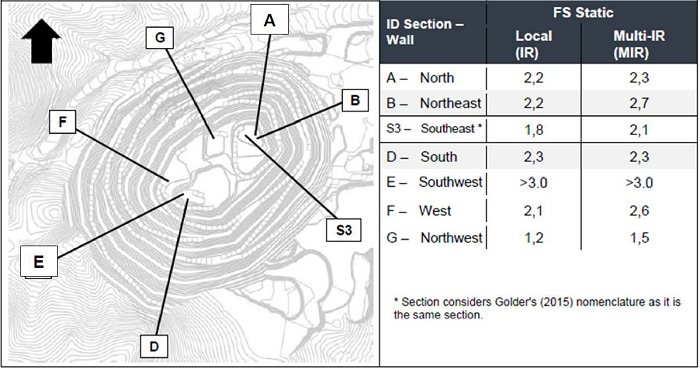
| Figure 16-17: | Ujina LoM 2024 stability analysis: plan view (left) and deterministic analysis results for the static scenario (right) (WSP Golder, 2024) |
In relation to the LoM stability modelling, the following comments are noted:
| · | It is emphasised that modelled FoS are predicated on drained slope conditions arising from effective dewatering (depressurised slopes within the credible zone of potential rupture). |
| · | Given the evident sensitivity of the slope geometries, the assumption of drained slopes is highlighted as a risk. Notwithstanding the extensive dewatering infrastructure that has been established at Ujina and which has successfully delivered pit-wide drawdown to date, significant ongoing efforts will be required to ensure drained conditions to the depths demanded by the LoM profile. |
| · | Groundwater is included in the models as a phreatic surface with an assumed hydrostatic gradient. This is rudimentary and does not account for potential variations in vertical and lateral pore pressure gradients arising from the complex flow dynamics surrounding a large open pit. |
| · | The basis of the extension of the structural model and geotechnical models to cover the LoM extent is not clearly stated. |
| · | Geotechnical modelling only considers force equilibria on 2D sections. Given the scale and shape of planned mining, the complexity of the various inputs, and the changing pore pressure distributions over time, more sophisticated (staged) 3D numerical modelling is required to accurately simulate the evolving strain and displacements. |
| 16.2.12 | Geotechnical sustaining process |
CMDIC has developed a comprehensive geotechnical data collection, interpretation, evaluation and model update process. This includes ongoing definition of geological models (lithology, alteration, mineralisation), structural models (large- and small-scale), and rock mass models. A 3D geotechnical block model including fracture frequency (FF), Rock Quality Designation (RQD), joint condition (JC) and GSI has been developed, and which is used for geotechnical planning (Figure 16-18). No details are available on the construction basis (compositing) and frequency of updates for the geotechnical block model.
| November 2025 | ||
| Page |
| SRK Consulting (UK) Limited | Mineral Resources and Mineral Reserves, Collahuasi Copper Mine - Main Report |
Geotechnical drilling and investigation are undertaken on a yearly basis. For 2025, this comprises 6000 m to cover the five-year plan and 2000 m for LoM studies. The specific details of these programmes are not known.
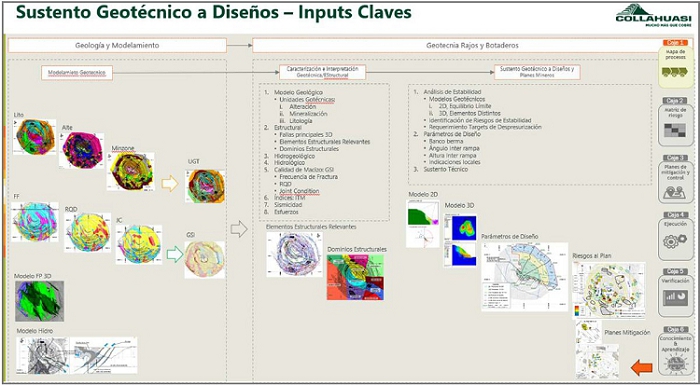
Figure 16-18: Rosario geotechnical sustaining process (CMDIC, 2025)
| 16.2.13 | Geotechnical governance and assurance |
The most recent external geotechnical assurance review at CMDIC was carried out in June 2019. The review team comprised internationally recognised experts in open pit geotechnical engineering (Dr Derek Martin and Peter Terbrugge), structural geology (Dr John Fredorowich) and hydrogeology (Jeremy Dowling).
The salient points of the review are summarised below:
Geology/structural geology:
| · | The mapping of intermediate and major faults should be carried out with a survey grade GPS to include fault breccia limits and damage zones and an associated database developed that includes the structural characterisation. In addition, bedding and foliation should be routinely mapped and recorded. |
| · | The structural model needs to be updated so that modelled faults are informed from surface mapping and drilling intercepts and the variability in fault rock strength included in the model. |
| · | Three quarters of the annual drilling is reverser circulation (approximately 15000 m) and one quarter is core drilling (approximately 5000 m). CMDIC should consider doing more core drilling to enable resolution of geological and structural geological issues. In addition, structural logging and photographs of the split tube should be done at the drill rig (and not after transport to a separate logging facility). |
| · | More validation and QAQC of the structural logging and mapping are required. |
| November 2025 | ||
| Page |
| SRK Consulting (UK) Limited | Mineral Resources and Mineral Reserves, Collahuasi Copper Mine - Main Report |
Hydrogeology:
| · | Additional hydrogeologic characterisation of: (1) argillic rocks; (2) perched groundwater; and (3) LoM pit shell characterisation is required. |
| · | Development of a domain-specific dewatering plan: (1) based on a 5-year mine sinking rate and pit slope depressurisation targets; (2) including a distributed array of piezometers encompassing all critical geotechnical sectors.; and (3) re-evaluation of the need for contingency horizontal drains. This will include definition of domain-specific depressurisation targets: (1) defined on a sector-by-sector basis from the geotechnical design; (2) reported as transient hydrographs of groundwater elevation versus time. |
Geotechnical:
| · | Take samples of the ARGI unit and fault gouge to measure shear strength and clay mineralogy and develop a field methodology to define the boundary in the weak ARGI unit R0, R1 and R2 between soil and rock. Field characterisation should also make use of the Needle Point Penetrometer. |
| · | Revisit the 3DEC model for the northeast sector to determine if sub-horizontal shears are playing role in the large deformations and sensitivity to rainfall. |
| · | Assess what role anisotropic strength may be playing in the instabilities. |
Mine operations:
| · | Introduce pre-splits and buffer or trim holes to improve pit wall safety and reduce small to medium scale kinematic failures on pit walls and ensure rigorous QAQC on pit limit blasting and grade control (bench floor) to improve wall and floor conditions. |
| · | Mine management to consider using risk analysis concepts in addition to standard FoS and PoF calculations in setting the slope design acceptance criteria. This will allow improved decisions on risk versus reward and development of an optimal design to extract the maximum value from the planned pits. |
To provide the necessary independent technical overview, CMDIC should re-establish the GAB. The GAB should be reconstituted on a frequency commensurate with the risks associated with the planned depth of mining and complexity of the geotechnical circumstances. As a minimum, the GAB should report annually and comprise recognised international experts in geotechnical engineering, structural geology, and hydrogeology. The GAB’s remit is to provide independent technical advice in relation to the management of current and planned slopes and their ability to meet accepted design criteria, risk thresholds and operational guidelines.
| 16.3 | Life of Mine Plan |
CMDIC’s Mineral Reserves are defined through its LoM planning process. Each year, a detailed five-year operational plan is developed, with the end position of that five-year horizon forming the basis for the broader life-of-asset or LoMP.
| November 2025 | ||
| Page |
| SRK Consulting (UK) Limited | Mineral Resources and Mineral Reserves, Collahuasi Copper Mine - Main Report |
Table 16-8 presents the overall mine production forecast for the 2025 LoM. Low-grade ore is classified as material with a copper grade between the cut-off of 0.30% CuT and the variable optimised cut-off applied in a given year.
Maximum in-pit extraction at the Rosario and Ujina deposits is projected to range between 282 and 296 Mtpa during the period 2025–2031. This increase is associated with the recovery of production losses incurred during the COVID-19 period, as well as the accelerated extraction of exposed ore to enhance overall feed quality. Thereafter, combined total extraction from Rosario and Ujina is expected to stabilise at approximately 285 Mtpa through to 2040.
| 16.4 | Mine Planning Process |
The CMDIC long-term plan is an extension of the five-year budget plan. The five-year budget incorporates greater operational detail and utilises software better suited to shorter-term mine planning. The budget is developed with monthly scheduling for the first year, quarterly for the following two years, and annually for the final two years. It is also based on slightly different, shorter-term design configurations. The end-of-period pit surface generated from the budget plan is then exported and used as the depletion surface upon which the long-term Life-of-Asset plan is based
The long-term planning process applied by CMDIC for the development of the LoMP is summarised as follows:
| · | Open pit optimisation is carried out using Whittle 4X software. |
| · | Phases (cutbacks) are developed within the optimised pit shells, typically by modifying the final phase or adding a new phase due to existing complexity. |
| · | Mine phases are designed, and material quantities within each phase are extracted in Vulcan. |
| · | COMET is used to schedule and sequence operations across the LoM period and to determine the optimal annual cut-off policy. |
| · | The initial production schedule is validated to confirm that ore exposure equivalent to three months is maintained, using an Ore Depletion Chart to assess exposure and equipment requirements by pushback. |
| · | Standard mine planning activities are completed, including dump design, haulage profiling and equipment scheduling, and the resulting data is used for cost estimation. |
| · | Waste dumps are designed in alignment with the schedule. |
| · | Haul profiles are developed, truck cycle times and productivities are calculated, and fleet requirements are determined based on availability and utilisation factors. |
The information provided by CMDIC indicates that the mine planning process is executed to a high standard. The long-term planning methodologies are robust and are being applied competently by the engineering team.
| November 2025 | ||
| Page |
| SRK Consulting (UK) Limited | Mineral Resources and Mineral Reserves, Collahuasi Copper Mine - Main Report |
Table 16-8: Summary of LoMP Totals for Rosario and Ujina
| Mine Production | Unit | 2025-2085 |
| Sulphide Ore | Mt | 3,175 |
| %CuT | 0.88 | |
| Low Grade Sulphide Ore | Mt | 615 |
| %CuT | 0.45 | |
| Sulphide Ore in Stocks | Mt | 316.82 |
| %CuT | 0.54 | |
| Total Ore | Mt | 4,107 |
| %CuT | 0.8 | |
| Waste + Oxide | Mt | 9,998 |
| Total Material | Mt | 14,105 |
| 16.5 | Mining Equipment |
The selection of mining equipment is predominantly driven by the overall scale of the operation, coupled with a deliberate preference for proven technologies that are aligned with, and demonstrably consistent with, the equipment currently deployed within the Rosario operation.
For both waste and ore handling, 73 yd3 cable shovels split between Bucyrus and P&H OEMs are designated as the primary loading units. In addition, ML1850 front-end loaders are considered to provide supplementary loading support. Based on the mining schedule over the period 2025–2070, the plan requires an average operating fleet of 12 cable shovels and 3 front-end loaders to sustain required loading rates.
Additionally, one P&H 73 yd3 cable shovel is allocated to specialised works associated with the construction of the TSF main wall. This construction activity extends across the life of the production plan, utilising waste material sourced from the Ujina WRD.
With respect to the truck fleet, the Komatsu 930E (+300 t class) haul truck is designated as the primary haul truck for both ore and waste movements, with 115 units currently available. Over the longer term, an uplift in the effective load factor to approximately 305 t is considered achievable. In parallel, during the next five years, the fleet will be supported by an additional allocation of 15 Komatsu 980 trucks and 8 Liebherr units, providing supplementary haulage capacity and enhanced operational flexibility. The supplementary fleet will be phased out by 2029 and replaced with Komatsu 930E trucks.
Fleet productivity is primarily influenced by:
| · | velocity profiles per fleet; and |
| · | haulage distances to waste dumps, stockpiles, and primary crushers. |
For each active haulage fleet, cycle times have been simulated in line with projected pit advancement using MINEHAUL software.
For drilling operations, production drilling and two buffer-drilling lines are included. Pre-cut drilling is not considered. Production drilling will utilise electric rigs (49HR, MD6640, and Pit Viper 351) operating with a 310 mm bit diameter in both Rosario and Ujina. The maximum forecast requirement is 11 production drills and 7 buffer drills throughout the plan.
| November 2025 | ||
| Page |
| SRK Consulting (UK) Limited | Mineral Resources and Mineral Reserves, Collahuasi Copper Mine - Main Report |
Fleet sizing estimates are underpinned by standard industry rules-of-thumb correlating required quantities with factors related back to number of loader, length of roads, mining rates, availabilities, etc.
The auxiliary equipment fleet includes:
| · | 16 bulldozers (CAT D10, CAT D11, Komatsu D475); |
| · | 15 wheel dozers (CAT 854, Komatsu WD600); |
| · | 16 motor graders (CAT 24H, CAT 16M); |
| · | 7 water trucks (HD785, Komatsu 830E); and |
| · | 5 excavators (Komatsu PC300, Komatsu PC600). |
| 16.6 | Equipment Operating Hours |
Figure 16-19 summarises the logic for calculating effective operating time that was used in determining available equipment hours per year that directly drives the number of required equipment.
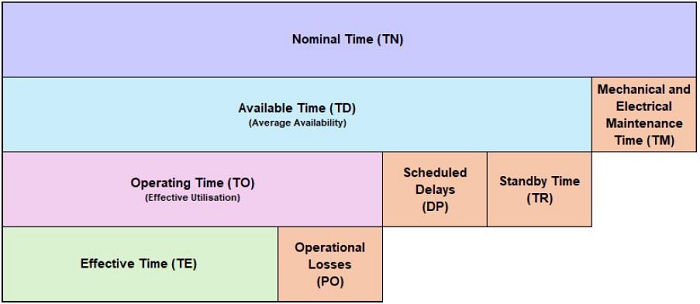
Figure 16-19: CMDIC Operating Time Model (CMDIC internal file)
| · | Nominal Time (TN) |
| o | Total calendar hours allocated per production shift. |
| o | Represents the theoretical maximum equipment availability prior to maintenance or operational deductions. |
| · | Mechanical and Electrical Maintenance Time (TM) |
| o | Includes planned and corrective maintenance interventions. |
| o | Encompasses workshop queue time, travel to maintenance facilities, and delays due to unavailable personnel, tooling, or spare parts. |
| · | Available Time (TD) |
| o | Calculated by subtracting Mechanical and Electrical Maintenance Time from Nominal Time. |
| o | Indicates mechanical useability and readiness for deployment into operational areas. |
| o | TD = TN − TM |
| November 2025 | ||
| Page |
| SRK Consulting (UK) Limited | Mineral Resources and Mineral Reserves, Collahuasi Copper Mine - Main Report |
| · | Scheduled Delays (DP) |
| o | Pre-planned operational interruptions. |
| o | Includes shift changeovers, blasting delays, refuelling, and statutory meal breaks. |
| · | Standby Time (TR) |
| o | Non-mechanical downtime when equipment remains idle and unproductive. |
| o | Typically, due to climatic constraints, insufficient face readiness, or logistical bottlenecks. |
| · | Operating Time (TO) |
| o | Portion of Available Time remaining after scheduled delays and standby periods are deducted. |
| o | Reflects the time equipment is expected to operate under standard production conditions. |
| o | TO = TD − (DP + TR) |
| · | Operational Losses (PO) |
| o | Productivity losses associated with operator training, minor stoppages, routine inspections, equipment relocations, and impacts from incidents. |
| · | Effective Time (TE) |
| o | Actual productive operating hours achieved after deducting Operational Losses. |
| o | Represents true value-adding utilisation of the equipment fleet. |
| o | TE = TO − PO |
Table 16-9 provides a summary of the time allocation breakdown used to determine the Effective Time applied in calculating the required haul truck fleet. The values presented in Table 16-9 represent fleet averages and may vary depending on equipment age, operating area, and the material types being handled.
| November 2025 | ||
| Page |
| SRK Consulting (UK) Limited | Mineral Resources and Mineral Reserves, Collahuasi Copper Mine - Main Report |
Table 16-9: Effective Time Applied
| Time Parameters | Units | Trucks | Rope Shovel |
FEL | Drills
Production |
Drills
Buffer |
| Days Per Year | Days/Year | 365 | 365 | 365 | 365 | 365 |
| Public Holidays | Days/Year | 8 | 8 | 8 | 8 | 8 |
| Nominal Days (TN) | Days/Year | 357 | 357 | 357 | 357 | 357 |
| Nominal Hours (TN) | Hours/Year | 8568 | 8568 | 8568 | 8568 | 8568 |
| Equipment Availability | % | 84% | 81% | 80% | 82% | 83% |
| Available Hours (TD) | Hours/Year | 7,197 | 6,940 | 6,854 | 7,026 | 7,111 |
| Equipment Reserve (operator shortage) | % | 0% | 0% | 0% | 0% | 0% |
| Operational Equipment | Hours/Year | 7,197 | 6,940 | 6,854 | 7,026 | 7,111 |
| Delays | % | 13% | 17% | 55% | 54% | 46% |
| Shift Start | min | 10 | 10 | 10 | 10 | 10 |
| Equipment & Work Area Inspection | min | 10 | 10 | 10 | 10 | 10 |
| Meal Break | min | 120 | 120 | 120 | 120 | 120 |
| Shift End | min | 10 | 10 | 10 | 10 | 10 |
|
Unscheduled Delays + Operational Losses |
min/h Operating | 0.5 | 2.5 | 25.0 | 25.0 | 20.0 |
| Effective Time (TE) | Hours/Year | 6,245 | 5,758 | 3,106 | 3,206 | 3,848 |
| Effective Utilisation | % | 87% | 83% | 45% | 46% | 54% |
| 16.7 | Haulage Analysis |
The truck fleet requirements consider material extraction from the Rosario and Ujina pits, stockpile management, and Ujina waste rehandling to support the construction of the tailings dam wall throughout the LoM plan.
The plan assumes utilisation of Komatsu 930E trucks as the primary haulage fleet, with an effective payload of 300 t during the first five-year period. In addition, the plan incorporates 15 Komatsu 980E (359 t) trucks, which will operate until the end of their respective useful lives and will subsequently be replaced by Komatsu 930E units. Furthermore, eight Liebherr T282 trucks will remain in operation until 2029.
Table 16-10 summarises the main weighted average haulage assumptions applied within MineHaul Software. All inputs were validated against site actual data to better reflect activity on site. MineHaul, developed by Dave Carkeet, provides cycle-time estimation by simulating all cycles to the waste dump, stockpiling and direct plant feed, optimising haul routes at the phase/bench/destination level to minimise total cycle time. Key inputs used for fleet estimation include:
| · | updated topographical surveys and phase designs; |
| · | dump and stockpile modelling (crest and toe geometry); |
| · | destination allocation (crushers, stockpiles, WRD); |
| · | user-defined haul routes; |
| · | temporary operational constraints; |
| · | seasonal speed profiles (winter/summer); and |
| · | phase/bench mining schedule inputs. |
| November 2025 | ||
| Page |
| SRK Consulting (UK) Limited | Mineral Resources and Mineral Reserves, Collahuasi Copper Mine - Main Report |
For the LoM-2024 planning cycle, updated maintenance data provided by Asset Management has been incorporated, alongside operational constraints identified. Specific considerations include:
| · | Rosario crusher maintenance schedule impacts and resultant ore diversion to the Ujina crusher; |
| · | maximum ballast discharge elevation in Rosario West of 4,700 masl; |
| · | conditional utilisation of the Rosario South dump, subject to compliance with environmental commitments (e.g., archaeological site remediation, placement of neutral material cover); and |
| · | restrictions governing dump advancement in proximity to the pipeline, diversion channel, and QB road, with full access anticipated by late 2026. |
Table 16-10: Summary of Main Haulage Inputs
| Summary of Haulage Inputs | |||||
| 2025 - 2029 | 2030 - LoM | ||||
| Truck Load Factor | (t) | 305 | 300 | ||
| Fixed Cycle Time | |||||
| Crushing (ROSARIO, UJINA) | (min) | 11.00 | |||
| Stockpiles (Sulf BLE, Sulf HG, Oxidos) | (min) | 10.05 | |||
| WRD | (min) | 9.05 | |||
| Average Haulage Speeds | |||||
| Empty | Loaded | ||||
| Flat Haul | (km/h) | 29.30 | 27.00 | ||
| Up | Down | Up | Down | ||
| 3% Slope | (km/h) | 29.3 | 29.3 | 27 | 27 |
| 6% Slope | (km/h) | 24.9 | 27.9 | 20.4 | 26.1 |
| 9% Slope | (km/h) | 21.3 | 28.7 | 15.6 | 23.2 |
| 10% Slope | (km/h) | 16.7 | 27.5 | 12.6 | 20.9 |
| November 2025 | ||
| Page |
| SRK Consulting (UK) Limited | Mineral Resources and Mineral Reserves, Collahuasi Copper Mine - Main Report |
Figure 16-20 show the projected haulage performance across the LoM, with a steady increase in weighted average haul distances and cycle times as mining moves deeper into the Rosario and Ujina pits. These metrics peak during the mid-LoM period, then drop sharply as material movement reduces and haul routes shorten in the final years when processing low-grade stockpiles and mining at Ujina. In line with this, total material moved and fleet operating hours follow a similar pattern as shown in Figure 16-21, peaking around 2060 before falling quickly as waste stripping requirements decrease.
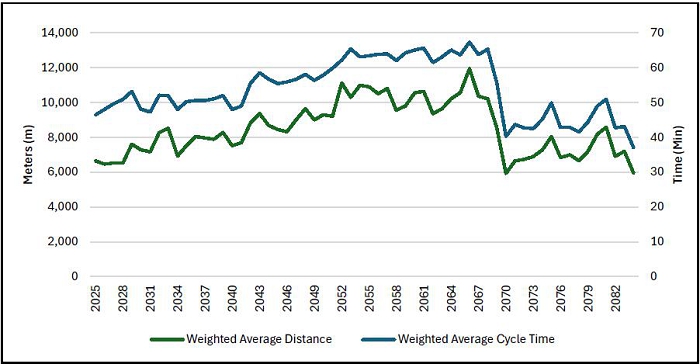
Figure 16-20: Weighted Average Haulage Distance and Cycle Time
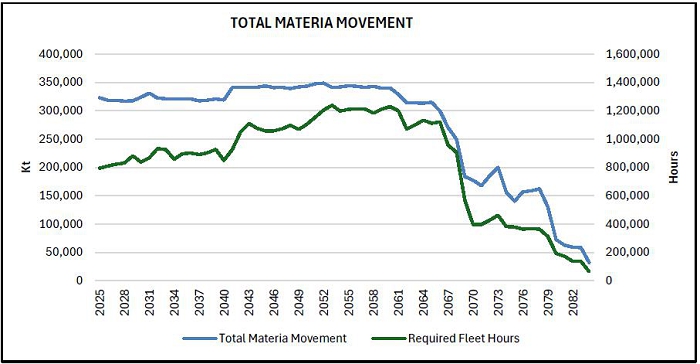
Figure 16-21: Total Material Moved and Required Fleet Hours
| 16.8 | Equipment Requirements and Replacement |
Equipment numbers are based on the production schedule, which is informed by productivity inputs developed from first-principles calculations. These are driven by equipment-specific assumptions such as loading times, spotting times, and other cycle components, which determine the productivity for each equipment combination or pairing. The productivity assumptions in combination with the useful life of each equipment will determine when additional or replacement equipment is required.
| November 2025 | ||
| Page |
| SRK Consulting (UK) Limited | Mineral Resources and Mineral Reserves, Collahuasi Copper Mine - Main Report |
Table 16-11 summarises the assumed useful life for each equipment type, thereby informing the timing and magnitude of replacement and retirement cycles across the LoMP, and ensuring sustained asset availability in alignment with operational productivity requirements.
Figure 16-22 through to Figure 16-26 summarise the total primary equipment requirements, replacement numbers, and the corresponding availability and utilisation assumptions applied.
Table 16-11: Assumed Useful Life per Equipment
| Equipment | Useful Life Hours (h) |
| Electric Drills | 100,000 |
| Buffer Drills | 45,000 |
| Rope Shovels | 100,000 |
| Hydraulic Shovels | 60,000 |
| FEL | 50,000 |
| Trucks | 100,000 |
| Bulldozer | 60,000 |
| Wheel dozer | 60,000 |
| Motor grader | 60,000 |
| Water truck | 78,000 |
| Backhoe | 60,000 |
| 16.8.1 | Truck Fleet |
The total fleet size increases steadily from 2025, peaking in the mid-2050s to mid-2060s in line with higher mining rates as shown in Figure 16-22. During this period, both additional units and replacements are introduced more frequently to maintain fleet capacity and offset ageing equipment. Beyond 2068, the total fleet requirement reduces sharply as mining activity winds down and stockpile processing dominates, resulting in fewer new units and replacements being required. The fleet requirement declines progressively thereafter, ultimately reaching zero as operations conclude.
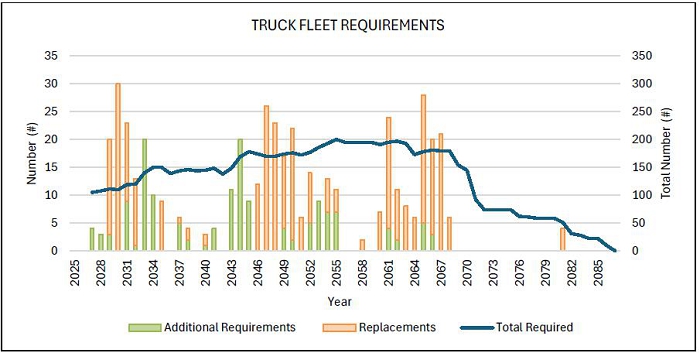
Figure 16-22: LoM Truck Fleet Requirements
| November 2025 | ||
| Page |
| SRK Consulting (UK) Limited | Mineral Resources and Mineral Reserves, Collahuasi Copper Mine - Main Report |
| 16.8.2 | Loading Fleet |
Across the LoM, both rope shovels and front end loaders (FEL) show stable fleet requirements through the early years, supported by periodic replacement units to sustain performance and manage asset life (Figure 16-23 and Figure 16-24). Rope shovel requirements remain higher, gradually declining with reduced material movement, while FEL requirements stay relatively constant at three units before stepping down to two units towards the end of operations.
Availability assumptions for both loading fleets remain consistent throughout, reflecting steady maintenance strategies and planned component change-outs. Utilisation, however, declines notably for both rope shovels and FEL during the late-2060s and early-2070s as mining activity increases at Ujina. Replacement intervals are spaced throughout the schedule for both fleets, aligning with forecasted equipment life cycles.
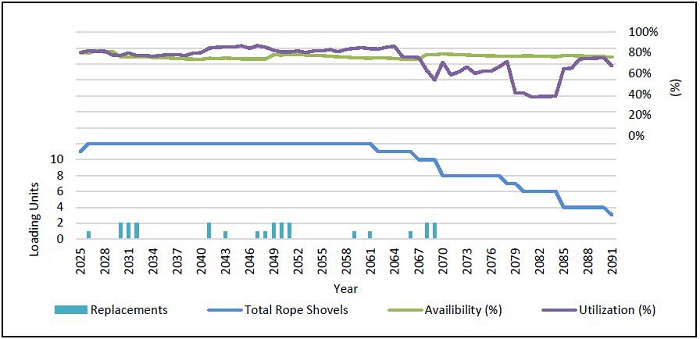
Figure 16-23: LoM Rope Shovel Requirements
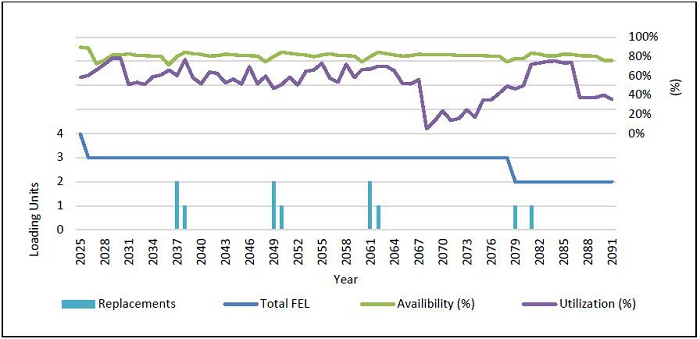
Figure 16-24: LoM FEL Requirements
| November 2025 | ||
| Page |
| SRK Consulting (UK) Limited | Mineral Resources and Mineral Reserves, Collahuasi Copper Mine - Main Report |
| 16.8.3 | Drill Requirements |
Across the LoM, both the production and buffer drill fleets, as shown in Figure 16-25 and Figure 16-26 respectively, exhibit a steady requirement profile, supported by periodic replacement units to maintain drilling capacity and manage component life. Production drill requirements gradually reduce from the mid-2060s onwards as mining volumes decline, tapering to zero towards the end of the schedule. Buffer drill requirements follow a similar trajectory, stepping down after 2064 before being fully retired prior to closure. Availability assumptions remain consistent across both fleets,
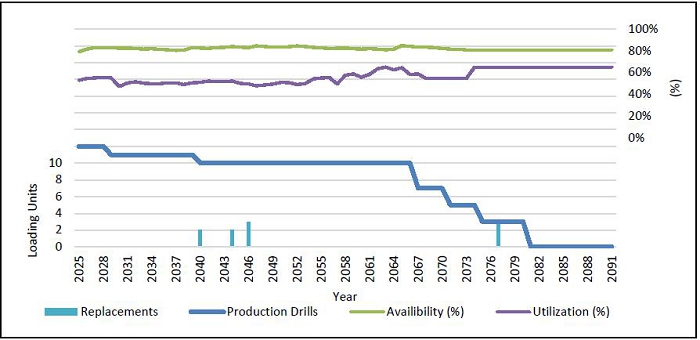
Figure 16-25: LoM Production Drill Requirements
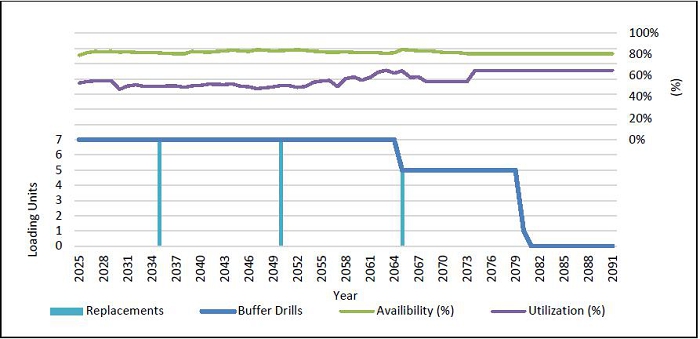
Figure 16-26: LoM Buffer Drill Requirements
| 16.8.4 | Support equipment requirements |
Table 16-12 summarises the total number of support equipment units required, including additional and replacement units projected over five-year increments. These requirements are derived from a series of operational rules of thumb, where support equipment allocations are determined in relation to the number of loading units, total haul road kilometres, and overall production rates. This approach aligns with standard industry practice, with the associated rules of thumb having been progressively developed and refined over time by CMDIC.
| November 2025 | ||
| Page |
| SRK Consulting (UK) Limited | Mineral Resources and Mineral Reserves, Collahuasi Copper Mine - Main Report |
Table 16-12: LoM Support Equipment Requirements
| Number
of Support Equipment |
2025 | 2030 | 2035 | 2040 | 2045 | 2050 | 2055 | 2060 | 2065 | 2070 | 2075 | 2080 | 2085 | |
| 2030 | 2035 | 2040 | 2045 | 2050 | 2055 | 2060 | 2065 | 2070 | 2075 | 2080 | 2085 | 2090 | ||
| Truck Dozers | (#) | 18 | 18 | 16 | 16 | 16 | 16 | 16 | 16 | 14 | 8 | 7 | 8 | 8 |
| Motor Grader | (#) | 16 | 15 | 15 | 16 | 16 | 16 | 16 | 16 | 12 | 10 | 9 | 8 | 8 |
| Wheel Dozers | (#) | 15 | 15 | 15 | 15 | 15 | 15 | 15 | 15 | 13 | 6 | 6 | 6 | 6 |
| Water Trucks | (#) | 7 | 7 | 7 | 7 | 7 | 7 | 7 | 7 | 5 | 4 | 4 | 3 | 3 |
| Backhoe | (#) | 5 | 6 | 5 | 5 | 5 | 5 | 5 | 5 | 5 | 2 | 2 | 2 | 0 |
| Replacements | ||||||||||||||
| Truck Dozers | (#) | 18 | 9 | 7 | 9 | 7 | 11 | 5 | 12 | 0 | 7 | 1 | 5 | 6 |
| Motor Grader | (#) | 2 | 8 | 7 | 5 | 13 | 2 | 14 | 8 | 4 | 8 | 0 | 8 | 0 |
| Wheel Dozers | (#) | 9 | 6 | 8 | 9 | 6 | 9 | 6 | 9 | 2 | 4 | 2 | 2 | 0 |
| Water Trucks | (#) | 0 | 0 | 2 | 0 | 0 | 2 | 0 | 0 | 2 | 2 | 0 | 0 | 0 |
| Backhoe | (#) | 5 | 1 | 3 | 4 | 0 | 5 | 0 | 4 | 2 | 0 | 0 | 0 | 0 |
| Additional
Requirements |
||||||||||||||
| Truck Dozers | (#) | 0 | 0 | 0 | 0 | 0 | 0 | 0 | 1 | 1 | 0 | 2 | 0 | 0 |
| Motor Grader | (#) | 5 | 0 | 1 | 0 | 0 | 0 | 0 | 0 | 0 | 0 | 0 | 0 | 0 |
| Wheel Dozers | (#) | 2 | 0 | 0 | 0 | 0 | 0 | 0 | 0 | 0 | 0 | 0 | 0 | 0 |
| Water Trucks | (#) | 0 | 0 | 0 | 0 | 0 | 0 | 0 | 0 | 0 | 0 | 0 | 0 | 0 |
| Backhoe | (#) | 1 | 0 | 0 | 0 | 0 | 0 | 0 | 0 | 0 | 0 | 0 | 0 | 0 |
| 16.9 | Mining Production Schedule |
The schedule was developed using the COMET Optimal Mine Schedule software. COMET applies a rule-based optimisation approach, enabling user-defined mining, processing, and haulage constraints to be embedded within the scheduling logic. This allows pit progression, material routing, and fleet utilisation to be aligned with operational priorities while maintaining technical feasibility.
The schedule was constrained within the various pit phases discussed in ITEM 15. Material flagged as ore includes only Proven and Probable material above a 0.3% Cu cut-off grade. All other material was treated as waste.
No additional dilution factors were applied beyond those inherent to the regularisation process, ensuring that resource modelling and block averaging inherit standardised dilution effects.
During LoM planning, the bench sinking rate was restricted to 12 benches per year per phase. CMDIC has previously demonstrated the capability to achieve, and in some instances exceed, this rate during selected periods between 2021 and 2024. However, this rate is considered high relative to typical industry benchmarks of 8 to 10 benches per annum. Failure to maintain the required mining rates would delay access to higher-grade ore, and result in an increased reliance on the historical low-grade stockpiles at various stages throughout the LoM.
A fixed breakeven cut-off grade of 0.3% Cu was applied to the pit inventories, with an annual variable cut-off grade derived within COMET based on optimised economic parameters. Material grading below the annual optimised cut-off grade but above the fixed breakeven threshold is directed to long-term stockpiles for deferred processing.
| November 2025 | ||
| Page |
| SRK Consulting (UK) Limited | Mineral Resources and Mineral Reserves, Collahuasi Copper Mine - Main Report |
Ore feed to the concentrator plant is planned at 170 ktpd until July 2026, supported by the fifth mill. With the commissioning of the third crusher in August 2026, treatment capacity increases to approximately 185 ktpd. A further increase to 210 ktpd is assumed from January 2028. This expanded processing throughput extends the production plan through to approximately 2091, at which point all available reserves, including stockpiles, are fully exhausted.
Approximately 5 Mt of ore are assumed to be redirected from Rosario to the Ujina crushers between 2025 and 2029 to allow for scheduled maintenance at the Rosario crushing circuit. This provides flexibility in plant feed continuity and mitigates downtime risk.
Rehandling is considered variable across the LoM and is driven by the dynamic interaction between planned direct feed and stockpile management requirements. This allows the schedule to balance plant feed targets, grade optimisation, and operational flexibility as mining advances deeper within each phase
| 16.10 | Production Scheduling Results |
Figure 16-27 presents the total material movement across the LoM. Total tonnes moved remain relatively stable through to around 2060, generally ranging between 290–320 Mtpa, with waste mining dominating during this phase. Ore mining is split between direct feed and feed to stockpiles. After 2060, total movement begins to decline as waste stripping requirements reduce and mining progresses into deeper, narrower phases. Figure 16-28 summarises total rock movement from each mine, illustrating the shift in contribution over time. Table 16-13 provides a five-yearly summary of the material mined per pit.
Figure 16-29 and Figure 16-30 respectively represent Rosario and Ujina material movement. Rosario contributes the majority of mining during the earlier portion of the schedule, with activity tapering and ceasing by the early 2070s. Ujina offsets the decline in movement from Rosario, sustaining overall production rates from approximately 2055 onwards.
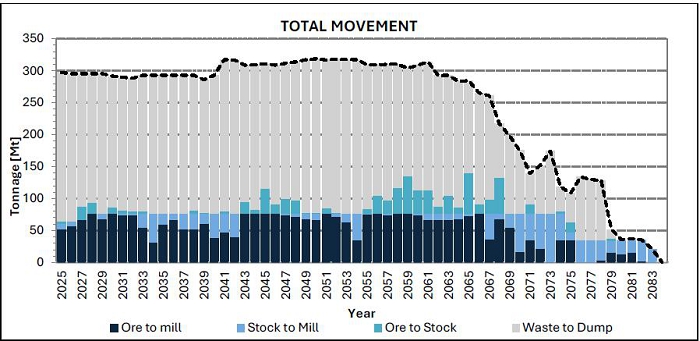
Figure 16-27: Rosario and Ujina LoM Total Material Movement
| November 2025 | ||
| Page |
| SRK Consulting (UK) Limited | Mineral Resources and Mineral Reserves, Collahuasi Copper Mine - Main Report |
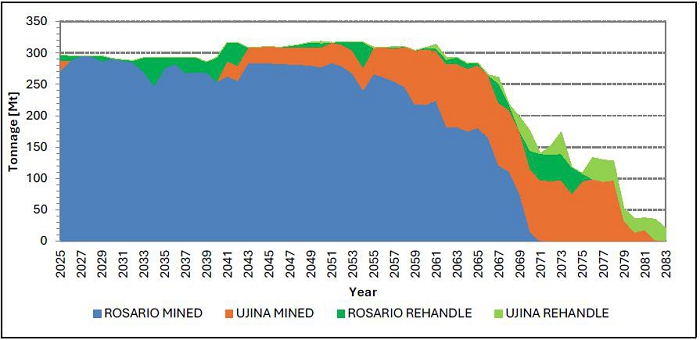
Figure 16-28: Total LoM Material Movement Split by Mine
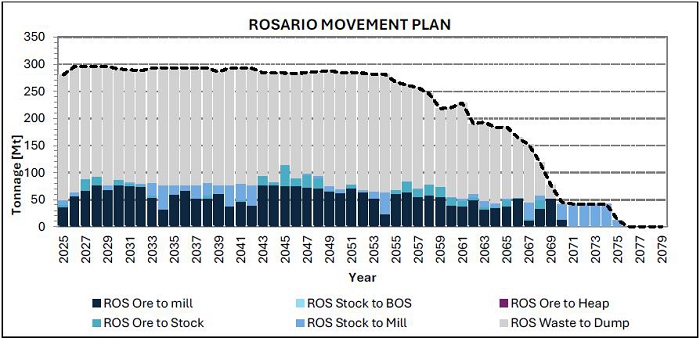
Figure 16-29: Rosario LoM Material Movement
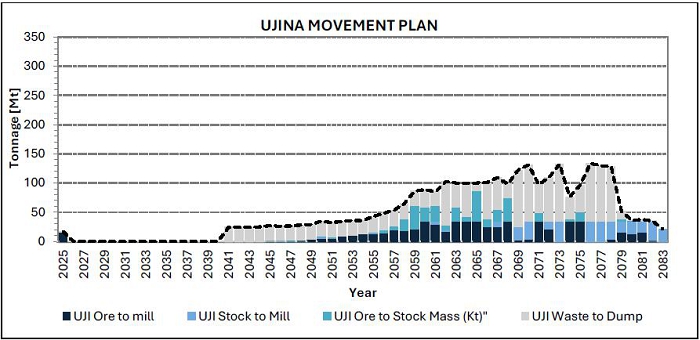
Figure 16-30: Ujina LoM Material Movement
| November 2025 | ||
| Page |
| SRK Consulting (UK) Limited | Mineral Resources and Mineral Reserves, Collahuasi Copper Mine - Main Report |
| 16.11 | Mill Feed Scheduling Results |
Figure 16-31 presents the annual ore feed to the mill over the LoM. Mill feed remains generally consistent through the majority of the schedule, supplemented by increasing reliance on stockpiled ore in the later years as the in-pit reserves are depleted. The lower is coupled with the uncertainty regarding the plant performance of old low-grade stockpiles at elevated feed rates. Copper head grade fluctuates as mining phases are completed and reliance on lower-grade stockpile material increases. From approximately 2067 onwards, average head grade gradually declines as higher-grade in-pit sources are exhausted and stockpile material becomes the primary feed source as shown in Figure 16-35. Figure 16-32 and Figure 16-33 respectively illustrate the distribution of resource confidence categories within the processing schedule, and the contribution of mill feed by UGM domain.
Figure 16-34 compares total ore mined against ore processed annually. Periods where mined tonnage exceeds mill capacity correspond with higher processed grades relative to the mined grade, indicating that the stockpiling strategy is successfully prioritising higher-grade material for early treatment. Feed grade becomes more stable from around 2040 onwards, coinciding with more consistent access to higher-grade ore from Rosario. This approach maximises value early in the schedule while preserving lower-grade material for later processing as shown in Figure 16-35.
Table 16-14 provides the five-yearly summary of material processed and the corresponding final concentrate produced.
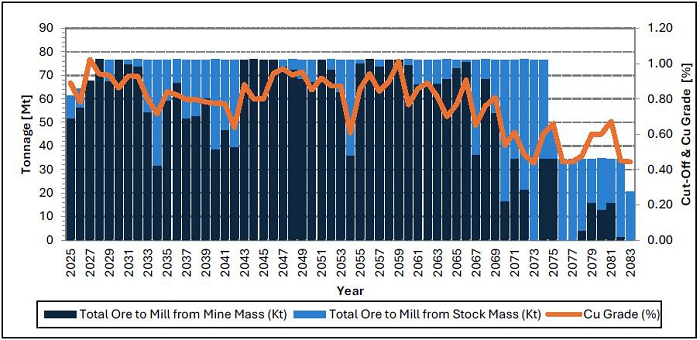
Figure 16-31: LoM Process Feed and Grade
| November 2025 | ||
| Page |
| SRK Consulting (UK) Limited | Mineral Resources and Mineral Reserves, Collahuasi Copper Mine - Main Report |
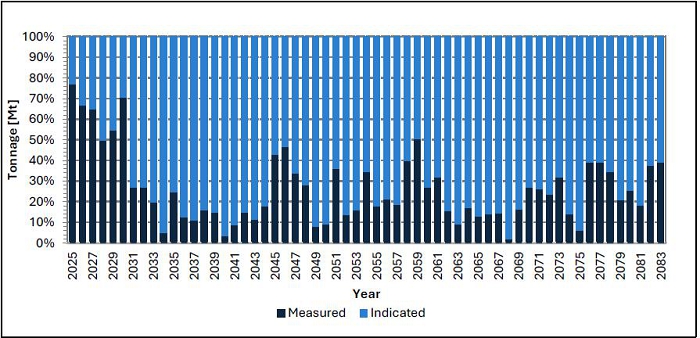
Figure 16-32: LoM Process Feed per Ore Classification
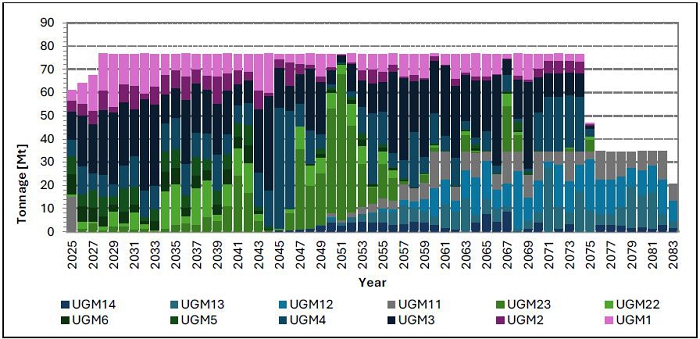
Figure 16-33: LoM Ore Feed contribution per UGM Zone
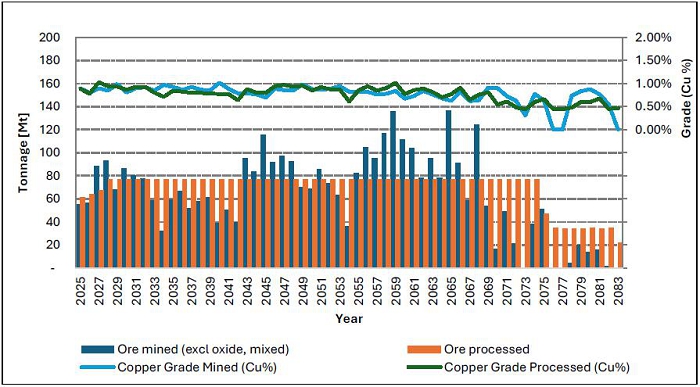
Figure 16-34: LoM Ore Mined and Grade vs Process Feed
| November 2025 | ||
| Page |
| SRK Consulting (UK) Limited | Mineral Resources and Mineral Reserves, Collahuasi Copper Mine - Main Report |
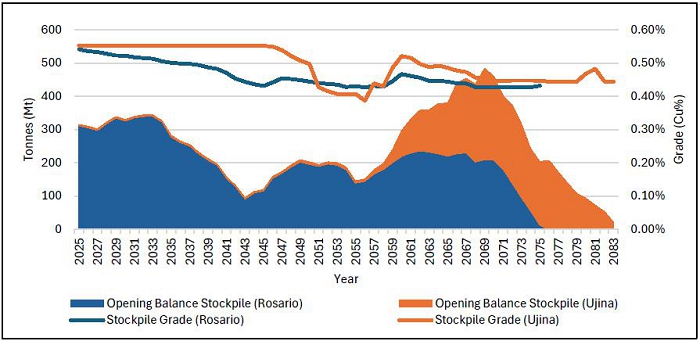
Figure 16-35: LoM Stockpile Balance
| November 2025 | ||
| Page |
| SRK Consulting (UK) Limited | Mineral Resources and Mineral Reserves, Collahuasi Copper Mine - Main Report |
Table 16-13: LoM Mining Schedule
| Description | Units | LoM | 2025- 2029 |
2030- 2034 |
2035- 2039 |
2040- 2044 |
2045- 2049 |
2050- 2054 |
2055- 2059 |
2060- 2064 |
2065- 2069 |
2070- 2074 |
2075- 2079 |
2080- 2084 |
| Rosario (Mining) | ||||||||||||||
| Ore mined (excl oxide, mixed) | kt | 2,856,948 | 345,863 | 335,372 | 297,329 | 306,635 | 456,032 | 281,708 | 374,725 | 227,237 | 219,202 | 12,846 | ||
| Copper grade | %CuT | 0.86% | 0.89% | 0.88% | 0.88% | 0.83% | 0.84% | 0.90% | 0.83% | 0.81% | 0.84% | 1.02% | ||
| Contained copper | Cu kt | 24,462 | 3,077 | 2,936 | 2,627 | 2,533 | 3,831 | 2,522 | 3,107 | 1,850 | 1,847 | 132 | ||
| Waste mined | kt | 8,330,571 | 1,090,499 | 1,047,537 | 1,068,806 | 1,035,676 | 954,422 | 1,069,071 | 871,652 | 755,412 | 435,008 | 2,489 | ||
| Total material mined | kt | 11,187,519 | 1,436,362 | 1,382,909 | 1,366,134 | 1,342,311 | 1,410,454 | 1,350,779 | 1,246,377 | 982,648 | 654,210 | 15,335 | ||
| Strip ratio | w:o | 2.92 | 3.15 | 3.12 | 3.59 | 3.38 | 2.09 | 3.79 | 2.33 | 3.32 | 1.98 | 0.19 | ||
| Ujina (Mining) | ||||||||||||||
| Ore mined (excl oxide, mixed) | kt | 933,260 | 15,153 | 226 | 10,490 | 44,664 | 159,574 | 239,488 | 245,589 | 112,212 | 74,825 | 31,040 | ||
| Copper grade | %CuT | 0.67% | 0.75% | 0.58% | 0.74% | 0.80% | 0.74% | 0.65% | 0.57% | 0.71% | 0.69% | 0.80% | ||
| Contained copper | Cu kt | 6,276 | 114 | 1 | 78 | 359 | 1,187 | 1,566 | 1,403 | 802 | 518 | 249 | ||
| Waste mined | kt | 1,667,736 | 1,843 | 97,256 | 125,801 | 124,789 | 132,621 | 228,036 | 251,616 | 355,677 | 346,151 | 3,946 | ||
| Total material mined | kt | 2,600,997 | 16,996 | 97,482 | 136,291 | 169,453 | 292,195 | 467,524 | 497,205 | 467,889 | 420,976 | 34,986 | ||
| Strip ratio | w:o | 1.79 | 0.12 | 430.36 | 11.99 | 2.79 | 0.83 | 0.95 | 1.02 | 3.17 | 4.63 | 0.13 | ||
| Total Mining | ||||||||||||||
| Ore mined (excl oxide, mixed) | kt | 3,790,208 | 361,016 | 335,372 | 297,329 | 306,861 | 466,522 | 326,372 | 534,298 | 466,725 | 464,791 | 125,057 | 74,825 | 31,040 |
| Copper grade | %CuT | 0.81% | 0.88% | 0.88% | 0.88% | 0.83% | 0.84% | 0.88% | 0.80% | 0.73% | 0.70% | 0.75% | 0.69% | 0.80% |
| Contained copper | Cu kt | 30,738 | 3,191 | 2,936 | 2,627 | 2,534 | 3,909 | 2,880 | 4,294 | 3,416 | 3,250 | 933 | 518 | 249 |
| Waste mined | kt | 9,998,308 | 1,092,342 | 1,047,537 | 1,068,806 | 1,132,932 | 1,080,222 | 1,193,860 | 1,004,273 | 983,447 | 686,624 | 358,166 | 346,151 | 3,946 |
| Total material mined | kt | 13,788,516 | 1,453,358 | 1,382,909 | 1,366,134 | 1,439,794 | 1,546,744 | 1,520,232 | 1,538,571 | 1,450,172 | 1,151,416 | 483,223 | 420,976 | 34,986 |
| Strip ratio | w:o | 2.64 | 3.03 | 3.12 | 3.59 | 3.69 | 2.32 | 3.66 | 1.88 | 2.11 | 1.48 | 2.86 | 4.63 | 0.13 |
| November 2025 | ||
| Page |
| SRK Consulting (UK) Limited | Mineral Resources and Mineral Reserves, Collahuasi Copper Mine - Main Report |
Table 16-14: LoM Processing Schedule
| Description | Units | LoM | 2025- 2029 |
2030- 2034 |
2035- 2039 |
2040- 2044 |
2045- 2049 |
2050- 2054 |
2055- 2059 |
2060- 2064 |
2065- 2069 |
2070- 2074 |
2075- 2079 |
2080- 2084 |
| Processing | ||||||||||||||
| Ore processed | kt | 4,107,031 | 346,362 | 383,460 | 383,032 | 383,504 | 383,460 | 383,231 | 383,460 | 383,670 | 383,238 | 383,081 | 184,925 | 125,609 |
| Copper grade | %CuT | 0.79% | 0.92% | 0.85% | 0.81% | 0.77% | 0.92% | 0.82% | 0.91% | 0.81% | 0.78% | 0.53% | 0.53% | 0.55% |
| Contained copper | Cu kt | 32,458 | 3,174 | 3,248 | 3,092 | 2,963 | 3,526 | 3,158 | 3,493 | 3,089 | 2,984 | 2,046 | 988 | 697 |
| Molybdenum grade | ppm | 209 | 217 | 268 | 204 | 187 | 227 | 86 | 286 | 273 | 250 | 141 | 137 | 147 |
| Contained Mo | Mo kt | 856 | 75 | 103 | 78 | 72 | 87 | 33 | 110 | 105 | 96 | 54 | 25 | 18 |
| Copper concentrate (pre-Moly & Filter plant) | kt | 100,121 | 10,253 | 10,397 | 9,694 | 9,319 | 11,472 | 9,736 | 10,966 | 9,437 | 9,030 | 5,832 | 2,366 | 1,619 |
| Copper grade | %CuT | 27.47% | 26.07% | 26.44% | 26.63% | 26.53% | 26.61% | 27.28% | 27.64% | 28.62% | 28.46% | 28.95% | 32.93% | 33.71% |
| Contained copper | Cu kt | 27,499 | 2,673 | 2,749 | 2,581 | 2,473 | 3,052 | 2,656 | 3,032 | 2,701 | 2,570 | 1,688 | 779 | 546 |
| Contained copper | Cu klb | 60,624,709 | 5,892,518 | 6,059,666 | 5,690,544 | 5,451,361 | 6,729,552 | 5,855,017 | 6,683,363 | 5,954,918 | 5,665,026 | 3,721,384 | 1,717,898 | 1,203,463 |
| Overall copper recovery | % | 84.72% | 84.21% | 84.63% | 83.49% | 83.44% | 86.57% | 84.09% | 86.79% | 87.44% | 86.11% | 82.52% | 78.88% | 78.35% |
| Molybdenum concentrate | kt | 710 | 80 | 114 | 66 | 59 | 61 | 27 | 86 | 83 | 71 | 40 | 12 | 12 |
| Molybdenum grade | %Mo | 31.86% | 31.97% | 31.66% | 31.87% | 31.92% | 31.92% | 32.49% | 31.71% | 31.73% | 31.75% | 32.08% | 32.29% | 32.15% |
| Contained molybdenum | Mo kt | 226 | 26 | 36 | 21 | 19 | 19 | 9 | 27 | 26 | 23 | 13 | 4 | 4 |
| Overall molybdenum recovery | % | 26.43% | 33.88% | 35.01% | 26.88% | 26.11% | 22.38% | 26.57% | 24.80% | 25.24% | 23.51% | 23.83% | 15.43% | 20.51% |
| Product Sales | ||||||||||||||
| Copper concentrate | kt | 99,468 | 10,173 | 10,283 | 9,628 | 9,260 | 11,411 | 9,709 | 10,880 | 9,354 | 8,959 | 5,792 | 2,354 | 1,665 |
| Copper grade | %CuT | 27.64% | 26.25% | 26.70% | 26.79% | 26.69% | 26.74% | 27.35% | 27.84% | 28.85% | 28.66% | 29.13% | 33.09% | 33.54% |
| Contained copper | Cu kt | 27,493 | 2,671 | 2,746 | 2,579 | 2,471 | 3,051 | 2,655 | 3,029 | 2,699 | 2,568 | 1,687 | 779 | 558 |
| Contained copper | Cu klb | 60,612,303 | 5,887,945 | 6,053,152 | 5,686,762 | 5,447,989 | 6,726,060 | 5,853,467 | 6,678,445 | 5,950,135 | 5,660,960 | 3,719,086 | 1,717,202 | 1,231,098 |
| Molybdenum concentrate | kt | 711 | 80 | 114 | 66 | 59 | 61 | 27 | 86 | 83 | 71 | 40 | 12 | 13 |
| Molybdenum grade | %Mo | 31.84% | 31.97% | 31.66% | 31.87% | 31.92% | 31.92% | 32.49% | 31.71% | 31.73% | 31.75% | 32.08% | 32.29% | 31.10% |
| Contained molybdenum | Mo kt | 226 | 26 | 36 | 21 | 19 | 19 | 9 | 27 | 26 | 23 | 13 | 4 | 4 |
| November 2025 | ||
| Page |
| SRK Consulting (UK) Limited | Mineral Resources and Mineral Reserves, Collahuasi Copper Mine - Main Report |
| ITEM 17 | RECOVERY METHODS |
| 17.1 | Concentrator |
CMDIC operates a conventional sulphide flotation facility producing separate copper and molybdenum concentrates. A combined copper-molybdenum concentrate is produced at the Ujina plant site, and the molybdenum concentrate is separated at a plant which is part of the Punta Patache port facility.
A simplified block diagram of the flowsheet is shown in Figure 17-1.
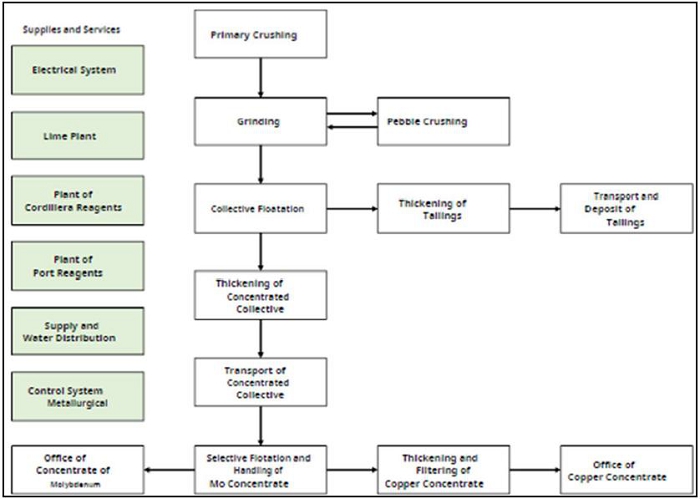
Figure 17-1: Simplified Flowsheet Block Diagram (CMDIC,2020)
A recent expansion project (completed in 2023) increased the capacity of the plant from 160 ktpd to 170 ktpd. The configuration of the plant at 170 ktpd is as follows:
| · | Crushing: a primary gyratory crusher at Rosario Pit (Crusher #4, 60” x 114”). Crushed ore is fed to the coarse ore stockpile. |
| · | Grinding: three parallel SAG-ball lines, lines 1 & 2 each with one 32’ x 13.5’ SAG mill and one 22’ x 36’ ball mill, and line 3 with one 40’ x 22’ SAG mill and two 26’ x 38’ ball mills. SAG mill pebbles are crushed and recycled, and the ball mills operate in closed circuit with cyclones. The target grind size P80 is 230 mm. |
| · | One key change for the 170 tpd upgrade was the installation of a fifth ball mill. This 26’ x 46.5’ mill takes as its feed the crushed SAG mill pebbles as well as a portion of the mill discharge from each of the other four ball mills. It operates in closed circuit with cyclones. |
| November 2025 | ||
| Page |
| SRK Consulting (UK) Limited | Mineral Resources and Mineral Reserves, Collahuasi Copper Mine - Main Report |
| · | Flotation: rougher, regrind, two cleaner, and cleaner scavenger stages. The rougher circuit consists of nine parallel lines, five lines consisting of nine 127 m3 cells fed by grinding lines 1 and 2, and five lines consisting of six 180 m3 cells, four of which are fed by grinding line 3 and one by the fifth ball mill. Rougher tailings are final tailings. Rougher concentrator is reground using a bank of seven 935 kW Vertimills (4 duty, 3 standby) operating in closed circuit with cyclones. The first stage cleaner and cleaner scavenger circuit consists of five parallel lines, two lines consisting of nine 127 m3 cells, one with five cleaner cells followed by four scavenger cells, and one with three cleaner cells and six scavenger cells, and three lines consisting of nine 160 m3 cells configured with 3-4 cells as cleaners and the remaining cells as scavengers. Cleaner scavenger tailings are also final tailings. Cleaner scavenger concentrate is returned to the regrind circuit. The second stage cleaner consists of 10 column cells, four 4.5 m diameter x 11 m high circular cross section cells and six 4 m x 11 m high square cross section cells. Column tailings are processed in two B6500/24 Jameson cells. The Jameson cell tailings are returned to the first cleaner stage, and the combined column and Jameson cell concentrate is the final “collective” (Cu-Mo) concentrate. |
| · | Tailings thickening: the flotation tailings are thickened using three 125 m diameter high-rate thickeners and two older 60 m diameter conventional thickeners. Thickener underflow flows by gravity to the TSF (see Section 18.2). |
| · | Concentrate thickening and transportation: the flotation concentrate is thickened using two 40 m diameter thickeners and a 43 m diameter clarifier then transferred to three 1,000 m3 holding tanks. There are two pipelines, a 7” line 200 km in length, and an 8” line 193 km in length. The 7” line has three monitoring stations, two valve stations, two dissipation stations and a terminal station. The 8” line has three monitoring stations, one valve station, three dissipation stations and a terminal station. Both pipelines discharge into a 500 m3 holding pond. |
| · | Molybdenum separation: five stages: rougher and four cleaning stages. The rougher stage consists of nine 28 m3 cells, the first cleaner stage four 14 m3 cells and the second cleaner stage two 14 m3 cells. These cells all operate in an inert gas environment. Rougher tailings report to the copper filtration circuit and each cleaner stage tailings are returned to the previous stage. The second cleaner concentrate is processed through two sequential desliming cyclone stages followed by a hydroseparator. The underflow streams report to the third cleaner stage and the hydroseparator overflow reports to the copper filtration circuit. Under some circumstances the hydroseparator is by-passed, with the second cyclone overflow reporting to a thickener. Depending on their grades, the thickener underflow can be directed either to the fourth cleaner stage or to the molybdenum filter, and the thickener overflow to the hydroseparator (as fluidisation water) or to the copper filtration circuit. The third and fourth cleaner stages use Maelgwyn pneumatic flotation cells; the third stage three IMF H14 cells and the fourth stage three IMF G14 cells. Cleaner tailings are returned to the previous stage. The final concentrate is filtered using four 2.6 m diameter disc filters, following which the concentrate is dried using a rotary screw dryer to a 10% target moisture content, following which it is bagged into 1 m3 bulk bags for transport. The molybdenum separation circuit has a capacity of 4,200 tpd of concentrate. Any concentrate received in excess of that is by-passed directly to the copper filtration circuit. |
| November 2025 | ||
| Page |
| SRK Consulting (UK) Limited | Mineral Resources and Mineral Reserves, Collahuasi Copper Mine - Main Report |
| · | Copper filtration: the final copper concentrate is thickened using two 43 m diameter thickener and a 36 m diameter clarifier, following which it is filtered using five 170 m2 vertical plate filter presses and one 168 m2 hyperbaric disc filter. Filtered concentrate, at the 8-10% target moisture content, is conveyed to two concentrate storage buildings with storage capacities of 118,000 t and 51,000 t, respectively. |
| 17.2 | Expansion / De-bottlenecking Projects |
There are two major capital construction projects (PG3A and PG210) underway as part of the as the “Ujina Growth Project - PG210” to achieve 210 ktpd milling capacity:
| · | PG3A: relocating a refurbished and upgraded Primary Crusher #3 to Rosario pit to achieve 185 ktpd (in latter stages of execution); and |
| · | PG210 Package (“Project Balance”): a large package of works across the processing plants and port facility to achieve 210 ktpd Project incorporating packages PG2 (Molybdenum plant upgrade) and PG3B works. |
Project PG1 (installation of 6 Rougher cells) has been completed to achieve 170 ktpd.
| 17.2.1 | 185 ktpd |
Project PG3A consists of the addition of a second primary gyratory crusher at the Rosario mine site. This crusher is the previously operating Crusher #3 (60” x 113’’), which will be relocated and refurbished, then connected using new conveyors, to the current conveyor CV203 that links the existing Crusher #4 to the coarse ore stockpile.
CMDIC has calculated that this system configuration can achieve 185 ktpd of production, with the bottleneck being the carrying capacity of CV203. The crushing and milling circuits have been calculated to be capable of processing in excess of 185 ktpd.
This upgrade is due for incorporation into the production profile in June 2026.
| 17.2.2 | 210 ktpd |
As noted above, CMDIC calculations have indicated that the crushing and milling circuit equipment, and most of the flotation circuit, can achieve the target 210 ktpd production rate, hence most of the modifications planned for the 210 ktpd expansion concern process related items and infrastructure rather than major process units themselves. The modifications are as follows:
At Ujina:
| · | increasing the belt speed of several of the conveyors in the crushing circuit; |
| · | modifications to some of the chutes and bins at the coarse ore stockpile; |
| · | an additional pebble screen, and expansion of the pebble screening plant building; |
| · | addition of a further rougher flotation line (six 180 m3 cells), and construction of a building to house this line and the one installed for the 170 ktpd expansion; |
| · | additional holding tank in the lime circuit with additional transfer pumps; |
| · | new reagent addition pumps for flotation; |
| · | additional 36,000 m3 fresh water pond; and |
| · | electrical upgrades. |
| November 2025 | ||
| Page |
| SRK Consulting (UK) Limited | Mineral Resources and Mineral Reserves, Collahuasi Copper Mine - Main Report |
At the port:
| · | 60 m diameter thickener to receive incoming concentrate; |
| · | desliming stage; |
| · | additional molybdenum separation flotation circuit, with a capacity of 2100 tpd of concentrate; |
| · | replacement of the molybdenum filtration and drying equipment; |
| · | extension of the No 2 copper concentrate storage shed to increase the storage capacity by 30 kt; and |
| · | electrical upgrades. |
The molybdenum separation circuit expansion would provide sufficient capacity to process all of the incoming collective concentrate, thus eliminating the need to by-pass the molybdenum separation circuit ;however, this part of the expansion is still subject to approval, and so it is not included in the current LoMP.
| 17.2.3 | ACP Growth Phase 370 ktpd |
A concept is being developed to increase the production rate to 370 ktpd by means of a separate process plant for the additional capacity. As this project is still under internal review by CMDIC, it is not included in the LoMP.
| 17.2.4 | Throughput recovery relationship |
As referenced in Section 13.2 based on the period of the schedule being considered the scheduling refers to the different calculated recovery relationship generated and recorded in the block model for the different throughputs in that specific period:
| · | 170 ktpd: 2025 |
| · | 175 ktpd: 2026 |
| · | 185 ktpd: 2027 |
| · | 210 ktpd: 2028 |
| 17.3 | Production Statistics |
| 17.3.1 | Historical |
Table 17-1 shows processing statistics for the period 2019 to 2024; annual figures showing budget and actual.
| November 2025 | ||
| Page |
| SRK Consulting (UK) Limited | Mineral Resources and Mineral Reserves, Collahuasi Copper Mine - Main Report |
Table 17-1: Historical Processing Statistics
| Item | Unit | 2019 | 2020 | 2021 | 2022 | 2023 | 2024 | 2025 | |||||||
| budget | actual | budget | actual | budget | actual | budget | actual | budget | actual | budget | actual | budget | actual* | ||
| Plant feed | Mt | 50.2 | 54.1 | 52.4 | 55.8 | 52.9 | 55.6 | 57.1 | 57.3 | 57.4 | 57.1 | 61.2 | 60.1 | 60.9 | 61.1 |
| ktpd | 138 | 148 | 144 | 153 | 145 | 153 | 156 | 157 | 157 | 157 | 168 | 165 | 167 | 168 | |
| % Cu | 1.28 | 1.19 | 1.31 | 1.24 | 1.28 | 1.25 | 1.12 | 1.11 | 1.14 | 1.17 | 1.07 | 1.15 | 0.93 | 0.92 | |
| ppm Mo | 247 | 206 | 327 | 313 | 288 | 292 | 322 | 327 | 279 | 256 | 233 | 233 | 156 | 169 | |
| ppm As | 149 | 214 | 112 | 130 | 174 | 218 | 75 | 101 | 184 | 169 | 260 | 165 | 162 | 278 | |
| Cu con | Mt | 2.00 | 2.17 | 2.18 | 2.37 | 2.23 | 2.34 | 2.17 | 2.18 | 2.17 | 2.24 | 2.06 | 2.35 | 1.99 | 1.94 |
| % Cu | 27.7 | 26.6 | 27.7 | 26.8 | 27.0 | 26.6 | 26.2 | 26.7 | 26.8 | 25.1 | 27.4 | 23.4 | 22.1 | 23.9 | |
| ppm As | 4,160 | 4,430 | 2,500 | 2,510 | 3,880 | 4,090 | 1,600 | 2,130 | 3,080 | 2,850 | 5,180 | 2,900 | 2,980 | 5,610 | |
| g/t Au | 1.41 | 1.27 | 1.96 | 1.65 | 1.80 | 1.45 | 1.39 | 1.27 | 1.33 | 1.28 | 1.41 | 1.37 | 0.83 | 0.75 | |
| g/t Ag | 117 | 96 | 146 | 119 | 134 | 126 | 93 | 110 | 116 | 126 | 99 | 111 | 76 | 64 | |
| Cu rec | % | 86.4 | 87.9 | 87.4 | 90.6 | 88.8 | 90.3 | 89.1 | 89.7 | 89.2 | 86.2 | 86.4 | 81.1 | 74.3 | 82.8 |
| Mo con | kt | 12.9 | 10.1 | 16.0 | 13.1 | 11.5 | 12.9 | 14.2 | 15.9 | 9.7 | 11.8 | 9.3 | 7.2 | 4.5 | 6.5 |
| % Mo | 33.0 | 29.6 | 36.1 | 29.1 | 33.4 | 36.0 | 33.6 | 41.5 | 36.8 | 40.6 | 37.4 | 29.0 | 26.1 | 26.1 | |
| % Cu | 2.60 | 1.51 | 2.60 | 2.06 | 2.60 | 1.41 | 2.60 | 1.80 | - | 2.16 | - | 1.43 | 1.48 | 2.60 | |
| Mo rec | % | 34.4 | 26.2 | 32.0 | 21.4 | 25.2 | 28.8 | 25.6 | 36.5 | 22.4 | 31.1 | 24.3 | 14.6 | 12.2 | 16.5 |
* 2025 actual is 9 months actual and 3 months forecast
| November 2025 | ||
| Page |
| SRK Consulting (UK) Limited | Mineral Resources and Mineral Reserves, Collahuasi Copper Mine - Main Report |
Plant feed rates up to 2024 show the plant not achieving the nominal 160 ktpd throughput, however the 2024 figures indicate that the modifications to achieve 170 ktpd have been successful. Cu feed grades have been declining over the period. Copper concentrate production has generally been below budget, although the concentrate Cu grades have been above budget. Cu recoveries have been slightly above budget until recently, where they have been below budget. This is likely due to higher proportions of stockpiled material having been fed to the plant recently. This is particularly noticeable for 2025 where the Cu recovery is significantly below budget. The 2025 throughput is also reduced due to ore availability. Molybdenum production has been variable compared to budget in terms of tonnage, grade and recovery.
| 17.3.2 | Forecast |
Forecast production data is shown below, aggregated into 5-year periods, for plant feed and feed grade (Figure 17-2), Cu feed grade and recovery (Figure 17-3), Cu concentrate production (Figure 17-4) and Mo concentrate production (Figure 17-5).
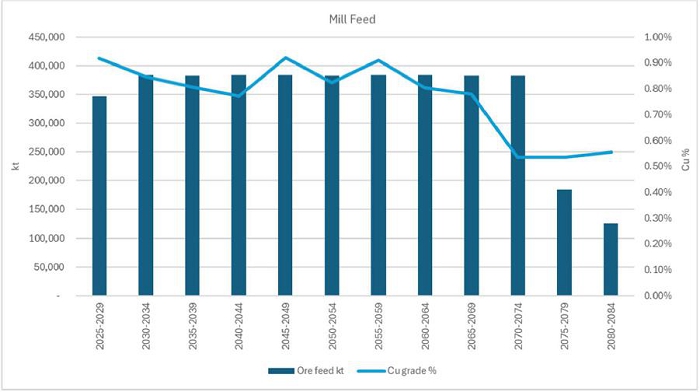
Figure 17-2: LoM Forecast Production Plant Feed and Feed Cu Grade
| November 2025 | ||
| Page |
| SRK Consulting (UK) Limited | Mineral Resources and Mineral Reserves, Collahuasi Copper Mine - Main Report |
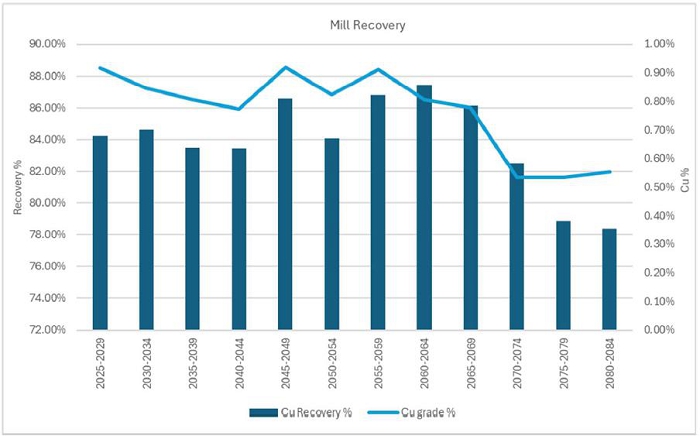
Figure 17-3: LoM Forecast Production: Plant Feed Cu Grade and Cu Recovery
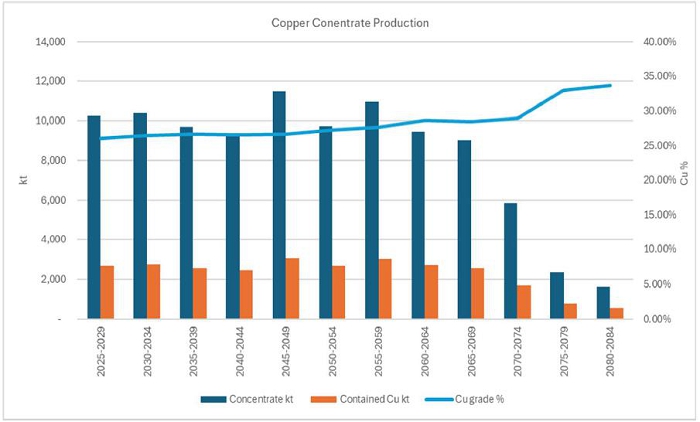
Figure 17-4: LoM Forecast Production: Copper Concentrate Production
| November 2025 | ||
| Page |
| SRK Consulting (UK) Limited | Mineral Resources and Mineral Reserves, Collahuasi Copper Mine - Main Report |
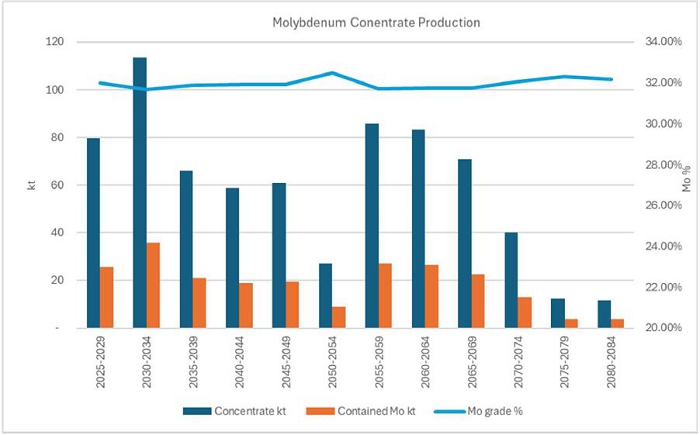
Figure 17-5: LoM Forecast Production: Molybdenum Concentrate Production
Figure 17-2 shows the plant feedrate ramping up until 2029, then maintaining 210 ktpd until the later years, when stockpiled low grade material will constitute the plant feed. The Cu feed grade remains relatively constant until it drops with the increasing proportion of low grade stockpiled material being fed. Figure 17-3 shows the Cu recovery decreasing slightly, then increasing again, presumably aligning with the reintroduction of Ujina ore, before again dropping due to the low grade stockpiled material. Figure 17-4 shows relatively consistent Cu concentrate production until the end years, where the concentrate grade is forecast to increase, likely due to the presence of secondary copper minerals in the stockpiled material. SRK considers there is a risk to achieving the higher copper concentrate grades assumed in the latter years of the LoM plan (>30% copper) which would result in higher freight costs and treatment charges if lower concentrate grades were produced than assumed. Figure 17-5 shows somewhat variable Mo concentrate production, albeit at a relatively consistent concentrate grade.
Included below are a series of Figures of the mill feed schedules over the LoM which show relative contributions to the mill feed by deposit and metallurgical domain:
| · | Figure 17-6: Total mill feed tonnage and grade split by direct feed and stockpile feed |
| · | Figure 17-7: Total mill feed tonnage and grade split by deposit, i.e. Rosario, Rosario West, Ujina |
| · | Figure 17-8: Total mill feed tonnage split by metallurgical domain, i.e. Rosario (UGM1-UGM6, Rosario West (UGM22-UGM23) and Ujina (UGM11-UGM14) |
| · | Figure 17-9: Total mill feed grade split by metallurgical domain, i.e. Rosario (UGM1-UGM6, Rosario West (UGM22-UGM23) and Ujina (UGM11-UGM14) |
| November 2025 | ||
| Page |
| SRK Consulting (UK) Limited | Mineral Resources and Mineral Reserves, Collahuasi Copper Mine - Main Report |
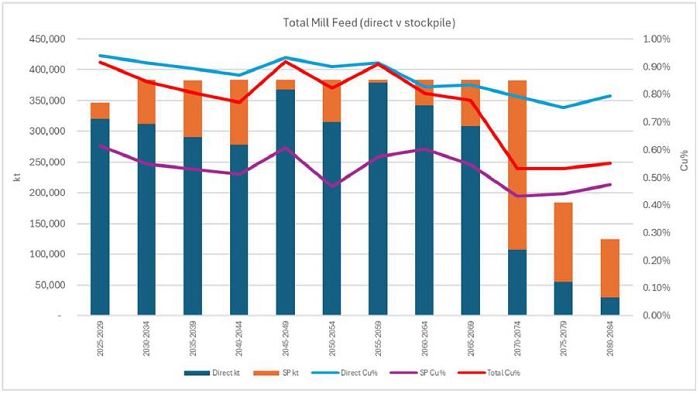
Figure 17-6: LoM Forecast Production: Mill feed, direct v stockpile
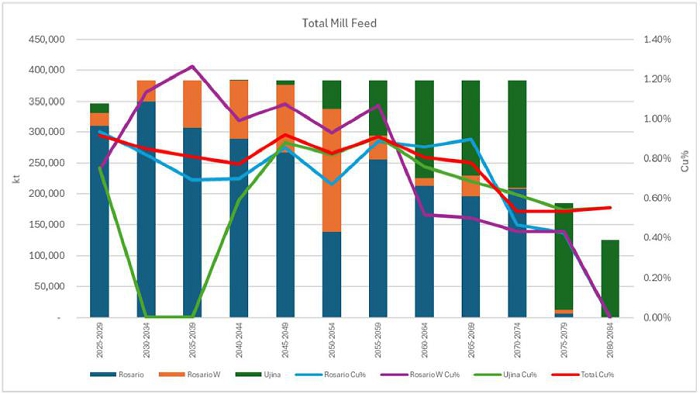
Figure 17-7: LoM Forecast Production: Total Mill feed by deposit
| November 2025 | ||
| Page |
| SRK Consulting (UK) Limited | Mineral Resources and Mineral Reserves, Collahuasi Copper Mine - Main Report |
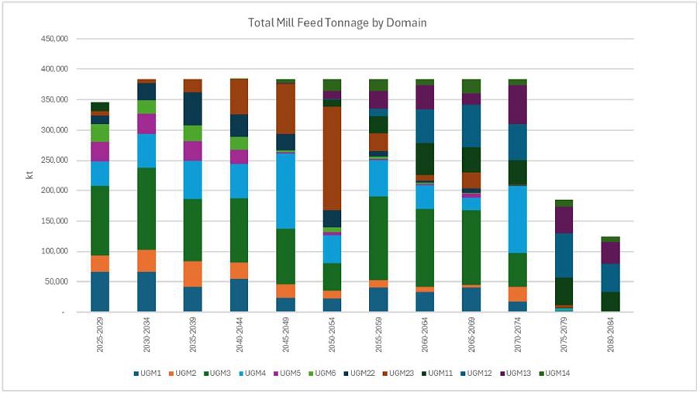
Figure 17-8: LoM Forecast Production: Total Mill feed tonnage by domain
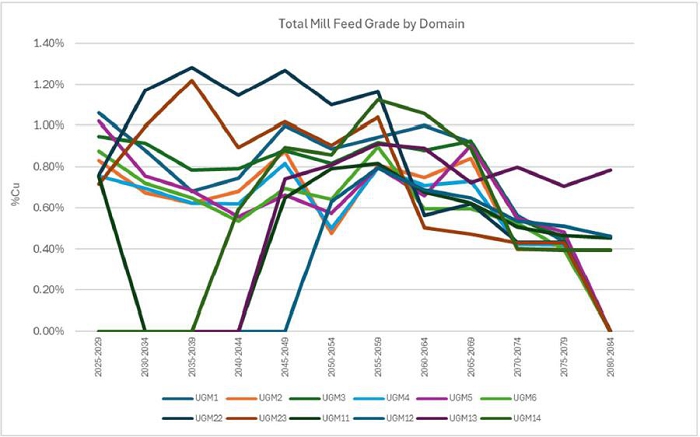
Figure 17-9: LoM Forecast Production: Total Mill feed grade by domain
| November 2025 | ||
| Page |
| SRK Consulting (UK) Limited | Mineral Resources and Mineral Reserves, Collahuasi Copper Mine - Main Report |
| ITEM 18 | PROJECT INFRASTRUCTURE |
| 18.1 | Introduction |
Collahuasi is an operating mine and has been in production since 1999. As such, all the required infrastructure is in place and operational, and able to facilitate mine and concentrate production at the current 170 ktpd milling capacity.
A description of this project infrastructure is presented in this section including:
| · | waste rock dumps; |
| · | tailings storage facility; |
| · | water supply and management (including the C20+ project which is under construction); |
| · | power supply; |
| · | site Infrastructure; and |
| · | concentrate export (slurry pipelines and port facility). |
The open pits, process plant facilities, TSF, and mine site, are at an elevation of between 3,800 m and 4,400 masl. The port facilities, including the molybdenum recovery plant, copper concentrate filter plant, concentrate storage facilities, and marine terminal, are located at Punta Patache approximately 80 km south of Iquique and are nominally at sea level.
CMDIC is in the process of executing a construction project to expand milling capacity known as the “Ujina Growth Project - PG210”. The Ujina Growth Project seeks to increase the average treatment capacity of the Ujina Concentrator Plant to 210 ktpd and is being delivered in phases under two main incremental project packages. Details of the two Ujina Growth Project phases currently under construction are summarised in this section (see Section 18.9).
| 18.2 | Waste Rock Dumps |
| 18.2.1 | Location |
WRD associated with LoM reserves include:
| · | Rosario Waste Dump (RWD), NW of Rosario Pit; |
| · | Rosario South Waste Dump (RSWD), south of Rosario Pit; and |
| · | Ujina Waste Dump (UWD), east of Ujina Pit. |
Figure 4-4 illustrates that the full UWD and RWD NW extension footprint are currently not covered by the current (2021) EIA; consequently modifications to the EIA will be needed to include the footprints covering the areas of expansion.
In addition, the Mineral Reserves case Rosario mine designs need to be reviewed in the context of the existing and future WRD footprints and extents, and ensure there are no overlaps and appropriate stand off distances are allowed. If the designs are not adapted then it will require excavation and rehandling of material in existing dumps, and revisions to LoM designs for future dumps.
| November 2025 | ||
| Page |
| SRK Consulting (UK) Limited | Mineral Resources and Mineral Reserves, Collahuasi Copper Mine - Main Report |
| 18.2.2 | Waste rock geochemistry |
99% of Ujina waste rock is predicted to be Non-PAG, while greater than 50% of the Rosario waste rock is classified as PAG (see Section 20.3.2).
Based on the geochemical characterisation, contact waters of the Rosario pit and WRD could be influenced by ARDML and could give rise to environmental impacts should those contact waters enter surface water and/or groundwater. The potential for WRD seepage and runoff to migrate to the valleys to the west presents a potential long-term water quality risk.
It is recommended that the RWD and RSWD designs are developed to include runoff capture, sedimentation ponds, and downstream water monitoring, especially to the west of the site.
A basal layer of neutral material has been placed beneath the WRD in key areas, to isolate deposited waste from potential contact with surface or groundwater, particularly in areas where groundwater is close to surface.
| 18.2.3 | Ground investigations & slope stability |
In August 2021 two geotechnical reviews have been completed by AKL Ingeniería y Geomecánica Ltda (‘AKL’) that assess the stability and design of the RWD (and associated Low-Grade Stockpile), and RSWD, covering the planned configuration for mine operations in the year 2040. The WRD studies undertaken evaluate the short- and long-term slope stability and operational safety, including their interaction with existing mining excavations. The studies exclude a slope design/ assessment associated with the UWD and are limited in their extent to the 2040 profiles.
From review of the 2024 LoM Book, the same waste dump slope geometry and profile as used in the 2021 geotechnical studies by AKL have been applied to the designs for the Mineral Reserves case LoM WRD (100 m high lifts; 60o inclination face; 60 m wide berms) ; however, revised assessments have yet to be completed to validate that the (presumed) higher slope stck heights. Recommendations for additional work are included below.
Both 2021 AKL studies rely on an extensive database of foundation and waste material characterisation informed by historical and recent site-specific investigations. Parameters were derived from laboratory testing and field investigations, including triaxial and direct shear tests for foundation soils, referencing works conducted by AKL, AMEC, Arcadis, and internal CMDIC campaigns from 1996 through 2018. These databases include grain size distributions, mineralogical character, and strength testing, as well as reviews and updates based on more recent geotechnical and hydrogeological field studies.
Specific reference is made by AKL that in their opinion the analyses include application of conservative strength properties compared to both field test results and published guideline values (e.g., Guidelines for Mine Waste and Stockpile Design, CSIRO 2017), especially for foundation units such as ‘bofedales’ (wetlands with organic, potentially weak soils referred to from here on a ‘critical foundation soils’), where values were deliberately reduced to account for natural variability and adverse conditions.
| November 2025 | ||
| Page |
| SRK Consulting (UK) Limited | Mineral Resources and Mineral Reserves, Collahuasi Copper Mine - Main Report |
The slope stability analysis methods included the following techniques and scenarios:
| · | Limit Equilibrium (Slide, Rocscience): Factors of Safety (FoS) under static & seismic loading; |
| · | Finite Element Modelling (Phase2): Deformation/kinematics under extreme seismic events; |
| · | Probabilistic Analysis: PoF accounting for uncertainty; |
| · | RocFall: Rockfall trajectory/standoff analysis; and |
| · | Benchmarks: CMDIC and CSIRO standards: FoS ≥1.2 (static), ≥1.0 (pseudo-static), target PF limits. No significant groundwater expected per field investigations. |
A summary of slope stability results (static and seismic analysis) for Rosario Waste Dump and Low-Grade Stockpile is provided below:
| · | Static: |
| o | Overall slope angle: 28°–34° for slope heights ranging between 162–310 m, resulting in FoS: 1.25–1.68 in most critical sections and PoF: <1%–10%. |
| · | Seismic (Pseudo-static, KH = 0.12g): |
| o | Minimum FoS: 1.14–1.39; PoF: up to 18% |
A summary of slope stability results (static and seismic analysis) for RSWD is provided below:
| · | Static: |
| o | FoS:1.49 for steep slopes on ‘bofedal’ (organic/weak) foundation; Up to 5.08 for shallower inclination slopes; Slope heights: 247–311 m; Overall slope angle: 15° for very gentle slopes or 31° for typical design slopes; PoF: <1% in all assessed sections |
| · | Seismic (Pseudo-static, KH = 0.12g): |
| o | FoS: 1.14 (steep slopes on bofedal); up to 3.28 (gentle slopes); PoF: up to 18% for steepest, weakest-foundation slopes |
All global slope sections (for both WRD, static and seismic) exceeded design criteria (FoS ≥1.2 static, ≥1.0 seismic), and PoF remains within target limits; however, organic/weak-saturated foundation soils are a key geotechnical risk, paralleling challenges in TSF foundations which are discussed elsewhere in this report. The associated recommended actions relating to weak foundation soils include:
| · | Remove or improve weak soils with engineered fill. |
| · | Where removal is not viable, place at least a 10 m thick granular layer (up to 20 m at RSWD). |
| · | Apply staged loading or displacement methods for challenging zones Analyses confirm that, with such measures, design safety margins are achieved. |
| November 2025 | ||
| Page |
| SRK Consulting (UK) Limited | Mineral Resources and Mineral Reserves, Collahuasi Copper Mine - Main Report |
The analyses also defined WRD slope toe standoff (18 m) and critical distances (36 m). Layouts of dumps need to ensure standoff distances far exceed maximum required by stability and rockfall analyses (>50 m), with ample margin under all design and event scenarios incorporated.
The dumps and associated stockpiles, as designed for 2040, meet or exceed all required FoS and PoF targets under both static and credible extreme seismic events, even in the presence of weak subsoils where improvement measures are applied.
Current LoM dump designs supporting the Mineral Reserves reflect the 2040-case slope geometries assessed in the AKL reports (100 m high dump lifts, 60° face, 60 m berms). Updated assessments are needed to validate these for the LoM Reserves case higher/thicker/laterally-extensive/additional future waste dumps, the anticipated foundation conditions (including presence of sensitive weak soils), and to detail any associated required mitigation measures. Additional ground investigations/laboratory tests targeting sensitive foundation soils are required; updated design parameters and stability analysis must result.
Notwithstanding the results of additional slope stability analyses, closure/final WRD outer slopes will need to be significantly lower in inclination than those proposed in the 2040 design validation studies to facilitate access, and safe and effective closure. The LoM slope designs are typically approximately 30° inclination overall; however, closure slopes are more typically 18-degrees overall (for slope surface management and to facilitate access, as recommended in typical closure best practices) which will necessitate expansion of WRD footprint and significant reprofiling if done at closure rather than if constructed progressively.
It is recommended that alternative waste dump construction practices and slope geometries are applied to result in lower inter-ramp slopes and more benches. This will facilitate easier access for closure reprofiling.
| 18.3 | Tailings Storage & Management |
| 18.3.1 | Introduction |
The Pampa Pabellón TSF is situated within the operations of CMDIC, in the Tarapacá Region, northern Chile. The facility is located at high altitude within the Volcanic Central Zone, a remote mountain region with arid climatic conditions and notable exposure to volcanic hazards such as avalanches, lahars and pyroclastic flows, particularly from neighbouring Irruputuncu and Olca-Michincha volcanoes. The geology comprises a foundation of Pre-Cenozoic basement rocks overlain by volcanic units, ignimbrites, and significant thicknesses of alluvial and lacustrine sediments. These units strongly influence both the geotechnical stability of the embankments and local hydrological behaviour.
Site records indicate that the existing TSF includes 1,089 Mt of tailings placed by end 2024. The current permitted TSF design, to 2041, has capacity for storage of 2,329 Mt of tailings. The LoM Mineral Reserve case generates 4,007 Mt of additional tailings post-2024 for an overall LoM tailings total of 5,096 Mt, therefore expansion beyond the limits of the current design will be required which has been considered part of the ACP Growth Phase Project linked to an increase in production to 370 ktpd. This expansion study is currently at Class 4 estimate level and therefore requires further development to upgrade the level of design and mitigate the risks identified.
| November 2025 | ||
| Page |
| SRK Consulting (UK) Limited | Mineral Resources and Mineral Reserves, Collahuasi Copper Mine - Main Report |
Figure 18-1 shows the forecast tailings production for the Mineral Reserves case LoM plan in 5 year increments.
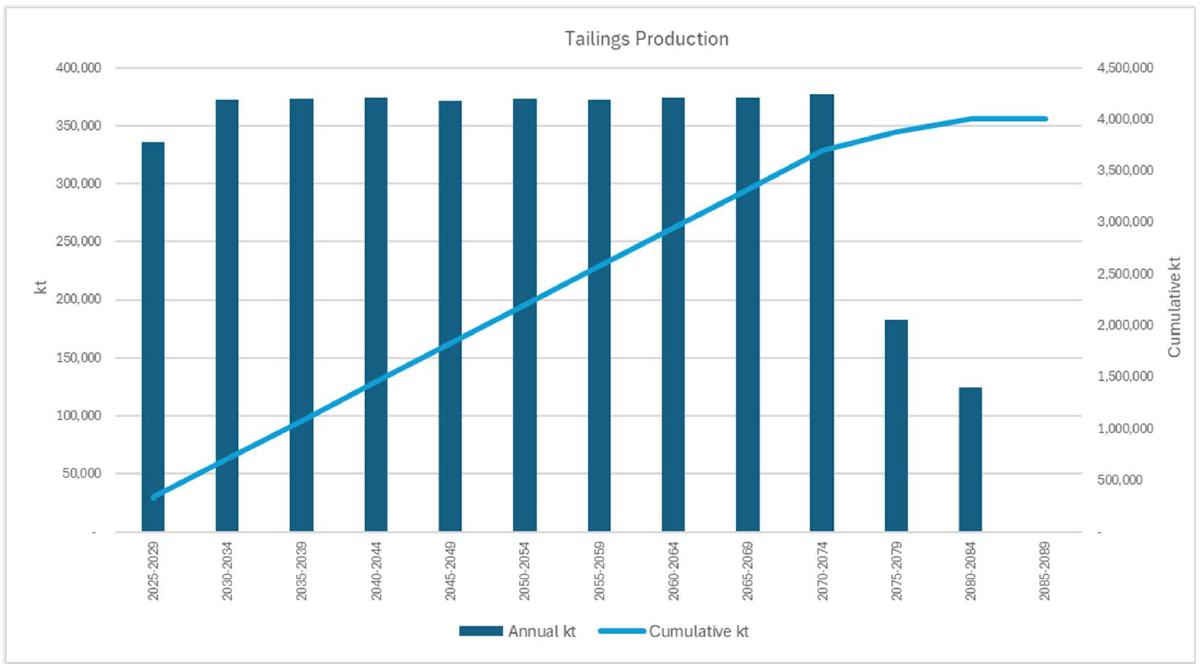
Figure 18-1: Reserves case LoM plan tailings production (5-year increments)
| 18.3.2 | TSF design, construction, and raising strategy |
The TSF began development and construction in the late 1990s, originally approved for operation in 1995 (RCA Nº 713/2199) and expanded over subsequent years.
Major expansion dates include the optimization to 126 ktpd (2003), 170 ktpd (2010), and a current permitted plan to operate and expand up to 2041 reaching 210 ktpd of copper ore processing, with scope for planned future expansion (discussed further in a following report section).
The engineering and design of the TSF have involved several firms over time. The most recent Engineer of Record (EoR) is WSP E&I Chile, responsible for design continuity and support between September 2022 and August 2025. Previous designers and contributors include Geotécnica Consultores (1994-1997), Arcadis Geotécnica (2003-2012), AMEC/IDIEM (2003-2014), Golder Associates (2015-2016), Arcadis (2020-2021), and Wood (2020-2023).
The TSF design layout (to 2041) is provided within (Figure 18-2) and comprises:
| · | Main Embankment (Figure 18-3): The principal dam is in the south and is founded predominantly on alluvial and lacustrine soils. The central section of the embankment sits atop thicker, weaker lacustrine strata (up to 9 m depth over approximately 15% of the footprint). The main embankment is raised incrementally downstream in accordance with the scheduled increase in tailings deposition. |
| · | Auxiliary Embankments (Figure 18-4): Saddle dams located in the NE and NW flank the TSF to control containment geometry and accommodate increased tailings storage. These are founded on alluvial/colluvial soils or weathered rock. Because tailings beaching from the southern flank of the TSF drives supernatant pond water to the north, the auxiliary embankments include nonwoven polypropylene geotextile filter/protector (≥500 g/m²) and 1.5 mm HDPE liner to minimise seepage and protect groundwater sources. |
| November 2025 | ||
| Page |
| SRK Consulting (UK) Limited | Mineral Resources and Mineral Reserves, Collahuasi Copper Mine - Main Report |
| · | Construction materials: The types and sources of materials used in constructing the embankments includes: 1) Material for the main embankment is sourced from the UWD (estéril mina) and is mainly composed of rhyolites and/or ignimbrites; 2) Empréstito materials (borrow) are taken from the cubeta (the TSF footprint) and excavations from surrounding surface water drainage channels; and 3) Transition materials are sourced from nearby alluvial deposits and consist of granular soils in a silty-clay matrix. Average monthly placement rates (2024) are 1,024,690 t of waste rock and 35,519 t of transition (filter) material, with corresponding annual totals of 12,296,280 t and 426,230 t, respectively. All material placement follows specification and compaction requirements, and quality control regimes involving regular sampling, laboratory analysis and continuous inspection. |
| · | Drainage and Seepage Systems: There is no liner system across the facility base or main embankment. A network of drainage and seepage interception wells intercepts contact water and returns it to the TSF clarification pond. The facility also features clarification lagoons to process decanted water and recycle it to the processing plant. |
| · | Incremental Downstream Raising: The embankment is raised downstream in response to tailings deposition rates (Figure 18-3 and Figure 18-4). A 5 m wide filter zone is constructed along the upstream face of the dam. All raising stages comply with rigorous design, specification, and QA/QC procedures. |
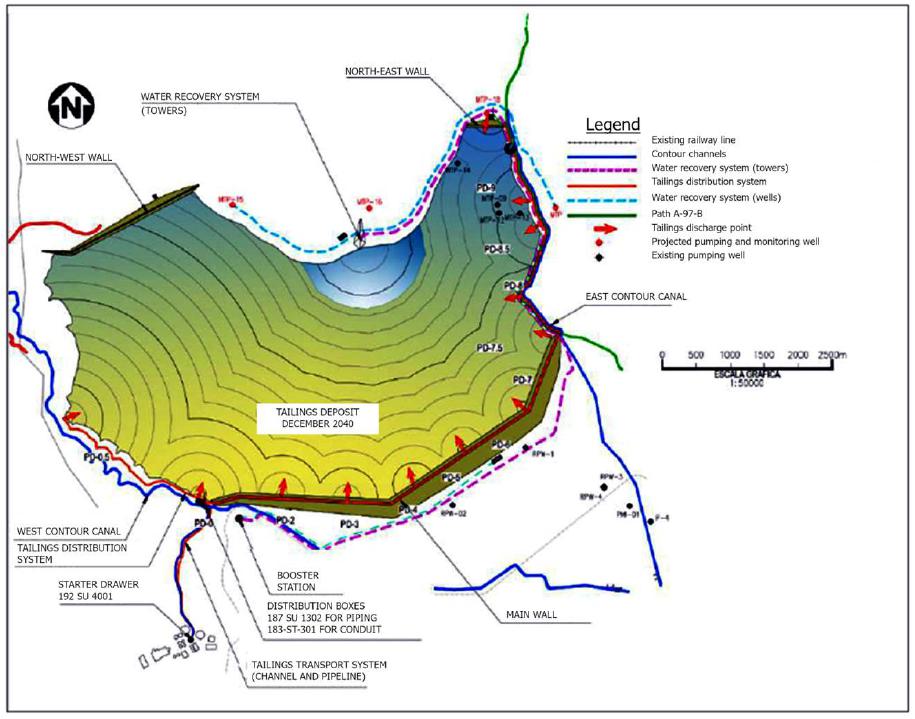
Figure 18-2: Pampa Pabellón Tailings Storage Facility project to 2041 (WSP, 2022)
| November 2025 | ||
| Page |
| SRK Consulting (UK) Limited | Mineral Resources and Mineral Reserves, Collahuasi Copper Mine - Main Report |
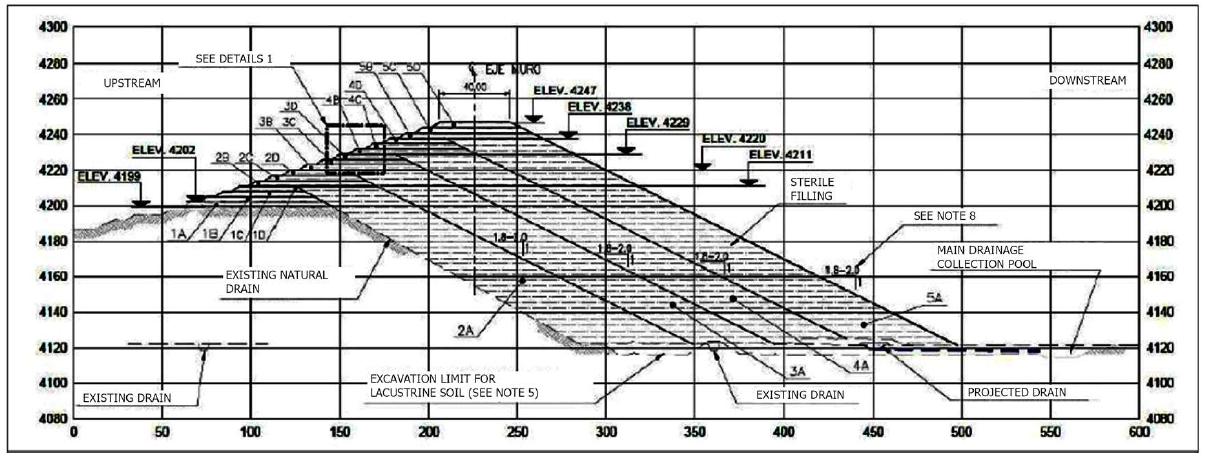
| Figure 18-3: | Pampa Pabellón Tailings Storage Facility (2041 permitted design); construction methodology and cross section of main embankment (WSP, 2023) |
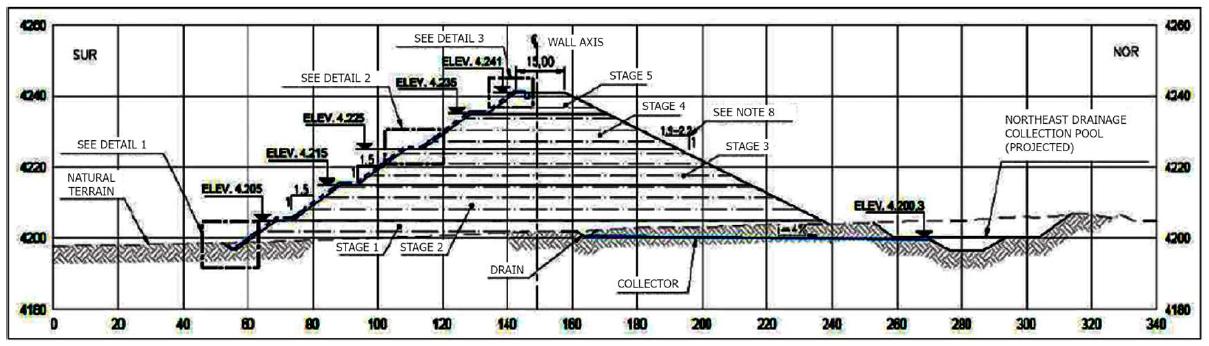
| Figure 18-4: | Pampa Pabellón Tailings Storage Facility (2041 permitted design); construction methodology and cross section of NW auxiliary embankment (WSP, 2023) |
| 18.3.3 | Geotechnical characterisation |
Foundation Soils: Geotechnical investigations included grain-size distribution, Atterberg limits (plasticity index 3–32%), and shear strength testing. Lacustrine strata comprise silts and clays with sandy interlayers (unit weight 1.8 kN/m³, friction angle 25°, undrained shear strength su ≈ 0.23). These materials are critical to performance of the TSF embankment dam due to their low shear strength and low density (discussed further in following report sections). Alluvial soils (gravels and sandy silts, up to 19 m thick) are well-graded, dense (unit weight 1.9 kN/m³, friction angle 36°, cohesion 15 kPa). Underlying volcaniclastic and tuff units provide competent load bearing and resistance to deep-seated failure mechanisms (unit weight 2.2 kN/m³, friction angle 22–32°, cohesion up to 270 kPa).
Embankment Materials: Bulk fill consists of angular to subangular waste rock sourced from the Ujina waste rock dump (non-plastic, minimal fines, primarily rhyolites/ignimbrites, natural unit weight 1.9 kN/m³, friction angle 40–42°, cohesion up to 252 kPa). The mine waste generated by the project is broadly classified as having potential for acid drainage and metal leaching; however, based upon testing over 99% of the Ujina waste rock materials were classed as non-PAG. This contrasts with waste from the Rosario and Sur dumps where over 50% of the material was classed as PAG (Section 20.3.2). Borrow and transition materials are well-graded sands and gravels (SW-SM, SP-SM, GW-GM), with compaction to 95% Modified Proctor density and moisture content within ±2% of optimum.
| November 2025 | ||
| Page |
| SRK Consulting (UK) Limited | Mineral Resources and Mineral Reserves, Collahuasi Copper Mine - Main Report |
Tailings: Tailings deposited at the TSF originate from copper sulphide processing, and based on extensive laboratory and pilot test data, are fine-grained, low to moderately plastic silty clays and clays (CL-ML and CL, USCS; fines 50–80% but may range from 25–100%; specific gravity 2.73–2.93; particle size P80 250 μm; dry density 1.66–1.76 t/m³). Plant flotation samples record plasticity index 0.1–1.5%, liquid limit 19.1–21.3%, characteristic solids concentration 56–60% by mass. These tailings are classified as potentially acid generating with high concentrations of sulphate and chloride, requiring robust containment and environmental controls.
Between 1994 and 2022, multiple geotechnical ground investigation campaigns have been conducted to accurately identify and characterise the foundation ground conditions underlying the progressively expanding dam footprint(s), including locating and characterising lacustrine soils in areas of future expansion out to the permitted 2040 design. Works include: test pits; boreholes; geophysics; standard penetration tests; and a program of associated laboratory testing including soil classification, density, triaxial and consolidation tests, seismic profiles, and chemical tests.
To date, there have been no geotechnical investigation campaigns completed to target ground conditions in the expanded footprint of the TSF beyond the currently permitted 2040 design. The TSF expansion project FEL2A documentation (WSP E&I Chile, 2024 and 2025) acknowledges that additional ground investigations and associated updated slope performance/stability analyses will be required (likely undertaken in FEL2B projects).
A tailored lacustrine material excavation plan is in place, validated by a geotechnical engineer. According to the currently approved wall design for operation up to 2040, it has not been necessary to design or construct a structural buttress for stability against these weak strata. The TSF expansion design (currently at FEL2A stage, and discussed in a following report section), however, does consider the potential for a buttress, which will require further detailed analysis and design in the next phase of engineering, taking into account any updated geotechnical information and risk reviews.
| 18.3.4 | Facility capacity, tailings deposition and expansion |
The TSF is designed to and permitted for storage of up to 2,329 Mt of tailings, an increase from 1,040 Mt as originally permitted. The area of surface impoundment will expand from 2,140 to 2,619 hectares (ha) as modifications advance. The ultimate main embankment crest elevation will be raised from 4,209.2 m to 4,247 masl. The operational tailings transportation and distribution system utilises pipelines and gravity channels with up to 12 distribution points and a hydraulic capacity of 23,500 m³/h.
At the end of 2024, approximately 1,089 Mt of tailings were contained within the TSF, leaving a remaining permitted capacity of 1,240 Mt and providing 20.6 years of operation at a standard production rate (165 ktpd) and 16.2 years at an expanded rate (210 ktpd).
| 18.3.5 | Water management |
The facility complies with Chilean regulations for flood control and dam safety (DS No. 50, DS No. 248 and related standards), including:
| · | Flood Management: Spillways designed for the Probable Maximum Flood (PMF). |
| · | Runoff and Seepage Control: Maintenance of hydraulic barriers, interception wells, and a detailed water balance scheme minimises infiltration and protects dam integrity. |
| November 2025 | ||
| Page |
| SRK Consulting (UK) Limited | Mineral Resources and Mineral Reserves, Collahuasi Copper Mine - Main Report |
| · | Water Quality Monitoring: Routine sampling and analysis of surface water, pore water, and groundwater, encompassing metals, anions, pH, conductivity, and dissolved solids. |
The TSF has two contour channels which collect and convey non-contact surface runoff from surrounding catchments and discharge it downstream of the main TSF dam wall. These have been designed to a 50-year return period (verified to 100-years).
The TSF water management system comprises a range of measures designed to control the supernatant lagoon, manage drainage within the dam wall, and intercept potential seepage from the base of the facility. The water recovery system for the lagoon relies on intake towers, with Tower N°5 currently in operation but due to be replaced with Tower N°6, currently under construction, in mid-2026. As the TSF develops, four additional towers (N°7, N°8, N°9, and N°10) will be constructed. The recovered water is pumped to a storage pond before being recirculated to the processing plant. The nominal flow rate from the water recovery system is 700 L/s with a design rate of 770 L/s.
A network of drains at the base of the TSF capture shallow seepage through the dam wall and recirculates it back to the process water circuit. Deeper seepage into groundwater is intercepted via a hydraulic barrier consisting of wells located both NE and south of the TSF, within the Michincha groundwater basin. The system has been designed to prevent potential water quality impacts on the Michincha and Coposa aquifers. The pumped water is recirculated back to the concentrator plant. Some infiltration interception wells will be covered as the tailings storage facility expands, requiring their relocation.
| 18.3.6 | Monitoring systems and performance assessment |
Operational safety is provided by a comprehensive monitoring network, supporting technical and regulatory requirements:
| · | Geotechnical Instrumentation: There are 26 piezometers deployed (20 standard, 6 vibrating wire), strategically located in the dam body and downstream to provide subsurface pore pressure and groundwater level information. These are fibre-optically linked for remote data access. Three accelerographs monitor seismic events: one on the dam foundation, one at the right abutment (Rock), and one within the embankment (although this will be submerged as the dam height increases and will be replaced). Topographic survey monuments (‘monolitos’) on the dam crest provide data for settlement, displacement and anomalous movement analysis after each stage of raising. |
| · | Hydrogeological Monitoring: Quarterly sampling programmes are in place for both surface water and groundwater, with specific attention to metals, pH, and electrical conductivity. The facility utilises an Early Warning Plan (PAT) and a hydraulic barrier system (well array) to monitor and manage seepage. There are currently 9 PAT wells pending construction to enhance surveillance capability. |
| · | Satellite Monitoring: Monthly satellite survey data tracks centimetre-scale deformations of the downstream slope and crest. |
| · | Physical Inspections: Instrument or satellite detection of anomalies triggers focused site inspections. |
| November 2025 | ||
| Page |
| SRK Consulting (UK) Limited | Mineral Resources and Mineral Reserves, Collahuasi Copper Mine - Main Report |
Recent regulatory and operational updates have been made to the PAT, now fully compliant with "Oficio DGA N°22/2024” and considered an integral part of RCA2021. The PAT Behaviour Deviation Analysis for the Pampa Pabellón TSF has specifically addressed infiltration risks by reviewing current monitoring outcomes and response protocols, helping to strengthen early detection and responsive management of seepage, infiltration, and possible contamination events. This underscores the facility’s ongoing commitment to adaptive hydrological control and regulatory compliance in the context of increased tailings volumes and evolving environmental drivers.
Based on the 2024 Dam Safety Review (DSR) report for Pampa Pabellón, no unexpected or concerning performance trends have been identified in the monitoring data (ARDUM Ingeniería, 2024).
| 18.3.7 | Dam breach assessment and consequence classification |
Numerical and iterative graphical methods were employed in the principal breach and runout studies (2018, updated 2020) for the 2040 permitted TSF. Scenarios included both normal and extreme rainfall events:
| · | Extreme Event (Overtopping): Numerical models indicate possible release of 58.8 Mm³ with a lateral runout of up to 7,900 m. |
| · | Operational/Local Failure: Potential released volumes between 6–12 Mm³ with lateral runout distances 745–2,725 m, contingent on slope and breach section. |
| · | Flow Behaviour: Experiments indicate a dominantly debris flow regime, influencing material deposition downstream. |
Recent reviews debate whether consequence classification should be “High” or “Extreme”. The most current Dam Safety Review (2023) accepts the “High” category, based on expected population at risk, environmental impact and loss of life; however, design standards meet requirements for ‘Extreme’ consequence under the GISTM.
Regular update of consequence classification and runout studies is advised as facility configuration and community occupancy change.
Note that no dam breach and runout studies have been completed for the expanded TSF project beyond the permitted 2040 design. Figure 18-5 shows the footprint of a hypothetical tailings runout.
| November 2025 | ||
| Page |
| SRK Consulting (UK) Limited | Mineral Resources and Mineral Reserves, Collahuasi Copper Mine - Main Report |
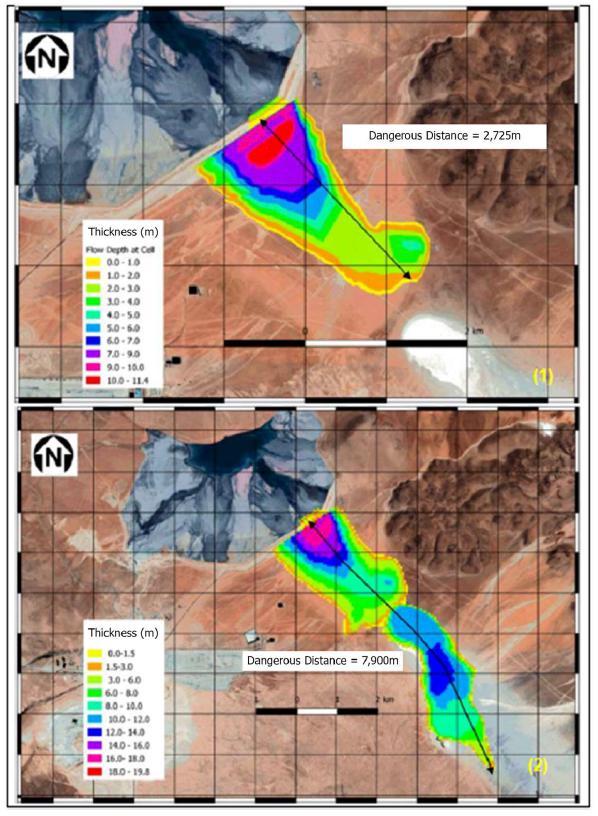
| Figure 18-5: | Footprint of hypothetical tailings runout in central section of TSF main wall; numerical model under normal condition (1) and extreme hydrological condition (2) (Wood, 2020) |
| 18.3.8 | Oversight, permitting and regulatory compliance |
TSF construction and operation follows all relevant Chilean laws:
| · | DS 248: Standards for design, construction, operation, and closure of TSF. |
| · | DS 50/DS 132: Technical requirements for hydraulic works and occupational safety. |
| · | DS 40 and Law 19.300: Environmental Impact Assessment and broad compliance. |
The TSF is in compliance with the permitting requirements:
| · | Environmental Qualification Resolutions (RCA): For main expansions (e.g., RCA Nº 20219900112, Dec 2021; RCA Nº 20230100119, Mar 2023). |
| · | Sectoral Permits: SERNAGEOMIN has issued permits for exploitation methodology changes, waste dump configuration, and plant upgrades (e.g., Exentas Nº 954, 1835, 1335, 2234/2022). |
| · | Closure Plan: Approved March 2023, supporting life expectancy through at least 2066. |
| November 2025 | ||
| Page |
| SRK Consulting (UK) Limited | Mineral Resources and Mineral Reserves, Collahuasi Copper Mine - Main Report |
The 2024 DSR report verifies that the permitted TSF structure is compliant with all required licences, permits, laws, and regulations, as evidenced by the documentation and approvals described in the report. It also sets recommendations for maintaining ongoing compliance as requirements evolve.
Governance approaches follow international best practice standards. TSF organisation includes defined roles for supervision, maintenance, surveillance, and emergency readiness, and all activity is executed according to an Operation, Maintenance and Surveillance Manual (OMS). Environmental monitoring (air, water, biota) is ongoing, with regular reporting to authorities and independent validation.
A significant aspect of past and ongoing environmental management at Pampa Pabellón has been the issue of grazing zones (highlighted green in Figure 18-6). The 2019 EIA identified "Modification of pastoral activity and related cultural practices due to the loss or reduction of grazing areas" (IMHOPCI-1) as a significant impact. This condition was integrated in the Indigenous Peoples Consultation Process (PCPI), engaging each affected group and defining appropriate compensation measures in agreement with stakeholders.
SRK notes that for any expansion cases considered past the permitted 2,329 Mt maximum storage capacity, embankment raises will impinge on these areas. For future TSF expansions, a new EIA will therefore be required. Appropriate mitigation measures and agreements must be established anew through the PCPI, ensuring culturally sensitive land use impacts continue to be acknowledged and addressed in accordance with both Chilean legislation and international good practice.
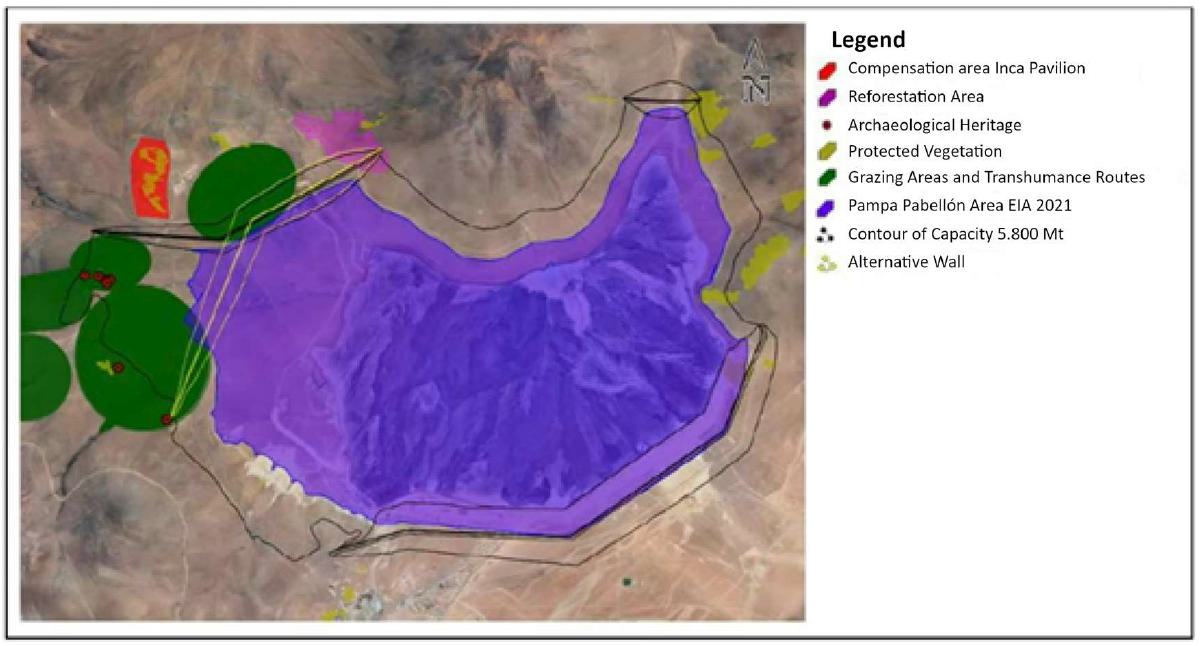
| Figure 18-6: | Expanded footprint of TSF for 5.7 Bt storage capacity including environmentally sensitive areas around and within footprint boundary (WSP, 2024) |
Integration with the GISTM is central to CMDIC's operational governance, embedded as an ongoing, cyclical improvement programme within the risk management cycle. Periodic gap analyses are undertaken: the Independent Technical Review Board (ITRB) audit in 2024, and an EoR gap analysis in 2025, both triggering defined action plans.
| November 2025 | ||
| Page |
| SRK Consulting (UK) Limited | Mineral Resources and Mineral Reserves, Collahuasi Copper Mine - Main Report |
The main current actions and progress include:
| · | Completion of tailings policy communication (Requirement 8.1) and facility disclosure (Requirement 15.1) by September 2025. |
| · | Revision of the EoR contract scopes to ensure full alignment with GISTM completed in July 2025. |
| · | Ongoing updates to Failure Modes and Effects Analysis (FMEA) due 2025, and As Low As Reasonably Practical(ALARP) analysis due 2026. |
Through the standard management system, compliance monitoring is continuous, and GISTM implementation is regularly reviewed within the tailored Tailings Management Plan and risk governance framework.
| 18.3.9 | Dam safety review (December 2023 / May 2024) |
The latest independent Dam Safety Review (DSR) for the permitted 2040 TSF was undertaken by ARDUM Ingeniería in 2024 who systematically assessed overtopping, slope/foundation instability, internal erosion (piping), and seepage/contamination failure modes. The main findings against each assessed risk/failure mode are listed below:
| · | Overtopping: Hydrological modelling, effective spillway and freeboard, and operational pond controls meet all standards. It is recommended to add climate change variables, document flood response procedures and regularly review hydraulic structure alignment with design. |
| · | Slope/Foundations: Static global factors of safety range 1.68–1.84; pseudo-static (seismic) FS range 1.25–1.43, all above regulatory minima. Localised downstream pseudo-static FS fall below guidance (1.01–1.14 vs 1.2 minimum) but pose no critical global risk. The DSR recommends extending piezometer coverage, improving instrumentation diversity, upgrading records for foundation remediation and escarpment works, and continual reanalysis of slope stability as designs evolve. |
| · | Internal Erosion/Piping: Filter and drainage system gradation and placement confirm compliance; routine inspections and QA/QC documentation should be maintained. |
| · | Seepage/Contamination: Hydrogeological models and interception wells are broadly effective, but explicit water quality monitoring is not comprehensive in all areas. Direct measurement and reporting of drainage/lagoon water quality should be enhanced; hydrogeological models updated. |
The review identified 20 findings split between Priority 3 “requires correction” and Priority 4 “industry best practice,” mainly affecting instrumentation, geotechnical documentation, consequence classification, emergency planning, operational manuals, volcanic risk, environmental monitoring, closure plan harmonisation, and governance.
| November 2025 | ||
| Page |
| SRK Consulting (UK) Limited | Mineral Resources and Mineral Reserves, Collahuasi Copper Mine - Main Report |
| 18.3.10 | Expansion options assessment |
The expansion of the tailings facility beyond 2041 has been considered as part of the ACP Growth Phase which considers both the total tonnes of tailings produced equivalent to the LoM and expanded production rate to 370 ktpd (mill feed).
A 2024 trade-off study (WSP, FEL2A) determined the optimal technical, economic and environmental solution for expanding tailings storage capacity beyond the current permitted period (2041). The study considered the following:
| · | Of the four candidate sites screened; only the existing Pampa Pabellón was deemed viable, others being eliminated due to intolerable social/environmental impact. |
| · | The study focused upon volumetric modelling of tailings beaching and embankment construction, with trade-offs of different wall raising strategies and different tailings delivery options (Figure 18-7 shows the footprint and layout). The study did not include any additional ground investigation, laboratory testing, slope performance/stability analysis, water balance, dam breach/runout assessments, and no detailed updated environmental impact assessments (all are however noted to be required in future study). |
| · | The concept followed a modified downstream dam methodology inclusive of steeper inclination upstream slope allowing for a balance between optimisation of engineering fill quantity/cost and slope-safety/reduced-footprint. This provides for a main embankment height of 200 m, crest width 80 m, and fill requirements of 355 Mm³ (vs 500 Mm³ under traditional downstream raise method), with sufficient available waste rock sourced from the Ujina WRD (estimated 620–700 Mm³, even with 20–30% rejection rate). |
| · | Auxiliary embankment Material: 84 Mm³ (NW wall) and 18 Mm³ (NE wall) borrow required; nearby sources provide only 50 Mm³, remainder to be met by excess waste rock or future borrow sites. |
| · | Auxiliary Embankment Material: 84 Mm³ (NW wall) and 18 Mm³ (NE wall) borrow required; nearby sources provide only 50 Mm³, remainder to be met by excess waste rock or future borrow sites. |
| · | Gravity pipelines from Rosario and Ujina, with repositioned NW wall minimising sensitive area impact. Fewer pumps and shorter pipelines intended to reduce operational and capital costs. |
| · | Level of engineering design equivalent to a scoping/PFS stated to a ‘Class 4 cost estimate, offering an accuracy range of -15% to +25%’. |
| · | Estimated capital expenditures for TSF expansion of USD362.9m (2029–2031), with deferred capital investments of USD1.8 billion (for incremental wall raising), and an overall cost of approximately USD0.4/t of tailings stored. The estimated costs assume that the key capital-cost-component of sourcing, selecting, hauling and placing suitable material for wall raising from mine waste is undertaken by the mine fleet rather than by a contractor fleet for which costs would be expected to be significantly higher than those estimated in this case. |
| November 2025 | ||
| Page |
| SRK Consulting (UK) Limited | Mineral Resources and Mineral Reserves, Collahuasi Copper Mine - Main Report |
| · | In response to the expansion, the average hauling distances required for material transport will increase in comparison to the 2025 scenario. This is primarily a result of greater growth rates and the increasing distance to the auxiliary embankments, both of which contribute to higher transportation costs. The cost estimates are therefore directly influenced by these anticipated logistics challenges. |
| · | Recommendations from the study include ongoing geotechnical/fill data update, advanced engineering (FEL2B), careful environmental/community oversight and flexible, staged expansion planning which should be implemented and followed. |
The expanded TSF design is considered broadly reasonable in light of the current study level. Highlighted areas which require addressing are: coverage of ground investigations to include the expanded TSF footprint; updated slope stability analyses to validate and optimise the design slopes; updated water balance to validate and optimise the contact and non-contact water and seepage management infrastructure; updated inundation maps from dam breach and runout assessments; and, updated environmental impact assessment to incorporate environmental and social impacts. The WSP 2024 study does acknowledge these areas will require focus in future studies.
SRK notes that that even without the ACP Growth phase project being implemented, the TSF will still require expansion (with associated engineering studies, validation analyses and updated permits) to continue to support the Mineral Reserves case.
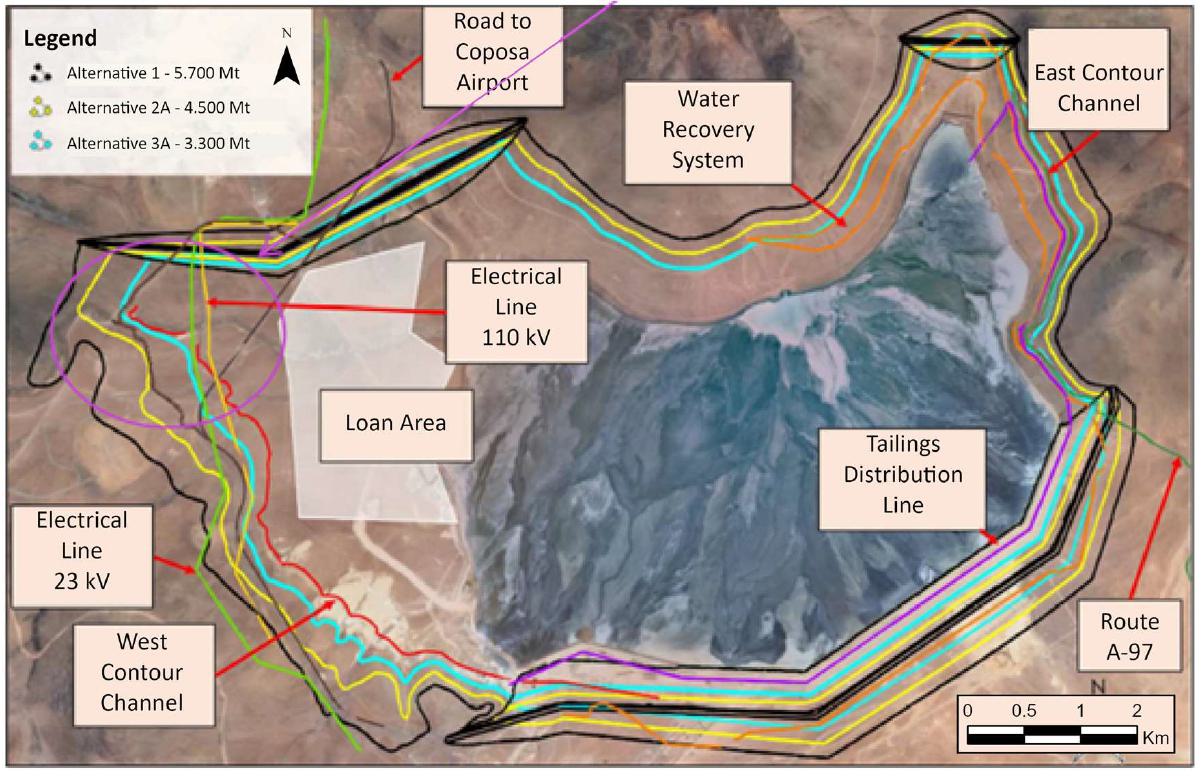
Figure 18-7: Expanded footprint of TSF for 5.7 Bt storage capacity (black outline) (WSP, 2024)
| November 2025 | ||
| Page |
| SRK Consulting (UK) Limited | Mineral Resources and Mineral Reserves, Collahuasi Copper Mine - Main Report |
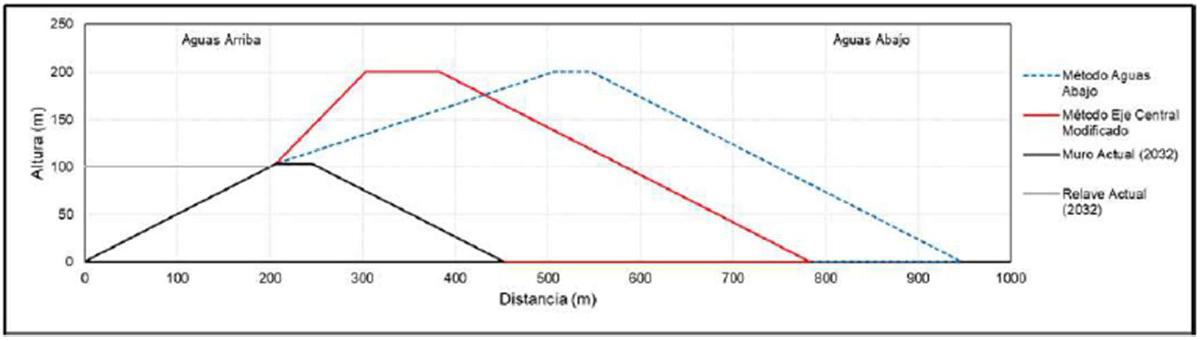
| Figure 18-8: | Schematic section showing TSF expansion by conventional downstream raising (blue) or by modified downstream raising (red) (WSP, 2024) |
| 18.4 | Water Supply |
| 18.4.1 | Water balance |
A GoldSim water balance model has been developed and refined for the Collahuasi operations to simulate the behaviour of the water circuit under varying climatic and operational conditions (Asesorías en Recursos Hídricos, 2025). The GoldSim model is a critical operational tool for water resource planning, enabling CMDIC to manage supply-demand dynamics, optimize infrastructure use, and ensure compliance with environmental obligations.
The model incorporates measured data, probabilistic climate inputs, mine plan, and operational constraints to project water availability, demand, and system performance. It simulates daily water flows across the system, from fresh water sources (Coposa and Michincha wellfields, dewatering from pits, desalinated water, and additional sources) to the TSF, and back to the concentrator via recirculation. The TSF is modelled in detail, accounting for retention, infiltration, and evaporation losses, with calibration against measured lagoon volumes.
Climate change has been integrated into the mine water balance showing a progressive reduction in water return from the TSF due to increased evaporation and slightly lower annual rainfall, which requires a corresponding increase in freshwater demand to meet process requirements.
| 18.4.2 | Water demand |
The 2025 GoldSim water balance model makes predictions of projected net water demand over various mine planning scenarios, summarised in Table 18-1.
| Table 18-1: | Predicted make-up water demand (L/s) according to GoldSim water balance, excluding recirculation from TSF and capture wells (Source: Asesorías en Recursos Hídricos, 2025) |
| Scenario |
Highest P50 annual demand (L/s, +/- 50 L/s) |
Specific water usage (m3/t) |
| 185 ktpd | 1,000 | 0.41-0.45 |
| 210 ktpd | 1,250 | 0.40-0.44 |
| ACP Growth Phase 370 ktpd | 1,750 | 0.37-0.40 |
| November 2025 | ||
| Page |
| SRK Consulting (UK) Limited | Mineral Resources and Mineral Reserves, Collahuasi Copper Mine - Main Report |
The model shows that water demand increases with production, while recirculation from the TSF decreases over time due to rising losses (evaporation and seepage) as the facility grows in size. The make-up water requirement, calculated dynamically as a function of processed tonnage and available recirculation, ranges from 0.40 to 0.45 m³/t for the 185 and 210 ktpd, scenarios, with higher values in later years due to increased evaporation and infiltration. The specific water usage is lower with increased production; for example, the ACP Growth Phase 370 ktpd, as higher production leads to proportionally more water recovery from the TSF and less fresh water required per ton of ore processed.
Plant demand represents around 90% of the total water demand in 2025, reducing to around 86% in 2026 with water efficiency and recapture initiatives being implemented (see Section 18.4.5). Mine water use such as dust suppression and vehicle washing (4-5%), potable water supply (1%) and environmental flow augmentation (5-9%) make up the remainder of the water usage requirements.
The model predicts the requirements for various sources of water for each of the production scenarios. Results from the model have supported the definition of the C20+ desalination project, a series of water supply infrastructure projects which are required to the reduce reliance on groundwater and to support the planned increased production rates (described in Section 18.4.4).
| 18.4.3 | Groundwater supply |
Until recently, the majority of mine water demand was sourced from groundwater in wellfields in the Coposa and Michincha basins in addition to pit dewatering activities, and a hydraulic barrier (capture wells) at the tailings storage facility. Groundwater is currently abstracted from wellfields in the Coposa and Michincha Basins at a rate of 632 L/s (projected 2025) which represents over 50% of the current total water demand.
Multiple PAT and mitigation measures are in place to protect aquifers and surface water features (as described in 20.3.2). Any activation of these plans can trigger immediate reductions in wellfield extraction.
Groundwater levels are declining in many key aquifers across the region and water stress increasing, consequently, legislative changes have been implemented declaring that continental water use must not exceed 10% of total mining water consumption by 2025 and should be reduced to 5% by 2040. Table 18-2 shows the licensed abstraction volumes for each of the current groundwater supply sources, which decrease progressively through 2041 from a total licensed abstraction volume of 1078 L/s currently to 403 L/s by 2039. The volumes in Table 18-2include an additional 245 L/s of Coposa extraction rights granted for a 15-month extension from January 2025 through to Q1 2026, under DIA2 (‘Adecuación Cronograma y Obras Collahuasi’). The DIA2 was approved on 2 August 2024 to address a 19-month delay in the commissioning of the C20+ desalination project, which created a projected water supply deficit of over 380 L/s. CMDIC will be reliant on the C20+ project to reduce use of continental water sources as well as to support increasing water demand associated with increased production scenarios.
| November 2025 | ||
| Page |
| SRK Consulting (UK) Limited | Mineral Resources and Mineral Reserves, Collahuasi Copper Mine - Main Report |
Table 18-2: Licensed abstractions from key water supply sources in L/s (CMDIC Lombook, 2024)
| Source | 2022-2024 | 2025-Q1 2026 |
Q2
2026- 2028 |
2029- 2038 |
2039- 2041 |
| Coposa basin water supply wells | 780 | 685 | 337 | 280 | 80 |
| Michincha basin water supply wells | 230 | 80 | 80 | 32.8 | 32.8 |
| Michicnha Hydraulic Barrier | 130 | 130 | 130 | 130 | 130 |
| Rosario pit dewatering | 214 | 183 | 183 | 160 | 160 |
| TOTAL | 1354 | 1078 | 730 | 603 | 403 |
| 18.4.4 | C20+ Project |
CMDIC is in the process of executing the C20+ desalination project, which pumps desalinated water from the Punta Patache Port, via a newly constructed pipeline.
The C20+ project is central to the long-term water supply strategy. Designed with an initial nominal capacity of 1,050 L/s, the desalination system comprises a seawater intake and sump (sentina), an ultrafiltration plant, five reverse osmosis modules and a 193 km pipeline with five pumping stations to deliver water to the mine. Integration of the C20+ project into the water balance began with using a third-party (ENEL) intake to supply the ultrafiltration plant which was commissioned and started sending water to site in July 2025, ahead of schedule. Marine weather conditions have slightly delayed the commissioning of the seawater intake which is expected to come online by the end of 2025. The first two racks of the RO plant are expected to be commissioned by February 2025, with final full operation of the system at a capacity of 1,050 L/s by June 2026. The total projected capital cost of the project is in the order of USD3.5B, with around USD0.5B remaining and a 95.7% total project completion as of August 2025 (USD772m forecast remaining spend in the Financial Model from the beginning of 2025).
| 18.4.5 | Water supply up to 210 ktpd |
A breakdown of how the current projected water demand for the expansion in production rate to meet the 210 ktpd scenario is shown in Table 18-3.
| Table 18-3: | Predicted water demand and supply capacity aligned to the 210ktpd production scenario (adapted from CMDIC Lombook, 2024) |
| Year | 2025 | 2026 | 2027 | 2028 | 2029 | 2030 | 2031 | 2032 | 2033 | 2034 |
| Predicted Demand | 1,132 | 1,062 | 1,114 | 1,219 | 1,224 | 1,234 | 1,233 | 1,244 | 1,243 | 1,255 |
| Predicted Supply Capacity | 1,132 | 1,390 | 1,612 | 1,584 | 1,522 | 1,495 | 1,495 | 1,495 | 1,495 | 1,495 |
| 1. Basin Wells | 632 | 483 | 397 | 397 | 340 | 313 | 313 | 313 | 313 | 313 |
| Coposa | 572 | 423 | 337 | 337 | 280 | 280 | 280 | 280 | 280 | 280 |
| Michincha | 60 | 60 | 60 | 60 | 60 | 33 | 33 | 33 | 33 | 33 |
| 2. Pit Dewatering | 160 | 180 | 173 | 145 | 140 | 140 | 140 | 140 | 140 | 140 |
| 3. QB Water | 87 | - | - | - | - | - | - | - | - | - |
| 4. UF Water | 243 | 291 | - | - | - | - | - | - | - | - |
| 5. TSF Management | 10 | - | - | - | - | - | - | - | - | - |
| 6. C20+ Project | - | 437 | 1,042 | 1,042 | 1,042 | 1,042 | 1,042 | 1,042 | 1,042 | 1,042 |
| Balance | - | 328 | 498 | 365 | 298 | 260 | 262 | 251 | 252 | 240 |
| Margin (%) | 0% | 31% | 45% | 30% | 24% | 21% | 21% | 20% | 20% | 19% |
| November 2025 | ||
| Page |
| SRK Consulting (UK) Limited | Mineral Resources and Mineral Reserves, Collahuasi Copper Mine - Main Report |
The current mine site water demand is sourced from a combination of the following, in order of relative contribution:
| · | Groundwater abstraction from the Coposa and Michincha basins at over 600 L/s and supplying more than 50% of the current demand. As described in Section 18.4.3, this will have to reduce from Q2 2026 onwards. Current plans are for 21% of water to come from continental sources to at least 2034, with Phase 1 of the C20+ project in place. |
| · | Ultrafiltered (UF) seawater conveyed to site via the C20+ pipeline. The C20+ UF plant is currently delivering at a monthly average flow of 246 L/s. This will transition to desalinated water as the C20+ desalination plant comes online in mid-2026. |
| · | Desalinated water delivered from the neighbouring Quebrada Blanca via pipeline. This was initially trucked at approximately 40 L/s but is now delivered through a newly commission pipeline at up to 120 L/s. This source is not anticipated to be required once the C20+ is fully commissioned but may serve as a back-up for additional capacity. |
| · | Pit dewatering water, at a projected average rate for 2025 of 160 L/s. This is predicted to rise to between 199 and 266 L/s by 2029 (see Section 16.1) but has been conservatively estimated in the LoM water balance at 140 L/s from 2029. |
An additional 10 L/s is expected to be made available through the implementation of a number of water recovery measures including capital projects to upgrade water intake tower 6 (USD36m) and improvements to the drainage and water recovery systems. Some of these projects have been delayed, although the bringing on the UF water to site early has delayed the need for some of them from a water supply perspective.
The desalination plant is currently under construction and on track to start providing desalinated water (via reverse osmosis) from June 2026. The initial design will have a maximum capacity of 1,050 L/s to provide approximately 70% of the projected mine water demand for the 210 ktpd case, reducing the contribution from continental water from 56% to 21%. From June 2026 onward, desalinated water becomes the dominant source of fresh water, replacing continental sources and supporting increased production while maintaining environmental commitments. Until then, the water supply system operates with minimal redundancy (see margin %, Table 18-3), with potential for short-term water deficits if any source underperforms, infrastructure commissioning is delayed, or if any regulatory triggers (PAT) require curtailment. Once the C20+ project is fully commissioned, there is more redundancy in the total water supply capacity of the system (>20% margin between supply capacity and demand from 2026 onwards) and the net water demand after desalination and pit dewatering reduces to 73 L/s.
| 18.4.6 | Expansion scenarios beyond 210 ktpd |
CMDIC has the option to expand the capacity of the C20+ project infrastructure to 2,200 L/s by installing and commissioning additional reverse osmosis modules (racks) and pumping stations. The system can therefore accommodate further production increases (e.g., ACP Growth Phase at 370 ktpd), subject to additional environmental permitting. This would support expansion beyond 210 ktpd or if further reductions in continental water usage are required.
| November 2025 | ||
| Page |
| SRK Consulting (UK) Limited | Mineral Resources and Mineral Reserves, Collahuasi Copper Mine - Main Report |
For expansions beyond 210 ktpd, total water demand could reach up to 1,750 L/s for the 370 ktpd scenario. Assuming the abstraction of continental water could continue beyond 2034, desalination demand would increase up to 1,600 L/s. For this demand, the desalination plant would require an additional four modules, however the pipeline is already sized for up to 2,200 L/s.
The main water supply sources through the life of the mine and for various production and potential scenarios are summarized in Table 18-4.
Table 18-4: Summary of main water supply sources for key mine plan scenarios
| Period/Scenario | Maximum Demand L/s | Main Sources | Notes/Transition Points |
|
2025–2026 (185–210 ktpd) |
1,062 |
Coposa, C20+ UF, dewatering, QB pipeline |
Coposa extension (DIA2) enables continued groundwater abstraction to Q2 2026; reduced capacity oversupply margin |
|
2026–2029 (210 ktpd) |
1,224 |
Coposa, C20+ UF transitioning to desalination |
Desalination becomes primary source; improved oversupply capacity |
|
2030–2041 (210 ktpd) |
1,255 | C20+ desalination, Coposa | Further reductions in continental water |
|
Potential Expansion 370 ktpd (ACP Growth Phase) |
1,750 | C20+ desalination (expanded) | Additional RO modules, pipeline capacity in place. (water pipeline sized to 390ktpd) |
| 18.5 | Surface Water Management |
Although precipitation is limited at the mine site, occasional intense rainfall events can generate significant runoff, posing risks of erosion, sediment transport, and operational disruption.
The primary objectives of surface water management are:
| · | Divert runoff around active mining areas, WRD, concentrator plant, leach pads, TSF and other mine facilities, separating non-contact water from contact water. |
| · | Minimise erosion and sedimentation impacts. |
| · | Protect water quality in downstream environments. |
| · | Ensure compliance with regulatory requirements. |
Surface water management is achieved through a combination of engineered structures and operational practices. Berms are constructed around pit perimeters and along haul roads to intercept and redirect surface runoff away from active mining areas. Diversion channels are used to channel clean water away from the TSF, WRD, leach pads and concentrator plant, and to convey water to sediment control basins where water quality can be checked and managed prior to downstream discharge.
Non-contact water management infrastructure diverts runoff around the Rosario WRD back into the Huinquintipa and San Daniel streams, downstream. Two lined ponds have been installed downstream of the WRD, designed to intercept runoff and seepage from the WRD. Parameters such as electrical conductivity, iron, sulfates, zinc, arsenic, and pH among others, are monitored at the ponds to ensure they remain within the range of agreed baseline water quality values. If the water meets the required quality, it is discharged into the Huinquintipa and San Daniel streams, downstream. If not, the water is replaced with water with an equivalent water quality to the streams at the same diverted flow rate.
| November 2025 | ||
| Page |
| SRK Consulting (UK) Limited | Mineral Resources and Mineral Reserves, Collahuasi Copper Mine - Main Report |
Diversion of non-contact water around the TSF comprises two large diversion channels, the west and east channels, as described in Section 18.3.5, which both discharge into two large sedimentation ponds.
Precipitation falling on leach piles is recirculated back into the process water circuit via lined channels. The pads themselves are isolated from non-contact runoff by a series of berms and diversion channels, designed to handle a 100-year precipitation event. During heavy rainfall events that generate flows exceeding the capacity of the process ponds, two HDPE-lined diversion channels are used to direct water to a 500,000 m³ emergency stormwater pond. From there, the water is either evaporated or recirculated back into the process. In the Represa and Jachu-Ujina streams, existing culverts and berms allow road crossings and protect mine infrastructure. The streams ultimately discharge into the Michincha Salar.
For the plant and camp areas, ditches and berms manage runoff and protect key infrastructure such as the plant, conveyors, crushers and the camp itself.
| 18.6 | Power Supply |
Chile has well developed power supply infrastructure, regulatory and operating systems. CMDIC is connected to the national electric system grid (SEN). Power demand is currently understood to be in the order of 200-210 MW peak demand, with between 1,500,000-1,600,000 MWh of annual energy consumption (approximately 125,000 MWh per month in 2025). Currently, more than 98% of this requirement corresponds to work in the mountain range sector (‘Faena Cordillera’, mine and processing facility) and the rest to work in the Patache port facility (‘Faena Puerto’). The major projects (C20+ pipeline, and PG210) will increase power demand and a summary of the estimated power demand and consumption is provided in Table 18-5 by annual period.
Table 18-5: Estimated increase in power demand (Port and Mine)
|
Case (Mine, Plant and Port ± C20 pipeline) |
Estimated Power Demand peak (MW) | Estimated Power Consumption (MWh) |
| Year 2023 | 190 | 1,370,000 |
| 170 tpd 2024 | 190 | 1,499,000 |
| 170 tpd (5th Ball Mill and PG1) | 207 | 1,620,000 |
| PG210 185 tpd (Forecast) | 215 | 1,689,000 |
| PG210 185 tpd + C20; 800 L/s (Forecast) | 288 | 2,258,000 |
| PG210 210 tpd + C20; 800 L/s (Forecast) | 313 | 2,465,000 |
| PG210 210 tpd + C20; 1,100 L/s (Forecast) | 338 | 2,665,000 |
Power demand at the port increases only slightly as a result of the PG210 project (5 MW to 8 MW total). This is because the majority of the PG210 project electrical loads are located at mine. The major electrical load increase at the port relates to the C20+ pipeline project which includes its own grid connection.
The mine and plant site are connected to the SEN through two double circuit 220 kV transmission lines with a maximum carrying capacity of approximately 521 MW consisting of:
| · | A 220 kV connection from the Substation Lagunas via a double circuit transmission line with 218 MW total capacity at Collahuasi; and |
| · | A 220 kV connection from the Substation Encuentro via double circuit transmission line with 303 MW capacity at Collahuasi. |
| November 2025 | ||
| Page |
| SRK Consulting (UK) Limited | Mineral Resources and Mineral Reserves, Collahuasi Copper Mine - Main Report |
This configuration allows CMDIC to maintain continuity of power supply in the event of a foreseen maintenance or unplanned failure from the SEN on either line. CMDIC also has a 35 MW back-up thermal power plant (critical loads) at the site if necessary. CMDIC owns and maintains the 220 kV supply infrastructure from the connecting substation to the mine.
The port is connected to the Substation Tarapacá owned by Transelec S.A. The C20+ project has its own power supply system incorporating a dedicated 220 kV grid transmission line to a new substation and switchyard adjacent to the desalination plant and pumping station #1. The remaining pumping stations are understood to be connected to the 220 kV electrical system network around the Laguna substation.
The two existing transmission lines are understood to have sufficient capacity for the 210 ktpd once proposed modification works are made to the transmission lines owned by CMDIC (incorporating in the capital and sustaining capital projects). The modifications encompass re-tensioning of sections of the transmission line conductors, additional of a sixth substation at Collahuasi, and other upgrades.
In Chile, the power generation mix is understood to be around 32% fossil fuels and 68% renewables and low carbon generation; however, the regulatory system allows Companies to purchase renewable energy via physical Power Purchase Agreements (PPA) from external producers. This is where physical energy is wheeled via the SEN, and facilities the receipt of renewable energy certificates (REC).
CMDIC is understood to have procured 100% renewable energy via these PPA which are a mix of mix of wind, solar, and hydroelectric energy. Around 50% of the PPA are indicated to expire by 2030 with the remainder to expire by 2035 and thus will need renegotiation and must incorporate the additional load and consumption from the executed major projects.
Existing infrastructure has sufficient capacity for the 210 ktpd case; however, resilience may be marginally downgraded with load support from the back-up power station (or load reduction) may be needed in the event that both connections to Substation Encuentro were temporarily down. The C20+ pipeline project power connections are understood to be in place and have been energised.
The estimated loads do not include for any fleet electrification or allowance for trolley assist infrastructure. Electrical infrastructure upgrades would be required to support these initiatives, or the current supply redundancy would be downgraded.
| 18.7 | Site Infrastructure |
The operation has a network of facilities designed to ensure the well-being, safety and operational continuity of the people who work at the site.
As an operating mine, all required support infrastructure and services are in place to support mining and processing operations including but not limited to the following:
| · | Administration. |
| · | Warehousing and storage. |
| · | Fuel supply and storage. |
| · | Mining equipment workshops, wheel change, vehicle washing, parking. |
| November 2025 | ||
| Page |
| SRK Consulting (UK) Limited | Mineral Resources and Mineral Reserves, Collahuasi Copper Mine - Main Report |
| · | Waste management facilities. |
| · | Camp Facilities: two main camps are maintained: Coposa Camp, for CMDIC personnel, and Pioneros Camp, for collaborating companies and contractors. Both have accommodation, recreation, connectivity and well-being services, as well as environmental and energy management systems that optimise the use of resources at height. |
| · | Welfare facilities (including four clinics that provide preventive and emergency medical care). |
| · | Internal roads and haul roads. |
| · | Electrical (23 kV) distribution, communications and water reticulation systems. |
| · | Back-up power station. |
Upgrades required for the 210 ktpd project have been identified under the FEL3 study such as access roads, electrical distribution, and other services.
| 18.8 | Concentrate Logistics |
Concentrate is pumped from the Ujina processing facility via two pipelines to the CMDIC wholly owned port facility at Punta Patache where the concentrate is further treated via a molybdenum plant, after which both concentrates are filtered and stored prior to export by ocean going vessel or by truck.
The proposed concentrate production profile (in 5-year increments) is shown in Figure 18-9. On a monthly basis, proposed export volumes do not exceed the maximum monthly volumes exported in the prior 4 years (2020-2024).
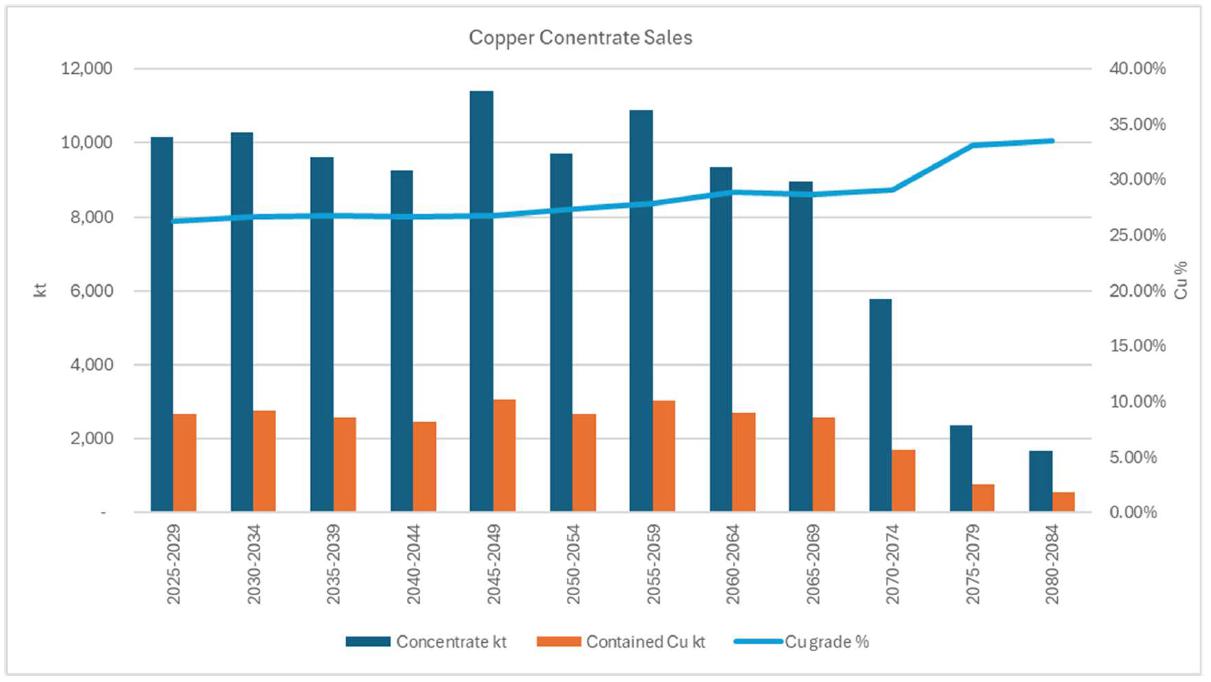
Figure 18-9: Copper concentrate export (dmt)
The concentrate pipeline system comprises two slurry pipelines (an 8” pipeline and 7” pipeline). Slurry concentrations vary between 60 and 65% solids with operational pressures closely monitored to ensure they are within range and to prevent suboptimal conditions (e.g. slack flow conditions). The operation of the pipelines is managed from a central Control Room and utilizes a SCADA system.
| November 2025 | ||
| Page |
| SRK Consulting (UK) Limited | Mineral Resources and Mineral Reserves, Collahuasi Copper Mine - Main Report |
The concentrate is stored in three tanks, which are discharged to the preload pumps. These pumps provide the pressure needed to propel the slurry inshore, passing it through filters for the proper operation of positive displacement pumps.
The 8” pipeline has a length of 193 km and has five valve stations, four of which have fixed and variable dissipation. In addition, it has three pressure monitoring stations designed to verify the pressure status of the slurry at high points.
The 7” pipeline has a length of approximately 200 km and has five valve stations, three of which have fixed and variable dissipation. In addition, the pipeline has two pressure monitoring stations to verify the pressure status of the slurry at high points.
CMDIC has an asset management system for each pipeline including an integrity and maintenance strategy.
The CDMDIC Port is the end point of the operation's production and logistics system.
The port includes two stockpiles for Copper Concentrate storage (55,000 t and 110,000 t), as well as covered storage for bagged molybdenum concentrate.
An emergency pond for the molybdenum processing plant is located at the port. Additionally, five evaporation ponds are situated approximately 5 km NE of Patache Port, with a combined capacity of around 2.2 Mm³ (based on information gathered during the site visit). These evaporation ponds serve multiple purposes, including the storage and evaporation of the process water from the thickeners and filtration process of the concentrate.
The berth supporting the 900 tph shiploader, configured to ensure logistical efficiency and operational continuity. A schematic flow sheet for the thickening, filtering and export of copper concentrate is presented in Figure 18-10 and a view of the berth and shiploader in Figure 18-11.
| November 2025 | ||
| Page |
| SRK Consulting (UK) Limited | Mineral Resources and Mineral Reserves, Collahuasi Copper Mine - Main Report |
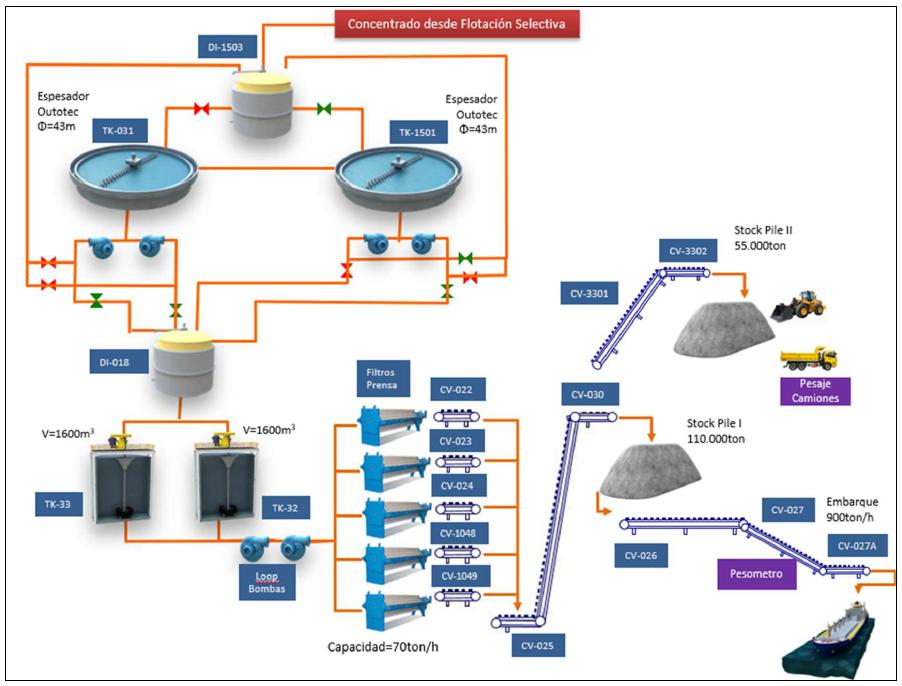
Figure 18-10: Port schematic flow sheet (CDMIC, 2025)
The port has real-time environmental monitoring systems, dust emission control and maritime safety protocols, which guarantee a safe, clean shipment and in compliance with international regulations.
The port facility has a draft of 16.5 m. Copper concentrates are typically exported in shipment sizes of 60,000 wmt. Concentrates can also be loaded to trucks for export by road.
SRK understands that as part of the 210 ktpd FEL3 study, CMDIC commissioned independent technical reports on the pipeline and port which confirm existing infrastructure is able to cope with the required concentrate tonnages, provided current inspection and maintenance strategies are continued.
| November 2025 | ||
| Page |
| SRK Consulting (UK) Limited | Mineral Resources and Mineral Reserves, Collahuasi Copper Mine - Main Report |
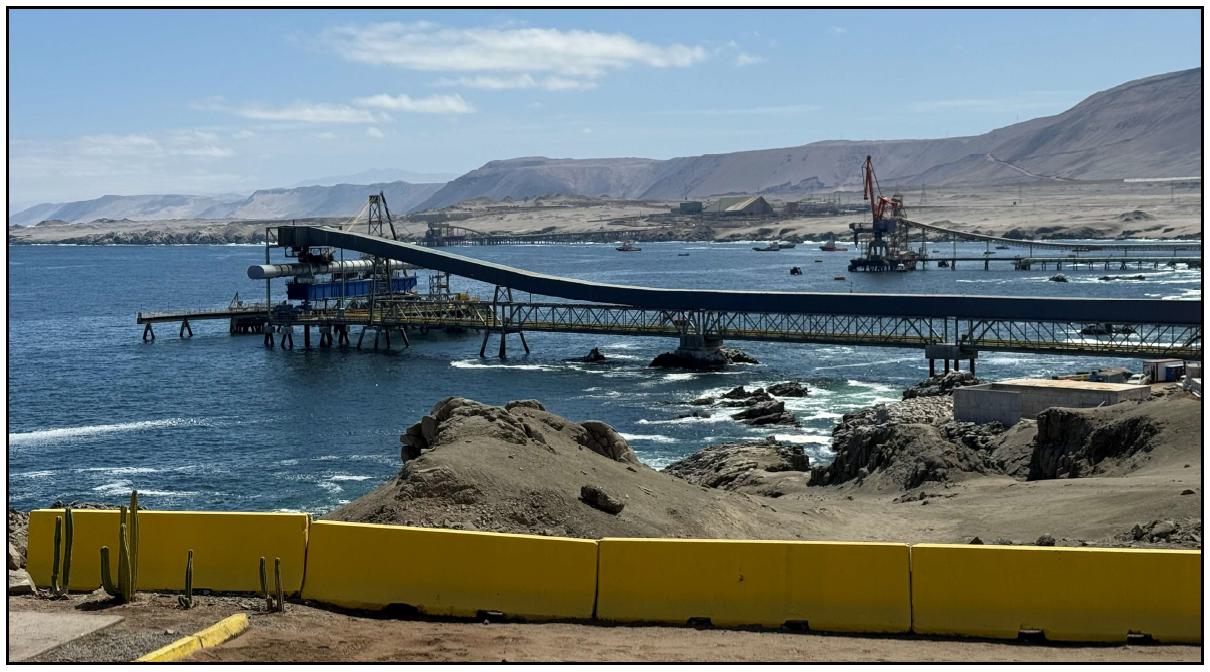
Figure 18-11: View of berth and shiploader (2025)
| 18.9 | Construction Projects – Capex / Progress |
| 18.9.1 | Overview |
The following capital projects are underway or being planned by CMDIC:
| · | C20+ Project: Construction of desalination plant and marine works, coupled with water pipeline to transport water supply to the mine site from Punta Patache. |
| · | PG3A: Relocating a refurbished and upgraded Primary Crusher #3 to Rosario pit to achieve 185 ktpd (in latter stages of execution). |
| · | PG210 Package (‘Project Balance’): A large package of works across the processing plants and port facility to achieve 210 ktpd Project incorporating packages PG2 (molybdenum plant upgrade) and PG3B works. |
Project PG1 (Installation of 6 Rougher cells) is understood to have been completed to achieve 170 ktpd. The Ujina growth phase projects are in study phase and are not required to meet the 210 ktpd milling rate; however, the study costs are allowed for in the CAPEX. Further detail on the current status and forecast of the three major and on-going capital construction projects is provided below.
| 18.9.2 | C20+ Project: desalination and pipeline |
The objective and description of the C20+ Project is presented in Section 18.4. The complete C20+ project is due to be completed and commissioning in 2026 and is divided into two major packages: 1) Desalination plant and marine works (Intake System and Sentina), 2) the conveyance pipeline.
The pipeline and electrical works are due to be commissioned ahead of the desalination plant and marine works (December 2025). As of August 2025, actual overall project progress was 96.4% versus planned 95.7%. The pipeline is on track against current schedule with pipeline and pump-station commissioning on-going using filtered water extracted via the ENEL water intake adjacent to, and piped into the Collahuasi facilities.
| November 2025 | ||
| Page |
| SRK Consulting (UK) Limited | Mineral Resources and Mineral Reserves, Collahuasi Copper Mine - Main Report |
Construction of the desalination plant and marine works are understood to be well advanced although the intake structure (79.3% versus 86.2% planned) and reverse osmosis plant (65.0% versus 68.0% planned) components are tracking behind schedule, although the reverse osmosis plant is stated to be in line with a schedule recovery plan. The intake structure delay is reported to be due to adverse maritime conditions impacting construction works. The marine works component is still scheduled for completion by December 2025 (reflecting an overrun in the order of a few months) and the desalination plant by end Q1 with overall C20+ project hot commissioning to be completed by end Q2 2026. According to the latest construction reports, the project is on-budget.
The operational readiness programme is underway with the agreement on operational and maintenance procedures well advanced and training underway for all areas. The pipeline itself is being hot commissioned with water sourced from the adjacent ENEL intake. There is a target of 1.2 Mm3 delivered to site by the end of Q4 2025 and the project is understood to be on track for achieving this target.
| 18.9.3 | Capacity 185 ktpd (Project No. P333 / PG3A) |
The PG3A Project is the interim package of the Ujina Growth Project to reach the annual average daily treatment capacity of 185 ktpd (mill feed), building on the base-case capacity of 170 ktpd.
This package involves the upgrading and relocation of Primary Crusher #3 into the Rosario open pit operation along with a new belt system (overall system design capacity of 8,205 tph) to increase the feed of coarse ore to the Ujina Concentrator Plant, thus enabling the increase in processing to 185 ktpd. The new belt system feeds on to the existing overland belt system from Primary Crusher #4 (115-CV-206). In addition, all the infrastructure, services and auxiliary equipment necessary for the implementation of the Project are included as part of the scope.
Current progress metrics are presented in Table 18-6. The project remains on schedule for commissioning in June 2026. The most recent monthly report indicates some delays in the spend schedule which requires mitigation. The project has a schedule contingency of 3 months (to end Q3 2026).
Table 18-6: Project No. P333 / PG3A Project Progress to the end of August 2025 (August Monthly Exhibit, 2025)
| Item | Progress Actual | Progress
Planned |
Budget | Committed |
| % | % | USDm | USDm | |
| Engineering | 98.9 | 100.0 | 26.3 | 26.3 |
| Procurement | 99.8 | 100.0 | 79.7 | 62.3 |
| Construction | 45.6 | 45.8 | 136.7 | 87.9 |
| Pre-Com/Commissioning | 0.0 | 0.0 | 1.7 | 0.0 |
| Owner + Contingency | n/a | n/a | 35.5 | 14.7 |
| Overall Project | 52.4 | 52.5 | 279.9 | 191.1 |
| 18.9.4 | Capacity 210 ktpd (Project No. PG210) |
PG210 Package (‘Project Balance’) is the last package of the 210 ktpd project to reach the annual average daily treatment capacity of 210 ktpd. It includes works at the Collahuasi mine and the port facility as per the following:
| November 2025 | ||
| Page |
| SRK Consulting (UK) Limited | Mineral Resources and Mineral Reserves, Collahuasi Copper Mine - Main Report |
| · | Upgrading for existing conveyor belts 115-CV-206/207/203 and related bins, chutes to cope with the material arriving from Primary Crusher #3. Modifications in the processing plant: third pebble washing screen, additional row of six rougher cells, along with upgrades in the lime plant, reagents area, and water supply and distribution systems. |
| · | Modifications to the capacity of the existing No. 2 concentrate stockpile building at the port, increasing capacity by 30,000 tonnes, along with the extension of the existing feed and recovery belts. |
A new Molybdenum Plant with a treatment capacity of 2100 tpd of collective concentrate is included in the FEL3 study; however, it is understood this aspect of the project has been deferred.
Current progress metrics are presented in Table 18-7. At this early phase consisting primarily of engineering and procurement, the project is projecting that it is slightly ahead of schedule. The project is due to complete in Q4, 2027.
Table 18-7: Project No. PG210 Balance Project Progress to the end of August 2025 (August Monthly Exhibit, 2025)
| Item | Actual | Planned | Budget* | Committed* |
| % | % | USDm | USDm | |
| Engineering | 37.6 | 39.2 | 69.0 | 57.5 |
| Procurement | 29.0 | 28.5 | 157.2 | 18.9 |
| Construction | 4.4 | 1.8 | 217.0 | 27.5 |
| Pre-Com/Commissioning | 0.0 | 0.0 | ~ | ~ |
| Owner + Contingency | n/a | n/a | 154.5 | 1.8 |
| Overall Project | 11.2 | 9.5 | 579.7 | 105.1 |
| 18.9.5 | ACP Growth Project |
The ACP Growth Project, which is a series of investments and studies by CMDIC to increase its production capacity beyond 210 ktpd to around 370 ktpd and is underway. The capital cost for the execution of the ACP Growth project is not incorporated in the scope of the expansion project reported herein.
| November 2025 | ||
| Page |
| SRK Consulting (UK) Limited | Mineral Resources and Mineral Reserves, Collahuasi Copper Mine - Main Report |
| ITEM 19 | MARKET STUDIES AND CONTRACTS |
| 19.1 | Introduction |
CMDIC produces both separate “Copper Concentrate” and “Molybdenum Concentrate” the sale terms of which are governed under specific and separate offtake agreements between CMDIC (the Seller) and the Principal Shareholders of CMDIC and their various subsidiary companies (collectively the Buyers):
| · | Copper Concentrate shareholder participants: Mitsui &Co. Ltd (Mitsui); Anglo American Chile Inversiones S.A. (Anglo American Chile); Anglo American Marketing Limited (Anglo American Marketing); Glencore International AG (Glencore); and |
| · | Molybdenum Concentrate shareholder participants: Mitsui &Co. Ltd (Mitsui); Anglo American Chile Inversiones S.A. (AA Chile); Anglo American Marketing Limited (AA Marketing); Glencore International AG (Glencore). |
The latest version of the Copper Concentrate offtake agreement (Copper Agreement) was entered into on 04 April 2016 and remains valid and in force as an ‘Evergreen Contract’ and has been applied on a continuous basis for each calendar year commencing 1 January 2015. The Copper Agreement is structured in accordance with standard copper concentrate market terms and addresses all key contractual components: product and quantity; delivery of concentrates; insurance; price; payment; weighting, sampling and determination of moisture; assay; force majeure; referees and various accompanying appendices addressing: definitions; seller’s expected analysis; basis for calculation of reference freight rate; notices; and shipping protocols.
The Molybdenum Concentrate Offtake Agreement (Molybdenum Agreement) was entered into on 1 April 2010 and remains valid and in force as an ‘Evergreen Contract’ and has been applied on a continuous basis for each calendar year commencing 1 January 2010. The Molybdenum Agreement is structured in accordance with standard molybdenum concentrate market terms and addresses all key contractual components: product and quantity; delivery of concentrates; insurance; price; payment; weighting, sampling and determination of moisture; assay; force majeure; referees and various accompanying appendices addressing: definitions; existing sales contracts; seller’s expected analysis; and umpires.
The following section includes discussion and comment on various aspects relating to Market Studies and Contracts relating to the sale of Copper Concentrate and Molybdenum Concentrate by CMDIC and the supporting assumptions incorporated into the current LoM plan as reported herein. Furthermore, this section includes an analysis of historical performance, historical and current pricing assumptions (as reflected in support of the Mineral Reserve and Mineral Resource declarations for 31 December 2024), contextual history of the concentrate markets for copper and molybdenum and the terms of the Offtake Agreements.
| November 2025 | ||
| Page |
| SRK Consulting (UK) Limited | Mineral Resources and Mineral Reserves, Collahuasi Copper Mine - Main Report |
CMDIC has not commissioned independent market experts to support either commodity pricing, concentrate “Treatment Charges” (also TC) nor “Refining Charges” (also RC) or seaborne concentrate shipping (Freight) terms to establish a short – long term assumptions, in support of the Mineral Reserve assessment reported herein. The LoM plan as reported here in assumes “Mineral Reserve” pricing assumptions for revenue determination (Copper at USD3.90/lb; Molybdenum at USD14.00/lb) and the results of collective discussion between CMDIC and the Principal Shareholders to establish a five-year forecast for copper concentrate TCs, RCs and Freight with year 5 being essentially assumed as the long run constant position. All other copper concentrate terms and conditions are as stipulated in the Copper Agreement. For molybdenum concentrates, the derivation of discounts, payable and freight assumptions follow a similar approach as noted for copper concentrates with all other terms as stipulated in the Molybdenum Agreement.
Anglo American has informed SRK that the express details pertaining to the Copper Agreement and the Molybdenum Agreement are confidential and cannot be disclosed in the public domain. Accordingly, where required SRK has relied on a combination of historical and on-market assumptions to derive the relevant terms required to determine the payable metal in concentrate, penalties and other considerations as necessary. In respect of copper concentrate SRK notes that the payability assumptions are broadly aligned with assumptions as reflected in Table 19 4. Accordingly, SRK has for the purpose of supporting the Ore Reserves assumed copper payability of approximately 96.4%. For Molybdenum SRK has assumed molybdenum payability of 76% which is broadly aligned with historical averages.
For clarification neither the Copper Agreement nor the Molybdenum Agreement include specific assumptions regarding concentrate freight nor treatment and refining terms. To support the reporting of Mineral Reserves these assumptions including short term and long-term treatment charges and refining charges reflect CMDICs view of on-market benchmark copper concentrate contract pricing terms which are higher than the current spot market. Furthermore, all freight charges are largely assumed based on a combination of historical, short term 5-year and long-term assumptions as provided by CMDIC.
Notwithstanding the above, SRK notes that the terms for treatment and refining and freight are set annually by CMDIC and the shareholders annually through reference to appropriate prevailing benchmarks and market conditions. As such these may well be different to that assumed herein.
| November 2025 | ||
| Page |
| SRK Consulting (UK) Limited | Mineral Resources and Mineral Reserves, Collahuasi Copper Mine - Main Report |
| 19.2 | Historical Performance |
Historical performance of concentrate sales by CMDIC as presented in Table 19-1 and
Table 19-2 which indicates as follows:
| · | Copper Concentrate: |
| o | annual production which has remained range bound between 2020 and 2024 at 2.2Mt to 2.4Mt of copper concentrate tonnage, |
| o | significant reduction in copper concentrate quality with grades declining from a high of 26.7% in 2022 to 21.7% for 2025 Q3 YTD largely as a result of limited ore availability and processing of lower grade stockpiles, noting that the concentrate grades are lower than the lower end of the Expected Approximate Range, |
| o | payable copper production which has largely declined since 2020 by 13%, |
| o | limited contribution from gold content given that grades are only marginally higher than the minimum deduction and sometimes lower, |
| o | variable impurity concentrations (Arsenic) which has ranged form 2,100ppm to 4,100ppm, |
| o | reducing TCs and RCs in line with current market conditions, |
| o | variable freight rates largely reflecting changes in ocean shipping rates; |
| · | Molybdenum Concentrate: |
| o | annual production which has largely declined from 16kt in 2022 to 7kt in 2024 and with 2025 Q3 YTD being only 3kt for 9 months of production, |
| o | production of off-grade concentrates with Mo concentration less than 43% and for 2024 and 2025 with grades of 29.0%Mo and 26.9%Mo respectively; |
| o | limited historical details for the contribution of TC+RC, Price Participation and Freight but overall denoting total concentrate costs substantially increasing from US$980/t in 2020 to US$3,423/t in 2024 and to US$8,836/t in 2025 Q3 YTD largely as a result of reduced payments for lower quality concentrate and the impact of fixed transportation costs. |
| Table 19-1: | Historical Concentrate Sales (Physicals): 2020 through 2025 Q3 YTD |
| Sales | Units | 2020 | 2021 | 2022 | 2023 | 2024 | 2025: Q3 YTD |
| Payable | |||||||
| Copper | (MlbCu) | 1,344.6 | 1,322.6 | 1,237.3 | 1,201.4 | 1,170.5 | 646.4 |
| Molybdenum | (MlbMo) | 5.0 | 8.0 | 13.9 | 6.6 | 2.8 | 1.3 |
| Silver | (MozAg) | 6.8 | 7.2 | 5.6 | 6.8 | 6.0 | 2.6 |
| Gold | (kozAu) | 50 | 34 | 19 | 21 | 28 | 1 |
| Copper Concentrate | |||||||
| Tonnage | (kt) | 2,366 | 2,338 | 2,178 | 2,244 | 2,347 | 1,395 |
| Grade | (%Cu) | 26.7 | 26.6 | 26.7 | 25.1 | 23.4 | 21.7 |
| (g/tAg) | 118.8 | 125.6 | 110.4 | 125.5 | 111.5 | 86.0 | |
| (g/tAu) | 1.7 | 1.4 | 1.3 | 1.3 | 1.4 | 0.9 | |
| (ppmAs) | 2,509 | 4,094 | 2,128 | 2,854 | 2,901 | 2,491 | |
| Content | (ktCu) | 631 | 621 | 581 | 564 | 549 | 303 |
| (kozAg) | 9,041 | 9,441 | 7,733 | 9,058 | 8,412 | 3,857 | |
| (kozAu) | 126 | 109 | 89 | 93 | 104 | 41 | |
| (ktAs) | 6 | 10 | 5 | 6 | 7 | 3 | |
| Payability | (Cu: %) | 96.65 | 96.65 | 96.65 | 96.65 | 96.65 | 96.65 |
| (Ag: %) | 74.93 | 76.10 | 72.06 | 74.72 | 71.59 | 67.12 | |
| (Au: %) | 39.88 | 30.94 | 21.36 | 22.28 | 26.93 | 3.39 | |
| Payable | (ktCu) | 610 | 600 | 561 | 545 | 531 | 293 |
| (kozAg) | 6,774 | 7,185 | 5,572 | 6,768 | 6,022 | 2,589 | |
| (kozAu) | 50 | 34 | 19 | 21 | 28 | 1 |
| November 2025 | ||
| Page |
| SRK Consulting (UK) Limited | Mineral Resources and Mineral Reserves, Collahuasi Copper Mine - Main Report |
| Sales | Units | 2020 | 2021 | 2022 | 2023 | 2024 | 2025: Q3 YTD |
| Molybdenum Concentrate | |||||||
| Tonnage | (kt) | 13 | 13 | 16 | 12 | 7 | 3 |
| Grade | (%Mo) | 29.1 | 36.0 | 41.5 | 40.6 | 29.0 | 26.9 |
| (%Cu) | 2.04 | 1.39 | 1.82 | 2.12 | 1.36 | 1.23 | |
| Content | (ktMo) | 4 | 5 | 7 | 5 | 2 | 1 |
| (tCu) | 267 | 179 | 290 | 250 | 98 | 43 | |
| Payability | (%) | 59.4 | 78.5 | 95.8 | 62.0 | 60.1 | 62.1 |
| Payable | (ktMo) | 2 | 4 | 6 | 3 | 1 | 1 |
| November 2025 | ||
| Page |
| SRK Consulting (UK) Limited | Mineral Resources and Mineral Reserves, Collahuasi Copper Mine - Main Report |
| Table 19-2: | Historical Concentrate Sales (Sales Revenue and Concentrate Charges): 2020 through 2025 Q3 YTD |
| Sales | 2020 | 2021 | 2022 | 2023 | 2024 | 2025: Q3 YTD | |
| Commodity Price Reference | |||||||
| Copper LME | (USc/lb) | 280 | 422 | 400 | 385 | 415 | 433 |
| Molybdenum | (US$/lb) | 9 | 16 | 19 | 24 | 21 | 22 |
| Silver LBM | (US$/oz) | 21 | 25 | 22 | 23 | 28 | 35 |
| Gold LBM | (US$/oz) | 1,771 | 1,799 | 1,803 | 1,944 | 2,390 | 3,203 |
| Commodity Price Actual | |||||||
| Copper | (USc/lb) | 291 | 437 | 374 | 382 | 412 | 436 |
| Molybdenum | (US$/lb) | 8.71 | 16.17 | 18.76 | 24.19 | 21.30 | 21.87 |
| Silver | (US$/oz) | 20.51 | 24.84 | 21.75 | 23.38 | 28.27 | 34.95 |
| Gold | (US$/oz) | 1,771 | 1,799 | 1,803 | 1,944 | 2,390 | 3,203 |
| Sales Revenue | |||||||
| Copper | (USDm) | 3,910.4 | 5,776.1 | 4,626.3 | 4,590.0 | 4,817.3 | 2,816.4 |
| Copper Base | (USDm) | 4,055.7 | 5,993.6 | 4,818.8 | 4,779.6 | 5,032.2 | 2,949.7 |
| Copper Deduction | (USDm) | (145.3) | (217.5) | (192.5) | (189.7) | (214.9) | (133.3) |
| Molybdenum | (USDm) | 43.4 | 129.4 | 261.4 | 158.6 | 58.9 | 28.0 |
| Silver | (USDm) | 138.9 | 178.5 | 121.2 | 158.3 | 170.3 | 90.5 |
| Gold | (USDm) | 88.9 | 60.6 | 34.3 | 40.2 | 66.6 | 4.4 |
| Total | (USDm) | 4,181.7 | 6,144.6 | 5,043.2 | 4,947.0 | 5,113.1 | 2,939.4 |
| Total (excl. deductions) | (USDm) | 4,327.0 | 6,362.1 | 5,235.7 | 5,136.7 | 5,327.9 | 3,072.6 |
| Copper Concentrate | |||||||
| Payable Revenue | (USDm) | 3,910.4 | 5,776.1 | 4,626.3 | 4,590.0 | 4,817.3 | 2,816.4 |
| Arsenic | (USDm) | 2.3 | 21.0 | 4.9 | 8.6 | 13.0 | 5.3 |
| TC | (USDm) | 146.8 | 139.2 | 141.0 | 189.9 | 188.3 | 42.1 |
| RC | (USDm) | 87.3 | 78.4 | 79.8 | 100.7 | 93.1 | 16.0 |
| Freight/Other | (USDm) | 122.3 | 192.0 | 206.9 | 156.0 | 166.3 | 89.1 |
| Subtotal | (USDm) | 358.7 | 430.6 | 432.6 | 455.1 | 460.7 | 152.4 |
| Net Margin | (USDm) | 3,551.7 | 5,345.6 | 4,193.7 | 4,134.9 | 4,356.6 | 2,664.0 |
| (%) | 90.8 | 92.5 | 90.7 | 90.1 | 90.4 | 94.6 | |
| TC | (USD/t) | 62.1 | 59.5 | 64.7 | 84.6 | 80.2 | 30.2 |
| RC | (USc/lb) | 6.5 | 5.9 | 6.4 | 8.4 | 8.0 | 2.5 |
| Arsenic | (USD/t) | 1.0 | 9.0 | 2.3 | 3.8 | 5.5 | 3.8 |
| Freight/Other | (USD/t) | 51.7 | 82.1 | 95.0 | 69.5 | 70.9 | 63.9 |
| TC-RC-Fr-As | (USD/t) | 151.6 | 184.2 | 198.6 | 202.8 | 196.3 | 109.3 |
| TC-RC-Fr-As | (USc/lb) | 15.2 | 18.4 | 19.9 | 20.3 | 19.6 | 10.9 |
| TC-RC-Fr-As:Price | (%) | 5.2 | 4.2 | 5.3 | 5.3 | 4.8 | 2.5 |
| Molybdenum Concentrate | |||||||
| Payable Revenue | (USDm) | 43.4 | 129.4 | 261.4 | 158.6 | 58.9 | 28.0 |
| TC+RC's | (USDm) | 12.8 | 18.4 | 16.5 | 22.1 | 24.6 | 30.7 |
| Price Participation | (USDm) | ||||||
| Freight/Other | (USDm) | ||||||
| Subtotal | (USDm) | 12.8 | 18.4 | 16.5 | 22.1 | 24.6 | 30.7 |
| Net Margin | (USDm) | 30.6 | 111.0 | 244.9 | 136.5 | 34.3 | (2.7) |
| (%) | 70.5 | 85.8 | 93.7 | 86.0 | 58.2 | (9.8) | |
| TC+RC | (USD/t) | 980.2 | 1,432.4 | 1,035.3 | 1,873.9 | 3,422.5 | 8,836.2 |
| Price Participation | (%) | - | - | - | - | - | - |
| Freight/Other | (USD/t) | - | - | - | - | - | - |
| TC-RC-PP-Fr | (USD/t) | 980.2 | 1,432.4 | 1,035.3 | 1,873.9 | 3,422.5 | 8,836.2 |
| (USD/lb) | 2.57 | 2.30 | 1.18 | 3.38 | 8.91 | 24.01 |
| November 2025 | ||
| Page |
| SRK Consulting (UK) Limited | Mineral Resources and Mineral Reserves, Collahuasi Copper Mine - Main Report |
| 19.3 | Commodity Pricing |
The principal commodity price assumptions incorporated into the LoM plan by CMDIC comprise that assumed for reporting the Mineral Reserves as of 31 December 2024, which are noted as USc390/lb (USD3.90/lb) for copper and USD14.00/lb for Molybdenum. These assumptions can be compared with the following:
| · | Consensus Market Forecast (October 2025) reflecting long term prices (reflecting an assumed Mineral Reserve price) of: |
| o | USc399/lb (USD3.99/lb) for copper, and |
| o | USD15.83/lb for molybdenum. |
| · | Historical statistics for calendar 2025 reflecting: |
| o | for copper an average daily price of USc410/lb ranging from a low of USc402/lb to a maximum USc422/lb and a three year daily moving average to 15 October 2025 of USc395/lb, |
| o | for molybdenum an average daily price of US$22.24/lb ranging from a low of US$19.80/lb to a maximum of US$27.00/lb and a three-year moving daily average of US$22.09/lb, |
| o | for silver an average daily price of US$27.37/oz ranging from a low of US$26.61/oz to a maximum of US$27.56/oz and a three-year moving daily average of US$28.16/lb, and |
| o | for gold an average daily price of US$3,244/oz ranging from a low of US$2,624/oz to a maximum of US$4,190/oz and a three-year moving daily average of US$2,420/oz. |
| · | Copper Company ‘reserve’ price assumptions as follows: |
| o | Corporación Nacional del Cobre copper price assumption of USc430/lb (2025), |
| o | Fitch Ratings copper price assumption of USc381/lb (2025), |
| o | Freeport-McMoRan Inc. price assumption of USc325/lb for copper and US$12/lb for molybdenum (31 December 2024), |
| o | Southern Copper Corp. copper price assumption of USc330/lb (2024), |
| o | McEwen Copper copper price assumption of USc425/lb (2025), |
| o | Capstone Copper copper price assumption of USc375/lb (2025), |
| o | Antofagasta copper price assumption of USc380/lb (2024), |
| o | Newmont copper price assumption of USc300/lb (2024), and |
| o | Barrick copper price assumption of USc300/lb (2024). |
SRK also notes that the Collahuasi copper concentrates also includes both silver and gold credits, with the former averaging 60g/tAg (historically >100g/tAg and 1.0g/tAu) and 0.8g/tAu in the latest LoM plan. As both silver and gold cannot be reported in the current Mineral Reserve and Mineral Resource statements, any revenue associated with these have been excluded in the LoM plan statistics reported in this Technical Report. The internal life of asset plan prepared by CMDIC, which includes Inferred Mineral Resources, assumes silver and gold price assumptions of US$25.00/oz and US$2,051/oz respectively.
| November 2025 | ||
| Page |
| SRK Consulting (UK) Limited | Mineral Resources and Mineral Reserves, Collahuasi Copper Mine - Main Report |

| Figure 19-1: | Historical Copper Price nominal and real (1 October) statistics for historical data through 15 October 2025 and forecast (consensus) to 2024 |
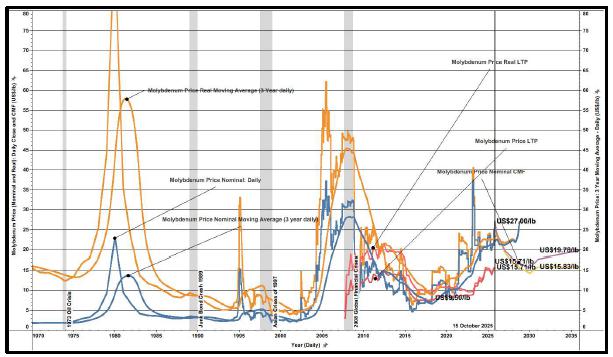
| Figure 19-2: | Historical Molybdenum Price nominal and real (1 October) statistics for historical data through 15 October 2025 and forecast (consensus) to 2024 |
| November 2025 | ||
| Page |
| SRK Consulting (UK) Limited | Mineral Resources and Mineral Reserves, Collahuasi Copper Mine - Main Report |

| Figure 19-3: | Historical Silver Price nominal and real (1 October) statistics for historical data through 15 October 2025 and forecast (consensus) to 2024 |
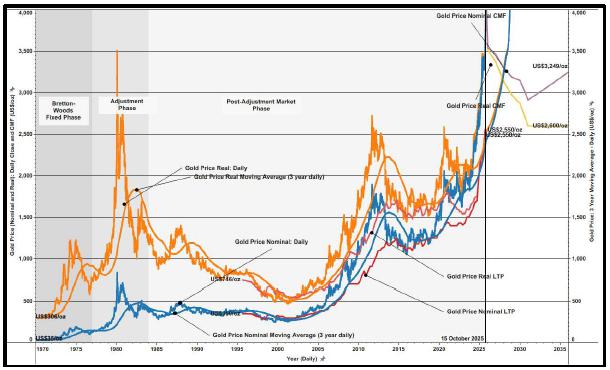
| Figure 19-4: | Historical Gold Price nominal and real (1 October) statistics for historical data through 15 October 2025 and forecast (consensus) to 2024 |
| November 2025 | ||
| Page |
| SRK Consulting (UK) Limited | Mineral Resources and Mineral Reserves, Collahuasi Copper Mine - Main Report |
| 19.4 | Concentrate Markets |
The following section includes contextual summaries of the key elements influencing the copper concentrate and molybdenum concentrate markets sourced from public domain. These do not reflect a detailed supply-demand concentrate terms analysis to support the underlying assumptions included in the LoM plan but rather provide a historical basis against which forecast assumptions can be assessed. Furthermore, SRK notes that details for the molybdenum concentrate market are limited, however the contribution to total revenue at Collahuasi is historically low (2024: 1.2%) and is assumed at 2.3% for the LoM plan totals.
| 19.4.1 | Copper Concentrate |
History
The history of the copper concentrate market evolved dramatically in the 20th century, shaped by key technological advances, shifting global geopolitics, and recent demand from green energy. Before modern concentration techniques, smelters were located near mines to process raw, low-grade ore. Today, copper concentrate is a globally traded commodity, linking major mining countries like Chile to powerhouse refining nations such as China
The development of the froth flotation process in the early 1900s fundamentally changed the copper industry leading to increased efficiency. Froth flotation allowed miners to separate valuable copper-bearing sulphide minerals from the uneconomical waste rock (gangue). This process created a high-grade copper concentrate that could be efficiently and economically transported to remote smelters. Ultimately this led to the development of a new business model which uncoupled the physical location of mines and processing plants, establishing the modern copper concentrate market whereby high-volume concentration operations were established to exploit low grade open-pit deposits.
The modern concentrate market has evolved largely in response to market dynamics and generally reflects two distinct periods:
| · | 1960s through 1980: In the mid-20th century, many developing countries nationalised large-scale copper mines, ending the dominance of North American producers and by the end of the 1980’s global production was largely dominated by state-owned enterprises in the Republic of Chile and the Republic of Zambia; |
| · | 1990 to present: From 1990 onwards the price for processing copper concentrate has been set by annual benchmark negotiations between major mining companies (producers) and smelters which can be subdivided into two distinct periods: |
| o | the early period (<2000) where major producers like Escondida and Freeport Indonesia negotiated directly with Japanese smelters, and |
| o | more recent (>2000) trends where Chinese smelters now dominate the negotiations, as China has become the world's largest buyer of copper concentrate and production of refined copper. |
| November 2025 | ||
| Page |
| SRK Consulting (UK) Limited | Mineral Resources and Mineral Reserves, Collahuasi Copper Mine - Main Report |
During the 21st century, the copper concentrate market has been characterised by market volatility, a tightening of supply and the rise Asia led demand with China now accounting for more than 60% of the global copper concentrate smelting capacity. In summary this has led to intense competition among smelters for limited concentrate supply and the emergence of record low TC-RC terms which in 2024 and 2025 entered negative territory. Typically, low TC-RC arrangements indicate tight concentrate supply and high demand from smelters. Further mine supply challenges including falling ore grades, production issues, mine closure and long development lead times have also exacerbated supply constraints. Conversely demand for refined copper continues to grow in response to the green energy demand associated with the global energy transition, which relies on copper for renewable energy infrastructure and electric vehicles. This has propelled refined copper prices to new highs on major exchanges like the LME, even as concentrate supply remains tight.
Concentrate Supply
Global mine production of concentrates has increased significantly since 2008 (12.6MtCu) with 2025 indicating contained copper in concentrates production of 18.5MtCu. This remains well short of installed production capacity of 25MtCu indicating utilisation of some 75%. Similarly smelter capacity has increased to 29.2MtCu contained with current (2025) utilisation reported at 72%.
The driving factors on the supply side remain focused on the combined impact of mine disruptions and operational issues, declining ore grades and limited investment in new mining projects. The driving factors in the demand side reflect a significant expansion in smelting capacity, continued high demand for copper and increased trading activity. The combination of supply and demand side drivers have significantly impacted the copper concentrate market which in recent times is dominated by:
| · | Smelter Resilience Concerns: With TC/RCs at record lows or even negative, many smelters have been operating on razor-thin or negative margins. This has forced some to cut output or consider temporary shutdowns; |
| · | Market Power Dynamics: The supply shortage has completely changed the negotiation dynamic, with miners now holding significant leverage over smelters; |
| · | Termination of traditional benchmark led arrangements: The collapse of TC/RCs led key industry players to abandon the long-standing annual benchmark pricing system in favour of alternative bilateral agreements or spot market indexes; and |
| · | Increased price and market volatility: The supply and demand imbalance has boosted spot market activity and contributed to greater price volatility for copper concentrate |
Recent key events in the copper concentrate market comprise:
2023
| · | Expansion of Chinese smelting capacity: China significantly increased its smelting capacity throughout the year, adding 1.2Mt 2023–2024 which expanded demand for copper concentrate, further straining supply; |
| November 2025 | ||
| Page |
| SRK Consulting (UK) Limited | Mineral Resources and Mineral Reserves, Collahuasi Copper Mine - Main Report |
| · | Mine disruptions begin: Several of the world's largest copper mines started experiencing unexpected production challenges. These issues, which included declining ore grades and operational problems, were early indicators of the coming supply crunch; |
| · | November—Cobre Panama closure: First Quantum's Cobre Panama copper mine was unexpectedly closed, creating a major supply disruption. This event triggered the rapid decline of spot TC/RCs. |
2024
| · | January-March TC/RCs fall: Due to tighter supply and strong buying from smelters (particularly Chinese ones), TC/RCs plummeted. Benchmark rates for 2024 were initially set at US$80/t, however spot charges fell far below this; |
| · | April-negative TC/RCs: for the first time in market history, the weekly TC/RC index fell into negative territory on April 26. This indicated that smelters were effectively paying a premium to miners just to secure concentrate; |
| · | May-miners make long-term deals: As TC/RCs hit record lows, miners increasingly agreed to very-long-term deals to lock in favourable processing terms; and |
| · | June-record low TC/RCs: The TC/RC index hit a record low of US$5/t on June 21, reflecting intense supply-side pressure. |
2025
| · | Early 2025-supply remains tight: Experts widely forecast that concentrate supply would remain tight throughout the year, keeping TC/RCs low. The International Copper Study Group (“ICSG”) revised its 2025 mine production forecast downwards due to ongoing operational incidents; |
| · | April-May-further disruptions and policy changes: A significant blow to the market came as the export license for Freeport's Grasberg mine in Indonesia expired in May, further removing concentrate from the global market; |
| · | October-record-low benchmark and new strategies: During LME Week 2025, it became clear the market was in historic turmoil. Freeport announced it would break away from the traditional benchmark system due to the unworkable record-low TC/RCs, which some analysts characterized as ‘nonsense’. |
| · | October-ICSG confirms deficit: A late-October report from the ICSG revealed the full impact of mine supply disruptions, projecting a global supply deficit for 2026. Several large mines faced operational problems during the year, limiting output. |
| · | Late 2025 zero-dollar agreements: Chilean miner Antofagasta and Chinese smelters agreed on zero-dollar TC/RCs for 2026, a first in history. |
| November 2025 | ||
| Page |
| SRK Consulting (UK) Limited | Mineral Resources and Mineral Reserves, Collahuasi Copper Mine - Main Report |
Offtake Arrangements
The copper concentrate market is influenced not only by the overall copper concentrate balance of supply and smelter capacity but also by the various market mechanisms for sale of concentrates. In summary the market between mines and smelters are defined as either integrated: mines which directly feed dedicated smelters; or custom mines which either sell directly to independent smelters or via independent traders. Typically, the custom concentrates markets are responsible for up to 50% of total smelter consumption where the pricing terms are generally referenced to an internationally recognised benchmark e.g., CIF Asia Pacific, where typical concentrate qualities are noted in Table 19-3.
| Table 19-3: | Copper Concentrate Benchmark Quality Assessment |
| Element | Unit | Base | Max | Min |
| Copper | (%Cu) | 28 | 37 | 22 |
| Gold | (g/tAu) | 1.10 | 50.00 | - |
| Silver | (g/tAg) | 75.0 | 350.0 | - |
| Sulphur | (%S) | 32 | 38 | 20 |
| Iron | (%Fe) | 28 | 35 | 15 |
| Lead | (%Pb) | 0.07 | 5.50 | - |
| Zinc | (%Zn) | 2.00 | 5.00 | - |
| Arsenic | (%As) | 0.17 | 2.00 | - |
| Antimony | (%Asb) | 0.018 | 0.200 | - |
| Mercury | (g/tHg) | 2.5 | 10.0 | - |
| Bismuth | (g/tBi) | 145 | 5,000 | - |
Analysis of historical statistics (Figure 19-5 and Figure 19-6) generally requires determination of key statistics which are then compared to the prevailing copper prices by conversion to total costs per pound of payable copper contained in concentrates sold. Determination of these key statistics requires reference to:
| · | Treatment Charges (“TC”) referenced in USD/t of dry concentrate smelted; |
| · | Refining Charges (“RC”) referenced in USc per pound of payable (refined) copper; |
| · | Consideration for Price Participation (“PP”) referenced in USc per pound or % of copper price above and below a reference base price: these have however not been noted in the copper concentrate market since 2006; and |
| · | A base case smelter copper recovery with allowances for minimum deductions which essentially results in lower overall copper recoveries with reducing copper concentrate grades. |
| November 2025 | ||
| Page |
| SRK Consulting (UK) Limited | Mineral Resources and Mineral Reserves, Collahuasi Copper Mine - Main Report |
Table 19-4 reflects a typical international benchmark recovery calculation for a base 28%Cu copper concentrate which indicates recovery benchmarks for payable copper determination of: 28%Cu (96.43%); 25%Cu (96.00%); 20%Cu (95.00%); 15%Cu (93.33%); 12%Cu (91.97%); and 10%Cu (90.00%).
| November 2025 | ||
| Page |
| SRK Consulting (UK) Limited | Mineral Resources and Mineral Reserves, Collahuasi Copper Mine - Main Report |
| Table 19-4: | Typical copper concentrate physical recovery calculations for a (28%Cu concentrate grade) |
| Terms | Units | Typical |
| Copper Conc. Tonnage | (t) | 1 |
| Copper Recovery | (%) | 96.65 |
| Copper .Concentrate Grade | (%TCu) | 28.00 |
| Copper Content | (tCu) | 0.28 |
| (lbCu) | 617 | |
| Minimum Deduction | (%TCu) | 1 |
| Recovered Copper (tCu) | (tCu) | 0.27 |
| Recovered Copper (lbCu) | (lbCu) | 595 |
| Overall Recovery | (%) | 96.43 |
Figure 19-5 presents a historical timeline of copper concentrate terms from 1982 through 2025 sourced from monthly data and Figure 19-6 expresses the same data as a percentage of the recorded spot cooper price with terms converted assuming benchmark copper concentrate grades of approximately 28%Cu. A notable feature is the emergence of negative TC-RC arrangements from 2024 onwards with the TC-RC terms reflected as a percentage of the spot copper price indicating a downwards trend since 2016.
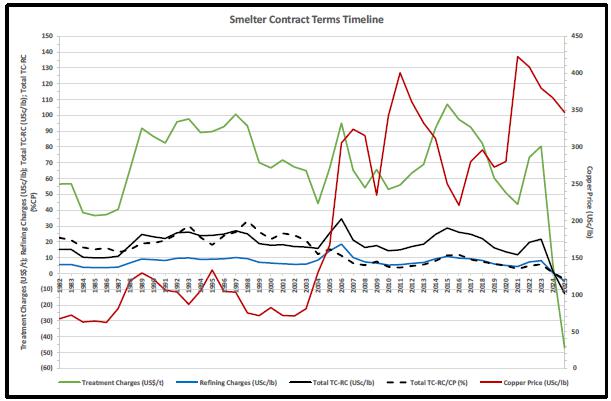
| Figure 19-5: | Historical Copper Concentrate terms: 1982 through October 2025 |
| November 2025 | ||
| Page |
| SRK Consulting (UK) Limited | Mineral Resources and Mineral Reserves, Collahuasi Copper Mine - Main Report |
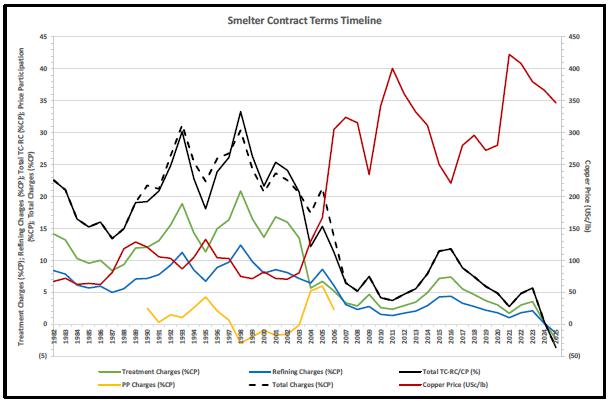
| Figure 19-6: | Historical Copper Concentrate terms (copper price relative): 1982 through October 2025 |
| 19.4.2 | Molybdenum Concentrate |
The molybdenum concentrate market is not as widely reported with access to historical public domain sourced data limited and reflecting a generally opaque position where a number of commodity market specialists focusing on pricing of molybdenum in near final or refined form as opposed to details pertaining to concentrate terms. The key elements of the overall Molybdenum market are reflect by:
| · | Market drivers including steel production, renewable energy, technological applications and aerospace and defence; |
| · | Market segments subdivided by end-use industries (oil and gas, chemicals and petrochemicals, automotive, construction, and aerospace and defence) and end-products (steel, chemicals, foundry products, molybdenum metal, and nickel alloys). Ferromolybdenum is used as the main additive in steelmaking and represents the largest market share. Molybdenum disulfide (MoS2) is also a significant market whose primary use is in high-performance lubricants and greases; |
| · | Geographic contribution whereby the Asia-Pacific region represents the largest market for molybdenum, both in production and consumption, with China being the dominant force. North America remains in second place which is expected to see growth due to demand from the aerospace and defence sectors; |
| · | Supply dynamics and market volatility: China and Chile are among the largest global producers, and the overall supply is heavily dependent on copper mining, as molybdenum is often a byproduct, which can make its supply inelastic to price changes. Recent factors influencing the molybdenum market continue to reflect supply chain disruptions, sustainability and increased regulatory focus (China and Chile) and recycling (primarily form steel scrap) accounting for approximately one third of global consumption. |
| November 2025 | ||
| Page |
| SRK Consulting (UK) Limited | Mineral Resources and Mineral Reserves, Collahuasi Copper Mine - Main Report |
Molybdenum concentrate specifications vary based on whether the product is unroasted (molybdenite) or roasted (technical molybdenum oxide), with the roasting process increasing the percentage of molybdenum by weight. Primary specifications relate to the percentage of molybdenum and key impurities like sulphur, copper, phosphorus, and lead.
| · | Roasted molybdenum concentrate (Technical Molybdenum Oxide): This is the most common form of concentrate, produced by roasting molybdenite concentrate in an air furnace with the following specifications: molybdenum - a minimum of 56% to 57% is standard, but some grades range from 57% to 63%; sulphur - typically less than 0.10%; sopper - generally a maximum of 0.50% however higher levels are possible in lower-grade concentrates; phosphorus - maximum 0.05%; lead - maximum 0.05% to 0.20%, depending on the grade; carbon - maximum 0.10% to 0.15%; arsenic – typically below 0.05%. This is typically sold as powders, granules, or compressed briquettes; |
| · | Unroasted molybdenite concentrate: This form is the direct product of mining and flotation before roasting. Molybdenum disulfide (MoS2) has typical concentrations ranging from 85% to 92% with sulphur content ranging from 35% to 37%. The overall elemental molybdenum content is lower than in roasted concentrate, but some producers offer grades starting at 40%Mo. Small amounts of other minerals are present, including sulphur, copper, and lead, which can be further removed by acid leaching. Producers can offer different specifications based on customer needs. For example, some mines produce high-quality concentrates with Mo content over 55%, while others with lower grades (47% to 50% Mo) are often blended to meet typical standards. |
Molybdenum concentrate treatment charges are fees paid by miners to smelters for processing, with specific amounts varying by contract and market conditions. Access to historical statistics is limited in the public domain as disclosure is more focused on the price paid per tonne of molybdenum concentrate (Figure 19 3) received (2025: USD540/t) rather than concentrate treatment terms directly. TCs are the fee charged by smelters to miners for converting concentrate into refined metal. Since the concentrate price is the net of the refined metal price minus the TC, focusing on the price still captures market dynamics.
Recent trends from 2023 through 2025 (Figure 19-7) indicate as follows:
| · | Increased concentrate prices (2023–2025): Reports from June 2025 mention that molybdenum concentrate prices hit a new high since February 2023, driven by tight supply. A tight concentrate market generally leads to lower TCs as smelters compete for raw materials; |
| · | Constrained profitability for processors: Reports from August 2025 note that high concentrate costs constrain profitability for molybdenum processors (ferromolybdenum plants). This suggests that TCs have been under pressure or are not sufficient to cover rising raw material costs; |
| · | Supply disruptions: Planned technical upgrades at mines in Henan and accidents in Inner Mongolia mentioned in an August 2025 report contributed to a tightened molybdenum concentrate supply. This would place further downward pressure on TCs; and |
| · | Upward cost pressure: An SMM report from July 2025 noted that concentrated high-level transactions in the raw material market created significant cost pressure for ferromolybdenum plants, which supports a lower TC environment. |
| November 2025 | ||
| Page |
| SRK Consulting (UK) Limited | Mineral Resources and Mineral Reserves, Collahuasi Copper Mine - Main Report |
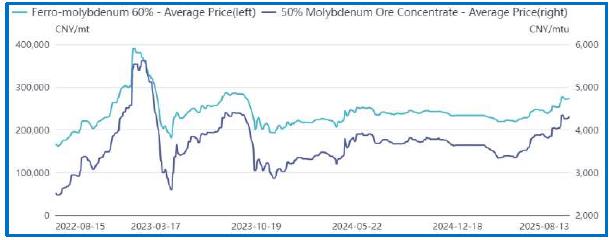
| Figure 19-7: | Historical Molybdenum pricing (2022 through 2025): SMM |
| 19.5 | Off-take Agreements |
The offtake agreements for both copper and molybdenum concentrate are ‘evergreen’ contracts which have been in place for more than a decade. The terms are structured in accordance with standard industry practice and define the basis of the contractual delivers to the Buyer/Offtaker (CMDIC shareholder and their representatives) and the Seller (CMDIC).
| 19.5.1 | Copper Concentrate Agreement |
The Cooper Concentrate Agreement has been reviewed by SRK and addresses a range of on market elements common to all evergreen style contracts. The key areas covered comprise:
| · | Shipping Terms governing, bulk ocean transport, moisture limits in accordance with the International Maritime Organisation (“IMO) Code of safe practice for Solid Bulk Cargos; delivery parcels, basis of freight determination being typically Cost and Freight (“CFR”), and shipping protocols governing shipment distribution to the individual Buyers; and |
| · | Concentrate Terms including: |
| o | copper payability and minimum deductions for copper, gold and silver, |
| o | benchmark reference commodity pricing being typically London Metal Exchange Grade A Settlement quotation for copper quoted in US$, and precious metals based on LBMA Gold and Silver Price benchmarks, |
| o | benchmark reference treatment charges, refining charges and where relevant price participation, |
| o | freight, demurrage and cargo insurance, |
| o | Expected Typical Analysis and Expected Approximate Range for grades of constituent elements including: copper, total iron, sulphur, gold, silver, molybdenum, antimony, bismuth, selenium, lead, cadmium, nickel, zinc, chlorine, fluorine, mercury, calcium carbonate, silica dioxide and aluminium oxide. |
| o | particle size distribution |
| o | impurity penalties for all deleterious elements included in the expected typical analysis base value which includes a US$/t unit rate applied to each and every exceedance value over and above the expected base value. |
| November 2025 | ||
| Page |
| SRK Consulting (UK) Limited | Mineral Resources and Mineral Reserves, Collahuasi Copper Mine - Main Report |
SRK has been informed by CMDIC, that the only significant impurity charges noted to date are in respect of arsenic grades which has to date exceeded international reference benchmark base of 2,000pm (0.2%As) with all annual periods reported to date exceeding this value. The current LoMp reflects arsenic concentration grades which exceed this by more than 2x on average for 2025 through 2044 and with the next five years being higher at over 3x the reference benchmark for 2025 to 2029. In respect of all other exceedance limits, SRK has been informed that no other significant charges have been incurred historically and that the current LoMp reflects continuation of this assumption, with the exception of the aforementioned arsenic.
| 19.5.2 | Molybdenum Concentrate |
The Molybdenum Concentrate Agreement has been reviewed by SRK and addresses a range of on market elements common to all evergreen style contracts. The key areas covered comprise:
| · | Shipping Terms governing transportation which largely occurs by road and includes specific deductions for moisture content from a floor up to a maximum for compliance with transportation safety. Unit charges are referenced as US$/lb of payable Molybdenum. Freight assumptions are largely based on a combination and forecast assumptions by CMDIC which results in a LoM average of US$174/t of dry concentrate delivered; and |
| · | Concentrate terms including: |
| o | payability reflective of the lower grade concentrate produced with the typical reference benchmark of 40%Mo to 45%Mo oxide pre-roasted concentrate, |
| o | Concentrate related charges, |
| o | Expected Typical Analysis and Expected Approximate Range for grades of constituent elements including: molybdenum, total iron, copper, iron, sulphur, arsenic, lead, chlorine, fluorine, rhenium and oil, |
| o | particle size distribution. |
| 19.6 | LoMp Summary |
The LoMp from which the Ore Reserves are derived assumes concentrate production from 1 January 2025 through to 2084 with total sales as follows:
| · | Copper Concentrate comprising 99.5Mt grading 27.6%TCu and reporting payable copper of 58.4Bnlb; and |
| · | Molybdenum Concentrate comprising 711kt grading 31.8%Mo and 2.60%Cu and reporting payable molybdenum of 379.4Mlb. |
In comparison with historical performance the key variances identified are:
| · | a significant improvement in copper concentrate quality largely assumed through the improved availability of direct feed ore to the concentrator and reduced reliance on the processing of lower grade ores; |
| · | increased copper concentrate production as a result of higher throughput and retaining historical production rate maximums from 2028 onwards; |
| November 2025 | ||
| Page |
| SRK Consulting (UK) Limited | Mineral Resources and Mineral Reserves, Collahuasi Copper Mine - Main Report |
| · | significantly increased arsenic concentration in the copper concentrate with annual values exceeding 6,000ppm and a maximum of 9,900ppm in 2028 as a direct result of mining and processing from Rosario West; |
| · | significantly increased molybdenum concentrate production which is at least an order of magnitude higher than that produced in 2024 and 2025 Q3 YTD; |
| · | improved molybdenum concentrate grades which nevertheless remain range-bound for low grade concentrates; and |
| · | substantially reduced total concentrate related charges which reflect an increase on 2024 but a 40% reduction from the 2025 Q3 YTD actuals. |
The supporting key assumptions for determination of sales revenue and associated concentrate charges are:
| · | For Copper Concentrate weighted average LoM comprising: |
| o | TC of USD63.1/t |
| o | RC of USc6.2/lb |
| o | Arsenic Penalty of UISD5.1/t noting that the values are substantially higher during the next 10 years, |
| o | Freight, Insurance and Demurrage costs of USD68.1/t. |
| o | No price participation; and |
| · | For Molybdenum Concentrate weighted average LoM comprising: |
| o | Combined concentrate charges of USD3.7/lb payable Molybdenum t, |
| o | Freight and other Charges of US$174/t, |
| o | Total charges inclusive of Freight and other charges of US$4.0/lb of payable Molybdenum. |
| November 2025 | ||
| Page |
| SRK Consulting (UK) Limited | Mineral Resources and Mineral Reserves, Collahuasi Copper Mine - Main Report |
| Table 19-5: | LoMp Concentrate Sales: 2025 through 2059 |
| Sales | Units | LoMp | 2025-2029 | 2030-2034 | 2035-2039 | 2040-2044 | 2045-2049 | 2050-2054 | 2055-2059 |
| Payable | |||||||||
| Copper | (MlbCu) | 58,408.6 | 5,663.7 | 5,826.5 | 5,474.5 | 5,243.8 | 6,474.5 | 5,639.4 | 6,438.6 |
| Molybdenum | (MlbMo) | 379.4 | 42.7 | 60.3 | 35.2 | 31.5 | 32.6 | 14.7 | 45.6 |
| Copper Concentrate | |||||||||
| Tonnage | (kt) | 99,468 | 10,173 | 10,283 | 9,628 | 9,260 | 11,411 | 9,709 | 10,880 |
| Grade | (%Cu) | 27.6 | 26.3 | 26.7 | 26.8 | 26.7 | 26.7 | 27.3 | 27.8 |
| (ppmAs) | 3,315 | 6,805 | 4,892 | 4,610 | 4,169 | 2,623 | 3,428 | 1,935 | |
| Content | (ktCu) | 27,493 | 2,671 | 2,746 | 2,579 | 2,471 | 3,051 | 2,655 | 3,029 |
| (ktAs) | 330 | 69 | 50 | 44 | 39 | 30 | 33 | 21 | |
| Payability | (Cu: %) | 96.36 | 96.19 | 96.25 | 96.27 | 96.25 | 96.26 | 96.34 | 96.41 |
| Payable | (ktCu) | 26,494 | 2,569 | 2,643 | 2,483 | 2,379 | 2,937 | 2,558 | 2,920 |
| Molybdenumn Concentrate | |||||||||
| Tonnage | (kt) | 711 | 80 | 114 | 66 | 59 | 61 | 27 | 86 |
| Grade | (%Mo) | 31.8 | 32.0 | 31.7 | 31.9 | 31.9 | 31.9 | 32.5 | 31.7 |
| (%Cu) | 2.60 | 2.60 | 2.60 | 2.60 | 2.60 | 2.60 | 2.60 | 2.60 | |
| Content | (ktMo) | 226 | 26 | 36 | 21 | 19 | 19 | 9 | 27 |
| (tCu) | 18,491 | 2,074 | 2,955 | 1,715 | 1,529 | 1,584 | 703 | 2,231 | |
| Payability | (%) | 76.0 | 76.0 | 76.0 | 76.0 | 76.0 | 76.0 | 76.0 | 76.0 |
| Payable | (ktMo) | 172 | 19 | 27 | 16 | 14 | 15 | 7 | 21 |
| Commodity Price | |||||||||
| Copper LME | (USc/lb) | 390 | 390 | 390 | 390 | 390 | 390 | 390 | 390 |
| Molybdenum | (US$/lb) | 14.00 | 14.00 | 14.00 | 14.00 | 14.00 | 14.00 | 14.00 | 14.00 |
| Sales Revenue | |||||||||
| Copper | (US$m) | 227,793.3 | 22,088.3 | 22,723.1 | 21,350.6 | 20,450.9 | 25,250.5 | 21,993.8 | 25,110.5 |
| Copper Base | (US$m) | 236,388.0 | 22,963.0 | 23,607.3 | 22,178.4 | 21,247.2 | 26,231.6 | 22,828.5 | 26,045.9 |
| Copper Deduction | (US$m) | (8,594.7) | (874.7) | (884.2) | (827.8) | (796.2) | (981.1) | (834.8) | (935.5) |
| Molybdenum | (US$m) | 5,311.7 | 598.4 | 843.9 | 493.2 | 440.4 | 456.1 | 206.1 | 638.3 |
| Total | (US$m) | 233,104.9 | 22,686.7 | 23,567.1 | 21,843.8 | 20,891.4 | 25,706.7 | 22,199.9 | 25,748.7 |
| Total (excl. deductions) | (US$m) | 241,699.6 | 23,561.4 | 24,451.2 | 22,671.6 | 21,687.6 | 26,687.8 | 23,034.6 | 26,684.2 |
| Copper Concentrate | |||||||||
| Payable Revenue | (US$m) | 227,793.3 | 22,088.3 | 22,723.1 | 21,350.6 | 20,450.9 | 25,250.5 | 21,993.8 | 25,110.5 |
| Arsenic | (US$m) | 510.3 | 222.1 | 95.1 | 75.0 | 50.2 | 20.5 | 34.7 | 7.8 |
| TC | (US$m) | 6,158.3 | 522.0 | 649.1 | 607.7 | 584.5 | 720.2 | 612.8 | 686.8 |
| RC | (US$m) | 3,619.0 | 289.8 | 367.8 | 345.6 | 331.0 | 408.7 | 356.0 | 406.4 |
| Freight/Other | (US$m) | 6,773.2 | 681.8 | 701.2 | 656.6 | 631.5 | 778.1 | 662.2 | 742.2 |
| Subtotal | (US$m) | 17,060.8 | 1,715.7 | 1,813.2 | 1,684.8 | 1,597.2 | 1,927.6 | 1,665.6 | 1,843.1 |
| Net Margin | (US$m) | 210,732.4 | 20,372.6 | 20,910.0 | 19,665.7 | 18,853.7 | 23,323.0 | 20,328.2 | 23,267.3 |
| (%) | 92.5 | 92.2 | 92.0 | 92.1 | 92.2 | 92.4 | 92.4 | 92.7 | |
| TC | (US$/t) | 61.9 | 51.3 | 63.1 | 63.1 | 63.1 | 63.1 | 63.1 | 63.1 |
| RC | (USc/lb) | 6.2 | 5.1 | 6.3 | 6.3 | 6.3 | 6.3 | 6.3 | 6.3 |
| Arsenic | (US$/t) | 5.1 | 21.8 | 9.3 | 7.8 | 5.4 | 1.8 | 3.6 | 0.7 |
| Freight/Other | (US$/t) | 68.1 | 67.0 | 68.2 | 68.2 | 68.2 | 68.2 | 68.2 | 68.2 |
| TC-RC-Fr | (US$/t) | 171.5 | 168.7 | 176.3 | 175.0 | 172.5 | 168.9 | 171.6 | 169.4 |
| TC-RC-Fr | (USc/lb) | 29.2 | 30.3 | 31.1 | 30.8 | 30.5 | 29.8 | 29.5 | 28.6 |
| TC-RC-Fr:Price | (%) | 7.5 | 7.8 | 8.0 | 7.9 | 7.8 | 7.6 | 7.6 | 7.3 |
| Molybdenum Concentrate | |||||||||
| Payable Revenue | (US$m) | 5,311.7 | 598.4 | 843.9 | 493.2 | 440.4 | 456.1 | 206.1 | 638.3 |
| Conc Charges | (US$m) | 1,403.8 | 158.2 | 223.0 | 130.4 | 116.4 | 120.6 | 54.5 | 168.7 |
| Freight/Other | (US$m) | 123.7 | 13.7 | 19.8 | 11.5 | 10.3 | 10.6 | 4.7 | 15.0 |
| Subtotal | (US$m) | 1,527.5 | 171.8 | 242.9 | 141.9 | 126.7 | 131.2 | 59.2 | 183.6 |
| Net Margin | (US$m) | 3,784.1 | 426.6 | 601.1 | 351.4 | 313.8 | 325.0 | 146.9 | 454.6 |
| Conc Charges | (US$/t) | 1,974 | 1,982 | 1,963 | 1,976 | 1,979 | 1,979 | 2,014 | 1,966 |
| Freight/Other | (US$/t) | 174 | 172 | 174 | 174 | 174 | 174 | 174 | 174 |
| Total Charges | (US$/t) | 2,148 | 2,154 | 2,137 | 2,150 | 2,153 | 2,154 | 2,188 | 2,140 |
| (US$/lb) | 4.0 | 4.0 | 4.0 | 4.0 | 4.0 | 4.0 | 4.0 | 4.0 |
| November 2025 | ||
| Page |
| SRK Consulting (UK) Limited | Mineral Resources and Mineral Reserves, Collahuasi Copper Mine - Main Report |
| Table 19-6: | LoMp Concentrate Sales: 2060 through 2094 |
| Sales | Units | LoMp | 2060-2064 | 2065-2069 | 2070-2074 | 2075-2079 | 2080-2084 |
| Payable | |||||||
| Copper | (MlbCu) | 58,408.6 | 5,743.9 | 5,463.4 | 3,590.7 | 1,659.7 | 1,189.9 |
| Molybdenum | (MlbMo) | 379.4 | 44.4 | 37.7 | 21.5 | 6.6 | 6.6 |
| Copper Concentrate | |||||||
| Tonnage | (kt) | 99,468 | 9,354 | 8,959 | 5,792 | 2,354 | 1,665 |
| Grade | (%Cu) | 27.6 | 28.9 | 28.7 | 29.1 | 33.1 | 33.5 |
| (ppmAs) | 3,315 | 1,482 | 1,852 | 1,769 | 652 | 429 | |
| Content | (ktCu) | 27,493 | 2,699 | 2,568 | 1,687 | 779 | 558 |
| (ktAs) | 330 | 14 | 17 | 10 | 2 | 1 | |
| Payability | (Cu: %) | 96.36 | 96.53 | 96.51 | 96.55 | 96.65 | 96.65 |
| Payable | (ktCu) | 26,494 | 2,605 | 2,478 | 1,629 | 753 | 540 |
| Molybdenumn Concentrate | |||||||
| Tonnage | (kt) | 711 | 83 | 71 | 40 | 12 | 13 |
| Grade | (%Mo) | 31.8 | 31.7 | 31.8 | 32.1 | 32.3 | 31.1 |
| (%Cu) | 2.60 | 2.60 | 2.60 | 2.60 | 2.60 | 2.60 | |
| Content | (ktMo) | 226 | 26 | 23 | 13 | 4 | 4 |
| (tCu) | 18,491 | 2,169 | 1,844 | 1,042 | 316 | 329 | |
| Payability | (%) | 76.0 | 76.0 | 76.0 | 76.0 | 76.0 | 76.0 |
| Payable | (ktMo) | 172 | 20 | 17 | 10 | 3 | 3 |
| Commodity Price | |||||||
| Copper LME | (USc/lb) | 390 | 390 | 390 | 390 | 390 | 390 |
| Molybdenum | (US$/lb) | 14.00 | 14.00 | 14.00 | 14.00 | 14.00 | 14.00 |
| Sales Revenue | |||||||
| Copper | (US$m) | 227,793.3 | 22,401.2 | 21,307.4 | 14,003.8 | 6,472.7 | 4,640.4 |
| Copper Base | (US$m) | 236,388.0 | 23,205.5 | 22,077.7 | 14,504.4 | 6,697.1 | 4,801.3 |
| Copper Deduction | (US$m) | (8,594.7) | (804.3) | (770.3) | (500.7) | (224.4) | (160.8) |
| Molybdenum | (US$m) | 5,311.7 | 621.0 | 528.3 | 301.6 | 92.0 | 92.3 |
| Total | (US$m) | 233,104.9 | 23,022.2 | 21,835.7 | 14,305.4 | 6,564.7 | 4,732.7 |
| Total (excl. deductions) | (US$m) | 241,699.6 | 23,826.5 | 22,606.0 | 14,806.1 | 6,789.1 | 4,893.5 |
| Copper Concentrate | |||||||
| Payable Revenue | (US$m) | 227,793.3 | 22,401.2 | 21,307.4 | 14,003.8 | 6,472.7 | 4,640.4 |
| Arsenic | (US$m) | 510.3 | - | 4.3 | 0.5 | - | - |
| TC | (US$m) | 6,158.3 | 590.4 | 565.5 | 365.6 | 148.6 | 105.1 |
| RC | (US$m) | 3,619.0 | 362.6 | 344.9 | 226.6 | 104.8 | 75.1 |
| Freight/Other | (US$m) | 6,773.2 | 638.3 | 611.4 | 395.2 | 160.9 | 113.8 |
| Subtotal | (US$m) | 17,060.8 | 1,591.3 | 1,526.1 | 988.0 | 414.2 | 294.0 |
| Net Margin | (US$m) | 210,732.4 | 20,809.9 | 19,781.4 | 13,015.8 | 6,058.5 | 4,346.5 |
| (%) | 92.5 | 92.9 | 92.8 | 92.9 | 93.6 | 93.7 | |
| TC | (US$/t) | 61.9 | 63.1 | 63.1 | 63.1 | 63.1 | 63.1 |
| RC | (USc/lb) | 6.2 | 6.3 | 6.3 | 6.3 | 6.3 | 6.3 |
| Arsenic | (US$/t) | 5.1 | - | 0.5 | 0.1 | - | - |
| Freight/Other | (US$/t) | 68.1 | 68.2 | 68.2 | 68.2 | 68.3 | 68.3 |
| TC-RC-Fr | (US$/t) | 171.5 | 170.1 | 170.3 | 170.6 | 175.9 | 176.6 |
| TC-RC-Fr | (USc/lb) | 29.2 | 27.7 | 27.9 | 27.5 | 25.0 | 24.7 |
| TC-RC-Fr:Price | (%) | 7.5 | 7.1 | 7.2 | 7.1 | 6.4 | 6.3 |
| Molybdenum Concentrate | |||||||
| Payable Revenue | (US$m) | 5,311.7 | 621.0 | 528.3 | 301.6 | 92.0 | 92.3 |
| Conc Charges | (US$m) | 1,403.8 | 164.1 | 139.6 | 79.7 | 24.3 | 24.4 |
| Freight/Other | (US$m) | 123.7 | 14.6 | 12.4 | 7.0 | 2.1 | 2.1 |
| Subtotal | (US$m) | 1,527.5 | 178.7 | 152.0 | 86.7 | 26.4 | 26.5 |
| Net Margin | (US$m) | 3,784.1 | 442.3 | 376.3 | 214.9 | 65.5 | 65.8 |
| Conc Charges | (US$/t) | 1,974 | 1,967 | 1,969 | 1,989 | 2,002 | 1,928 |
| Freight/Other | (US$/t) | 174 | 174 | 174 | 174 | 174 | 168 |
| Total Charges | (US$/t) | 2,148 | 2,142 | 2,143 | 2,163 | 2,176 | 2,096 |
| (US$/lb) | 4.0 | 4.0 | 4.0 | 4.0 | 4.0 | 4.0 |
| November 2025 | ||
| Page |
| SRK Consulting (UK) Limited | Mineral Resources and Mineral Reserves, Collahuasi Copper Mine - Main Report |
In summary the marketing and sales processes governing both copper and molybdenum concentrates are well established and indicate a consistent track record of sustainable delivery to the Buyers. That aside, SRK notes that there are some key points of observations which reflect both risks and opportunities as outlined below:
| · | The risk that continued direct ore feed from the open-pit operations remain constrained and that concentrator feed continues to be supplemented by low grade stockpiles. In this instance it is likely that during such periods concentrate production and concentrate grades will remain under pressure with qualities remaining outside of the Expected Approximate Range; |
| · | The risk that increasing arsenic concentrations which are higher than the Expected Approximate Range result in either increased arsenic penalties and or the requirement for further blending by the Buyers; and |
| · | The risk that molybdenum concentrate production will not surpass historical production rates and that the unit costs of treatment and freight remain exposed to increased offtake costs due to its off-grade quality 2 status. |
| · | The opportunity to negotiate revised TC-RC offtake terms given the recent fundamental changes in the copper concentrate market and the emergence of negative TC-RC contracts. In this instance SRK notes that certain producers and offtakes have mutually agreed zero rated TC-RC terms in contrast to adopting negative values. |
| November 2025 | ||
| Page |
| SRK Consulting (UK) Limited | Mineral Resources and Mineral Reserves, Collahuasi Copper Mine - Main Report |
| ITEM 20 | ENVIRONMENTAL STUDIES, PERMITTING AND SOCIAL OR COMMUNITY IMPACT |
| 20.1 | Introduction |
The environmental, social and governance (ESG) input is based on a desktop review of information made available by CMDIC and a site visit by an SRK Chile environmental specialist in October 2025. The site visit included a short tour of the mine, processing facilities and TSF, and discussions with site team members.
Background information on environmental permitting requirements, the status of environmental approvals and compliance is covered in ITEM 4, and the environmental and social setting for the operation is provided in ITEM 5. This section describes the status of management of environmental and social issues and ESG factors relevant to the reporting of Mineral Resources and Mineral Reserves.
| 20.2 | Environmental and Social Management |
| 20.2.1 | Status of assessments and studies |
As a result of the environmental permitting processes in Chile, CMDIC has conducted a series of extensive environmental and social studies on baseline conditions and anticipated impacts from the operations across all three sectors. The studies include most bio-physical and social topics that would be expected in an EIA. Other than a limited climate change analysis, SRK has not seen additional environmental or social studies that may have been commissioned outside of the various environmental impact assessment processes.
The most recent EIA was submitted in 2019 and approved through the 2021 RCA. The outcomes of the impact assessment are captured in a series of management plans. A ‘mitigation, repair and / or compensation measures plan’ (PMRC) has been developed to address impacts rated as significant in the EIA, and the ‘voluntary environmental commitments’ plan addresses impacts rated as not significant. CMDIC tracks the implementation of actions arising from both these plans in the same manner (described further in Section 4.5.3). Early Warning Plans are also implemented to proactively mitigate impacts in the event that alert thresholds are triggered (see Section 20.2.2).
Key mitigation measures in the PMRC include restoration of flows in the streams surrounding the Rosario pit affected by dewatering activities, management of archaeological sites, vegetation and low-mobility fauna of heritage value located in the disturbance footprint of expanded facilities, plan to strengthen production units for high-altitude livestock farming to mitigate the reduction in grazing area, and creation of the Collacagua Conservation Area as compensation for the loss of soil, vegetation, terrestrial and aquatic habitats and grazing areas due to expansion of the operation.
Voluntary commitments extend to the assessment and protection of sites of cultural heritage importance, protection of ceremonial and pastoral activities and wildlife, communication with communities, and participatory monitoring programmes aimed at building trust between CDMIC and local stakeholders.
| November 2025 | ||
| Page |
| SRK Consulting (UK) Limited | Mineral Resources and Mineral Reserves, Collahuasi Copper Mine - Main Report |
CDMIC’s 2024 Sustainability Report3 provides detailed information on the wide range of community investment programmes implemented by the company within the Tarapacá region. These investments are focussed on economic development, social development programmes, environmental initiatives and educational programmes aimed at developing local human capital.
SRK understands that a further update to the 2021 EIA is currently in progress to support the further growth of the operation to allow for treatment of 370 ktpd (ACP Growth Phase, see Section 4.5.2). Whilst SRK has not been able to review the scope of work for this EIA, it is understood that the requisite baseline studies are currently in progress and the EIA is due to be completed in Q2 2027.
| 20.2.2 | Management and monitoring |
The CDMIC Sustainability Policy seeks to align with internationally recognised sustainability principles including the principles of the ICMM, Global Compact, Universal Declaration of Human Rights and the values of accountability, integrity and transparency. The Policy focusses on four key areas including business, the environment, communities and people. In 2021 CDMIC developed an ESG Management Framework that includes 12 concrete medium- and long-term commitments4.
CDMIC has appointed a Vice President Development and Sustainability. This role includes responsibilities for the Environmental Relationship Management team, Environmental and Permitting team, Energy Management and Water Resource management.
Whilst CDMIC does not currently seek external certification for the environmental, health and safety or community management systems that it operates, it works to achieve continuous improvement via the Risk Management Cycle programme. The system includes activity planning, monitoring, incident management and ensuring compliance with the company’s commitments. Internal audits and compliance reviews are undertaken to confirm effective operation of the system components and to drive a preventative approach to risk identification, assessment and response.
Although a climate change analysis has been undertaken to inform the water balance (see Section 18.4.1) and design of the expanded TSF, there is no specific physical climate change risk assessment available at present.
Management plans arising from the EIA drive much of the risk control measures. These plans also include contingency and emergency response plans across all three sectors. Contingency plans are pre-defined preventative measures aimed at avoiding or minimising the possibility of occurrence or subsequent significance of impact of an unwanted event. Emergency plans cater for the immediate actions required in response to a sudden, unexpected event.
3 https://www.collahuasi.cl/wp-content/uploads/2025/07/reporte-sustentabilidad-collahuasi-2024.pdf
4 https://www.collahuasi.cl/sustentabilidad/politica-de-sustentabilidad/
| November 2025 | ||
| Page |
| SRK Consulting (UK) Limited | Mineral Resources and Mineral Reserves, Collahuasi Copper Mine - Main Report |
An extensive range of monitoring programmes are undertaken at the mine, pipeline and port sectors as part of the Environmental Monitoring Plan (EPS). As part of the voluntary commitments agreed to by CMDIC, there are also several participatory monitoring programmes that include representatives of local communities and organisations, including indigenous peoples organisations. Monitoring programmes that are participatory are focussed on potential impacts of most importance to the relevant stakeholders, for example marine and odour monitoring programmes at the port.
In order to manage the impacts of CMDIC’s activities on ecosystem services, various measures to mitigate impacts on protected areas and biodiversity have been implemented. For example, flamingos are monitored at the Coposa salt flats to assess changes in richness and abundance of these species to enable adjustments to conversation strategies as necessary. Specific biodiversity metrics are included in the annual Sustainability Report.
A system of Early Warning Plans (EWP) has been implemented to assist with proactive identification and response to events or conditions that could generate impacts greater than those assessed in the EIA. The plans establish critical monitoring parameters, alert thresholds and specific mitigation or contingency actions aimed at protecting sensitive environmental components such as water resources, soils or biodiversity.
| 20.2.3 | Stakeholder engagement |
CMDIC recognises the importance of building strong relationships with its stakeholders. Engagement methods include direct, in-person engagements, formal collaboration agreements and open, ongoing dialogue in topic specific working groups.
Permanent working groups have been established with indigenous communities. These operate in terms of Framework Agreements that ensure alignment with international standards on indigenous peoples and communities. The working groups are focused on impacts to pastoral activity and cultural practices due to loss or reduction of grazing areas, and alteration of culturally significant areas used by indigenous groups due to mining infrastructure.
The Environmental Relations Management (GRE) strategy has been developed to coordinate and align the Company’s stakeholder engagement and relationship building programmes. The programme includes the identification and analysis of risks and the development of controls to mitigate these risks. The annual Sustainability Report provides information on the specific engagements held annually as well as the number of complaints received and resolved via the grievance mechanism.
| 20.3 | ESG Factors |
This Item presents ESG factors that could be Modifying Factors when reporting Ore Reserves and may influence the determination of economic extraction. The concept of double materiality is applied, with potential ESG impacts from the operation considered equally to impacts posed by the ESG setting to the operation. For this assessment, potentially material is assumed to be factors that could:
| · | Stop or affect the continuation of operations, or obtaining and maintaining of approvals; |
| · | Pose major concern to stakeholders and/or could affect the social licence to operate (this includes local communities, potential business stakeholders and non-governmental or community organisations); |
| November 2025 | ||
| Page |
| SRK Consulting (UK) Limited | Mineral Resources and Mineral Reserves, Collahuasi Copper Mine - Main Report |
| · | Lead to mis-alignment with corporate strategies or policies; and/or |
| · | Result in the need for additional studies or costs that could affect the proposed design and/or operation and thus the value of the assets (e.g., design changes, operational management requirements, cash flow restrictions, rehabilitation/closure demands). |
The potential for materiality has been identified on the basis of:
| · | Experience of ESG reviewers; |
| · | Understanding of the location; proposed operation; regulatory and governance structure; socio-political situation; environmental and social setting; described in ITEM 4, ITEM 5 and ITEM 20 of this Technical Report; and |
| · | Understanding of potential investors’ expectations on ESG disclosure. |
Based on a review of ESG Factors that could be Modifying Factors when reporting Mineral Reserves and which may influence the determination of economic extraction, several issues have been identified that have the potential to interrupt operations or result in additional capital or operating costs. These factors relate to permitting, water management, stakeholder engagement, decarbonisation and closure. These are described qualitatively rather than adjustments to the LoM plan or financial model.
| 20.3.1 | Permitting and compliance |
As described in Section 4.5.2, the current environmental approval for the operation was issued in 2021 and expires in 2041. The operation permitted via this approval is smaller in scale and duration than the Mineral Reserves case. This is common practice in Chile where the duration of environmental approvals is often limited to between 20 and 25 years. CMDIC plans to submit an EIA for the ACP Growth Project in 2027 ahead of an approval anticipated in 2030. Should the expansion case to 370 ktpd be deferred, a revised application for an environment permit will be required to support the right to extract Mineral Reserves beyond 2041
Until the approval is secured, there is no environmental permit for mining after 2041, which accounts for 30% of the current Mineral Reserves. Factors that could present risks to this approval being obtained include: material changes to the operation (other than expansion of current facilities); continued need for groundwater abstraction beyond 2041; anticipated carbon emissions; status of stakeholder relationships prior to and during the permitting process; and disturbance to sensitive features in the future TSF footprint, including archaeological sites, grazing areas used by indigenous groups and areas of protected vegetation.
The environmental permit for Ujina pit expires in 2027. In the short-term there is a requirement to mine waste from the Ujina pit to support the expansion of the TSF dam wall. A permit application for this activity (DIA) is in progress and is scheduled for submission in Q1 2026 and approval in Q1 2027. The permitting schedule will need to be aligned with the planned construction programme to mitigate any impacts on production. Longer-term, extraction of ore from the Ujina deposit is scheduled to recommence in 2044, following a hiatus of circa 40 years. These ore mining activities are due to be included in the EIA for the ACP Growth Project, with approval anticipated to be obtained prior to 2030.
| November 2025 | ||
| Page |
| SRK Consulting (UK) Limited | Mineral Resources and Mineral Reserves, Collahuasi Copper Mine - Main Report |
| 20.3.2 | Mine waste management |
The copper porphyry ore and waste rock materials contain a range of sulfide minerals including chalcocite, chalcopyrite, bornite and pyrite. Oxidation of sulfide minerals can lead to risks associated with Acid Rock Drainage and Metal Leaching (ARMDL), where contact waters can become net acid and/or can contain elevated solute concentrations that could be detrimental to water quality at environmental receptors. Annex 4.4D of the 2018 EIA provides a summary of several phases of geochemical characterisation studies that have been undertaken on the Collahuasi ore and waste rock (over 150 samples) and tailings (11 samples) to evaluate the geochemical behaviour of a range of material types and compositions. The testing comprised a range of industry standard static test methods; including mineralogical analysis by X-Ray Diffraction (XRD) with Reitveld refinement, Acid-Base Accounting (ABA), Net Acid Generation (NAG), and Acid Base Characteristic Curves (ABCC) and Synthetic Precipitation Leach Protocol (SPLP). In addition, kinetic testing has also been conducted by Humidity Cell Test (HCT) for 35 samples of waste rock and two tailings samples.
The geochemical characterisation indicated a range of behaviour from Non-Potentially Acid Generating (Non-PAG) materials to Potentially Acid Generating (PAG) materials. There was limited occurrence of carbonate or other minerals to readily consume acidity. The materials were classified into 9 geo-environmental units (UGA) based on mineralisation and pyrite content. UGA1 was classed as ‘Non-PAG’, UGA7 to UGA9 were classed as PAG, and UGA2 to UGA6 were classed as uncertain. Most (>99%) of the Ujina waste rock materials were classed as Non-PAG. For the Rosario and Sur WRD, over 50% of the material was classed as PAG.
Based on the geochemical characterisation, contact waters of the Rosario pit and WRD, the stockpiles and the TSF could be influenced by ARDML and could give rise to environmental impacts should those contact waters enter surface water and/or groundwater. There may be a lag time for ARDML conditions to occur, particularly for the TSF where the high salinity, high moisture content and ongoing addition of fresh tailings can act to inhibit the rate of acid generation processes. The stockpile materials will likely contain a higher proportion of sulfide minerals, and hence pose a greater risk of having acidic contact waters, as will the historical leach piles. The pit walls may contain exposures of ore and other PAG materials, and hence the in-pit run off could be ARDML influenced. The water quality monitoring database indicates the occurrence of low pH waters in several locations, including the Rosario pit and in locations within the Pacific Slope Basins. The water quality data therefore indicates that acid conditions may have been established in several areas.
The number of samples for static testing could be considered to be on the low side for a deposit of this size, particularly for the tailings materials, compared to the recommendations of the GARD guide (INAP, 2014); however, the data provided in combination with the HCT provide sufficient information to confirm the overall classification of materials and to indicate there is a large proportion of PAG material associated with the Rosario pit and waste rock. The site is operational and therefore monitoring of contact waters will provide a direct measurement of contact water quality that can be used as a basis for forecasting future water quality during operations and into closure.
| November 2025 | ||
| Page |
| SRK Consulting (UK) Limited | Mineral Resources and Mineral Reserves, Collahuasi Copper Mine - Main Report |
| 20.3.3 | Potential water impacts |
Routine monitoring of water flow, level and quality is well controlled, with data reviewed regularly against targets and triggers via a series of Power BI dashboards. Beyond routine monitoring, CMDIC is also actively mitigating water availability and water quality impacts on an ongoing basis through management commitments defined in the 2021 RCA. The key ongoing water impacts mitigation activities are:
Flow restitution at the Jachucoposa and Michincha springs CMDIC has an environmental obligation to maintain spring flow at equal or higher than 60 L/s by supplementing the natural discharge with make-up water of similar quality. This is achieved via a reinjection well connected to the site water supply system. CMDIC also has an obligation to maintain continuous discharge of around 5 L/s.
Flow restitution and quality management on the Huinquintipa The Huinquintipa and tributaries below the Rosario WRD showed a progressive increase in electrical conductivity (EC) between 2007, peaking in around 2013, with episodic increases in copper, manganese and zinc especially during event-flow conditions (Arcadis, 2018). Ongoing monitoring and management of seepage and runoff from the Rosario WRD has been implemented. Field parameters are measured daily and major ions and select trace solutes (such as arsenic) are measured weekly using fluorometry. This monitoring data is validated with laboratory analyses conducted fortnightly. If monitoring data meets the required quality, water is discharged into the Huinquintipa and San Daniel streams, downstream. If not, the water is replaced with water with an equivalent water quality to the baseline stream chemistry (usually from the Rosario pit) which is discharged to the streams at the same diverted flow rate, to ensure no flow impacts.
TSF capture wells CMDIC is operating a seepage-recovery well network around the tailings storage facility (the hydraulic barrier) and tailings drains to intercept seepage from the TSF and return water to the circuit.
PAT (Plan de Alerta Temprana / Early Warning Plan) The PAT/EWP is mandated in the 2021 RCA and defines threshold-based monitoring and triggers for the Jachucoposa spring (levels and spring flow), Coposito abstraction wells, Border abstraction wells, and the TSF. If levels/flow exceed thresholds for the defined period, certain actions are activated such as reduction of abstraction and/or injecting additional water near the spring. The TSF EWP was activated in August 2024 due to quality thresholds being exceeded, likely due to contamination with drilling waste. Additional monitoring and other actions are currently being implemented to further investigate.
Although currently well managed, the scale and complexity of ongoing mitigation commitments is challenging. There remains a risk that management measures fail to control the impact from the operation, resulting in non-compliances against the permit conditions, operational constraints relating to water availability or impacts on downstream users. For example, there is an ongoing risk of the EWP triggering a reduction in water abstraction volumes, which would directly impact water availability for production. A further example would be failure of any of the water quality management controls protecting downstream users, which could result in regulatory action and reputational impacts from stakeholders.
| November 2025 | ||
| Page |
| SRK Consulting (UK) Limited | Mineral Resources and Mineral Reserves, Collahuasi Copper Mine - Main Report |
| 20.3.4 | Community relations |
Indigenous people, including members of formal Associations, live near and utilise the land around the mine site for ceremonial and / or grazing activities. Whilst SRK understands that Framework Agreements are in place with indigenous associations, CMDIC will need to ensure it maintains robust and constructive relationships with traditional users of the land and its associated ecosystem services.
Between October 2023 and April 2024, several indigenous communities from the Tarapacá region in northern Chile filed lawsuits challenging the 2021 environmental approval of the operation. The claimants alleged that the environmental evaluation process did not properly assess the impact on affected indigenous communities and their livelihoods process, and that their rights were not adequately assessed as a result. An additional legal proceeding was launched by indigenous communities, Wilamasi and Chanavaya, located on the coast to the south of Puerto Patache. This lawsuit relates to alleged contamination and impact on seawater, sediments and marine fauna from discharge of copper during shipping operations. Because these cases involve the same claimants, the cases were merged and are now being managed as a single lawsuit. The claim for environmental damage was filed before the First Environmental Court of Antofagasta and was rejected by the Court in July 2025. The ruling stated that there is insufficient evidence to prove environmental damage as alleged by the plaintiff (CMDIC). In addition, the plaintiff was ordered to pay the costs of the trial. The plaintiffs appealed the decision, and the case will be moved to the Second Environmental Court of Antofagasta. The case remains ongoing at the time of publication of this Technical Report.
| 20.3.5 | Decarbonisation |
Chile's Framework Law on Climate Change (Law 21,455) establishes a legal basis for climate action with a goal of carbon neutrality by 2050. Key provisions include a Long-Term Climate Strategy, sectoral mitigation and adaptation plans, and emissions standards that can lead to a cap-and-trade system. The law also creates a national system for citizen participation and information on climate change, and distributes climate responsibilities across multiple government ministries, regional governments, and municipalities. Additional climate related targets are included in Chile’s mining policy (Section 4.3.1).
Greenhouse gas (GHG) emissions accounting is undertaken for the operation in accordance with the GHG Protocol and ISO 14064-1 standards. Total estimated emissions for steady-state operations for 2024 were 1,153,901 tCO2e on the market-based method, with Scope 1 sources contributing 49% and Scope 3 sources contributing 51%. CMDIC has signed 100% renewable energy contracts, hence Scope 2 emissions on the market-based method is 0 tCO2e. However, SRK has only been supplied with renewable energy certificates, issued by the National Electricity Coordinator, that equates to 19.462% of their total energy consumption.
The GHG intensity for 2024 is 0.48 tCO₂e /t of copper concentrate. There has been a steady decline in emissions from 2013 to 2024.
| November 2025 | ||
| Page |
| SRK Consulting (UK) Limited | Mineral Resources and Mineral Reserves, Collahuasi Copper Mine - Main Report |
There is a carbon tax in Chile, which is applicable to stationary sources that generate heat and energy (electricity, steam and useful heat). The current price of the carbon tax is USD5/tCO2e and will see additional rises by 2030. It has been noted by CMDIC that the carbon tax does not apply to the site. There are stationary combustion activities at the site including a backup power plant that is seldom used due to the reliability of energy from the grid. In 2024, CMDIC emitted 27,948 tCO2e from fixed combustion sources; however, due to the granularity of the emissions data it cannot be determined if these sources (individually or as a whole) are used for the generation of electricity, steam or useful heat that would exceed the threshold of 25,000 tCO2e for the carbon tax to apply. In accordance with Chile’s Long Term Climate Strategy, the operation could be subject to carbon tax in the future as Chile’s plans to have a comprehensive and efficient system of carbon price instruments by 2030. This could include taxes on emissions and the use of fossil fuels.
CMDIC has set a voluntary commitment to achieve carbon neutrality by 2040 in its Scope 1 and 2 emissions; however, in the National Mining Policy, a mid-term target of reducing emissions by at least 50% by 2030 is stated, along with a long-term target of carbon neutrality of 2040. The policy also states that companies should establish GHG emissions targets for scope 1, 2 and 3, complying with 2030, and thereafter monitor compliance and update as approapriate.
The National Mining Policy also states the following for the mining industry:
| · | Generate zero-emission fleet plans by 2025 for large-scale mining and implement zero-emission fleet by 2030. |
| · | 90% of electricity contracts in the mining sector from renewable sources by 2030 and 100% by 2050. |
To achieve carbon neutrality by 2040, CMDIC has implemented and outlined potential emission reduction opportunities to support this target through the development of a decarbonisation strategy. CMDIC has 100% renewable energy contracts and are piloting trolley assist technology. To further reduce emissions to meet the 2040 target, CMDIC are considering pilot projects on the best available technology to reduce emissions. Technologies include but not limited to CAEX (Computer-Aided Earthmoving System), trolley systems (including hybrid), electric vehicles for personal transportation, fleet renewal or conversion to full electric or latest-generation dual-drive models, on-site renewable energy, fossil fuel replacement and electrification of auxiliary equipment. CMDIC is also evaluating offset projects to offset residual emissions. The efficacy of these projects on this asset are dependent on the mine plan going forward, as some of these may not be suitable for future mine operations, and/or require redesign. It should be noted that no provisions have been made for decarbonisation projects in the financial model.
| November 2025 | ||
| Page |
| SRK Consulting (UK) Limited | Mineral Resources and Mineral Reserves, Collahuasi Copper Mine - Main Report |
| 20.3.6 | Closure planning and provisions |
The first mine closure plan developed for CMDIC was approved by Exempt Resolution No. 1,857 on 22 July 2015 in terms of the transitional arrangements of Law No. 20,551 on Regulations of the Law of the Closure of Mining Sites and Facilities. This plan was updated in May 2018 in alignment with the EIA that was submitted for the project to increase processing capacity to 170 ktpd. That closure plan only included facilities that were specific to the project, did not extend the useful life of the asset and did not update the anticipated closure measures.
In alignment with the EIA approved by RCA 2021, an updated closure plan was submitted in 2021 to SERNAGEOMIN. The scope of this plan includes all existing facilities (including those approved in the 2015 and 2018 closure plans) as well as new facilities and infrastructure assessed in the 2021 EIS. This latest plan was approved by Ex. Res. No. 0324 in March 2023.
The closure cost in the 2021 plan was estimated at UF17m (USD656m as of 23 August 2021). The quantum of financial guarantee was calculated in line with legal requirements and CMDIC provides annual contributions via a combination of permitted instruments which are selected at the time that each provision is made. SRK notes that the closure provision in the LoM financial model is USD473m.
The Closure Plan assumes a 12-year active closure period, followed by a post-closure phase. Monitoring activities are described as taking place during both phases; however, the closure estimate only provides for monitoring to be undertaken in the 12-year active closure phase, as instructed by the regulator. As required by regulation, additional provisions for perpetual maintenance activities were also determined and will be funded by an annuity.
Closure Assumptions
The closure plan describes measures that will be implemented to manage the identified closure risks once operations cease. This phase will last for 12 years and will include all works to rehabilitate and close the project. The measures described are for the infrastructure and footprints described in the EIA that was approved by the 2021 RCA.
In summary, the closure measures described in the plan include:
| · | Construction of additional berms downstream of the TSF to act as secondary spill containment. |
| · | Construction of berms to protect the tailings dam walls. |
| · | Construction of perimeter berms in around the Rosario and Ujina areas to act as access control measures. |
| · | Active capture and treatment of runoff and seepage from the Rosario and South WRD as well as the TSF for a period of 12 years post-closure. |
| · | Construction of upstream stormwater diversion channels and downstream stormwater management drains around key infrastructure. |
| · | Maintenance of the hydraulic barrier around the Rosaio and Ujina pits (for the 12-year closure period) to avoid increased pore pressures and stability risks to the pit walls. |
| · | Closure of processing ponds and dams including liner removal. |
| · | Blocking of access roads. |
| · | The WRD and TSF (after the supernatant ponds is pumped dry) will be capped with 30 cm of granular material to reduce erosion. |
| · | Construction of emergency landfills. |
| · | De-energising of all installations. |
| · | Dismantling, demolition and removal of steel and concrete structures and covering of foundations with rockfill or borrow material up to a maximum of 1.5 m. |
| November 2025 | ||
| Page |
| SRK Consulting (UK) Limited | Mineral Resources and Mineral Reserves, Collahuasi Copper Mine - Main Report |
| · | Flushing of heap leach pad 1 with water following its final leach cycle and then constructing protection dykes around the heap leach pads. |
| · | Covering of leach pad 2 with a 30 cm granular cover. |
| · | Removal of contaminated soils and disposal in landfill. |
| · | Removal of hazardous and non-hazardous wastes to offsite, authorised facilities. |
| · | Sealing off unrequired wells and the pipeline with concrete plugs. |
| · | Placing of warning signs indicating the presence of closed mining facilities. |
During the active closure phase, monitoring activities will continue to track the physical and chemical stability of the pits, waste rock and tailings facilities as well as soil, surface water and groundwater receptors.
Post-closure measures
Once the active closure phase (of 12 years) has been completed then a programme focussed on monitoring and maintenance of the implemented closure measures commences. The 2021 Closure Plan describes a range of monitoring programmes to be continued for durations ranging from 1 to 15 years; however, the costs for this are not reflected in the liability estimate. The latter only provides for biodiversity monitoring programmes at the mine (terrestrial and aquatic studies) and port areas (coastal, intertidal, subtidal and marine) for a period of three years, commencing after the 12-year closure phase.
At this time, the pumping wells in the Coposa and Michincha basins will be sealed and decommissioned. Once the pit dewatering systems are decommissioned, the pits will slowly start to flood with groundwater and surface water runoff. Hydrological modelling of the pit lakes predicts both the Rosario and Ujina pit lakes to gradually fill and reach hydrological equilibrium around the year 2300. Both the Rosario and Ujina pit lakes are expected to remain hydrological sinks after closure, with evaporation as the only output.
The Rosario pit lake is anticipated to develop acidic conditions, due to a high proportion of acid-generating wall rock within the pit, leading to likely leaching of metals, particularly cadmium, copper, lead, and zinc, as well as, to a lesser extent, arsenic. In contrast, the Ujina pit lake presents a moderate risk of acidification and metal leaching, as less of the final pit wall is classified as acid-generating, while the remainder has varying degrees of acid generation potential. Over time, evaporative concentration may further exacerbate contaminant levels in both lakes.
| November 2025 | ||
| Page |
| SRK Consulting (UK) Limited | Mineral Resources and Mineral Reserves, Collahuasi Copper Mine - Main Report |
Comments on accuracy and adequacy of the closure plan
SRK notes the following in respect of the 2021 Mine Closure Plan:
| · | The scope of activities and infrastructure footprints are based on the designs presented in the 2021 EIA for the modifications made at that time. All other designs are as per the 2015 or 2018 EIA as relevant. The plan does not currently include the fully anticipated extent and final footprints of facilities contemplated in the Mineral Reserves case presented in this Technical Report. Further amendments to the closure plan (and adjustments to the associated liability) will be required to ensure adequate funding for the full life of mine liability. SRK expects that this will happen once the EIA for the ACP Growth project is approved, in line with legal requirements. |
| · | The underlying rates that have informed the determination of the quantum for closure are based on rates presented in the initial 2015 closure plan, as instructed by SERNAGEOMIN. The rates determined at that time were based on market related costs to undertake the required closure activities, converted to UF. The latest estimate is based on quantities (areas, volumes etc) for the cumulative project design and rates as per the 2015 closure plan. Good industry practice requires closure liability estimates to be regularly updated using latest market-related costs. Due to the fact that the current estimate is based on rates that are at least 10 years old, the liability is likely inadequate and not reflective of current market-based costs. |
| · | The Closure Plan lacks adequate assessment of long-term solutions to manage anticipated impacts. In some instances, risks have not been fully assessed and in other cases the currently proposed mitigation measures are not aligned with good international industry practice and are likely to be inadequate. Examples include: |
| o | There are no designs to ensure long term restoration of flows to surface water catchments beyond the initial 12-year active closure phase. CMDIC has committed to post-closure monitoring of flow at the Jachucoposa and Michincha springs for five years. While active reinjection is not explicitly committed for a fixed duration post-closure, the plan requires ongoing assessment for the need for continued recharge during the monitoring period for as long as necessary until the spring's natural flow is restored, implying that reinjection may continue beyond 12 years if environmental flows have not recovered to an acceptable state. Some pumping wells in the Coposa and Michincha basin would likely need to be left operational in order to supply water for any flow augmentation required. |
| o | There are no plans to manage the quality (including via potential treatment) of contact water and contaminated, potentially acidic, seepage from waste facilities beyond the initial 12-year closure period. There is a lack of information on anticipated volumes or qualities of water likely to require management beyond the initial 12-year period. |
| o | Monitoring activities are only scheduled to last for the 12-year active closure phase. Whilst the plan does mention that the results of the monitoring during the closure phase must be reviewed at the end of this period, there are currently no financial provisions to continue monitoring to evaluate the impacts once active water treatment and recharge programmes cease. |
| o | No impermeable cover is planned on the WRD or TSF, which may represent a risk to groundwater and surface water with this design when/if the water treatment plant is switched off. |
| November 2025 | ||
| Page |
| SRK Consulting (UK) Limited | Mineral Resources and Mineral Reserves, Collahuasi Copper Mine - Main Report |
| o | The plan and associated estimate do not contemplate the need for flushing of heap leach pad 2 or the placement of a cover on heap leach pad 1. The reasons for the difference in planned closure measures is not clear. |
| o | Slope stability of WRD will require further assessment to more robustly determine what measures are required to ensure appropriate factors of safety in the long term., Redesign of the dumps and associated footprints may be required to achieve the appropriate FoS, which will in turn need to be considered in future permit applications. |
| o | The closure designs contemplated in the closure plan do not consider the influence of physical climate change effects on the long-term suitability of the designs. |
| o | Activities contemplated in the perpetual maintenance component of the closure plan do not consider the potential need for maintenance of long-term water treatment infrastructure, whether this be in the form of active or passive systems. |
| o | The closure plan and liability assessment do not consider the social implications of mine closure for example retrenchment costs of staff, social investment programmes, staff reskilling, local economic development, etc. |
As a result of the above observations, SRK is of the opinion that the current CMDIC closure liability is likely to be underestimated in terms of adequacy of the financial quantum (due to outdated rates and likely inadequate closure measures), accuracy in terms of underlying assumptions (such as duration of mitigation actions required to manage impacts), as well as completeness of the perpetual maintenance activities.
Considering these factors, the closure cost estimate for the LoM case is likely to exceed USD1,000m, which would potentially double the current annual closure provisions. This estimate is based on the principal of local regulatory compliance, if the estimate were to be brought in line with best international practices (market-based rates) then the increase could be substantially higher than the revised estimate presented above.
SRK understands that research activities are in progress to improve understanding of some potential long-term closure risks (e.g. passive water treatment solutions). This will assist in mitigating these risks by the time planned closure takes place. Should unplanned closure take place prior to advancement of these workstreams, however, then there is a risk that currently proposed mitigation measures may prove ineffective, inadequate or significantly more costly than anticipated.
| November 2025 | ||
| Page |
| SRK Consulting (UK) Limited | Mineral Resources and Mineral Reserves, Collahuasi Copper Mine - Main Report |
| ITEM 21 | CAPITAL AND OPERATING COSTS |
| 21.1 | Introduction |
Table 21-1 shows the LoM plan mining and processing production, direct operating costs, capital costs, C1 Cash Costs and C1 All in Sustaining Cost in 5-year increments.
Commentary on the forecast physical production assumptions are included above in Section 16.10, 16.11 and 17.3.2.
Commentary on capital and operating costs are included below. Capital costs include project and sustaining capital. Capitalised deferred stripping costs are included separately Table 21-1.
Direct operating costs have been estimated by CMDIC and are informed by current budgets and recent actual data. Direct operating costs include mining, processing (processing, pipeline and port costs) and indirects (G&A). Mining costs presented in Table 21-1 show the costs before and after the adjustment for capitalised deferred stripping costs.
C1 Cash Costs are presented in Table 21-1 in USD terms and unit costs per pound payable copper production with direct mining costs adjusted to exclude capitalised deferred stripping costs. Realisation costs include TC/RC, impurity penalties (As in concentrate), metallurgical deductions and freight. By-product credits include revenue from sale of molybdenum concentrate (credits for gold and silver payable in concentrate are excluded).
C1 All in Sustaining Costs include stock movements, other costs (including closure costs), deferred stripping and sustaining capital costs.
Collahuasi is subject to a mining royalty which consists of: 1) a 1% ad valorem component on copper revenue; and 2) a profit based component ranging from 8% to 26% on adjusted operating profits (this is capped so the overall effective tax rate for royalties, corporate tax and dividend withholding tax does not exceed 46.5%). A corporate tax rate of 27% on taxable profits is applicable to Collahuasi.
| November 2025 | ||
| Page |
| SRK Consulting (UK) Limited | Mineral Resources and Mineral Reserves, Collahuasi Copper Mine - Main Report |
Table 21-1: Life of Mine production, operating and capital costs (5-year increments)
| Description | Units | LoM | 2025-2029 | 2030-2034 | 2035-2039 | 2040-2044 | 2045-2049 | 2050-2054 | 2055-2059 | 2060-2064 | 2065-2069 | 2070-2074 | 2075-2079 | 2080-2084 |
| Mining | ||||||||||||||
| Ore mined | kt | 3,790,208 | 361,016 | 335,372 | 297,329 | 306,861 | 466,522 | 326,372 | 534,298 | 466,725 | 464,791 | 125,057 | 74,825 | 31,040 |
| Copper grade | %CuT | 0.81% | 0.88% | 0.88% | 0.88% | 0.83% | 0.84% | 0.88% | 0.80% | 0.73% | 0.70% | 0.75% | 0.69% | 0.80% |
| Contained copper | Cu kt | 30,738 | 3,191 | 2,936 | 2,627 | 2,534 | 3,909 | 2,880 | 4,294 | 3,416 | 3,250 | 933 | 518 | 249 |
| Waste mined | kt | 9,998,308 | 1,092,342 | 1,047,537 | 1,068,806 | 1,132,932 | 1,080,222 | 1,193,860 | 1,004,273 | 983,447 | 686,624 | 358,166 | 346,151 | 3,946 |
| Total material mined | kt | 13,788,516 | 1,453,358 | 1,382,909 | 1,366,134 | 1,439,794 | 1,546,744 | 1,520,232 | 1,538,571 | 1,450,172 | 1,151,416 | 483,223 | 420,976 | 34,986 |
| Strip ratio | w:o | 2.64 | 3.03 | 3.12 | 3.59 | 3.69 | 2.32 | 3.66 | 1.88 | 2.11 | 1.48 | 2.86 | 4.63 | 0.13 |
| Processing | ||||||||||||||
| Ore processed | kt | 4,107,031 | 346,362 | 383,460 | 383,032 | 383,504 | 383,460 | 383,231 | 383,460 | 383,670 | 383,238 | 383,081 | 184,925 | 125,609 |
| Copper grade | %CuT | 0.79% | 0.92% | 0.85% | 0.81% | 0.77% | 0.92% | 0.82% | 0.91% | 0.81% | 0.78% | 0.53% | 0.53% | 0.55% |
| Contained copper | Cu kt | 32,458 | 3,174 | 3,248 | 3,092 | 2,963 | 3,526 | 3,158 | 3,493 | 3,089 | 2,984 | 2,046 | 988 | 697 |
| Molybdenum grade | ppm | 209 | 217 | 268 | 204 | 187 | 227 | 86 | 286 | 273 | 250 | 141 | 137 | 147 |
| Contained Mo | Mo kt | 856 | 75 | 103 | 78 | 72 | 87 | 33 | 110 | 105 | 96 | 54 | 25 | 18 |
| Copper concentrate (pre-Moly & Filter plant) | kt | 100,121 | 10,253 | 10,397 | 9,694 | 9,319 | 11,472 | 9,736 | 10,966 | 9,437 | 9,030 | 5,832 | 2,366 | 1,619 |
| Copper grade | %CuT | 27.47% | 26.07% | 26.44% | 26.63% | 26.53% | 26.61% | 27.28% | 27.64% | 28.62% | 28.46% | 28.95% | 32.93% | 33.71% |
| Contained copper | Cu kt | 27,499 | 2,673 | 2,749 | 2,581 | 2,473 | 3,052 | 2,656 | 3,032 | 2,701 | 2,570 | 1,688 | 779 | 546 |
| Contained copper | Cu klb | 60,624,709 | 5,892,518 | 6,059,666 | 5,690,544 | 5,451,361 | 6,729,552 | 5,855,017 | 6,683,363 | 5,954,918 | 5,665,026 | 3,721,384 | 1,717,898 | 1,203,463 |
| Overall copper recovery | % | 84.72% | 84.21% | 84.63% | 83.49% | 83.44% | 86.57% | 84.09% | 86.79% | 87.44% | 86.11% | 82.52% | 78.88% | 78.35% |
| Molybdenum concentrate | kt | 710 | 80 | 114 | 66 | 59 | 61 | 27 | 86 | 83 | 71 | 40 | 12 | 12 |
| Molybdenum grade | %Mo | 31.86% | 31.97% | 31.66% | 31.87% | 31.92% | 31.92% | 32.49% | 31.71% | 31.73% | 31.75% | 32.08% | 32.29% | 32.15% |
| Contained molybdenum | Mo kt | 226 | 26 | 36 | 21 | 19 | 19 | 9 | 27 | 26 | 23 | 13 | 4 | 4 |
| Overall molybdenum recovery | % | 26.43% | 33.88% | 35.01% | 26.88% | 26.11% | 22.38% | 26.57% | 24.80% | 25.24% | 23.51% | 23.83% | 15.43% | 20.51% |
| Product Sales | ||||||||||||||
| Copper concentrate | kt | 99,468 | 10,173 | 10,283 | 9,628 | 9,260 | 11,411 | 9,709 | 10,880 | 9,354 | 8,959 | 5,792 | 2,354 | 1,665 |
| Copper grade | %CuT | 27.64% | 26.25% | 26.70% | 26.79% | 26.69% | 26.74% | 27.35% | 27.84% | 28.85% | 28.66% | 29.13% | 33.09% | 33.54% |
| Contained copper | Cu kt | 27,493 | 2,671 | 2,746 | 2,579 | 2,471 | 3,051 | 2,655 | 3,029 | 2,699 | 2,568 | 1,687 | 779 | 558 |
| Contained copper | Cu klb | 60,612,303 | 5,887,945 | 6,053,152 | 5,686,762 | 5,447,989 | 6,726,060 | 5,853,467 | 6,678,445 | 5,950,135 | 5,660,960 | 3,719,086 | 1,717,202 | 1,231,098 |
| November 2025 | ||
| Page |
| SRK Consulting (UK) Limited | Mineral Resources and Mineral Reserves, Collahuasi Copper Mine - Main Report |
| Description | Units | LoM | 2025-2029 | 2030-2034 | 2035-2039 | 2040-2044 | 2045-2049 | 2050-2054 | 2055-2059 | 2060-2064 | 2065-2069 | 2070-2074 | 2075-2079 | 2080-2084 |
| Molybdenum concentrate | kt | 711 | 80 | 114 | 66 | 59 | 61 | 27 | 86 | 83 | 71 | 40 | 12 | 13 |
| Molybdenum grade | %Mo | 31.84% | 31.97% | 31.66% | 31.87% | 31.92% | 31.92% | 32.49% | 31.71% | 31.73% | 31.75% | 32.08% | 32.29% | 31.10% |
| Contained molybdenum | Mo kt | 226 | 26 | 36 | 21 | 19 | 19 | 9 | 27 | 26 | 23 | 13 | 4 | 4 |
| Gross Revenue | ||||||||||||||
| Copper revenue (after deductions) | USDm | 227,793 | 22,088 | 22,723 | 21,351 | 20,451 | 25,251 | 21,994 | 25,110 | 22,401 | 21,307 | 14,004 | 6,473 | 4,640 |
| Copper price | USD/lb | 3.90 | 3.90 | 3.90 | 3.90 | 3.90 | 3.90 | 3.90 | 3.90 | 3.90 | 3.90 | 3.90 | 3.90 | 3.90 |
| Molybdenum revenue (after deductions) | USDm | 5,312 | 598 | 844 | 493 | 440 | 456 | 206 | 638 | 621 | 528 | 302 | 92 | 92 |
| Molybdenum price | USD/lb | 14.00 | 14.00 | 14.00 | 14.00 | 14.00 | 14.00 | 14.00 | 14.00 | 14.00 | 14.00 | 14.00 | 14.00 | 14.00 |
| Direct operating costs | ||||||||||||||
| Mining (including deferred stripping) | USDm | 44,620 | 4,063 | 4,135 | 4,209 | 4,491 | 4,623 | 4,816 | 4,775 | 4,565 | 3,807 | 2,331 | 1,971 | 834 |
| Deferred stripping | USDm | -6,331 | -1,261 | -460 | -1,570 | -741 | -1,283 | -501 | - | -284 | -230 | - | - | - |
| Mining (excl. deferred stripping) | USDm | 38,289 | 2,802 | 3,675 | 2,639 | 3,750 | 3,340 | 4,315 | 4,775 | 4,281 | 3,576 | 2,331 | 1,971 | 834 |
| Unit mining cost (per tonne mined) | USD/t | 3.24 | 2.80 | 2.99 | 3.08 | 3.12 | 2.99 | 3.17 | 3.10 | 3.15 | 3.31 | 4.82 | 4.68 | 23.85 |
| Processing & Port | USDm | 43,848 | 3,598 | 3,913 | 3,953 | 4,017 | 4,017 | 4,015 | 4,017 | 4,018 | 4,015 | 4,014 | 2,470 | 1,802 |
| Unit processing cost (per tonne processed) | USD/t | 10.68 | 10.39 | 10.21 | 10.32 | 10.47 | 10.47 | 10.48 | 10.47 | 10.47 | 10.48 | 10.48 | 13.36 | 14.35 |
| G&A | USDm | 10,785 | 1,021 | 971 | 917 | 949 | 1,045 | 1,035 | 1,022 | 972 | 933 | 713 | 699 | 508 |
| Unit G&A cost (per tonne processed) | USD/t | 2.63 | 2.95 | 2.53 | 2.39 | 2.47 | 2.73 | 2.70 | 2.67 | 2.53 | 2.44 | 1.86 | 3.78 | 4.05 |
| Total Direct Operating Cost (excl. deferred stripping) | USDm | 92,923 | 7,420 | 8,560 | 7,509 | 8,715 | 8,402 | 9,365 | 9,814 | 9,271 | 8,525 | 7,057 | 5,140 | 3,145 |
| Total Unit cost (per tonne processed) | USD/t | 22.63 | 21.42 | 22.32 | 19.60 | 22.73 | 21.91 | 24.44 | 25.59 | 24.16 | 22.24 | 18.42 | 27.80 | 25.04 |
| Capital costs | ||||||||||||||
| Project capital | USDm | 1,874 | 1,874 | - | - | - | - | - | - | - | - | - | - | - |
| Stay in Business capital (excluding deferred stripping) | USDm | 22,877 | 2,352 | 1,699 | 1,842 | 2,214 | 2,116 | 2,026 | 1,984 | 2,361 | 1,917 | 1,573 | 1,805 | 989 |
| Deferred stripping | USDm | 6,331 | 1,261 | 460 | 1,570 | 741 | 1,283 | 501 | - | 284 | 230 | - | - | - |
| Total Capital Costs | USDm | 31,082 | 5,487 | 2,159 | 3,412 | 2,955 | 3,398 | 2,527 | 1,984 | 2,645 | 2,147 | 1,573 | 1,805 | 989 |
| November 2025 | ||
| Page |
| SRK Consulting (UK) Limited | Mineral Resources and Mineral Reserves, Collahuasi Copper Mine - Main Report |
| Description | Units | LoM | 2025-2029 | 2030-2034 | 2035-2039 | 2040-2044 | 2045-2049 | 2050-2054 | 2055-2059 | 2060-2064 | 2065-2069 | 2070-2074 | 2075-2079 | 2080-2084 |
| C1 Cash Cost | ||||||||||||||
| Production: payable | Cu klb | 58,396,264 | 5,663,666 | 5,826,447 | 5,474,505 | 5,243,832 | 6,474,500 | 5,639,426 | 6,438,580 | 5,743,895 | 5,463,441 | 3,590,708 | 1,659,676 | 1,177,589 |
| Production: molybdenum payable | Mo kt | 172 | 19 | 27 | 16 | 14 | 15 | 7 | 21 | 20 | 17 | 10 | 3 | 3 |
| Direct production cost (excluding deferred stripping, including stockpile inventories) | USDm | 93,129 | 7,579 | 8,608 | 7,509 | 8,715 | 8,401 | 9,365 | 9,814 | 9,271 | 8,525 | 7,057 | 5,140 | 3,145 |
| Realisation costs | USDm | 17,060 | 1,716 | 1,813 | 1,685 | 1,597 | 1,927 | 1,666 | 1,843 | 1,591 | 1,526 | 988 | 414 | 294 |
| C1 cash cost before credits | USDm | 110,189 | 9,294 | 10,421 | 9,194 | 10,313 | 10,329 | 11,030 | 11,657 | 10,862 | 10,051 | 8,045 | 5,555 | 3,439 |
| By-product credits (molybdenum only) | USDm | -3,784 | -427 | -601 | -351 | -314 | -325 | -147 | -455 | -442 | -376 | -215 | -66 | -66 |
| C1 cash cost after credits | USDm | 106,405 | 8,868 | 9,820 | 8,842 | 9,999 | 10,004 | 10,884 | 11,202 | 10,420 | 9,674 | 7,830 | 5,489 | 3,373 |
| Direct production cost (excluding deferred stripping, including stockpile inventories) | USD/lb Cu | 1.59 | 1.34 | 1.48 | 1.37 | 1.66 | 1.30 | 1.66 | 1.52 | 1.61 | 1.56 | 1.97 | 3.10 | 2.67 |
| Realisation costs | USD/lb Cu | 0.29 | 0.30 | 0.31 | 0.31 | 0.30 | 0.30 | 0.30 | 0.29 | 0.28 | 0.28 | 0.28 | 0.25 | 0.25 |
| C1 cash cost before credits | USD/lb Cu | 1.89 | 1.64 | 1.79 | 1.68 | 1.97 | 1.60 | 1.96 | 1.81 | 1.89 | 1.84 | 2.24 | 3.35 | 2.92 |
| By-product credits (Molybdenum only) | USD/lb Cu | -0.06 | -0.08 | -0.10 | -0.06 | -0.06 | -0.05 | -0.03 | -0.07 | -0.08 | -0.07 | -0.06 | -0.04 | -0.06 |
| C1 cash cost after credits | USD/lb Cu | 1.82 | 1.57 | 1.69 | 1.62 | 1.91 | 1.55 | 1.93 | 1.74 | 1.81 | 1.77 | 2.18 | 3.31 | 2.86 |
| C1 All in Sustaining Cost | ||||||||||||||
| All in Sustaining Cost (excl royalty) | USDm | 137,116 | 12,565 | 12,106 | 12,364 | 13,041 | 13,546 | 13,521 | 13,336 | 13,207 | 11,992 | 9,518 | 7,409 | 4,510 |
| Royalty | USDm | 12,602 | 1,310 | 1,433 | 951 | 852 | 1,864 | 955 | 1,932 | 1,324 | 1,459 | 450 | 40 | 31 |
| All in Sustaining Cost (including royalty) | USDm | 149,718 | 13,875 | 13,540 | 13,316 | 13,892 | 15,410 | 14,475 | 15,268 | 14,531 | 13,451 | 9,969 | 7,449 | 4,540 |
| All in Sustaining Cost (excluding royalty) | USD/lb Cu | 2.35 | 2.22 | 2.08 | 2.26 | 2.49 | 2.09 | 2.40 | 2.07 | 2.30 | 2.19 | 2.65 | 4.46 | 3.83 |
| Royalty | USD/lb Cu | 0.22 | 0.23 | 0.25 | 0.17 | 0.16 | 0.29 | 0.17 | 0.30 | 0.23 | 0.27 | 0.13 | 0.02 | 0.03 |
| All in Sustaining Cost (excluding royalty) | USD/lb Cu | 2.56 | 2.45 | 2.32 | 2.43 | 2.65 | 2.38 | 2.57 | 2.37 | 2.53 | 2.46 | 2.78 | 4.49 | 3.86 |
| November 2025 | ||
| Page |
| SRK Consulting (UK) Limited | Mineral Resources and Mineral Reserves, Collahuasi Copper Mine - Main Report |
| 21.2 | Capital Costs |
| 21.2.1 | Project capital |
The LoM plan includes project capital of USD1,874m which are scheduled to be incurred between 2025 and 2029.
The main elements of the project capital costs are:
| · | C20+ Project: desalination and pipeline: USD772m forecast spend. |
| · | Process plant 6 rougher cells (Project PG1): USD26m. |
| · | Capacity 185 ktpd (Project PG3A): USD212m. |
| · | Capacity 210 ktpd (Project PG210): USD560m. |
| · | Other: USD303m |
| 21.2.2 | Sustaining capital |
Sustaining capital costs (excluding capitalised deferred stripping costs) total USD22,877m over the LoM. Annual costs vary between USD200m to USD550m per annum, averaging some USD400m per annum over the LoM. In addition, capitalized deferred stripping costs total 6,331m over the LoM. Figure 21-1 shows the sustaining capital costs over the LoM in 5 year increments and allocated to four main categories:
| · | Mine and Plant Equipment: Includes mining fleet replacement and overhaul expenditure determined by the mine planning team based on unit operating hours. Plant equipment relates to fixed plant equipment maintenance and overhauls for the processing plant. |
| · | Buildings: Includes tailings dam wall construction, dewatering expenditure (i.e. progressive dewater well drilling and installations) and an allowance for general buildings expenditure. |
| · | Other: Includes EIA compensation (i.e. Including ongoing environmental monitoring commitments) and community expenditure, power supply related expenditure (i.e. including replacement and maintenance of existing electrical infrastructure) and a general allowance for other items (for civils and infrastructu.re). |
| · | Deferred stripping: capitalized waste mining costs |
| November 2025 | ||
| Page |
| SRK Consulting (UK) Limited | Mineral Resources and Mineral Reserves, Collahuasi Copper Mine - Main Report |
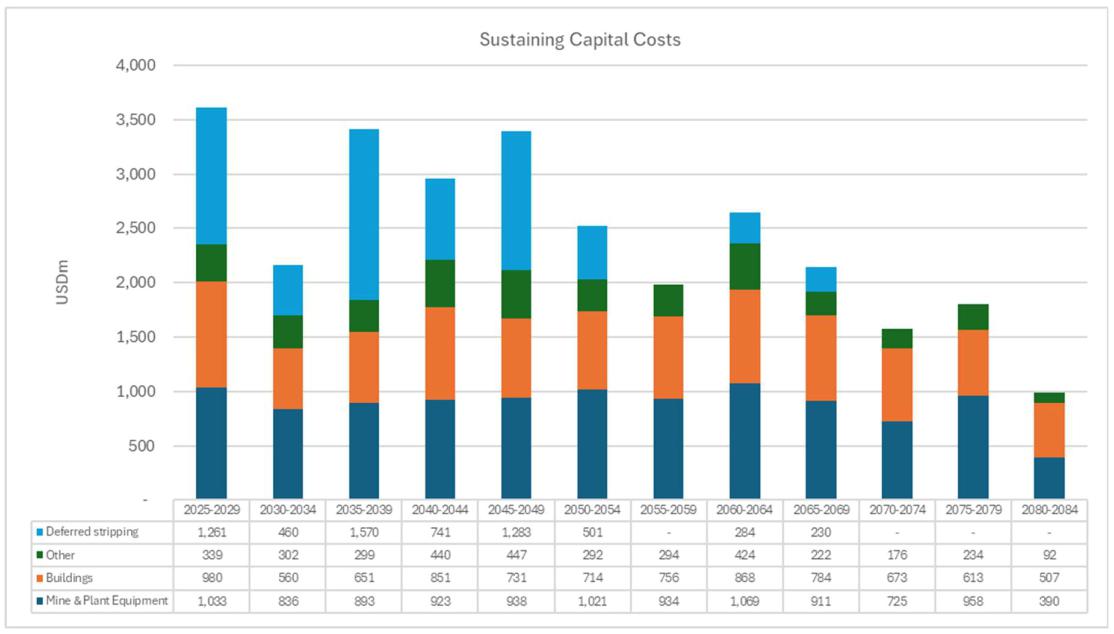
Figure 21-1: Sustaining capital costs
| 21.3 | Operating Costs |
| 21.3.1 | Direct operating costs |
Figure 21-2 illustrates the direct operating costs for mining (showing including and excluding capitalised deferred stripping costs), processing (including port) and indirects (G&A) in 5 year increments and associated unit costs (mining cost expressed per tonne of total material mined, processing and indirects expressed per tonne processed).
Forecast operating costs are in line with recent actual costs incurred by the operation. Prior to reduction in mined tonnages at the end of the LoM the mining unit costs vary between USD2.7/t mined and USD5.4/t mined with an appropriate increase in unit costs observed later in the mine life reflecting increased haulage distances as the pit deepens. Prior to processing lower tonnages towards the end of the mine life (from 2075) processing unit costs vary between USD10-11/t processed, averaging USD10.4/t – these costs are in line with recent actual unit costs and also reflect an appropriate slight reduction in unit costs once the operations achieve expanded production of 210ktpd. Indirect costs average some USD180m per annum over the full LoM which is consistent with recent actual costs.
| November 2025 | ||
| Page |
| SRK Consulting (UK) Limited | Mineral Resources and Mineral Reserves, Collahuasi Copper Mine - Main Report |
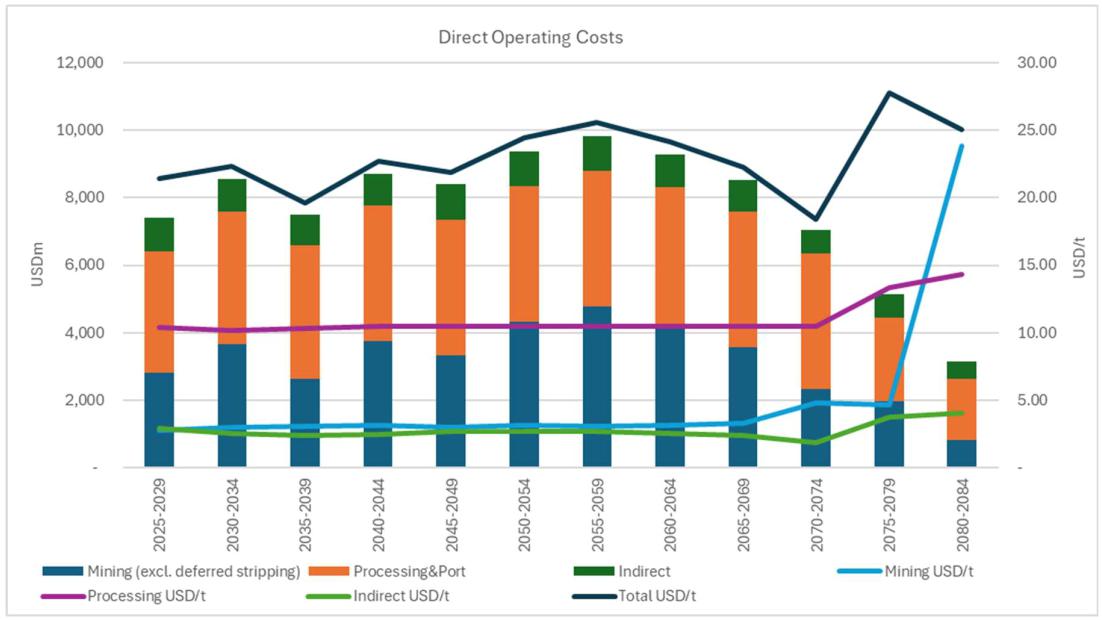
Figure 21-2: Direct operating costs
| 21.3.2 | Realisation costs |
Copper
Over the LoM the average payable copper in concentrate equates to 96.4% which is aligned with industry benchmark terms for copper concentrate specifications. The concentrate grade over the LoM is forecast to generally be below 30% (apart from the latter years of the LoM, beyond 2075).
Long-term treatment and refining charges (TC, RC) and freight costs are summarised in Table 21-2. It is noted that in 2025, the TC/RC assumptions are USD30/t and USD0.03/lb copper respectively to reflect current market conditions but are assumed to increase gradually over the next 5 years reaching the long term assumption from 2029.
Arsenic (As) levels in the copper concentrate attract a penalty based on exceedances greater than 2,000ppm (0.2% As) which reflects the international reference benchmark base Higher arsenic levels are expected to be recovered to copper concentrate in the earlier year of the LoM plan which is illustrated in Figure 21-3, which shows the As grade in concentrate (ppm) and the overall effective penalty in USD/t concentrate (dry). Over the LoM the average penalty for As levels in concentrate equates to USD5.1/t concentrate.
Other realisation costs on sale of copper concentrate include insurance, surveying, umpire assaying and other costs.
Figure 21-4 summarises the realisation costs applicable to sale of copper concentrate over the LoM.
Table 21-2: TC/RC, Freight
| Description | Unit | Assumption |
| Treatment charge | USD/t conc | 63 |
| Refining charge | USD/lb Cu payable | 0.063 |
| Freight | USD/t conc (dry) | 58.2 |
| November 2025 | ||
| Page |
| SRK Consulting (UK) Limited | Mineral Resources and Mineral Reserves, Collahuasi Copper Mine - Main Report |
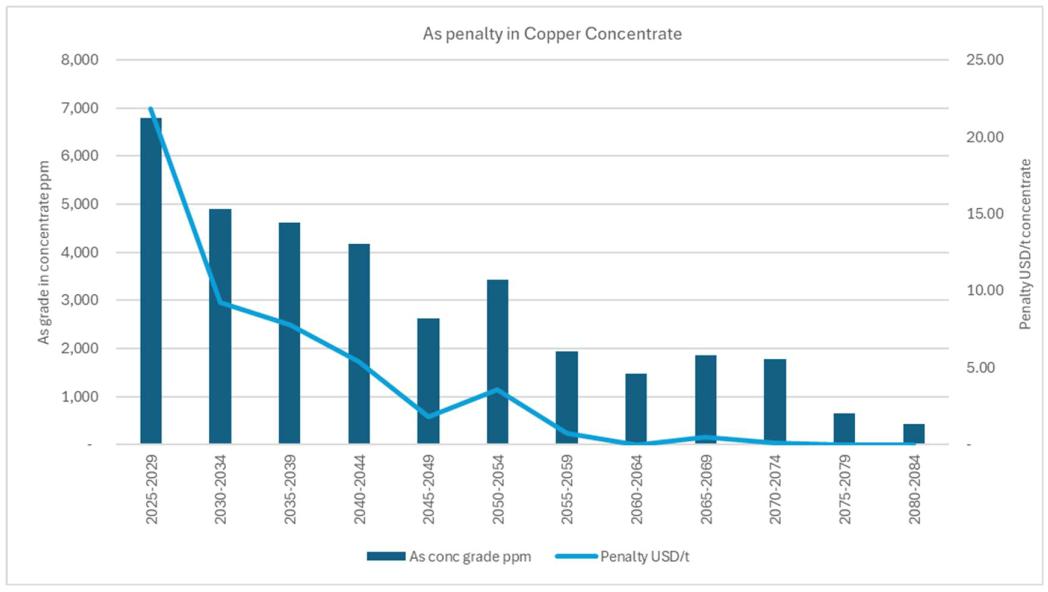
Figure 21-3: Arsenic penalty in copper concentrate
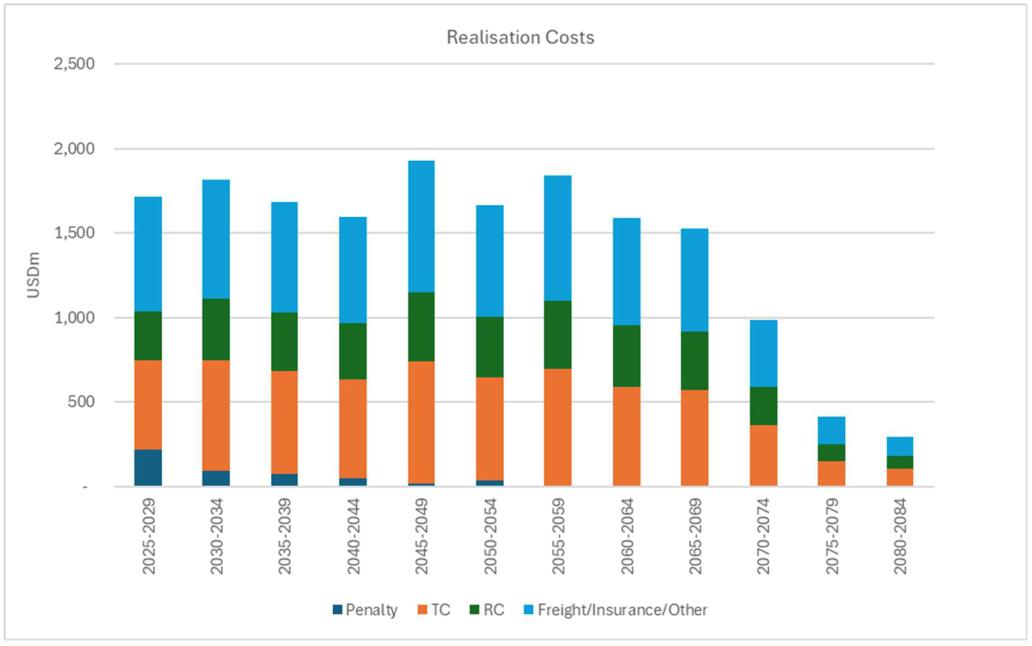
Figure 21-4: Copper concentrate realisation costs
Molybdenum
By-product credit for sale of molybdenum (Mo) concentrate is net of realisation costs including price participation, treatment charge, freight and insurance.
Over the LoM the molybdenum concentrate is forecast to have a molybdenum grade of between 25% and 35% Mo and is therefore lower than typical reference benchmark concentrate grades. Over the LoM the average payable molybdenum in concentrate equates to 76% which is aligned with actual historical averages. A long-term freight cost from 2029 of USD173/t molybdenum concentrate (dry) is assumed, increasing from an assumption of USD168/t in 2025.
| November 2025 | ||
| Page |
| SRK Consulting (UK) Limited | Mineral Resources and Mineral Reserves, Collahuasi Copper Mine - Main Report |
Over the LoM the average combined concentrate charges equates to USD3.7/lb payable Mo. Inclusive of freight and other charges this equates to USD4.0/lb payable Mo.
| 21.3.3 | C1 Cash cost and all in sustaining cost |
C1 cash costs are illustrated in Figure 21-5 in USD unit costs per pound payable copper production before and after molybdenum by-product credits. C1 cash costs are forecast to vary between USD1.5/lb and USD2.0/lb payable copper until 2070 thereafter increasing at the end of the mine life with reduced copper production.
C1 All in Sustaining Costs include stock movements, other costs (including closure costs, USD473m), deferred stripping and sustaining capital costs. Figure 21-5 also includes the C1 All in Sustaining Cost before and after royalties which are forecast to vary between approximately USD2.0/lb and USD2.5/lb payable copper until 2070 thereafter increasing at the end of the mine life with reduced copper production.
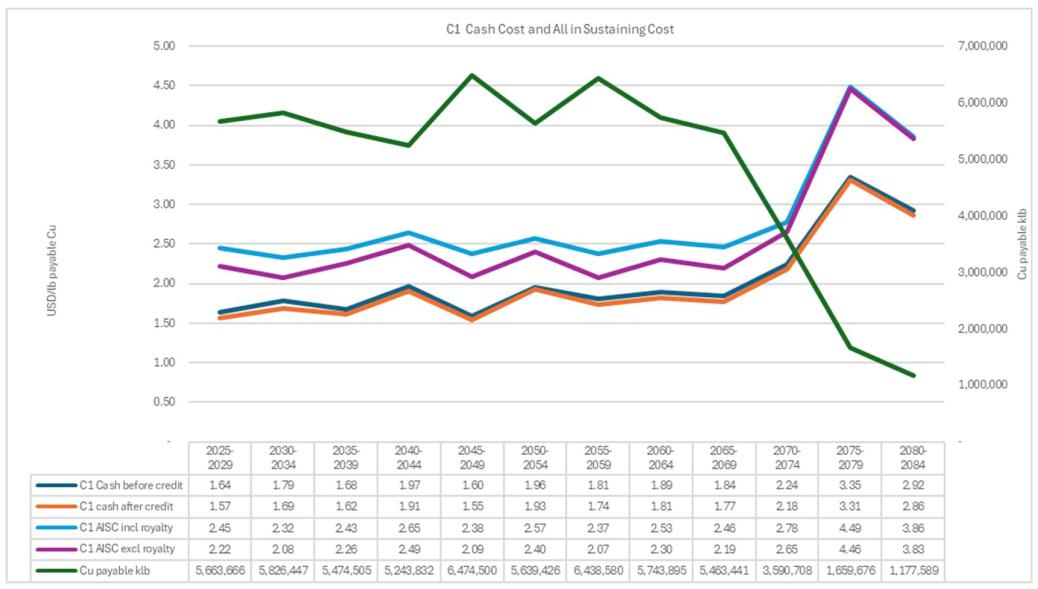
Figure 21-5: C1 Cash Cost and All in Sustaining Cost
| 21.4 | Reserves Reporting Assessment |
SRK has made a sensitivity assessment on the overall project economics to the risks identified including higher project capital costs, dewatering costs, tailings costs and closure costs and is satisfied that the project continues to demonstrate positive economics in support of reporting Ore Reserves.
| November 2025 | ||
| Page |
| SRK Consulting (UK) Limited | Mineral Resources and Mineral Reserves, Collahuasi Copper Mine - Main Report |
| ITEM 22 | ECONOMIC ANALYSIS |
Issuers who are classified as a producing issuer “may exclude the information required under Item 22 for technical reports on properties currently in production unless the technical report includes a material expansion of current production”. Currently planned increases in process throughput from 170ktpd to 210ktpd are not considered by Anglo American to be a material expansion of current production.
| ITEM 23 | ADJACENT PROPERTIES |
No information from adjacent properties has been used in the preparation of this report.
Details of the Quebrada Blanca operation which is located circa 10km to the west of CMDIC operations can be found in the “NI 43-101 Technical Report Quebrada Blanca Operations Región de Tarapacá, Chile, December 31, 2024” filed on Sedar+ (https://www.sedarplus.ca/).
| ITEM 24 | OTHER RELEVANT DATA AND INFORMATION |
No other relevant data is presented herein.
| ITEM 25 | INTERPRETATION AND CONCLUSIONS |
The Collahuasi asset has the potential to form a long-life operation, which is following a structured plan to deliver increasing value. Through the developments planned in 2025 and 2026 the operation should achieve its objectives of the “optimisation phase” that will realise production rates in the order of 210 ktpd, coupled with steps to deliver more sustainable practices, including the reduction of its reliance on groundwater sources. Thereafter the opportunity for achieving the goals of the ACP Growth phase and further increased production still needs to be tested.
Operational challenges in recent years, dating back to the COVID-19 pandemic period have led to certain constraints with the mine and plant, which CMDIC is actively trying to mitigate. These challenges will likely lead to similar production figures being achieved in 2025 and 2026, which if not addressed may impact the short-term plan further.
SRK understands that the CMDIC mining concessions are in good standing and constitute all of the mineral rights that are required to permit exploitation of the deposits. Furthermore, SRK understands that CMDIC has the legal right to mine and extract minerals from the Rosario deposit to 2041 and Ujina to 2027 (mining assumed to recommence 2043). The portion of Mineral Reserves constrained by this period represents approximately 30% of the current total. CMDIC’s right to extract minerals from the Rosario and Ujina pits beyond 2041 (Rosario pit) requires the completion of the necessary technical studies and associated impact assessments, to inform an updated EIA, to be submitted in 2027. The scope of the updated EIA is presently focused on a potential expansion to achieve a production rate of 370 ktpd, with approval anticipated in 2030. Should the expansion case to 370 ktpd be deferred, a revised application for an environment permit will be required to support the right to extract Mineral Reserves beyond 2041.
| November 2025 | ||
| Page |
| SRK Consulting (UK) Limited | Mineral Resources and Mineral Reserves, Collahuasi Copper Mine - Main Report |
SRK has reviewed the methodology applied and the results obtained for the 2024 Mineral Resource Estimation completed by CMDIC. The Mineral Resources have an effective date of 31 December 2024. SRK is satisfied that the current drilling information is sufficiently reliable to interpret with confidence the copper and molybdenum mineralization and that the assay data are sufficiently reliable to support Mineral Resource estimation. SRK has reviewed the estimation process, and conducted sufficient validation to accept the estimate as presented along with the application of Mineral Resource classification and RPEEE, sufficient to support the reporting of Mineral Resources in the Measured, Indicated and Inferred categories. The audited Mineral Resources reported herein on an exclusive basis represent 47 Mt of Measured Mineral Resources at a grade of 0.80%Cu and 193 ppm Mo, 1,450 Mt of Indicated Mineral Resources at a grade of 0.77%Cu and 268 ppm Mo, and 4,990 Mt of Inferred Mineral Resources at a grade of 0.72%Cu and 144 ppm Mo.
SRK has reviewed the methodology applied and the results obtained for the 2024 Mineral Reserve Estimation completed by CMDIC. SRK is satisfied that the conversion of Mineral Resources to Mineral Reserves was undertaken using appropriate mine design and planning practices. Dilution and mining recovery assumptions are supported by historical operational data and are modelled following industry standard practices at appropriate cut-off grades. The audited Mineral Reserves equate reported herein represent 1,032 Mt of Proven Mineral Reserves at a grade of 0.82%Cu and 166 ppm Mo and 3,075 Mt of Probable Mineral Reserves at a grade of 0.78%Cu and 215 ppm Mo.
As an operating mine, all required support infrastructure and services are in place to support mining and processing operations. Anything required for the 210 ktpd project will be provided under the FEL3 study.
No fatal flaws have been identified for the Pampa Pabellón TSF including the future expansion project. The TSF currently complies with all relevant Chilean regulations with no immediate or critical risks identified by the independent Dam Safety Review in 2024; however, development of the level of design detail for the post 2041 deposition schedule is required as well as attention to several key issues and risks identified in the WSP 2024 options assessment. The expansion case is currently linked to the ACP Growth Phase project; however, SRK notes that the expansion design and associated permitting application will be required regardless of the decision to proceed with the ACP Growth phase or not.
SRK notes that certain elements of the operation have focused on the period up to 2041, which is aligned with the current period of the EIA. In order to support future life of asset planning, the level of design detail for the period beyond 2041 requires further data collection and studies to bring in line with the level of planning currently implemented for the period 2030-2041. The operation is also currently in the process of implementing or planning for a series of capital projects which when combined supports the planned production expansion to 210 ktpd. Current indications are that the C20+, 185 ktpd execution project and 210 ktpd project, whilst at differing level of progress are on schedule, or have sufficient opportunity to address of schedule risks, and on budget when inclusive of contingency.
| November 2025 | ||
| Page |
| SRK Consulting (UK) Limited | Mineral Resources and Mineral Reserves, Collahuasi Copper Mine - Main Report |
In presenting the Mineral Resources and Mineral Reserves for the Collahuasi operation, SRK notes the following risks and opportunities:
Risks
| · | Summary documentation, inclusive of several independent audit reports, indicates that the geological data has been collected in a manner which is generally comprehensive by industry standards, with no significant issues being flagged. Notwithstanding this observation, there are various gaps in the source raw data which have not been possible to validate. |
| · | There is some uncertainty around the quality of data available for the Ujina deposit mainly due to lack of documentation and lack of records sufficiently detailed for a meaningful production reconciliation. The last phase of infill drilling for the Ujina deposit was conducted in 2007-2008 after mining ceased in 2004. Historical records associated with data quality and pit operations are limited or no longer available, and available records do not align with the level of information available for the Rosario pit. Up to the cessation of mining a total of approximately 46 Mt of oxide and 213 Mt of sulphide material was extracted from the Ujina pit. Some limited twin drilling has recently been completed as part of a more extensive infill drilling programme, SRK has reviewed all recent drilling and compared it with the historical drilling and concludes that holistically, the new drilling supports the historical drilling; however, further work is required to validate the data more thoroughly and the models and design parameters that were established circa 10-15 years previously. |
| · | The Rosario West deposit is characterised by minerals associated with higher arsenic content (e.g. enargite), consequently as the proportion of ore feed derived from the Rosario West deposit increases there is greater potential for As to report to the Cu concentrate and risk that greater quantities of out-of-specification concentrate be produced which, in turn, could lead to selling price penalties/reductions. |
| · | Stockpile balances are principally based on dispatch data and end or period surveys, and historical block model grade estimates. Given the period of time over which these have been accumulated, the confidence in historical production data has not been possible to validate beyond the volumes covered by the recent drilling and trenching exercises which account for circa 80-100 Mt of material. |
| · | Recent pit inspections noted the occurrence of extensive areas of poor ground over multiple benches, in which ravelling/rockfall were observed adjacent to an active ramp (in Rosario Cut 14). The poor ground may be associated with persistent faulting/argillic alteration, and/or a result of overspill from a vertically coincident mining phase. Irrespective, mining in the Rosario pit will continue to require access to adjacent production phases where there may be an elevated risk of rockfalls interacting with contiguous phases. Flexibility in mine planning allied with appropriate operational procedures and geotechnical slope monitoring will be necessary to detect, manage, and mitigate such risks, particularly where access is constrained. To control this risk CMDIC implements a 24/7 slope monitoring programme with immediately alerts operators in case of failure acceleration. Mine design practices also include several ramp accesses points to mitigate the impact of disruptions associated to minor slope failure. |
| November 2025 | ||
| Page |
| SRK Consulting (UK) Limited | Mineral Resources and Mineral Reserves, Collahuasi Copper Mine - Main Report |
| · | More detailed geotechnical characterisation of the ground conditions beyond the medium-term planning horizon is required. Studies should focus on structural geological conditions, including mechanical characterisation of the principal fault structures, as well as the smaller scale defects that control bench and inter-ramp stability. The definition of geological and alteration boundaries, particularly zones of low- and very low-quality rock and their associated engineering properties, will be critical for accurate prediction of slope stability to the LoM pit boundaries. Furthermore, although geotechnical stability assessments for the five-year plan horizon are relatively detailed incorporating 3D analysis and pore water pressure grid inputs from 3D numerical groundwater modelling, the analysis at the LoM scale is far more simplistic and limited to simple 2D limit equilibrium analysis with simple 2D phreatic surface inputs for groundwater, which cannot accurately reflect the complexity of the complex dewatering system required. |
| · | Achieving pit depressurisation targets is challenging due to the scale of the in-pit dewatering operations. The ultimate LoM pit depth is forecast to achieve a crest to toe height of circa 1000 m with a planned sink rate of greater than180 m per year. Although dewatering targets have largely been achieved over a relatively long period of time (the dewatering system has operated for at least 20 years), the system will need to continue to expand to meet the future production scenarios, with some of the potential long-term dewatering scenarios include over 200 dewatering wells, with up to 26 new wells being drilled per year to depths of over 800 m, as well as drilling and operation of up to 33, 200 m long horizontal drain holes. Furthermore, there are some gaps in the current hydrogeological understanding with respect to hydrogeological properties to the full depth of the LoM pit as well as pore water pressure responses across some problematic units which may be slow to drain, which add uncertainty to the LoM dewatering plan. Achieving slope depressurisation targets is critical to ensure stable slopes, with little margin for error. Development of this large open pit at the high sink rates planned in the LoM will pose significant technical and logistical challenges, in particular where the rock mass is considered poor relating to the presence of complex structural, geological and hydrogeological conditions. |
| · | To provide the necessary independent technical overview and scrutiny, CMDIC should re-establish the GAB which last reported in 2019. The GAB should be reconstituted on a frequency commensurate with the risks associated with the planned depth of mining and complexity of the geotechnical circumstances. The GAB should comprise recognised international experts in geotechnical engineering, structural geology and hydrogeology. |
| · | For the Rosario West deposit, an alternative approach should be sought to better represent mining dilution and recovery modifying factors that are applied to estimate extraction from the structurally controlled geological units found in Rosario West, if they can be aligned with the adapted mining practices being used there. Currently, the modifying factors used are the same as those applied for the bulk porphyry style mineralisation that predominates at Collahuasi, whereas the Rosario West deposit is an epithermal high sulphidation system that is structurally controlled resulting in more discrete grade distributions. |
| November 2025 | ||
| Page |
| SRK Consulting (UK) Limited | Mineral Resources and Mineral Reserves, Collahuasi Copper Mine - Main Report |
| · | To sustain the planned plant throughput, an average pit sinking rate of approximately 12 benches per annum is required. CMDIC has previously demonstrated the capability to achieve, and in some instances exceed, this rate during selected periods between 2021 and 2024; however, this rate is considered high relative to typical industry benchmarks of 8 to 10 benches per annum. Failure to maintain the required mining rates would delay access to higher-grade ore, and result in an increased reliance on the historical low-grade stockpiles at various stages throughout the LoM. The lower grades, coupled with the uncertainty regarding the plant performance of the old low-grade stockpiles at elevated feed rates, would further exacerbate these impacts and compound production losses. |
| · | The impact of permitting delays that stemmed from the COVID-19 pandemic has hindered advance stripping activities, resulting in sub-optimal operating conditions. Initial efforts to accelerate ore access through smaller cutbacks reduced productivity, subsequently leading to a shift towards larger phases with higher strip ratios to improve operating efficiencies. Until deeper bulk ore is reached, the operation must rely more heavily on low-grade stockpiles, which reduces concentrate production rates and increases demand for process water. This delay to accessing primary ore is expected to cause a temporary decline in concentrate production rates, with the lower production targets in 2026 being similar to those achieved in 2025 to date on an annualised basis, and, if unmanaged, may impact performance over the next five years. |
| · | The waste dump slope geometry and profile as defined in the 2040 case geotechnical studies have been applied to the designs for the Mineral Reserves case LoM waste rock dump (WRD) (100 m high lifts; 60o inclination face; 60 m wide berms); however, no revised assessments have been completed to validate that the (presumed) higher slopes and foundation mitigation measures are appropriate to present acceptable factors of safety. Further analyses are therefore required, which should be informed by sufficient and appropriate ground investigation and laboratory testing, and consider representative drained and undrained shear strengths with particular emphasis on strength models applied to weak/sensitive/low-strength/low density/saturated foundation soil units. |
| · | Closure/final WRD outer slopes will need to be significantly lower in inclination than those proposed in the 2040 design validation studies to facilitate safe and effective closure. The LoM slope designs are typically approximately 30° inclination overall; however, closure slopes are more typically 18° overall which will necessitate expansion of footprint and potentially significant reprofiling if done at closure rather than if considered progressively as part of the dump development. |
| · | The expansion programme underway to increase the mine’s production rate to 210 ktpd is at varying stages of development. Delivery of the construction projects to align with resolution of the various operational challenges being faced needs careful management to mitigate possible delays to achieving the targeted production rate of 210 ktpd. |
| · | The energy project related capital expenditure (including SIB) needs to be reviewed to ensure the costs include in the financial model align to the selected energy infrastructure improvements to meet the needs at Collahuasi. Similarly, the information provided regarding the estimate at completion for the various project also needs to be checked as the financial model has a USD130m shortfall between the model input and the current P50 estimate at completion of the C20+ project. |
| November 2025 | ||
| Page |
| SRK Consulting (UK) Limited | Mineral Resources and Mineral Reserves, Collahuasi Copper Mine - Main Report |
| · | CMDIC implements a comprehensive geometallurgical process focused on short term planning and performance of the process plant. LoM projections are based on findings from these assessments as applied to the interpreted oxidation state, lithology and alteration style of mineralisation that is planned for extraction over the long term; however, there is limited testwork to support geometallurgical interpretation for later phases of mine production planned at depth, to the south west and for the Ujina deposit. In addition, the ability to audit the geomet outputs against the input data is challenged by the complexity of the approach and multi-variable relationships. It is recommended that CMDIC supplements their processes with routines to validate the geomet outputs against the key input criteria. |
| · | Comparisons of the short term and budget model reconciliation indicates a decrease in total molybdenum content recovered over recent years. The basis for this decreasing trend is not yet fully explained; however, as more material is sourced from the Rosario West deposit, which has a naturally lower molybdenum content, this trend might continue and potentially worsen. |
| · | Stockpiles of low-grade sulphide material historically accounts for 316 Mt. Risk to concentrate recovery and production output from greater reliance on low grade stockpile material to maintain plant feed rates is compounded by lower processing recoveries resulting from this material being partially oxidised, as shown by recent operational experience. The mine plan has sought to incorporate this factor, but the potential for the material to oxidise further over time, could result in lower concentrate recovery and production outputs. |
| · | There is a risk to achieving the higher copper concentrate grades assumed in the latter years of the LoM plan which would result in higher freight costs and treatment charges if lower concentrate grades were produced than assumed. |
| · | The balance of water availability and water requirements is stressed by operating conditions. As operations progress to extract Rosario West at depth there is potential for higher concentrations of deleterious clay materials to be incorporated in the mill feed, which requires more water to achieve planned process recoveries. In addition, monitoring data are flagging the requirement for groundwater extraction rates to be constrained in some areas to comply with abstraction license conditions and mitigate any potential impacts to groundwater receptors through activation of the PAT/EWP, a situation which is likely to become increasing challenging as groundwater levels continue to decline. Until the C20+ desalination plant is fully commissioned in June 2026, operations are using filtered seawater pumped to site through the new desalination pipeline. The ability to deliver the required long-term water supply depends on timely commissioning of the new seawater intake and reverse osmosis plants. During this commissioning period, the water supply system operates with minimal redundancy, with potential for short-term water deficits and reduced concentrate production if any source underperforms, infrastructure commissioning is delayed, or if any regulatory triggers (PAT) require curtailment. |
| November 2025 | ||
| Page |
| SRK Consulting (UK) Limited | Mineral Resources and Mineral Reserves, Collahuasi Copper Mine - Main Report |
| · | The continued abstraction of continental/groundwater proximal to the mine site, whilst currently permitted, is sensitively balanced and likely to come under increasing stakeholder and regulatory pressure to be reduced in the future beyond current plans, as has been the case for other operators in the region. The water pipeline has been sized to support a potential higher production rate (of up to 390 ktpd), with the associated infrastructure designed to allow modular upgrades. Notwithstanding this potential capacity expansion (and associated capital cost and scheduling implications), any reduction in continental water extraction would increase the water requirement from alternative sources. Accordingly, the LoMP and any further production expansion case should consider this risk as part of a continual water balance assessment and be incorporated into future permitting processes. |
| · | CDMIC has several ongoing environmental obligations related to spring and stream flow management in its operational area. For example, at the Jachucoposa and Michincha springs, CDMIC must maintain flows by supplementing natural discharge with water pumped in from other areas. At the Huinquintipa stream, ongoing interception and quality monitoring of seepage and runoff from the Rosario WRD is carried out, with flow compensation required where water quality is not suitable for discharge. The PAT/EWP required in the 2021 RCA, sets threshold-based triggers for springs, Coposito, Border, and the TSF, activating mitigation actions if thresholds are breached, such as reducing abstraction or additional water injection. Although current measures are well managed, maintaining these commitments poses operational and reputational risks, especially if mitigation actions reduce water availability for production or if water quality controls fail to protect downstream users. Furthermore, mitigations at the springs and Huinquintipa stream are planned to continue until 12 years post closure and it is not currently clear how the CMDIC plans to meet this commitment after 12 years if post-closure monitoring suggests that these controls continue to be required. CMDIC is studying alternative solutions and will update the closure plan as these studies progress, but the current plan does not account for this potential requirement or associated cost. |
| · | The current Pampa Pabellón TSF expansion plan is currently limited to a scoping and pre-feasibility study level of detail. Consequently, a greater level of design detail and associated studies are required, in particular, to support robust and explicit assessment of capital and operating costs; to consider potential environmental impacts associated with seepage and downstream geochemistry; and make further assessment of environmental and social impact for the expanded TSF footprint which will include sensitive grazing areas. Additionally, further planning for the availability and suitability of construction fill for future embankment raises is required, noting geotechnical uncertainties with foundation soils and variable material quality from the mine waste source(s). Continuous improvement in monitoring, governance, and engineering validation is also recommended to help comply with GISTM (an ongoing project) and to ensure that identified risks are effectively managed, and a substantiated, reliable basis for future design, cost, and risk estimates is established. |
| November 2025 | ||
| Page |
| SRK Consulting (UK) Limited | Mineral Resources and Mineral Reserves, Collahuasi Copper Mine - Main Report |
| · | Waste rock and tailings materials have been classified as potentially acid generating. Therefore, runoff and seepage of contact waters from the WRD, stockpiles and TSF could degrade water quality at downstream receptors and for associated water users. This risk particularly impacts the streams and receptors that drain to the west and south-west of the Rosario pit and associated facilities and is compounded by limited long-term understanding of solute transport pathways and the absence of fully developed mitigation measures. The future project expansion will increase footprint area of the TSF and WRD necessitating progressive expansion of seepage monitoring, capture and pumping infrastructure, and potentially requiring infrastructure in new locations/areas. The current closure plan includes the construction and operation of seepage collection and treatment systems for the 12 year active closure phase. CMDIC has not yet defined whether treatment beyond this period is anticipated, and if so, what potential solutions may be required. |
| · | There is risk that delays to permitting at the Ujina deposit delays future production. In the short-term, there is a requirement to mine waste from the Ujina pit to support the expansion of the TSF dam wall. A permit application for this activity (DIA) is in progress and is scheduled for submission in Q1 2026 and approval in Q1 2027. The permitting schedule will need to be aligned with the planned construction programme to mitigate any impacts on production. Longer-term, extraction of ore from the Ujina deposit is scheduled to recommence in 2044, following a hiatus of circa 40 years. The environmental permit for Ujina pit expires in 2027 and therefore, in advance of restarting mining activities at Ujina, a permitting programme, inclusive of EIA, will need to be enacted and approved before mining can recommence. |
| · | As described in the CMDIC strategic development plan, the operation is in the second phase of a three-phase development plan. The current environmental approval for the operation was issued in 2021 and expires in 2041. The operation permitted via this approval is smaller in scale and duration than the Mineral Reserves case. This is common practice in Chile where the duration of environmental approvals are often limited to between 20 and 25 years. CMDIC plans to submit an EIA for the ACP Growth project in 2027 ahead of an approval anticipated in 2030. Until the approval is secured, there is no environmental permit for mining after 2041, which accounts for 30% of the current Mineral Reserves. Factors that could present risks to this approval being obtained include: material changes to the operation (other than expansion of current facilities); continued need for groundwater abstraction beyond 2041; anticipated carbon emissions; status of stakeholder relationships prior to and during the permitting process; and disturbance to sensitive features in the future TSF footprint, including archaeological sites, grazing areas used by indigenous groups and areas of protected vegetation. |
| November 2025 | ||
| Page |
| SRK Consulting (UK) Limited | Mineral Resources and Mineral Reserves, Collahuasi Copper Mine - Main Report |
| · | Between October 2023 and April 2024, several indigenous communities from the Tarapacá region in northern Chile filed lawsuits challenging the 2021 environmental approval of the operation. The claimants alleged that the environmental evaluation process did not properly assess the impact on affected indigenous communities and their livelihoods. There are ongoing legal proceedings with indigenous communities, Wilamasi and Chanavaya, located on the coast to the south of Puerto Patache. The lawsuit relates to alleged contamination and impact on seawater, sediments and marine fauna from discharge of copper. The claim for environmental damage filed before the First Environmental Court of Antofagasta was rejected by the Court in July 2025. The ruling stated that there is insufficient evidence to prove environmental damage as alleged by the plaintiff. In addition, the plaintiff was ordered to pay the costs of the trial. The plaintiffs appealed the decision and the case will be moved to the Second Environmental Court of Antofagasta. |
| · | The undiscounted cost of closure in the LoM financial model is USD473m. The undiscounted closure cost estimate for planned closure in the approved 2021 closure plan is USD656m. The costs based on the conditions foreseen at the end of the mine life are likely to be underestimated in the context of the requirements of the life of mine Mineral Reserve case. Firstly, the estimate is based on a project description approved by the 2021 RCA, which does not reflect the ultimate extents of the operations or quantities, extracted, processed and placed in waste facilities. Secondly, the unit rates used in the estimate are derived from a previous (2016) version of the closure cost estimate and are outdated and not reflective of a base date of 2025. Considering these factors, the closure cost estimate for the Life of Mine case is likely to exceed USD1,000m, which would potentially double the costs reflected in the life of mine plan. This estimate is based on the principal of local regulatory compliance, if the estimate were to be brought in line with best international practices then the increase could be substantially higher than the revised estimate presented above. |
| · | The wider implications of plans that are being developed to meet the CMDIC decarbonisation targets are being assessed, which adds uncertainty to LoM projections. CMDIC annually reports carbon emissions and has made a voluntary commitment to achieve carbon neutrality by 2040 in Scope 1 and Scope 2 emissions. The voluntary target aligns with decarbonisation goals in Chile’s National Mining Policy. The operation’s decarbonisation strategy outlines potential emission reduction opportunities to support this target and pilot projects are in progress to determine the most viable solutions. Some technologies, such as installation of trolley systems to electrify sections of the pit for truck haulage, would require changes to the current mine plan and design. At present, carbon emission reduction projects have not been fully defined and are therefore not considered in the financial model. Chile’s carbon tax does not yet apply to the operation but may do so in the future in accordance with Chile’s long term climate strategy. |
Opportunities
| · | The Rosario porphyry copper mineralisation remains open at depth, dipping towards the SW. The limited drilling that intersects the current pit and which is applied for reporting Mineral Resources, indicates intersections in excess of 1% copper over sufficient widths to warrant further investigation of a potential target for extraction by underground mining. |
| November 2025 | ||
| Page |
| SRK Consulting (UK) Limited | Mineral Resources and Mineral Reserves, Collahuasi Copper Mine - Main Report |
| · | Whilst not the focus of current operations or development plans, there is a sizable amount of oxide material located both in situ and in stockpiles, which could be incorporated into future development plans if it were demonstrated to have economic value. |
| · | CMDIC has defined in their strategic plan for the operations, the opportunity to expand operations through the ACP Growth phase to a production rate of 370 ktpd. The ACP Growth project would require significant investment to expand current infrastructure and operations, but in doing so would bring forward the realisation of potential revenues in the life of the operations. In planning for the current optimisation phase, certain infrastructure (for example the desalination water pipeline) have been sized to support the ACP Growth phase, demonstrating a forward-looking commitment. |
| · | Dependent on the outcomes of the assessment of future production rates under the ACP Growth plan, the additional capacity incorporated in the desalination pipeline infrastructure provides opportunity to remove the mine’s dependency on groundwater as a source of water supply. |
| · | Through inter-company arrangements with nearby operations CMDIC might seek opportunity to optimise regional operational factors such as water stewardship for the benefit of participating companies and to local stakeholders. |
| ITEM 26 | RECOMMENDATIONS |
SRK notes that certain elements of the operation have focused on the period up to 2041, which is aligned with the current period of the EIA. It is SRK’s recommendation that to support future life of asset planning that the level of design detail for the period beyond 2041 be brought in line with the effort applied to the medium-term planning that currently supports the period 2030-2041.
In addressing the above, SRK recommends that CMDIC reviews the risks and opportunities presented in ITEM 25 and develops specific actions to mitigate or accommodate the items as appropriate.
SRK recommends that CMDIC reinstates a full mine to mill reconciliation process to monitor the performance of the long-term models and operating processes. In parallel to this process, CMDIC should validate the outputs of the geomet recovery models to the core input data.
For and on behalf of SRK Consulting (UK) Limited
| “Signed and Sealed” | Signed and Sealed” | |
| Dr Tim Lucks, [Corporate Consultant, Project Evaluation], Project Manager SRK Consulting (UK) Limited Date Issued: 03 November 2025 |
Dr
Iestyn Humphreys, [Corporate Consultant, Due Diligence], Project Director SRK Consulting (UK) Limited |
| November 2025 | ||
| Page |
| SRK Consulting (UK) Limited | Mineral Resources and Mineral Reserves, Collahuasi Copper Mine - References |
| ITEM 27 | REFERENCES |
A Karzulovic & Associates Ltd., December 2020, Geotechnical Evaluation of Rosario Pit Exploitation Permit 2021 (Design 2040).
Anglo American, 2025, Collahuasi Review / CMDIC Planning Review (June 2025).
Arcadis, 2018, Estudio De Impacto Ambiental Desarrollo de Infraestructura y Mejoramiento de Capacidad Productiva de Collahuasi. Capítulos 3.6: Hidrología, 3.7: Hidrogeología, 3.8: Calidad de Aguas Superficiales y Subterráneas.
Arcadis, March 2021. Memoria De Cálculo Canal Oeste y Canal Este. Document number CMDIC 271-R97232-183-41-CS-0009.
Arcadis, 2018: Estudio de impacto ambiental “desarrollo de infraestructura Y mejoramiento de capacidad Productiva de Collahuasi” prepared for Doña Inés de Collahuasi Mining Company, December 2018. Including selected annexures
Arcadis, 2020; "INFORME DE EXPLORACIONES - SUELO DE FUNDACIÓN MURO PRINCIPAL." Nº 5286-0000-GE-INF-0002.;; Apoyo Geotécnico Campaña Exploraciones y Caracterización de la Presa de Relaves CMDIC /
Arcadis, 2020; "RECOPILACIÓN Y ANÁLISIS DE ANTECEDENTES GEOTÉCNICOS." Nº 5286-0000-GE-INF-0001.;; Apoyo Geotécnico Campaña Exploraciones y Caracterización de la Presa de Relaves CMDIC
Arcadis, 2021; "MEMORIA DE CÁLCULO - SISTEMA DE DISTRIBUCIÓN DE RELAVES. Servicio Ingeniería para Tramitación Permiso Sectorial Del Depósito de Relaves, Nº DOCUMENTO CMDIC 271-R97232-183-41-CS-0005, Nº DOCUMENTO CONTRATISTA 5335-183-RE-MEC-0002, Rev. B.";
ARDUM Ingeniería SpA, 2025; "MEMORANDUM MMT-0001_0: Breve evaluación de riesgo y oportunidades DRPP"; (Brief Risk and Opportunity Assessment - DRPP); Prepared for Compañía Minera Doña Inés de Collahuasi S.C.M., October 2025.
ARDUM Ingeniería, 2024; "INFORME DAM SAFETY REVIEW – DEPÓSITO DE RELAVES PAMPA PABELLÓN";; Código 10001-IA-INF-HS-001, Rev. B. Prepared for Compañía Minera Doña Inés de Collahuasi S.C.M.
Asesorías en Recursos Hídrico, August 2023. Análisis del Efecto del Cambio Climático Sobre el Balance de Aguas de CMDIC. Escenario Lom2022, Aplicando Modelo GoldSim Etapa 4
Asesorías en Recursos Hídricos, February 2025. Plataforma de Gestión De Recursos Hídricos CMDIC. Etapa 5
ASPIS, 2025, Informe resultados evaluación de cumplimiento y propuesta Plan de Acción, Doña Inés de Collahuasi Mining Company. 9 June 2025
ASPIS, 2025, Informe resultados fiscalización ambiental simulada Collahuasi, 6 June 2025
| November 2025 | ||
| Page |
| SRK Consulting (UK) Limited | Mineral Resources and Mineral Reserves, Collahuasi Copper Mine - References |
Bisso, C.B., Duran, M. And Gonzales, A.A., 1998, Geology of the Ujina and Rosario copper deposits Collahuasi district, Chile, in Porter, T.M., ed., Porphyry and hydrothermal copper and gold deposits: A global perspective, Adelaide, PGC Publishing, p. 217-232.
CMDIC, November 2003, Rosario resource model: Internal report, 78p.
CMDIC, November 2005, Manual de Estándares y P.N.R. - Superintendencia de Exploraciones: Procedimiento corte de testigos - VPDP005, 9p.
CMDIC, November 2005, Procedimiento específico gerencia geología - Superintendencia de Exploraciones: Procedimiento muestreo de pozos de exploracion e infill - VPDPC004, 7P.
CMDIC, April 2007, Actualización Modelo Rosario: Internal report, 151p.
CMDIC Annual Report Exhibits 2020 to 2024
CDMIC, INFORME CASO BASE PROCESOS VPP-00000-000-49-DC-0001, 2020.
CDMIC, January 2021, Report: “190-PRI20091-5100-40-IN-0001_docx”
CDMIC, April 2022, Report # 186-00000-5600-40-BA-0001 “42. BT EPC Desaladora.pdf”.
CDMIC, May 2022, Report # 186-00000-5700-40-BA-0003 “42. BT EPC Impulsión.pdf”.
Collahuasi CPR. 2023. Competent Persons Statement – Mineral Resources and Ore Reserves. Collahuasi.
CMDIC, October 2024, Modelos Rec-Cu CMDICContexto Geometalúrgico y Desarrollos 2025.
CMDIC, Cía. Minera Doña Inés de Collahuasi. (2024). Lombook 2024.
CMDIC, August 2025, Actualización Modelos Geometalúrgicos 2025 Rosario y Rosario Oeste
CMDIC, August 2025, Elaboración de Modelos Geometalúrgicos de Ujina 2025
CMDIC, June 2005, Procedimiento Específico Vicepresidencia de Desarrollo Gerencia de Geología-VPD: Confección de Despachos de Preparación de Muestras y/o Análisis con Inserción de Muestras de Control - VPDPC007, 11p.
CDMIC, 2023, 2023.10_02_E1_Matriz Consolidada Compromisos Ambientales.xslx
CDMIC, 2023, Compliance Plan and RCA Compliance Review, Internal Audit Report, October 2023
CMDIC, 2023, Project P333 / PG3A Final FEL 3 Report (selected chapters).
CDMIC, 2024, Declaración Anual Recursos y Reservas 2024 Collahuasi CDMIC, August 2024, Report “427-PRI24014-5121-47-CS-0003_RP.docx”
CMDIC, 2024, Project PG210, Final FEL 3 Report
CMDIC, March 2024, Geotechnical Baseline Project 4th Line Collahuasi, Rajo Rosario.
CMDIC, August 2025, Instrumentation and Geotechnical Monitoring Report Background of Instabilities in Rosario Pit (2021-2025).
| November 2025 | ||
| Page |
| SRK Consulting (UK) Limited | Mineral Resources and Mineral Reserves, Collahuasi Copper Mine - References |
CMDIC, October 2025, Geotechnical Engineering Open Pits and Waste Dumps.
CDMIC, 2025, “Construction Monthly Reports” for the P333 / PG3A Project.
CDMIC, 2025, “Construction Monthly Reports” for the PG210 Project.
CDMIC, 2025, C20+ Steering Committee Monthly Report July 225
CDMIC, October 2025A, Presentation document “Compañía Minera Doña Inés de Collahuasi Puerto Collahuasi”.
CDMIC, October 2025B, Presentation document “Gerencia Tranque, Agua y Mineroducto: Planta Desaladora y Sistema de Impulsión de Agua Desalada”
CDMIC, October 2025C, Presentation document “Sistemas transporte de concentrado 7” –8””
CDMIC, 2025, Collahuasi Monthly Reports (January to September 2025)
CDMIC, 2025, Estrategia de relacionamiento con el entorno (GRE), September 2025
CDMIC, 2025, Recursos Humanos en Collahuasi, October 2025
CDMIC, 2025, Reporte Sustentabilidad 2024, prepared by SLR Consulting
CMDIC, 2025. Decarbonisation Strategy
CMDIC, 2025. Resultados Emisiones 20024 Final versión Reporte Sustentabilidad
CDMIC, undated, Gerencia relacionamiento del entorno, Estrategia asuntos públicos
CDMIC, undated, Gerencia relacionamiento del entorno, Mapa de procesos gestión del mecanismo de comunicación y quejas
Compañía Minera Doña Inés de Collahuasi S.C.M. & Arcadis, 2018; "DESARROLLO DE INFRASTRUCTURA Y MEJORAMIENTO DE CAPACIDAD PRODUCTIVA DE COLLAHUASI: 9.4 PAS Nº135 Construcción y Operación de Depósitos de Relaves.";
Compañía Minera Doña Inés de Collahuasi, May 2022. 186 Proyecto Fuente Hídrica Complementaria (FHC) Bases Técnicas Contrato Para Ingeniería, Compras y Construcción (EPC) Y Operación y Mantenimiento (O&M) Para Sistema De Suministro de Agua Para FHC. 186-00000-5600-40-BA-0001.
Compañía Minera Doña Inés de Collahuasi, May 2022. P186 Proyecto Fuente Hídrica Complementaria (FHC). Bases Técnicas Contrato EPC para Sistema de Impulsión de Agua Producto para FHC. 86-00000-5700-40-BA-0003.
Compañía Minera Doña Inés de Collahuasi, 2023. Declaración Impacto Ambiental Adecuación Cronograma y Obras Collahuasi.
Compañía Minera Doña Inés de Collahuasi, 2024, Lombook 2024 - Capítulo 6 Suministro de Agua.
Compañía Minera Doña Inés de Collahuasi, 2024, Reporte de Sustentabilidad Collahuasi 2024.
| November 2025 | ||
| Page |
| SRK Consulting (UK) Limited | Mineral Resources and Mineral Reserves, Collahuasi Copper Mine - References |
Compañía Minera Doña Inés de Collahuasi, 2024. Informe Final FEL 3: Capítulo 7 Desarrollo de la Ingeniería. 333-Pri24001-000-37-IN-1007.
Compañía Minera Doña Inés de Collahuasi, 2024-2025 Monthly Reports (various)
Compañía Minera Doña Inés de Collahuasi S.C.M., 2025; "GMAP N°045/25. Solicitud de exención de Auditoría al Plan de Cierre vigente CMDIC".
Dieco, 2021, Report: “Informe Reponteciamiento Del Sistema De Transmisión 220 Kv Collahuasi Rev 1”.
Ecotecnos, 2018, Desarrollo de Infraestructura y Mejoramiento de Capacidad Productiva de Collahuasi. Capítulo 4: Predicción y Evaluación de Impacto Ambiental.
Golder Associates & Geotécnica Consultores, 1995; "PROYECTO COLLAHUASI - VOLUMEN 3: SITE SELECTION REPORT (Agosto 1995)".
Golder Associates S.A. & Geotécnica Consultores S.A., 1997; "Informe Técnico Geotecnia, Especificaciones Técnicas Generales de Rellenos y Empréstitos, Proyecto Collahuasi.".
Golder Associates S.A., 2008, Review of Resources and Reserves, Collahuasi, Region I of Iquique, Chile, 137p.
Golder Associates S.A., 2009, Audit of Mineral Resources and Ore Reserves for Compañía Minera Doña Inés de Collahuasi, 299p.
Golder Associates S.A., 2010, Rosario Oeste Mineral Resources Audit, Compañía Minera Doña Inés de Collahuasi, Technical Report, 100p.
Golder Associates S.A., 2012, Auditoría de Recursos Rosario Sur I, II & III, Compañía Minera Doña Inés de Collahuasi, Technical Report, 180p.
Golder Associates, November 2014, Geotechnical Characterisation of the Main Faults of the Rosario Pit.
Golder Associates S.A., December 2024, 5YP Stability Analysis 2025-2029.
Golder Associates S.A., February 2025, Stability of the Final Rosario Pit.
Hidroestudios, 2024; "Actualización Planes de Alerta Temprana (PAT) vertiente Jachucoposa, Coposito y depósito de relaves Pampa Pabellón, acorde al Oficio DGA Nº22/2024"; (Update of Early Warning Plans – Jachucoposa Spring, Coposito, and Pampa Pabellón Tailings Storage Facility, as per DGA Official Communication 22/2024); Informe HIDRO.CMDIC874.210.INF001.REV0, May 2024. Prepared for Compañía Minera Doña Inés de Collahuasi S.C.M.
GEOINNOVA, June 2023, CMDIC Structural Domains.
Geotechnical Advisory Board 2019 Report, June 2019.
Government of Chile, Ministry of Mining & Ministry of the Environment. (2021). Strategic Environmental Assessment of the National Mining Policy 2050: Environmental Report. Santiago, Chile: Government of Chile.
| November 2025 | ||
| Page |
| SRK Consulting (UK) Limited | Mineral Resources and Mineral Reserves, Collahuasi Copper Mine - References |
Government of Chile, Ministry of the Environment. (2020). Updated Nationally Determined Contribution (NDC) of Chile under the Paris Agreement. Santiago, Chile: Ministry of the Environment.
Government of Chile, Ministry of the Environment. (2021). Chile’s Long-Term Climate Strategy. Santiago, Chile: Ministry of the Environment.
Hidroestudios, December 2023, Actualización del modelo hidrogeológico regional y modelos asociados.
Hidroestudios, December 2023, Actualización modelo numérico regional y modelos asociados.
Itasca Chile, December 31, 2024, Servicio de Asesoría Hidrogeológica Modelo LOM (Resultados LOM Dic24).
Itasca Chile, July 2024, Servicio de Asesoría Hidrogeológica Simulación Quinquenio (2024–2029).
Itasca Chile, May 2024, Actualización Modelo Hidrogeológico Ujina.
Itasca Chile, October 2024, Modelo Numérico Ujina.
JORC, 2004, Australasian Code for Reporting of Exploration Results, Mineral Resources and Ore Reserves (The JORC Code). Prepared by the Joint Ore Reserves Committee of the Australasian Institute of Mining and Metallurgy, Australian Institute of Geoscientists and Minerals Council of Australia (JORC), effective 17 December 2004.
Lee, A.W., 1994, Evolution of the Rosario copper-molybdenum porphyry deposit and associated copper-silver vein system, Collahuasi district, I Region, northern Chile: Unpublished MSc thesis, Kingston, Ontario, Canada, Queen’s University, 75p.
Masterman, G.J., 2003, Structural and geochemical evolution of the Rosario Cu-Mo porphyry deposit and related Cu-Ag veins, Collahuasi district, northern Chile: Unpublished PhD dissertation, Tasmania, Australia, University of Tasmania, 253p.
Masterman, G.J., Cooke, D.R., Berry, R.F., Clark, A.H., Archibald, D.A., Mathur, R., Walshe, J.L. and Duran, M., 2004; 40Ar/39Ar and Re-Os geochronology of porphyry copper-molybdenum deposits and related copper-silver veins in Collahuasi district, northern Chile,: Economic Geology, v. 99, p. 673-690.
Masterman, G.J., Cooke, D.R., Berry, R.F., Walshe, J.L., Lee, A.W. and Clark, A.H., 2005, Fluid chemistry, structural setting and emplacement history of the Rosario Cu-Mo porphyry and Cu-Ag epithermal veins, Collahuasi district, northern Chile: Economic Geology, v. 100, p. 835-862.
Munchmeyer, C., Hunt, J.P. and Ware, H., 1984, Geología del Distrito de Collahuasi y del pórfido cuprífero Rosario: Internal report: Santiago, Compañía Doña Inés de Collahuasi, 84p.
National Electricity Coordinator, 2025. Renewable Energy Certificate 2024.
Pitard, F., December 2004, Review of sampling systems and sampling practices at the Cia. Minera Doña Inés de Collahuasi Scm, Phase 2: Internal report, 45p.
| November 2025 | ||
| Page |
| SRK Consulting (UK) Limited | Mineral Resources and Mineral Reserves, Collahuasi Copper Mine - References |
Pitard, F., June 2004, Review of sampling systems and sampling practices at the Cia. Minera Doña Inés de Collahuasi Scm: Internal report, 38p.
Repύblica de Chile, 2021, Comisión de Evaluación, Dirección Ejectutia, Califica Ambientalmente el proyecto “Desarrollo de Infraestructura y Mejoramiento de Capacidad Productiva de Collahuasi”, Resolucion Extenta No. 20213300112, 21 de Diciembre de 2021
Rodrigo González Alarcón, February 2025, Plataforma de Gestión de Recursos Hídricos Compañía Minera Doña Inés de Collahuasi, Etapa 5.
Servicio Nacional de Geología y Minería (SERNAGEOMIN), 2025; "RESOLUCIÓN EXENTA Nº 1483/2025. Exime a la empresa Compañía Minera Doña Inés de Collahuasi SCM de la obligción de ejecutar la Auditoría Periódica al Plan de Cierre, año 2025";
Shaw, William J., 1997, Validation of Sampling and Assaying Quality for Bankable Feasibility Studies. In: The Resource Database Towards 2000, Wollongong, 16 May, AusIMM Melbourne, p. 41-19.
SRK Consulting (Chile), December 2021, Actualización Plan de Cierre CMDIC.
SRK Consulting (Chile) SpA, 2021; "Actualización Plan de cierre CMDIC. 191-I1961-000-43-IN-0005"; (Closure Plan Update CMDIC); Rev. 2, Diciembre 2021. Prepared for Compañía Minera Doña Inés de Collahuasi S.C.M. including various Annexures
Wood, 2020; "Nota Técnica: Evaluación de Resistencia No Drenada Suelo Lacustre y Estabilidad Muro Principal – Aseguramiento de Calidad Depósito de Relaves"; Documento E40208-1300-DT00-RPT-4016, Rev. B; Proyecto E40208 - GTAM 0045.
WSP, July 2024, Stability of the Final Pit: Rajo Ujina.
WSP, July 2024, Update of Basic Geotechnical Units Rosario Pit (technical memorandum).
WSP E&I Chile, 2023; "DETERMINACIÓN DE CLASIFICACIÓN POR CONSECUENCIA DEPÓSITO DE RELAVES";; Nº E40255-1300-DT00-INF-2007 (WSP) / GTAM0315-185-40-IN-0057 (CMDIC); Rev. 0. Prepared for Compañía Minera Doña Inés de Collahuasi S.C.M.
WSP E&I Chile, 2024; "REPORTE DE BASES DE DISEÑO (DBR) - INGENIERÍA DE REGISTRO & INGENIERÍA DE SOPORTE, DEPÓSITO DE RELAVES PAMPA PABELLÓN. Proyecto Nº E40255-1300-DT00-INF-2010 (WSP) / GTAM0315-185-40-TE-0008 (CMDIC)."; (Design Basis Report (DB) ; Prepared for Compañía Minera Doña Inés de Collahuasi S.C.M.
WSP E&I Chile, 2025; "DEPÓSITO DE RELAVES PAMPA PABELLÓN. Respaldos LOM 2024. Estimación de demanda de materiales para muros del Depósito de Relaves, proyecciones y tasas asociadas a la producción de relaves y construcción de muros, considerando proyecto 4ta Línea."; Nº E40255-1300-DT00-RPT-0068 (WSP) / GTAM0315-185-40-NR-0068 (CMDIC), Rev. D. Prepared for Compañía Minera Doña Inés de Collahuasi S.C.M.
WSP E&I Chile, 2025; "INFORME TÉCNICO INSPECCIÓN DE SEGURIDAD DSI DICIEMBRE 2024 – DEPÓSITO DE RELAVES PAMPA PABELLÓN";; Nº E40255-1300-DT00-INF-2030 (WSP) / GTAM0315-185-40-IN-0063 (CMDIC). Prepared for Compañía Minera Doña Inés de Collahuasi S.C.M.nd GTAM Collahuasi.
| November 2025 | ||
| Page |
| SRK Consulting (UK) Limited | Mineral Resources and Mineral Reserves, Collahuasi Copper Mine - References |
WSP, 2024; "INFORME FINAL ETAPA ESTUDIOS, TRADE OFF SCREENING ÁREAS DPOSITACIÓN RELAVES";; Nº CMDIC: 164-PRI22066-001-040-IN-0023, Rev. P. Prepared for Compañía Minera Doña Inés de Collahuasi S.C.M.
WSP, 2024; "REVISIÓN DE CAPACIDAD PAMPA PABELLÓN"; (Pampa Pabellón Capacity Review); Nº CMDIC: 164-PRI22066-001-040-IN-0007, Rev. P;). Prepared for Compañía Minera Doña Inés de Collahuasi S.C.M
Xstrate Canada Corporation, Mineral resources and Mineral reserves, Collahuasi Copper Mine, Tarapacá Region, Chile, 20212.
| November 2025 | ||
| Page |
| SRK Consulting (UK) Limited | Mineral Resources and Mineral Reserves, Collahuasi Copper Mine - QP Certificates |
QUALIFIED PERSONS CERTIFICATES
| November 2025 |
 |
SRK Consulting (UK) Limited 5th Floor Churchill House 17 Churchill Way Cardiff CF10 2HH Wales, United Kingdom E-mail: enquiries@srk.co.uk URL: www.srk.com Tel: + 44 (0) 2920 348 150 |
CERTIFICATE OF QUALIFIED PERSON
I, Timothy Lucks, PhD, MAusIMM (CP) do hereby certify that:
| 1. | I am a Corporate Consultant (Project Evaluation) of SRK Consulting (U.K) Ltd., 5th Floor, Churchill House, 17 Churchill Way, Cardiff, CF10 2HH, Wales, UK. |
| 2. | This certificate applies to the technical report titled “NI 43-101 Technical Report, Collahuasi Copper Mine, Tarapacá Region, Chile” with an effective date of December 31, 2024 (the “Technical Report”) prepared for Anglo American Plc. |
| 3. | I graduated with a degree in Geology and Mineral Exploration from Imperial College, London, UK in 1999. In addition, I have obtained a PhD in Mineral Deposit Geology from Leeds University, UK in 2004, and have over 15 years’ experience in a combination of Exploration and Mineral Resource Geology and Project Management. I am a member of the Australian Institution of Materials Mining and Metallurgy (Membership Number 304968), and I am a Chartered Professional. |
| 4. | I have read the definition of “qualified person” set out in National Instrument 43-101 – Standards of Disclosure for Mineral Projects (“NI 43-101”) and certify that by reason of my education, affiliation with a professional association (as defined in NI 43-101) and past relevant work experience, I fulfil the requirements to be a “qualified person” for the purposes of NI 43-101. |
| 5. | I have personally inspected the Collahuasi operation between October 7-8, 2025. |
| 6. | I am Co-author of the report and responsible for the overall coordination of the Technical Report. I am responsible for Sections 1.1-1.3, 1.9, 1.12, 1.14, 2-6, 15, 17, and 19-27. |
| 7. | I am independent of Anglo American plc, as defined in section 1.5 of NI 43-101. |
| 8. | I have no prior involvement with the property that is the subject of the Technical Report. |
| 9. | I have read NI 43-101 and Form 43-101F1 and the sections of the Technical Report I am responsible for have been prepared in compliance with that instrument and form. |
| 10. | As of the effective date of the Technical Report, to the best of my knowledge, information and belief, the sections of the Technical Report I am responsible for contains all scientific and technical information that is required to be disclosed to make the Technical Report not misleading. |
| Dated this 3rd day of November 2025. | |
| “Signed and Sealed” | |
| Timothy Lucks, PhD, MAusIMM (CP) | |
| Principal Consultant (Project Evaluation) |
 |
Registered Address: 21 Gold Tops, City and County of Newport, NP20 4PG, Wales, United Kingdom. SRK Consulting (UK) Limited Reg No 01575403 (England and Wales) |
Group Offices: Africa Asia Australia Europe North America South America |
|
|
SRK Consulting (UK) Limited 5th Floor Churchill House 17 Churchill Way Cardiff CF10 2HH Wales, United Kingdom E-mail: enquiries@srk.co.uk URL: www.srk.com Tel: + 44 (0) 2920 348 150 |
CERTIFICATE OF QUALIFIED PERSON
I, Martin Pittuck, , MSc, MIMMM(QMR), CEng, FGS do hereby certify that:
| 1. | I am a Corporate Consultant (Resource Geology) of SRK Consulting (U.K) Ltd., 5th Floor, Churchill House, 17 Churchill Way, Cardiff, CF10 2HH, Wales, UK. |
| 2. | This certificate applies to the technical report titled “NI 43-101 Technical Report, Collahuasi Copper Mine, Tarapacá Region, Chile” with an effective date of December 31, 2024 (the “Technical Report”) prepared for Anglo American Plc. |
| 3. | I am a graduate with a Bachelor of Science degree in Geochemistry from the University of London in 1993. In addition, I have a Master of Science in Mineral Resources gained from Cardiff College, University of Wales in 1996 and I have practised my profession continuously since that time. Since graduating I have worked as a consultant at SRK on a wide range of mineral projects. I have undertaken many geological investigations, resource estimations, mine evaluation technical studies and due diligence reports. I am a member of the Institute of Materials Mining and Metallurgy (Membership Number 49186); I am a Fellow of the Geological Society and I am a Chartered Engineer. |
| 4. | I have read the definition of “qualified person” set out in National Instrument 43-101 (NI 43-101) – Standards of Disclosure for Mineral Projects (“NI 43-101”) and certify that by reason of my education, affiliation with a professional association (as defined in NI 43-101) and past relevant work experience, I fulfil the requirements to be a “qualified person” for the purposes of NI 43-101. |
| 5. | I have personally inspected the Collahuasi operation between October 7-8, 2025. |
| 6. | I am responsible for the preparation of Items 1.4 – 1.7, 1.13, 7 – 12, 14, and provided contributions to 1.14, 25 and 26 of the Technical Report relating to geology and Mineral Resource Estimation. |
| 7. | I am independent of Anglo American plc, as defined in section 1.5 of NI 43-101. |
| 8. | I have no prior involvement with the property that is the subject of the Technical Report. |
| 9. | I have read NI 43-101 and Form 43-101F1 and the sections of the Technical Report I am responsible for have been prepared in compliance with that instrument and form. |
| 10. | As of the effective date of the Technical Report, to the best of my knowledge, information and belief, the sections of the Technical Report I am responsible for contains all scientific and technical information that is required to be disclosed to make the Technical Report not misleading. |
| Dated this 3rd day of November 2025. | |
| “Signed and Sealed” | |
| Martin Pittuck, MSc, MIMMM(QMR), CEng, FGS | |
| Corporate Consultant (Resource Geology) |
|
|
Registered Address: 21 Gold Tops, City and County of Newport, NP20 4PG, Wales, United Kingdom. SRK Consulting (UK) Limited Reg No 01575403 (England and Wales) |
Group Offices: Africa Asia Australia Europe North America South America |
|
|
SRK Consulting (UK) Limited 5th Floor Churchill House 17 Churchill Way Cardiff CF10 2HH Wales, United Kingdom E-mail: enquiries@srk.co.uk URL: www.srk.com Tel: + 44 (0) 2920 348 150 |
CERTIFICATE OF QUALIFIED PERSON
I, John Willis, PhD, MAusIMM (CP), Member AIME do hereby certify that:
| 1. | I am a Principal Consultant (Mineral Processing) of SRK Consulting (U.K) Ltd., 5th Floor, Churchill House, 17 Churchill Way, Cardiff, CF10 2HH, Wales, UK. |
| 2. | This certificate applies to the technical report titled “NI 43-101 Technical Report, Collahuasi Copper Mine, Tarapacá Region, Chile” with an effective date of December 31, 2024 (the “Technical Report”) prepared for Anglo American Plc. |
| 3. | I am a graduate with a PhD in Metallurgy gained from the University of Queensland in 1994 and a Graduate Certificate in Risk Management from the Queensland University of Technology in 2003. I have over 30 years of experience in the minerals industry, including 12 years with the Hydrometallurgy Research Laboratories of MIM Holdings (now Xstrata) in Australia where I was responsible for the development, implementation and management of metallurgical testwork programs aimed at flowsheet development. I was a member of the team that developed the patented Albion Process, a novel hydrometallurgical process route for the extraction of base metals and refractory gold from their ores. I also have significant experience in plant technical auditing, optimisation and troubleshooting. I am a member of MAusIMM (CP) (103635) and Member of AIME. |
| 4. | I have read the definition of “qualified person” set out in National Instrument 43-101 (NI 43-101) – Standards of Disclosure for Mineral Projects (“NI 43-101”) and certify that by reason of my education, affiliation with a professional association (as defined in NI 43-101) and past relevant work experience, I fulfil the requirements to be a “qualified person” for the purposes of NI 43-101. |
| 5. | I have not personally inspected the operation. |
| 6. | I am responsible for the preparation of Items 1.9, 13, 17, and provided contributions to 1.14, 21, 25 and 26 of the Technical Report relating to Metallurgy and Processing. |
| 7. | I am independent of Anglo American plc, as defined in section 1.5 of NI 43-101. |
| 8. | I have no prior involvement with the property that is the subject of the Technical Report. |
| 9. | I have read NI 43-101 and Form 43-101F1 and the sections of the Technical Report I am responsible for have been prepared in compliance with that instrument and form. |
| 10. | As of the effective date of the Technical Report, to the best of my knowledge, information and belief, the sections of the Technical Report I am responsible for contains all scientific and technical information that is required to be disclosed to make the Technical Report not misleading. |
| Dated this 3rd day of November 2025. | |
| “Signed and Sealed” | |
| John Willis, PhD, MAusIMM (CP) | |
| Principal Consultant (Mineral Processing) |
|
|
Registered Address: 21 Gold Tops, City and County of Newport, NP20 4PG, Wales, United Kingdom. SRK Consulting (UK) Limited Reg No 01575403 (England and Wales) |
Group Offices: Africa Asia Australia Europe North America South America |
|
|
SRK Consulting (UK) Limited 5th Floor Churchill House 17 Churchill Way Cardiff CF10 2HH Wales, United Kingdom E-mail: enquiries@srk.co.uk URL: www.srk.com Tel: + 44 (0) 2920 348 150 |
CERTIFICATE OF QUALIFIED PERSON
I, Francois Taljaard, Pr.Eng, BEng (Hons), SAIMM, MIMMM do hereby certify that:
| 1. | I am a Principal Consultant (Mining Engineer) of SRK Consulting (U.K) Ltd., 5th Floor, Churchill House, 17 Churchill Way, Cardiff, CF10 2HH, Wales, UK. |
| 2. | This certificate applies to the technical report titled “NI 43-101 Technical Report, Collahuasi Copper Mine, Tarapacá Region, Chile” with an effective date of December 31, 2024 (the “Technical Report”) prepared for Anglo American Plc. |
| 3. | I hold a Bachelor of Engineering in Mining Engineering and a Bachelor of Engineering Honours in Industrial Engineering, both from the University of Pretoria. With more than 18 years of industry experience, I specialise in mine technical studies across all levels, integrated multi-disciplinary mining projects, due diligence reviews, strategic and business planning, and equipment trade-off assessments. I maintain a strong commitment to environmental stewardship, having assessed carbon emissions associated with mining operations and supported the identification of practical pathways to reduce carbon footprints. I am a registered Professional Engineer (Pr.Eng, ECSA 20150469) and an active member of the Southern African Institute of Mining and Metallurgy and the Institute of Materials, Minerals and Mining. |
| 4. | I have read the definition of “qualified person” set out in National Instrument 43-101 (NI 43-101) – Standards of Disclosure for Mineral Projects (“NI 43-101”) and certify that by reason of my education, affiliation with a professional association (as defined in NI 43-101) and past relevant work experience, I fulfil the requirements to be a “qualified person” for the purposes of NI 43-101. |
| 5. | I have not personally inspected the operation. |
| 6. | I am responsible for the preparation of Items 1.7, 1.8, 15, 16 (excluding 16.1 and 16.2), and provided contributions to 1.14, 21, 25 and 26 of the Technical Report relating to Mining Engineering. |
| 7. | I am independent of Anglo American plc, as defined in section 1.5 of NI 43-101. |
| 8. | I have no prior involvement with the property that is the subject of the Technical Report. |
| 9. | I have read NI 43-101 and Form 43-101F1 and the sections of the Technical Report I am responsible for have been prepared in compliance with that instrument and form. |
| 10. | As of the effective date of the Technical Report, to the best of my knowledge, information and belief, the sections of the Technical Report I am responsible for contains all scientific and technical information that is required to be disclosed to make the Technical Report not misleading. |
| Dated this 3rd day of November 2025. | |
| “Signed and Sealed” | |
| Francois Taljaard, Pr.Eng, BEng (Hons), SAIMM, MIMMM | |
| Principal Consultant (Mining Engineering) |
|
|
Registered Address: 21 Gold Tops, City and County of Newport, NP20 4PG, Wales, United Kingdom. SRK Consulting (UK) Limited Reg No 01575403 (England and Wales) |
Group Offices: Africa Asia Australia Europe North America South America |
|
|
SRK Consulting (UK) Limited 5th Floor Churchill House 17 Churchill Way Cardiff CF10 2HH Wales, United Kingdom E-mail: enquiries@srk.co.uk URL: www.srk.com Tel: + 44 (0) 2920 348 150 |
CERTIFICATE OF QUALIFIED PERSON
I, Max Brown, CEng, MSc, BSc, (IMMM) do hereby certify that:
| 1. | I am a Principal Consultant (Geotech Engineer) of SRK Consulting (U.K) Ltd., 5th Floor, Churchill House, 17 Churchill Way, Cardiff, CF10 2HH, Wales, UK. |
| 2. | This certificate applies to the technical report titled “NI 43-101 Technical Report, Collahuasi Copper Mine, Tarapacá Region, Chile” with an effective date of December 31, 2024 (the “Technical Report”) prepared for Anglo American Plc. |
| 3. | I am a graduate with a Master of Science in Mining Geology gained from Camborne School of Mines, 1999. In addition, I have a Bachelor of Science in Geology from Brunel University, 1998. I have over 25 years’ international experience in the extractive industries specialising in rock mechanics within both open pit and underground mining. I am an experienced geotechnical engineer, skilled in the development and interpretation of geotechnical datasets (drillhole, geophysics and mapping) and subsequent definition of rock mass characterisation for use in excavation design. I am a Chartered Engineer and IMMM Member. |
| 4. | I have read the definition of “qualified person” set out in National Instrument 43-101 (NI 43-101) – Standards of Disclosure for Mineral Projects (“NI 43-101”) and certify that by reason of my education, affiliation with a professional association (as defined in NI 43-101) and past relevant work experience, I fulfil the requirements to be a “qualified person” for the purposes of NI 43-101. |
| 5. | I have not personally inspected the operation. |
| 6. | I am responsible for the preparation of Items 16.2, and provided contributions to 1.14, 21, 25 and 26 of the Technical Report relating to Geotechnical Engineering. |
| 7. | I am independent of Anglo American plc, as defined in section 1.5 of NI 43-101. |
| 8. | I have no prior involvement with the property that is the subject of the Technical Report. |
| 9. | I have read NI 43-101 and Form 43-101F1 and the sections of the Technical Report I am responsible for have been prepared in compliance with that instrument and form. |
| 10. | As of the effective date of the Technical Report, to the best of my knowledge, information and belief, the sections of the Technical Report I am responsible for contains all scientific and technical information that is required to be disclosed to make the Technical Report not misleading. |
| Dated this 3rd day of November 2025. | |
| “Signed and Sealed” | |
| Max Brown, CEng, MSc, BSc, (MIMMM) | |
| Principal Consultant (Geotechnical Engineering) |
|
|
Registered Address: 21 Gold Tops, City and County of Newport, NP20 4PG, Wales, United Kingdom. SRK Consulting (UK) Limited Reg No 01575403 (England and Wales) |
Group Offices: Africa Asia Australia Europe North America South America |
|
|
SRK Consulting (UK) Limited 5th Floor Churchill House 17 Churchill Way Cardiff CF10 2HH Wales, United Kingdom E-mail: enquiries@srk.co.uk URL: www.srk.com Tel: + 44 (0) 2920 348 150 |
CERTIFICATE OF QUALIFIED PERSON
I, James Bellin, MSc, BSc, CGeol FGS do hereby certify that:
| 1. | I am a Principal Consultant (Hydrogeologist) of SRK Consulting (U.K) Ltd., 5th Floor, Churchill House, 17 Churchill Way, Cardiff, CF10 2HH, Wales, UK. |
| 2. | This certificate applies to the technical report titled “NI 43-101 Technical Report, Collahuasi Copper Mine, Tarapacá Region, Chile” with an effective date of December 31, 2024 (the “Technical Report”) prepared for Anglo American Plc. |
| 3. | I graduated with a Bachelor of Science in Environmental Geoscience gained from University of Bristol in 2003. In addition, I have a Master of Science in Hydrogeology from University of Birmingham in 2005. I have over 20 years of mine water management experience in both consultancy and industry. My experience spans study, operational, and closure phases of various water management projects around the world, including technical studies, problem solving, review and audit, and incident investigations, open-pit and underground. I am a Chartered Geologist (CGeol) and Fellow of the Geological Society of London, Alliance for Water Stewardship Credentialled Specialist. |
| 4. | I have read the definition of “qualified person” set out in National Instrument 43-101 (NI 43-101) – Standards of Disclosure for Mineral Projects (“NI 43-101”) and certify that by reason of my education, affiliation with a professional association (as defined in NI 43-101) and past relevant work experience, I fulfil the requirements to be a “qualified person” for the purposes of NI 43-101. |
| 5. | I have not personally inspected the operation. |
| 6. | I am responsible for the preparation of 16.1, 18.4,18.5, and provided contributions to 1.10, 1.14, 5.3, 20.3, 21, 25 and 26 of the Technical Report relating to Hydrology and hydrogeology, dewatering and site water management, water supply, water stewardship. |
| 7. | I am independent of Anglo American plc, as defined in section 1.5 of NI 43-101. |
| 8. | I have no prior involvement with the property that is the subject of the Technical Report. |
| 9. | I have read NI 43-101 and Form 43-101F1 and the sections of the Technical Report I am responsible for have been prepared in compliance with that instrument and form. |
| 10. | As of the effective date of the Technical Report, to the best of my knowledge, information and belief, the sections of the Technical Report I am responsible for contains all scientific and technical information that is required to be disclosed to make the Technical Report not misleading. |
| Dated this 3rd day of November 2025. | |
| “Signed and Sealed” | |
| James Bellin, MSc, BSc, CGeol FGS | |
| Principal Consultant (Hydrogeologist) |
|
|
Registered Address: 21 Gold Tops, City and County of Newport, NP20 4PG, Wales, United Kingdom. SRK Consulting (UK) Limited Reg No 01575403 (England and Wales) |
Group Offices: Africa Asia Australia Europe North America South America |
|
|
SRK Consulting (UK) Limited 5th Floor Churchill House 17 Churchill Way Cardiff CF10 2HH Wales, United Kingdom E-mail: enquiries@srk.co.uk URL: www.srk.com Tel: + 44 (0) 2920 348 150 |
CERTIFICATE OF QUALIFIED PERSON
I, Colin Chapman, CEng, MSc, BSc, MIMMM do hereby certify that:
| 1. | I am a Principal Consultant (Mine Infrastructure & Logistics) of SRK Consulting (U.K) Ltd., 5th Floor, Churchill House, 17 Churchill Way, Cardiff, CF10 2HH, Wales, UK. |
| 2. | This certificate applies to the technical report titled “NI 43-101 Technical Report, Collahuasi Copper Mine, Tarapacá Region, Chile” with an effective date of December 31, 2024 (the “Technical Report”) prepared for Anglo American Plc. |
| 3. | I hold a Bachelor of Science in Applied Geology gained from the University of Leicester in 2000 and a Master of Science in Applied Environmental Geology from Cardiff University in 2007. I have over 20 years of experience in mining, civil engineering, and construction industries. I specialise in the development of mining infrastructure and utilities, transport logistics assessments and infrastructure (road, rail, port, marine), project construction, and civil geotechnical engineering. I am involved in mining development studies, as well as review and due diligence. I am a Chartered Engineer and member of MIMMM. |
| 4. | I have read the definition of “qualified person” set out in National Instrument 43-101 (NI 43-101) – Standards of Disclosure for Mineral Projects (“NI 43-101”) and certify that by reason of my education, affiliation with a professional association (as defined in NI 43-101) and past relevant work experience, I fulfil the requirements to be a “qualified person” for the purposes of NI 43-101. |
| 5. | I have not personally inspected the operation. |
| 6. | I am responsible for the preparation of Items 1.10, 1.11, 18.1, 18.6-18.9, and have provided contributions to 21, 25 and 26 of the Technical Report relating to Infrastructure. |
| 7. | I am independent of Anglo American plc, as defined in section 1.5 of NI 43-101. |
| 8. | I have no prior involvement with the property that is the subject of the Technical Report. |
| 9. | I have read NI 43-101 and Form 43-101F1 and the sections of the Technical Report I am responsible for have been prepared in compliance with that instrument and form. |
| 10. | As of the effective date of the Technical Report, to the best of my knowledge, information and belief, the sections of the Technical Report I am responsible for contains all scientific and technical information that is required to be disclosed to make the Technical Report not misleading. |
| Dated this 3rd day of November 2025. | |
| “Signed and Sealed” | |
| Signed and Sealed | |
| Colin Chapman, CEng, MSc, BSc, MIMMM | |
| Principal Consultant (Mine Infrastructure & Logistics) |
|
|
Registered Address: 21 Gold Tops, City and County of Newport, NP20 4PG, Wales, United Kingdom. SRK Consulting (UK) Limited Reg No 01575403 (England and Wales) |
Group Offices: Africa Asia Australia Europe North America South America |
|
|
SRK Consulting (UK) Limited 5th Floor Churchill House 17 Churchill Way Cardiff CF10 2HH Wales, United Kingdom E-mail: enquiries@srk.co.uk URL: www.srk.com Tel: + 44 (0) 2920 348 150 |
CERTIFICATE OF QUALIFIED PERSON
I, Richard Martindale, CEng; BSc; MSc; MCSM; MIMMM; do hereby certify that:
| 1. | I am a Principal Consultant (Geotechnical Engineering) of SRK Consulting (U.K) Ltd., 5th Floor, Churchill House, 17 Churchill Way, Cardiff, CF10 2HH, Wales, UK. |
| 2. | This certificate applies to the technical report titled “NI 43-101 Technical Report, Collahuasi Copper Mine, Tarapacá Region, Chile” with an effective date of December 31, 2024 (the “Technical Report”) prepared for Anglo American Plc. |
| 3. | I graduated with a Bachelor of Science in Geology gained from the University of Durham in 2001. In addition, I have a Master of Science in Mining Geology from the University of Exeter in 2002. I have over 22 years’ experience in assessment and design of rock and soil slopes; numerical modelling; design and management of ground investigations and performance monitoring schemes; and, audits of slopes and waste storage facilities. I am a Chartered Engineer and MIMMM member. |
| 4. | I have read the definition of “qualified person” set out in National Instrument 43-101 (NI 43-101) – Standards of Disclosure for Mineral Projects (“NI 43-101”) and certify that by reason of my education, affiliation with a professional association (as defined in NI 43-101) and past relevant work experience, I fulfil the requirements to be a “qualified person” for the purposes of NI 43-101. |
| 5. | I have not personally inspected the operation. |
| 6. | I am responsible for the preparation of the Contributions 1.10, 1.14, 18.2, 18.3. Contributions to 21, 25 and 26 of the Technical Report relating to Waste management. |
| 7. | I am independent of Anglo American plc, as defined in section 1.5 of NI 43-101. |
| 8. | I have no prior involvement with the property that is the subject of the Technical Report. |
| 9. | I have read NI 43-101 and Form 43-101F1 and the sections of the Technical Report I am responsible for have been prepared in compliance with that instrument and form. |
| 10. | As of the effective date of the Technical Report, to the best of my knowledge, information and belief, the sections of the Technical Report I am responsible for contains all scientific and technical information that is required to be disclosed to make the Technical Report not misleading. |
| Dated this 3rd day of November 2025. | |
| “Signed and Sealed” | |
| Richard Martindale, CEng; BSc; MSc; MCSM; MIMMM | |
| Principal Consultant (Geotechnical Engineering) |
|
|
Registered Address: 21 Gold Tops, City and County of Newport, NP20 4PG, Wales, United Kingdom. SRK Consulting (UK) Limited Reg No 01575403 (England and Wales) |
Group Offices: Africa Asia Australia Europe North America South America |
| SRK Consulting (UK) Limited | Mineral Resources and Mineral Reserves, Collahuasi Copper Mine - Abbreviations, Units |
ABBREVIATIONS
| AA | Anglo American plc |
| ABA | Acid-Base Accounting |
| ABA | Acid-Base Accounting |
| ABCC | Acid Base Characteristic Curves |
| acQuire | Geoscientific Information Management System |
| Ag | Silver |
| ALARP | |
| Anglo Teck | Anglo Teck Group |
| ARD | Acid Rock Drainage |
| ARDML | Acid Rock Drainage and Metal Leaching |
| ARGI | argillically altered rocks |
| As | Arsenic |
| BH | Blasthole |
| BV | Bureau Veritas |
| BWi | Bond Work index |
| C20+ | Desalination project |
| CIM | |
| CIMM | CIMM Tecnologías y Servicios S.A |
| CMDIC | Compañía Minera Doña Inés de Collahuasi |
| Cu | Copper |
| CuT | Total copper |
| DCF | Discounted Case Flow |
| DDH | Diamon drillhole |
| DGA | General Directorate of Water |
| DIA | Environmental Impact Declaration / Declaración de Impacto Ambiental |
| EIA | Environmental Impact Assessment / Estudio de Impacto Ambiental |
| ENEL | Enel Generación |
| EoR | Engineer of Record |
| EPS | Environmental Monitoring Plan |
| ESAP | Environmental and Social Action Plan |
| ESG | Environmental, social and governance |
| ESIA | Environmental Social Impact Assessment |
| EWP | Early Warning Plans |
| FCAB | Antofagasta (Chili) & Bolivia Railway |
| FD | Field duplicates |
| FEL | Front end loaders |
| FF | Fracture frequency |
| FMEA | |
| FoS | Factor of Safety |
| GAB | Geotechnical Assessment Board |
| GC | Grade control |
| GeoInnova | GeoInnova Consultores SPA |
| geomet | Geometallurgical |
| GHG | Greenhouse gas |
| GISTM | Global Industry Standard on Tailings Management |
| November 2025 | ||
| Page |
| SRK Consulting (UK) Limited | Mineral Resources and Mineral Reserves, Collahuasi Copper Mine - Abbreviations, Units |
| GISTM | Global Industry Standard on Tailings Management |
| GRE | Environmental Relations Management |
| GSI | Geological strength index |
| GU | geotechnical units |
| HCT | Humidity Cell Test |
| IESC | Independent Environmental and Social Consultant |
| INF | Inferred material |
| ITRB | Independent Technical Review Board |
| JC | Joint condition |
| JORC | Joint Ore Reserves Committee |
| ktpd | Kilotonnes per day |
| LMAS | Sectoral Authorization Framework Law |
| LoM | Life of Mine |
| LSE | London Stock Exchange |
| masl | metres above the sea level |
| MI | Measured and Indicated material |
| MII | including Inferred material |
| Mo | Molybdenum |
| MoT | Total molybdenum |
| MRE | Mineral Resource Estimation |
| mRL | Metres relative level |
| Mtpa | Million tonnes per annum |
| NAG | Net Acid Generation |
| NAG | Non-Acid-Generating |
| NAG | Net Acid Generation |
| NAP | Net Acid Production |
| Non-PAG | Non-Potentially Acid Generating |
| NPV | Net present value |
| NSR | Net Smelter Return |
| OK | Ordinary Kriging |
| PAG | Potentially-Acid-Generating |
| PAG | Potentially acid generating |
| PAS | Environmental sectoral permits |
| PAT | Early Warning Plan |
| PCPI | Indigenous Peoples Consultation Process |
| PFS | Pre-Feasibility Study |
| PNM | Chile's National Mining Policy / Política Nacional Minera |
| PoF | Probability of failure |
| PPA | Power Purchase Agreements |
| QAQC | Quality Assurance Quality Control |
| QP | Qualified Person |
| RC | Reverse circulation drilling |
| RCA | Environmental Qualification Resolution / Resolución de Calificación Ambiental |
| REC | Renewable energy certificates |
| RoM | Run-of-Mine |
| RPEEE | Reasonable Prospects for Eventual Economic extraction |
| RQD | Rock Quality Designation |
| RSWD | Rosario South Waste Dump |
| November 2025 | ||
| Page |
| SRK Consulting (UK) Limited | Mineral Resources and Mineral Reserves, Collahuasi Copper Mine - Abbreviations, Units |
| RWD | Rosario Waste Dump |
| S | Sulphur |
| SBL/LG SP | low grade stockpiles |
| SEA | Ministry of Environment, Environmental Evaluation Service /Servicio de Evaluación Ambiental |
| SEIA | Environmental Impact Evaluation System / Sistema de Evaluación de Impacto Ambiental |
| SERNAGEOMIN | National Geology and Mining Service |
| SMA | Environmental Superintendent Authority |
| SMA | Superintendence of the Environment / Superintendencia del Medio Ambiente |
| SMU | Selective Mining Unit |
| SPLP | Synthetic Precipitation Leach Protocol |
| SX-EW | Solvent extraction/ electro-winning plant |
| TDS | total dissolved solids |
| Teck | Teck Resources Limited |
| TEM | Technical Economic Model |
| TEM | Transient electromagnetic survey |
| TSF | Tailings Storage Facility |
| TSX | Toronto Stock Exchange |
| UCS | Uni-axial Compressive Strength |
| UF | Unidad de Fomento, a Chilean Unit of Account |
| UF | Ultrafiltered sea water |
| UGA | Geo-environmental units |
| UGM | metallurgical domains / unidades geometalúrgicas |
| USD | United States Dollar |
| UWD | Ujina Waste Dump |
| VWP | vibrating wire piezometers |
| WRD | Waste Rock Dump |
| November 2025 | ||
| Page |
| SRK Consulting (UK) Limited | Mineral Resources and Mineral Reserves, Collahuasi Copper Mine - Abbreviations, Units |
Units
| masl | Metres above sea level |
| cm | Centimetre |
| cm3 | Cubic centimetre |
| m3 | Cubic metre |
| yd3 | Cubic yard |
| d | Day |
| ° | Degree |
| °C | Degrees Celsius |
| g | Gram |
| g/L | Grams per litre |
| g/t | Grams per tonne |
| > | Greater than |
| ha | Hectare (10,000 m2) |
| h | Hour |
| k | Kilo (thousand) |
| pa | Per annum |
| pd | Per day |
| s | Second |
| km | Kilometre |
| % | Percentage |
| lb | Pound |
| t | Metric tonne (1,000 kg) |
| kg | Kilogramme (1,000 g) |
| Pa | Pascal |
| N | Newton |
| ppm | Parts per million |
| L | Litre |
| µm | Micron |
| W | Watt |
| November 2025 | ||
| Page |