UNITED STATES
SECURITIES AND EXCHANGE COMMISSION
Washington, D.C. 20549
FORM 6-K
REPORT OF FOREIGN PRIVATE ISSUER
PURSUANT TO RULE 13a-16 OR 15d-16
UNDER THE SECURITIES EXCHANGE ACT OF 1934
For the month of November 2025
Commission File Number: 001-13184
TECK RESOURCES LIMITED
(Exact name of registrant as specified in its charter)
Suite 3300 – 550 Burrard Street
Vancouver, British Columbia V6C 0B3
(Address of principal executive offices)
Indicate by check mark whether the registrant files or will file annual reports under cover of Form 20-F or Form 40-F.
Form 20-F ¨ Form 40-F x Pursuant to the requirements of the Securities Exchange Act of 1934, the registrant has duly caused this report to be signed on its behalf by the undersigned, thereunto duly authorized.
EXHIBIT INDEX
SIGNATURE
| Teck Resources Limited | ||
| (Registrant) | ||
| Date: November 10, 2025 | By: | /s/ Amanda R. Robinson |
| Amanda R. Robinson | ||
| Corporate Secretary | ||
Exhibit 99.1

HALF YEAR FINANCIAL REPORT
for the six months ended 30 June 2025
This page has been intentionally left blank.
31 July 2025
Anglo American Interim Results 2025
Copper and iron ore lead strong operational and cost performance
| • | Portfolio simplification: successful demerger of Valterra Platinum unlocked significant value for shareholders; steelmaking coal and nickel sales agreed; and De Beers in process |
| • | Strong production and cost performance: EBITDA margins of 48% in copper and 44% in premium iron ore |
| • | Underlying EBITDA* of $3.0 billion from continuing operations, reflecting challenging rough diamond trading conditions |
| • | On track to deliver committed $1.8 billion of cost savings: $1.3 billion realised by the end of June 2025 |
| • | Strong cash conversion* at 108%, with further reductions in working capital delivered |
| • | Net debt* of $10.8 billion, prior to receipt of majority of portfolio simplification proceeds |
| • | $0.1 billion interim dividend, equal to $0.07 per share, consistent with our 40% payout policy, reflecting negative earnings from discontinued operations and lack of contribution from De Beers |
Note: Continuing operations includes Anglo American’s future portfolio and De Beers, per accounting requirements; discontinued operations includes the Platinum, Steelmaking Coal and Nickel businesses.
Duncan Wanblad, CEO of Anglo American, said: “We are delivering on our strategy, transforming Anglo American into a higher margin, more cash generative and more valuable mining company. By focusing on our exceptional copper, premium iron ore and crop nutrients resource endowments, each with significant value-accretive growth options, we are unlocking material value for our shareholders by delivering the see-through value of our portfolio, in which we expect copper to account for more than 60% of EBITDA.
“Safety is our number one value and always our first priority. We continue to make progress towards our goal of zero harm, with a further major improvement in the first half on what was our lowest-ever injury rate in 2024. I am, though, sorry to report the loss of two colleagues following accidents in Brazil and Zimbabwe. We are unconditional in our commitment to safety and we extend our heartfelt condolences to their families, friends and colleagues.
“I am delighted that the first half saw our continued strong operational and cost performance in copper and iron ore, coupled with further momentum towards our committed $1.8 billion of cost savings. Group underlying EBITDA of $3.0 billion from continuing operations reflects this focus on cost discipline, despite the challenging rough diamond market conditions. While 2025 is very much a year of transition, we maintained a strong EBITDA margin for our go-forward business at 43% (consistent with the prior period, on a pro forma basis(1)), compared with our current overall margin position of 32% from continuing operations (2024: 37%).
“We have made further good progress towards our simplified portfolio. In May, we completed the demerger of the majority of our interest in Valterra Platinum to our shareholders and we expect to monetise our residual 19.9% interest – currently valued at $2.6 billion – responsibly over time. We are also continuing to progress the agreed steelmaking coal and nickel business sale transactions. We expect a material strengthening of our balance sheet flexibility upon receipt of proceeds from these transactions. The work to separate De Beers is well under way, with action taken to strengthen cash flow as we position De Beers for long-term success and value realisation.
“Our clear and decisive actions are transforming Anglo American into a highly attractive and differentiated value proposition for the long term, offering strong cash generation to support sustainable shareholder returns combined with the capabilities and longstanding relationship networks to deliver our full value and growth potential.”
|
Six months ended US$ million, unless otherwise stated |
30 June 2025 | 30
June 2024 (re-presented)(2) |
Change | |||||||||
| Continuing operations | ||||||||||||
| Revenue | 8,954 | 9,584 | (7 | )% | ||||||||
| Underlying EBITDA* | 2,955 | 3,672 | (20 | )% | ||||||||
| EBITDA margin* | 32 | % | 37 | % | ||||||||
| Attributable free cash flow* | 322 | 191 | 69 | % | ||||||||
| Basic underlying earnings per share*($) | 0.32 | 0.71 | (55 | )% | ||||||||
| Attributable ROCE* | 9 | % | 12 | % | (3 | )% | ||||||
| Total (including discontinued operations) | ||||||||||||
| Loss attributable to equity shareholders of the Company | (1,879 | ) | (672 | ) | 180 | % | ||||||
| Basic underlying earnings per share* ($) | 0.15 | 1.06 | (86 | )% | ||||||||
| Loss per share ($) | (1.58 | ) | (0.55 | ) | 187 | % | ||||||
| Interim dividend per share ($) | 0.07 | 0.42 | (83 | )% | ||||||||
Terms with this symbol * are defined as Alternative Performance Measures (APMs). For more information, refer to page 88.
| (1) | Pro forma basis represents reported performance of continuing operations excluding De Beers, adjusted for committed cost savings. |
| (2) | Comparative figures are re-presented to show separately results from discontinued operations, see note 22. |
| Anglo American plc Interim Results 2025 | 1 |
Anglo American Interim Results
Sustainability performance
Key sustainability performance indicators(1)
Anglo American tracks its strategic progress using KPIs that are based on our seven pillars of value: safety and health, financial, cost, environment, people, production and socio-political. In addition to the financial and cost performance set out above and our operational performance on pages 3-30, our performance for the remaining four pillars is set out below, with further detail on pages 12-14.
Sustainability reporting accounts for 100% of managed operations (including both continuing and discontinued operations) until the date of divestment.
| Pillar of value | Metric | 30 June 2025 | 30 June 2024 | Target(2) | Target achieved | |||||
| Safety and health | Work-related fatal injuries(3) | 2 | 2 | Zero | Not achieved | |||||
| Total recordable injury frequency rate (TRIFR) per million hours | 1.20 | 1.69 | Reduction year on year | On track | ||||||
| New cases of occupational disease | 4 | 9 | Reduction year on year | On track | ||||||
| Environment | GHG emissions – Scopes 1 & 2 (Mt CO2e)(4) | 4.3 | 5.0 | Reduce absolute GHG emissions by 30% by 2030 | On track | |||||
| Fresh water withdrawals (ML)(4) (9) | 12,423 | 17,009 | Reduce fresh water abstraction in water scarce areas by 50% by 2030 | On track for 2030 target | ||||||
| Level 4–5 environmental incidents | 0 | 0 | Zero | Achieved | ||||||
| People | Women in management(5) | 36 | % | 35 | % | To achieve 33% by 2023 | Achieved | |||
| Women in the workforce | 26 | % | 26 | % | ||||||
| Voluntary labour turnover | 4.5 | % | 4 | % | < 5% | Achieved | ||||
| Socio-political | Number of jobs supported off site(6) (9) | 157,199 | 144,004 | |||||||
| Local procurement spend ($bn)(7) | 5.1 | 6.2 | ||||||||
| Taxes and royalties ($m)(8) | 1,991 | 2,481 |
| (1) | Sustainability performance indicators for the six months ended 30 June 2025 and the comparative period are not externally assured. |
| (2) | Targets indicated are in reference to our existing Sustainable Mining Plan’s commitments and goals. |
| (3) | 2025 reported performance includes one work-related fatality at the PGMs business (considered a discontinued operation under financial reporting, but included in sustainability data per the sustainability basis of preparation). |
| (4) | Data for current and prior period is to 31 May 2025 and 31 May 2024, respectively. |
| (5) | Management includes middle and senior management across the Group. |
| (6) | Jobs supported since 2018, in line with the Sustainable Mining Plan’s Livelihoods stretch goal. Current and prior period data represented is at 31 December 2024 and 2023 respectively. |
| (7) | Local procurement is defined as procurement from businesses that are registered and based in the country of operation – also referred to as in-country procurement – and includes local procurement expenditure from the Group’s subsidiaries and a proportionate share of the Group’s joint operations, based on shareholding. |
| (8) | Taxes and royalties include all taxes and royalties borne and taxes collected by the Group. This includes corporate income taxes, withholding taxes, mining taxes and royalties, employee taxes and social security contributions and other taxes, levies and duties directly incurred by the Group, as well as taxes incurred by other parties (e.g. customers and employees) but collected and paid by the Group on their behalf. Figures disclosed are based on cash remitted, being the amounts remitted by entities consolidated for accounting purposes, plus a proportionate share, based on the percentage shareholding, of joint operations. Taxes borne and collected by equity accounted associates and joint ventures are not included. Data is inclusive of both continuing and discontinued operations, in alignment with the sustainability performance reporting basis of preparation. |
| (9) | Prior period comparatives have been restated to reflect data model updates and the results of external assurance findings at 31 December 2024. |
| 2 | Anglo American plc Interim Results 2025 |
Anglo American Interim Results
Operational and financial review of Group results for the six months ended 30 June 2025
Operational performance
| Production – continuing operations | H1 2025 | H1 2024 | % vs H1 2024 | |||||||||
| Copper (kt)(1) | 342 | 394 | (13 | )% | ||||||||
| Iron ore (Mt)(2) | 31.4 | 30.7 | 2 | % | ||||||||
| Manganese ore (kt)(3) | 1,094 | 1,140 | (4 | )% | ||||||||
| Diamonds (Mct)(4) | 10.2 | 13.3 | (23 | )% | ||||||||
| (1) | Contained metal basis. Reflects copper production from the Copper operations in Chile and Peru only (excludes copper production from the Platinum Group Metals business). |
| (2) | Wet basis. |
| (3) | Anglo American’s 40% attributable share of saleable production. |
| (4) | Production is on a 100% basis, except for the Gahcho Kué joint operation which is on an attributable 51% basis. |
Continuing operations
Production volumes decreased by 9% on a copper equivalent basis, reflecting lower production at Copper Chile and De Beers.
Copper production decreased by 13% versus the prior period. At Copper Chile, anticipated lower grades, lower copper recoveries and temporary water supply constraints impacted Collahuasi, and the planned closure of the smaller Los Bronces processing plant in July 2024 impacted production at Los Bronces versus H1 2024. This was partly offset by a 6% increase in production at Copper Peru resulting from strong plant stability and higher grades.
Iron ore production increased by 2% driven by a 7% increase at Minas-Rio which was underpinned by improved mass recovery. This was partly offset by a 1% decrease at Kumba Iron Ore, facilitating the proactive drawdown of on-mine stockpiles.
Manganese production decreased by 4% reflecting the temporary suspension of the Australian operations since March 2024 as a result of the impact of tropical cyclone Megan.
At De Beers, the continued production response to the prolonged period of lower demand and higher than normal levels of inventory in the midstream impacted production in the period.
Group unit costs increased by 3% on a copper equivalent basis driven by the impact of lower production at Copper Chile and increased inflationary pressures. Excluding negligible foreign exchange impacts, unit costs also increased by 3%.
For more information on each Business’ production and unit cost performance, please refer to the following pages 16-28.
Discontinued operations
For operational information on each Business’ production and unit cost performance, please refer to the following pages 29-30.
| Anglo American plc Interim Results 2025 | 3 |
Anglo American Interim Results
Financial performance
Continuing operations Underlying EBITDA* decreased by 20% to $3.0 billion largely driven by $0.5 billion lower earnings from De Beers due to continuing challenging trading conditions. Gross cost savings of $0.3 billion delivered in the rest of the continuing operations portfolio remain on track to realise $0.5 billion of cost reductions by the end of 2025 and supported EBITDA Margin* of 32% despite a 1% reduction in the Group basket price, lower sales volumes and the impact of inflation. As a consequence, continuing operations contributed $0.4 billion to total underlying earnings of $0.2 billion.
Despite lower earnings, management actions to support the release of $0.4 billion of working capital primarily through inventory management, as well as net proceeds on disposal of Jellinbah, ensured only a modest increase in net debt to $10.8 billion with deleveraging to benefit from future divestment proceeds.
Underlying EBITDA* – Continuing operations
Underlying EBITDA decreased by $0.7 billion to $3.0 billion (30 June 2024: $3.7 billion). Financial results were predominantly impacted by the challenging rough diamond trading conditions at De Beers, alongside lower sales at Copper Chile, driven by the lower production. Despite these pressures, cost reductions partly offset these impacts and supported an EBITDA margin* of 32% (30 June 2024: 37%). Our ongoing focus on cost control and cash generation has positioned us well as we execute our strategy. A reconciliation of ‘Profit before net finance costs and tax’, the closest equivalent IFRS measure to underlying EBITDA, is provided within note 4 to the Condensed financial statements.
Underlying EBITDA* by segment
| $ million | Six months ended 30 June 2025 |
Six months ended 30 June 2024 (re-presented)(1) |
||||||
| Copper | 1,756 | 2,038 | ||||||
| Iron Ore | 1,410 | 1,413 | ||||||
| Manganese | (11 | ) | 11 | |||||
| Crop Nutrients | (30 | ) | (22 | ) | ||||
| De Beers | (189 | ) | 300 | |||||
| Corporate and other | 19 | (68 | ) | |||||
| Total | 2,955 | 3,672 | ||||||
| (1) | Comparative figures are re-presented to show separately results from discontinued operations, see note 22. |
Underlying EBITDA* reconciliation for the six months ended 30 June 2024 to six months ended 30 June 2025
The reconciliation of underlying EBITDA from $3.7 billion in 2024 to $3.0 billion in 2025 shows the major controllable factors (e.g. cost and volume), as well as those outside of management control (e.g. price, foreign exchange and inflation), that drive the Group’s performance.
| $ billion | ||||
| H1 2024 underlying EBITDA* | 3.7 | |||
| De Beers | (0.5 | ) | ||
| Price | – | |||
| Foreign exchange | – | |||
| Inflation | (0.1 | ) | ||
| Volume | (0.2 | ) | ||
| Cost | 0.2 | |||
| Other | (0.1 | ) | ||
| H1 2025 underlying EBITDA* | 3.0 | |||
De Beers
Rough diamond trading conditions remained challenged in the first half of 2025 resulting in a reduction in the rough price index, alongside the stock rebalancing initiatives at De Beers and including the impact of a one-off benefit from the fair value uplift of a non-diamond royalty right in H1 2024 saw underlying EBITDA* contribution reduce by $0.5 billion.
| 4 | Anglo American plc Interim Results 2025 |
| Anglo American Preliminary Results | Financial performance |
Price
Excluding the impact of De Beers, average market prices for the Group’s basket of products decreased by 1% compared with H1 2024. This was driven by a 4% reduction in the weighted average realised price for iron ore. This was partially offset by a 2% increase in the weighted average realised price for copper.
Foreign exchange
The Group’s average foreign exchange rate basket was broadly in line with H1 2024, creating no period-on-period impact to underlying EBITDA. The favourable impact of the weaker Chilean peso and Brazilian real was offset by the stronger South African rand and Peruvian sol.
Inflation
The Group’s weighted average CPI was 4% in 2025, broadly in line with the prior period. The impact of CPI inflation on costs reduced underlying EBITDA by $0.1 billion (30 June 2024: $0.3 billion).
Net cost and volume
Lower sales volumes impacted EBITDA by $0.2 billion, due to lower production at Copper Chile. This was partly offset by strong iron ore sales.
This was further offset by the realisation of savings delivered in 2024 seeing a gross $0.3 billion reduction in costs driven by lower headcount and mining costs at Kumba and lower overhead costs in Corporate partly offset by $0.1 billion of headwinds at Collahuasi. We are well on track to realise $0.5 billion of committed savings in 2025.
Other
The $0.1 billion unfavourable movement was driven by lower earnings at Manganese due to the suspension of operations following the tropical cyclone in March 2024.
Reconciliation from underlying EBITDA* to underlying earnings* – Continuing operations
Group underlying earnings decreased to $0.4 billion (30 June 2024: $0.9 billion), driven by lower underlying EBITDA, partly offset by lower income tax expense due to the lower earnings.
| $ million | Six months
ended 30 June 2025 |
Six
months ended 30 June 2024 (re-presented)(1) |
||||||
| Underlying EBITDA* | 2,955 | 3,672 | ||||||
| Depreciation and amortisation | (1,130 | ) | (1,071 | ) | ||||
| Net finance costs | (293 | ) | (275 | ) | ||||
| Income tax expense | (746 | ) | (1,025 | ) | ||||
| Non-controlling interests | (399 | ) | (440 | ) | ||||
| Underlying earnings* – continuing operations | 387 | 861 | ||||||
| (1) | Comparative figures are re-presented to show separately results from discontinued operations, see note 22. |
Depreciation and amortisation
Depreciation and amortisation was broadly in line at $1.1 billion (30 June 2024: $1.1 billion), as lower shipping rates and the impact of the impairment at De Beers in 2024 were offset by higher depreciation at Kumba from the reversal of an impairment at the end of 2024 and the capitalisation of Kapstevel South in June 2024, as well as Minas-Rio due to higher production and Copper Chile due to the capitalisation of material projects during the second half of 2024.
Net finance costs
Net finance costs, before special items and remeasurements, were broadly in line with the prior period at $0.3 billion (30 June 2024: $0.3 billion).
| Anglo American plc Interim Results 2025 | 5 |
| Anglo American Preliminary Results | Financial performance |
Income tax expense
The underlying effective tax rate was higher than the prior period at 48.7% (30 June 2024: 44.1%), impacted by the relative levels of profits arising in the Group’s operating jurisdictions. The tax charge for the period, before special items and remeasurements, was $0.7 billion (30 June 2024: $1.0 billion).
Non-controlling interests
The share of underlying earnings attributable to non-controlling interests was flat at $0.4 billion (30 June 2024: $0.4 billion). Amounts principally relate to minority shareholdings in Iron Ore and Copper.
Reconciliation from underlying EBITDA* to underlying earnings* – Discontinued operations
| $ million | Six months ended 30 June 2025 |
Six months ended 30 June 2024 (re-presented)(1) |
||||||
| Underlying EBITDA - discontinued operations* | 93 | 1,308 | ||||||
| Depreciation and amortisation | (212 | ) | (446 | ) | ||||
| Net finance costs | (85 | ) | (139 | ) | ||||
| Income tax expense | – | (204 | ) | |||||
| Non-controlling interests | (8 | ) | (90 | ) | ||||
| Underlying earnings* - discontinued operations | (212 | ) | 429 | |||||
| (1) | Comparative figures are re-presented to show separately results from discontinued operations, see note 22. |
Underlying earnings from discontinued operations was significantly lower largely driven by lower purchases of concentrate and the impact of flooding at Amandelbult in Platinum Group Metals (PGMs), as well as the impact in Steelmaking Coal due to the suspension of Grosvenor from July 2024, the sale of Jellinbah at the end of 2024 and the underground incident at Moranbah in March 2025. Due to the lower earnings, tax and non-controlling interests were both consequently lower.
Reconciliation from underlying EBITDA - Total Group* to underlying earnings*
| $ million | Six months ended 30 June 2025 |
Six months ended 30 June 2024 |
||||||
| Underlying EBITDA - Total Group* | 3,048 | 4,980 | ||||||
| Depreciation and amortisation | (1,342 | ) | (1,517 | ) | ||||
| Net finance costs | (378 | ) | (414 | ) | ||||
| Income tax expense | (746 | ) | (1,229 | ) | ||||
| Non-controlling interests | (407 | ) | (530 | ) | ||||
| Underlying earnings* | 175 | 1,290 | ||||||
Special items and remeasurements – Continuing operations
Special items and remeasurements (after tax and non-controlling interests) from continuing operations are a net credit of $0.1 billion (H1 2024: net charge of $1.9 billion). This principally relates to tax functional currency remeasurements of $0.2 billion partially offset by restructuring costs related to the Group’s strategic change programme of $0.1 billion.
Full details of the special items and remeasurements recorded are included in note 11 to the Condensed financial statements.
| 6 | Anglo American plc Interim Results 2025 |
| Anglo American Preliminary Results | Financial performance |
Net debt*
| 2024 | ||||||||
| $ million | 2025 | (re-presented)(1) | ||||||
| Opening net debt* at 1 January | (10,623 | ) | (10,615 | ) | ||||
| Underlying EBITDA* from subsidiaries and joint operations | 2,923 | 3,626 | ||||||
| Working capital movements | 361 | 675 | ||||||
| Other cash flows from operations | (17 | ) | (301 | ) | ||||
| Cash flows from operations | 3,267 | 4,000 | ||||||
| Capital repayments of lease obligations | (133 | ) | (167 | ) | ||||
| Cash tax paid | (612 | ) | (739 | ) | ||||
| Dividends from associates, joint ventures and financial asset investments | 28 | 42 | ||||||
| Net interest(2) | (405 | ) | (485 | ) | ||||
| Distributions paid to non-controlling interests | (220 | ) | (257 | ) | ||||
| Sustaining capital expenditure | (1,298 | ) | (1,495 | ) | ||||
| Sustaining attributable free cash flow* | 627 | 899 | ||||||
| Growth capital expenditure and other(3) | (305 | ) | (708 | ) | ||||
| Attributable free cash flow* | 322 | 191 | ||||||
| Dividends to Anglo American plc shareholders | (270 | ) | (503 | ) | ||||
| Acquisitions and disposals | (49 | ) | – | |||||
| Foreign exchange and fair value movements | 69 | (3 | ) | |||||
| Other net debt movements(4) | (121 | ) | (401 | ) | ||||
| Total movement in net debt* – continuing operations | (49 | ) | (716 | ) | ||||
| Total movement in net debt* – discontinued operations(5) | (92 | ) | 243 | |||||
| Closing net debt* at 30 June | (10,764 | ) | (11,088 | ) | ||||
| (1) | The 2024 results have been restated to exclude the discontinued operations for comparability to the current year. |
| (2) | Includes cash outflows of $128 million (30 June 2024: outflows of $243 million), relating to interest payments on derivatives hedging net debt, which are included in cash flows from derivatives related to financing activities. |
| (3) | Growth capital expenditure and other includes $17 million (30 June 2024: $46 million) of expenditure on non-current intangible assets. |
| (4) | Includes the purchase of shares (including for employee share schemes) of $40 million and other movements in lease liabilities (excluding variable vessel leases) increasing net debt by $26 million. 30 June 2024 Includes the purchase of shares (including for employee share schemes) of $99 million and other movements in lease liabilities (excluding variable vessel leases) increasing net debt by $165 million |
| (5) | Includes cash received from the Jellinbah disposal of $870 million; finance leases included within held for sale at 30 June and thus excluded from net debt of $141m; offset by capital expenditure of $518 million; Valterra Platinum dividends paid to non-controlling interests of $297 million and the net debt impact of the demerger of Valterra Platinum of $151 million including tax and transaction costs. 30 June 2024 includes cash flows from discontinued operations of $1,117 million; partially offset by capital expenditure of $762 million and cash tax paid of $145 million. |
Net debt (including related derivatives) of $10.8 billion has increased by $0.2 billion from 31 December 2024. Net debt at 30 June 2025 represented gearing (net debt to total capital) of 29% (31 December 2024: 27%). The net debt to EBITDA ratio increased to 1.8x (31 December 2024: 1.3x), as a result of the slightly higher net debt coupled with the lower underlying EBITDA. This is temporarily elevated as the portfolio transitions, with proceeds from expected divestments to be used to deleverage.
Cash flow
Cash flows from operations and Cash conversion* – Continuing operations
Cash flows from operations decreased to $3.3 billion (30 June 2024: $4.0 billion), reflecting the lower Underlying EBITDA from subsidiaries and joint operations and lower working capital inflow of $0.4 billion (30 June 2024: inflow of $0.7 million). An inventory inflow of $0.6 billion was partly offset by a $0.2 billion payables outflow.
These factors contributed to the Group’s cash conversion increasing to 108% (30 June 2024: 93%).
| Anglo American plc Interim Results 2025 | 7 |
| Anglo American Preliminary Results | Financial performance |
Capital expenditure* – Continuing operations
| $ million | Six months ended 30 June 2025 |
Six months ended 30 June 2024 (re-presented)(1) |
||||||
| Stay-in-business | 913 | 1,068 | ||||||
| Development and stripping | 292 | 258 | ||||||
| Life-extension projects | 101 | 173 | ||||||
| Proceeds from disposal of property, plant and equipment | (8 | ) | (5 | ) | ||||
| Sustaining capital | 1,298 | 1,494 | ||||||
| Growth projects | 288 | 635 | ||||||
| Total capital expenditure | 1,586 | 2,129 | ||||||
| (1) | Comparative figures are re-presented to show separately results from discontinued operations, see note 22. |
Capital expenditure was $0.5 billion lower compared to the prior period at $1.6 billion (30 June 2024: $2.1 billion).
Sustaining capital expenditure was lower at $1.3 billion (30 June 2024: $1.5 billion), primarily due to the Collahuasi desalinisation project spend reducing as it progresses towards completion in 2026.
Growth capital expenditure primarily relates to spend on the Woodsmith project (Crop Nutrients), the first phase of the Collahuasi debottlenecking initiative (Copper Chile) and the Kumba Ultra High Dense-Media-Separation (UHDMS) project (Iron Ore). Growth capital expenditure was lower at $0.3 billion (30 June 2024: $0.6 billion), due to the slow down in development of Woodsmith in the near term.
Attributable free cash flow* – Continuing operations
The Group’s attributable free cash flow was $0.3 billion (30 June 2024: $0.2 billion). Despite lower cash flows from operations this period of $3.3 billion (30 June 2024: $4.0 billion) driven by lower earnings and a smaller working capital outflow, a reduction in total capex to $1.6 billion (30 June 2024: $2.1 billion) and cash tax to $0.6 billion (30 June 2024: $0.7 billion) fully offset this decrease.
Other movements in net debt – Continuing operations
In addition to the movements in attributable free cash flow, the total movement in net debt was impacted by dividends to Anglo American plc shareholders, acquisitions and disposals, foreign exchange and fair value movements and other net debt movements. The dividend paid to Anglo American plc shareholders reduced to $0.3 billion (30 June 2024: $0.5 billion), driven by a reduction in underlying earnings.
Shareholder returns
In line with the Group’s established dividend policy to pay out 40% of underlying earnings, the Board has proposed an interim dividend of 40% of first half total underlying earnings, equal to $0.07 per share (30 June 2024: $0.42 per share), equivalent to $0.1 billion (30 June 2024: $0.5 billion).
Balance sheet
Net assets decreased by $3.0 billion to $25.6 billion (31 December 2024: $28.5 billion), driven principally by the demerger of the PGMs business, whereby net assets of $5.6 billion were demerged. This was partially offset by the recognition of a financial asset investment of $2.3 billion as at 30 June 2025 for the residual 19.9% holding in the PGMs business held at fair value.
Attributable ROCE* – Continuing operations
Attributable ROCE decreased to 9% (30 June 2024: 12%). Attributable underlying EBIT decreased to $2.0 billion (30 June 2024: $3.1 billion), reflecting the impact of lower underlying EBITDA. Average attributable capital employed decreased to $22.8 billion (2024: $25.6 billion), primarily due to the impact from the impairment recognised in the prior year at De Beers.
| 8 | Anglo American plc Interim Results 2025 |
| Anglo American Preliminary Results | Financial performance |
Liquidity and funding
Group liquidity was $12.0 billion (31 December 2024: $15.3 billion), comprising $5.8 billion of cash and cash equivalents (31 December 2024: $8.1 billion) and $6.2 billion of undrawn committed facilities (31 December 2024: $7.2 billion).
In March 2025, the Group partially bought back Euro and US dollar denominated bonds with maturities in 2027 and 2028. The Group used $1.0 billion of cash to retire $1.0 billion of contractual repayment obligations (including derivatives hedging the bonds).
Consequently, the weighted average maturity on the Group’s bonds increased to 7.8 years (31 December 2024: 7.6 years).
Attractive growth options
Anglo American continues to evolve its portfolio of competitive, world-class assets towards those future-enabling products that are essential for decarbonising the global economy, improving living standards, and supporting food security. In addition to these expansion opportunities, we also have value-accretive adjacencies in our portfolio where we expect significant value to be unlocked.
Growth projects (metrics presented on a 100% basis unless otherwise indicated)
Progress and current expectations in respect of our key growth projects are as follows:
| Operation | Scope | Capex $bn |
Remaining capex $bn |
First production |
||||
| Copper | ||||||||
| Collahuasi | Debottlenecking investment in additional crushing capacity and flotation cells is expected to increase plant throughput from c.170 ktpd to c.185 ktpd, adding production of c.10 ktpa (44% share) on average from 2026. | c.0.2 (44% share) |
c.0.1 (44% share) |
2026 | ||||
| Further investments in debottlenecking initiatives have been approved and are expected to expand the existing plant to the total permitted capacity of 210 ktpd and will add c.15 ktpa (44% share) of production from late 2027. | c.0.3 (44% share) |
c.0.3 (44% share) |
Late 2027 | |||||
| Beyond that, studies and permitting are required to be finalised for a fourth processing line in the plant and mine expansion that would add up to c.150 ktpa (44% share) of production from the early 2030s. The desalination plant that is currently under construction has been designed to accommodate capital efficient expansion in light of the growth potential at the asset. | Subject to ongoing studies, permitting, and approvals | |||||||
| Quellaveco | The plant throughput was initially permitted to a level of 127.5 ktpd and a change in legislation in June 2024 has increased the permit allowance from 5% to 10%, enabling throughput of up to c.140 ktpd. | |||||||
| In order to maximise throughput within the parameters of the current EIA permit, a rapid permit to increase throughput to 150 ktpd plus the 10% allowance was obtained in 2025. This provides added flexibility to design optimal throughput for the plant with limited configuration changes, subject to sectorial permits associated with the specific design and water availability. | ||||||||
| In light of this, the stage one expansion has been approved and will increase throughput to c.142 ktpd by late 2026, involving installation of a second pebble crusher and additional floatation cells. | c. 0.1 | c.0.1 | Late 2026 | |||||
| Efforts will continue to further debottleneck the plant, while conducting early studies to support Quellaveco’s long-term expansion prospects. | Subject to ongoing studies, permitting and approvals |
| Anglo American plc Interim Results 2025 | 9 |
| Anglo American Preliminary Results | Financial performance |
| Operation | Scope | Capex $bn |
Remaining capex $bn |
First production |
||||
| Sakatti | Polymetallic greenfield project in Finland containing copper, nickel, platinum, palladium, gold, silver and cobalt. The mine design has been updated to reflect the latest studies and production profile, expected to deliver 60-80 ktpa copper equivalent production from a state-of-the-art mine design with minimal surface footprint. The EIA was approved by the Finnish authorities in 2023 and we are progressing with work to augment existing studies in support of a Natura 2000 update. | Subject to ongoing studies, permitting, and approvals | Early 2030s | |||||
| Los Bronces | A memorandum of understanding with Codelco was signed in February 2025 to implement a joint mine plan between Los Bronces and Andina, which is expected to contribute an additional c.60 ktpa copper equivalent production (average over 2030-2051). |
Subject to definitive agreement, ongoing studies, permitting, and approvals. | 2030 | |||||
Work is progressing towards a definitive agreement in H2 2025, with the joint mine plan expected to start from 2030. |
||||||||
| The underground project will partly replace lower grade open-pit tonnes with higher grade underground tonnes. It is located 5 km from the existing pit and will use the same plant and tailings deposit capacity used by the current operation, without requiring any additional fresh water. |
||||||||
| The underground development was permitted as part of the wider Los Bronces integrated project permit granted in 2023. Studies are under way with the aim being to develop a modern operation with minimal surface impact while maximising value delivery from the project. |
||||||||
| Timing of the underground project is under review, dependent on the finalisation of the joint mine plan agreement with Codelco. The joint mine plan excludes the endowments related to Los Bronces underground. | Beyond 2030 | |||||||
| Premium iron ore | ||||||||
| Minas-Rio | The implementation of recleaner flotation columns to enable higher throughput while maintaining product quality. The average impact on production from the implementation of the recleaners from 2028 to 2040 is expected to be ~2.8 Mtpa. | c.0.3 | c.0.2 | 2028 | ||||
| The acquisition of the neighbouring Serpentina resource from Vale completed in Q4 2024. Serpentina is of a higher iron ore grade than Minas-Rio’s ore and contains predominantly softer friable ore that together are expected to translate into lower unit costs and capital requirements. | Subject to studies, permitting and approvals. | |||||||
| The combination of Minas-Rio with the scale and quality of the Serpentina endowment provides a high value option to double Minas-Rio’s production. Vale will also have an option to acquire an additional 15% shareholding in the enlarged Minas-Rio for cash (at fair value calculated at the time of exercise of the option), if and when certain events relating to a future expansion occur. Near-term access to the Serpentina ore as well as the potential future expansion are both subject to obtaining normal licences, which are expected to take a number of years. | ||||||||
| Kumba | The conversion of Sishen’s Dense Media Separation plant to an UHDMS plant will enable Sishen to reduce its ROM cut-off grade (from 48% to 40%) and produce more premium-grade product (from less than 20% to more than 50% of production) | c.0.6 | c.0.4 | 2028 |
| 10 | Anglo American plc Interim Results 2025 |
| Anglo American Preliminary Results | Financial performance |
| Operation | Scope | Capex $bn |
Remaining capex $bn |
First production |
||||
| Crop Nutrients | ||||||||
| Woodsmith | New polyhalite (natural mineral fertiliser) mine being developed in North Yorkshire, UK. Expected to produce a premium quality, comparatively low carbon fertiliser suitable for organic use. Final design capacity of c.13 Mtpa is expected, subject to studies and approval. | Refer to page 23 for more information on project progress | ||||||
Life-extension projects (metrics presented on a 100% basis unless otherwise indicated)
Progress and current expectations in respect of our key life-extension projects are as follows:
| Operation | Scope | Capex $bn |
Remaining capex $bn |
Expected first production |
||||
| Diamonds | ||||||||
| Venetia |
The Venetia underground is a replacement for the open pit and currently is expected to produce c.4Mctpa. First production was achieved in 2023 with ramp-up over the next few years as development continues. |
c.2.3 | c.0.6 | Achieved in June 2023 | ||||
| The Venetia Underground Project is undergoing a review in order to optimise cost, capital and production in light of the current market environment. |
||||||||
| Jwaneng | 9 Mctpa (100% basis) replacement for Cuts 7 and 8. This will extend the life of the mine by 9 years to 2036. | c.0.4 (19.2% share) |
c.0.1 (19.2% share) |
2027 |
Technology projects(1)
The Group continues to invest in technology projects that relate to its FutureSmart MiningTM approach, including the delivery of Anglo American’s Sustainable Mining Plan targets, particularly those that relate to safety, energy, emissions and water. The Group has optimised its technology programme, focusing only on those technologies that will bring the most benefit to the operating assets and development projects, as well as determining the most effective manner to execute these programmes. For more information on technology, please refer to our 2024 Integrated Annual Report, from page 62.
| (1) | Expenditure relating to technology projects is included within operating expenditure, or if it meets the accounting criteria for capitalisation, within Growth capital expenditure. |
| Anglo American plc Interim Results 2025 | 11 |
Anglo American Preliminary Results
Sustainability performance
Sustainable Mining Plan
Anglo American’s longstanding and holistic approach to sustainability helps to build trust with our employees and stakeholders across society, reduces operational risk and delivers direct financial value for our business. Our reputation as a responsible mining company supports our ability to access future resource development opportunities, both from the significant endowments within our business and more broadly – critical to delivering our growth ambitions.
Our Sustainable Mining Plan is designed to be a flexible, living plan and we continue to evolve it as we learn and make progress, and as technologies develop, while also ensuring it stays relevant and suitably stretching, in tune with our employees’ and stakeholders’ ambitions for our business. We are finalising an update to the Sustainable Mining Plan to both reflect the Group’s future portfolio, and to ensure that our sustainability ambitions deliver tangible value to our many stakeholders at a local level, where it matters most. Progress against the existing Sustainable Mining Plan targets is discussed below.
Zero mindset
Occupational safety
We tragically lost two colleagues in fatal incidents in the first half of 2025. On 4 February, Mr Edvan de Jesus Pinto Bogea, a colleague working for MIP Engenharia, a contractor company working on the construction of the Filtering Plant Project at Minas-Rio in Brazil was fatally injured in a fall from height incident during construction activities. On 20 April, Mr Felix Kore, a colleague working at the Unki PGMs mine in Zimbabwe was fatally injured in a mobile equipment incident.
The loss of a colleague is a profound reminder of how deeply safety matters. It affects not just the workplace, but every life connected to it, and we keep them in our thoughts at this very difficult time. We must remain focused and vigilant at all times, staying alert to hazards and the risks that surround us.
We are pleased to report continued progress in our safety performance during the first half of 2025. Our Total Recordable Injury Frequency Rate (TRIFR) has shown a sustained downward trend, building on the improvements achieved in 2024 (2024 FY: 1.57; 2025 H1: 1.20). Importantly, we have also seen a consistent decline in High Potential Incidents, reflecting the effectiveness of our risk mitigation strategies and operational discipline.
These improvements in our lagging safety indicators are underpinned by strong performance in key leading indicators. Hazard reporting remains robust, demonstrating a proactive reporting culture across our operations. Visible Felt Leadership continues to drive accountability and engagement at all levels. Planned maintenance is being executed with precision, reducing unplanned work and enhancing reliability.
Our commitment to safety is unwavering, and these results reflect the strength of our systems, our people, and our leadership. We remain focused on continuous improvement to ensure a safe and sustainable operating environment.
Occupational health
Our health and well-being strategy, aligned with the World Health Organization (WHO) Healthy Workplace model, has been updated to include Total Worker Health concepts that integrate actions to support the health and well-being of our workforce and host communities. This integrated strategy incorporates our WeCare well-being programme and other social performance activities, including our livelihoods-support programmes. It requires us to work synergistically to support our people and achieve our health and well-being goals.
Occupational diseases
To date in 2025, there were four reported new cases of occupational disease, all of which were hearing loss related to historic noise exposure (2024 H1: 9; 2024 FY: 19, of which 14 were related to noise exposure and one was musculoskeletal). The challenge in occupational disease reporting is that many hazards do not cause immediately detectable health harms, with most occupational diseases not clinically definable until many years post exposure. This means disease cases reported in a given year reflect accumulated and/or past working conditions and exposures. This is termed “latency of presentation”, and the challenge underscores the importance of ongoing robust environment monitoring, comprehensive worker education and health surveillance, regularly updated risk assessments, and proactive control of hazards with levels over the Occupational Exposure Limit. This is why reduction and prevention strategies to control all known workplace hazards down to scientifically proven protective levels remain an ongoing focus at Anglo American.
| 12 | Anglo American plc Interim Results 2025 |
| Anglo American Preliminary Results | Sustainability Performance |
We continue to maintain efforts on quality data and evolving the reporting of our health data to help inform our future decision making.
Healthy environment
Our existing Sustainable Mining Plan includes commitments to be a leader in environmental stewardship. These include our aims, by 2030, to reduce operational greenhouse gas (GHG) emissions (Scopes 1 and 2) by 30%; achieve a 50% reduction in fresh water abstraction in water scarce areas; and deliver net-positive impacts in biodiversity across our managed operations.
Climate change
In the first half of 2025, Scope 1 and 2 GHG emissions for the current portfolio, including PGMs, were 14% lower than the same period in 2024. This was largely driven by the shutdown of the Grosvenor mine at Steelmaking Coal and the Mortimer smelter at PGMs, as well as planned lower production at some assets, compared to 2024.
We are making progress towards achieving carbon neutrality across our operations by 2040. Compared with 2019, when our emissions peaked, by 2024 we had delivered a 31% reduction in our total Scope 1 and 2 emissions. Year-on-year improvements in the management of methane in our steelmaking coal business made the largest contribution to this reduction, with the completion of our renewable energy rollout in South America in 2023 also making a significant contribution. A major milestone so far in 2025 was the shift of our managed operations in Australia to 100% renewable electricity supply. Added to our South American operations, which have been supplied with 100% renewable electricity since 2023, this means that approximately 60% of the global grid supply for the current Anglo American portfolio (including PGMs) is currently drawn from renewable sources.
We continue to make progress towards addressing Anglo American’s largest remaining current source of Scope 2 emissions – our electricity supply in southern Africa. Our jointly owned renewable energy venture with EDF Power Solutions, known as Envusa Energy, is continuing construction of three renewable energy projects, known as the Koruson 2 cluster. These projects, located on the border of the Northern and Eastern Cape provinces of South Africa, are designed to have a total capacity of 520 MW of wind and solar electricity generation. In the first half of 2025, the Anglo American Board approved construction of a 63MW solar plant on one of the waste rock dumps at Kumba’s Sishen mine.
Water
With more than 80% of our global assets (including PGMs) located in water scarce areas, we need to reduce our dependence on fresh water and are working on a number of projects and technologies to help us achieve our fresh water reduction targets.
By the end of 2024, we had reduced fresh water withdrawals by 27% against the 2015 baseline that informs the Sustainable Mining Plan target of a 50% reduction in fresh water withdrawals by 2030. At mid-year 2025, fresh water withdrawals are down an additional 27% compared to H1 2024. Our operations continue to improve their water re-use and recycling rates, reducing their reliance on fresh water. Group-wide water efficiency increased to 86% in 2024 (2023: 84%). This focus on efficiency continues at all our operations throughout 2025, with reported H1 2025 efficiency at 85%.
Biodiversity
As custodians of the land and ecosystems around our operations, we seek to improve the footprint of our operations and direct our efforts towards delivering positive and lasting environmental outcomes for host communities and our wide range of stakeholders.
We have now completed detailed biodiversity baseline assessments across all our managed operations, defining and assessing significant biodiversity features including key habitats and species, as well as identifying those ecosystems that require protection and restoration. The progress towards Net Positive Impact (NPI) was reassessed in 2023, enabling us to begin developing each site’s pathway to maintaining an NPI position throughout the life of the asset. Detailed biodiversity management programmes have been developed for each site and have been independently reviewed by our NGO partners.
We continue to implement a range of biodiversity programmes across our its operations to support delivery of the Biodiversity Management Plans. These include large-scale land conservation at El Soldado and Minas-Rio, restoration of degraded land at Los Bronces, and connecting fragmented ecosystems at Kumba and Minas-Rio. At Quellaveco, collaboration with International Union for Conservation of Nature and UNEP World Conservation Monitoring Centre is advancing species monitoring while also supporting community engagement and afforestation. Collectively, these initiatives contribute to species protection, ecosystem restoration, data sharing, and long term biodiversity resilience across landscapes.
| Anglo American plc Interim Results 2025 | 13 |
| Anglo American Preliminary Results | Sustainability Performance |
Thriving communities
We continue working to strengthen and broaden our social performance competencies through embedding our social performance management system – the Social Way – across Anglo American. Through the implementation of the Social Way, which we believe is one of the most robust and comprehensive social performance management systems in the mining sector, we protect and enable both business and stakeholder value. Through our collaborative regional development initiatives, we are working actively to support local and regional economies, as well as the lives and livelihoods of the communities where we operate.
In 2024 we completed an efficiency review of the Social Way Assurance programme and the revised approach to assurance will be piloted in H2 2025.
Since the launch of our Sustainable Mining Plan, we have supported more than 157,000 off site jobs through livelihoods programmes. One example of where we are offering support beyond traditional social investment is our Impact Finance Network (IFN), which supports local growth-stage SMEs to prepare for and access funding from investors, provides pre-investment technical assistance, investor matching and catalytic capital and unlocks impact capital at scale, working with partners to build effective impact investment ecosystems. To date, the IFN has provided technical assistance and matching to more than 100 companies globally, supporting more than 53,000 jobs and raising over $117 million of third-party capital. Building off the work in southern Africa, we now have a strong footprint in South America. We are into our third year of operation in Chile and into our second year in Peru, while rolling out the IFN to Brazil, with a pilot running to the end of 2025.
Trusted corporate leader
Tightly linked to our safety imperative and our Values, we strive to create a workplace that places people at its heart. We are committed to promoting an inclusive and diverse environment where every colleague is valued and respected for who they are, and has the opportunity to fulfil their potential.
At mid-year 2025, we have continued to increase female representation across the business for our management population, reaching 36%. In addition, in regard to female representation on the Executive Leadership Team (ELT) we have increased to 30% (from 25% at the end of 2024). Female representation on the ELT, plus those reporting to an ELT member, increased to 35% (from 34% in 2024). In addition to ELT representation, we continue to work on other key performance metrics, such as the percentage of women in the overall workforce, which has remained at 26%.
To demonstrate the high standards to which we operate, we have actively worked with multi-stakeholder groups developing and adopting some of the most trusted sustainability certification programmes for the mining sector, including the Initiative for Responsible Mining Assurance (IRMA) and the Responsible Jewellery Council (RJC).
Having met our Sustainable Mining Plan interim target of having half of our operations undergo third-party audits against recognised responsible mine certification systems in 2022, we continue to work towards our 2025 target to have initiated third-party audits of all our relevant operations.
Sites that have undergone third-party assessment include:
| – | Minas-Rio and Barro Alto mines in Brazil are the first iron ore and nickel-producing mines in the world to complete an IRMA audit. Both mines achieved the IRMA 75 level of performance. |
| – | Kolomela and Sishen mines in South Africa are the first iron ore mines in Africa to complete IRMA audits, achieving an IRMA 75 level of performance. |
| – | Los Bronces and El Soldado copper operations have achieved The Copper Mark certification. Our first audits in Steelmaking Coal, using the Towards Sustainable Mining (TSM) standard, were completed at the Capcoal and Aquila mines. |
The success of our business is shared with a wide range of stakeholders, including national governments and host communities, through the significant corporate tax, mining tax and royalty payments that we make. Total taxes and royalties borne and taxes collected amounted to $1,991 million, a 20% decrease compared with the $2,481 million paid in the prior reporting period.
| 14 | Anglo American plc Interim Results 2025 |
Anglo American Preliminary Results
The Board
Changes to the composition of the Board in 2025 are set out below.
As announced in December 2024, Anne Wade joined the Board as a non-executive director and a member of the Board’s Audit and Sustainability committees on 1 January 2025.
At the date of this report, five (45%) of the 11 Board directors are female and two (18%) identify as minority ethnic. The names of the directors at the date of this report and the skills and experience our Board members contribute to the long term sustainable success of Anglo American are set out on the Group’s website:
www.angloamerican.com/about-us/leadership-team
Principal risks and uncertainties
Anglo American is exposed to a variety of risks and uncertainties which may have a financial, operational or reputational impact on the Group, and which may also have an impact on the achievement of social, economic and environmental objectives.
The principal risks and uncertainties facing the Group relate to the following:
| – | Catastrophic and natural catastrophe risks |
| – | Product prices |
| – | Geopolitical |
| – | Cybersecurity |
| – | Permitting and regulatory |
| – | Operational performance |
| – | Safety |
| – | Corruption |
| – | Portfolio and organisational transformation |
| – | Community stakeholder conflict |
| – | Water |
| – | Pandemic |
| – | Climate change |
The Group is exposed to changes in the economic environment, including tax rates and regimes, as with any other business. Details of any key risks and uncertainties specific to the period are covered in the business reviews on pages 16–30. Details of relevant tax matters are included in note 7 to the Condensed financial statements. The principal risks and uncertainties facing the Group at the 2024 year end are set out in detail in the strategic report section of the Integrated Annual Report 2024, published on the Group’s website www.angloamerican.com, on 3 March 2025.
| Anglo American plc Interim Results 2025 | 15 |
Copper
Operational and financial business review
Copper
Operational and financial metrics
| Production volume |
Sales volume |
Price | Unit cost* |
Group revenue* |
Underlying EBITDA* |
EBITDA margin* |
Underlying EBIT* |
Capex* | ROCE* | |||||||||||||
| kt(1) | kt(2) | c/lb(3) | c/lb(4) | $m(5) | $m | $m | $m | |||||||||||||||
| Copper Total | 342 | 345 | 436 | 155 | 3,666 | 1,756 | 48 | % | 1,214 | 712 | 18 | % | ||||||||||
| Prior period | 394 | 391 | 429 | 152 | 3,875 | 2,038 | 53 | % | 1,564 | 855 | 25 | % | ||||||||||
| Copper Chile | 186 | 192 | 444 | 211 | 2,142 | 715 | 33 | % | 360 | 543 | 13 | % | ||||||||||
| Prior period | 247 | 242 | 437 | 176 | 2,455 | 1,196 | 49 | % | 893 | 620 | 33 | % | ||||||||||
| Los Bronces(6) | 80 | 82 | n/a | 248 | 813 | 293 | 36 | % | 126 | 121 | n/a | |||||||||||
| Prior period | 97 | 92 | – | 241 | 873 | 369 | 42 | % | 244 | 146 | – | |||||||||||
| Collahuasi(7) | 83 | 86 | n/a | 181 | 859 | 379 | 44 | % | 253 | 403 | n/a | |||||||||||
| Prior period | 125 | 127 | – | 119 | 1,204 | 782 | 65 | % | 654 | 463 | – | |||||||||||
| Other operations(8) | 22 | 24 | n/a | n/a | 470 | 43 | 9 | % | (19) | 19 | n/a | |||||||||||
| Prior period | 24 | 23 | – | – | 378 | 45 | 12 | % | (5) | 11 | – | |||||||||||
| Copper
Peru (Quellaveco)(9) |
157 | 153 | 427 | 88 | 1,524 | 1,041 | 68 | % | 854 | 169 | 23 | % | ||||||||||
| Prior period | 147 | 149 | 415 | 112 | 1,420 | 842 | 59 | % | 671 | 235 | 17 | % | ||||||||||
| (1) | Shown on a contained metal basis. Reflects copper production from the Copper operations in Chile and Peru only (excludes copper production from the PGMs business). |
| (2) | Shown on a contained metal basis. Excludes 175 kt third-party sales (30 June 2024: 168 kt). |
| (3) | Represents realised copper price and excludes impact of third-party sales. |
| (4) | C1 unit cost includes by-product credits. Total copper unit cost is a weighted average. |
| (5) | Group revenue is shown after deduction of treatment and refining charges (TC/RCs). |
| (6) | Figures on a 100% basis (Group’s share: 50.1%). |
| (7) | 44% share of Collahuasi production, sales and financials. |
| (8) | Other operations form part of the results of Copper Chile. Production and sales are from El Soldado mine (figures on a 100% basis, Group’s share: 50.1%). Financials include El Soldado and Chagres (figures on a 100% basis, Group’s share: 50.1%), third-party trading, projects, including Sakatti, and corporate costs. El Soldado mine C1 unit costs increased by 16% to 259c/lb (30 June 2024: 224c/lb). |
| (9) | Figures on a 100% basis (Group’s share: 60%). |
Operational performance
Copper Chile
Copper production of 185,600 tonnes decreased by 25% (30 June 2024: 246,500 tonnes), due to the anticipated lower grade and lower copper recovery at Collahuasi and the planned closure of the smaller of the two Los Bronces processing plants.
At Los Bronces, production decreased by 17% to 80,300 tonnes (30 June 2024: 97,100 tonnes), primarily due to the impact of the smaller Los Bronces processing plant being put on care and maintenance at the end of July 2024, partially offset by higher ore grade (0.54% vs 0.48%) and copper recovery.
At Collahuasi, Anglo American’s attributable share of copper production decreased by 33% to 83,400 tonnes (30 June 2024: 125,000 tonnes), due to anticipated lower ore grade (0.91% vs 1.13%) as well as lower copper recovery and throughput associated with lower ore feed quality from processing lower grade stockpiles and temporary water supply constraints.
Production at El Soldado decreased by 10% to 21,900 tonnes (30 June 2024: 24,400 tonnes), principally due to planned lower grade (0.88% vs 0.94%).
| 16 | Anglo American plc Interim Results 2025 |
Copper
Copper Peru
Quellaveco production increased by 6% to 156,600 tonnes (30 June 2024: 147,300 tonnes), reflecting strong plant performance and higher grades (0.77% vs 0.73%). As planned, in 2025, the mine is expected to average similar grades as 2024, while the next phases are opened and developed, allowing for greater flexibility in the medium and long term. Optimising plant stability and throughput remains a priority during 2025 as we continue to work to improve recoveries, including at the coarse particle recovery plant.
Markets
| 30 June 2025 | 30 June 2024 | |||||||
| Average market price (c/lb) | 428 | 412 | ||||||
| Average realised price (Copper Chile – c/lb) | 444 | 437 | ||||||
| Average realised price (Copper Peru – c/lb) | 427 | 415 | ||||||
The differences between the market price and the realised prices are largely a function of provisional pricing adjustments and the timing of sales across the period.
Copper prices were volatile during the first half of 2025 as strong Chinese refined demand and a tariff-related surge in US refined copper imports were partly offset by uncertainty regarding the wider economic impact of US tariffs. The LME copper price averaged 428 c/lb, up 4% from the comparative period (30 June 2024: 412 c/lb), with the anticipation of Section 232 tariffs on copper driving a 127% period-on-period surge in US refined imports during the first 5 months of the year, drawing refined copper away from more typical demand centres in Asia and Europe. Chinese refined demand has remained robust, despite evolving US trade policies, while longer term copper prices are expected to remain well-supported by continued electrification and energy transition infrastructure investment.
Financial performance
Underlying EBITDA for Copper decreased by 14% to $1,756 million (30 June 2024: $2,038 million), driven by lower sales volumes, despite the higher copper price.
Copper Chile
Underlying EBITDA decreased by 40% to $715 million (30 June 2024: $1,196 million), primarily driven by lower sales volumes and higher unit costs, partially offset by higher copper prices. C1 unit costs increased by 20% to 211 c/lb (30 June 2024: 176 c/lb), reflecting the impact of lower production coupled with a shift in the production mix between Los Bronces and Collahuasi, partially offset by the benefit of higher by-product credits, lower treatment and refining charges and a weaker Chilean peso.
Capital expenditure decreased by 12% to $543 million (30 June 2024: $620 million), driven by expected lower expenditure at Collahuasi on the desalination plant project and a weaker Chilean peso.
Copper Peru
Underlying EBITDA increased by 24% to $1,041 million (30 June 2024: $842 million), reflecting higher sales volumes and prices as well as lower C1 unit costs. C1 unit costs decreased by 21% to 88 c/lb (30 June 2024: 112 c/lb), reflecting the benefit from lower treatment and refining charges, lower fuel and maintenance contract costs as well as the deferral of some costs into the second half of the year.
Capital expenditure decreased by 28% to $169 million (30 June 2024: $235 million), due to rephasing of spend on the tailings management facility and completion of tailings dam phases.
Operational outlook
Copper Chile
Los Bronces
Los Bronces is a world-class copper deposit, accounting for more than 2% of the world’s known copper resources. A single phase with harder ore is currently been mined, and until the economics improve, the smaller (c.40% of total plant capacity) Los Bronces processing plant will remain on care and maintenance.
Good progress is being made in the development of Donoso 2, the next phase of the mine, which has higher grade and softer ore. Development activities for this phase continue and it is expected to be fully opened by early 2027. The first phase of the Los Bronces integrated water security project is also ongoing, which will secure a large portion of the mine’s water needs through a desalinated water supply from 2026.
| Anglo American plc Interim Results 2025 | 17 |
Copper
The permitted Los Bronces integrated project work is progressing as planned. For the mine pit expansion, the first mine phase development has already started, and for Los Bronces underground, the pre-feasibility study is advancing and is expected to be finalised during the second half of 2025.
Collahuasi
Collahuasi is a world-class orebody with significant growth potential, accounting for more than 2% of the world´s known copper resources with over 2.6 billion tonnes of sulphide Ore Reserves at 0.96% TCu grade. The mine is currently transitioning between phases in the main Rosario pit and is expected to continue drawing on lower grade stockpiles over the coming period, while remaining focused on optimising plant feed to mitigate the impact of this transitional period and completing the key debottlenecking projects. Various debottlenecking options have been approved and are in execution that are expected to add c.25,000 tonnes per annum (tpa) (our 44% share) of production from late 2027. Beyond that, studies and permitting are under way for a fourth processing line in the plant and mine expansion that would add up to c.150,000 tpa (our 44% share) of production. Timing of that expansion is subject to the permitting process; depending on permit approval, first production could follow from the early 2030s.
A desalination plant is currently under construction that will meet a large portion of the mine’s water requirements by mid-2026 when fully operational and has been designed to accommodate capital-efficient expansion to support the fourth processing line expansion project. Until then, the operation continues to progress mitigation measures to optimise and reduce water consumption, as well as securing third-party water sources including the provision of ultra-filtered sea water that was delivered in July for system testing and is expected to ramp-up during the second half of 2025.
El Soldado
Production in 2025 is expected to return to 2023 production levels (c.40,000 tpa) due to planned lower grades, before declining to 30,000–35,000 tpa until end of mine life which is expected by mid-2028. Options to extend the life of the mine beyond 2028 are being evaluated.
Copper Chile
These factors are reflected in the unchanged guidance provided on pages 31-33. Production guidance for Chile for 2025 is 380,000–410,000 tonnes, subject to water availability, and is expected to be weighted to the second half of 2025 given the impact from lower grades in the first half from Collahuasi, particularly in Q1.
2025 unit cost guidance is c.195 c/lb(1). The first half unit cost of 211 c/lb, was higher than guidance, reflecting the impact of the production mix between Los Bronces and Collahuasi.
Copper Peru
Quellaveco in Peru remains a cornerstone in our portfolio of world-class copper assets, designed to produce on average c.300,000 tonnes of copper per annum in its first 10 years of operation.
In the latter part of 2023, a revised mine plan was put into place due to a localised geotechnical fault. The stripping and mine development work is progressing well, with other lower grade phases being mined and opened up to increase the flexibility in the mine. After five years of operating, maintenance will be carried out on the concentrator, including the mills and conveyors; this is expected to occur in 2027 and 2028, modestly impacting production in those years.
There is significant expansion potential that could sustain production beyond the initial high-grade area. The original plant throughput design capacity was 127,500 tonnes per day (tpd) and a change in legislation in the middle of 2024 increased the permit allowance from 5% to 10%, enabling throughput to increase from 133,800 tpd to c.140,000 tpd. In order to maximise throughput within the parameters of the current Environmental Impact Assessment permit, a rapid permit to increase throughput to 150,000 tpd plus the 10% allowance was obtained in 2025. This provides added flexibility to design optimal throughput for the plant with limited configuration changes, subject to sectorial permits associated with the specific design and water availability.
In light of this, the stage one expansion has been approved and will increase throughput to c.142,000 tpd by late 2026, involving the installation of a second pebble crusher and additional flotation cells. This project represents the first stage to full optimisation of the plant with minimal capital investment, delivering robust returns. Efforts will continue to further debottleneck the plant, while conducting early studies to support Quellaveco’s long-term expansion prospects, underpinned by an exploration drilling campaign below and around the current pit shell, which to date has yielded promising results.
| 18 | Anglo American plc Interim Results 2025 |
Copper
These factors are reflected in the unchanged guidance provided on pages 31-33. Production guidance for Peru for 2025 is 310,000–340,000 tonnes. 2025 unit cost guidance is c.100 c/lb(1). The first half unit cost of 88 c/lb was lower than guidance, reflecting higher molybdenum volumes due to mine phasing with strong pricing realisations, the impact of mine sequencing and lower treatment and refining charges.
| (1) | The copper unit costs are impacted by FX rates and pricing of by-products, such as molybdenum. 2025 unit cost guidance was set at c.950 CLP:USD for Chile and c.3.75 PEN:USD for Peru. |
| Anglo American plc Interim Results 2025 | 19 |
Iron Ore
Iron Ore
Operational and financial metrics
| Production volume |
Sales volume |
Price | Unit cost* |
Group revenue* |
Underlying EBITDA* |
EBITDA margin* |
Underlying EBIT* | Capex* | ROCE* | |||||||||||||||||||||||||||||||
| Mt(1) | Mt(1) | $/t(2) | $/t(3) | $m | $m | $m | $m | |||||||||||||||||||||||||||||||||
| Iron Ore Total | 31.4 | 31.0 | 89 | 35 | 3,224 | 1,410 | 44 | % | 1,055 | 520 | 18 | % | ||||||||||||||||||||||||||||
| Prior period | 30.7 | 29.5 | 93 | 37 | 3,296 | 1,413 | 43 | % | 1,171 | 495 | 21 | % | ||||||||||||||||||||||||||||
| Kumba Iron Ore(4) | 18.2 | 18.7 | 91 | 39 | 1,886 | 849 | 45 | % | 645 | 246 | 38 | % | ||||||||||||||||||||||||||||
| Prior period | 18.5 | 18.1 | 97 | 39 | 1,988 | 888 | 45 | % | 742 | 266 | 47 | % | ||||||||||||||||||||||||||||
| Iron Ore Brazil (Minas-Rio) | 13.1 | 12.3 | 86 | 29 | 1,338 | 561 | 42 | % | 410 | 274 | 12 | % | ||||||||||||||||||||||||||||
| Prior period | 12.3 | 11.4 | 86 | 33 | 1,308 | 525 | 40 | % | 429 | 229 | 14 | % | ||||||||||||||||||||||||||||
| (1) | Production and sales volumes are reported as wet metric tonnes. Product is shipped with c.1.5% moisture from Kumba and c.9% moisture from Minas-Rio. |
| (2) | Prices for Kumba Iron Ore are the average realised export basket price (FOB Saldanha) (wet basis). Prices for Minas-Rio are the average realised export basket price (FOB Brazil) (wet basis). Prices for total iron ore are a blended average. |
| (3) | Unit costs are reported on an FOB wet basis. Unit costs for total iron ore are a weighted average. |
| (4) | Sales volumes, stock and realised price could differ to Kumba’s stand-alone reported results due to sales to other Group companies. |
Operational performance
Kumba(1)
Total production of 18.2 Mt is marginally lower than the prior period (30 June 2024: 18.5 Mt) reflecting a flexible production approach to managing Sishen and Kolomela as an integrated complex. Production was 6% lower at Sishen at 12.4 Mt (30 June 2024: 13.2 Mt) following a proactive drawdown of high mine stockpiles in the first quarter and maintenance activities in the second quarter. This was mostly offset by an increase of 12% at Kolomela to 5.9Mt (30 June 2024: 5.3Mt) due to the improved third-party rail availability to the mine.
Sales volumes increased by 3% to 18.7 Mt (30 June 2024: 18.1 Mt), due to improved equipment availability at Saldanha Bay Port.
The third-party rail performance improved by 0.8 Mt to 18.9 Mt (30 June 2024: 18.1 Mt) due to improved running times. Total finished stock remained broadly flat in the first six months of the year at 7.4 Mt, with stock at the mines decreasing by 0.5 Mt to 6.4 Mt and stock at the port increasing by 0.5 Mt to 1.0 Mt.
Minas-Rio
Minas-Rio delivered a strong performance in the first six months of the year, with production increasing by 7% to 13.1 Mt (30 June 2024: 12.3 Mt). This performance was underpinned by improved mass recovery at the beneficiation plant, which in turn was driven by reduced ore variability, higher iron ore content, enhanced operational discipline and stability through improved equipment availability to ensure consistent ore feed supply.
Markets
| 30 June 2025 | 30 June 2024 | |||||||
| Average market price (Platts 62% Fe CFR China – $/tonne) | 101 | 118 | ||||||
| Average market price (MB 65% Fe Fines CFR – $/tonne) | 113 | 131 | ||||||
| Average realised price (Kumba export – $/tonne) (FOB wet basis) | 91 | 97 | ||||||
| Average realised price (Minas-Rio – $/tonne) (FOB wet basis) | 86 | 86 | ||||||
The Platts 65-62 differential averaged $12/dmt in H1 2025, down from $13/dmt in H1 2024, reflecting a shift in demand towards low to mid-grade iron ore. The shift has prompted consecutive narrowing of the spread throughout the first six months of the year, as steelmakers sought to reduce costs amid sustained margin pressure. The lump premium averaged $0.1514/dmtu in H1 2025, up from $0.1339/dmtu a year earlier, supported by a significant decline in metallurgical coke prices that incentivised greater lump usage in blast furnace operations.
Kumba’s FOB realised price of $91/wet metric tonne (wmt) was above the equivalent Platts 62% Fe FOB Saldanha market price (adjusted for moisture) of $84/wmt in the first six months of the year. The premiums for iron content (64.1% Fe) and lump product (approximately 67%) were partially offset by provisionally priced sales volumes.
| 20 | Anglo American plc Interim Results 2025 |
Iron Ore
Minas-Rio’s pellet feed product is higher grade (with iron content of c.67% and lower impurities) so the MB 65 Fines index is used when referring to the Minas-Rio product. The Minas-Rio realised price of $86/wmt FOB was 5% higher than the equivalent MB 65 FOB Brazil index (adjusted for moisture) of $82/wmt FOB, benefitting from the premium for our high quality product, including higher (~67%) Fe content, partially offset by provisionally priced sales volumes.
Financial performance
Underlying EBITDA for Iron Ore remained broadly flat at $1,410 million (30 June 2024: $1,413 million), as a 4% lower realised iron ore price was fully offset by a 5% increase in sales volumes.
Kumba(1)
Underlying EBITDA was 4% lower at $849 million (30 June 2024: $888 million), as the lower realised price was largely offset by higher sales volumes. Unit costs were maintained at $39/tonne (30 June 2024: $39/tonne), as a result of ongoing cost optimisation work that offset the effects of inflation and the stronger South African rand.
Capital expenditure decreased by 8% to $246 million (30 June 2024: $266 million) reflecting lower stay-in-business spend as a result of optimisation initiatives and phasing as projects are ramping up in the second half of the year, partially offset by higher deferred stripping capitalisation.
Minas-Rio
Underlying EBITDA increased by 7% to $561 million (30 June 2024: $525 million), driven primarily by higher sales volumes and lower unit cost. Unit costs decreased by 12% to $29/tonne (30 June 2024: $33/tonne), mainly due to a weaker Brazilian real and higher production volumes.
Capital expenditure was 20% higher at $274 million (30 June 2024: $229 million), primarily associated to the tailings filtration project, which is expected to start up in early 2026.
Operational outlook
Kumba
Production is expected to remain at 35–37 Mtpa in the near term, apart from 2026, which is expected to decrease by c.4Mt to 31-33 Mtpa reflecting the tie-in of the Ultra High Dense-Media-Separation (UHDMS) project which was announced by Kumba in August 2024. Unit costs are expected to be between $39–40/tonne during this three-year period.
These factors are reflected in the unchanged guidance provided on pages 31-33. Production guidance for 2025 is 35– 37Mt, subject to third-party rail and port availability and performance. 2025 unit cost guidance is c.$39/tonne(2). The first half unit cost of $39/tonne was in line with guidance.
| (1) | Production and sales volumes, stock and realised price are reported on a wet basis and could differ from Kumba’s stand-alone results due to sales to other Group companies. |
Minas-Rio
An inspection of the 529 km pipeline that carries iron ore slurry from the plant to the port is planned for Q3 2025. Plant maintenance has been scheduled to coincide with the operational stoppage. Pipeline inspections take place every five years and are validated by external consultants and agreed with the Brazilian Environmental Authorities.
These factors are reflected in the unchanged guidance provided on pages 31-33. Production guidance for 2025 is 22–24 Mt. 2025 unit cost guidance is c.$32/tonne(2). The first half unit cost of $29/tonne, was lower than guidance, due to production volumes being weighted to the first half of the year.
Following a record 12-month performance of 25 million tonnes in 2024, focus will remain on delivering consistent and stable production, while increasing the maturity of the capital projects to sustain and grow production volumes as well as improving the mine plan to minimise ore feed quality variability. In light of the completion of the transaction to integrate the contiguous Serra da Serpentina high-grade iron ore resource, options to maximise long-term value are currently being evaluated.
In parallel, Minas-Rio is focused on increasing tailings storage capacity. The tailings filtration plant project is on track for completion by early 2026 and alternative, additional disposal options continue to be studied.
| (2) | 2025 unit cost guidance was set at c.18.60 ZAR:USD for Kumba and c.5.75 BRL:USD for Minas-Rio. |
| Anglo American plc Interim Results 2025 | 21 |
Manganese
Manganese
Operational and financial metrics
| Production volume |
Sales volume |
Group revenue* |
Underlying EBITDA* | EBITDA margin* |
Underlying EBIT* |
Capex* | ROCE* | ||||||||||||||||||||||||||
| Mt | Mt | $m | $m | $m | $m | ||||||||||||||||||||||||||||
| Manganese | 1.1 | 0.9 | 147 | (11 | ) | (7 | )% | (52 | ) | – | (50 | )% | |||||||||||||||||||||
| Prior period | 1.1 | 1.2 | 219 | 11 | 5 | % | (35 | ) | – | (53 | )% | ||||||||||||||||||||||
Operational performance
Attributable manganese ore production decreased 4% to 1.1 Mt (30 June 2024: 1.1 Mt), reflecting the temporary suspension of the Australian operations since March 2024 as a result of the impact of tropical cyclone Megan, with operations resuming in Q2 2025. Export shipping activities resumed progressively in the second half of May.
The sale of the South African manganese alloy smelter, which has been on care and maintenance since March 2020 completed in June, in line with expectations.
Financial performance
Underlying EBITDA decreased by 200% to a loss of $11 million (30 June 2024: $11 million profit), primarily driven by a 22% decrease in export sales following the damage caused by the tropical cyclone in March 2024 at the Australian operation and the weaker average realised manganese ore price, which was partially offset by lower operating costs. Insurance proceeds of $40 million (40% attributable share basis) for the cyclone damage have been received in the first six months of this year (taking the total received since the incident to $160 million).
High grade manganese ore prices (Metal Bulletin 44% manganese ore CIF China) averaged $4.53/dmtu in the first six months of the year, down 18% from the same period last year (30 June 2024: $5.54/dmtu), reflecting the market normalisation in the second half of 2024 following the cyclone damage to critical infrastructure at the South32 Australian operation in March and subsequent recovery in overall seaborne supply. Despite the growing use of manganese in batteries, margins in the main consumer steel industry remained weak in early 2025, leading to subdued demand in the key consuming regions of China and Europe, and prices have drifted down again to more normal levels.
| 22 | Anglo American plc Interim Results 2025 |
Crop Nutrients
Crop Nutrients
Operational and financial metrics
| Production volume |
Sales volume |
Group revenue* |
Underlying EBITDA* |
EBITDA margin* |
Underlying EBIT* |
Capex* | ROCE* | |||||||||||||||||||||||||
| $m | $m | $m | $m | |||||||||||||||||||||||||||||
| Crop Nutrients | n/a | n/a | 78 | (30 | ) | n/a | (30 | ) | 184 | n/a | ||||||||||||||||||||||
| Prior period | – | – | 86 | (22 | ) | – | (22 | ) | 500 | – | ||||||||||||||||||||||
| Woodsmith project | n/a | n/a | 1 | n/a | n/a | n/a | 184 | n/a | ||||||||||||||||||||||||
| Prior period | – | – | – | – | – | – | 500 | – | ||||||||||||||||||||||||
| Other(1) | n/a | n/a | 77 | (30 | ) | n/a | (30 | ) | n/a | n/a | ||||||||||||||||||||||
| Prior period | – | – | 86 | (22 | ) | – | (22 | ) | – | – | ||||||||||||||||||||||
| (1) | Other comprises projects and corporate costs as well as the share in associate results from The Cibra Group, a fertiliser distributor based in Brazil. |
Crop Nutrients
Anglo American is developing Woodsmith, a large-scale, long-life Tier 1 asset in the north east of England, to access the world’s largest known deposit of polyhalite – a natural mineral fertiliser product containing potassium, sulphur, magnesium and calcium – four of the six nutrients that every plant needs to grow.
The Woodsmith project is located on the North Yorkshire coast, just south of Whitby, where polyhalite ore will be extracted via two 1.6 km deep mine shafts (a service shaft and a production shaft) and then transported to the port area in Teesside via an underground conveyor belt in a 37 km mineral transport system (MTS) tunnel, thereby minimising any environmental impact on the surface. The polyhalite can then be developed into POLY4, our comparatively low-carbon multi-nutrient polyhalite product, at a materials handling facility in the port area, before being exported to a network of customers around the world from the priority access port facility.
Progress update
Woodsmith project
In 2024, the Group announced that in order to support deleveraging of the balance sheet, it will be slowing the pace of development of the Woodsmith project in the near-term. Crop Nutrients is one of the three businesses within the simplified portfolio and, as such, the current focus is on preserving the exceptional long-term value of this high quality asset. The transition to slowdown status was completed in Q1 2025 with activities now focused on critical value-adding works to de-risk the overall project schedule, preserve progress in areas that are in care and maintenance, and further optimise certain scopes of the project to be ready for ramp-up when conditions allow.
Shaft sinking activities are continuing on the service shaft in order to progress through the Sherwood sandstone strata – a water-bearing layer of hard rock. As planned during H1 2025, initial sinking activities in the sandstone, grouting and installation of water-tight liner (tubbing) have been completed. Good progress has been made to date, and the learnings from these initial activities will help progress shaft sinking in the second half of the year and confirm key assumptions on the overall project development schedule. Sinking activities on the production shaft were paused in June 2024. Tunnel boring activities have continued at a significantly reduced pace, which will continue during 2025. The tunnel has now reached c.29.6 km, approximately 80% of the total 37 km length.
Value-preservation work during the slowdown period also includes maintenance of key permits and preservation of land rights to allow project ramp-up in due course, and execution of the critical study programme, focused on enhancing the project’s configuration to enable efficient, scalable mining methods and optimising additional infrastructure. The critical study programme re-scoping considers the revised capital schedule and development plan and importantly allows us to review project and business development opportunities, to optimise our business plans prior to ramping up again when conditions allow.
Before the project would be sanctioned for full development and consideration by the Board for approval, three conditions need to be met. First, a feasibility study would need to be completed, which requires sufficient information from the sandstone strata to confirm key assumptions. The second condition is a clear pathway to syndication for value. Finally, the Group’s balance sheet would need to be sufficiently deleveraged.
| Anglo American plc Interim Results 2025 | 23 |
Crop Nutrients
The expected final design capacity remains c.13 Mtpa, subject to ongoing studies and approval. Work is also continuing to identify and secure one or more strategic syndication partners for Woodsmith ahead of consideration by the Board for approval and subsequent project ramp-up, anticipated from 2027.
Forecast capital expenditure for 2025 remains c.$0.3 billion, focused on core infrastructure, with $184 million spent during the first half of this year (H1 2024: $500 million). We will continue to fund our Thriving Communities programmes that focus on education and supporting vulnerable young people. We also engage regularly with local stakeholders and community partners to ensure that they are informed of changes to the project and any concerns are addressed.
Market development
Polyhalite products provide farmers with a fertiliser solution to tackle the three key challenges facing the food industry today – the increasing demand for food from less available land; the need to reduce the environmental impact of farming; and the deteriorating health of soils.
In February 2025, we published a report looking into the “Future of Fertiliser”. This report brought together the voices of a diverse group of 74 agricultural experts from around the world and across the food value chain to consider how agriculture will have changed by 2050. Their opinions confirmed the need for the fertiliser industry to adapt to recognise the value of sustainability, balanced nutrition, and soil health. The qualities and characteristics of POLY4, confirmed through over 2,000 field demonstrations to date on over 80 crops, fit neatly into the long-term gaps the agricultural industry is facing. To further validate this, we are also continuing progress on our pioneering five-year research project with the International Atomic Energy Agency, an organisation within the United Nation’s Food and Agriculture Organization (FOA) announced in 2024, into the beneficial impact polyhalite could have in reducing salt levels in soil – a major factor in the degradation of soil health globally.
We are continuing focused research and market development activities to maintain relationships and better understand demand for POLY4 and potential for polyhalite products.
Woodsmith remains a Tier 1 asset aligned with the demand trends of decarbonisation and food security. Anglo American has high confidence, backed by its proven track record in project delivery, to develop the Woodsmith project once the critical studies have been completed, the pathway to syndication is clear and the balance sheet is suitably deleveraged.
| 24 | Anglo American plc Interim Results 2025 |
De Beers – Diamonds
De Beers – Diamonds
Operational and financial metrics(1)
| Production volume |
Sales volume |
Price | Unit cost* |
Group revenue* |
Underlying EBITDA* |
EBITDA margin(6) |
Underlying EBIT* |
Capex* | ROCE* | |||||||||||||||||||||||||||||||
| ‘000 cts |
‘000 cts(2) |
$/ct(3) | $/ct(4) | $m(5) | $m | $m | $m | |||||||||||||||||||||||||||||||||
| De Beers | 10,214 | 11,005 | 155 | 87 | 1,952 | (189 | ) | (10 | )% | (303 | ) | 172 | (17 | )% | ||||||||||||||||||||||||||
| Prior period | 13,312 | 11,945 | 164 | 85 | 2,247 | 300 | 13 | % | 150 | 264 | (4 | )% | ||||||||||||||||||||||||||||
| Botswana | 7,223 | n/a | 120 | 39 | n/a | 227 | n/a | 204 | 34 | n/a | ||||||||||||||||||||||||||||||
| Prior period | 9,697 | – | 145 | 36 | – | 177 | – | 150 | 32 | – | ||||||||||||||||||||||||||||||
| Namibia | 1,166 | n/a | 340 | 215 | n/a | 78 | n/a | 58 | 7 | n/a | ||||||||||||||||||||||||||||||
| Prior period | 1,194 | – | 435 | 270 | – | 84 | – | 66 | 18 | – | ||||||||||||||||||||||||||||||
| South Africa | 1,075 | n/a | 75 | 97 | n/a | (48 | ) | n/a | (72 | ) | 71 | n/a | ||||||||||||||||||||||||||||
| Prior period | 1,103 | – | 93 | 107 | – | (13 | ) | – | (41 | ) | 164 | – | ||||||||||||||||||||||||||||
| Canada | 750 | n/a | 60 | 59 | n/a | 27 | n/a | 20 | 52 | n/a | ||||||||||||||||||||||||||||||
| Prior period | 1,318 | – | 80 | 51 | – | 41 | – | 23 | 28 | – | ||||||||||||||||||||||||||||||
| Trading | n/a | n/a | n/a | n/a | n/a | (260 | ) | (16 | )% | (262 | ) | – | n/a | |||||||||||||||||||||||||||
| Prior period | – | – | – | – | – | 58 | 3 | % | 56 | – | – | |||||||||||||||||||||||||||||
| Other(7) | n/a | n/a | n/a | n/a | n/a | (213 | ) | n/a | (251 | ) | 8 | n/a | ||||||||||||||||||||||||||||
| Prior period | – | – | – | – | – | (47 | ) | – | (104 | ) | 22 | – | ||||||||||||||||||||||||||||
| (1) | Prepared on a consolidated accounting basis, except for production, which is stated on a 100% basis except for the Gahcho Kué joint operation in Canada, which is on an attributable 51% basis. |
| (2) | Total sales volumes on a 100% basis were 12.3 million carats (30 June 2024: 12.7 million carats). Total sales volumes (100%) include De Beers Group’s joint arrangement partners’ 50% proportionate share of sales to entities outside De Beers Group from Diamond Trading Company Botswana and Namibia Diamond Trading Company. |
| (3) | Pricing for the mining businesses is based on 100% selling value post-aggregation of goods. Realised price includes the price impact of the sale of non-equity product and, as a result, is not directly comparable to the unit cost. |
| (4) | Unit cost is based on consolidated production and operating costs, excluding depreciation and operating special items, divided by carats recovered. |
| (5) | Includes rough diamond sales of $1.7billion (30 June 2024: $2.0 billion). |
| (6) | EBITDA margin on a total reported basis. On an equity basis, and excluding the impact of non-mining activities, third-party sales, purchases, trading, brands and diamond desirability, and corporate, the adjusted EBITDA margin is 45% (30 June 2024: 40%). |
| (7) | Other includes Element Six, brands and diamond desirability, and Corporate. |
Markets
Rough diamond trading conditions remained challenging in the first half of 2025 as both the diamond midstream and downstream adopted a cautious approach to restocking amid broader market uncertainty, coupled with continued surplus polished inventory in the midstream.
While a stabilisation of polished diamond prices in the first quarter of the year temporarily supported an improvement in industry sentiment, polished trading slowed again in the second quarter amid increased uncertainty surrounding US tariffs announced in April.
Although wholesale rough and polished diamond trading conditions remained difficult, consumer demand for diamond jewellery was broadly stable in the first half of the year. Demand in the US held steady year-to-date, though the full impact of the tariffs has yet to be seen. In India, leading retailers reported double-digit growth in the first quarter of the year. Meanwhile, the rate of decline in China appears to be slowing, while demand in Japan and the Gulf remains robust.
Operational performance
Mining
Rough diamond production reduced by 23% to 10.2 million carats (30 June 2024: 13.3 million carats), reflecting a proactive production response to the prolonged period of lower demand and higher than normal levels of inventory in the midstream.
| Anglo American plc Interim Results 2025 | 25 |
De Beers – Diamonds
In Botswana, production was reduced by 26% to 7.2 million carats (30 June 2024: 9.7 million carats), as a result of planned actions to lower production at Jwaneng and Orapa, as well as extended maintenance at Orapa(1) and putting the Letlhakane Tailings Treatment Plant on care and maintenance as part of the planned production response.
Production in Namibia was flat at 1.2 million carats (30 June 2024: 1.2 million carats), as planned actions to lower production at Debmarine Namibia were offset by planned higher grade mining and better recoveries at Namdeb.
In South Africa, production was flat at 1.1 million carats (30 June 2024: 1.1 million carats). The output from the Venetia underground project remains much lower than during the prior open-pit operations, with the capital spend being rephased as part of De Beers’ cash preservation initiatives. Production is expected to increase over the next few years as the underground project continues its ramp-up in line with the recently reconfigured plan.
Production in Canada decreased by 43% to 0.8 million carats (30 June 2024: 1.3 million carats) due to the planned treatment of lower grade ore.
Financial performance
Challenging rough diamond trading conditions persisted through the first half of 2025 with total revenue declining to $2.0 billion (30 June 2024: $2.2 billion). This was driven by a 13% reduction in rough diamond sales to $1.7 billion (30 June 2024: $2.0 billion), reflecting the subdued demand and lower realised price.
The H1 2025 consolidated average realised price decreased by 5% to $155 per carat, reflecting the impact of a 14% decrease in the average rough price index, partially offset by stronger demand for higher-value stones impacting the sales mix in Q2 2025.
Whilst the business generated positive cashflow, the consequential impact of the declining price index and the impact of stock rebalancing initiatives with specific assortments being sold at lower margins, resulted in an underlying EBITDA loss of $189 million (H1 2024: income of $300 million). Further, H1 2024 benefitted from the one- off sale of a non-diamond royalty right of $127 million. Unit costs of $87/ct (30 June 2024: $85/ct) were broadly flat, as the impact of lower rough diamond production volumes were offset by cost reduction initiatives across the operations, a temporary mine sequencing benefit at Venetia and lower in-port maintenance costs at Debmarine Namibia due to timing.
Capital expenditure decreased by 35% to $172 million (30 June 2024: $264 million), predominantly due to cash preservation and optimisation initiatives. This includes the rephasing of Venetia underground life-extension and rationalisation of stay-in-business capex spend.
Corporate strategy
De Beers advanced delivery of its Origins strategy, with a focus on strengthening the appeal of natural diamonds through key partnerships and targeted campaigns to revitalise natural diamond marketing. In India, new initiatives were introduced to deepen the cultural resonance of natural diamonds and enhance retail engagement. These included launching a national natural diamond marketing campaign, the launch of a new collection in collaboration with leading Indian jeweller, Tanishq, and providing support for independent jewellers via the Gem and Jewellery Export Promotion Council (GJEPC).
In the US, De Beers advanced the roll-out of its DiamondProofTM verification device – empowering retailers and consumers to easily distinguish natural from lab-grown diamonds – backed by promotional activity. The company also unveiled its first category-defining ‘Beacon’ product in over a decade to increase consumer desire for natural diamonds, alongside the formal launch of ORIGIN – De Beers Group: a branded loose diamond programme powered by the TracrTM blockchain, offering full provenance and product storytelling for retail partners.
De Beers was also a signatory to the Luanda Accord, a landmark commitment between government and industry representatives to promote natural diamonds and drive global demand.
De Beers remains on track to achieve its strategic goals, including committed overhead cost savings through 2025.
| 26 | Anglo American plc Interim Results 2025 |
De Beers – Diamonds
Brands and Diamond Desirability
De Beers Jewellers, rebranded as De Beers London at the beginning of the year, continued to deliver on its re-set plan, with a focus on design-led pieces and high jewellery collections, despite ongoing market challenges. The brand also continues to build its global presence with new flagship stores in key markets. In April, it launched a flagship store in Dubai Mall in partnership with the Chalhoub Group, a renowned partner for luxury across the Middle East. Preparations are also underway for the launch of its Paris flagship store.
Forevermark continues its transformation into a premium finished jewellery brand, with a focus on growth opportunities in India. Four new stores are expected to open in Mumbai and Delhi during the second half of 2025. Forevermark’s legacy business continues its planned global ramp-down.
Market outlook
Near-term rough diamond trading conditions remain subdued amid continued tariff-related uncertainty. While the risk of a US recession has eased, high geopolitical and macroeconomic uncertainty continues to dampen sentiment.
Medium-term recovery prospects are supported by diamond producers seeking to adjust supply to meet prevailing demand, and a gradual improvement in demand, particularly in China.
Differentiation between natural and synthetic or laboratory-grown diamonds (LGDs) continues. Falling wholesale LGD prices and growing consumer awareness of the low production costs of LGDs are driving their positioning as low-cost fashion jewellery.
The outlook for natural diamonds is further bolstered by growing demand for verified provenance. TracrTM, the pioneering blockchain traceability platform developed by De Beers, now provides single-country origin information for all gem quality diamonds over 0.5 carats – aligning with new G7 import rules.
Operational outlook
Production guidance for 2025 remains at 20–23 million carats (100% basis). De Beers continues to monitor rough diamond trading conditions and will respond accordingly.
Unit cost guidance for 2025 is c.$94/carat(2). The first half unit cost of $87/carat is lower than guidance, reflecting the impact of mine sequencing at Venetia and timing of in-port maintenance at Debmarine Namibia.
| (1) | Orapa constitutes the Orapa Regime which includes Orapa, Letlhakane and Damtshaa. Letlhakane was placed on care and maintenance March 2025, and Damtshaa has been on care and maintenance since 2021. |
| (2) | Unit cost is based on De Beers’ proportionate consolidated share of costs and associated production. 2025 unit cost guidance was set at c.18.60 ZAR:USD. |
| Anglo American plc Interim Results 2025 | 27 |
Corporate and Other
Corporate and Other
Financial metrics
| Group revenue* |
Underlying EBITDA* |
Underlying EBIT* |
Capex* | |||||||||||||
| $m | $m | $m | $m | |||||||||||||
| Corporate and Other | 186 | 19 | (59 | ) | (2 | ) | ||||||||||
| Prior period (2) | 233 | (68 | ) | (227 | ) | 15 | ||||||||||
| Exploration | n/a | (55 | ) | (55 | ) | – | ||||||||||
| Prior period (2) | – | (60 | ) | (60 | ) | – | ||||||||||
| Corporate activities and unallocated costs(1) | 186 | 74 | (4 | ) | (2 | ) | ||||||||||
| Prior period (2) | 233 | (8 | ) | (167 | ) | 15 | ||||||||||
| (1) | Revenue within Corporate activities and unallocated costs primarily relates to third-party shipping activities, as well as the Marketing business’ trading activities from energy solutions and other ancillary products. |
| (2) | Comparative figures are re-presented to include Nickel trading activities that are outside the perimeter of the sale of the Nickel business as well intercompany interest transactions with discontinued operations. Refer to note 4 to the Condensed financial statements for more detail. |
Financial overview
Exploration
Exploration expenditure was $55 million, 8% lower than the prior period (30 June 2024: $60 million), due to planned lower spend.
Corporate activities and unallocated costs
Underlying EBITDA was $74 million (30 June 2024: $8 million loss). The improved result was primarily driven by cost savings following the initiation of the transformational changes and the consequent refocusing on key strategic projects. This more than offset reduced margins from the Marketing business’ shipping activities due to lower freight rates.
| 28 | Anglo American plc Interim Results 2025 |
Discontinued Operations
Discontinued Operations
Operational and financial metrics
| Production volume(1) |
Sales volume(3) |
Price(4) | Unit cost* |
Group revenue* |
Underlying EBITDA* |
EBITDA margin* |
Underlying EBIT* |
Capex* | ROCE* | ||||||||||||||||||||||||||||||||
| koz/Mt/t(2) | koz/Mt/t(2) | $/PGM oz/ $/t/c/lb(5) |
$m | $m | $m | $m | |||||||||||||||||||||||||||||||||||
| PGMs | 1,188 | 1,134 | 1,506 | 1,149 | 1,773 | 199 | 11 | % | 49 | 353 | 3 | % | |||||||||||||||||||||||||||||
| Prior period | 1,755 | 1,974 | 1,442 | 976 | 2,796 | 675 | 24 | % | 481 | 455 | 17 | % | |||||||||||||||||||||||||||||
| Steelmaking Coal(6) | 4.3 | 3.8 | 164 | 136 | 708 | (149 | ) | (21 | )% | (206 | ) | 149 | (14 | )% | |||||||||||||||||||||||||||
| Prior period | 8.0 | 7.9 | 265 | 125 | 2,108 | 592 | 28 | % | 346 | 257 | 20 | % | |||||||||||||||||||||||||||||
| Nickel | 19,300 | 19,800 | 6.28 | 473 | 280 | 43 | 10 | % | 38 | 16 | 11 | % | |||||||||||||||||||||||||||||
| Prior period | 19,500 | 19,000 | 6.85 | 505 | 329 | 41 | 12 | % | 35 | 50 | 8 | % | |||||||||||||||||||||||||||||
| (1) | PGMs production reflects own mined production and purchase of metal in concentrate. PGM volumes consist of 5E metals and gold. SMC production volumes are saleable tonnes, excluding thermal coal production of 0.5 Mt (H1 2024: 0.5 Mt). Includes production relating to third- party product purchased and processed at Anglo American’s operations, and may include some product sold as thermal coal. |
| (2) | PGMs volumes measured in koz, Steelmaking Coal in Mt and Nickel in t. |
| (3) | PGM sales volumes exclude tolling and third-party trading activities. SMC sales volumes exclude thermal coal sales of 0.8 Mt (H1 2024: 0.7 Mt). Includes sales relating to third-party product purchased and processed by Anglo American. |
| (4) | Price for a basket of goods per PGM oz. The dollar basket price is the net sales revenue from all metals sold (PGMs, base metals and other metals) excluding trading and foreign exchange translation impacts, per PGM 5E + gold ounces sold (own mined and purchase of concentrate) excluding trading, and measured in $/PGM oz. SMC price is realised price is the weighted average hard coking coal and PCI export sales price achieved at managed operations, measured in $/t. Nickel shows its realised price, measured in $/lb. |
| (5) | PGMs unit cost is total cash operating costs (includes on-mine, smelting and refining costs only) per own mined PGM ounce of production, measured in $/PGM oz. SMC unit cost is FOB unit cost comprises managed operations and excludes royalties, measured in $/t. Nickel is C1 unit cost, measured in c/lb. |
| (6) | Anglo American’s attributable share of Jellinbah is 23.3%. Anglo American agreed the sale of its 33.33% stake in Jellinbah in November 2024, and this transaction has now completed on 29 January 2025. The results from Jellinbah post 1 November 2024, after the sale was agreed, did not accrue to Anglo American and have been excluded. Jellinbah production in H1 2024 was 1.6 Mt. |
PGMs
The PGMs business was classified as ‘held for distribution’ from 30 April 2025 upon the approval of the demerger resolution at the Group AGM. The demerger subsequently took effect on 31 May 2025, resulting in five months being consolidated in 2025 compared to six months in 2024.
Operational performance
Total PGM metal-in-concentrate production decreased by 32% to 1,188,400 ounces (30 June 2024: 1,755,100 ounces). Excluding June 2024 (on a like-for-like basis), production decreased by 18% primarily due to the Kroondal transition to a 4E toll arrangement which commenced in September 2024, and heavy flooding at the start of the year at Amandelbult, which then impacted operations for the remainder of the period.
PGM sales volumes decreased by 43% to 1,134,000 ounces (30 June 2024: 1,973,600 ounces). On a like-for-like basis, sales were 31% lower due to the lower production, triennial stock take at the Base Metal Refinery, as well as the comparative period benefitting from a drawdown of finished goods.
Financial performance
Underlying EBITDA decreased to $199 million (30 June 2024: $675 million). On a like-for-like basis, EBITDA decreased by 55% driven by the lower sales volumes and the flooding at Amandelbult. The own mined unit cost increased by 18% to $1,149/PGM ounce (30 June 2024: $976/PGM ounce). On a like-for-like basis, unit costs increased by 17%, predominantly driven by the lower own-mined production and flood recovery costs at Amandelbult.
Capital expenditure of $353 million was 22% lower (30 June 2024: $455 million). On a like-for-like basis, capex was 4% lower due to planned lower growth spend following a reprioritisation and rephasing of projects.
| Anglo American plc Interim Results 2025 | 29 |
Discontinued Operations
Steelmaking Coal
Anglo American agreed the sale of its 33.33% stake in Jellinbah in November 2024, and this transaction completed on 29 January 2025, with proceeds of $0.9 billion received. The results from Jellinbah post 1 November 2024, after the sale was agreed, did not accrue to Anglo American and have been excluded.
On 25 November 2024, the signing of definitive agreements to sell the entirety of our remaining Steelmaking Coal business was announced, generating up to $3.8 billion in aggregate gross cash proceeds.
The Moranbah-Grosvenor joint operations and Jellinbah associate were classified as held for sale as at 31 December 2024. The remainder of the Steelmaking Coal business was held for sale on 15 March 2025 following expiry of the relevant pre-emptive rights. We continue to believe that the event that occurred on 31 March 2025 at the Moranbah North steelmaking coal mine in Australia does not constitute a Material Adverse Change (MAC) in accordance with the definitive agreements signed with Peabody in November 2024, such belief reinforced by the substantial regulatory progress made towards a restart of the operation. We continue to work constructively with Peabody towards completing the transaction and we are fulfilling our responsibilities under the sale agreements. Anglo American reserves its rights under the definitive agreements with Peabody and is confident in its legal position.
Operational performance
Production decreased by 46% to 4.3 Mt (30 June 2024: 8.0 Mt), reflecting the suspension of mining at the Grosvenor longwall operation during the first six months of this year, following the underground fire on 29 June 2024, and the sale of Jellinbah. Production was also impacted by the underground incident at Moranbah on 31 March 2025, with operations remaining temporarily suspended. These decreases were partially offset by increased production from the Aquila underground operation reflecting strong performance of the longwall coupled with improved ground conditions, as well as higher production at the Capcoal open cut operation due to mine sequencing.
At Moranbah, significant progress has been made since the re-entry to the underground area in mid-April. Maintenance and development operations resumed in early June and work is now well progressed to prepare the longwall panel for restart. Approval to move the shearer from the tailgate to the maingate to undertake maintenance activities was recently received - and in so doing, will provide useful dynamic data for validating our controls, as we move towards a risk-based, safe and structured restart of the longwall. Subject to final approval from the regulator, we intend to use remote operation at the restart for a period of time, as part of a moderated ramp-up as we work safely to reach steady state production. At Grosvenor, we continue to work with the regulator to complete the remaining requirements for re-entry approval – a critical milestone that will enable our teams to return underground, conduct visual inspections and continue our readiness activities.
Financial performance
Underlying EBITDA loss of $149 million (30 June 2024: gain of $592 million), as a result of lower sales volumes, which includes the impact of the Jellinbah sale, a 38% decrease in the weighted average realised price for steelmaking coal and $60 million non-operational costs associated with Grosvenor. Unit costs increased by 9% to $136/tonne (30 June 2024: $125/tonne), primarily reflecting the impact of lower production from Moranbah, which as an underground operation has a higher proportion of fixed costs.
Capital expenditure decreased to $149 million (30 June 2024: $257 million), primarily reflecting the reduced spend at Grosvenor following the underground fire in June 2024.
Nickel
Anglo American has entered into a definitive agreement to sell the Nickel business to MMG Singapore Resources Pte. Ltd, subject to relevant approvals. The Nickel business was classified as held for sale on 18 February 2025 following the announcement of the signed sale and purchase agreement.
Operational performance
Nickel production decreased by 1% to 19,300 tonnes (30 June 2024: 19,500 tonnes), due to expected lower grade.
Financial performance
Underlying EBITDA increased to $43 million (30 June 2024: $41 million), primarily due to the lower unit cost and higher sales volumes, partially offset by lower realised price. Unit costs decreased by 6% to 473 c/lb (30 June 2024: 505 c/ lb), reflecting the benefit of cost efficiencies, particularly energy, lower input prices and the weaker Brazilian real.
Capital expenditure of $16 million was lower than 30 June 2024 of $50 million, reflecting lower capitalised stripping costs.
| 30 | Anglo American plc Interim Results 2025 |
Guidance summary
Guidance summary
Production and unit costs
| Unit costs | Production volumes | |||||||||||||||
| 2025F | Units | 2025F | 2026F | 2027F | ||||||||||||
| Simplified portfolio | ||||||||||||||||
| Copper(1) | c.151 c/lb | kt | 690–750 | 760–820 | 760-820 | |||||||||||
| Iron ore(2) | c.$36/t | Mt | 57–61 | 54–58 | 59-63 | |||||||||||
| Exiting businesses | ||||||||||||||||
| Diamonds(3) | c.$94/ct | Mct | 20–23 | 26–29 | 28-31 | |||||||||||
Further commentary on the operational outlook is included within the respective business reviews on pages 16-30.
Note: Unit costs exclude royalties, depreciation and include direct support costs only. 2025 unit cost guidance was set at: c.950 CLP:USD, c.3.75 PEN:USD, c.5.75 BRL:USD, c.18.60 ZAR:USD, c.1.60 AUD:USD. Subject to macro-economic factors.
| (1) | Copper business only. On a contained-metal basis. Total copper production is the sum of Chile and Peru. Unit cost total reflects a weighted average using the mid-point of production guidance. 2025 Chile: 380–410 kt; Peru 310–340 kt. 2026 Chile: 440–470 kt; Peru: 320–350 kt. 2027 Chile: 450-480 kt; Peru 310-340 kt. In 2025, copper production is impacted by lower grades at most of our operations in Chile. In 2026, production benefits from improved grades at Collahuasi in Chile and higher plant throughput in Peru. In 2027, production benefits from higher grades at Los Bronces and higher throughput at Collahuasi in Chile, partially offset by slightly lower production in Peru due to planned plant maintenance, including mills and conveyors. Chile production is subject to water availability, and is expected to be weighted to the second half of 2025 given the impact from lower grades in the first half from Collahuasi, particularly in Q1. 2025 unit cost guidance for Chile is c.195 c/lb and for Peru is c.100 c/lb. The copper unit costs are impacted by FX rates and pricing of by-products, such as molybdenum. |
| (2) | Wet basis. Total iron ore is the sum of Kumba and Minas-Rio. Unit cost total reflects a weighted average using the mid-point of production guidance. 2025 Kumba: 35–37 Mt; Minas-Rio: 22–24 Mt. 2026 Kumba: 31–33 Mt; Minas-Rio: 23–25 Mt. 2027 Kumba: 35-37 Mt; Minas-Rio: 24-26 Mt. In 2025, Minas-Rio production guidance reflects a pipeline inspection (that occurs every five years), planned for the third quarter of the year. In 2026, Kumba production is lower by c.4 Mt due to tie-in activities required for the ultra-high-dense-media-separation (UHDMS) project which was announced by Kumba in August 2024. Kumba production is subject to the third-party rail and port availability and performance. 2025 unit cost guidance for Kumba is c.$39/tonne and for Minas-Rio is c.$32/tonne. |
| (3) | Production is on a 100% basis except for the Gahcho Kué joint operation, which is on an attributable 51% basis. Production is lower in 2025 and 2026 reflecting the challenging rough diamond trading conditions. De Beers continues to monitor rough diamond trading conditions and will respond accordingly. Unit cost is based on De Beers’ proportionate consolidated share of costs and associated production. |
| Anglo American plc Interim Results 2025 | 31 |
Guidance summary
Capital expenditure ($bn)(1)
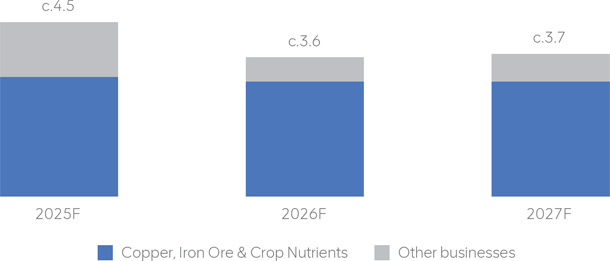
| Current portfolio | 2025F | 2026F | 2027F | |||
|
Growth
|
c.$0.7bn Includes ~$0.3bn Woodsmith capex(2) |
c.$0.7bn | c.$0.9bn | |||
|
Sustaining
|
c.$2.8bn Reflects c.$2.3bn baseline, c.$0.2bn lifex projects and c.$0.3bn Collahuasi desalination plant(3) |
c.$2.9bn Reflects c.$2.5bn baseline, c.$0.3bn lifex projects and c.$0.1bn Collahuasi desalination plant(3) |
c.$2.8bn Reflects c.$2.5bn baseline and c.$0.3bn lifex projects |
|||
| Total continuing operations(4) | c.$3.5bn | c.$3.6bn | c.$3.7bn | |||
|
Sustaining
|
c.$1.0bn Reflects c.$0.9bn baseline, c.$0.1bn lifex projects |
|||||
| Total discontinued operations(4) | c.$1.0bn |
| Simplified portfolio | 2025F | 2026F | 2027F | |||
|
Growth
|
c.$0.7bn Includes ~$0.3bn Woodsmith capex(2) |
c.$0.7bn | c.$0.9bn | |||
|
Sustaining
|
c.$2.4bn Reflects c.$2.0bn baseline, c.$0.1bn lifex projects and c.$0.3bn Collahuasi desalination plant(3) |
c.$2.3bn Reflects c.$2.2bn baseline, c.$0.1bn Collahuasi desalination plant(3) |
c.$2.1bn Reflects c.$2.1bn baseline |
|||
| Total | c.$3.1bn | c.$3.0bn | c.$3.0bn |
Further details on Anglo American’s high quality growth and life-extension projects, including details of the associated volumes benefit, are disclosed on pages 9-11.
Long term sustaining capital expenditure for the simplified portfolio is expected to be $2.0 billion per annum(5), excluding life-extension projects.
| 32 | Anglo American plc Interim Results 2025 |
Guidance summary
Other guidance
| – | 2025 depreciation for continuing operations: $2.3-2.5 billion |
| – | 2025 underlying effective tax rate for continuing operations: 44-48%(6) |
| – | Long-term underlying effective tax rate (simplified portfolio): 38-42%(6) |
| – | Dividend payout ratio: 40% of underlying earnings |
| – | Net debt:EBITDA: <1.5x at the bottom of the cycle |
| (1) | Cash expenditure on property, plant and equipment including related derivatives, net of proceeds from disposal of property, plant and equipment, and includes direct funding for capital expenditure from non-controlling interests. Guidance includes unapproved projects and is, therefore, subject to the progress of project studies, permitting and approval. Refer to the Interim 2025 results presentation for further detail on the breakdown of the capex guidance at project level. |
| (2) | Woodsmith operating costs for 2025 and 2026 are expected to be c.$0.1 billion and c.$0.1billion, respectively. |
| (3) | Collahuasi desalination capex shown includes related infrastructure, with other water management projects included in baseline sustaining. Attributable share of capex at 44%. |
| (4) | Capex guidance for continuing operations includes Copper, Iron Ore, Crop Nutrients and De Beers. Capex guidance for discontinued operations includes a full year of Steelmaking Coal and Nickel as well as the actual five-months of spend at PGMs. The c.$0.1 billion of lifex for discontinued operations relates to PGMs. |
| (5) | Long-term sustaining capex guidance is shown on a 2025 real basis and is for the simplified portfolio. |
| (6) | Underlying effective tax rate guidance is highly dependent on a number of factors, including the mix of profits and any relevant tax reforms impacting the countries where we operate, and may vary from guidance, and will be impacted by the timing of the exit of De Beers from the portfolio. |
| Anglo American plc Interim Results 2025 | 33 |
Further information
For further information, please contact:
| Media | Investors |
| UK James Wyatt-Tilby james.wyatt-tilby@angloamerican.com Tel: +44 (0)20 7968 8759 |
UK Tyler Broda tyler.broda@angloamerican.com Tel: +44 (0)20 7968 1470 |
| Marcelo
Esquivel marcelo.esquivel@angloamerican.com Tel: +44 (0)20 7968 8891 |
Emma Waterworth emma.waterworth@angloamerican.com Tel: +44 (0)20 7968 8574 |
| Rebecca
Meeson-Frizelle rebecca.meeson-frizelle@angloamerican.com Tel: +44 (0)20 7968 1374 |
Michelle
West-Russell michelle.west-russell@angloamerican.com Tel: +44 (0)20 7968 1494 |
| South Africa Nevashnee Naicker nevashnee.naicker@angloamerican.com Tel: +27 (0)11 638 3189 |
Asanda
Malimba asanda.malimba@angloamerican.com Tel: +44 (0)20 7968 8480 |
| Ernest
Mulibana ernest.mulibana@angloamerican.com Tel: +27 82 263 7372 |
Notes to editors:
Anglo American is a leading global mining company focused on the responsible production of copper, premium iron ore and crop nutrients
– future-enabling products that are essential for decarbonising the global economy, improving living standards, and food
security. Our portfolio of world-class operations and outstanding resource endowments offers value-accretive growth potential across
all three businesses, positioning us to deliver into structurally attractive major demand growth trends.
Our integrated approach to sustainability and innovation drives our decision-making across the value chain, from how we discover new resources to how we mine, process, move and market our products to our customers – safely, efficiently and responsibly. Our Sustainable Mining Plan commits us to a series of stretching goals over different time horizons to ensure we contribute to a healthy environment, create thriving communities and build trust as a corporate leader. We work together with our business partners and diverse stakeholders to unlock enduring value from precious natural resources for our shareholders, for the benefit of the communities and countries in which we operate, and for society as a whole. Anglo American is re-imagining mining to improve people’s lives.
Anglo American is currently implementing a number of major structural changes to unlock the inherent value in its portfolio and thereby accelerate delivery of its strategic priorities of Operational excellence, Portfolio simplification, and Growth. This portfolio transformation is focusing Anglo American on its world-class resource asset base in copper, premium iron ore and crop nutrients – with the sale of our steelmaking coal and nickel businesses agreed, the demerger of our PGMs business (Anglo American Platinum, now Valterra Platinum) completed, and the separation of our iconic diamond business (De Beers) to follow.
www.angloamerican.com

Webcast of presentation:
A live webcast of the results presentation, starting at 9.00am UK time on 31 July 2025, can be accessed through the Anglo American
website at www.angloamerican.com
Note: Throughout this results announcement, ‘$’ denotes United States dollars and ‘cents’ refers to United States cents. Tonnes are metric tons, ‘Mt’ denotes million tonnes and ‘kt’ denotes thousand tonnes, unless otherwise stated.
| 34 | Anglo American plc Interim Results 2025 |
Further information
Group terminology
In this document, references to “Anglo American”, the “Anglo American Group”, the “Group”,
“we”, “us”, and “our” are to refer to either Anglo American plc and its subsidiaries and/or
those who work for them generally, or where it is not necessary to refer to a particular entity, entities or persons. The use of
those generic terms herein is for convenience only, and is in no way indicative of how the Anglo American Group or any entity within
it is structured, managed or controlled. Anglo American subsidiaries, and their management, are responsible for their own day-to-day
operations, including but not limited to securing and maintaining all relevant licences and permits, operational adaptation and
implementation of Group policies, management, training and any applicable local grievance mechanisms. Anglo American produces Group-wide
policies and procedures to ensure best uniform practices and standardisation across the Anglo American Group but is not responsible
for the day to day implementation of such policies. Such policies and procedures constitute prescribed minimum standards only.
Group operating subsidiaries are responsible for adapting those policies and procedures to reflect local conditions where appropriate,
and for implementation, oversight and monitoring within their specific businesses.
Disclaimer
This document is for information purposes only and does not constitute, nor is to be construed as, an offer to sell or the recommendation,
solicitation, inducement or offer to buy, subscribe for or sell shares in Anglo American or any other securities by Anglo American
or any other party. Further, it should not be treated as giving investment, legal, accounting, regulatory, taxation or other advice
and has no regard to the specific investment or other objectives, financial situation or particular needs of any recipient.
Forward-looking statements and third-party information:
This document includes forward-looking statements. All statements other than statements of historical facts included in this document,
including, without limitation, those regarding Anglo American’s financial position, business, acquisition and divestment
strategy, dividend policy, plans and objectives of management for future operations, prospects and projects (including development
plans and objectives relating to Anglo American’s products, production forecasts and Ore Reserve and Mineral Resource positions)
and sustainability performance related (including environmental, social and governance) goals, ambitions, targets, visions, milestones
and aspirations, are forward-looking statements. By their nature, such forward-looking statements involve known and unknown risks,
uncertainties and other factors which may cause the actual results, performance or achievements of Anglo American or industry results
to be materially different from any future results, performance or achievements expressed or implied by such forward-looking statements.
Such forward-looking statements are based on numerous assumptions regarding Anglo American’s present and future business strategies and the environment in which Anglo American will operate in the future. Important factors that could cause Anglo American’s actual results, performance or achievements to differ materially from those in the forward-looking statements include, among others, levels of actual production during any period, levels of global demand and product prices, unanticipated downturns in business relationships with customers or their purchases from Anglo American, resource exploration and project development capabilities and delivery, recovery rates and other operational capabilities, safety, health or environmental incidents, the effects of global pandemics and outbreaks of infectious diseases, the impact of attacks from third parties on our information systems, natural catastrophes or adverse geological conditions, climate change and extreme weather events, the outcome of litigation or regulatory proceedings, the availability of mining and processing equipment, the ability to obtain key inputs in a timely manner, the ability to produce and transport products profitably, the availability of necessary infrastructure (including transportation) services, the development, efficacy and adoption of new or competing technology, challenges in realising resource estimates or discovering new economic mineralisation, the impact of foreign currency exchange rates on market prices and operating costs, the availability of sufficient credit, liquidity and counterparty risks, the effects of inflation, terrorism, war, conflict, political or civil unrest, uncertainty, tensions and disputes and economic and financial conditions around the world, evolving societal and stakeholder requirements and expectations, shortages of skilled employees, unexpected difficulties relating to acquisitions or divestitures, competitive pressures and the actions of competitors, activities by courts, regulators and governmental authorities such as in relation to permitting or forcing closure of mines and ceasing of operations or maintenance of Anglo American’s assets and changes in taxation or safety, health, environmental or other types of regulation in the countries where Anglo American operates, conflicts over land and resource ownership rights and such other risk factors identified in Anglo American’s most recent Annual Report. Forward-looking statements should, therefore, be construed in light of such risk factors and undue reliance should not be placed on forward-looking statements. These forward-looking statements speak only as of the date of this document. Anglo American expressly disclaims any obligation or undertaking (except as required by applicable law, the City Code on Takeovers and Mergers, the UK Listing Rules, the Disclosure Guidance and Transparency Rules of the Financial Conduct Authority, the Listings Requirements of the securities exchange of the JSE Limited in South Africa, the SIX Swiss Exchange, the Botswana Stock Exchange and the Namibian Stock Exchange and any other applicable regulations) to release publicly any updates or revisions to any forward-looking statement contained herein to reflect any change in Anglo American’s expectations with regard thereto or any change in events, conditions or circumstances on which any such statement is based.
Nothing in this document should be interpreted to mean that future earnings per share of Anglo American will necessarily match or exceed its historical published earnings per share. Certain statistical and other information included in this document is sourced from third party sources (including, but not limited to, externally conducted studies and trials). As such it has not been independently verified and presents the views of those third parties, but may not necessarily correspond to the views held by Anglo American and Anglo American expressly disclaims any responsibility for, or liability in respect of, such information.
©Anglo
American Services (UK) Ltd 2025.  TM
and
TM
and  TM are trade marks of Anglo American Services (UK) Ltd.
Anglo American plc
17 Charterhouse Street London EC1N 6RA United Kingdom
Registered office as above. Incorporated in England and Wales under the Companies Act 1985.
Registered Number: 3564138 Legal Entity Identifier: 549300S9XF92D1X8ME43
| Anglo American plc Interim Results 2025 | 35 |
This page has been intentionally left blank.
CONDENSED FINANCIAL STATEMENTS
for the six months ended 30 June 2025
Financial statements and other financial information
Contents
| Primary statements | ||
| Consolidated income statement | 39 | |
| Consolidated statement of comprehensive income | 40 | |
| Consolidated balance sheet | 41 | |
| Consolidated cash flow statement | 42 | |
| Consolidated statement of changes in equity | 43 | |
| Notes to the Condensed financial statements | ||
| 1. | Basis of preparation | 44 |
| 2. | Changes in accounting policies, estimates and disclosures | 45 |
| Financial performance | ||
| 3. | Operating profit from subsidiaries and joint operations | 46 |
| 4. | Financial performance by segment | 47 |
| 5. | Earnings per share | 51 |
| 6. | Net finance costs | 53 |
| 7. | Income tax expense | 54 |
| 8. | Dividends | 56 |
| Significant items | ||
| 9. | Significant accounting matters | 57 |
| 10. | Impairment | 59 |
| 11. | Special items and remeasurements | 60 |
| Capital base | ||
| 12. | Capital by segment | 62 |
| 13. | Capital expenditure | 64 |
| 14. | Investments in associates and joint ventures | 65 |
| Net debt and financial risk management | ||
| 15. | Net debt | 66 |
| 16. | Borrowings | 68 |
| 17. | Financial instruments | 69 |
| Equity | ||
| 18. | Non-controlling interests | 72 |
| Unrecognised items and uncertain events | ||
| 19. | Events occurring after the period end | 74 |
| 20. | Contingent assets and liabilities | 74 |
| Group structure | ||
| 21. | Assets and liabilities held for sale | 75 |
| 22. | Discontinued operations | 76 |
| 23. | Disposals | 79 |
| Responsibility statement | 81 | |
| Independent review report to Anglo American plc | 82 | |
| Summary by operation | 84 | |
| Alternative Performance Measures | 88 | |
| Exchange rates and commodity prices | 96 | |
| Notice of Dividend | 97 | |
| 38 | Anglo American plc Interim Results 2025 |
| Financial statements and other financial information | Primary statements |
Consolidated income statement
for the six months ended 30 June 2025
| 6 months ended 30.06.24 | ||||||||||||||||||||||||||||
| 6 months ended 30.06.25 | (re-presented)(1) | |||||||||||||||||||||||||||
| US$ million | Note | Before special items and remeasurements |
Special items and remeasurements (note 11) |
Total | Before special items and remeasurements |
Special items and remeasurements (note 11) |
Total | |||||||||||||||||||||
| Continuing operations | ||||||||||||||||||||||||||||
| Revenue | 4 | 8,965 | (11 | ) | 8,954 | 9,579 | 5 | 9,584 | ||||||||||||||||||||
| Operating costs | (7,127 | ) | (90 | ) | (7,217 | ) | (6,977 | ) | (1,840 | ) | (8,817 | ) | ||||||||||||||||
| Operating profit | 3 | 4 | 1,838 | (101 | ) | 1,737 | 2,602 | (1,835 | ) | 767 | ||||||||||||||||||
| Non-operating special items | 11 | – | (29 | ) | (29 | ) | – | 9 | 9 | |||||||||||||||||||
| Net income/(loss) from associates and joint ventures | 4 | 14 | (23 | ) | 31 | 8 | (12 | ) | – | (12 | ) | |||||||||||||||||
| Profit before net finance costs and tax | 1,815 | (99 | ) | 1,716 | 2,590 | (1,826 | ) | 764 | ||||||||||||||||||||
| Investment income | 179 | – | 179 | 175 | – | 175 | ||||||||||||||||||||||
| Interest expense | (428 | ) | – | (428 | ) | (448 | ) | – | (448 | ) | ||||||||||||||||||
| Other net financing (losses)/gains | (19 | ) | 8 | (11 | ) | 16 | (3 | ) | 13 | |||||||||||||||||||
| Net finance costs | 6 | (268 | ) | 8 | (260 | ) | (257 | ) | (3 | ) | (260 | ) | ||||||||||||||||
| Profit before tax | 1,547 | (91 | ) | 1,456 | 2,333 | (1,829 | ) | 504 | ||||||||||||||||||||
| Income tax expense | 7 | (761 | ) | 210 | (551 | ) | (1,034 | ) | (147 | ) | (1,181 | ) | ||||||||||||||||
| Profit/(loss) for the financial period from continuing operations | 786 | 119 | 905 | 1,299 | (1,976 | ) | (677 | ) | ||||||||||||||||||||
| (Loss)/profit for the financial period from discontinued operations | 22 | (204 | ) | (2,070 | ) | (2,274 | ) | 519 | (41 | ) | 478 | |||||||||||||||||
| Profit/(loss) for the financial period Attributable to: | 582 | (1,951 | ) | (1,369 | ) | 1,818 | (2,017 | ) | (199 | ) | ||||||||||||||||||
| Non-controlling interests | 18 | 407 | 103 | 510 | 528 | (55 | ) | 473 | ||||||||||||||||||||
| Equity shareholders of the Company | 175 | (2,054 | ) | (1,879 | ) | 1,290 | (1,962 | ) | (672 | ) | ||||||||||||||||||
| Earnings/(loss) per share (US$) | ||||||||||||||||||||||||||||
| Basic | 5 | 0.15 | (1.73 | ) | (1.58 | ) | 1.06 | (1.61 | ) | (0.55 | ) | |||||||||||||||||
| Diluted | 5 | 0.15 | (1.73 | ) | (1.58 | ) | 1.06 | (1.61 | ) | (0.55 | ) | |||||||||||||||||
| (1) | Comparative figures are re-presented to show separately results from discontinued operations, see note 22. |
| Anglo American plc Interim Results 2025 | 39 |
| Financial statements and other financial information | Primary statements |
Consolidated statement of comprehensive income
for the six months ended 30 June 2025
| US$ million | 6 months ended 30.06.25 |
6 months ended 30.06.24 (re-presented)(1) |
||||||
| Loss for the financial period | (1,369 | ) | (199 | ) | ||||
| Items that will not be reclassified to the income statement (net of tax): | ||||||||
| Remeasurement of net retirement benefit obligation | (43 | ) | (47 | ) | ||||
| Net revaluation gain/(loss) on equity investments | 243 | (6 | ) | |||||
| Items that have been or may subsequently be reclassified to the income statement (net of tax): | ||||||||
| Net exchange differences: | ||||||||
| Net gain (including associates and joint ventures) | 739 | 111 | ||||||
| Cumulative gain transferred to the income statement on disposal of foreign operations | 4,804 | – | ||||||
| Fair value movement on cash flow hedges: | ||||||||
| Net revaluation (loss)/gain (including associates and joint ventures) | (4 | ) | 156 | |||||
| Other comprehensive income for the financial period (net of tax) | 5,739 | 214 | ||||||
| Total comprehensive income for the financial period (net of tax) | 4,370 | 15 | ||||||
| Attributable to: | ||||||||
| Non-controlling interests | 684 | 507 | ||||||
| Equity shareholders of the Company | 3,686 | (492 | ) | |||||
| Attributable to: | ||||||||
| Continuing operations | 1,081 | (996 | ) | |||||
| Discontinued operations | 2,605 | 504 | ||||||
| 3,686 | (492 | ) | ||||||
| (1) | Comparative figures are re-presented to show separately results from discontinued operations, see note 22. |
| 40 | Anglo American plc Interim Results 2025 |
| Financial statements and other financial information | Primary statements |
Consolidated balance sheet
as at 30 June 2025
| US$ million | Note | 30.06.25 | 31.12.24 | |||||||||
| ASSETS | ||||||||||||
| Non-current assets | ||||||||||||
| Intangible assets | 841 | 940 | ||||||||||
| Property, plant and equipment | 34,687 | 40,844 | ||||||||||
| Environmental rehabilitation trusts | 17 | 100 | 151 | |||||||||
| Investments in associates and joint ventures | 529 | 587 | ||||||||||
| Financial asset investments | 262 | 292 | ||||||||||
| Inventories | 664 | 1,192 | ||||||||||
| Trade and other receivables | 373 | 432 | ||||||||||
| Deferred tax assets | 345 | 294 | ||||||||||
| Derivative financial assets | 17 | 503 | 116 | |||||||||
| Pension asset surplus and other non-current assets | 345 | 358 | ||||||||||
| Total non-current assets | 38,649 | 45,206 | ||||||||||
| Current assets | ||||||||||||
| Inventories | 3,152 | 5,247 | ||||||||||
| Trade and other receivables | 2,960 | 3,228 | ||||||||||
| Current tax assets | 182 | 266 | ||||||||||
| Derivative financial assets | 17 | 61 | 186 | |||||||||
| Financial asset investments | 23 | 2,330 | 36 | |||||||||
| Cash and cash equivalents | 15 | 5,809 | 8,167 | |||||||||
| Total current assets | 14,494 | 17,130 | ||||||||||
| Assets classified as held for sale | 21 | 4,129 | 2,530 | |||||||||
| Total assets | 57,272 | 64,866 | ||||||||||
| LIABILITIES | ||||||||||||
| Current liabilities | ||||||||||||
| Trade and other payables | (3,901 | ) | (6,092 | ) | ||||||||
| Short term borrowings | 15 | 16 | (1,926 | ) | (2,019 | ) | ||||||
| Provisions for liabilities and charges | (829 | ) | (740 | ) | ||||||||
| Current tax liabilities | (151 | ) | (191 | ) | ||||||||
| Derivative financial liabilities | 17 | (51 | ) | (191 | ) | |||||||
| Total current liabilities | (6,858 | ) | (9,233 | ) | ||||||||
| Non-current liabilities | ||||||||||||
| Trade and other payables | (190 | ) | (190 | ) | ||||||||
| Medium and long term borrowings | 15 | 16 | (15,065 | ) | (16,191 | ) | ||||||
| Royalty liability | 17 | (511 | ) | (478 | ) | |||||||
| Retirement benefit obligations | (534 | ) | (503 | ) | ||||||||
| Deferred tax liabilities | (4,653 | ) | (6,061 | ) | ||||||||
| Derivative financial liabilities | 17 | (339 | ) | (740 | ) | |||||||
| Provisions for liabilities and charges | (2,339 | ) | (2,574 | ) | ||||||||
| Total non-current liabilities | (23,631 | ) | (26,737 | ) | ||||||||
| Liabilities directly associated with assets classified as held for sale | 21 | (1,205 | ) | (363 | ) | |||||||
| Total liabilities | (31,694 | ) | (36,333 | ) | ||||||||
| Net assets | 25,578 | 28,533 | ||||||||||
| EQUITY | ||||||||||||
| Called-up share capital | 734 | 734 | ||||||||||
| Share premium account | 2,558 | 2,558 | ||||||||||
| Own shares | (6,055 | ) | (6,188 | ) | ||||||||
| Other reserves | (7,616 | ) | (13,088 | ) | ||||||||
| Retained earnings | 29,717 | 36,744 | ||||||||||
| Equity attributable to equity shareholders of the Company | 19,338 | 20,760 | ||||||||||
| Non-controlling interests | 18 | 6,240 | 7,773 | |||||||||
| Total equity | 25,578 | 28,533 | ||||||||||
The Condensed financial statements of Anglo American plc, registered number 03564138, were approved by the Board of directors on 30 July 2025 and signed on its behalf by:
| Duncan Wanblad | John Heasley |
| Chief Executive Officer | Chief Financial Officer |
| Anglo American plc Interim Results 2025 | 41 |
| Financial statements and other financial information | Primary statements |
Consolidated cash flow statement
for the six months ended 30 June 2025
| US$ million | Note | 6 months ended 30.06.25 |
6 months ended 30.06.24 (re-presented)(1) |
|||||||||
| Cash flows from operating activities | ||||||||||||
| Profit before tax | 1,456 | 504 | ||||||||||
| Net finance costs including financing special items and remeasurements | 6 | 260 | 260 | |||||||||
| Net (income)/loss from associates and joint ventures | 14 | (8 | ) | 12 | ||||||||
| Non-operating special items | 11 | 29 | (9 | ) | ||||||||
| Operating profit | 1,737 | 767 | ||||||||||
| Revenue and operating special items and remeasurements | 11 | 101 | 1,835 | |||||||||
| Cash element of special items | (115 | ) | (37 | ) | ||||||||
| Depreciation and amortisation | 1,085 | 1,024 | ||||||||||
| Share-based payment charges | 101 | 113 | ||||||||||
| Decrease in provisions and net retirement benefit obligations | (97 | ) | (111 | ) | ||||||||
| Decrease in inventories | 573 | 196 | ||||||||||
| (Increase)/decrease in operating receivables | (28 | ) | 700 | |||||||||
| Decrease in operating payables | (185 | ) | (221 | ) | ||||||||
| Other adjustments | 95 | (266 | ) | |||||||||
| Cash flows from operations | 3,267 | 4,000 | ||||||||||
| Dividends from associates and joint ventures | 28 | 42 | ||||||||||
| Income tax paid | (612 | ) | (739 | ) | ||||||||
| Net cash from continuing operating activities | 2,683 | 3,303 | ||||||||||
| Net cash (used in)/from discontinued operating activities | (9 | ) | 1,117 | |||||||||
| Net cash from operating activities | 2,674 | 4,420 | ||||||||||
| Cash flows from investing activities | ||||||||||||
| Expenditure on property, plant and equipment | 13 | (1,595 | ) | (2,160 | ) | |||||||
| Cash flows from derivatives related to capital expenditure | 13 | 1 | – | |||||||||
| Proceeds from disposal of property, plant and equipment | 13 | 8 | 5 | |||||||||
| Investments in associates and joint ventures | (20 | ) | (20 | ) | ||||||||
| Expenditure on intangible assets | (17 | ) | (46 | ) | ||||||||
| Net issuance of financial asset investments | (11 | ) | – | |||||||||
| Interest received and other investment income | 161 | 153 | ||||||||||
| Net cash outflow on disposals | (49 | ) | – | |||||||||
| Other investing activities | (5 | ) | (23 | ) | ||||||||
| Net cash used in investing activities from continuing operations | (1,527 | ) | (2,091 | ) | ||||||||
| Net cash used in investing activities from discontinued operations | 23 | (901 | ) | (741 | ) | |||||||
| Net cash used in investing activities | (2,428 | ) | (2,832 | ) | ||||||||
| Cash flows from financing activities | ||||||||||||
| Interest paid | (439 | ) | (353 | ) | ||||||||
| Cash flows used in derivatives related to financing activities | 15 | (180 | ) | (233 | ) | |||||||
| Dividends paid to Company shareholders | (270 | ) | (503 | ) | ||||||||
| Distributions paid to non-controlling interests | 18 | (220 | ) | (257 | ) | |||||||
| Proceeds from issuance of bonds | – | 2,853 | ||||||||||
| Proceeds from other borrowings | 452 | 1,020 | ||||||||||
| Capital repayment of lease obligations | (133 | ) | (167 | ) | ||||||||
| Repayments of bonds and borrowings | (2,461 | ) | (1,065 | ) | ||||||||
| Purchase of shares by Group companies | (39 | ) | (102 | ) | ||||||||
| Other financing activities | (18 | ) | 17 | |||||||||
| Net cash (used in)/from financing activities from continuing operations | (3,308 | ) | 1,210 | |||||||||
| Net cash from/(used in) financing activities from discontinued operations | 654 | (324 | ) | |||||||||
| Net cash (used in)/from financing activities | (2,654 | ) | 886 | |||||||||
| Net (decrease)/increase in cash and cash equivalents | (2,408 | ) | 2,474 | |||||||||
| Cash and cash equivalents at start of period | 15 | 8,134 | 6,074 | |||||||||
| Cash movements in the period | (2,408 | ) | 2,474 | |||||||||
| Effects of changes in foreign exchange rates | 69 | 11 | ||||||||||
| Cash and cash equivalents at end of period | 15 | 5,795 | 8,559 | |||||||||
| (1) | Comparative figures are re-presented to show separately results from discontinued operations, see note 22. |
| 42 | Anglo American plc Interim Results 2025 |
| Financial statements and other financial information | Primary statements |
Consolidated statement of changes in equity
for the six months ended 30 June 2025
| US$ million | Total share capital(1)(2) |
Own shares(3) |
Retained earnings |
Cumulative translation adjustment reserve |
Other reserves(4) |
Total equity attributable to equity shareholders of the Company |
Non- controlling interests |
Total equity |
||||||||||||||||||||||||
| At 1 January 2024 | 3,292 | (6,275 | ) | 40,860 | (13,389 | ) | 569 | 25,057 | 6,560 | 31,617 | ||||||||||||||||||||||
| (Loss)/profit for the period | – | – | (672 | ) | – | – | (672 | ) | 473 | (199 | ) | |||||||||||||||||||||
| Other comprehensive income/(loss) | – | – | (42 | ) | 73 | 149 | 180 | 34 | 214 | |||||||||||||||||||||||
| Dividends | – | – | (503 | ) | – | – | (503 | ) | (296 | ) | (799 | ) | ||||||||||||||||||||
| Equity settled share-based payment schemes | – | 148 | 73 | – | (107 | ) | 114 | 3 | 117 | |||||||||||||||||||||||
| Treasury shares purchased(5) | – | (96 | ) | – | – | – | (96 | ) | – | (96 | ) | |||||||||||||||||||||
| Change in ownership interest in subsidiaries | – | – | – | – | – | – | (1 | ) | (1 | ) | ||||||||||||||||||||||
| Other | – | – | (10 | ) | – | 22 | 12 | (1 | ) | 11 | ||||||||||||||||||||||
| At 30 June 2024 | 3,292 | (6,223 | ) | 39,706 | (13,316 | ) | 633 | 24,092 | 6,772 | 30,864 | ||||||||||||||||||||||
| Loss for the period | – | – | (2,396 | ) | – | – | (2,396 | ) | (193 | ) | (2,589 | ) | ||||||||||||||||||||
| Other comprehensive loss | – | – | – | (455 | ) | (28 | ) | (483 | ) | (129 | ) | (612 | ) | |||||||||||||||||||
| Dividends | – | – | (523 | ) | – | – | (523 | ) | (246 | ) | (769 | ) | ||||||||||||||||||||
| Equity settled share-based payment schemes | – | 37 | (70 | ) | – | 70 | 37 | – | 37 | |||||||||||||||||||||||
| Treasury shares purchased(5) | – | (2 | ) | – | – | – | (2 | ) | – | (2 | ) | |||||||||||||||||||||
| Change in ownership interest in subsidiaries (6) | – | – | 31 | – | (14 | ) | 17 | 1,571 | 1,588 | |||||||||||||||||||||||
| Other | – | – | (4 | ) | – | 22 | 18 | (2 | ) | 16 | ||||||||||||||||||||||
| At 31 December 2024 | 3,292 | (6,188 | ) | 36,744 | (13,771 | ) | 683 | 20,760 | 7,773 | 28,533 | ||||||||||||||||||||||
| (Loss)/profit for the period | – | – | (1,879 | ) | – | – | (1,879 | ) | 510 | (1,369 | ) | |||||||||||||||||||||
| Other comprehensive income/(loss) | – | – | (49 | ) | 5,371 | 243 | 5,565 | 174 | 5,739 | |||||||||||||||||||||||
| Dividends | – | – | (270 | ) | – | – | (270 | ) | (545 | ) | (815 | ) | ||||||||||||||||||||
| Equity settled share-based payment schemes | – | 139 | (22 | ) | – | (39 | ) | 78 | – | 78 | ||||||||||||||||||||||
| Treasury shares purchased(5) | – | (4 | ) | – | – | – | (4 | ) | – | (4 | ) | |||||||||||||||||||||
| Disposal | – | – | 73 | – | (73 | ) | – | (1,673 | ) | (1,673 | ) | |||||||||||||||||||||
| Distribution in specie (note 23) | – | – | (4,869 | ) | – | – | (4,869 | ) | – | (4,869 | ) | |||||||||||||||||||||
| Change in ownership interest in subsidiaries | – | – | 5 | – | – | 5 | (2 | ) | 3 | |||||||||||||||||||||||
| Other | – | (2 | ) | (16 | ) | – | (30 | ) | (48 | ) | 3 | (45 | ) | |||||||||||||||||||
| At 30 June 2025 | 3,292 | (6,055 | ) | 29,717 | (8,400 | ) | 784 | 19,338 | 6,240 | 25,578 | ||||||||||||||||||||||
| (1) | Includes share capital and share premium. |
| (2) | Following the demerger of Valterra Platinum, on 1 June 2025 a share consolidation became effective with the result that the number of ordinary shares held reduced by 159,527,641 shares and the nominal value increased from 54.95 US cents to 62.39 US cents per share (rounded to 2 decimal places). |
| (3) | Own shares comprise shares of Anglo American plc held by the Company, its subsidiaries and employee benefit trusts. |
| (4) | Includes the share-based payment reserve, financial asset revaluation reserve, capital redemption reserve, legal reserve, cash flow hedge reserve and other reserves. |
| (5) | Shares purchased by controlled trusts and subsidiaries. |
| (6) | During the prior year, the Group sold approximately 11.9% of its holding in Valterra Platinum Limited (formerly Anglo American Platinum), and transferred 15% of its holding in Minas-Rio. |
| Anglo American plc Interim Results 2025 | 43 |
Financial statements and other financial information
Notes to the Condensed financial statements
1. Basis of preparation
Basis of preparation
This Condensed consolidated interim financial statements for the six months ended 30 June 2025 have been prepared in accordance with the UK-adopted International Accounting Standard IAS 34 Interim Financial Reporting and the Disclosure Guidance and Transparency Rules sourcebook of the United Kingdom’s Financial Conduct Authority (‘DTR’).
The Condensed financial statements represent a ‘condensed set of financial statements’ as referred to in the DTR. Accordingly, they do not include all of the information required for a full annual financial report and are to be read in conjunction with the annual financial statements for the year ended 31 December 2024 which have been prepared in accordance with UK-adopted international accounting standards in conformity with the requirements of the Companies Act 2006, IFRS Interpretations Committee (IFRS IC) interpretations and those parts of the Companies Act 2006 applicable to companies reporting under International Financial Reporting Standards (IFRS).
The Condensed financial statements are unaudited and do not constitute statutory accounts as defined in section 434 of the Companies Act 2006. The financial information for the year to 31 December 2024 included in this report was derived from the statutory accounts for the year ended 31 December 2024, a copy of which has been delivered to the Registrar of Companies. The auditor’s report on these accounts was unqualified, did not include a reference to any matters to which the auditor drew attention by way of an emphasis of matter and did not contain a statement under section 498 of the Companies Act 2006.
Going concern
The financial position of the Group, its cash flows, liquidity position and borrowing facilities are set out in the Group financial review for the six months ended 30 June 2025 on pages 4 to 9. The Group’s net debt (including related hedges) at 30 June 2025 was $10.8 billion (31 December 2024: $10.6 billion). During the first six months of 2025 the Group executed a bond buyback of $1.0 billion ($111 million of the $700 million 4.75% Senior Notes due April 2027; $394 million of the $650 million 4.0% Senior Notes due September 2027; $380 million of the $500 million 2.25% Senior Notes due March 2028 and €126 million ($137 million) of the €500 million 4.5% Senior Notes due September 2028) and repaid $532 million of bonds which matured during the period ($193 million 5.375% Senior Notes in April 2025 and $339 million 4.875% Senior Notes in May 2025). The Group’s liquidity position (defined as cash and cash equivalents and undrawn committed facilities) of $12.0 billion at 30 June 2025 (31 December 2024: $15.3 billion) remains strong. Further analysis of net debt is set out in note 15 and details of borrowings and facilities are set out in note 16.
The directors have considered the Group’s cash flow forecasts for the period to the end of December 2026 under base and downside scenarios with reference to the Group’s principal risks as set out on page 15 of these results. In the downside scenarios modelled (including pricing and production downsides, alongside a significant operational incident and considering variation in timing of the Group’s divestments), the Group maintains sufficient liquidity throughout the period of assessment without the use of mitigating actions.
The Board is satisfied that the Group’s forecasts and projections, taking account of reasonably possible changes in trading performance, show that the Group will be able to operate within the level of its current facilities for the period of at least twelve months from the date of approval of the Condensed financial statements. For this reason the Group continues to adopt the going concern basis in preparing its financial statements.
Alternative Performance Measures
When assessing and discussing the Group’s reported financial performance, financial position and cash flows, management makes reference to Alternative Performance Measures (APMs) of historical or future financial performance, financial position or cash flows that are not defined or specified under IFRS. APMs should be considered in addition to, and not as a substitute for or as superior to, measures of financial performance, financial position or cash flows reported in accordance with IFRS. Further information on APMs is provided on page 88.
| 44 | Anglo American plc Interim Results 2025 |
| Financial statements and other financial information | Notes to the Condensed financial statements |
2. Changes in accounting policies, estimates and disclosures
The accounting policies applied are consistent with those adopted and disclosed in the Group financial statements for the year ended 31 December 2024 with the exception of new accounting pronouncements, which became effective on 1 January 2025 and have been adopted by the Group. The adoption of these new accounting pronouncements has not had a significant impact on the accounting policies, methods of computation or presentation applied by the Group.
The Group has not early adopted any other amendment, standard or interpretation that has been issued but is not yet effective. It is expected that where applicable, these standards and amendments will be adopted on each respective effective date.
The Group has begun its impact assessment on the implementation of IFRS 18 Presentation and Disclosure in Financial Statements (effective 1 January 2027). The most significant impact on the Group financial statements is expected to be on the presentation of the Consolidated income statement, and disclosure of Management Performance Measures (MPMs). The Group will apply the standard from its mandatory effective date of 1 January 2027. Retrospective application is required, and so comparative information for the financial year ending 31 December 2026 will be restated. A more detailed impact analysis and associated transition activities will be undertaken during the remainder of 2025.
Accounting policy for non-cash distribution to owners
Due to the demerger of the Group’s Platinum business via a distribution in specie on 31 May 2025 (see note 23), the Group includes its accounting policy in respect of non-cash distribution to owners.
Non-cash distributions to owners occur when a distribution of assets is made to owners rather than cash.
The Group recognises a liability for dividends declared in the form of non-cash assets when the distribution is appropriately authorised and is no longer at the discretion of the entity. The liability is measured at the fair value of the assets to be distributed at that date. Movements in fair value between the date of declaration and the date of settlement are recognised within equity (see note 23).
On the date of distribution, the carrying amount of the liability is settled, and the non-cash assets are derecognised from the Group’s financial statements. Any difference between the carrying amount of the distributed assets and the carrying amount of the dividend payable is recognised in profit or loss.
Retirement benefits
During the period, the Group purchased insurance policies to settle the defined benefit pension liabilities related to the Tarmac B scheme and the Anglo UK scheme (on 13 January 2025), and the Tarmac UK scheme (‘the schemes’) (on 14 January 2025) (a ‘buy-in’). This resulted in the reduction of corporate and government bonds and the recognition of an insurance policy asset. At the date of the insurance policy purchase the respective schemes had plan assets valued at $1.3 billion and benefit obligations of $1.0 billion, which closely matched the purchase price of the insurance policies.
| Anglo American plc Interim Results 2025 | 45 |
| Financial statements and other financial information | Notes to the Condensed financial statements |
Financial performance
Profit attributable to equity shareholders from continuing operations is $477 million profit (six months ended 30 June 2024: $1,068 million loss). Underlying earnings from continuing operations decreased by 55% to $387 million (six months ended 30 June 2024: $861 million).
The following disclosures provide further information about the drivers of the Group’s financial performance in the period. This includes analysis of the respective contribution of the Group’s reportable segments along with information about its operating cost base, net finance costs and tax. In addition, disclosure on earnings per share and the dividend is provided.
3. Operating profit from subsidiaries and joint operations
| Continuing operations | ||||||||||||
| US$ million | Note | 6 months ended 30.06.25 |
6 months ended 30.06.24 (re-presented)(1) |
|||||||||
| Revenue before special items and remeasurements | 8,965 | 9,579 | ||||||||||
| Operating costs: | ||||||||||||
| Employee costs | (1,153 | ) | (1,259 | ) | ||||||||
| Depreciation of property, plant and equipment | (1,016 | ) | (994 | ) | ||||||||
| Amortisation of intangible assets | (69 | ) | (30 | ) | ||||||||
| Third-party commodity purchases(2) | (966 | ) | (1,205 | ) | ||||||||
| Consumables, maintenance and production input costs | (2,294 | ) | (1,971 | ) | ||||||||
| Logistics, marketing and selling costs | (1,047 | ) | (1,130 | ) | ||||||||
| Royalties | (94 | ) | (106 | ) | ||||||||
| Exploration and evaluation | (103 | ) | (106 | ) | ||||||||
| Net foreign exchange losses | (51 | ) | (9 | ) | ||||||||
| Other operating income | 112 | 63 | ||||||||||
| Other operating expenses | (446 | ) | (230 | ) | ||||||||
| Operating profit before special items and remeasurements | 1,838 | 2,602 | ||||||||||
| Revenue remeasurements | 11 | (11 | ) | 5 | ||||||||
| Operating special items and remeasurements | 11 | (90 | ) | (1,840 | ) | |||||||
| Operating profit from continuing operations | 1,737 | 767 | ||||||||||
| (1) | Comparative figures are re-presented to show separately results from discontinued operations, see note 22. |
| (2) | Third-party commodity purchases principally relate to purchases from joint operation partners within De Beers. |
Royalties exclude items which meet the definition of income tax on profit and which have been accounted for as taxes. Exploration and evaluation excludes associated employee costs. The full exploration and evaluation expenditure (including associated employee costs) is presented in the table below:
Operating profit before special items and remeasurements is stated after charging:
| US$ million | 6 months ended 30.06.25 |
6 months ended 30.06.24 (re-presented)(1) |
||||||
| Exploration expenditure | (44 | ) | (59 | ) | ||||
| Evaluation expenditure | (76 | ) | (63 | ) | ||||
| Research and development expenditure | (18 | ) | (53 | ) | ||||
| (1) | Comparative figures are re-presented to show separately results from discontinued operations, see note 22. |
| 46 | Anglo American plc Interim Results 2025 |
| Financial statements and other financial information | Notes to the Condensed financial statements |
Financial performance
4. Financial performance by segment
Overview
The Group’s operating segments are aligned to those businesses that are evaluated regularly by the chief operating decision maker in deciding how to allocate resources and in assessing performance. Operating segments with similar economic characteristics are aggregated into reportable segments.
The Group aggregates the following operating segments into reportable segments:
| – | Kumba Iron Ore and Iron Ore Brazil are aggregated into Iron Ore. |
| – | Copper Chile, Copper Peru and Sakatti are aggregated into Copper. |
The Group’s Platinum Group Metals, Steelmaking Coal and Nickel businesses were each classified as held for sale during the period and, in the case of the Platinum Group Metals Business, subsequently demerged (see note 9). These businesses represent separate major lines of business and have therefore been presented as discontinued operations and therefore are no longer reportable segments of the Group. Comparatives have been re-presented accordingly.
The expected disposal of the Group’s Nickel operations excludes certain Nickel trading activities that were previously included within the Nickel reportable segment but are outside the perimeter of the transaction. These activities will continue following completion of the sale and their presentation has been reclassified within the ‘Corporate and other’ segment to align with the presentation of the Group’s trading activities for other ancillary products. Comparatives have been restated to reflect the changes.
Shipping revenue related to shipments of the Group’s products is shown within the relevant operating segment. Revenue from other marketing and trading activities from shipping, energy solutions and other ancillary products within the Marketing business is presented within the ‘Corporate and other’ segment, which also includes unallocated corporate costs and exploration costs.
The disclosures in this note include certain Alternative Performance Measures (APMs). For more information on the APMs used by the Group, including definitions, please refer to page 88.
| Anglo American plc Interim Results 2025 | 47 |
| Financial statements and other financial information | Notes to the Condensed financial statements |
Financial performance
4. Financial performance by segment continued
Segment result
| Continuing operations | 6 months ended 30.06.25 | |||||||||||||||||||||||||||
| US$ million | Group revenue |
Underlying EBITDA |
Depreciation and amortisation |
Underlying EBIT |
Net finance costs and income tax expense |
Non- controlling interests |
Underlying earnings |
|||||||||||||||||||||
| Copper | 3,666 | 1,756 | (542 | ) | 1,214 | (576 | ) | (163 | ) | 475 | ||||||||||||||||||
| Iron Ore | 3,224 | 1,410 | (355 | ) | 1,055 | (369 | ) | (271 | ) | 415 | ||||||||||||||||||
| Manganese | 147 | (11 | ) | (41 | ) | (52 | ) | 8 | – | (44 | ) | |||||||||||||||||
| Crop Nutrients | 78 | (2) | (30 | ) | – | (30 | ) | (5 | ) | – | (35 | ) | ||||||||||||||||
| De Beers | 1,952 | (189 | ) | (114 | ) | (303 | ) | 9 | 49 | (245 | ) | |||||||||||||||||
| Corporate and other | 186 | 19 | (78 | ) | (59 | ) | (106 | ) | (14 | ) | (179 | ) | ||||||||||||||||
| 9,253 | 2,955 | (1,130 | ) | 1,825 | (1,039 | )(3) | (399 | ) | 387 | |||||||||||||||||||
| Less: associates and joint ventures | (288 | ) | (32 | ) | 45 | 13 | 10 | – | 23 | |||||||||||||||||||
| Subsidiaries and joint operations | 8,965 | 2,923 | (1,085 | ) | 1,838 | (1,029 | ) | (399 | ) | 410 | ||||||||||||||||||
| Reconciliation: | ||||||||||||||||||||||||||||
| Net income from associates and joint ventures | 8 | 8 | ||||||||||||||||||||||||||
| Special items and remeasurements | (11 | ) | (130 | ) | 59 | |||||||||||||||||||||||
| Revenue | 8,954 | |||||||||||||||||||||||||||
| Profit before net finance costs and tax | 1,716 | |||||||||||||||||||||||||||
| Profit attributable to equity shareholders of the Company from continuing operations | 477 | |||||||||||||||||||||||||||
| Loss attributable to equity shareholders of the Company from discontinued operations | (2,356 | ) | ||||||||||||||||||||||||||
| Loss attributable to equity shareholders of the Company | (1,879 | ) | ||||||||||||||||||||||||||
See next page for footnotes.
| 48 | Anglo American plc Interim Results 2025 |
| Financial statements and other financial information | Notes to the Condensed financial statements |
Financial performance
4. Financial performance by segment continued
| Continuing operations | 6 months ended 30.06.24 (re-presented)(1) | |||||||||||||||||||||||||||
| US$ million | Group revenue |
Underlying EBITDA |
Depreciation and amortisation |
Underlying EBIT |
Net finance costs and income tax expense |
Non- controlling interests |
Underlying earnings |
|||||||||||||||||||||
| Copper | 3,875 | 2,038 | (474 | ) | 1,564 | (655 | ) | (167 | ) | 742 | ||||||||||||||||||
| Iron Ore | 3,296 | 1,413 | (242 | ) | 1,171 | (323 | ) | (274 | ) | 574 | ||||||||||||||||||
| Manganese | 219 | 11 | (46 | ) | (35 | ) | 10 | (2 | ) | (27 | ) | |||||||||||||||||
| Crop Nutrients | 86 | (2) | (22 | ) | – | (22 | ) | – | – | (22 | ) | |||||||||||||||||
| De Beers | 2,247 | 300 | (150 | ) | 150 | (65 | ) | (12 | ) | 73 | ||||||||||||||||||
| Corporate and other | 233 | (68 | ) | (159 | ) | (227 | ) | (267 | ) | 15 | (479 | ) | ||||||||||||||||
| 9,956 | 3,672 | (1,071 | ) | 2,601 | (1,300 | )(3) | (440 | ) | 861 | |||||||||||||||||||
| Less: associates and joint ventures | (377 | ) | (46 | ) | 47 | 1 | 9 | 2 | 12 | |||||||||||||||||||
| Subsidiaries and joint operations | 9,579 | 3,626 | (1,024 | ) | 2,602 | (1,291 | ) | (438 | ) | 873 | ||||||||||||||||||
| Reconciliation: | ||||||||||||||||||||||||||||
| Net income from associates and joint ventures | (12 | ) | (12 | ) | ||||||||||||||||||||||||
| Special items and remeasurements | 5 | (1,826 | ) | (1,929 | ) | |||||||||||||||||||||||
| Revenue | 9,584 | |||||||||||||||||||||||||||
| Profit before net finance costs and tax | 764 | |||||||||||||||||||||||||||
| Loss attributable to equity shareholders of the Company from continuing operations | (1,068 | ) | ||||||||||||||||||||||||||
| Profit attributable to equity shareholders of the Company from discontinued operations | 396 | |||||||||||||||||||||||||||
| Loss attributable to equity shareholders of the Company | (672 | ) | ||||||||||||||||||||||||||
| (1) | Comparative figures are re-presented to show separately results from discontinued operations, see note 22. |
| (2) | Group revenue in respect of Crop Nutrients principally relates to revenue from its associate, The Cibra Group, a fertiliser distributor based in Brazil. |
| (3) | Comprises net finance costs of $293 million (six months ended 30 June 2024: $275 million) and income tax expense of $746 million (six months ended 30 June 2024: $1,025 million). |
The segment results are stated after elimination of inter-segment interest and operating costs and include an allocation of corporate costs.
Further information
Group revenue by product
Segments predominantly derive revenue as follows – Copper: copper concentrate and cathodes; Iron Ore: iron ore; Manganese: manganese ore; De Beers: rough and polished diamonds. Revenue reported within Corporate and other includes net margins from marketing and trading activities in the Group’s energy solutions activities, shipping services provided to third parties and sale of ancillary products.
Other revenue principally relates to molybdenum, silver and gold. The revenue analysis below includes the Group’s share of revenue in equity accounted associates and joint ventures up to the point of being classified as held for sale (see note 21) excluding special items and remeasurements (see note 14).
| Anglo American plc Interim Results 2025 | 49 |
| Financial statements and other financial information | Notes to the Condensed financial statements |
Financial performance
4. Financial performance by segment continued
| Continuing operations | 6 months ended 30.06.25 | 6 months ended 30.06.24 (re-presented)(1) | ||||||||||||||||||||||
| US$ million | Revenue from contracts with customers |
Revenue from other sources |
Group revenue |
Revenue from contracts with customers |
Revenue from other sources |
Group revenue |
||||||||||||||||||
| Copper | 3,197 | 97 | 3,294 | 3,341 | 154 | 3,495 | ||||||||||||||||||
| Iron ore | 2,816 | (17 | ) | 2,799 | 3,025 | (291 | ) | 2,734 | ||||||||||||||||
| Diamonds | 1,938 | 14 | 1,952 | 2,224 | 23 | 2,247 | ||||||||||||||||||
| Thermal coal(2) | (7 | ) | 7 | – | (1 | ) | 19 | 18 | ||||||||||||||||
| Manganese ore | – | 147 | 147 | – | 219 | 219 | ||||||||||||||||||
| Shipping | 566 | – | 566 | 749 | – | 749 | ||||||||||||||||||
| Other | 341 | 154 | 495 | 354 | 140 | 494 | ||||||||||||||||||
| 8,851 | 402 | 9,253 | 9,692 | 264 | 9,956 | |||||||||||||||||||
| Reconciliation: | ||||||||||||||||||||||||
| Less: Revenue from associates and joint ventures | – | (288 | ) | (288 | ) | – | (377 | ) | (377 | ) | ||||||||||||||
| Special items and remeasurements | – | (11 | ) | (11 | ) | – | 5 | 5 | ||||||||||||||||
| Revenue | 8,851 | 103 | 8,954 | 9,692 | (108 | ) | 9,584 | |||||||||||||||||
| (1) | Comparative figures are re-presented to show separately results from discontinued operations, see note 22. |
| (2) | For the period ended 30 June 2025, thermal coal represents less than 1% of Group revenue and comprises sales volumes of 3.3 Mt (six months ended 30 June 2024: 8.1 Mt). These arise from transitional marketing support provided to Thungela Resources, purchases from other third parties included within the Marketing business’ energy solutions activities, and secondary product sales from the Steelmaking Coal business. |
Revenue from other sources for subsidiaries and joint operations gain of $103 million (six months end 30 June 2024: loss of $108 million) comprises net fair value losses relating to derivatives of $74 million (six months ended 30 June 2024: net fair value losses of $263 million), net fair value gains relating to provisionally priced contracts of $188 million and revenue remeasurements losses of $11 million (six months ended 30 June 2024: gain of $150 million and gain of $5 million respectively). Derivative net losses include both financial derivatives and the net margin arising on contracts for the physical sale and purchase of third-party material (third-party sales) where these contracts are accounted for as derivatives prior to settlement and are entered into to generate a trading margin.
Group revenue by destination
The Group’s geographical analysis of segment revenue is allocated based on the customer’s port of destination. Where the port of destination is not known, revenue is allocated based on the customer’s country of domicile.
| 6 months ended 30.06.24 | ||||||||||||||||
| Continuing operations | 6 months ended 30.06.25 | (re-presented)(1) | ||||||||||||||
| US$ million | % | US$ million | % | |||||||||||||
| China | 4,140 | 45 | % | 4,565 | 46 | % | ||||||||||
| India | 430 | 5 | % | 542 | 6 | % | ||||||||||
| Japan | 594 | 6 | % | 511 | 5 | % | ||||||||||
| Other Asia | 1,649 | 17 | % | 1,621 | 16 | % | ||||||||||
| South Africa | 61 | 1 | % | 95 | 1 | % | ||||||||||
| Other Africa | 622 | 7 | % | 757 | 8 | % | ||||||||||
| Brazil | 216 | 2 | % | 145 | 1 | % | ||||||||||
| Chile | 448 | 5 | % | 511 | 5 | % | ||||||||||
| Other South America | 49 | 1 | % | 78 | 1 | % | ||||||||||
| North America | 210 | 2 | % | 186 | 2 | % | ||||||||||
| Australia | – | – | 11 | – | ||||||||||||
| United Kingdom(2) | (121 | ) | (1 | )% | (75 | ) | (1 | )% | ||||||||
| Other Europe | 955 | 10 | % | 1,009 | 10 | % | ||||||||||
| 9,253 | 100 | % | 9,956 | 100 | % | |||||||||||
| (1) | Comparative figures are re-presented to show separately results from discontinued operations, see note 22. |
| (2) | United Kingdom is Anglo American plc’s country of domicile. United Kingdom revenue principally relates to losses on derivative contracts recognised in Revenue from other sources. |
| 50 | Anglo American plc Interim Results 2025 |
| Financial statements and other financial information | Notes to the Condensed financial statements |
Financial performance
5. Earnings per share
Overview
The disclosures in this note include certain Alternative Performance Measures (APMs). For more information on the APMs used by the Group, including definitions, please refer to page 88.
| US$ | 6 months ended 30.06.25 |
6 months ended 30.06.24 (re-presented)(1) |
||||||
| (Loss)/earnings per share | ||||||||
| Basic from continuing operations | 0.40 | (0.88 | ) | |||||
| Basic from discontinued operations(2) | (1.98 | ) | 0.33 | |||||
| Basic | (1.58 | ) | (0.55 | ) | ||||
| Diluted from continuing operations | 0.40 | (0.88 | ) | |||||
| Diluted from discontinued operations(2) | (1.98 | ) | 0.33 | |||||
| Diluted | (1.58 | ) | (0.55 | ) | ||||
| Underlying earnings per share | ||||||||
| Basic from continuing operations | 0.32 | 0.71 | ||||||
| Basic from discontinued operations(3) | (0.17 | ) | 0.35 | |||||
| Basic | 0.15 | 1.06 | ||||||
| Diluted from continuing operations | 0.32 | 0.71 | ||||||
| Diluted from discontinued operations(3) | (0.17 | ) | 0.35 | |||||
| Diluted | 0.15 | 1.06 | ||||||
| Headline earnings per share | ||||||||
| Basic | 0.23 | 0.73 | ||||||
| Diluted | 0.23 | 0.73 | ||||||
| (1) | Comparative figures are re-presented to show separately results from discontinued operations, see note 22. |
| (2) | Profit from discontinued operations attributable to equity shareholders of the Company was used for the calculation of basic and diluted EPS from discontinued operations. |
| (3) | Underlying earnings from discontinued operations was used for the calculation of basic and diluted EPS from discontinued operations. |
Further information
The calculation of basic and diluted earnings per share is based on the following data:
| (Loss)/profit attributable to equity shareholders of the Company |
Underlying earnings | Headline earnings | ||||||||||||||||||||||
| 6 months ended 30.06.25 |
6 months ended 30.06.24 (re-presented)(1) |
6 months ended 30.06.25 |
6 months ended 30.06.24 (re-presented)(1) |
6 months ended 30.06.25 |
6 months ended 30.06.24 (re-presented)(1) |
|||||||||||||||||||
| Earnings (US$ million) | ||||||||||||||||||||||||
| Basic and diluted earnings from continuing operations | 477 | (1,068 | ) | 387 | 861 | n/a | n/a | |||||||||||||||||
| Basic and diluted earnings from discontinued operations | (2,356 | ) | 396 | (212 | ) | 429 | n/a | n/a | ||||||||||||||||
| Basic and diluted earnings | (1,879 | ) | (672 | ) | 175 | 1,290 | 274 | 887 | ||||||||||||||||
| Weighted average number of shares (million) | ||||||||||||||||||||||||
| Basic number of ordinary shares outstanding | 1,192 | 1,212 | 1,192 | 1,212 | 1,192 | 1,212 | ||||||||||||||||||
| Diluted number of ordinary shares outstanding | 1,192 | 1,212 | 1,192 | 1,212 | 1,192 | 1,212 | ||||||||||||||||||
| (1) | Comparative figures are re-presented to show separately results from discontinued operations, see note 22. |
| Anglo American plc Interim Results 2025 | 51 |
| Financial statements and other financial information | Notes to the Condensed financial statements |
Financial performance
5. Earnings per share continued
The weighted average number of ordinary shares in issue is the weighted number of shares in issue throughout the period, and excludes shares held by employee benefit trusts and Anglo American plc shares held by Group companies.
In conjunction with the demerger of Valterra Platinum via a distribution in specie (see note 23), the Group completed a share consolidation to increase the value of each remaining share to provide approximate comparability in the Anglo American share price. The effect of the consolidation resulted in every 109 existing Anglo American Ordinary shares being exchanged for 96 new Anglo American ordinary shares.
Since the transaction is linked to the outflow of resources and is therefore akin to a share repurchase at fair value, the weighted average number of shares used in the EPS calculation has been adjusted prospectively from the effective date for the demerger and declaration of the distribution in specie.
In the six months ended 30 June 2025 and 30 June 2024, basic loss per share is equal to diluted loss per share as all potential ordinary shares are anti-dilutive.
Headline earnings, a Johannesburg Stock Exchange defined performance measure, is reconciled from profit attributable to equity shareholders of the Company as follows, and the reconciling items below are shown gross and net of tax and non-controlling interests:
| 6 months ended 30.06.25 | 6 months ended 30.06.24 | |||||||||||||||
| US$ million | Gross | Net | Gross | Net | ||||||||||||
| Loss attributable to equity shareholders of the Company | (1,879 | ) | (672 | ) | ||||||||||||
| Special items and remeasurements | 2,054 | 1,962 | ||||||||||||||
| Underlying earnings for the financial period | 175 | 1,290 | ||||||||||||||
| Revenue remeasurements | (11 | ) | (6 | ) | 5 | 36 | ||||||||||
| Operating special items – restructuring | (83 | ) | (74 | ) | (304 | ) | (271 | ) | ||||||||
| Other operating special items | – | 53 | – | – | ||||||||||||
| Operating remeasurements | (3 | ) | (9 | ) | (34 | ) | (30 | ) | ||||||||
| Non-operating special items – Amapa labour provision | (4 | ) | (4 | ) | – | – | ||||||||||
| Financing special items and remeasurements | – | – | (4 | ) | (4 | ) | ||||||||||
| Tax special items and remeasurements | – | 133 | – | (149 | ) | |||||||||||
| Other reconciling items | 11 | 6 | 12 | 15 | ||||||||||||
| Headline earnings for the financial period | 274 | 887 | ||||||||||||||
Other reconciling items principally comprise of individual asset impairments in De Beers and write-off of assets in Platinum Group Metals (six months ended 30 June 2024: principally comprise adjustments relating to former operations, disposals of property, plant and equipment and individual asset impairments in De Beers).
| 52 | Anglo American plc Interim Results 2025 |
| Financial statements and other financial information | Notes to the Condensed financial statements |
Financial performance
6. Net finance costs
| Continuing operations | 6 months ended | |||||||
| 6 months ended | 30.06.24 | |||||||
| US$ million | 30.06.25 | (re-presented)(1) | ||||||
| Investment income | ||||||||
| Interest income from cash and cash equivalents | 138 | 127 | ||||||
| Interest income from associates and joint ventures | 1 | 6 | ||||||
| Net interest income on defined benefit arrangements | 12 | 12 | ||||||
| Other interest income | 28 | 30 | ||||||
| Investment income | 179 | 175 | ||||||
| Interest expense | ||||||||
| Interest and other finance expense | (587 | ) | (602 | ) | ||||
| Lease liability interest expense | (32 | ) | (36 | ) | ||||
| Net interest cost on defined benefit arrangements | (20 | ) | (21 | ) | ||||
| Unwinding of discount relating to provisions and other liabilities | (30 | ) | (26 | ) | ||||
| (669 | ) | (685 | ) | |||||
| Less: Interest expense capitalised | 241 | 237 | ||||||
| Interest expense | (428 | ) | (448 | ) | ||||
| Other net financing (losses)/gains | ||||||||
| Net foreign exchange (losses)/gains | (54 | ) | 26 | |||||
| Other net fair value gains/(losses) | 35 | (10 | ) | |||||
| Other net financing (losses)/gains before special items and remeasurements | (19 | ) | 16 | |||||
| Financing remeasurements | 8 | (3 | ) | |||||
| Other net financing (losses)/gains | (11 | ) | 13 | |||||
| Net finance costs | (260 | ) | (260 | ) | ||||
| (1) | Comparative figures are re-presented to show separately results from discontinued operations, see note 22. |
| Anglo American plc Interim Results 2025 | 53 |
| Financial statements and other financial information | Notes to the Condensed financial statements |
Financial performance
7. Income tax expense
Overview
| 6 months ended 30.06.25 |
6 months ended 30.06.24 (re-presented)(1) |
|||||||||||||||
| Profit/(loss) before tax US$ million |
Tax (charge)/credit US$ million |
Effective tax rate |
Effective tax rate |
|||||||||||||
| Calculation of effective tax rate (statutory basis) | 1,456 | (551 | ) | 37.8 | % | |||||||||||
| Adjusted for: | ||||||||||||||||
| Special items and remeasurements | 91 | (210 | ) | |||||||||||||
| Associates’ and joint ventures’ tax and non-controlling interests | (15 | ) | 15 | |||||||||||||
| Calculation of effective tax rate (underlying) | 1,532 | (746 | ) | 48.7 | % | 44.1 | % | |||||||||
| (1) | Comparative figures are re-presented to show separately results from discontinued operations, see note 22. |
The underlying effective tax rate for continuing operations was 48.7% for the six months ended 30 June 2025. This is higher than the underlying effective tax rate for continuing operations (re-presented) of 44.1% for the six months ended 30 June 2024. The underlying effective tax rate in 2025 was mainly impacted by the relative levels of profits arising in the Group’s operating jurisdictions.
In accordance with IAS 34 Interim Financial Reporting, the Group’s interim tax charge has been calculated by applying on a jurisdictional basis, the forecast annual effective tax rate to the pre-tax income for the six month period and adjusting for certain discrete items which occurred in the interim period.
Uncertainty and changes to tax regimes can materialise in any country in which we operate and the Group has no control over political acts, actions of regulators, or changes in local tax regimes. Global and local economic and social conditions can have a significant influence on governments’ policy decisions and these have the potential to change tax and other political risks faced by the Group.
In line with our published Tax Strategy, the Group actively monitors tax developments at a national level, as well as global themes and international policy trends, on a continuous basis, and has active engagement strategies with governments, regulators and other stakeholders within the countries in which the Group operates, or plans to operate, as well as at an international level. This includes global tax reforms such as those being agreed through the OECD’s Digitalisation of the Economy Project which seeks to reallocate taxing rights for large profitable groups (‘Pillar 1’) and has already effectively implemented a minimum effective tax rate of 15% on profits of large multinational groups in each country in which they operate (‘Pillar 2’).
The Group continues to review proposals and announced legislation to evaluate the potential impact and is engaging with policymakers in efforts to ensure that guidance and any required additional legislation is aligned to the stated policy objectives and that the Group is well placed to comply. The Pillar 2 rules applied to the Group from 1 January 2024 onwards, and the Group has put in place procedures to ensure compliance.
The disclosures in this note include certain Alternative Performance Measures (APMs). For more information on the APMs used by the Group, including definitions, please refer to page 88.
| 54 | Anglo American plc Interim Results 2025 |
| Financial statements and other financial information | Notes to the Condensed financial statements |
Financial performance
7. Income tax expense continued
| a) | Analysis of charge for the period |
| Continuing operations | 6 months ended | |||||||
| 6 months ended | 30.06.24 | |||||||
| US$ million | 30.06.25 | (re-presented)(1) | ||||||
| United Kingdom tax | 40 | 73 | ||||||
| South Africa tax | 201 | 195 | ||||||
| Chile tax | 59 | 328 | ||||||
| Peru tax | 125 | 110 | ||||||
| Brazil tax | 88 | 49 | ||||||
| Other overseas tax | 39 | 55 | ||||||
| Prior year adjustments | (24 | ) | 25 | |||||
| Current tax | 528 | 835 | ||||||
| Deferred tax | 233 | 199 | ||||||
| Income tax expense before special items and remeasurements | 761 | 1,034 | ||||||
| Special items and remeasurements tax | (210 | ) | 147 | |||||
| Income tax expense | 551 | 1,181 | ||||||
| (1) | Comparative figures are re-presented to show separately results from discontinued operations, see note 22. |
Current tax includes royalties which meet the definition of income tax and are in addition to royalties recorded in operating costs.
The Group has applied the mandatory temporary exception under IAS 12 Income Taxes in relation to the accounting for deferred taxes related to Pillar 2 income taxes.
| b) | Factors affecting tax charge for the period |
The reconciling items between the United Kingdom corporation tax rate and the income tax expense are:
| US$ million | 6 months ended 30.06.25 |
6 months ended 30.06.24 (re-presented)(1) |
||||||
| Profit before tax | 1,456 | 504 | ||||||
| Less: Net (income)/losses from associates and joint ventures | (8 | ) | 12 | |||||
| Profit before tax (excluding associates and joint ventures) | 1,448 | 516 | ||||||
| Tax calculated at United Kingdom corporation tax rate of 25% (2024: 25%) | 362 | 129 | ||||||
| Tax effects of: | ||||||||
| Items non-deductible/(taxable) for tax purposes | 51 | 21 | ||||||
| Temporary difference adjustments | 152 | 214 | ||||||
| Special items and remeasurements | ||||||||
| Functional currency remeasurements (note 11) | (205 | ) | 161 | |||||
| Other special items and other remeasurements | 26 | 443 | ||||||
| Other adjustments | ||||||||
| Withholding taxes | 50 | 68 | ||||||
| Effect of differences between local and United Kingdom tax rates | 161 | 194 | ||||||
| Prior year adjustments | (23 | ) | 31 | |||||
| Other adjustments | (23 | ) | (80 | ) | ||||
| Income tax expense | 551 | 1,181 | ||||||
| (1) | Comparative figures are re-presented to show separately results from discontinued operations, see note 22. |
The special items and remeasurements reconciling credit of $179 million (six months ended 30 June 2024: charge of $604 million) relates to the net tax impact of total special items and remeasurements before tax calculated at the United Kingdom corporation tax rate, less the associated tax recorded against these items and tax special items and remeasurements.
Associates’ and joint ventures’ tax included within net income from associates and joint ventures for the six months ended 30 June 2025 is a credit of $16 million (six months ended 30 June 2024: $9 million). Excluding special items and remeasurements, this becomes a credit of $15 million (six months ended 30 June 2024: $9 million).
| Anglo American plc Interim Results 2025 | 55 |
| Financial statements and other financial information | Notes to the Condensed financial statements |
Financial performance
8. Dividends
| 6 months ended 30.06.25 |
6 months ended 30.06.24 |
|||||||
| Proposed interim ordinary dividend per share (US cents) | 7 | 42 | ||||||
| Proposed interim ordinary dividend (US$ million) | 75 | 511 | ||||||
As at the dividend record date, there are forecasted to be 1,074,142,645 (six months ended 30 June 2024: 1,217,827,857) dividend bearing shares in issue.
| 56 | Anglo American plc Interim Results 2025 |
| Financial statements and other financial information | Notes to the Condensed financial statements |
Significant items
Special items and remeasurements from continuing operations are a net credit of $0.1 billion. Special items and remeasurements of $2.1 billion relating to the Platinum Group Metals, Steelmaking Coal and Nickel businesses are presented within discontinued operations.
9. Significant accounting matters
The significant judgements and key sources of estimation uncertainty that affect the results for the six months ended 30 June 2025 relate to the assessment of impairment and impairment reversal indicators, the estimation of the recoverable amount for impairment testing and the classification of disposal groups as held for sale and discontinued operations. Further information about these matters is provided below and in note 7 of the Group’s Integrated Annual Report for the year ended 31 December 2024.
Significant accounting judgement – identification of impairment and impairment reversal indicators
As at 30 June 2025, no impairment or impairment reversal triggers have been identified for the following previously impaired assets: Natural Diamonds (De Beers), Minas-Rio (Iron Ore) or Woodsmith (Crop Nutrients). Assets which have previously been impaired are generally carried on the balance sheet at a value close to their recoverable amount at the last assessment. Therefore, in principle it is reasonably possible that an impairment or impairment reversal trigger, and hence a potential material adjustment to the carrying value, may arise within the next twelve months. The key areas of estimation uncertainty in respect of these assets are disclosed in the Group’s Integrated Annual Report for the year ended 31 December 2024.
Significant accounting judgement – classification of disposal groups as held for sale and discontinued operations
The Group is currently transforming its portfolio to focus on copper, premium iron ore and crop nutrients. Significant accounting judgements in respect of the transformation have considered the following developments in the period:
Platinum Group Metals
The Group’s shareholders approved the demerger of the Platinum Group Metals business on 30 April 2025, to be executed via a distribution in specie. The business was therefore recorded as held for distribution from that date. The demerger was completed on 31 May 2025 when each Anglo American shareholder received Valterra Platinum shares as settlement for the dividend declared by Anglo American plc.
The Group has a residual 19.9% interest in Valterra Platinum which is presented as a financial asset investment at fair value through other comprehensive income. The Group will manage this shareholding position responsibly over time to effect a full separation. Further information about the demerger is presented in note 23.
In conjunction with the demerger, the Group conducted a share consolidation with the intention of maintaining broad comparability between Anglo American’s share price before and after the demerger. Each shareholder received 96 new shares for every 109 existing Anglo American shares.
Steelmaking Coal
The Moranbah-Grosvenor (MG) joint operations were classified as held for sale in 2024 following the signing of the sales agreement with Peabody Energy as regulatory approvals and conditions precedent to the sale were not considered substantive. On 15 March 2025, the previously announced disposal of the remaining Steelmaking Coal (SMC) business became highly probable following the waiver of certain pre-emptive rights that could have caused potential changes to the timing and structure of the sale. Changes to the legal structure of the business that can only occur following the MG completion are still required, but following the waiver of the pre-emptive rights, these are considered usual and customary in nature. These assets were therefore classified as held for sale from that date.
Per the Group’s announcement on 5 May 2025, the Group has noted the statements issued by Peabody, and continues to believe that the event that occurred on 31 March 2025 at the Moranbah North steelmaking coal mine in Australia does not constitute a Material Adverse Change (MAC) in accordance with the definitive agreements signed with Peabody in November 2024, such belief reinforced by the substantial regulatory progress made towards a restart of the operation. We continue to work constructively with Peabody towards completing the transaction and we are fulfilling our responsibilities under the sale agreements.
| Anglo American plc Interim Results 2025 | 57 |
| Financial statements and other financial information | Notes to the Condensed financial statements |
Significant items
9. Significant accounting matters continued
The Group’s interest in the Jellinbah associate was presented as held for sale as at 31 December 2024 and the sale completed on 29 January 2025.
Nickel
On 18 February 2025, a sale and purchase agreement was signed for the sale of the Group’s Nickel business, comprising its two ferronickel operations in Brazil – Barro Alto and Codemin, and its two high quality greenfield growth projects – Jacaré and Morro Sem Boné. The conditions precedent, including regulatory approvals, are not considered substantive and therefore the business met the criteria to be classified as held for sale following the signing of the sale agreement.
De Beers
While management remain committed to a divestment or demerger of the business, there remains uncertainty around the terms, legal structure and regulatory approvals for any such transaction. As a result the business did not meet the criteria to be classified as held for sale as at 30 June 2025.
The Group’s Platinum Group Metals, Steelmaking Coal and Nickel businesses represent separate major lines of business and have therefore been presented as discontinued operations.
| 58 | Anglo American plc Interim Results 2025 |
| Financial statements and other financial information | Notes to the Condensed financial statements |
Significant items
| 10. | Impairment |
Overview
No significant impairments have been recorded for the six months ended 30 June 2025 in respect of continuing operations. Impairments recorded in respect of discontinued operations are detailed in note 22.
2024
| Continuing operations | 6 months ended 30.06.24 | |||||||
| US$ million | Before tax | Net | ||||||
| Impairment | ||||||||
| Woodsmith (Crop Nutrients) | (1,554 | ) | (1,554 | ) | ||||
| Impairment recognised as special items | (1,554 | ) | (1,554 | ) | ||||
| 6 months ended 30.06.24 (re-presented)(1) |
||||
| US$ million | Impairment | |||
| Allocated as: | ||||
| Intangible assets | (39 | ) | ||
| Property, plant and equipment | (1,523 | ) | ||
| Total | (1,562 | ) | ||
| Recognised before tax: | ||||
| As special items | (1,554 | ) | ||
| Within operating costs before special items | (8 | ) | ||
| Total | (1,562 | ) | ||
| (1) | Comparative figures are re-presented to show separately results from discontinued operations, see note 22. |
Impairment recorded
Woodsmith (Crop Nutrients)
At 30 June 2024, following a slowdown in the development of the project in order to support balance sheet deleveraging within the context of broader portfolio simplification, an impairment of $1.6 billion ($1.6 billion after tax and non-controlling interest) was recorded against primarily property, plant and equipment to bring the carrying value in line with the recoverable amount of $0.9 billion, calculated using a discount rate of 9.58%.
| Anglo American plc Interim Results 2025 | 59 |
| Financial statements and other financial information | Notes to the Condensed financial statements |
Significant items
| 11. | Special items and remeasurements |
Overview
| Continuing operations | 6 months ended 30.06.25 | 6
months ended 30.06.24 (re-presented)(1) |
||||||||||||||||||
| US$ million | Before tax | Tax | Non-controlling
interests |
Net | Net | |||||||||||||||
| Revenue remeasurements | (11 | ) | 2 | 3 | (6 | ) | 36 | |||||||||||||
| Impairment | – | – | – | – | (1,554 | ) | ||||||||||||||
| Impairment reversal | 5 | – | – | 5 | – | |||||||||||||||
| Restructuring costs | (83 | ) | 3 | 6 | (74 | ) | (243 | ) | ||||||||||||
| Other operating special items | (7 | ) | 11 | 2 | 6 | – | ||||||||||||||
| Operating remeasurements | (5 | ) | (1 | ) | (3 | ) | (9 | ) | (30 | ) | ||||||||||
| Operating special items and remeasurements | (90 | ) | 13 | 5 | (72 | ) | (1,827 | ) | ||||||||||||
| Disposals of businesses and investments | (24 | ) | – | (1 | ) | (25 | ) | – | ||||||||||||
| Adjustments relating to business combinations | – | – | – | – | (12 | ) | ||||||||||||||
| Adjustments relating to former operations | (5 | ) | – | – | (5 | ) | 25 | |||||||||||||
| Non-operating special items | (29 | ) | – | (1 | ) | (30 | ) | 13 | ||||||||||||
| Financing special items and remeasurements | 8 | – | – | 8 | (3 | ) | ||||||||||||||
| Tax special items and remeasurements | – | 195 | (36 | ) | 159 | (148 | ) | |||||||||||||
| Total before joint ventures’ special items and remeasurements | (122 | ) | 210 | (29 | ) | 59 | (1,929 | ) | ||||||||||||
| Joint ventures’ special items and remeasurements | 31 | – | ||||||||||||||||||
| Total | 90 | (1,929 | ) | |||||||||||||||||
| (1) | Comparative figures are re-presented to show separately results from discontinued operations, see note 22. |
Special items and remeasurements
Special items are those items of financial performance that, due to their size and nature, the Group believes should be separately disclosed on the face of the income statement. Remeasurements are items that are excluded from underlying earnings in order to reverse timing differences in the recognition of gains and losses in the income statement in relation to transactions that, whilst economically linked, are subject to different accounting measurement or recognition criteria. Refer to note 9 of the Group’s Integrated Annual Report for further details on the classification of special items.
Special items and remeasurements, along with related tax and non-controlling interests, are excluded from underlying earnings, which is an Alternative Performance Measure (APM). For more information on the APMs used by the Group, including definitions, please refer to page 88.
Revenue remeasurements
The loss of $11 million ($6 million after tax and non-controlling interests) (six months ended 30 June 2024: gain of $36 million) relates to remeasurements on derivatives presented in revenue from other sources. For further details see note 4.
Operating special items
Impairments
There were no impairments related to continuing operations recognised for the six months ended 30 June 2025.
2024
The impairment of $1,554 million ($1,554 million after tax) recognised for the six months ended 30 June 2024 relates to Woodsmith (Crop Nutrients) following the announcement of a slowdown in the development of the project.
| 60 | Anglo American plc Interim Results 2025 |
| Financial statements and other financial information | Notes to the Condensed financial statements |
Significant items
| 11. | Special items and remeasurements continued |
Impairment reversals
Impairment reversals of $5 million ($5 million after tax and non-controlling interests) recognised for the six months ended 30 June 2025 relates to an impairment reversal recognised on the Corporate Johannesburg office which was disposed of in February 2025.
2024
There were no impairment reversals recognised for the six months ended 30 June 2024.
Restructuring costs
Restructuring costs associated with the Group’s strategic change programme of $83 million ($74 million after tax and non-controlling interests) have been recognised for the six months ended 30 June 2025 (six months ended 30 June 2024: $243 million).
Operating remeasurements
Operating remeasurements reflect a loss of $5 million ($9 million after tax and non-controlling interests) (six months ended 30 June 2024: $30 million) which principally relates to a $11 million (six months ended 30 June 2024: $29 million) depreciation and amortisation charge arising due to the fair value uplift on the Group’s pre-existing 45% shareholding in De Beers, which was required on acquisition of a controlling stake in 2012.
Non-operating special items
Disposal of businesses and investments
The $24 million loss ($25 million after tax and non-controlling interests) relates to transaction costs associated with planned divestments across the Group, which do not qualify as discontinued operations.
2024
There were no disposals in the six months ended 30 June 2024.
Adjustments relating to former operations
The net loss of $5 million ($5 million after tax and non-controlling interests) (six months ended 30 June 2024: gain of $25 million) principally relates to foreign exchange movements on balances related to former operations.
Financing special items and remeasurements
Financing special items and remeasurements comprise a net fair value gain of $8 million (six months ended 30 June 2024: $3 million loss) consisting of fair value adjustments in relation to cross currency and interest rate swap derivatives and the related bonds of $39 million, offset by a loss on bond buy backs completed in 2025 of $31 million.
Tax associated with special items and remeasurements
Tax associated with special items and remeasurements includes a tax remeasurement credit of $205 million (six months ended 30 June 2024: charge of $161 million) principally arising on Brazilian deferred tax, a tax on special items and remeasurements credit of $15 million (six months ended 30 June 2024: credit of $8 million), and a tax special items charge of $10 million (six months ended 30 June 2024: credit of $6 million).
Of the total tax credit of $210 million (six months ended 30 June 2024: charge of $147 million), there is a net current tax credit of $4 million (six months ended 30 June 2024: nil) and a net deferred tax credit of $206 million (six months ended 30 June 2024: charge of $147 million).
| Anglo American plc Interim Results 2025 | 61 |
| Financial statements and other financial information | Notes to the Condensed financial statements |
Capital base
We have a value-focused approach to capital allocation with clear prioritisation: maintain asset integrity; pay dividends to our shareholders while ensuring a strong balance sheet. Discretionary capital is then allocated based on a balanced approach.
Value-disciplined capital allocation throughout the cycle is critical to protecting and enhancing our shareholders’ capital, given the long term and capital intensive nature of our business.
The Group uses attributable return on capital employed (ROCE) to monitor how efficiently assets are generating profit on invested capital for the equity shareholders of the Company. Attributable ROCE is an Alternative Performance Measure (APM). For more information on the APMs used by the Group, including definitions, please refer to page 88.
| Continuing operations | Attributable ROCE % | |||||||
| 6
months ended 30.06.25 |
6
months ended 30.06.24 (re-presented)(1) |
|||||||
| Copper | 18 | 25 | ||||||
| Iron Ore | 18 | 21 | ||||||
| Manganese | (50 | ) | (53 | ) | ||||
| Crop Nutrients | n/a | n/a | ||||||
| De Beers | (17 | ) | (4 | ) | ||||
| Corporate and other | n/a | n/a | ||||||
| 9 | 12 | |||||||
| (1) | Comparative figures are re-presented to show separately results from discontinued operations, see note 22. |
Attributable ROCE from continuing operations decreased to 9% in the six months ended 30 June 2025 (six months ended 30 June 2024 re-presented: 12%). Average attributable capital employed decreased to $22.8 billion (six months ended 30 June 2024 re-presented: $25.6 billion) primarily due to the impacts of lower EBIT and impairment recorded in De Beers at 31 December 2024.
| 12. | Capital by segment |
The disclosures in this note include certain Alternative Performance Measures (APMs). For more information on the APMs used by the Group, including definitions, please refer to page 88.
The Group’s Platinum Group Metals, Steelmaking Coal and Nickel businesses were each classified as held for sale during the period and, in the case of the Platinum Group Metals business, subsequently demerged (see note 9). As a result the Platinum Group Metals, Steelmaking Coal and Nickel reportable segments have been classified as discontinued operations. Capital employed excludes amounts in relation to discontinued operations and comparatives have been re-presented accordingly.
Capital employed by segment
Capital employed is the principal measure of segment assets and liabilities reported to the Executive Leadership Team. Capital employed is defined as net assets excluding net debt, variable vessel lease contracts that are priced with reference to a freight index, the debit valuation adjustment attributable to derivatives hedging net debt and financial asset investments.
| 62 | Anglo American plc Interim Results 2025 |
| Financial statements and other financial information | Notes to the Condensed financial statements |
Capital base
| 12. | Capital by segment continued |
| Capital employed | ||||||||
| US$ million | 30.06.25 | 31.12.24 (re-presented)(1) |
||||||
| Copper | 14,088 | 13,877 | ||||||
| Iron Ore | 10,068 | 9,644 | ||||||
| Manganese | 214 | 210 | ||||||
| Crop Nutrients | 1,291 | 947 | ||||||
| De Beers | 4,819 | 4,909 | ||||||
| Corporate and other | 656 | 438 | ||||||
| Capital employed | 31,136 | 30,025 | ||||||
| Reconciliation to the Consolidated balance sheet: | ||||||||
| Net debt | (10,764 | ) | (10,623 | ) | ||||
| Capital employed related to disposal groups held for sale | 2,869 | 8,960 | ||||||
| Variable vessel leases excluded from net debt (see note 15) | (257 | ) | (179 | ) | ||||
| Debit valuation adjustment attributable to derivatives hedging net debt | 2 | 22 | ||||||
| Financial asset investments | 2,592 | 328 | ||||||
| Net assets | 25,578 | 28,533 | ||||||
| (1) | Comparative figures are re-presented to show separately results from discontinued operations, see note 22. |
| Anglo American plc Interim Results 2025 | 63 |
| Financial statements and other financial information | Notes to the Condensed financial statements |
Capital base
| 13. | Capital expenditure |
The disclosures in this note include certain Alternative Performance Measures (APMs). For more information on the APMs used by the Group, including definitions, please refer to page 88. The Group’s Platinum Group Metals, Steelmaking Coal and Nickel businesses were each classified as held for sale during the period and, in the case of the Platinum Group Metals Business, subsequently demerged (see note 9). As a result the Nickel, Steelmaking Coal and Platinum Group Metals’ reportable segments have been classified as discontinued operations and are therefore excluded from capital expenditure.
Capital expenditure by segment
| Continuing operations | 6 months ended | |||||||
| US$ million | 6 months ended 30.06.25 |
30.06.24 (re-presented)(1) |
||||||
| Copper | 712 | 855 | ||||||
| Iron Ore | 520 | 495 | ||||||
| Crop Nutrients | 184 | 500 | ||||||
| De Beers | 172 | 264 | ||||||
| Corporate and other | (2 | ) | 15 | |||||
| Capital expenditure | 1,586 | 2,129 | ||||||
| Reconciliation to Consolidated cash flow statement: | ||||||||
| Cash flows used in derivatives related to capital expenditure | 1 | – | ||||||
| Proceeds from disposal of property, plant and equipment | 8 | 5 | ||||||
| Direct funding for capital expenditure received from non-controlling interests | – | 26 | ||||||
| Expenditure on property, plant and equipment for continuing operations | 1,595 | 2,160 | ||||||
| (1) | Comparative figures are re-presented to show separately results from discontinued operations, see note 22. |
Capital expenditure by category
| Continuing operations | 6 months ended | |||||||
| US$ million | 6 months ended 30.06.25 |
30.06.24 (re-presented)(1) |
||||||
| Growth projects | 288 | 635 | ||||||
| Life-extension projects | 101 | 173 | ||||||
| Stay-in-business | 913 | 1,068 | ||||||
| Development and stripping | 292 | 258 | ||||||
| Proceeds from disposal of property, plant and equipment | (8 | ) | (5 | ) | ||||
| 1,586 | 2,129 | |||||||
| (1) | Comparative figures are re-presented to show separately results from discontinued operations, see note 22. |
Growth projects and life-extension projects capital expenditure includes the cash flows from derivatives related to capital expenditure and is net of direct funding for capital expenditure received from non-controlling interests.
As of 30 June 2025, the Group’s capital commitments increased by $462 million in relation to the extension of mining licences based on the updated agreements between De Beers Group and the Government of the Republic of Botswana.
| 64 | Anglo American plc Interim Results 2025 |
| Financial statements and other financial information | Notes to the Condensed financial statements |
Capital base
| 14. | Investments in associates and joint ventures |
Overview
Investments in associates and joint ventures represent businesses the Group does not control, but instead exercises significant influence or joint control. These include (within the respective businesses) the joint ventures Ferroport (port operations in the Iron Ore segment) and Samancor (manganese mining in the Manganese segment). The Group’s other investments in associates and joint ventures arise primarily in the Crop Nutrients segment.
The disclosures in this note include certain Alternative Performance Measures (APMs). For more information on the APMs used by the Group, including definitions, please refer to page 88.
Income statement
The Group’s share of the results of the associates and joint ventures is as follows:
| Continuing operations | 6 months ended | |||||||
| US$ million | 6 months ended 30.06.25 |
30.06.24 (re-presented)(1) |
||||||
| Group revenue | 288 | 377 | ||||||
| Operating costs (before special items and remeasurements) | (301 | ) | (378 | ) | ||||
| Associates’ and joint ventures’ underlying EBIT | (13 | ) | (1 | ) | ||||
| Net finance costs | (25 | ) | (18 | ) | ||||
| Income tax credit | 15 | 9 | ||||||
| Non-controlling interests | – | (2 | ) | |||||
| Net expense from associates and joint ventures (before special items and remeasurements) | (23 | ) | (12 | ) | ||||
| Special items and remeasurements | 30 | – | ||||||
| Special items and remeasurements tax | 1 | – | ||||||
| Net income/(expense) from associates and joint ventures | 8 | (12 | ) | |||||
| (1) | Comparative figures are re-presented to show separately results from discontinued operations, see note 22. |
Further information
The Group’s share of the results of the associates and joint ventures is as follows:
| 6 months ended 30.06.25 | ||||||||||||||||||||
| US$ million | Group Revenue | Underlying EBITDA |
Underlying EBIT |
Share of net income/(loss) |
Dividends | |||||||||||||||
| Samancor | 147 | (11 | ) | (52 | ) | (15 | ) | 2 | ||||||||||||
| Ferroport | 51 | 40 | 36 | 25 | 34 | |||||||||||||||
| Other | 90 | 3 | 3 | (2 | ) | 5 | ||||||||||||||
| 288 | 32 | (13 | ) | 8 | 41 | |||||||||||||||
| 6 months ended 30.06.24 (re-presented)(1) |
||||||||||||||||||||
| US$ million | Group Revenue | Underlying EBITDA |
Underlying EBIT |
Share of net (loss)/income |
Dividends | |||||||||||||||
| Samancor | 219 | 11 | (35 | ) | (27 | ) | 10 | |||||||||||||
| Ferroport | 52 | 32 | 28 | 20 | 35 | |||||||||||||||
| Other | 106 | 3 | 6 | (5 | ) | 2 | ||||||||||||||
| 377 | 46 | (1 | ) | (12 | ) | 47 | ||||||||||||||
| (1) | Comparative figures are re-presented to show separately results from discontinued operations, see note 22. |
| Anglo American plc Interim Results 2025 | 65 |
| Financial statements and other financial information | Notes to the Condensed financial statements |
Net debt and financial risk management
Net debt increased modestly by $0.2 billion to $10.8 billion. Gearing has increased from 27% at 31 December 2024 to 29% as at 30 June 2025 driven by a decrease in total capital following the demerger of Valterra Platinum. Gearing is expected to benefit from the receipt of divestment proceeds in future periods.
| US$ million | 30.06.25 | 31.12.24 | ||||||
| Net assets | 25,578 | 28,533 | ||||||
| Net debt including related derivatives (note 15) | 10,764 | 10,623 | ||||||
| Variable vessel leases | 257 | 179 | ||||||
| Total capital | 36,599 | 39,335 | ||||||
| Gearing | 29 | % | 27 | % | ||||
Net debt is calculated as total borrowings excluding variable vessel lease contracts that are priced with reference to a freight index, less cash and cash equivalents (including derivatives that provide an economic hedge of net debt but excluding the impact of the debit valuation adjustment on these derivatives). Total capital is calculated as ‘Net assets’ (as shown in the Consolidated balance sheet) excluding net debt and variable vessel leases.
| 15. | Net debt |
Overview
The disclosures in this note include certain Alternative Performance Measures (APMs). For more information on the APMs used by the Group, including definitions, please refer to page 88.
Movement in net debt
| US$ million | Short term borrowings |
Medium and long term borrowings |
Total financing activity liabilities |
Removal of variable vessel leases |
Cash and cash equivalents |
Derivatives hedging net debt |
Net debt including derivatives |
|||||||||||||||||||||
| At 1 January 2024 | (1,726 | ) | (15,172 | ) | (16,898 | ) | 637 | 6,074 | (428 | ) | (10,615 | ) | ||||||||||||||||
| Cash flow | 759 | (2,914 | ) | (2,155 | ) | (107 | ) | 2,474 | 229 | 441 | ||||||||||||||||||
| Interest accrued on borrowings | (430 | ) | (18 | ) | (448 | ) | 9 | – | – | (439 | ) | |||||||||||||||||
| Reclassifications | (707 | ) | 707 | – | – | – | – | – | ||||||||||||||||||||
| Movement in fair value | (1 | ) | 225 | 224 | – | – | (597 | ) | (373 | ) | ||||||||||||||||||
| Other movements | (45 | ) | (204 | ) | (249 | ) | 16 | – | – | (233 | ) | |||||||||||||||||
| Currency movements | (5 | ) | 125 | 120 | – | 11 | – | 131 | ||||||||||||||||||||
| At 30 June 2024 | (2,155 | ) | (17,251 | ) | (19,406 | ) | 555 | 8,559 | (796 | ) | (11,088 | ) | ||||||||||||||||
| Cash flow | 1,277 | 309 | 1,586 | (104 | ) | (346 | ) | 234 | 1,370 | |||||||||||||||||||
| Interest accrued on borrowings | (417 | ) | (19 | ) | (436 | ) | 8 | – | – | (428 | ) | |||||||||||||||||
| Reclassifications | (747 | ) | 747 | – | – | – | – | – | ||||||||||||||||||||
| Movement in fair value | (3 | ) | (180 | ) | (183 | ) | – | – | (197 | ) | (380 | ) | ||||||||||||||||
| Other movements | 57 | 119 | 176 | (280 | ) | – | – | (104 | ) | |||||||||||||||||||
| Currency movements | 2 | 84 | 86 | – | (79 | ) | – | 7 | ||||||||||||||||||||
| At 31 December 2024 | (1,986 | ) | (16,191 | ) | (18,177 | ) | 179 | 8,134 | (759 | ) | (10,623 | ) | ||||||||||||||||
| Cash flow(1) | 930 | 1,309 | 2,239 | (66 | ) | (2,155 | ) | 181 | 199 | |||||||||||||||||||
| Interest accrued on borrowings | (399 | ) | (17 | ) | (416 | ) | 5 | – | – | (411 | ) | |||||||||||||||||
| Reclassifications | (624 | ) | 624 | – | – | – | – | – | ||||||||||||||||||||
| Movement in fair value | – | (257 | ) | (257 | ) | – | – | 739 | 482 | |||||||||||||||||||
| Other movements | (118 | ) | (133 | ) | (251 | ) | 139 | – | – | (112 | ) | |||||||||||||||||
| Currency movements | (115 | ) | (495 | ) | (610 | ) | – | 69 | – | (541 | ) | |||||||||||||||||
| Transfer to held for sale(1) | 400 | 95 | 495 | – | (253 | ) | – | 242 | ||||||||||||||||||||
| At 30 June 2025 | (1,912 | ) | (15,065 | ) | (16,977 | ) | 257 | 5,795 | 161 | (10,764 | ) | |||||||||||||||||
| (1) | Cash flow movements in the Consolidated cash flow statement include the cash flows in cash and cash equivalents and the transfer of cash balances to held for sale. |
| 66 | Anglo American plc Interim Results 2025 |
| Financial statements and other financial information | Notes to the Condensed financial statements |
Net debt and financial risk management
15. Net debt continued
Further information
Other movements within financing activity liabilities include $107 million relating to leases entered into in the six months ended 30 June 2025 (six months ended 30 June 2024: $278 million), and an upward revaluation of $121 million (six months ended 30 June 2024: downward revaluation of $27 million) relating to variable vessel leases.
Reconciliation to the Consolidated balance sheet
| Cash and cash equivalents |
Short term borrowings | Medium and long term borrowings | ||||||||||||||||||||||||||||||||||
| US$ million | 30.06.25 | 30.06.24 | 31.12.24 | 30.06.25 | 30.06.24 | 31.12.24 | 30.06.25 | 30.06.24 | 31.12.24 | |||||||||||||||||||||||||||
| Balance sheet | 5,809 | 8,580 | 8,167 | (1,926 | ) | (2,176 | ) | (2,019 | ) | (15,065 | ) | (17,251 | ) | (16,191 | ) | |||||||||||||||||||||
| Bank overdrafts | (14 | ) | (21 | ) | (33 | ) | 14 | 21 | 33 | – | – | – | ||||||||||||||||||||||||
| Net cash/(debt) classifications |
5,795 | 8,559 | 8,134 | (1,912 | ) | (2,155 | ) | (1,986 | ) | (15,065 | ) | (17,251 | ) | (16,191 | ) | |||||||||||||||||||||
Other
Debit valuation adjustments of $2 million (six months ended 30 June 2024: $22 million) (31 December 2024: $22 million) reduce the valuation of derivative liabilities hedging net debt reflecting the impact of the Group’s own credit risk. These adjustments are excluded from the Group’s definition of net debt.
Cash and cash equivalents includes $564 million which is restricted (31 December 2024: $598 million). This primarily relates to cash which is held in joint operations where the timing of dividends is jointly controlled by the joint operators and to cash which is held as part of the Group’s insurance arrangements.
| Anglo American plc Interim Results 2025 | 67 |
| Financial statements and other financial information | Notes to the Condensed financial statements |
Net debt and financial risk management
| 16. | Borrowings |
Overview
The Group borrows mostly in the capital markets through bonds issued in the US markets and under the Euro Medium Term Note (EMTN) programme. The Group uses interest rate and cross currency swaps to ensure that the majority of the Group’s borrowings are exposed to floating US dollar interest rates.
In March 2025, the Group partially bought back Euro and US dollar denominated bonds with maturities in 2027 and 2028.
At 30 June 2025 and 31 December 2024, the following bonds were retained as fixed rate exposure: $99 million 5% due May 2027, and the following bonds had been swapped into floating rates until March 2033: $500 million 3.95% due September 2050 and $750 million 4.75% due March 2052. All other bonds as at 30 June 2025 and 31 December 2024 were swapped to floating rate exposures for the entirety of their remaining term.
Further information
| 30.06.25 | 31.12.24 | |||||||||||||||||||||||
| US$ million | Short
term borrowings |
Medium
and long term borrowings |
Total borrowings |
Short term borrowings |
Medium and long term borrowings |
Total borrowings |
||||||||||||||||||
| Secured | ||||||||||||||||||||||||
| Bank loans and overdrafts | 44 | 32 | 76 | 48 | 44 | 92 | ||||||||||||||||||
| Leases | 226 | 913 | 1,139 | 237 | 924 | 1,161 | ||||||||||||||||||
| 270 | 945 | 1,215 | 285 | 968 | 1,253 | |||||||||||||||||||
| Unsecured | ||||||||||||||||||||||||
| Bank loans and overdrafts | 11 | 508 | 519 | 128 | 498 | 626 | ||||||||||||||||||
| Bank sustainability linked loans | – | – | – | – | 66 | 66 | ||||||||||||||||||
| Bonds | 1,280 | 11,645 | 12,925 | 1,145 | 12,458 | 13,603 | ||||||||||||||||||
| Mitsubishi facility | – | 1,866 | 1,866 | – | 2,106 | 2,106 | ||||||||||||||||||
| Anglo American Sur bank facilities | 125 | – | 125 | 200 | – | 200 | ||||||||||||||||||
| Vale facility | 55 | 95 | 150 | 55 | 95 | 150 | ||||||||||||||||||
| Interest payable and other loans | 185 | 6 | 191 | 206 | – | 206 | ||||||||||||||||||
| 1,656 | 14,120 | 15,776 | 1,734 | 15,223 | 16,957 | |||||||||||||||||||
| Total borrowings | 1,926 | 15,065 | 16,991 | 2,019 | 16,191 | 18,210 | ||||||||||||||||||
Covenants
Medium and long term borrowings, as detailed in the above table, are governed by various financial and procedural covenants, in line with the standard terms of such agreements. If these covenants are not met, this may result in the borrowings becoming repayable on demand. For all outstanding loan balances, the Group has complied with all covenants that were required to be met on, or before 30 June 2025, and has the right to defer settlement for a period of at least twelve months.
Undrawn committed borrowing facilities
The Group had the following undrawn committed borrowing facilities at the period end:
| US$ million | 30.06.25 | 31.12.24 | ||||||
| Expiry date | ||||||||
| Within one year | 1,273 | 1,261 | ||||||
| Greater than one year, less than two years | 95 | 243 | ||||||
| Greater than two years, less than three years | 606 | 1,522 | ||||||
| Greater than three years, less than four years | 513 | 44 | ||||||
| Greater than four years, less than five years | 3,700 | 4,094 | ||||||
| 6,187 | 7,164 | |||||||
| 68 | Anglo American plc Interim Results 2025 |
| Financial statements and other financial information | Notes to the Condensed financial statements |
Net debt and financial risk management
17. Financial instruments
Financial instruments overview
For financial assets and liabilities which are traded on an active market, such as listed investments or listed debt instruments, fair value is determined by reference to market value. For non-traded financial assets and liabilities, fair value is calculated using discounted cash flows, considered to be reasonable and consistent with those that would be used by a market participant, and based on observable market data where available (for example forward exchange rate, interest rate or commodity price curve), unless carrying value is considered to approximate fair value.
Where discounted cash flow models based on management’s assumptions are used, the resulting fair value measurements are considered to be at level 3 in the fair value hierarchy, as defined in IFRS 13 Fair Value Measurement, as they depend to a significant extent on unobservable valuation inputs.
All derivatives that have been designated into hedge relationships have been separately disclosed.
| 30.06.25 | ||||||||||||||||||||||||
| US$ million | At fair value through profit or loss | Financial assets at amortised cost | At fair value through other comprehensive income | Designated into hedges | Financial liabilities at amortised cost | Total | ||||||||||||||||||
| Financial assets | ||||||||||||||||||||||||
| Trade and other receivables | 1,395 | 961 | – | – | – | 2,356 | ||||||||||||||||||
| Derivative financial assets | 284 | – | – | 280 | – | 564 | ||||||||||||||||||
| Cash and cash equivalents | 3,728 | 2,081 | – | – | – | 5,809 | ||||||||||||||||||
| Financial asset investments | 50 | 188 | 2,354 | – | – | 2,592 | ||||||||||||||||||
| Environmental rehabilitation trusts(1) | 93 | 7 | – | – | – | 100 | ||||||||||||||||||
| 5,550 | 3,237 | 2,354 | 280 | – | 11,421 | |||||||||||||||||||
| Financial liabilities | ||||||||||||||||||||||||
| Trade and other payables | (509 | ) | – | – | – | (3,160 | ) | (3,669 | ) | |||||||||||||||
| Derivative financial liabilities | (57 | ) | – | – | (333 | ) | – | (390 | ) | |||||||||||||||
| Royalty liability | – | – | – | 63 | (574 | ) | (511 | ) | ||||||||||||||||
| Borrowings | – | – | – | (12,963 | ) | (4,028 | ) | (16,991 | ) | |||||||||||||||
| (566 | ) | – | – | (13,233 | ) | (7,762 | ) | (21,561 | ) | |||||||||||||||
| Net financial assets/(liabilities) | 4,984 | 3,237 | 2,354 | (12,953 | ) | (7,762 | ) | (10,140 | ) | |||||||||||||||
| 31.12.24 | ||||||||||||||||||||||||
| US$ million | At fair value through profit or loss | Financial assets at amortised cost | At fair value through other comprehensive income | Designated into hedges | Financial liabilities at amortised cost | Total | ||||||||||||||||||
| Financial assets | ||||||||||||||||||||||||
| Trade and other receivables | 1,291 | 1,020 | – | – | – | 2,311 | ||||||||||||||||||
| Derivative financial assets | 208 | – | – | 94 | – | 302 | ||||||||||||||||||
| Cash and cash equivalents | 5,163 | 3,004 | – | – | – | 8,167 | ||||||||||||||||||
| Financial asset investments | 45 | 172 | 111 | – | – | 328 | ||||||||||||||||||
| Environmental rehabilitation trusts(1) | 143 | 8 | – | – | – | 151 | ||||||||||||||||||
| 6,850 | 4,204 | 111 | 94 | – | 11,259 | |||||||||||||||||||
| Financial liabilities | ||||||||||||||||||||||||
| Trade and other payables | (657 | ) | – | – | – | (4,555 | ) | (5,212 | ) | |||||||||||||||
| Derivative financial liabilities | (288 | ) | – | – | (643 | ) | – | (931 | ) | |||||||||||||||
| Royalty liability | – | – | – | 69 | (547 | ) | (478 | ) | ||||||||||||||||
| Borrowings | – | – | – | (13,471 | ) | (4,739 | ) | (18,210 | ) | |||||||||||||||
| (945 | ) | – | – | (14,045 | ) | (9,841 | ) | (24,831 | ) | |||||||||||||||
| Net financial assets/(liabilities) | 5,905 | 4,204 | 111 | (13,951 | ) | (9,841 | ) | (13,572 | ) | |||||||||||||||
| (1) | These funds are not available for the general purposes of the Group. All income from these assets is reinvested to meet specific environmental obligations. |
| Anglo American plc Interim Results 2025 | 69 |
| Financial statements and other financial information | Notes to the Condensed financial statements |
Net debt and financial risk management
17. Financial instruments continued
Trade and other receivables exclude prepayments and tax receivables. Trade and other payables exclude tax, social security, contract liabilities and deferred income.
When the Group acquired the Woodsmith project, the Hancock royalty liability and related embedded derivative were recognised. The royalty liability does not form part of borrowings on the basis that obligations to make cash payments against this liability only arise when the Woodsmith project generates revenues, and that otherwise the Group is not currently contractually liable to make any payments under this arrangement (other than in the event of Anglo American Crop Nutrients Limited’s insolvency). The related embedded derivative which forms part of the total royalty liability was an asset as at 30 June 2025 (31 December 2024: asset). Refer to note 24 of the Group’s 2024 Integrated Annual Report for further information about the Hancock royalty liability.
Fair value hierarchy
An analysis of financial assets and liabilities carried at fair value is set out below:
| 30.06.25 | 31.12.24 | |||||||||||||||||||||||||||||||
| US$ million | Level 1 | Level 2 | Level 3 | Total | Level 1 | Level 2 | Level 3 | Total | ||||||||||||||||||||||||
| Financial assets | ||||||||||||||||||||||||||||||||
| At fair value through profit or loss | ||||||||||||||||||||||||||||||||
| Provisionally priced trade receivables | – | 1,280 | – | 1,280 | – | 1,180 | – | 1,180 | ||||||||||||||||||||||||
| Other receivables | – | 102 | 13 | 115 | – | 67 | 44 | 111 | ||||||||||||||||||||||||
| Financial asset investments | – | 44 | 6 | 50 | – | 41 | 4 | 45 | ||||||||||||||||||||||||
| Derivatives hedging net debt | – | 239 | – | 239 | – | 14 | – | 14 | ||||||||||||||||||||||||
| Other derivatives | – | 45 | – | 45 | – | 194 | – | 194 | ||||||||||||||||||||||||
| Cash and cash equivalents | 3,728 | – | – | 3,728 | 5,163 | – | – | 5,163 | ||||||||||||||||||||||||
| Environmental rehabilitation trusts(1) | – | 93 | – | 93 | – | 143 | – | 143 | ||||||||||||||||||||||||
| Designated into hedges | ||||||||||||||||||||||||||||||||
| Derivatives hedging net debt | – | 280 | – | 280 | – | 94 | – | 94 | ||||||||||||||||||||||||
| At fair value through other comprehensive income | ||||||||||||||||||||||||||||||||
| Financial asset investments | 2,345 | – | 9 | 2,354 | 30 | – | 81 | 111 | ||||||||||||||||||||||||
| 6,073 | 2,083 | 28 | 8,184 | 5,193 | 1,733 | 129 | 7,055 | |||||||||||||||||||||||||
| Financial liabilities | ||||||||||||||||||||||||||||||||
| At fair value through profit or loss | ||||||||||||||||||||||||||||||||
| Provisionally priced trade payables | – | (307 | ) | – | (307 | ) | – | (365 | ) | – | (365 | ) | ||||||||||||||||||||
| Other payables | – | (5 | ) | (197 | ) | (202 | ) | – | (95 | ) | (197 | ) | (292 | ) | ||||||||||||||||||
| Derivatives hedging net debt | – | (25 | ) | – | (25 | ) | – | (224 | ) | – | (224 | ) | ||||||||||||||||||||
| Other derivatives | – | (34 | ) | – | (34 | ) | – | (85 | ) | (1 | ) | (86 | ) | |||||||||||||||||||
| Designated into hedges | ||||||||||||||||||||||||||||||||
| Derivatives hedging net debt | – | (333 | ) | – | (333 | ) | – | (643 | ) | – | (643 | ) | ||||||||||||||||||||
| Royalty liability | – | – | 63 | 63 | – | – | 69 | 69 | ||||||||||||||||||||||||
| Debit valuation adjustment to derivative liabilities | – | 2 | – | 2 | – | 22 | – | 22 | ||||||||||||||||||||||||
| – | (702 | ) | (134 | ) | (836 | ) | – | (1,390 | ) | (129 | ) | (1,519 | ) | |||||||||||||||||||
| Net assets/(liabilities) carried at fair value | 6,073 | 1,381 | (106 | ) | 7,348 | 5,193 | 343 | – | 5,536 | |||||||||||||||||||||||
| (1) | These funds are not available for the general purposes of the Group. All income from these assets is reinvested to meet specific environmental obligations. |
| Fair value hierarchy | Valuation technique | |
| Level 1 | Valued using unadjusted quoted prices in active markets for identical financial instruments. This category includes cash and cash equivalents held in money market funds, listed equity shares and quoted futures. | |
| Level 2 | Instruments in this category are valued using valuation techniques where all of the inputs that have a significant effect on the valuation are directly or indirectly based on observable market data. This category includes provisionally priced trade receivables and payables and over-the-counter derivatives. | |
| Level 3 | Instruments in this category have been valued using a valuation technique where at least one input (which could have a significant effect on the instrument’s valuation) is not based on observable market data. Where inputs can be observed from market data without undue cost and effort, the observed input is used. Otherwise, management determines a reasonable estimate for the input. This category includes deferred consideration, receivables relating to disposals, unlisted equity investments and the embedded derivative relating to the Royalty liability. |
| 70 | Anglo American plc Interim Results 2025 |
| Financial statements and other financial information | Notes to the Condensed financial statements |
Net debt and financial risk management
| 17. | Financial instruments continued |
The movements in the fair value of the level 3 financial assets and liabilities are shown as follows:
| US$ million | Assets | Liabilities | ||
| At 1 January 2025 | 129 | (129) | ||
| Net loss recorded in the income statement | (25) | – | ||
| Net loss recorded in the statement of comprehensive income | (12) | (5) | ||
| Additions | 3 | – | ||
| Settlements and disposals | (69) | 1 | ||
| Currency movements | 2 | (1) | ||
| At 30 June 2025 | 28 | (134) |
Further information
Borrowings designated in fair value hedges represent listed debt which is held at amortised cost, adjusted for the fair value of the hedged interest rate risk and foreign currency risk. The fair value of these borrowings is $12,869 million (31 December 2024: $13,459 million), which is measured using quoted indicative broker prices and consequently categorised as level 2 in the fair value hierarchy. The carrying value of the remaining borrowings at amortised cost is considered to approximate the fair value.
| Anglo American plc Interim Results 2025 | 71 |
| Financial statements and other financial information | Notes to the Condensed financial statements |
Equity
Equity
represents the capital of the Group attributable to Company
shareholders and non-controlling interests, and includes share capital,
share premium and reserves.
Total equity has decreased from $28.5 billion to $25.6 billion in the period, driven by dividends to Company shareholders, distributions to non-controlling interests and the demerger of Valterra Platinum Limited, offset by the total comprehensive income for the period.
| 18. | Non-controlling interests |
Overview
Non-controlling interests that are material to the Group relate to the following subsidiaries:
| – | Anglo American Sur S.A. (Anglo American Sur), which is a company incorporated in Chile. Its principal operations are the Los Bronces and El Soldado copper mines and the Chagres smelter, which are located in Chile. Non-controlling interests hold a 49.9% (31 December 2024: 49.9%) interest in Anglo American Sur. |
| – | Anglo American Quellaveco S.A. (Anglo American Quellaveco), which is a company incorporated in Peru. Its principal operation is the Quellaveco copper mine, which is located in Peru. Non-controlling interests hold a 40.0% (31 December 2024: 40.0%) interest in Anglo American Quellaveco. |
| – | Anglo American Minério de Ferro Brasil S.A. is a company incorporated in Brazil. Its principal operation is the Minas-Rio iron ore mine, which is located in Brazil. Non-controlling interests hold a 15.0% (31 December 2024: 15.0%) interest in Minas-Rio. |
| – | Kumba Iron Ore Limited (Kumba Iron Ore), which is a company incorporated in South Africa and listed on the Johannesburg Stock Exchange (JSE). Its principal mining operations are the Sishen and Kolomela iron ore mines which are located in South Africa. Non-controlling interests hold an effective 46.6% (31 December 2024: 46.6%) interest in the operations of Kumba Iron Ore, comprising the 30.0% (31 December 2024: 30.0%) interest held by other shareholders in Kumba Iron Ore and the 23.7% (31 December 2024: 23.7%) of Kumba Iron Ore’s principal operating subsidiary, Sishen Iron Ore Company Proprietary Limited, that is held by shareholders outside the Group. |
| – | De Beers plc (De Beers), which is a company incorporated in Jersey. It is the world’s leading diamond company with operations across all key parts of the diamond value chain. Non-controlling interests hold a 15.0% (31 December 2024: 15.0%) interest in De Beers, which represents the whole of the Diamonds reportable segment. |
| – | Valterra Platinum Limited (formerly Anglo American Platinum Limited), is a company incorporated in South Africa and listed on the LSE and JSE. Its principal mining operations are the Mogalakwena and Amandelbult platinum group metals mines which are located in South Africa. In the prior year, non-controlling interests held an effective 32.7% interest in the operations of Valterra Platinum, which represented the Platinum Group Metals reportable segment. Following demerger on 31 May 2025 (see note 23), the business is no longer a subsidiary of the Group. |
| 72 | Anglo American plc Interim Results 2025 |
| Financial statements and other financial information | Notes to the Condensed financial statements |
Equity
| 18. | Non-controlling interests continued |
The disclosures in this note include certain Alternative Performance Measures (APMs). For more information on the APMs used by the Group, including definitions, please refer to page 88.
| 30.06.25 | ||||||||||||||||||||||||||||||||
| US$ million | Anglo American Sur |
Anglo American Quellaveco |
Minas-Rio | Kumba Iron Ore |
Valterra Platinum |
De Beers | Other | Total | ||||||||||||||||||||||||
| Underlying earnings attributable to non-controlling interests | 26 | 137 | 31 | 240 | 8 | (49 | ) | 14 | 407 | |||||||||||||||||||||||
| Profit/(loss) attributable to non-controlling interests | 26 | 144 | 57 | 238 | 82 | (51 | ) | 14 | 510 | |||||||||||||||||||||||
| Distributions to non-controlling interests (1) | – | – | (2 | ) | (214 | ) | (297 | ) | (1 | ) | (3 | ) | (517 | ) | ||||||||||||||||||
| Balance sheet information: | ||||||||||||||||||||||||||||||||
| Equity attributable to non-controlling interests | 1,585 | 1,302 | 886 | 1,781 | – | 689 | (3 | ) | 6,240 | |||||||||||||||||||||||
| 30.06.24 | ||||||||||||||||||||||||||||||||
| US$ million | Anglo American Sur |
Anglo American Quellaveco |
Minas-Rio | Kumba Iron Ore |
Valterra Platinum |
De Beers | Other | Total | ||||||||||||||||||||||||
| Underlying earnings attributable to non-controlling interests | 84 | 83 | n/a | 271 | 90 | 10 | (10 | ) | 528 | |||||||||||||||||||||||
| Profit/(loss) attributable to non-controlling interests | 84 | 78 | n/a | 235 | 82 | 4 | (10 | ) | 473 | |||||||||||||||||||||||
| Distributions to non-controlling interests (1) | – | – | n/a | (253 | ) | (42 | ) | (1 | ) | (4 | ) | (300 | ) | |||||||||||||||||||
| Balance sheet information: | 31.12.24 | |||||||||||||||||||||||||||||||
| US$ million | Anglo American Sur |
Anglo American Quellaveco |
Minas-Rio | Kumba Iron Ore |
Valterra Platinum |
De Beers | Other | Total | ||||||||||||||||||||||||
| Equity attributable to non-controlling interests | 1,549 | 1,158 | 880 | 1,676 | 1,834 | 715 | (39 | ) | 7,773 | |||||||||||||||||||||||
| (1) | The distributions to non-controlling interests in relation to Valterra Platinum Limited are included within Net cash used in financing activities from discontinued operations within the Consolidated cash flow statement. |
| Anglo American plc Interim Results 2025 | 73 |
| Financial statements and other financial information | Notes to the Condensed financial statements |
Unrecognised items and uncertain events
| 19. | Events occurring after the period end |
With the exception of the declaration of the 2025 interim dividend, there have been no further reportable events since 30 June 2025.
| 20. | Contingent assets and liabilities |
Overview
The assessment of risk and estimation of future outflows in respect of contingent liabilities is inherently uncertain and hence a material outflow may arise in future periods in relation to these matters.
Contingent assets
Steelmaking
Coal
In 2014, the Steelmaking Coal business was granted an arbitration award of $107 million (100% basis) against MMTC Limited in respect
of a contractual dispute. The award has since been challenged in the Indian courts, during which time interest has continued to
accrue. On 17 December 2020, the Indian Supreme Court found in favour of the Steelmaking Coal business. The total award, inclusive
of interest, is currently valued at approximately $158 million. The precise timing and value of receipt remains uncertain and
hence no receivable has been recognised on the Consolidated balance sheet as at 30 June 2025. Receipt of the final amount is independent
of the sale of the Steelmaking Coal business.
Contingent liabilities
De
Beers
Guarantees provided in respect of environmental restoration and decommissioning obligations involve judgements in terms of the
outcome of future events. In one of the territories in which De Beers operates, conditions exist, or are proposed, with respect
to backfilling pits on closure. An appeal has been submitted following the rejection of an amendment application to remove these
conditions, with no provision raised on the basis that it is not probable that this condition will be enforced. Should efforts
to remove these conditions ultimately be unsuccessful, the estimated cost of backfilling is $226 million.
Anglo
American South Africa Proprietary Limited (AASA)
In October 2020, an application was initiated against Anglo American South Africa Proprietary Limited (AASA). The application
sought the certification of class action litigation to be brought on behalf of community members residing in the Kabwe area in
Zambia in relation to alleged lead-related health impacts. The certification hearing was held late in January 2023.
On 15 December 2023, the High Court of South Africa issued a judgment dismissing the claimants’ application for certification and ruled that the applicants pay the costs incurred by AASA in responding to the application. In its judgment, the Court recognised the multiple legal and factual flaws in the claims made against AASA and deemed that it is not in the interests of justice for the class action to proceed.
The claimants have filed an appeal against the December 2023 ruling. In light of the pending appeal lodged by the claimants, the outcome of this litigation is still subject to significant uncertainty, and no provision is recognised for this matter.
Accounting judgement
The Group operates in a number of jurisdictions and, from time to time, is subject to commercial disputes, tax matters, litigation and other claims. The resolution of disputes is inherently unpredictable and the Group may in the future incur judgments or enter into settlements of claims that could lead to material cash outflows. A provision is recognised where it is considered probable that an outflow of resources will be required to settle a present obligation that can be measured reliably. Where payment is not probable or cannot be reliably estimated, the Group has not provided for such matters. Based on the information currently available, it is not expected that any of these matters will have a materially adverse impact on our financial position.
Where the existence of an asset is contingent on uncertain future events which are outside the Group’s control, the asset is only recognised once it becomes virtually certain that the Group will receive future economic benefits.
Determining the likelihood of a future event is an accounting judgement. These judgements are based on the Group’s legal views and, in some cases, independent advice.
| 74 | Anglo American plc Interim Results 2025 |
| Financial statements and other financial information | Notes to the Condensed financial statements |
Group structure
| 21. | Assets and liabilities held for sale |
30 June 2025
Assets and liabilities held for sale relate to the Steelmaking Coal and Nickel businesses which are being sold as part of the Group’s portfolio transformation (see note 9). Net assets held for sale of $2,924 million relate principally to the sale of Steelmaking coal assets to Peabody Energy ($2,603 million) and the sale of Nickel assets to MMG Resources ($321 million).
Steelmaking coal assets held for sale include Moranbah-Grosvenor (which was held for sale as at 31 December 2024) as well as the Capcoal and Dawson joint operations, which were only considered to meet the criteria to be held for sale following the expiry of pre-emption rights on 15 March 2025.
The Nickel business includes two ferronickel operations in Brazil – Barro Alto and Codemin – and two high quality greenfield growth projects – Jacaré and Morro Sem Boné. The business was classified as held for sale on 18 February 2025 following the announcement of the signed sale and purchase agreement.
31 December 2024
Assets and liabilities held for sale principally related to the sale of Moranbah-Grosvenor to Peabody Energy and the sale of the Group’s 33.3% interest in the Jellinbah associate to Zashvin (which subsequently completed on 29 January 2025).
Further information
| US$ million | 30.06.25 | 31.12.24 | ||||||
| ASSETS | ||||||||
| Intangible assets | 13 | 3 | ||||||
| Property, plant and equipment | 3,181 | 2,128 | ||||||
| Investments in associates and joint ventures | 13 | 295 | ||||||
| Financial asset investments | 5 | 1 | ||||||
| Inventories | 567 | 36 | ||||||
| Trade and other receivables | 316 | 67 | ||||||
| Deferred tax assets | 34 | – | ||||||
| Assets classified as held for sale | 4,129 | 2,530 | ||||||
| LIABILITIES | ||||||||
| Trade and other payables | (396 | ) | (170 | ) | ||||
| Borrowings | (141 | ) | (15 | ) | ||||
| Provisions for liabilities and charges | (668 | ) | (178 | ) | ||||
| Liabilities directly associated with assets classified as held for sale | (1,205 | ) | (363 | ) | ||||
| Net assets directly associated with disposal group | 2,924 | 2,167 | ||||||
| Anglo American plc Interim Results 2025 | 75 |
| Financial statements and other financial information | Notes to the Condensed financial statements |
Group structure
| 22. | Discontinued operations |
The Platinum Group Metals, Steelmaking Coal and Nickel reportable segments are now classified as discontinued operations and are therefore no longer reportable segments of the Group (see note 9 for further information).
Financial information relating to the discontinued operations for the current and prior period to the date of disposal and for subsequent adjustments to contingent consideration is set out below.
| 6 months ended 30.06.25 | ||||||||||||||||
| US$ million | Platinum Group Metals(1) |
Steelmaking Coal | Nickel | Total | ||||||||||||
| Revenue | 1,773 | 708 | 280 | 2,761 | ||||||||||||
| Operating costs | (1,722 | ) | (919 | ) | (242 | ) | (2,883 | ) | ||||||||
| Operating special items | (37 | ) | (277 | ) | (170 | ) | (484 | ) | ||||||||
| Operating profit/(loss) | 14 | (488 | ) | (132 | ) | (606 | ) | |||||||||
| Non-operating special items | (1,793 | ) | 370 | (8 | ) | (1,431 | ) | |||||||||
| Net income from associates and joint ventures | (2 | ) | 5 | – | 3 | |||||||||||
| Loss before net finance costs and tax | (1,781 | ) | (113 | ) | (140 | ) | (2,034 | ) | ||||||||
| Investment income | 5 | 2 | 1 | 8 | ||||||||||||
| Net financing special items | (12 | ) | 4 | – | (8 | ) | ||||||||||
| Interest expense | (24 | ) | (16 | ) | (20 | ) | (60 | ) | ||||||||
| Other net financing losses | (27 | ) | (3 | ) | (3 | ) | (33 | ) | ||||||||
| Net finance costs | (58 | ) | (13 | ) | (22 | ) | (93 | ) | ||||||||
| Loss before tax | (1,839 | ) | (126 | ) | (162 | ) | (2,127 | ) | ||||||||
| Income tax charge on special items (2) | (93 | ) | (54 | ) | – | (147 | ) | |||||||||
| Income tax (charge)/credit on underlying items (2) | (21 | ) | 21 | – | – | |||||||||||
| Loss for the financial period from discontinued operations | (1,953 | ) | (159 | ) | (162 | ) | (2,274 | ) | ||||||||
| Less: Special items for the financial period from discontinued operations | 1,935 | (43 | ) | 178 | 2,070 | |||||||||||
| (Loss)/profit for the financial period from discontinued operations before special items | (18 | ) | (202 | ) | 16 | (204 | ) | |||||||||
| Attributable to: | ||||||||||||||||
| Non-controlling interests | 8 | |||||||||||||||
| Equity shareholders of the Company | (212 | ) | ||||||||||||||
| (1) | The demerger of Valterra Platinum occurred on 31 May 2025 (see note 23). The results presented above in respect of the Platinum Group Metals segment are therefore for the 5 months ended 31 May 2025. |
| (2) | Please see note 23 where the tax on gain/loss on disposal included within the above tax charge has been disclosed. |
| 76 | Anglo American plc Interim Results 2025 |
| Financial statements and other financial information | Notes to the Condensed financial statements |
Group structure
| 22. | Discontinued operations continued |
| 6 months ended 30.06.24 | ||||||||||||||||
| US$ million | Platinum Group Metals |
Steelmaking Coal | Nickel | Total | ||||||||||||
| Revenue | 2,796 | 1,754 | 329 | 4,879 | ||||||||||||
| Operating costs | (2,291 | ) | (1,556 | ) | (294 | ) | (4,141 | ) | ||||||||
| Operating special items | (55 | ) | – | – | (55 | ) | ||||||||||
| Operating profit | 450 | 198 | 35 | 683 | ||||||||||||
| Net income from associates and joint ventures | (24 | ) | 96 | – | 72 | |||||||||||
| Profit before net finance costs and tax | 426 | 294 | 35 | 755 | ||||||||||||
| Investment income | 5 | 2 | 3 | 10 | ||||||||||||
| Interest expense | (22 | ) | (101 | ) | (26 | ) | (149 | ) | ||||||||
| Other net financing (gains)/losses | (2 | ) | – | 4 | 2 | |||||||||||
| Net finance costs | (19 | ) | (99 | ) | (19 | ) | (137 | ) | ||||||||
| Profit before tax | 407 | 195 | 16 | 618 | ||||||||||||
| Income tax credit on special items | 14 | – | – | 14 | ||||||||||||
| Income tax charge on underlying items | (114 | ) | (40 | ) | – | (154 | ) | |||||||||
| Profit for the financial period from discontinued operations | 307 | 155 | 16 | 478 | ||||||||||||
| Less: Special items for the financial period from discontinued operations | 41 | – | – | 41 | ||||||||||||
| Profit for the financial period from discontinued operations before special items | 348 | 155 | 16 | 519 | ||||||||||||
| Attributable to: | ||||||||||||||||
| Non-controlling interests | 90 | |||||||||||||||
| Equity shareholders of the Company | 429 | |||||||||||||||
Impairments recorded within operating special items
Six months ended 30 June 2025
Barro Alto and Codemin (Nickel)
The Barro Alto and Codemin CGUs have been classified as held for sale following the signing of a sale and purchase agreement. This agreement includes cash consideration and consideration contingent on future nickel prices and project development milestones. Total consideration under the agreement is considered indicative of the fair value of the disposal groups.
A valuation was prepared when the CGUs became held for sale, and updated at 30 June 2025 in line with IFRS 5 Non-current Assets Held for Sale and Discontinued Operations. An impairment charge of $170 million ($170 million after tax) has been recognised in the six months ended 30 June 2025 and allocated against property, plant and equipment to bring the carrying value of the disposal group to $322 million.
For the purposes of the impairment valuation, contingent consideration has been discounted at rates between 8.3% and 13.7% depending on the risk profile of the payments. For the valuation of the price-linked consideration, the model uses forecast LME nickel prices that fall within the analyst price range of $7.31/lb to $8.53/lb throughout the model. The consideration linked to project milestones was valued based on management’s best estimate of the timing of the payment criteria being met.
The valuation is not materially sensitive to reasonably possible changes in key assumptions.
Moranbah – Grosvenor (Steelmaking Coal)
Moranbah – Grosvenor was presented as held for sale at 31 December 2024 following the signing of a sale and purchase agreement and the waiver of pre-emption rights. An impairment charge against the CGU of $226 million ($158 million after tax) was recognised at that date based on the terms of the signed Share and Asset Purchase Agreement (SAPA). Total consideration in the SAPA includes deferred consideration, including price-linked contingent consideration and consideration linked to the Grosvenor mine restart.
| Anglo American plc Interim Results 2025 | 77 |
| Financial statements and other financial information | Notes to the Condensed financial statements |
| 22. | Discontinued operations continued |
In line with IFRS 5 Non-current Assets Held for Sale and Discontinued Operations, the valuation was updated at 30 June 2025 and principally, due to changes in the foreign exchange rate between the Australian and US Dollar that increased the carrying value of the CGU during the period, an impairment charge of $209 million ($146 million after tax) has been recognised in the six months ended 30 June 2025 to bring the carrying value of the CGU to $1,857 million, in line with the fair value of the consideration agreed. The impairment charge has been allocated against property, plant and equipment.
Capcoal (Steelmaking Coal)
On 15 March 2025, the previously announced disposal of the remainder of the Group’s Steelmaking Coal business including the Capcoal CGU to Peabody Energy became highly probable following the waiver of certain pre-emption rights for existing partners under the relevant agreements. The Capcoal CGU was therefore classified as held for sale from that date. A valuation based on the terms of the Share Purchase Agreement (SPA) signed in 2024 was prepared when the assets were transferred to held for sale, and updated at 30 June 2025 in line with IFRS 5 Non-current Assets Held for Sale and Discontinued Operations. An impairment charge of $69 million ($48 million after tax) has been recognised in the six months ended 30 June 2025, principally due to foreign exchange movements increasing the carrying value of the CGU during the period. The impairment charge has been allocated against property, plant and equipment to bring the carrying value of the CGU to $529 million, in line with the fair value of the consideration agreed.
For the purposes of the impairment valuations of the Steelmaking Coal CGUs, contingent consideration was discounted at rates between 6.7% and 11.6% depending on the risk profile of the payments. For the valuation of the price-linked consideration, the models use forecast steelmaking coal prices that fall within the upper quartile of the analyst price range throughout the model. The Grosvenor restart consideration was valued based on probabilistic outcomes of management’s best estimate of the timing of the mine’s restart.
The valuations of the Moranbah-Grosvenor and Capcoal CGUs are not materially sensitive to reasonably possible changes in key assumptions.
The impairment charges in respect of the Steelmaking Coal and Nickel CGUs detailed above have been recorded within operating special items. Operating special items included within the Platinum Group Metals disposal group relate to the impairment of individual assets.
Special items and remeasurements from discontinued operations
Non-operating special items
The net loss of $1,431 million principally relates to the loss from demerger of the Group’s interest in the Platinum Group Metals business (Valterra Platinum) of $1,803 million ($2,183 million after tax) partially offset by profit from disposal of the Group’s interest in the Jellinbah associate of $392 million; for further information please see note 23.
Income tax on special items
The income tax charge on special items of $93 million in Platinum Group Metals principally relates to withholding tax and other transaction taxes on the demerger, net of the release of the associated deferred tax liability recognised in 2024. In Steelmaking Coal, the income tax charge on special items of $54 million relates to taxes payable on the Jellinbah disposal partially offset by deferred tax movements on the associated impairments.
Transactions between continuing and discontinued operations
Intra-group transactions such as inter-segment trading, insurance claims and recharge arrangements occur between the Group’s continuing and discontinued operations. Where the income and expense relating to these transactions are recorded within the same financial statement line item they continue to be included within the results of both continuing and discontinued operations without adjustment. For transactions recorded across multiple financial statements line items, the Group has recorded appropriate elimination adjustments.
| 78 | Anglo American plc Interim Results 2025 |
| Financial statements and other financial information | Notes to the Condensed financial statements |
Group structure
| 23. | Disposals |
Platinum Group Metals
On 31 May 2025, the Group completed the demerger of its controlling interest in the Platinum Group Metals business, Valterra Platinum Limited (formerly named Anglo American Platinum Limited) (“Valterra Platinum”), which on 2 June 2025 was admitted to trading as an international commercial companies secondary listing on the London Stock Exchange (LSE) in addition to its existing primary listing on the Johannesburg Stock Exchange (JSE).
The demerger was executed by means of a distribution in specie valued at an amount equal to the fair value of the disposed share of operations. The fair value of the distribution in specie at the date of the demerger and residual financial asset investment was a level 1 fair value measurement based on the closing price of the Valterra Platinum shares as quoted on the JSE on the close of trade on 30 May 2025, being the last day of trading prior to the demerger.
Details of the net loss on demerger of Valterra Platinum is shown below:
| US$ million | 31 May 2025 | |||
| Intangible assets | 92 | |||
| Property, plant and equipment | 6,656 | |||
| Environmental rehabilitation trusts | 70 | |||
| Other non-current assets | 467 | |||
| Inventories | 1,509 | |||
| Trade and other receivables | 661 | |||
| Other current assets | 939 | |||
| Trade and other payables | (2,081 | ) | ||
| Short term borrowings | (1,058 | ) | ||
| Other current liabilities | (62 | ) | ||
| Deferred tax liabilities | (1,382 | ) | ||
| Other non-current liabilities | (168 | ) | ||
| Platinum Group Metals net assets | 5,643 | |||
| Non-controlling interest | (1,673 | ) | ||
| Net assets demerged | 3,970 | |||
| Net cash and cash equivalents demerged | 825 | |||
| Net cash outflow from demerger of Platinum Group Metals | (825 | ) | ||
| US$ million | 31 May 2025 | |||
| Distribution in specie relating to Platinum Group Metals demerger | 5,317 | |||
| Distribution in specie distributed to group companies (see Further information below) | (448 | ) | ||
| Fair value of distribution to external shareholders (1) | 4,869 | |||
| Net assets demerged | (3,970 | ) | ||
| Residual financial asset investments (see Further information below) | 2,038 | |||
| Gain on demerger before tax, transaction costs and reclassification of foreign currency translation reserve | 2,937 | |||
| Transaction costs | (155 | ) | ||
| Withholding taxes | (307 | ) | ||
| Other related taxes | (73 | ) | ||
| Reclassification of foreign currency translation reserve | (4,585 | ) | ||
| Loss on demerger of Platinum Group Metals net of tax and transaction costs | (2,183 | ) | ||
| (1) | On 30 April 2025, the distribution in specie was approved and payable. The change in value of consideration between approval date and demerger was $588 million and has been recorded in equity. |
| Anglo American plc Interim Results 2025 | 79 |
| Financial statements and other financial information | Notes to the Condensed financial statements |
Group structure
| 23. | Disposals continued |
Further information
On completion of the demerger, the Group retained a residual 19.9% interest in Valterra Platinum. 4.4% of the residual interest resulted from the distribution in specie being distributed to group companies and is held through Tenon and its related investment companies (see note 40 of the 2024 Integrated Annual Report for further information about the Tenon structure). The remaining 15.5% holding is held by a group subsidiary. A financial asset at fair value through other comprehensive income of $2,038 million was recognised on the Group’s Consolidated balance sheet in respect of this combined interest, with a revaluation gain of $914 million, representing the difference between the previous carrying value of the 19.9% interest in the net assets and their fair value, also recognised within discontinued special items in the consolidated income statement. The retained investment in Valterra Platinum is accounted for as a level 1 financial instrument.
As at 30 June 2025, the fair value of the investment was $2,330 million presented within current financial asset investments. A gain of $286 million ($251 million net of tax) relating to the change in fair value since initial recognition has been recorded within other comprehensive income.
Jellinbah
On 29 January 2025, the Group completed the sale of its interest in Jellinbah. In line with the agreement, the initial cash consideration of $1,019 million was reduced by $149 million of cash dividends received in 2024 following the agreement of the sale. The cash inflow on disposal was therefore $870 million.
The carrying value of the investment in the associate was $298 million. The transaction resulted in a net gain on disposal of $392 million after the recycling of cumulative foreign currency translation differences of $180 million, which was presented as a non-operating special item within discontinued operations. Transaction costs related to the sale were immaterial.
2024
Cash received of $16 million in respect of disposals principally relates to the deferred consideration balances relating to the sale of the Kroondal Marikana joint operation (Platinum Group Metals).
Reconciliation of cashflows on disposal to Net cash used in investing activities from discontinued operations
| US$ million | Six months ended 30.06.2025 |
|||
| Cash inflow on disposal of Jellinbah | 870 | |||
| Cash outflow on demerger of Valterra Platinum | (825 | ) | ||
| Transaction costs, withholding taxes and other taxes paid | (431 | ) | ||
| Expenditure on property, plant and equipment by discontinued operations | (518 | ) | ||
| Other investing cashflows relating to discontinued operations | 3 | |||
| Net cash used in investing activities from discontinued operations | (901 | ) | ||
| 80 | Anglo American plc Interim Results 2025 |
Financial statements and other financial information
Responsibility statement
We confirm that to the best of our knowledge:
| (a) | the Condensed financial statements have been prepared in accordance with International Accounting Standard 34, ‘Interim Financial Reporting’, as adopted in the United Kingdom (IAS 34), and give a true and fair view of the assets, liabilities, financial position and profit or loss of the Company and its subsidiaries included in the consolidation as a whole as required by DTR 4.2.4R; |
| (b) | the Half year financial report includes a fair review of the information required by DTR 4.2.7R (being an indication of important events that have occurred during the first six months of the financial year, and their impact on the Half year financial report, and a description of the principal risks and uncertainties for the remaining six months of the financial year); and |
| (c) | the Half year financial report includes a fair review of the information required by DTR 4.2.8R (being disclosure of related party transactions that have taken place in the first six months of the current financial year and that have materially affected the financial position or the performance of the Group during that period and any changes in the related party transactions described in the last annual report that could have a material effect on the financial position or performance of the Group in the first six months of the current financial year). |
By order of the Board
| Duncan Wanblad | John Heasley |
| Chief Executive Officer | Chief Financial Officer |
| Anglo American plc Interim Results 2025 | 81 |
Financial statements and other financial information
Independent review report to Anglo American plc
Report on the Condensed consolidated interim financial statements
Our conclusion
We have reviewed Anglo American plc’s Condensed consolidated interim financial statements (the “interim financial statements”) in the Half year financial report of Anglo American plc for the 6 month period ended 30 June 2025 (the “period”).
Based on our review, nothing has come to our attention that causes us to believe that the interim financial statements are not prepared, in all material respects, in accordance with UK adopted International Accounting Standard 34, ‘Interim Financial Reporting’ and the Disclosure Guidance and Transparency Rules sourcebook of the United Kingdom’s Financial Conduct Authority.
The interim financial statements comprise:
| – | the Consolidated balance sheet as at 30 June 2025; |
| – | the Consolidated income statement and Consolidated statement of comprehensive income for the period then ended; |
| – | the Consolidated cash flow statement for the period then ended; |
| – | the Consolidated statement of changes in equity for the period then ended; and |
| – | the explanatory notes to the interim financial statements. |
The interim financial statements included in the Half year financial report of Anglo American plc have been prepared in accordance with UK adopted International Accounting Standard 34, ‘Interim Financial Reporting’ and the Disclosure Guidance and Transparency Rules sourcebook of the United Kingdom’s Financial Conduct Authority.
Basis for conclusion
We conducted our review in accordance with International Standard on Review Engagements (UK) 2410, ‘Review of Interim Financial Information Performed by the Independent Auditor of the Entity’ issued by the Financial Reporting Council for use in the United Kingdom (“ISRE (UK) 2410”). A review of interim financial information consists of making enquiries, primarily of persons responsible for financial and accounting matters, and applying analytical and other review procedures.
A review is substantially less in scope than an audit conducted in accordance with International Standards on Auditing (UK) and, consequently, does not enable us to obtain assurance that we would become aware of all significant matters that might be identified in an audit. Accordingly, we do not express an audit opinion.
We have read the other information contained in the Half year financial report and considered whether it contains any apparent misstatements or material inconsistencies with the information in the interim financial statements.
Conclusions relating to going concern
Based on our review procedures, which are less extensive than those performed in an audit as described in the Basis for conclusion section of this report, nothing has come to our attention to suggest that the directors have inappropriately adopted the going concern basis of accounting or that the directors have identified material uncertainties relating to going concern that are not appropriately disclosed. This conclusion is based on the review procedures performed in accordance with ISRE (UK) 2410. However, future events or conditions may cause the Group to cease to continue as a going concern.
| 82 | Anglo American plc Interim Results 2025 |
| Financial statements and other financial information | Independent review report to Anglo American plc |
Responsibilities for the interim financial statements and the review
Our responsibilities and those of the directors
The Half year financial report, including the interim financial statements, is the responsibility of, and has been approved by the directors. The directors are responsible for preparing the Half year financial report in accordance with the Disclosure Guidance and Transparency Rules sourcebook of the United Kingdom’s Financial Conduct Authority. In preparing the Half year financial report, including the interim financial statements, the directors are responsible for assessing the Group’s ability to continue as a going concern, disclosing, as applicable, matters related to going concern and using the going concern basis of accounting unless the directors either intend to liquidate the Group or to cease operations, or have no realistic alternative but to do so.
Our responsibility is to express a conclusion on the interim financial statements in the Half year financial report based on our review. Our conclusion, including our Conclusions relating to going concern, is based on procedures that are less extensive than audit procedures, as described in the Basis for conclusion paragraph of this report. This report, including the conclusion, has been prepared for and only for the Company for the purpose of complying with the Disclosure Guidance and Transparency Rules sourcebook of the United Kingdom’s Financial Conduct Authority and for no other purpose. We do not, in giving this conclusion, accept or assume responsibility for any other purpose or to any other person to whom this report is shown or into whose hands it may come save where expressly agreed by our prior consent in writing.
PricewaterhouseCoopers
LLP
Chartered Accountants
London
30 July 2025
| Anglo American plc Interim Results 2025 | 83 |
Other information
Summary by operation
The disclosures in this section include certain Alternative Performance Measures (APMs). For more information on the APMs used by the Group, including definitions, please refer to page 88.
Marketing activities are allocated to the underlying operation to which they relate.
| Continuing operations | 6 months ended | |||||||||||||||||||||||
| 30.06.25 | ||||||||||||||||||||||||
| US$ million | Sales | Realised | Unit | Group | Underlying | Underlying | Underlying | Capital | ||||||||||||||||
| (unless otherwise stated) | volume | price | cost | revenue(1) | EBITDA | EBIT | earnings | expenditure | ||||||||||||||||
| kt | c/lb | c/lb | ||||||||||||||||||||||
| Copper | 345 | (2) | 436 | (3) | 155 | (4) | 3,666 | 1,756 | 1,214 | 475 | 712 | |||||||||||||
| Copper Chile | 192 | (2) | 444 | (3) | 211 | (4) | 2,142 | 715 | 360 | n/a | 543 | |||||||||||||
| Los Bronces(5) | 82 | n/a | 248 | (4) | 813 | 293 | 126 | n/a | 121 | |||||||||||||||
| Collahuasi(6) | 86 | n/a | 181 | (4) | 859 | 379 | 253 | 161 | 403 | |||||||||||||||
| Other operations(7) | 24 | n/a | n/a | 470 | 43 | (19 | ) | n/a | 19 | |||||||||||||||
| Copper Peru | ||||||||||||||||||||||||
| (Quellaveco)(8) | 153 | 427 | 88 | (4) | 1,524 | 1,041 | 854 | 333 | 169 | |||||||||||||||
| Mt | $/t | $/t | ||||||||||||||||||||||
| Iron Ore | 31.0 | (9) | 89 | (10) | 35 | (11) | 3,224 | 1,410 | 1,055 | 415 | 520 | |||||||||||||
| Kumba Iron Ore(12) | 18.7 | (9) | 91 | (10) | 39 | (11) | 1,886 | 849 | 645 | 200 | 246 | |||||||||||||
| Iron
Ore Brazil (Minas-Rio) |
12.3 | (9) | 86 | (10) | 29 | (11) | 1,338 | 561 | 410 | 215 | 274 | |||||||||||||
| Mt | $/t | $/t | ||||||||||||||||||||||
| Manganese (Samancor) |
0.9 | n/a | n/a | 147 | (11 | ) | (52 | ) | (44 | ) | – | |||||||||||||
| Crop Nutrients | n/a | n/a | n/a | 78 | (30 | ) | (30 | ) | (35 | ) | 184 | |||||||||||||
| Woodsmith | n/a | n/a | n/a | 1 | n/a | n/a | n/a | 184 | ||||||||||||||||
| Other(13) | n/a | n/a | n/a | 77 | (30 | ) | (30 | ) | (35 | ) | – | |||||||||||||
| ‘000 cts | $/ct | $/ct | ||||||||||||||||||||||
| De Beers | 11,005 | (14) | 155 | (15) | 87 | (16) | 1,952 | (17) | (189 | ) | (303 | ) | (245 | ) | 172 | |||||||||
| Mining | ||||||||||||||||||||||||
| Botswana | n/a | 120 | (15) | 39 | (16) | n/a | 227 | 204 | n/a | 34 | ||||||||||||||
| Namibia | n/a | 340 | (15) | 215 | (16) | n/a | 78 | 58 | n/a | 7 | ||||||||||||||
| South Africa | n/a | 75 | (15) | 97 | (16) | n/a | (48 | ) | (72 | ) | n/a | 71 | ||||||||||||
| Canada | n/a | 60 | (15) | 59 | (16) | n/a | 27 | 20 | n/a | 52 | ||||||||||||||
| Trading | n/a | n/a | n/a | n/a | (260 | ) | (262 | ) | n/a | – | ||||||||||||||
| Other(18) | n/a | n/a | n/a | n/a | (213 | ) | (251 | ) | n/a | 8 | ||||||||||||||
| Corporate and other(19) | n/a | n/a | n/a | 186 | 19 | (59 | ) | (179 | ) | (2 | ) | |||||||||||||
| Exploration | n/a | n/a | n/a | n/a | (55 | ) | (55 | ) | (53 | ) | – | |||||||||||||
| Corporate activities and unallocated costs | n/a | n/a | n/a | 186 | 74 | (4 | ) | (126 | ) | (2 | ) | |||||||||||||
| n/a | n/a | n/a | 9,253 | 2,955 | 1,825 | 387 | 1,586 | |||||||||||||||||
| Discontinued operations | ||||||||||||||||||||||||
| koz (20) | $/PGM oz (21) | $/PGM oz (22) | ||||||||||||||||||||||
| Platinum Group Metals | 1,134 | 1,506 | 1,149 | 1,773 | 199 | 49 | (26 | ) | 353 | |||||||||||||||
| Mt | $/t | $/t | ||||||||||||||||||||||
| Steelmaking Coal(23) | 3.8 | 164 | 136 | 708 | (149 | ) | (206 | ) | (202 | ) | 149 | |||||||||||||
| kt | $/lb | $/lb | ||||||||||||||||||||||
| Nickel | 20 | 6.28 | 473 | 280 | 43 | 38 | 16 | 16 | ||||||||||||||||
| n/a | n/a | n/a | 2,761 | 93 | (119 | ) | (212) | (24) | 518 | |||||||||||||||
| n/a | n/a | n/a | 12,014 | 3,048 | 1,706 | 175 | 2,104 | |||||||||||||||||
| 84 | Anglo American plc Interim Results 2025 |
| Other information | Summary by operation |
See page 87 for footnotes.
| Continuing operations | 6 months ended | |||||||||||||||||||||||
| 30.06.24 (re-presented)(25) | ||||||||||||||||||||||||
| US$ million | Sales | Realised | Unit | Group | Underlying | Underlying | Underlying | Capital | ||||||||||||||||
| (unless otherwise stated) | volume | price | cost | revenue(1) | EBITDA | EBIT | earnings | expenditure | ||||||||||||||||
| kt | c/lb | c/lb | ||||||||||||||||||||||
| Copper | 391 | (2) | 429 | (3) | 152 | (4) | 3,875 | 2,038 | 1,564 | 742 | 855 | |||||||||||||
| Copper Chile | 242 | (2) | 437 | (3) | 176 | (4) | 2,455 | 1,196 | 893 | n/a | 620 | |||||||||||||
| Los Bronces(5) | 92 | n/a | 241 | (4) | 873 | 369 | 244 | n/a | 146 | |||||||||||||||
| Collahuasi(6) | 127 | n/a | 119 | (4) | 1,204 | 782 | 654 | 414 | 463 | |||||||||||||||
| Other operations(7) | 23 | n/a | n/a | 378 | 45 | (5 | ) | n/a | 11 | |||||||||||||||
| Copper
Peru (Quellaveco)(8) |
149 | 415 | 112 | (4) | 1,420 | 842 | 671 | 300 | 235 | |||||||||||||||
| Mt | $/t | $/t | ||||||||||||||||||||||
| Iron Ore | 29.5 | (9) | 93 | (10) | 37 | (11) | 3,296 | 1,413 | 1,171 | 574 | 495 | |||||||||||||
| Kumba Iron Ore(12) | 18.1 | (9) | 97 | (10) | 39 | (11) | 1,988 | 888 | 742 | 264 | 266 | |||||||||||||
| Iron Ore Brazil | ||||||||||||||||||||||||
| (Minas-Rio) | 11.4 | (9) | 86 | (10) | 33 | (11) | 1,308 | 525 | 429 | 310 | 229 | |||||||||||||
| Mt | $/t | $/t | ||||||||||||||||||||||
| Manganese (Samancor) |
1.2 | n/a | n/a | 219 | 11 | (35 | ) | (27 | ) | – | ||||||||||||||
| Crop Nutrients | n/a | n/a | n/a | 86 | (22 | ) | (22 | ) | (22 | ) | 500 | |||||||||||||
| Woodsmith | n/a | n/a | n/a | n/a | n/a | n/a | n/a | 500 | ||||||||||||||||
| Other(13) | n/a | n/a | n/a | 86 | (22 | ) | (22 | ) | (22 | ) | – | |||||||||||||
| ‘000 cts | $/ct | $/ct | ||||||||||||||||||||||
| De Beers | 11,945 | (14) | 164 | (15) | 85 | (16) | 2,247 | (17) | 300 | 150 | 73 | 264 | ||||||||||||
| Mining | ||||||||||||||||||||||||
| Botswana | n/a | 145 | (15) | 36 | (16) | n/a | 177 | 150 | n/a | 32 | ||||||||||||||
| Namibia | n/a | 435 | (15) | 270 | (16) | n/a | 84 | 66 | n/a | 18 | ||||||||||||||
| South Africa | n/a | 93 | (15) | 107 | (16) | n/a | (13 | ) | (41 | ) | n/a | 164 | ||||||||||||
| Canada | n/a | 80 | (15) | 51 | (16) | n/a | 41 | 23 | n/a | 28 | ||||||||||||||
| Trading | n/a | n/a | n/a | n/a | 58 | 56 | n/a | – | ||||||||||||||||
| Other(18) | n/a | n/a | n/a | n/a | (47 | ) | (104 | ) | n/a | 22 | ||||||||||||||
| Corporate and other(19) | n/a | n/a | n/a | 233 | (68 | ) | (227 | ) | (479 | ) | 15 | |||||||||||||
| Exploration | n/a | n/a | n/a | n/a | (60 | ) | (60 | ) | (56 | ) | – | |||||||||||||
| Corporate activities and unallocated costs | n/a | n/a | n/a | 233 | (8 | ) | (167 | ) | (423 | ) | 15 | |||||||||||||
| n/a | n/a | n/a | 9,956 | 3,672 | 2,601 | 861 | 2,129 | |||||||||||||||||
| Discontinued operations | ||||||||||||||||||||||||
| koz (20) | $/PGM oz (21) | $/PGM oz (22) | ||||||||||||||||||||||
| Platinum Group Metals | 1,974 | 1,442 | 976 | 2,796 | 675 | 481 | 258 | 455 | ||||||||||||||||
| Mt | $/t | $/t | ||||||||||||||||||||||
| Steelmaking Coal(23) | 7.9 | 265 | 125 | 2,108 | 592 | 346 | 155 | 257 | ||||||||||||||||
| kt | $/lb | $/lb | ||||||||||||||||||||||
| Nickel | 19 | 6.85 | 505 | 329 | 41 | 35 | 16 | 50 | ||||||||||||||||
| n/a | n/a | n/a | 5,233 | 1,308 | 862 | 429 (24) | 762 | |||||||||||||||||
| n/a | n/a | n/a | 15,189 | 4,980 | 3,463 | 1,290 | 2,891 | |||||||||||||||||
See page 87 for footnotes.
| Anglo American plc Interim Results 2025 | 85 |
| Other information | Summary by operation |
| Continuing operations | Year ended | |||||||||||||||||||||||
| 31.12.24 (re-presented)(25) | ||||||||||||||||||||||||
| US$ million | Sales | Realised | Unit | Group | Underlying | Underlying | Underlying | Capital | ||||||||||||||||
| (unless otherwise stated) | volume | price | cost | revenue(1) | EBITDA | EBIT | earnings | expenditure | ||||||||||||||||
| kt | c/lb | c/lb | ||||||||||||||||||||||
| Copper | 769 | (2) | 416 | (3) | 151 | (4) | 7,572 | 3,805 | 2,804 | 1,336 | 1,598 | |||||||||||||
| Copper Chile | 463 | (2) | 416 | (3) | 181 | (4) | 4,668 | 2,049 | 1,398 | n/a | 1,161 | |||||||||||||
| Los Bronces(5) | 174 | n/a | 273 | (4) | 1,535 | 467 | 189 | n/a | 277 | |||||||||||||||
| Collahuasi(6) | 242 | n/a | 120 | (4) | 2,293 | 1,447 | 1,175 | 747 | 837 | |||||||||||||||
| Other operations(7) | 47 | n/a | n/a | 840 | 135 | 34 | n/a | 47 | ||||||||||||||||
| Copper
Peru (Quellaveco)(8) |
306 | 415 | 105 | (4) | 2,904 | 1,756 | 1,406 | 622 | 437 | |||||||||||||||
| Mt | $/t | $/t | ||||||||||||||||||||||
| Iron Ore | 60.9 | (9) | 89 | (10) | 35 | (11) | 6,573 | 2,655 | 2,135 | 1,110 | 945 | |||||||||||||
| Kumba Iron Ore(12) | 36.2 | (9) | 92 | (10) | 39 | (11) | 3,796 | 1,581 | 1,260 | 450 | 527 | |||||||||||||
| Iron Ore
Brazil (Minas-Rio) |
24.7 | (9) | 84 | (10) | 30 | (11) | 2,777 | 1,074 | 875 | 660 | 418 | |||||||||||||
| Mt | $/t | $/t | ||||||||||||||||||||||
| Manganese (Samancor) | 1.9 | n/a | n/a | 359 | 116 | 31 | – | – | ||||||||||||||||
| Crop Nutrients | n/a | n/a | n/a | 188 | (34 | ) | (35 | ) | (27 | ) | 834 | |||||||||||||
| Woodsmith | n/a | n/a | n/a | n/a | n/a | n/a | n/a | 834 | ||||||||||||||||
| Other(13) | n/a | n/a | n/a | 188 | (34 | ) | (35 | ) | (27 | ) | – | |||||||||||||
| ‘000 cts | $/ct | $/ct | ||||||||||||||||||||||
| De Beers | 17,883 | (14) | 152 | (15) | 93 | (16) | 3,292 | (17) | (25 | ) | (349 | ) | (288 | ) | 536 | |||||||||
| Mining | ||||||||||||||||||||||||
| Botswana | n/a | 143 | (15) | 39 | (16) | n/a | 241 | 185 | n/a | 83 | ||||||||||||||
| Namibia | n/a | 426 | (15) | 295 | (16) | n/a | 121 | 82 | n/a | 41 | ||||||||||||||
| South Africa | n/a | 85 | (15) | 115 | (16) | n/a | (54 | ) | (126 | ) | n/a | 312 | ||||||||||||
| Canada | n/a | 79 | (15) | 56 | (16) | n/a | 45 | 11 | n/a | 63 | ||||||||||||||
| Trading | n/a | n/a | n/a | n/a | (50 | ) | (54 | ) | n/a | 1 | ||||||||||||||
| Other(18) | n/a | n/a | n/a | n/a | (328 | ) | (447 | ) | n/a | 36 | ||||||||||||||
| Corporate and other(19) | n/a | n/a | n/a | 500 | (195 | ) | (545 | ) | (789 | ) | 22 | |||||||||||||
| Exploration | n/a | n/a | n/a | n/a | (118 | ) | (118 | ) | (116 | ) | 1 | |||||||||||||
| Corporate activities and unallocated costs | n/a | n/a | n/a | 500 | (77 | ) | (427 | ) | (673 | ) | 21 | |||||||||||||
| n/a | n/a | n/a | 18,484 | 6,322 | 4,041 | 1,342 | 3,935 | |||||||||||||||||
| Discontinued operations | ||||||||||||||||||||||||
| koz (20) | $/PGM oz (21) | $/PGM oz (22) | ||||||||||||||||||||||
| Platinum Group Metals | 4,078 | 1,468 | 957 | 5,962 | 1,106 | 668 | 348 | 1,013 | ||||||||||||||||
| Mt | $/t | $/t | ||||||||||||||||||||||
| Steelmaking Coal(23) | 14.4 | 232 | 124 | 3,519 | 924 | 480 | 135 | 468 | ||||||||||||||||
| kt | $/lb | $/lb | ||||||||||||||||||||||
| Nickel | 39 | 6.82 | 481 | 617 | 108 | 96 | 112 | 74 | ||||||||||||||||
| n/a | n/a | n/a | 10,098 | 2,138 | 1,244 | 595 | (24) | 1,555 | ||||||||||||||||
| n/a | n/a | n/a | 28,582 | 8,460 | 5,285 | 1,937 | 5,490 | |||||||||||||||||
See page 87 for footnotes.
| 86 | Anglo American plc Interim Results 2025 |
| Other information | Summary by operation |
| (1) | Group revenue is shown after deduction of treatment and refining charges (TC/RCs). |
| (2) | Shown on a contained metal basis. Excludes 175 kt third-party sales (six months ended 30 June 2024: 168 kt and year ended 31 December 2024: 422kt). |
| (3) | Represents realised copper price and excludes impact of third-party sales. |
| (4) | C1 unit cost includes by-product credits. Total copper unit cost is a weighted average. |
| (5) | Figures on a 100% basis (Group’s share: 50.1%). |
| (6) | 44% share of Collahuasi sales and financials. |
| (7) | Other operations form part of the results of Copper Chile. Sales are from El Soldado mine (figures on a 100% basis, Group’s share: 50.1%). Financials include El Soldado and Chagres (figures on a 100% basis, Group’s share: 50.1%), third-party trading, projects, including Sakatti, and corporate costs. El Soldado mine C1 unit costs increased by 16% to 259c/lb (30 June 2024: 224c/lb). |
| (8) | Figures on a 100% basis (Group’s share: 60%). |
| (9) | Sales volumes are reported as wet metric tonnes. Product is shipped with c.1.5% moisture from Kumba and c.9% moisture from Minas-Rio. |
| (10) | Prices for Kumba Iron Ore are the average realised export basket price (FOB Saldanha) (wet basis). Prices for Minas-Rio are the average realised export basket price (FOB Brazil) (wet basis). Prices for total iron ore are a blended average. |
| (11) | Unit costs are reported on an FOB wet basis. Unit costs for total iron ore are a weighted average. |
| (12) | Sales volumes, stock and realised price could differ to Kumba’s stand-alone reported results due to sales to other Group companies. |
| (13) | Other comprises projects and corporate costs as well as the share in associate results from The Cibra Group, a fertiliser distributor based in Brazil. |
| (14) | Total sales volumes on a 100% basis were 12.3 million carats (six months ended 30 June 2024: 12.7 million carats and year ended 31 December 2024: 19.4 million carats). Total sales volumes (100%) include De Beers Group’s joint arrangement partners’ 50% proportionate share of sales to entities outside De Beers Group from Diamond Trading Company Botswana and Namibia Diamond Trading Company. |
| (15) | Pricing for the mining businesses is based on 100% selling value post-aggregation of goods. Realised price includes the price impact of the sale of non-equity product and, as a result, is not directly comparable to the unit cost. |
| (16) | Unit cost is based on consolidated production and operating costs, excluding depreciation and operating special items, divided by carats recovered. |
| (17) | Includes rough diamond sales of $1.7 billion (six months ended 30 June 2024: $2.0 billion and year ended 31 December 2024: $2.7 billion). |
| (18) | Other includes Element Six, brands and diamond desirability, and Corporate. |
| (19) | Revenue within Corporate activities and unallocated costs primarily relates to third-party shipping activities, marketing costs previously incurred by Nickel business unit which have not been discontinued, as well as the Marketing business’ energy solutions activities. Refer to note 4 for more details. |
| (20) | PGM sales volumes exclude tolling and third-party trading activities. SMC sales volumes exclude thermal coal sales of 0.8 Mt (six months ended 30 June 2024: 0.7 Mt; year ended 31 December 2024: 2.0 Mt). Includes sales relating to third-party product purchased and processed by Anglo American. |
| (21) | Price for a basket of goods per PGM oz. The dollar basket price is the net sales revenue from all metals sold (PGMs, base metals and other metals) excluding trading and foreign exchange translation impacts, per PGM 5E + gold ounces sold (own mined and purchase of concentrate) excluding trading, and measured in $/PGM oz. SMC price is realised price is the weighted average hard coking coal and PCI export sales price achieved at managed operations, measured in $/t. Nickel shows its realised price, measured in $/lb. |
| (22) | PGMs unit cost is total cash operating costs (includes on-mine, smelting and refining costs only) per own mined PGM ounce of production, measured in $/ PGM oz. SMC unit cost is FOB unit cost comprises managed operations and excludes royalties, measured in $/t. Nickel is C1 unit cost, measured in c/lb. |
| (23) | Anglo American’s attributable share of Jellinbah is 23.3%. Anglo American agreed the sale of its 33.33% stake in Jellinbah in November 2024, and this transaction has now completed on 29 January 2025. The results from Jellinbah post 1 November 2024, after the sale was agreed, did not accrue to Anglo American and have been excluded |
| (24) | Includes net finance costs, income tax and NCI of $93 million (six months ended 30 June 2024: $433 million and year end 31 December 2024: $649 million) |
| (25) | Comparative figures are re-presented to show separately results from discontinued operations, see note 22. |
| Anglo American plc Interim Results 2025 | 87 |
Other information
Alternative performance measures
Introduction
When assessing and discussing the Group’s reported financial performance, financial position and cash flows, management makes reference to Alternative Performance Measures (APMs) of historical or future financial performance, financial position or cash flows that are not defined or specified under International Financial Reporting Standards (IFRS).
The APMs used by the Group fall into two categories:
| – | Financial APMs: These financial measures are usually derived from the financial statements, prepared in accordance with IFRS. Certain financial measures cannot be directly derived from the financial statements as they contain additional information, such as financial information from earlier periods or profit estimates or projections. The accounting policies applied when calculating APMs are, where relevant and unless otherwise stated, substantially the same as those disclosed in the Group’s Consolidated financial statements for the year ended 31 December 2024 with the exception of the new accounting pronouncements disclosed in note 2. |
| – | Non-financial APMs: These measures incorporate certain non-financial information that management believes is useful when assessing the performance of the Group. |
APMs are not uniformly defined by all companies, including those in the Group’s industry. Accordingly, the APMs used by the Group may not be comparable with similarly titled measures and disclosures made by other companies.
APMs should be considered in addition to, and not as a substitute for or as superior to, measures of financial performance, financial position or cash flows reported in accordance with IFRS. Measures used by the Group exclude the impact of certain items, which impact the financial performance and cash flows, in order to aid comparability of financial information reported. The adjustments performed to defined IFRS measures and rationale for adjustments are detailed on pages 89 to 91.
Purpose
The Group uses APMs to improve the comparability of information between reporting periods and businesses, either by adjusting for uncontrollable factors or special items which impact upon IFRS measures or, by aggregating measures, to aid the user of the Annual Report in understanding the activity taking place across the Group’s portfolio.
Their use is driven by characteristics particularly visible in the mining sector:
| 1. | Earnings volatility: The Group mines and markets commodities, precious metals and minerals. The sector is characterised by significant volatility in earnings driven by movements in macro-economic factors, primarily price and foreign exchange. This volatility is outside the control of management and can mask underlying changes in performance. As such, when comparing year-on-year performance, management excludes certain items (such as those classed as ‘special items’) to aid comparability and then quantifies and isolates uncontrollable factors in order to improve understanding of the controllable portion of variances. |
| 2. | Nature of investment: Investments in the sector typically occur over several years and are large, requiring significant funding before generating cash. These investments are often made with partners and the nature of the Group’s ownership interest affects how the financial results of these operations are reflected in the Group’s results e.g. whether full consolidation (subsidiaries), consolidation of the Group’s attributable assets and liabilities (joint operations) or equity accounted (associates and joint ventures). Attributable metrics are therefore presented to help demonstrate the financial performance and returns available to the Group, for investment and financing activities, excluding the effect of different accounting treatments for different ownership interests. |
| 3. | Portfolio complexity: The Group operates in a number of different, but complementary commodities, precious metals and minerals. The cost, value of and return from each saleable unit (e.g. tonne, pound, carat, ounce) can differ materially between each business. This makes understanding both the overall portfolio performance, and the relative performance of its constituent parts on a like-for-like basis, more challenging. The Group therefore uses composite APMs to provide a consistent metric to assess performance at the portfolio level. |
| 88 | Anglo American plc Interim Results 2025 |
| Other information | Alternative performance measures |
Consequently, APMs are used by the Board and management for planning and reporting. A subset is also used by management in setting director and management remuneration, such as attributable free cash flow prior to growth capital expenditure. The measures are also used in discussions with the investment analyst community and credit rating agencies.
Updates to APMs
APMs marked with a (**) have been introduced for the current period. These are reflective of the impact of disposal groups and businesses being classified as assets held for sale qualifying as discontinued operations during the period. The measures are reconciled to the primary statements either in Note 4 or Note 22. Further details on each measure are provided in the table below:
Financial APMs
| Group APM | Closest equivalent IFRS measure | Adjustments to reconcile to primary statements (1) | Rationale for adjustments | |||
| Income statement | ||||||
| Group revenue | Revenue from continuing operations |
– Revenue from associates and joint ventures – Revenue special items and remeasurements |
– Exclude the impact of certain items due to their size and nature to aid comparability – Exclude the effect of different basis of consolidation to aid comparability |
|||
| Underlying EBIT | Profit/(loss) before net finance income/ (costs) and tax from continuing operations |
– Revenue, operating and non-operating special items and remeasurements – Underlying EBIT from associates and joint ventures |
– Exclude the impact of certain items due to their size and nature to aid comparability – Exclude the effect of different basis of consolidation to aid comparability |
|||
| Underlying EBITDA | Profit/(loss) before net finance income/ (costs) and tax from continuing operations |
– Revenue, operating and non-operating special items and remeasurements – Depreciation and amortisation – Underlying EBITDA from associates and joint ventures |
– Exclude the impact of certain items due to their size and nature to aid comparability – Exclude the effect of different basis of consolidation to aid comparability |
|||
| **Underlying EBITDA - discontinued operations | Profit/(loss) for the financial period from discontinued operations |
– Revenue, operating and non-operating special items and remeasurements from discontinued operations – Depreciation and amortisation from discontinued operations – Underlying EBITDA from associates and joint ventures from discontinued operations – Net finance income/(costs) and Income tax (expense)/credit from discontinued operations |
– Exclude the impact of certain items due to their size and nature to aid comparability – Exclude the effect of different basis of consolidation to aid comparability |
|||
| **Underlying EBITDA - Total Group | Profit/(loss) for the financial period |
– Revenue, operating and non-operating special items and remeasurements from continuing and discontinued operations – Depreciation and amortisation from continuing and discontinued operations – Underlying EBITDA from associates and joint ventures from continuing and discontinued operations – Net finance income/(costs) and Income tax (expense)/credit from continuing and discontinued operations |
– Exclude the impact of certain items due to their size and nature to aid comparability – Exclude the effect of different basis of consolidation to aid comparability |
|||
| Underlying earnings | Profit/(loss) for the financial period attributable to equity shareholders of the Company | – Special items and remeasurements |
– Exclude the impact of certain items due to their size and nature to aid comparability |
|||
| **Underlying earnings – continuing operations | Profit/(loss) for the financial year from continuing operations | – Special items and remeasurements |
– Exclude the impact of certain items due to their size and nature to aid comparability |
|||
| Anglo American plc Interim Results 2025 | 89 |
| Other information | Alternative performance measures |
| Group APM | Closest equivalent IFRS measure | Adjustments to reconcile to primary statements (1) | Rationale for adjustments | |||
| **Underlying earnings – discontinued operations | Profit/(loss) for the financial year from discontinued operations | – Special items and remeasurements |
– Exclude the impact of certain items due to their size and nature to aid comparability |
|||
| Underlying effective tax rate | Income tax expense from continuing operations |
– Tax related to special items and remeasurements – The Group’s share of associates’ and joint ventures’ profit before tax, before special items and remeasurements, and tax expense, before special items and remeasurements |
– Exclude the impact of certain items due to their size and nature to aid comparability – Exclude the effect of different basis of consolidation to aid comparability |
|||
| Basic underlying earnings per share | Earnings per share | – Special items and remeasurements |
– Exclude the impact of certain items due to their size and nature to aid comparability |
|||
| **Basic underlying earnings per share from continuing operations | Earnings per share |
– Special items and remeasurements – Earnings per share from discontinued operations |
– Exclude the impact of certain items due to their size and nature to aid comparability |
|||
| **Basic underlying earnings per share from discontinued operations | Earnings per share |
– Special items and remeasurements – Earnings per share from continuing operations |
– Exclude the impact of certain items due to their size and nature to aid comparability |
|||
| EBITDA margin | Operating profit margin from continuing operations, defined by IFRS |
– Revenue from associates and joint ventures – Revenue, operating and non-operating special items and remeasurements – Underlying EBIT from associates and joint ventures |
– To show earnings margin on the total cost base of the business – To align metric to reported targets for our strategy |
|||
| Balance sheet | ||||||
| Net debt | Borrowings less cash and related hedges |
– Debit valuation adjustment – Borrowings are adjusted to exclude vessel lease contracts that are priced with reference to a freight index – Borrowings do not include the royalty liability on the basis that obligations to make cash payments against this liability only arise when the Woodsmith project generates revenues, and that otherwise the Group is not currently contractually liable to make any payments under this arrangement (other than in the event of Anglo American Crop Nutrients Limited’s insolvency) |
– Exclude the impact of accounting adjustments from the net debt obligation of the Group – Exclude the volatility arising from vessel lease contracts that are priced with reference to a freight index. These liabilities are required to be remeasured at each reporting date to the latest spot freight rate, which means that the carrying value of the lease liability is not necessarily consistent with the average lease payments which are expected to be made over the lease term |
|||
| Attributable ROCE | No direct equivalent |
– Non-controlling interests’ share of capital employed and underlying EBIT (2) – Average of opening and closing attributable capital employed (2) |
– Exclude the effect of different basis of consolidation to aid comparability |
|||
| Cash flow - continuing operations | ||||||
| Capital expenditure (capex) | Expenditure on property, plant and equipment |
– Cash flows from derivatives related to capital expenditure – Proceeds from disposal of property, plant and equipment – Direct funding for capital expenditure from non-controlling interests |
– To reflect the net attributable cost of capital expenditure taking into account economic hedges |
|||
| Operating free cash flow | Cash flow from operations |
– Cash element of special items – Dividends from associates, joint ventures – Capital repayment of lease obligations – Sustaining capital expenditure |
– To measure the net cash generated by the business after capital expenditure, matching the cash flows of those items included within Underlying EBIT |
|||
| 90 | Anglo American plc Interim Results 2025 |
| Other information | Alternative performance measures |
| Group APM | Closest equivalent IFRS measure | Adjustments to reconcile to primary statements (1) | Rationale for adjustments | |||
| Sustaining attributable free cash flow | Cash flows from operations |
– Cash tax paid – Dividends from associates, joint ventures and financial asset investments – Net interest paid – Dividends to non-controlling interests – Capital repayment of lease obligations – Sustaining capital expenditure – Capitalised operating cash flows relating to life-extension projects |
– To measure the amount of cash available to finance returns to shareholders or growth after servicing debt, providing a return to minority shareholders and meeting the capex commitments needed to sustain the current production base of existing assets. It is calculated as attributable free cash flow prior to growth capex and expenditure on non-current intangible assets (excluding goodwill) |
|||
| Attributable free cash flow | Cash flows from operations |
– Capital expenditure – Cash tax paid – Dividends from associates, joint ventures and financial asset investments – Net interest paid – Dividends to non-controlling interests – Capital repayment of lease obligations – Expenditure on non-current intangible assets (excluding goodwill) |
– To measure the amount of cash available to finance returns to shareholders or growth after servicing debt, providing a return to minority shareholders and meeting existing capex commitments |
|||
| Cash conversion | No direct equivalent |
– Cash element of special items – Dividends from associates, joint ventures – Capital repayment of lease obligations – Sustaining capital expenditure – Revenue, operating and non-operating special items and remeasurements – Underlying EBIT from associates and joint ventures |
– Cash conversion is a ratio used to measure the efficiency of the business in generating cash from accounting profits. It is calculated as a ratio of operating free cash flow and Underlying EBIT |
| (1) | Adjustments to reconcile to primary statements are assumed to relate to continuing operations where the closest equivalent IFRS measure is a continuing operations measure. |
| (2) | Attributable ROCE has been calculated on a continuing operations basis. The attributable capital employed has been adjusted to exclude balances relating to entities classified as discontinued operations. |
Group revenue
Group revenue includes the Group’s attributable share of associates’ and joint ventures’ revenue and excludes revenue special items and remeasurements. A reconciliation to ‘Revenue’, the closest equivalent IFRS measure to Group revenue, is provided within note 4 to the Condensed financial statements.
Underlying EBIT
Underlying EBIT is ‘Operating profit/(loss)’ presented before special items and remeasurements(1) and includes the Group’s attributable share of associates’ and joint ventures’ underlying EBIT. Underlying EBIT of associates and joint ventures is the Group’s attributable share of associates’ and joint ventures’ revenue less operating costs before special items and remeasurements(1) of associates and joint ventures.
A reconciliation to ‘Profit/(loss) before net finance income/(costs) and tax’, the closest equivalent IFRS measure to underlying EBIT, is provided within note 4 to the Condensed financial statements.
Underlying EBITDA
Underlying EBITDA is underlying EBIT before depreciation and amortisation and includes the Group’s attributable share of associates’ and joint ventures’ underlying EBIT before depreciation and amortisation.
A reconciliation to ‘Profit/(loss) before net finance income/(costs) and tax’, the closest equivalent IFRS measure to underlying EBITDA, is provided within note 4 to the Condensed financial statements.
Underlying earnings
Underlying earnings is ‘Profit/(loss) for the financial year attributable to equity shareholders of the Company’ before special items and remeasurements(1) and is therefore presented after net finance costs, income tax expense and non-controlling interests.
A reconciliation to ‘Profit/(loss) for the financial year attributable to equity shareholders of the Company’, the closest equivalent IFRS measure to underlying earnings, is presented in the Consolidated income statement.
| Anglo American plc Interim Results 2025 | 91 |
| Other information | Alternative performance measures |
Underlying effective tax rate
The underlying effective tax rate equates to the income tax expense, before special items and remeasurements(1) and including the Group’s share of associates’ and joint ventures’ tax before special items and remeasurements, divided by profit before tax before special items and remeasurements and including the Group’s share of associates’ and joint ventures’ profit before tax before special items and remeasurements.
A reconciliation to ‘Income tax expense’, the closest equivalent IFRS measure to underlying effective tax rate, is provided within note 7 to the Condensed financial statements.
(1) Special items and remeasurements are defined in note 11 to the Condensed financial statements.
Underlying earnings per share
Basic and diluted underlying earnings per share are calculated as underlying earnings divided by the basic or diluted shares in issue. The calculation of underlying earnings per share is disclosed within note 5 to the Condensed financial statements.
EBITDA margin
The EBITDA margin is derived from the Group’s underlying EBITDA as a percentage of Group revenue. This is to reflect the profit margin of the business as a whole (including all costs) and aligns to the targets that were reported for our strategy.
| US$ million (unless otherwise stated) | 6 months ended 30.06.25 |
6 months ended 30.06.24 (re-presented)(1) |
||||||
| Underlying EBITDA | 2,955 | 3,672 | ||||||
| Group revenue | 9,253 | 9,956 | ||||||
| EBITDA margin | 32 | % | 37 | % | ||||
| (1) | Comparative figures are re-presented to show separately results from discontinued operations, see note 22. |
Net debt
Net debt is calculated as total borrowings less variable vessel lease contracts that are priced with reference to a freight index, and cash and cash equivalents (including derivatives that provide an economic hedge of net debt, but excluding the impact of the debit valuation adjustment on these derivatives, explained in note 15). A reconciliation to the Consolidated balance sheet is provided within note 15 to the Condensed financial statements.
Capital expenditure (capex)
Capital expenditure is defined as cash expenditure on property, plant and equipment, including related derivatives, and is presented net of proceeds from disposal of property, plant and equipment and includes direct funding for capital expenditure from non-controlling interests in order to match more closely the way in which it is managed. A reconciliation to ‘Expenditure on property, plant and equipment’, the closest equivalent IFRS measure to capital expenditure, is provided within note 13 to the Condensed financial statements.
Sustaining capital
Sustaining capital is calculated as stay-in-business, stripping and development, life-extension projects and proceeds from disposals of property, plant and equipment. The Group uses sustaining capital as a measure to provide additional information to understand the capital needed to sustain the current production base of existing assets.
Attributable return on capital employed (ROCE)
ROCE is a ratio that measures the efficiency and profitability of a company’s capital investments. Attributable ROCE displays how effectively assets are generating profit on invested capital for the equity shareholders of the Company. It is calculated as attributable underlying EBIT divided by average attributable capital employed.
Attributable underlying EBIT excludes the underlying EBIT of non-controlling interests.
Capital employed is defined as net assets excluding net debt, vessel lease contracts that are priced with reference to a freight index, the debit valuation adjustment attributable to derivatives hedging net debt and financial asset investments. Attributable capital employed excludes capital employed of non-controlling interests. Average attributable capital employed is calculated by adding the opening and closing attributable capital employed for the relevant period and dividing by two.
| 92 | Anglo American plc Interim Results 2025 |
| Other information | Alternative performance measures |
Attributable ROCE is also used as an incentive measure in executives’ remuneration and is predicated upon the achievement of ROCE targets assessed using an average across a three year performance period.
A reconciliation to ‘Profit/(loss) before net finance income/(costs) and tax’, the closest equivalent IFRS measure to underlying EBIT, is provided within note 4 to the Condensed financial statements. A reconciliation to ‘Net assets’, the closest equivalent IFRS measure to capital employed, is provided within note 12 to the Condensed financial statements. The table below reconciles underlying EBIT and capital employed to attributable underlying EBIT and average attributable capital employed by segment.
| Attributable ROCE % | ||||||||
| 6 months ended 30.06.25 |
6 months ended 30.06.24 (re-presented)(1) |
|||||||
| Copper | 18 | 25 | ||||||
| Iron Ore | 18 | 21 | ||||||
| Manganese | (50 | ) | (53 | ) | ||||
| Crop Nutrients | n/a | n/a | ||||||
| De Beers | (17 | ) | (4 | ) | ||||
| Corporate and other | n/a | n/a | ||||||
| 9 | 12 | |||||||
| (1) | Comparative figures are re-presented to show separately results from discontinued operations, see note 22. |
| 30.06.25 | ||||||||||||||||||||||||||||||||||||
| US$ million | Underlying EBIT | Annualised underlying EBIT | Less: Non- controlling interests’ share of underlying EBIT |
Attributable underlying EBIT | Opening attributable capital employed | Closing capital employed | Less: Non- controlling interests’ share of closing capital employed |
Closing attributable capital employed | Average attributable capital employed | |||||||||||||||||||||||||||
| Copper | 1,214 | 2,429 | (775 | ) | 1,654 | 9,192 | 14,088 | (4,547 | ) | 9,541 | 9,367 | |||||||||||||||||||||||||
| Iron Ore | 1,055 | 2,110 | (769 | ) | 1,341 | 7,258 | 10,068 | (2,458 | ) | 7,610 | 7,434 | |||||||||||||||||||||||||
| Manganese | (52 | ) | (105 | ) | – | (105 | ) | 210 | 214 | – | 214 | 212 | ||||||||||||||||||||||||
| Crop Nutrients | (30 | ) | (60 | ) | – | (60 | ) | 947 | 1,291 | – | 1,291 | 1,119 | ||||||||||||||||||||||||
| De Beers (2) | (303 | ) | (814 | ) | 122 | (692 | ) | 4,112 | 4,819 | (783 | ) | 4,036 | 4,074 | |||||||||||||||||||||||
| Corporate and other | (59 | ) | (118 | ) | 3 | (115 | ) | 505 | 656 | – | 656 | 580 | ||||||||||||||||||||||||
| 1,825 | 3,442 | (1,419 | ) | 2,023 | 22,224 | 31,136 | (7,788 | ) | 23,348 | 22,786 | ||||||||||||||||||||||||||
| 30.06.24 (re-presented)(1) | ||||||||||||||||||||||||||||||||||||
| US$ million | Underlying EBIT | Annualised underlying EBIT | Less: Non- controlling interests’ share of underlying EBIT |
Attributable underlying EBIT | Opening attributable capital employed | Closing capital employed | Less: Non- controlling interests’ share of closing capital employed |
Closing attributable capital employed | Average attributable capital employed | |||||||||||||||||||||||||||
| Copper | 1,564 | 3,129 | (810 | ) | 2,319 | 9,293 | 14,357 | (4,890 | ) | 9,467 | 9,380 | |||||||||||||||||||||||||
| Iron Ore | 1,171 | 2,341 | (729 | ) | 1,612 | 7,653 | 8,912 | (1,377 | ) | 7,535 | 7,594 | |||||||||||||||||||||||||
| Manganese | (35 | ) | (70 | ) | (3 | ) | (73 | ) | 141 | 134 | – | 134 | 137 | |||||||||||||||||||||||
| Crop Nutrients | (22 | ) | (44 | ) | – | (44 | ) | 1,309 | 412 | – | 412 | 860 | ||||||||||||||||||||||||
| De Beers (2) | 150 | (307 | ) | 40 | (267 | ) | 6,076 | 7,490 | (1,205 | ) | 6,285 | 6,181 | ||||||||||||||||||||||||
| Corporate and other | (227 | ) | (454 | ) | 26 | (428 | ) | 1,394 | 1,425 | (14 | ) | 1,412 | 1,402 | |||||||||||||||||||||||
| 2,601 | 4,595 | (1,476 | ) | 3,119 | 25,866 | 32,730 | (7,486 | ) | 25,245 | 25,554 | ||||||||||||||||||||||||||
| (1) | Comparative figures are re-presented to show separately results from discontinued operations, see note 22. |
| (2) | For half year reporting attributable underlying EBIT is annualised apart from the calculation of De Beers’ attributable ROCE, where it is based on the prior 12 months, rather than the annualised half year performance, owing to the seasonality of sales and underlying EBIT profile of De Beers. |
| Anglo American plc Interim Results 2025 | 93 |
| Other information | Alternative performance measures |
Operating free cash flow
Operating free cash flow is used to measure the amount of cash available to the business after sustaining capital expenditure, matching the cash flows with those items included within Underlying EBIT. It is defined as ‘Cash flows from operations’, including dividends from associates and joint ventures, less sustaining capital expenditure and the capital repayment of lease obligations and excludes the cash element of special items.
Continuing operations
| US$ million | 6 months ended 30.06.25 |
6 months ended 30.06.24 (re-presented)(1) |
||||||
| Cash flows from operations | 3,267 | 4,000 | ||||||
| Adjustments for: | ||||||||
| Dividends from associates, joint ventures and financial asset investments | 28 | 42 | ||||||
| Sustaining capital expenditure | (1,298 | ) | (1,494 | ) | ||||
| Capital repayment of lease obligations | (133 | ) | (167 | ) | ||||
| Cash element of special items | 115 | 37 | ||||||
| Operating free cash flow | 1,979 | 2,418 | ||||||
| (1) | Comparative figures are re-presented to show separately results from discontinued operations, see note 22. |
Sustaining attributable free cash flow
Sustaining attributable free cash flow is used to measure the amount of cash available to finance returns to shareholders or growth after servicing debt, providing a return to minority shareholders and meeting the capex commitments needed to sustain the current production base of existing assets. Sustaining attributable free cash flow is also used as an incentive measure in executives’ remuneration. It is calculated as attributable free cash flow prior to growth capex and expenditure on non-current intangible assets (excluding goodwill). A reconciliation of ‘Cash flows from operations’, the closest equivalent IFRS measure, is provided on page 7 of the Group financial review.
Attributable free cash flow
Attributable free cash flow is calculated as ‘Cash flows from operations’ plus dividends received from associates, joint ventures and financial asset investments, less capital expenditure, less expenditure on non-current intangible assets (excluding goodwill), less tax cash payments excluding tax payments relating to disposals, less net interest paid including interest on derivatives hedging net debt, less dividends paid to non-controlling interests.
A reconciliation of ‘Cash flows from operations’, the closest equivalent IFRS measure, is provided on page 7 of the Group financial review.
Cash conversion
Cash conversion is a ratio used to measure the efficiency of the business in generating cash from accounting profits. It is calculated as a ratio of operating free cash flow and Underlying EBIT.
| US$ million (unless otherwise stated) | 6 months ended 30.06.25 |
6 months ended 30.06.24 (re-presented)(1) |
||||||
| Operating free cash flow | 1,979 | 2,418 | ||||||
| Underlying EBIT | 1,825 | 2,601 | ||||||
| Cash conversion (Operating Free Cashflow: Underlying EBIT) | 108 | % | 93 | % | ||||
| (1) | Comparative figures are re-presented to show separately results from discontinued operations, see note 22. |
| 94 | Anglo American plc Interim Results 2025 |
| Other information | Alternative performance measures |
Non-financial APMs
Some of our measures are not reconciled to IFRS either because they include non-financial information, there is no meaningful IFRS comparison or the purpose of the measure is not typically covered by IFRS.
Copper equivalent production
Copper equivalent production, expressed as copper equivalent tonnes, shows changes in underlying production volume. It is calculated by expressing each commodity’s volume as revenue, subsequently converting the revenue into copper equivalent units by dividing by the copper price (per tonne). Long term forecast prices (and foreign exchange rates where appropriate) are used, in order that period-on-period comparisons exclude any impact for movements in price.
When calculating copper equivalent production, sales from non-mining activities are excluded. Volume from projects in pre-commercial production are included.
Unit cost
Unit cost is the direct cash cost including direct cash support costs incurred in producing one unit of saleable production. Unit cost relates to equity production only.
For iron ore and coal, unit costs shown are FOB i.e. cost on board at port. For copper and nickel, they are shown at C1 i.e. after inclusion of by-product credits and logistics costs. For PGMs and diamonds, unit costs include all direct expensed cash costs incurred i.e. excluding, among other things, market development activity, corporate overhead etc. Royalties are excluded from all unit cost calculations.
Copper equivalent unit cost
Copper equivalent unit cost is the cost incurred to produce one tonne of copper equivalent. Only the cost incurred in mined output from subsidiaries and joint operations is included, representing direct costs in the Consolidated income statement controllable by the Group. Costs and volumes from associates and joint ventures are excluded, as are those from operations that are not yet in commercial production, that deliver domestic production, and those associated with third-party volume purchases of diamonds and PGMs concentrate.
When calculating copper equivalent unit cost, unit costs for each commodity are multiplied by relevant production, combined and then divided by the total copper equivalent production, to get a copper equivalent unit cost i.e. the cost of mining one tonne of copper equivalent. The metric is in US dollars and, where appropriate, long term foreign exchange rates are used to convert from local currency to US dollars.
Volume and cash cost improvements
The Group uses an underlying EBITDA waterfall to understand its year-on-year underlying EBITDA performance. The waterfall isolates the impact of uncontrollable factors in order that the real year-on-year improvement in performance can be seen by the user.
Three variables are normalised, in the results of subsidiaries and joint operations, for:
| – | Price: The movement in price between comparative periods is removed by multiplying current year sales volume by the movement in realised price for each product group. |
| – | Foreign exchange: The year-on-year movement in exchange is removed from the current year non-US dollar cost base i.e. costs are restated at prior year foreign exchange rates. The non-US dollar cash cost base excludes costs which are price linked (e.g. purchase of concentrate from third-party PGMs providers, third-party diamond purchases). |
| – | Inflation: CPI is removed from cash costs, restating these costs at the pricing level of the base year. |
The remaining variances in the underlying EBITDA waterfall are in real US dollar terms for the base year i.e. for a waterfall comparing 2025 with 2024, the sales volume and cash cost variances exclude the impact of price, foreign exchange and CPI and are hence in real 2024 terms. This allows the user of the waterfall to understand the underlying real movement in sales volumes and cash costs on a consistent basis.
| Anglo American plc Interim Results 2025 | 95 |
| Other information | |
Exchange rates and commodity prices
| US$ exchange rates | 30.06.25 | 30.06.24 | 31.12.24 | |||||||||
| Period end spot rates | ||||||||||||
| South African rand | 17.81 | 18.19 | 18.73 | |||||||||
| Brazilian real | 5.48 | 5.54 | 6.18 | |||||||||
| Sterling | 0.73 | 0.79 | 0.80 | |||||||||
| Australian dollar | 1.53 | 1.50 | 1.61 | |||||||||
| Euro | 0.85 | 0.93 | 0.96 | |||||||||
| Chilean peso | 943 | 943 | 990 | |||||||||
| Botswana pula | 13.33 | 13.59 | 13.94 | |||||||||
| Peruvian sol | 3.55 | 3.83 | 3.76 | |||||||||
| Average rates for the period | ||||||||||||
| South African rand | 18.40 | 18.73 | 18.32 | |||||||||
| Brazilian real | 5.76 | 5.08 | 5.38 | |||||||||
| Sterling | 0.77 | 0.79 | 0.78 | |||||||||
| Australian dollar | 1.58 | 1.52 | 1.52 | |||||||||
| Euro | 0.92 | 0.92 | 0.92 | |||||||||
| Chilean peso | 956 | 941 | 944 | |||||||||
| Botswana pula | 13.71 | 13.66 | 13.56 | |||||||||
| Peruvian sol | 3.68 | 3.75 | 3.75 | |||||||||
| Commodity prices | 30.06.25 | 30.06.24 | 31.12.24 | |||||||||||
| Period end spot prices | ||||||||||||||
| Copper(1) | US cents/lb | 455 | 430 | 395 | ||||||||||
| Iron ore (62% Fe CFR)(2) | US$/tonne | 94 | 107 | 100 | ||||||||||
| Iron ore (65% Fe Fines CFR)(3) | US$/tonne | 105 | 123 | 115 | ||||||||||
| Platinum(4) | US$/oz | 1,071 | 1,012 | 914 | ||||||||||
| Palladium(4) | US$/oz | 964 | 972 | 909 | ||||||||||
| Rhodium(5) | US$/oz | 5,355 | 4,650 | 4,575 | ||||||||||
| Hard coking coal (FOB Australia)(2) | US$/tonne | 174 | 234 | 197 | ||||||||||
| PCI (FOB Australia)(2) | US$/tonne | 138 | 182 | 150 | ||||||||||
| Nickel(1) | US$/lb | 6.81 | 7.69 | 6.85 | ||||||||||
| Manganese ore (44% CIF China)(3) | US$/dmtu | 4.20 | 8.30 | 4.08 | ||||||||||
| Average market prices for the period | ||||||||||||||
| Copper(1) | US cents/lb | 428 | 412 | 415 | ||||||||||
| Iron ore (62% Fe CFR)(2) | US$/tonne | 101 | 118 | 109 | ||||||||||
| Iron ore (65% Fe Fines CFR)(3) | US$/tonne | 113 | 131 | 123 | ||||||||||
| Platinum(4) | US$/oz | 977 | 945 | 956 | ||||||||||
| Palladium(4) | US$/oz | 964 | 976 | 984 | ||||||||||
| Rhodium(5) | US$/oz | 5,126 | 4,602 | 4,637 | ||||||||||
| Hard coking coal (FOB Australia)(2) | US$/tonne | 185 | 276 | 240 | ||||||||||
| PCI (FOB Australia)(2) | US$/tonne | 139 | 164 | 165 | ||||||||||
| Nickel(1) | US$/lb | 6.97 | 7.94 | 7.63 | ||||||||||
| Manganese ore (44% CIF China)(3) | US$/dmtu | 4.53 | 5.54 | 5.56 | ||||||||||
| (1) | Source: London Metal Exchange (LME). |
| (2) | Source: Platts. |
| (3) | Source: Metal Bulletin. |
| (4) | Source: London Platinum and Palladium Market (LPPM). For 2025, spot price is 31 May 2025 and average is May YTD. |
| (5) | Source: Johnson Matthey. For 2025, spot price is 31 May 2025 and average is May YTD. |
| 96 | Anglo American plc Interim Results 2025 |
| ANGLO AMERICAN plc | ||
| (Incorporated in
England and Wales – Registered number 03564138) (the Company) |
||
| Notice of Dividend | ||
| (Dividend No. 47) | ||
| Notice is hereby given that an interim dividend on the Company’s ordinary share capital in respect of the year to 31 December 2025 will be paid as follows: | ||
| Amount (United States currency) (note 1) | 7 cents per ordinary share | |
| Amount (South Africa currency) (note 2) | 125.01720 cents per ordinary share | |
| Amount (Botswana currency) (note 3) | 99.29080 thebes per ordinary share | |
| Last day to effect transfer of shares between the United Kingdom (UK) and branch share registers | Monday, 18 August 2025 | |
| Last day to trade on the JSE Limited (JSE) to qualify for dividend | Tuesday, 19 August 2025 | |
| Ex-dividend on the JSE from the commencement of trading (note 4) | Wednesday, 20 August 2025 | |
| Ex-dividend on the Botswana Stock Exchange (BSE) from the commencement of trading | Wednesday, 20 August 2025 | |
| Ex-dividend on the London Stock Exchange from the commencement of trading | Thursday, 21 August 2025 | |
| Record date (applicable to both the principal register and branch registers) | Friday, 22 August 2025 | |
| Movement of shares between the principal and branch registers permissible from | Tuesday, 26 August 2025 | |
| Last day for receipt of Dividend Reinvestment Plan (DRIP) mandate forms by Central Securities Depository Participants (CSDPs) (notes 5, 6 and 7) | Monday, 8 September 2025 | |
| Last day for receipt of US$:£/€ currency elections by the UK Registrars (note 1) | Monday, 8 September 2025 | |
| Last day for receipt of DRIP mandate forms by the UK Registrars (notes 5, 6 and 7) | Monday, 8 September 2025 | |
| Last day for receipt of DRIP mandate forms by the South African Transfer Secretaries (notes 5, 6 and 7) | Wednesday, 10 September 2025 | |
| Currency conversion US$:£/€ rates announced on (note 8) | Monday, 15 September 2025 | |
| Payment date of dividend | Tuesday, 30 September 2025 | |
| Results of Dividend Reinvestment Plan released | Wednesday, 15 October 2025 | |
Notes
| 1. | Shareholders on the UK register of members with an address in the UK will be paid in Sterling and those with an address in a country in the European Union which has adopted the Euro will be paid in Euros. Such shareholders may, however, elect to be paid their dividends in US dollars provided the UK Registrars receive such election by Monday, 8 September 2025. Shareholders with an address elsewhere will be paid in US dollars except those registered on the South African branch register who will be paid in South African rand and those registered on the Botswanan branch register who will be paid in Botswana Pula. |
| 2. | Dividend Tax will be withheld from the amount of the gross dividend of 125.01720 Rand cents per ordinary share paid to South African shareholders at the rate of 20% unless a shareholder qualifies for exemption. After the Dividend Tax has been withheld, the net dividend will be 100.01376 Rand cents per ordinary share. Anglo American plc had a total of 1,178,050,272 ordinary shares in issue as at Wednesday, 30 July 2025. In South Africa the dividend will be distributed by Anglo American South Africa Proprietary Limited, a South African company with tax registration number 9030010608, or one of its South African subsidiaries, in accordance with the Company’s dividend access share arrangements. The dividend in South African rand is based on an exchange rate of USD1:ZAR17.85960 taken on Wednesday, 30 July 2025, being the currency conversion date. |
| 3. | The dividend in Botswana Pula is based on an exchange rate of USD1:BWP14.18440 taken on Wednesday, 30 July 2025, being the currency conversion date. |
| 4. | Dematerialisation and rematerialisation of registered share certificates in South Africa will not be effected by CSDPs during the period from the JSE ex-dividend date to the record date (both days inclusive). |
| 5. | Those shareholders who already participate in the DRIP need not complete a DRIP mandate form for each dividend as such forms provide an ongoing authority to participate in the DRIP until cancelled in writing. Shareholders who wish to participate in the DRIP should obtain a mandate form from the UK Registrars, the South African Transfer Secretaries or, in the case of those who hold their shares through the STRATE system, their CSDP. |
| 6. | In terms of the DRIP, and subject to the purchase of shares in the open market, share certificates/CREST notifications are expected to be mailed and CSDP investor accounts credited/updated on or around Tuesday, 14 October 2025. CREST accounts will be credited on Friday, 3 October 2025. |
| 7. | Copies of the terms and conditions of the DRIP provided by Equiniti Financial Services Limited are available from the UK Registrars at www.shareview.co.uk/info/ drip or the South African Transfer Secretaries for the South African Branch Register DRIP. |
| 8. | The US$:£/€ conversion rates will be determined by the actual rates achieved by Anglo American buying forward contracts for those currencies, during the three days preceding the announcement of the conversion rates, for delivery on the dividend payment date. |
| Registered office | UK Registrars | South African Transfer Secretaries | Transfer Secretaries in Botswana | |||
| 17 Charterhouse Street | EQ (formerly Equiniti) | Computershare Investor Services | Central Securities in Depository Botswana | |||
| London | Aspect House | (Pty) Limited | (PTY) LTD | |||
| EC1N 6RA | Spencer Road | Rosebank Towers, 15 Biermann Avenue | Plot 70667, Fairscape, Precinct, | |||
| United Kingdom | Lancing | Rosebank, 2196, South Africa | Fargrounds, Gaborone, Botswana | |||
| West Sussex | Private Bag X9000 | Private Bag 00417, Gaborone | ||||
| BN99 6DA | Saxonwold, 2132 | Botswana | ||||
| United Kingdom | South Africa |
©Anglo American plc 2025. All rights reserved.
| Anglo American plc Interim Results 2025 | 97 |
Exhibit 99.2
| 214 | Anglo American plc | Financial statements and other financial information |
| Integrated Annual Report 2023 |
Independent auditors’ report to the members of Anglo American plc
Report on the audit of the financial statements
Opinion
In our opinion:
| – | Anglo American plc’s Group financial statements and Parent Company financial statements (the “financial statements”) give a true and fair view of the state of the Group’s and of the Parent Company’s affairs as at 31 December 2023 and of the Group’s profit and the Group’s cash flows for the year then ended; |
| – | the Group financial statements have been properly prepared in accordance with UK-adopted international accounting standards as applied in accordance with the provisions of the Companies Act 2006; |
| – | the Parent Company financial statements have been properly prepared in accordance with United Kingdom Generally Accepted Accounting Practice (United Kingdom Accounting Standards, including FRS 101 “Reduced Disclosure Framework”, and applicable law); and |
| – | the financial statements have been prepared in accordance with the requirements of the Companies Act 2006. |
We have audited the financial statements, included within the Integrated Annual Report 2023 (the “Annual Report”), which comprise: the Consolidated and Parent Company balance sheets as at 31 December 2023; the Consolidated income statement, the Consolidated statement of comprehensive income, the Consolidated cash flow statement and the Consolidated and Parent Company statements of changes in equity for the year then ended; and the notes to the financial statements, comprising material accounting policy information and other explanatory information.
Our opinion is consistent with our reporting to the Audit Committee.
Basis for opinion
We conducted our audit in accordance with International Standards on Auditing (UK) (“ISAs (UK)”) and applicable law. Our responsibilities under ISAs (UK) are further described in the Auditors’ responsibilities for the audit of the financial statements section of our report. We believe that the audit evidence we have obtained is sufficient and appropriate to provide a basis for our opinion.
Independence
We remained independent of the Group in accordance with the ethical requirements that are relevant to our audit of the financial statements in the UK, which includes the FRC’s Ethical Standard, as applicable to listed public interest entities, and we have fulfilled our other ethical responsibilities in accordance with these requirements.
To the best of our knowledge and belief, we declare that non-audit services prohibited by the FRC’s Ethical Standard were not provided.
Other than those disclosed in note 38, we have provided no non-audit services to the Parent Company or its controlled undertakings in the period under audit.
Our audit approach
Overview
Audit scope
| – | Our audit included full scope audits, audit of specific account balances or specified procedures at each of the Group’s twelve in-scope businesses, joint ventures and associates (“components”). |
| – | Taken together, the components at which audit work was performed accounted for 98% of consolidated revenue, 95% of consolidated profit before tax and 94% of consolidated profit before tax, special items and remeasurements. |
Key audit matters
| – | Assessment of impairment and impairment reversals for intangible assets, property, plant and equipment (Group) and investments in subsidiaries (Parent Company) |
| – | Provisions for environmental restoration and decommissioning (Group) |
Materiality
| – | Overall Group materiality: $400 million (2022: $400 million) based on approximately 3.4% of the Group’s three year-average consolidated profit before tax, special items and remeasurements. |
| – | Overall Parent Company materiality: $300 million (2022: $300 million) based on approximately 1% of the Parent Company’s total assets. |
| – | Performance materiality: $300 million (2022: $300 million) (Group) and $225 million (2022: $225 million) (Parent Company). |
The scope of our audit
As part of designing our audit, we determined materiality and assessed the risks of material misstatement in the financial statements.
Key audit matters
Key audit matters are those matters that, in the auditors’ professional judgement, were of most significance in the audit of the financial statements of the current period and include the most significant assessed risks of material misstatement (whether or not due to fraud) identified by the auditors, including those which had the greatest effect on: the overall audit strategy; the allocation of resources in the audit; and directing the efforts of the engagement team. These matters, and any comments we make on the results of our procedures thereon, were addressed in the context of our audit of the financial statements as a whole, and in forming our opinion thereon, and we do not provide a separate opinion on these matters.
This is not a complete list of all risks identified by our audit.
The key audit matters below are consistent with last year.
| Anglo American plc | Financial statements and other financial information | 215 |
| Integrated Annual Report 2023 | Independent auditors’ report to the members of Anglo American plc |
| Key audit matter | How our audit addressed the key audit matter | |
|
Assessment of impairment and impairment reversals for intangible assets, property, plant and equipment (Group) and investments in subsidiaries (Parent Company)
As at 31 December 2023, the Group has intangible assets of $1,479 million (2022: $2,828 million) and property, plant and equipment of $43,949 million (2022: $41,125 million). All of these asset categories require review for indicators of impairment, and where relevant, impairment reversal.
The determination of whether an impairment or impairment reversal indicator exists can be judgemental. Management must determine the recoverable amount when impairment indicators or indicators of impairment reversal are identified.
Goodwill is required to be tested for impairment at least annually. The Group’s goodwill of $270 million (2022: $1,671 million), decreased following the impairment recorded during the year at De Beers of $1.6 billion.
The determination of recoverable amount, being the higher of value-in-use (“VIU”) and fair value less costs of disposal (“FVLCD”), requires judgement and estimation on the part of management in identifying and then determining the recoverable amounts for the relevant cash-generating units (“CGUs”). Recoverable amounts are based on management’s view of key value driver inputs and external market conditions such as future commodity prices, budgeted operating expenditure, the timing and approval of future capital expenditure, and the most appropriate discount rate. As these assumptions were derived from observable data available to a market participant as required under IFRS, they are not necessarily aligned with the Paris Agreement scenario. Estimation uncertainty is considered to be significant due to the long lives of the majority of assets and uncertainty in the quantum and timing of cash flows, including the uncertain impact of climate change on the Group’s operations, as described in note 7 to the financial statements.
Impairment indicators were identified in the year for Minas-Rio (Iron Ore Brazil) and Barro Alto (Nickel). No indicators for impairment reversal were identified. As indicators for impairment were identified in respect of these CGUs, management prepared a detailed cash flow model on a FVLCD basis to estimate the recoverable amount. Management’s analysis over those CGUs with indicators for impairment determined that an impairment loss during the year had occurred within the Barro Alto CGU of $0.8 billion. This includes the impairment of $0.4 billion recognised within Barro Alto at the half year ended 30 June 2023.
Separately, the Group holds goodwill associated with the De Beers and Platinum Group Metals segments and the Los Bronces - Chagres (Copper Chile) CGU and so annual goodwill impairment tests are performed for these assets. Management’s analysis over those assets with goodwill determined that an impairment loss had occurred at De Beers ($1.6 billion).
Refer to notes 7 and 8 for management conclusions and the Audit Committee’s views on page 170.
At 31 December 2023, the Parent Company holds investments in subsidiaries amounting to $33,113 million (2022: $32,971 million). Investments in subsidiaries are accounted for at historical cost less accumulated impairment. Judgement is required to assess if impairment indicators exist and where indicators are identified, if the investment carrying value is supported by the recoverable amount. In forming this assessment, management compares the underlying net assets of the investments to their carrying amount and any other relevant facts and circumstances, including the impact of any impairments recorded in the Group financial statements.
Refer to note 1 to the Parent Company’s financial statements. |
For all material finite-lived intangible assets and property, plant and equipment, we undertook the following to test management’s assessment for indicators of impairment/impairment reversal:
– we understood management’s processes and evaluated the design and implementation of controls in respect of the impairment indicator assessment process;
– we assessed the appropriateness of management’s identification of the Group’s CGUs; and
– we evaluated and challenged management’s assessment and judgements in respect of impairment/impairment reversal indicators, including ensuring that the impact of climate change, and recent commodity price and foreign exchange volatility, were appropriately considered in management’s impairment indicator assessment and conclusions.
For each CGU where indicators for impairment were identified, and in respect of the De Beers segment and other CGUs where an annual goodwill impairment test was required, management prepared a detailed cash flow model on a FVLCD basis to estimate the recoverable amount, or compared the carrying value to the fair value indicated by the share price of listed subsidiaries, where relevant. Our procedures in respect of each model included:
– verifying the integrity of formulae and the mathematical accuracy of management’s valuation models;
– consideration of the impact of the latest life of asset plan assumptions and ensuring that the valuation model reflects the latest plans and, where relevant, sufficient value has been attributed to residual reserves and resources to the extent this would be undertaken by a third party market participant. This included assessing the competence and objectivity of management’s internal technical experts in preparing the plan as well as reviewing the supporting information underpinning the internal expert’s report, where appropriate;
– assessing the reliability of management’s forecast capital and operating expenses with reference to comparing budgeted results with actual performance in prior periods;
– with the support of our valuations experts, assessing the discount rate used in each model and whether it fell within a reasonable range taking into account external market data. Our assessment of discount rates also included consideration of country and asset specific risks and challenging management to ensure that these had been appropriately captured in either the discount rate or underlying cash flow forecasts;
– benchmarking management’s forecast commodity price and foreign exchange assumptions against our own collated consensus data to assess whether they fell within an external analyst range. Specifically in respect of De Beers, we engaged our economics experts to challenge and assess the appropriateness of the methodology and assumptions used in deriving forecast diamond prices;
– challenging and verifying that the cash flow forecasts appropriately captured and considered the impact of carbon emissions on price, mine plan costs and cost of capital, where material;
– verifying that costs and benefits of the implementation of projects to mitigate physical climate risk were appropriately included in cash flow forecasts, where such costs and benefits have been incorporated into the approved life of asset plan;
– assessing whether the assumptions had been determined and applied on a consistent basis, where relevant, across the Group; and
– assessing the disclosure made over the impairment charges and sensitivities within note 8 to the financial statements and challenging management where any inconsistencies were noted. |
| 216 | Anglo American plc | Financial statements and other financial information |
| Integrated Annual Report 2023 | Independent auditors’ report to the members of Anglo American plc |
| Key audit matter | How our audit addressed the key audit matter | |
|
Based on the procedures performed, we noted no material issues arising from our work.
In respect of investments in subsidiaries in the Parent Company, we undertook the following to test management’s assessment for indicators of impairment:
– evaluated and challenged management’s assessment and judgements, including ensuring that consideration had been given to the results of the Group’s impairment assessment in respect of intangible assets and property, plant and equipment;
– verified the mathematical accuracy of management’s assessment including that the net assets of the subsidiaries being assessed agreed to the respective subsidiary balance sheet at 31 December 2023; and
– examined management’s assessment of other internal and external impairment indicators, including considering the market capitalisation of the Group with reference to the carrying value of investments in subsidiaries in the Parent Company to identify other possible impairment indicators.
Based on the procedures performed, we noted no material issues arising from our work. |
| Anglo American plc | Financial statements and other financial information | 217 |
| Integrated Annual Report 2023 | Independent auditors’ report to the members of Anglo American plc |
| Key audit matter | How our audit addressed the key audit matter | |
|
Provisions for environmental restoration and decommissioning (Group)
The Group has provisions for environmental restoration and decommissioning of $2,801 million as at 31 December 2023 (2022: $2,667 million).
The calculation of these provisions requires management to estimate the quantum and timing of future costs, taking into account the unique nature of each site, the long timescales involved and the potential associated obligations. These calculations also require management to determine an appropriate rate to discount future costs to their net present value.
Management reviews the environmental restoration and decommissioning obligations at each reporting period, using experts to provide support in its assessment where appropriate. This review incorporates the effects of any changes in local regulations, mining disturbance and rehabilitation activities that have taken place during the year, and management’s anticipated approach to restoration and rehabilitation.
During the 2023 financial year, the Group announced its significant progress towards conformance for all tailings dams in the highest priority rankings according to the GISTM. The Group continues to refine designs and all material costs of conformance with GISTM have been recorded within decommissioning and environmental restoration provisions.
Refer to note 16 for management’s conclusions and the Audit Committee’s views on page 171. |
We assessed management’s process for the review of environmental restoration and decommissioning provisions and, for those estimates we consider to be material, performed detailed testing in respect of the cost estimates.
We validated the existence of legal and/or constructive obligations with respect to the provision and considered whether the intended method of restoration and rehabilitation was appropriate. We evaluated the competence and objectivity of management’s experts who produced cost estimates. We read correspondence between management and management’s experts, as well as with mining regulatory bodies, where applicable, and also held meetings with the experts, where relevant, to understand their methodology and inputs. We considered whether any risks associated with climate change impacted either the timing or extent of remediation activities.
For certain of the Group’s environmental restoration and decommissioning provisions, we engaged our own internal experts to assess the work performed by management’s expert. This assessment included a review of any potential contingent liabilities which are not provided for, and identification of any other potential costs requiring recognition or disclosure that could be material.
In assessing the appropriateness of cost estimates, we focused on validating that costs underpinning the accounting provision represent management’s and the experts’ best estimate of expenditure, based on the current extent of mine disturbance as well as any risk adjustments included in the estimate. In respect of claims that have been made by regulatory authorities or government bodies regarding closure estimates, we met with legal counsel, where relevant, to assess the probable outcomes in relation to ongoing claims and exposure and areas where legal requirements are open to interpretation. We assessed the timing of the cash flows and discount rates applied to calculate the present value of estimated costs by comparing the rates applied by management to the yields on government bonds with maturities approximating the timing of cash flows for each territory and currency.
Specifically in relation to the Group’s conformance with the GISTM, we obtained the assessments performed by management to ensure cost estimates had been included for any material expenditure required with respect to the tailings facilities.
We validated the integrity of formulae and mathematical accuracy of management’s calculations.
Based on the procedures performed, we noted no material issues arising from our work. |
| 218 | Anglo American plc | Financial statements and other financial information |
| Integrated Annual Report 2023 | Independent auditors’ report to the members of Anglo American plc |
How we tailored the audit scope
We tailored the scope of our audit to ensure that we performed enough work to be able to give an opinion on the financial statements as a whole, taking into account the structure of the Group and the Parent Company, the accounting processes and controls, and the industry in which they operate.
The Group is organised into eight reportable segments – De Beers, Copper, Platinum Group Metals, Iron Ore, Steelmaking Coal, Nickel, Manganese and Crop Nutrients, as well as a Corporate function. Each segment is further divided into businesses which align to discrete country or joint venture operations. We have identified each business as a component, with each component typically representing a consolidation of a number of discrete country operations.
The Group’s accounting processes for managed operations are structured around a local finance function at each component, which is supported by the Group’s central functions including: i) one of the Group’s three shared service centres in South Africa, Brazil or Australia; and ii) with the exception of De Beers and Steelmaking Coal, the Group’s Marketing business in Singapore where the majority of the Group’s commodity sales are transacted and processed. Each component reports to the Group through an integrated consolidation system.
Based on our risk and materiality assessments, we determined which components required an audit of their complete financial information having consideration to the relative significance of each component to the Group, locations with significant inherent risks and the overall coverage obtained over each material line item in the consolidated financial statements.
We scoped in ten components requiring an audit of their complete financial information, of which five were considered to be financially significant components. The additional five components subject to a complete audit were selected due to specific risk characteristics and in order to achieve sufficient coverage in respect of each material line item in the financial statements, including the Group’s Corporate function. In addition, one component was scoped in for an audit of specific account balances and one component was scoped in for specified procedures to obtain appropriate coverage of all material balances.
Recognising that not every operation or business in a component is included in our Group audit scope, we considered as part of our Group audit oversight responsibility what audit coverage had been obtained in aggregate by our component teams by reference to operations or businesses at which audit work had been undertaken. For all other components, the Group team performed analytical review procedures.
Where the work was performed by component audit teams or at a central function, we determined the level of involvement we needed to have in the audit work at those components to be able to conclude whether sufficient appropriate audit evidence had been obtained as a basis for our opinion on the Group financial statements as a whole.
The Group audit team visited component teams and local operations in South Africa, Singapore and Brazil during the 2023 audit. This is in addition to site visits to component teams and local operations in Chile, Peru, South Africa, Australia and Singapore in the prior year. Furthermore, our oversight procedures included the issuance of formal, written instructions to component auditors setting out the work to be performed at each location and regular communication throughout the audit cycle including regular component calls through video conferencing, review of component auditor workpapers and participation in audit clearance meetings.
Taken together, the components where we performed our audit work accounted for 98% of consolidated revenue, 95% of consolidated profit before tax and 94% of consolidated profit before tax, special items and remeasurements. This was before considering the contribution to our audit evidence from performing audit work at the Group level, including disaggregated analytical review procedures and our evaluation of entity level controls, which covers a significant portion of the Group’s smaller and lower risk components that were not directly included in our Group audit scope.
The financial statements of the Parent Company are prepared using the same accounting processes as the Group’s central functions and were audited by the Group audit team.
The impact of climate risk on our audit
Climate change is one of the Group’s principal risks. As part of our audit, we made enquiries of management to understand its process to assess the extent of the potential impact of climate change risks on the Group and its financial statements. Management has explained how it has considered the impact of climate change on the financial statements, including specifically in respect of cash flow projections for impairment testing, in note 7 to the financial statements. This includes its consideration of risks and opportunities that could impact the financial statements.
We used our knowledge of the Group to consider the risk assessment performed by management, including its assessment of the strategic and financial resilience of the Group’s portfolio under various scenarios. Management remains committed to achieving its previously stated 2040 climate ambitions. During 2022, management engaged the Carbon Trust to conduct an independent assessment to provide external verification regarding the alignment of the Group’s Scope 1 and 2 ambitions with a well-below 2° scenario. As a result of this assessment, and recognising that with forecasts of any type there is a margin of error, management has confidence that capital deployment in accordance with the Group’s operational carbon neutrality ambitions is capital aligned with a contribution to achieving the goals of the Paris Agreement. For financial statement reporting purposes, as detailed in note 7, no specific climate scenario is used when determining asset valuations as no single scenario is representative of management’s best estimate of the likely assumptions that would be used by a market participant when valuing the Group’s assets. The forecasts for determining asset valuations also include an adjustment for the cost of unabated future Scope 1 and 2 emissions irrespective of whether each jurisdiction currently has a carbon tax or similar regime in place.
We considered management’s financial statement reporting risk assessment in respect of climate change, focusing on those areas considered to be most heavily impacted such as management’s impairment assessment over non-current assets. Whilst the impact is uncertain, we particularly considered the impact of both physical and transition risks arising due to climate change, as well as related opportunities and climate targets made by the Group, including any incremental capital expenditure and/or operating costs, on the recoverable value of the Group’s assets.
The Group has set climate targets, which include a commitment to be carbon neutral (Scopes 1 and 2) by 2040. Whilst a pathway has been set out to achieve this commitment, further project studies are required to determine how specific categories of emissions can be managed effectively. As a result, not all costs and benefits associated with the projects that will be required to achieve this commitment are included in forward looking estimates including those used to determine the recoverable amount of the Group’s assets. However, this is factored into asset valuations through the application of a carbon cost as described above. Where the Group has a high degree of confidence that projects supporting the achievement of these targets are technically feasible, the related costs and benefits are included in the relevant Life of Asset Plan and relevant forward looking estimates.
The useful lives of the Group’s mines are reassessed annually and changes could impact depreciation charges and timing of mine restoration activities. Based on the current life of asset plans there were no indications that useful lives had been materially impacted by climate change. Our work on impairment is further described in the relevant Key Audit Matter. We have also read the disclosures made in relation to climate change, in the other information within the Annual Report, and considered their consistency with the financial statements and our knowledge from our audit.
| Anglo American plc | Financial statements and other financial information | 219 |
| Integrated Annual Report 2023 | Independent auditors’ report to the members of Anglo American plc |
Materiality
The scope of our audit was influenced by our application of materiality. We set certain quantitative thresholds for materiality. These, together with qualitative considerations, helped us to determine the scope of our audit and the nature, timing and extent of our audit procedures on the individual financial statement line items and disclosures and in evaluating the effect of misstatements, both individually and in aggregate on the financial statements as a whole.
Based on our professional judgement, we determined materiality for the financial statements as a whole as follows:
| Financial statements – Group | Financial statements – Parent Company | |||
| Overall materiality | $400 million (2022: $400 million). | $300 million (2022: $300 million). | ||
| How we determined it | approximately 3.4% of the Group’s three year-average consolidated profit before tax, special items and remeasurements | approximately 1% of the Parent Company’s total assets | ||
| Rationale for benchmark applied | Profit before tax, special items and remeasurements is used as the materiality benchmark. The directors use this measure as they believe that it reflects the underlying performance of the Group. We consider that it is most appropriate to calculate materiality based on a three-year average of profit before tax, special items and remeasurements to respond to longer-term trends in commodity markets and to dampen the impact of short-term price volatility. We used judgement to cap our materiality at $400 million. | We considered total assets to be an appropriate benchmark for the Parent Company, given that it is the ultimate holding company and holds material investments in subsidiary undertakings. We used judgement to cap our materiality at $300 million. |
For each component in the scope of our Group audit, we allocated a materiality that is less than our overall Group materiality. The range of materiality allocated across components was $60 million to $110 million.
We use performance materiality to reduce to an appropriately low level the probability that the aggregate of uncorrected and undetected misstatements exceeds overall materiality. Specifically, we use performance materiality in determining the scope of our audit and the nature and extent of our testing of account balances, classes of transactions and disclosures, for example in determining sample sizes. Our performance materiality was 75% (2022: 75%) of overall materiality, amounting to $300 million (2022: $300 million) for the Group financial statements and $225 million (2022: $225 million) for the Parent Company financial statements.
In determining the performance materiality, we considered a number of factors - the history of misstatements, risk assessment and aggregation risk and the effectiveness of controls - and concluded that an amount at the upper end of our normal range was appropriate.
We agreed with the Audit Committee that we would report to them misstatements identified during our audit above $20 million (Group audit) (2022: $20 million) and $15 million (Parent Company audit) (2022: $15 million) as well as misstatements below those amounts that, in our view, warranted reporting for qualitative reasons.
Conclusions relating to going concern
Our evaluation of the directors’ assessment of the Group’s and the Parent Company’s ability to continue to adopt the going concern basis of accounting included:
| – | Obtaining and examining management’s base case forecast and downside scenarios, which include pricing and production downsides alongside a significant operational incident, and checking that the forecasts have been subject to board review and approval; |
| – | Considering the historical reliability of management forecasting for cash flow and net debt by comparing budgeted results to actual performance; |
| – | Checking the key inputs into the models, such as commodity prices and production forecasts, to ensure that these were consistent with our understanding and the inputs used in other key accounting judgements in the financial statements; |
| – | Performing our own independent sensitivity analysis to understand the impact of changes in cash flow and net debt on the resources available to the Group; |
| – | Checking the covenants applicable to the Group’s borrowings and examining whether management’s assessment supports ongoing compliance with those covenants; and |
| – | Reading management’s paper to the Audit Committee in respect of going concern, and agreeing the forecasts set out in this paper to the underlying base case cash flow model. |
Based on the work we have performed, we have not identified any material uncertainties relating to events or conditions that, individually or collectively, may cast significant doubt on the Group’s and the Parent Company’s ability to continue as a going concern for a period of at least twelve months from when the financial statements are authorised for issue.
In auditing the financial statements, we have concluded that the directors’ use of the going concern basis of accounting in the preparation of the financial statements is appropriate.
However, because not all future events or conditions can be predicted, this conclusion is not a guarantee as to the Group’s and the Parent Company’s ability to continue as a going concern.
In relation to the directors’ reporting on how they have applied the UK Corporate Governance Code, we have nothing material to add or draw attention to in relation to the directors’ statement in the financial statements about whether the directors considered it appropriate to adopt the going concern basis of accounting.
Our responsibilities and the responsibilities of the directors with respect to going concern are described in the relevant sections of this report.
Reporting on other information
The other information comprises all of the information in the Annual Report other than the financial statements and our auditors’ report thereon. The directors are responsible for the other information. Our opinion on the financial statements does not cover the other information and, accordingly, we do not express an audit opinion or, except to the extent otherwise explicitly stated in this report, any form of assurance thereon.
In connection with our audit of the financial statements, our responsibility is to read the other information and, in doing so, consider whether the other information is materially inconsistent with the financial statements or our knowledge obtained in the audit, or otherwise appears to be materially misstated. If we identify an apparent material inconsistency or material misstatement, we are required to perform procedures to conclude whether there is a material misstatement of the financial statements or a material misstatement of the other information. If, based on the work we have performed, we conclude that there is a material misstatement of this other information, we are required to report that fact. We have nothing to report based on these responsibilities.
| 220 | Anglo American plc | Financial statements and other financial information |
| Integrated Annual Report 2023 | Independent auditors’ report to the members of Anglo American plc |
With respect to the Strategic Report and Directors’ report, we also considered whether the disclosures required by the UK Companies Act 2006 have been included.
Based on our work undertaken in the course of the audit, the Companies Act 2006 requires us also to report certain opinions and matters as described below.
Strategic Report and Directors’ report
In our opinion, based on the work undertaken in the course of the audit, the information given in the Strategic Report and Directors’ report for the year ended 31 December 2023 is consistent with the financial statements and has been prepared in accordance with applicable legal requirements.
In light of the knowledge and understanding of the Group and Parent Company and their environment obtained in the course of the audit, we did not identify any material misstatements in the Strategic Report and Directors’ report.
Directors’ Remuneration
In our opinion, the part of the Directors’ remuneration report to be audited has been properly prepared in accordance with the Companies Act 2006.
Corporate governance statement
The Listing Rules require us to review the directors’ statements in relation to going concern, longer-term viability and that part of the corporate governance statement relating to the Parent Company’s compliance with the provisions of the UK Corporate Governance Code specified for our review. Our additional responsibilities with respect to the corporate governance statement as other information are described in the Reporting on other information section of this report.
Based on the work undertaken as part of our audit, we have concluded that each of the following elements of the corporate governance statement, included within the Directors’ report is materially consistent with the financial statements and our knowledge obtained during the audit, and we have nothing material to add or draw attention to in relation to:
| – | The directors’ confirmation that they have carried out a robust assessment of the emerging and principal risks; |
| – | The disclosures in the Annual Report that describe those principal risks, what procedures are in place to identify emerging risks and an explanation of how these are being managed or mitigated; |
| – | The directors’ statement in the financial statements about whether they considered it appropriate to adopt the going concern basis of accounting in preparing them, and their identification of any material uncertainties to the Group’s and Parent Company’s ability to continue to do so over a period of at least twelve months from the date of approval of the financial statements; |
| – | The directors’ explanation as to their assessment of the Group's and Parent Company’s prospects, the period this assessment covers and why the period is appropriate; and |
| – | The directors’ statement as to whether they have a reasonable expectation that the Parent Company will be able to continue in operation and meet its liabilities as they fall due over the period of its assessment, including any related disclosures drawing attention to any necessary qualifications or assumptions. |
Our review of the directors’ statement regarding the longer-term viability of the Group and Parent Company was substantially less in scope than an audit and only consisted of making inquiries and considering the directors’ process supporting their statement; checking that the statement is in alignment with the relevant provisions of the UK Corporate Governance Code; and considering whether the statement is consistent with the financial statements and our knowledge and understanding of the Group and Parent Company and their environment obtained in the course of the audit.
In addition, based on the work undertaken as part of our audit, we have concluded that each of the following elements of the corporate governance statement is materially consistent with the financial statements and our knowledge obtained during the audit:
| – | The directors’ statement that they consider the Annual Report, taken as a whole, is fair, balanced and understandable, and provides the information necessary for the members to assess the Group’s and Parent Company’s position, performance, business model and strategy; |
| – | The section of the Annual Report that describes the review of effectiveness of risk management and internal control systems; and |
| – | The section of the Annual Report describing the work of the Audit Committee. |
We have nothing to report in respect of our responsibility to report when the directors’ statement relating to the Parent Company’s compliance with the Code does not properly disclose a departure from a relevant provision of the Code specified under the Listing Rules for review by the auditors.
Responsibilities for the financial statements and the audit
Responsibilities of the directors for the financial statements
As explained more fully in the Statement of directors’ responsibilities, the directors are responsible for the preparation of the financial statements in accordance with the applicable framework and for being satisfied that they give a true and fair view. The directors are also responsible for such internal control as they determine is necessary to enable the preparation of financial statements that are free from material misstatement, whether due to fraud or error.
In preparing the financial statements, the directors are responsible for assessing the Group’s and the Parent Company’s ability to continue as a going concern, disclosing, as applicable, matters related to going concern and using the going concern basis of accounting unless the directors either intend to liquidate the Group or the Parent Company or to cease operations, or have no realistic alternative but to do so.
Auditors’ responsibilities for the audit of the financial statements
Our objectives are to obtain reasonable assurance about whether the financial statements as a whole are free from material misstatement, whether due to fraud or error, and to issue an auditors’ report that includes our opinion. Reasonable assurance is a high level of assurance, but is not a guarantee that an audit conducted in accordance with ISAs (UK) will always detect a material misstatement when it exists. Misstatements can arise from fraud or error and are considered material if, individually or in the aggregate, they could reasonably be expected to influence the economic decisions of users taken on the basis of these financial statements.
Irregularities, including fraud, are instances of non-compliance with laws and regulations. We design procedures in line with our responsibilities, outlined above, to detect material misstatements in respect of irregularities, including fraud. The extent to which our procedures are capable of detecting irregularities, including fraud, is detailed below.
| Anglo American plc | Financial statements and other financial information | 221 |
| Integrated Annual Report 2023 | Independent auditors’ report to the members of Anglo American plc |
Based on our understanding of the Group and industry, we identified that the principal risks of non-compliance with laws and regulations related to the failure to comply with environmental regulations, health and safety regulations and anti-bribery and corruption laws, and we considered the extent to which non-compliance might have a material effect on the financial statements. We also considered those laws and regulations that have a direct impact on the financial statements such as the Companies Act 2006 and applicable tax legislation in the jurisdictions in which the Group has material operations. We evaluated management’s incentives and opportunities for fraudulent manipulation of the financial statements (including the risk of override of controls), and determined that the principal risks were related to posting inappropriate journal entries and management bias in accounting estimates. The Group engagement team shared this risk assessment with the component auditors so that they could include appropriate audit procedures in response to such risks in their work. Audit procedures performed by the Group engagement team and/or component auditors included:
| – | Understanding and evaluating the design and implementation of controls designed to prevent and detect irregularities and fraud; |
| – | Inquiry of management, Internal Audit and the Group’s legal advisors regarding their consideration of known or suspected instances of non-compliance with laws and regulations and fraud; |
| – | Identifying and testing journal entries, in particular any journal entries posted with unusual account combinations; and |
| – | Challenging assumptions and judgements made by management in respect of significant accounting judgements and estimates, and assessing these judgements and estimates for management bias. |
There are inherent limitations in the audit procedures described above. We are less likely to become aware of instances of non-compliance with laws and regulations that are not closely related to events and transactions reflected in the financial statements. Also, the risk of not detecting a material misstatement due to fraud is higher than the risk of not detecting one resulting from error, as fraud may involve deliberate concealment by, for example, forgery or intentional misrepresentations, or through collusion.
Our audit testing might include testing complete populations of certain transactions and balances, possibly using data auditing techniques. However, it typically involves selecting a limited number of items for testing, rather than testing complete populations. We will often seek to target particular items for testing based on their size or risk characteristics. In other cases, we will use audit sampling to enable us to draw a conclusion about the population from which the sample is selected.
A further description of our responsibilities for the audit of the financial statements is located on the FRC’s website at: www.frc.org.uk/auditorsresponsibilities. This description forms part of our auditors’ report.
Use of this report
This report, including the opinions, has been prepared for and only for the Parent Company’s members as a body in accordance with Chapter 3 of Part 16 of the Companies Act 2006 and for no other purpose. We do not, in giving these opinions, accept or assume responsibility for any other purpose or to any other person to whom this report is shown or into whose hands it may come save where expressly agreed by our prior consent in writing.
Other required reporting
Companies Act 2006 exception reporting
Under the Companies Act 2006 we are required to report to you if, in our opinion:
| – | we have not obtained all the information and explanations we require for our audit; or |
| – | adequate accounting records have not been kept by the Parent Company, or returns adequate for our audit have not been received from branches not visited by us; or |
| – | certain disclosures of directors’ remuneration specified by law are not made; or |
| – | the Parent Company financial statements and the part of the Directors’ remuneration report to be audited are not in agreement with the accounting records and returns. |
We have no exceptions to report arising from this responsibility.
Appointment
Following the recommendation of the Audit Committee, we were appointed by the members on 5 May 2020 to audit the financial statements for the year ended 31 December 2020 and subsequent financial periods. The period of total uninterrupted engagement is four years, covering the years ended 31 December 2020 to 31 December 2023.
Other matter
In due course, as required by the Financial Conduct Authority Disclosure Guidance and Transparency Rule 4.1.14R, these financial statements will form part of the ESEF-prepared annual financial report filed on the National Storage Mechanism of the Financial Conduct Authority in accordance with the ESEF Regulatory Technical Standard (‘ESEF RTS’). This auditors’ report provides no assurance over whether the annual financial report will be prepared using the single electronic format specified in the ESEF RTS.
Mark King (Senior Statutory Auditor)
for and on behalf of PricewaterhouseCoopers LLP
Chartered Accountants and Statutory Auditors London
21 February 2024
| 222 | Anglo American plc | Financial statements and other financial information |
| Integrated Annual Report 2023 | Primary statements |
Consolidated income statement
for the year ended 31 December 2023
| 2023 | 2022 | |||||||||||||||||||||||||||
| US$ million | Note |
Before special items and remeasurements |
Special items and remeasurements (note 9) |
Total | Before special items and remeasurements |
Special items and remeasurements (note 9) | Total | |||||||||||||||||||||
| Revenue | 2 | 30,656 | (4 | ) | 30,652 | 35,127 | (9 | ) | 35,118 | |||||||||||||||||||
| Operating costs | (24,100 | ) | (2,648 | ) | (26,748 | ) | (24,203 | ) | (1,672 | ) | (25,875 | ) | ||||||||||||||||
| Operating profit | 1, 2 | 6,556 | (2,652 | ) | 3,904 | 10,924 | (1,681 | ) | 9,243 | |||||||||||||||||||
| Non-operating special items | 9 | — | (100 | ) | (100 | ) | — | (77 | ) | (77 | ) | |||||||||||||||||
| Net income from associates and joint ventures | 2, 14 | 378 | — | 378 | 641 | — | 641 | |||||||||||||||||||||
| Profit before net finance costs and tax | 6,934 | (2,752 | ) | 4,182 | 11,565 | (1,758 | ) | 9,807 | ||||||||||||||||||||
| Investment income | 427 | — | 427 | 214 | — | 214 | ||||||||||||||||||||||
| Interest expense | (990 | ) | — | (990 | ) | (515 | ) | — | (515 | ) | ||||||||||||||||||
| Other net financing gains/(losses) | 7 | (31 | ) | (24 | ) | (41 | ) | 15 | (26 | ) | ||||||||||||||||||
| Net finance costs | 4 | (556 | ) | (31 | ) | (587 | ) | (342 | ) | 15 | (327 | ) | ||||||||||||||||
| Profit before tax | 6,378 | (2,783 | ) | 3,595 | 11,223 | (1,743 | ) | 9,480 | ||||||||||||||||||||
| Income tax expense | 5 | (2,337 | ) | 86 | (2,251 | ) | (3,570 | ) | 114 | (3,456 | ) | |||||||||||||||||
| Profit for the financial year | 4,041 | (2,697 | ) | 1,344 | 7,653 | (1,629 | ) | 6,024 | ||||||||||||||||||||
| Attributable to: | ||||||||||||||||||||||||||||
| Non-controlling interests | 27 | 1,109 | (48 | ) | 1,061 | 1,617 | (107 | ) | 1,510 | |||||||||||||||||||
| Equity shareholders of the Company | 2,932 | (2,649 | ) | 283 | 6,036 | (1,522 | ) | 4,514 | ||||||||||||||||||||
| Earnings per share (US$) | ||||||||||||||||||||||||||||
| Basic | 3 | 2.42 | (2.19 | ) | 0.23 | 4.97 | (1.25 | ) | 3.72 | |||||||||||||||||||
| Diluted | 3 | 2.40 | (2.17 | ) | 0.23 | 4.92 | (1.24 | ) | 3.68 | |||||||||||||||||||
Consolidated statement of comprehensive income
for the year ended 31 December 2023
| US$ million | 2023 | 2022 | ||||||
| Profit for the financial year | 1,344 | 6,024 | ||||||
| Items that will not be reclassified to the income statement (net of tax)(1) | ||||||||
| Remeasurement of net retirement benefit obligation | (53 | ) | (207 | ) | ||||
| Net revaluation (loss)/gain on equity investments | (40 | ) | 20 | |||||
| Items that have been or may subsequently be reclassified to the income statement (net of tax)(1) | ||||||||
| Net exchange differences: | ||||||||
| Net loss (including associates and joint ventures) | (938 | ) | (1,153 | ) | ||||
| Cumulative loss transferred to the income statement on disposal of foreign operations | 9 | — | ||||||
| Revaluation of cash flow hedges: | ||||||||
| Net revaluation loss | (11 | ) | (80 | ) | ||||
| Other comprehensive loss for the financial year (net of tax) | (1,033 | ) | (1,420 | ) | ||||
| Total comprehensive income for the financial year (net of tax) | 311 | 4,604 | ||||||
| Attributable to: | ||||||||
| Non-controlling interests | 850 | 1,285 | ||||||
| Equity shareholders of the Company | (539 | ) | 3,319 | |||||
| (1) | Tax amounts are shown in note 5C. |
| Anglo American plc | Financial statements and other financial information | 223 |
| Integrated Annual Report 2023 | Primary statements |
Consolidated balance sheet
as at 31 December 2023
| US$ million | Note | 2023 |
2022 (restated)(1) |
|||||||||
| ASSETS | ||||||||||||
| Non-current assets | ||||||||||||
| Intangible assets | 11 | 1,479 | 2,828 | |||||||||
| Property, plant and equipment | 12 | 43,949 | 41,125 | |||||||||
| Environmental rehabilitation trusts | 16, 24 | 108 | 107 | |||||||||
| Investments in associates and joint ventures | 14 | 1,066 | 1,056 | |||||||||
| Financial asset investments | 15 | 391 | 390 | |||||||||
| Inventories | 18 | 847 | 809 | |||||||||
| Trade and other receivables | 19 | 467 | 440 | |||||||||
| Deferred tax assets | 17 | 262 | 198 | |||||||||
| Derivative financial assets | 24 | 238 | 49 | |||||||||
| Pension asset surplus and other non-current assets | 410 | 469 | ||||||||||
| Total non-current assets | 49,217 | 47,471 | ||||||||||
| Current assets | ||||||||||||
| Inventories | 18 | 6,387 | 6,598 | |||||||||
| Trade and other receivables | 19 | 4,516 | 4,483 | |||||||||
| Current tax assets | 170 | 201 | ||||||||||
| Derivative financial assets | 24 | 118 | 204 | |||||||||
| Current financial asset investments | 15 | 48 | 38 | |||||||||
| Cash and cash equivalents | 21 | 6,088 | 8,412 | |||||||||
| Total current assets | 17,327 | 19,936 | ||||||||||
| Total assets | 66,544 | 67,407 | ||||||||||
LIABILITIES |
||||||||||||
| Current liabilities | ||||||||||||
| Trade and other payables | 20 | (6,511 | ) | (7,380 | ) | |||||||
| Short term borrowings | 21, 22 | (1,740 | ) | (1,420 | ) | |||||||
| Provisions for liabilities and charges | 16 | (684 | ) | (684 | ) | |||||||
| Current tax liabilities | (326 | ) | (569 | ) | ||||||||
| Derivative financial liabilities | 24 | (94 | ) | (441 | ) | |||||||
| Total current liabilities | (9,355 | ) | (10,494 | ) | ||||||||
| Non-current liabilities | ||||||||||||
| Trade and other payables | 20 | (189 | ) | (249 | ) | |||||||
| Medium and long term borrowings | 21, 22 | (15,172 | ) | (12,945 | ) | |||||||
| Royalty liability | 24 | (578 | ) | (510 | ) | |||||||
| Retirement benefit obligations | 29 | (531 | ) | (510 | ) | |||||||
| Deferred tax liabilities | 17 | (5,580 | ) | (5,249 | ) | |||||||
| Derivative financial liabilities | 24 | (648 | ) | (888 | ) | |||||||
| Provisions for liabilities and charges | 16 | (2,874 | ) | (2,609 | ) | |||||||
| Total non-current liabilities | (25,572 | ) | (22,960 | ) | ||||||||
| Total liabilities | (34,927 | ) | (33,454 | ) | ||||||||
Net assets |
31,617 | 33,953 | ||||||||||
EQUITY |
||||||||||||
| Called-up share capital | 26 | 734 | 734 | |||||||||
| Share premium account | 2,558 | 2,558 | ||||||||||
| Own shares | 26 | (6,275 | ) | (6,272 | ) | |||||||
| Other reserves | (12,820 | ) | (12,070 | ) | ||||||||
| Retained earnings | 40,860 | 42,368 | ||||||||||
| Equity attributable to equity shareholders of the Company | 25,057 | 27,318 | ||||||||||
| Non-controlling interests | 27 | 6,560 | 6,635 | |||||||||
| Total equity | 31,617 | 33,953 | ||||||||||
| (1) | Comparative figures are restated for the adoption of the amendment to IAS 12, see note 39A. |
The financial statements of Anglo American plc, registered number 03564138, were approved by the Board of directors on 21 February 2024 and signed on its behalf by:
| Duncan Wanblad | John Heasley |
| Chief Executive | Finance Director |
| 224 | Anglo American plc | Financial statements and other financial information |
| Integrated Annual Report 2023 | Primary statements |
Consolidated cash flow statement
for the year ended 31 December 2023
| US$ million | Note | 2023 | 2022 | |||||||||
| Cash flows from operating activities | ||||||||||||
| Profit before tax | 3,595 | 9,480 | ||||||||||
| Net finance costs including financing special items and remeasurements | 4 | 587 | 327 | |||||||||
| Net income from associates and joint ventures | 14 | (378 | ) | (641 | ) | |||||||
| Non-operating special items | 9 | 100 | 77 | |||||||||
| Operating profit | 1 | 3,904 | 9,243 | |||||||||
| Revenue and operating special items and remeasurements | 9 | 2,652 | 1,681 | |||||||||
| Cash element of special items | (89 | ) | (12 | ) | ||||||||
| Depreciation and amortisation | 1 | 2,685 | 2,446 | |||||||||
| Share-based payment charges | 175 | 215 | ||||||||||
| Increase in provisions and net retirement benefit obligations | 25 | 250 | ||||||||||
| Decrease/(increase) in inventories | 2 | (1,776 | ) | |||||||||
| Increase in operating receivables | (384 | ) | (374 | ) | ||||||||
| (Decrease)/increase in operating payables | (785 | ) | 48 | |||||||||
| Other adjustments | (70 | ) | 168 | |||||||||
| Cash flows from operations | 8,115 | 11,889 | ||||||||||
| Dividends from associates and joint ventures | 14 | 379 | 602 | |||||||||
| Dividends from financial asset investments | 3 | — | ||||||||||
| Income tax paid | (2,001 | ) | (2,726 | ) | ||||||||
| Net cash inflows from operating activities | 6,496 | 9,765 | ||||||||||
Cash flows from investing activities |
||||||||||||
| Expenditure on property, plant and equipment | 13 | (5,876 | ) | (6,191 | ) | |||||||
| Cash flows used in derivatives related to capital expenditure | 13 | (3 | ) | — | ||||||||
| Proceeds from disposal of property, plant and equipment | 13 | 16 | 7 | |||||||||
| Investments in associates and joint ventures | 14 | (15 | ) | (37 | ) | |||||||
| Expenditure on intangible assets | (133 | ) | (129 | ) | ||||||||
| Net issuance of financial asset investments | 15 | (63 | ) | (142 | ) | |||||||
| Interest received and other investment income | 377 | 181 | ||||||||||
| Net cash outflow on acquisitions | (10 | ) | — | |||||||||
| Net cash inflow on disposals | 34 | 210 | 564 | |||||||||
| Other investing activities | (63 | ) | (70 | ) | ||||||||
| Net cash used in investing activities | (5,560 | ) | (5,817 | ) | ||||||||
Cash flows from financing activities |
||||||||||||
| Interest paid | (701 | ) | (420 | ) | ||||||||
| Cash flows used in derivatives related to financing activities | 21 | (605 | ) | (1 | ) | |||||||
| Dividends paid to Company shareholders | 6 | (1,564 | ) | (3,549 | ) | |||||||
| Distributions paid to non-controlling interests | 27 | (978 | ) | (1,794 | ) | |||||||
| Proceeds from issuance of bonds | 1,950 | 1,963 | ||||||||||
| Proceeds from other borrowings | 1,113 | 1,537 | ||||||||||
| Capital repayment of lease obligations | (309 | ) | (266 | ) | ||||||||
| Repayments of bonds and borrowings | (1,650 | ) | (1,098 | ) | ||||||||
| Purchase of shares by Group companies | (274 | ) | (527 | ) | ||||||||
| Other financing activities | (205 | ) | (213 | ) | ||||||||
| Net cash used in financing activities | (3,223 | ) | (4,368 | ) | ||||||||
| Net decrease in cash and cash equivalents | (2,287 | ) | (420 | ) | ||||||||
| Cash and cash equivalents at start of year | 21 | 8,400 | 9,057 | |||||||||
| Cash movements in the year | (2,287 | ) | (420 | ) | ||||||||
| Effects of changes in foreign exchange rates | (39 | ) | (237 | ) | ||||||||
| Cash and cash equivalents at end of year | 21 | 6,074 | 8,400 | |||||||||
| Anglo American plc | Financial statements and other financial information | 225 |
| Integrated Annual Report 2023 | Primary statements |
Consolidated statement of changes in equity
for the year ended 31 December 2023
| US$ million | Total share capital(1) | Own shares(2) |
Retained earnings | Cumulative translation adjustment reserve | Other reserves (note 26) | Total equity attributable to equity shareholders of the Company | Non-controlling interests | Total equity | ||||||||||||||||||||||||
| At 31 December 2021 | 3,295 | (6,141 | ) | 41,716 | (11,696 | ) | 651 | 27,825 | 6,945 | 34,770 | ||||||||||||||||||||||
| Adoption of amendments to IAS 12 (see note 39A) | — | — | (43 | ) | — | — | (43 | ) | (28 | ) | (71 | ) | ||||||||||||||||||||
| At 1 January 2022 (restated) | 3,295 | (6,141 | ) | 41,673 | (11,696 | ) | 651 | 27,782 | 6,917 | 34,699 | ||||||||||||||||||||||
| Profit for the year | — | — | 4,514 | — | — | 4,514 | 1,510 | 6,024 | ||||||||||||||||||||||||
| Other comprehensive loss | — | — | (183 | ) | (963 | ) | (49 | ) | (1,195 | ) | (225 | ) | (1,420 | ) | ||||||||||||||||||
| Dividends | — | — | (3,549 | ) | — | — | (3,549 | ) | (1,566 | ) | (5,115 | ) | ||||||||||||||||||||
| Equity settled share-based payment schemes(3) | — | 397 | (59 | ) | — | 1 | 339 | (1 | ) | 338 | ||||||||||||||||||||||
| Treasury shares purchased(3) | — | (527 | ) | — | — | — | (527 | ) | — | (527 | ) | |||||||||||||||||||||
| Shares cancelled during the year | (3 | ) | — | — | — | 3 | — | — | — | |||||||||||||||||||||||
| Other | — | (1 | ) | (28 | ) | — | (17 | ) | (46 | ) | — | (46 | ) | |||||||||||||||||||
| At 31 December 2022 (restated) | 3,292 | (6,272 | ) | 42,368 | (12,659 | ) | 589 | 27,318 | 6,635 | 33,953 | ||||||||||||||||||||||
| Profit for the year | — | — | 283 | — | — | 283 | 1,061 | 1,344 | ||||||||||||||||||||||||
| Other comprehensive loss | — | — | (45 | ) | (730 | ) | (47 | ) | (822 | ) | (211 | ) | (1,033 | ) | ||||||||||||||||||
| Dividends | — | — | (1,564 | ) | — | — | (1,564 | ) | (957 | ) | (2,521 | ) | ||||||||||||||||||||
| Equity settled share-based payment schemes | — | 272 | (137 | ) | — | 25 | 160 | (3 | ) | 157 | ||||||||||||||||||||||
| Treasury shares purchased | — | (275 | ) | — | — | — | (275 | ) | — | (275 | ) | |||||||||||||||||||||
| Change in ownership interest in subsidiaries | — | — | (38 | ) | — | — | (38 | ) | 37 | (1 | ) | |||||||||||||||||||||
| Other | — | — | (7 | ) | — | 2 | (5 | ) | (2 | ) | (7 | ) | ||||||||||||||||||||
| At 31 December 2023 | 3,292 | (6,275 | ) | 40,860 | (13,389 | ) | 569 | 25,057 | 6,560 | 31,617 | ||||||||||||||||||||||
| (1) | Includes share capital and share premium. |
| (2) | Own shares comprise shares of Anglo American plc held by the Company, its subsidiaries and employee benefit trusts (note 26). |
| (3) | The prior year equity settled share-based payment schemes were presented net of treasury shares purchased. Comparatives were re-presented to align with the current presentation. |
| 226 | Anglo American plc | Financial statements and other financial information |
| Integrated Annual Report 2023 |
Notes to the financial statements
| Financial performance | ||
|
Profit attributable to equity shareholders decreased by 94% to $283 million (2022: $4,514 million). Underlying earnings decreased by 51% to $2,932 million (2022: $6,036 million). |
Profit attributable to equity shareholders
$0.3 bn
(2022: $4.5 bn) |
|
| The following disclosures provide further information about the drivers of the Group’s financial performance in the year. This includes analysis of the respective contribution of the Group’s reportable segments along with information about its operating cost base, net finance costs and tax. In addition, disclosure on earnings per share and the dividend is provided. |
1. Operating profit from subsidiaries and joint operations
Overview
| US$ million | Note | 2023 | 2022 | |||||||||
| Revenue before special items and remeasurements | 30,656 | 35,127 | ||||||||||
| Operating costs: | ||||||||||||
| Employee costs | 28 | (3,839 | ) | (3,630 | ) | |||||||
| Depreciation of property, plant and equipment | (2,623 | ) | (2,401 | ) | ||||||||
| Amortisation of intangible assets | (62 | ) | (45 | ) | ||||||||
| Third-party commodity purchases | (4,488 | ) | (6,350 | ) | ||||||||
| Consumables, maintenance and production input costs | (7,464 | ) | (5,492 | ) | ||||||||
| Logistics, marketing and selling costs | (2,749 | ) | (2,898 | ) | ||||||||
| Royalties | (971 | ) | (1,238 | ) | ||||||||
| Exploration and evaluation | (319 | ) | (322 | ) | ||||||||
| Net foreign exchange gains/(losses) | 45 | (6 | ) | |||||||||
| Other operating income | 190 | 313 | ||||||||||
| Other operating expenses | (1,820 | ) | (2,134 | ) | ||||||||
| Operating profit before special items and remeasurements | 6,556 | 10,924 | ||||||||||
| Revenue special items and remeasurements | 9 | (4 | ) | (9 | ) | |||||||
| Operating special items and remeasurements | 9 | (2,648 | ) | (1,672 | ) | |||||||
| Operating profit | 3,904 | 9,243 | ||||||||||
Royalties exclude items which meet the definition of income tax on profit and which have been accounted for as taxes. Exploration and evaluation excludes associated employee costs. The full exploration and evaluation expenditure (including associated employee costs) is presented in the table below:
Operating profit before special items and remeasurements is stated after charging:
| US$ million | 2023 | 2022 | ||||||
| Exploration expenditure | (145 | ) | (155 | ) | ||||
| Evaluation expenditure | (197 | ) | (191 | ) | ||||
| Research and development expenditure | (147 | ) | (167 | ) | ||||
| Provisional pricing adjustment | (6 | ) | (96 | ) | ||||
Accounting policy
See note 39C for the Group’s accounting policy on revenue and exploration and evaluation expenditure.
| Anglo American plc | Financial statements and other financial information | 227 |
| Integrated Annual Report 2023 | Notes to the financial statements |
Financial performance
2. Financial performance by segment
Overview
The Group’s operating segments are aligned to those businesses that are evaluated regularly by the chief operating decision maker in deciding how to allocate resources and in assessing performance. Operating segments with similar economic characteristics are aggregated into reportable segments.
The Group aggregates the following operating segments into reportable segments:
– Kumba Iron Ore and Iron Ore Brazil are aggregated into Iron Ore
– Copper Chile and Copper Peru are aggregated into Copper.
Shipping revenue related to shipments of the Group’s products is shown within the relevant operating segment. Revenue from other marketing and trading activities from shipping and energy solutions within the Marketing business is presented within the ‘Corporate and other’ segment, which also includes unallocated corporate costs and exploration costs.
The disclosures in this note include certain Alternative Performance Measures (APMs). For more information on the APMs used by the Group, including definitions, please refer to page 318.
Segment results
| 2023 | ||||||||||||||||||||||||||||
| US$ million | Group revenue |
Underlying EBITDA |
Depreciation and amortisation |
Underlying EBIT |
Net finance costs and income tax expense |
Non- controlling interests |
Underlying earnings |
|||||||||||||||||||||
| Copper | 7,360 | 3,233 | (782 | ) | 2,451 | (1,127 | ) | (225 | ) | 1,099 | ||||||||||||||||||
| Nickel | 653 | 133 | (71 | ) | 62 | 3 | — | 65 | ||||||||||||||||||||
| Platinum Group Metals | 6,734 | 1,209 | (354 | ) | 855 | (226 | ) | (181 | ) | 448 | ||||||||||||||||||
| De Beers | 4,267 | 72 | (324 | ) | (252 | ) | (113 | ) | 51 | (314 | ) | |||||||||||||||||
| Iron Ore | 8,000 | 4,013 | (464 | ) | 3,549 | (987 | ) | (770 | ) | 1,792 | ||||||||||||||||||
| Steelmaking Coal | 4,153 | 1,320 | (498 | ) | 822 | (138 | ) | — | 684 | |||||||||||||||||||
| Manganese | 670 | 231 | (86 | ) | 145 | (77 | ) | (2 | ) | 66 | ||||||||||||||||||
| Crop Nutrients | 225 | (1) | (60 | ) | (1 | ) | (61 | ) | (14 | ) | — | (75 | ) | |||||||||||||||
| Corporate and other | 440 | (193 | ) | (210 | ) | (403 | ) | (447 | ) | 17 | (833 | ) | ||||||||||||||||
| 32,502 | 9,958 | (2,790 | ) | 7,168 | (3,126 | )(2) | (1,110 | ) | 2,932 | |||||||||||||||||||
| Less: associates and joint ventures | (1,846 | ) | (717 | ) | 105 | (612 | ) | 233 | 1 | (378 | ) | |||||||||||||||||
| Subsidiaries and joint operations | 30,656 | 9,241 | (2,685 | ) | 6,556 | (2,893 | ) | (1,109 | ) | 2,554 | ||||||||||||||||||
| Reconciliation: | ||||||||||||||||||||||||||||
| Net income from associates and joint ventures | 378 | 378 | ||||||||||||||||||||||||||
| Special items and remeasurements | (4 | ) | (2,752 | ) | (2,649 | ) | ||||||||||||||||||||||
| Revenue | 30,652 | |||||||||||||||||||||||||||
| Profit before net finance costs and tax | 4,182 | |||||||||||||||||||||||||||
| Profit attributable to equity shareholders of the Company | 283 | |||||||||||||||||||||||||||
| 2022 | ||||||||||||||||||||||||||||
| US$ million | Group revenue |
Underlying EBITDA |
Depreciation and amortisation |
Underlying EBIT |
Net finance costs and income tax expense |
Non- controlling interests |
Underlying earnings |
|||||||||||||||||||||
| Copper | 5,599 | 2,182 | (587 | ) | 1,595 | (684 | ) | (151 | ) | 760 | ||||||||||||||||||
| Nickel | 858 | 381 | (64 | ) | 317 | (58 | ) | — | 259 | |||||||||||||||||||
| Platinum Group Metals | 10,096 | 4,417 | (365 | ) | 4,052 | (1,132 | ) | (654 | ) | 2,266 | ||||||||||||||||||
| De Beers | 6,622 | 1,417 | (423 | ) | 994 | (334 | ) | (108 | ) | 552 | ||||||||||||||||||
| Iron Ore | 7,534 | 3,455 | (493 | ) | 2,962 | (927 | ) | (698 | ) | 1,337 | ||||||||||||||||||
| Steelmaking Coal | 5,034 | 2,749 | (380 | ) | 2,369 | (729 | ) | — | 1,640 | |||||||||||||||||||
| Manganese | 840 | 378 | (66 | ) | 312 | (161 | ) | (3 | ) | 148 | ||||||||||||||||||
| Crop Nutrients | 254 | (1) | (44 | ) | (1 | ) | (45 | ) | (6 | ) | — | (51 | ) | |||||||||||||||
| Corporate and other | 554 | (440 | ) | (153 | ) | (593 | ) | (276 | ) | (6 | ) | (875 | ) | |||||||||||||||
| 37,391 | 14,495 | (2,532 | ) | 11,963 | (4,307 | )(2) | (1,620 | ) | 6,036 | |||||||||||||||||||
| Less: associates and joint ventures | (2,264 | ) | (1,125 | ) | 86 | (1,039 | ) | 395 | 3 | (641 | ) | |||||||||||||||||
| Subsidiaries and joint operations | 35,127 | 13,370 | (2,446 | ) | 10,924 | (3,912 | ) | (1,617 | ) | 5,395 | ||||||||||||||||||
| Reconciliation: | ||||||||||||||||||||||||||||
| Net income from associates and joint ventures | 641 | 641 | ||||||||||||||||||||||||||
| Special items and remeasurements | (9 | ) | (1,758 | ) | (1,522 | ) | ||||||||||||||||||||||
| Revenue | 35,118 | |||||||||||||||||||||||||||
| Profit before net finance costs and tax | 9,807 | |||||||||||||||||||||||||||
| Profit attributable to equity shareholders of the Company | 4,514 | |||||||||||||||||||||||||||
| (1) | Group revenue in respect of Crop Nutrients principally relates to revenue from its associate, The Cibra Group, a fertiliser distributor based in Brazil. |
| (2) | Comprises net finance costs of $593 million (2022: $358 million) and income tax expense of $2,533 million (2022: $3,949 million). |
The segment results are stated after elimination of inter-segment interest and dividends and include an allocation of corporate costs.
| 228 | Anglo American plc | Financial statements and other financial information |
| Integrated Annual Report 2023 | Notes to the financial statements |
Financial performance
2. Financial performance by segment continued
Further information
Group revenue by product
Segments predominantly derive revenue as follows – Copper: copper; De Beers: rough and polished diamonds; Platinum Group Metals: platinum group metals and nickel; Iron Ore: iron ore; Steelmaking Coal: steelmaking coal; Nickel: nickel; Manganese: manganese ore. Revenue reported within Corporate and other includes margins from marketing and trading activities in the Group’s Energy Solutions activities and shipping services provided to third parties. See note 39C for the Group’s accounting policy on revenue recognition.
Other revenue principally relates to iridium, gold, ruthenium and molybdenum. The revenue analysis below includes the Group’s share of revenue in equity accounted associates and joint ventures excluding special items and remeasurements. See note 14.
| 2023 | 2022 | |||||||||||||||||||||||
| US$ million | Revenue from contracts with customers |
Revenue from other sources |
Group revenue |
Revenue from contracts with customers |
Revenue from other sources |
Group revenue |
||||||||||||||||||
| Copper | 6,824 | 86 | 6,910 | 5,247 | (80 | ) | 5,167 | |||||||||||||||||
| Nickel | 1,046 | 47 | 1,093 | 1,422 | 15 | 1,437 | ||||||||||||||||||
| Platinum | 1,723 | 8 | 1,731 | 1,680 | 6 | 1,686 | ||||||||||||||||||
| Palladium | 1,681 | 9 | 1,690 | 2,542 | 6 | 2,548 | ||||||||||||||||||
| Rhodium | 1,509 | 22 | 1,531 | 4,066 | 21 | 4,087 | ||||||||||||||||||
| Diamonds | 4,198 | 69 | 4,267 | 6,608 | 14 | 6,622 | ||||||||||||||||||
| Iron ore | 6,548 | 606 | 7,154 | 6,597 | (45 | ) | 6,552 | |||||||||||||||||
| Steelmaking coal | 3,155 | 755 | 3,910 | 3,544 | 990 | 4,534 | ||||||||||||||||||
| Thermal coal(1) | 213 | 169 | 382 | 495 | 188 | 683 | ||||||||||||||||||
| Manganese ore | — | 670 | 670 | — | 840 | 840 | ||||||||||||||||||
| Shipping | 1,115 | — | 1,115 | 1,362 | — | 1,362 | ||||||||||||||||||
| Other | 1,770 | 279 | 2,049 | 1,484 | 389 | 1,873 | ||||||||||||||||||
| 29,782 | 2,720 | 32,502 | 35,047 | 2,344 | 37,391 | |||||||||||||||||||
| Reconciliation: | ||||||||||||||||||||||||
| Less: Revenue from associates and joint ventures | — | (1,846 | ) | (1,846 | ) | — | (2,264 | ) | (2,264 | ) | ||||||||||||||
| Special items and remeasurements | — | (4 | ) | (4 | ) | — | (9 | ) | (9 | ) | ||||||||||||||
| Revenue | 29,782 | 870 | 30,652 | 35,047 | 71 | 35,118 | ||||||||||||||||||
| (1) | For the year ended 31 December 2023, thermal coal represents 1% of Group revenue and comprises sales volumes of 15.3Mt. These arise from transitional marketing support provided to Thungela Resources, purchases from other third parties included within the Marketing business’ energy solutions activities, and secondary product sales from the Steelmaking Coal business. |
Revenue from other sources for subsidiaries and joint operations of $870 million (2022: $71 million) includes net fair value gains relating to derivatives of $880 million (2022: net fair value gains of $176 million), net fair value losses relating to provisionally priced contracts of $6 million and revenue remeasurements loss of $4 million (2022: $96 million and $9 million respectively). Derivative net gains/losses include both financial derivatives and the net margin arising on contracts for the physical sale and purchase of third-party material (third-party sales) where these contracts are accounted for as derivatives prior to settlement and are entered into to generate a trading margin.
Group revenue by destination
The Group’s geographical analysis of segment revenue is allocated based on the customer’s port of destination. Where the port of destination is not known, revenue is allocated based on the customer’s country of domicile.
| 2023 | 2022 | |||||||||||||||
| US$ million | % | US$ million | % | |||||||||||||
| China | 9,891 | 30 | % | 8,965 | 24 | % | ||||||||||
| India | 2,275 | 7 | % | 2,798 | 7 | % | ||||||||||
| Japan | 3,783 | 12 | % | 5,542 | 15 | % | ||||||||||
| Other Asia | 5,710 | 18 | % | 6,944 | 18 | % | ||||||||||
| South Africa | 833 | 3 | % | 1,312 | 4 | % | ||||||||||
| Other Africa | 1,403 | 4 | % | 2,080 | 6 | % | ||||||||||
| Brazil | 923 | 3 | % | 986 | 3 | % | ||||||||||
| Chile | 882 | 3 | % | 811 | 2 | % | ||||||||||
| Other South America | 63 | — | 10 | — | ||||||||||||
| North America | 1,230 | 4 | % | 1,160 | 3 | % | ||||||||||
| Australia | 103 | — | 309 | 1 | % | |||||||||||
| United Kingdom(1) | 1,902 | 6 | % | 1,502 | 4 | % | ||||||||||
| Other Europe | 3,504 | 10 | % | 4,972 | 13 | % | ||||||||||
| 32,502 | 100 | % | 37,391 | 100 | % | |||||||||||
| (1) | United Kingdom is Anglo American plc’s country of domicile. |
| Anglo American plc | Financial statements and other financial information | 229 |
| Integrated Annual Report 2023 | Notes to the financial statements |
Financial performance
3. Earnings per share
Overview
The disclosures in this note include certain Alternative Performance Measures (APMs). For more information on the APMs used by the Group, including definitions, please refer to page 318.
| US$ | 2023 | 2022 | |||||||
| Earnings per share | |||||||||
| Basic | 0.23 | 3.72 | |||||||
| Diluted | 0.23 | 3.68 | |||||||
| Underlying earnings per share | |||||||||
| Basic | 2.42 | 4.97 | |||||||
| Diluted | 2.40 | 4.92 | |||||||
| Headline earnings per share | |||||||||
| Basic | 2.06 | 4.98 | |||||||
| Diluted | 2.05 | 4.93 | |||||||
Further information
The calculation of basic and diluted earnings per share is based on the following data:
| Profit attributable to equity | ||||||||||||||||||||||||
| shareholders of the Company | Underlying earnings | Headline earnings | ||||||||||||||||||||||
| 2023 | 2022 | 2023 | 2022 | 2023 | 2022 | |||||||||||||||||||
| Earnings (US$ million) | ||||||||||||||||||||||||
| Basic and diluted earnings | 283 | 4,514 | 2,932 | 6,036 | 2,496 | 6,050 | ||||||||||||||||||
| Weighted average number of shares (million) | ||||||||||||||||||||||||
| Basic number of ordinary shares outstanding | 1,214 | 1,215 | 1,214 | 1,215 | 1,214 | 1,215 | ||||||||||||||||||
| Effect of dilutive potential ordinary shares | 6 | 11 | 6 | 11 | 6 | 11 | ||||||||||||||||||
| Diluted number of ordinary shares outstanding | 1,220 | 1,226 | 1,220 | 1,226 | 1,220 | 1,226 | ||||||||||||||||||
The weighted average number of ordinary shares in issue is the weighted number of shares in issue throughout the year, and excludes shares held by employee benefit trusts and Anglo American plc shares held by Group companies. The diluted number of ordinary shares outstanding, including share options and awards, is calculated on the assumption of conversion of all dilutive potential ordinary shares. In the year ended 31 December 2023 there were 345,152 (2022: 342,939) share options that were potentially dilutive but not included in the calculation of diluted earnings because they were anti-dilutive.
Headline earnings, a Johannesburg Stock Exchange defined performance measure, is reconciled from profit attributable to equity shareholders of the Company as follows, and the reconciling items below are shown gross and net of tax and non-controlling interests:
| 2023 | 2022 | |||||||||||||||
| US$ million | Gross | Net | Gross | Net | ||||||||||||
| Profit attributable to equity shareholders of the Company | 283 | 4,514 | ||||||||||||||
| Special items and remeasurements | 2,649 | 1,522 | ||||||||||||||
| Underlying earnings for the financial year | 2,932 | 6,036 | ||||||||||||||
| Revenue remeasurements | (4 | ) | (3 | ) | (9 | ) | (14 | ) | ||||||||
| Operating special items – restructuring | (142 | ) | (131 | ) | — | — | ||||||||||
| Operating remeasurements | (86 | ) | (82 | ) | (80 | ) | (72 | ) | ||||||||
| Non-operating special items – charges relating to BEE transactions | — | — | (10 | ) | (9 | ) | ||||||||||
| Non-operating special items – remeasurement of deferred consideration | (17 | ) | (14 | ) | (111 | ) | (73 | ) | ||||||||
| Non-operating special items – disposals | 8 | 6 | (3 | ) | (4 | ) | ||||||||||
| Financing special items and remeasurements | (31 | ) | (31 | ) | 15 | 15 | ||||||||||
| Tax special items and remeasurements | — | (183 | ) | — | 126 | |||||||||||
| Other reconciling items | (4 | ) | 2 | 63 | 45 | |||||||||||
| Headline earnings for the financial year | 2,496 | 6,050 | ||||||||||||||
Other reconciling items principally comprise adjustments relating to business combinations in prior years partially offset by impairments in De Beers (2022: relate to adjustments to former operations and disposals of Property, plant and equipment).
| 230 | Anglo American plc | Financial statements and other financial information |
| Integrated Annual Report 2023 | Notes to the financial statements |
Financial performance
4. Net finance costs
Overview
| US$ million | 2023 | 2022 | ||||||
| Investment income | ||||||||
| Interest income from cash and cash equivalents | 345 | 173 | ||||||
| Interest income from associates and joint ventures | 15 | 6 | ||||||
| Net interest income on defined benefit arrangements | 24 | 20 | ||||||
| Other interest income | 43 | 16 | ||||||
| 427 | 215 | |||||||
| Less: Interest income capitalised | — | (1 | ) | |||||
| Investment income | 427 | 214 | ||||||
| Interest expense | ||||||||
| Interest and other finance expense | (1,322 | ) | (721 | ) | ||||
| Lease liability interest expense | (62 | ) | (42 | ) | ||||
| Net interest cost on defined benefit arrangements | (42 | ) | (45 | ) | ||||
| Unwinding of discount relating to provisions and other liabilities | (79 | ) | (86 | ) | ||||
| (1,505 | ) | (894 | ) | |||||
| Less: Interest expense capitalised | 515 | 379 | ||||||
| Interest expense | (990 | ) | (515 | ) | ||||
| Other net financing (losses)/gains | ||||||||
| Net foreign exchange (losses)/gains | (51 | ) | 105 | |||||
| Other net fair value gains/(losses) | 58 | (146 | ) | |||||
| Other net financing gains/(losses) before special items and remeasurements | 7 | (41 | ) | |||||
| Financing remeasurements | (31 | ) | 15 | |||||
| Other net financing losses | (24 | ) | (26 | ) | ||||
| Net finance costs | (587 | ) | (327 | ) | ||||
Further information
Interest income recognised on financial assets at amortised cost is $183 million (2022: $96 million) and interest expense recognised on financial liabilities at amortised cost is $769 million (2022: $302 million).
Interest expense capitalised predominantly relates to US dollar denominated borrowings which were capitalised at a weighted average interest rate of 7.1% (2022: 3.7%).
Included in other net fair value gains/losses is $46 million (2022: loss of $47 million) in respect of fair value gains on the revaluation of deferred consideration balances relating to the Mototolo acquisition. Revaluation of deferred consideration balances are classified as special items and remeasurements only when the original gain or loss on disposal or acquisition has been classified as a special item.
5. Income tax expense
Overview
| 2023 | ||||||||||||
| Profit | ||||||||||||
| before tax | Tax charge | Effective | ||||||||||
| US$ million | US$ million | tax rate | ||||||||||
| Calculation of effective tax rate (statutory basis) | 3,595 | (2,251 | ) | 62.6 | % | |||||||
| Adjusted for: | ||||||||||||
| Special items and remeasurements | 2,783 | (86 | ) | |||||||||
| Associates’ and joint ventures’ tax and non-controlling interests | 197 | (196 | ) | |||||||||
| Calculation of underlying effective tax rate | 6,575 | (2,533 | ) | 38.5 | % | |||||||
The underlying effective tax rate was 38.5% for the year ended 31 December 2023. This is higher than the underlying effective tax rate of 34.0% for the year ended 31 December 2022. The underlying effective tax rate in 2023 was mainly impacted by the relative level of profits arising in the Group’s operating jurisdictions.
| Anglo American plc | Financial statements and other financial information | 231 |
| Integrated Annual Report 2023 | Notes to the financial statements |
Financial performance
5. Income tax expense continued
Uncertainty and changes to tax regimes can materialise in any country in which we operate and the Group has no control over political acts, actions of regulators, or changes in local tax regimes. Global and local economic and social conditions can have a significant influence on governments’ policy decisions and these have the potential to change tax and other political risks faced by the Group.
A new Mining Royalty Bill in Chile was enacted during August 2023. This legislation creates a new mining royalty regime including both an ‘ad valorem tax’ and a ‘specific mining tax’. While current taxes do not start to accrue until 1 January 2024, the rebasing of the Group's Chilean deferred taxes to reflect the impact of this new regime, has increased the Group's underlying effective tax rate for the year ended 31 December 2023 by 1.2 percentage points.
In line with our published Tax Strategy, the Group actively monitors tax developments at a national level, as well as global themes and international policy trends, on a continuous basis, and has active engagement strategies with governments, regulators and other stakeholders within the countries in which the Group operates, or plans to operate, as well as at an international level. This includes global tax reforms such as those being agreed through the OECD’s Digitalisation of the Economy Project which seeks to reallocate taxing rights for large profitable groups (‘Pillar 1’) and implement a minimum effective tax rate of 15% on profits of large multinational groups in each country in which they operate (‘Pillar 2’). On 23 March 2023, HM Treasury released draft legislation for the Global Minimum Tax rules in the UK which was enacted on 11 July 2023.
Although these rules will only apply to the Group from the financial year ended 31 December 2024 onwards, the Group has carried out an assessment of its potential exposure to Pillar 2 taxes. This assessment is principally based on the application of the transitional safe harbour exemptions within the UK's Pillar 2 legislation and uses data from the most recent submission of the Group’s Country-by-Country report, being for the year ended 31 December 2022. As part of this assessment, the Group has adjusted for one-off events in the year ended 31 December 2022, which are not expected to be repeated in future periods. The Group is not aware of any events in the current year ended 31 December 2023 which would give a materially different result. The assessment has identified a potential exposure where the Pillar 2 effective tax rate is estimated to have been lower than 15%. This exposure is estimated to have had an impact of less than one percentage point to the Group's underlying effective tax rate based on underlying profit before tax for 2022.
The Group continues to review legislation to evaluate the potential impact and is engaging with policymakers in efforts to ensure that guidance and any required additional legislation is aligned to the stated policy objectives and that the Group is well placed to comply.
The Group has applied the mandatory temporary exception under IAS 12 in relation to the accounting for deferred taxes arising from the implementation of the Pillar 2 rules.
The disclosures in this note include certain Alternative Performance Measures (APMs). For more information on the APMs used by the Group, including definitions, please refer to page 318.
A. Analysis of charge for the year
| US$ million | 2023 | 2022 | ||||||
| United Kingdom tax | 165 | 106 | ||||||
| South Africa tax | 585 | 1,409 | ||||||
| Other overseas tax | 1,074 | 1,128 | ||||||
| Prior year adjustments | (76 | ) | (80 | ) | ||||
| Current tax | 1,748 | 2,563 | ||||||
| Deferred tax | 589 | 1,007 | ||||||
| Income tax expense before special items and remeasurements | 2,337 | 3,570 | ||||||
| Special items and remeasurements tax (note 9) | (86 | ) | (114 | ) | ||||
| Income tax expense | 2,251 | 3,456 | ||||||
Current tax includes royalties which meet the definition of income tax and are in addition to royalties recorded in operating costs.
| 232 | Anglo American plc | Financial statements and other financial information |
| Integrated Annual Report 2023 | Notes to the financial statements |
Financial performance
5. Income tax expense continued
B. Factors affecting tax charge for the year
The reconciling items between the statutory corporation tax rate and the income tax expense are:
| US$ million | 2023 | 2022 | ||||||
| Profit before tax | 3,595 | 9,480 | ||||||
| Less: Net income from associates and joint ventures | (378 | ) | (641 | ) | ||||
| Profit before tax (excluding associates and joint ventures) | 3,217 | 8,839 | ||||||
| Tax calculated at the weighted average annual statutory rate of corporation tax in the United Kingdom of 23.5% (2022: 19.0%) | 756 | 1,679 | ||||||
| Tax effects of: | ||||||||
| Items non-deductible/taxable for tax purposes | 61 | (2 | ) | |||||
| Temporary difference adjustments | ||||||||
| Current year losses and temporary differences not recognised | 523 | 390 | ||||||
| Recognition of losses and temporary differences not previously recognised | (96 | ) | (6 | ) | ||||
| Utilisation of losses and temporary differences not previously recognised | (25 | ) | (55 | ) | ||||
| Write-off of losses and temporary differences previously recognised | 33 | 54 | ||||||
| Other temporary differences | 105 | (23 | ) | |||||
| Special items and remeasurements | ||||||||
| Functional currency remeasurements (note 9) | (119 | ) | (72 | ) | ||||
| Taxable income on intercompany loan write-off | — | 298 | ||||||
| Utilisation of losses and other temporary differences not previously recognised against intercompany loan write-off income | — | (298 | ) | |||||
| Other special items and remeasurements | 687 | 289 | ||||||
| Other adjustments | ||||||||
| Withholding taxes | 108 | 104 | ||||||
| Effect of differences between local and United Kingdom tax rates | 396 | 1,176 | ||||||
| Prior year adjustments to current tax | (76 | ) | (80 | ) | ||||
| Other adjustments | (102 | ) | 2 | |||||
| Income tax expense | 2,251 | 3,456 | ||||||
The special items and remeasurements reconciling charge of $568 million (2022: $217 million) relates to the net tax impact of total special items and remeasurements before tax calculated at the United Kingdom corporation tax rate less the associated tax recorded against these items and tax special items and remeasurements.
Included within withholding taxes for the year ended 31 December 2023 is a charge of $2 million (2022: credit of $67 million) due to a reassessment of future dividend distributions.
Associates’ and joint ventures’ tax included within Net income from associates and joint ventures for the year ended 31 December 2023 is a charge of $196 million (2022: $379 million). Excluding special items and remeasurements, this remains a charge of $196 million (2022: $379 million).
C. Tax amounts included in other comprehensive income
The Consolidated statement of comprehensive income includes a tax credit on the remeasurement of net retirement benefit obligations recognised directly in equity that will not be reclassified to the income statement of $18 million (2022: $80 million). In addition, there is a tax credit on the net revaluation credit on equity investments recognised directly in equity that will not subsequently be reclassified to the income statement of $1 million (2022: $3 million).
D. Tax amounts recognised directly in equity
In 2023, deferred tax of $6 million (2022: $6 million) was charged directly to equity mainly in relation to movements in share-based payments.
Accounting judgement
The Group’s tax affairs are governed by complex domestic tax legislations, international tax treaties between countries and the interpretation of these by tax authorities and courts. Given the many uncertainties that could arise from these factors, judgement is often required in determining the tax that is due. Where management is aware of potential uncertainties, and where it is judged not probable that the taxation authorities would accept the uncertain tax treatment, a provision is made following the appropriate requirements set out in IFRIC 23 Uncertainty over income tax treatments, and determined with reference to similar transactions and, in some cases, reports from independent experts.
Accounting policy
See note 39G for the Group’s accounting policy on tax.
| Anglo American plc | Financial statements and other financial information | 233 |
| Integrated Annual Report 2023 | Notes to the financial statements |
Financial performance
6. Dividends
| 2023 | 2022 | |||||||
| Proposed final ordinary dividend per share (US cents) | 41 | 74 | ||||||
| Proposed final ordinary dividend (US$ million) | 500 | 905 | ||||||
These financial statements do not reflect the proposed final ordinary dividend as it is still subject to shareholder approval. Dividends paid during the year are as follows:
| US$ million | 2023 | 2022 | ||||||
| Final ordinary dividend for 2022 – 74 US cents per ordinary share (2021: 118 US cents per ordinary share) | 905 | 1,440 | ||||||
| Final special dividend for 2021 – 50 US cents per ordinary share | — | 612 | ||||||
| Interim ordinary dividend for 2023 – 55 US cents per ordinary share (2022: 124 US cents per ordinary share) | 659 | 1,497 | ||||||
| 1,564 | 3,549 | |||||||
As at the dividend record date, there are forecasted to be 1,219,991,762 (2022: 1,222,809,154) dividend bearing shares in issue.
| 234 | Anglo American plc | Financial statements and other financial information |
| Integrated Annual Report 2023 | Notes to the financial statements |
Significant items
| Special items and remeasurements are a net charge of $2.6 billion and include a $1.6 billion impairment of De Beers assets and a $0.8 billion impairment of Nickel assets. |
Special items and remeasurements loss
$2.6 bn
(2022: $1.5 bn) |
During 2023, the significant accounting judgements and estimates made by management included:
| – | The assessment of impairment and impairment reversal indicators |
| – | The estimation of recoverable amount for impairment testing |
7. Significant accounting matters
Management necessarily makes judgements and estimates that can have a significant impact on the financial statements. The significant judgements and key sources of estimation uncertainty that affect the results for the year ended 31 December 2023 are set out below and relate to the impairment and impairment reversal of assets. In addition to these items, information about other judgements and estimates determined by management is provided, where applicable, in the relevant note to the financial statements.
The Group also considers the impact of climate change on judgements and estimates. Although not a key judgement or estimate in itself, climate change potentially impacts a number of judgements and estimates made by the Group, particularly where these are reliant on longer term forecasts.
Significant accounting judgements and estimates
Impairment and impairment reversals of assets
Significant accounting judgement – identification of impairment and impairment reversal indicators
The Group assesses at each reporting date whether there are any indicators that its assets and cash generating units (CGUs) may be impaired, or that an impairment reversal is required for previously impaired assets and CGUs (other than goodwill). Assets which have previously been impaired are generally carried on the balance sheet at a value close to their recoverable amount at the last assessment. Therefore in principle any change in operational assumptions or economic parameters could result in further impairment or impairment reversal if an indicator is identified.
The assessment considers a wide range of potential indicators, including revisions to forecast operating performance, changes to capital projects, the impact of external factors such as tax rates for relevant geographies and both the Group’s internal long term economic forecasts and external market data. Judgement is required to determine whether the updates represent significant changes in the service potential of an asset or CGU, and are therefore indicators of impairment or impairment reversal.
Particular judgement may be required to determine whether multiple changes are linked to the same underlying factor and hence should be assessed together, for example where inflationary pressures lead to offsetting increases in both forecast revenues and costs. The Group uses quantitative data and sensitivity analysis using discounted cashflow models to inform these judgements where relevant. For certain previously impaired assets where an impairment or impairment reversal trigger has not been identified at 31 December 2023, it is reasonably possible that an impairment or reversal trigger, and hence a potential material adjustment to the carrying value, may arise within the next twelve months. Further information about these assets is provided below:
Woodsmith
The Woodsmith polyhalite project is currently under construction and has recognised previous impairments of $1.7 billion (2022) which remain eligible for potential impairment reversal. The valuation remains inherently sensitive to changes in economic and operational assumptions, in particular the forecast polyhalite price and discount rate. The Group has reassessed key input assumptions as at 31 December 2023. At this stage the Group believes the assumptions for these key inputs used in the valuation prepared at 31 December 2022 remain appropriate and hence no indicators of impairment or reversal have been identified.
Moranbah-Grosvenor
Moranbah-Grosvenor is a CGU within the Steelmaking Coal segment and has recognised previous impairments of $0.1 billion which remain eligible for potential impairment reversal. The asset valuation is inherently sensitive to changes in economic and operational assumptions, in particular the steelmaking coal price and the AUD/ USD exchange rate. The Group has reviewed operational and macroeconomic developments in the year, including the potential impact of global decarbonisation efforts in response to climate change on forecast steelmaking coal prices, and concluded that there are no indicators of impairment or impairment reversal.
Significant accounting estimate – estimation of recoverable amount
Where indicators of impairment or impairment reversal are identified (or at least annually for goodwill and indefinite life assets), the Group performs impairment reviews to assess the recoverable amount of the relevant operating assets. The recoverable amount is assessed with reference to fair value less costs of disposal, as this is higher than the value in use model for the Group’s assets. The fair value less cost of disposal is estimated with reference to the share price of listed subsidiaries, where appropriate, and for other assets is based on discounted cash flow models. The expected future cash flows used in these models are inherently uncertain and could materially change over time. They may be significantly affected by a number of factors including Ore Reserves and Mineral Resources, together with economic factors such as commodity prices, exchange rates, discount rates and estimates of production costs and future capital expenditure. Where discounted cash flow models based on management’s assumptions are used, the resulting fair value measurements are considered to be at level 3 in the fair value hierarchy, as defined in IFRS 13 Fair Value Measurement, as they depend to a significant extent on unobservable valuation inputs.
| Anglo American plc | Financial statements and other financial information | 235 |
| Integrated Annual Report 2023 | Notes to the financial statements |
Significant items
7. Significant accounting matters continued
Cash flow projections are based on financial budgets and Life of Asset Plans or, for non-mine assets, an equivalent appropriate long term forecast, incorporating key assumptions as detailed below:
| – | Ore Reserves and Mineral Resources |
Ore Reserves and, where considered appropriate, Mineral Resources are incorporated in projected cash flows, based on Ore Reserves and Mineral Resources statements and exploration and evaluation work undertaken by appropriately qualified persons. Mineral Resources are included where management has a high degree of confidence in their economic extraction, despite additional evaluation still being required prior to meeting the required confidence to convert to Ore Reserves. Risk adjustments are applied to the inclusion of these resources where appropriate. For further information refer to the unaudited Ore Reserves and Mineral Resources Report 2023.
| – | Commodity and product prices |
Commodity and product prices are based on latest internal forecasts, benchmarked with external sources of information such as the range of available analyst forecasts and for the short term, spot prices where applicable. In estimating the forecast cash flows, management also takes into account the expected realised price from existing contractual arrangements. Price forecasts are made with reference to the impact of climate change on supply and demand fundamentals for each commodity but are not aligned to any particular emissions scenario.
| – | Foreign exchange rates |
Foreign exchange rates are based on latest internal forecasts, benchmarked with external sources of information for relevant countries of operation or directly from external forecasts.
| – | Discount rates |
Cash flow projections used in fair value less costs of disposal impairment models are discounted based on real post-tax discount rates, assessed annually. Adjustments to the rates are made for any risks that are not reflected in the underlying cash flows, including the risk profile of the individual asset and country risk.
| – | Operating costs, capital expenditure and other operating factors |
Operating costs and capital expenditure are based on the most recently approved financial budgets. Cash flow projections beyond the budget period are based on Life of Asset Plans, as applicable, and internal management forecasts. Cost assumptions incorporate management experience and expectations, as well as the nature and location of the operation and the risks associated therewith (for example, the grade of Ore Reserves varying significantly over time and unforeseen operational issues). Underlying input cost assumptions are consistent with related output price assumptions. Other operating factors, such as the timelines of granting licences and permits, are based on management’s best estimate of the outcome of uncertain future events at the balance sheet date.
Where an asset has potential for future development through capital investment, to which a market participant would attribute value, and the costs and economic benefits can be estimated reliably, this development is included in the recoverable amount (with appropriate risk adjustments).
Significant estimate: sensitivity disclosures
The recoverable amounts of the following assets are considered to be significant accounting estimates as a material impairment or an impairment reversal could arise within the next twelve months due to a realistic change in assumptions:
| – | De Beers |
| – | Barro Alto |
| – | Minas-Rio. |
Key input and sensitivity information for these assets is provided in note 8.
Climate change
Tackling climate change is the defining challenge of our time and understanding and addressing the implications of climate change for our business is embedded in our strategy. The Group’s response to climate change is implemented at an asset-level through the Group’s Sustainable Mining Plan and related Life of Asset Plans. Climate change potentially impacts judgements and estimates made when preparing the Group’s financial statements. Potential impacts arise in three principal areas; physical risk such as extreme weather events or long term changes in climate patterns, transition risk as demand shifts between commodities and the Group’s climate ambitions as the financial impact of climate targets is reflected in operational decisions and cost structures.
The estimation of recoverable amounts for the Group’s non-current assets is currently the only judgement or estimate which is materially impacted by climate change. Further information about this estimate, together with additional information in other areas which may be impacted in the medium to long term, is provided below:
| Judgement/Estimate | Physical Risk |
Transition Risk |
||
| Estimation of recoverable amounts |  |
 |
||
| Useful economic lives of non-current assets | _ | |
||
| Net realisable value of inventory | _ | _ | ||
| Measurement of rehabilitation and decommissioning provisions | |
|
|
Significant impact on judgement/estimate |
|
Moderate impact on judgement/estimate |
| – | Limited impact on judgement/estimate |
Estimation of recoverable amounts
Physical risk
The cashflow forecasts used to determine the recoverable amount of the Group’s assets reflect our current best-estimate of the impact of material physical risks. The most significant impacts generally relate to managing either an excess or scarcity of water resources and the resulting impact on production levels. Cashflow forecasts also include the costs (and benefits) of risk mitigation actions included in the Life of Asset Plan, such as water purchases and the cost of new infrastructure. These forecasts may be revised in future periods as the Group continues its programme of detailed site-specific monitoring and assessments.
Transition risk
Transition risk may impact the recoverable amount of the Group’s assets as forecast commodity prices are a key input in the discounted cashflow models which are used to calculate the recoverable amount. The Group’s discounted cashflow models are prepared on a fair value less cost of disposal basis, which requires input assumptions to be determined from the perspective of a market participant. While the Group has confirmed the strategic and financial resilience of its portfolio under a 1.5°C scenario as part of its Task Force on Climate-Related Financial Disclosures (TCFD) reporting, this scenario is not used for financial reporting purposes as it is not representative of management’s best estimate of the likely assumptions that would be used by a market participant when valuing the Group’s assets.
The Group has not performed a full assessment of the implications of any resilience scenario on asset valuations used for financial reporting purposes. While there is a wide range of possible transition impacts for each level of warming depending on the assumptions made, we anticipate that prices for the majority of the Group’s commodities would be higher than existing forecasts in the short and medium term under a 1.5°C scenario, driven by growing investment in infrastructure associated with the transition to a low carbon economy while carbon prices are also likely to be higher than existing forecasts.
| 236 | Anglo American plc | Financial statements and other financial information |
| Integrated Annual Report 2023 | Notes to the financial statements |
Significant items
7. Significant accounting matters continued
In the longer term, the more rapid decarbonisation of the steel value chain under a 1.5°C scenario through higher steel recycling rates and technological change would be expected to lead to lower benchmark prices for both iron ore and steelmaking coal, although we anticipate that for iron ore this may largely be offset by higher product premiums for the Group’s high quality lump and high grade pellet-feed products given these are particularly well-suited to less carbon intensive steelmaking technologies. The valuation of the Group’s steelmaking coal assets is less sensitive to changes in the long term price than other operations given the remaining asset lives.
Increased demand for battery electric vehicles in a 1.5°C scenario may also pose a downside risk to demand for the PGM-containing catalytic converters used in internal combustion engine (ICE) vehicles, although this is expected to be partly offset by hybrids, which require similar quantities of PGMs, and in the longer term, fuel cell electric vehicles. The recoverable amount of the Group’s PGM assets is currently significantly in excess of their accounting carrying values, which makes these carrying values less sensitive to changing valuation input assumptions than other assets.
Climate ambitions and targets
The Group has announced a number of climate targets, which are disclosed on pages 54-57.
When preparing valuation models on a fair value less cost of disposal basis the Group generally assumes that any purchaser would retain similar climate targets and ambitions. The Group therefore includes the cost and commercial benefits of achieving its emissions reduction ambitions and targets once the Group has a high degree of confidence that a project is technically feasible and it is included in the Life of Asset Plan, which typically aligns with the related capital project being internally approved. This is consistent with the approach taken for other key assumptions such as forecasted operating costs and capital expenditures as outlined above.
Some projects relating to the Group’s climate targets and ambitions are not included in the Life of Asset Plans, generally because it is not yet possible to reliably estimate the costs and benefits or technical feasibility has not been demonstrated. While the costs and benefits of such projects are not included in cashflow forecasts (other than study costs within the next five years), the Group includes an adjustment within the forecast for the cost of unabated future Scope 1 and 2 emissions irrespective of whether each jurisdiction currently has a carbon tax or similar regime in place. When new emissions reduction projects are included in the Life of Asset Plan, the valuation impact of including the related project’s cost is therefore offset by the removal of the cost of the emissions.
Carbon prices are used both as an input into our commodity price forecasts and in our forecast carbon cost for each operation. Carbon costs included in the valuation of each asset are based on the forecast carbon price per tonne/CO2e, multiplied by estimated Scope 1 and 2 emissions for the relevant operation. Short term carbon prices are incorporated based on currently enacted legislation (where relevant). Short term carbon prices for jurisdictions without currently enacted legislation and long term prices for all jurisdictions are based on the latest internal views of what a market participant would assess, formed with reference to external forecasts. Separate carbon prices are used for each region in which the Group operates. These internal prices range between $20 and $95 per tonne (2023 real basis) by 2030.
The Group has an ambition to reduce its Scope 3 emissions by 50% (against a 2020 baseline) by 2040. The Group has signed a number of agreements with steel producers to explore how the Group’s high quality iron ore and steelmaking coal products can facilitate the decarbonisation of the steel value chain. The financial cost of these agreements is incurred centrally and is not expected to be material to the Group. It is therefore not included in asset-level valuation models.
Useful economic lives of non-current assets
Physical risk
Physical risk is not expected to have a material impact on the useful economic lives of the Group’s assets based on the risk assessments conducted to date, given the risk mitigation strategies in place.
Transition risk
Transition risk may impact the useful economic lives of the Group’s mining properties if changing commodity prices extend or reduce the period in which resources can be extracted from an orebody economically. This would in turn impact the depreciation charge.
The depreciation charge relating to mining properties is $859 million. Considering the alignment of the Group’s portfolio to future-enabling products we believe any impact of transition risk is not likely to be material.
The useful economic lives of other assets are generally shorter and therefore less exposed to transition risk than mining properties.
Climate ambitions and targets
Any impact is not currently expected to be material as new technologies will be phased in as existing equipment or other infrastructure naturally come to the end of their life. The introduction of new dual-fuelled LNG vessels into the Group’s shipping fleet has not significantly impacted asset lives as vessels have previously been leased for relatively short periods of up to two years.
Net realisable value of inventory
Physical risk
Any impact is not currently expected to be material.
Transition risk
Transition risk could result in the recognition of an impairment if falling commodity prices mean that the net realisable value is lower than the production cost at which inventory balances are generally recorded.
Notwithstanding this, the majority of the Group’s inventory is expected to be used within one year and is therefore less exposed to transition risk, which will principally impact prices in the medium and long term. The Group’s long term inventory balances principally relate to the Iron Ore and Nickel reportable segments. These commodities are future-enabling for a more sustainable world and hence the carrying value of related inventory is less likely to be impacted by climate change.
Climate ambitions and targets
Any impact is not currently expected to be material.
Measurement of rehabilitation and decommissioning provisions
Physical risk
Physical risk may impact the cost of rehabilitating the Group’s sites, for example higher average rainfall may impact the water management strategies required for the tailings storage facilities. Changing weather patterns may also lead to increased rates of soil erosion and reduced vegetation rates. Cashflow forecasts include the Group’s current best estimate of the impact of such changes.
Transition risk
Transition risk may impact the useful economic lives of the Group’s mines and hence the present value of rehabilitation and decommissioning provisions by changing the period over which the future costs are discounted. The Group has reviewed the sensitivity of its provisions to changing asset lives and concluded that this does not represent an area of material estimation uncertainty.
Climate ambitions and targets
Any impact is not expected to be material.
| Anglo American plc | Financial statements and other financial information | 237 |
| Integrated Annual Report 2023 | Notes to the financial statements |
Significant items
8. Impairment and impairment reversals
Overview
The Group has recognised the following impairments as special items in the year ended 31 December 2023:
| 2023 | 2022 | |||||||||||||||||||||||
| US$ million | Before tax | Tax | Non-controlling interests | Net | Before tax | Net | ||||||||||||||||||
| Impairments | ||||||||||||||||||||||||
| De Beers (Diamonds) | (1,601 | ) | 12 | 31 | (1,558 | ) | — | — | ||||||||||||||||
| Barro Alto (Nickel) | (779 | ) | 235 | — | (544 | ) | — | — | ||||||||||||||||
| Codemin (Nickel) | (40 | ) | — | — | (40 | ) | — | — | ||||||||||||||||
| Kolomela (Iron Ore) | — | — | — | — | (313 | ) | (122 | ) | ||||||||||||||||
| Woodsmith (Crop Nutrients) | — | — | — | — | (1,707 | ) | (1,707 | ) | ||||||||||||||||
| Impairments recognised as special items | (2,420 | ) | 247 | 31 | (2,142 | ) | (2,020 | ) | (1,829 | ) | ||||||||||||||
| Impairment reversals | ||||||||||||||||||||||||
| Moranbah-Grosvenor (Steelmaking Coal) | — | — | — | — | 211 | 147 | ||||||||||||||||||
| Dawson (Steelmaking Coal) | — | — | — | — | 217 | 152 | ||||||||||||||||||
| Impairment reversals recognised as special items | — | — | — | — | 428 | 299 | ||||||||||||||||||
| Net impairments recognised as special items | (2,420 | ) | 247 | 31 | (2,142 | ) | (1,592 | ) | (1,530 | ) | ||||||||||||||
Further information
Additional information is provided for each of the Group’s assets where an impairment or impairment reversal has been recorded. Additional sensitivity disclosures are also provided for CGUs or groups of CGUs containing the most significant goodwill balances and for other assets where the recoverable amount is considered to be a significant estimate (see note 7).
| 2023 | 2022 | |||||||||||
| US$ million | Impairments | Impairments | Impairment reversals | |||||||||
| Allocates as: | ||||||||||||
| Intangibles | (1,438 | ) | (40 | ) | — | |||||||
| Property, plant and equipment | (1,044 | ) | (2,025 | ) | 438 | |||||||
| Other | (10 | ) | (3 | ) | — | |||||||
| Total | (2,492 | ) | (2,068 | ) | 438 | |||||||
| Recognised before tax: | ||||||||||||
| As special items | (2,420 | ) | (2,020 | ) | 428 | |||||||
| Within operating costs before special items | (72 | ) | (48 | ) | 10 | |||||||
| Total | (2,492 | ) | (2,068 | ) | 438 | |||||||
| 238 | Anglo American plc | Financial statements and other financial information |
| Integrated Annual Report 2023 | Notes to the financial statements |
Significant items
8. Impairment and impairment reversals continued
Impairments recorded
De Beers
Overview
The recoverable amount of De Beers was assessed as at 31 December 2023 and an impairment of $1.6 billion ($1.6 billion after tax and non-controlling interest) was recorded to bring the carrying value into line with the recoverable amount of $7.6 billion, calculated using a discount rate of 7.5% (2022: 7.5%). The impairment was allocated primarily to goodwill ($1.4 billion), which has been fully impaired, and property, plant and equipment ($0.2 billion).
Changes in 2023
The reduction in the recoverable amount is primarily driven by lower prices than previous forecasts reflecting a reduction in forecast consumer demand. This reflects macroeconomic uncertainty mainly in the US and China, as well as a strengthening of the US dollar against consumer country currencies which has had an adverse impact on demand in US dollar terms. Management has also updated its best estimates of the timing of differentiation between lab grown and natural diamonds, the impact of recycling, the latest Ore Reserves and Mineral Resources estimates and life of asset plans for the Group’s mines and, less significantly, the financial impact of revised contractual terms relating to De Beers’ longstanding mutually beneficial relationship with the Government of the Republic of Botswana (which are expected to be finalised during 2024).
Inputs to the valuation
The following are key inputs in the consumer demand forecast which in turn drives forecast prices:
| – | The model assumes real GDP growth, weighted by the markets in which we operate, of 3.3% (2022: 3.4%) over the next five years and starting from a lower base in 2023. |
| – | The external foreign exchange medium term forecast against the US dollar in our end consumer markets is annual US dollar depreciation of 2.5% against the Chinese renminbi, 6.2% against the Japanese yen, 1.7% against the euro and 1.3% against the Indian rupee for the medium term compared to 2023 actual average rates. |
| – | It is still assumed that lab grown diamonds will become clearly established as a product distinct from natural diamonds (as is increasingly clear in the market today given the significant and clear price and consumer offering differential). The model forecasts an imminent bifurcation between lab grown and natural diamond product offerings with only limited residual impact on the natural diamond market in the medium to long term. |
Forecast producer currencies are also a key input to the model as the forecasts impact operating costs in US dollar terms. In the medium term, we assume the Southern African producer currencies exchange rates depreciate by 0.1% for the Botswana pula and 0.6% for the South African rand per annum against the US dollar compared to the 2023 actual rates. Thereafter we assume purchasing power parity against the US dollar.
Sensitivities
The valuation remains sensitive to reasonably possible changes in the key inputs. Sensitivities are presented below on the basis that all other assumptions remain constant, although in reality changes may not occur independently of each other:
| – | A 0.5 percentage point increase or decrease in consumer countries GDP growth rate results in a change in the impairment charge of $0.6 billion. |
| – | A 5% appreciation or depreciation of the US dollar against consumer countries’ currencies results in a change in the impairment charge of $0.3 billion. |
| – | A 5% appreciation or depreciation of producer country currencies against our assumed US dollar results in a change in the impairment charge of $0.6 billion. |
| – | An increased level of residual competition from lab grown diamonds or a 1 year delay in bifurcation of natural diamonds and lab grown diamonds would result in an increase in the impairment charge of $0.4 billion and $0.3 billion respectively. |
| – | A 0.5% change in the discount rate would result in a change in the impairment charge of $0.2 billion. |
Impairments of goodwill are not eligible for reversal in future periods. The maximum potential reversal within the next twelve months is therefore $0.2 billion.
Barro Alto
The Barro Alto nickel operations had been previously impaired, of which $1 billion remained eligible for potential reversal at the start of the year. The recoverable amount of the CGU was assessed at 30 June 2023 as changes in the long term cost profile were identified as an indicator of impairment. This resulted in an impairment of $0.4 billion.
At 31 December 2023 the recoverable amount of the CGU was assessed again principally due to the short and medium term price outlook changes in the second half of the year, which were considered to be an indicator of impairment. The valuation, calculated using a discount rate of 8.3%, resulted in a further impairment of $0.4 billion, total for the year of $0.8 billion ($0.5 billion after tax), allocated to property, plant and equipment. The remaining carrying value of the CGU represents long term ore stockpiles (non-current inventory), which are required to be blended with future production. The net realisable value of these stockpiles is assessed under IAS 2 Inventories and currently exceeds their carrying value of $0.2 billion.
The valuation is inherently sensitive to changes in economic and operational assumptions. The model prepared at 31 December 2023 uses forecast nickel prices that fell within the analyst range throughout the model. The long term price from 2028 in the model fell within the third quartile of the analyst price range of $8.41/lb to $8.83/lb (LME Nickel, 2023 real basis). The model used a forecast for the average Brazilian real to US dollar real exchange rate which fell within the range of 5.0 BRL/$ to 5.3 BRL/$.
Sensitivities were considered to assess the impact of changes in key assumptions, principally price and foreign exchange forecasts. If the future nickel prices were increased by 10% throughout the valuation model with all other valuation assumptions remaining the same, the valuation would have increased by $0.4 billion. A 10% depreciation of the Brazilian real compared to the valuation assumptions would have resulted in an increase to the valuation of $0.3 billion.
Other assets
Minas-Rio
The Minas-Rio CGU includes the Minas-Rio iron ore mine and the Ferroport joint venture, which provides port services to ship the mine’s production. The CGU has been previously impaired, of which $5.9 billion remained eligible for potential reversal at the start of the year. At 31 December 2023 the recoverable amount of the CGU was assessed as changes to the medium and long term price outlook and revisions to the forecast production and capital expenditure profile indicated that the recoverable amount may have changed. The valuation, calculated using a discounted cashflow model and a discount rate of 7.8% was consistent with the carrying amount of $7.3 billion.
| Anglo American plc | Financial statements and other financial information | 239 |
| Integrated Annual Report 2023 | Notes to the financial statements |
Significant items
8. Impairment and impairment reversals continued
The valuation is inherently sensitive to changes in economic and operational assumptions and the recoverable amount is considered to be a significant accounting estimate. The valuation model uses forecast iron ore prices that fall within the analyst range throughout the model. The long term price from 2028 fell within the top quartile of the analyst price range of $84/tonne to $100/tonne (Platts 62% CFR Reference basis, 2023 real basis). The model used a forecast for the average Brazilian real to US dollar real exchange rate which fell within the range of 5.0 BRL/$ to 5.3 BRL/$.
Sensitivities were considered to assess the impact of changes in key assumptions, principally price and foreign exchange forecasts. If the future iron ore prices were increased or decreased by 10% throughout the valuation model with all other valuation assumptions remaining the same, the valuation would have changed by $2.0 billion. A 10% depreciation of the Brazilian real compared to the valuation assumptions would have resulted in an increase to the valuation of $0.9 billion. A 10% appreciation of the Brazilian real compared to the valuation assumptions would have resulted in a decrease to the valuation of $1.0 billion.
2022
Impairments/impairment reversals recorded
Kolomela
At 31 December 2022, following revisions to the forecast production and cost profile in the latest Life of Asset Plan, the valuation of the Kolomela mine was assessed and an impairment of $0.3 billion ($0.1 billion after tax and non-controlling interest) was recorded against property, plant and equipment to bring the carrying value in line with the recoverable amount of $0.7 billion, calculated using a discount rate of 8.8%.
Moranbah-Grosvenor
Improvements in the economic environment and the current market conditions were considered to be a trigger for impairment reversal. A partial impairment reversal of $0.2 billion ($0.1 billion after tax) was recognised against property, plant and equipment, based on discounted cashflows using a discount rate of 6.7%, to bring the carrying value to $2.4 billion.
Dawson
Improvements in the economic environment and the current market conditions were considered to be a trigger for impairment reversal. An impairment reversal of $0.2 billion ($0.2 billion after tax) was recognised against property, plant and equipment, based on discounted cashflows using a discount rate of 6.7%, bringing the carrying value to $0.3 billion.
Woodsmith
In 2022, project team proposals, endorsed by the Board at the end of the year, indicated there would be changes to the configuration of the project that would incur higher future capital expenditure and result in a longer construction schedule with first product expected to be brought to market in 2027. These items were identified as an indicator of impairment and the carrying value of the related assets was assessed as at 31 December 2022 based on discounted cashflows using a discount rate of 9.58%. This resulted in an impairment of $1.7 billion ($1.7 billion after tax) to bring the carrying value into line with the recoverable amount of $0.9 billion. The impairment was allocated primarily to property, plant and equipment.
Accounting judgements
Impairment testing involves a number of significant accounting judgements and estimates, which are set out in note 7.
CGU assessment
As set out in note 7, the Group regularly assesses each of its cash generating units (CGUs) for indicators of impairment or impairment reversal. The Group applies judgement when allocating its assets to CGUs, which are defined as the smallest group of assets that generate cash inflows that are largely independent of the cash inflows from other assets or groups of assets. Where an operation is vertically integrated so that each activity/process feeds into the next one until a final product is produced, particular judgement may be required to determine whether there is an active market for any intermediate product.
The Group’s platinum group metals mining, smelting and processing business is considered to be a single CGU on the basis that there is only an active market for the final refined product and hence none of the preceding stages in the production process would be capable of generating independent cash inflows.
| 240 | Anglo American plc | Financial statements and other financial information |
| Integrated Annual Report 2023 | Notes to the financial statements |
Significant items
9. Special items and remeasurements
Overview
| 2023 | 2022 | |||||||||||||||||||
| US$ million | Before tax | Tax | Non- controlling interests |
Net | Net | |||||||||||||||
| Revenue remeasurements | (4 | ) | (2 | ) | 3 | (3 | ) | (14 | ) | |||||||||||
| Impairments | (2,420 | ) | 247 | 31 | (2,142 | ) | (1,829 | ) | ||||||||||||
| Impairment reversals | — | — | — | — | 299 | |||||||||||||||
| Restructuring costs | (142 | ) | 5 | 6 | (131 | ) | — | |||||||||||||
| Operating remeasurements | (86 | ) | 5 | (1 | ) | (82 | ) | (72 | ) | |||||||||||
| Operating special items and remeasurements | (2,648 | ) | 257 | 36 | (2,355 | ) | (1,602 | ) | ||||||||||||
| Disposals of businesses and investments | (40 | ) | 3 | 8 | (29 | ) | 32 | |||||||||||||
| Adjustments relating to business combinations | (36 | ) | 10 | — | (26 | ) | (24 | ) | ||||||||||||
| Adjustments relating to former operations | (24 | ) | (1 | ) | 3 | (22 | ) | (46 | ) | |||||||||||
| Charges relating to BEE transactions | — | — | — | — | (9 | ) | ||||||||||||||
| Non-operating special items | (100 | ) | 12 | 11 | (77 | ) | (47 | ) | ||||||||||||
| Financing special items and remeasurements | (31 | ) | — | — | (31 | ) | 15 | |||||||||||||
| Tax special items and remeasurements | — | (181 | ) | (2 | ) | (183 | ) | 126 | ||||||||||||
| Total | (2,783 | ) | 86 | 48 | (2,649 | ) | (1,522 | ) | ||||||||||||
Special items
Special items are those items of financial performance that, due to their size and nature, the Group believes should be separately disclosed on the face of the income statement. The Group classifies subsequent adjustments to items classified as special items on initial recognition in subsequent periods as special items. These items, along with related tax and non-controlling interests, are excluded from underlying earnings, which is an Alternative Performance Measure (APM). For more information on the APMs used by the Group, including definitions, please refer to page 318.
| – | Operating special items are those that relate to the operating performance of the Group and principally include impairment charges and reversals and restructuring costs relating to significant reorganisation programmes. |
| – | Non-operating special items are those that relate to changes in the Group’s asset portfolio. This category principally includes profits and losses on disposals of businesses and investments or closure of operations, adjustments relating to business combinations, and adjustments relating to former operations of the Group, such as changes in the measurement of deferred consideration receivable or provisions recognised on disposal or closure of operations in prior periods. This category also includes charges relating to Black Economic Empowerment (BEE) transactions. |
| – | Financing special items are those that relate to financing activities and include realised gains and losses on early repayment of borrowings, and the unwinding of the discount on material provisions previously recognised as special items. |
| – | Tax special items are those that relate to tax charges or credits where the associated cash outflow or inflow is anticipated to be significant due to its size and nature, principally including resolution of tax enquiries. |
Remeasurements
Remeasurements are items that are excluded from underlying earnings in order to reverse timing differences in the recognition of gains and losses in the income statement in relation to transactions that, whilst economically linked, are subject to different accounting measurement or recognition criteria. Remeasurements include mark-to-market movements on derivatives that are economic hedges of transactions not yet recorded in the financial statements, in order to ensure that the overall economic impact of such transactions is reflected within the Group’s underlying earnings in the period in which they occur. When the underlying transaction is recorded in the income statement, the realised gains or losses are recorded in underlying earnings within either revenue, operating costs or net finance costs as appropriate. If the underlying transaction is recorded in the balance sheet, for example capital expenditure, the realised amount remains in remeasurements on settlement of the derivative.
| – | Revenue remeasurements, presented within revenue from other sources, include gains and losses on unsettled derivatives relating to revenue. |
| – | Operating remeasurements include unrealised gains and losses on derivatives relating to operating costs or capital expenditure transactions. They also include the reversal through depreciation and amortisation of a fair value gain or loss, arising on revaluation of a previously held equity interest in a business combination. |
| – | Financing remeasurements include unrealised gains and losses on financial assets and liabilities that represent economic hedges, including accounting hedges, related to financing arrangements. |
| – | Tax remeasurements include foreign exchange impacts arising in US dollar functional currency entities where tax calculations are generated based on local currency financial information and hence tax is susceptible to currency fluctuations. |
| Anglo American plc | Financial statements and other financial information | 241 |
| Integrated Annual Report 2023 | Notes to the financial statements |
Significant items
9. Special items and remeasurements continued
Revenue remeasurements
The loss of $4 million ($3 million after tax and non-controlling interests) (2022: loss of $14 million) relates to remeasurements on derivatives presented in revenue from other sources. For further details see note 2.
Operating special items
Impairments
Impairments of $2,420 million ($2,142 million after tax and non-controlling interests) recognised for the year ended 31 December 2023 primarily relate to impairments within De Beers: $1,601 million ($1,558 million after tax and non-controlling interests) and Barro Alto (Nickel): $779 million ($544 million after tax).
Further information on significant accounting matters relating to impairments is provided in note 8.
2022
Impairments of $1,829 million recognised for the year ended 31 December 2022 comprise impairments within Woodsmith (Crop Nutrients) $1,707 million and Kolomela (Iron Ore): $122 million.
Impairment reversals
There were no impairment reversals recognised for the year ended 31 December 2023.
2022
Impairment reversals of $299 million for the year ended 31 December 2022 relate to Steelmaking Coal.
Restructuring costs
Restructuring costs associated with an organisational change programme of $142 million ($131 million after tax and non-controlling interests) have been recognised for the year ended 31 December 2023 (2022: nil).
Operating remeasurements
Operating remeasurements reflect a loss of $86 million ($82 million after tax and non-controlling interests) (2022: $72 million) which principally relates to a $82 million (2022: $84 million) depreciation and amortisation charge arising due to the fair value uplift on the Group’s pre-existing 45% shareholding in De Beers, which was required on acquisition of a controlling stake in 2012.
Non-operating special items
Disposals of businesses and investments
The $40 million loss ($29 million after tax and non-controlling interests) relates to the disposal of Kroondal (Platinum Group Metals). Further information is provided in note 34.
2022
The $32 million profit relates to the disposal of Bokoni (Platinum Group Metals).
Adjustments relating to business combinations
The $36 million loss ($26 million after tax) (2022: $24 million) related to adjustments in respect of business combinations in prior years.
Adjustments relating to former operations
The net loss of $24 million ($22 million after tax and non-controlling interests) (2022: $46 million) principally related to deferred consideration adjustments in respect of the Group’s interests in Rustenburg and Union (Platinum Group Metals). The Rustenburg consideration was received in full in March 2023.
Charges relating to BEE transactions
There were no charges relating to BEE transactions for the year ended 31 December 2023.
2022
The charge of $9 million relates to a modification charge under IFRS 2 Share-based Payments following the amendment of the De Beers agreement with Ponahalo Investments (Pty) Ltd.
Financing special items and remeasurements
Financing special items and remeasurements comprise a net fair value loss of $31 million (2022: a net fair value gain of $15 million) in respect of fair value adjustments in relation to cross currency and interest rate swap derivatives and the related bonds.
Tax associated with special items and remeasurements
Tax associated with special items and remeasurements includes a tax remeasurement credit of $119 million (2022: credit of $72 million) principally arising on Brazilian deferred tax, a tax on special items and remeasurement credit of $267 million (2022: charge of $14 million) and a tax special items charge of $300 million (2022: credit of $56 million).
Of the total tax credit of $86 million (2022: credit of $114 million), there is a net current tax charge of $34 million (2022: charge of $41 million) and a net deferred tax credit of $120 million (2022: credit of $155 million).
| 242 | Anglo American plc | Financial statements and other financial information |
| Integrated Annual Report 2023 | Notes to the financial statements |
Capital base
We have a value-focused approach to capital allocation with clear prioritisation: maintain asset integrity; pay dividends to our shareholders while ensuring a strong balance sheet. Discretionary capital is then allocated based on a balanced approach.
Value-disciplined capital allocation throughout the cycle is critical to protecting and enhancing our shareholders’ capital, given the long term and capital intensive nature of our business.
The Group uses attributable return on capital employed (ROCE) to monitor how efficiently assets are generating profit on invested capital for the equity shareholders of the Company. Attributable ROCE is an Alternative Performance Measure (APM). For more information on the APMs used by the Group, including definitions, please refer to page 318.
Attributable ROCE decreased to 16% (2022: 30%). Attributable underlying EBIT decreased to $5.4 billion (2022: $9.7 billion), reflecting the impact of lower realised prices for the Group’s products and inflationary cost pressures. Average attributable capital employed increased to $33.2 billion (2022: $32.0 billion(1)), primarily due to capital expenditure, largely at Quellaveco and Collahuasi (Copper), and shipping vessel lease additions and revaluations (Corporate and Other), partly offset by the reduction in capital employed following the De Beers and Nickel impairments recorded in 2023.
| Attributable ROCE % | ||||||||
| 2023 | 2022 | |||||||
| Copper | 20 | 16 | ||||||
| Nickel | 6 | 24 | ||||||
| Platinum Group Metals | 15 | 86 | ||||||
| De Beers | (3 | ) | 11 | |||||
| Iron Ore | 34 | 28 | ||||||
| Steelmaking Coal | 27 | 85 | ||||||
| Manganese | 81 | 138 | ||||||
| Crop Nutrients | n/a | n/a | ||||||
| Corporate and other | n/a | n/a | ||||||
| 16 | 30 | |||||||
| (1) | Comparative figures are restated for the adoption of the amendment to IAS 12, see note 39A. |
10. Capital by segment
The disclosures in this note include certain Alternative Performance Measures (APMs). For more information on the APMs used by the Group, including definitions, please refer to page 318.
Capital employed by segment
Capital employed is the principal measure of segment assets and liabilities reported to the Executive Leadership Team. Capital employed is defined as net assets excluding net debt, vessel lease contracts that are priced with reference to a freight index, the debit valuation adjustment attributable to derivatives hedging net debt and financial asset investments.
| Capital employed | ||||||||
| US$ million | 2023 | 2022 (restated)(1) |
||||||
| Copper(1) | 14,309 | 13,661 | ||||||
| Nickel | 588 | 1,393 | ||||||
| Platinum Group Metals | 5,175 | 4,753 | ||||||
| De Beers | 7,257 | 8,218 | ||||||
| Iron Ore | 9,044 | 8,488 | ||||||
| Steelmaking Coal | 3,364 | 2,837 | ||||||
| Manganese | 141 | 210 | ||||||
| Crop Nutrients | 1,309 | 489 | ||||||
| Corporate and other | 1,240 | 492 | ||||||
| Capital employed | 42,427 | 40,541 | ||||||
| Reconciliation to Consolidated balance sheet: | ||||||||
| Net debt | (10,615 | ) | (6,918 | ) | ||||
| Variable vessel leases excluded from net debt (see note 21) | (637 | ) | (127 | ) | ||||
| Debit valuation adjustment attributable to derivatives hedging net debt | 3 | 29 | ||||||
| Financial asset investments | 439 | 428 | ||||||
| Net assets | 31,617 | 33,953 | ||||||
| (1) | Comparative figures are restated for the adoption of the amendment to IAS 12, see note 39A. |
| Anglo American plc | Financial statements and other financial information | 243 |
| Integrated Annual Report 2023 | Notes to the financial statements |
Capital base
10. Capital by segment continued
Non-current assets by location
| Intangible
assets, Property, plant and equipment |
Total non-current assets | |||||||||||||||
| US$ million | 2023 | 2022 | 2023 | 2022 | ||||||||||||
| South Africa | 10,352 | 10,074 | 10,986 | 10,778 | ||||||||||||
| Botswana | 2,025 | 2,979 | 2,031 | 2,982 | ||||||||||||
| Other Africa | 844 | 1,084 | 848 | 1,088 | ||||||||||||
| Brazil | 7,112 | 7,529 | 7,817 | 8,138 | ||||||||||||
| Chile | 8,253 | 7,424 | 8,330 | 7,498 | ||||||||||||
| Peru | 8,654 | 8,075 | 8,693 | 8,079 | ||||||||||||
| Other South America | — | — | 1 | 2 | ||||||||||||
| North America | 630 | 563 | 642 | 581 | ||||||||||||
| Australia and Asia | 4,357 | 3,591 | 4,838 | 4,083 | ||||||||||||
| United Kingdom(1) | 3,102 | 2,536 | 3,291 | 2,653 | ||||||||||||
| Other Europe | 99 | 98 | 99 | 98 | ||||||||||||
| Non-current assets by location | 45,428 | 43,953 | 47,576 | 45,980 | ||||||||||||
| Unallocated assets | 1,641 | 1,491 | ||||||||||||||
| Total non-current assets | 49,217 | 47,471 | ||||||||||||||
| (1) | United Kingdom is Anglo American plc’s country of domicile. |
Total non-current assets by location primarily comprise Intangible assets, Property, plant and equipment and Investments in associates and joint ventures.
11. Intangible assets
Overview
Intangible assets comprise goodwill acquired through business combinations, brands, contracts and other non-mining assets.
| 2023 | 2022 | |||||||||||||||||||||||||||||||
| US$ million | Brands | Contracts and other intangibles |
Goodwill | Total | Brands | Contracts and other intangibles |
Goodwill | Total | ||||||||||||||||||||||||
| Net book value | ||||||||||||||||||||||||||||||||
| At 1 January | 517 | 640 | 1,671 | 2,828 | 517 | 608 | 1,877 | 3,002 | ||||||||||||||||||||||||
| Acquired through business combinations | — | — | 50 | 50 | — | — | — | — | ||||||||||||||||||||||||
| Additions | — | 191 | — | 191 | — | 153 | — | 153 | ||||||||||||||||||||||||
| Amortisation charge for the year | — | (76 | ) | — | (76 | ) | — | (59 | ) | — | (59 | ) | ||||||||||||||||||||
| Impairments | (21 | ) | (27 | ) | (1,390 | ) | (1,438 | ) | — | (40 | ) | — | (40 | ) | ||||||||||||||||||
| Currency movements | — | (15 | ) | (61 | ) | (76 | ) | — | (22 | ) | (206 | ) | (228 | ) | ||||||||||||||||||
| At 31 December | 496 | 713 | 270 | 1,479 | 517 | 640 | 1,671 | 2,828 | ||||||||||||||||||||||||
| Cost | 517 | 1,258 | 1,732 | 3,507 | 517 | 1,183 | 1,742 | 3,442 | ||||||||||||||||||||||||
| Accumulated amortisation and impairment | (21 | ) | (545 | ) | (1,462 | ) | (2,028 | ) | — | (543 | ) | (71 | ) | (614 | ) | |||||||||||||||||
Brands, contracts and other intangibles includes $822 million (2022: $889 million) relating to De Beers, principally comprising assets that were recognised at fair value on acquisition of a controlling interest in De Beers in August 2012. At 31 December 2023, $496 million (2022: $517 million) of intangible assets that are deemed to have indefinite useful lives relating to brands in De Beers.
Further information
Goodwill relates to the following cash generating units (CGUs) or groups of CGUs:
| US$ million | 2023 | 2022 | ||||||
| Copper Chile | 124 | 124 | ||||||
| Platinum Group Metals | 96 | 103 | ||||||
| De Beers | — | 1,434 | ||||||
| Other | 50 | 10 | ||||||
| 270 | 1,671 | |||||||
Accounting judgements and estimates
Goodwill and brands are tested at least annually for impairment by assessing the recoverable amount of the related CGU or group of CGUs. Further information in relation to De Beers is set out in note 8. Management believes that any reasonably possible change in a key assumption, on which the recoverable amount of goodwill allocated to the Los Bronces - Chagres CGU (Copper Chile) and Platinum Group Metals is based, would not cause the carrying values to exceed their recoverable amounts. Further details about how the recoverable amounts have been determined are set out in notes 7 and 8.
Accounting policy
See note 39D for the Group’s accounting policies on intangible assets.
| 244 | Anglo American plc | Financial statements and other financial information |
| Integrated Annual Report 2023 | Notes to the financial statements |
Capital base
12. Property, plant and equipment
Overview
Property, plant and equipment comprises the physical assets that make up the Group’s operations. These include acquired mineral rights, capitalised waste stripping and mine development costs, processing plants and infrastructure, vehicles and other equipment.
| 2023 | ||||||||||||||||||||||||||||
| Owned and leased assets | ||||||||||||||||||||||||||||
| US$ million | Mining properties – Owned |
Land and buildings – Owned |
Land and buildings – Right-of- use assets |
Plant and equipment – Owned |
Plant and equipment – Right-of- use assets |
Capital works in progress |
Total | |||||||||||||||||||||
| Net book value | ||||||||||||||||||||||||||||
| At 1 January | 10,032 | 1,655 | 464 | 13,999 | 312 | 14,663 | 41,125 | |||||||||||||||||||||
| Additions | 307 | 12 | 53 | 258 | 536 | 6,162 | 7,328 | |||||||||||||||||||||
| Depreciation charge for the year | (859 | ) | (147 | ) | (52 | ) | (1,437 | ) | (240 | ) | — | (2,735 | ) | |||||||||||||||
| Impairments | (283 | ) | (310 | ) | (11 | ) | (268 | ) | (34 | ) | (138 | ) | (1,044 | ) | ||||||||||||||
| Revaluation of shipping leases | — | — | — | — | 362 | — | 362 | |||||||||||||||||||||
| Disposals | (20 | ) | (11 | ) | — | (88 | ) | (1 | ) | (1 | ) | (121 | ) | |||||||||||||||
| Reclassifications | 2,825 | 4,453 | — | 3,689 | — | (10,967 | ) | — | ||||||||||||||||||||
| Currency movements | (473 | ) | (51 | ) | (11 | ) | (147 | ) | (1 | ) | (283 | ) | (966 | ) | ||||||||||||||
| At 31 December | 11,529 | 5,601 | 443 | 16,006 | 934 | 9,436 | 43,949 | |||||||||||||||||||||
| Cost | 25,913 | 7,052 | 682 | 35,130 | 1,840 | 11,381 | 81,998 | |||||||||||||||||||||
| Accumulated depreciation and impairment | (14,384 | ) | (1,451 | ) | (239 | ) | (19,124 | ) | (906 | ) | (1,945 | ) | (38,049 | ) | ||||||||||||||
| 2022 | ||||||||||||||||||||||||||||
| Owned and leased assets | ||||||||||||||||||||||||||||
| US$ million | Mining properties – Owned |
Land and buildings – Owned |
Land and buildings – Right-of- use assets |
Plant and equipment – Owned |
Plant and equipment – Right-of- use assets |
Capital works in progress |
Total | |||||||||||||||||||||
| Net book value | ||||||||||||||||||||||||||||
| At 1 January | 10,119 | 1,776 | 454 | 13,590 | 312 | 13,250 | 39,501 | |||||||||||||||||||||
| Additions | 586 | 16 | 76 | 102 | 194 | 5,860 | 6,834 | |||||||||||||||||||||
| Depreciation charge for the year | (890 | ) | (81 | ) | (44 | ) | (1,347 | ) | (195 | ) | — | (2,557 | ) | |||||||||||||||
| Impairments | (106 | ) | (82 | ) | (32 | ) | (142 | ) | — | (1,663 | ) | (2,025 | ) | |||||||||||||||
| Impairments reversed | 181 | 24 | — | 197 | 4 | 24 | 430 | |||||||||||||||||||||
| Revaluation of shipping leases | — | — | — | — | 8 | — | 8 | |||||||||||||||||||||
| Disposals | (12 | ) | (1 | ) | (6 | ) | (35 | ) | (7 | ) | (23 | ) | (84 | ) | ||||||||||||||
| Reclassifications | 664 | 50 | 22 | 1,827 | — | (2,563 | ) | — | ||||||||||||||||||||
| Currency movements | (510 | ) | (47 | ) | (6 | ) | (193 | ) | (4 | ) | (222 | ) | (982 | ) | ||||||||||||||
| At 31 December | 10,032 | 1,655 | 464 | 13,999 | 312 | 14,663 | 41,125 | |||||||||||||||||||||
| Cost | 25,896 | 2,673 | 648 | 32,394 | 987 | 16,496 | 79,094 | |||||||||||||||||||||
| Accumulated depreciation and impairment | (15,864 | ) | (1,018 | ) | (184 | ) | (18,395 | ) | (675 | ) | (1,833 | ) | (37,969 | ) | ||||||||||||||
Additions include $515 million (2022: $378 million) of net interest expense incurred on borrowings which fund the construction of qualifying assets that have been capitalised during the year, principally for the Quellaveco copper project in Peru and the Woodsmith project in the UK. The Quellaveco project achieved commercial production on 1 June 2023, after which interest expense incurred on borrowings was recognised within finance costs in the Consolidated income statement.
Depreciation includes $2,623 million (2022: $2,401 million) of depreciation within operating profit, $68 million (2022: $69 million) of depreciation arising due to the fair value uplift on the pre-existing 45% shareholding in De Beers which has been included within operating remeasurements (see note 9), and $44 million (2022: $87 million) of pre-commercial production depreciation on assets used in capital projects which has been capitalised.
The impairment charge for the year relates principally to the Group’s Nickel reportable segment. A charge of $213 million relates to the De Beers reportable segment and was primarily recorded within the mining properties asset class.
Disposals includes disposals of assets and businesses.
Accounting
judgements and estimates
Impairment testing
Impairment testing involves a number of significant accounting judgements and estimates, which are set out in note 7.
Commercial production
The Group applies judgement in determining when a mine reaches commercial production. The Group assesses a number of factors when making this judgement. Typically, a mine reaches commercial production when mine assets are consistently operating at 80% of nameplate production capacity. The Group’s Quellaveco copper project is most affected by this judgement in the current year. The Quellaveco project achieved commercial production on 1 June 2023, after which borrowing costs were recognised within finance costs in the Consolidated income statement and assets considered ready for use were reclassified from Capital Work in Progress to appropriate asset classes and subsequently depreciated.
| Anglo American plc | Financial statements and other financial information | 245 |
| Integrated Annual Report 2023 | Notes to the financial statements |
Capital base
12. Property, plant and equipment continued
Depreciation
Depreciation is calculated with reference to the Group’s best estimate of useful economic lives of assets. Useful economic lives of mining properties are generally limited to the expected life of the related orebody. The life of the orebody, in turn, is estimated on the basis of the Life of Asset Plan. Where an asset is not dependent on the life of a related orebody, management applies judgment in estimating the remaining useful economic life of the asset. Climate change may impact the useful economic lives of the Group’s mining properties if changing commodity prices extend or reduce the period in which resources can be extracted from an orebody economically.
Deferred stripping
In certain mining operations, rock or soil overlying a mineral deposit, known as overburden, and other waste materials must be removed to access the orebody. The process of removing overburden and other mine waste materials is referred to as stripping.
The Group defers stripping costs onto the balance sheet where they are considered to improve access to ore in future periods. Where the amount to be capitalised cannot be specifically identified because stripping activities and production occur simultaneously, the amount to be capitalised is calculated based on the waste moved in excess of the life of mine average for the component. Determining the average strip ratio for the mine is an accounting estimate. The identification of components is an area of judgement, reflecting the design of each mine. Both accounting judgements and estimates are made with reference to the Life of Asset Plan.
Accounting policy
See note 39D for the Group’s accounting policies on property, plant and equipment.
13. Capital expenditure
The disclosures in this note include certain Alternative Performance Measures (APMs). For more information on the APMs used by the Group, including definitions, please refer to page 318.
Capital expenditure by segment
| US$ million | 2023 | 2022 | ||||||
| Copper | 1,684 | 2,031 | ||||||
| Nickel | 91 | 79 | ||||||
| Platinum Group Metals | 1,108 | 1,017 | ||||||
| De Beers | 623 | 593 | ||||||
| Iron Ore | 909 | 834 | ||||||
| Steelmaking Coal | 619 | 648 | ||||||
| Crop Nutrients | 641 | 522 | ||||||
| Corporate and other | 59 | 14 | ||||||
| Capital expenditure | 5,734 | 5,738 | ||||||
| Reconciliation to Consolidated cash flow statement: | ||||||||
| Cash flows used in derivatives related to capital expenditure | (3 | ) | — | |||||
| Proceeds from disposal of property, plant and equipment | 16 | 7 | ||||||
| Direct funding for capital expenditure received from non-controlling interests | 129 | 446 | ||||||
| Expenditure on property, plant and equipment | 5,876 | 6,191 | ||||||
Direct funding for capital expenditure from non-controlling interests related to the Quellaveco project was fully drawn in April 2023. Mitsubishi has continued to provide direct funding for its 40% share of capital expenditure relating to the coarse particle recovery project via draw-downs against a committed shareholder facility which are recorded as borrowings on the Group’s Consolidated balance sheet.
Capital expenditure by category
| US$ million | 2023 | 2022 | ||||||
| Growth projects | 1,330 | 1,595 | ||||||
| Life-extension projects | 598 | 582 | ||||||
| Stay-in-business | 2,902 | 2,558 | ||||||
| Development and stripping | 920 | 1,010 | ||||||
| Proceeds from disposal of property, plant and equipment | (16 | ) | (7 | ) | ||||
| 5,734 | 5,738 | |||||||
Growth projects and life-extension projects capital expenditure includes the cash flows from derivatives related to capital expenditure and is net of direct funding for capital expenditure received from non-controlling interests.
| 246 | Anglo American plc | Financial statements and other financial information |
| Integrated Annual Report 2023 | Notes to the financial statements |
Capital base
14. Investments in associates and joint ventures
Overview
Investments in associates and joint ventures represent businesses the Group does not control, but instead exercises significant influence or joint control. These include (within the respective businesses) the associate Jellinbah (steelmaking coal production in the Steelmaking Coal segment) and the joint ventures Ferroport (port operations in the Iron Ore segment) and Samancor (manganese mining in the Manganese segment). The Group’s other investments in associates and joint ventures arise primarily in the Platinum Group Metals segment and Crop Nutrients segment.
The disclosures in this note include certain Alternative Performance Measures (APMs). For more information on the APMs used by the Group, including definitions, please refer to page 318.
| 2023 | 2022 | |||||||||||||||||||||||
| US$ million | Associates | Joint ventures | Total | Associates | Joint ventures | Total | ||||||||||||||||||
| At 1 January | 416 | 640 | 1,056 | 388 | 633 | 1,021 | ||||||||||||||||||
| Net income from associates and joint ventures | 248 | 130 | 378 | 452 | 189 | 641 | ||||||||||||||||||
| Dividends received | (203 | ) | (184 | ) | (387 | ) | (398 | ) | (210 | ) | (608 | ) | ||||||||||||
| Investments in equity and capitalised loans | 4 | 11 | 15 | 6 | 31 | 37 | ||||||||||||||||||
| Impairments | (10 | ) | — | (10 | ) | (3 | ) | — | (3 | ) | ||||||||||||||
| Other movements | 2 | (2 | ) | — | 3 | (2 | ) | 1 | ||||||||||||||||
| Currency movements | (1 | ) | 15 | 14 | (32 | ) | (1 | ) | (33 | ) | ||||||||||||||
| At 31 December | 456 | 610 | 1,066 | 416 | 640 | 1,056 | ||||||||||||||||||
Further information
The Group’s total investments in associates and joint ventures include long term loans of $125 million (2022: $137 million), which in substance form part of the Group’s net investment. These loans are not repayable in the foreseeable future.
The Group’s share of the results of the associates and joint ventures is as follows:
Income statement
| US$ million | 2023 | 2022 | ||||||
| Group revenue | 1,846 | 2,264 | ||||||
| Operating costs (before special items and remeasurements) | (1,234 | ) | (1,225 | ) | ||||
| Associates’ and joint ventures’ underlying EBIT | 612 | 1,039 | ||||||
| Net finance costs | (37 | ) | (16 | ) | ||||
| Income tax expense | (196 | ) | (379 | ) | ||||
| Non-controlling interests | (1 | ) | (3 | ) | ||||
| Net income from associates and joint ventures | 378 | 641 | ||||||
Balance sheet
| US$ million | Associates | Joint ventures | Total | |||||||||
| Non-current assets | 179 | 1,087 | 1,266 | |||||||||
| Current assets | 494 | 416 | 910 | |||||||||
| Current liabilities | (155 | ) | (214 | ) | (369 | ) | ||||||
| Non-current liabilities | (62 | ) | (679 | ) | (741 | ) | ||||||
| Net assets as at 31 December 2023 | 456 | 610 | 1,066 | |||||||||
| Net assets as at 31 December 2022 | 416 | 640 | 1,056 | |||||||||
| Anglo American plc | Financial statements and other financial information | 247 |
| Integrated Annual Report 2023 | Notes to the financial statements |
Capital base
14. Investments in associates and joint ventures continued
Further information
The Group’s share of the results of the associates and joint ventures is as follows:
| 2023 | ||||||||||||||||||||
| US$ million | Group revenue |
Underlying EBITDA |
Underlying EBIT |
Share of net income |
Dividends received |
|||||||||||||||
| Samancor | 670 | 231 | 145 | 66 | 127 | |||||||||||||||
| Jellinbah | 779 | 373 | 360 | 244 | 198 | |||||||||||||||
| Ferroport | 105 | 82 | 74 | 50 | 55 | |||||||||||||||
| Other | 292 | 31 | 33 | 18 | 7 | |||||||||||||||
| 1,846 | 717 | 612 | 378 | 387 | ||||||||||||||||
| 2022 | ||||||||||||||||||||
| US$ million | Group revenue |
Underlying EBITDA |
Underlying EBIT |
Share of net income |
Dividends received |
|||||||||||||||
| Samancor | 840 | 378 | 312 | 148 | 169 | |||||||||||||||
| Jellinbah | 1,056 | 674 | 660 | 454 | 393 | |||||||||||||||
| Ferroport | 99 | 75 | 69 | 47 | 41 | |||||||||||||||
| Other | 269 | (2 | ) | (2 | ) | (8 | ) | 5 | ||||||||||||
| 2,264 | 1,125 | 1,039 | 641 | 608 | ||||||||||||||||
| Aggregate investment | ||||||||
| US$ million | 2023 | 2022 | ||||||
| Samancor | 147 | 212 | ||||||
| Jellinbah | 415 | 370 | ||||||
| Ferroport | 290 | 280 | ||||||
| Other | 214 | 194 | ||||||
| 1,066 | 1,056 | |||||||
Accounting
judgements
Impairment
No indicators of impairment were identified for the Group’s material investments in associates and joint ventures during 2023. The key assumptions used in determining the recoverable amounts are set out in note 7.
Accounting policy
See note 39I for the Group’s accounting policy on associates and joint arrangements, which includes joint ventures.
| 248 | Anglo American plc | Financial statements and other financial information |
| Integrated Annual Report 2023 | Notes to the financial statements |
Capital base
15. Financial asset investments
Overview
Financial asset investments include three categories. Financial assets at amortised cost principally comprise loans to and deposits with third parties including the Group’s associates and joint ventures. Assets classified at fair value through other comprehensive income principally comprise investments in equities of other companies. Financial assets held at fair value through profit and loss comprise financial assets that do not meet the criteria to be classified under either of the other two categories.
| 2023 | 2022 | |||||||||||||||||||||||||||||||
| US$ million | Financial assets at amortised cost |
At fair value through profit and loss |
At fair value through other comprehensive income |
Total | Financial assets at amortised cost |
At fair value through profit and loss |
At fair value through other comprehensive income |
Total | ||||||||||||||||||||||||
| At 1 January | 226 | 35 | 167 | 428 | 127 | 60 | 182 | 369 | ||||||||||||||||||||||||
| Additions | — | 6 | 50 | 56 | — | 7 | 80 | 87 | ||||||||||||||||||||||||
| Interest receivable | 6 | 2 | — | 8 | 2 | — | — | 2 | ||||||||||||||||||||||||
| Net loans (repaid)/advanced | (1 | ) | 39 | — | 38 | 89 | (5 | ) | — | 84 | ||||||||||||||||||||||
| Disposals | — | — | (5 | ) | (5 | ) | — | — | (134 | ) | (134 | ) | ||||||||||||||||||||
| Impairments | — | — | — | — | (2 | ) | — | — | (2 | ) | ||||||||||||||||||||||
| Impairment reversals | — | — | — | — | 17 | — | — | 17 | ||||||||||||||||||||||||
| Fair value and other movements | — | (9 | ) | (76 | ) | (85 | ) | (12 | ) | (29 | ) | 50 | 9 | |||||||||||||||||||
| Currency movements | 3 | — | (4 | ) | (1 | ) | 5 | 2 | (11 | ) | (4 | ) | ||||||||||||||||||||
| At 31 December | 234 | 73 | 132 | 439 | 226 | 35 | 167 | 428 | ||||||||||||||||||||||||
| Current | 17 | 31 | — | 48 | 14 | 24 | — | 38 | ||||||||||||||||||||||||
| Non-current | 217 | 42 | 132 | 391 | 212 | 11 | 167 | 390 | ||||||||||||||||||||||||
Accounting policy
See note 39D for the Group’s accounting policies on financial asset investments.
16. Provisions for liabilities and charges
Overview
| US$ million | Environmental restoration |
Decommissioning | Employee benefits |
Onerous contracts |
Legal | Restructuring | Other | Total | ||||||||||||||||||||||||
| At 1 January | (1,761 | ) | (906 | ) | (161 | ) | (30 | ) | (250 | ) | (17 | ) | (168 | ) | (3,293 | ) | ||||||||||||||||
| Additional provisions charged to income statement | (246 | ) | (29 | ) | (76 | ) | (4 | ) | (34 | ) | (56 | ) | (18 | ) | (463 | ) | ||||||||||||||||
| Changes in discount rate | 38 | 29 | — | — | — | — | — | 67 | ||||||||||||||||||||||||
| Capitalised | (42 | ) | (121 | ) | — | — | (2 | ) | — | (130 | ) | (295 | ) | |||||||||||||||||||
| Unwinding of discount | (48 | ) | (26 | ) | (3 | ) | (2 | ) | — | — | — | (79 | ) | |||||||||||||||||||
| Amounts applied | 97 | 56 | 52 | 4 | 39 | 17 | 14 | 279 | ||||||||||||||||||||||||
| Unused amounts reversed | 7 | 65 | 7 | 18 | 33 | 1 | 24 | 155 | ||||||||||||||||||||||||
| Disposals | 28 | 15 | — | — | — | — | — | 43 | ||||||||||||||||||||||||
| Currency movements | 39 | 4 | 1 | (9 | ) | (15 | ) | 1 | 7 | 28 | ||||||||||||||||||||||
| At 31 December | (1,888 | ) | (913 | ) | (180 | ) | (23 | ) | (229 | ) | (54 | ) | (271 | ) | (3,558 | ) | ||||||||||||||||
| Current | (148 | ) | (30 | ) | (160 | ) | (23 | ) | (23 | ) | (53 | ) | (247 | ) | (684 | ) | ||||||||||||||||
| Non-current | (1,740 | ) | (883 | ) | (20 | ) | — | (206 | ) | (1 | ) | (24 | ) | (2,874 | ) | |||||||||||||||||
Further
information
Environmental restoration
The Group has an obligation to undertake restoration, rehabilitation and environmental work when environmental disturbance is caused by the development or ongoing production of a mining property. A provision is recognised for the present value of such costs, based on management’s best estimate of the legal and constructive obligations incurred. Changes in legislation could result in changes in provisions recognised. It is anticipated that the majority of these costs will be incurred over a period in excess of 20 years.
Decommissioning
Provision is made for the present value of costs relating to the decommissioning of plant or other site restoration work. It is anticipated that the majority of these costs will be incurred over a period in excess of 20 years.
The pre-tax, real discount rates that have been used in calculating the environmental restoration and decommissioning liabilities as at 31 December 2023, in the principal currencies in which these liabilities are denominated and with matching maturities to the timelines are as follows: US dollar: 1.7%–1.9% (2022: 1.7%–1.9%); South African rand: 4.9%–5.0% (2022: 4.5%–5.0%); Australian dollar: 1.5%–1.8% (2022: 1.5%–1.8%); Chilean peso: 2.2%–2.6% (2022: 1.7%–2.2%); and Brazilian real: 5.5%–5.9% (2022: 5.6%–6.0%).
Movements in environmental restoration and decommissioning provisions resulted in a net charge of $219 million within operating profit (2022: net charge of $324 million). In addition, the Group is required to provide guarantees in several jurisdictions in respect of environmental restoration and decommissioning obligations. These have not resulted in the recognition of any additional liabilities.
| Anglo American plc | Financial statements and other financial information | 249 |
| Integrated Annual Report 2023 | Notes to the financial statements |
Capital base
16. Provisions for liabilities and charges continued
Decommissioning and environmental restoration provisions also includes management’s best estimates of all material costs of conformance with Global Industry Standard for Tailing Management (GISTM). For further details see note 33.
Employee benefits
Provision is made for statutory or contractual employee entitlements where there is significant uncertainty over the timing or amount of settlement. It is anticipated that these costs will be incurred when employees choose to take their benefits.
Onerous contracts
Provision is made for the present value of certain long term contracts where the unavoidable cost of meeting the Group’s obligations is expected to exceed the benefits to be received.
Other
Other provisions relate to social commitments and other claims and liabilities.
Environmental rehabilitation trusts
The Group makes contributions to controlled funds that were established to meet the cost of some of its restoration and environmental rehabilitation liabilities in South Africa. The funds comprise the following investments, which with the exception of some cash balances, are held in unit trusts:
| US$ million | 2023 | 2022 | ||||||
| Equity | 76 | 74 | ||||||
| Bonds | 14 | 13 | ||||||
| Cash and cash equivalents | 18 | 20 | ||||||
| 108 | 107 | |||||||
These assets are primarily denominated in South African rand. Where not held in a unit trust, cash and cash equivalents are held in short term fixed deposits or earn interest at floating inter-bank rates. Bonds held in unit trusts earn interest at a weighted average fixed rate of 10.0% (2022: 10.0%) for an average period of eight years (2022: seven years).
These funds are not available for the general purposes of the Group (see note 24). All income from these assets is reinvested to meet specific environmental obligations. These obligations are included in provisions as stated above.
Accounting judgements and estimates
Environmental restoration and decommissioning provisions
The recognition and measurement of environmental restoration and decommissioning provisions requires judgement and is based on assumptions and estimates, including the required closure and rehabilitation costs, the timing of future cash flows, and the discount rates applied. Future cash flows used to determine environmental restoration and decommissioning provisions are risk adjusted to reflect potential changes in relation to the key assumptions made in the mine closure plan. Discount rates applied to determine environmental restoration and decommissioning provisions represent a market assessment of the time value of money only i.e. a risk-free rate. These rates are calculated on a real basis with reference to the yield for government bonds of the appropriate currency and duration. The Group has considered reasonably possible changes to discount rates and if the discount rates at 31 December 2023 were decreased by 1.0% then the total environmental restoration and decommissioning provisions would increase by $0.5 billion. Increase in discount rates by 1.0% would decrease the total restoration and decommissioning provisions by $0.4 billion.
The Group considers the impact of climate change on environmental restoration and decommissioning provisions, specifically the timing of future cash flows, and has concluded that it does not currently represent a key source of estimation uncertainty. Changes to legislation, including in relation to climate change, are factored into the provisions when the legislation becomes enacted.
Accounting policy
See note 39D for the Group’s accounting policy on environmental restoration and decommissioning obligations.
| 250 | Anglo American plc | Financial statements and other financial information |
| Integrated Annual Report 2023 | Notes to the financial statements |
Capital base
17. Deferred tax
Overview
The movement in net deferred tax liabilities during the year is as follows:
| US$ million | 2023 | 2022 (restated)(1) |
||||||
| At 1 January | (5,051 | ) | (4,404 | ) | ||||
| Charged to the income statement | (469 | ) | (852 | ) | ||||
| Credited to equity | 13 | 77 | ||||||
| Currency movements | 189 | 128 | ||||||
| At 31 December | (5,318 | ) | (5,051 | ) | ||||
| (1) | Comparative figures are restated for the adoption of the amendment to IAS 12, see note 39A. |
Further information
Where there is a right of offset of deferred tax balances within the same tax jurisdiction, IAS 12 Income Taxes requires these to be presented after such offset in the Consolidated balance sheet. The closing deferred tax balances before this offset are as follows:
| US$ million | 2023 | 2022 (restated)(1) |
||||||
| Deferred tax assets before offset | ||||||||
| Tax losses | 706 | 875 | ||||||
| Depreciation in excess of capital allowances | 240 | 163 | ||||||
| Other temporary differences | 638 | 745 | ||||||
| 1,584 | 1,783 | |||||||
| Deferred tax liabilities before offset | ||||||||
| Capital allowances in excess of depreciation | (4,410 | ) | (4,317 | ) | ||||
| Fair value adjustments | (548 | ) | (645 | ) | ||||
| Withholding tax | (22 | ) | (20 | ) | ||||
| Other temporary differences | (1,922 | ) | (1,852 | ) | ||||
| (6,902 | ) | (6,834 | ) | |||||
| (1) | Comparative figures are restated for the adoption of the amendment to IAS 12, see note 39A. |
The closing deferred tax balances after offset are as follows:
| US$ million | 2023 | 2022 (restated)(1) |
||||||
| Deferred tax assets | 262 | 198 | ||||||
| Deferred tax liabilities | (5,580 | ) | (5,249 | ) | ||||
| (5,318 | ) | (5,051 | ) | |||||
| (1) | Comparative figures are restated for the adoption of the amendment to IAS 12, see note 39A. |
Other temporary differences primarily arise in relation to deferred stripping costs and functional currency differences. The amount of deferred tax charged to the Consolidated income statement is as follows:
| US$ million | 2023 | 2022 | ||||||
| Capital allowances in excess of depreciation | (252 | ) | (712 | ) | ||||
| Fair value adjustments | 67 | 1 | ||||||
| Tax losses | (92 | ) | (404 | ) | ||||
| Provisions | (123 | ) | 45 | |||||
| Other temporary differences | (69 | ) | 218 | |||||
| (469 | ) | (852 | ) | |||||
Deferred tax charged to the income statement includes a credit of $119 million (2022: $72 million) relating to deferred tax remeasurements, a deferred tax on special items and remeasurement credit of $301 million (2022: $27 million) and a deferred tax special items charge of $300 million (2022: credit of $56 million).
Deferred tax assets are recognised to the extent that the business has forecast taxable profits against which the assets can be recovered. While the Group is in an overall net deferred tax liability (2022: liability) position, some deferred tax assets remain unrecognised in jurisdictions where no taxable profits are forecast and no right of offset against the Group’s deferred tax liabilities exists.
| Anglo American plc | Financial statements and other financial information | 251 |
| Integrated Annual Report 2023 | Notes to the financial statements |
Capital base
17. Deferred tax continued
The Group has the following temporary differences for which no deferred tax assets have been recognised:
| 2023 | 2022 (restated)(1) | |||||||||||||||||||||||||||||||
| US$ million | Tax losses – revenue |
Tax losses – capital |
Other temporary differences |
Total | Tax losses – revenue |
Tax losses – capital |
Other temporary differences |
Total | ||||||||||||||||||||||||
| Expiry date | ||||||||||||||||||||||||||||||||
| Less than five years | 155 | — | 139 | 294 | 126 | — | 2 | 128 | ||||||||||||||||||||||||
| Greater than five years | 864 | — | 898 | 1,762 | 832 | — | — | 832 | ||||||||||||||||||||||||
| No expiry date | 9,767 | 2,394 | 6,594 | 18,755 | 6,239 | 2,501 | 5,509 | 14,249 | ||||||||||||||||||||||||
| 10,786 | 2,394 | 7,631 | 20,811 | 7,197 | 2,501 | 5,511 | 15,209 | |||||||||||||||||||||||||
| (1) | The 2022 comparative figures have been restated to include $1,279 million of revenue tax losses and other temporary differences. |
No deferred tax has been recognised in respect of temporary differences associated with investments in subsidiaries, branches, associates and interests in joint ventures and joint operations where the Group is in a position to control the timing of the reversal of the temporary differences and it is probable that such differences will not reverse in the foreseeable future. Consistent with the Group’s impairment testing, the Group uses the Board approved forecasts as the basis for the profits expected to arise in the foreseeable future. The aggregate amount of temporary differences associated with such investments in subsidiaries, branches, associates and interests in joint ventures and joint operations is represented by the contribution of those investments to the Group’s retained earnings and amounted to $20,969 million (2022: $20,620 million).
Accounting
judgements and estimates
Recognition of deferred tax asset
In accordance with the requirements of IAS 12 Income Taxes, the Group reassesses the recognition and recoverability of deferred tax assets at the end of each reporting period.
Accounting policy
See note 39G for the Group’s accounting policy on tax.
| 252 | Anglo American plc | Financial statements and other financial information |
| Integrated Annual Report 2023 | Notes to the financial statements |
Working capital
This section includes analysis of inventories, receivables and payables. These balances principally relate to current assets and liabilities held to support operating activities.
| US$ million | 2023 | 2022 | ||||||
| Inventories | 7,234 | 7,407 | ||||||
| Trade and other receivables | 4,983 | 4,923 | ||||||
| Trade and other payables | (6,700 | ) | (7,629 | ) | ||||
| 5,517 | 4,701 | |||||||
Net working capital increased in 2023 led by a decrease in payables largely driven by the impact of lower Platinum Group Metals prices. Inventory and receivables remain broadly flat.
18. Inventories
Overview
Inventories represent goods held for sale in the ordinary course of business (finished products), ore being processed into a saleable condition (work in progress) and spares, raw materials and consumables to be used in the production process (raw materials and consumables).
| 2023 | 2022 | |||||||||||||||||||||||
| US$ million |
Expected to be used within one year |
Expected to be used after more than one year |
Total |
Expected to be used within one year |
Expected to be used after more than one year |
Total | ||||||||||||||||||
| Raw materials, consumables and other | 1,100 | 8 | 1,108 | 889 | — | 889 | ||||||||||||||||||
| Work in progress | 2,138 | 822 | 2,960 | 2,777 | 798 | 3,575 | ||||||||||||||||||
| Finished products | 3,149 | 17 | 3,166 | 2,932 | 11 | 2,943 | ||||||||||||||||||
| 6,387 | 847 | 7,234 | 6,598 | 809 | 7,407 | |||||||||||||||||||
Further information
The cost of inventories recognised as an expense and included in operating costs amounted to $15,457 million (2022: $16,983 million). The write-down of inventories to net realisable value (net of revaluation of provisionally priced purchases) amounted to $357 million (2022: $106 million).
Accounting estimates
Accounting for inventory involves the use of judgements and estimates, particularly in relation to the measurement and valuation of work in progress inventory within the production process. Certain estimates, including expected metal recoveries and work in progress volumes, are calculated by engineers using available industry, engineering and scientific data. Estimates used are periodically reassessed taking into account technical analysis, historical performance and physical counts. During the year, the Platinum Group Metals business updated its estimate of work in progress quantities following the completion of a physical count. This change in estimate reduced the carrying value of inventories by $89 million.
Accounting policy
See note 39E for the Group’s accounting policy on inventories.
| Anglo American plc | Financial statements and other financial information | 253 |
| Integrated Annual Report 2023 | Notes to the financial statements |
Working capital
19. Trade and other receivables
Overview
Trade receivables are amounts due from the Group’s customers for commodities and services the Group has provided. Many of the Group’s sales are provisionally priced, which means that the price is finalised at a date after the sale takes place. When there is uncertainty about the final amount that will be received, the receivable is marked to market based on the forward price.
Trade and other receivables also includes amounts receivable for VAT and other indirect taxes, prepaid expenses and deferred consideration.
| 2023 | 2022 | |||||||||||||||||||||||
| US$ million |
Due within one year |
Due after one year |
Total |
Due within one year |
Due after one year |
Total | ||||||||||||||||||
| Trade receivables | 2,468 | 43 | 2,511 | 2,175 | 46 | 2,221 | ||||||||||||||||||
| Tax receivables | 974 | 214 | 1,188 | 978 | 120 | 1,098 | ||||||||||||||||||
| Accrued income | 182 | — | 182 | 254 | — | 254 | ||||||||||||||||||
| Prepayments | 391 | 22 | 413 | 530 | 41 | 571 | ||||||||||||||||||
| Contract assets | 67 | — | 67 | 46 | — | 46 | ||||||||||||||||||
| Other receivables | 434 | 188 | 622 | 500 | 233 | 733 | ||||||||||||||||||
| 4,516 | 467 | 4,983 | 4,483 | 440 | 4,923 | |||||||||||||||||||
Further information
The Group applies the simplified expected credit loss model for its trade receivables measured at amortised cost, as permitted by IFRS 9 Financial Instruments. The expected credit losses on trade receivables are estimated using a provision matrix by reference to past default experience, credit profiles and financial metrics, adjusted as appropriate for current observable data.
As part of its approach to working capital management, the Group uses debtor discounting arrangements. These arrangements are on a non-recourse basis and hence the related receivables are derecognised from the Consolidated balance sheet.
Of the year end trade receivables balance $82 million (2022: $76 million) were past due, stated after an associated impairment provision of $33 million (2022: $22 million). Given the use of payment security instruments and the nature of the related counterparties, these amounts are considered recoverable. The historical level of customer default is minimal and there is no current observable data to indicate a material future default. As a result, the credit quality of year end trade receivables is considered to be high.
Trade receivables do not incur any interest as they are principally short term in nature and therefore are measured at their nominal value (with the exception of receivables relating to provisionally priced sales, as set out in the revenue recognition accounting policy, see note 39C), net of appropriate provisions for estimated irrecoverable amounts.
20. Trade and other payables
Overview
Trade and other payables include amounts owed to suppliers, tax authorities and other parties that are typically due to be settled within 12 months. The total also includes contract liabilities, which represents monies received from customers but for which we have not yet delivered the associated goods or service. These amounts are recognised as revenue when the goods are delivered or the service is provided. All revenue relating to performance obligations which were incomplete as at 31 December 2022 was recognised during the year. Other payables include deferred consideration in respect of business combinations and dividends payable to non-controlling interests.
| US$ million | 2023 | 2022 | ||||||
| Trade payables | 2,716 | 2,987 | ||||||
| Accruals | 2,504 | 2,399 | ||||||
| Contract liabilities and deferred income | 719 | 1,492 | ||||||
| Tax and social security | 198 | 131 | ||||||
| Other payables | 563 | 620 | ||||||
| 6,700 | 7,629 | |||||||
Further information
Trade payables are non-interest bearing and are measured at their nominal value (with the exception of payables relating to provisionally priced commodity purchases which are marked to market using the appropriate forward price) until settled. $189 million (2022: $249 million) of trade and other payables are included within non-current liabilities.
Contract liabilities and deferred income include $608 million (2022: $1,358 million) for payments received in advance for metal which is expected to be delivered within six months and $80 million (2022: $99 million) in respect of freight and performance obligations which are expected to be completed within 30 to 45 days. The decrease in contract liabilities and deferred income is primarily driven by a decrease in metal prices.
| 254 | Anglo American plc | Financial statements and other financial information |
| Integrated Annual Report 2023 | Notes to the financial statements |
Net debt and financial risk management
Net debt increased from $6.9 billion to $10.6 billion during the year, which includes a working capital cash outflow of $1.2 billion, primarily due to a reduction in payables. Gearing has increased from 17% at 31 December 2022 to 25% at 31 December 2023.
| US$ million | 2023 |
2022 (restated)(1) |
||||||
| Net assets | 31,617 | 33,953 | ||||||
| Net debt including related derivatives (note 21) | 10,615 | 6,918 | ||||||
| Variable vessel leases | 637 | 127 | ||||||
| Total capital | 42,869 | 40,998 | ||||||
| Gearing | 25 | % | 17 | % | ||||
| (1) | Comparative figures are restated for the adoption of the amendment to IAS 12, see note 39A. |
Net debt is calculated as total borrowings excluding variable vessel lease contracts that are priced with reference to a freight index, less cash and cash equivalents (including derivatives that provide an economic hedge of net debt but excluding the impact of the debit valuation adjustment on these derivatives). Total capital is calculated as ‘Net assets’ (as shown in the Consolidated balance sheet) excluding net debt and variable vessel leases.
21. Net debt
Overview
The disclosures in this note include certain Alternative Performance Measures (APMs). For more information on the APMs used by the Group, including definitions, please refer to page 318.
Movement in net debt
| US$ million |
Short term borrowings |
Medium and long term borrowings |
Total financing activity liabilities |
Removal of variable vessel leases |
Cash and cash equivalents |
Derivatives hedging net debt |
Net debt including derivatives |
|||||||||||||||||||||
| At 1 January 2022 | (1,226 | ) | (11,621 | ) | (12,847 | ) | 74 | 9,057 | (126 | ) | (3,842 | ) | ||||||||||||||||
| Cash flow | 1,274 | (2,990 | ) | (1,716 | ) | (86 | ) | (420 | ) | 103 | (2,119 | ) | ||||||||||||||||
| Interest accrued on borrowings | (430 | ) | (130 | ) | (560 | ) | 1 | — | — | (559 | ) | |||||||||||||||||
| Reclassifications | (940 | ) | 940 | — | — | — | — | — | ||||||||||||||||||||
| Movement in fair value | 8 | 886 | 894 | — | — | (1,069 | ) | (175 | ) | |||||||||||||||||||
| Other movements | (141 | ) | (143 | ) | (284 | ) | 138 | — | — | (146 | ) | |||||||||||||||||
| Currency movements | 47 | 113 | 160 | — | (237 | ) | — | (77 | ) | |||||||||||||||||||
| At 31 December 2022 | (1,408 | ) | (12,945 | ) | (14,353 | ) | 127 | 8,400 | (1,092 | ) | (6,918 | ) | ||||||||||||||||
| Cash flow | 1,538 | (1,941 | ) | (403 | ) | (133 | ) | (2,287 | ) | 610 | (2,213 | ) | ||||||||||||||||
| Interest accrued on borrowings | (719 | ) | (75 | ) | (794 | ) | 12 | — | — | (782 | ) | |||||||||||||||||
| Reclassifications | (847 | ) | 847 | — | — | — | — | — | ||||||||||||||||||||
| Movement in fair value | 14 | (293 | ) | (279 | ) | — | — | 54 | (225 | ) | ||||||||||||||||||
| Other movements | (329 | ) | (622 | ) | (951 | ) | 631 | — | — | (320 | ) | |||||||||||||||||
| Currency movements | 25 | (143 | ) | (118 | ) | — | (39 | ) | — | (157 | ) | |||||||||||||||||
| At 31 December 2023 | (1,726 | ) | (15,172 | ) | (16,898 | ) | 637 | 6,074 | (428 | ) | (10,615 | ) | ||||||||||||||||
Other movements within financing activity liabilities include $576 million relating to leases entered into in the year ended 31 December 2023 (2022: $278 million) and $362 million (2022: $8 million) relating to shipping lease revaluations, refer to note 23.
Further information
Reconciliation to the Consolidated balance sheet
| Cash and cash equivalents | Short term borrowings |
Medium and long term borrowings |
||||||||||||||||||||||
| US$ million | 2023 | 2022 | 2023 | 2022 | 2023 | 2022 | ||||||||||||||||||
| Balance sheet | 6,088 | 8,412 | (1,740 | ) | (1,420 | ) | (15,172 | ) | (12,945 | ) | ||||||||||||||
| Bank overdrafts | (14 | ) | (12 | ) | 14 | 12 | — | — | ||||||||||||||||
| Net cash/(debt) classifications | 6,074 | 8,400 | (1,726 | ) | (1,408 | ) | (15,172 | ) | (12,945 | ) | ||||||||||||||
Other
Debit valuation adjustments of $3 million (2022: $29 million) reduce the valuation of derivative liabilities hedging net debt reflecting the impact of the Group’s own credit risk. These adjustments are excluded from the Group’s definition of net debt.
Cash and cash equivalents includes $532 million which is restricted (2022: $513 million). This primarily relates to cash which is held in joint operations where the timing of dividends is jointly controlled by the joint operators.
Accounting policy
See note 39F for the Group’s accounting policy on cash and debt.
| Anglo American plc | Financial statements and other financial information | 255 |
| Integrated Annual Report 2023 | Notes to the financial statements |
Net debt and financial risk management
22. Borrowings
Overview
The Group borrows mostly in the capital markets through bonds issued in the US markets and under the Euro Medium Term Note (EMTN) programme. The Group uses interest rate and cross currency swaps to ensure that the majority of the Group’s borrowings are exposed to floating rate US dollar interest rates.
As part of its routine financing activities, in March 2023, the Group issued €500 million 4.5% Senior Notes due September 2028 and €500 million 5% Senior Notes due March 2031, and in May 2023, $900 million 5.5% Senior Notes due May 2033.
At 31 December 2022, the following bonds were retained as fixed rate exposure: $193 million 5.375% due April 2025, $99 million 5% due May 2027, $500 million 3.95% due September 2050, and $750 million 4.75% due March 2052. During the year ended 31 December 2023, the Group converted the following bonds to floating rates of interest for the next ten years by entering into interest rate swaps for a notional amount totalling $1.25 billion: $500 million 3.95% due September 2050 and $750 million 4.75% due March 2052. All other bonds at 31 December 2023 and 31 December 2022 were swapped to floating rate exposures.
Further information
| 2023 | 2022 | |||||||||||||||||||||||
| US$ million | Short
term |
Medium
and long term borrowings |
Total borrowings |
Contractual
repayment at hedge rates |
Short
term borrowings |
Medium
and long term borrowings |
Total borrowings |
Contractual
repayment at hedge rates |
||||||||||||||||
| Secured | ||||||||||||||||||||||||
| Bank loans and overdrafts | 43 | 71 | 114 | 114 | 38 | 96 | 134 | 134 | ||||||||||||||||
| Leases | 408 | 1,107 | 1,515 | 1,515 | 184 | 676 | 860 | 860 | ||||||||||||||||
| 451 | 1,178 | 1,629 | 1,629 | 222 | 772 | 994 | 994 | |||||||||||||||||
| Unsecured | ||||||||||||||||||||||||
| Bank loans and overdrafts | 489 | 503 | 992 | 992 | 253 | 509 | 762 | 762 | ||||||||||||||||
| Bank sustainability linked loans | — | 66 | 66 | 66 | — | 40 | 40 | 40 | ||||||||||||||||
| Bonds issued under EMTN programme | ||||||||||||||||||||||||
| 3.25% €750m bond due April 2023 | — | — | — | — | 800 | — | 800 | 1,033 | ||||||||||||||||
| 1.625% €600m bond due September 2025 | — | 637 | 637 | 714 | — | 595 | 595 | 714 | ||||||||||||||||
| 1.625% €500m bond due March 2026 | — | 523 | 523 | 566 | — | 485 | 485 | 566 | ||||||||||||||||
| 4.5% €500m bond due September 2028 | — | 570 | 570 | 528 | — | — | — | — | ||||||||||||||||
| 3.375% £300 million bond due March 2029 | — | 341 | 341 | 395 | — | 306 | 306 | 395 | ||||||||||||||||
| 5% €500m bond due March 2031 | — | 578 | 578 | 528 | — | — | — | — | ||||||||||||||||
| 4.75% €745m sustainability linked bond due September 2032 | — | 825 | 825 | 745 | — | 749 | 749 | 745 | ||||||||||||||||
| US bonds | ||||||||||||||||||||||||
| 3.625% $650m bond due September 2024 | 635 | — | 635 | 650 | — | 620 | 620 | 650 | ||||||||||||||||
| 5.375% $193m bond due April 2025 | — | 193 | 193 | 193 | — | 192 | 192 | 193 | ||||||||||||||||
| 4.875% $339m bond due May 2025 | — | 326 | 326 | 339 | — | 320 | 320 | 339 | ||||||||||||||||
| 4.75% $700m bond due April 2027 | — | 664 | 664 | 700 | — | 651 | 651 | 700 | ||||||||||||||||
| 5% $99m bond due May 2027(1) | — | 128 | 128 | 159 | — | 120 | 120 | 159 | ||||||||||||||||
| 4% $650m bond due September 2027 | — | 609 | 609 | 650 | — | 595 | 595 | 650 | ||||||||||||||||
| 2.25% $500m bond due March 2028 | — | 448 | 448 | 500 | — | 433 | 433 | 500 | ||||||||||||||||
| 4.5% $650m bond due March 2028 | — | 622 | 622 | 650 | — | 612 | 612 | 650 | ||||||||||||||||
| 3.875% $500m bond due March 2029 | — | 464 | 464 | 500 | — | 454 | 454 | 500 | ||||||||||||||||
| 5.625% $750m bond due April 2030 | — | 753 | 753 | 750 | — | 748 | 748 | 750 | ||||||||||||||||
| 2.625% $1bn bond due September 2030 | — | 811 | 811 | 1,000 | — | 780 | 780 | 1,000 | ||||||||||||||||
| 2.875% $500m bond due March 2031 | — | 430 | 430 | 500 | — | 419 | 419 | 500 | ||||||||||||||||
| 5.5% $900m bond due May 2033 | — | 874 | 874 | 900 | — | — | — | — | ||||||||||||||||
| 3.95% $500m bond due September 2050 | — | 499 | 499 | 500 | — | 490 | 490 | 500 | ||||||||||||||||
| 4.75% $750m bond due March 2052 | — | 749 | 749 | 750 | — | 732 | 732 | 750 | ||||||||||||||||
| Mitsubishi facility | — | 2,381 | 2,381 | 2,381 | — | 2,323 | 2,323 | 2,323 | ||||||||||||||||
| Interest payable and other loans | 165 | — | 165 | 165 | 145 | — | 145 | 145 | ||||||||||||||||
| 1,289 | 13,994 | 15,283 | 15,821 | 1,198 | 12,173 | 13,371 | 14,564 | |||||||||||||||||
| Total borrowings | 1,740 | 15,172 | 16,912 | 17,450 | 1,420 | 12,945 | 14,365 | 15,558 | ||||||||||||||||
(1) Bond acquired as part of the acquisition of Sirius Minerals plc (Crop Nutrients). At maturity the bond will be redeemed at 160% of par value.
Accounting policy
See note 39F for the Group’s accounting policies on bank borrowings and lease liabilities.
| 256 | Anglo American plc | Financial statements and other financial information |
| Integrated Annual Report 2023 | Notes to the financial statements |
Net debt and financial risk management
23. Leases
Overview
Leases relate principally to shipping vessels, corporate offices, employee accommodation and diamond jewellery retail outlets. Leases for shipping vessels typically run for 1 to 10 years and the majority are priced with reference to a freight index and the lease liability is therefore revalued to the spot freight rate at the end of each period. The leases for office space typically run for 5 to 25 years, employee accommodation up to 25 years and leases of retail stores 5 to 25 years. Some longer leases incorporate fixed increases in rentals or provide for annual uplifts based upon an index, typically a measure of inflation.
Further information
Amounts recognised in the Consolidated balance sheet
Lease agreements give rise to the recognition of a right-of-use asset (see note 12) and a related liability for future lease payments (see note 22). Lease liabilities balance and maturity analysis:
| US$ million | 2023 | 2022 | ||||
| Amount due for repayment within one year | 450 | 204 | ||||
| Greater than one year, less than two years | 266 | 121 | ||||
| Greater than two years, less than three years | 176 | 96 | ||||
| Greater than three years, less than four years | 153 | 80 | ||||
| Greater than four years, less than five years | 124 | 67 | ||||
| Greater than five years | 806 | 579 | ||||
| Total due for repayment after more than one year | 1,525 | 943 | ||||
| Total | 1,975 | 1,147 | ||||
| Effect of discounting | (460 | ) | (287 | ) | ||
| Lease liabilities | 1,515 | 860 |
Amounts recognised in the statement of profit or loss
| US$ million | 2023 | 2022 | ||||
| Depreciation of right-of-use assets (see note 12) | 292 | 239 | ||||
| Interest expense for lease liabilities (included in finance costs, see note 4) | 62 | 42 | ||||
| Expense relating to short term leases less than 12 months, variable leasing costs and leases of low value | 145 | 167 |
Amounts recognised in the Consolidated cash flow statement
In the Consolidated cash flow statement for the year ended 31 December 2023, the total amount of cash paid in respect of leases recognised on the Consolidated balance sheet are split between repayments of principal of $309 million (2022: $266 million) and repayments of interest of $53 million (2022: $31 million), both included within cash flows from financing activities. The repayment of both principal and interest forms part of both the Attributable free cash flow and Sustaining attributable free cash flow Alternative Performance Measures (APMs). For more information on the APMs used by the Group, including definitions, please refer to page 318.
Further disclosures
In addition to the lease commitments above, the Group has lease commitments in relation to leases not yet commenced of $204 million.
Accounting judgements
At the date of inception of a new contract or significant modification of an existing contract, the Group assesses whether the contract is, or contains, a lease. A contract is, or contains, a lease if the contract conveys the right to control the asset for a period of time in exchange for consideration. To identify lease arrangements, the Group assesses whether:
| – | The contract specifies the use of an identified asset or collection of assets |
| – | The Group has the right to obtain substantially all of the economic benefits from the use of the identified asset(s) |
| – | The Group has the right to direct the use of the asset(s). |
The Group has paid particular attention to the judgement over whether the lessor has a substantive right to substitute the specified assets for alternatives.
| – | Many assets used by the Group are highly specialised in nature and are purpose-built or modified to meet the Group’s specification. Judgement is required to assess whether the assets can be substituted and used for other purposes without significant additional modification. |
| – | The remote location of some of the Group’s operations presents practical difficulties to the substitution of assets. Judgement is required to determine whether assets in remote locations can be relocated to other locations within a reasonable timeframe and cost. |
| – | At some locations, high levels of security restrict the movement of assets to alternative locations, limiting the ability to substitute assets. |
| – | The Group’s health and safety standards exceed statutory requirements in some jurisdictions. This places limitations on the ability to substitute certain assets, such as vehicles. Judgement is required to assess whether equivalent assets meeting the Group’s requirements can be sourced within required operational timeframes. |
Accounting policy
Accounting policies applied to lease liabilities and corresponding right-of-use assets are set out respectively in notes 39F and 39D.
| Anglo American plc | Financial statements and other financial information | 257 |
| Integrated Annual Report 2023 | Notes to the financial statements |
Net debt and financial risk management
24. Financial instruments and derivatives
Financial instruments overview
For financial assets and liabilities which are traded on an active market, such as listed investments or listed debt instruments, fair value is determined by reference to market value. For non-traded financial assets and liabilities, fair value is calculated using discounted cash flows, considered to be reasonable and consistent with those that would be used by a market participant, and based on observable market data where available (for example forward exchange rate, interest rate or commodity price curve), unless carrying value is considered to approximate fair value.
Where discounted cash flow models based on management’s assumptions are used, the resulting fair value measurements are considered to be at level 3 in the fair value hierarchy, as defined in IFRS 13 Fair Value Measurement, as they depend to a significant extent on unobservable valuation inputs.
All derivatives that have been designated into hedge relationships have been separately disclosed.
| 2023 | ||||||||||||||||||||||||
| US$ million |
At fair value through profit and loss |
Financial assets at amortised cost |
At fair value through other comprehensive income |
Designated into hedges |
Financial liabilities at amortised cost |
Total | ||||||||||||||||||
| Financial assets | ||||||||||||||||||||||||
| Trade and other receivables | 2,247 | 1,082 | — | — | — | 3,329 | ||||||||||||||||||
| Derivative financial assets | 241 | — | — | 115 | — | 356 | ||||||||||||||||||
| Cash and cash equivalents | 4,359 | 1,729 | — | — | — | 6,088 | ||||||||||||||||||
| Financial asset investments | 73 | 234 | 132 | — | — | 439 | ||||||||||||||||||
| Environmental rehabilitation trusts(1) | 103 | 5 | — | — | — | 108 | ||||||||||||||||||
| 7,023 | 3,050 | 132 | 115 | — | 10,320 | |||||||||||||||||||
| Financial liabilities | ||||||||||||||||||||||||
| Trade and other payables | (668 | ) | — | — | — | (5,115 | ) | (5,783 | ) | |||||||||||||||
| Derivative financial liabilities | (172 | ) | — | — | (570 | ) | — | (742 | ) | |||||||||||||||
| Royalty liability | — | — | — | (91 | ) | (487 | ) | (578 | ) | |||||||||||||||
| Borrowings | — | — | — | (11,509 | ) | (5,403 | ) | (16,912 | ) | |||||||||||||||
| (840 | ) | — | — | (12,170 | ) | (11,005 | ) | (24,015 | ) | |||||||||||||||
| Net financial assets/(liabilities) | 6,183 | 3,050 | 132 | (12,055 | ) | (11,005 | ) | (13,695 | ) | |||||||||||||||
| 2022 | ||||||||||||||||||||||||
| US$ million | At fair value through profit and loss |
Financial assets at amortised cost |
At fair value through other comprehensive income |
Designated into hedges | Financial liabilities at amortised cost |
Total | ||||||||||||||||||
| Financial assets | ||||||||||||||||||||||||
| Trade and other receivables | 2,106 | 1,114 | — | — | — | 3,220 | ||||||||||||||||||
| Derivative financial assets | 241 | — | — | 12 | — | 253 | ||||||||||||||||||
| Cash and cash equivalents | 6,447 | 1,965 | — | — | — | 8,412 | ||||||||||||||||||
| Financial asset investments | 35 | 226 | 167 | — | — | 428 | ||||||||||||||||||
| Environmental rehabilitation trusts(1) | 100 | 7 | — | — | — | 107 | ||||||||||||||||||
| 8,929 | 3,312 | 167 | 12 | — | 12,420 | |||||||||||||||||||
| Financial liabilities | ||||||||||||||||||||||||
| Trade and other payables | (735 | ) | — | — | — | (5,271 | ) | (6,006 | ) | |||||||||||||||
| Derivative financial liabilities | (592 | ) | — | — | (737 | ) | — | (1,329 | ) | |||||||||||||||
| Royalty liability | — | — | — | (80 | ) | (430 | ) | (510 | ) | |||||||||||||||
| Borrowings | — | — | — | (8,681 | ) | (5,684 | ) | (14,365 | ) | |||||||||||||||
| (1,327 | ) | — | — | (9,498 | ) | (11,385 | ) | (22,210 | ) | |||||||||||||||
| Net financial assets/(liabilities) | 7,602 | 3,312 | 167 | (9,486 | ) | (11,385 | ) | (9,790 | ) | |||||||||||||||
| (1) | These funds are not available for the general purposes of the Group. All income from these assets is reinvested to meet specific environmental obligations. These obligations are included in provisions as per note 16. |
The Group’s cash and cash equivalents at 31 December 2023 include $4,359 million (2022: $6,447 million) held in high grade money market funds. These funds are selected to ensure compliance with the minimum credit rating requirements and counterparty exposure limits set out in the Group’s Treasury policy.
| 258 | Anglo American plc | Financial statements and other financial information |
| Integrated Annual Report 2023 | Notes to the financial statements |
Net debt and financial risk management
24. Financial instruments and derivatives continued
Fair value hierarchy
An analysis of financial assets and liabilities carried at fair value is set out below:
| 2023 | 2022 | |||||||||||||||||||||||
| US$ million | Level 1 | Level 2 | Level 3 | Total | Level 1 | Level 2 | Level 3 | Total | ||||||||||||||||
| Financial assets | ||||||||||||||||||||||||
| At fair value through profit and loss | ||||||||||||||||||||||||
| Provisionally priced trade receivables | — | 2,113 | — | 2,113 | — | 1,799 | — | 1,799 | ||||||||||||||||
| Other receivables | — | 12 | 122 | 134 | — | — | 307 | 307 | ||||||||||||||||
| Derivatives hedging net debt | — | 119 | — | 119 | — | 49 | — | 49 | ||||||||||||||||
| Other derivatives | — | 122 | — | 122 | — | 192 | — | 192 | ||||||||||||||||
| Cash and cash equivalents | 4,359 | — | — | 4,359 | 6,447 | — | — | 6,447 | ||||||||||||||||
| Financial asset investments | — | 68 | 5 | 73 | — | 31 | 4 | 35 | ||||||||||||||||
| Environmental rehabilitation trusts(1) | — | 103 | — | 103 | — | 100 | — | 100 | ||||||||||||||||
| Designated into hedges | ||||||||||||||||||||||||
| Derivatives hedging net debt | — | 115 | — | 115 | — | 12 | — | 12 | ||||||||||||||||
| At fair value through other comprehensive income | ||||||||||||||||||||||||
| Financial asset investments | 46 | — | 86 | 132 | 60 | — | 107 | 167 | ||||||||||||||||
| 4,405 | 2,652 | 213 | 7,270 | 6,507 | 2,183 | 418 | 9,108 | |||||||||||||||||
| Financial liabilities | ||||||||||||||||||||||||
| At fair value through profit and loss | ||||||||||||||||||||||||
| Provisionally priced trade payables | — | (426 | ) | — | (426 | ) | — | (368 | ) | — | (368 | ) | ||||||||||||
| Other payables | — | — | (242 | ) | (242 | ) | — | — | (367 | ) | (367 | ) | ||||||||||||
| Derivatives hedging net debt | — | (92 | ) | — | (92 | ) | — | (416 | ) | — | (416 | ) | ||||||||||||
| Other derivatives | — | (82 | ) | (1 | ) | (83 | ) | — | (205 | ) | — | (205 | ) | |||||||||||
| Debit valuation adjustment to derivative liabilities | — | 3 | — | 3 | — | 29 | — | 29 | ||||||||||||||||
| Designated into hedges | ||||||||||||||||||||||||
| Derivatives hedging net debt | — | (570 | ) | — | (570 | ) | — | (737 | ) | — | (737 | ) | ||||||||||||
| Royalty liability | — | — | (91 | ) | (91 | ) | — | — | (80 | ) | (80 | ) | ||||||||||||
| — | (1,167 | ) | (334 | ) | (1,501 | ) | — | (1,697 | ) | (447 | ) | (2,144 | ) | |||||||||||
| Net assets carried at fair value | 4,405 | 1,485 | (121 | ) | 5,769 | 6,507 | 486 | (29 | ) | 6,964 | ||||||||||||||
| (1) | These funds are not available for the general purposes of the Group. All income from these assets is reinvested to meet specific environmental obligations. These obligations are included in provisions as per note 16. |
| Fair value hierarchy | Valuation technique | |
| Level 1 | Valued using unadjusted quoted prices in active markets for identical financial instruments. This category includes cash and cash equivalents held in money market funds, listed equity shares and quoted futures. | |
|
Level 2
|
Instruments in this category are valued using valuation techniques where all of the inputs that have a significant effect on the valuation are directly or indirectly based on observable market data. This category includes provisionally priced trade receivables and payables and over-the-counter derivatives. | |
| Level 3 | Instruments in this category have been valued using a valuation technique where at least one input (which could have a significant effect on the instrument’s valuation) is not based on observable market data. Where inputs can be observed from market data without undue cost and effort, the observed input is used. Otherwise, management determines a reasonable estimate for the input. This category includes deferred consideration, receivables relating to disposals, unlisted equity investments and the embedded derivative relating to the Royalty liability. |
The movements in the fair value of the level 3 financial assets and liabilities are shown as follows:
| Assets | Liabilities | |||||||||||
| US$ million | 2023 | 2022 | 2023 | 2022 | ||||||||
| At 1 January | 418 | 830 | (447 | ) | (464 | ) | ||||||
| Net (loss)/profit recorded in the income statement | (22 | ) | (79 | ) | 9 | (73 | ) | |||||
| Net (loss)/profit recorded in the statement of comprehensive income | (12 | ) | 53 | (11 | ) | (80 | ) | |||||
| Reclassification (from)/to level 3 financial assets/(liabilities) | (7 | ) | 9 | (23 | ) | — | ||||||
| Additions | 94 | 22 | — | — | ||||||||
| Settlements and disposals | (233 | ) | (388 | ) | 119 | 153 | ||||||
| Currency movements | (25 | ) | (29 | ) | 19 | 17 | ||||||
| At 31 December | 213 | 418 | (334 | ) | (447 | ) | ||||||
| Anglo American plc | Financial statements and other financial information | 259 |
| Integrated Annual Report 2023 | Notes to the financial statements |
Net debt and financial risk management
24. Financial instruments and derivatives continued
Further information on financial instruments
Borrowings designated in fair value hedges represent listed debt which is held at amortised cost, adjusted for the fair value of the hedged interest rate risk. The fair value of these borrowings is $11,546 million (2022: $8,846 million), which is measured using quoted indicative broker prices and consequently categorised as level 2 in the fair value hierarchy. The carrying value of the remaining borrowings at amortised cost includes bonds which are not designated into hedge relationships, bank borrowings and lease liabilities. The carrying value of these bonds is $323 million (2022: $1,608 million) and the fair value is $330 million (2022: $1,381 million). The carrying value of the remaining borrowings at amortised cost are considered to approximate the fair value.
Offsetting of financial assets and liabilities
The Group offsets financial assets and liabilities and presents them on a net basis in the Consolidated balance sheet only where there is a legally enforceable right to offset the recognised amounts, and the Group intends to either settle the recognised amounts on a net basis or to realise the asset and settle the liability simultaneously.
At 31 December 2023, certain over-the-counter derivatives entered into by the Group and recognised at fair value through profit and loss are both subject to enforceable ISDA master netting arrangements and intended to be settled on a net basis. In accordance with the requirements of IAS 32 Financial Instruments: Presentation, the positions of these derivatives have been offset; those in a liability position totalling $9 million (2022: $7 million) were offset against those in an asset position totalling $281 million (2022: $149 million). The net asset position of $272 million (2022: $142 million) is presented within derivative assets (2022: within derivative assets) in the Consolidated balance sheet.
If certain credit events (such as default) were to occur, additional derivative instruments would be settled on a net basis under ISDA agreements. Interest rate and cross currency interest rate swaps in an asset position totalling $243 million (2022: $78 million) would be offset against those in a liability position totalling $681 million (2022: $1,129 million). These instruments are presented on a gross basis in the Consolidated balance sheet as the Group does not have a legally enforceable right to offset the amounts in the absence of a credit event occurring.
Royalty liability
When the Group acquired the Woodsmith project, the Hancock royalty liability and related embedded derivative were recognised. The royalty liability and associated derivative does not form part of borrowings on the basis that obligations to make cash payments against this liability only arise when the Woodsmith project generates revenues, and that otherwise the Group is not currently contractually liable to make any payments under this arrangement (other than in the event of Anglo American Crop Nutrients Limited’s insolvency).
Derivatives overview
The Group utilises derivative instruments to manage certain market risk exposures; however, it may choose not to designate certain derivatives as hedges for accounting purposes. Such derivatives are classified as ‘Held for trading’ and fair value movements are recorded in the Consolidated income statement.
The use of derivative instruments is subject to limits and the positions are regularly monitored and reported to senior management.
Fair value hedges
In accordance with the Group’s policy, interest rate swaps are taken out to swap the Group’s fixed rate borrowings to floating rate. These have been designated as fair value hedges. The carrying value of the hedged debt is adjusted at each balance sheet date to reflect the impact on its fair value of changes in market interest rates. At 31 December 2023, this adjustment was to decrease the carrying value of borrowings by $508 million (2022: $787 million decrease). Changes in the fair value of the hedged debt are offset against fair value changes in the interest rate swap and recognised in the Consolidated income statement as financing remeasurements. Recognised in the Consolidated income statement is a loss on fair value hedged items of $279 million (2022: $894 million gain), offset by a gain on fair value hedging instruments of $274 million (2022: $906 million loss).
Cash flow hedges
The royalty liability contains an embedded derivative as future payments are linked directly to future revenues. The Group has designated this embedded derivative as a cash flow hedge of future revenue from the Woodsmith project. During the year the Group recognised a loss within other comprehensive income of $11 million (2022: loss of $80 million) and a liability of $91 million (2022: liability of $80 million) within the royalty liability in respect of this derivative.
Held for trading
The Group may choose not to designate certain derivatives as hedges. This may occur where the Group is economically hedged but IFRS 9 Financial Instruments hedge accounting cannot be achieved or where gains and losses on both the derivative and hedged item naturally offset in the Consolidated income statement, as is the case for certain cross currency swaps of non-US dollar debt. A fair value gain of $149 million in respect of these cross currency swaps has been recognised in the Consolidated income statement (2022: loss of $1 million) and is presented within financing remeasurements net of foreign exchange losses on the related borrowings of $149 million (2022: gains of $30 million). Fair value changes on held for trading derivatives are recognised in the Consolidated income statement as remeasurements or within underlying earnings in accordance with the policy set out in note 9.
| 260 | Anglo American plc | Financial statements and other financial information |
| Integrated Annual Report 2023 | Notes to the financial statements |
Net debt and financial risk management
24. Financial instruments and derivatives continued
Further information on derivatives
Fair value of derivative positions
The fair value of the Group’s open derivative positions at 31 December (excluding normal purchase and sale contracts held off balance sheet) recorded within ‘Derivative financial assets’ and ‘Derivative financial liabilities’, is as follows:
| Current | Non-current | |||||||||||||||||||||||||||||||
| 2023 | 2022 | 2023 | 2022 | |||||||||||||||||||||||||||||
| US$ million | Asset | Liability | Asset | Liability | Asset | Liability | Asset | Liability | ||||||||||||||||||||||||
| Derivatives hedging net debt | ||||||||||||||||||||||||||||||||
| Fair value hedge | ||||||||||||||||||||||||||||||||
| Interest rate swaps | — | (11 | ) | 12 | — | 115 | (559 | ) | — | (737 | ) | |||||||||||||||||||||
| Held for trading | ||||||||||||||||||||||||||||||||
| Cross currency swaps | — | — | — | (265 | ) | 119 | (92 | ) | 49 | (151 | ) | |||||||||||||||||||||
| Debit valuation adjustment to derivative liabilities | — | — | — | 29 | — | 3 | — | — | ||||||||||||||||||||||||
| — | (11 | ) | 12 | (236 | ) | 234 | (648 | ) | 49 | (888 | ) | |||||||||||||||||||||
| Other derivatives | 118 | (83 | ) | 192 | (205 | ) | 4 | — | — | — | ||||||||||||||||||||||
| Total derivatives | 118 | (94 | ) | 204 | (441 | ) | 238 | (648 | ) | 49 | (888 | ) | ||||||||||||||||||||
Other derivatives primarily relate to forward foreign currency contracts hedging capital expenditure, forward commodity contracts and other commodity contracts that are accounted for as ‘Held for trading’. These marked to market valuations are not predictive of the future value of the hedged position, nor of the future impact on the profit of the Group. The valuations represent the cost of closing all hedge contracts at 31 December, at market prices and rates available at the time.
Interest Rate Benchmark Reform
Benchmark transition progress
The Group transitioned all remaining trades referenced to the USD LIBOR rate to incorporate alternative risk-free rates with the principal benchmarks used now being EURIBOR, SOFR and SONIA. The Group does not hold any material lease agreements that contain references to existing benchmarks and as a result there is no material impact on the lease liabilities or right-of-use assets at 31 December 2023. Further details of the Group’s transition is included in note 39F.
Fair value of financial instruments
Certain of the Group’s financial instruments, principally derivatives, are required to be measured on the balance sheet at fair value. Where a quoted market price for an identical instrument is not available, a valuation model is used to estimate the fair value based on the net present value of the expected cash flows under the contract. Valuation assumptions are usually based on observable market data (for example forward foreign exchange rate, interest rate or commodity price curves) where available.
Accounting policies
See notes 39D and 39F for the Group’s accounting policies on financial asset investments, impairment of financial assets, derivative financial instruments and hedge accounting.
| Anglo American plc | Financial statements and other financial information | 261 |
| Integrated Annual Report 2023 | Notes to the financial statements |
Net debt and financial risk management
25. Financial risk management
Overview
The Board approves and monitors the risk management processes, including documented treasury policies, counterparty limits and controlling and reporting structures. The risk management processes of the Group’s independently listed subsidiaries are in line with the Group’s own policies.
The types of risk exposure, the way in which such exposure is managed and quantification of the level of exposure in the Consolidated balance sheet at 31 December is as follows:
| – | Liquidity risk |
| – | Credit risk |
| – | Commodity price risk |
| – | Foreign exchange risk |
| – | Interest rate risk. |
A. Liquidity risk
The Group ensures that there are sufficient committed loan facilities (including refinancing, where necessary) in order to meet short term business requirements, after taking into account cash flows from operations and its holding of cash and cash equivalents, as well as any Group distribution restrictions that exist. In addition, certain projects may be financed by means of limited recourse project finance, if appropriate.
Certain borrowing facilities within the Group are the subject of financial covenants that vary from facility to facility, but which would be considered normal for such facilities, such as the ratio of debt to tangible net worth. The respective borrowers were not in breach with these financial covenants as at 31 December 2023.
The expected undiscounted cash flows of the Group’s financial liabilities, by remaining contractual maturity, based on conditions existing at the balance sheet date, are as follows:
| 2023 | ||||||||||||||||||||||||||||
| US$ million |
Amount due repayment within one |
Greater than one year, than two years |
Greater than two years, than three years |
Greater than three years, less than four years |
Greater than four years, less than five years |
Greater than five years |
Total | |||||||||||||||||||||
| Net financial liabilities | ||||||||||||||||||||||||||||
| Borrowings | (1,590 | ) | (1,523 | ) | (1,166 | ) | (1,651 | ) | (1,805 | ) | (9,726 | ) | (17,461 | ) | ||||||||||||||
| Expected future interest payments | (547 | ) | (491 | ) | (460 | ) | (430 | ) | (359 | ) | (2,140 | ) | (4,427 | ) | ||||||||||||||
| Derivatives hedging debt – net settled | (257 | ) | (122 | ) | (73 | ) | (67 | ) | (45 | ) | (61 | ) | (625 | ) | ||||||||||||||
| Derivatives hedging debt – gross settled: | ||||||||||||||||||||||||||||
| – gross inflows | 496 | 721 | 578 | 20 | 19 | 387 | 2,221 | |||||||||||||||||||||
| – gross outflows | (560 | ) | (801 | ) | (595 | ) | (22 | ) | (22 | ) | (400 | ) | (2,400 | ) | ||||||||||||||
| Other financial liabilities | (5,651 | ) | — | (11 | ) | (8 | ) | (14 | ) | (445 | ) | (6,129 | ) | |||||||||||||||
| Total | (8,109 | ) | (2,216 | ) | (1,727 | ) | (2,158 | ) | (2,226 | ) | (12,385 | ) | (28,821 | ) | ||||||||||||||
| 2022 | ||||||||||||||||||||||||||||
| US$ million |
Amount due for year |
Greater than one year, less |
Greater than two years, less |
Greater than three years, |
Greater than less years |
Greater than five years |
Total | |||||||||||||||||||||
| Net financial liabilities | ||||||||||||||||||||||||||||
| Borrowings | (1,267 | ) | (773 | ) | (1,340 | ) | (1,056 | ) | (1,568 | ) | (9,077 | ) | (15,081 | ) | ||||||||||||||
| Expected future interest payments | (459 | ) | (420 | ) | (379 | ) | (350 | ) | (321 | ) | (2,012 | ) | (3,941 | ) | ||||||||||||||
| Derivatives hedging debt – net settled | (237 | ) | (198 | ) | (127 | ) | (87 | ) | (79 | ) | (115 | ) | (843 | ) | ||||||||||||||
| Derivatives hedging debt – gross settled: | ||||||||||||||||||||||||||||
| – gross inflows | 1,044 | 80 | 709 | 563 | 22 | 388 | 2,806 | |||||||||||||||||||||
| – gross outflows | (1,343 | ) | (104 | ) | (796 | ) | (595 | ) | (22 | ) | (423 | ) | (3,283 | ) | ||||||||||||||
| Other financial liabilities | (5,963 | ) | (95 | ) | — | (15 | ) | (14 | ) | (358 | ) | (6,445 | ) | |||||||||||||||
| Total | (8,225 | ) | (1,510 | ) | (1,933 | ) | (1,540 | ) | (1,982 | ) | (11,597 | ) | (26,787 | ) | ||||||||||||||
The table above does not include cash flows in relation to the Woodsmith royalty financing on the basis that cash flows under this arrangement are not contractually defined, but instead are wholly dependent upon Woodsmith revenue in future years. However, should the Woodsmith primary subsidiary, Anglo American Crop Nutrients Limited, enter insolvency, then it would be required to repay Hancock the principal value of $250 million upon its request.
| 262 | Anglo American plc | Financial statements and other financial information |
| Integrated Annual Report 2023 | Notes to the financial statements |
Net debt and financial risk management
25. Financial risk management continued
The Group had the following undrawn committed borrowing facilities at 31 December:
| US$ million | 2023 | 2022 | ||||||
| Expiry date | ||||||||
| Within one year | 1,383 | 414 | ||||||
| Greater than one year, less than two years | 691 | 1,082 | ||||||
| Greater than two years, less than three years | 789 | 5,632 | ||||||
| Greater than three years, less than four years | 547 | — | ||||||
| Greater than four years, less than five years | 3,747 | 587 | ||||||
| Greater than five years | 1 | — | ||||||
| 7,158 | 7,715 | |||||||
In the second half of 2023, the Group refinanced its $4.7 billion revolving credit facility maturing in March 2025, to a one year $1.0 billion facility maturing in November 2024, and a $3.7 billion five year facility maturing in November 2028.
B. Credit risk
Credit risk is the risk that a counterparty to a financial instrument will cause a loss to the Group by failing to pay its obligation.
The Group’s principal financial assets are cash, trade and other receivables, investments and derivative financial instruments. The Group’s maximum exposure to credit risk primarily arises from these financial assets and is as follows:
| US$ million | 2023 | 2022 | ||||||
| Cash and cash equivalents | 6,088 | 8,412 | ||||||
| Trade and other receivables | 3,329 | 3,220 | ||||||
| Financial asset investments | 307 | 261 | ||||||
| Derivative financial assets | 356 | 253 | ||||||
| Environmental rehabilitation trust | 108 | 107 | ||||||
| 10,188 | 12,253 | |||||||
The Group limits credit risk on liquid funds and derivative financial instruments through diversification of exposures with a range of financial institutions. Counterparty limits are set for each financial institution with reference to credit ratings assigned by Standard & Poor’s, Moody’s and Fitch Ratings, shareholder equity (in the case of relationship banks) and fund size (in the case of asset managers).
Given the diverse nature of the Group’s operations (both in relation to commodity markets and geographically), and the use of payment security instruments (including letters of credit from financial institutions), it does not have significant concentration of credit risk in respect of trade receivables, with exposure spread over a large number of customers.
The classification of trade and other receivables excludes prepayments and tax receivables, the classification of financial asset investments excludes equity investments held at fair value through other comprehensive income.
C. Commodity price risk
The Group’s earnings are exposed to movements in the prices of the commodities it produces.
The Group’s policy is to sell its products at prevailing market prices and is generally not to hedge commodity price risk, although some hedging may be undertaken for strategic reasons. In such cases, the Group generally uses forward contracts and other derivative instruments to economically hedge the price risk.
Certain of the Group’s sales and purchases are provisionally priced, meaning that the selling price is determined normally 30 to 180 days after delivery to the customer, based on quoted market prices stipulated in the contract, and as a result are susceptible to future price movements. The exposure of the Group’s financial assets and liabilities to commodity price risk is as follows:
| 2023 | 2022 | |||||||||||||||||||||||||||||||
| Commodity price linked | Commodity price linked | |||||||||||||||||||||||||||||||
| US$ million |
Subject to price movements |
Fixed price |
Not linked to commodity price |
Total | Subject to price movements |
Fixed price |
Not linked to |
Total | ||||||||||||||||||||||||
| Total net financial instruments (excluding derivatives) | 1,691 | 67 | (15,067 | ) | (13,309 | ) | 1,254 | 203 | (10,171 | ) | (8,714 | ) | ||||||||||||||||||||
| Derivatives | 42 | — | (428 | ) | (386 | ) | (13 | ) | — | (1,063 | ) | (1,076 | ) | |||||||||||||||||||
| 1,733 | 67 | (15,495 | ) | (13,695 | ) | 1,241 | 203 | (11,234 | ) | (9,790 | ) | |||||||||||||||||||||
Commodity price linked financial instruments subject to price movements include provisionally priced trade receivables and trade payables.
Commodity price linked financial instruments at fixed price include receivables and payables for commodity sales and purchases no longer subject to price adjustment at the balance sheet date.
D. Foreign exchange risk
As a global business, the Group is exposed to many currencies principally as a result of non-US dollar operating costs and, to a lesser extent, from non-US dollar revenue.
| Anglo American plc | Financial statements and other financial information | 263 |
| Integrated Annual Report 2023 | Notes to the financial statements |
Net debt and financial risk management
25. Financial risk management continued
The South African rand, Australian dollar, Chilean peso, and Brazilian real are the most significant non-US dollar currencies influencing costs.
A strengthening of the US dollar against the currencies to which the Group is exposed has a positive effect on the Group’s earnings. The Group’s policy is generally not to hedge such exposures given the correlation, over the longer term, with commodity prices and the diversified nature of the Group, although exceptions can be approved by a committee with delegated authority from the Executive Leadership Team.
In addition, currency exposures exist in respect of non-US dollar capital expenditure projects and non-US dollar borrowings in US dollar functional currency entities. The Group’s policy is to evaluate whether or not to hedge its non-US dollar capital expenditure on a case-by-case basis, taking into account the estimated foreign exchange exposure, liquidity of foreign exchange markets and the cost of executing a hedging strategy. Further detail with respect to the Group’s non-US dollar borrowings approach is included in note 22.
Net other financial liabilities (excluding net debt related balances, variable vessel leases and cash in disposal groups, but including the debit valuation adjustment attributable to derivatives hedging net debt) are $2,443 million. This includes net assets of $220 million denominated in US dollars, and net liabilities of $506 million denominated in Brazilian real, $413 million denominated in Australian dollars, $343 million denominated in Chilean pesos and $949 million denominated in South African rand.
E. Interest rate risk
Interest rate risk arises due to fluctuations in interest rates which impact the value of short term investments and financing activities. The Group is principally exposed to US and South African interest rates.
The Group transitioned all derivative instruments referenced to USD LIBOR to alternative risk-free rates during the year. Please see note 39F for further details.
The Group’s policy is to borrow funds at fixed rates of interest. The Group uses interest rate derivatives to convert the majority of borrowings to floating rates of interest and manage its exposure to interest rate movements on its debt.
In respect of financial assets, the Group’s policy is to invest cash at floating rates of interest and to maintain cash reserves in short term investments (less than one year) in order to maintain liquidity.
Analysis of interest rate risk associated with net debt balances and the impact of derivatives to hedge against this risk is included within the table below. Net other financial liabilities (excluding net debt related balances, variable vessel leases and cash in disposal groups, but including the debit valuation adjustment attributable to derivatives hedging net debt) of $2,443 million (2022: $2,745 million) are primarily non-interest bearing.
The table below reflects the exposure of the Group’s net debt to currency and interest rate risk:
| 2023 | ||||||||||||||||||||||||
| US$ million |
Cash and cash equivalents |
Floating rate borrowings |
Fixed rate borrowings |
Derivatives hedging net debt |
Impact of currency derivatives |
Total | ||||||||||||||||||
| US dollar | 5,058 | (3,049 | ) | (9,432 | ) | (428 | ) | (3,534 | ) | (11,385 | ) | |||||||||||||
| Euro | 22 | — | (3,185 | ) | — | 3,183 | 20 | |||||||||||||||||
| South African rand | 280 | (240 | ) | (150 | ) | — | — | (110 | ) | |||||||||||||||
| Brazilian real | 16 | — | (38 | ) | — | — | (22 | ) | ||||||||||||||||
| Australian dollar | 254 | — | (43 | ) | — | — | 211 | |||||||||||||||||
| Sterling | 95 | (7 | ) | (663 | ) | — | 351 | (224 | ) | |||||||||||||||
| Other | 349 | (3 | ) | (88 | ) | — | — | 258 | ||||||||||||||||
| Impact of interest rate derivatives | — | (11,509 | ) | 11,509 | — | — | — | |||||||||||||||||
| Total | 6,074 | (14,808 | ) | (2,090 | ) | (428 | ) | — | (11,252 | ) | ||||||||||||||
| Reconciliation: | ||||||||||||||||||||||||
| Variable vessel leases | 637 | |||||||||||||||||||||||
| Net debt | (10,615 | ) | ||||||||||||||||||||||
| 2022 | ||||||||||||||||||||||||
| US$ million |
Cash and cash |
Floating rate borrowings |
Fixed rate borrowings |
Derivatives hedging net debt |
Impact of currency |
Total | ||||||||||||||||||
| US dollar | 6,667 | (2,994 | ) | (7,742 | ) | (1,092 | ) | (2,985 | ) | (8,146 | ) | |||||||||||||
| Euro | 29 | — | (2,673 | ) | — | 2,669 | 25 | |||||||||||||||||
| South African rand | 421 | (11 | ) | (168 | ) | — | — | 242 | ||||||||||||||||
| Brazilian real | 735 | — | (18 | ) | — | — | 717 | |||||||||||||||||
| Australian dollar | 161 | — | (45 | ) | — | — | 116 | |||||||||||||||||
| Sterling | 84 | (6 | ) | (613 | ) | — | 316 | (219 | ) | |||||||||||||||
| Other | 303 | (1 | ) | (82 | ) | — | — | 220 | ||||||||||||||||
| Impact of interest rate derivatives | — | (8,682 | ) | 8,682 | — | — | — | |||||||||||||||||
| Total | 8,400 | (11,694 | ) | (2,659 | ) | (1,092 | ) | — | (7,045 | ) | ||||||||||||||
| Reconciliation: | ||||||||||||||||||||||||
| Variable vessel leases | 127 | |||||||||||||||||||||||
| Net debt | (6,918 | ) | ||||||||||||||||||||||
Based on the net foreign currency and interest rate risk exposures detailed above, and taking into account the effects of the hedging arrangements in place, management considers that earnings and equity are not materially sensitive to reasonable foreign exchange or interest rate movements in respect of the financial instruments held as at 31 December 2023 or 2022.
| 264 | Anglo American plc | Financial statements and other financial information |
| Integrated Annual Report 2023 | Notes to the financial statements |
Equity
| Equity represents the capital of the Group attributable to Company shareholders and non-controlling interests, and includes share capital, share premium and reserves. |
Total equity
$31.6 bn
(2022: $34.0 bn) |
Total equity has decreased from $34.0 billion to $31.6 billion in the year, driven by dividends to Company shareholders and non-controlling interests of $2.5 billion.
26. Called-up share capital and consolidated equity analysis
Called-up share capital
| 2023 | 2022 | |||||||||||||||
| Number of shares |
US$ million | Number of shares |
US$ million | |||||||||||||
| Ordinary shares of 5486/91 US cents each: | ||||||||||||||||
| At 1 January | 1,337,577,913 | 734 | 1,341,651,975 | 737 | ||||||||||||
| Shares cancelled(1) | — | — | (4,074,062 | ) | (3 | ) | ||||||||||
| At 31 December | 1,337,577,913 | 734 | 1,337,577,913 | 734 | ||||||||||||
(1) During the year, no shares were cancelled under the buyback programme. In 2022, 4,074,062 shares were cancelled under the buyback programme.
The number and carrying value of called-up, allotted and fully paid ordinary shares as at 31 December 2023 (including the shares held by the Group in other structures, as outlined below) was 1,337,577,913 and $734 million (2022: 1,337,577,913 and $734 million).
At general meetings, every member who is present in person has one vote on a show of hands and, on a poll, every member who is present in person or by proxy has one vote for every ordinary share held.
Own shares
| 2023 | 2022 | |||||||||||||||
| Number of shares |
US$ million | Number of shares |
US$ million | |||||||||||||
| Own shares | ||||||||||||||||
| Own shares held by subsidiaries and employee benefit trusts | 125,245,665 | 6,275 | 124,618,014 | 6,272 | ||||||||||||
| Total | 125,245,665 | 6,275 | 124,618,014 | 6,272 | ||||||||||||
Included in Own shares are 112,300,129 (2022: 112,300,129) Anglo American plc shares held by Epoch Investment Holdings (RF) Proprietary Limited, Epoch Two Investment Holdings (RF) Proprietary Limited and Tarl Investment Holdings (RF) Proprietary Limited, which are consolidated by the Group by virtue of their contractual arrangements with Tenon Investment Holdings Proprietary Limited, a wholly owned subsidiary of Anglo American South Africa Proprietary Limited. Further details of these arrangements are provided in note 39B.
Included in the calculation of the dividend payable are 4,561,006 ($115 million) shares held in the Employee Benefit Trust in respect of forfeitable share awards granted to certain employees. Under the terms of these awards, the shares are beneficially owned by the respective employees, who are entitled to receive dividends in respect of the shares. The shares are released to the employees on vesting of the awards, and any shares that do not vest are returned to the Company or the Employee Benefit Trust. These shares are recognised on the Consolidated balance sheet within Own shares and are excluded from the calculation of basic earnings per share. They are included in the calculation of diluted earnings per share to the extent that the related share awards are dilutive (see note 3).
| Anglo American plc | Financial statements and other financial information | 265 |
| Integrated Annual Report 2023 | Notes to the financial statements |
Equity
26. Called-up share capital and consolidated equity analysis continued
Consolidated equity analysis
Fair value and other reserves comprise:
| Financial | Total | |||||||||||||||
| Share-based | asset | fair value | ||||||||||||||
| payment | revaluation | Other | and other | |||||||||||||
| US$ million | reserve | reserve | reserves | reserves | ||||||||||||
| At 1 January 2022 | 460 | 31 | 160 | 651 | ||||||||||||
| Other comprehensive income/(loss) | — | 31 | (80 | ) | (49 | ) | ||||||||||
| Equity settled share-based payment schemes | 1 | — | — | 1 | ||||||||||||
| Cancellation of treasury shares | — | — | 3 | 3 | ||||||||||||
| Other | (4 | ) | (32 | ) | 19 | (17 | ) | |||||||||
| At 31 December 2022 | 457 | 30 | 102 | 589 | ||||||||||||
| Other comprehensive loss | — | (36 | ) | (11 | ) | (47 | ) | |||||||||
| Equity settled share-based payment schemes | 25 | — | — | 25 | ||||||||||||
| Other | (3 | ) | 4 | 1 | 2 | |||||||||||
| At 31 December 2023 | 479 | (2 | ) | 92 | 569 | |||||||||||
Other reserves comprise a capital redemption reserve of $153 million (2022: $153 million) and other reserves.
27. Non-controlling interests
Overview
Non-controlling interests that are material to the Group relate to the following subsidiaries:
| – | Anglo American Sur S.A. (Anglo American Sur) is a company incorporated in Chile. Its principal operations are the Los Bronces and El Soldado copper mines and the Chagres smelter, which are located in Chile. Non-controlling interests hold a 49.9% (2022: 49.9%) interest in Anglo American Sur. |
| – | Anglo American Quellaveco S.A. (Anglo American Quellaveco) is a company incorporated in Peru. Its principal operation is the Quellaveco copper mine, which is located in Peru. Non-controlling interests hold a 40.0% (2022: 40.0%) interest in Anglo American Quellaveco. |
| – | Anglo American Platinum Limited (Anglo American Platinum) is a company incorporated in South Africa and listed on the Johannesburg Stock Exchange (JSE). Its principal mining operations are the Mogalakwena and Amandelbult platinum group metals mines, which are located in South Africa. Non-controlling interests hold an effective 20.8% (2022: 20.8%) interest in the operations of Anglo American Platinum, which represents the whole of the Platinum Group Metals reportable segment. |
| – | De Beers plc (De Beers) is a company incorporated in Jersey. It is one of the world’s leading diamond companies with operations across all key parts of the diamond value chain. Non-controlling interests hold a 15.0% (2022: 15.0%) interest in De Beers, which represents the whole of the Diamonds reportable segment. |
| – | Kumba Iron Ore Limited (Kumba Iron Ore) is a company incorporated in South Africa and listed on the JSE. Its principal mining operations are the Sishen and Kolomela iron ore mines, which are located in South Africa. Non-controlling interests hold an effective 46.6% (2022: 46.6%) interest in the operations of Kumba Iron Ore, comprising the 30.0% (2022: 30.0%) interest held by other shareholders in Kumba Iron Ore and the 23.7% (2022: 23.7%) of Kumba Iron Ore’s principal operating subsidiary, Sishen Iron Ore Company Proprietary Limited, that is held by shareholders outside the Group. |
The disclosures in this note include certain Alternative Performance Measures (APMs). For more information on the APMs used by the Group, including definitions, please refer to page 318.
| 2023 | 2022 | |||||||||||||||||||||||||||||||||||||||||||||||||||||||
| US$ million | Anglo American Sur |
Quellaveco | Anglo American Platinum |
De Beers |
Kumba Iron Ore |
Other | Total | Anglo American Sur |
Quellaveco | Anglo American Platinum |
De Beers | Kumba Iron Ore |
Other | Total | ||||||||||||||||||||||||||||||||||||||||||
| Underlying earnings attributable to non-controlling interests | (92 | ) | 317 | 181 | (56 | ) | 757 | 2 | 1,109 | 88 | 63 | 653 | 105 | 682 | 26 | 1,617 | ||||||||||||||||||||||||||||||||||||||||
| (Loss)/profit attributable to non-controlling interests | (93 | ) | 319 | 170 | (89 | ) | 753 | 1 | 1,061 | 88 | 65 | 641 | 103 | 586 | 27 | 1,510 | ||||||||||||||||||||||||||||||||||||||||
| Distributions paid to non-controlling interests(1) | — | (320 | ) | (149 | ) | (46 | ) | (420 | ) | (43 | ) | (978 | ) | (234 | ) | — | (754 | ) | (21 | ) | (738 | ) | (47) | (1,794 | ) | |||||||||||||||||||||||||||||||
| Balance sheet information: | ||||||||||||||||||||||||||||||||||||||||||||||||||||||||
| Equity attributable to non-controlling interests(2) | 1,532 | 987 | 1,148 | 1,210 | 1,668 | 15 | 6,560 | 1,630 | 988 | 1,202 | 1,378 | 1,434 | 3 | 6,635 | ||||||||||||||||||||||||||||||||||||||||||
| (1) | Includes payments of $320 million related to share buy-backs at Quellaveco and dividend payments of $658 million. |
| (2) | Comparative figures are restated for the adoption of the amendment to IAS 12, see note 39A. |
| 266 | Anglo American plc | Financial statements and other financial information |
| Integrated Annual Report 2023 | Notes to the financial statements |
Equity
27. Non-controlling interests continued
Further information
Summarised financial information on a 100% basis and before inter-company eliminations for Anglo American Sur, Quellaveco, Anglo American Platinum, De Beers and Kumba Iron Ore is as follows:
| 2023 | 2022 | |||||||||||||||||||||||||||||||||||||||
| US$ million | Anglo American Sur |
Quellaveco | Anglo American Platinum |
De
Beers |
Kumba Iron Ore |
Anglo American Sur |
Quellaveco (restated)(1) |
Anglo American Platinum |
De
Beers |
Kumba Iron Ore |
||||||||||||||||||||||||||||||
| Non-current assets | 5,154 | 8,831 | 6,249 | 6,422 | 3,229 | 4,890 | 8,194 | 6,125 | 8,023 | 3,104 | ||||||||||||||||||||||||||||||
| Current assets | 891 | 1,306 | 3,758 | 4,585 | 2,129 | 1,231 | 1,188 | 5,296 | 5,147 | 1,818 | ||||||||||||||||||||||||||||||
| Current liabilities | (1,003 | ) | (869 | ) | (2,531 | ) | (939 | ) | (798 | ) | (1,036 | ) | (563 | ) | (3,425 | ) | (949 | ) | (915 | ) | ||||||||||||||||||||
| Non-current liabilities | (1,968 | ) | (6,800 | ) | (1,416 | ) | (2,808 | ) | (858 | ) | (1,817 | ) | (6,352 | ) | (1,531 | ) | (2,489 | ) | (802 | ) | ||||||||||||||||||||
| Net assets (restated)(1) | 3,074 | 2,468 | 6,060 | 7,260 | 3,702 | 3,268 | 2,467 | 6,465 | 9,732 | 3,205 | ||||||||||||||||||||||||||||||
| Revenue | 2,382 | 2,722 | 6,734 | 4,198 | 4,674 | 2,758 | 600 | 10,096 | 6,609 | 4,612 | ||||||||||||||||||||||||||||||
| (Loss)/profit for the financial year(2) | (186 | ) | 798 | 692 | (1,989 | ) | 1,604 | 177 | 162 | 3,053 | 633 | 1,247 | ||||||||||||||||||||||||||||
| Total comprehensive (expense)/income | (195 | ) | 798 | 261 | (2,328 | ) | 1,423 | 160 | 162 | 2,592 | 57 | 1,034 | ||||||||||||||||||||||||||||
| Net cash inflow/(outflow) from operating activities | 318 | 1,704 | 899 | (513 | ) | 1,584 | 772 | (193 | ) | 2,869 | 1,112 | 1,746 | ||||||||||||||||||||||||||||
| (1) | Comparative figures are restated for the adoption of the amendment to IAS 12, see note 39A. |
| (2) | Stated after special items and remeasurements. |
| Anglo American plc | Financial statements and other financial information | 267 |
| Integrated Annual Report 2023 | Notes to the financial statements |
Employees
| This section contains information about the Group’s employee numbers and associated costs as well as the post employment benefits incurred by the Group. |
Employees(1)
58,000
(2022: 57,000)
(1) Excluding contractors and associates’ and joint ventures’ employees and including a proportionate share of employees within joint operations. |
28. Employee numbers and costs
Employee numbers
The average number of employees, excluding contractors and associates’ and joint ventures’ employees and including a proportionate share of employees within joint operations, by segment was:
| Thousand | 2023 | 2022(1) | ||||||
| Copper | 5 | 5 | ||||||
| Nickel | 1 | 1 | ||||||
| Platinum Group Metals(1) | 27 | 27 | ||||||
| De Beers | 9 | 9 | ||||||
| Iron Ore | 9 | 9 | ||||||
| Steelmaking Coal | 3 | 2 | ||||||
| Crop Nutrients | 1 | 1 | ||||||
| Corporate and other | 3 | 3 | ||||||
| 58 | 57 |
| (1) | Platinum Group Metals prior year number of employees was restated to exclude contractors. |
The average number of employees, excluding contractors and associates’ and joint ventures’ employees and including a proportionate share of employees within joint operations, by principal location of employment was:
| Thousand | 2023 | 2022(1) |
| South Africa(1) | 36 | 36 | ||||||
| Other Africa | 4 | 5 | ||||||
| South America | 10 | 9 | ||||||
| North America | 1 | 1 | ||||||
| Australia and Asia | 4 | 3 | ||||||
| Europe | 3 | 3 | ||||||
| 58 | 57 |
| (1) | Prior year number of employees in South Africa was restated to exclude contractors. |
Employee costs
Payroll costs in respect of the employees included in the tables above were:
| US$ million | 2023 | 2022 | ||||||
| Wages and salaries | 3,357 | 3,180 | ||||||
| Social security costs | 181 | 193 | ||||||
| Post employment benefits | 365 | 258 | ||||||
| Share-based payments | 193 | 218 | ||||||
| Total payroll costs | 4,096 | 3,849 | ||||||
| Reconciliation: | ||||||||
| Less: Employee costs capitalised | (160 | ) | (219 | ) | ||||
| Less: Employee costs included within special items | (97 | ) | — | |||||
| Employee costs included in operating costs before special items and remeasurements | 3,839 | 3,630 |
Post employment benefits include contributions to defined contribution pension and medical plans, current and past service costs related to defined benefit pension and medical plans and other benefits provided to certain employees during retirement.
| 268 | Anglo American plc | Financial statements and other financial information |
| Integrated Annual Report 2023 | Notes to the financial statements |
Employees
28. Employee numbers and costs continued
Key management
Key management personnel are those persons having authority and responsibility for planning, directing and controlling the activities of the Group, directly or indirectly, including any director (executive and non-executive) of the Group. Key management comprises members of the Board and the Executive Leadership Team.
Compensation for key management was as follows:
| US$ million | 2023 | 2022 | ||||||
| Salaries and short term employee benefits | 31 | 30 | ||||||
| Social security costs | 10 | 12 | ||||||
| Termination benefits | 3 | 1 | ||||||
| Post employment benefits | 2 | 2 | ||||||
| Share-based payments | 18 | 20 | ||||||
| 64 | 65 |
Disclosure of directors’ emoluments, pension entitlements, share options and long term incentive plan awards required by the Companies Act 2006 and those specified for audit by Part 3 and Schedule 8 of the Large and Medium-Sized Companies and Groups (Accounts and Reports) (Amendment) Regulations 2013 are included in the Remuneration report.
29. Retirement benefits
Overview
The Group operates a number of defined contribution and defined benefit pension plans with the most significant plans being in South Africa and the United Kingdom. It also operates post employment medical plans, the majority of which are unfunded, principally in South Africa. The post employment medical plans provide health benefits to retired employees and certain dependants.
Defined contribution plans
The charge for the year for defined contribution pension plans (net of amounts capitalised) was $171 million (2022: $153 million) and for defined contribution medical plans (net of amounts capitalised) was $68 million (2022: $61 million).
Defined benefit pension plans and post employment medical plans
Characteristics of plans
The majority of the defined benefit pension plans are funded. The assets of these plans are held separately from those of the Group, in independently administered funds, in accordance with statutory requirements or local practice in the relevant jurisdiction. The responsibility for the governance of the funded retirement benefit plans, including investment and funding decisions, lies with the Trustees of each scheme. The unfunded liabilities are principally in relation to termination indemnity plans in Chile.
South Africa
The defined benefit pension plan in South Africa is in surplus. It is closed to new members and closed to future benefit accrual except for a small number of members. As the plan is in surplus no employer contributions are currently being made. The Group’s provision of anti-retroviral therapy to HIV positive staff does not significantly impact the post employment medical plan liability.
United Kingdom
The Group operates a number of funded pension plans in the United Kingdom. These plans are closed to new members and to the future accrual of benefits. The Group is committed to make payments to certain United Kingdom pension plans under deficit funding plans agreed with the respective Trustees.
Other
Other pension and post employment medical plans primarily comprise obligations in Chile where legislation requires employers to provide for a termination indemnity, entitling employees to a cash payment made on the termination of an employment contract.
Contributions
Employer contributions are made in accordance with the terms of each plan and may vary from year to year. Employer contributions made to funded pension plans in the year ended 31 December 2023 were $6 million (2022: $4 million). In addition, $17 million (2022: $14 million) of benefits were paid in relation to unfunded pension plans and $13 million (2022: $14 million) of benefits were paid in relation to post employment medical plans. The Group expects to contribute $32 million to its pension plans and $14 million to its post employment medical plans in 2024.
Income statement
The amounts recognised in the Consolidated income statement are as follows:
| 2023 | 2022 | |||||||||||||||||||||||
| US$ million | Pension
plans |
Post employment medical plans |
Total | Pension
plans |
Post employment medical plans |
Total | ||||||||||||||||||
| Charged to operating costs | 18 | 1 | 19 | 15 | 2 | 17 | ||||||||||||||||||
| Net (credit)/charge to net finance costs | (2 | ) | 20 | 18 | 5 | 20 | 25 | |||||||||||||||||
| Total net charge to the income statement | 16 | 21 | 37 | 20 | 22 | 42 | ||||||||||||||||||
Net (credit)/charge to net finance costs includes interest expense on surplus restriction of $11 million (2022: $15 million).
| Anglo American plc | Financial statements and other financial information | 269 |
| Integrated Annual Report 2023 | Notes to the financial statements |
Employees
29. Retirement benefits continued
Comprehensive income
The pre-tax amounts recognised in the Consolidated statement of comprehensive income are as follows:
| 2023 | 2022 | |||||||||||||||||||||||
| US$ million | Pension plans |
Post employment medical plans |
Total | Pension
plans |
Post employment medical plans |
Total | ||||||||||||||||||
| Return on plan assets, excluding interest income | (32 | ) | (2 | ) | (34 | ) | (1,576 | ) | (14 | ) | (1,590 | ) | ||||||||||||
| Actuarial (losses)/gains on plan liabilities | (64 | ) | 9 | (55 | ) | 1,239 | 26 | 1,265 | ||||||||||||||||
| Movement in surplus restriction | 18 | — | 18 | 38 | — | 38 | ||||||||||||||||||
| Remeasurement of net defined benefit obligation | (78 | ) | 7 | (71 | ) | (299 | ) | 12 | (287 | ) | ||||||||||||||
Actuarial gains on plan liabilities comprise net gains from changes in financial and demographic assumptions as well as experience on plan liabilities. The tax amounts arising on remeasurement of the net defined benefit obligations are disclosed in note 5.
Balance sheet
A summary of the movements in the net pension plan assets and retirement benefit obligations on the Consolidated balance sheet is as follows:
| US$ million | 2023 | 2022 | ||||||
| Net (liability)/asset recognised at 1 January | (56 | ) | 284 | |||||
| Net income statement charge before special items | (37 | ) | (42 | ) | ||||
| Remeasurement of net defined benefit obligation | (71 | ) | (287 | ) | ||||
| Employer contributions to funded pension plans | 6 | 4 | ||||||
| Benefits paid to unfunded plans | 30 | 28 | ||||||
| Effects of curtailments/settlements | 2 | — | ||||||
| Other | (32 | ) | — | |||||
| Currency movements | 32 | (43 | ) | |||||
| Net liability recognised at 31 December | (126 | ) | (56 | ) | ||||
| Amounts recognised as: | ||||||||
| Defined benefit pension plans in surplus | 339 | 381 | ||||||
| Retirement benefit obligation – pension plans | (285 | ) | (243 | ) | ||||
| Retirement benefit asset – medical plans | 66 | 73 | ||||||
| Retirement benefit obligation – medical plans | (246 | ) | (267 | ) | ||||
| (126 | ) | (56 | ) | |||||
The Group, in consultation with scheme and legal advisers, has determined that once all beneficiaries of the schemes have been settled the full economic benefit of the surplus of each of the schemes would become payable to the relevant Group company. Therefore, defined benefit pension plans and post retirement medical plans assets are included in Pension asset surplus and other non-current assets on the Consolidated balance sheet.
Further information
Movement analysis
The changes in the fair value of plan assets are as follows:
| 2023 | 2022 | |||||||||||||||||||||||
| US$ million | Pension
plans |
Post
employment medical plans |
Total | Pension plans |
Post
employment medical plans |
Total | ||||||||||||||||||
| At 1 January | 3,315 | 84 | 3,399 | 5,450 | 102 | 5,552 | ||||||||||||||||||
| Interest income | 190 | 7 | 197 | 142 | 9 | 151 | ||||||||||||||||||
| Return on plan assets, excluding interest income | (32 | ) | (2 | ) | (34 | ) | (1,576 | ) | (14 | ) | (1,590 | ) | ||||||||||||
| Contributions paid by employer to funded pension plans | 5 | 1 | 6 | 3 | 1 | 4 | ||||||||||||||||||
| Benefits paid | (198 | ) | (7 | ) | (205 | ) | (214 | ) | (7 | ) | (221 | ) | ||||||||||||
| Effects of curtailments/settlements | (33 | ) | — | (33 | ) | — | — | — | ||||||||||||||||
| Other | (19 | ) | — | (19 | ) | 7 | — | 7 | ||||||||||||||||
| Currency movements | 104 | (8 | ) | 96 | (497 | ) | (7 | ) | (504 | ) | ||||||||||||||
| As at 31 December | 3,332 | 75 | 3,407 | 3,315 | 84 | 3,399 | ||||||||||||||||||
| 270 | Anglo American plc | Financial statements and other financial information |
| Integrated Annual Report 2023 | Notes to the financial statements |
Employees
29. Retirement benefits continued
The changes in the present value of defined benefit obligations are as follows:
| 2023 | 2022 | |||||||||||||||||||||||
| US$ million | Pension plans |
Post
employment medical plans |
Total | Pension plans |
Post
employment medical plans |
Total | ||||||||||||||||||
| At 1 January | (3,068 | ) | (278 | ) | (3,346 | ) | (4,811 | ) | (315 | ) | (5,126 | ) | ||||||||||||
| Current service costs | (18 | ) | (1 | ) | (19 | ) | (15 | ) | (2 | ) | (17 | ) | ||||||||||||
| Interest costs | (177 | ) | (27 | ) | (204 | ) | (132 | ) | (29 | ) | (161 | ) | ||||||||||||
| Actuarial (losses)/gains | (64 | ) | 9 | (55 | ) | 1,239 | 26 | 1,265 | ||||||||||||||||
| Benefits paid | 215 | 20 | 235 | 228 | 21 | 249 | ||||||||||||||||||
| Effects of curtailments/settlements | 35 | — | 35 | — | — | — | ||||||||||||||||||
| Other | (13 | ) | — | (13 | ) | (7 | ) | — | (7 | ) | ||||||||||||||
| Currency movements | (93 | ) | 22 | (71 | ) | 430 | 21 | 451 | ||||||||||||||||
| As at 31 December | (3,183 | ) | (255 | ) | (3,438 | ) | (3,068 | ) | (278 | ) | (3,346 | ) | ||||||||||||
The most significant actuarial loss arose from changing financial assumptions totalling $78 million (2022: $1,353 million actuarial gain).
Pension plan assets and liabilities by geography
The split of the present value of funded and unfunded obligations in defined benefit pension plans and the fair value of pension assets at 31 December is as follows:
| 2023 | 2022 | |||||||||||||||||||||||||||||||
| US$ million | South
Africa |
United Kingdom |
Other | Total | South Africa |
United Kingdom |
Other | Total | ||||||||||||||||||||||||
| Corporate bonds | 96 | 1,427 | 1 | 1,524 | 115 | 1,621 | 1 | 1,737 | ||||||||||||||||||||||||
| Government bonds | 326 | 1,313 | 66 | 1,705 | 341 | 1,566 | 61 | 1,968 | ||||||||||||||||||||||||
| Debt (Repurchase Agreements) | (39 | ) | (452 | ) | — | (491 | ) | (27 | ) | (844 | ) | (1 | ) | (872 | ) | |||||||||||||||||
| Equity | 77 | 1 | 5 | 83 | 77 | 1 | 6 | 84 | ||||||||||||||||||||||||
| Cash | 14 | 448 | — | 462 | 39 | 301 | 1 | 341 | ||||||||||||||||||||||||
| Other | 12 | 37 | — | 49 | 8 | 49 | — | 57 | ||||||||||||||||||||||||
| Fair value of pension plan assets | 486 | 2,774 | 72 | 3,332 | 553 | 2,694 | 68 | 3,315 | ||||||||||||||||||||||||
| Active members | (3 | ) | — | (6 | ) | (9 | ) | (3 | ) | — | (6 | ) | (9 | ) | ||||||||||||||||||
| Deferred members | (1 | ) | (629 | ) | (3 | ) | (633 | ) | (2 | ) | (576 | ) | (2 | ) | (580 | ) | ||||||||||||||||
| Pensioners | (387 | ) | (1,832 | ) | (66 | ) | (2,285 | ) | (407 | ) | (1,792 | ) | (57 | ) | (2,256 | ) | ||||||||||||||||
| Present value of funded obligations | (391 | ) | (2,461 | ) | (75 | ) | (2,927 | ) | (412 | ) | (2,368 | ) | (65 | ) | (2,845 | ) | ||||||||||||||||
| Present value of unfunded obligations | — | (32 | ) | (224 | ) | (256 | ) | — | (25 | ) | (198 | ) | (223 | ) | ||||||||||||||||||
| Net surplus/(deficit) in pension plans | 95 | 281 | (227 | ) | 149 | 141 | 301 | (195 | ) | 247 | ||||||||||||||||||||||
| Surplus restriction | (95 | ) | — | — | (95 | ) | (109 | ) | — | — | (109 | ) | ||||||||||||||||||||
| Recognised retirement benefit assets/(liabilities) | — | 281 | (227 | ) | 54 | 32 | 301 | (195 | ) | 138 | ||||||||||||||||||||||
| Non-current assets – pension asset surplus | — | 338 | 1 | 339 | 32 | 349 | — | 381 | ||||||||||||||||||||||||
| Retirement benefit obligation – pension plans | — | (57 | ) | (228 | ) | (285 | ) | — | (48 | ) | (195 | ) | (243 | ) | ||||||||||||||||||
Other assets principally comprise debt backed securities, annuities and property.
The fair value of assets is used to determine the funding level of the plans. The fair value of the assets of the funded plans was sufficient to cover 114% (2022: 117%) of the benefits that had accrued to members after allowing for expected increases in future earnings and pensions. The present value of unfunded obligations includes $234 million (2022: $203 million) relating to active members. All material investments are quoted.
In South Africa, the asset recognised is restricted to the amount in the Employer Surplus Account. The Employer Surplus Account is the amount that the Group is entitled to by way of a refund, taking into consideration any contingency reserves as recommended by the funds’ actuaries.
| Anglo American plc | Financial statements and other financial information | 271 |
| Integrated Annual Report 2023 | Notes to the financial statements |
Employees
29. Retirement benefits continued
Actuarial assumptions
The principal assumptions used to determine the actuarial present value of benefit obligations and pension charges and credits are detailed below (shown as weighted averages):
| 2023 | 2022 | |||||||||||||||||||||||
| South
Africa |
United Kingdom |
Other | South
Africa |
United Kingdom |
Other | |||||||||||||||||||
| Defined benefit pension plans | ||||||||||||||||||||||||
| Average discount rate for plan liabilities | 11.4 | % | 4.6 | % | 5.6 | % | 11.4 | % | 4.9 | % | 6.1 | % | ||||||||||||
| Average rate of inflation | 6.4 | % | 3.0 | % | 3.0 | % | 6.6 | % | 3.1 | % | 3.7 | % | ||||||||||||
| Average rate of increase of pensions in payment | 6.4 | % | 3.3 | % | 2.6 | % | 6.6 | % | 3.4 | % | 3.2 | % | ||||||||||||
| Post employment medical plans | ||||||||||||||||||||||||
| Average discount rate for plan liabilities | 11.4 | % | n/a | 11.3 | % | 11.4 | % | n/a | 11.5 | % | ||||||||||||||
| Average rate of inflation | 6.4 | % | n/a | 6.9 | % | 6.6 | % | n/a | 7.1 | % | ||||||||||||||
| Expected average increase in healthcare costs | 9.1 | % | n/a | 9.4 | % | 8.7 | % | n/a | 9.5 | % | ||||||||||||||
The weighted average duration of the South African plans is 7 years (2022: 9 years), United Kingdom plans is 13 years (2022: 13 years) and plans in other regions is 13 years (2022: 13 years). This represents the average period, weighted by discounted value, over which future benefit payments are expected to be made.
Mortality assumptions are determined based on standard mortality tables with adjustments, as appropriate, to reflect experience of conditions locally. In South Africa the PA90 tables are used. The main plans in the United Kingdom use CMI tables or Club Vita models with plan specific adjustments based on mortality investigations. The mortality tables used imply that a male or female aged 60 at the balance sheet date has the following future life expectancy (shown as weighted averages):
| Male | Female | |||||||||||||||
| Years | 2023 | 2022 | 2023 | 2022 | ||||||||||||
| South Africa | 18.7 | 18.8 | 23.4 | 23.4 | ||||||||||||
| United Kingdom | 27.4 | 27.8 | 29.2 | 29.6 | ||||||||||||
| Other | 26.0 | 24.2 | 30.2 | 28.9 | ||||||||||||
The table below summarises the expected life expectancy from the age of 60 for a male or female aged 45 at the balance sheet date. When viewed together with the respective life expectancy at age 60 in the table above, this indicates the anticipated improvement in life expectancy (shown as weighted averages):
| Male | Female | |||||||||||||||
| Years | 2023 | 2022 | 2023 | 2022 | ||||||||||||
| South Africa | 18.7 | 18.8 | 23.4 | 23.4 | ||||||||||||
| United Kingdom | 28.1 | 28.6 | 30.3 | 30.8 | ||||||||||||
| Other | 27.8 | 25.6 | 31.7 | 30.2 | ||||||||||||
Risk of plans
The Group has identified the main risk to its defined benefit pension schemes as being interest rate risk due to the impact on the UK discount rate assumption:
| Risk | Description | Mitigation | ||
| Interest rate risk |
An increase in longer term real and nominal interest rates expectations causes gilt yields and corporate bond yields to increase, which results in a higher discount rate being applied to the UK pension liabilities and so, with all else being held equal, the value of the pension scheme liabilities decreases.
If the pension scheme assets decrease by more than the decrease in the pension scheme liabilities (caused by the increase in interest rates) then, all else being equal, this will result in a worsening of the pension scheme funding position. |
The Trustees’ investment strategies vary by plan for the UK and include investing, with the intention of counter-balancing the movements in the liabilities, in fully owned (fully funded) physical credit and gilts, and by gaining unfunded exposure to gilts (via gilt repurchase agreements) and other fixed income based derivatives to match the real and nominal interest rate sensitivity of the pension scheme liabilities.
Approximately 90-100% (depending on the scheme) of the pension scheme liabilities are currently hedged against movements in real and nominal interest rates.
The Trustees’ hedging strategies are typically designed to protect the respective schemes’ funding plans against volatility in market yields. The discount rate used to calculate any funding requirement for the schemes is linked to gilt yields rather than to corporate bond yields as required under IAS 19 Employee Benefits. Consequently the valuation of the net retirement benefit obligation for accounting purposes remains susceptible to movements in value due to the difference between corporate bond and gilt yields. In addition, since corporate bond yields are typically higher than gilt yields, this can result in the recognition of accounting surpluses in respect of schemes where cash contributions continue to be made to meet funding shortfalls. |
| 272 | Anglo American plc | Financial statements and other financial information |
| Integrated Annual Report 2023 | Notes to the financial statements |
Employees
29. Retirement benefits continued
Sensitivity analysis
Significant actuarial assumptions for the determination of pension and medical plan liabilities are the discount rate, inflation rate and mortality. The sensitivity analysis below has been provided by local actuaries on an approximate basis based on changes in the assumptions occurring at the end of the year, assuming that all other assumptions are held constant and the effect of interrelationships is excluded. The effect on plan liabilities is as follows:
| 2023 | ||||||||||||||||
| South | United | |||||||||||||||
| US$ million | Africa | Kingdom | Other | Total | ||||||||||||
| Discount rate – 1% decrease | (47 | ) | (338 | ) | (20 | ) | (405 | ) | ||||||||
| Inflation rate – pension plans – 0.5% increase | (14 | ) | (49 | ) | (10 | ) | (73 | ) | ||||||||
| Inflation rate – medical plans – 0.5% increase | (8 | ) | — | (3 | ) | (11 | ) | |||||||||
| Life expectancy – increase by 1 year | (20 | ) | (97 | ) | (3 | ) | (120 | ) | ||||||||
Independent qualified actuaries carry out full valuations at least every three years using the projected unit credit method. The actuaries have updated the valuations to 31 December 2023. Assumptions are set after consultation with the qualified actuaries. While management believes the assumptions used are appropriate, a change in the assumptions used would impact the Group’s other comprehensive income.
Accounting judgements and estimates
Recoverability of pension asset surplus and estimation of retirement benefit obligations
The value of the Group’s obligations for defined benefit schemes and post employment medical plans is dependent on the present value of the amount of benefits that are expected to be paid. The most significant assumption used in the calculation of this accounting estimate is the discount rate. The discount rate used is based on AA rated corporate bonds of a suitable duration and currency or, where there is no deep market for such bonds, is based on government bonds.
The Group does not believe that a reasonably possible change in the assumptions used to estimate retirement benefit obligations will have a material impact on the carrying value to the net surplus position within the next year given the hedging arrangements in place. The sensitivity of the gross liability value to reasonably possible changes in discount rate is presented above.
Management apply judgement in determining how much of any surplus is recoverable considering the arrangements in place for each scheme.
Accounting policy
See note 39H for the Group’s accounting policy on retirement benefits.
| Anglo American plc | Financial statements and other financial information | 273 |
| Integrated Annual Report 2023 | Notes to the financial statements |
Employees
30. Share-based payments
Overview
During the year ended 31 December 2023 the Group had share-based payment arrangements with employees relating to shares of the Company. All of these Company schemes, as well as any non-cyclical awards, are equity settled either by award of ordinary shares (BSP, LTIP, MyShare, SIP and Non-cyclical) or award of options to acquire ordinary shares (SAYE). The awards are conditional on employment. LTIPs vest in accordance with the achievement of relative TSR targets and a balanced scorecard of operational and financial measures.
The total share-based payment charge relating to Anglo American plc shares for the year is split as follows:
| US$ million | 2023 | 2022 | ||||||
| BSP | 123 | 99 | ||||||
| LTIP | 23 | 82 | ||||||
| Other schemes | 22 | 6 | ||||||
| Share-based payment charge relating to Anglo American plc shares | 168 | 187 | ||||||
In addition there are equity settled share-based payment charges of $11 million (2022: $13 million) relating to Kumba Iron Ore Limited shares and $13 million (2022: $14 million) relating to Anglo American Platinum Limited shares. Certain entities also operate cash settled employee share-based payment schemes.
Further information
The movements in the number of shares for the more significant share-based payment arrangements are as follows:
Bonus Share Plan
Ordinary shares of 5486/91 US cents may be awarded under the terms of this scheme for no consideration.
| Number of awards | 2023 | 2022 | ||||||
| Outstanding at 1 January | 8,210,594 | 8,891,489 | ||||||
| Conditionally awarded in year | 2,782,466 | 2,564,499 | ||||||
| Vested in year | (4,765,627 | ) | (3,084,708 | ) | ||||
| Forfeited or expired in year | (218,488 | ) | (160,686 | ) | ||||
| Outstanding at 31 December | 6,008,945 | 8,210,594 | ||||||
Further information in respect of the BSP, including vesting conditions, is shown in the Remuneration report.
Long Term Incentive Plan
Ordinary shares of 5486/91 US cents may be awarded under the terms of this scheme for no consideration.
| Number of awards | 2023 | 2022 | ||||||
| Outstanding at 1 January | 10,461,665 | 12,002,419 | ||||||
| Conditionally awarded in year | 3,880,609 | 2,734,704 | ||||||
| Vested in year | (3,081,508 | ) | (3,465,625 | ) | ||||
| Forfeited or expired in year | (3,077,814 | ) | (809,833 | ) | ||||
| Outstanding at 31 December | 8,182,952 | 10,461,665 | ||||||
The early vesting of share awards is permitted at the discretion of the Company upon, inter alia, termination of employment, ill health or death. Further information in respect of the LTIP, including performance conditions, is shown in the Remuneration report.
Accounting policy
See note 39H for the Group’s accounting policy on share-based payments.
| 274 | Anglo American plc | Financial statements and other financial information |
| Integrated Annual Report 2023 | Notes to the financial statements |
| Unrecognised items and uncertain events | ||
|
This section includes disclosure of items and transactions that are not reflected in the Group’s results because they are uncertain or have been incurred after the end of the year. These disclosures are considered relevant to an understanding of the Group’s financial position and the effect of expected or possible future events. |
||
31. Events occurring after end of year
Iron Ore resource acquisition at Minas-Rio
On 21 February 2024, the Anglo American plc Board approved the acquisition and integration of the contiguous Serra da Serpentina (“Serpentina”) high-grade iron ore resource owned by Vale SA (“Vale”) into Anglo American’s Minas-Rio mine in Brazil. Vale will contribute Serpentina and $157.5 million in cash to acquire a 15% shareholding in Anglo American Minério De Ferro Brasil S.A, the owner of the Minas-Rio operation subject to normal completion adjustments. A purchase price adjustment payment will be made depending on average iron ore prices over a four-year period in line with an agreed formula.
Following completion of the transaction, Vale will receive its pro rata share of Minas-Rio production. Vale will also have an option to acquire an additional 15% shareholding in the enlarged Minas-Rio operation, for cash subject to certain licensing milestones being achieved, at fair value calculated at the time of exercise of the option.
Management has considered the potential impact of the transaction on the valuation of the Minas-Rio CGU (see note 8), of which the mine forms part, and concluded that the valuation supports the carrying value of Minas-Rio at 31 December 2023 with no impairment or impairment reversal required. The transaction is expected to complete in Q4 2024, subject to regulatory conditions.
With the exception of the proposed final dividend for 2023 (see note 6), there have been no further reportable events since 31 December 2023.
32. Commitments
Overview
A commitment is a contractual obligation to make a payment in the future which is not provided for in the Consolidated balance sheet. The Group also has purchase obligations relating to take or pay agreements which are legally binding and enforceable.
Capital commitments (including cancellable and non-cancellable contracts) for subsidiaries and joint operations relating to the acquisition of property, plant and equipment are $3,055 million (2022: $4,531 million), of which 67% (2022: 55%) relates to expenditure to be incurred within the next year.
The Group’s outstanding commitments relating to take or pay agreements are $14,320 million (2022: $14,233 million), of which 9% (2022: 11%) relate to expenditure to be incurred within the next year.
33. Contingent assets and liabilities
Overview
The assessment of risk and estimation of future outflows in respect of contingent liabilities is inherently uncertain and hence a material outflow may arise in future periods in relation to these matters.
Contingent assets
Steelmaking Coal
In 2014, the Steelmaking Coal business was granted an arbitration award of $94 million (Group’s share) against MMTC Limited in respect of a contractual dispute. The award has since been challenged in the Indian courts, during which time interest has continued to accrue. On 17 December 2020, the Indian Supreme Court found in favour of the Steelmaking Coal business. The award, inclusive of interest, is currently valued at approximately $133 million (Group’s share). The precise timing and value of receipt remains uncertain and hence no receivable has been recognised on the Consolidated balance sheet as at 31 December 2023.
| Anglo American plc | Financial statements and other financial information | 275 |
| Integrated Annual Report 2023 | Notes to the financial statements |
Contingent liabilities
Global Industry Standard for Tailing Management (GISTM)
In 2022 the Group disclosed a contingent liability for costs of conformance with the GISTM for sites where reliable cost estimates were not available as technical studies and surveys were ongoing. In August 2023, the Group announced its significant progress towards conformance for all tailings dams in the highest priority rankings according to the GISTM. The Group continues to refine designs and all material costs of conformance with GISTM have been recorded within decommissioning and environmental restoration provisions.
Although the Group targets conformance with Anglo American equivalent standards for non-managed operations, there is no constructive obligation in respect of GISTM where the partner is not an ICMM member, unless a public commitment has been made by that partner.
Anglo American South Africa Proprietary Limited (AASA)
In October 2020, an application was initiated against Anglo American South Africa Proprietary Limited (AASA). The application sought the certification of class action litigation to be brought on behalf of community members residing in the Kabwe area in Zambia in relation to alleged lead-related health impacts. The certification hearing was held late in January 2023.
On 15 December 2023, the High Court of South Africa issued a judgment dismissing the claimants’ application for certification and ruled that the applicants pay the costs incurred by AASA in responding to the application. In its judgment, the Court recognised the multiple legal and factual flaws in the claims made against AASA and deemed that it is not in the interests of justice for the class action to proceed.
The claimants have filed an application seeking leave to appeal against the December 2023 ruling. In light of the pending appeal lodged by the claimants, the outcome of this litigation is still subject to significant uncertainty, and no provision is recognised for this matter.
De Beers
Guarantees provided in respect of environmental restoration and decommissioning obligations involve judgements in terms of the outcome of future events. In one of the territories in which De Beers operates, conditions exist, or are proposed, with respect to backfilling pits on closure. A formal appeal has been lodged to remove the existing backfilling condition and no provision has been raised on the basis that it is not probable that this condition will be enforced. Should the appeal not be successful the estimated cost of backfilling is $217 million.
Accounting judgement
Where the existence of an asset is contingent on uncertain future events which are outside the Group’s control, the asset is only recognised once it becomes virtually certain that the Group will receive future economic benefits.
A provision is recognised where it is considered probable that an outflow of resources will be required to settle a present obligation that can be measured reliably.
Determining the likelihood of a future event is an accounting judgement. These judgements are based on the Group’s legal views and, in some cases, independent advice.
| 276 | Anglo American plc | Financial statements and other financial information |
| Integrated Annual Report 2023 | Notes to the financial statements |
| Group structure | ||
|
This section includes details about the composition of the Group and how this is reflected in the Consolidated financial statements. It also includes disclosures of significant corporate transactions such as acquisitions and disposals. |
||
34. Disposals
On 1 November 2023, the Platinum Group Metals business completed the disposal of its 50% interest in the Kroondal pool-and-share agreement (Kroondal PSA) and the Marikana pool-and-share agreement (Marikana PSA) (collectively the PSAs), to Sibanye-Stillwater Limited (Sibanye-Stillwater), the other 50% owner of the PSAs.
The gross assets and liabilities disposed of amounted to $161 million and $51 million, respectively. Estimated deferred consideration of $70 million was recognised within receivables. A loss on disposal of $40 million was recognised as a non-operating special item, refer to note 9.
Cash received of $210 million in respect of disposals principally related to the settlement of deferred consideration balances relating to the sale of the Rustenburg operations (Platinum Group Metals) completed in November 2016.
2022
Cash received of $564 million in respect of disposals for year ended 31 December 2022 principally related to the settlement of deferred consideration balances relating to the sale of the Rustenburg operations (Platinum Group Metals) completed in November 2016, the sale of the Group’s remaining 8.0% shareholding in Thungela Resources Limited, the Group’s disposal of the Cerrejón associate and the sale of the Group’s 49% interest in Bokoni mine to African Rainbow Minerals Limited (Platinum Group Metals).
| Anglo American plc | Financial statements and other financial information | 277 |
| Integrated Annual Report 2023 | Notes to the financial statements |
Group structure
35. Basis of consolidation
Overview
The principal subsidiaries, joint operations, joint ventures and associates of the Group and the Group percentage of equity capital are set out below. All these interests are held indirectly by the Parent Company and are consolidated within these financial statements.
A complete list of the Group’s related undertakings can be found in note 36.
| Percentage of equity owned | ||||||||||||
| Segment and asset | Location | Accounting treatment | 2023 | 2022 | ||||||||
| Copper | ||||||||||||
| Copper Chile | ||||||||||||
| Los Bronces | Chile | Full consolidation | 50.1 | % | 50.1 | % | ||||||
| El Soldado | Chile | Full consolidation | 50.1 | % | 50.1 | % | ||||||
| Chagres | Chile | Full consolidation | 50.1 | % | 50.1 | % | ||||||
| Collahuasi | Chile | Joint operation | 44 | % | 44 | % | ||||||
| Copper Peru | ||||||||||||
| Quellaveco | Peru | Full consolidation | 60 | % | 60 | % | ||||||
| Nickel | ||||||||||||
| Barro Alto | Brazil | Full consolidation | 100 | % | 100 | % | ||||||
| Platinum Group Metals(1) | 79 | % | 79 | % | ||||||||
| Mogalakwena Mine | South Africa | Full consolidation | 100 | % | 100 | % | ||||||
| Amandelbult complex(2) | South Africa | Full consolidation | 100 | % | 100 | % | ||||||
| Twickenham Mine | South Africa | Full consolidation | 100 | % | 100 | % | ||||||
| Unki Mine | Zimbabwe | Full consolidation | 100 | % | 100 | % | ||||||
| Platinum Refining | South Africa | Full consolidation | 100 | % | 100 | % | ||||||
| Modikwa Platinum Joint Operation | South Africa | Joint operation | 50 | % | 50 | % | ||||||
| Mototolo | South Africa | Full consolidation | 100 | % | 100 | % | ||||||
| Kroondal Pooling and Sharing Agreement(3) | South Africa | Joint operation | — | 50 | % | |||||||
| De Beers(4) | 85 | % | 85 | % | ||||||||
| Debswana(5), comprising: | Botswana | Joint operation | 19.2 | % | 19.2 | % | ||||||
| Jwaneng | ||||||||||||
| Orapa regime | ||||||||||||
| Namdeb Holdings(6), comprising: | Namibia | Joint operation | 50 | % | 50 | % | ||||||
| Namdeb Diamond Corporation | ||||||||||||
| Debmarine Namibia | ||||||||||||
| De Beers Consolidated Mines(7), comprising: | South Africa | Full consolidation | 100 | % | 100 | % | ||||||
| Venetia | ||||||||||||
| De Beers Canada, comprising: | ||||||||||||
| Snap Lake | Canada | Full consolidation | 100 | % | 100 | % | ||||||
| Victor | Canada | Full consolidation | 100 | % | 100 | % | ||||||
| Gahcho Kué | Canada | Joint operation | 51 | % | 51 | % | ||||||
| Sales, comprising: | ||||||||||||
| De Beers Global Sightholder Sales | Botswana | Full consolidation | 100 | % | 100 | % | ||||||
| De Beers Sightholder Sales South Africa | South Africa | Full consolidation | 100 | % | 100 | % | ||||||
| Auction Sales | Singapore | Full consolidation | 100 | % | 100 | % | ||||||
| DTC Botswana | Botswana | Joint operation | 50 | % | 50 | % | ||||||
| Namibia DTC | Namibia | Joint operation | 50 | % | 50 | % | ||||||
| Element Six, comprising: | ||||||||||||
| Element Six Technologies | Global | Full consolidation | 100 | % | 100 | % | ||||||
| Element Six Abrasives | Global | Full consolidation | 60 | % | 60 | % | ||||||
| Brands, comprising: | ||||||||||||
| Forevermark | Global | Full consolidation | 100 | % | 100 | % | ||||||
| De Beers Jewellers | Global | Full consolidation | 100 | % | 100 | % | ||||||
See page 278 for footnotes.
| 278 | Anglo American plc | Financial statements and other financial information |
| Integrated Annual Report 2023 | Notes to the financial statements |
Group structure
35. Basis of consolidation continued
| Percentage of equity owned | ||||||||||||
| Segment and asset | Location | Accounting treatment | 2023 | 2022 | ||||||||
| Iron Ore | ||||||||||||
| Kumba Iron Ore | South Africa | Full consolidation | 69.7 | % | 69.7 | % | ||||||
| Sishen(8) | South Africa | Full consolidation | 76.3 | % | 76.3 | % | ||||||
| Kolomela(8) | South Africa | Full consolidation | 76.3 | % | 76.3 | % | ||||||
| Minas-Rio | Brazil | Full consolidation | 100 | % | 100 | % | ||||||
| Ferroport(9) | Brazil | Equity accounted joint venture | 50 | % | 50 | % | ||||||
| Steelmaking Coal | ||||||||||||
| Coal Australia and Canada, comprising: | ||||||||||||
| Moranbah(10) | Australia | Joint operation | 88 | % | 88 | % | ||||||
| Grosvenor(10) | Australia | Joint operation | 88 | % | 88 | % | ||||||
| Capcoal(10) | Australia | Joint operation | 70 | % | 70 | % | ||||||
| Dawson(10) | Australia | Joint operation | 51 | % | 51 | % | ||||||
| Jellinbah(11)(12) | Australia | Equity accounted associate | 33.3 | % | 33.3 | % | ||||||
| Dalrymple Bay Coal Terminal Pty Ltd | Australia | Equity accounted associate | 25.3 | % | 25.3 | % | ||||||
| Peace River Coal | Canada | Full consolidation | 100 | % | 100 | % | ||||||
| Manganese | ||||||||||||
| Samancor(11)(13) | South Africa and Australia | Equity accounted joint venture | 40 | % | 40 | % | ||||||
| Crop Nutrients | ||||||||||||
| Woodsmith | United Kingdom | Full consolidation | 100 | % | 100 | % | ||||||
| Corporate and other | ||||||||||||
| Envusa Energy Proprietary Limited | South Africa | Equity accounted joint venture | 50 | % | 50 | % | ||||||
| (1) | The Group’s effective interest in Anglo American Platinum is 79.2% (2022: 79.2%), which excludes shares issued as part of a community empowerment deal. |
| (2) | Amandelbult complex comprises Tumela mine and Dishaba mine. |
| (3) | On 31 January 2022, Anglo American Platinum agreed to dispose of its 50% interest in the Kroondal pool-and-share agreement and Marikana pool-and-share agreement to Sibanye-Stillwater Limited, the other 50% owner. The remaining conditions precedent were waived and the disposal was effective 1 November 2023. |
| (4) | 85% should be applied to all holdings within De Beers to determine the Group’s attributable share of the asset. |
| (5) | De Beers owns 50% of equity in Debswana, but consolidates 19.2% of Debswana on a proportionate basis, reflecting the economic interest. The Group’s effective interest in Debswana is 16.3% (taking into account the Group’s 85% interest in De Beers Group). |
| (6) | The 50% interest in Namdeb Holdings is held indirectly through De Beers. The Group’s effective interest in Namdeb Holdings is 42.5%. |
| (7) | De Beers’ legal ownership of De Beers Consolidated Mines (DBCM) and its subsidiaries is 74%. For accounting purposes De Beers consolidates 100% of DBCM as it is deemed to control the BEE entity, Ponahalo, which holds the remaining 26%. The Group’s effective interest in DBCM is 85%. |
| (8) | Sishen and Kolomela are fully owned by Sishen Iron Ore Company Proprietary Limited (SIOC). Kumba Iron Ore Limited has a 76.3% interest in SIOC (2022: 76.3%). Including shares held by Kumba Iron Ore in relation to its own employee share schemes, the Group’s effective interest in Kumba Iron Ore is 69.97% (2022: 69.97%). Consequently, the Group’s effective interest in SIOC is 53.4% (2022: 53.4%). |
| (9) | Ferroport owns and operates the iron ore handling and shipping facilities at the port of Açu. |
| (10) | The wholly owned subsidiary Anglo American Steelmaking Coal Holdings Limited holds the proportionately consolidated joint operations. These operations are unincorporated and jointly controlled. |
| (11) | These entities have a 30 June year end. |
| (12) | The Group’s effective interest in the Jellinbah operation is 23.3%. |
| (13) | Samancor is comprised of investments in Groote Eylandt Mining Company Proprietary Limited, Samancor Marketing Pte. Limited and Samancor Holdings Proprietary Limited. Samancor Holdings Proprietary Limited is the parent company of Hotazel Manganese Mines Proprietary Limited (HMM) and the Metalloys Smelter. BEE shareholders hold a 26% interest in HMM and therefore, the Group’s effective ownership interest in HMM is 29.6%. |
Accounting judgements
Joint arrangements
Joint arrangements are classified as joint operations or joint ventures according to the rights and obligations of the parties, as described in note 39I. Judgement is required in determining this classification through an evaluation of the facts and circumstances arising from each individual arrangement. When a joint arrangement has been structured through a separate vehicle, consideration has been given to the legal form of the separate vehicle, the terms of the contractual arrangement and, when relevant, other facts and circumstances. When the activities of an arrangement are primarily designed for the provision of output to the parties and, the parties are substantially the only source of cash flows contributing to the continuity of the operations of the arrangement, this indicates that the parties to the arrangement have rights to the assets and obligations for the liabilities. Certain joint arrangements that are structured through separate vehicles including Collahuasi, Debswana and Namdeb Holdings are accounted for as joint operations. These arrangements are primarily designed for the provision of output to the parties sharing joint control, indicating that the parties have rights to substantially all the economic benefits of the assets. The liabilities of the arrangements are in substance satisfied by cash flows received from the parties; this dependence indicates that the parties effectively have obligations for the liabilities. It is primarily these facts and circumstances that give rise to the classification as joint operations.
Functional Currency
The Group presents its financial statements in US dollars, the currency in which its business is primarily conducted. The functional currency for each subsidiary, joint operation, joint venture and associate is the currency of the primary economic environment in which it operates. The Group applies judgement in determining the functional currency of its operations, particularly where businesses primarily incur costs in local currencies and earn revenue in US dollars. Where the functional currency is unclear from analysis of the revenue and costs, particular attention is paid to the currency in which financing activities are conducted. The determination of functional currency affects the measurement of non-current assets such as property, plant and equipment and intangible assets and therefore the depreciation and amortisation charge for those assets. It also impacts the presentation of exchange gains and losses included in the income statement and in equity.
| Anglo American plc | Financial statements and other financial information | 279 |
| Integrated Annual Report 2023 | Notes to the financial statements |
Group structure
36. Related undertakings of the Group
The Group consists of the Parent Company, Anglo American plc, incorporated in the United Kingdom and its subsidiaries, joint operations, joint ventures and associates. In accordance with Section 409 of the Companies Act 2006 a full list of related undertakings, the country of incorporation and the effective percentage of equity owned as at 31 December 2023 is disclosed below. Unless otherwise disclosed all entities with an indirect equity holding of greater than 50% are considered subsidiary undertakings. See note 35 for the Group’s principal subsidiaries, joint operations, joint ventures and associates.
As disclosed in the Group’s published tax strategy, the Group does not use tax haven jurisdictions to manage taxes. There remain a small number of undertakings in the Group which are registered in tax haven jurisdictions and have remained so for other business purposes. The Group is well advanced in our strategy to remove legacy undertakings from tax haven jurisdictions, and, where possible, these entities are resident for tax purposes in the United Kingdom regardless of where they are registered. Where the tax residency of a related undertaking is different from its country of incorporation, this is referenced in the notes to the list below.
| Percentage | ||||||||||
| Country of | of equity | |||||||||
| incorporation(1)(2) | Name of undertaking | owned(3) | Share class | Registered address | ||||||
| See page 293 for footnotes. | ||||||||||
| Angola | Anglo American Discovery (Moxico) - Prospeccao E Exploracao Mineira (SU), LDA | 100 | % | Quota | Rua Rainha Ginga, no. 87 - 9th floor, Urban District of Ingombota, Luanda | |||||
| Angola | Anglo American Discovery (Cunene) - Prospeccao E Exploracao Mineira (SU), LDA | 100 | % | Quota | Rua Rainha Ginga, no. 87 - 9th floor, Urban District of Ingombota, Luanda | |||||
| Angola | De Beers Angola Holdings SARL | 85 | % | Quota | Rua Rainha Ginga, no. 87 - 9th floor, Urban District of Ingombota, Luanda | |||||
| Angola | De Beers Angola Lunda Norte, Limitada | 77 | % | Quota | Rua Rainha Ginga, no. 87 - 9th floor, Urban District of Ingombota, Luanda | |||||
| Angola | De Beers Angola Lunda Sul, Limitada | 77 | % | Quota | Rua Rainha Ginga, no. 87 - 9th floor, Urban District of Ingombota, Luanda | |||||
| Argentina | Minera Anglo American Argentina S.A.U | 100 | % | Ordinary Nominative Non-Endorsable | Esteban Echeverría 1776, Piso 2, Godoy Cruz, Mendoza | |||||
| Australia | Anglo American Australia Finance Limited | 100 | % | Ordinary | Level 11, 201 Charlotte Street, Brisbane QLD 4000 | |||||
| Australia | Anglo American Australia Holdings Pty Limited | 100 | % | Ordinary | Level 11, 201 Charlotte Street, Brisbane QLD 4000 | |||||
| Australia | Anglo American Australia Limited | 100 | % | Ordinary | Level 11, 201 Charlotte Street, Brisbane QLD 4000 | |||||
| Australia | Anglo American Energy Solutions (Australia) Pty Ltd | 100 | % | Ordinary | Level 11, 201 Charlotte Street, Brisbane QLD 4000 | |||||
| Australia | Anglo American Exploration (Australia) Pty Limited | 100 | % | Ordinary | Level 11, 201 Charlotte Street, Brisbane QLD 4000 | |||||
| Australia | Anglo American Steelmaking Coal Assets Eastern Australia Limited | 100 | % | Ordinary | Level 11, 201 Charlotte Street, Brisbane QLD 4000 | |||||
| Australia | Anglo American Steelmaking Coal Assets Pty Ltd | 100 | % | Ordinary | Level 11, 201 Charlotte Street, Brisbane QLD 4000 | |||||
| Australia | Anglo American Steelmaking Coal Finance Limited | 100 | % | Ordinary | Level 11, 201 Charlotte Street, Brisbane QLD 4000 | |||||
| Australia | Anglo American Steelmaking Coal Holdings Limited | 100 | % | Ordinary | Level 11, 201 Charlotte Street, Brisbane QLD 4000 | |||||
| Australia | Anglo American Steelmaking Coal Pty Ltd | 100 | % | Ordinary | Level 11, 201 Charlotte Street, Brisbane QLD 4000 | |||||
| Australia | Anglo Coal (Archveyor Management) Pty Ltd | 100 | % | Ordinary | Level 11, 201 Charlotte Street, Brisbane QLD 4000 | |||||
| Australia | Anglo Coal (Capcoal Management) Pty Limited | 100 | % | A Class Ordinary | Level 11, 201 Charlotte Street, Brisbane QLD 4000 | |||||
| B Class Ordinary | ||||||||||
| C Class Ordinary | ||||||||||
| D Class Ordinary | ||||||||||
| E Class Ordinary | ||||||||||
| F Class Ordinary | ||||||||||
| G Class Ordinary | ||||||||||
| H Class Ordinary | ||||||||||
| Australia | Anglo Coal (Dawson Management) Pty Ltd | 100 | % | Ordinary | Level 11, 201 Charlotte Street, Brisbane QLD 4000 | |||||
| Australia | Anglo Coal (Dawson Services) Pty Ltd | 100 | % | Ordinary | Level 11, 201 Charlotte Street, Brisbane QLD 4000 | |||||
| 280 | Anglo American plc | Financial statements and other financial information |
| Integrated Annual Report 2023 | Notes to the financial statements |
Group structure
36. Related undertakings of the Group continued
| Percentage | ||||||||||
| Country of | of equity | |||||||||
| incorporation(1)(2) | Name of undertaking | owned(3) | Share class | Registered address | ||||||
| See page 293 for footnotes. | ||||||||||
| Australia | Anglo Coal (Dawson South Management) Pty Ltd | 100 | % | Ordinary | Level 11, 201 Charlotte Street, Brisbane QLD 4000 | |||||
| Australia | Anglo Coal (Dawson South) Pty Ltd | 100 | % | Ordinary | Level 11, 201 Charlotte Street, Brisbane QLD 4000 | |||||
| Australia | Anglo Coal (Dawson) Holdings Pty Ltd | 100 | % | Ordinary | Level 11, 201 Charlotte Street, Brisbane QLD 4000 | |||||
| Australia | Anglo Coal (Dawson) Limited | 100 | % | Limited by guarantee | Level 11, 201 Charlotte Street, Brisbane QLD 4000 | |||||
| Australia | Anglo Coal (German Creek) Pty Ltd | 100 | % | Ordinary | Level 11, 201 Charlotte Street, Brisbane QLD 4000 | |||||
| Australia | Anglo Coal (Grasstree Management) Pty Limited | 100 | % | Ordinary | Level 11, 201 Charlotte Street, Brisbane QLD 4000 | |||||
| Australia | Anglo Coal (Grosvenor Management) Pty Ltd | 100 | % | Ordinary | Level 11, 201 Charlotte Street, Brisbane QLD 4000 | |||||
| Australia | Anglo Coal (Grosvenor) Pty Ltd | 100 | % | Ordinary | Level 11, 201 Charlotte Street, Brisbane QLD 4000 | |||||
| Australia | Anglo Coal (Jellinbah) Holdings Pty Ltd | 100 | % | Ordinary | Level 11, 201 Charlotte Street, Brisbane QLD 4000 | |||||
| Australia | Anglo Coal (Moranbah North Management)Pty Limited | 100 | % | Ordinary | Level 11, 201 Charlotte Street, Brisbane QLD 4000 | |||||
| Australia | Anglo Coal (Roper Creek) Pty Ltd | 100 | % | Ordinary | Level 11, 201 Charlotte Street, Brisbane QLD 4000 | |||||
| Australia | Anglo Coal (Theodore South) Pty Ltd | 100 | % | Ordinary | Level 11, 201 Charlotte Street, Brisbane QLD 4000 | |||||
| Australia | Anglo Operations (Australia) Pty Ltd | 100 | % | Ordinary | Level 11, 201 Charlotte Street, Brisbane QLD 4000 | |||||
| Australia | Bowen Basin Coal Pty. Ltd. | 23 | % | Ordinary | Level 20, 66 Eagle Street, Brisbane QLD 4000 | |||||
| Australia | Capricorn Coal Developments Joint Venture | 70 | % | N/A | N/A | |||||
| Australia | Dalrymple Bay Coal Terminal Pty. Ltd. | 25 | % | Ordinary | Martin Armstrong Drive, Hay Point QLD 4740 | |||||
| Australia | Dawson Coal Processing Pty Ltd | 100 | % | Ordinary | Level 11, 201 Charlotte Street, Brisbane QLD 4000 | |||||
| Australia | Dawson Highwall Mining Pty Ltd | 100 | % | Ordinary | Level 11, 201 Charlotte Street, Brisbane QLD 4000 | |||||
| Australia | Dawson Joint Venture | 51 | % | N/A | N/A | |||||
| Australia | Dawson Sales Pty Ltd | 51 | % | Ordinary | Level 11, 201 Charlotte Street, Brisbane QLD 4000 | |||||
| Australia | Dawson South Exploration Joint Venture | 51 | % | N/A | N/A | |||||
| Australia | Dawson South Joint Venture | 51 | % | N/A | N/A | |||||
| Australia | Dawson South Sales Pty Ltd | 51 | % | Ordinary | Level 11, 201 Charlotte Street, Brisbane QLD 4000 | |||||
| Australia | De Beers Australia Exploration Limited | 85 | % | Ordinary | 23 North Street, Mount Lawley, WA 6050 | |||||
| Australia | First Mode Pty Ltd | 81 | % | Ordinary | 165-169 Aberdeen Street, Northbridge, 6003, | |||||
| Australia | German Creek Coal Pty. Limited | 70 | % | B Class Ordinary | Level 11, 201 Charlotte Street, Brisbane QLD 4000 | |||||
| C Class Ordinary | ||||||||||
| D Class Ordinary | ||||||||||
| E Class Ordinary | ||||||||||
| Australia | Groote Eylandt Mining Company Proprietary Limited | 40 | % | Ordinary | Level 35, 108 St Georges Terrace, Perth WA 6000 | |||||
| Australia | Jellinbah East Joint Venture | 23 | % | N/A | N/A | |||||
| Australia | Jellinbah Group Pty Ltd | 33 | % | Ordinary | Level 20, 66 Eagle Street, Brisbane QLD 4000 | |||||
| A Class Ordinary | ||||||||||
| E Class Ordinary | ||||||||||
| F Class Ordinary | ||||||||||
| Australia | Jellinbah Mining Pty Ltd | 33 | % | Ordinary | Level 20, 66 Eagle Street, Brisbane QLD 4000 | |||||
| Australia | Jellinbah Resources Pty Ltd | 33 | % | Ordinary | Level 20, 66 Eagle Street, Brisbane QLD 4000 | |||||
| Australia | Jena Pty. Limited | 100 | % | Ordinary | Level 11, 201 Charlotte Street, Brisbane QLD 4000 | |||||
| Australia | Jena Unit Trust | 100 | % | N/A | Level 11, 201 Charlotte Street, Brisbane QLD 4000 | |||||
| Australia | JG Land Company Pty Ltd | 23 | % | Ordinary | Level 20, 66 Eagle Street, Brisbane QLD 4000 | |||||
| Australia | Lake Vermont Joint Venture | 23 | % | N/A | N/A | |||||
| Australia | Lake Vermont Marketing Pty Ltd | 33 | % | Ordinary | Level 20, 66 Eagle Street, Brisbane QLD 4000 | |||||
| Australia | Lake Vermont Resources Pty Ltd | 33 | % | Ordinary | Level 20, 66 Eagle Street, Brisbane QLD 4000 | |||||
| Australia | Monash Energy Coal Limited | 100 | % | Ordinary | Level 11, 201 Charlotte Street, Brisbane QLD 4000 | |||||
| Australia | Moranbah North Coal (No2) Pty Ltd | 100 | % | Ordinary | Level 11, 201 Charlotte Street, Brisbane QLD 4000 | |||||
| Australia | Moranbah North Coal (Sales) Pty Ltd | 88 | % | Ordinary | Level 11, 201 Charlotte Street, Brisbane QLD 4000 | |||||
| Anglo American plc | Financial statements and other financial information | 281 |
| Integrated Annual Report 2023 | Notes to the financial statements |
Group structure
36. Related undertakings of the Group continued
| Percentage | ||||||||||
| Country of | of equity | |||||||||
| incorporation(1)(2) | Name of undertaking | owned(3) | Share class | Registered address | ||||||
| See page 293 for footnotes. | ||||||||||
| Australia | Moranbah North Coal Joint Venture | 88 | % | N/A | N/A | |||||
| Australia | Moranbah North Coal Pty Ltd | 100 | % | Ordinary | Level 11, 201 Charlotte Street, Brisbane QLD 4000 | |||||
| Australia | Moranbah South Exploration Joint Venture | 50 | % | N/A | N/A | |||||
| Australia | QCMM (Lake Vermont Holdings) Pty Ltd | 33 | % | Ordinary | Level 20, 66 Eagle Street, Brisbane QLD 4000 | |||||
| Australia | QCMM Finance Pty Ltd | 33 | % | Ordinary | Level 20, 66 Eagle Street, Brisbane QLD 4000 | |||||
| Australia | Roper Creek Joint Venture | 86 | % | N/A | N/A | |||||
| Australia | Theodore South Joint Venture | 51 | % | N/A | N/A | |||||
| Australia | Tremell Pty. Ltd. | 33 | % | Ordinary | Level 20, 66 Eagle Street, Brisbane QLD 4000 | |||||
| Belgium | De Beers Auction Sales Belgium NV | 85 | % | Ordinary | 21 Schupstraat, 2018 Antwerp | |||||
| Belgium | International Institute of Diamond Grading and Research (Belgium) NV | 85 | % | Ordinary | 21 Schupstraat, 2018 Antwerp | |||||
| Bermuda | Coromin Insurance Limited | 100 | % | Common | Wellesley House, 90 Pitts Bay Road, Hamilton | |||||
| Bermuda | Holdac Insurance Limited | 100 | % | Common | Wellesley House, 90 Pitts Bay Road, Hamilton | |||||
| Botswana | Ambase Prospecting (Botswana) (Pty) Ltd | 100 | % | Ordinary | Plot 32, Unit G3 Victoria House, Independence Avenue, Gaborone, AD54 ACJ | |||||
| Botswana | Anglo American Corporation Botswana (Services) Limited | 100 | % | Ordinary | Plot 67977, Fairground Office Park, Gaborone | |||||
| Botswana | Broadhurst Primary School (Proprietary) Limited | 45 | % | Ordinary | Plot 113, Unit 28 Kgale Mews, Gaborone International Finance Park, Gaborone | |||||
| Botswana | De Beers Global Sightholder Sales (Pty) Ltd | 85 | % | Ordinary | 3rd Floor, DTCB Building, Plot 63016, Block 8, Airport Road, Gaborone | |||||
| Botswana | De Beers Holdings Botswana (Pty) Ltd | 85 | % | Ordinary | 5th Floor, Debswana House, Main Mall, Gaborone | |||||
| Botswana | Debswana Diamond Company (Proprietary) Limited(4) | 43 | % | Ordinary | First Floor Debswana Corporate Centre, Plot 64288 Airport Road, Block 8, Gaborone | |||||
| Botswana | Debswana Wellness Fund | 43 | % | N/A | First Floor Debswana Corporate Centre, Plot 64288 Airport Road, Block 8, Gaborone | |||||
| Botswana | Diamond Trading Company Botswana (Pty) Ltd | 43 | % | Ordinary | Plot 63016, Airport Road, Block 8, Gaborone | |||||
| Botswana | Naledi Mining Services Company (Proprietary) Limited | 43 | % | Ordinary | First Floor Debswana Corporate Centre, Plot 64288 Airport Road, Block 8, Gaborone | |||||
| Botswana | Sesiro Insurance Company (Proprietary) Limited | 43 | % | Ordinary | First Floor Debswana Corporate Centre, Plot 64288 Airport Road, Block 8, Gaborone | |||||
| Botswana | The Diamond Trust | 85 | % | N/A | Debswana House, The Mall, Gaborone | |||||
| Botswana | Tokafala (Proprietary) Limited | 57 | % | Ordinary | 3rd Floor, DTCB Building, Plot 63016, Block 8, Airport Road, Gaborone | |||||
| Brazil | Anglo American Comercializadora E Exportadora Ltda. | 100 | % | Membership interest | Rua Maria Luiza Santiago, n.,200, 16º andar, parte, bairro Santa Lúcia, CEP 30360-740 | |||||
| Brazil | Anglo American Holding Patrimonial Ltda. | 100 | % | Membership interest | Rua Maria Luiza Santiago, n.,200, 16º andar, parte, bairro Santa Lúcia, CEP 30360-740 | |||||
| Brazil | Anglo American Investimentos - Minério de Ferro Ltda. | 100 | % | Membership interest | Rua Maria Luiza Santiago, nº 200, 16º andar, sala 1603, bairro Santa Lúcia, CEP 30360-740, Belo Horizonte, Minas Gerais | |||||
| Brazil | Anglo American Minério de Ferro Brasil S.A | 100 | % | Ordinary | Rua Maria Luiza Santiago, nº 200, 16º andar, sala 1601, bairro Santa Lucia, CEP 30360-740, Belo Horizonte, Minas Gerais | |||||
| Brazil | Anglo American Niquel Brasil Ltda. | 100 | % | Membership interest | Rua Maria Luiza Santiago, nº. 200, 8º andar (parte), Santa Lúcia, CEP 30360-740, Belo Horizonte, Minas Gerais | |||||
| Brazil | Anglo Ferrous Brazil Participações S.A. | 100 | % | Ordinary | Rua Maria Luiza Santiago, nº 200, 16º andar, sala 1601, bairro Santa Lucia, CEP 30360-740, Belo Horizonte, Minas Gerais | |||||
| Brazil | Ferroport Logística Comercial Exportadora S.A. | 50 | % | Ordinary | Rua da Passagem, nº 123, 11º andar, sala 1101, Botafogo, CEP 22290-030, Rio de Janeiro/RJ | |||||
| 282 | Anglo American plc | Financial statements and other financial information |
| Integrated Annual Report 2023 | Notes to the financial statements |
Group structure
36. Related undertakings of the Group continued
| Percentage | ||||||||||
| Country of | of equity | |||||||||
| incorporation(1)(2) | Name of undertaking | owned(3) | Share class | Registered address | ||||||
| See page 293 for footnotes. | ||||||||||
| Brazil | GD Empreendimentos Imobiliários S.A. | 33 | % | Ordinary Preference | Rua Visconde de Ouro Preto, nº 5, 11º andar (parte), Botafogo, Rio de Janeiro/RJ | |||||
| Brazil | Guaporé Mineração Ltda. | 49 | % | Membership interest | Rua Maria Luiza Santiago, nº. 200, 8º andar (parte), bairro Santa Lúcia, CEP 30.360-740, Belo Horizonte, Minas Gerais | |||||
| Brazil | Mineração Tanagra Ltda. | 49 | % | Membership interest | Rua Maria Luiza Santiago, nº. 200, 20º andar (parte), bairro Santa Lúcia, CEP 30.360-740, Belo Horizonte, Minas Gerais | |||||
| Brazil | Ventos de Santa Alice Energias Renováveis S/A | 98 | % | Ordinary | Rodovia Doutor Mendel Steinbruch, nº 10.800, sala 236, Distrito Industrial, Maracanaú/CE, CEP 61939-906 | |||||
| Brazil | Ventos de Santa Alice Holding S/A | 98 | % | Ordinary | Rodovia Doutor Mendel Steinbruch, nº 10.800, sala 236, Distrito Industrial, Maracanaú/CE, CEP 61939-906 | |||||
| Brazil | Ventos de Santa Sara Energias Renováveis S/A | 98 | % | Ordinary | Rodovia Doutor Mendel Steinbruch, nº 10.800, sala 236, Distrito Industrial, Maracanaú/CE, CEP 61939-906 | |||||
| Brazil | Ventos de Santa Sara Holding S/A | 98 | % | Ordinary | Rodovia Doutor Mendel Steinbruch, nº 10.800, sala 236, Distrito Industrial, Maracanaú/CE, CEP 61939-906 | |||||
| Brazil | Ventos de São Felipe Energias Renováveis S/A | 98 | % | Ordinary | Rodovia Doutor Mendel Steinbruch, nº 10.800, sala 236, Distrito Industrial, Maracanaú/CE, CEP 61939-906 | |||||
| Brazil | Ventos de São Felipe Holding S/A | 98 | % | Ordinary | Rodovia Doutor Mendel Steinbruch, nº 10.800, sala 236, Distrito Industrial, Maracanaú/CE, CEP 61939-906 | |||||
| British Virgin Islands | De Beers Centenary Angola Properties Ltd | 85 | % | Ordinary | Craigmuir Chambers, Road Town, Tortola, VG1109 | |||||
| British Virgin Islands | Delibes Holdings Limited(5) | 85 | % | A Ordinary | Craigmuir Chambers, Road Town, Tortola, VG1110 | |||||
| British Virgin Islands | Loma de Niquel Holdings Limited(5) | 94 | % | Class A1 | Craigmuir Chambers, Road Town, Tortola, VG1110 | |||||
| Class A2 | ||||||||||
| Class B | ||||||||||
| Class C | ||||||||||
| Canada | 0912055 B.C. Ltd. | 100 | % | Common | c/- McCarthy Tetrault, Suite 2400, 745 Thurlow Street, Vancouver, BC, V6E 0C5 | |||||
| Canada | Anglo American Exploration (Canada) Ltd. | 100 | % | Common | Suite 620 – 650 West Georgia Street, Vancouver, BC, V6B 4N8 | |||||
| Class B Preference | ||||||||||
| Class C Preference | ||||||||||
| Canada | Auspotash Corporation | 100 | % | N/A | 333 Bay Street, Suite 2400, Toronto, ON, M5H2T6 | |||||
| Canada | Central Ecuador Holdings Ltd. | 70 | % | Class A Common | c/o Borden Ladner Gervais, 1200 Waterfront Centre, 200 Burrard Street, Vancouver, BC, V6C 3L6 | |||||
| Class B Common | ||||||||||
| Canada | De Beers Canada Holdings Inc. | 85 | % | A Ordinary | 2400-333 Bay St, Toronto, ON, M5H2T6 | |||||
| B Ordinary | ||||||||||
| Canada | De Beers Canada Inc. | 85 | % | Preference | 2400-333 Bay St, Toronto, ON, M5H2T6 | |||||
| Canada | Lion Battery Technologies Inc. | 37 | % | Class A Preferred | Suite 2600, Three Bentall Centre, 595 Burrard Street, P.O. Box 49314, Vancouver, BC, V7X 1L3 | |||||
| Canada | Peace River Coal Inc. | 100 | % | Common Class A Non-Voting Preference | c/- McCarthy Tetrault, Suite 2400, 745 Thurlow Street, Vancouver, BC, V6E 0C5 | |||||
| Canada | Peregrine Diamonds Ltd | 85 | % | Common Preference | 2400-333 Bay St, Toronto, ON, M5H 2T6 | |||||
| Chile | Anglo American Chile Limitada | 100 | % | Ordinary | Isidora Goyenechea 2800, piso 46, Las Condes, Santiago | |||||
| Chile | Anglo American Copper Finance SpA | 100 | % | Ordinary | Isidora Goyenechea 2800, piso 46, Las Condes, Santiago | |||||
| Chile | Anglo American Marketing Chile SpA | 100 | % | Ordinary | Isidora Goyenechea 2800, piso 46, Las Condes, Santiago | |||||
| Chile | Anglo American Sur S.A. | 50 | % | Ordinary | Isidora Goyenechea 2800, piso 46, Las Condes, Santiago | |||||
| Chile | Compañía Minera Dona Ines De Collahuasi SCM | 44 | % | Ordinary | Av. Andrés Bello 2457 Piso 39 Providencia, Santiago, Región Metropolitana | |||||
| Anglo American plc | Financial statements and other financial information | 283 |
| Integrated Annual Report 2023 | Notes to the financial statements |
Group structure
36. Related undertakings of the Group continued
| Percentage | ||||||||||
| Country of | of equity | |||||||||
| incorporation(1)(2) | Name of undertaking | owned(3) | Share class | Registered address | ||||||
| See page 293 for footnotes. | ||||||||||
| Chile | Compañía Minera Westwall S.C.M | 50 | % | Ordinary | Av. Andrés Bello 2457 Piso 39 Providencia, Santiago, Región Metropolitana | |||||
| Chile | First Mode Chile SpA | 81 | % | Nominative and without par value | Alonso De Cordova 4355, Of 1503, Vitacura | |||||
| Chile | Inversiones Anglo American Norte SpA | 100 | % | Ordinary | Isidora Goyenechea 2800, piso 46, Las Condes, Santiago | |||||
| Chile | Inversiones Anglo American Sur SpA | 100 | % | Ordinary | Isidora Goyenechea 2800, piso 46, Las Condes, Santiago | |||||
| Chile | Inversiones Minorco Chile SpA | 100 | % | Ordinary | Isidora Goyenechea 2800, piso 46, Las Condes, Santiago | |||||
| China | Anglo American Resources Trading (China) Co., Ltd. | 100 | % | Equity interest | Units 01, 02A, 07A, 08, Floor 32, No. 1198 Century Avenue, Pudong New Area, Shanghai | |||||
| China | De Beers Jewellers Commercial (Shanghai) Co., Ltd | 85 | % | Equity interest | Suite 4607, The Park Place, No.1601 Nan Jing West Road, Shanghai | |||||
| China | Element Six Trading (Shanghai) Co., Ltd | 51 | % | Equity interest | Room 807, Floor 8, No 390-408 East Beijing Road, Huangpu District, Shanghai | |||||
| China | Forevermark Marketing (Shanghai) Company Limited | 85 | % | Equity interest | Suite 4601, 4602 and 4608, The Park Place, No.1601 Nan Jing West Road, Shanghai | |||||
| China | Platinum Guild International (Shanghai) Co., Limited | 77 | % | Ordinary | Room 601, L'Avenue, 99 XianXia Road, Shanghai 200051 | |||||
| China | Suzhou Yibai Environmental Protection Technologies Co., Ltd | 24 | % | N/A | No. 558, Fenhu Avenue, Lili Town, Wujiang District, Suzhou | |||||
| Colombia | Anglo American Colombia Exploration S.A. | 100 | % | Ordinary | Carrera 7 No. 71-52 Torre B, Piso 9, Bogotá | |||||
| Democratic Republic of Congo | Ambase Exploration Africa (DRC) SPRL | 100 | % | Ordinary | c/o KPMG, 500b. Av. Mpala/Quartier Golf, Lubumbashi | |||||
| Ecuador | Anglo American Ecuador S.A. | 100 | % | Ordinary | Av. Patria E4-69 y Av. Amazonas, Cofiec ,16th Floor | |||||
| Ecuador | Central Ecuador EC-CT S.A. | 70 | % | Ordinary | Av. Patria E4-69 y Av. Amazonas, Edif.COFIEC, piso 17, Quito | |||||
| Finland | AA Sakatti Mining Oy | 100 | % | Ordinary | AA Sakatti Mining Oy, Tuohiaavantie 2, 99600, Sodankylä | |||||
| Gabon | Samancor Gabon SA | 40 | % | Ordinary | C/- Fiduge SARL, Battery IV, Soraya Building, PO Box 15.950, Liberville | |||||
| Germany | Element Six GmbH | 51 | % | Ordinary | Staedeweg 18, 36151, Burghaun | |||||
| Germany | Kupfer Copper Germany GmbH | 80 | % | Ordinary | Alfred-Herrhausen-Allee 3-5, 65760 Eschborn, Deutschland | |||||
| Germany | Anglo American Exploration Germany GmbH | 100 | % | Ordinary | Alfred-Herrhausen-Allee 3-5, 65760 Eschborn, Deutschland | |||||
| Greenland | NAIP West Exploration A/S | 75 | % | Ordinary | Issortarfimmut 6, 3905 Nuussuaq | |||||
| Hong Kong | De Beers Auction Sales Holdings Limited | 85 | % | Ordinary | 2602-2606, 26/F, Kinwick Centre, 32 Hollywood Road, Central | |||||
| Hong Kong | De Beers Jewellers (Hong Kong) Limited | 85 | % | Ordinary | RM 02B&03-06 26/F, Kinwick Centre, 32 Hollywood Road, Central | |||||
| Hong Kong | Forevermark Limited | 85 | % | Ordinary | RM 02B&03-06 26/F, Kinwick Centre, 32 Hollywood Road, Central | |||||
| Hong Kong | Platinum Guild International (Hong Kong) Limited | 77 | % | Ordinary | Suites 2901-2, Global Trade Square, No.21 Wong Chuk Hang Road | |||||
| India | Anglo American Crop Nutrients (India) Private Limited | 100 | % | Ordinary | Regus Elegance, 2F, Elegance, Jasola Districe Centre Old Mathura Road, New Delhi, 110025 | |||||
| India | Anglo American Services (India) Private Limited | 100 | % | Equity | A- 1/292, Janakpuri, New Delhi - 110058 | |||||
| India | De Beers India Private Ltd | 85 | % | Ordinary Equity Preference Equity | 601, 6th floor, TCG Financial Centre, C -53, G Block, Bandra Kurla Complex, Bandrar (East), Mumbai - 400 058 | |||||
| 284 | Anglo American plc | Financial statements and other financial information |
| Integrated Annual Report 2023 | Notes to the financial statements |
Group structure
36. Related undertakings of the Group continued
| Country
of incorporation(1)(2) |
Name of undertaking | Percentage of equity owned(3) |
Share class | Registered address | ||||||
| See page 293 for footnotes. | ||||||||||
| India | Hindustan Diamond Company Private Limited | 43 | % | Ordinary equity | Office No. 12, 14th Floor, Navjivan Society Building, No.3, Lamington Road, Mumbai - 400 008 | |||||
| India | Platinum Guild India Private Limited | 77 | % | Ordinary | Notan Classic, 3rd Floor, 114 Turner Road, Bandra West, Mumbai 400 050 | |||||
| Indonesia | PT Anglo American Indonesia | 100 | % | Ordinary | Treasury Tower, 11th Floor Unit A & B, District 8, SCBD Lot. 28 Jl. Jend. Sudirman Kav. 52-53, RT/RW 5/3, Kel. Senayan, Kec. Kebayoran Baru, South Jakarta 12190 | |||||
| Indonesia | PT Minorco Services Indonesia | 100 | % | Ordinary | Treasury Tower, 11th Floor Unit A & B, District 8, SCBD Lot. 28 Jl. Jend. Sudirman Kav. 52-53, RT/RW 5/3, Kel. Senayan, Kec. Kebayoran Baru, South Jakarta 12190 | |||||
| Ireland | Coromin Insurance (Ireland) DAC | 100 | % | Ordinary | Charlotte House, Charlemont Street, Dublin 2, D02 NV26 | |||||
| Ireland | Element Six (Holdings) Limited | 51 | % | Ordinary | Shannon Airport, Shannon, Co.Clare | |||||
| Ireland | Element Six (Trade Marks) Limited | 51 | % | Ordinary A Ordinary |
Shannon Airport, Shannon, Co.Clare | |||||
| Ireland | Element Six Abrasives Treasury Limited | 51 | % | Ordinary | Shannon Airport, Shannon, Co.Clare | |||||
| Ireland | Element Six Limited | 51 | % | Ordinary | Shannon Airport, Shannon, Co.Clare | |||||
| Ireland | Element Six Technologies Limited | 85 | % | Ordinary | Shannon Airport, Shannon, Co.Clare | |||||
| Ireland | Element Six Treasury Limited | 85 | % | Ordinary | Shannon Airport, Shannon, Co.Clare | |||||
| Isle of Man | Element Six (Legacy Pensions) Limited | 85 | % | Ordinary A Ordinary |
1st Floor, 18-20 North Quay, Douglas, IM1 4LE | |||||
| Israel | De Beers Auction Sales Israel Ltd | 85 | % | Ordinary | 11th Floor, Yahalom (Diamond) Building, 21 Tuval Street Ramat Gan 5252236 | |||||
| Italy | Forevermark Italy S.R.L. | 85 | % | Ordinary | Via Burlamacchi Francesco 14, 20135, Milan | |||||
| Japan | De Beers Jewellers Japan K.K. | 85 | % | Common stock | New Otani Garden Court 7th Floor, 4-1 Kioi-cho, Chiyoda-ku, Tokyo. | |||||
| Japan | De Beers K.K. | 43 | % | Common stock | New Otani Garden Court, 7th Floor, 4-1 Kioi-cho, Chiyoda-ku, Tokyo | |||||
| Japan | Element Six Limited | 51 | % | Ordinary | 9F PMO Hatchobori, 3-22-13 Hatchobori, Chuo-ku, Tokyo, 104 | |||||
| Japan | Forevermark KK | 85 | % | Common stock | New Otani Garden Court, 7th Floor, 4-1 Kioi-cho, Chiyoda-ku, Tokyo | |||||
| Japan | Furuya Eco-Front Technology Co., Ltd | 31 | % | Common | MSB-21 Minami Otsuka Building, 2-37-5 Minami Otsuka, Toshima-ku, Tokyo | |||||
| Japan | PGI KK | 77 | % | Ordinary | Imperial Hotel Tower 17F, 1-1-1 Uchisaiwai-cho, Chiyoda-ku,Tokyo, 100-8575 | |||||
| Jersey | A.R.H. Investments Limited(5) | 100 | % | Ordinary | 3rd Floor, 44 Esplanade, St Helier, JE4 9WG | |||||
| Jersey | A.R.H. Limited(5) | 100 | % | Class A Class B Class C |
3rd Floor, 44 Esplanade, St Helier, JE4 9WG | |||||
| Jersey | Ambras Holdings Limited(5)(6) | 100 | % | Repurchaseable Class A Ordinary Repurchaseable Class B Ordinary |
3rd Floor, 44 Esplanade, St Helier, JE4 9WG | |||||
| Jersey | Ammin Coal Holdings Limited(5) | 100 | % | Ordinary | 3rd Floor, 44 Esplanade, St Helier, JE4 9WG | |||||
| Jersey | Anglo African Exploration Holdings Limited(5) | 100 | % | Ordinary | 3rd Floor, 44 Esplanade, St Helier, JE4 9WG | |||||
| Jersey | Anglo American Amcoll UK Ltd(5) | 100 | % | Ordinary | 3rd Floor, 44 Esplanade, St Helier, JE4 9WG | |||||
| Jersey | Anglo American Buttercup Company Limited(5) | 100 | % | Ordinary | 3rd Floor, 44 Esplanade, St Helier, JE4 9WG | |||||
| Jersey | Anglo American Chile Investments UK Ltd(5) | 100 | % | Ordinary | 3rd Floor, 44 Esplanade, St Helier, JE4 9WG | |||||
| Jersey | Anglo American Clarent UK Ltd(5) | 100 | % | Ordinary | 3rd Floor, 44 Esplanade, St Helier, JE4 9WG | |||||
| Jersey | Anglo American Corporation de Chile Holdings Limited(5) | 100 | % | Ordinary | 3rd Floor, 44 Esplanade, St Helier, JE4 9WG | |||||
| Anglo American plc | Financial statements and other financial information | 285 |
| Integrated Annual Report 2023 | Notes to the financial statements |
Group structure
36. Related undertakings of the Group continued
| Country
of incorporation(1)(2) |
Name of undertaking | Percentage of equity owned(3) |
Share class | Registered address | ||||||
| See page 293 for footnotes. | ||||||||||
| Jersey | Anglo American Exploration Colombia Limited(5) | 100 | % | Ordinary | 3rd Floor, 44 Esplanade, St Helier, JE4 9WG | |||||
| Jersey | Anglo American Exploration Overseas Holdings Limited(5) | 100 | % | Ordinary | 3rd Floor, 44 Esplanade, St Helier, JE4 9WG | |||||
| Jersey | Anglo American Finland Holdings 2 Limited(5) | 100 | % | Ordinary | 3rd Floor, 44 Esplanade, St Helier, JE4 9WG | |||||
| Jersey | Anglo American Midway Investment Limited(5) | 100 | % | A Shares B Shares |
3rd Floor, 44 Esplanade, St Helier, JE4 9WG | |||||
| Jersey | Anglo American Overseas Limited(5)(7) | 100 | % | Repurchaseable Class A Ordinary Repurchaseable Class B Ordinary Repurchaseable Class C Ordinary |
3rd Floor, 44 Esplanade, St Helier, JE4 9WG | |||||
| Jersey | Anglo Australia Investments Limited(5) | 100 | % | Ordinary | 3rd Floor, 44 Esplanade, St Helier, JE4 9WG | |||||
| Jersey | Anglo Diamond Investments Limited(5) | 100 | % | Ordinary | 3rd Floor, 44 Esplanade, St Helier, JE4 9WG | |||||
| Jersey | Anglo Iron Ore Investments Limited(5) | 100 | % | Ordinary | 3rd Floor, 44 Esplanade, St Helier, JE4 9WG | |||||
| Jersey | Anglo Operations (International) Limited(5) | 100 | % | Ordinary | 3rd Floor, 44 Esplanade, St Helier, JE4 9WG | |||||
| Jersey | Anglo Peru Investments Limited(5) | 100 | % | Ordinary | 3rd Floor, 44 Esplanade, St Helier, JE4 9WG | |||||
| Jersey | Anglo Quellaveco Limited(5) | 100 | % | Ordinary | 3rd Floor, 44 Esplanade, St Helier, JE4 9WG | |||||
| Jersey | Anglo South American Investments Limited(5) | 100 | % | Ordinary | 3rd Floor, 44 Esplanade, St Helier, JE4 9WG | |||||
| Jersey | Anglo Venezuela Investments Limited(5) | 100 | % | Ordinary | 3rd Floor, 44 Esplanade, St Helier, JE4 9WG | |||||
| Jersey | Aval Holdings Limited(5) | 100 | % | Ordinary | 3rd Floor, 44 Esplanade, St Helier, JE4 9WG | |||||
| Jersey | Cheviot Holdings Limited(5) | 85 | % | Ordinary | 3rd Floor, 44 Esplanade, St Helier, JE4 9WG | |||||
| Jersey | De Beers Centenary Limited(5) | 85 | % | Ordinary | 3rd Floor, 44 Esplanade, St Helier, JE4 9WG | |||||
| Jersey | De Beers Exploration Holdings Limited(5) | 85 | % | Ordinary | 3rd Floor, 44 Esplanade, St Helier, JE4 9WG | |||||
| Jersey | De Beers Holdings Investments Limited(5) | 85 | % | Ordinary | 3rd Floor, 44 Esplanade, St Helier, JE4 9WG | |||||
| Jersey | De Beers Investments plc(5) | 85 | % | Ordinary | 3rd Floor, 44 Esplanade, St Helier, JE4 9WG | |||||
| Jersey | De Beers plc(5) | 85 | % | A Ordinary B Ordinary |
3rd Floor, 44 Esplanade, St Helier, JE4 9WG | |||||
| Jersey | Highbirch Limited(5) | 100 | % | Class A Class B |
3rd Floor, 44 Esplanade, St Helier, JE4 9WG | |||||
| Jersey | Kumba International Trading Limited(5) | 53 | % | Ordinary | 3rd Floor, 44 Esplanade, St Helier, JE4 9WG | |||||
| Jersey | Minorco Overseas Holdings Limited(5) | 100 | % | Ordinary | 3rd Floor, 44 Esplanade, St Helier, JE4 9WG | |||||
| Jersey | Minorco Peru Holdings Limited(5) | 100 | % | Ordinary | 3rd Floor, 44 Esplanade, St Helier, JE4 9WG | |||||
| Jersey | Minpress Investments Limited(5) | 100 | % | Ordinary | 3rd Floor, 44 Esplanade, St Helier, JE4 9WG | |||||
| Jersey | Sirius Minerals Finance Limited(5) | 100 | % | Ordinary Preference |
3rd Floor, 44 Esplanade, St Helier, JE4 9WG | |||||
| Jersey | Sirius Minerals Finance No.2 Limited(5) | 100 | % | Ordinary Preference |
3rd Floor, 44 Esplanade, St Helier, JE4 9WG | |||||
| Luxembourg | Kumba Iron Ore Holdings S.à r.l. | 53 | % | Ordinary | 58 rue Charles Martel, L-2134 | |||||
| Macau | De Beers Jewellers (Macau) Company Limited | 85 | % | Ordinary | Avenida da Praia Grande No. 409, China Law Building 16/F – B79 | |||||
| Madagascar | Societe Civille De Prospection De Nickel A Madagascar | 32 | % | N/A | Unknown | |||||
| Mauritius | Anglo American International Limited(5) | 100 | % | Normal Class A Ordinary Ordinary-B Repurchaseable Class A Ordinary |
C/o AXIS Fiduciary Ltd, 2nd Floor, The AXIS, 26 Bank Street, Cybercity Ebene, 72201 | |||||
| Mexico | Anglo American Mexico S.A. de C.V. | 100 | % | Common | c/o Sanchez Mejorada, Velasco y Ribe, S.C., Paseo de la Reforma No. 450, Col. Lomas de Chapultepec, 11000 | |||||
| 286 | Anglo American plc | Financial statements and other financial information |
| Integrated Annual Report 2023 | Notes to the financial statements |
Group structure
36. Related undertakings of the Group continued
| Country
of incorporation(1)(2) |
Name of undertaking | Percentage of equity owned(3) |
Share class | Registered address | ||||||
| See page 293 for footnotes. | ||||||||||
| Mexico | Servicios Anglo American Mexico S.A. de C.V. | 100 | % | Common | c/o Sanchez Mejorada, Velasco y Ribe, S.C., Paseo de la Reforma No. 450, Col. Lomas de Chapultepec, 11000 | |||||
| Mozambique | Anglo American Corporation Mocambique Servicos Limitada | 100 | % | Quota | PricewaterhouseCoopers, Ltda. Avenida Vladimir Lenine, No 174, 4o andar, Edifício Millennium Park, Maputo | |||||
| Namibia | Ambase Prospecting (Namibia) (Pty) Ltd | 100 | % | Ordinary | c/o SGA, 24 Orban Street, Klein Windhoek, Windhoek | |||||
| Namibia | De Beers Marine Namibia (Pty) Ltd | 43 | % | Ordinary | 4th Floor, Namdeb Centre, 10 Dr Frans Indongo Street, Windhoek | |||||
| Namibia | De Beers Namibia Holdings (Pty) Ltd | 85 | % | Ordinary | 6th floor, Namdeb Centre, 10 Dr Frans Indongo Street, Windhoek | |||||
| Namibia | Debmarine Namdeb Foundation | 43 | % | N/A | 10th Floor, Namdeb Centre, 10 Dr Frans Indongo Street, Windhoek | |||||
| Namibia | DTC Valuations Namibia (Pty) Ltd | 85 | % | Ordinary | 4th Floor, Namdeb Centre, 10 Dr Frans Indongo Street, Windhoek | |||||
| Namibia | Exclusive Properties (Pty) Ltd | 43 | % | Ordinary | 10th Floor, Namdeb Centre, 10 Dr Frans Indongo Street, Windhoek | |||||
| Namibia | Longboat Trading (Pty) Ltd | 100 | % | Ordinary | 24 Orban Street, Klein Windhoek, Windhoek | |||||
| Namibia | Mamora Mines & Estates Limited | 28 | % | Ordinary | 10th Floor, Namdeb Centre, 10 Dr Frans Indongo Street, Windhoek | |||||
| Namibia | Namdeb Diamond Corporation (Pty) Ltd | 43 | % | Ordinary | 10th Floor, Namdeb Centre, 10 Dr Frans Indongo Street, Windhoek | |||||
| Namibia | Namdeb Holdings (Pty) Ltd | 43 | % | Ordinary | 10th Floor, Namdeb Centre, 10 Dr Frans Indongo Street, Windhoek | |||||
| Namibia | Namdeb Properties (Pty) Ltd | 43 | % | Ordinary | 10th Floor, Namdeb Centre, 10 Dr Frans Indongo Street, Windhoek | |||||
| Namibia | Namibia Diamond Trading Company (Pty) Ltd | 43 | % | Ordinary | 9th Floor, Namdeb Centre, 10 Dr Frans Indongo Street, Windhoek | |||||
| Namibia | OMDis Town Transformation Agency | 43 | % | N/A | Unit 6, Gold Street Business Park, Gold Street, Prosperita, Windhoek | |||||
| Namibia | Oranjemund Private Hospital (Proprietary) Limited | 43 | % | Ordinary | 10th Floor, Namdeb Centre, 10 Dr Frans Indongo Street, Windhoek | |||||
| Namibia | Oranjemund Town Management Company (Pty) Ltd | 43 | % | Ordinary | 10th Floor, Namdeb Centre, 10 Dr Frans Indongo Street, Windhoek | |||||
| Namibia | Namdeb Hospital Pharmacy (Pty) Ltd | 43 | % | Ordinary | 10th Floor, Namdeb Centre, 10 Dr Frans Indongo Street, Windhoek | |||||
| Netherlands | Anglo American (TIH) B.V.(5) | 100 | % | Ordinary | 17 Charterhouse Street, London, EC1N 6RA | |||||
| Netherlands | Anglo American Europe B.V.(5) | 100 | % | Ordinary | Kingsfordweg 151, 1043GR, Amsterdam | |||||
| Netherlands | Anglo American Exploration B.V.(5) | 100 | % | Ordinary | 17 Charterhouse Street, London, EC1N 6RA | |||||
| Netherlands | Anglo American Exploration (Philippines) B.V.(5) | 100 | % | Ordinary | 17 Charterhouse Street, London, EC1N 6RA | |||||
| Netherlands | Anglo American International B.V.(5) | 100 | % | Ordinary | 17 Charterhouse Street, London, EC1N 6RA | |||||
| Netherlands | Anglo American Netherlands B.V.(5) | 100 | % | Ordinary | 17 Charterhouse Street, London, EC1N 6RA | |||||
| Netherlands | Anglo Operations (Netherlands) B.V.(5) | 100 | % | Ordinary | 17 Charterhouse Street, London, EC1N 6RA | |||||
| Netherlands | Erabas B.V.(5) | 77 | % | Ordinary | 17 Charterhouse Street, London, EC1N 6RA | |||||
| Netherlands | Loma de Niquel Holdings B.V.(5) | 100 | % | Ordinary | 17 Charterhouse Street, London, EC1N 6RA | |||||
| Netherlands | Minorco Exploration (Indonesia) B.V.(5) | 100 | % | Ordinary | 17 Charterhouse Street, London, EC1N 6RA | |||||
| North Macedonia | Anglo American Exploration West Tetyan Skopje | 100 | % | Ordinary | Str. Risto Ravanovski no. 13A, 1000, Skopje, Municipality of Karpos | |||||
| Papua New Guinea | Anglo American (Star Mountain) Limited | 100 | % | Ordinary | c/o Pacific Legal Group Lawyers, Ground Floor, Iaraguma Haus, Lot 30 Section 38 Off Cameron Road, Gordons, National Capital District | |||||
| Papua New Guinea | Anglo American Exploration (PNG) Limited | 100 | % | Ordinary | c/o Pacific Legal Group Lawyers, Ground Floor, Iaraguma Haus, Lot 30 Section 38 Off Cameron Road, Gordons, National Capital District | |||||
| Peru | Anglo American Marketing Peru S.A. | 100 | % | Ordinary | Calle Esquilache 371, Piso 10, San Isidro, Lima 27 | |||||
| Anglo American plc | Financial statements and other financial information | 287 |
| Integrated Annual Report 2023 | Notes to the financial statements |
Group structure
36. Related undertakings of the Group continued
| Country
of incorporation(1)(2) |
Name of undertaking | Percentage of equity owned(3) |
Share class | Registered address | ||||||
| See page 293 for footnotes. | ||||||||||
| Peru | Anglo American Peru S.A. | 100 | % | Ordinary | Calle Esquilache 371, Piso 10, San Isidro, Lima 27 | |||||
| Peru | Anglo American Quellaveco S.A. | 60 | % | Class A Ordinary Class B Non-Voting |
Calle Esquilache 371, Piso 10, San Isidro, Lima 27 | |||||
| Peru | Anglo American Servicios Perú S.A. en Liquidación | 100 | % | Ordinary | Calle Esquilache 371, Piso 10, San Isidro, Lima 27 | |||||
| Peru | Asociación Quellaveco | 100 | % | N/A | Calle Esquilache 371, Piso 10, San Isidro, Lima 27 | |||||
| Peru | Cobre del Norte S.A. | 100 | % | Ordinary | Calle Esquilache 371, Piso 10, San Isidro, Lima 27 | |||||
| Philippines | Anglo American Exploration (Philippines) Inc. | 100 | % | Ordinary | c/o SyCipLaw Center, 105 Paseo de Roxas, Makati City 1226, Metro Manila | |||||
| Sierra Leone | Gemfair (SL) Limited | 85 | % | Ordinary | 31 Lightfoot Boston Street, Freetown | |||||
| Singapore | Anglo American Crop Nutrients (Singapore) Pte Ltd | 100 | % | Ordinary | 9 Raffles Place, #26-01 Republic Plaza, 048619 | |||||
| Singapore | Anglo American Shipping Pte. Limited | 100 | % | Ordinary | 10 Collyer Quay, #38-00 Ocean Financial Centre, 049315 | |||||
| Singapore | De Beers Auction Sales Singapore Pte. Ltd. | 85 | % | Ordinary | 10 Collyer Quay, #03-04 Ocean Financial Centre, 049315 | |||||
| Singapore | Kumba Singapore Pte. Ltd. | 53 | % | Ordinary | 10 Collyer Quay, #38-00 Ocean Financial Centre, 049315 | |||||
| Singapore | MR Iron Ore Marketing Services Pte. Ltd. | 50 | % | Ordinary | 10 Collyer Quay, #38-00 Ocean Financial Centre, 049315 | |||||
| Singapore | Samancor Marketing Pte.Ltd. | 40 | % | Ordinary | 16 Collyer Quay #18-00 Collyer Quay Centre, 049318 | |||||
| Singapore | Sulista Forte Pte. Ltd. | 100 | % | Ordinary | 77 Robinson Road, #13-00 Robinson 77 Singapore 068896 | |||||
| South Africa | African Pipe Industries North (Pty) Ltd | 40 | % | Ordinary | 144 Oxford Road, Rosebank, Melrose 2196, Johannesburg | |||||
| South Africa | Amandelbult Solar Pv (Pty) Ltd | 100 | % | Ordinary | 144 Oxford Road, Rosebank, Melrose 2196, Johannesburg | |||||
| South Africa | Amaprop Townships Ltd | 100 | % | Ordinary | 61 Katherine Street, Sandton, 2196 | |||||
| South Africa | Ambase Investment Africa (Botswana) (Pty) Ltd | 100 | % | Ordinary | 144 Oxford Road, Rosebank, Melrose 2196, Johannesburg | |||||
| South Africa | Ambase Investment Africa (DRC) (Pty) Ltd | 100 | % | Ordinary | 144 Oxford Road, Rosebank, Melrose 2196, Johannesburg | |||||
| South Africa | Ambase Investment Africa (Tanzania) (Pty) Ltd | 100 | % | Ordinary | 144 Oxford Road, Rosebank, Melrose 2196, Johannesburg | |||||
| South Africa | Ambase Investment Africa (Zambia) (Pty) Ltd | 100 | % | Ordinary | 144 Oxford Road, Rosebank, Melrose 2196, Johannesburg | |||||
| South Africa | Anglo American Corporation of South Africa (Pty) Ltd | 100 | % | Ordinary | 144 Oxford Road, Rosebank, Melrose 2196, Johannesburg | |||||
| South Africa | Anglo American EMEA Shared Services (Pty) Ltd | 100 | % | Ordinary | 144 Oxford Road, Rosebank, Melrose 2196, Johannesburg | |||||
| South Africa | Anglo American Farms (Pty) Ltd | 100 | % | Ordinary | Vergelegen Wine Farm, Lourensford Road, Somerset West, 7130 | |||||
| South Africa | Anglo American Farms Investment Holdings (Pty) Ltd | 100 | % | Ordinary | Vergelegen Wine Farm, Lourensford Road, Somerset West, 7130 | |||||
| South Africa | Anglo American Group Employee Shareholder Nominees (Pty) Ltd | 100 | % | Ordinary | 144 Oxford Road, Rosebank, Melrose 2196, Johannesburg | |||||
| South Africa | Anglo American Marketing South Africa (Pty) Ltd | 77 | % | Ordinary | 144 Oxford Road, Rosebank, Melrose 2196, Johannesburg | |||||
| South Africa | Anglo American Platinum Limited | 79 | % | Ordinary | 144 Oxford Road, Rosebank, Melrose 2196, Johannesburg | |||||
| South Africa | Anglo American Properties Ltd | 100 | % | Ordinary | 61 Katherine Street, Sandton, 2196 | |||||
| South Africa | Anglo American Prospecting Services (Pty) Ltd | 100 | % | Ordinary | 55 Marshall Street, Johannesburg, 2001, | |||||
| 288 | Anglo American plc | Financial statements and other financial information |
| Integrated Annual Report 2023 | Notes to the financial statements |
Group structure
36. Related undertakings of the Group continued
| Country
of incorporation(1)(2) |
Name of undertaking | Percentage of equity owned(3) |
Share class | Registered address | ||||||
| See page 293 for footnotes. | ||||||||||
| South Africa | Anglo American SA Finance Proprietary Limited | 100 | % | Ordinary | 144 Oxford Road, Rosebank, Melrose 2196, Johannesburg | |||||
| South Africa | Anglo American SEFA Mining Fund (Pty) Ltd | 50 | % | Ordinary | 144 Oxford Road, Rosebank, Melrose 2196, Johannesburg | |||||
| South Africa | Anglo American South Africa Investments Proprietary Limited | 100 | % | Ordinary Preference |
144 Oxford Road, Rosebank, Melrose 2196, Johannesburg | |||||
| South Africa | Anglo American South Africa Proprietary Limited | 100 | % | Ordinary | 144 Oxford Road, Rosebank, Melrose 2196, Johannesburg | |||||
| South Africa | Anglo American Zimele (Pty) Ltd | 100 | % | Ordinary | 144 Oxford Road, Rosebank, Melrose 2196, Johannesburg | |||||
| South Africa | Anglo American Zimele Loan Fund (Pty) Ltd | 100 | % | Ordinary | 144 Oxford Road, Rosebank, Melrose 2196, Johannesburg | |||||
| South Africa | Anglo Coal Investment Africa (Botswana) (Pty) Ltd | 100 | % | Ordinary | 144 Oxford Road, Rosebank, Melrose 2196, Johannesburg | |||||
| South Africa | Anglo Corporate Enterprises (Pty) Ltd | 100 | % | Ordinary | 144 Oxford Road, Rosebank, Melrose 2196, Johannesburg | |||||
| South Africa | Anglo Corporate Services South Africa Proprietary Limited | 100 | % | Ordinary | 144 Oxford Road, Rosebank, Melrose 2196, Johannesburg | |||||
| South Africa | Anglo Platinum Management Services (Pty) Ltd | 77 | % | Ordinary | 144 Oxford Road, Rosebank, Melrose 2196, Johannesburg | |||||
| South Africa | Anglo South Africa (Pty) Ltd | 100 | % | Ordinary Redeemable Preference |
144 Oxford Road, Rosebank, Melrose 2196, Johannesburg | |||||
| South Africa | Anglo South Africa Capital (Pty) Ltd | 100 | % | Ordinary Redeemable Preference |
144 Oxford Road, Rosebank, Melrose 2196, Johannesburg | |||||
| South Africa | Atomatic Trading (Pty) Limited | 57 | % | Ordinary | 144 Oxford Road, Rosebank, Melrose 2196, Johannesburg | |||||
| South Africa | Balgo Nominees (Pty) Ltd | 100 | % | Ordinary | 144 Oxford Road, Rosebank, Melrose 2196, Johannesburg | |||||
| South Africa | Blinkwater Farms 244KR (Pty) Ltd | 77 | % | Ordinary | 144 Oxford Road, Rosebank, Melrose 2196, Johannesburg | |||||
| South Africa | Damelin Emalahleni (Pty) Ltd | 20 | % | Ordinary | Cnr OR Tambo & Beatrix Avenue, Witbank, 1035 | |||||
| South Africa | DBCM Holdings (Pty) Ltd | 63 | % | Ordinary Redeemable Preference |
36 Stockdale Street, Kimberley, 8301 | |||||
| South Africa | De Beers Consolidated Mines (Pty) Ltd(8) | 63 | % | Ordinary Redeemable Preference |
36 Stockdale Street, Kimberley, 8301 | |||||
| South Africa | De Beers Group Services (Pty) Ltd | 85 | % | Ordinary Redeemable Preference |
144 Oxford Road, Rosebank, Melrose 2196, Johannesburg | |||||
| South Africa | De Beers Marine (Pty) Ltd | 85 | % | Ordinary | DMB Gardens Golf Park, 2 Raapenberg Road, Cape Town, Western Cape, 7405 | |||||
| South Africa | Dido Nominees (Pty) Ltd | 100 | % | Ordinary | 144 Oxford Road, Rosebank, Melrose 2196, Johannesburg | |||||
| South Africa | Dingleton Home Owners Resettlement Trust | 53 | % | N/A | 144 Oxford Road, Rosebank, Melrose 2196, Johannesburg | |||||
| South Africa | Element Six (Production) Proprietary Limited | 51 | % | Ordinary | Debid Road, Nuffield, Springs, 1559 | |||||
| South Africa | Envusa Energy Proprietary Limited | 50 | % | Ordinary | 144 Oxford Road, Rosebank, Melrose 2196, Johannesburg | |||||
| South Africa | First Mode SA (Pty) Ltd | 81 | % | Ordinary No Par Value |
144 Oxford Road, Rosebank, Johannesburg, Gauteng, 2196 | |||||
| South Africa | First Mode SA Holdings (Pty) Ltd | 81 | % | Ordinary No Par Value |
144 Oxford Road, Rosebank, Johannesburg, Gauteng, 2196 | |||||
| Anglo American plc | Financial statements and other financial information | 289 |
| Integrated Annual Report 2023 | Notes to the financial statements |
Group structure
36. Related undertakings of the Group continued
| Country
of incorporation(1)(2) |
Name of undertaking | Percentage of equity owned(3) |
Share class | Registered address | ||||||
| See page 293 for footnotes. | ||||||||||
| South Africa | HMM Rehabilitation Trust Fund | 30 | % | N/A | 6 Hollard Street, Johannesburg, 2001 | |||||
| South Africa | Hotazel Manganese Mines Proprietary Limited | 30 | % | Ordinary Preference |
39 Melrose Boulevard, Melrose Arch, Johannesburg, 2076 | |||||
| South Africa | Khongoni Haaskraal Coal (Pty) Ltd | 20 | % | Ordinary | Unit 3, Bauhinia Street, Highveld Technopark, Centurion, 0157 | |||||
| South Africa | KIO Investments Holdings (Pty) Ltd | 70 | % | Ordinary | 144 Oxford Road, Rosebank, Melrose 2196, Johannesburg | |||||
| South Africa | Kumba BSP Trust | 53 | % | N/A | 144 Oxford Road, Rosebank, Melrose 2196, Johannesburg | |||||
| South Africa | Kumba Iron One Rehabilitation Trust | 70 | % | N/A | 144 Oxford Road, Rosebank, Melrose 2196, Johannesburg | |||||
| South Africa | Kumba Iron Ore Limited | 70 | % | Ordinary | 144 Oxford Road, Rosebank, Melrose 2196, Johannesburg | |||||
| South Africa | Lexshell 49 General Trading (Pty) Ltd | 35 | % | Ordinary | 144 Oxford Road, Rosebank, Melrose 2196, Johannesburg | |||||
| South Africa | Longboat (Pty) Ltd | 100 | % | Ordinary | 144 Oxford Road, Rosebank, Melrose 2196, Johannesburg | |||||
| South Africa | Main Place Holdings Limited | 39 | % | Ordinary | Suite 801, 76 Regent Road, Sea Point, Western Cape 8005 | |||||
| South Africa | Marikana Ferrochrome Limited | 100 | % | Ordinary | 44 Main Street, Johannesburg, 2001 | |||||
| South Africa | Marikana Minerals (Pty) Ltd | 100 | % | Ordinary | 55 Marshall Street, Johannesburg, 2001 | |||||
| South Africa | Matthey Rustenburg Refiners (Pty) Ltd | 77 | % | A Ordinary Shares B Ordinary Shares |
144 Oxford Road, Rosebank, Melrose 2196, Johannesburg | |||||
| South Africa | Metalloys Manganese Smelter Proprietary Limited | 40 | % | Ordinary NPV | 39 Melrose Boulevard, Melrose Arch, Johannesburg, 2076 | |||||
| South Africa | Micawber 146 (Pty) Ltd | 77 | % | Ordinary | 144 Oxford Road, Rosebank, Melrose 2196, Johannesburg | |||||
| South Africa | Modikwa Mining Personnel Services (Pty) Ltd | 38 | % | Ordinary | 29 Impala Road, Chislehurston, Standton, 2196 | |||||
| South Africa | Modikwa Platinum Mine (Pty) Ltd | 38 | % | Ordinary | 16 North Road, Dunkeld Court, Dunkeld West, 2196 | |||||
| South Africa | Mogalakwena Platinum Limited | 77 | % | Ordinary | 144 Oxford Road, Rosebank, Melrose 2196, Johannesburg | |||||
| South Africa | Newshelf 480 (Pty) Ltd | 55 | % | Ordinary | 144 Oxford Road, Rosebank, Melrose 2196, Johannesburg | |||||
| South Africa | Norsand Holdings (Pty) Ltd | 77 | % | Ordinary B Ordinary Non-Cumulative Redeemable Preference |
144 Oxford Road, Rosebank, Melrose 2196, Johannesburg | |||||
| South Africa | Peglerae Hospital (Pty) Ltd | 31 | % | Ordinary | 21 Oxford Manor, Rudd & Chaplin Roads, Illovo, Johannesburg, 2196 | |||||
| South Africa | Platmed (Pty) Ltd | 77 | % | Ordinary | 144 Oxford Road, Rosebank, Melrose 2196, Johannesburg | |||||
| South Africa | Platmed Properties (Pty) Ltd | 77 | % | Ordinary | 144 Oxford Road, Rosebank, Melrose 2196, Johannesburg | |||||
| South Africa | Polokwane Iron Ore Company (Pty) Ltd | 27 | % | Ordinary | 144 Oxford Road, Rosebank, Melrose 2196, Johannesburg | |||||
| South Africa | Precious Metals Refiners Proprietary Limited | 77 | % | Ordinary | 144 Oxford Road, Rosebank, Melrose 2196, Johannesburg | |||||
| South Africa | Pro Enviro (Pty) Ltd | 20 | % | Ordinary | Greenside Colliery, PTN 0ff 331, Blackhills, 1032 | |||||
| South Africa | Resident Nominees (Pty) Ltd | 100 | % | Ordinary | 144 Oxford Road, Rosebank, Melrose 2196, Johannesburg | |||||
| South Africa | Rustenburg Base Metals Refiners Proprietary Limited | 77 | % | Ordinary | 144 Oxford Road, Rosebank, Melrose 2196, Johannesburg | |||||
| 290 | Anglo American plc | Financial statements and other financial information |
| Integrated Annual Report 2023 | Notes to the financial statements |
Group structure
36. Related undertakings of the Group continued
| Country
of incorporation(1)(2) |
Name of undertaking | Percentage of equity owned(3) |
Share class | Registered address | ||||||
| See page 293 for footnotes. | ||||||||||
| South Africa | Rustenburg Platinum Mines Limited | 77 | % | Ordinary | 144 Oxford Road, Rosebank, Melrose 2196, Johannesburg | |||||
| South Africa | Samancor Holdings Proprietary Limited | 40 | % | Ordinary | 39 Melrose Boulevard, Melrose Arch, Johannesburg, 2076 | |||||
| South Africa | Samancor Manganese Proprietary Limited | 40 | % | Ordinary NPV | 39 Melrose Boulevard, Melrose Arch, Johannesburg, 2076 | |||||
| South Africa | Samancor Manganese Rehabilitation Trust | 40 | % | N/A | 6 Hollard Street, Johannesburg, 2001 | |||||
| South Africa | Sheba’s Ridge Platinum (Pty) Ltd | 27 | % | Ordinary | Harrowdene Office Park Building 5, Woodmead, 2128 | |||||
| South Africa | Sibelo Resource Development (Pty) Ltd | 53 | % | Ordinary | 144 Oxford Road, Rosebank, Melrose 2196, Johannesburg | |||||
| South Africa | SIOC Employee Benefit Trust | 53 | % | N/A | 144 Oxford Road, Rosebank, Melrose 2196, Johannesburg | |||||
| South Africa | SIOC Employee Share Ownership Plan Trust | 53 | % | N/A | 144 Oxford Road, Rosebank, Melrose 2196, Johannesburg | |||||
| South Africa | SIOC Solar SPV (Pty) Ltd | 53 | % | Ordinary | 144 Oxford Road, Rosebank, Melrose 2196, Johannesburg | |||||
| South Africa | Sishen Iron Ore Company (Pty) Ltd | 53 | % | Ordinary | 144 Oxford Road, Rosebank, Melrose 2196, Johannesburg | |||||
| South Africa | Spectrem Air Pty Ltd | 93 | % | Ordinary and no par value |
144 Oxford Road, Rosebank, Melrose 2196, Johannesburg | |||||
| South Africa | Tenon Investment Holdings (Pty) Ltd | 100 | % | Ordinary | 144 Oxford Road, Rosebank, Melrose 2196, Johannesburg | |||||
| South Africa | Terra Nominees Proprietary Limited | 40 | % | Ordinary | 39 Melrose Boulevard, Melrose Arch, Johannesburg, 2076 | |||||
| South Africa | The Village of Cullinan (Pty) Ltd | 63 | % | Ordinary | 36 Stockdale Street, Kimberley, 8301 | |||||
| South Africa | The Work Expert (Pty) Ltd | 46 | % | Ordinary | 17 Du Plooy Street, FH Building, Potchefstroom, North West, 2530 | |||||
| South Africa | Venetia Solar Project Pty Ltd | 64 | % | Ordinary | De Beers House, Corner Diamond Drive and Crownwood Road, Theta, Johannesburg, 2013 | |||||
| South Africa | Vergelegen Wine Estate (Pty) Ltd | 100 | % | Ordinary | Vergelegen Wine Farm, Lourensford Road, Somerset West, 7130 | |||||
| South Africa | Vergelegen Wines (Pty) Ltd | 100 | % | Ordinary | Vergelegen Wine Farm, Lourensford Road, Somerset West, 7130 | |||||
| South Africa | Whiskey Creek Management Services (Pty) Ltd | 77 | % | Ordinary | 144 Oxford Road, Rosebank, Melrose 2196, Johannesburg | |||||
| South Africa | WPIC Holdings Pty Ltd | 40 | % | Ordinary | Rosebank Towers, 19 Biermann Ave, Rosebank, Johannesburg, 2196 | |||||
| South Africa | Zero Emissions Hydrogen Solutions (PTY) Ltd | 100 | % | Ordinary | 144 Oxford Road, Rosebank, Melrose 2196, Johannesburg | |||||
| South Africa | Main Street 1252 (Pty) Ltd (RF) | 63 | % | Ordinary | Cornerstone, Corner of Diamond Drive and Crownwood Road, Theta, Johannesburg, 2013 | |||||
| Sweden | Element Six AB | 51 | % | Ordinary | c/o Advokatbyrån Kaiding, Box 385, 931 24 Skellefteå | |||||
| Switzerland | De Beers Centenary AG(5) | 85 | % | Ordinary | c/o Telemarketing, Plus AG, Sonnenplatz 6, 6020, Emmenbrücke | |||||
| Switzerland | PGI SA | 77 | % | Ordinary | Avenue Mon- Repos 24, Case postale 656, CH- 1001 Lausanne | |||||
| Switzerland | Synova S.A. | 28 | % | Ordinary | 13 Route de Genolier, 1266 Duillier | |||||
| Tanzania | Ambase Prospecting (Tanzania) (Pty) Ltd | 100 | % | Ordinary | c/o Mawalla Advocates, Mawalla Road, Mawalla Heritage Park, Plot No. 175/20, Arusha | |||||
| United Arab Emirates | De Beers DMCC | 85 | % | Ordinary | Office 4D, Almas Tower, Jumeirah Lakes Towers, Dubai | |||||
| United Kingdom | Anglo American Australia Investments Limited(9) | 100 | % | Ordinary | 17 Charterhouse Street, London, EC1N 6RA | |||||
| United Kingdom | Anglo American Capital Australia Limited | 100 | % | Ordinary | 17 Charterhouse Street, London, EC1N 6RA | |||||
| Anglo American plc | Financial statements and other financial information | 291 |
| Integrated Annual Report 2023 | Notes to the financial statements |
Group structure
36. Related undertakings of the Group continued
| Country
of incorporation(1)(2) |
Name of undertaking | Percentage of equity owned(3) |
Share class | Registered address | ||||||
| See page 293 for footnotes. | ||||||||||
| United Kingdom | Anglo American Capital plc(9) | 100 | % | Ordinary 3% Cumulative Preference |
17 Charterhouse Street, London, EC1N 6RA | |||||
| United Kingdom | Anglo American CMC Holdings Limited | 100 | % | Ordinary | 17 Charterhouse Street, London, EC1N 6RA | |||||
| United Kingdom | Anglo American Corporate Secretary Limited | 100 | % | Ordinary | 17 Charterhouse Street, London, EC1N 6RA | |||||
| United Kingdom | Anglo American Crop Nutrients Limited | 100 | % | Ordinary | 17 Charterhouse Street, London, EC1N 6RA | |||||
| United Kingdom | Anglo American Diamond Holdings Limited | 100 | % | Ordinary | 17 Charterhouse Street, London, EC1N 6RA | |||||
| United Kingdom | Anglo American Energy Solutions Limited | 100 | % | Ordinary | 17 Charterhouse Street, London, EC1N 6RA | |||||
| United Kingdom | Anglo American Finance (UK) Limited | 100 | % | Ordinary | 17 Charterhouse Street, London, EC1N 6RA | |||||
| United Kingdom | Anglo American Holdings Limited | 100 | % | Ordinary 8% Preference 8.3% Preference B shares |
17 Charterhouse Street, London, EC1N 6RA | |||||
| United Kingdom | Anglo American International Holdings Limited | 100 | % | Ordinary | 17 Charterhouse Street, London, EC1N 6RA | |||||
| United Kingdom | Anglo American Investments (UK) Limited | 100 | % | Ordinary | 17 Charterhouse Street, London, EC1N 6RA | |||||
| United Kingdom | Anglo American Marketing Limited | 100 | % | Ordinary Preference |
17 Charterhouse Street, London, EC1N 6RA | |||||
| United Kingdom | Anglo American Medical Plan Limited | 100 | % | Ordinary | 17 Charterhouse Street, London, EC1N 6RA | |||||
| United Kingdom | Anglo American Medical Plan Trust | 100 | % | N/A | 17 Charterhouse Street, London, EC1N 6RA | |||||
| United Kingdom | Anglo American Prefco Limited(9) | 100 | % | Ordinary Capital Preference Preference |
17 Charterhouse Street, London, EC1N 6RA | |||||
| United Kingdom | Anglo American Rand Capital Limited | 100 | % | Ordinary | 17 Charterhouse Street, London, EC1N 6RA | |||||
| United Kingdom | Anglo American REACH Limited | 100 | % | Ordinary | 17 Charterhouse Street, London, EC1N 6RA | |||||
| United Kingdom | Anglo American Services (UK) Ltd.(9) | 100 | % | Ordinary | 17 Charterhouse Street, London, EC1N 6RA | |||||
| United Kingdom | Anglo American Technical & Sustainability Limited | 100 | % | Ordinary | 17 Charterhouse Street, London, EC1N 6RA | |||||
| United Kingdom | Anglo American Technical & Sustainability Services Ltd | 100 | % | Ordinary | 17 Charterhouse Street, London, EC1N 6RA | |||||
| United Kingdom | Anglo American Woodsmith (Teesside) Limited | 100 | % | Ordinary Non-voting |
17 Charterhouse Street, London, EC1N 6RA | |||||
| United Kingdom | Anglo American Woodsmith Limited | 100 | % | Ordinary B preference Non-voting |
17 Charterhouse Street, London, EC1N 6RA | |||||
| United Kingdom | Anglo Base Metals Marketing Limited | 100 | % | Ordinary | 17 Charterhouse Street, London, EC1N 6RA | |||||
| United Kingdom | Anglo Platinum Marketing Limited | 77 | % | Ordinary | 17 Charterhouse Street, London, EC1N 6RA | |||||
| United Kingdom | Anglo UK Pension Trustee Limited | 100 | % | Ordinary | 17 Charterhouse Street, London, EC1N 6RA | |||||
| United Kingdom | AP Ventures Fund I LP | 39 | % | N/A | 16 Littleworth Lane, Esher, Surrey, KT10 9PF | |||||
| United Kingdom | Birchall Gardens LLP | 50 | % | N/A | Bardon Hall, Copt Oak Road, Markfield, Leicestershire, LE67 9PJ | |||||
| United Kingdom | Charterhouse CAP Limited | 85 | % | Ordinary | 17 Charterhouse Street, London, EC1N 6RA | |||||
| United Kingdom | Curtis Fitch Limited | 21 | % | Ordinary B | Formal House, 60 St George’s Place, Cheltenham, Gloucestershire, GL50 3PN | |||||
| United Kingdom | De Beers Capital Southern Africa Limited | 85 | % | Ordinary | 17 Charterhouse Street, London, EC1N 6RA | |||||
| United Kingdom | De Beers Corporate Secretary Limited | 85 | % | Ordinary | 17 Charterhouse Street, London, EC1N 6RA | |||||
| United Kingdom | De Beers Jewellers Limited | 85 | % | A Ordinary B Ordinary Deferred Share Special Dividend Share |
17 Charterhouse Street, London, EC1N 6RA | |||||
| United Kingdom | De Beers Jewellers Trade Mark Limited | 85 | % | Ordinary | 17 Charterhouse Street, London, EC1N 6RA | |||||
| United Kingdom | De Beers Jewellers UK Limited | 85 | % | Ordinary | 17 Charterhouse Street, London, EC1N 6RA | |||||
| United Kingdom | De Beers UK Limited | 85 | % | Ordinary | 17 Charterhouse Street, London, EC1N 6RA | |||||
| 292 | Anglo American plc | Financial statements and other financial information |
| Integrated Annual Report 2023 | Notes to the financial statements |
Group structure
36. Related undertakings of the Group continued
| Country
of incorporation(1)(2) |
Name of undertaking | Percentage of equity owned(3) |
Share class | Registered address | ||||||
| See page 293 for footnotes. | ||||||||||
| United Kingdom | Debcore Limited | 43 | % | Ordinary-A | 17 Charterhouse Street, London, EC1N 6RA | |||||
| United Kingdom | Ebbsfleet Property Limited | 50 | % | Ordinary | Bardon Hall, Copt Oak Road, Markfield, Leicestershire, LE67 9PJ | |||||
| United Kingdom | Element Six (UK) Limited | 51 | % | Ordinary | Global Innovation Centre, Fermi Avenue, Harwell, Oxford, Didcot, Oxfordshire, OX11 0QR | |||||
| United Kingdom | Element Six Abrasives Holdings Limited | 51 | % | Ordinary Preference |
17 Charterhouse Street, London, EC1N 6RA | |||||
| United Kingdom | Element Six Holdings Limited | 85 | % | Ordinary | 17 Charterhouse Street, London, EC1N 6RA | |||||
| United Kingdom | Element Six Limited | 85 | % | Ordinary | Global Innovation Centre, Fermi Avenue, Harwell, Oxford, Didcot, Oxfordshire, OX11 0QR | |||||
| United Kingdom | Element Six Technologies Limited | 85 | % | Ordinary | Global Innovation Centre, Fermi Avenue, Harwell, Oxford, Didcot, Oxfordshire, OX11 0QR | |||||
| United Kingdom | Ferro Nickel Marketing Limited | 100 | % | Ordinary | 17 Charterhouse Street, London, EC1N 6RA | |||||
| United Kingdom | First Mode IPP Limited | 81 | % | Ordinary | 10 Bloomsbury Way, London, WC1A 2SL | |||||
| United Kingdom | Forevermark Limited | 85 | % | Ordinary | 17 Charterhouse Street, London, EC1N 6RA | |||||
| United Kingdom | Gemfair Limited | 85 | % | Ordinary | 17 Charterhouse Street, London, EC1N 6RA | |||||
| United Kingdom | IIDGR (UK) Limited | 85 | % | Ordinary | 17 Charterhouse Street, London, EC1N 6RA | |||||
| United Kingdom | Lightbox Jewelry Ltd. | 85 | % | Ordinary | 17 Charterhouse Street, London, EC1N 6RA | |||||
| United Kingdom | Rhoanglo Trustees Limited | 100 | % | Ordinary | 17 Charterhouse Street, London, EC1N 6RA | |||||
| United Kingdom | Sach 1 Ltd | 100 | % | Ordinary | 17 Charterhouse Street, London, EC1N 6RA | |||||
| United Kingdom | Sach 2 Ltd | 100 | % | Ordinary Redeemable Preference |
17 Charterhouse Street, London, EC1N 6RA | |||||
| United Kingdom | Security Nominees Limited | 100 | % | Ordinary | 17 Charterhouse Street, London, EC1N 6RA | |||||
| United Kingdom | Sirius Minerals Holdings Limited | 100 | % | Ordinary | 17 Charterhouse Street, London, EC1N 6RA | |||||
| United Kingdom | Swanscombe Development LLP | 50 | % | N/A | Bardon Hall, Copt Oak Road, Markfield, Leicestershire, LE67 9PJ | |||||
| United Kingdom | Tarvos Limited | 30 | % | N/A | Unit 107, 121 Upper Richmond Road, London, England, SW15 2DW | |||||
| United Kingdom | The Diamond Trading Company Limited | 85 | % | Ordinary | 17 Charterhouse Street, London, EC1N 6RA | |||||
| United Kingdom | TRACR Limited | 85 | % | Ordinary | 17 Charterhouse Street, London, EC1N 6RA | |||||
| United Kingdom | York Potash Holdings Limited | 100 | % | Ordinary | 1 More London Place, London, SE1 2AF | |||||
| United Kingdom | York Potash Intermediate Holdings Limited | 100 | % | Ordinary | 1 More London Place, London, SE1 2AF | |||||
| United Kingdom | YPF Limited | 100 | % | Ordinary | 17 Charterhouse Street, London, EC1N 6RA | |||||
| United States of America | Anglo American Crop Nutrients (USA), LLC | 100 | % | Membership interest |
7700 E Arapahoe Road, Suite 220, Centennial Colorado, 80112 | |||||
| United States of America | Anglo American US Holdings Inc. | 100 | % | Common | c/o Corporation Service Company, 251 Little Falls Drive, Wilmington Delaware, 19808 | |||||
| United States of America | De Beers Jewellers US, Inc. | 85 | % | Common | 300 First Stamford Place, Stamford, CT, 06902 | |||||
| United States of America | Element Six Technologies (OR) Corp. | 85 | % | Ordinary | Cogency Global Inc., 850 New Burton Road, Suite 201, Dover, DE 19904 | |||||
| United States of America | Element Six Technologies US Corporation | 85 | % | Ordinary | 3901 Burton Drive, Santa Clara, CA 95054 | |||||
| United States of America | Element Six US Corporation | 51 | % | Common stock | 24900 Pitkin Road, Suite 250, Spring TX 77386 | |||||
| United States of America | First Mode Holdings Inc. | 81 | % | Ordinary | 1209 Orange Street, City of Wilmington, Delaware, 19801 | |||||
| United States of America | Forevermark US Inc. | 85 | % | Common | 300 First Stamford Place, Stamford, CT, 06902 | |||||
| United States of America | Lightbox Jewelry Inc. | 85 | % | Ordinary | Cogency Global Inc., 850 New Burton Road, Suite 201, Dover, DE 19904 | |||||
| Anglo American plc | Financial statements and other financial information | 293 |
| Integrated Annual Report 2023 | Notes to the financial statements |
Group structure
36. Related undertakings of the Group continued
| Country
of incorporation(1)(2) |
Name of undertaking | Percentage of equity owned(3) |
Share class | Registered address | ||||||
| See page 293 for footnotes. | ||||||||||
| United States of America | Platinum Guild International (U.S.A.) Jewelry Inc. | 77 | % | Ordinary | 125 Park Avenue, 25th Floor, New York, New York 10017 | |||||
| United States of America | Synchronous LLC | 81 | % | Membership Units | C/O Corpserve, Inc., 1001 Fourht Avenue, Ste. 4400, Seattle, WA 98154 | |||||
| Venezuela | Minera Loma de Niquel C.A. | 100 | % | Class A | Torre Humboldt, floor 9, office 09-07, Rio Caura Street, Prados del Este. Caracas 1080. | |||||
| Zambia | Anglo Exploration (Zambia) (Pty) Ltd | 100 | % | Ordinary | 11 Katemo Road, Rhodes Park, Lusaka | |||||
| Zimbabwe | Amzim Holdings Limited | 79 | % | Ordinary | 28 Broadlands Road, Emerald Hill, Harare | |||||
| Zimbabwe | Southridge Limited | 79 | % | Ordinary | 28 Broadlands Road, Emerald Hill, Harare | |||||
| Zimbabwe | Unki Mines (Private) Limited | 79 | % | Ordinary | 28 Broadlands Road, Emerald Hill, Harare | |||||
| Zimbabwe | Unki Solar PV (Private) Limited | 79 | % | Ordinary | 28 Broadlands Road, Emerald Hill, Harare | |||||
| (1) | All the companies with an incorporation in the United Kingdom are registered in England and Wales. |
| (2) | The country of tax residence is disclosed where different from the country of incorporation. |
| (3) | All percentages have been rounded. |
| (4) | The interest in Debswana Diamond Company (Pty) Ltd is held indirectly through De Beers and is consolidated on a 19.2% proportionate basis, reflecting economic interest. The Group’s effective interest in Debswana Diamond Company (Pty ) Ltd is 16.3%. |
| (5) | Tax resident in the United Kingdom. |
| (6) | 2% direct holding by Anglo American plc. |
| (7) | 0.03% direct holding by Anglo American plc. |
| (8) | A 74% interest in De Beers Consolidated Mines (Pty) Ltd (DBCM) and its subsidiaries is held indirectly through De Beers. The 74% interest represents De Beers’ legal ownership share in DBCM. For accounting purposes De Beers consolidates 100% of DBCM as it is deemed to control the BEE entity, Ponahalo, which holds the remaining 26%. The Group’s effective interest in DBCM is 85%. |
| (9) | 100% direct holding by Anglo American plc. |
| 294 | Anglo American plc | Financial statements and other financial information |
| Integrated Annual Report 2023 | Notes to the financial statements |
Other items
This section includes disclosures about related party transactions, auditors’ remuneration and accounting policies.
| 37. | Related party transactions |
The Group has related party relationships with its subsidiaries, joint operations, associates and joint ventures (see notes 35 and 36). Members of the Board and the Executive Leadership Team are considered to be related parties.
The Company and its subsidiaries, in the ordinary course of business, enter into various sale, purchase and service transactions with joint operations, associates, joint ventures and others in which the Group has a material interest. These transactions are under terms that are no less favourable to the Group than those arranged with third parties.
| Associates | Joint ventures | Joint operations | ||||||||||||||||||||||
| US$ million | 2023 | 2022 | 2023 | 2022 | 2023 | 2022 | ||||||||||||||||||
| Transactions with related parties | ||||||||||||||||||||||||
| Sale of goods and services | — | — | 3 | 16 | 118 | 181 | ||||||||||||||||||
| Purchase of goods and services | — | — | (204 | ) | (190 | ) | (2,980 | ) | (4,253 | ) | ||||||||||||||
| Balances with related parties | ||||||||||||||||||||||||
| Trade and other receivables from related parties | — | — | 2 | 7 | 18 | 17 | ||||||||||||||||||
| Trade and other payables to related parties | — | — | (18 | ) | (18 | ) | (86 | ) | (250 | ) | ||||||||||||||
| Loans receivable from related parties | 2 | 2 | 163 | 147 | 1 | — | ||||||||||||||||||
Balances and transactions with joint operations or joint operation partners represent the portion that the Group does not have the right to offset against the corresponding amount recorded by the respective joint operations. These amounts primarily relate to purchases by De Beers and Platinum Group Metals from their joint operations in excess of the Group’s attributable share of their production.
Loans receivable from related parties are included in Financial asset investments on the Consolidated balance sheet.
Remuneration and benefits received by directors are disclosed in the Remuneration report. Remuneration and benefits of key management personnel, including directors, are disclosed in note 28. Information relating to pension fund arrangements is disclosed in note 29.
| 38. | Auditors’ remuneration |
| 2023 | 2022 | ||||||||||||||||
| Paid/payable to PwC | Paid/payable to auditor (if not PwC) |
Paid/payable to PwC | Paid/payable to auditor (if not PwC) |
||||||||||||||
| US$ million | United Kingdom |
Overseas | Total | United Kingdom and overseas |
United Kingdom |
Overseas | Total | United Kingdom and overseas |
|||||||||
| Paid to the Company’s auditor for audit of the Anglo American plc Annual Report(1) | 4.9 | 2.7 | 7.6 | — | 6.0 | 1.7 | 7.7 | — | |||||||||
| Paid to the Company’s auditor for other services to the Group | |||||||||||||||||
| Audit of the Company’s subsidiaries | 1.6 | 7.0 | 8.6 | 0.4 | 1.1 | 7.4 | 8.5 | 0.3 | |||||||||
| Total audit fees | 6.5 | 9.7 | 16.2 | 0.4 | 7.1 | 9.1 | 16.2 | 0.3 | |||||||||
| Audit related assurance services | 1.0 | 0.7 | 1.7 | — | 0.9 | 0.8 | 1.7 | — | |||||||||
| Other assurance services | 0.4 | 0.2 | 0.6 | — | 0.4 | 0.1 | 0.5 | — | |||||||||
| Total non-audit fees | 1.4 | 0.9 | 2.3 | — | 1.3 | 0.9 | 2.2 | — | |||||||||
(1) In addition there is $0.6 million of audit fees paid in 2023 related to the audit for the year ended 31 December 2022.
Audit related assurance services includes $1.7 million (2022: $1.7 million) for the interim review.
| Anglo American plc | Financial statements and other financial information | 295 |
| Integrated Annual Report 2023 | Notes to the financial statements |
Other items
| 39. | Accounting policies |
A. Basis of preparation
Basis of preparation
The financial statements have been prepared in accordance with the requirements of the Companies Act 2006, UK-adopted International Accounting Standards and those parts of the Companies Act 2006 applicable to companies reporting under those standards and the requirements of the Disclosure Guidance and Transparency Rules of the Financial Conduct Authority in the United Kingdom as applicable to periodic financial reporting. The financial statements have been prepared under the historical cost convention as modified by the revaluation of pension assets and liabilities and certain financial instruments. A summary of the material Group accounting policies is set out below.
The preparation of financial statements in conformity with generally accepted accounting principles requires the use of estimates and assumptions that affect the reported amounts of assets and liabilities at the date of the financial statements and the reported amounts of revenues and expenses during the reporting period. Although these estimates are based on management’s best knowledge of the amount, event or actions, actual results ultimately may differ from those estimates.
The Group’s results are presented in US dollars, the currency in which its business is primarily conducted.
Changes in accounting policies, estimates and disclosures
The accounting policies applied are consistent with those adopted and disclosed in the Group financial statements for the year ended 31 December 2022 with the exception of new accounting pronouncements, which became effective on 1 January 2023 and have been adopted by the Group. The adoption of these new accounting pronouncements has not had a significant impact on the accounting policies, methods of computation or presentation applied by the Group except for the adoption of the amendment to IAS 12 Income Taxes below.
IAS 12 Income Taxes: Deferred Tax related to Assets and Liabilities arising from a Single Transaction
An amendment to IAS 12 Income Taxes was published in May 2021 and became effective for the Group from 1 January 2023. The amendment narrowed the scope of the deferred tax recognition exemption so that it no longer applies to transactions that, on initial recognition, give rise to equal taxable and deductible temporary differences.
The Group has considered the impact of this amendment, notably in relation to the accounting for deferred taxes on leases and decommissioning and environmental restoration provisions. The impact of transitioning to the revised standard was to increase net deferred tax liabilities and reduce total equity as at 1 January 2022 and 31 December 2022 by $71million ($43 million reducing Retained earnings and $28 million reducing Non-controlling interests).
Going concern
The financial position of the Group, its cash flows, liquidity position and borrowing facilities are set out in the Group financial review on pages 90–93. Further details of our policy on financial risk management are set out in note 25 to the financial statements on pages 261-263. The Group’s net debt (including related hedges) at 31 December 2023 was $10.6 billion (2022: $6.9 billion). During the first half of 2023, the Group issued $2.0 billion of bond debt. In March 2023, the Group issued €500 million 4.5% Senior Notes due 2028, €500 million 5.0% Senior Notes due 2031 and, in May 2023, $900 million 5.5% Senior Notes due 2033. In the second half of 2023, the Group refinanced its $4.7 billion revolving credit facility maturing in March 2025, to a one year $1 billion facility maturing in November 2024, and a $3.7 billion five year facility maturing in November 2028. The Group’s liquidity position (defined as cash and undrawn committed facilities) of $13.2 billion at 31 December 2023 remains strong. Further details of borrowings and facilities are set out in note 22 and note 25 on pages 255 and 261–263 respectively, and net debt is set out in note 21 on page 254.
The directors have considered the Group’s cash flow forecasts for the period to the end of December 2025 under base and downside scenarios, with reference to the Group’s principal risks as set out within the Group viability statement on pages 79–80. In the downside scenario modelled (including pricing and production downsides, alongside a significant operational incident), the Group maintains sufficient liquidity throughout the period of assessment without the use of mitigating actions.
The Board is satisfied that the Group’s forecasts and projections, taking account of reasonably possible changes in trading performance, show that the Group will be able to operate within the level of its current facilities for the period of at least 12 months from the date of approval of the financial statements. For this reason the Group continues to adopt the going concern basis in preparing its financial statements.
New IFRS accounting standards, amendments and interpretations not yet adopted
The Group has not early adopted any other amendment, standard or interpretation that has been issued but is not yet effective. It is expected that where applicable, these standards and amendments will be adopted on each respective effective date. The following new or amended IFRS accounting standards, amendments and interpretations not yet adopted are not expected to have a significant impact on the Group:
| – | Amendments to IAS 1 Presentation of financial statements: non-current liabilities with covenants |
| – | Amendments to IFRS 16 Leases: Lease Liability in a Sale and Leaseback |
| – | Amendments to IAS 7 and IFRS 7, Supplier finance-disclosure requirements |
B. Basis of consolidation
Basis of consolidation
The financial statements incorporate a consolidation of the financial statements of the Company and entities controlled by the Company (its subsidiaries). Control is achieved where the Company is exposed, or has rights, to variable returns from its involvement with the investee and has the ability to affect those returns through its power over the investee.
The results of subsidiaries acquired or disposed of during the year are included in the income statement from the effective date of acquisition or up to the effective date of disposal, as appropriate.
Where necessary, adjustments are made to the results of subsidiaries, joint arrangements and associates to bring their accounting policies into line with those used by the Group. Intra-group transactions, balances, income and expenses are eliminated on consolidation, where appropriate.
| 296 | Anglo American plc | Financial statements and other financial information |
| Integrated Annual Report 2023 | Notes to the financial statements |
Other items
| 39. | Accounting policies continued |
For non-wholly owned subsidiaries, non-controlling interests are presented in equity separately from the equity attributable to shareholders of the Company. Profit or loss and other comprehensive income are attributed to the shareholders of the Company and to non-controlling interests even if this results in the non-controlling interests having a deficit balance.
Changes in ownership interest in subsidiaries that do not result in a change in control are accounted for in equity. The carrying amounts of the controlling and non-controlling interests are adjusted to reflect the changes in their relative interests in the subsidiary. Any difference between the amount by which the non-controlling interest is adjusted and the fair value of the consideration paid or received is recorded directly in equity and attributed to the shareholders of the Company.
Foreign currency transactions and translation
Foreign currency transactions by Group companies are recognised in the functional currencies of the companies at the exchange rate ruling on the date of the transaction. At each reporting date, monetary assets and liabilities that are denominated in foreign currencies are retranslated at the rates prevailing on the reporting date. Gains and losses arising on retranslation are included in the income statement for the period and are classified in the income statement according to the nature of the monetary item giving rise to them.
Non-monetary assets and liabilities that are measured at historical cost in a foreign currency are translated using the exchange rate at the date of the transaction.
On consolidation, the assets and liabilities of the Group’s foreign operations are translated into the presentation currency of the Group at exchange rates prevailing on the reporting date. Income and expense items are translated at the average exchange rates for the period where these approximate the rates at the dates of the transactions. Any exchange differences arising are classified within the statement of comprehensive income and transferred to the Group’s cumulative translation adjustment reserve. Exchange differences on foreign currency balances with foreign operations for which settlement is neither planned nor likely to occur in the foreseeable future, and therefore form part of the Group’s net investment in these foreign operations, are offset in the cumulative translation adjustment reserve.
Cumulative translation differences are recycled from equity and recognised as income or expense on disposal of the operation to which they relate.
Goodwill and fair value adjustments arising on the acquisition of foreign entities are treated as assets of the foreign entity and translated at the closing rate.
Tenon
Tenon Investment Holdings Proprietary Limited (Tenon), a wholly owned subsidiary of Anglo American South Africa Proprietary Limited (AASA), has entered into agreements with Epoch Investment Holdings (RF) Proprietary Limited (Epoch), Epoch Two Investment Holdings (RF) Proprietary Limited (Epoch Two) and Tarl Investment Holdings (RF) Proprietary Limited (Tarl) (collectively the Investment Companies), each owned by independent charitable trusts whose trustees are independent of the Group. Under the terms of these agreements, the Investment Companies have purchased Anglo American plc shares on the market and have granted to Tenon the right to nominate a third party (which may include Anglo American plc but not any of its subsidiaries) to take transfer of the Anglo American plc shares each has purchased on the market. Tenon paid the Investment Companies 80% of the cost of the Anglo American plc shares including associated costs for this right to nominate, which together with subscriptions by Tenon for non-voting participating redeemable preference shares in the Investment Companies, provided all the funding required to acquire the Anglo American plc shares through the market. These payments by Tenon were sourced from the cash resources of AASA. Tenon is able to exercise its right of nomination at any time up to 31 December 2025 against payment of an average amount of $2.93 per share to Epoch, $4.56 per share to Epoch Two and $3.78 per share to Tarl which will be equal to 20% of the total costs respectively incurred by Epoch, Epoch Two and Tarl in purchasing shares nominated for transfer to the third party. These funds will then become available for redemption of the preference shares issued by the Investment Companies. The amount payable by the third party on receipt of the Anglo American plc shares will accrue to Tenon and, as these are own shares of the Company, any resulting gain or loss recorded by Tenon will not be recognised in the Consolidated income statement of Anglo American plc.
Under the agreements, the Investment Companies will receive dividends on the shares they hold and have agreed to waive the right to vote on those shares. The preference shares issued to the charitable trusts are entitled to a participating right of up to 10% of the profit after tax of Epoch and 5% of the profit after tax of Epoch Two and Tarl. The preference shares issued to Tenon will carry a fixed coupon of 3% plus a participating right of up to 80% of the profit after tax of Epoch and 85% of the profit after tax of Epoch Two and Tarl. Any remaining distributable earnings in the Investment Companies, after the above dividends, are then available for distribution as ordinary dividends to the charitable trusts.
The structure effectively provides Tenon with a beneficial interest in the price risk on these shares together with participation in future dividend receipts. The Investment Companies will retain legal title to the shares until Tenon exercises its right to nominate a transferee.
At 31 December 2023 the Investment Companies together held 112,300,129 (2022: 112,300,129) Anglo American plc shares, which represented 8.4% (2022: 8.4%) of the ordinary shares in issue (excluding treasury shares) with a market value of $2,818 million (2022: $4,400 million). The Investment Companies are not permitted to hold more than an aggregate of 10% of the issued share capital of Anglo American plc at any one time.
The Investment Companies are considered to be structured entities. Although the Group has no voting rights in the Investment Companies and cannot appoint or remove trustees of the charitable trusts, the Group considers that the agreement outlined above, including Tenon’s right to nominate the transferee of the Anglo American plc shares held by the Investment Companies, results in the Group having control over the Investment Companies as defined under IFRS 10 Consolidated Financial Statements. Accordingly, the Investment Companies are required to be consolidated by the Group.
C. Financial performance
Revenue recognition
Revenue from contracts with customers
Revenue from contracts with customers is recognised in a manner that depicts the pattern of the transfer of goods and services to customers. The amount recognised reflects the amount to which the Group expects to be entitled in exchange for those goods and services. Sales contracts are evaluated to determine the performance obligations, the transaction price and the point at which there is transfer of control. The transaction price is the amount of consideration due in exchange for transferring the promised goods or services to the customer, and is allocated against the performance obligations and recognised in accordance with whether control is transferred over a defined period or at a specific point in time.
Revenue is derived principally from commodity sales. A sale is recognised when control has been transferred. This is usually when title and insurance risk have passed to the customer and the goods have been delivered to a contractually agreed location. Revenue from contracts with customers is measured at the fair value of consideration received or receivable as at the date control is transferred, after deducting discounts, volume rebates, value added tax and other sales taxes. Some sales are provisionally priced such that the price is not settled until a predetermined future date and is based on the market price at that time or a specified period to that date. For these sales, revenue from contracts with customers is recognised on the date control is transferred to the customer using the relevant forward price at that date. Sales of metal concentrate are stated at their invoiced amount which is net of treatment and refining charges.
| Anglo American plc | Financial statements and other financial information | 297 |
| Integrated Annual Report 2023 | Notes to the financial statements |
Other items
| 39. | Accounting policies continued |
Revenues from the sale of material by-products are recognised within revenue from contracts with customers at the point control passes. Where a by-product is not regarded as significant, revenue may be credited against operating costs.
Revenue from services is recognised over time in line with the policy above. For contracts which contain separate performance obligations for the sale of commodities and the provision of freight services, the portion of the revenue representing the obligation to perform the freight service is deferred and recognised over time as the obligation is fulfilled. In situations where the Group is acting as an agent, amounts billed to customers are offset against the relevant costs.
Revenue from other sources
Revenue from other sources principally relates to gains and losses on financial instruments which are intrinsically linked to the delivery of commodities to customers or to the Group’s commodity trading activities.
Sales of commodities which are provisionally priced are marked to market at each reporting date using the forward price for the period equivalent to that outlined in the contract. Mark-to-market adjustments arising after control of the goods transfers to the customer are recognised in revenue from other sources.
Physically-settled contracts relating to the purchase and sale of material produced by third parties (third-party sales) are presented on a net basis within revenue from other sources where these contracts are entered into and managed collectively to generate a trading margin as part of the Group’s Marketing business and are accounted for as derivatives prior to settlement. This includes third-party material purchased for blending activities conducted to benefit from short term pricing differentials (usually of less than twelve months). The sale and purchase of third-party material to mitigate shortfalls in the Group’s own production are shown on a gross basis with sales reported within revenue from contracts with customers as such contracts are used to maintain customer relationships and fulfil physical sale commitments rather than to generate a trading margin.
Revenue from other sources also includes fair value gains and losses arising from mark-to-market adjustments to inventory purchased from third parties as part of trading activities and accounted for at fair value less costs to sell under the broker-trader exemption of IAS 2 Inventories.
Contracts with a right to repurchase
Where the Group enters into commodity sale or purchase agreements in the course of its commodity trading activities in which the seller has a right to repurchase, consideration is given to whether the risks and rewards of ownership have been transferred as a result of the sale. This assessment is made with reference to the criteria in IFRS 9 Financial Instruments. Key considerations in this assessment include whether the purchaser has a practical ability to use the commodity and whether price risk has been transferred.
Where risks and rewards have been transferred, the sale or purchase contract is accounted for separately from the repurchase obligation (which is recorded as a derivative financial instrument). Where risks and rewards have not been transferred or the arrangements do not relate to the Group’s commodity trading activities, any consideration received or paid is recorded as a liability or asset as appropriate and no adjustment is made to revenue or inventory.
Interest income
Interest income is accrued on a time basis, by reference to the principal outstanding and at the effective interest rate applicable.
Dividend income
Dividend income from investments is recognised when the shareholders’ rights to receive payment have been established.
Exploration and evaluation expenditure
Exploration and evaluation expenditure is expensed in the year in which it is incurred.
Exploration expenditure is the cost of exploring for Mineral Resources other than that occurring at existing operations and projects and comprises geological and geophysical studies, exploratory drilling and sampling and Mineral Resource development.
Evaluation expenditure includes the cost of conceptual and pre-feasibility studies and evaluation of Mineral Resources at existing operations.
When a decision is taken that a mining project is technically feasible and commercially viable, usually after a pre-feasibility study has been completed, subsequent directly attributable expenditure, including feasibility study costs, are considered development expenditure and are capitalised within property, plant and equipment.
Exploration properties acquired are recognised on the balance sheet when management considers that their value is recoverable. These properties are measured at cost less any accumulated impairment losses.
Short term and low value leases
Leases with a term of less than 12 months or those with committed payments of less than $5,000 are not recognised in the balance sheet. The Group recognises payments for these leases as an expense on a straight-line basis over the lease term within operating costs in underlying EBITDA.
Borrowing costs
Interest on borrowings directly relating to the financing of qualifying assets in the course of construction is added to the capitalised cost of those projects under ‘Capital works in progress’, until such time as the assets are substantially ready for their intended use or sale.
Where funds have been borrowed specifically to finance a project, the amount capitalised represents the actual borrowing costs incurred. Where the funds used to finance a project form part of general borrowings, the amount capitalised is calculated using a weighted average of rates applicable to relevant general borrowings of the Group during the period. All other borrowing costs are recognised in the income statement in the period in which they are incurred.
All cash flows relating to interest on borrowings are presented within interest paid in the cash flow statement.
D. Capital base
Business combinations and goodwill arising thereon
The identifiable assets, liabilities and contingent liabilities of a subsidiary, a joint arrangement or an associate, which can be measured reliably, are recorded at their provisional fair values at the date of acquisition. The estimation of the fair value of identifiable assets and liabilities is subjective and the use of different valuation assumptions could have a significant impact on financial results. Goodwill is the fair value of the consideration transferred (including contingent consideration and previously held non-controlling interests) less the fair value of the Group’s share of identifiable net assets on acquisition.
Where a business combination is achieved in stages, the Group’s previously held interests in the acquiree are remeasured to fair value at the acquisition date and the resulting gain or loss is recognised in the income statement.
| 298 | Anglo American plc | Financial statements and other financial information |
| Integrated Annual Report 2023 | Notes to the financial statements |
Other items
| 39. | Accounting policies continued |
Amounts arising from interests in the acquiree prior to the acquisition date that have previously been recognised in other comprehensive income are reclassified to the income statement, where such treatment would be appropriate if that interest were disposed of.
Transaction costs incurred in connection with the business combination are expensed. Provisional fair values are finalised within 12 months of the acquisition date.
Goodwill in respect of subsidiaries and joint operations is included within intangible assets. Goodwill relating to associates and joint ventures is included within the carrying value of the investment.
Where the fair value of the identifiable net assets acquired exceeds the cost of the acquisition, the surplus, which represents the discount on the acquisition, is recognised directly in the income statement in the period of acquisition.
For non-wholly owned subsidiaries, non-controlling interests are initially recorded at the non-controlling interests’ proportion of the fair values of net assets recognised at acquisition.
Impairment of goodwill, intangible assets and property, plant and equipment
Goodwill arising on business combinations is allocated to the group of cash generating units (CGUs) that is expected to benefit from synergies of the combination, and represents the lowest level at which goodwill is monitored by the Group’s Board of directors for internal management purposes. The recoverable amount of the CGU, or group of CGUs, to which goodwill has been allocated is tested for impairment annually, or when events or changes in circumstances indicate that it may be impaired.
Any impairment loss is recognised immediately in the income statement. Impairment of goodwill is not subsequently reversed.
At each reporting date, the Group reviews the carrying amounts of its property, plant and equipment and intangible assets to determine whether there is any indication that those assets are impaired. If such an indication exists, the recoverable amount of the asset is estimated in order to determine the extent of any impairment. Where the asset does not generate cash flows that are independent from other assets, the Group estimates the recoverable amount of the CGU to which the asset belongs. An intangible asset with an indefinite useful life is tested for impairment annually and whenever there is an indication that the asset may be impaired.
Recoverable amount is the higher of fair value less costs of disposal and value in use (VIU) assessed using discounted cash flow models, as explained in note 7. In assessing VIU, the estimated future cash flows are discounted to their present value using a pre-tax discount rate that reflects current market assessments of the time value of money and the risks specific to the asset for which estimates of future cash flows have not been adjusted.
If the recoverable amount of an asset or CGU is estimated to be less than its carrying amount, the carrying amount of the asset or CGU is reduced to its recoverable amount. An impairment loss is recognised in the income statement.
Where an impairment loss is subsequently reversed, the carrying amount of the asset or CGU is increased to the revised estimate of its recoverable amount, to the extent that the increased carrying amount does not exceed the carrying amount that would have been determined had no impairment been recognised for the asset or CGU.
A reversal of an impairment loss is recognised in the income statement.
In addition, in making assessments for impairment, management necessarily applies its judgement in allocating assets, including goodwill, that do not generate independent cash inflows to appropriate CGUs.
Subsequent changes to the CGU allocation, timing of cash flows or assumptions used to determine the cash flows could impact the carrying value of the respective assets.
Non-mining licences and other intangible assets
Non-mining licences and other intangible assets are measured at cost less accumulated amortisation and accumulated impairment losses. Intangible assets acquired as part of an acquisition of a business are capitalised separately from goodwill if the asset is separable or arises from contractual or legal rights and the fair value can be measured reliably on initial recognition. Intangible assets are amortised over their estimated useful lives, usually between 3 and 20 years, except goodwill and those intangible assets that are considered to have indefinite lives. For intangible assets with a finite life, the amortisation period is determined as the period over which the Group expects to obtain economic benefits from the asset, taking account of all relevant facts and circumstances including contractual lives and expectations about the renewal of contractual arrangements without significant incremental costs. An intangible asset is deemed to have an indefinite life when, based on an analysis of all of the relevant factors, there is no foreseeable limit to the period over which the asset is expected to generate cash flows for the Group. Indefinite lived intangible assets are principally brands for which there is global recognition with no foreseeable timeframe of expected contribution that the Group is continuing to invest and actively market. Amortisation methods, residual values and estimated useful lives are reviewed at least annually.
Deferred stripping
The removal of rock or soil overlying a mineral deposit, overburden and other waste materials is often necessary during the initial development of an open pit mine site, in order to access the orebody. The process of removing overburden and other mine waste materials is referred to as stripping. The directly attributable cost of this activity is capitalised in full within ‘Mining properties – owned’, until the point at which the mine is considered to be capable of operating in the manner intended by management. This is classified as growth or life-extension capital expenditure, within investing cash flows.
The removal of waste material after the point at which depreciation commences is referred to as production stripping. When the waste removal activity improves access to ore extracted in the current period, the costs of production stripping are charged to the income statement as operating costs in accordance with the principles of IAS 2 Inventories.
Where production stripping activity both produces inventory and improves access to ore in future periods the associated costs of waste removal are allocated between the two elements. The portion that benefits future ore extraction is capitalised within ‘Mining properties – owned’. This is classified as stripping and development capital expenditure, within investing cash flows. If the amount to be capitalised cannot be specifically identified, it is determined based on the volume of waste extracted compared with expected volume for the identified component of the orebody. This determination is dependent on an individual mine’s design and Life of Asset Plan and therefore changes to the design or Life of Asset Plan will result in changes to these estimates. Identification of the components of a mine’s orebody is made by reference to the Life of Asset Plan. The assessment depends on a range of factors including each mine’s specific operational features and materiality.
In certain instances, significant levels of waste removal may occur during the production phase with little or no associated production. This may occur at both open pit and underground mines, for example longwall development.
The cost of this waste removal is capitalised in full to ‘Mining properties – owned’.
| Anglo American plc | Financial statements and other financial information | 299 |
| Integrated Annual Report 2023 | Notes to the financial statements |
Other items
| 39. | Accounting policies continued |
All amounts capitalised in respect of waste removal are depreciated using the unit of production method for the component of the orebody to which they relate, consistent with depreciation of property, plant and equipment.
The effects of changes to the Life of Asset Plan on the expected cost of waste removal or remaining Ore Reserves for a component are accounted for prospectively as a change in estimate.
Property, plant and equipment
Property, plant and equipment is stated at cost, less accumulated depreciation and accumulated impairment losses. Cost is the fair value of consideration required to acquire and develop the asset and includes the purchase price, acquisition of mineral rights, costs directly attributable to bringing the asset to the location and condition necessary for it to be capable of operating in the manner intended by management, the initial estimate of any decommissioning obligation and, for assets that take a substantial period of time to get ready for their intended use, borrowing costs. Revenue and costs arising from assets before they are capable of operating in the manner intended by management are recognised in the income statement.
Gains or losses on disposal of property, plant and equipment are determined by comparing the net proceeds from disposal with the carrying amount. The gain or loss is recognised in the income statement.
Depreciation of property, plant and equipment
Mining properties are depreciated to their residual values using the unit of production method based on Proved and Probable Ore Reserves and, in certain limited circumstances, other Mineral Resources included in the Life of Asset Plan. These other Mineral Resources are included in depreciation calculations where, taking into account historical rates of conversion to Ore Reserves, there is a high degree of confidence that they will be extracted in an economic manner. This is the case principally for diamond operations, where depreciation calculations are based on Diamond Reserves and Diamond Resources included in the Life of Asset Plan. This reflects the unique nature of diamond deposits where, due to the difficulty in estimating grade, Life of Asset Plans frequently include significant amounts of Inferred Resources.
Buildings and items of plant and equipment for which the consumption of economic benefit is linked primarily to utilisation or to throughput rather than production, are depreciated to their residual values at varying rates on a straight-line basis over their estimated useful lives, or the Reserve Life, whichever is shorter. Estimated useful lives normally vary from up to 20 years for items of plant and equipment to a maximum of 50 years for buildings. Under limited circumstances, items of plant and equipment may be depreciated over a period that exceeds the Reserve Life by taking into account additional Mineral Resources other than Proved and Probable Reserves included in the Life of Asset Plan, after making allowance for expected production losses based on historical rates of Mineral Resource to Ore Reserve conversion.
‘Capital works in progress’ are measured at cost less any recognised impairment. Depreciation commences when the assets are capable of operating in the manner intended by management, at which point they are transferred to the appropriate asset class.
Land is not depreciated.
When parts of an item of property, plant and equipment have different useful lives, they are accounted for as separate items (major components).
Depreciation methods, residual values and estimated useful lives are reviewed at least annually.
Leased right-of-use assets
Leased right-of-use assets are included within property, plant and equipment, and on inception of the lease are recognised at the amount of the corresponding lease liability, adjusted for any lease payments made at or before the lease commencement date, plus any direct costs incurred and an estimate of costs for dismantling, removing, or restoring the underlying asset and less any lease incentives received.
The right-of-use asset is depreciated on a straight-line basis over the term of the lease, or, if shorter, the useful life of the asset. The useful lives of right-of-use assets are estimated on the same basis as those of owned property, plant and equipment.
Financial assets
Investments, other than investments in subsidiaries, joint arrangements and associates, are financial asset investments and are initially recognised at fair value. The Group’s financial assets are classified into the following measurement categories: debt instruments at amortised cost, equity instruments and debt instruments designated at fair value through other comprehensive income (OCI), and debt instruments, derivatives and equity instruments at fair value through profit and loss. Financial assets are classified as at amortised cost only if the asset is held within a business model whose objective is to collect the contractual cash flows and the contractual terms of the asset give rise to cash flows that are solely payments of principal and interest.
At subsequent reporting dates, financial assets at amortised cost are measured at amortised cost less any impairment losses. Other investments are classified as either at fair value through profit or loss (which includes investments held for trading) or at fair value through OCI. Both categories are subsequently measured at fair value. Where investments are held for trading purposes, unrealised gains and losses for the period are included in the income statement within other gains and losses.
The Group has elected to measure equity instruments, which are neither held for trading nor are contingent consideration in a business combination, at fair value through OCI as this better reflects the strategic nature of the Group’s equity investments. For equity instruments at fair value through OCI, changes in fair value, including those related to foreign exchange, are recognised in other comprehensive income and there is no subsequent reclassification of fair value gains and losses to profit or loss.
Impairment of financial assets
A financial asset not measured at fair value through profit or loss is assessed at each reporting date to determine whether there is any objective evidence that it is impaired. The Group assesses on a forward-looking basis the expected credit losses, defined as the difference between the contractual cash flows and the cash flows that are expected to be received, associated with its assets carried at amortised cost and fair value through OCI. The impairment methodology applied depends on whether there has been a significant increase in credit risk. For trade receivables only, the simplified approach permitted by IFRS 9 is applied, which requires expected lifetime losses to be recognised from initial recognition of the receivables.
Losses are recognised in the income statement. When a subsequent event causes the amount of impairment loss to decrease, the decrease in impairment loss is reversed through the income statement.
Impairment losses relating to equity instruments at fair value through OCI are not reported separately from other changes in fair value.
Derecognition of financial assets and financial liabilities
Financial assets are derecognised when the right to receive cash flows from the asset has expired, the right to receive cash flows has been retained but an obligation to on-pay them in full without material delay has been assumed or the right to receive cash flows has been transferred together with substantially all the risks and rewards of ownership.
| 300 | Anglo American plc | Financial statements and other financial information |
| Integrated Annual Report 2023 | Notes to the financial statements |
Other items
| 39. | Accounting policies continued |
Financial liabilities are derecognised when the associated obligation has been discharged, cancelled or has expired.
Environmental restoration and decommissioning obligations
An obligation to incur environmental restoration, rehabilitation and decommissioning costs arises when disturbance is caused by the development or ongoing production of a mining asset. Costs for restoration of site damage, rehabilitation and environmental costs are estimated using either the work of external consultants or internal experts. Such costs arising from the decommissioning of plant and other site preparation work, discounted to their net present value, are provided for and capitalised at the start of each project, as soon as the obligation to incur such costs arises.
These costs are recognised in the income statement over the life of the operation, through the depreciation of the asset and the unwinding of the discount on the provision. Costs for restoration of subsequent site damage which is created on an ongoing basis during production are provided for at their net present values and recognised in the income statement as ore extraction progresses.
The amount recognised as a provision represents management’s best estimate of the consideration required to complete the restoration and rehabilitation activity, the application of the relevant regulatory framework and timing of expenditure. These estimates are inherently uncertain and could materially change over time. Changes in the measurement of a liability relating to the decommissioning of plant or other site preparation work (that result from changes in the estimated timing or amount of the cash flow or a change in the discount rate), are added to or deducted from the cost of the related asset in the current period. If a decrease in the liability exceeds the carrying amount of the asset, the excess is recognised immediately in the income statement. If the asset value is increased and there is an indication that the revised carrying value is not recoverable, an impairment test is performed in accordance with the accounting policy set out above.
For some South African operations, annual contributions are made to dedicated environmental rehabilitation trusts to fund the estimated cost of rehabilitation during and at the end of the life of the relevant mine. The Group exercises full control of these trusts and therefore the trusts are consolidated. The trusts’ assets are disclosed separately on the balance sheet as non-current assets.
The trusts’ assets are measured based on the nature of the underlying assets in accordance with accounting policies for similar assets.
Carbon credits
Carbon credits held for future sale as part of the Group’s trading activities, to meet obligations in compliance markets and those expected to be surrendered for the production of ‘green’ or ‘carbon neutral’ products are accounted for under the Group’s inventory accounting policy.
Carbon credits used for other purposes such as to satisfy the Group’s voluntary carbon emission targets or for capital appreciation over an extended period are accounted for under the Group’s accounting policy for intangible assets.
Where carbon credits are required to meet obligations in compliance markets, provisions are recognised which reflect the cost of carbon credits needed to settle the obligation relating to emissions recorded to date.
E. Working capital
Inventories
Inventory and work in progress are measured at the lower of cost and net realisable value, except for inventory held by commodity broker-traders which is measured at fair value less costs to sell and are disclosed separately to the extent that they are material. The production cost of inventory includes an appropriate proportion of depreciation and production overheads. Cost is determined on the following basis:
| – | Raw materials and consumables are measured at cost on a first in, first out (FIFO) basis or a weighted average cost basis |
| – | Work in progress and finished products are measured at raw material cost, labour cost and a proportion of production overhead expenses |
| – | Metal and coal stocks are included within finished products and are measured at average cost. |
At precious metals operations that produce ‘joint products’, cost is allocated among precious metal products according to production volumes.
Inventory is recognised as a current asset where it is expected to be consumed in the next 12 months. Stockpiles are classified as non-current where stockpiles are not expected to be processed in the next 12 months and there is no market to sell the product in its current state.
Metal leasing
Where the Group enters into metal leasing arrangements and metal is received or provided to counterparties for a specific period of time in return for a lease fee, consideration is given to the purpose of the arrangement and whether control of the metal inventory has been transferred.
Key considerations in this assessment include whether the lessee has a practical ability to use the commodity and whether price risk has been transferred.
Where control of the inventory has been transferred to the counterparty, inventory is derecognised and a financial receivable is recorded for the future receipt of metal. The financial receivable forms part of trade and other receivables where the purpose of the arrangement is to generate a trading margin and is otherwise presented within financial asset investments.
Where the Group receives control of inventory as a result of a lease arrangement, inventory is recognised and a payable is recorded to reflect the future return obligation. This liability forms part of trade and other payables where the purpose of the arrangement is to generate a trading margin or manage physical delivery requirements and is otherwise presented within financing liabilities.
Where control of the inventory is not transferred, the arrangement has no impact on the value of inventory recorded.
Trade and other payables
The majority of the Group’s trade and other payables are measured at amortised cost, using the effective interest method.
Payables related to the purchase of provisionally priced third party PGM concentrate as part of the Group’s processing activities are recognised at amortised cost on delivery. Any changes in pricing between the delivery date and the date that prices are confirmed is recognised as an embedded derivative. Changes in the fair value of the embedded derivative is capitalised to inventory as it forms part of the cost directly related to bringing the inventory to its present location and condition.
Provisionally priced payables arising from the Group’s commodity trading activities are recognised at fair value and subsequent fair value movements form part of the net margin reported within revenue from other sources.
| Anglo American plc | Financial statements and other financial information | 301 |
| Integrated Annual Report 2023 | Notes to the financial statements |
Other items
| 39. | Accounting policies continued |
F. Net debt and financial risk management
Cash and debt
Cash and cash equivalents
Cash and cash equivalents comprise cash in hand and on demand deposits, together with short term, highly liquid investments that are readily convertible to a known amount of cash and that are subject to an insignificant risk of changes in value. Initial margin relating to the Group’s commodity trading activities is presented within cash and cash equivalents as the terms of the agreement allow the Group to request closure of the open positions and return of the margin within three days. Bank overdrafts are shown within short term borrowings in current liabilities on the balance sheet.
Cash and cash equivalents in the cash flow statement are shown net of overdrafts. Cash and cash equivalents are measured at amortised cost except for money market fund investments which are held at fair value as they are redeemed through the sale of units in the funds and not solely through the recovery of principal and interest.
Financial liabilities and equity instruments
Financial liabilities and equity instruments are classified and accounted for as debt or equity according to the substance of the contractual arrangements entered into.
Borrowings
Interest bearing borrowings and overdrafts are initially recognised at fair value, net of directly attributable transaction costs. Finance charges, including premiums payable on settlement or redemption and direct issue costs, are recognised in the income statement using the effective interest method. They are added to the carrying amount of the instrument to the extent that they are not settled in the period in which they arise.
Where interest or principal payments are linked to non-financial ESG targets, the best estimate of the future payment is included in the calculation of the effective interest rate at inception. If this best estimate changes in subsequent periods, the carrying value of the borrowing is adjusted to reflect the revised forecast, discounted using the effective interest rate determined at inception and any resulting gain or loss is recognised in the income statement.
Lease liabilities
Lease liabilities recognised on balance sheet are recognised within borrowings, and with the exception of variable vessel leases are recognised as part of net debt. On inception, the lease liability is recognised as the present value of the expected future lease payments, discounted using the Group’s incremental borrowing rate, adjusted to reflect the length of the lease and country of location. For a minority of leases where it is possible to determine the interest rate implicit in the lease, it is used in place of the Group’s incremental borrowing rate.
Lease payments included in the lease liability consist of each of the following:
| – | Fixed payments, including in-substance fixed payments |
| – | Payments whose variability is dependent only upon an index or a rate, measured initially using the index or rate at the lease commencement date. The lease liability is revalued when there is a change in future lease payments arising from a change in an index or rate |
| – | Any amounts expected to be payable under a guarantee of residual value |
| – | The exercise price of a purchase option that the Group is reasonably certain to exercise, the lease payments after the date of a renewal option if the Group is reasonably certain to exercise its option to renew the lease, and penalties for exiting a lease agreement unless the Group is reasonably certain not to exit the lease early. |
Variable leasing costs (other than those referred to above) and the costs of non-lease components are not included in the lease liability and are charged to operating costs in underlying EBITDA as they are incurred.
The lease liability is measured at amortised cost using the effective interest method. It is remeasured when there is a change to the forecast lease payments. When the lease liability is remeasured, an adjustment is made to the corresponding right-of-use asset.
Derivative financial instruments and hedge accounting
In order to hedge its exposure to foreign exchange, interest rate and commodity price risk, the Group enters into forward, option and swap contracts. Commodity based (own use) contracts that meet the scope exemption in IFRS 9 are recognised in earnings when they are settled by physical delivery. Commodity contracts which do not meet the own use criteria are accounted for as derivatives.
All derivatives are held at fair value in the balance sheet within ‘Derivative financial assets’ or ‘Derivative financial liabilities’ except if they are linked to settlement and delivery of an unquoted equity instrument and the fair value cannot be measured reliably, in which case they are carried at cost. A derivative cannot be measured reliably where the range of reasonable fair value estimates is significant and the probabilities of various estimates cannot be reasonably assessed. Derivatives are classified as current or non-current depending on the contractual maturity of the derivative.
Changes in the fair value of derivative financial instruments that are designated and effective as hedges of future cash flows (cash flow hedges) are recognised directly in equity. The gain or loss relating to the ineffective portion is recognised immediately in the income statement. If the cash flow hedge of a firm commitment or forecast transaction results in the recognition of a non-financial asset or liability, then, at the time the asset or liability is recognised, the associated gains or losses on the derivative that had previously been recognised in equity are included in the initial measurement of the asset or liability. For hedges that do not result in the recognition of a non-financial asset or liability, amounts deferred in equity are recognised in the income statement in the same period in which the hedged item affects profit or loss.
For an effective hedge of an exposure to changes in fair value, the hedged item is adjusted for changes in fair value attributable to the risk being hedged. The corresponding entry and gains or losses arising from remeasuring the associated derivative are recognised in the income statement within financing remeasurements.
Hedge effectiveness is determined at the inception of the hedge relationship, and through periodic prospective effectiveness assessments to ensure that an economic relationship exists between the hedged item and hedging instrument. The Group’s material hedging instruments are interest rate swaps that have similar critical terms to the related debt instruments, such as payment dates, maturities and notional amount. As all critical terms matched during the year, there was no material hedge ineffectiveness. The Group also uses cross currency swaps to manage foreign exchange risk associated with borrowings denominated in foreign currencies. These are not designated in an accounting hedge as there is a natural offset against foreign exchange movements on associated borrowings.
The Group has designated the embedded derivative component of the royalty liability (see note 24) as a cash flow hedge of future revenue cash flows from the Woodsmith project. In future periods, assuming the hedge remains effective, fair value derivative gains and losses as a result of changing forecast price and production forecasts will be recorded within other comprehensive income and recycled to revenue as the related revenue is recognised.
| 302 | Anglo American plc | Financial statements and other financial information |
| Integrated Annual Report 2023 | Notes to the financial statements |
Other items
| 39. | Accounting policies continued |
Hedge accounting is discontinued when the hedging instrument expires or is sold, terminated, exercised, revoked, or no longer qualifies for hedge accounting. At that time, any cumulative gain or loss on the hedging instrument recognised in equity is retained until the forecast transaction occurs. If a hedge transaction is no longer expected to occur, the net cumulative gain or loss previously recognised in equity is recycled to the income statement for the period.
Changes in the fair value of any derivative instruments that are not designated in a hedge relationship are recognised immediately in the income statement.
Derivatives embedded in other financial instruments or non-financial host contracts (other than financial assets in the scope of IFRS 9) are treated as separate derivatives when their risks and characteristics are not closely related to those of their host contracts and the host contracts themselves are not carried at fair value with unrealised gains or losses reported in the income statement.
Derivatives embedded in contracts which are financial assets in the scope of IFRS 9 are not separated and the whole contract is accounted for at either amortised cost or fair value.
Interest Rate Benchmark Reform: IFRS 9 Financial Instruments and IFRS 7 Financial Instruments: Disclosures
The Group uses interest rate derivatives to swap the majority of its Euro, Sterling and US dollar bonds from fixed interest rates to EURIBOR, SONIA and SOFR rates respectively. Any non-USD interest rate derivatives are swapped to SOFR using cross currency interest rate swaps which are not designated into accounting hedges. The interest rate derivatives are designated into accounting fair value hedges.
The Group transitioned all remaining trades referenced to the USD LIBOR rate to incorporate alternative risk-free rates with the principal benchmarks used now being EURIBOR, SOFR and SONIA. The Group does not hold any material lease agreements that contain references to existing benchmarks and as a result there is no material impact on the lease liabilities or right-of-use assets at 31 December 2023.
G. Taxation
Tax
The tax expense includes the current tax and deferred tax charge recognised in the income statement.
Current tax payable is based on taxable profit for the year. Taxable profit differs from profit before tax as reported in the income statement because it excludes items of income or expense that are taxable or deductible in other years and it further excludes items that are not taxable or deductible. The Group’s liability for current tax is calculated using tax rates that have been enacted or substantively enacted by the reporting date.
Deferred tax is recognised in respect of temporary differences between the carrying amounts of assets and liabilities for financial reporting purposes and the amounts used for taxation purposes. Deferred tax liabilities are generally recognised for all taxable temporary differences and deferred tax assets are recognised to the extent that it is probable that taxable profits will be available against which deductible temporary differences can be utilised. Probable taxable profits are based on evidence of historical profitability and taxable profit forecasts limited by reference to the criteria set out in IAS 12 Income Taxes. Such assets and liabilities are not recognised if the temporary differences arise from the initial recognition of goodwill or of an asset or liability in a transaction (other than in a business combination) that affects neither taxable profit nor accounting profit, and does not give rise to equal taxable and deductible temporary differences.
Deferred tax liabilities are recognised for taxable temporary differences arising on investments in subsidiaries, joint arrangements and associates except where the Group is able to control the reversal of the temporary difference and it is probable that the temporary difference will not reverse in the foreseeable future.
The carrying amount of deferred tax assets is reviewed at each reporting date and is adjusted to the extent that it is no longer probable that sufficient taxable profit will be available to allow all or part of the asset to be recovered.
Deferred tax is calculated at the tax rates that are expected to apply in the period when the liability is settled or the asset is realised, based on the laws that have been enacted or substantively enacted by the reporting date. Deferred tax is charged or credited to the income statement, except when it relates to items charged or credited directly to equity, in which case the deferred tax is also taken directly to equity.
Deferred tax assets and liabilities are offset when they relate to income taxes levied by the same taxation authority and the Group intends to settle its current tax assets and liabilities on a net basis with that taxation authority.
H. Employees
Retirement benefits
The Group’s accounting policy involves the use of ‘best estimate’ assumptions in calculating the schemes’ valuations in accordance with the accounting standard. This valuation methodology differs from that applied in calculating the funding valuations, which require the use of ‘prudent’ assumptions, such as lower discount rates, higher assumed rates of future inflation expectations and greater improvements in life expectancy, leading to a higher value placed on the liabilities. The funding valuations are carried out every three years, using the projected unit credit method, by independent qualified actuaries and are used to determine the money that must be put into the funded schemes. The Group operates both defined benefit and defined contribution pension plans for its employees as well as post employment medical plans. For defined contribution plans the amount recognised in the income statement is the contributions paid or payable during the year.
For defined benefit pension and post employment medical plans, full actuarial valuations are carried out at least every three years using the projected unit credit method and updates are performed for each financial year end. The average discount rate for the plans’ liabilities is based on AA-rated corporate bonds of a suitable duration and currency or, where there is no deep market for such bonds, is based on government bonds. Pension plan assets are measured using year end market values.
Remeasurements comprising actuarial gains and losses, movements in asset surplus restrictions and the return on scheme assets (excluding interest income) are recognised immediately in the statement of comprehensive income and are not recycled to the income statement. Any increase in the present value of plan liabilities expected to arise from employee service during the year is charged to operating profit. The net interest income or cost on the net defined benefit asset or liability is included in investment income or interest expense respectively.
The retirement benefit obligation recognised on the balance sheet represents the present value of the deficit or surplus of the defined benefit plans. Any recognised surplus is limited to the present value of available refunds or reductions in future contributions to the plan.
| Anglo American plc | Financial statements and other financial information | 303 |
| Integrated Annual Report 2023 | Notes to the financial statements |
Other items
| 39. | Accounting policies continued |
Share-based payments
The Group makes equity settled share-based payments to certain employees, which are measured at fair value at the date of grant and expensed on a straight-line basis over the vesting period, based on the Group’s estimate of shares that will eventually vest. For those share schemes with market related vesting conditions, the fair value is determined using the Monte Carlo model at the grant date. The fair value of share options issued with non-market vesting conditions has been calculated using the Black Scholes model.
For all other share awards, the fair value is determined by reference to the market value of the shares at the grant date. For all share schemes with non-market vesting conditions, the likelihood of vesting has been taken into account when determining the relevant charge. Vesting assumptions are reviewed during each reporting period to ensure they reflect current expectations.
I. Group structure
Associates and joint arrangements
Associates are investments over which the Group has significant influence, which is the power to participate in the financial and operating policy decisions of the investee, but without the ability to exercise control or joint control. Typically the Group owns between 20% and 50% of the voting equity of its associates.
Joint arrangements are arrangements in which the Group shares joint control with one or more parties. Joint control is the contractually agreed sharing of control of an arrangement, and exists only when decisions about the activities that significantly affect the arrangement’s returns require the unanimous consent of the parties sharing control.
Judgement is required in determining this classification through an evaluation of the facts and circumstances arising from each individual arrangement. Joint arrangements are classified as either joint operations or joint ventures based on the rights and obligations of the parties to the arrangement. In joint operations, the parties have rights to the assets and obligations for the liabilities relating to the arrangement, whereas in joint ventures, the parties have rights to the net assets of the arrangement.
Joint arrangements that are not structured through a separate vehicle are always joint operations. Joint arrangements that are structured through a separate vehicle may be either joint operations or joint ventures depending on the substance of the arrangement. In these cases, consideration is given to the legal form of the separate vehicle, the terms of the contractual arrangement and, where relevant, other facts and circumstances. When the activities of an arrangement are primarily designed for the provision of output to the parties, and the parties are substantially the only source of cash flows contributing to the continuity of the operations of the arrangement, this indicates that the parties to the arrangements have rights to the assets and obligations for the liabilities.
Certain joint arrangements that are structured through separate vehicles including Collahuasi, Debswana and Namdeb are accounted for as joint operations. These arrangements are primarily designed for the provision of output to the parties sharing joint control, indicating that the parties have rights to substantially all the economic benefits of the assets. The liabilities of the arrangements are in substance satisfied by cash flows received from the parties; this dependence indicates that the parties effectively have obligations for the liabilities. It is primarily these facts and circumstances that give rise to the classification as joint operations.
The Group accounts for joint operations by recognising the assets, liabilities, revenue and expenses for which it has rights or obligations, including its share of such items held or incurred jointly.
Investments in associates and joint ventures are accounted for using the equity method of accounting except when classified as held for sale. The Group’s share of associates’ and joint ventures’ net income is based on their most recent audited financial statements or unaudited interim statements drawn up to the Group’s balance sheet date.
The total carrying values of investments in associates and joint ventures represent the cost of each investment including the carrying value of goodwill, the share of post-acquisition retained earnings, any other movements in reserves and any long term debt interests which in substance form part of the Group’s net investment, less any cumulative impairments. The carrying values of associates and joint ventures are reviewed on a regular basis and if there is objective evidence that an impairment in value has occurred as a result of one or more events during the period, the investment is impaired. Investments which have been previously impaired are regularly reviewed for indicators of impairment reversal.
The Group’s share of an associate’s or joint venture’s losses in excess of its interest in that associate or joint venture is not recognised unless the Group has an obligation to fund such losses. Unrealised gains arising from transactions with associates and joint ventures are eliminated against the investment to the extent of the Group’s interest in the investee. Unrealised losses are eliminated in the same way, but only to the extent that there is no evidence of impairment.
Non-current assets and disposal groups held for sale
Non-current assets and disposal groups are classified as held for sale if their carrying amount will be recovered through a sale transaction rather than through continuing use. This condition is met only when a sale is highly probable within one year from the date of classification, management is committed to the sale and the asset or disposal group is available for immediate sale in its present condition.
Non-current assets and disposal groups are classified as held for sale from the date these conditions are met and are measured at the lower of carrying amount and fair value less costs to sell. Any resulting impairment loss is recognised in the income statement.
On classification as held for sale the assets are no longer depreciated. Comparative amounts are not adjusted.
Black Economic Empowerment (BEE) transactions
Where the Group disposes of a portion of a South African based subsidiary or operation to a BEE company at a discount to fair value, the transaction is considered to be a share-based payment (in line with the principle contained in South Africa interpretation AC 503 Accounting for Black Economic Empowerment (BEE) Transactions).
The discount provided or value given is calculated in accordance with IFRS 2 Share-based Payments and the cost, representing the fair value of the BEE credentials obtained by the subsidiary, is recorded in the income statement.
| 304 | Anglo American plc | Financial statements and other financial information |
| Integrated Annual Report 2023 |
Financial statements of the Parent Company
Balance sheet of the Parent Company, Anglo American plc, as at 31 December 2023
| US$ million | Note | 2023 | 2022 | ||||||||
| Fixed assets | |||||||||||
| Investment in subsidiaries | 1 | 33,113 | 32,971 | ||||||||
| Financial asset investments | — | 7 | |||||||||
| 33,113 | 32,978 | ||||||||||
| Current assets | |||||||||||
| Cash at bank and in hand | — | 2 | |||||||||
| — | 2 | ||||||||||
| Creditors due within one year | |||||||||||
| Amounts owed to Group undertakings | (2,239 | ) | (1,874 | ) | |||||||
| (2,239 | ) | (1,874 | ) | ||||||||
| Net current liabilities | (2,239 | ) | (1,872 | ) | |||||||
| Total assets less current liabilities | 30,874 | 31,106 | |||||||||
| Net assets | 30,874 | 31,106 | |||||||||
| Capital and reserves | |||||||||||
| Called-up share capital | 2 | 734 | 734 | ||||||||
| Share premium account | 2 | 2,558 | 2,558 | ||||||||
| Capital redemption reserve | 2 | 153 | 153 | ||||||||
| Other reserves | 2 | 1,955 | 1,955 | ||||||||
| Retained earnings | 2 | 25,474 | 25,706 | ||||||||
| Total shareholders’ funds | 30,874 | 31,106 | |||||||||
Statement of changes in equity of the Parent Company
| US$ million | Called-up share capital |
Share premium account |
Capital redemption reserve |
Other reserves |
Retained earnings |
Total | ||||||||||||||||||
| At 1 January 2022 | 737 | 2,558 | 150 | 1,955 | 26,563 | 31,963 | ||||||||||||||||||
| Profit for the financial year | — | — | — | — | 1,921 | 1,921 | ||||||||||||||||||
| Dividends(1) | — | — | — | — | (2,661 | ) | (2,661 | ) | ||||||||||||||||
| Equity settled share-based payments schemes | — | — | — | — | 1 | 1 | ||||||||||||||||||
| Treasury shares purchased | — | — | — | — | (308 | ) | (308 | ) | ||||||||||||||||
| Shares cancelled during the year | (3 | ) | — | 3 | — | — | — | |||||||||||||||||
| Capital contribution to Group undertakings | — | — | — | — | 187 | 187 | ||||||||||||||||||
| Other | — | — | — | — | 3 | 3 | ||||||||||||||||||
| At 31 December 2022 | 734 | 2,558 | 153 | 1,955 | 25,706 | 31,106 | ||||||||||||||||||
| Profit for the financial year | — | — | — | — | 1,061 | 1,061 | ||||||||||||||||||
| Dividends(1) | — | — | — | — | (1,213 | ) | (1,213 | ) | ||||||||||||||||
| Equity settled share-based payments schemes | — | — | — | — | 2 | 2 | ||||||||||||||||||
| Treasury shares purchased | — | — | — | — | (254 | ) | (254 | ) | ||||||||||||||||
| Capital contribution to Group undertakings | — | — | — | — | 168 | 168 | ||||||||||||||||||
| Other | — | — | — | — | 4 | 4 | ||||||||||||||||||
| At 31 December 2023 | 734 | 2,558 | 153 | 1,955 | 25,474 | 30,874 | ||||||||||||||||||
| (1) | Dividends relate only to shareholders on the United Kingdom principal register excluding dividends waived by Wealth Nominees Limited as nominees for Estera Trust (Jersey) Limited, the trustee for the Anglo American employee share scheme. Dividends paid to shareholders on the Johannesburg branch register are distributed by a South African subsidiary in accordance with the terms of the Dividend Access Share Provisions of Anglo American plc’s Articles of Association. The directors are proposing a final dividend in respect of the year ended 31 December 2023 of 41 US cents per share (see note 6 to the Consolidated financial statements). The profit after tax for the year of the Parent Company amounted to $1,061 million (2022: $1,921 million). |
The financial statements of Anglo American plc, registered number 03564138, were approved by the Board of directors on 21 February 2024 and signed on its behalf by:
| Duncan Wanblad | John Heasley |
| Chief Executive | Finance Director |
| Anglo American plc | Financial statements and other financial information | 305 |
| Integrated Annual Report 2023 | Notes to the financial statements of the Parent Company |
| 1. | Investment in subsidiaries |
| US$ million | 2023 | 2022 | ||||||
| Cost | ||||||||
| At 1 January | 32,971 | 31,804 | ||||||
| Capital contributions(1) | 142 | 167 | ||||||
| Additions | — | 1,000 | ||||||
| At 31 December | 33,113 | 32,971 | ||||||
| Provisions for impairment | ||||||||
| At 1 January | — | (8 | ) | |||||
| Impairment reversal | — | 8 | ||||||
| At 31 December | — | — | ||||||
| Net book value | 33,113 | 32,971 | ||||||
(1) This amount represents the Group share-based payment charge and is net of $26 million (2022: $20 million) of intra-group recharges.
Further information about subsidiaries is provided in note 36 to the Consolidated financial statements.
| 2. | Accounting policies: Anglo American plc (the Company) |
The Parent Company balance sheet and related notes have been prepared under the historical cost convention and in accordance with Financial Reporting Standard 100 Application of Financial Reporting Requirements (FRS 100) and Financial Reporting Standard 101 Reduced Disclosure Framework (FRS 101).
The Parent Company financial statements have been prepared in accordance with the requirements of the Companies Act 2006 and The Large and Medium-sized Companies and Groups (Accounts and Reports) Regulations 2008 (SI 2008/410).
A summary of the material accounting policies is set out below.
The preparation of financial statements in compliance with FRS 101 requires the use of certain critical accounting estimates. It also requires management to exercise judgement in applying the Parent Company’s accounting policies.
As permitted by section 408 of the Companies Act 2006, the statement of comprehensive income of the Parent Company is not presented as part of these financial statements.
The Parent Company has taken advantage of the following disclosure exemptions under FRS 101:
| – | the requirements of paragraphs 45(b) and 46-52 of IFRS 2 Share-based Payments |
| – | the requirements of IFRS 7 Financial Instruments: Disclosures |
| – | the requirements of paragraphs 91-99 of IFRS 13 Fair Value Measurement |
| – | the requirement in paragraph 38 of IAS 1 Presentation of Financial Statements to present comparative information in respect of paragraph 79(a)(iv) of IAS 1 |
| – | the requirements of paragraphs 10(d), 10(f), 16, 38A, 38B, 38C, 38D, 40A, 40B, 40C, 40D, 111 and 134-136 of IAS 1 Presentation of Financial Statements |
| – | the requirements of IAS 7 Statement of Cash Flows |
| – | the requirements of paragraphs 30 and 31 of IAS 8 Accounting Policies, Changes in Accounting Estimates and Errors |
| – | the requirements of paragraphs 17 and 18A of IAS 24 Related Party Disclosures |
| – | the requirements in IAS 24 Related Party Disclosures to disclose related party transactions entered into between two or more members of a group, provided that any subsidiary which is a party to the transaction is wholly owned by such a member. |
Material accounting policies
Investments
Investments represent equity holdings in subsidiaries and are measured at cost less accumulated impairment.
Financial instruments
The Parent Company recognises financial instruments when it becomes a party to the contractual arrangements of the instrument. Financial instruments are derecognised when they are discharged or when the contractual terms expire.
Dividends
Interim equity dividends are recognised when declared. Final equity dividends are recognised when approved by the shareholders at an Annual General Meeting.
Share-based payments
The Parent Company has applied the requirements of IFRS 2 Share-based Payments.
| 306 | Anglo American plc | Financial statements and other financial information |
| Integrated Annual Report 2023 | Notes to the financial statements of the Parent Company |
| 2. | Accounting policies: Anglo American plc (the Company) continued |
The Parent Company makes equity settled share-based payments to the directors, which are measured at fair value at the date of grant and expensed on a straight-line basis over the vesting period, based on the Parent Company’s estimate of shares that will eventually vest. For those share schemes with market related vesting conditions, the fair value is determined using the Monte Carlo model at the grant date. The fair value of share options issued with non-market vesting conditions has been calculated using the Black Scholes model. For all other share awards, the fair value is determined by reference to the market value of the shares at the grant date. For all share schemes with non-market vesting conditions, the likelihood of vesting has been taken into account when determining the relevant charge. Vesting assumptions are reviewed during each reporting period to ensure they reflect current expectations.
The Parent Company also makes equity settled share-based payments to certain employees of certain subsidiary undertakings. Equity settled share-based payments that are made to employees of the Parent Company’s subsidiaries are treated as increases in equity over the vesting period of the award, with a corresponding increase in the Parent Company’s investments in subsidiaries, based on an estimate of the number of shares that will eventually vest.
Any payments received from subsidiaries are applied to reduce the related increases in Investments in subsidiaries.
Insurance contracts
IFRS 17 Insurance Contracts was issued in May 2017 and became effective for the Parent Company from 1 January 2023.
Adoption of the new standard principally impacts issued financial guarantee contracts, which have previously been asserted to be insurance contacts under IFRS 4 Insurance Contracts. The Parent Company has elected to account for the majority of such arrangements under IFRS 9 Financial Instruments. The additional liabilities under these arrangements are deemed to be of an immaterial value.
Taxation
Current and deferred tax is recognised in the statement of comprehensive income of the Parent Company, except that a charge attributable to an item of income and expense recognised as other comprehensive income or to an item recognised directly in equity is also recognised in other comprehensive income or directly in equity respectively.
The only income of the Parent Company is dividend income from subsidiaries. This income is non-taxable and there is no tax charge for the year (2022: nil).
Significant accounting judgements and estimates
In the course of preparing financial statements, management necessarily makes judgements and estimates that can have a significant impact on the financial statements. The critical judgements that affect the results for the year ended 31 December 2023 are set out below.
Impairment of investments in subsidiaries
Judgement is required to determine whether there are indicators that the Company’s equity investments in subsidiaries may be impaired. When making this judgement, consideration is given to various factors, including the market capitalisation of the Group, the net asset value of the Company’s direct subsidiaries and the recoverable amount of operating assets based on the Group’s impairment and impairment reversal assessments (see note 7 and note 8 for further information).
If an impairment indicator were identified, estimation would be required to determine the recoverable amount of the investments. Recoverable amount is the higher of fair value less costs of disposal and value in use.
If the recoverable amount of an investment is estimated to be less than its carrying amount, the carrying amount of the investment is reduced to its recoverable amount and an impairment loss is recognised in the statement of comprehensive income.
| 3. | Fees for non-audit services |
Fees payable to PwC for non-audit services to the Parent Company are not required to be disclosed because they are included within the consolidated disclosure in note 38 to the Consolidated financial statements.