UNITED STATES
SECURITIES AND EXCHANGE COMMISSION
Washington, D.C. 20549
FORM 8-K
CURRENT REPORT
Pursuant to Section 13 or 15(d) of The Securities Exchange Act of 1934
Date of Report (Date of earliest event reported) November 10, 2025
SOUTHERN MISSOURI BANCORP, INC.
(Exact name of registrant as specified in its charter)
Missouri |
|
000-23406 |
|
43-1665523 |
(State or other |
|
(Commission File No.) |
|
(IRS Employer |
jurisdiction of incorporation) |
|
|
|
Identification Number) |
2991 Oak Grove Road, Poplar Bluff, Missouri |
|
63901 |
(Address of principal executive offices) |
|
(Zip Code) |
Registrant's telephone number, including area code: (573) 778-1800
N/A
(Former name or former address, if changed since last report)
Check the appropriate box below if the Form 8-K filing is intended to simultaneously satisfy the filing obligation of the registrant under any of the following provisions:
☐ |
Written communications pursuant to Rule 425 under the Securities Act (17 CFR 230.425) |
☐ |
Soliciting material pursuant to Rule 14a-12 under the Exchange Act (17 CFR 240.14a-12) |
☐ |
Pre-commencement communications pursuant to Rule 14d-2(b) under the Exchange Act (17 CFR 240.14d-2(b)) |
☐ |
Pre-commencement communications pursuant to Rule 13e-4(c) under the Exchange Act (17 CFR 240.13e-4(c)) |
Securities registered pursuant to Section 12(b) of the Act:
Title of each class |
Trading Symbol(s) |
Name of each exchange on which registered |
Common Stock, par value $0.01 per share |
SMBC |
The NASDAQ Stock Market LLC |
Indicate by check mark whether the registrant is an emerging growth company as defined in Rule 405 of the Securities Act of 1933 (§230.405 of this chapter) or Rule 12b-2 of the Securities Exchange Act of 1934 (§240.12b-2 of this chapter).
Emerging growth company ☐
If an emerging growth company, indicate by check mark if the registrant has elected not to use the extended transition period for complying with any new or revised financial accounting standards provided pursuant to Section 13(a) of the Exchange Act. ☐
Item 7.01Regulation FD Disclosure
Included in Exhibit 99.1 is the investor presentation material of Southern Missouri Bancorp, Inc. to be presented Tuesday, November 11, 2025, at the Piper Sandler Financial Services Conference.
Item 9.01Financial Statements and Exhibits
(d)Exhibits
The following exhibits are filed herewith:
Exhibit No.Exhibit
99.1 |
104Cover Page Interactive Data File (embedded within the Inline XBRL documents).
SIGNATURES
Pursuant to the requirements of the Securities Exchange Act of 1934, the registrant has duly caused this report to be signed on its behalf by the undersigned hereunto duly authorized.
|
|
SOUTHERN MISSOURI BANCORP, INC. |
|
|
|
|
|
Date: November 10, 2025 |
|
By: |
/s/ Matthew T. Funke |
|
|
|
Matthew T. Funke |
|
|
|
President and Chief Administrative Officer |
|
NASDAQ: SMBC November 11, 2025 |
|
Why Southern Bank? We see people working to seize opportunities, build communities, and achieve their dreams right in their hometowns. And we want to keep it that way. That's why we provide services, resources, and tools that help you accomplish what you want, where you want. Southern Missouri Bancorp, Inc, (“Company”) is a bank holding company and the parent company of Southern Bank (“Bank”). |
|
Arnold/Oakville team members participated in and worked the booth at last year’s Keene Insurance Group Golf Tournament Smithville team members participated in Smithville School District’s staff vendor fair. Cape Girardeau team members attended United Way’s ribbon cutting. What Sets Us Apart? OUR COMMUNITIES We’re invested in what our communities are doing and dedicated to provide exactly what they need in their local bank. Our team members are deeply involved in their communities – whether it is serving on boards and committees, volunteering with local schools/organizations, or coaching little league teams. OUR PEOPLE Our team members are what make our organization great. We are respectful, honest, and professional and strive to make every experience a good one – for both our customers and coworkers. We work as a team to help our customers reach their goals, whatever they may be. |
|
OUR MISSION We’re here for you and your financial goals. OUR VISION We create growth through opportunity. • We provide our customers the best service and expand our relationships to help them achieve their financial goals. • We provide our team with the tools and knowledge to serve our customers wherever they may be. • We provide our team members opportunities for professional development, career advancement, and a positive work environment. • We provide for the well-being of our communities, working to advance their economic, social, and educational prospects. • We provide a sound return on our shareholders’ investment. |
|
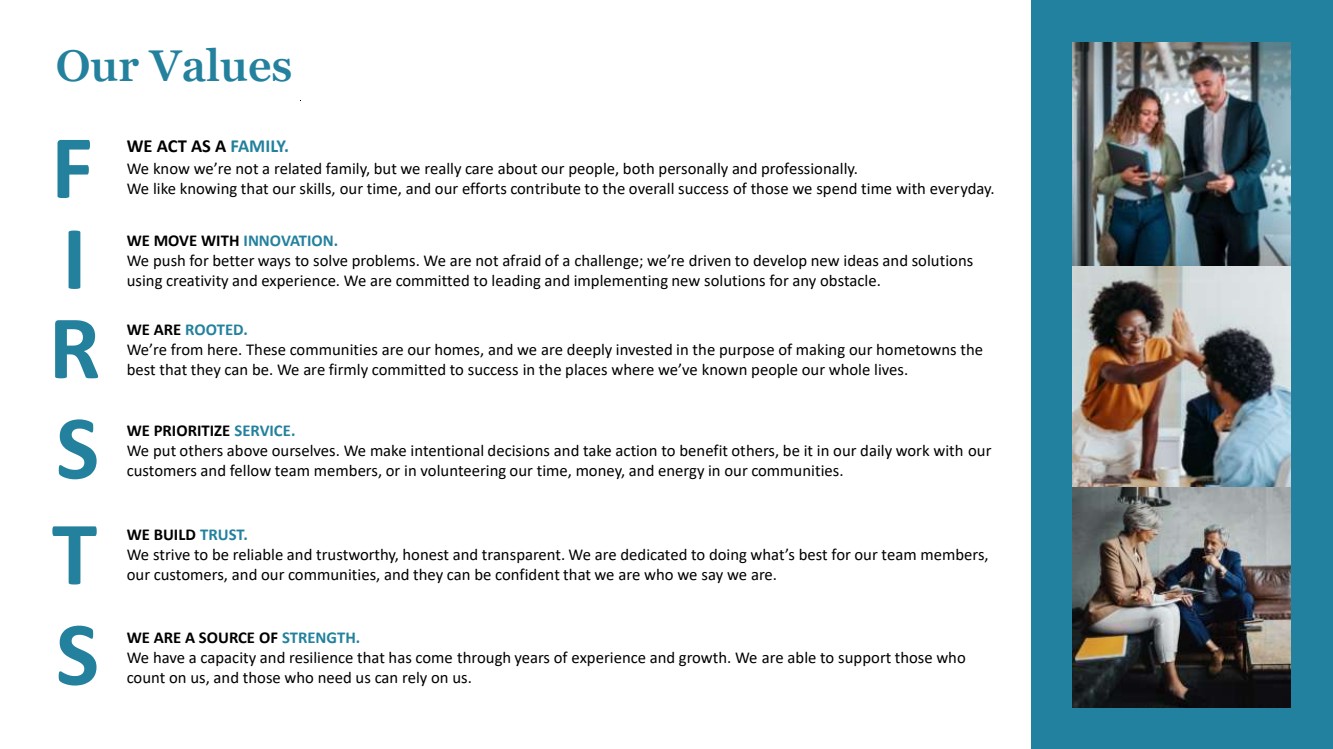
Our Values F WE ACT AS A FAMILY. We know we’re not a related family, but we really care about our people, both personally and professionally. We like knowing that our skills, our time, and our efforts contribute to the overall success of those we spend time with everyday. I R S T S WE MOVE WITH INNOVATION. We push for better ways to solve problems. We are not afraid of a challenge; we’re driven to develop new ideas and solutions using creativity and experience. We are committed to leading and implementing new solutions for any obstacle. WE ARE ROOTED. We’re from here. These communities are our homes, and we are deeply invested in the purpose of making our hometowns the best that they can be. We are firmly committed to success in the places where we’ve known people our whole lives. WE PRIORITIZE SERVICE. We put others above ourselves. We make intentional decisions and take action to benefit others, be it in our daily work with our customers and fellow team members, or in volunteering our time, money, and energy in our communities. WE BUILD TRUST. We strive to be reliable and trustworthy, honest and transparent. We are dedicated to doing what’s best for our team members, our customers, and our communities, and they can be confident that we are who we say we are. WE ARE A SOURCE OF STRENGTH. We have a capacity and resilience that has come through years of experience and growth. We are able to support those who count on us, and those who need us can rely on us. |
|
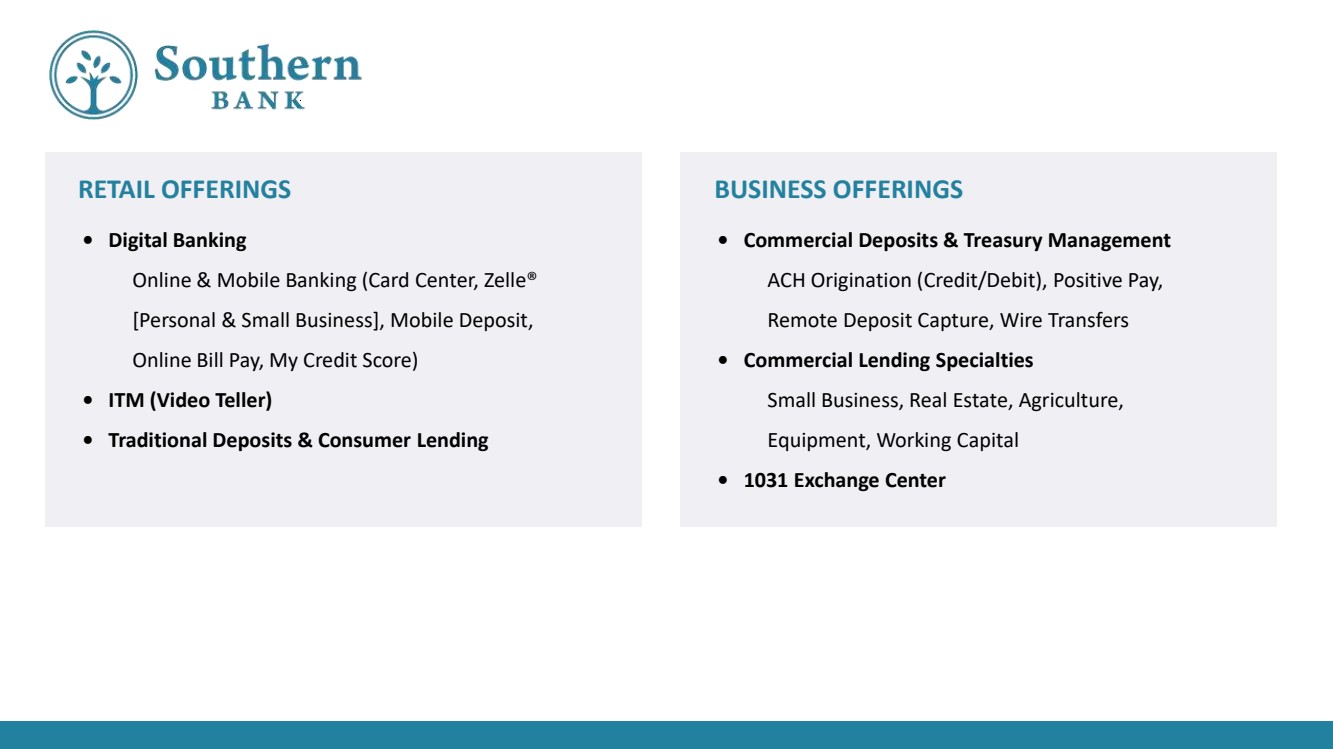
RETAIL OFFERINGS BUSINESS OFFERINGS • Digital Banking Online & Mobile Banking (Card Center, Zelle® [Personal & Small Business], Mobile Deposit, Online Bill Pay, My Credit Score) • ITM (Video Teller) • Traditional Deposits & Consumer Lending • Commercial Deposits & Treasury Management ACH Origination (Credit/Debit), Positive Pay, Remote Deposit Capture, Wire Transfers • Commercial Lending Specialties Small Business, Real Estate, Agriculture, Equipment, Working Capital • 1031 Exchange Center |
|
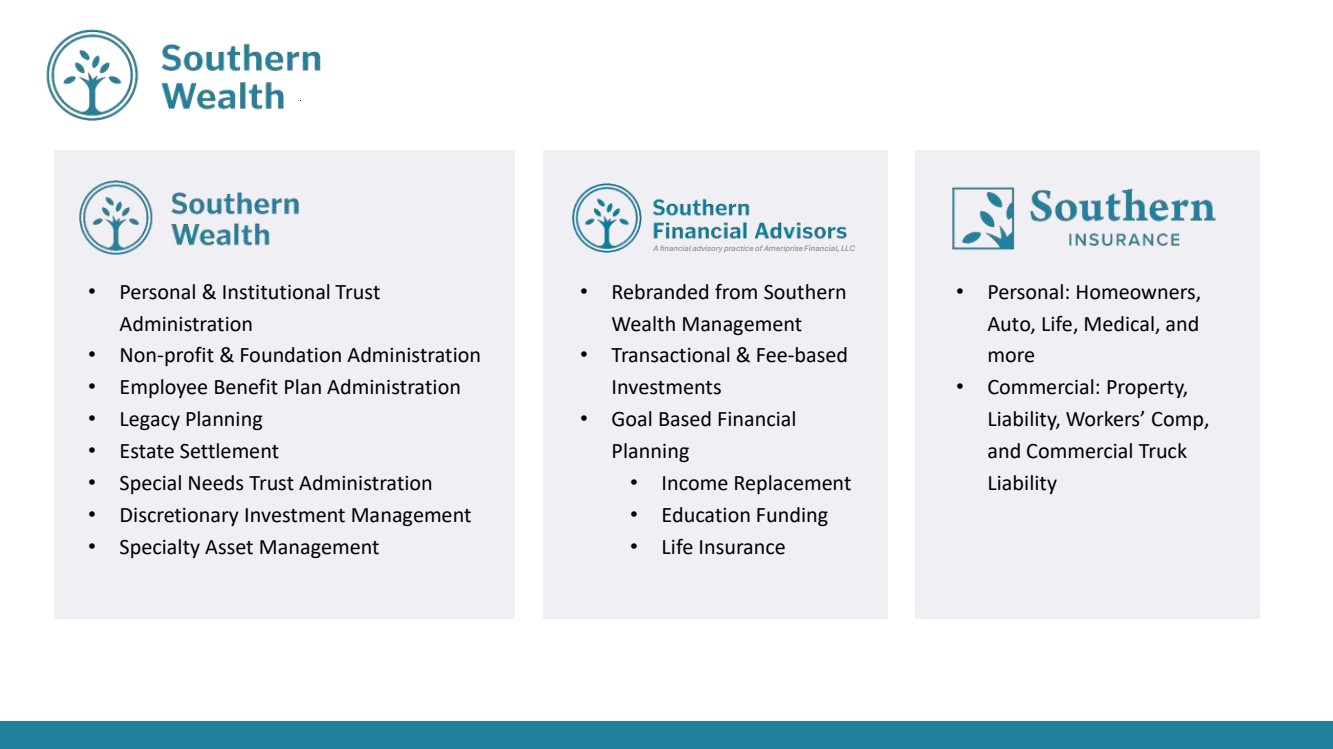
• Rebranded from Southern Wealth Management • Transactional & Fee-based Investments • Goal Based Financial Planning • Income Replacement • Education Funding • Life Insurance • Personal: Homeowners, Auto, Life, Medical, and more • Commercial: Property, Liability, Workers’ Comp, and Commercial Truck Liability • Personal & Institutional Trust Administration • Non-profit & Foundation Administration • Employee Benefit Plan Administration • Legacy Planning • Estate Settlement • Special Needs Trust Administration • Discretionary Investment Management • Specialty Asset Management A financial advisory practice of Ameriprise Financial, LLC |
|
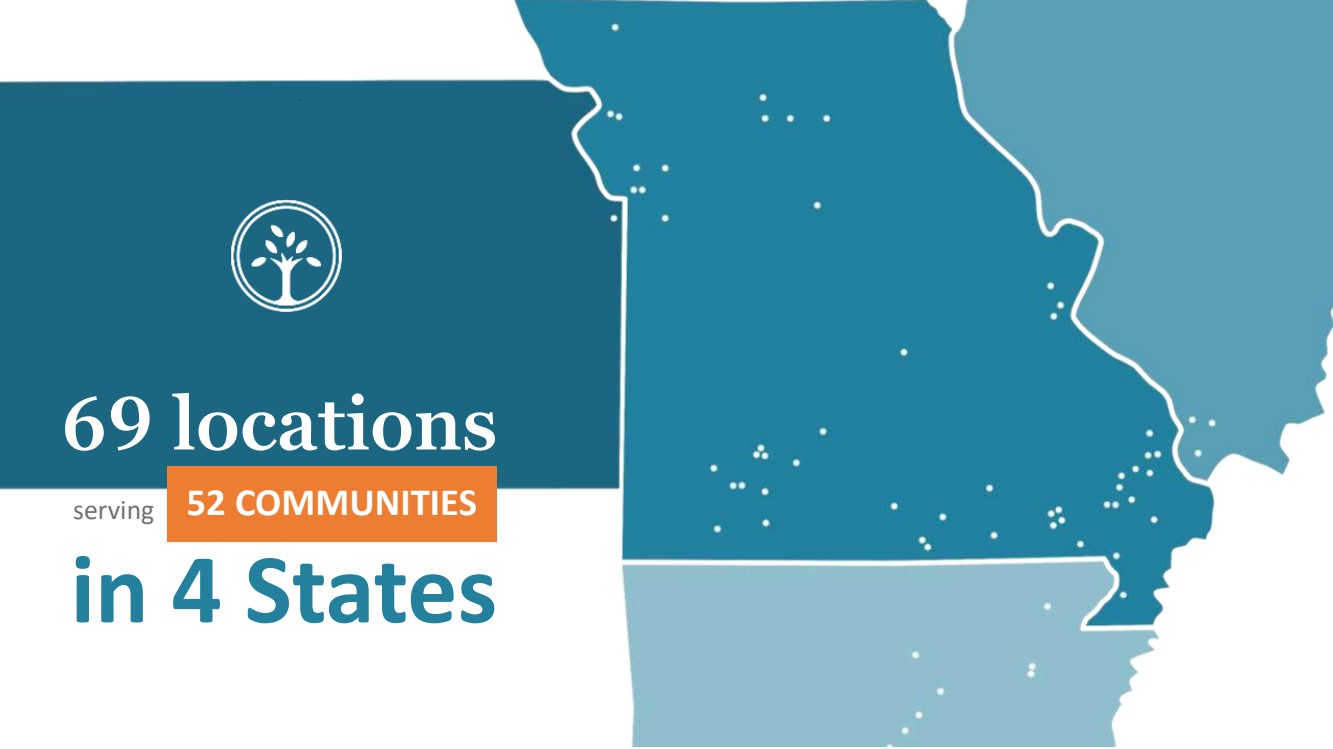
69 locations serving in 4 States 52 COMMUNITIES |
|
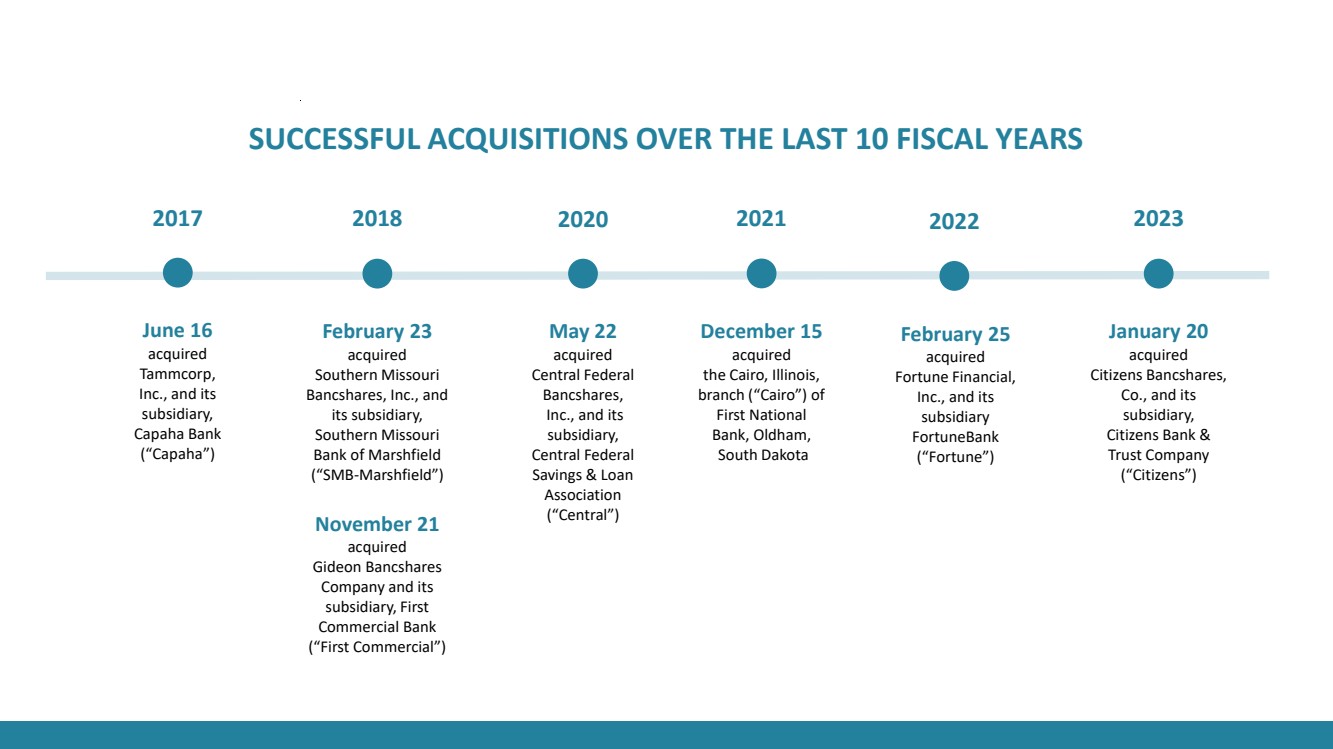
SUCCESSFUL ACQUISITIONS OVER THE LAST 10 FISCAL YEARS June 16 acquired Tammcorp, Inc., and its subsidiary, Capaha Bank (“Capaha”) 2017 February 23 acquired Southern Missouri Bancshares, Inc., and its subsidiary, Southern Missouri Bank of Marshfield (“SMB-Marshfield”) 2018 November 21 acquired Gideon Bancshares Company and its subsidiary, First Commercial Bank (“First Commercial”) May 22 acquired Central Federal Bancshares, Inc., and its subsidiary, Central Federal Savings & Loan Association (“Central”) 2020 December 15 acquired the Cairo, Illinois, branch (“Cairo”) of First National Bank, Oldham, South Dakota 2021 February 25 acquired Fortune Financial, Inc., and its subsidiary FortuneBank (“Fortune”) 2022 January 20 acquired Citizens Bancshares, Co., and its subsidiary, Citizens Bank & Trust Company (“Citizens”) 2023 |
|
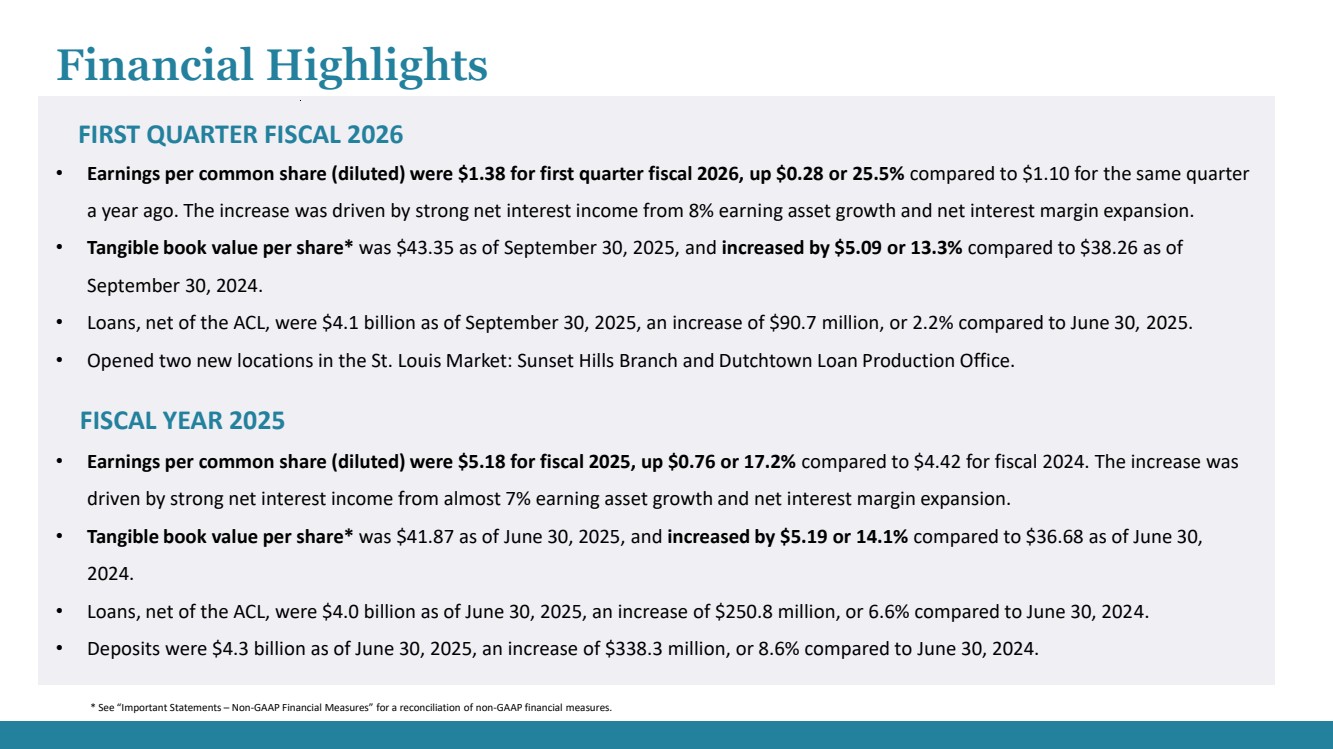
Financial Highlights • Earnings per common share (diluted) were $1.38 for first quarter fiscal 2026, up $0.28 or 25.5% compared to $1.10 for the same quarter a year ago. The increase was driven by strong net interest income from 8% earning asset growth and net interest margin expansion. • Tangible book value per share* was $43.35 as of September 30, 2025, and increased by $5.09 or 13.3% compared to $38.26 as of September 30, 2024. • Loans, net of the ACL, were $4.1 billion as of September 30, 2025, an increase of $90.7 million, or 2.2% compared to June 30, 2025. • Opened two new locations in the St. Louis Market: Sunset Hills Branch and Dutchtown Loan Production Office. FIRST QUARTER FISCAL 2026 * See “Important Statements – Non-GAAP Financial Measures” for a reconciliation of non-GAAP financial measures. FISCAL YEAR 2025 • Earnings per common share (diluted) were $5.18 for fiscal 2025, up $0.76 or 17.2% compared to $4.42 for fiscal 2024. The increase was driven by strong net interest income from almost 7% earning asset growth and net interest margin expansion. • Tangible book value per share* was $41.87 as of June 30, 2025, and increased by $5.19 or 14.1% compared to $36.68 as of June 30, 2024. • Loans, net of the ACL, were $4.0 billion as of June 30, 2025, an increase of $250.8 million, or 6.6% compared to June 30, 2024. • Deposits were $4.3 billion as of June 30, 2025, an increase of $338.3 million, or 8.6% compared to June 30, 2024. |
|
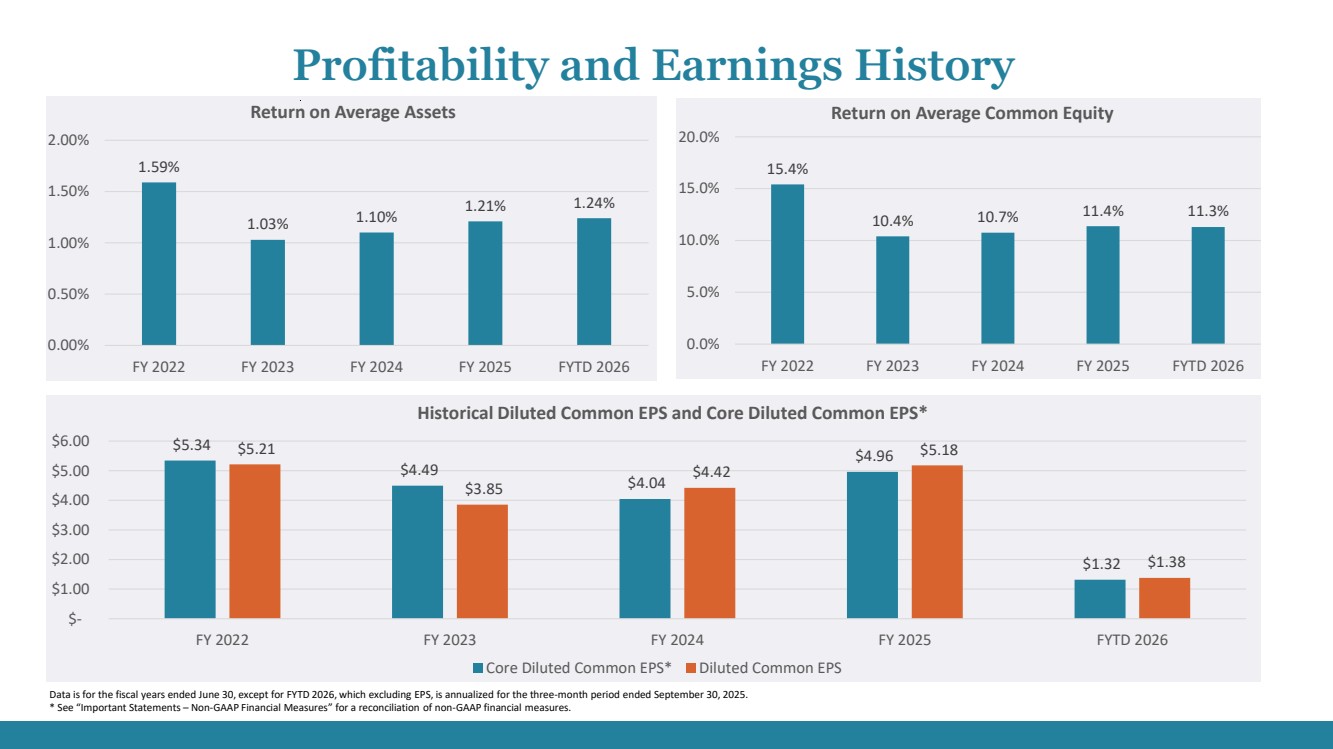
1.59% 1.03% 1.10% 1.21% 1.24% 0.00% 0.50% 1.00% 1.50% 2.00% FY 2022 FY 2023 FY 2024 FY 2025 FYTD 2026 Return on Average Assets 15.4% 10.4% 10.7% 11.4% 11.3% 0.0% 5.0% 10.0% 15.0% 20.0% FY 2022 FY 2023 FY 2024 FY 2025 FYTD 2026 Return on Average Common Equity $5.34 $4.49 $4.04 $4.96 $1.32 $5.21 $3.85 $4.42 $5.18 $1.38 $- $1.00 $2.00 $3.00 $4.00 $5.00 $6.00 FY 2022 FY 2023 FY 2024 FY 2025 FYTD 2026 Historical Diluted Common EPS and Core Diluted Common EPS* Core Diluted Common EPS* Diluted Common EPS Data is for the fiscal years ended June 30, except for FYTD 2026, which excluding EPS, is annualized for the three-month period ended September 30, 2025. * See “Important Statements – Non-GAAP Financial Measures” for a reconciliation of non-GAAP financial measures. . Profitability and Earnings History |
|
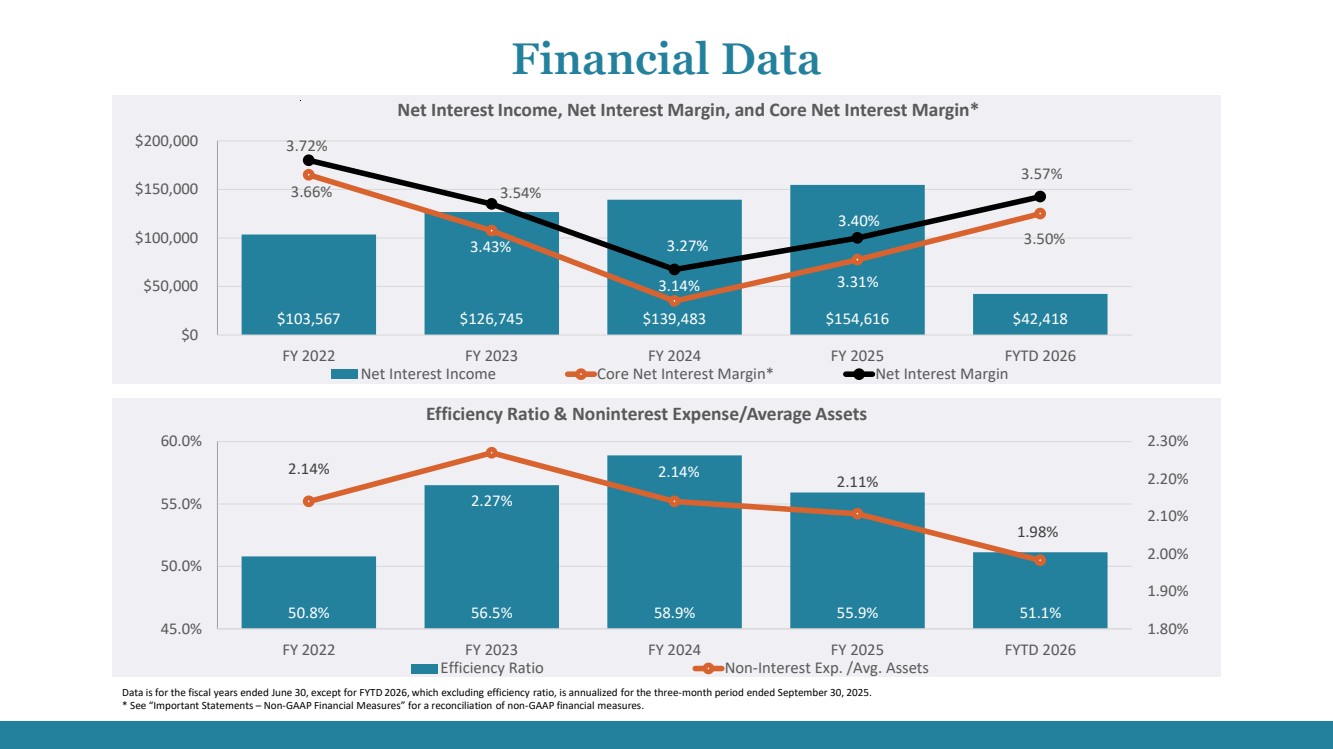
$103,567 $126,745 $139,483 $154,616 $42,418 3.66% 3.43% 3.14% 3.31% 3.50% 3.72% 3.54% 3.27% 3.40% 3.57% 3.00% 3.20% 3.40% 3.60% 3.80% $0 $50,000 $100,000 $150,000 $200,000 FY 2022 FY 2023 FY 2024 FY 2025 FYTD 2026 Net Interest Income, Net Interest Margin, and Core Net Interest Margin* Net Interest Income Core Net Interest Margin* Net Interest Margin 50.8% 56.5% 58.9% 55.9% 51.1% 2.14% 2.27% 2.14% 2.11% 1.98% 1.80% 1.90% 2.00% 2.10% 2.20% 2.30% 45.0% 50.0% 55.0% 60.0% FY 2022 FY 2023 FY 2024 FY 2025 FYTD 2026 Efficiency Ratio & Noninterest Expense/Average Assets Efficiency Ratio Non-Interest Exp. /Avg. Assets Data is for the fiscal years ended June 30, except for FYTD 2026, which excluding efficiency ratio, is annualized for the three-month period ended September 30, 2025. * See “Important Statements – Non-GAAP Financial Measures” for a reconciliation of non-GAAP financial measures. Financial Data |
|
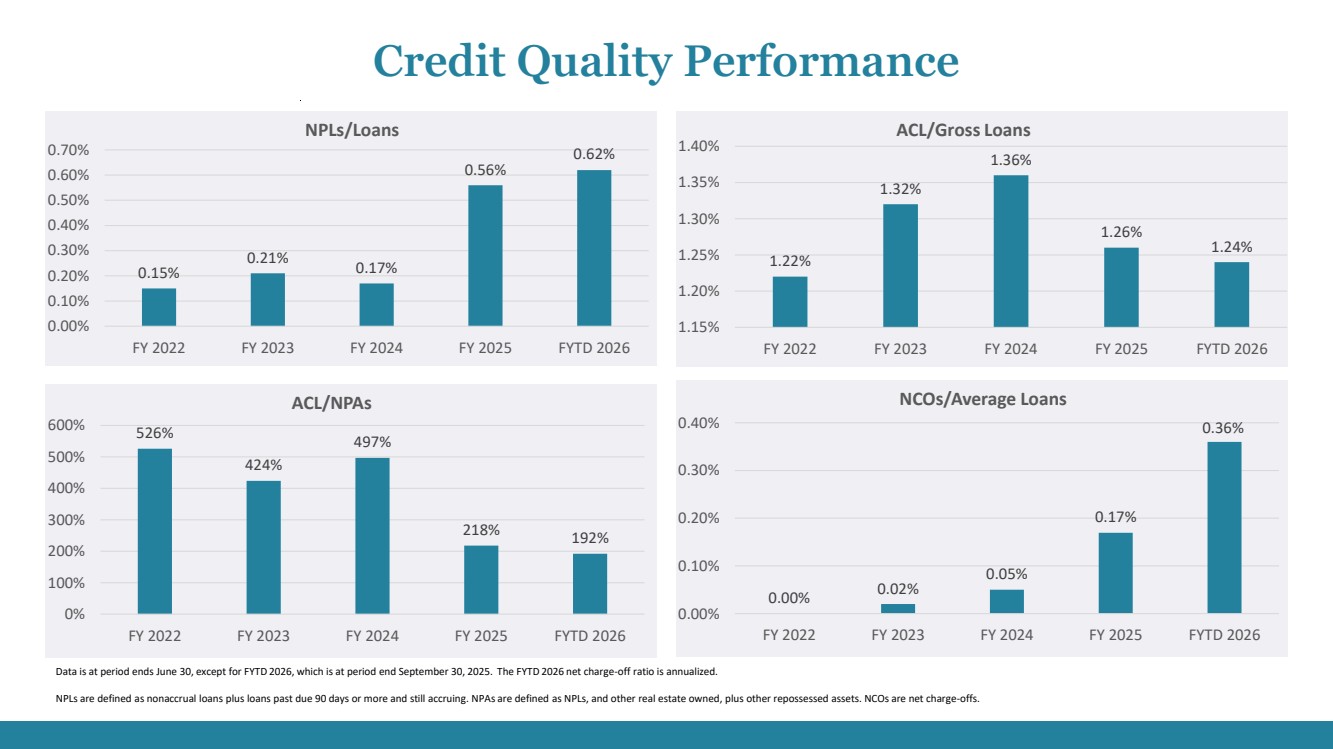
0.15% 0.21% 0.17% 0.56% 0.62% 0.00% 0.10% 0.20% 0.30% 0.40% 0.50% 0.60% 0.70% FY 2022 FY 2023 FY 2024 FY 2025 FYTD 2026 NPLs/Loans 1.22% 1.32% 1.36% 1.26% 1.24% 1.15% 1.20% 1.25% 1.30% 1.35% 1.40% FY 2022 FY 2023 FY 2024 FY 2025 FYTD 2026 ACL/Gross Loans 526% 424% 497% 218% 192% 0% 100% 200% 300% 400% 500% 600% FY 2022 FY 2023 FY 2024 FY 2025 FYTD 2026 ACL/NPAs 0.00% 0.02% 0.05% 0.17% 0.36% 0.00% 0.10% 0.20% 0.30% 0.40% FY 2022 FY 2023 FY 2024 FY 2025 FYTD 2026 NCOs/Average Loans Data is at period ends June 30, except for FYTD 2026, which is at period end September 30, 2025. The FYTD 2026 net charge-off ratio is annualized. NPLs are defined as nonaccrual loans plus loans past due 90 days or more and still accruing. NPAs are defined as NPLs, and other real estate owned, plus other repossessed assets. NCOs are net charge-offs. Credit Quality Performance |
|
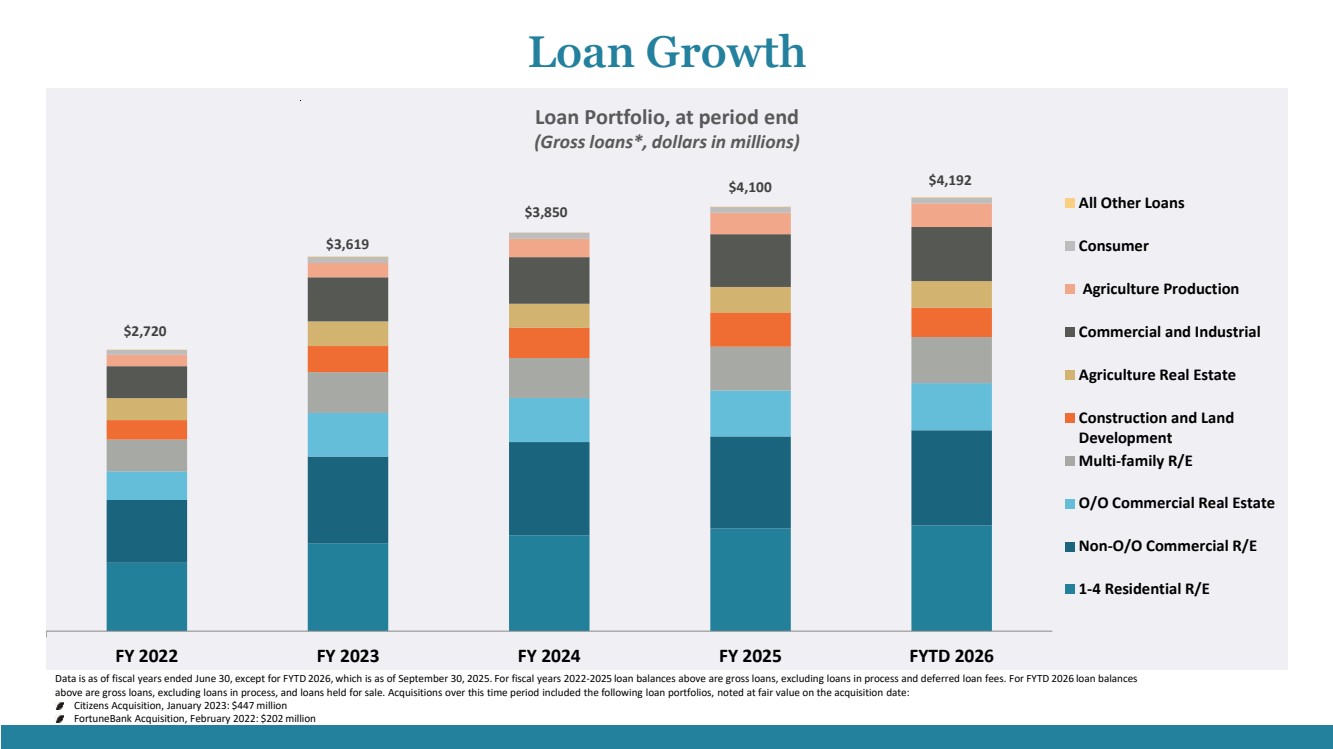
FY 2022 FY 2023 FY 2024 FY 2025 FYTD 2026 All Other Loans Consumer Agriculture Production Commercial and Industrial Agriculture Real Estate Construction and Land Development Multi-family R/E O/O Commercial Real Estate Non-O/O Commercial R/E 1-4 Residential R/E $2,720 $4,192 $4,100 $3,850 $3,619 Loan Portfolio, at period end (Gross loans*, dollars in millions) Loan Growth Data is as of fiscal years ended June 30, except for FYTD 2026, which is as of September 30, 2025. For fiscal years 2022-2025 loan balances above are gross loans, excluding loans in process and deferred loan fees. For FYTD 2026 loan balances above are gross loans, excluding loans in process, and loans held for sale. Acquisitions over this time period included the following loan portfolios, noted at fair value on the acquisition date: Citizens Acquisition, January 2023: $447 million FortuneBank Acquisition, February 2022: $202 million |
|
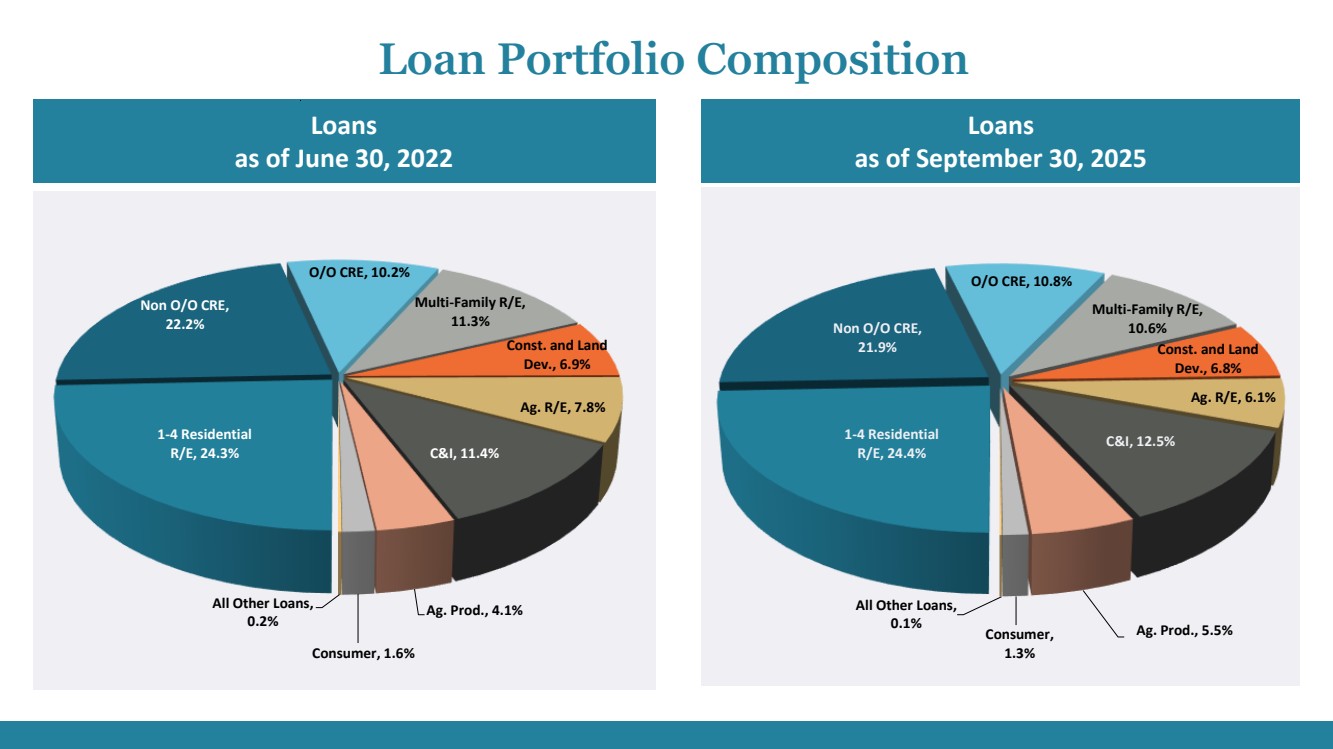
Loans as of September 30, 2025 Loans as of June 30, 2022 Loan Portfolio Composition 1-4 Residential R/E, 24.3% Non O/O CRE, 22.2% O/O CRE, 10.2% Multi-Family R/E, 11.3% Const. and Land Dev., 6.9% Ag. R/E, 7.8% C&I, 11.4% Ag. Prod., 4.1% Consumer, 1.6% All Other Loans, 0.2% 1-4 Residential R/E, 24.4% Non O/O CRE, 21.9% O/O CRE, 10.8% Multi-Family R/E, 10.6% Const. and Land Dev., 6.8% Ag. R/E, 6.1% C&I, 12.5% Consumer, Ag. Prod., 5.5% 1.3% All Other Loans, 0.1% |
|
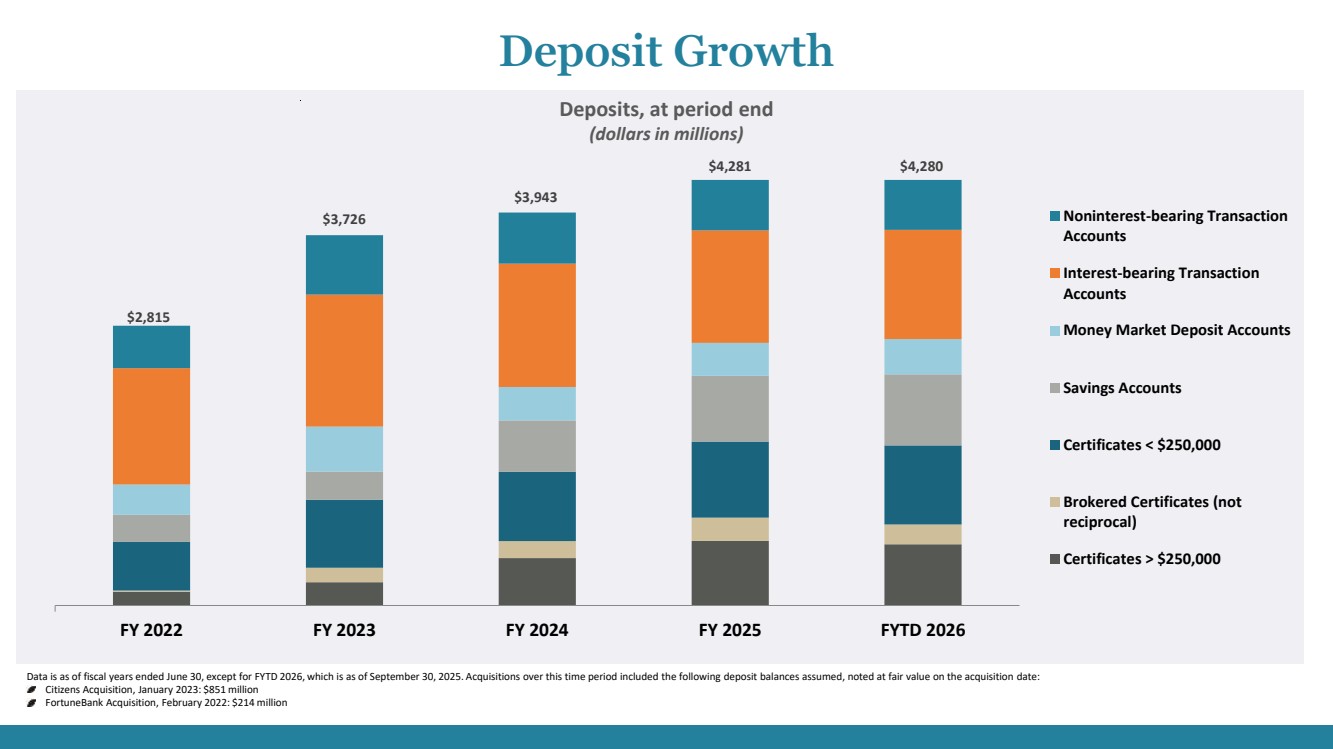
$2,815 $3,726 $3,943 $4,281 $4,280 FY 2022 FY 2023 FY 2024 FY 2025 FYTD 2026 Noninterest-bearing Transaction Accounts Interest-bearing Transaction Accounts Money Market Deposit Accounts Savings Accounts Certificates < $250,000 Brokered Certificates (not reciprocal) Certificates > $250,000 Deposits, at period end (dollars in millions) Deposit Growth Data is as of fiscal years ended June 30, except for FYTD 2026, which is as of September 30, 2025. Acquisitions over this time period included the following deposit balances assumed, noted at fair value on the acquisition date: Citizens Acquisition, January 2023: $851 million FortuneBank Acquisition, February 2022: $214 million |
|
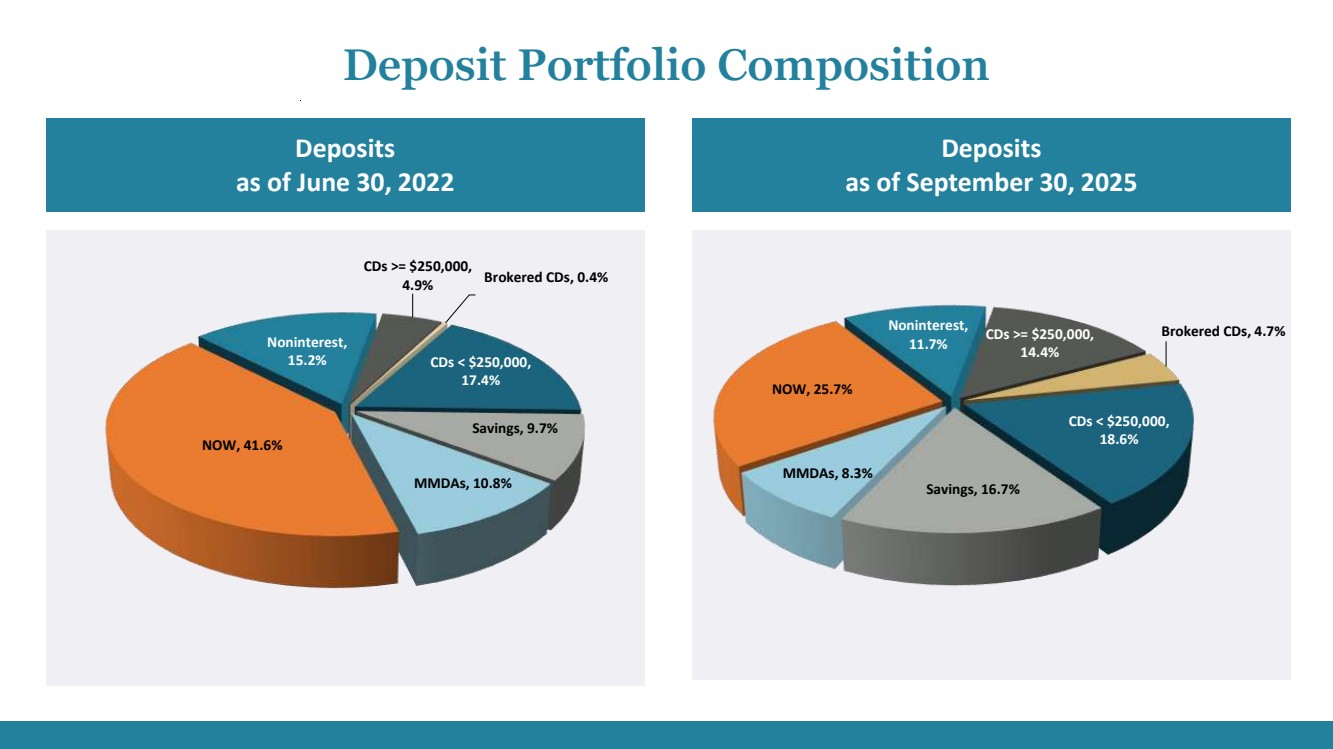
Deposits as of June 30, 2022 Deposits as of September 30, 2025 Deposit Portfolio Composition CDs >= $250,000, 4.9% Brokered CDs, 0.4% CDs < $250,000, 17.4% Savings, 9.7% MMDAs, 10.8% NOW, 41.6% Noninterest, 15.2% CDs >= $250,000, 14.4% Brokered CDs, 4.7% CDs < $250,000, 18.6% Savings, 16.7% MMDAs, 8.3% NOW, 25.7% Noninterest, 11.7% |
|
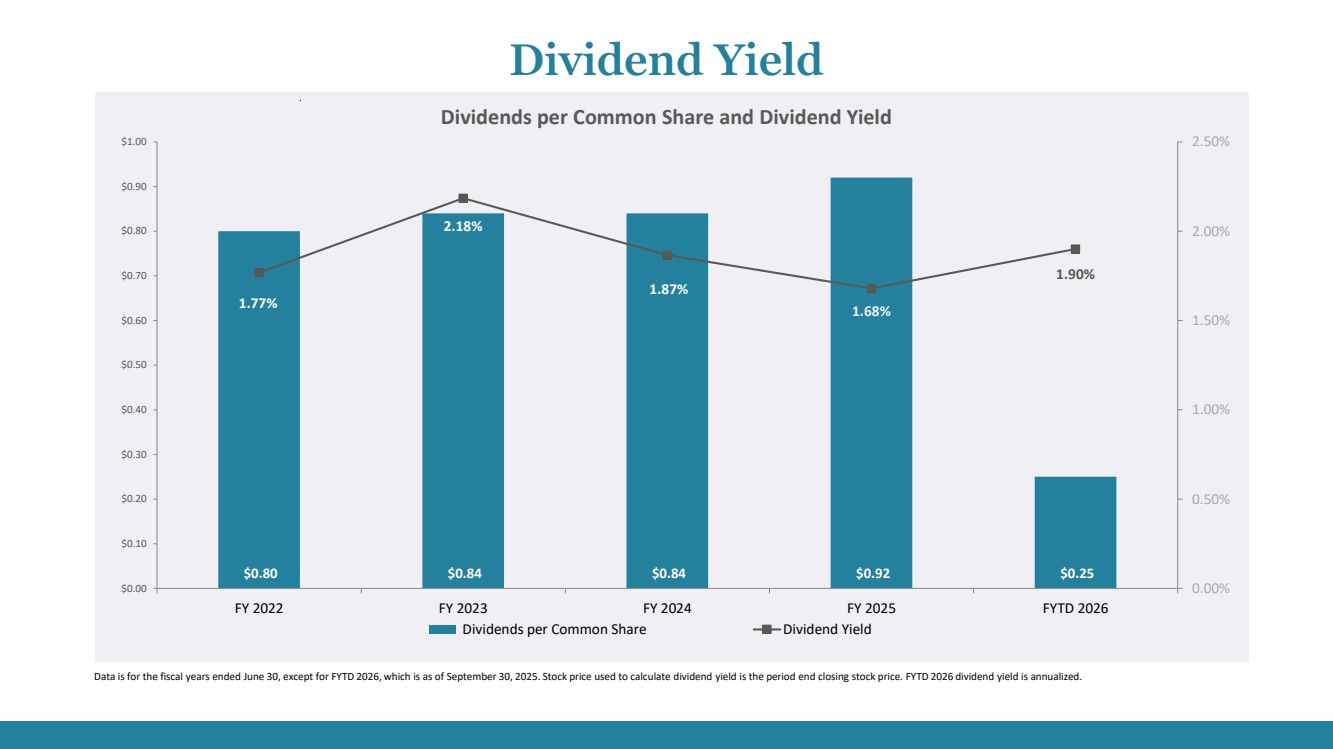
$0.80 $0.84 $0.84 $0.92 $0.25 1.77% 2.18% 1.87% 1.68% 1.90% 0.00% 0.50% 1.00% 1.50% 2.00% 2.50% $0.00 $0.10 $0.20 $0.30 $0.40 $0.50 $0.60 $0.70 $0.80 $0.90 $1.00 FY 2022 FY 2023 FY 2024 FY 2025 FYTD 2026 Dividends per Common Share Dividend Yield Data is for the fiscal years ended June 30, except for FYTD 2026, which is as of September 30, 2025. Stock price used to calculate dividend yield is the period end closing stock price. FYTD 2026 dividend yield is annualized. Dividends per Common Share and Dividend Yield Dividend Yield |
|
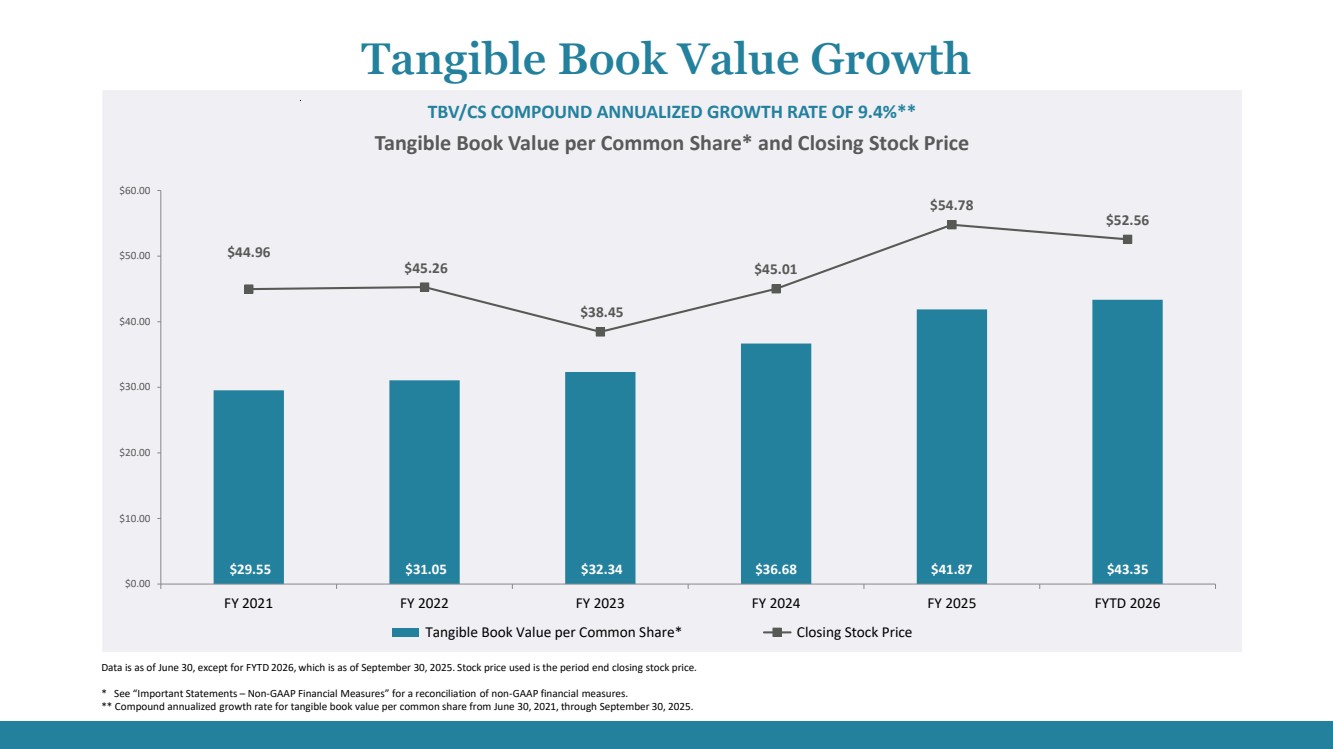
$29.55 $31.05 $32.34 $36.68 $41.87 $43.35 $44.96 $45.26 $38.45 $45.01 $54.78 $52.56 $0.00 $10.00 $20.00 $30.00 $40.00 $50.00 $60.00 FY 2021 FY 2022 FY 2023 FY 2024 FY 2025 FYTD 2026 Tangible Book Value per Common Share* Closing Stock Price TBV/CS COMPOUND ANNUALIZED GROWTH RATE OF 9.4%** Data is as of June 30, except for FYTD 2026, which is as of September 30, 2025. Stock price used is the period end closing stock price. * See “Important Statements – Non-GAAP Financial Measures” for a reconciliation of non-GAAP financial measures. ** Compound annualized growth rate for tangible book value per common share from June 30, 2021, through September 30, 2025. Tangible Book Value per Common Share* and Closing Stock Price Tangible Book Value Growth |
|
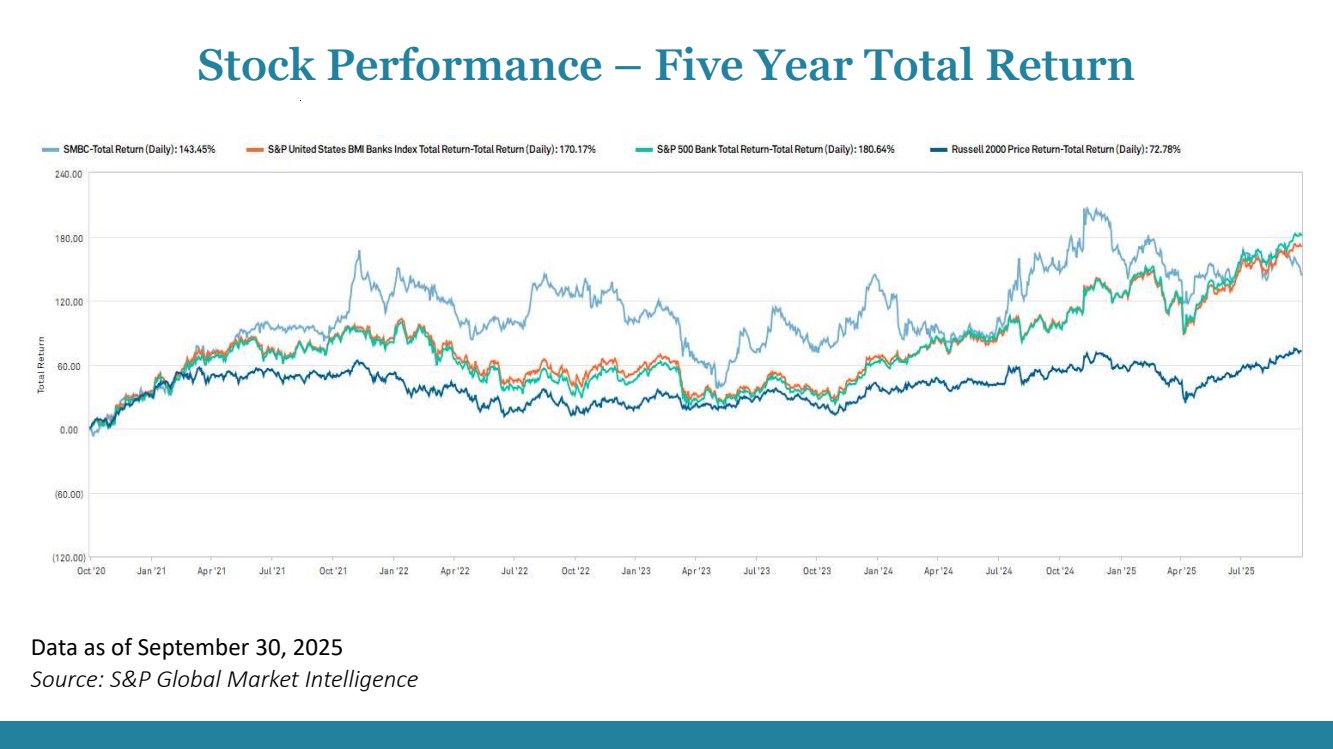
Data as of September 30, 2025 Source: S&P Global Market Intelligence Stock Performance – Five Year Total Return |
|
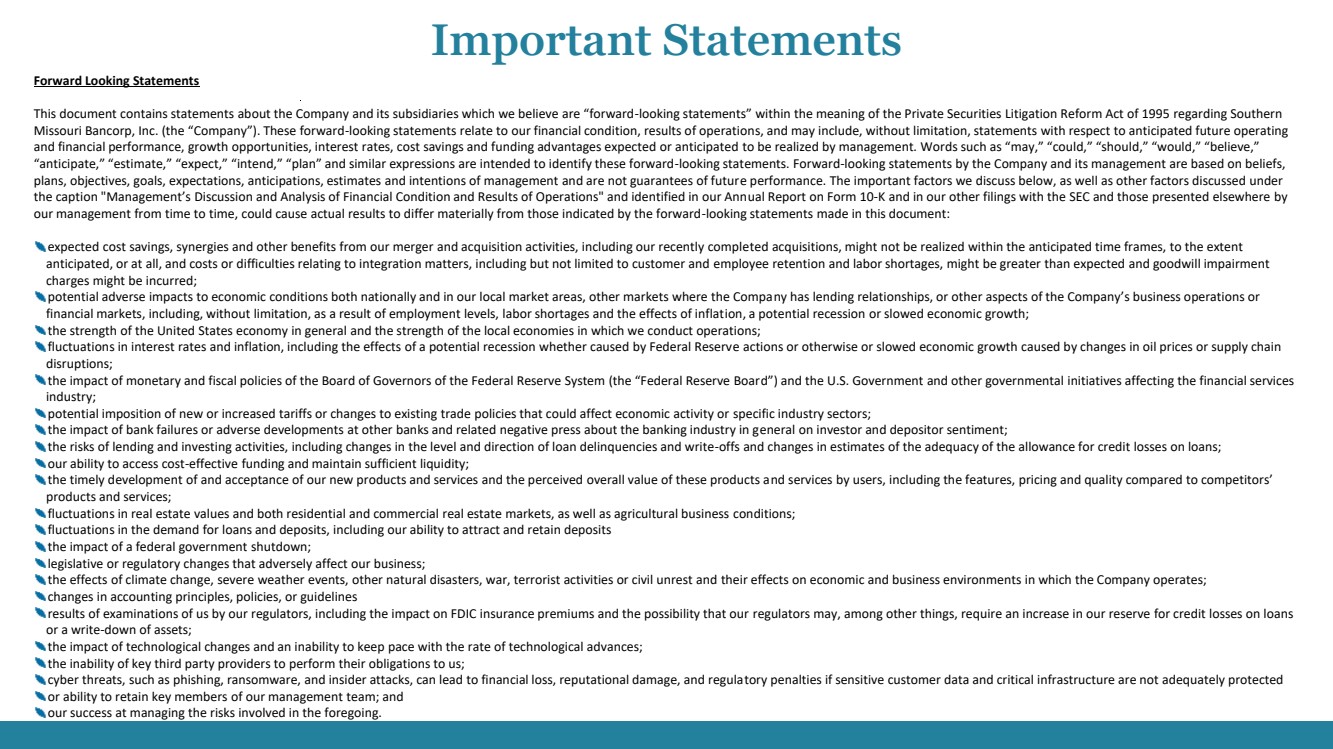
Forward Looking Statements This document contains statements about the Company and its subsidiaries which we believe are “forward-looking statements” within the meaning of the Private Securities Litigation Reform Act of 1995 regarding Southern Missouri Bancorp, Inc. (the “Company”). These forward-looking statements relate to our financial condition, results of operations, and may include, without limitation, statements with respect to anticipated future operating and financial performance, growth opportunities, interest rates, cost savings and funding advantages expected or anticipated to be realized by management. Words such as “may,” “could,” “should,” “would,” “believe,” “anticipate,” “estimate,” “expect,” “intend,” “plan” and similar expressions are intended to identify these forward-looking statements. Forward-looking statements by the Company and its management are based on beliefs, plans, objectives, goals, expectations, anticipations, estimates and intentions of management and are not guarantees of future performance. The important factors we discuss below, as well as other factors discussed under the caption "Management’s Discussion and Analysis of Financial Condition and Results of Operations" and identified in our Annual Report on Form 10-K and in our other filings with the SEC and those presented elsewhere by our management from time to time, could cause actual results to differ materially from those indicated by the forward-looking statements made in this document: expected cost savings, synergies and other benefits from our merger and acquisition activities, including our recently completed acquisitions, might not be realized within the anticipated time frames, to the extent anticipated, or at all, and costs or difficulties relating to integration matters, including but not limited to customer and employee retention and labor shortages, might be greater than expected and goodwill impairment charges might be incurred; potential adverse impacts to economic conditions both nationally and in our local market areas, other markets where the Company has lending relationships, or other aspects of the Company’s business operations or financial markets, including, without limitation, as a result of employment levels, labor shortages and the effects of inflation, a potential recession or slowed economic growth; the strength of the United States economy in general and the strength of the local economies in which we conduct operations; fluctuations in interest rates and inflation, including the effects of a potential recession whether caused by Federal Reserve actions or otherwise or slowed economic growth caused by changes in oil prices or supply chain disruptions; the impact of monetary and fiscal policies of the Board of Governors of the Federal Reserve System (the “Federal Reserve Board”) and the U.S. Government and other governmental initiatives affecting the financial services industry; potential imposition of new or increased tariffs or changes to existing trade policies that could affect economic activity or specific industry sectors; the impact of bank failures or adverse developments at other banks and related negative press about the banking industry in general on investor and depositor sentiment; the risks of lending and investing activities, including changes in the level and direction of loan delinquencies and write-offs and changes in estimates of the adequacy of the allowance for credit losses on loans; our ability to access cost-effective funding and maintain sufficient liquidity; the timely development of and acceptance of our new products and services and the perceived overall value of these products and services by users, including the features, pricing and quality compared to competitors’ products and services; fluctuations in real estate values and both residential and commercial real estate markets, as well as agricultural business conditions; fluctuations in the demand for loans and deposits, including our ability to attract and retain deposits the impact of a federal government shutdown; legislative or regulatory changes that adversely affect our business; the effects of climate change, severe weather events, other natural disasters, war, terrorist activities or civil unrest and their effects on economic and business environments in which the Company operates; changes in accounting principles, policies, or guidelines results of examinations of us by our regulators, including the impact on FDIC insurance premiums and the possibility that our regulators may, among other things, require an increase in our reserve for credit losses on loans or a write-down of assets; the impact of technological changes and an inability to keep pace with the rate of technological advances; the inability of key third party providers to perform their obligations to us; cyber threats, such as phishing, ransomware, and insider attacks, can lead to financial loss, reputational damage, and regulatory penalties if sensitive customer data and critical infrastructure are not adequately protected or ability to retain key members of our management team; and our success at managing the risks involved in the foregoing. Important Statements |
|
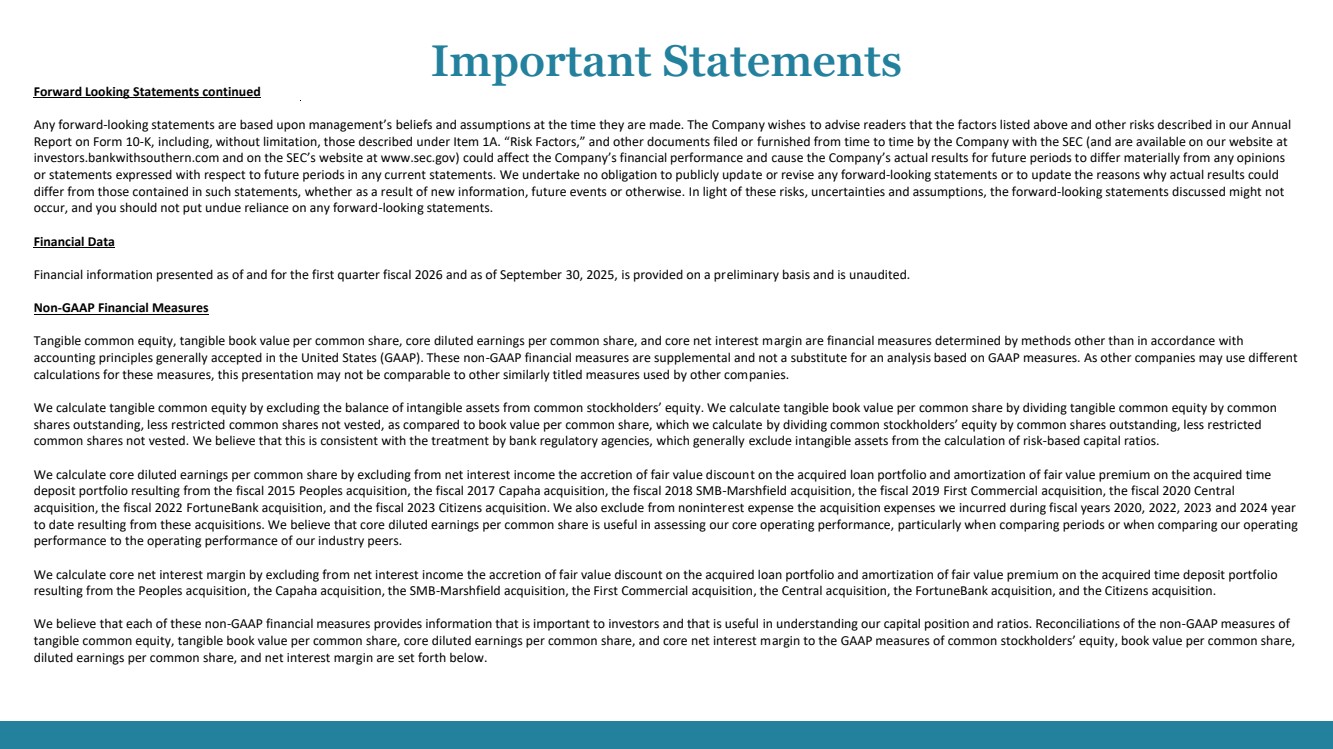
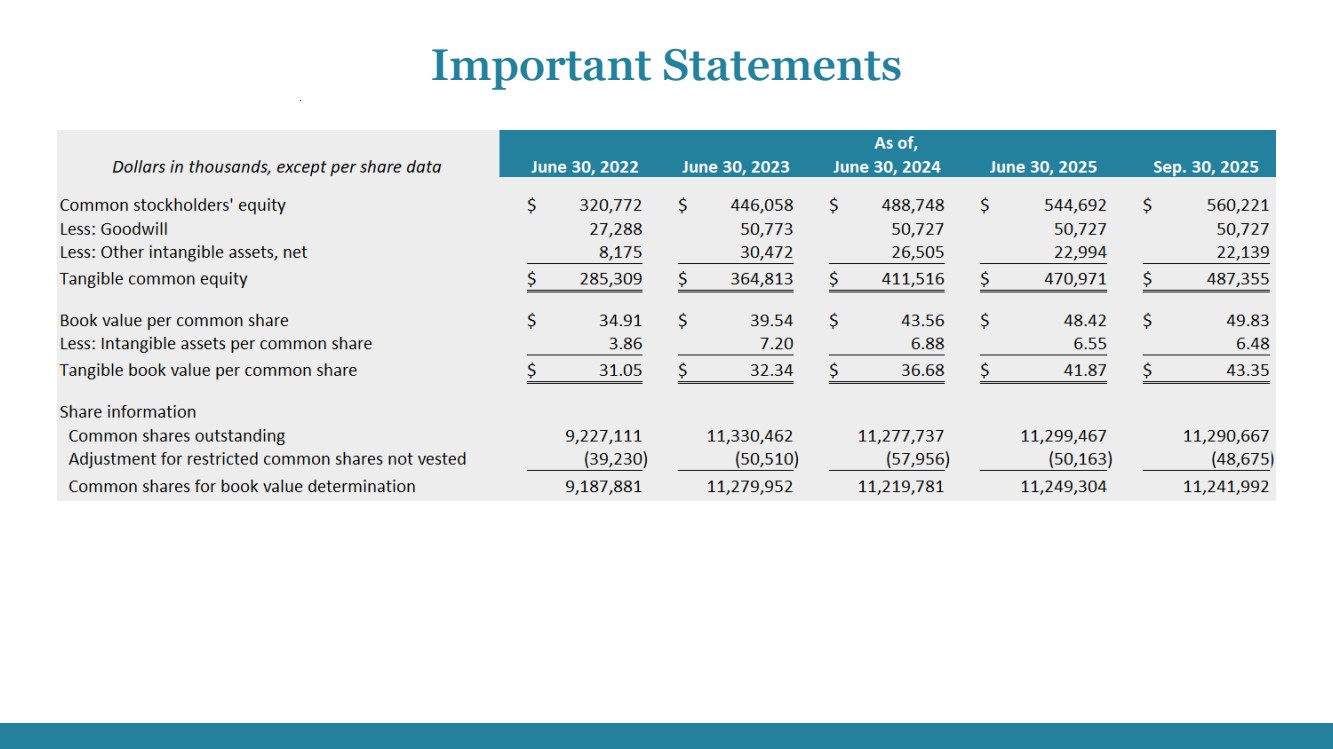
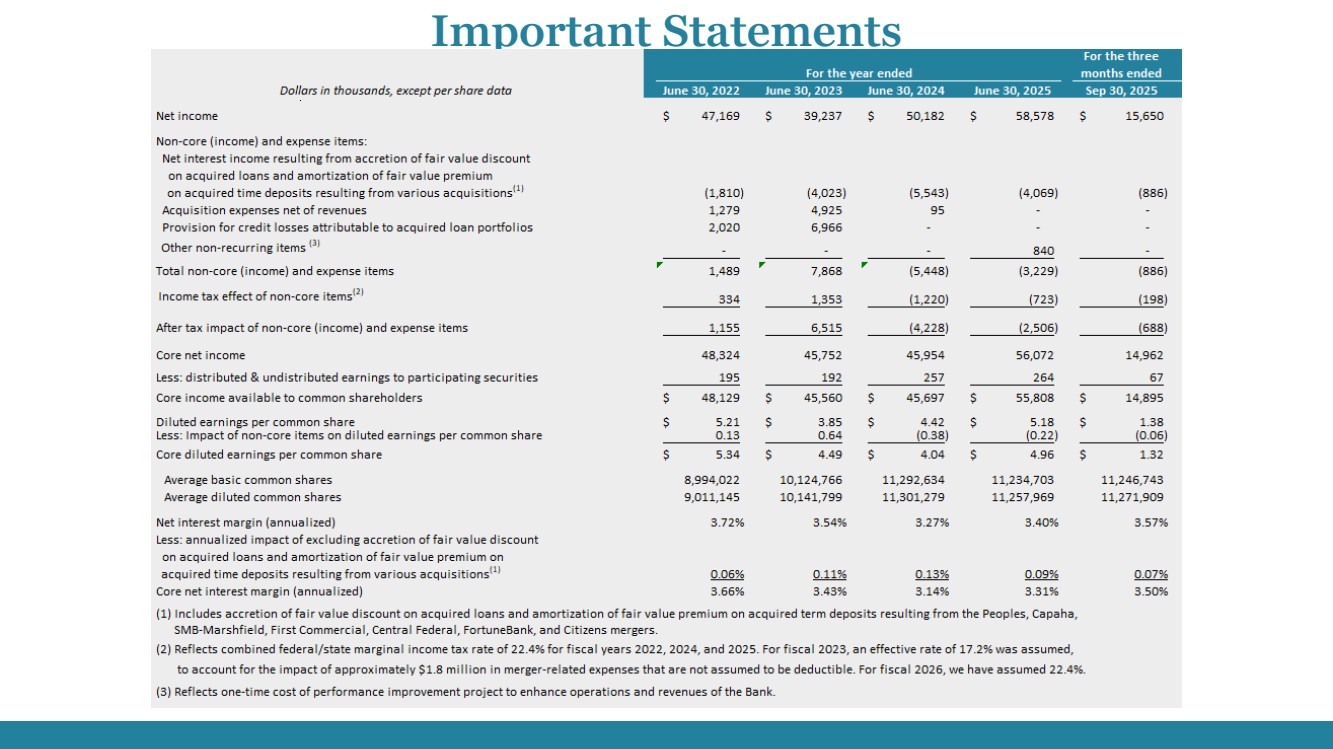
Forward Looking Statements continued Any forward-looking statements are based upon management’s beliefs and assumptions at the time they are made. The Company wishes to advise readers that the factors listed above and other risks described in our Annual Report on Form 10-K, including, without limitation, those described under Item 1A. “Risk Factors,” and other documents filed or furnished from time to time by the Company with the SEC (and are available on our website at investors.bankwithsouthern.com and on the SEC’s website at www.sec.gov) could affect the Company’s financial performance and cause the Company’s actual results for future periods to differ materially from any opinions or statements expressed with respect to future periods in any current statements. We undertake no obligation to publicly update or revise any forward-looking statements or to update the reasons why actual results could differ from those contained in such statements, whether as a result of new information, future events or otherwise. In light of these risks, uncertainties and assumptions, the forward-looking statements discussed might not occur, and you should not put undue reliance on any forward-looking statements. Financial Data Financial information presented as of and for the first quarter fiscal 2026 and as of September 30, 2025, is provided on a preliminary basis and is unaudited. Non-GAAP Financial Measures Tangible common equity, tangible book value per common share, core diluted earnings per common share, and core net interest margin are financial measures determined by methods other than in accordance with accounting principles generally accepted in the United States (GAAP). These non-GAAP financial measures are supplemental and not a substitute for an analysis based on GAAP measures. As other companies may use different calculations for these measures, this presentation may not be comparable to other similarly titled measures used by other companies. We calculate tangible common equity by excluding the balance of intangible assets from common stockholders’ equity. We calculate tangible book value per common share by dividing tangible common equity by common shares outstanding, less restricted common shares not vested, as compared to book value per common share, which we calculate by dividing common stockholders’ equity by common shares outstanding, less restricted common shares not vested. We believe that this is consistent with the treatment by bank regulatory agencies, which generally exclude intangible assets from the calculation of risk-based capital ratios. We calculate core diluted earnings per common share by excluding from net interest income the accretion of fair value discount on the acquired loan portfolio and amortization of fair value premium on the acquired time deposit portfolio resulting from the fiscal 2015 Peoples acquisition, the fiscal 2017 Capaha acquisition, the fiscal 2018 SMB-Marshfield acquisition, the fiscal 2019 First Commercial acquisition, the fiscal 2020 Central acquisition, the fiscal 2022 FortuneBank acquisition, and the fiscal 2023 Citizens acquisition. We also exclude from noninterest expense the acquisition expenses we incurred during fiscal years 2020, 2022, 2023 and 2024 year to date resulting from these acquisitions. We believe that core diluted earnings per common share is useful in assessing our core operating performance, particularly when comparing periods or when comparing our operating performance to the operating performance of our industry peers. We calculate core net interest margin by excluding from net interest income the accretion of fair value discount on the acquired loan portfolio and amortization of fair value premium on the acquired time deposit portfolio resulting from the Peoples acquisition, the Capaha acquisition, the SMB-Marshfield acquisition, the First Commercial acquisition, the Central acquisition, the FortuneBank acquisition, and the Citizens acquisition. We believe that each of these non-GAAP financial measures provides information that is important to investors and that is useful in understanding our capital position and ratios. Reconciliations of the non-GAAP measures of tangible common equity, tangible book value per common share, core diluted earnings per common share, and core net interest margin to the GAAP measures of common stockholders’ equity, book value per common share, diluted earnings per common share, and net interest margin are set forth below. Important Statements |
|
Important Statements |
|
Important Statements |
|
Stefan Chkautovich Executive Vice President and Chief Financial Officer Thank You. Matt Funke President and Chief Administrative Officer Greg Steffens Chairman and Chief Executive Officer |