UNITED STATES
SECURITIES AND EXCHANGE COMMISSION
WASHINGTON, D.C. 20549
FORM 8-K
CURRENT REPORT
PURSUANT TO SECTION 13 OR 15(D) OF
THE SECURITIES EXCHANGE ACT OF 1934
Date of Report (Date of earliest event reported): November 10, 2025
Orange County Bancorp, Inc.
(Exact Name of Registrant as Specified in Charter)
| Delaware | 001-40711 | 26-1135778 |
| (State or Other Jurisdiction) | (Commission File No.) | (I.R.S. Employer |
| of Incorporation) | Identification No.) |
| 212 Dolson Avenue, Middletown, New York | 10940 |
| (Address of Principal Executive Offices) | (Zip Code) |
Registrant's telephone number, including area code: (845) 341-5000
Not Applicable
(Former name or former address, if changed since last report)
Check the appropriate box below if the Form 8-K filing is intended to simultaneously satisfy the filing obligation of the registrant under any of the following provisions (see General Instruction A.2. below):
| ¨ | Written communications pursuant to Rule 425 under the Securities Act (17 CFR 230.425) |
| ¨ | Soliciting material pursuant to Rule 14a-12 under the Exchange Act (17 CFR 240.14a-12) |
| ¨ | Pre-commencement communications pursuant to Rule 14d-2(b) under the Exchange Act (17 CFR 240.14d-2(b)) |
| ¨ | Pre-commencement communications pursuant to Rule 13e-4(c) under the Exchange Act (17 CFR 240.13e-4(c)) |
Securities registered pursuant to Section 12(b) of the Act:
| Title of each class |
Trading Symbol(s) |
Name of each exchange on which registered |
||
| Common Stock, par value $0.25 | OBT | The Nasdaq Stock Market, LLC |
Indicate by check mark whether the registrant is an emerging growth company as defined in Rule 405 of the Securities Act of 1933 (§230.405 of this chapter) or Rule 12b-2 of the Securities Exchange Act of 1934 (§240.12b-2 of this chapter).
Emerging growth company x
If an emerging growth company, indicate by check mark if the registrant has elected not to use the extended transition period for complying with any new or revised financial accounting standards provided pursuant to Section 13(a) of the Exchange Act. ¨
| Item 7.01 | Regulation FD Disclosure |
On November 10, 2025, Orange County Bancorp, Inc. (the “Company”), parent company of Orange Bank & Trust Company and Orange Investment Advisors, Inc. made available and distributed to analysts and prospective investors a slide presentation. The slide presentation will be reviewed with certain analysts and certain institutional investors at the Piper Sandler Financial Services Conference on November 11, 2025. The presentation materials include information regarding the Company’s operating and growth strategies and financial performance. The slide presentation is furnished in this Current Report on Form 8-K, pursuant to this Item 7.01, as Exhibit 99.1, and is incorporated herein by reference.
This Current Report and the information included below and furnished as exhibits hereto shall
not be deemed to be “filed” for purposes of Section 18 of the Securities Exchange Act of 1934, as amended (“Exchange
Act”), nor shall it be incorporated by reference into a filing under the Securities Act of 1933, as amended, or the Exchange Act,
except as expressly set forth by specific reference in such a filing. The furnishing of the information in this Current Report is not
intended to, and does not, constitute a determination or admission by the Company that the information in this report is material or complete,
or that investors should consider this information before making an investment decision with respect to any security of the Company or
any of its affiliates.
| Item 9.01 | Financial Statements and Exhibits |
| (a) | Financial statements of businesses acquired. None. | |||
| (b) | Pro forma financial information. None. | |||
| (c) | Shell company transactions: None. | |||
| (d) | Exhibits. | |||
| 99.1 | Presentation Materials of Orange County Bancorp, Inc. | |||
| 104 | Cover Page Interactive Data File (embedded in the cover page formatted in Inline XBRL) | |||
SIGNATURES
Pursuant to the requirements of the Securities Exchange Act of 1934, the registrant has duly caused this report to be signed on its behalf by the undersigned, hereunto duly authorized.
| ORANGE COUNTY BANCORP, INC. | ||
| DATE: November 10, 2025 | By: | /s/ Michael Lesler |
| Michael Lesler | ||
| Executive Vice President, Chief Financial Officer | ||
Exhibit 99.1
INVESTOR Presentation November 2025 Results for the Third Quarter, 2025
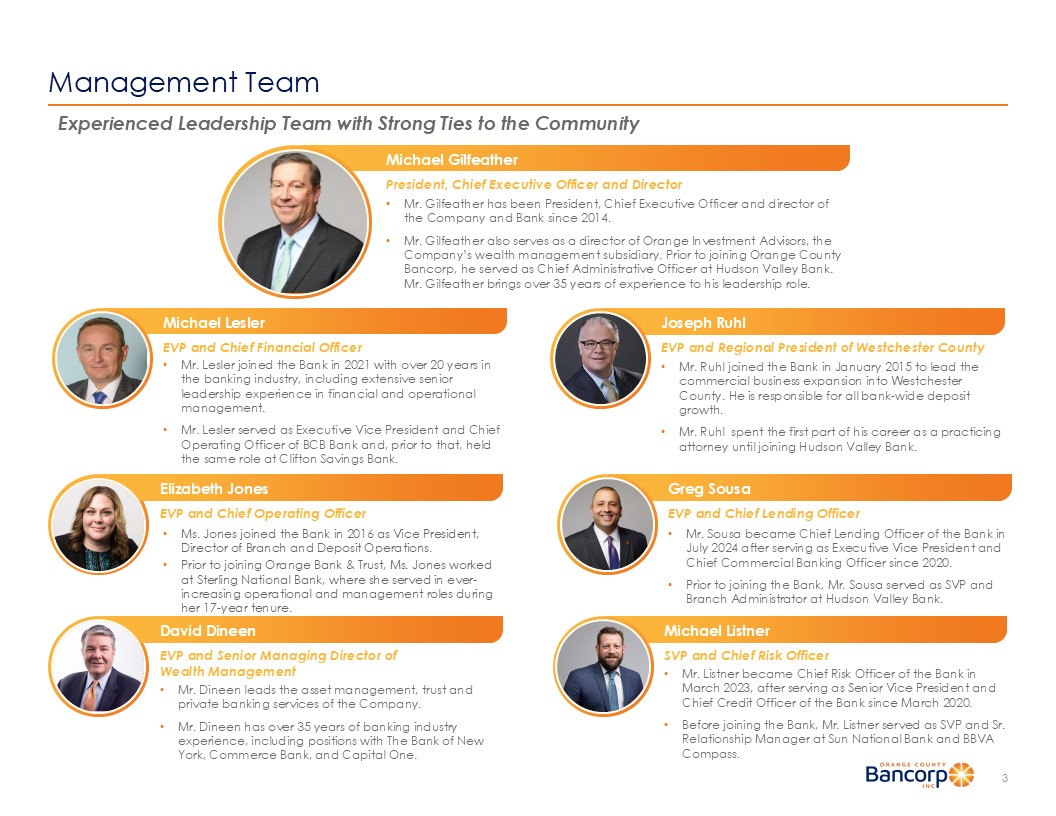
Safe Harbor Statement and Disclaimer Forward - Looking Statements This presentation and any other written or oral statements made by us from time to time may contain forward - looking statements w ithin the meaning of the Private Securities Litigation Reform Act of 1995, which may be identified by the use of such words as “may,” “believe,” “expect,” “anticipate,” “consider,” “should,” “pl an, ” “estimate,” “predict,” “continue,” “probable,” and “potential” or the negative of these terms or other comparable terminology. These statements include statements with respect to the Company, Or ange Bank & Trust Company (the “Bank”) and Orange Investment Advisors, Inc. (“OIA”) and our strategies, plans, objectives, expectations and intentions and other statements in thi s presentation. These statements are not guarantees of future performance and are subject to risks, uncertainties and other factors (many of which are beyond the Company’s control) that c oul d cause actual results to differ materially from future results expressed or implied by such forward - looking statements. For more information about factors that could cause actual results to d iffer from those discussed in the forward - looking statements, please refer to the “Risk Factors” and “Management's Discussion and Analysis of Financial Condition and Results of Operations” secti ons of and the forward - looking statement disclaimers in the Company’s annual and quarterly reports filed with the SEC. All forward - looking statements are subject to risks, uncertainties and other factors that may cause the actual results, performa nce or achievements of the Company to differ materially from any results expressed or implied by such forward - looking statements. Such factors include, among others: (i) general economic conditions, ei ther nationally or in our market areas, that are worse than expected; (ii) changes in the level and direction of loan delinquencies and write - offs and changes in estimates of the adequacy of the all owance for credit losses; (iii) our ability to access cost - effective funding; (iv) fluctuations in real estate values and both residential and commercial real estate market conditions; (v) deman d f or loans and deposits in our market area; (vi) our ability to implement and change our business strategies; (vii) competition among depository and other financial institutions; (viii) inflation, ta rif fs, recession, and changes in the interest rate environment that reduce our margins or reduce the fair value of financial instruments; (ix) the effects of any turmoil or negative news in the banking in dus try; (x) the rate of delinquencies and amounts of loans charged - off; (xi) fluctuations in real estate values and both residential and commercial real estate market conditions; (xii) adverse changes i n t he securities markets; (xiii) fluctuations in the stock market, including those that may have an adverse effect on transaction fees, client activity and client investment portfolio gains and losses r ela ted to our trust and wealth management business; (xiv) changes in laws or government regulations or policies affecting financial institutions, including changes in regulatory fees and capital requ ire ments; (xv) our ability to enter new markets successfully and capitalize on growth opportunities; (xvi) our ability to capitalize on strategic opportunities; (xvii) our ability to successfully introduc e n ew products and services; (xviii) our ability to successfully integrate into our operations any assets, liabilities, customers, systems and management personnel we may acquire and our ability to realize rel ate d revenue synergies and cost savings within expected time frames, and any goodwill charges related thereto; (xix) our ability to retain our existing customers; (xx) our ability to prevent or mit igate fraudulent activity; (xxi) changes in consumer spending, borrowing and savings habits; (xxii) changes in accounting policies and practices, as may be adopted by the bank regulatory agencies, the F ina ncial Accounting Standards Board, the Securities and Exchange Commission or the Public Company Accounting Oversight Board; (xxiii) changes in our organization, compensation and benefit pl ans ; (xxiv) changes in the quality or composition of our loan or investment portfolios; (xxv) a breach in security of our information systems, including the occurrence of a cyber incident or a deficiency in cyber security; (xxvi) political instability or civil unrest; (xxvii) acts of war or terrorism or pandemics; (xxviii) competition and innovation with respect to financial products and services by ba nks, financial institutions and non - traditional providers, including retail businesses and technology companies; (xxix) the failure to attract and retain skilled people; (xxx) the fiscal and monetary p oli cies of the federal government and its agencies; (xxxi) any future FDIC insurance premium increases, or special assessment may adversely affect our earnings; and (xxxii) other economic, competitive , g overnmental, regulatory and operational factors affecting our operations. Industry Information This presentation includes statistical and other industry and market data that we obtained from government reports and other thi rd - party sources. Our internal data, estimates, and forecasts are based on information obtained from government reports, trade and business organizations and other contacts in the markets in whi ch we operate and our management’s understanding of industry conditions. Although we believe that this information (including the industry publications and third party research, surveys, an d studies) is accurate and reliable, we have not independently verified such information. In addition, estimates, forecasts and assumptions are necessarily subject to a high degree of uncertainty a nd risk due to a variety of factors. Finally, forward - looking information obtained from these sources is subject to the same qualifications and the additional uncertainties regarding the other forwar d - l ooking statements in this presentation. Non - GAAP Financial Measures In addition to financial measures presented in accordance with U.S. generally accepted accounting principles (“GAAP”), we pre sen t non - GAAP financial measures, such as tangible shareholders’ equity to tangible assets, tangible book value per share and efficiency ratios to help us describe our operating performance. Ou r presentation of these non - GAAP measures is intended as a supplemental measure of our performance that is not required by, or presented in accordance with, GAAP. These non - GAAP measures should not be considered as an alternative to performance measures derived in accordance with U.S. GAAP. See slides 29 - 30 of this presentation for a reconciliation of these non - GAAP meas ures to the most directly comparable GAAP financial measures. 2 • Mr. Sousa became Chief Lending Officer of the Bank in July 2024 after serving as Executive Vice President and Chief Commercial Banking Officer since 2020. • Prior to joining the Bank, Mr. Sousa served as SVP and Branch Administrator at Hudson Valley Bank. Greg Sousa EVP and Chief Lending Officer Management Team 3 Experienced Leadership Team with Strong Ties to the Community • Mr. Gilfeather has been President, Chief Executive Officer and director of the Company and Bank since 2014. • Mr. Gilfeather also serves as a director of Orange Investment Advisors, the Company’s wealth management subsidiary. Prior to joining Orange County Bancorp, he served as Chief Administrative Officer at Hudson Valley Bank. Mr. Gilfeather brings over 35 years of experience to his leadership role. President, Chief Executive Officer and Director Michael Gilfeather • Mr. Listner became Chief Risk Officer of the Bank in March 2023, after serving as Senior Vice President and Chief Credit Officer of the Bank since March 2020. • Before joining the Bank, Mr. Listner served as SVP and Sr. Relationship Manager at Sun National Bank and BBVA Compass. Michael Listner SVP and Chief Risk Officer • Mr. Lesler joined the Bank in 2021 with over 20 years in the banking industry, including extensive senior leadership experience in financial and operational management. • Mr. Lesler served as Executive Vice President and Chief Operating Officer of BCB Bank and, prior to that, held the same role at Clifton Savings Bank. Michael Lesler E VP and Chief Financial Officer • Mr. Ruhl joined the Bank in January 2015 to lead the commercial business expansion into Westchester County. He is responsible for all bank - wide deposit growth. • Mr. Ruhl spent the first part of his career as a practicing attorney until joining Hudson Valley Bank. Joseph Ruhl EVP and Regional President of Westchester County • Mr. Dineen leads the asset management, trust and private banking services of the Company. • Mr. Dineen has over 35 years of banking industry experience, including positions with The Bank of New York, Commerce Bank, and Capital One. David Dineen EVP and Senior Managing Director of Wealth Management • Ms. Jones joined the Bank in 2016 as Vice President, Director of Branch and Deposit Operations. • Prior to joining Orange Bank & Trust, Ms. Jones worked at Sterling National Bank, where she served in ever - increasing operational and management roles during her 17 - year tenure. Elizabeth Jones EVP and Chief Operating Officer

Investment Highlights 4 1) For the quarter ended September 30, 2025. Source: S&P Capital IQ Pro. Strong and Experienced Management Team Successful and Ongoing Expansion of Market Footprint Highly Attractive Market Geography and Scarcity Value of Franchise Ability to Take Advantage of M&A Driven Market Disintermediation Stable, Low - Cost Deposit Base: 51% Transaction Accounts, 113 bps Total Cost 1 Demonstrated Loan Growth Driven by Relationship - Based Model Complementary Offerings in Private Banking and Trust & Wealth Businesses Consistent and Very Strong Financial Metrics Best in Class Business Technology Franchise Overview 5 1) There are 2 branches located in Middletown and 2 branches located in the Bronx.
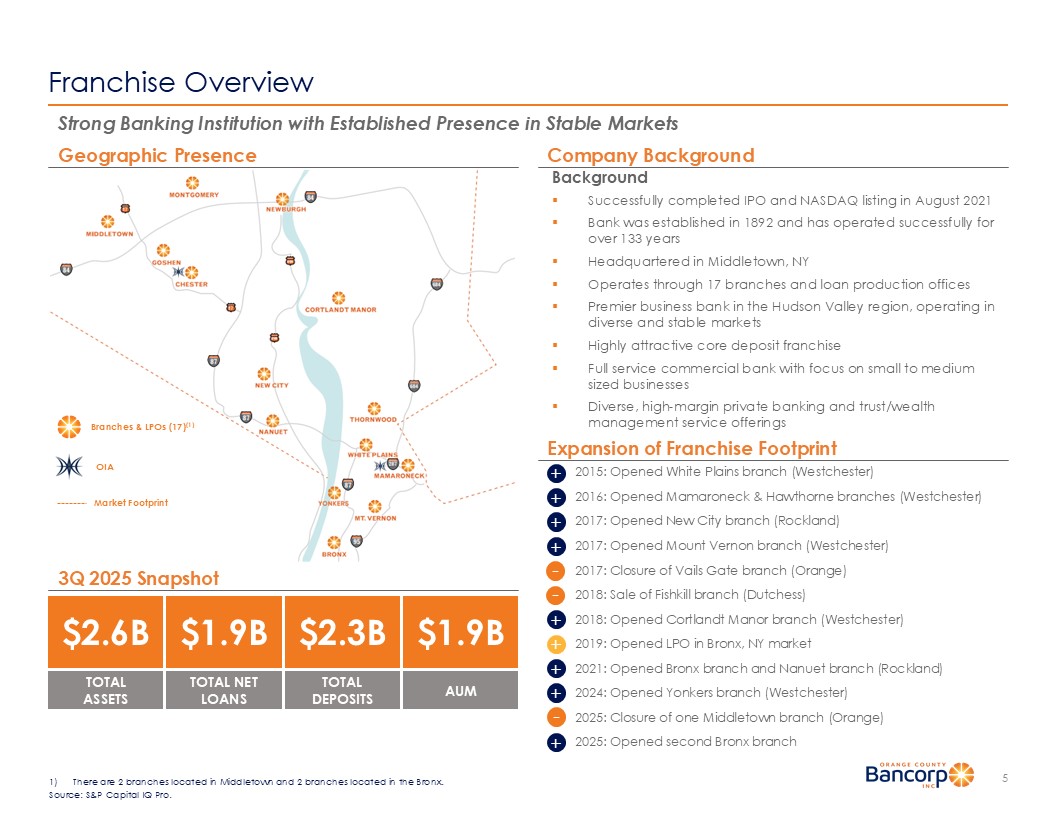
Source: S&P Capital IQ Pro. Background ▪ Successfully completed IPO and NASDAQ listing in August 2021 ▪ Bank was established in 1892 and has operated successfully for over 133 years ▪ Headquartered in Middletown, NY ▪ Operates through 17 branches and loan production offices ▪ Premier business bank in the Hudson Valley region, operating in diverse and stable markets ▪ Highly attractive core deposit franchise ▪ Full service commercial bank with focus on small to medium sized businesses ▪ Diverse, high - margin private banking and trust/wealth management service offerings Strong Banking Institution with Established Presence in Stable Markets Geographic Presence $1.9B TOTAL NET LOANS Company Background 3Q 2025 Snapshot - + + + + + + + - - 2015: Opened White Plains branch (Westchester) 2016: Opened Mamaroneck & Hawthorne branches (Westchester) 2017: Opened New City branch (Rockland) 2017: Opened Mount Vernon branch (Westchester) 2017: Closure of Vails Gate branch (Orange) 2018: Sale of Fishkill branch (Dutchess) 2018: Opened Cortlandt Manor branch (Westchester) 2019: Opened LPO in Bronx, NY market 2021: Opened Bronx branch and Nanuet branch (Rockland) 2024: Opened Yonkers branch (Westchester) 2025: Closure of one Middletown branch (Orange) 2025: Opened second Bronx branch Branches & LPOs (17) (1) Market Footprint Expansion of Franchise Footprint OIA + $2.3B TOTAL DEPOSITS $2.6B TOTAL ASSETS $1.9B AUM + 1HZ<RUN 3ULYDWH % 7& 2UDQJH ;&RXQW\%DQFRUS 1RUWKHDVW&RPPXQLW\ :DOGHQ6DYLQJV%DQN 7RPSNLQV)LQDQFLDO 7UXVW&R%DQN&RUS :DOONLOO9DOOH\0+& 5LGJHZRRG6% 5KLQHEHFN0+& 7%%,QYHVWPHQWV//& )LUVW)HGHUDO6DYLQJV )LUVW*UHHQZLFK)LQDQFLDO 9HFWD,QF ,%&%DQFRUS,QF 8OVWHU6% Franchise Located in Highly Attractive Markets 6 Attractive Demographics in a Large, Growing Addressable Market Median Household Income ($000s) 1) Lower Hudson Valley comprised of Orange, Westchester, and Rockland counties.
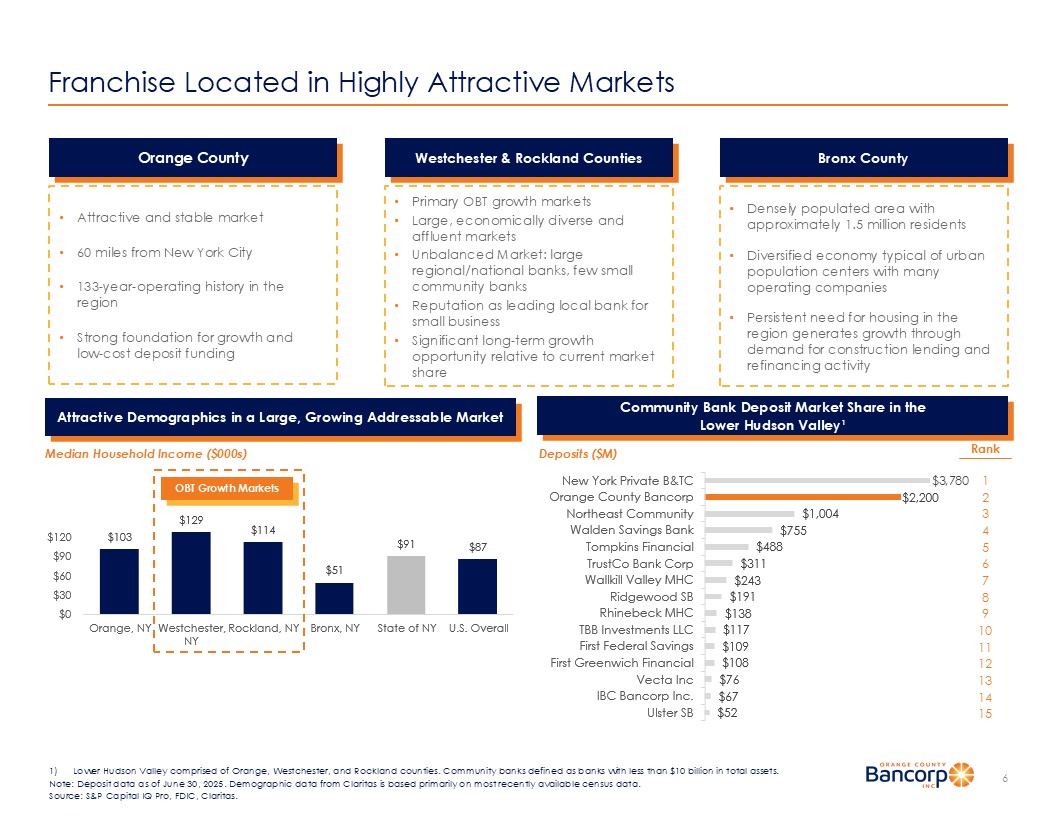
Community banks defined as banks with less than $10 billion in total assets. Note: Deposit data as of June 30, 2025. Demographic data from Claritas is based primarily on most recently available census d ata . Source: S&P Capital IQ Pro, FDIC, Claritas . 2UDQJH 1< :HVWFKHVWHU 1< 5RFNODQG 1< %URQ[ 1< 6WDWHRI1< 8 6 2YHUDOO OBT Growth Markets Orange County Westchester & Rockland Counties Bronx County • Attractive and stable market • 60 miles from New York City • 133 - year - operating history in the region • Strong foundation for growth and low - cost deposit funding • Primary OBT growth markets • Large, economically diverse and affluent markets • Unbalanced Market: large regional/national banks, few small community banks • Reputation as leading local bank for small business • Significant long - term growth opportunity relative to current market share • Densely populated area with approximately 1.5 million residents • Diversified economy typical of urban population centers with many operating companies • Persistent need for housing in the region generates growth through demand for construction lending and refinancing activity Community Bank Deposit Market Share in the Lower Hudson Valley¹ Deposits ($M) Rank 1 2 3 4 5 6 7 8 9 10 11 12 13 14 15 $3,780 Structure & Scope Balanced, Client - Driven Business Model 7 Business Banking Orange Wealth Management • 17 branches and LPOs • Focus on small to medium size businesses, professionals, and non - profit entities in the communities served • Seasoned lenders with significant regional and industry expertise • Comprehensive product offering • Full treasury management suite Key Metrics $1.9 billion net loans $2.3 billion deposits • Launched in mid 2017 • Division of Orange Bank & Trust • Client - driven service linking our four primary product areas 1) Deposits with Cash Management / Treasury Services 2) Investment Advisory Services (through OIA) 3) Trust, Estate and Custody Services 4) Loans (Commercial and/or Residential) Approximately 700 Clients • Subsidiary of Orange County Bancorp, Inc. • Acquired in late 2012 from Sterling Bancorp • SEC registered Investment Advisor $1.9 billion AUM • Founding division of the Bank • Traditional trust & administration services to local clients • Niche focus on Special Needs Trust and Guardianship services Note: Key metrics as of September 30, 2025. Source: Company documents. Client - Driven Service Unifies Three Unique Product Areas Private Banking

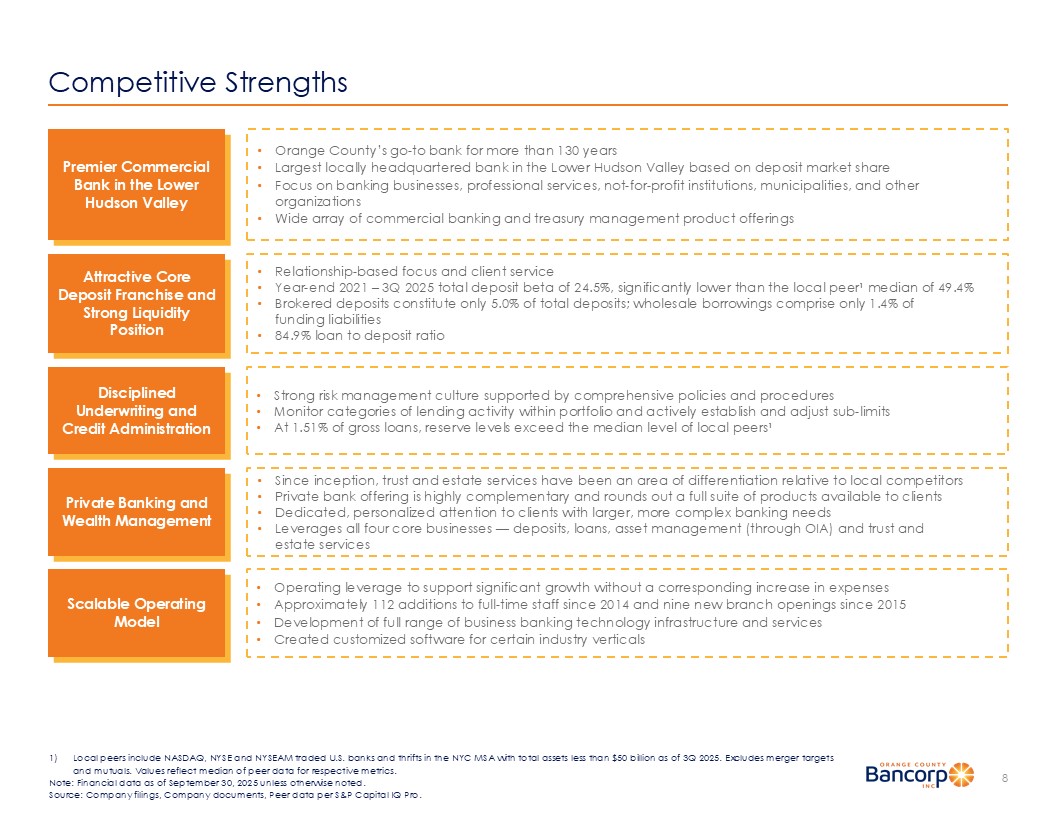
Competitive Strengths 8 1) Local peers include NASDAQ, NYSE and NYSEAM traded U.S. banks and thrifts in the NYC MSA with total assets less than $50 bill ion as of 3Q 2025. Excludes merger targets and mutuals. Values reflect median of peer data for respective metrics. Note: Financial data as of September 30, 2025 unless otherwise noted. Source: Company filings, Company documents, Peer data per S&P Capital IQ Pro. Premier Commercial Bank in the Lower Hudson Valley • Orange County’s go - to bank for more than 130 years • Largest locally headquartered bank in the Lower Hudson Valley based on deposit market share • Focus on banking businesses, professional services, not - for - profit institutions, municipalities, and other organizations • Wide array of commercial banking and treasury management product offerings Attractive Core Deposit Franchise and Strong Liquidity Position • Relationship - based focus and client service • Year - end 2021 – 3Q 2025 total deposit beta of 24.5%, significantly lower than the local peer¹ median of 49.4% • Brokered deposits constitute only 5.0% of total deposits; wholesale borrowings comprise only 1.4% of funding liabilities • 84.9% loan to deposit ratio Scalable Operating Model • Operating leverage to support significant growth without a corresponding increase in expenses • Approximately 112 additions to full - time staff since 2014 and nine new branch openings since 2015 • Development of full range of business banking technology infrastructure and services • Created customized software for certain industry verticals Private Banking and Wealth Management • Since inception, trust and estate services have been an area of differentiation relative to local competitors • Private bank offering is highly complementary and rounds out a full suite of products available to clients • Dedicated, personalized attention to clients with larger, more complex banking needs • Leverages all four core businesses — deposits, loans, asset management (through OIA) and trust and estate services Disciplined Underwriting and Credit Administration • Strong risk management culture supported by comprehensive policies and procedures • Monitor categories of lending activity within portfolio and actively establish and adjust sub - limits • At 1.51% of gross loans, reserve levels exceed the median level of local peers¹ Business Strategy 9 Note: Financial data as of September 30, 2025 unless otherwise noted.

Course: Company filings, S&P Capital IQ Pro. Leverage Relationships to Drive Organic Growth Derive Loan Growth Through Relationship - Based Model Continue to Grow Core Deposit Franchise Continue to Build Fee - Based Business Strategic Expansion / Opportunistic M&A • Seek trusted advisor role with clients as they build their businesses with the Bank’s resources and support • The Bank’s historical success has been closely tied to that of its clients and the communities it serves • Majority of loan growth comes from existing clients and referrals • Direct access to senior management offers customers quicker response time on loan applications and other transactions • Differentiated level of service provides a pricing advantage, often resulting in higher loan rates • Core deposits (which includes all deposits except certificates of deposit) comprise 95.0% of total funding, attributed to the Bank’s long - standing relationships with clients • Cash management has helped the Bank expand depth and efficiency of deposit product offerings • By continuing to broaden its suite of business services, deposits and loans grew 6.5% and 7.8% year over year as of 3Q 2025, respectively • Strategic Expansion: Ongoing investments in Rockland, Westchester and Bronx Counties continue to be significant drivers of growth & profitability • Capitalize on Market Disruption: Consolidation from the sales/mergers of Signature Bank, The Westchester Bank, Sterling National Bank, Hudson Valley Bank, Hometown Bank, Greater Hudson Bank, Catskill Hudson Bank and PCSB Bank presents opportunities to hire seasoned bankers and capture market share • Opportunistic M&A: Could include fee - based business, whole bank or branch acquisitions that would improve market position in geographies with attractive demographics • Having recently reached $1.9 billion in combined AUM in 3Q 2025, the Company’s trust and advisory services businesses provide a strong foundation of fee - based revenue • Company intends to further expand OIA’s services into Westchester and Rockland counties • Private Banking service enables approximately 700 clients to leverage the resources of the platform <7' <7' Transformation, Significant Growth and Expansion 10 Significant Investments in People, Systems and Footprint Expansion… … Has Led to Enhanced Profitability and Peer Outperformance FTE Count Best in Class Profitability Return on Average Assets (%) Noninterest Expense ($M) 1) Non - GAAP financial metric.

See slides 29 and 30 for applicable reconciliation. 2) Bank level Call Report data. 3) Local peers include NASDAQ, NYSE and NYSEAM traded U.S. banks and thrifts in the NYC MSA with total assets less than $50 billion as of 3Q 2025. Excludes merger targets and mutuals. Values reflect median of peer data for respective metrics. <7' 2%7 /RFDO3HHUV ó Profitability 4.09% NIM 1.51% ROAA 17.48% ROAE 55.70% Efficiency Ratio¹ 10.04% TCE / TA¹ 12.31% Tier 1 Leverage² (Bank Level) 16.77% Tier 1 Capital Ratio² (Bank Level) 18.02% Total Capital Ratio² (Bank Level) 0.15% NCOs / Average Loans 0.46% NPAs / Assets 1.51% Loan Loss Reserves / Gross Loans Regulatory Capital Asset Quality September 30, 2025 Financial Snapshot Note: Financial data as of or for the nine months ended September 30, 2025 unless otherwise noted. Data as of December 31 for respective years. Source: S&P Capital IQ Pro, Company filings, Peer data per S&P Capital IQ Pro. Return on Average Equity (%) <7' 2%7 /RFDO3HHUV ó <7' <7' <7' <7' Consistent History of Growth 11 Note: Financial data as of the nine months ended September 30, 2025 unless otherwise noted.
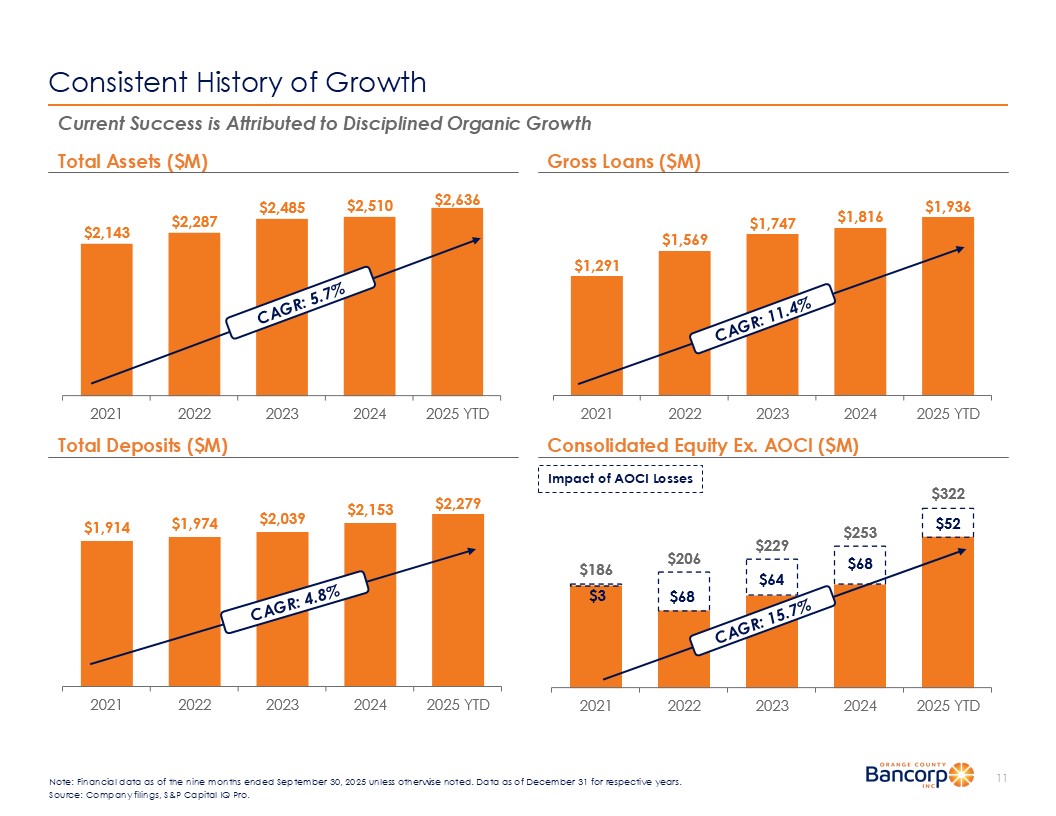
Data as of December 31 for respec tiv e years. Source: Company filings, S&P Capital IQ Pro. Current Success is Attributed to Disciplined Organic Growth Gross Loans ($M) Total Assets ($M) Consolidated Equity Ex.
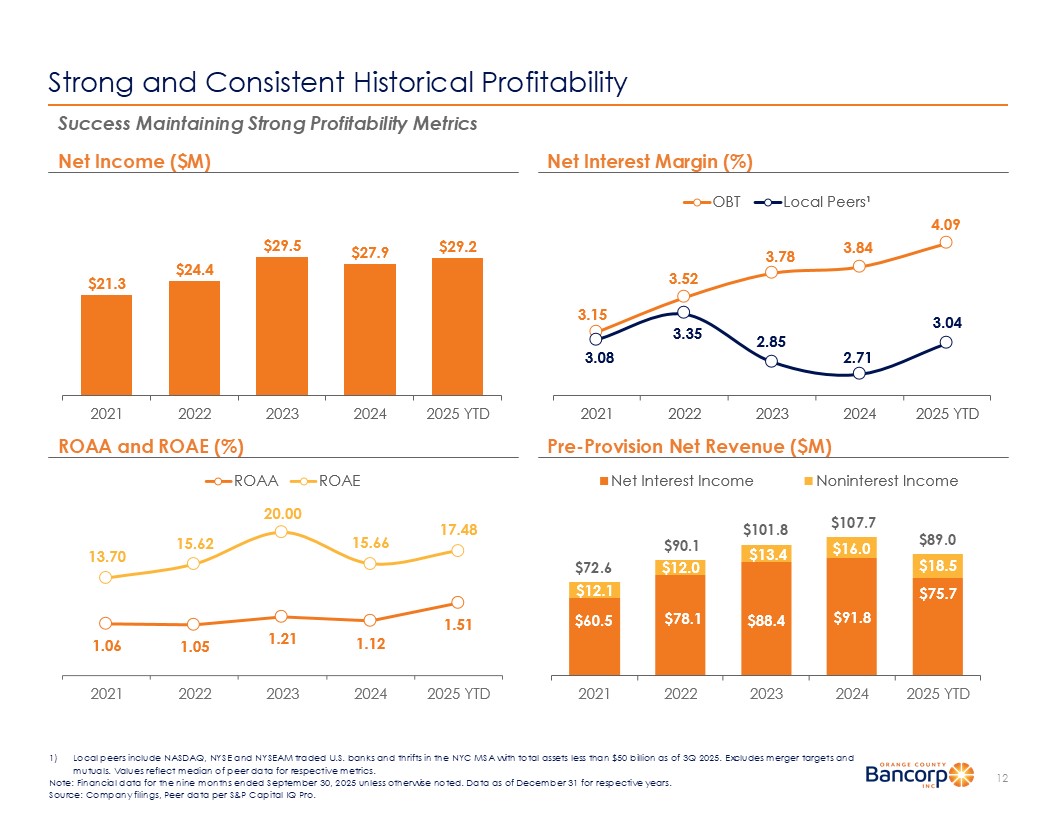
AOCI ($M) Total Deposits ($M) Impact of AOCI Losses <7' <7' 2%7 /RFDO3HHUV ñ Strong and Consistent Historical Profitability 12 Net Interest Margin (%) Net Income ($M) Pre - Provision Net Revenue ($M) ROAA and ROAE (%) Success Maintaining Strong Profitabilit y Metrics 1) Local peers include NASDAQ, NYSE and NYSEAM traded U.S. banks and thrifts in the NYC MSA with total assets less than $50 bill ion as of 3Q 2025. Excludes merger targets and mutuals. Values reflect median of peer data for respective metrics. Note: Financial data for the nine months ended September 30, 2025 unless otherwise noted. Data as of December 31 for respecti ve years. Source: Company filings, Peer data per S&P Capital IQ Pro. <7' 52$$ 52$( <7' 1HW,QWHUHVW,QFRPH 1RQLQWHUHVW,QFRPH $72 .6 $9 0.1 $ 101.8 $107.7 $89.0 <7' <7' <7' <7' Stable Regulatory Capital Position 13 1) Non - GAAP financial metric.
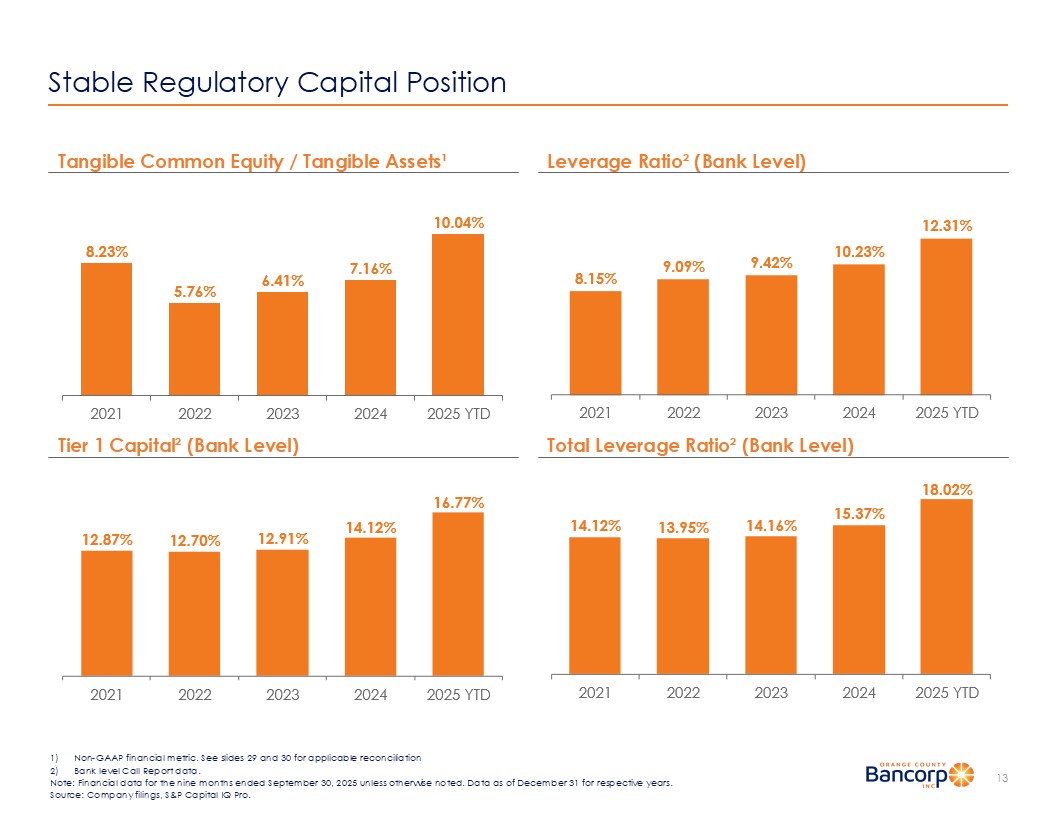
See slides 29 and 30 for applicable reconciliation 2) Bank level Call Report data. Note: Financial data for the nine months ended September 30, 2025 unless otherwise noted. Data as of December 31 for respecti ve years. Source: Company filings, S&P Capital IQ Pro. Leverage Ratio² (Bank Level) Tangible Common Equity / Tangible Assets¹ Total Leverage Ratio² (Bank Level) Tier 1 Capital² (Bank Level)

<7' <7' 6HUYLFH&KDUJHV RQ'HSRVLWV 7UXVW,QFRPH ,QYHVWPHQW$GYLVRU\ +9,$ (DUQLQJV RQ%2/, 3URFHHGV IURP%2/, *DLQRQ6DOH RI$VVHWV ò 2WKHU ,QYHVWPHQW &RPSDQ\ ,QGLYLGXDOV 3URILWVKDULQJ &RUSRUDWLRQV +LJK1HW:RUWK &KDULW\ 2WKHU ó Diversified Revenue Sources 1) Based on annualized 3Q 2025 trust and investment advisory fee income. 2) “Gain on Sale of Assets” category includes $568 thousand loss on sale of investment securities and $1.2 million gain associated with the sale of branch location in 3Q 2025. 3) “Other” AUM category is comprised of Profit Sharing and State Entity assets Noninterest Income Composition Total AUM: $1.9 Billion AUM Composition Unique and complementary ability to offer private banking and wealth management services to OBT clients ▪ Client - driven success of the Orange Wealth Management initiative, which includes services offered by OIA, private banking and the trust department in a coordinated strategy for growth ▪ Trust Services (Division of the Bank): offering traditional trust and administration services to local clients and with a niche focus on Special Needs Trust and Guardianship service ▪ OIA: RIA offering asset management, financial planning and wealth management services Demonstrated Growth in Revenue & AUM Noninterest Income to Total Revenue: 15.6% OIA AUM: $1.23 Billion (64.5% of the total) Trust Dept. AUM: $675.3 Million (35.5% of the total) Total AUM ($B) 14 Total Noninterest Income : $18.5 Million Trust & Investment Advisory Fee Income ($M) Note: Financial data as of or for the nine months ended September 30, 2025 unless otherwise noted. Data as of December 31 for respective years. Source: Company filings, Company documents.

:HVWFKHVWHU 2UDQJH %URQ[ 2WKHU1< &RXQWLHV 2WKHU 5RFNODQG 1HZ-HUVH\ 0DQKDWWDQ &5( & , &5( &RQVWUXFWLRQ 5HVLGHQWLDO5( +RPH(TXLW\ &RQVXPHU Loan Composition 15 1) CRE and CRE Construction loans as a % of Total Risk - Based Capital. Reflects bank level Call Report data. 2) Reflects weighted average yield on loans for the nine months ended September 30, 2025, annualized. Note: Financial data as of September 30, 2025. Source: Company filings, Company documents. Total Loans: $1.9 Billion Commercial - Focused Portfolio with Conservative Concentrations ▪ Advantageous, relationship - based lending model through existing clients and referrals ▪ Syndicated loans represent less than 1.0% of total loans ▪ Purchased loan participations represent 4.7% of total loans ▪ Majority of lending occurs within market; ~90% of real estate secured loans are in market as of September 30, 2025 ▪ $489.9 million (or 25.4%) of loans are repricing or maturing within one year or less ▪ $1.8 billion (or 95.5%) of loans are repricing or maturing within five years Geographic Composition of RE Secured Loans Loan Portfolio Commentary 6.04% Yield on Loans² 374% CRE Concentration¹ (% of Risked - Based Capital) 36% CRE Construction Concentration¹ (% of Risked - Based Capital)
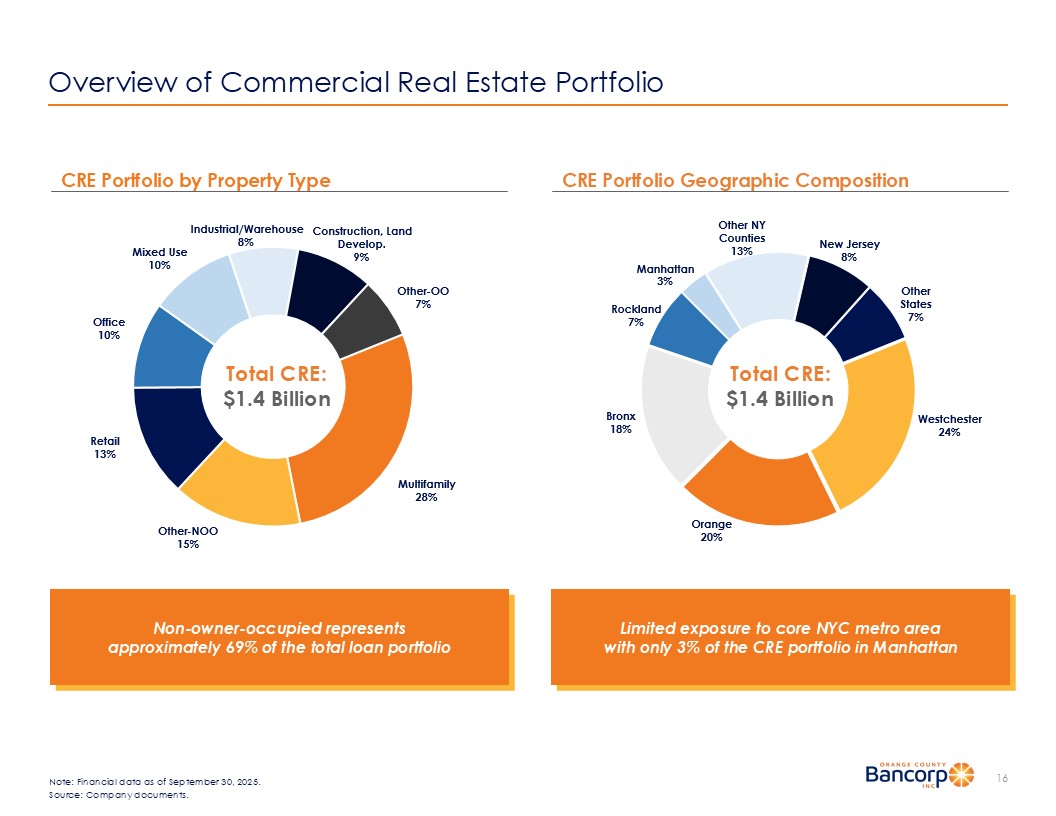
0XOWLIDPLO\ 2WKHU 122 5HWDLO 2IILFH 0L[HG8VH ,QGXVWULDO :DUHKRXVH &RQVWUXFWLRQ /DQG 'HYHORS 2WKHU 22 Overview of Commercial Real Estate Portfolio 16 Note: Financial data as of September 30, 2025. Source: Company documents. CRE Portfolio Geographic Composition CRE Portfolio by Property Type :HVWFKHVWHU 2UDQJH %URQ[ 5RFNODQG 0DQKDWWDQ 2WKHU1< &RXQWLHV 1HZ-HUVH\ 2WKHU 6WDWHV Total CRE: $1.4 Billion Total CRE: $1.4 Billion Limited exposure to core NYC metro area with only 3% of the CRE portfolio in Manhattan Non - owner - occupied represents approximately 69% of the total loan portfolio Overview of Multifamily Portfolio 17 Note: Financial data as of September 30, 2025.
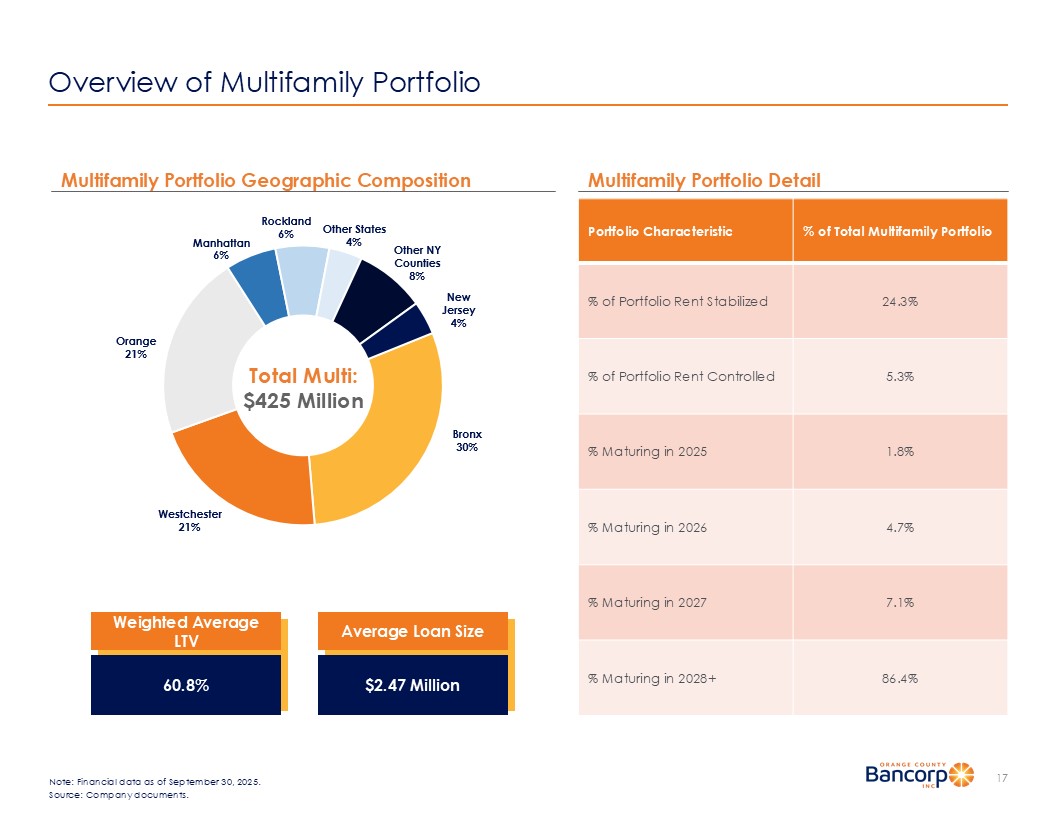
Source: Company documents. Multifamily Portfolio Detail Multifamily Portfolio Geographic Composition Weighted Average LTV 60.8% Average Loan Size $2.47 Million % of Total Multifamily Portfolio Portfolio Characteristic 24.3% % of Portfolio Rent Stabilized 5.3% % of Portfolio Rent Controlled 1.8% % Maturing in 2025 4.7% % Maturing in 2026 7.1% % Maturing in 2027 86.4% % Maturing in 2028+ %URQ[ :HVWFKHVWHU 2UDQJH 0DQKDWWDQ 5RFNODQG 2WKHU6WDWHV 2WKHU1< &RXQWLHV 1HZ -HUVH\ Total Multi: $425 Million Overview of CRE Office Portfolio 18 Note: Financial data as of September 30, 2025.
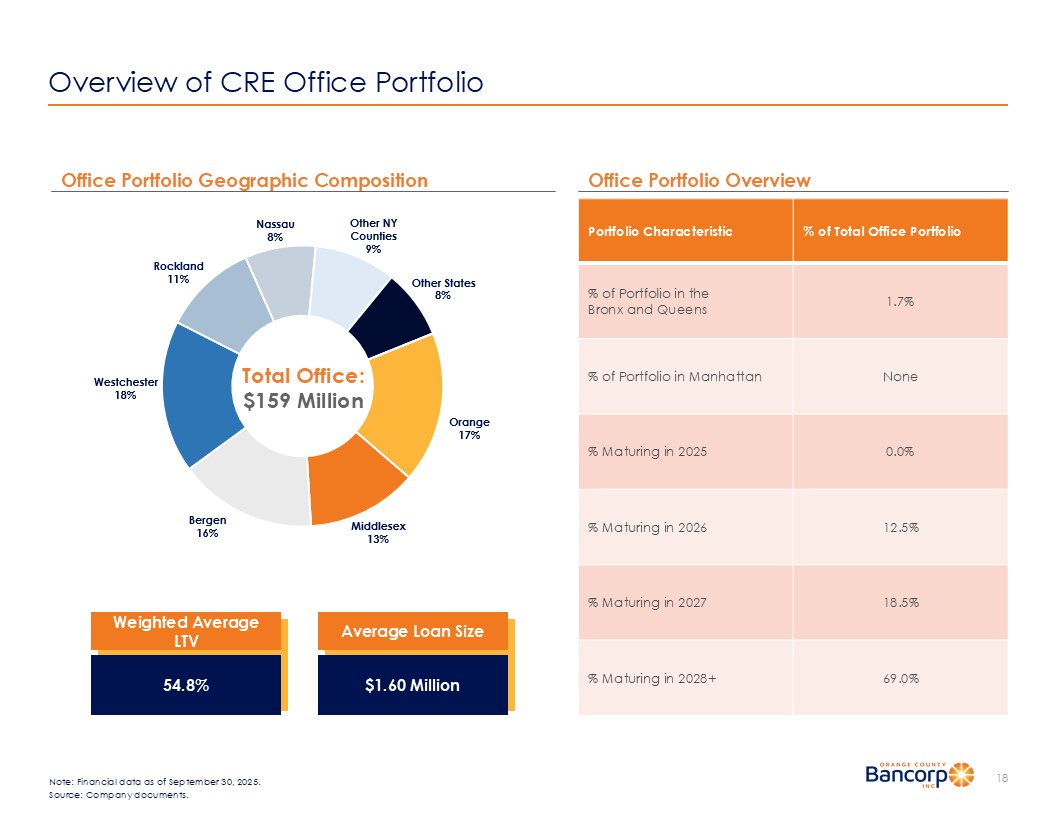
Source: Company documents. Office Portfolio Overview % of Total Office Portfolio Portfolio Characteristic 1.7% % of Portfolio in the Bronx and Queens None % of Portfolio in Manhattan 0.0% % Maturing in 2025 12.5% % Maturing in 2026 18.5% % Maturing in 2027 69.0% % Maturing in 2028+ Weighted Average LTV 54.8% Average Loan Size $1.60 Million 2UDQJH 0LGGOHVH[ %HUJHQ :HVWFKHVWHU 5RFNODQG 1DVVDX 2WKHU1< &RXQWLHV 2WKHU6WDWHV Total Office: $159 Million Office Portfolio Geographic Composition 2UDQJH :HVWFKHVWHU 2WKHU %HUJHQ 5RFNODQG 1DVVDX 2WKHU1< &RXQWLHV 2WKHU1- &RXQWLHV Overview of C&I Portfolio 19 Note: Financial data as of September 30, 2025.
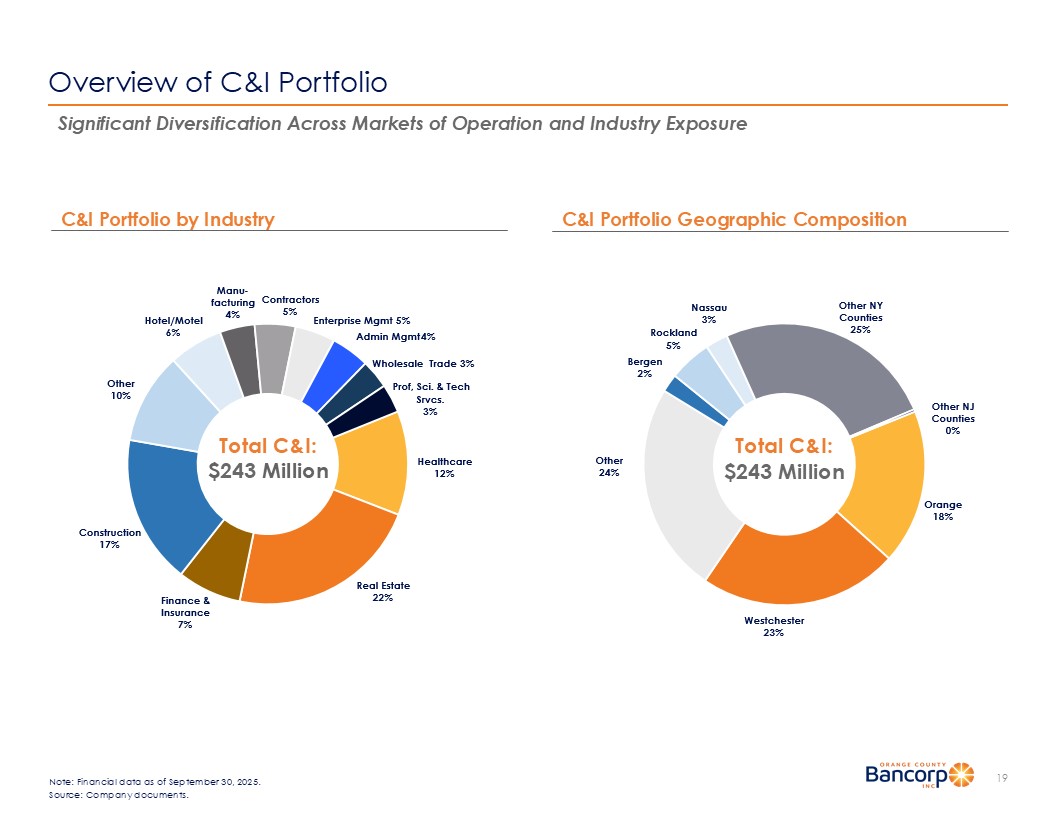
Source: Company documents.
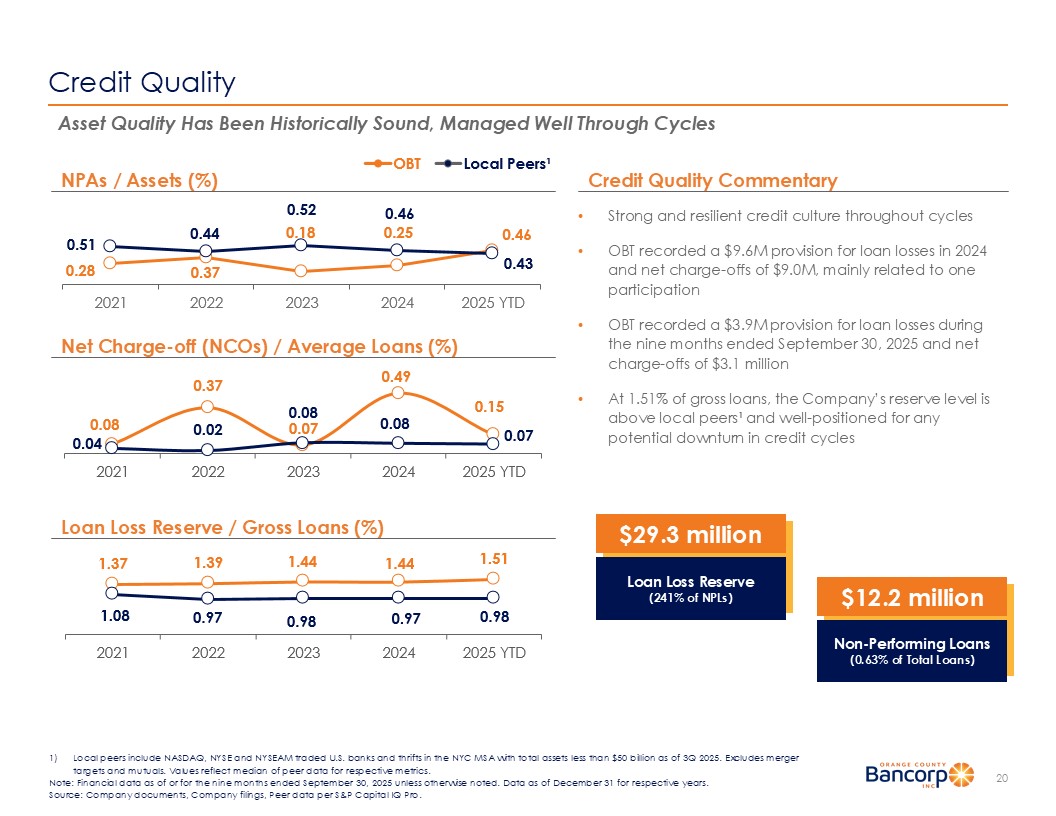
C&I Portfolio Geographic Composition C&I Portfolio by Industry Total C&I: $243 Million Total C&I: $ 243 Million Significant Diversification Across Markets of Operation and Industry Exposure +HDOWKFDUH 5HDO(VWDWH )LQDQFH ,QVXUDQFH &RQVWUXFWLRQ 2WKHU +RWHO 0RWHO 0DQX IDFWXULQJ (QWHUSULVH0JPW &RQWUDFWRUV $GPLQ0JPW :KROHVDOH7UDGH 3URI 6FL 7HFK 6UYFV Credit Quality 20 1) Local peers include NASDAQ, NYSE and NYSEAM traded U.S. banks and thrifts in the NYC MSA with total assets less than $50 bill ion as of 3Q 2025. Excludes merger targets and mutuals. Values reflect median of peer data for respective metrics. Note: Financial data as of or for the nine months ended September 30, 2025 unless otherwise noted. Data as of December 31 for re spective years. Source: Company documents, Company filings, Peer data per S&P Capital IQ Pro. Asset Quality Has Been Historically Sound, Managed Well Through Cycles • Strong and resilient credit culture throughout cycles • OBT recorded a $ 9.6 M provision for loan losses in 2024 and net charge - offs of $ 9.0M, mainly related to one participation • OBT recorded a $3.9M provision for loan losses during the nine months ended September 30, 2025 and net charge - offs of $3.1 million • At 1.51% of gross loans, the Company’s reserve level is above local peers¹ and well - positioned for any potential downturn in credit cycles Credit Quality Commentary <7' <7' NPAs / Assets (%) Net Charge - off (NCOs) / Average Loans (%) <7' Loan Loss Reserve / Gross Loans (%) 4 2%7 /RFDO3HHUV ñ $12.2 million Non - Performing Loans (0.63% of Total Loans) $29.3 million Loan Loss Reserve (241% of NPLs)
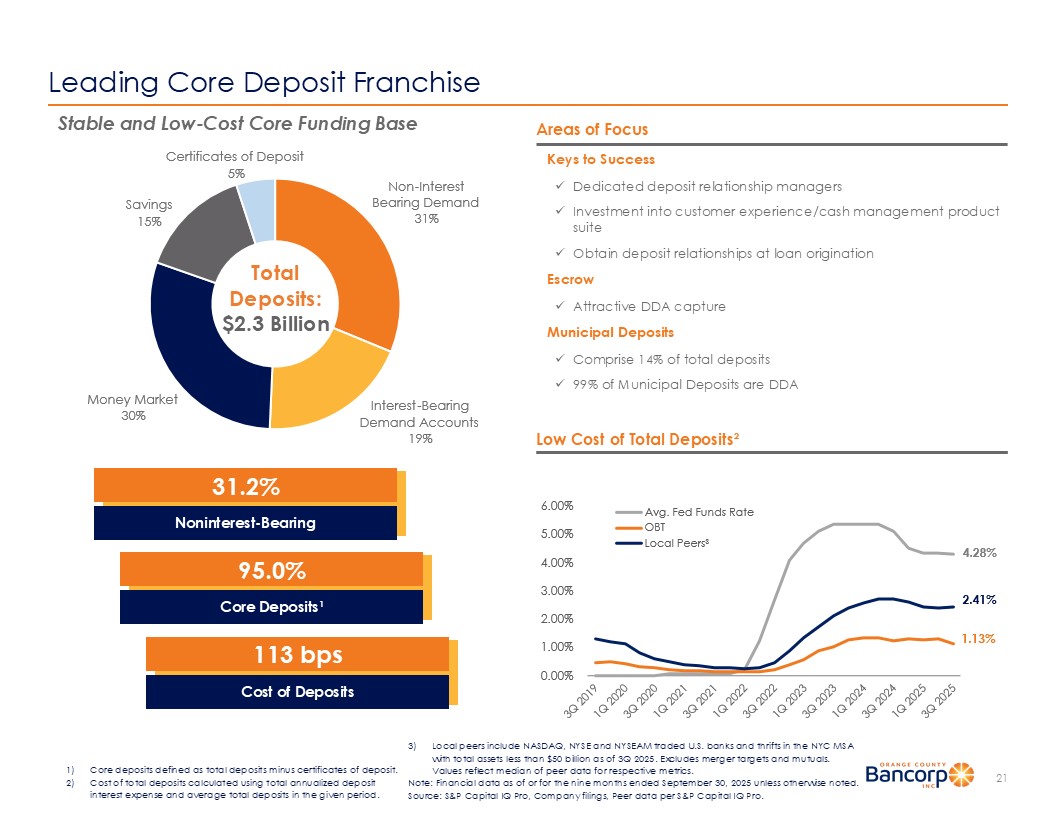
$YJ )HG)XQGV5DWH 2%7 /RFDO3HHUV ó Leading Core Deposit Franchise Areas of Focus Keys to Success x Dedicated deposit relationship managers x Investment into customer experience/cash management product suite x Obtain deposit relationships at loan origination Escrow x Attractive DDA capture Municipal Deposits x Comprise 14% of total deposits x 99% of Municipal Deposits are DDA 21 Low Cost of Total Deposits² Stable and Low - Cost Core Funding Base 1RQ ,QWHUHVW %HDULQJ'HPDQG ,QWHUHVW %HDULQJ 'HPDQG$FFRXQWV 0RQH\0DUNHW 6DYLQJV &HUWLILFDWHVRI'HSRVLW Total Deposits: $2.3 Billion 31.2% Noninterest - Bearing 95.0% Core Deposits¹ 113 bps Cost of Deposits 1) Core deposits defined as total deposits minus certificates of deposit. 2) Cost of total deposits calculated using total annualized deposit interest expense and average total deposits in the given period. 3) Local peers include NASDAQ, NYSE and NYSEAM traded U.S. banks and thrifts in the NYC MSA with total assets less than $50 billion as of 3Q 2025. Excludes merger targets and mutuals. Values reflect median of peer data for respective metrics. Note: Financial data as of or for the nine months ended September 30, 2025 unless otherwise noted. Source: S&P Capital IQ Pro, Company filings, Peer data per S&P Capital IQ Pro.

Liquidity Overview 22 Note: Financial data as of September 30, 2025 unless otherwise noted. Source: Company filings. Strong Recent Deposit Growth and Significant Borrowing Capacity • Borrowings consist of both short - term and long - term borrowings and provide the Company with one of its sources of funding • Maintaining available borrowing capacity provides the Company with a contingent source of liquidity • FHLBNY short - term borrowings decreased by $91.0 million, or 80.2%, to $22.5 million as of September 30, 2025, as compared to $113.5 million at December 31, 2024 • The decrease in borrowings continues to reflect a strategic decision to manage liquidity sources and take advantage of opportunities to reduce funding costs. • As of September 30, 2025, the Bank’s unused borrowing capacity with the FHLBNY was $557.0 million • Uninsured deposits, net of fully collateralized municipal relationships, remain stable and represent approximately 45% of total deposits at September 30, 2025 8 6 *RYHUQPHQW $JHQFLHV 0RUWJDJH EDFNHG 6HFXULWLHV &RUSRUDWH 6HFXULWLHV 0XQLFLSDO 6HFXULWLHV Conservatively Managed Securities Portfolio 23 Note: Financial data as of September 30, 2025.
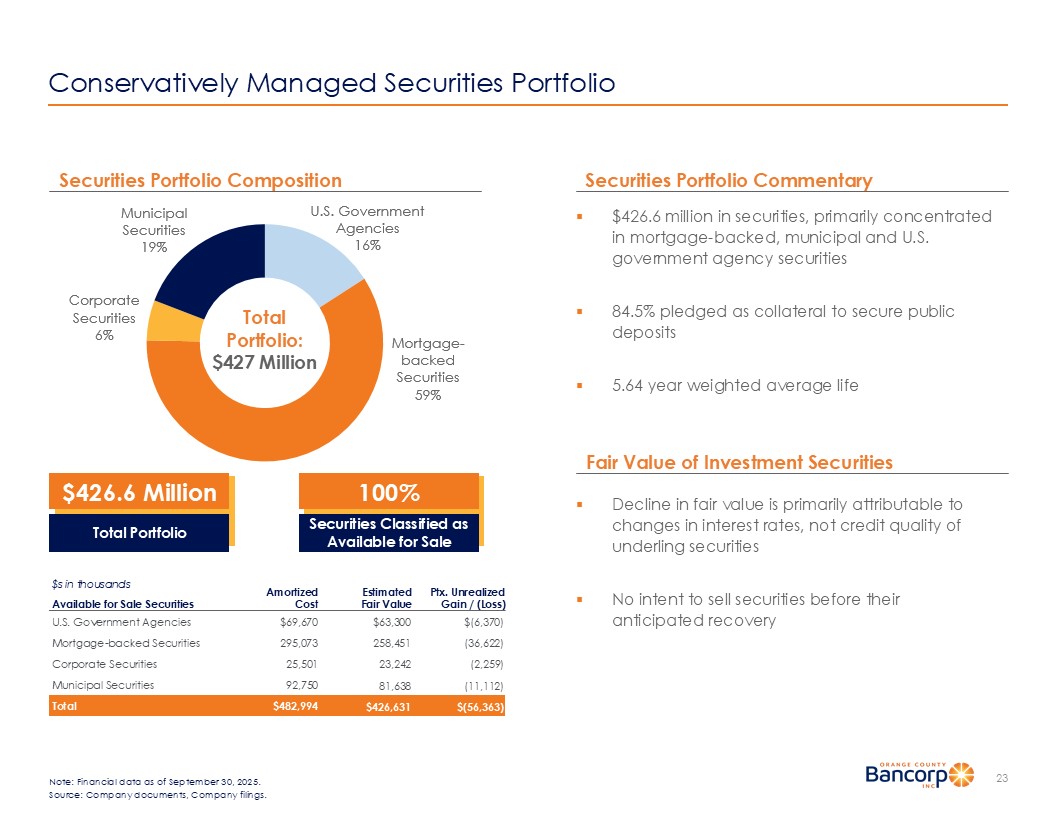
Source: Company documents, Company filings. ▪ $ 426.6 million in securities, primarily concentrated in mortgage - backed, municipal and U.S. government agency securities ▪ 84.5% pledged as collateral to secure public deposits ▪ 5.64 year weighted average life Securities Portfolio Commentary Securities Portfolio Composition $426.6 Million Total Portfolio Fair Value of Investment Securities ▪ Decline in fair value is primarily attributable to changes in interest rates, not credit quality of underling securities ▪ No intent to sell securities before their anticipated recovery Ptx. Unrealized Gain / (Loss) Estimated Fair Value Amortized Cost $s in thousands Available for Sale Securities $(6,370) $63,300 $69,670 U.S.

Government Agencies (36,622) 258,451 295,073 Mortgage - backed Securities (2,259) 23,242 25,501 Corporate Securities (11,112) 81,638 92,750 Municipal Securities $(56,363) $426,631 $482,994 Total 100% Securities Classified as Available for Sale Total Portfolio: $427 Million At September 30, 2025 Change in Interest Rates Net Interest Income Year 1 Change (basis points)² Year 1 Forecast Base Case (Dollars in thousands) Shock Up 200 bps 114,876 4,792 Shock Up 100 bps 112,683 2,599 Base 110,084 - Shock Down 100 bps 107,073 (3,011) Shock Down 200 bps 104,163 (5,921) Interest Rate Sensitivity 1 24 1) Although the net interest income table above provides an indication of our interest rate risk exposure at a particular point in time, such measurements are not intended to and do not provide a precise forecast of the effect of changes in market interest rates on net interest income an d m ay differ from actual results. 2) This analysis assumes an instantaneous and parallel rate shock across the entire yield curve for the scenarios indicated. Note: Financial data as of September 30, 2025. Source: Company documents.
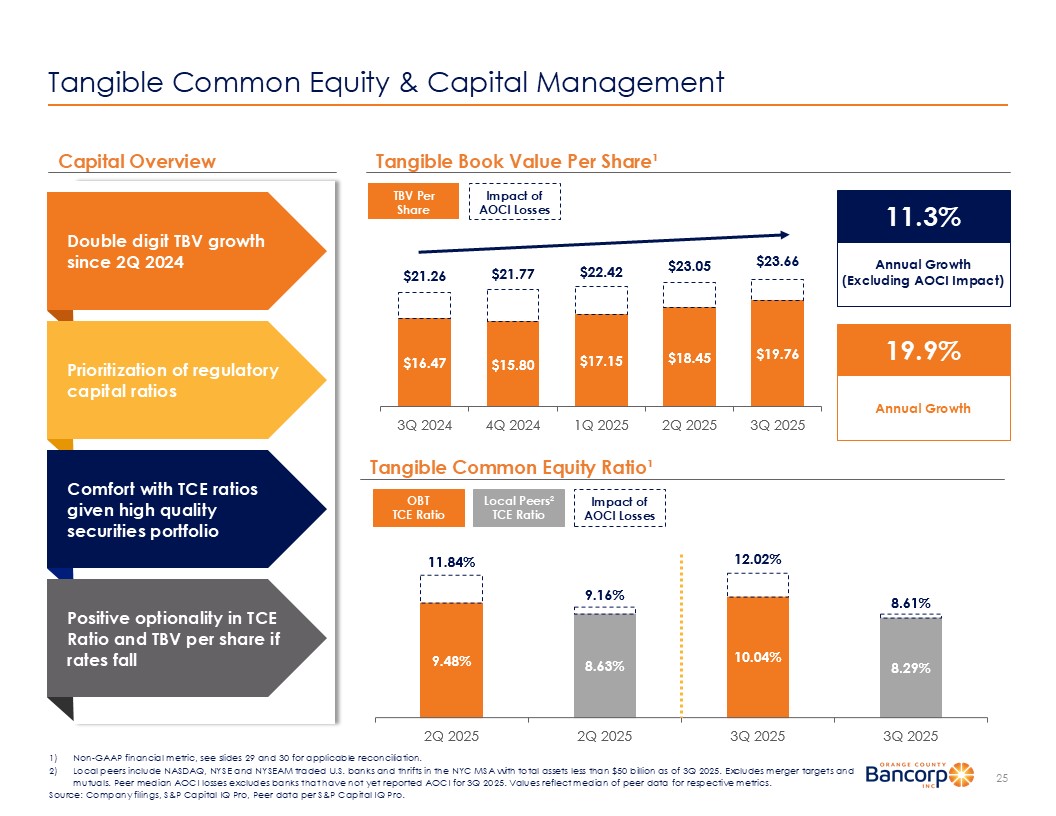
4 4 4 4 Tangible Common Equity & Capital Management 25 Tangible Common Equity Ratio¹ Capital Overview 1) Non - GAAP financial metric, see slides 29 and 30 for applicable reconciliation. 2) Local peers include NASDAQ, NYSE and NYSEAM traded U.S. banks and thrifts in the NYC MSA with total assets less than $50 bill ion as of 3Q 2025. Excludes merger targets and mutuals. Peer median AOCI losses excludes banks that have not yet reported AOCI for 3Q 2025. Values reflect median of peer da ta for respective metrics. Source: Company filings, S&P Capital IQ Pro, Peer data per S&P Capital IQ Pro.

Tangible Book Value P er Share¹ 4 4 4 4 4 OBT TCE Ratio Impact of AOCI Losses Local Peers² TCE Ratio TBV Per Share Impact of AOCI Losses Double digit TBV growth since 2 Q 2024 Prioritization of regulatory capital ratios Comfort with TCE ratios given high quality securities portfolio Positive optionality in TCE Ratio and TBV per share if rates fall 11 .3% Annual Growth (Excluding AOCI Impact) 19.9 % Annual Growth 2025 Trends and Company Highlights 26 Continued High Performance During Turbulent Industry Period x Consistent growth and compelling financial performance, maintaining a net interest margin above peers and outperforming on ROAA and ROAE 1 x Highly successful deposit gathering strategy maintains a low - cost funding base while supporting growth x Asset quality reflective of conservative credit culture, considerable local market knowledge and demonstrated ability to actively manage our loan portfolio x Continued focus on maintaining liquidity with diversified funding sources for additional stability, including increased coverage of uninsured deposit segment x Highly experienced management team continuing to drive the growth of “the business bank with wealth management services” 1) Net interest margin, ROAA and ROAE commentary based on median LTM performance of local peers. Local peers include NASDAQ, NYS E a nd NYSEAM traded U.S. banks and thrifts in the NYC MSA with total assets less than $50 billion as of 3Q 2025. Excludes merger targets and mutuals. Values re flect median of peer data for respective metrics. Source: Company filings, Peer data per S&P Capital IQ Pro.
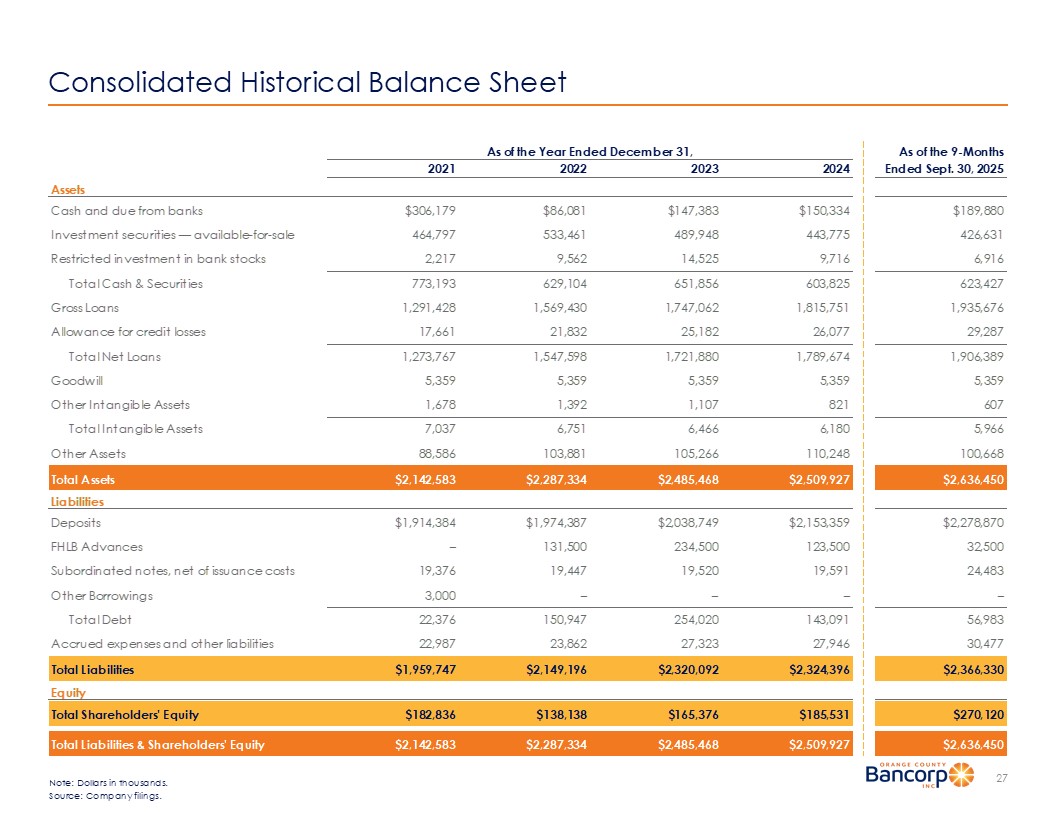
Consolidated Historical Balance Sheet 27 As of the Year Ended December 31, As of the 9-Months 2021 2022 2023 2024 Ended Sept. 30, 2025 Assets Cash and due from banks $306,179 $86,081 $147,383 $150,334 $189,880 Investment securities — available-for-sale 464,797 533,461 489,948 443,775 426,631 Restricted investment in bank stocks 2,217 9,562 14,525 9,716 6,916 Total Cash & Securities 773,193 629,104 651,856 603,825 623,427 Gross Loans 1,291,428 1,569,430 1,747,062 1,815,751 1,935,676 Allowance for credit losses 17,661 21,832 25,182 26,077 29,287 Total Net Loans 1,273,767 1,547,598 1,721,880 1,789,674 1,906,389 Goodwill 5,359 5,359 5,359 5,359 5,359 Other Intangible Assets 1,678 1,392 1,107 821 607 Total Intangible Assets 7,037 6,751 6,466 6,180 5,966 Other Assets 88,586 103,881 105,266 110,248 100,668 Total Assets $2,142,583 $2,287,334 $2,485,468 $2,509,927 $2,636,450 Liabilities Deposits $1,914,384 $1,974,387 $2,038,749 $2,153,359 $2,278,870 FHLB Advances – 131,500 234,500 123,500 32,500 Subordinated notes, net of issuance costs 19,376 19,447 19,520 19,591 24,483 Other Borrowings 3,000 – – – – Total Debt 22,376 150,947 254,020 143,091 56,983 Accrued expenses and other liabilities 22,987 23,862 27,323 27,946 30,477 Total Liabilities $1,959,747 $2,149,196 $2,320,092 $2,324,396 $2,366,330 Equity Total Shareholders' Equity $182,836 $138,138 $165,376 $185,531 $270,120 Total Liabilities & Shareholders' Equity $2,142,583 $2,287,334 $2,485,468 $2,509,927 $2,636,450 Note: Dollars in thousands. Source: Company filings.
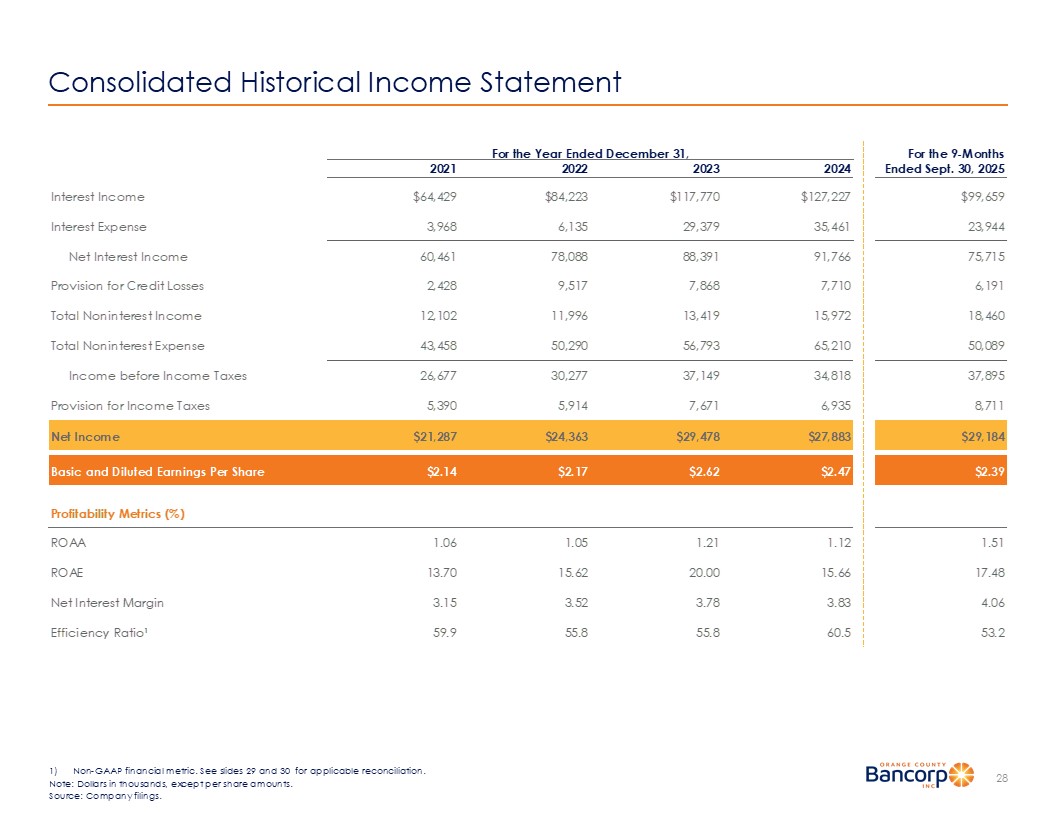
Consolidated Historical Income Statement 28 1) Non - GAAP financial metric. See slides 29 and 30 for applicable reconciliation. Note: Dollars in thousands, except per share amounts. Source: Company filings. For the Year Ended December 31, For the 9-Months 2021 2022 2023 2024 Ended Sept.
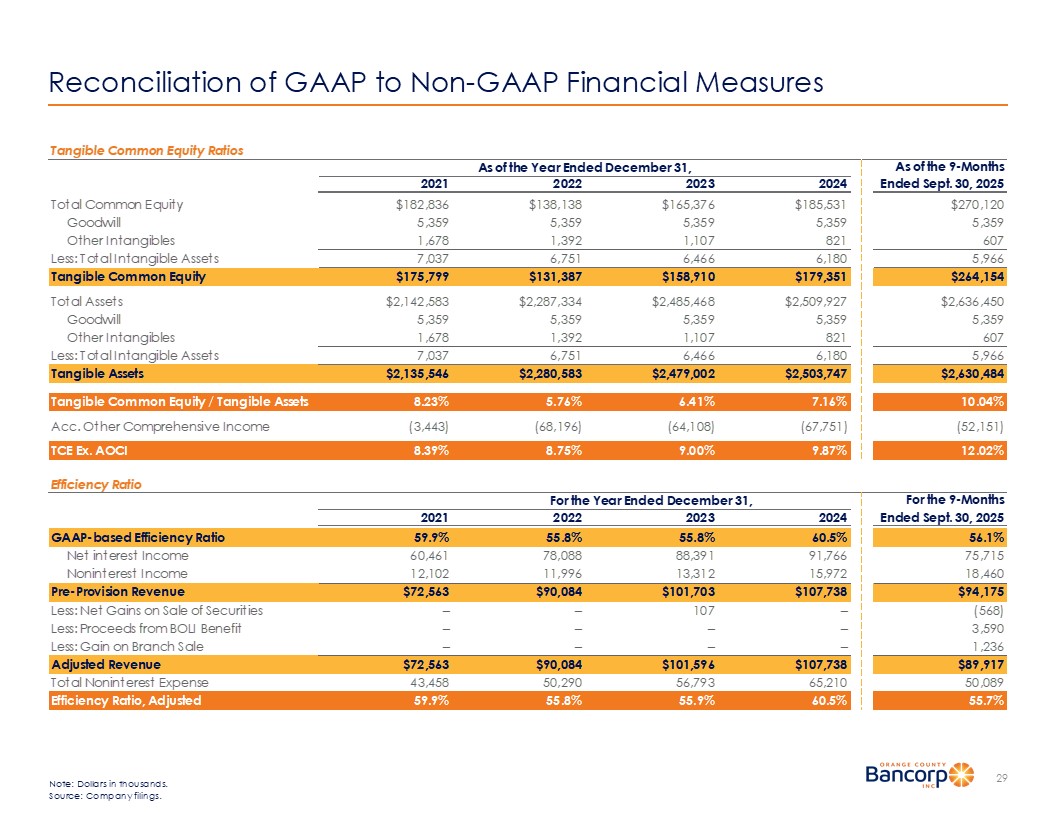
30, 2025 Interest Income $64,429 $84,223 $117,770 $127,227 $99,659 Interest Expense 3,968 6,135 29,379 35,461 23,944 Net Interest Income 60,461 78,088 88,391 91,766 75,715 Provision for Credit Losses 2,428 9,517 7,868 7,710 6,191 Total Noninterest Income 12,102 11,996 13,419 15,972 18,460 Total Noninterest Expense 43,458 50,290 56,793 65,210 50,089 Income before Income Taxes 26,677 30,277 37,149 34,818 37,895 Provision for Income Taxes 5,390 5,914 7,671 6,935 8,711 Net Income $21,287 $24,363 $29,478 $27,883 $29,184 Basic and Diluted Earnings Per Share $2.14 $2.17 $2.62 $2.47 $2.39 Profitability Metrics (%) ROAA 1.06 1.05 1.21 1.12 1.51 ROAE 13.70 15.62 20.00 15.66 17.48 Net Interest Margin 3.15 3.52 3.78 3.83 4.06 Efficiency Ratio¹ 59.9 55.8 55.8 60.5 53.2 Tangible Common Equity Ratios As of the Year Ended December 31, As of the 9-Months 2021 2022 2023 2024 Ended Sept. 30, 2025 Total Common Equity $182,836 $138,138 $165,376 $185,531 $270,120 Goodwill 5,359 5,359 5,359 5,359 5,359 Other Intangibles 1,678 1,392 1,107 821 607 Less: Total Intangible Assets 7,037 6,751 6,466 6,180 5,966 Tangible Common Equity $175,799 $131,387 $158,910 $179,351 $264,154 Total Assets $2,142,583 $2,287,334 $2,485,468 $2,509,927 $2,636,450 Goodwill 5,359 5,359 5,359 5,359 5,359 Other Intangibles 1,678 1,392 1,107 821 607 Less: Total Intangible Assets 7,037 6,751 6,466 6,180 5,966 Tangible Assets $2,135,546 $2,280,583 $2,479,002 $2,503,747 $2,630,484 Tangible Common Equity / Tangible Assets 8.23% 5.76% 6.41% 7.16% 10.04% Acc. Other Comprehensive Income (3,443) (68,196) (64,108) (67,751) (52,151) TCE Ex. AOCI 8.39% 8.75% 9.00% 9.87% 12.02% Efficiency Ratio For the Year Ended December 31, For the 9-Months 2021 2022 2023 2024 Ended Sept. 30, 2025 GAAP-based Efficiency Ratio 59.9% 55.8% 55.8% 60.5% 56.1% Net interest Income 60,461 78,088 88,391 91,766 75,715 Noninterest Income 12,102 11,996 13,312 15,972 18,460 Pre-Provision Revenue $72,563 $90,084 $101,703 $107,738 $94,175 Less: Net Gains on Sale of Securities – – 107 – (568) Less: Proceeds from BOLI Benefit – – – – 3,590 Less: Gain on Branch Sale – – – – 1,236 Adjusted Revenue $72,563 $90,084 $101,596 $107,738 $89,917 Total Noninterest Expense 43,458 50,290 56,793 65,210 50,089 Efficiency Ratio, Adjusted 59.9% 55.8% 55.9% 60.5% 55.7% Reconciliation of GAAP to Non - GAAP Financial Measures 29 Note: Dollars in thousands. Source: Company filings.
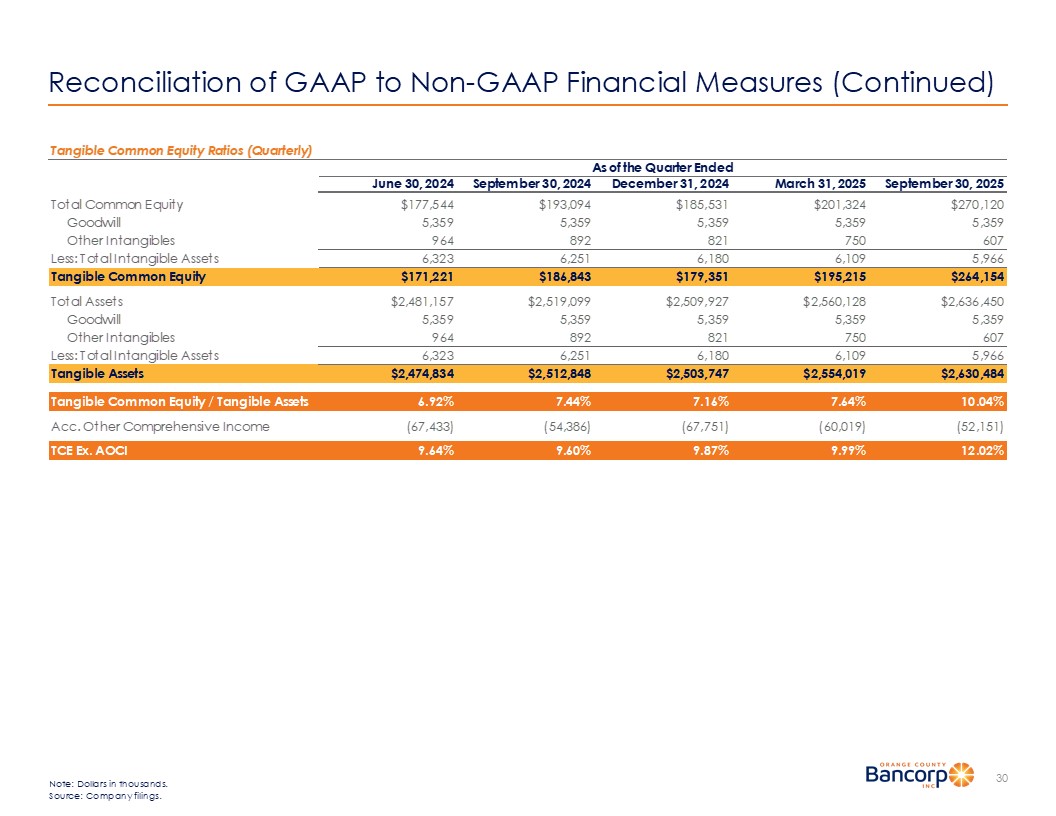
Tangible Common Equity Ratios (Quarterly) As of the Quarter Ended June 30, 2024 September 30, 2024 December 31, 2024 March 31, 2025 September 30, 2025 Total Common Equity $177,544 $193,094 $185,531 $201,324 $270,120 Goodwill 5,359 5,359 5,359 5,359 5,359 Other Intangibles 964 892 821 750 607 Less: Total Intangible Assets 6,323 6,251 6,180 6,109 5,966 Tangible Common Equity $171,221 $186,843 $179,351 $195,215 $264,154 Total Assets $2,481,157 $2,519,099 $2,509,927 $2,560,128 $2,636,450 Goodwill 5,359 5,359 5,359 5,359 5,359 Other Intangibles 964 892 821 750 607 Less: Total Intangible Assets 6,323 6,251 6,180 6,109 5,966 Tangible Assets $2,474,834 $2,512,848 $2,503,747 $2,554,019 $2,630,484 Tangible Common Equity / Tangible Assets 6.92% 7.44% 7.16% 7.64% 10.04% Acc. Other Comprehensive Income (67,433) (54,386) (67,751) (60,019) (52,151) TCE Ex. AOCI 9.64% 9.60% 9.87% 9.99% 12.02% Reconciliation of GAAP to Non - GAAP Financial Measures (Continued) 30 Note: Dollars in thousands. Source: Company filings.