UNITED STATES
SECURITIES AND EXCHANGE COMMISSION
Washington, D.C. 20549
FORM 6-K
REPORT OF FOREIGN PRIVATE ISSUER
PURSUANT TO RULE 13A-16 OR 15D-16
UNDER THE SECURITIES EXCHANGE ACT OF 1934
For the month of November 2025
Commission File Number 001--39966
New Found Gold Corp.
(Translation of Registrant’s name into English)
Suite 3500, The Stack,
1133 Melville Street,
Vancouver, British Columbia,
Canada V6E 4E5
(Address of principal executive office)
Indicate by check mark whether the registrant files or will file annual reports under cover of Form 20-F or Form 40-F:
Form 20-F ¨ Form 40-F x Exhibits 99.1 and 99.2 to this Form 6-K are incorporated by reference as additional exhibits to the registrant’s Registration Statement on Form F-10 (File No.
INCORPORATION BY REFERENCE
333-287547).
DOCUMENTS INCLUDED AS PART OF THIS REPORT
SIGNATURES
Pursuant to the requirements of the Securities Exchange Act of 1934, the registrant has duly caused this report to be signed on its behalf by the undersigned, thereunto duly authorized.
| New Found Gold Corp. | |||
| Date: November 6, 2025 | By: | /s/ Hashim Ahmed | |
| Name: | Hashim Ahmed | ||
| Title: | Chief Financial Officer | ||
Exhibit 99.1
TABLE OF CONTENTS
| Condensed interim statements of financial position | 1 |
| Condensed interim statements of loss and comprehensive loss | 2 |
| Condensed interim statements of cash flows | 3 |
| Condensed interim statements of changes in equity | 4 |
| Notes to the condensed interim financial statements | 5 |
New Found Gold Corp.
Condensed Interim Statements of Financial Position
(Unaudited - Expressed in Canadian Dollars)
| Note |
September 30, 2025 $ |
December 31, 2024 $ |
||||||||
| ASSETS | ||||||||||
| Current assets | ||||||||||
| Cash and cash equivalents | 71,136,121 | 22,317,548 | ||||||||
| Investments | 5 | 540,096 | 926,019 | |||||||
| Interest receivable | 282 | - | ||||||||
| Sales taxes recoverable | 1,750,210 | 2,209,948 | ||||||||
| Prepaid expenses and deposits | 1,454,185 | 1,480,341 | ||||||||
| Secured notes | 7 | - | 2,817,554 | |||||||
| Total current assets | 74,880,894 | 29,751,410 | ||||||||
| Non-current assets | ||||||||||
| Exploration and evaluation assets | 3 | 34,574,784 | 34,505,484 | |||||||
| Investment in Kirkland Lake Discoveries Corp. | 6 | 2,322,095 | 1,525,756 | |||||||
| Property and equipment | 4 | 7,848,920 | 7,938,149 | |||||||
| Right-of-use assets | 62,346 | 118,509 | ||||||||
| Other assets | 256,534 | 179,703 | ||||||||
| Total non-current assets | 45,064,679 | 44,267,601 | ||||||||
| Total Assets | 119,945,573 | 74,019,011 | ||||||||
| LIABILITIES | ||||||||||
| Current liabilities | ||||||||||
| Accounts payable and accrued liabilities | 9,11 | 6,511,740 | 7,325,203 | |||||||
| Flow-through share premium | 8 | 11,992,641 | - | |||||||
| Lease liabilities | 450 | 53,783 | ||||||||
| Share-based compensation liabilities | 10 | 40,808 | - | |||||||
| Total current liabilities | 18,545,639 | 7,378,986 | ||||||||
| Lease liabilities | 68,741 | 69,320 | ||||||||
| Total non-current liabilities | 68,741 | 69,320 | ||||||||
| Total liabilities | 18,614,380 | 7,448,306 | ||||||||
| EQUITY | ||||||||||
| Share capital | 10 | 407,822,989 | 341,346,716 | |||||||
| Reserves | 10 | 35,718,073 | 34,988,421 | |||||||
| Deficit | (342,209,869 | ) | (309,764,432 | ) | ||||||
| Total equity | 101,331,193 | 66,570,705 | ||||||||
| Total Liabilities and Equity | 119,945,573 | 74,019,011 | ||||||||
NATURE OF OPERATIONS AND GOING CONCERN (Note 1)
COMMITMENTS (Note 3)
SUBSEQUENT EVENTS (Notes 3(i), 6 and 16)
These condensed interim financial statements are authorized for issue by the Board of Directors on November 6, 2025. They are signed on the Company’s behalf by:
| “Paul Huet” | , Director | |
| “William Hayden” | , Director |
The accompanying notes are an integral part of these condensed interim financial statements.
-
New Found Gold Corp.
Condensed Interim Statements of Loss and Comprehensive Loss
(Unaudited - Expressed in Canadian Dollars, except share amounts)
| Three months ended September 30, |
Nine
months ended |
|||||||||||||||||
| Note |
2025 $ |
2024 $ |
2025 $ |
2024 $ |
||||||||||||||
| Expenses | ||||||||||||||||||
| Exploration and evaluation expenditures | 3,11 | 13,423,595 | 12,861,119 | 27,794,432 | 37,150,120 | |||||||||||||
| Salaries and consulting | 11 | 1,298,781 | 602,260 | 4,026,378 | 2,066,939 | |||||||||||||
| Corporate development and investor relations | 11 | 839,097 | 192,858 | 1,338,980 | 581,974 | |||||||||||||
| Share-based compensation | 10,11 | 766,158 | 188,857 | 2,125,090 | 815,246 | |||||||||||||
| Depreciation | 4 | 183,182 | 195,958 | 582,363 | 615,238 | |||||||||||||
| Professional fees | 399,730 | 362,187 | 1,239,263 | 1,185,478 | ||||||||||||||
| Office and sundry | 178,117 | 195,030 | 600,196 | 594,750 | ||||||||||||||
| Travel | 156,408 | 66,900 | 448,345 | 125,019 | ||||||||||||||
| Transfer agent and regulatory fees | 26,162 | 60,824 | 381,943 | 341,137 | ||||||||||||||
| Loss from operating activities | (17,271,230 | ) | (14,725,993 | ) | (38,536,990 | ) | (43,475,901 | ) | ||||||||||
| Other income (expenses) | ||||||||||||||||||
| Settlement of flow-through share premium | 8 | 3,495,191 | 3,189,263 | 4,249,959 | 9,095,737 | |||||||||||||
| Gains (losses) on equity investment | 6 | 864,087 | (321,932 | ) | 796,339 | (1,062,312 | ) | |||||||||||
| Foreign exchange gain (loss) | 28,272 | (59,233 | ) | (115,821 | ) | 25,847 | ||||||||||||
| Part XII.6 tax | 8 | (67,143 | ) | (190,140 | ) | (67,143 | ) | (819,179 | ) | |||||||||
| Gains on secured notes | 7 | - | 63,310 | 55,911 | 104,527 | |||||||||||||
| Interest expense | (3,409 | ) | (6,031 | ) | (12,882 | ) | (18,730 | ) | ||||||||||
| Interest income | 511,795 | 730,741 | 892,946 | 2,373,638 | ||||||||||||||
| Investment gains (losses) | 5 | (502,357 | ) | (263,651 | ) | 292,243 | (1,334,287 | ) | ||||||||||
| Settlement of legal claim | 10,14 | - | - | - | (1,750,100 | ) | ||||||||||||
| Total | 4,326,436 | 3,142,327 | 6,091,552 | 6,615,141 | ||||||||||||||
| Loss and comprehensive loss for the period | (12,944,794 | ) | (11,583,666 | ) | (32,445,437 | ) | (36,860,760 | ) | ||||||||||
| Loss per share – basic and diluted ($) | 12 | (0.06 | ) | (0.06 | ) | (0.15 | ) | (0.19 | ) | |||||||||
| Weighted average number of shares outstanding – basic and diluted | 12 | 235,018,399 | 198,019,407 | 214,761,519 | 192,324,461 | |||||||||||||
The accompanying notes are an integral part of these condensed interim financial statements.
-
New Found Gold Corp.
Condensed Interim Statements of Cash Flows
(Unaudited - Expressed in Canadian Dollars)
| Nine months ended September 30, | ||||||||
|
2025 $ |
2024 $ |
|||||||
| Cash flows from operating activities | ||||||||
| Loss for the period | (32,445,437 | ) | (36,860,760 | ) | ||||
| Adjustments for: | ||||||||
| Depreciation | 582,363 | 615,238 | ||||||
| Gains (losses) on equity investment | (796,339 | ) | 1,062,312 | |||||
| Interest income | (74,468 | ) | (227,463 | ) | ||||
| Interest expense | 12,882 | 18,730 | ||||||
| Gains on secured notes | (55,911 | ) | (104,527 | ) | ||||
| Settlement of legal claim | - | 1,750,100 | ||||||
| Foreign exchange loss (gain) on secured notes | 95,465 | (50,514 | ) | |||||
| Unrealized foreign exchange loss (gain) | 10,334 | (11,888 | ) | |||||
| Settlement of flow-through share premium | (4,249,959 | ) | (9,095,737 | ) | ||||
| Share-based compensation | 2,125,090 | 815,246 | ||||||
| Investment (gains) losses | (292,243 | ) | 1,334,287 | |||||
| (35,088,223 | ) | (40,754,976 | ) | |||||
| Change in non-cash working capital items: | ||||||||
| Decrease in prepaid expenses and deposits | 26,156 | 62,854 | ||||||
| Decrease in sales taxes recoverable | 459,738 | 1,544,694 | ||||||
| Decrease in other assets | 179,703 | - | ||||||
| Increase in interest receivable | (282 | ) | - | |||||
| (Decrease) in accounts payable and accrued liabilities | (290,793 | ) | (49,844 | ) | ||||
| Net cash and cash equivalents (used in) operating activities | (34,713,701 | ) | (39,197,272 | ) | ||||
| Cash flows from investing activities | ||||||||
| Expenditures on claim staking and mineral license renewals | (69,300 | ) | (3,450 | ) | ||||
| Interest received on secured notes | - | 229,688 | ||||||
| Other assets | (173,025 | ) | (111,108 | ) | ||||
| Purchases of exploration and evaluation assets | (676,921 | ) | (2,413,010 | ) | ||||
| Proceeds from sale of secured notes | 2,778,000 | - | ||||||
| Proceeds on disposal of investments | 752,634 | 688,220 | ||||||
| Purchases of property and equipment | (365,948 | ) | (370,303 | ) | ||||
| Net cash and cash equivalents generated from (used in) investing activities | 2,245,440 | (1,979,963 | ) | |||||
| Cash flows from financing activities | ||||||||
| Issuance of common shares in prospectus offering | 63,480,000 | 27,522,494 | ||||||
| Issuance of common shares in a private placement | 20,000,001 | - | ||||||
| Share issue costs | (3,912,782 | ) | (921,158 | ) | ||||
| Other assets | - | (174,552 | ) | |||||
| Stock options exercised | 1,797,025 | 87,500 | ||||||
| Lease principal payments | (53,912 | ) | (105,549 | ) | ||||
| Lease interest payments | (12,882 | ) | (18,730 | ) | ||||
| Net cash and equivalents generated from financing activities | 81,297,450 | 26,390,005 | ||||||
| Effect of exchange rate fluctuations on cash and cash equivalents | (10,616 | ) | 10,842 | |||||
| Net increase (decrease) in cash and cash equivalents | 48,818,573 | (14,776,388 | ) | |||||
| Cash and cash equivalents at beginning of period | 22,317,548 | 53,884,809 | ||||||
| Cash and cash equivalents at end of period | 71,136,121 | 39,108,421 | ||||||
SUPPLEMENTAL DISCLOSURE WITH RESPECT TO CASH FLOWS (Note 13)
The accompanying notes are an integral part of these condensed interim financial statements.
-
New Found Gold Corp.
Condensed Interim Statements of Changes in Equity
(Unaudited - Expressed in Canadian Dollars, except share amounts)
| Share capital | Reserves | |||||||||||||||||||||||
|
Number of shares |
Amount $ |
Equity
settled $ |
Warrants $ |
Deficit $ |
Total equity $ |
|||||||||||||||||||
| Balance at December 31, 2023 | 186,873,012 | 290,244,029 | 34,751,151 | 3,918 | (259,496,078 | ) | 65,503,020 | |||||||||||||||||
| Issued pursuant to acquisition of the Kingsway Project (Note 3(i)) | 5,263,157 | 20,000,000 | - | - | - | 20,000,000 | ||||||||||||||||||
| Issued pursuant to acquisition of exploration and evaluation assets | 300,000 | 1,011,000 | - | - | - | 1,011,000 | ||||||||||||||||||
| Issued in prospectus offering | 5,857,242 | 27,522,494 | - | - | - | 27,522,494 | ||||||||||||||||||
| Share issue costs | - | (917,610 | ) | - | - | - | (917,610 | ) | ||||||||||||||||
| Issued in settlement of legal claim | 370,000 | 1,750,100 | - | - | - | 1,750,100 | ||||||||||||||||||
| Share-based compensation | - | - | 815,246 | - | - | 815,246 | ||||||||||||||||||
| Stock options exercised | 175,000 | 154,020 | (66,520 | ) | - | - | 87,500 | |||||||||||||||||
| Total loss and comprehensive loss for the period | - | - | - | - | (36,860,760 | ) | (36,860,760 | ) | ||||||||||||||||
| Balance at September 30, 2024 | 198,838,411 | 339,764,033 | 35,499,877 | 3,918 | (296,356,838 | ) | 78,910,990 | |||||||||||||||||
| Issued pursuant to acquisition of exploration and evaluation assets | 69,583 | 215,707 | - | - | - | 215,707 | ||||||||||||||||||
| Share issue costs | - | 2,803 | - | - | - | 2,803 | ||||||||||||||||||
| Stock options exercised | 1,550,000 | 1,364,173 | (589,173 | ) | - | - | 775,000 | |||||||||||||||||
| Share-based compensation | - | - | 73,799 | - | - | 73,799 | ||||||||||||||||||
| Total loss and comprehensive loss for the period | - | - | - | - | (13,407,594 | ) | (13,407,594 | ) | ||||||||||||||||
| Balance at December 31, 2024 | 200,457,994 | 341,346,716 | 34,984,503 | 3,918 | (309,764,432 | ) | 66,570,705 | |||||||||||||||||
| Issued in prospectus offering | 28,980,000 | 63,480,000 | - | - | - | 63,480,000 | ||||||||||||||||||
| Issued in private placement | 12,269,939 | 20,000,001 | - | - | 20,000,001 | |||||||||||||||||||
| Flow-through premium | - | (16,242,600 | ) | - | - | (16,242,600 | ) | |||||||||||||||||
| Share issue costs | - | (3,912,782 | ) | - | - | - | (3,912,782 | ) | ||||||||||||||||
| Stock options exercised | 1,329,329 | 3,151,654 | (1,354,629 | ) | - | - | 1,797,025 | |||||||||||||||||
| Share-based compensation | - | - | 2,084,281 | - | - | 2,084,281 | ||||||||||||||||||
| Total loss and comprehensive loss for the period | - | - | - | - | (32,445,437 | ) | (32,445,437 | ) | ||||||||||||||||
| Balance at September 30, 2025 | 243,037,262 | 407,822,989 | 35,714,155 | 3,918 | (342,209,869 | ) | 101,331,193 | |||||||||||||||||
The accompanying notes are an integral part of these condensed interim financial statements.
-
New Found Gold Corp.
Notes to the Condensed Interim Financial Statements
For the three and nine months ended September 30, 2025 and 2024
(Unaudited - Expressed in Canadian Dollars Unless Otherwise Noted)
| 1. | NATURE OF OPERATIONS AND GOING CONCERN |
New Found Gold Corp. (the “Company”) was incorporated on January 6, 2016, under the Business Corporations Act in the Province of Ontario. On September 23, 2020, the Company continued as a British Columbia corporation under the Business Corporations Act in the Province of British Columbia. The Company’s registered office is located at Suite 3500, The Stack, 1133 Melville Street, Vancouver, British Columbia V6E 4E5.
The Company is a mineral exploration company engaged in the acquisition, exploration and evaluation of resource properties with a focus on gold properties located in Newfoundland and Labrador, Canada. The Company’s exploration and evaluation assets presently have no proven or probable reserves. The recoverability of amounts shown for exploration and evaluation assets are dependent upon the existence of economically recoverable reserves or the Company’s ability to recover the value of exploration and evaluation assets through their sale, the ability of the Company to obtain necessary financing to complete the development of those reserves and upon future profitable production.
These condensed interim financial statements (“financial statements”) have been prepared assuming the Company will continue on a going concern basis and do not include adjustments to amounts and classifications of assets and liabilities that might be necessary, should the Company be unable to continue operations. Such adjustments could be material. The ability of the Company to continue as a going concern depends upon its ability to develop profitable operations or to continue to raise adequate financing. As at September 30, 2025, the Company had an accumulated deficit of $342,209,869 and shareholders’ equity of $101,331,193. In addition, the Company has a working capital surplus, calculated as current assets less current liabilities, of $56,335,255, consisting primarily of cash and cash equivalents, and negative cash flow from operating activities of $34,713,701 for the nine months ended September 30, 2025.
Management is actively targeting sources of additional financing including through the issuance of shares, which would assure continuation of the Company’s operations and exploration programs. In order for the Company to meet its liabilities as they come due and to continue its operations, the Company is solely dependent upon its ability to generate such financing. Although the Company has been successful in the past in generating financing, there is no assurance it will be able to do so in the future. These items give rise to material uncertainties that cast significant doubt as to the Company’s ability to continue as a going concern.
These condensed interim financial statements were approved by the Board of Directors of the Company on November 6, 2025.
| 2. | MATERIAL ACCOUNTING POLICY INFORMATION |
The principal accounting policies applied in the preparation of these financial statements are set out below.
| a) | Statement of compliance |
The Company’s condensed interim financial statements have been prepared in accordance with International Financial Reporting Standards (“IFRS”), as applicable to interim financial reports including International Accounting Standards 34 “Interim Financial Reporting” issued by the International Accounting Standards Board (“IASB”).
-
New Found Gold Corp.
Notes to the Condensed Interim Financial Statements
For the three and nine months ended September 30, 2025 and 2024
(Unaudited - Expressed in Canadian Dollars Unless Otherwise Noted)
| 2. | MATERIAL ACCOUNTING POLICY INFORMATION (continued) |
| a) | Statement of compliance (continued) |
These condensed interim financial statements do not include all the information and note disclosures required by IFRS for annual financial statements and should be read in conjunction with the annual financial statements for the year ended December 31, 2024, which have been prepared in accordance with IFRS as issued by the IASB.
The policies applied in these condensed interim financial statements are the same as those applied in the most recent annual financial statements and were consistently applied to all the periods presented.
| b) | Basis of presentation |
These condensed interim financial statements are expressed in Canadian dollars and have been prepared on a historical cost basis except for financial instruments classified as subsequently measured at fair value. In addition, these financial statements have been prepared using the accrual basis of accounting, except for cash flow information.
Certain comparative figures on the income statement, cash flow statement and in Note 3 have been aggregated to conform to the current year presentation.
| c) | Significant accounting estimates and judgments |
The preparation of these condensed interim financial statements requires management to make certain estimates, judgments and assumptions that affect the reported amounts of assets and liabilities at the date of the financial statements and reported amounts of expenses during the reporting period. Actual outcomes could differ from these estimates.
In preparing these condensed interim financial statements, the Company applied the critical judgments and estimates disclosed in Note 2 of its audited financial statements for the year ended December 31, 2024.
| d) | Initial application of standards, interpretations and amendments to standards and interpretations in the reporting period |
The IASB issued certain new accounting standards or amendments that are mandatory for accounting periods on or after January 1, 2025. The effect of such new accounting standards or amendments did not have a material impact on the Company and therefore the Company did not record any adjustments to the financial statements.
| e) | New and amended IFRS standards not yet effective |
Certain new accounting standards or interpretations have been published that are not mandatory for the current period and have not been early adopted. These standards and interpretations are not expected to have a material impact on the Company’s financial statements, except for IFRS 18 “Presentation and Disclosure in Financial Statements”.
IFRS 18 includes requirements for all entities applying IFRS for the presentation and disclosure of information in financial statements and has an effective date of January 1, 2027. The effects of the adoption of IFRS 18 on the Company’s financial statements have not yet been determined.
-
New Found Gold Corp.
Notes to the Condensed Interim Financial Statements
For the three and nine months ended September 30, 2025 and 2024
(Unaudited - Expressed in Canadian Dollars Unless Otherwise Noted)
| 3. | EXPLORATION AND EVALUATION ASSETS |
The schedules below summarize the carrying amounts of acquisition costs and exploration expenditures incurred to date for each exploration and evaluation asset that the Company is continuing to explore as at September 30, 2025 and December 31, 2024:
| Nine months ended September 30, 2025 |
Queensway(i) $ |
Other $ |
Total $ |
|||||||||
| Exploration and evaluation assets | ||||||||||||
| Balance as at December 31, 2024 | 34,390,976 | 114,508 | 34,505,484 | |||||||||
| Additions: | ||||||||||||
| Claim staking and license renewal costs | 65,975 | 3,325 | 69,300 | |||||||||
| Balance as at September 30, 2025 | 34,456,951 | 117,833 | 34,574,784 | |||||||||
| Exploration and evaluation expenditures | ||||||||||||
| Cumulative exploration expense - December 31, 2024 | 267,847,694 | 575,695 | 268,423,389 | |||||||||
| Drilling | 10,389,100 | - | 10,389,100 | |||||||||
| Salaries and consulting | 6,918,652 | - | 6,918,652 | |||||||||
| Assays | 2,808,386 | - | 2,808,386 | |||||||||
| Supplies and equipment | 1,290,164 | - | 1,290,164 | |||||||||
| Geophysics | 1,275,692 | - | 1,275,692 | |||||||||
| Environmental studies | 780,496 | - | 780,496 | |||||||||
| Office and general | 684,167 | - | 684,167 | |||||||||
| Metallurgy | 625,537 | - | 625,537 | |||||||||
| Travel and accommodations | 576,725 | - | 576,725 | |||||||||
| Preliminary economic assessment | 538,038 | - | 538,038 | |||||||||
| Reclamation | 463,802 | - | 463,802 | |||||||||
| Trenching | 417,726 | - | 417,726 | |||||||||
| Technical reports | 258,647 | - | 258,647 | |||||||||
| Engineering and evaluation studies | 243,724 | - | 243,724 | |||||||||
| Waste rock geochemistry | 227,566 | - | 227,566 | |||||||||
| Resource estimate | 222,480 | - | 222,480 | |||||||||
| Other | 73,530 | - | 73,530 | |||||||||
| 27,794,432 | - | 27,794,432 | ||||||||||
| Cumulative exploration expense – September 30, 2025 | 295,642,126 | 575,695 | 296,217,821 | |||||||||
-
New Found Gold Corp.
Notes to the Condensed Interim Financial Statements
For the three and nine months ended September 30, 2025 and 2024
(Unaudited - Expressed in Canadian Dollars Unless Otherwise Noted)
| 3. | EXPLORATION AND EVALUATION ASSETS (continued) |
| Nine months ended September 30, 2024 |
Queensway(i) $ |
Other $ |
Total $ |
|||||||||
| Exploration and evaluation assets | ||||||||||||
| Balance as at December 31, 2023 | 9,014,478 | 78,709 | 9,093,187 | |||||||||
| Additions: | ||||||||||||
| Acquisition costs – Kingsway Project | 20,838,541 | - | 20,838,541 | |||||||||
| Acquisition costs – royalty purchases | 3,024,620 | - | 3,024,620 | |||||||||
| Acquisition costs – other claims | 51,655 | - | 51,655 | |||||||||
| Claim staking and license renewal costs | 3,450 | - | 3,450 | |||||||||
| Balance as at September 30, 2024 | 32,932,744 | 78,709 | 33,011,453 | |||||||||
| Exploration and evaluation expenditures | ||||||||||||
| Cumulative exploration expense - December 31, 2023 | 215,285,192 | 574,857 | 215,860,049 | |||||||||
| Drilling | 15,689,676 | - | 15,689,676 | |||||||||
| Salaries and consulting | 7,189,306 | 488 | 7,189,794 | |||||||||
| Assays | 4,941,692 | - | 4,941,692 | |||||||||
| Trenching | 2,025,311 | - | 2,025,311 | |||||||||
| Reclamation | 1,163,413 | - | 1,163,413 | |||||||||
| Other | 1,191,162 | 350 | 1,191,512 | |||||||||
| Supplies and equipment | 1,045,732 | - | 1,045,732 | |||||||||
| Metallurgy | 1,031,331 | - | 1,031,331 | |||||||||
| Environmental studies | 744,420 | - | 744,420 | |||||||||
| Geophysics | 566,411 | - | 566,411 | |||||||||
| Travel and accommodations | 556,717 | - | 556,717 | |||||||||
| Permitting | 507,639 | - | 507,639 | |||||||||
| Office and general | 496,472 | - | 496,472 | |||||||||
| 37,149,282 | 838 | 37,150,120 | ||||||||||
| Cumulative exploration expense – September 30, 2024 | 252,434,474 | 575,695 | 253,010,169 | |||||||||
-
New Found Gold Corp.
Notes to the Condensed Interim Financial Statements
For the three and nine months ended September 30, 2025 and 2024
(Unaudited - Expressed in Canadian Dollars Unless Otherwise Noted)
| 3. | EXPLORATION AND EVALUATION ASSETS (continued) |
| (i) | Queensway Project – Gander, Newfoundland and Labrador |
As at September 30, 2025, the Company owned a 100% interest in 98 (December 31, 2024 – 103) mineral licenses including 7,018 claims (December 31, 2024 – 7,024 claims) comprising 175,450 hectares of land (December 31, 2024 – 175,600) located near Gander, Newfoundland and Labrador. The project rights were acquired by map staking mineral licenses and making staged payments in cash and common shares of the Company from 2016 through 2022 under ten separate option agreements, of which nine are completed.
On November 2, 2022, the Company entered into the VOA Option Agreement to acquire a 100% interest in five mineral licenses located in Gander, Newfoundland and Labrador. Under the terms of the VOA Option Agreement, the Company may exercise the option by issuing an aggregate of 487,078 common shares in the capital of the Company and making aggregate cash payments of $2,350,000 to the optionors as follows:
| · | $200,000 (paid) and 39,762 common shares (issued) on the later of (i) staking confirmation date as defined in the Option Agreement and (ii) the receipt of the TSX Venture Exchange’s approval; |
| · | $200,000 (paid) and 39,762 common shares on or before November 2, 2023 (issued); |
| · | $250,000 (paid) and 69,583 common shares on or before November 2, 2024 (issued); |
| · | $300,000 (paid subsequent to September 30, 2025) and 89,463 common shares on or before November 2, 2025 (issued subsequent to September 30, 2025); |
| · | $600,000 and 129,224 common shares on or before November 2, 2026; and |
| · | $800,000 and 119,284 common shares on or before November 2, 2027. |
The Queensway Project carries various net smelter return (“NSR”) royalties ranging from 0.4% to 3.00%, many of which include buy-back provisions that allow the Company, at its option, to reduce the NSR by making lump-sum payments ranging from $250,000 to $1,000,000 to the holders of the royalties.
On July 29, 2024, the Company entered into three royalty purchase agreements (the “Royalty Purchase Agreements”) with arm’s length royalty holders (together, the “Vendors” and each, a “Vendor”) to purchase part of each Vendor’s royalty interest in aggregate, 0.6% of the Vendors’ 1.6% net smelter returns royalty underlying several zones at the Company’s Queensway project (the “Royalty Interests”). The transaction closed on August 8, 2024. Pursuant to the transaction, the Company paid aggregate cash consideration of $1,950,000 and aggregate share consideration of 300,000 common shares with a combined value of $1,011,000 to the Vendors (Note 10). The Company paid $63,620 in professional fees in connection with the royalty purchases.
During the year ended December 31, 2024, the Company purchased the remaining 1.0% net smelter returns royalty from the Vendors for $1,000,000 in aggregate in cash, of which $666,667 was paid during the nine months ended September 30, 2025. The Company also paid $16,225 in professional fees in connection with the purchase.
-
New Found Gold Corp.
Notes to the Condensed Interim Financial Statements
For the three and nine months ended September 30, 2025 and 2024
(Unaudited - Expressed in Canadian Dollars Unless Otherwise Noted)
| 3. | EXPLORATION AND EVALUATION ASSETS (continued) |
| (i) | Queensway Project – Gander, Newfoundland and Labrador (continued) |
Acquisition of Kingsway Project
On July 9, 2024, the Company acquired a 100% interest in LabGold’s Kingsway Project, located near Gander, Newfoundland and Labrador, as well as certain related assets of LabGold. The Kingsway Project is contiguous to Queensway and the Company considers it to be part of the Queensway Project. Pursuant to the acquisition, the Company issued 5,263,157 common shares of the Company with a value of $20,000,000 (Note 10). The Company paid $438,541 in professional and filing fees in connection with the acquisition. The Company also paid a $750,000 Expenditure Target Payment to the optionors upon completion of an aggregate of $30,000,000 of exploration expenditures incurred on the property during the year ended December 31, 2024.
The Kingsway Project carries a 1.0% NSR payable to the royalty holders upon commencement of commercial production. The Company will also pay to the royalty holders $1 per ounce of gold contained within the property in the indicated mineral resource and measured mineral resource categories (the “Resource Payment”) as defined by the Canadian Institute of Mining, Metallurgy and Petroleum, and established in a National Instrument 43-101 – Standards of Disclosure for Mineral Projects or like technical report for the development of the property. The Resource Payment is payable upon the commencement of commercial production. An advance royalty payment of $50,000 per year will be payable commencing on March 3, 2026 and continuing each year until the commencement of commercial production. Any advance royalties paid will be deducted from the royalty payable after commencement of commercial production.
| 4. | PROPERTY AND EQUIPMENT |
| Property and Buildings |
Computer Equipment |
Geological Equipment and Other Facilities |
Vehicles | Office Furniture and Equipment |
Total | |||||||||||||||||||
| $ | $ | $ | $ | $ | $ | |||||||||||||||||||
| Cost | ||||||||||||||||||||||||
| Balance at December 31, 2023 | 6,365,256 | 136,492 | 2,311,030 | 935,323 | 38,353 | 9,786,454 | ||||||||||||||||||
| Additions - Kingsway Project | 100,000 | - | 250,000 | - | - | 350,000 | ||||||||||||||||||
| Additions - other | 3,615 | - | 583,610 | 38,550 | - | 625,775 | ||||||||||||||||||
| Balance at December 31, 2024 | 6,468,871 | 136,492 | 3,144,640 | 973,873 | 38,353 | 10,762,229 | ||||||||||||||||||
| Additions | - | - | 194,196 | 242,775 | - | 436,971 | ||||||||||||||||||
| Balance at September 30, 2025 | 6,468,871 | 136,492 | 3,338,836 | 1,216,648 | 38,353 | 11,199,200 | ||||||||||||||||||
| Accumulated Depreciation | ||||||||||||||||||||||||
| Balance at December 31, 2023 | 413,031 | 85,549 | 1,016,219 | 625,256 | 7,791 | 2,147,846 | ||||||||||||||||||
| Depreciation | 277,685 | 33,153 | 184,532 | 173,193 | 7,671 | 676,234 | ||||||||||||||||||
| Balance at December 31, 2024 | 690,716 | 118,702 | 1,200,751 | 798,449 | 15,462 | 2,824,080 | ||||||||||||||||||
| Depreciation | 206,095 | 10,624 | 126,487 | 177,241 | 5,753 | 526,200 | ||||||||||||||||||
| Balance at September 30, 2025 | 896,811 | 129,326 | 1,327,238 | 975,690 | 21,215 | 3,350,280 | ||||||||||||||||||
| Carrying Amount | ||||||||||||||||||||||||
| At December 31, 2024 | 5,778,155 | 17,790 | 1,943,889 | 175,424 | 22,891 | 7,938,149 | ||||||||||||||||||
| At September 30, 2025 | 5,572,060 | 7,166 | 2,011,598 | 240,958 | 17,138 | 7,848,920 | ||||||||||||||||||
-
New Found Gold Corp.
Notes to the Condensed Interim Financial Statements
For the three and nine months ended September 30, 2025 and 2024
(Unaudited - Expressed in Canadian Dollars Unless Otherwise Noted)
| 5. | INVESTMENTS |
The Company classifies its investments at fair value through profit or loss. Realized gains and losses on disposal of investments and unrealized gains and losses in the fair value of investments are reflected in profit or loss in the period in which they occur.
Investments consist of the following as at September 30, 2025 and December 31, 2024:
| September 30, 2025 | December 31, 2024 | |||||||
| $ | $ | |||||||
| Equities held (i) | 540,096 | 779,019 | ||||||
| Warrants held (ii) | - | 147,000 | ||||||
| Total Investments | 540,096 | 926,019 | ||||||
(i) Equities held
The Company held the following equities as at September 30, 2025 and December 31, 2024:
| Quantity | Cost $ |
Fair Value September 30, 2025 $ |
||||||||||
| Exploits Discovery Corp. | 4,157,466 | 2,659,473 | 291,023 | |||||||||
| Maritime Resources Corp. | 102,923 | 74,468 | 249,073 | |||||||||
| Total Equities | 2,733,941 | 540,096 | ||||||||||
| Quantity | Cost $ |
Fair Value December 31, 2024 $ |
||||||||||
| Exploits Discovery Corp. | 4,157,466 | 2,659,473 | 187,086 | |||||||||
| Labrador Gold Corp. | 9,865,556 | 6,953,907 | 591,933 | |||||||||
| Total Equities | 9,613,380 | 779,019 | ||||||||||
Investments in Exploits Discovery Corp., Maritime Resources Corp. and Labrador Gold Corp. represent investments in public companies that are quoted on an active exchange and are measured using the quoted market price of these companies.
(ii) Warrants held
The Company held the following warrants as at December 31, 2024:
| Quantity | Cost $ |
Fair Value December 31, 2024 $ |
||||||||||
| Maritime Resources Corp. (1) | 1,532,457 | 174,500 | 147,000 | |||||||||
| Total Warrants | 174,500 | 147,000 | ||||||||||
(1) Each warrant was exercisable into one common share of Maritime Resources Corp. at a price of $0.70 per warrant until August 14, 2025. The number of warrants and the exercise price have been adjusted for the 10:1 share consolidation completed by Maritime Resources Corp. in June 2025. All the warrants expired unexercised on August 14, 2025.
-
New Found Gold Corp.
Notes to the Condensed Interim Financial Statements
For the three and nine months ended September 30, 2025 and 2024
(Unaudited - Expressed in Canadian Dollars Unless Otherwise Noted)
| 5. | INVESTMENTS (continued) |
Warrants that do not have a quoted market price are valued using a Black-Scholes option pricing model using assumptions including risk free interest rate, expected dividend yield, expected volatility, and expected remaining life of the warrant, which are supported by observable market conditions.
An analysis of investments including related gains and losses for the nine months ended September 30, 2025 and 2024 is as follows:
| Nine months ended September 30, | ||||||||
|
2025 $ |
2024 $ |
|||||||
| Investments, beginning of period | 926,019 | 3,596,592 | ||||||
| Received as interest income (Note 7) | 74,468 | - | ||||||
| Proceeds on disposal of investments | (752,634 | ) | (688,220 | ) | ||||
| Realized gains (losses) on investments | 160,701 | (247,660 | ) | |||||
| Unrealized gains (losses) on investments | 131,542 | (1,086,627 | ) | |||||
| Investments, end of period | 540,096 | 1,574,085 | ||||||
| 6. | INVESTMENT IN KIRKLAND LAKE DISCOVERIES CORP. |
The investment in Kirkland Lake Discoveries Corp. (“KLDC”) represents 24.67% (December 31, 2024 - 25.91%) of the issued and outstanding common shares of KLDC at September 30, 2025. KLDC and the Company had a director and officer in common up until December 16, 2024, being Denis Laviolette, former Director and President of the Company. Based on assessments of the relevant facts and circumstances, primarily, the Company's ownership interests, board representation and ability to influence operating, strategic and financing decisions, the Company concluded that it continues to have significant influence over KLDC, and as a result has accounted for it as an investment in an associate since the acquisition of its ownership interest on May 25, 2023.
The following tables illustrate the summarised financial information of the Company’s investment in KLDC as at September 30, 2025 and December 31, 2024 on a 100% basis and reflecting adjustments made by the Company, including fair value adjustments made at the time of acquisition and adjustments for differences due to accounting policies:
| September 30, 2025 $ |
December 31, 2024 $ |
|||||||
| Summarised Statement of Financial Position | ||||||||
| Current assets | 1,364,697 | 1,913,417 | ||||||
| Non-current assets | 8,433,529 | 4,551,364 | ||||||
| Current liabilities | (386,336 | ) | (576,261 | ) | ||||
| Net assets | 9,411,890 | 5,888,520 | ||||||
| The Company’s ownership interest | 24.67 | % | 25.91 | % | ||||
| Share of KLDC’s net assets | 2,322,095 | 1,525,756 | ||||||
-
New Found Gold Corp.
Notes to the Condensed Interim Financial Statement
For the three and nine months ended September 30, 2025 and 2024
(Unaudited - Expressed in Canadian Dollars Unless Otherwise Noted)
6. INVESTMENT IN KIRKLAND LAKE DISCOVERIES CORP. (continued)
| Three months ended September 30, | Nine months ended September 30, | |||||||||||||||
| Summarised Statement of Loss and Comprehensive Loss | 2025 $ |
2024 $ |
2025 $ |
2024 $ |
||||||||||||
| Net loss and comprehensive loss for the period | (766,868 | ) | (997,155 | ) | (982,367 | ) | (3,290,413 | ) | ||||||||
| Share of KLDC’s loss for the period | (186,324 | ) | (321,932 | ) | (244,116 | ) | (1,062,312 | ) | ||||||||
The Company performs an impairment indicator assessment on its investment in KLDC at each period end. The assessment is based on the review of recent share price history, industry statistics and assessment of the current market conditions. At December 31, 2024, there were no indicators of impairment of the Company’s investment in KLDC. The Company had previously recognized an impairment loss of $1,000,237 on its equity investment in Kirkland Lake Discoveries Corp. during the year ended December 31, 2023. This impairment loss was reversed at September 30, 2025 due to a significant increase in stock price of Kirkland Lake Discoveries Corp. during the three months ended September 30, 2025.
The following table illustrates the movement in investment in associate for the period from December 31, 2023 to September 30, 2025:
| Net carrying amount – December 31, 2023 | $ | 2,861,250 | ||
| Share of loss from operations of associate during the period | (1,306,722 | ) | ||
| Loss on dilution of equity investment | (28,772 | ) | ||
| Net carrying amount – December 31, 2024 | $ | 1,525,756 | ||
| Share of loss from operations of associate during the period | (244,116 | ) | ||
| Gain on dilution of equity investment | 40,218 | |||
| Reversal of impairment from equity investment | 1,000,237 | |||
| Net carrying amount – September 30, 2025 | $ | 2,322,095 |
The estimated fair value of the Company’s investment in KLDC is $10,040,126 as at September 30, 2025 (December 31, 2024 - $1,287,563) based on the quoted market price of its common shares on the TSX Venture exchange.
Subsequent to September 30, 2025, the Company’s ownership interest was further diluted and it lost significant influence over KLDC.
7. SECURED NOTES
On August 14, 2023, the Company participated in a brokered note offering completed by Maritime Resources Corp. (“Maritime”) consisting of the issuance of non-convertible senior secured notes (the “Notes”) and common share purchase warrants. The Notes had a maturity date of August 14, 2025 (the “Initial Maturity Date”). The Notes bore interest at a rate equal to the Secured Overnight Financing Rate (“SOFR”) plus 6% per annum, payable quarterly in arrears.
Based on the business model in which the secured notes are held and the characteristics of their contractual cash flows, the secured notes were classified as a financial instrument at fair value through profit and loss ("FVTPL") in accordance with IFRS 9 “Financial Instruments”.
The issuance of the Notes included a 40% warrant coverage resulting in the Company receiving 15,324,571 warrants (“Warrants”). These warrants were classified by the Company as investments at FVTPL (Note 5).
The Company allocated the gross investment of $2,638,500 (US$1,960,000) to the Notes and warrants based on their respective fair values at initial recognition. At the time of issuance, the fair value of the Notes was $2,464,000 (US$1,830,300) and the fair value of the warrants was $174,500 (US$129,700).
-
New Found Gold Corp.
Notes to the Condensed Interim Financial Statemen
For the three and nine months ended September 30, 2025 and 2024
(Unaudited - Expressed in Canadian Dollars Unless Otherwise Noted)
7. SECURED NOTES (continued)
During the nine months ended September 30, 2025, the Company sold the Notes for gross proceeds of $2,778,000 (US$2,000,000).
The following table illustrates the movement in the Company’s secured notes for the period from December 31, 2023 to September 30, 2025:
| Secured notes at December 31, 2023 | $ | 2,454,300 | ||
| Revaluation of secured notes | 140,786 | |||
| Foreign exchange gain | 222,468 | |||
| Secured notes at December 31, 2024 | $ | 2,817,554 | ||
| Proceeds on disposal of secured notes | (2,778,000 | ) | ||
| Realized gain on disposal of secured notes | 55,911 | |||
| Foreign exchange loss | (95,465 | ) | ||
| Secured notes at September 30, 2025 | $ | - |
During the nine months ended September 30, 2025, the Company received $74,468 of interest income paid in common shares of Maritime on the secured notes (September 30, 2024 – $227,463).
8. FLOW-THROUGH SHARE PREMIUM
| Issued November 2023 |
Issued June 2025 |
Total | ||||||||||
| $ | $ | $ | ||||||||||
| Balance at December 31, 2023 | 12,426,322 | - | 12,426,322 | |||||||||
| Settlement of flow-through share premium on expenditures incurred | (5,906,474 | ) | - | (5,906,474 | ) | |||||||
| Balance at September 30, 2024 | 6,519,848 | - | 6,519,848 | |||||||||
| Settlement of flow-through share premium on expenditures incurred | (6,519,848 | ) | - | (6,519,848 | ) | |||||||
| Balance at December 31, 2024 | - | - | - | |||||||||
| Liability incurred on flow-through shares issued | - | 16,242,600 | 16,242,600 | |||||||||
| Settlement of flow-through share premium on expenditures incurred | - | (4,249,959 | ) | (4,249,959 | ) | |||||||
| Balance at September 30, 2025 | - | 11,992,641 | 11,992,641 | |||||||||
Flow-through share arrangements entitle the holder of the flow-through share to a 100% tax deduction in respect of qualifying Canadian exploration expenses as defined in the Income Tax Act, Canada (“Qualifying CEE”).
During the nine months ended September 30, 2025, the Company incurred $14,746,070 (nine months ended September 30, 2024 – $21,627,242) in Qualifying CEE and amortized a total of $4,249,959 (nine months ended September 30, 2024 – $5,906,474) of its flow-through share premium liabilities. The flow-through share premium liability does not represent a cash liability to the Company and is to be fully amortized to the statement of loss and comprehensive loss pro-rata with the amount of qualifying expenditures that will be incurred.
During the nine months ended September 30, 2025, the Company incurred $67,143 (nine months ended September 30, 2024 - $629,039) in Part XII.6 tax in respect of unspent flow-through proceeds renounced in year 1 under the Look-Back Rules, in accordance with the Income Tax Act of Canada. As at September 30, 2025, the Company must spend another $41,610,830 of Qualifying CEE by December 31, 2026, to satisfy its remaining current flow-through share premium liability of $11,992,641.
-
New Found Gold Corp.
Notes to the Condensed Interim Financial Statements
For the three and nine months ended September 30, 2025 and 2024
(Unaudited - Expressed in Canadian Dollars Unless Otherwise Noted)
| 9. | ACCOUNTS PAYABLE AND ACCRUED LIABILITIES |
| September 30,
2025 $ |
December 31,
2024 $ |
|||||||
| Accounts payable and accrued liabilities | 3,913,045 | 4,898,825 | ||||||
| Reclamation provision(1) | 2,598,695 | 2,426,378 | ||||||
| Accounts payable and accrued liabilities, end of period | 6,511,740 | 7,325,203 | ||||||
(1) Provincial laws and regulations concerning environmental protection affect the Company’s exploration and operations. Under current regulations, the Company is required to meet performance standards to minimize the environmental impact from its activities and to perform site restoration and other reclamation activities. The Company’s reclamation provision is based on known requirements.
The breakdown of the Company’s reclamation provision is as follows:
| September 30,
2025 $ |
December 31,
2024 $ |
|||||||
| Balance, beginning of period | 2,426,378 | 1,285,031 | ||||||
| Additions to reclamation provision | 330,601 | 1,515,593 | ||||||
| Change in estimate | (7,232 | ) | 26,784 | |||||
| Reclamation costs incurred | (151,052 | ) | (401,030 | ) | ||||
| Balance, end of period | 2,598,695 | 2,426,378 | ||||||
The Company has estimated that the reclamation obligations are current costs and as such considers the present value of the provision at September 30, 2025 to be equal to the total future undiscounted cash flows to settle the provision for reclamation, being $2,598,695 (December 31, 2024 - $2,426,378). Additions to the reclamation provision are included in the total amount of exploration and evaluation expenditures in the condensed interim statement of loss and comprehensive loss.
| 10. | SHARE CAPITAL AND RESERVES |
Authorized Share Capital
At September 30, 2025, the authorized share capital comprised an unlimited number of common shares. The common shares do not have a par value. All issued shares are fully paid.
Details of Common Shares Issued During the Nine Months Ended September 30, 2025
On June 12, 2025, the Company completed a bought deal offering of 24,610,000 flow-through common shares, closing the first tranche of the offering on June 3, 2025 and the second and final tranche of the offering on June 12, 2025, at a price of $2.29 per common share and 4,370,000 non-flow-through common shares at a price of $1.63 per common share, for aggregate gross proceeds of $63,480,000. The Company incurred share issuance costs of $3,912,782 in cash of which $2,602,373 was paid to the underwriters. The premium received on the flow-through shares issued was determined to be $16,242,600.
On August 27, 2025, the Company completed a non-brokered private placement and issued 12,269,939 common shares at a price of $1.63 per common share for gross proceeds of $20,000,001.
During the nine months ended September 30, 2025, 1,329,329 common shares were issued on exercise of 1,345,000 stock options. They options were exercised at a weighted average exercise price of $1.38 per share for gross proceeds of $1,797,025.
-
New Found Gold Corp.
Notes to the Condensed Interim Financial Statements
For the three and nine months ended September 30, 2025 and 2024
(Unaudited - Expressed in Canadian Dollars Unless Otherwise Noted)
| 10. | SHARE CAPITAL AND RESERVES (continued) |
Details of Common Shares Issued During the Year Ended December 31, 2024
In August 2022, the Company filed a prospectus supplement to its short form base shelf prospectus, pursuant to which the Company may, at its discretion and from time-to-time, sell common shares of the Company for aggregate gross proceeds of up to US$100,000,000. The sale of common shares is to be made through “at-the-market distributions” ("ATM"), as defined in the Canadian Securities Administrators’ National Instrument 44-102 Shelf Distributions, directly on the TSX Venture Exchange and the NYSE American stock exchange.
During the year ended December 31, 2024, the Company sold 5,857,242 common shares of the Company under the ATM program at an average price of $4.70 for gross proceeds of $27,522,494 or net proceeds of $26,607,687, and paid an aggregate commission of $914,807. At December 31, 2024, the Company completed $51,798,893 of the ATM program. As at December 31, 2024, the ATM had expired.
On November 1, 2024, the Company issued 69,583 common shares with a value of $215,707 pursuant to the acquisition of exploration and evaluation assets in accordance with the terms of certain property option agreements (Note 3 (i)).
On August 8, 2024, the Company issued 300,000 common shares with a value of $1,011,000 pursuant to the acquisition of certain royalty interests (Note 3(i)).
On July 9, 2024, the Company issued 5,263,157 common shares to LabGold with a value of $20,000,000 pursuant to the acquisition of the Kingsway Project (Note 3(i)).
On June 26, 2024, the Company issued 370,000 common shares with a value of $1,750,100 pursuant to a legal claim settlement agreement (Note 14).
During the year ended December 31, 2024, 1,725,000 share purchase options were exercised at a weighted average exercise price of $0.50 per share for gross proceeds of $862,500.
Share Purchase Option Compensation Plan
As at September 30, 2025, the Company has a share purchase option plan (the “Option Plan”) approved by the Company’s shareholders that allows it to grant share purchase options, subject to regulatory and corporate approval, to its officers, directors, employees and service providers. The Option Plan is based on the maximum number of eligible shares not exceeding 10% in the aggregate and 5% with respect to any one optionee of the Company’s outstanding common shares in any twelve-month period. If outstanding share purchase options are exercised or expire, and/or the number of issued and outstanding common shares of the Company increases, then the share purchase options available to grant under the Option Plan increase proportionately. The exercise price and vesting terms of each share purchase option is set by the Board of Directors at the time of grant. Share purchase options granted may be subject to a four-month hold period and exercisable for a period determined by the Board of Directors which cannot exceed ten years.
Share Unit Compensation Plan
The Company adopted a share unit plan (the “Share Unit Plan”). Under the Share Unit Plan, the Company may grant incentive awards (the “Awards”) consisting of restricted share units (“RSUs”), deferred share units (“DSUs”), and performance share units (“PSUs”), subject to regulatory and corporate approvals, to its officers, directors, employees and service providers (the “Participants”). The Share Unit Plan, in conjunction with the Option Plan, cannot exceed 10% of the issued and outstanding common shares of the Company. The terms of the Awards are set by the Board of Directors at the time of grant.
-
New Found Gold Corp.
Notes to the Condensed Interim Financial Statements
For the three and nine months ended September 30, 2025 and 2024
(Unaudited - Expressed in Canadian Dollars Unless Otherwise Noted)
| 10. | SHARE CAPITAL AND RESERVES (continued) |
Share Purchase Options
The continuity of share purchase options for the nine months ended September 30, 2025 is as follows:
|
Expiry date |
Exercise Price |
Outstanding December 31, 2024 |
Granted | Exercised |
Cancelled/ Forfeited/ Expired |
Outstanding September 30, 2025 |
Exercisable September 30, 2025 |
|||||||||||||||||||||
| April 18, 2025 | $ | 1.00 | 100,000 | - | (100,000 | ) | - | - | - | |||||||||||||||||||
| May 23, 2025 | $ | 1.075 | 75,000 | - | (75,000 | ) | - | - | - | |||||||||||||||||||
| August 11, 2025 | $ | 1.40 | 1,125,000 | - | (1,125,000 | ) | - | - | - | |||||||||||||||||||
| September 3, 2025 | $ | 2.07 | 50,000 | - | (20,000 | ) | (30,000 | ) | - | - | ||||||||||||||||||
| October 1, 2025 | $ | 2.15 | 25,000 | - | (25,000 | ) | - | - | - | |||||||||||||||||||
| December 31, 2025 | $ | 4.10 | 5,305,000 | - | - | (4,530,000 | ) | 775,000 | 775,000 | |||||||||||||||||||
| April 29, 2026 | $ | 6.79 | 891,500 | - | - | (398,500 | ) | 493,000 | 493,000 | |||||||||||||||||||
| May 17, 2026 | $ | 8.62 | 200,000 | - | - | (200,000 | ) | - | - | |||||||||||||||||||
| September 27, 2026 | $ | 8.70 | 125,000 | - | - | - | 125,000 | 125,000 | ||||||||||||||||||||
| November 8, 2026 | $ | 8.04 | 7,500 | - | - | - | 7,500 | 7,500 | ||||||||||||||||||||
| January 4, 2027 | $ | 8.98 | 15,000 | - | - | (7,500 | ) | 7,500 | 7,500 | |||||||||||||||||||
| August 19, 2027 | $ | 5.75 | 340,000 | - | - | (150,000 | ) | 190,000 | 190,000 | |||||||||||||||||||
| September 8, 2027 | $ | 5.00 | 20,000 | - | - | - | 20,000 | 20,000 | ||||||||||||||||||||
| December 27, 2027 | $ | 5.68 | 2,037,750 | - | - | (887,750 | ) | 1,150,000 | 1,114,375 | |||||||||||||||||||
| February 20, 2029 | $ | 4.59 | 200,000 | - | - | - | 200,000 | 200,000 | ||||||||||||||||||||
| May 6, 2029 | $ | 4.78 | 40,000 | - | - | (40,000 | ) | - | - | |||||||||||||||||||
| May 13, 2030 | $ | 1.67 | - | 3,770,000 | - | - | 3,770,000 | 1,166,667 | ||||||||||||||||||||
| September 26, 2030 | $ | 2.97 | - | 809,167 | - | - | 809,167 | - | ||||||||||||||||||||
| 10,556,750 | 4,579,167 | (1,345,000 | ) | (6,243,750 | ) | 7,547,167 | 4,099,042 | |||||||||||||||||||||
| Weighted average exercise price $ | 3.97 | 1.90 | 1.38 | 4.68 | 3.32 | 4.42 | ||||||||||||||||||||||
| Weighted average contractual remaining life (years) | 1.50 | - | - | - | 3.41 | 2.34 | ||||||||||||||||||||||
-
New Found Gold Corp.
Notes to the Condensed Interim Financial Statements
For the three and nine months ended September 30, 2025 and 2024
(Unaudited - Expressed in Canadian Dollars Unless Otherwise Noted)
| 10. | SHARE CAPITAL AND RESERVES (continued) |
Share Purchase Options (continued)
The continuity of share purchase options for the nine months ended September 30, 2024 is as follows:
| Expiry date | Exercise
Price |
Outstanding
December 31, 2023 |
Granted | Exercised | Cancelled/ Forfeited/ Expired |
Outstanding
September 30, 2024 |
Exercisable
September 30, 2024 |
|||||||||||||||||||||
| December 17, 2024 | $ | 0.50 | 1,725,000 | - | (175,000 | ) | - | 1,550,000 | 1,550,000 | |||||||||||||||||||
| April 18, 2025 | $ | 1.00 | 100,000 | - | - | - | 100,000 | 100,000 | ||||||||||||||||||||
| May 23, 2025 | $ | 1.075 | 75,000 | - | - | - | 75,000 | 75,000 | ||||||||||||||||||||
| August 11, 2025 | $ | 1.40 | 1,125,000 | - | - | - | 1,125,000 | 1,125,000 | ||||||||||||||||||||
| September 3, 2025 | $ | 2.07 | 50,000 | - | - | - | 50,000 | 50,000 | ||||||||||||||||||||
| October 1, 2025 | $ | 2.15 | 25,000 | - | - | - | 25,000 | 25,000 | ||||||||||||||||||||
| December 31, 2025 | $ | 4.10 | 5,305,000 | - | - | - | 5,305,000 | 5,305,000 | ||||||||||||||||||||
| April 29, 2026 | $ | 6.79 | 962,875 | - | - | (36,375 | ) | 926,500 | 926,500 | |||||||||||||||||||
| May 17, 2026 | $ | 8.62 | 200,000 | - | - | - | 200,000 | 200,000 | ||||||||||||||||||||
| September 27, 2026 | $ | 8.70 | 125,000 | - | - | - | 125,000 | 125,000 | ||||||||||||||||||||
| November 8, 2026 | $ | 8.04 | 47,500 | - | - | (40,000 | ) | 7,500 | 6,375 | |||||||||||||||||||
| January 4, 2027 | $ | 8.98 | 22,500 | - | - | (7,500 | ) | 15,000 | 12,750 | |||||||||||||||||||
| August 19, 2027 | $ | 5.75 | 340,000 | - | - | - | 340,000 | 283,000 | ||||||||||||||||||||
| September 8, 2027 | $ | 5.00 | 20,000 | - | - | - | 20,000 | 20,000 | ||||||||||||||||||||
| December 27, 2027 | $ | 5.68 | 2,156,250 | - | - | (116,250 | ) | 2,040,000 | 1,926,375 | |||||||||||||||||||
| February 20, 2029 | $ | 4.59 | - | 200,000 | - | - | 200,000 | 200,000 | ||||||||||||||||||||
| May 6, 2029 | $ | 4.78 | - | 40,000 | - | - | 40,000 | 4,000 | ||||||||||||||||||||
| 12,279,125 | 240,000 | (175,000 | ) | (200,125 | ) | 12,144,000 | 11,934,000 | |||||||||||||||||||||
| Weighted average exercise price $ | 3.97 | 4.62 | 0.50 | 6.48 | 3.99 | 3.96 | ||||||||||||||||||||||
| Weighted average contractual remaining life (years) | 2.25 | - | - | - | 1.56 | 1.53 | ||||||||||||||||||||||
The table below summarizes the weighted average fair value of share purchase options granted, exercised and the share price at the date of exercise:
| Nine months ended September 30, | |||||||||
| 2025 | 2024 | ||||||||
| Weighted average: | |||||||||
| Fair value of share purchase options granted | $ | 1.11 | $ | 3.06 | |||||
| Fair value of share purchase options exercised | $ | 1.02 | $ | 0.38 | |||||
| Closing share price at the date of exercise | $ | 2.32 | $ | 4.24 | |||||
-
New Found Gold Corp.
Notes to the Condensed Interim Financial Statements
For the three and nine months ended September 30, 2025 and 2024
(Unaudited - Expressed in Canadian Dollars Unless Otherwise Noted)
| 10. | SHARE CAPITAL AND RESERVES (continued) |
Share Purchase Options (continued)
Options were priced based on the Black-Scholes option pricing model using the following weighted average assumptions to estimate the fair value of options granted:
| Nine months ended September 30, | ||||||||
| 2025 | 2024 | |||||||
| Risk-free interest rate | 2.80 | % | 3.59 | % | ||||
| Expected option life in years | 5 | 5 | ||||||
| Expected share price volatility | 68.33 | % | 80.23 | %(i) | ||||
| Grant date share price | $ | 1.90 | $ | 4.62 | ||||
| Expected forfeiture rate | Nil | Nil | ||||||
| Expected dividend yield | Nil | Nil | ||||||
| (i) | The expected share price volatility was based on the average historical share price of comparable companies over the life of the option. |
Restricted Share Units (“RSUs”)
During the nine months ended September 30, 2025, the Company granted 300,000 RSUs of the Company (2024 – Nil) to a consultant. These RSUs are cash settled and vest on September 26, 2026. The Company recorded a share-based compensation expense of $40,808 related to these RSUs (2024 – $Nil), net of forfeitures of $Nil.
The continuity of the share-based compensation liabilities in connection with these RSUs for the nine months ended September 20, 2025 is as follows:
| Balance at December 31, 2024 | $ | - | ||
| Share-based compensation for the period | 40,808 | |||
| Forfeitures | - | |||
| Settlement | - | |||
| Balance at September 30, 2025 | $ | 40,808 |
During the nine months ended September 30, 2025, the Company also granted 2,053,000 RSUs of the Company (2024 – Nil) to directors and officers of the Company. These RSUs are expected to be equity settled. 1/3 of the RSUs vest on September 26, 2026, 1/3 vest on September 26, 2027 and 1/3 vest on September 26, 2028. The Company recorded a share-based compensation expense of $58,950 related to these RSUs (2024 – $Nil), net of forfeitures of $Nil.
As at September 30, 2025, outstanding RSUs are as follows:
| Vesting date | Number of RSUs | |||
| September 26, 2026 | 984,334 | |||
| September 26, 2027 | 684,333 | |||
| September 26, 2028 | 684,333 | |||
| Total | 2,353,000 | |||
-
New Found Gold Corp.
Notes to the Condensed Interim Financial Statements
For the three and nine months ended September 30, 2025 and 2024
(Unaudited - Expressed in Canadian Dollars Unless Otherwise Noted)
| 10. | SHARE CAPITAL AND RESERVES (continued) |
Restricted Share Units (“RSUs”) (continued)
The continuity of the equity-settled RSUs for the nine months ended September 30, 2025 is as follows:
| Balance at December 31, 2024 | - | ||||
| Granted | 2,353,000 | ||||
| Vested | - | ||||
| Forfeited | - | ||||
| Balance at September 30, 2025 | 2,353,000 | ||||
11. RELATED PARTY BALANCES AND TRANSACTIONS
All transactions with related parties have occurred in the normal course of operations and are measured at the amount of consideration paid or received. A summary of the Company’s related party transactions with corporations having similar directors and officers is as follows:
| Three months ended September 30, |
Nine months ended September 30, |
|||||||||||||||
| 2025 $ |
2024 $ |
2025 $ |
2024 $ |
|||||||||||||
| Amounts paid to PJH Consulting, LLC (i) included in salaries and consulting | 20,615 | - | 63,134 | - | ||||||||||||
| Amounts paid to EarthLabs Inc. (ii) for exploration and evaluation | - | 4,500 | - | 13,500 | ||||||||||||
| Amounts paid to Notz Capital Corp. (iii) for corporate development and investor relations | - | 44,397 | 46,921 | 132,361 | ||||||||||||
| (i) | Amounts incurred for administrative services provided by a close family member of Paul Huet, Chair of the Board of directors. PJH Consulting, LLC is a related entity of Paul Huet, Chair of the Board of Directors. |
| (ii) | Amounts incurred for administrative services provided by EarthLabs Inc., a related entity of Denis Laviolette, former Director and President. |
| (iii) | Amounts incurred for corporate development and investor relations services provided by a close family member of Collin Kettell, former Executive Chairman and Chief Executive Officer. |
There are no ongoing contractual commitments resulting from these transactions with related parties.
Key management personnel compensation
Key management personnel include those persons having authority and responsibility for planning, directing and controlling the activities of the Company as a whole. The Company has determined that key management personnel consist of executive and non-executive members of the Company’s Board of Directors and corporate officers.
-
New Found Gold Corp.
Notes to the Condensed Interim Financial Statements
For the three and nine months ended September 30, 2025 and 2024
(Unaudited - Expressed in Canadian Dollars Unless Otherwise Noted)
| 11. | RELATED PARTY BALANCES AND TRANSACTIONS (continued) |
| Three months ended September 30, 2025 | Salaries
and Consulting $ |
Share-based
compensation $ |
Bonus $ |
Total $ |
||||||||||||
| Keith Boyle, Chief Executive Officer | 112,500 | 205,079 | - | 317,579 | ||||||||||||
| Melissa Render, President | 90,000 | (1) | 94,789 | - | 184,789 | |||||||||||
| Hashim Ahmed, Chief Financial Officer | 15,256 | 5,736 | - | 20,992 | ||||||||||||
| Robert Assabgui, Chief Operating Officer | 13,542 | 2,704 | - | 16,246 | ||||||||||||
| Michael Kanevsky, Former Chief Financial Officer | 204,120 | (2) | - | - | 204,120 | |||||||||||
| Paul Huet, Director | 41,229 | 334,132 | - | 375,361 | ||||||||||||
| William Hayden, Director | 18,000 | 8,614 | - | 26,614 | ||||||||||||
| Chad Williams, Director | 18,000 | 8,614 | - | 26,614 | ||||||||||||
| Vijay Mehta, Director | 15,000 | - | - | 15,000 | ||||||||||||
| Tamara Brown, Director | 8,400 | 8,614 | - | 17,014 | ||||||||||||
| Dr. Andrew Furey, Director | 6,000 | 8,614 | - | 14,614 | ||||||||||||
| Total | 542,047 | 676,896 | - | 1,218,943 | ||||||||||||
| (1) | Salary recorded in exploration and evaluation expenditures in the statement of loss and comprehensive loss. |
| (2) | Includes termination benefit of $174,960 in accordance with the terms of their management agreement. |
| Three months ended September 30, 2024 | Salaries
and Consulting $ |
Share-based
compensation $ |
Bonus $ |
Total $ |
||||||||||||
| Collin Kettell, Former Executive Chairman and Chief Executive Officer | 97,200 | - | - | 97,200 | ||||||||||||
| Denis Laviolette, Former President | 68,040 | - | - | 68,040 | ||||||||||||
| Michael Kanevsky, Former Chief Financial Officer | 29,160 | - | - | 29,160 | ||||||||||||
| Greg Matheson, Former Chief Operating Officer | 70,680 | - | - | 70,680 | ||||||||||||
| Ron Hampton, Former Chief Development Officer | 84,240 | (1) | 21,269 | - | 105,509 | |||||||||||
| Doug Hurst, Former Director | 18,000 | - | - | 18,000 | ||||||||||||
| Raymond Threlkeld, Former Director | 18,000 | - | - | 18,000 | ||||||||||||
| Vijay Mehta, Director | 18,000 | - | - | 18,000 | ||||||||||||
| Total | 403,320 | 21,269 | - | 424,589 | ||||||||||||
| (1) | Salary and bonus recorded in exploration and evaluation expenditures in the statement of loss and comprehensive loss. |
-
New Found Gold Corp.
Notes to the Condensed Interim Financial Statements
For the three and nine months ended September 30, 2025 and 2024
(Unaudited - Expressed in Canadian Dollars Unless Otherwise Noted)
| 11. | RELATED PARTY BALANCES AND TRANSACTIONS (continued) |
| Nine months ended September 30, 2025 | Salaries
and Consulting $ |
Share-based
compensation $ |
Bonus $ |
Total $ |
||||||||||||
| Keith Boyle, Chief Executive Officer | 313,306 | 309,080 | - | 622,387 | ||||||||||||
| Collin Kettell, Former Executive Chairman and Chief Executive Officer | 38,400 | - | 1,031,760 | 1,070,160 | ||||||||||||
| Melissa Render, President | 270,000 | (1) | 307,724 | - | 577,724 | |||||||||||
| Hashim Ahmed, Chief Financial Officer | 15,256 | 5,736 | - | 20,992 | ||||||||||||
| Robert Assabgui, Chief Operating Officer | 13,542 | 2,704 | - | 16,246 | ||||||||||||
| Michael Kanevsky, Former Chief Financial Officer | 262,440 | (2) | - | - | 262,440 | |||||||||||
| Greg Matheson, Former Chief Operating Officer | 471,200 | (3) | - | - | 471,200 | |||||||||||
| Ron Hampton, Former Chief Development Officer | 562,529 | (1)(4) | - | - | 562,529 | |||||||||||
| Paul Huet, Director | 126,268 | 1,481,849 | - | 1,608,117 | ||||||||||||
| William Hayden, Director | 54,000 | 8,614 | - | 62,614 | ||||||||||||
| Chad Williams, Director | 42,000 | 8,614 | - | 50,614 | ||||||||||||
| Vijay Mehta, Director | 51,000 | - | - | 51,000 | ||||||||||||
| Tamara Brown, Director | 8,400 | 8,614 | - | 17,014 | ||||||||||||
| Dr. Andrew Furey, Director | 6,000 | 8,614 | - | 14,614 | ||||||||||||
| Total | 2,234,341 | 2,141,549 | 1,031,760 | 5,407,650 | ||||||||||||
| (1) | Salary recorded in exploration and evaluation expenditures in the statement of loss and comprehensive loss. |
| (2) | Includes termination benefit of $174,960 in accordance with the terms of their management agreement. |
| (3) | Includes termination benefit of $424,080 in accordance with the terms of their management agreement. |
| (4) | Includes termination benefit of $505,440 in accordance with the terms of their management agreement. |
| Nine months ended September 30, 2024 | Salaries
and Consulting $ |
Share-based
compensation $ |
Bonus $ |
Total $ |
||||||||||||
| Collin Kettell, Former Executive Chairman and Chief Executive Officer | 291,600 | - | 129,600 | 421,200 | ||||||||||||
| Denis Laviolette, Former President | 204,120 | - | 90,720 | 294,840 | ||||||||||||
| Michael Kanevsky, Former Chief Financial Officer | 87,480 | - | 38,880 | 126,360 | ||||||||||||
| Greg Matheson, Former Chief Operating Officer | 199,540 | - | 84,240 | 283,780 | ||||||||||||
| Ron Hampton, Former Chief Development Officer | 252,720 | (1) | 80,566 | 112,320 | (1) | 445,606 | ||||||||||
| Doug Hurst, Former Director | 54,000 | - | - | 54,000 | ||||||||||||
| Raymond Threlkeld, Former Director | 54,000 | - | - | 54,000 | ||||||||||||
| Vijay Mehta, Director | 54,000 | - | - | 54,000 | ||||||||||||
| Total | 1,197,460 | 80,566 | 455,760 | 1,733,786 | ||||||||||||
| (1) | Salary and bonus recorded in exploration and evaluation expenditures in the statement of loss and comprehensive loss. |
As at September 30, 2025, there was $31,494 owed to Keith Boyle, the Company’s Chief Executive Officer, for travel expenditures, $15,000 owed to Melissa Render, the Company’s President, for compensation, $15,256 owed to Hashim Ahmed, the Company’s Chief Financial Officer, for compensation, $3,000 owed to Chad Williams for directors fees, and $3,000 owed to Tamara Brown for directors fees included in accounts payable and accrued liabilities (December 31, 2024 - $56,040 comprised of $15,000 for compensation and $1,533 for travel expenditures owed to Melissa Render, the Company’s President, $22,426 for travel expenditures owed to Greg Matheson, former Chief Operating Officer, $2,163 for travel expenditures owed to Collin Kettell, former Executive Chairman and Chief Executive Officer, $152 to Michael Kanevsky, Chief Financial Officer for office expenditures, $14,040 for compensation and $725 for travel expenditures owed to Ron Hampton, the Company’s former Chief Development Officer). The amounts are unsecured, non-interest bearing and without fixed terms of repayment.
Under the terms of their management agreements, certain officers of the Company are entitled to 18 months of base pay in the event of their agreements being terminated without cause.
-
New Found Gold Corp.
Notes to the Condensed Interim Financial Statements
For the three and nine months ended September 30, 2025 and 2024
(Unaudited - Expressed in Canadian Dollars Unless Otherwise Noted)
12. BASIC AND DILUTED LOSS PER COMMON SHARE
| Three months ended September 30, | Nine months ended September 30, | |||||||||||||||
| 2025 | 2024 | 2025 | 2024 | |||||||||||||
| Basic weighted average number of common shares outstanding | 235,018,399 | 198,019,407 | 214,761,519 | 192,324,461 | ||||||||||||
| Effect of outstanding securities | - | - | - | - | ||||||||||||
| Diluted weighted average number of common shares outstanding | 235,018,399 | 198,019,407 | 214,761,519 | 192,324,461 | ||||||||||||
For the three and nine months ended September 30, 2025 and 2024, the Company incurred net loss and comprehensive loss. As such, diluted loss per share excludes any potential conversion of 7,547,167 (2024 - 12,144,000) share purchase options and 2,353,000 RSU’s (2024 – Nil) as they are anti-dilutive.
| 13. | SUPPLEMENTAL DISCLOSURE WITH RESPECT TO CASH FLOWS |
| Nine months ended September 30, | ||||||||
| 2025 $ |
2024 $ |
|||||||
| Non-cash investing and financing activities: | ||||||||
| Right-of-use assets and liabilities | - | 75,041 | ||||||
| Interest income received in common shares of Maritime Resources Corp. | 74,468 | - | ||||||
| Share issuance costs included in accounts payable and accrued liabilities | - | 6,302 | ||||||
| Other assets included in accounts payable and accrued liabilities | 83,509 | 79,724 | ||||||
| Property and equipment included in accounts payable and accrued liabilities | 71,023 | 24,500 | ||||||
| Exploration and evaluation assets included in accounts payable and accrued liabilities | - | 840,806 | ||||||
| Shares issued pursuant to acquisition of exploration and evaluation assets (Note 3(i)) | - | 20,661,000 | ||||||
| Shares issued pursuant to acquisition of property and equipment (Note 3(i)) | - | 350,000 | ||||||
| Cash paid for income taxes | - | - | ||||||
| Cash paid for interest | 12,882 | 18,730 | ||||||
| Cash received for interest | 818,196 | 2,375,863 | ||||||
14. SETTLEMENT OF LEGAL CLAIM
Claims and Legal Proceedings
On November 15, 2019, ThreeD Capital Inc. (“ThreeD”) and 1313366 Ontario Inc. (“131” and together with ThreeD, the “Plaintiffs”) each entered into share purchase agreements (the “Share Purchase Agreements”) with Palisades Goldcorp Ltd. (“Palisades”) under which Palisades agreed to purchase the 13,500,000 common shares of the Company owned by ThreeD and the 4,000,000 common shares of the Company owned by 131 for $0.08 per common share. The transactions closed on November 20, 2019. As a private company with restrictions on the transfer of its common shares, the Company had to approve the proposed transfer, which it did by a consent resolution of the Board.
-
New Found Gold Corp.
Notes to the Condensed Interim Financial Statements
For the three and nine months ended September 30, 2025 and 2024
(Unaudited - Expressed in Canadian Dollars Unless Otherwise Noted)
14. SETTLEMENT OF LEGAL CLAIM (continued)
On March 10, 2020, ThreeD Capital Inc. and 131 filed a statement of claim in the Ontario Superior Court of Justice against Collin Kettell, Palisades and the Company (the “Defendants” and the “ThreeD Claim”). Pursuant to the ThreeD Claim, the Plaintiffs are challenging the validity of the sale of 17,500,000 common shares by the Plaintiffs to Palisades on November 20, 2019. ThreeD and 131 claim that at the time of negotiation and execution of the Share Purchase Agreements, Palisades and Mr. Kettell were aware of positive drill results from the Company’s 2019 Drill Program and the results were not disclosed to ThreeD and 131 to their detriment. Palisades and Mr. Kettell strongly deny ThreeD and 131’s allegations.
On June 5, 2024, the Company entered into a Settlement Agreement, pursuant to which the Plaintiffs received a total of 3,750,000 common shares of the Company from the Defendants. Palisades transferred 2,607,434 common shares of the Company to ThreeD and 772,566 common shares of the Company to 131. The Company issued 285,429 common shares to ThreeD and 84,571 common shares to 131 with a total value of $1,750,100 recorded in the statement of loss and comprehensive loss for the year ended December 31, 2024. The Settlement Agreement resolves the lawsuit completely, does not include any admission of liability and provides for fulsome releases by the Plaintiffs to the Defendants.
15. FINANCIAL INSTRUMENTS
a) Fair Values
Financial assets and liabilities measured at fair value are recognized according to a fair value hierarchy that prioritizes the inputs to valuation techniques used to measure fair value. The hierarchy gives the highest priority to unadjusted quoted prices in active markets for identical assets and liabilities and the lowest priority to unobservable inputs. The three levels of fair value hierarchy are as follows:
| Level 1 – | Unadjusted quoted prices in active markets that are accessible at the measurement date for identical, unrestricted assets or liabilities. | |
| Level 2 – | Quoted prices in markets that are not active, or inputs that are observable, either directly or indirectly, for substantially the full term of the asset or liability. | |
| Level 3 – | Prices or valuation techniques that require inputs that are both significant to the fair value measurement and unobservable (supported by little or no market activity). |
The Company’s financial instruments measured at fair value are its investments, which includes equities, warrants and Notes held. The fair value of equities held is determined using closing prices at the statement of financial position date with any unrealized gain or loss recognized in profit or loss. The Company’s equities that are subject to non-standard restrictions, warrants and Notes are classified within level 2 of the fair value hierarchy. Warrants are not traded on an active exchange and are valued using the Black-Scholes option pricing model using assumptions including risk-free interest rate, expected dividend yield, expected volatility and expected remaining life of the warrant which are supported by observable market conditions. The Notes are not traded on an active exchange and are valued using the Hull-White valuation model using assumptions including coupon rate, credit spread, mean reversion, rate volatility, riskless rate curve and redemption prices.
The carrying values of other financial instruments, including cash and cash equivalents, deposits, amounts receivable, interest receivable, accounts payable and accrued liabilities, and lease liabilities approximate their fair values due to the short-term maturity of these financial instruments.
-
New Found Gold Corp.
Notes to the Condensed Interim Financial Statements
For the three and nine months ended September 30, 2025 and 2024
(Unaudited - Expressed in Canadian Dollars Unless Otherwise Noted)
15. FINANCIAL INSTRUMENTS (continued)
The Company’s financial instruments carried at fair value and categorized according to the fair value hierarchy are as follows as at September 30, 2025:
| Level 1 $ |
Level 2 $ |
Level 3 $ |
Total $ |
|||||||||||||||||
| Recurring measurements | Carrying amount | Fair value | ||||||||||||||||||
| Investments | 540,096 | 540,096 | - | - | 540,096 | |||||||||||||||
The Company’s financial instruments carried at fair value and categorized according to the fair value hierarchy are as follows as at December 31, 2024:
| Level 1 $ |
Level 2 $ |
Level 3 $ |
Total $ |
|||||||||||||||||
| Recurring measurements | Carrying amount | Fair value | ||||||||||||||||||
| Investments | 926,019 | 779,019 | 147,000 | - | 926,019 | |||||||||||||||
| Secured notes | 2,817,554 | - | 2,817,554 | - | 2,817,554 | |||||||||||||||
There were no movements between levels during the nine months ended September 30, 2025.
(b) Financial Instrument Risk Exposure
Credit risk
Credit risk is the risk that one party to a financial instrument will fail to discharge an obligation and cause the other party to incur a financial loss.
Sales taxes recoverable are due from the Canada Revenue Agency and the Company places its cash with financial institutions with high credit ratings, therefore in management’s judgment, credit risk related to sales taxes recoverable and cash is low.
There have been no changes in management’s methods for managing credit risk since December 31, 2024.
Liquidity risk
Liquidity risk is the risk that the Company will not be able to meet its financial obligations as they fall due. The Company has in place a planning and budgeting process to help determine the funds required to ensure the Company has the appropriate liquidity to meet its operating and growth objectives. The Company has historically relied on the issuance of shares to fund exploration programs and may require doing so again in the future. As at September 30, 2025, the Company has total liabilities of $18,614,380 and cash and cash equivalents of $71,136,121 which is available to discharge these liabilities (December 31, 2024 – total liabilities of $7,448,306 and cash of $22,317,548).
There have been no changes in management’s methods for managing liquidity risk since December 31, 2024.
Market risk
Market risk is the risk that changes in market prices, such as commodity prices, interest rates and foreign exchange rates will affect the Company’s net earnings or the value of financial instruments. The objective of the Company is to manage and mitigate market risk exposures within acceptable limits, while maximizing returns.
-
New Found Gold Corp.
Notes to the Condensed Interim Financial Statements
For the three and nine months ended September 30, 2025 and 2024
(Unaudited - Expressed in Canadian Dollars Unless Otherwise Noted)
15. FINANCIAL INSTRUMENTS (continued)
(b) Financial Instrument Risk Exposure (continued)
| (i) | Currency risk |
Financial instruments that impact the Company’s net earnings or other comprehensive income due to currency fluctuation include cash accounts and accounts payable denominated in US dollars. The sensitivity of the Company’s net loss to changes in the exchange rate between the US dollar and the Canadian dollar at September 30, 2025 would change the Company’s net loss by $48,800 (December 31, 2024 - $322,434) as a result of a 10% change in the exchange rate.
| (ii) | Interest rate risk |
Interest rate risk is the risk that the fair value of future cash flows of a financial instrument will fluctuate due to changes in market interest rates. As the Company deposits its cash and cash equivalents into demand accounts with minimal interest rates, interest rate risk is not significant.
| (iii) | Commodity price risk |
Commodity price risk is defined as the potential adverse impact on earnings and economic value due to commodity price movements and volatilities. The Company’s property has exposure to predominantly gold. Commodity prices, especially gold, greatly affect the value of the Company and the potential value of its property and investments.
| (iv) | Equity price risk |
Equity price risk is the risk that the fair value of or future cash flows from the Company’s financial instruments will significantly fluctuate because of changes in market prices. The Company is exposed to market risk in trading its investments in unfavorable market conditions which could result in dispositions of investments at less than favorable prices. Additionally, the Company adjusts its investments to fair value at the end of each reporting period. This process could result in write-downs of the Company’s investments over one or more reporting periods, particularly during periods of overall market instability.
The sensitivity of the Company’s net loss to changes in market prices at September 30, 2025 would change the Company’s net loss by $54,100 (December 31, 2024 - $92,602) as a result of a 10% change in the market price of its investments.
There have been no changes in management’s methods for managing market risks since December 31, 2024.
16. SUBSEQUENT EVENTS
Acquisition of Maritime Resources Corp.
On September 5, 2025, the Company and Maritime entered into a definitive agreement, pursuant to which the Company agreed to acquire all of the issued and outstanding common shares of Maritime that it does not already own (the “Transaction”) by way of a plan of arrangement (the “Arrangement”).
Under the terms of the Arrangement, each holder of the common shares of Maritime will receive 0.75 of a New Found Gold Corp. common share in exchange for each Maritime Share (the “Exchange Ratio”) at the effective time of the Transaction.
In addition to Maritime shareholder and court approval, the Transaction is also subject to the satisfaction of certain other closing conditions customary for a transaction of this nature, including receipt of customary stock exchange approvals. The Transaction is expected to be completed in the fourth quarter of 2025.
-
New Found Gold Corp.
Notes to the Condensed Interim Financial Statements
For the three and nine months ended September 30, 2025 and 2024
(Unaudited - Expressed in Canadian Dollars Unless Otherwise Noted)
| 16. | SUBSEQUENT EVENTS (continued) |
Acquisition of mineral claims from Exploits Discovery Corp.
On September 8, 2025, the Company announced that it had entered into a property purchase agreement with Exploits providing for the purchase by the Company of a 100% interest in certain mineral claims in Newfoundland and Labrador held by Exploits (the “Claims”). The Claims adjoin New Found’s Queensway Gold project and increase the size of the Project by 58,600 hectares.
As consideration for the Claims, New Found Gold will (i) issue 2,821,556 common shares of the Company to Exploits; (ii) grant to Exploits a 1% NSR Royalty; and (iii) within 10 business days following a final determination by the Supreme Court of Newfoundland and Labrador with respect to certain disputed mineral claims, issue 725,543 common shares to Exploits.
The transaction was approved by holders of common shares of Exploits at a shareholder meeting called by Exploits and remains subject to customary closing conditions. The transaction is expected to close in the fourth quarter of 2025.
-
Exhibit 99.2
 Management’s Discussion and Analysis For the three and nine months ended September 30, 2025 and 2024 |
TABLE OF CONTENTS
| DESCRIPTION OF BUSINESS | 3 |
| PROJECT SUMMARY | 4 |
| QUEENSWAY MRE | 7 |
| QUEENSWAY PEA | 8 |
| MINERAL RESOURCE | 10 |
| EXPLORATION ACTIVITIES | 11 |
| PRE-DEVELOPMENT STUDIES AND NEXT STEPS | 13 |
| ENVIRONMENT AND SOCIAL RESPONSIBILITIES | 14 |
| OVERALL PERFORMANCE AND RESULTS OF OPERATIONS | 14 |
| LIQUIDITY AND CAPITAL RESOURCES | 17 |
| OUTSTANDING SHARE DATA | 19 |
| RELATED PARTY TRANSACTIONS | 20 |
| RISKS AND UNCERTANTIES | 22 |
| CRITICAL ACCOUNTING POLICIES AND ESTIMATES | 22 |
| FINANCIAL RISK MANAGEMENT | 23 |
| DISCLOSURE CONTROLS AND PROCEDURES | 24 |
| CAUTIONARY NOTES REGARDING FORWARD-LOOKING STATEMENTS | 25 |
| CAUTIONARY NOTES FOR UNITED STATES INVESTORS | 27 |
| OFF-BALANCE SHEET ARRANGEMENTS | 27 |
| PROPOSED TRANSACTIONS | 27 |
| ADDITIONAL INFORMATION | 28 |
|
Management’s Discussion and Analysis For the three and nine months ended September 30, 2025 and 2024 |
The following discussion is management’s discussion and analysis (“MD&A”) of the results and financial condition of New Found Gold Corp. (the “Company” or “New Found”) and should be read in conjunction with the accompanying unaudited condensed interim financial statements for the three and nine months ended September 30, 2025 and September 30, 2024 and related notes. In addition, this MD&A should be read in conjunction with the audited annual financial statements and the related notes for the years ended December 31, 2024 and December 31, 2023. The financial data was prepared using accounting policies consistent with International Financial Reporting Standards (“IFRS”), as applicable to interim financial reports including International Accounting Standards 34 – “Interim Financial Reporting” issued by the International Accounting Standards Board (“IASB”), and all figures are reported in Canadian dollars unless otherwise indicated. Please refer to the cautionary note regarding forward-looking statements and information within this MD&A and the Risk Factors discussed in the Company’s most recent Annual Information Form on file on the Canadian Securities Administrators’ System for Electronic Data Analysis and Retrieval+ (“SEDAR+”) at www.sedarplus.ca and Form 40-F on file with the U.S. Securities and Exchange Commission (the “SEC”) at www.sec.gov. The effective date of this report is November 6, 2025.
Unless otherwise indicated, technical disclosure regarding the Company’s properties included or incorporated by reference herein, including use of the capitalized terms “Mineral Resources” and “Mineral Reserves”, has been prepared in accordance with the requirements of, and imports the meaning of such terms as defined in, National Instrument 43-101 – Standards of Disclosure for Mineral Projects (“NI 43-101”) and the Canadian Institute of Mining, Metallurgy and Petroleum (the “CIM”) – CIM Definition Standards on Mineral Resources and Mineral Reserves, adopted by the CIM Council, as amended (the “CIM Definition Standards”), as applicable, and should be read in conjunction with the cautionary statements provided in section “Cautionary Statements – Cautionary Note for United States Investors” at the end of this MD&A.
The technical content disclosed in this MD&A was reviewed and approved by Melissa Render, P. Geo., President, and a Qualified Person as defined under NI 43-101. Ms. Render consents to the publication of this MD&A by New Found. The scientific and technical information in this MD&A relating to the Queensway Project (as defined herein) is derived from, and in some instances is a direct extract from, and is based on the assumptions, qualifications and procedures set out in, the report entitled “NI 43-101 Technical Report, Queensway Gold Project, Newfoundland and Labrador, Canada” with an effective date June 30, 2025 prepared by Pierre Landry, P.Geo., Lance Engelbrecht, P. Eng. and David M. Robson, P.Eng., each of SLR Consulting (Canada) Ltd. (“SLR”) and Sheldon H. Smith, P.Geo. of Stantec (each, a “Qualified Person” or “QP”) in accordance with NI 43-101 (the “Queensway Technical Report”). Reference should be made to the full text of the Queensway Technical Report, which is available for review under the Company’s profile on SEDAR+ at www.sedarplus.ca.
|
Management’s Discussion and Analysis For the three and nine months ended September 30, 2025 and 2024 |
Description of Business
The Company was incorporated on January 6, 2016, under the Business Corporations Act (Ontario). On June 23, 2020, the Company continued as a British Columbia corporation under the Business Corporations Act (British Columbia) in the province of British Columbia. The Company’s head office and its registered office are located at Suite 3500, The Stack, 1133 Melville Street, Vancouver, British Columbia, V6E 4E5. On August 11, 2020, the Company completed an initial public offering and listed on the TSX Venture Exchange under the symbol “NFG”. On September 29, 2021, the Company also listed its shares on the NYSE American stock exchange under the symbol “NFGC”.
The Company is a mineral exploration company engaged in the acquisition, exploration and evaluation of resource properties with a focus on gold properties located in Newfoundland and Labrador, Canada. The Company’s principal objective is to explore and develop the Queensway Project, which is located near Gander, Newfoundland and Labrador, and to identify other properties worthy of investment and exploration. For the purpose of NI 43-101, the Queensway Project is the Company’s only material property.
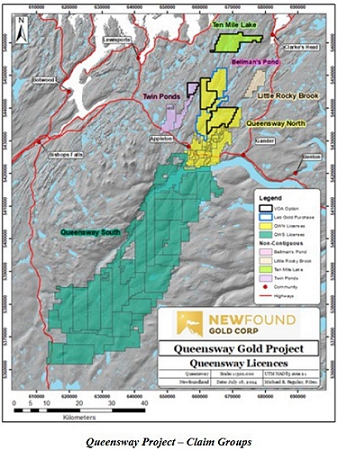
The Queensway Project is comprised of 98 mineral licences, including 7,018 claims comprising 175,450 ha of land located near Gander, Newfoundland and Labrador. The Queensway Project is accessible by main access roads including the Trans-Canada Highway that passes through the northern portion of the project and has high voltage electric transmission lines running through the project area. The Queensway Project is divided into two blocks, Queensway North (“QWN”) which is designated to the claim group north of Gander Lake and Queensway South (“QWS”) which is the property portion located south of Gander Lake.
As of the date of this MD&A, the Company’s Board of Directors (the “Board”) consisted of the following: Paul Huet (Chairman), Keith Boyle, Andrew Furey, Melissa Render, William Hayden, Chad Williams and Tamara Brown.
|
Management’s Discussion and Analysis For the three and nine months ended September 30, 2025 and 2024 |
Project Summary
Queensway Project, Newfoundland
Ownership and Acquisition
The Queensway Gold Project (“Queensway”, the “Project” or the “Queensway Project”) consists of licences that were acquired by New Found through; i) online map staking with the Government of Newfoundland and Labrador, ii) the successful completion of a series of option agreements (9 option agreements), iii) licences originally acquired by Palisades Resources Corp., which was renamed New Found Gold Corp. in June 2017 and iv) purchase agreements.
In addition, five licences are currently owned by separate licence holders and are subject to the Company satisfying conditions of an option agreement (the “VOA Option Agreement”) between Aidan O’Neil, Suraj Amarnani, Josh Vann and VOA Exploration Inc. and New Found.
On April 21, 2024, the Company entered into a property purchase agreement with Labrador Gold Corp. (“LabGold”) to acquire a 100% interest in LabGold’s Kingsway Project, located near Gander, Newfoundland and Labrador, as well as certain related assets of LabGold (the “Transaction”). The Transaction closed on July 9, 2024. Pursuant to the Transaction, the Company issued 5,263,157 common shares to LabGold with a value of $20,000,000. The Company paid $438,541 in professional and filing fees in connection with the Transaction. This acquisition resulted in expansion of the Project by 7,775 ha and a gain of approximately 13.5 km of strike along the Appleton Fault Zone. The Company also paid a $750,000 Expenditure Target Payment to the optionors upon completion of an aggregate of $30,000,000 of exploration expenditures incurred on the property during the year ended December 31, 2024. During the year ended December 31, 2024, the Company incurred certain exploration expenditures and having met the remaining expenditure target on the property paid $750,000 to the optionors.
In May 2024, New Found also completed a purchase agreement with Sky Gold Corp. expanding the Project by 4,800 ha. As consideration for this purchase, New Found paid $35,000.
On July 29, 2024, the Company entered into three royalty purchase agreements with arm’s length royalty holders (together, the “Vendors” and each, a “Vendor”) to purchase part of each Vendor’s royalty interest, (0.6% of the Vendors’ 1.6% net smelter returns royalty) underlying several zones at the Company’s Queensway Project. The transaction closed on August 8, 2024. Pursuant to the acquisition, the Company paid aggregate cash consideration of $1,950,000 and aggregate share consideration of 300,000 common shares with a combined value of $1,011,000 to the Vendors. The Company purchased the remaining 1.0% net smelter returns royalty from the Vendors for $1,000,000 in aggregate in cash, of which $666,667 was paid during the nine months ended September 30, 2025. The Company paid an aggregate of $79,845 in professional fees in connection with the royalty purchases.
Location and Geology
The Project is located adjacent to the Trans-Canada Highway approximately 15 km west of Gander, Newfoundland. Queensway is centered on a 110 kilometre (“km”) segment of the district-scale Appleton (“AFZ”) and Joe Batts Pond (“JBPFZ”) fault zones and encompasses an area of 1,754 square kilometre (“km2”). Epizonal-style gold-bearing veins are hosted in secondary faults that splay from the AFZ in various orientations. The Keats Baseline Fault is a highly prospective northeast striking splay branching from the AFZ with a strike length of 575 metres (“m”). In 2019, while exploring the Keats Baseline Fault, a broad array of visible gold bearing epizonal-style quartz veining was intercepted in what is now the Keats Zone. The interval graded 92.9 g/t Au over 19 m which initiated a 650,000 m drill campaign that is still on-going as of the date of this MD&A. Since 2019, New Found has discovered key high-grade zones such as Iceberg, Keats West, Golden Joint, Lotto, Jackpot, K2, Monte Carlo, Pistachio, Golden Dome and Dropkick in Queensway North and several in Queensway South including Astronaut and Nova. The Project is 100%-owned and benefits from excellent infrastructure, including highway access, power, and proximity to skilled labor and supply chains.
|
Management’s Discussion and Analysis For the three and nine months ended September 30, 2025 and 2024 |
Exploration Activities
New Found has drilled approximately 660,000 m to systematically explore the immediate hanging wall and footwall domains of the AFZ and JBPFZ. Drilling mainly focused on a seven km segment of the AFZ testing shallow targets with vertical depths of approximately 250 m in Queensway North. In 2023 and 2024, New Found conducted a 3D seismic survey to define the architecture of mineralized fault systems at depth and acquired the Kingsway Project to add an additional 12-km of the AFZ to explore. In 2024, New Found utilized the seismic survey to test deeper extensions of known mineral zones and began drilling shallow targets on the Kingsway Project. During this time, New Found made new gold discoveries on its Golden Dome and Dropkick zones which includes grades of 343 g/t Au over 2.15 m and 89.5 g/t Au over 5.85 m, respectively. With the Kingsway Project acquisition, Queensway currently boasts tens of kilometers of untested strike length along the AFZ and JBPFZ. The Company is well positioned to advance and replenish a healthy pipeline of targets as it continues to expand its footprint on a district-scale gold play. In 2025, New Found plans to continue conducting infill and definition drilling on resource-stage zones and explore untested shallow targets along the AFZ and JBPFZ.
Key Exploration Milestones
| · | 2016–2019: | Initial claim staking and grassroots exploration. | |
| · | 2020: | High-grade discovery at the Keats Zone, including drill intercepts of 92.96 g/t Au over 19.0 m. | |
| · | 2021–2023: |
Drill expansion with over 500,000 meters drilled across multiple targets leading to several near-surface high-grade discoveries including Lotto, Golden Joint, Keats West, Iceberg, K2, Jackpot and Honeypot. Completion of deep 3D seismic survey for deep targeting. |
|
| · | 2024: | Announcement the Company engaged SLR to conduct an initial mineral resource estimate (“MRE”) and preliminary economic assessment (“PEA”). Continued step-out drilling both near-surface and deep which doubled vertical extent of the gold mineral footprint to 830 m with a project total of 606,226 meters drilled by New Found. Gained an additional 13 km of strike along the AFZ with the acquisition of the Kingsway Project from Labrador Gold. | |
| · | 2025: | Completion of an initial MRE and PEA (see below and the Company’s news release dated March 24, 2025, and July 21, 2025). |
Q3 - Q4 2025 Exploration & Technical Highlights
| · | On July 9, 2025, the Company announced the results of the first phase of infill drilling targeting the high-grade corridor in the proposed Keats West open pit. The results confirmed the continuity of the high-grade with the highlight intervals of 55.0 g/t Au over 35.05 m, 20.7 g/t Au over 18.05 m and 15.4 g/t Au over 16.70 m and demonstrated the opportunity for further expansion beyond the current pit extents with the interval of 7.08 g/t Au over 15.55 m. | |
| · | On July 21, 2025, the Company announced the results of a PEA outlining a phased mine plan targeting initial gold production in 2027 with a 15-year LOM5, a LOM AISC2 of US$1,256 and 1.5 Moz1 of production. The PEA demonstrates a low-cost production profile with strong economics including a $743 million after-tax NPV 3, IRR4 of 56.3%, and less than 2-year after-tax payback at US$2,500 per ounce gold price. |
|
Management’s Discussion and Analysis For the three and nine months ended September 30, 2025 and 2024 |
| · | On September 2, 2025, the Company announced the results of Phase III Metallurgical test work confirming an overall recovery at Keats West of 89.2% and the filling of its Queensway Technical Report. | |
| · | On September 25, 2025, the Company announced the results from a channel sampling program at the Iceberg excavation. Highlights of this program include: 64.8 g/t Au over 6.71 m 23.9 g/t Au over 15.12 m, 113 g/t Au over 2.99 m, 47.4 g/t Au over 7.36 m, 23.0 g/t Au over 13.74 m, 117 g/t Au over 2.16 m confirming the high-grade at-surface continuity of the Iceberg zone. | |
| · | On October 15, 2025, the Company announced the results from step-out drilling at Dome targeting new high-grade mineralization discovered in Q4/24 at depth below the PEA pit shell, as well as infill drilling of the Lotto and Lotto North PEA pit shell. Highlight step-out results at Dome include 10.4 g/t Au over 20.50 m and 7.47 g/t Au over 13.40 m forming part of a newly identified high-grade domain starting 100 m below the current extent of the Dome PEA pit. Lotto and Lotto North highlights included 40.6 g/t Au over 2.80 m, 30.5 g/t Au over 2.05 m, 12.3 g/t Au over 2.25 m, 33.8 g/t Au over 2.05 m, 8.26 g/t Au over 4.40 m, and 13.5 g/t Au over 2.55 m. The results of this infill program conform well with the MRE block model and will be included in the next MRE update. |
Q3 – Q4 2025 Corporate Highlights
| · | On August 27, 2025, the Company announced the closing of a $20,000,000 private placement by 2176423 Ontario Ltd., a company controlled by Eric Sprott, and as a result Mr. Sprott now beneficially owns or controls 56,224,015 common shares representing approximately 23.1% on a non-diluted basis, and is a new “Control Person” (as defined by the policies of the TSX Venture Exchange) of the Company. | |
| · | On September 5, 2025, the Company announced it had entered into a definitive agreement to combine with Maritime Resources Corp. (“Maritime”) to become an emerging Canadian gold producer. The transaction is expected to create a multi-asset near-term gold producer in a tier 1 jurisdiction with significant regional synergies across its portfolio. | |
| · | On September 8, 2025, the Company announced a potential expansion of the Queensway Project by entering into a purchase agreement to acquire all of Exploits Discovery Corp.’s (“Exploits”) Newfoundland mineral licenses. The acquisition will increase New Found Gold’s land holdings by 33% and gain access to an additional 20 km of strike along the Appleton Fault Zone. | |
| · | On September 15, 2025, the Company announced that former Newfoundland and Labrador Premier, Dr. Andrew Furey joined the Board and strengthened its management team by appointing Hashim Ahmed as new Chief Financial Officer (“CFO”) and Robert Assabgui as new Chief Operating Officer (“COO”). Vijay Mehta stepped down from his role as Director and Michael Kanevsky as CFO. |
Notes:
1Moz = million ounces
2AISC = All-in sustaining costs are the sum of treatment and refining charges, royalties, onsite operating costs, sustaining capital costs, and closure costs, divided by the quantity of ounces sold as further described below under “Non-GAAP Financial Measures” section
3 NPV5% = net present value at a 5 percent discount rate
4 IRR = internal rate of return
5 LOM = life of mine As of March 18, 2025, the Queensway Mineral Resources are estimated as follows:
|
Management’s Discussion and Analysis For the three and nine months ended September 30, 2025 and 2024 |
Queensway MRE
Table 1: Summary of Mineral Resources – Effective Date March 18, 2025
| Zone | Category1 | Tonnage (Mt) |
Grade (g/t Au) |
Contained
Metal (Moz Au) |
|||||||||||
| Open Pit | Indicated | 17.3 | 2.25 | 1.25 | |||||||||||
| Inferred | 9.0 | 1.24 | 0.36 | ||||||||||||
| Underground | Indicated | 0.8 | 5.76 | 0.14 | |||||||||||
| Inferred | 1.7 | 4.44 | 0.25 | ||||||||||||
| Total | Indicated | 18.0 | 2.40 | 1.39 | |||||||||||
| Inferred | 10.7 | 1.77 | 0.61 | ||||||||||||
Notes:
| 1. | CIM (2014) definitions were followed for Mineral Resources. | |
| 2. | Mineral Resources are estimated using a long-term gold price of US$2,200 per ounce, and a US$/C$ exchange rate of US$1.00 = C$1.43. | |
| 3. | Open pit Mineral Resources are estimated at a cut-off grade of 0.3 g/t Au and constrained by a preliminary optimized pit shell with a pit slope angle of 45°, and bench height of 5 m. | |
| 4. | Reasonable prospects for eventual economic extraction for underground Mineral Resources was demonstrated by constraining within reporting panels generated at a cut-off grade of 1.65 g/t Au, with heights (H) of 10 m, lengths (L) of 5 m and minimum widths of 1.8 m. | |
| 5. | The optimized pit shell, underground reporting shapes, and cut-off grades were generated by assuming metallurgical recovery of 90%, standard treatment and refining charges, mining costs of C$5.0/t moved for open pit and C$120/t processed for underground, processing costs of C$20/t processed, and general & administrative costs of C$7.5/t processed. | |
| 6. | Pierre Landry, P.Geo. of SLR, an independent Qualified Person who prepared the initial MRE is not aware of any environmental, permitting, legal, title, taxation, socio-economic, marketing, political, or other relevant factors that could materially affect the Mineral Resource estimate | |
| 7. | Bulk density within the vein and halo mineralization domains is 2.7 t/m³. | |
| 8. | Mineral Resources that are not Mineral Reserves do not have demonstrated economic viability. | |
| 9. | Numbers may not add due to rounding. |
On September 2, 2025, the Queensway Technical Report was filed on SEDAR+.
| · | The MRE is grouped into three primary areas. The AFZ Core area contains the majority of zones, including K2 and Monte Carlo; Keats West, Cokes, and Powerline; Keats, Keats South, Iceberg, Iceberg Alley, Knob, and Golden Bullet; as well as Lotto, Golden Joint, Jackpot, and Honeypot. These zone names reflect the most prominent veins contributing to the contained metal within each zone, though each zone includes numerous additional veins beyond those listed. The AFZ Peripheral area includes the Big Vein, Pristine, HM, and Midway zones. The JBP area includes the H Pond, 1744, and Pocket Pond zones. All Mineral Resources are located within the QWN block; no Mineral Resources have been estimated for QWS. | |
| · | The resource database was closed on November 1, 2024 and contains 3,214 holes drilled by New Found and previous operators, for a total of 723,387 m of which 550,949 m have assay intervals. Within the AFZ Core area, mineralization was modelled as 308 veins and nine additional halo zones. Within the Queensway North peripheral areas, mineralization domains consist of 17 veins in the JBP area and 33 veins in the AFZ Peripheral area. All areas also include a 2 m buffer around the veins capturing adjacent low-grade mineralization. Au grades were estimated using Inverse Distance cubed (ID3) and a four-pass search strategy. |
|
Management’s Discussion and Analysis For the three and nine months ended September 30, 2025 and 2024 |
| · | Protocols for drilling, sample preparation and analysis, verification, and security meet industry standard practices and are appropriate for the purposes of a Mineral Resource estimate. | |
| · | Mineral Resource classification was based primarily on drill hole spacing, applied to designate contiguous zones of like classification. |
Queensway PEA
As announced in the July 21, 2025 press release, Queensway Project is planned as a primary conventional open pit (“OP”) mine complemented by a high-grade underground (“UG”), mechanized cut and fill mine, with early off-site toll milling transitioning to on-site treatment of the mined material. Material will be processed through a conventional circuit consisting of comminution, gravity concentration, flotation of a sulphide concentrate for off-site treatment, and cyanide leach and adsorption via carbon-in-leach of the flotation tailings, carbon elution and gold recovery circuits. The two products to be produced are doré on site, plus a gold-bearing, sulphide concentrate sold for treatment at an off-site facility.
The PEA envisions a 15-year LOM producing 1.5 million ounces (“Moz”) recoverable gold and is planned to be developed in three distinct phases. Phasing of the project allows for lower upfront capital requirements, early revenue generation, funding of subsequent phases, processing highest grade first, and best-in-class in-pit tailings deposition.
Phase 1 (Years 1-4): OP Mine with Off-Site Toll Milling
Phase 1 involves preparing the Queensway site and installing the infrastructure for a small OP mine. High-grade material will be crushed and transported to an off-site toll mill located in Newfoundland, at a rate of 700 tonnes per day (“tpd”) for the first five years of the operation. Lower grade material will be stockpiled on-site for future processing once the on-site processing plant is in operation. Phase 1 has an initial capital cost of $155 million, average annual gold production of 69.3 koz Au and AISC of US$1,282/oz measured over project Year 1 to Year 4.
Phase 2 (Years 5-15): OP Mine with Construction and Operation of On-Site Processing Plant and In-Pit Tailings Deposition
Phase 2 involves the construction of the on-site 7,000 tpd processing plant. Construction of the plant is scheduled to start in Year 3, with completion in Year 4. Processing of the material will commence in Year 5 of the operation, for a planned total of nine years, followed by two years of processing low grade stockpiles. The stockpiles created during Phase 1 and the UG high-grade material in Phase 3 will allow for grade sequencing, thereby prioritizing higher grade mined material during the initial years of processing to optimize the project economics. The mining rate and sequence for the OP will allow for in-pit tailings deposition for the life of the operation. Phase 2 has average annual gold production of 129.0 koz and AISC of US$1,206/oz (measured from Year 5 to Year 13), including average annual production of 172.2 koz and AISC of US$1,090/oz during the first five years of operation (project Year 5 to Year 9).
Phase 3 (Years 6-10): UG Mine Development and Operation
Construction of the UG mine is scheduled to commence in Year 5 of the project. The UG mine is planned as a high-grade cut-and-fill operation from Year 6 to Year 10 at a nominal production rate of 700 tpd. The UG mine will consist of a series of five separate ramp systems to access the stopes and mine the mineralized material in a traditional mechanized cut-and-fill method with 3 m x 3 m heading size. The mineralized material will be hauled to surface using 20 tonne trucks.
|
Management’s Discussion and Analysis For the three and nine months ended September 30, 2025 and 2024 |
Optimized Project Economics Through a Phased Mine Plan
The phased mine plan is possible because of the high-grade core of the deposit and is intended to minimize both initial capital and shareholder dilution with the first phase funding future expansions. This is accomplished through grade sequencing, that is, the stockpiles created during Phase 1 and UG high-grade ores in Phase 3 will allow prioritizing higher grade mined material during the initial years of on-site processing to optimize project economics. The lowest grades will be processed starting in Year 13 through to the end of processing in Year 15 after the mining has been completed. Processing the higher grades first will generate higher cash flow in the earlier years.
The PEA is preliminary in nature, it includes inferred mineral resources that are considered too speculative geologically to have economic considerations applied to them that would enable them to be categorized as mineral reserves, and there is no certainty that the PEA will be realized.
Table 1: Queensway PEA Summary
| Production1 | Value | Units | ||||
| LOM | 15 | years | ||||
| Total Mill Feed | 27,373 | ktonnes | ||||
| Phase 1: Off-Site Toll Mill | 1,150 | ktonnes | ||||
| Phase 2 and 3: On-Site Mill | 26,223 | ktonnes | ||||
| Average Head Grade | 1.85 | g/t Au | ||||
| Phase 1: Off-Site Toll Mill (Years 1-5) | 9.64 | g/t Au | ||||
| Phase 2: On-Site Mill (Years 5-9) | 2.22 | g/t Au | ||||
| Cut-off Grade (OP) | 0.3 | g/t Au | ||||
| Cut-off Grade (UG) | 2.68 | g/t Au | ||||
| Average Gold Recovery | 91.9 | % | ||||
| Contained Gold | 1,626 | koz | ||||
| Recovered Gold | 1,494 | koz | ||||
| Average Annual Gold Production (Years 1-4) | 69.3 | Koz/yr | ||||
| Average Annual Gold Production (Years 5-9) | 172.2 | Koz/yr | ||||
| Average Production Mining Rate – Phase 1 | 700 | tpd | ||||
| Average Production Mining Rate – Phases 2 & 3 | 7,000 | tpd | ||||
| Strip Ratio | 6.0 | - | ||||
| Capital Costs1 | ||||||
| Initial Capital (Phase 1) | 154.8 | $M | ||||
| Growth Capital (Phase 2 and 3) | 584.9 | $M | ||||
| Sustaining Capital | 325.4 | $M | ||||
| Reclamation and Closure Capital | 30.0 | $M | ||||
| Total Capital Costs | 1,095.1 | $M | ||||
| Total Operating Costs1,2 | 1,977 | $M | ||||
| Royalty NSR | 0.40 | % | ||||
| Total Cash Cost | 1,085 | US$/oz Au | ||||
| AISC (LOM)3 | 1,256 | US$/oz Au | ||||
| AISC (Years 1-4)3 | 1,282 | US$/oz Au | ||||
| AISC (Years 5-9)3 | 1,090 | US$/oz Au | ||||
| Financial Summary | ||||||
| Gold Price (Base Case) | 2,500 | US$/oz Au | ||||
| Exchange Rate | 1.43 | C$/US$ | ||||
| After-Tax NPV5% | 743 | $M | ||||
| After-Tax IRR | 56.3 | % | ||||
| After-Tax Payback | <1 | years | ||||
| Mine Net Revenue | 4,924 | $M | ||||
| EBITDA4 | 2,947 | $M | ||||
| EBITDA Margin | 59.8 | % | ||||
|
Management’s Discussion and Analysis For the three and nine months ended September 30, 2025 and 2024 |
Notes:
1 Denotes a “specified financial measure” within the meaning of National Instrument 52-112 – non-GAAP and Other Financial Measures Disclosure. See note on Non-GAAP Financial Measures.
2 Total operating costs refer to onsite charges that cover open pit mining, underground mining, third party processing and material handling, onsite processing, and onsite general & administrative costs.
3 AISC is calculated as the sum of treatment and refining charges, royalties, onsite operating costs, sustaining capital costs, and closure costs, divided by the quantity of ounces sold as further described below under Non-GAAP Financial Measures.
4 See note on Non-GAAP Financial Measures.
Queensway PEA and Technical Report
The Queensway PEA was prepared using the Company’s initial mineral resource estimate with an effective date as at March 18, 2025 (the "MRE"). The PEA, with an effective date as at June 30, 2025 was prepared by SLR in accordance with the 2019 Canadian Institute of Mining, Metallurgy and Petroleum (“CIM”) Definition Standards and NI 43-101. SLR is independent of New Found.
Mineral Resource Estimate
Measured and Indicated Mineral Resources ("M&I") total 18.0 million tonnes ("Mt") at an average gold grade of 2.40 grams per tonne ("g/t Au") for 1.39 million contained ounces of gold. Inferred Mineral Resources total 10.7 Mt at an average grade of 1.77 g/t Au for 0.61 million ounces of gold. The Mineral Resource estimate has an effective date of March 18, 2025.
The OP Indicated Mineral Resources total 17.3 Mt grading 2.25 g/t Au containing 1.25 million ounces Au, and Inferred Mineral Resources total 9.0 Mt grading 1.24 g/t Au containing 0.36 million ounces Au.
The UG Indicated Mineral Resources total 0.8 Mt grading 5.76 g/t Au containing 0.14 million ounces Au, and Inferred Mineral Resources total 1.7 Mt grading 4.44 g/t Au containing 0.25 million ounces Au.
The resource database was closed on November 1, 2024 and contains 3,214 drill holes for a total of 723,387 m, for which 550,949 m have assay intervals. The Company is currently conducting a 70,000 m 2025 drill program and anticipates completing as required to advance future economic studies. An updated MRE is planned to be completed in the first quarter of 2026.
The Qualified Person (“QP”) is not aware of any environmental, permitting, legal, title, taxation, socio-economic, marketing, political, or other relevant factors that could materially affect the Mineral Resource estimate.
No Mineral Reserves are defined for the property.
The overall conversion of Mineral Resources to the PEA mine plan was 92% and 74% for the indicated and inferred categories, respectively. Only the AFZ Core was considered for the PEA. A lower conversion of the UG Inferred category is mainly attributed to changes in the cutoff grade between the MRE and PEA. The MRE considered underground mining with the longhole open stoping method, while the PEA assumed the comparatively higher cost cut and fill method.
|
Management’s Discussion and Analysis For the three and nine months ended September 30, 2025 and 2024 |
Economic Analysis
At a base case consensus long-term gold price of US$2,500 and an exchange rate of 1.43 (C$/US$) the Project generates an after-tax NPV5% of $743 million and an IRR of 56.3%. Growth capital of $442 million for Phase 2 is spent in Year 2 to Year 4 and is paid back in Year 5, less than one year after Phase 2 is in operation. The after-tax NPV5% increases to $1.45 billion and the IRR increases to 197% when the gold price is raised to US$3,300 /oz Au.
After-Tax Cash Flow
Using the base case gold price of US$2,500, the average annual after-tax cash flow is $75.2 million and the cumulative LOM after-tax cash flow is estimated at $1,128 million. The Phase 1 average annual after-tax operating cash flow is $117 million, demonstrating the ability to pay back the initial capital of $155 million in Year 2. The Company plans to reinvest the after-tax cash flow generated in Phase 1 to fund the Project growth capital needed in Phases 2 and 3, to be paid back in Year 5.
Exploration Activities
Since 2019, a total of 660,649 m of drilling in 2,870 holes have been completed by the Company. This drilling has expanded the known mineralization at Keats and led to the discovery, and subsequent expansion, of Lotto, Golden Joint, Keats North, Keats West, Iceberg, K2, and numerous other zones.
The majority of the exploration drilling completed to date has been focused on a 5 km long segment of the AFZ (AFZ Core area) and is largely limited to the top 250 m vertical depth. At QWN alone, New Found controls over 30 km of strike along the AFZ. The Project offers the potential to i) expand known discoveries at depth within the AFZ Core area, ii) identify new near-surface discoveries along strike of the main discovery area, and iii) advance existing targets and identify new targets at QWS and along the JBPFZ.
Since the release of the Queensway Project’s initial MRE with an effective date of November 1, 2024, exploration drilling has continued mainly as infill conversion and resource expansion step-out drilling. In Q4 2024, post MRE, drilling focused on follow-up testing at the recent discovery, Golden Dome, in addition to expansion drilling at both Dome, Dropkick, Keats-AFZ Deep, and Keats South Deep (see New Found news releases dated February 11, 2025, and February 24, 2025). The early success of these programs have demonstrated the potential for i) epizonal style gold mineralization to extend to significant depths as seen in the deep drilling at Keats South and Keats-AFZ Deep with significant gold intervals at depths that are now up to 1,150m, and at Golden Dome with high grade mineralization occurring just below the existing Mineral Resource estimate footprint, ii) the extension of known gold zones currently tested shallowly, like at Dome, and iii) the potential to both expand known near surface discoveries like at Dropkick and search for new ones like at Pistachio along the 12 km of strike length acquired at AFZ Peripheral.
In Q1 2025, with the information gained from the completion of the MRE, work focused on planning exploration activities for the remainder of 2025, including within and near-MRE expansion drilling, and regional exploration including prospecting, soil sampling, geophysics, trenching, and field mapping. Priority targets include those within and adjacent to MRE areas (AFZ Core and AFZ Peripheral) and along the southern extensions of the AFZ at Queensway South.
In Q2, 2025, drilling commenced on May 1, 2025, with four drills, increasing to five drills on June 1, 2025, with a plan to complete 70,000 m of diamond drilling in 2025. The drilling program has allocated 80% of meters towards resource definition and 20% towards exploration.
|
Management’s Discussion and Analysis For the three and nine months ended September 30, 2025 and 2024 |
These early drilling programs have focused on MRE in-pit conversion drilling from inferred to indicated categories at Keats West, Lotto, Lotto North, Keats, K2 and Iceberg, while exploration drilling has been testing early-stage exploration targets at AFZ Peripheral and expanding on the discovery areas at Dropkick, Iceberg and Dome.
Channel sampling commenced in early June 2025 at Iceberg excavation as part of a larger ongoing program to excavate, map and channel sample near-surface zones of the AFZ Core, with the objective of validating the geological model and collecting detailed analytical information across key zones that will be part of the Phase 1 mine plan as outlined in the PEA.
Regional programs have been ongoing since mid-May 2025, working to advance and generate new early-stage gold targets in priority areas generally focussed on the northern and southern extensions of the Appleton and JBP fault zones through prospecting, mapping and soil sampling. A drone-borne magnetic survey commenced mid-July covering the southern continuation of the Greenwood area at Queensway South and is now complete.
In Q3 2025, drilling programs continued with MRE in-pit conversion drilling at AFZ Core, and step-out drilling at Dome and Dropkick and other early stage targets at AFZ Peripheral. In early August, the drill count increased to six with the start of a 5 m by 5 m definition drilling program covering a 65 m by 30 m area at Keats. Additional ongoing drilling at Queensway that also commenced in Q3 2025 includes geotechnical drilling of PEA Phase 1 pits, grade control drilling at Iceberg, condemnation drilling for infrastructure and plant siting and hydrogeological drilling. These programs are all expected to conclude in Q4 2025 and brings the total drill count to eight.
The excavation, mapping and channel sampling of the Lotto zone also concluded in Q3 2025 and the results of this program are pending.
As at the date of this report, 54,431m in 422 holes have been drilled in 2025, which represents 78% of the proposed 2025 program.
Notable exploration progress in Q3 - Q4 2025
On July 9, 2025, the Company announced the results of the first phase of infill drilling designed to convert inferred resource blocks to indicated targeting the high-grade corridor within the proposed Keats West open pit. The results confirmed the continuity of the high-grade corridor with the highlight intervals of 55.0 g/t Au over 35.05 m, 20.7 g/t Au over 18.05 m and 15.4 g/t Au over 16.70 m and demonstrated the opportunity for further expansion beyond the current pit extents with the interval of 7.08 g/t Au over 15.55 m. Multiple regions within the Keats West open pit tested by the infill program intercepted significant mineralization outside of the current MRE block model. Overall, the results correlate well to the MRE block model, with local fluctuations where grades were either higher or lower than anticipated.
On September 25, 2025, the Company announced the results of from a channel sampling program at the Iceberg excavation. Highlights of this program include: 64.8 g/t Au over 6.71 m (IB-25-01-10), 23.9 g/t Au over 15.12 m (IB-25-01-16), 113 g/t Au over 2.99 m (IB-25-01-18), 47.4 g/t Au over 7.36 m (IB-25-01-40), 23.0 g/t Au over 13.74 m (IB-25-01-08), 117 g/t Au over 2.16 m (IB-25-01-07) confirming the high-grade at-surface continuity of the Iceberg zone. These intervals form part of a 185 m long continuous section of the Iceberg vein which is exposed in a 220 m x 105 m area that was excavated in late 2024. Channel sample and mapping results correlate well with the established geological and resource model, while showing local variability characteristic of a coarse free gold quartz vein system.
On October 15, 2025, the Company announced the results from step-out drilling at Dome targeting new high-grade mineralization discovered in Q4/24 at depth below the PEA pit shell, as well as infill drilling of the Lotto and Lotto North PEA pit shell. Highlight step-out results at Dome include 10.4 g/t Au over 20.50 m (NFGC-25-2299) and 7.47 g/t Au over 13.40 m (NFGC-25-2265) forming part of a newly identified high-grade domain starting 100 m below the current extent of the Dome PEA pit that extends for 130 m down dip. With only limited drilling along strike and at depth, the depth extension of Dome has clear expansion potential and will be assessed for inclusion in the next MRE update. Drilling converting inferred resource blocks to indicated at Lotto and Lotto North PEA pits returned the highlight intervals of 40.6 g/t Au over 2.80 m (NFGC-25-2268), 30.5 g/t Au over 2.05 m (NFGC-25-2263), 12.3 g/t Au over 2.25 m (NFGC-25-2305), 33.8 g/t Au over 2.05 m (NFGC-25-2292), 8.26 g/t Au over 4.40 m (NFGC-25-2331), and 13.5 g/t Au over 2.55 m (NFGC-25-2298). The program results conform well with the MRE block model and will be included in the next MRE update.
|
Management’s Discussion and Analysis For the three and nine months ended September 30, 2025 and 2024 |
Pre-Development Studies and Next Steps
On November 6, 2024, the Company announced it had engaged SLR to deliver an initial MRE and PEA. The MRE was announced on March 24, 2025 and the PEA was announced on July 21, 2025.
As Queensway moves towards development, the following activities are planned to be completed in the next few years:
| · | Geological work consisting of: |
| o | Infill and step-out drilling to upgrade and add to the initial MRE. | |
| o | Definition drilling of the high-grade areas where initial mining is to take place at a tight spacing to permit appropriate statistical analysis of a high-grade gold deposit. | |
| o | Excavation, mapping and channel sampling of Keats West and K2 zones. | |
| o | Exploration of regional targets looking for the next major deposit. |
| · | Engineering studies and data collection programs to support the project development schedule include: |
| o | Ongoing metallurgical testing programs, with additional work to further refine the flowsheet for the next phase of studies. | |
| o | Geo-metallurgical modelling of the refractory gold distribution to be incorporated into future block models. | |
| o | Condemnation drilling for siting of plant infrastructure, geotechnical and hydrogeological data collection programs. | |
| o | Trade-off and optimization studies with more detailed engineering to support a rapid, small mine development. |
| · | Environmental studies and data collection programs to support the project development schedule include: |
| o | Complete the baseline studies based on the mine design and layout. | |
| o | Preparation of project description and submission of an Environmental Assessment (“EA”). | |
| o | Continued engagement with communities and government. |
| · | The potential timeline for the project with key milestones includes: |
| o | Submission of an EA in 2026. | |
| o | An updated MRE and technical report to support Phase 1 in 2026 with detailed engineering starting thereafter. | |
| o | Subject to project financing, long lead time equipment would be procured and early works program initiated in 2026. | |
| o | Phase 1 construction is planned to commence in 2027 with first production in Q3 2027. |
The Company is continuing its ongoing work programs that will allow the Company to advance the Queensway Project towards production. The Company is planning to complete the following activities during fiscal 2025 and fiscal 2026:
| · | Infill and definition drilling aimed at converting the Company’s inferred resources to measured and indicated resources; | |
| · | Regional exploration which includes prospecting, soil sampling, geophysics, trenching and field mapping of priority targets; | |
| · | At-surface excavation and channel sampling of high-grade zones | |
| · | Follow-up drilling of recent discovery zones; |
Management’s Discussion and Analysis
For the three and nine months ended September 30, 2025 and 2024
| · | Initiate engineering studies; | |
| · | Ongoing metallurgical testing programs; | |
| · | Geotechnical, hydrogeological and condemnation drilling; | |
| · | Phase 1 trade-off studies and detailed engineering; | |
| · | Environmental studies, permitting and continued engagement with communities and government; |
These activities are planned in order to advance the Queensway project towards completion of a feasibility study in fiscal 2027.
Environment and Social Responsibility
New Found has undertaken a range of environmental baseline studies across key biophysical and socio-economic components of the Queensway Project area. These include terrestrial and aquatic ecology, air, and water quality, noise and light surveys, acid rock drainage and metal leaching characterization, and hydrogeological assessments. The scope and scale of these programs are consistent with industry best practices for projects transitioning from early-stage exploration to advanced technical evaluations such as a PEA.
Environmental sensitivities within the area studied have been identified and are generally manageable with standard permitting conditions and mitigation strategies. Key considerations include a portion of the mineral licences falling within protected water supply areas and Crown Lands. No critical habitat for species at risk has been identified within the area studied.
Regulatory frameworks at both the federal and provincial levels have been reviewed, and future development will require provincial EA registration and permitting. A federal EA is expected to be required for Phase 2 and 3 of the Project as the Production plant on site will exceed the 5,000 t/day threshold. To date, the Company has demonstrated proactive engagement with regulators and local communities and is committed to continued collaboration as the Project advances.
Overall Performance and Results of Operations
The most significant assets at September 30, 2025 were cash and cash equivalents of $71,136,121 (December 31, 2024: $22,317,548), exploration and evaluation assets of $34,574,784 (December 31, 2024: $34,505,484) and property and equipment of $7,848,920 (December 31, 2024: $7,938,149). Total assets increased to $119,945,573 at September 30, 2025, from $74,019,011 at December 31, 2024, primarily as a result of an increase in cash and cash equivalents of $48,818,573.
Cash and cash equivalents increased as a result of the Company completing a bought deal offering of 24,610,000 flow-through (“FT”) common shares at a price of $2.29 per share and 4,370,000 non-FT shares at a price of $1.63 per share for aggregate gross proceeds of $63,480,000, partially offset by share issuance costs of $3,912,782, completing a non-brokered private placement and issuing 12,269,939 common shares for gross proceeds of $20,000,001, $2,778,000 received from the sale of its Maritime secured notes, and $1,797,025 received from stock option exercises.
This cash generated from financing activities was partially offset by $34,713,701 cash used in operating activities as the Company completed its mineral resource estimate, preliminary economic assessment and continued exploration activities at its Queensway project.
Management’s Discussion and Analysis
For the three and nine months ended September 30, 2025 and 2024
The Company is in the exploration stage and has no history of revenue generation. As such, continued access to capital markets will impact the Company’s statement of financial position at each reporting period and its ability to realize the value of its assets. Access to capital markets is impacted by regulatory compliance, commodity prices and other risks further described below under Risks and Uncertainties.
Summary of Quarterly Financial Results
| Amounts in ($’000) | 2025 | 2024 | 2023 | |||||||||||||||||||||||||||||
| except per share | Sep. 30 | Jun. 30 | Mar. 31 | Dec. 31 | Sep. 30 | Jun. 30 | Mar. 31 | Dec. 31 | ||||||||||||||||||||||||
| Revenues | - | - | - | - | - | - | - | - | ||||||||||||||||||||||||
| Loss and Comprehensive Loss for the Period | (12,945 | )(2) | (10,563 | )(3) | (8,938 | )(4) | (13,408 | )(5) | (11,584 | )(6) | (12,095 | )(7) | (13,182 | )(8) | (20,544 | ) | ||||||||||||||||
| Loss per Common Share Basic(1) | (0.06 | ) | (0.05 | ) | (0.04 | ) | (0.07 | ) | (0.06 | ) | (0.06 | ) | (0.07 | ) | (0.11 | ) | ||||||||||||||||
| Loss per Common Share Diluted(1) | (0.06 | ) | (0.05 | ) | (0.04 | ) | (0.07 | ) | (0.06 | ) | (0.06 | ) | (0.07 | ) | (0.11 | ) | ||||||||||||||||
| (1) | Per share amounts are rounded to the nearest cent, therefore aggregating quarterly amounts may not reconcile to year-to-date per share amounts. | |
| (2) | Increase in loss and comprehensive loss from prior quarter primarily driven by an increase in exploration and evaluation activities of $4,783,134, higher investor relations costs of $649,354 due to the increase in corporate development transactions, increase in payroll expenses of $710,885, and an increase in unrealized losses on investments of $966,953. This was partially offset by an increase in settlement of FT premium liability of $2,740,324, higher interest income of $402,388, and a lower in share-based expense of $750,761. | |
| (3) | Increase in loss and comprehensive loss from prior quarter primarily driven by an increase in exploration and evaluation expenditures of $2,910,085, and an increase in share-based compensation of $1,664,040, partially offset by a decrease in salaries and consulting of $1,551,805 and an increase in settlement of FT premium liability of $754,768. | |
| (4) | Decrease in loss and comprehensive loss from prior quarter primarily driven by a decrease in exploration and evaluation expenditures of $9,682,844, offset by an increase in salaries and consulting fees of $1,594,620, an increase in professional fees of $358,469 and a decrease in settlement of FT share premium liability of $3,330,585. | |
| (5) | Increase in loss and comprehensive loss from prior quarter primarily driven by an increase in exploration and evaluation expenditures of $2,552,101, partially offset by a decrease in interest income of $234,976, an increase in foreign exchange gain of $257,672 and an increase in settlement of FT share premium liability of $141,322. | |
| (6) | Decrease in loss and comprehensive loss from prior quarter primarily driven by a decrease in settlement of legal claim of $1,750,100, a decrease in unrealized losses on investments of $702,051 and an increase in settlement of FT share premium liability of $689,701, partially offset by an increase in exploration and evaluation expenditures of $2,733,381. | |
| (7) | Decrease in loss and comprehensive loss from prior quarter primarily driven by a decrease in exploration and evaluation expenditures of $4,033,525 and a decrease in share-based compensation of $475,407, partially offset by an increase in salaries and consulting of $379,015, a decrease in settlement of FT share premium liability of $907,350, settlement of legal claim of $1,750,100 and an increase in unrealized losses on investments of $435,708. | |
| (8) | Decrease in loss and comprehensive loss from prior quarter primarily driven by a decrease in exploration and evaluation expenditures of $6,323,876 and a decrease in impairment of equity investment of $1,000,237, partially offset by an increase in share-based compensation of $344,292. |
Management’s Discussion and Analysis
For the three and nine months ended September 30, 2025 and 2024
Three months ended September 30, 2025 and 2024
The Company recorded loss and comprehensive loss of $12,944,794 or $0.06 basic and diluted loss per share for the three months ended September 30, 2025 (three months ended September 30, 2024: $11,583,666 or $0.06 basic and diluted loss per share).
Expenditures
During the three months ended September 30, 2025, loss from operating activities increased by $2,545,237 to $17,271,230 compared to $14,725,993 for the three months ended September 30, 2024, mainly due to:
| - | An increase of $562,476 in exploration and evaluation expenditures. The Company has completed its preliminary economic assessment in July 2025 and completed approximately 26,812 meters of drilling in 205 holes at its Queensway Project during the three months ended September 30, 2025 compared to completing approximately 14,814 meters of drilling in 32 holes at its Queensway Project during the three months ended September 30, 2024. | |
| - | An increase of $646,239 in corporate development and investor relations. The increase is primarily due to $617,472 incurred in connection with a planned acquisition of Maritime. | |
| - | An increase of $696,521 in salaries and consulting due to a $174,960 of termination benefit paid to the former CFO and $408,240 paid to a former financial advisor during the three months ended September 30, 2025. | |
| - | An increase of $577,301 in share-based compensation. The increase is due to 809,167 stock options granted, of which Nil vested, the continued vesting of previously granted stock options, and 2,353,000 restricted share units (“RSUs”) granted, of which Nil vested, with a total value of $766,158 during the three months ended September 30, 2025. |
Other Income
For the three months ended September 30, 2025, other income was $4,326,436 compared to $3,142,327 for the three months ended September 30, 2024. The $1,184,109 increase in other income is mainly due to a reversal of an impairment loss on an equity investment of $1,000,237. The Company had previously recognized an impairment loss on its equity investment in Kirkland Lake Discoveries Corp. during the year ended December 31, 2023. This impairment loss was reversed at September 30, 2025 due to a significant increase in stock price of Kirkland Lake Discoveries Corp. during the three months ended September 30, 2025.
Nine months ended September 30, 2025 and 2024
The Company recorded loss and comprehensive loss of $32,445,437 or $0.15 basic and diluted loss per share for the nine months ended September 30, 2025 (September 30, 2024: $36,860,760 or $0.19 basic and diluted loss per share).
Expenditures
During the nine months ended September 30, 2025, loss from operating activities decreased by $4,938,911 to $38,536,990 compared to $43,475,901 for the nine months ended September 30, 2024. The decrease in loss from operating activities is largely due to lower exploration expenditures by $9,355,688. Exploration and evaluation expenditures were $27,794,432 for the nine months ended September 30, 2025 compared to $37,150,120 for the nine months ended September 30, 2024. The Company published its initial mineral resource estimate, completed its preliminary economic assessment and completed approximately 47,337 meters of drilling in 348 holes during the nine months ended September 30, 2025 compared to completing approximately 61,861 meters of drilling in 296 holes at its Queensway project during the nine months ended September 30, 2024.
Management’s Discussion and Analysis
For the three and nine months ended September 30, 2025 and 2024
The decrease in loss from operating activities was partially offset by:
| - | An increase of $1,959,439 in salaries and consulting due to a bonus of $1,031,760 paid to the former Executive Chairman and Chief Executive Officer (“CEO”), $424,080 termination benefit paid to the former COO, $174,960 of termination benefit paid to the former CFO and $408,240 paid to a former financial advisor during the nine months ended September 30, 2025 compared to no termination benefits incurred in the same period in 2024. | |
| - | An increase of $1,309,844 in share-based compensation due to 4,579,167 stock options granted of which 1,666,667 vested, the continued vesting of previously granted stock options, and 2,353,000 RSUs granted, of which Nil vested, with a total value of $2,125,090 during the nine months ended September 30, 2025 compared to 240,000 stock options granted and the continued vesting of previously granted stock options with a value of $815,246 for the same period in 2024. | |
| - | An increase of $757,006 in corporate development and investor relations. The increase is primarily due to $617,472 incurred in connection with the announced acquisition of Maritime. |
Other Income
For the nine months ended September 30, 2025, other income was $6,091,552 compared to $6,615,141 for the nine months ended September 30, 2024. The $523,589 change is largely due to:
| - | A decrease of $4,845,778 in settlement of FT share premium liability, being $4,249,959 for the nine months ended September 30, 2025 as a result of less qualifying Canadian exploration expenses incurred compared to $9,095,737 for the same period in 2024. The Company incurred $14,746,070 of qualifying Canadian exploration expenses and derecognized $4,249,959 of its FT share premium liability during the nine months ended September 30, 2025. | |
| - | A decrease of $1,480,692 in interest income. The decrease is due to lower interest income due to the sale of secured notes, as well as the decrease in interest rates on cash and cash equivalents. |
The decrease in other income was partially offset by:
| - | A reversal of impairment loss on an equity investment of $1,000,237. This impairment loss was reversed at September 30, 2025 based on the results of the impairment assessment and due to a significant increase in stock price of Kirkland Lake Discoveries Corp. during the nine months ended September 30, 2025. | |
| - | A decrease of $1,750,100 in settlement of a legal claim, whereby the Company issued 370,000 common shares with a value of $1,750,100 during the nine months ended September 30, 2024 pursuant to a settlement agreement resolving the lawsuit filed against the Company by ThreeD Capital Inc. and 1313366 Ontario Inc. | |
| - | A decrease of $1,218,170 in unrealized losses on investments. The decrease is due to changes in the fair values and quantities of investments held at September 30, 2025 and 2024. | |
| - | A decrease of $752,036 in Part XII.6 tax. Part XII.6 tax was $67,143 for the nine months ended September 30, 2025 compared to $819,179 for the nine months ended September 30, 2024. The Company incurred $67,143 in Part XII.6 tax in respect of unspent FT proceeds during the nine months ended September 30, 2025 compared to incurring $819,179 in Part XII.6 tax in respect of unspent FT proceeds renounced in year 1 under the Look-Back Rules, in accordance with the Income Tax Act of Canada during the nine months ended September 30, 2025. |
Liquidity and Capital Resources
As at September 30, 2025, the Company had cash and cash equivalents of $71,136,121 to settle current liabilities of $18,614,380. As at September 30, 2025, the Company must spend another $41,610,830 of Qualifying Canadian Exploration Expenses by December 31, 2026 to satisfy its remaining current FT share premium liability of $11,992,641.
The Company does not currently have a recurring source of revenue and has historically incurred negative cash flows from Operating Activities. As at September 30, 2025, the Company has a working capital surplus, calculated as current assets less current liabilities, of $56,335,255, consisting primarily of cash and cash equivalents, and had negative cash flow from operating activities of $34,713,701 for the nine months ended September 30, 2025.
Management’s Discussion and Analysis
For the three and nine months ended September 30, 2025 and 2024
The Company’s exploration and evaluation assets presently have no proven or probable reserves. The recoverability of amounts shown for exploration and evaluation assets are dependent upon the existence of economically recoverable reserves, the ability of the Company to obtain necessary financing to complete the development of those reserves and upon future profitable production. Although the Company presently has sufficient financial resources to cover its existing obligations and operating costs, the Company expects to require further funding to fund its planned programs for the next year. Management is actively targeting sources of additional financing including through the issuance of shares, which would assure continuation of the Company’s operations and exploration programs. In order for the Company to meet its liabilities as they come due and to continue its operations, the Company is solely dependent upon its ability to generate such financing. Although the Company has been successful in the past in generating financing, there is no assurance it will be able to do so in the future. These items cast significant doubt as to the Company’s ability to continue as a going concern.
The sources of funds currently available to the Company for its acquisition and exploration projects are solely from equity financing. The Company does not have bank debt or banking credit facilities in place as at the date of this report.
As at September 30, 2025, the Company had the following contractual obligations:
| Contractual Obligations | Total $ |
1
Year $ |
1-3
Years $ |
4-5
Years $ |
After
5 Years $ |
|||||||||||||||
| Accounts payable and accrued liabilities | 6,511,740 | 6,511,740 | - | - | - | |||||||||||||||
| Lease obligations | 237,746 | 11,949 | 29,980 | 21,064 | 174,753 | |||||||||||||||
| Total contractual obligations | 6,749,486 | 6,523,689 | 29,980 | 21,064 | 174,753 | |||||||||||||||
Property Option Agreement
On November 2, 2022, the Company entered into the VOA Option Agreement to acquire a 100% interest in five mineral licenses located near Gander, Newfoundland. Under the terms of the VOA Option Agreement, the Company may exercise the option by issuing an aggregate of 487,078 common shares in the capital the Company and making aggregate cash payments of $2,350,000 to the optionors as follows:
| · | $200,000 (paid) and 39,762 common shares (issued) on the later of (i) staking confirmation date as defined in the VOA Option Agreement and (ii) the receipt of the TSX-Venture Exchange’s approval; | |
| · | $200,000 (paid) and 39,762 common shares (issued) on or before November 2, 2023; | |
| · | $250,000 (paid) and 69,583 common shares (issued) on or before November 2, 2024; | |
| · | $300,000
(paid) and 89,463 common shares (issued) on or before November 2, 2025; $600,000 and 129,224 common shares on or before November 2, 2026; and |
| · | $800,000 and 119,284 common shares on or before November 2, 2027. |
Kingsway Project
The Kingsway Project carries a 1.0% NSR payable to the royalty holders upon commencement of commercial production.
The Company will also pay to the royalty holders $1 per ounce of gold contained within the property in the indicated mineral resource and measured mineral resource categories (the “Resource Payment”) as defined by the Canadian Institute of Mining, Metallurgy and Petroleum, and established in a NI 43-101 or like technical report for the development of the property. The Resource Payment is payable upon the commencement of commercial production.
Management’s Discussion and Analysis
For the three and nine months ended September 30, 2025 and 2024
An advance royalty payment of $50,000 per year will be payable commencing on March 3, 2026 and continuing each year until the commencement of commercial production. Any advance royalties paid will be deducted from the royalty payable after commencement of commercial production.
June 12, 2025 – Net Proceeds of $59,671,138
On June 12, 2025, the Company completed a bought deal offering of 24,610,000 FT common shares, closing the first tranche of the offering on June 3, 2025 and the second and final tranche of the offering on June 12, 2025, at a price of $2.29 per common share and 4,370,000 non-FT common shares at a price of $1.63 per common share, for aggregate gross proceeds of $63,480,000. The Company incurred share issuance costs of $3,912,782 in cash of which $2,602,373 was paid to the underwriters. The premium received on the FT shares issued was determined to be $16,242,600.
| Uses of Funds: | Intended
Use of Proceeds |
Actual
Use of Proceeds |
Over/(Under)- |
|||||||||
| Queensway Project work program | 56,356,900 | 14,746,070 | (41,610,830 | ) | ||||||||
| General and administrative expenses | 3,314,238 | - | (3,314,238 | ) | ||||||||
| Total Uses | 59,671,138 | 14,746,070 | (44,925,068 | ) | ||||||||
August 27, 2025 – Net Proceeds of $20,000,001
On August 27, 2025, the Company completed a non-brokered private placement and issued 12,269,939 common shares at a price of $1.63 per common share for gross proceeds of $20,000,001.
| Uses of Funds: | Intended
Use of |
Actual
Use of |
Over/(Under)- |
|||||||||
| Queensway Project work program | 18,000,001 | - | (18,000,001 | ) | ||||||||
| General and administrative expenses | 2,000,000 | - | (2,000,000 | ) | ||||||||
| Total Uses | 20,000,001 | - | (20,000,001 | ) | ||||||||
Outstanding Share Data
| · | On August 27, 2025, the Company completed a non-brokered private placement and issued 12,269,939 common shares at a price of $1.63 per common share for gross proceeds of $20,000,001. | |
| · | During the nine months ended September 30, 2025, 1,345,000 stock options were exercised at a weighted average exercise price of $1.38 per share for gross proceeds of $1,797,025. | |
| · | Subsequent to September 30, 2025, the Company issued 89,463 common shares pursuant to the acquisitions of exploration and evaluation assets in accordance with the terms of certain property option agreements. |
Management’s Discussion and Analysis
For the three and nine months ended September 30, 2025 and 2024
| · | As at September 30, 2025, there were 243,037,262 common shares issued and outstanding. As of the date of this report, there were 245,126,725 common shares issued and outstanding. | |
| · | As at September 30, 2025 and as of the date of this report, there were 7,547,167 share purchase options, 2,353,000 RSUs and no warrants outstanding. |
Related Party Transactions
All transactions with related parties have occurred in the normal course of operations and are measured at the amount of consideration paid or received. A summary of the Company’s related party transactions with corporations having similar directors and officers is as follows:
| Three
months ended September 30, |
Nine
months ended |
|||||||||||||||
2025 |
2024 |
2025 |
2024 |
|||||||||||||
| Amounts paid to PJH Consulting, LLC (i) included in salaries and consulting | 20,615 | - | 63,134 | - | ||||||||||||
| Amounts
paid to EarthLabs Inc. (ii) for exploration and evaluation |
- | 4,500 | - | 13,500 | ||||||||||||
| Amounts paid to Notz Capital Corp. (iii) for corporate development and investor relations | - | 44,397 | 46,921 | 132,361 | ||||||||||||
| (i) | Amounts incurred for administrative services provided by a close family member of Paul Huet, Chair of the Board. PJH Consulting, LLC is a related entity of Paul Huet, Chair of the Board. | |
| (ii) | Amounts incurred for administrative services provided by EarthLabs Inc., a related entity of Denis Laviolette, former Director and President. | |
| (iii) | Amounts incurred for corporate development and investor relations services provided by a close family member of Collin Kettell, former Executive Chairman and Chief Executive Officer. |
There are no ongoing contractual commitments resulting from these transactions with related parties.
Key management personnel compensation
Key management personnel include those persons having authority and responsibility for planning, directing and controlling the activities of the Company as a whole. The Company has determined that key management personnel consist of executive and non-executive members of the Company’s Board and corporate officers.
| Three months ended September 30, 2025 | Salaries
and Consulting $ |
Share-based
compensation $ |
Bonus $ |
Total $ |
||||||||||||
| Keith Boyle, Chief Executive Officer | 112,500 | 205,079 | - | 317,579 | ||||||||||||
| Melissa Render, President | 90,000 | (1) | 94,789 | - | 184,789 | |||||||||||
| Hashim Ahmed, Chief Financial Officer | 15,256 | 5,736 | - | 20,992 | ||||||||||||
| Robert Assabgui, Chief Operating Officer | 13,542 | 2,704 | - | 16,246 | ||||||||||||
| Michael Kanevsky, Former Chief Financial Officer | 204,120 | (2) | - | - | 204,120 | |||||||||||
| Paul Huet, Director | 41,229 | 334,132 | - | 375,361 | ||||||||||||
| William Hayden, Director | 18,000 | 8,614 | - | 26,614 | ||||||||||||
| Chad Williams, Director | 18,000 | 8,614 | - | 26,614 | ||||||||||||
| Vijay Mehta, Director | 15,000 | - | - | 15,000 | ||||||||||||
| Tamara Brown, Director | 8,400 | 8,614 | - | 17,014 | ||||||||||||
| Dr. Andrew Furey, Director | 6,000 | 8,614 | - | 14,614 | ||||||||||||
| Total | 542,047 | 676,896 | - | 1,218,943 | ||||||||||||
| (1) | Salary recorded in exploration and evaluation expenditures in the statement of loss and comprehensive loss. | |
| (2) | Includes termination benefit of $174,960 in accordance with the terms of their management agreement. |
Management’s Discussion and Analysis
For the three and nine months ended September 30, 2025 and 2024
| Three months ended September 30, 2024 | Salaries
and Consulting $ |
Share-based compensation $ |
Bonus $ |
Total
$ |
||||||||||||
| Collin Kettell, Former Executive Chairman and Chief Executive Officer | 97,200 | - | - | 97,200 | ||||||||||||
| Denis Laviolette, Former President | 68,040 | - | - | 68,040 | ||||||||||||
| Michael Kanevsky, Former Chief Financial Officer | 29,160 | - | - | 29,160 | ||||||||||||
| Greg Matheson, Former Chief Operating Officer | 70,680 | - | - | 70,680 | ||||||||||||
| Ron Hampton, Former Chief Development Officer | 84,240 | (1) | 21,269 | - | 105,509 | |||||||||||
| Doug Hurst, Former Director | 18,000 | - | - | 18,000 | ||||||||||||
| Raymond Threlkeld, Former Director | 18,000 | - | - | 18,000 | ||||||||||||
| Vijay Mehta, Director | 18,000 | - | - | 18,000 | ||||||||||||
| Total | 403,320 | 21,269 | 424,589 | |||||||||||||
| (1) | Salary and bonus recorded in exploration and evaluation expenditures in the statement of loss and comprehensive loss. |
| Nine months ended September 30, 2025 | Salaries
and Consulting $ |
Share-based
compensation $ |
Bonus $ |
Total
$ |
||||||||||||
| Keith Boyle, Chief Executive Officer | 313,306 | 309,080 | - | 622,386 | ||||||||||||
| Collin Kettell, Former Executive
Chairman and Chief Executive Officer |
38,400 | - | 1,031,760 | 1,070,160 | ||||||||||||
| Melissa Render, President | 270,000 | (1) | 307,724 | - | 577,724 | |||||||||||
| Hashim Ahmed, Chief Financial Officer | 15,256 | 5,736 | - | 20,992 | ||||||||||||
| Robert Assabgui, Chief Operating Officer | 13,542 | 2,704 | - | 16,246 | ||||||||||||
| Michael Kanevsky, Former Chief Financial Officer | 262,440 | (2) | - | - | 262,440 | |||||||||||
| Greg Matheson, Former Chief Operating Officer | 471,200 | (3) | - | - | 471,200 | |||||||||||
| Ron Hampton, Former Chief Development Officer | 562,529 | (1)(4) | - | - | 562,529 | |||||||||||
| Paul Huet, Director | 126,268 | 1,481,849 | - | 1,608,117 | ||||||||||||
| William Hayden, Director | 54,000 | 8,614 | - | 62,614 | ||||||||||||
| Chad Williams, Director | 42,000 | 8,614 | - | 50,614 | ||||||||||||
| Vijay Mehta, Director | 51,000 | - | - | 51,000 | ||||||||||||
| Tamara Brown, Director | 8,400 | 8,614 | - | 17,014 | ||||||||||||
| Dr. Andrew Furey, Director | 6,000 | 8,614 | - | 14,614 | ||||||||||||
| Total | 2,234,341 | 2,141,549 | 1,031,760 | 5,407,650 | ||||||||||||
| (1) | Salary recorded in exploration and evaluation expenditures in the statement of loss and comprehensive loss. | |
| (2) | Includes termination benefit of $174,960 in accordance with the terms of their management agreement. | |
| (3) | Includes termination benefit of $424,080 in accordance with the terms of their management agreement. | |
| (4) | Includes termination benefit of $505,440 in accordance with the terms of their management agreement. |
Management’s Discussion and Analysis
For the three and nine months ended September 30, 2025 and 2024
| Nine months ended September 30, 2024 | Salaries
and Consulting $ |
Share-based
compensation $ |
Bonus $ |
Total $ |
||||||||||||
| Collin Kettell,
Former Executive Chairman and Chief Executive Officer |
291,600 | - | 129,600 | 421,200 | ||||||||||||
| Denis Laviolette, Former President | 204,120 | - | 90,720 | 294,840 | ||||||||||||
| Michael Kanevsky, Former Chief Financial Officer | 87,480 | - | 38,880 | 126,360 | ||||||||||||
| Greg Matheson, Former Chief Operating Officer | 199,540 | - | 84,240 | 283,780 | ||||||||||||
| Ron Hampton, Former Chief Development Officer | 252,720 | (1) | 80,566 | 112,320 | (1) | 445,606 | ||||||||||
| Doug Hurst, Former Director | 54,000 | - | - | 54,000 | ||||||||||||
| Raymond Threlkeld, Former Director | 54,000 | - | - | 54,000 | ||||||||||||
| Vijay Mehta, Director | 54,000 | - | - | 54,000 | ||||||||||||
| Total | 1,197,460 | 80,566 | 455,760 | 1,733,786 | ||||||||||||
| (1) | Salary and bonus recorded in exploration and evaluation expenditures in the statement of loss and comprehensive loss. |
As at September 30, 2025, there was $31,494 owed to Keith Boyle, the Company’s CEO, for travel expenditures, $15,000 owed to Melissa Render, the Company’s President, for compensation, $15,256 owed to Hashim Ahmed, the Company’s CFO, for compensation, $3,000 owed to Chad Williams for directors fees, and $3,000 owed to Tamara Brown for directors fees included in accounts payable and accrued liabilities (December 31, 2024 - $56,040 comprised of $15,000 for compensation and $1,533 for travel expenditures owed to Melissa Render, the Company’s President, $22,426 for travel expenditures owed to Greg Matheson, former COO, $2,163 for travel expenditures owed to Collin Kettell, former Executive Chairman and CEO, $152 to Michael Kanevsky, former CFO for office expenditures, $14,040 for compensation and $725 for travel expenditures owed to Ron Hampton, the Company’s former Chief Development Officer). The amounts are unsecured, non-interest bearing and without fixed terms of repayment.
Under the terms of their management agreements, certain officers of the Company are entitled to 18 months of base pay in the event of their agreements being terminated without cause.
Risks and Uncertainties
For a comprehensive discussion of the risks and uncertainties that may have an adverse effect on the Company’s business, operations or financial results, refer to the Company’s latest Annual Information Form for the year ended December 31, 2024. This document is available on the Company’s profile on SEDAR+ at www.sedarplus.ca.
Critical Accounting Policies and Estimates
The Company prepares its financial statements using accounting policies consistent with IFRS as issued by the IASB.
The preparation of the financial statements requires management to make certain estimates, judgments and assumptions that affect the reported amounts of assets and liabilities at the date of the financial statements and reported amounts of expenses during the reporting period. Actual outcomes could differ from these estimates.
In preparing the condensed interim financial statements for the three and nine months ended September 30, 2025 and 2024, the Company applied the critical judgments and estimates disclosed in Note 2 of its audited financial statements for the year ended December 31, 2024.
Management’s Discussion and Analysis
For the three and nine months ended September 30, 2025 and 2024
Financial Risk Management
The Company is exposed in varying degrees to a variety of financial instrument related risks. The Board approves and monitors the risk management processes.
Credit risk
Credit risk is the risk that one party to a financial instrument will fail to discharge an obligation and cause the other party to incur a financial loss. Sales taxes recoverable are due from the Canada Revenue Agency and the Company places its cash with financial institutions with high credit ratings, therefore in management’s judgment, credit risk related to sales taxes recoverable and cash is low. There have been no changes in management’s methods for managing credit risk since December 31, 2024.
Liquidity risk
Liquidity risk is the risk that the Company will not be able to meet its financial obligations as they fall due. The Company has in place a planning and budgeting process to help determine the funds required to ensure the Company has the appropriate liquidity to meet its operating and growth objectives. The Company has historically relied on the issuance of shares to fund exploration programs and may require doing so again in the future. As at September 30, 2025, the Company has total liabilities of $18,614,380 and cash and cash equivalents of $71,136,121 which is available to discharge these liabilities (December 31, 2024 – total liabilities of $7,448,306 and cash of $22,317,548). There have been no changes in management’s methods for managing liquidity risk since December 31, 2024.
Market risk
Market risk is the risk that changes in market prices, such as commodity prices, interest rates and foreign exchange rates will affect the Company’s net earnings or the value of financial instruments. The objective of the Company is to manage and mitigate market risk exposures within acceptable limits, while maximizing returns.
(i) Currency risk
Financial instruments that impact the Company’s net earnings or other comprehensive income due to currency fluctuation include cash accounts and accounts payable denominated in US dollars. The sensitivity of the Company’s net loss to changes in the exchange rate between the US dollar and the Canadian dollar at September 30, 2025 would change the Company’s net loss by $48,800 (December 31, 2024 - $322,434) as a result of a 10% change in the exchange rate.
(ii) Interest rate risk
Interest rate risk is the risk that the fair value of future cash flows of a financial instrument will fluctuate due to changes in market interest rates. As the Company deposits its cash and cash equivalents into demand accounts with minimal interest rates, interest rate risk is not significant.
(iii) Commodity price risk
Commodity price risk is defined as the potential adverse impact on earnings and economic value due to commodity price movements and volatilities. The Company’s property has exposure to predominantly gold. Commodity prices, especially gold, greatly affect the value of the Company and the potential value of its property and investments.
Management’s Discussion and Analysis
For the three and nine months ended September 30, 2025 and 2024
(iv) Equity price risk
Equity price risk is the risk that the fair value of or future cash flows from the Company’s financial instruments will significantly fluctuate because of changes in market prices. The Company is exposed to market risk in trading its investments in unfavorable market conditions which could result in dispositions of investments at less than favorable prices. Additionally, the Company adjusts its investments to fair value at the end of each reporting period. This process could result in write-downs of the Company’s investments over one or more reporting periods, particularly during periods of overall market instability.
The sensitivity of the Company’s net loss to changes in market prices at September 30, 2025 would change the Company’s net loss by $54,100 (December 31, 2024 - $92,602) as a result of a 10% change in the market price of its investments. There have been no changes in management’s methods for managing market risks since December 31, 2024.
Disclosure Controls and Procedures
The Company’s management, with the participation of its CEO and CFO, has evaluated the effectiveness of the Company’s disclosure controls and procedures. Based upon the results of that evaluation, the Company’s CEO and CFO have concluded that, as of September 30, 2025, the Company’s disclosure controls and procedures were effective to provide reasonable assurance that the information required to be disclosed by the Company in reports it files is recorded, processed, summarized and reported, within the appropriate time periods and is accumulated and communicated to management, including the CEO and CFO, as appropriate to allow timely decisions regarding required disclosure.
Internal Control over Financial Reporting
The Company’s management has determined that there have been no significant changes in the Company’s internal control over financial reporting during the quarter ended September 30, 2025, that have materially affected, or are reasonably likely to materially affect, the Company’s internal control over financial reporting.
Any system of internal control over financial reporting, no matter how well designed, has inherent limitations. As a result, even those systems determined to be effective can only provide reasonable assurance regarding the preparation of financial statements.
Non-GAAP Financial Measures
The Company has included certain non-GAAP financial measures in this MD&A. These financial measures are not defined under IFRS and should not be considered in isolation. The Company believes that these financial measures, together with financial measures determined in accordance with IFRS, provide investors with an improved ability to evaluate the underlying performance of the Company. The inclusion of these financial measures is meant to provide additional information and should not be used as a substitute for performance measures prepared in accordance with IFRS. These financial measures are not necessarily standard and therefore may not be comparable to other issuers.
All-in Sustaining Cost
All in sustaining cost is a non-GAAP financial measure calculated based on guidance published by the World Gold Council (“WGC”). The WGC is a market development organization for the gold industry and is an association whose membership comprises leading gold mining companies. Although the WGC is not a mining industry regulatory organization, it worked closely with its member companies to develop these metrics. Adoption of the all-in sustaining cost metric is voluntary and not necessarily standard, and therefore, this measure presented by the Company may not be comparable to similar measures presented by other issuers. The Company believes that the all-in sustaining cost measure complements existing measures and ratios reported by the Company.
Management’s Discussion and Analysis
For the three and nine months ended September 30, 2025 and 2024
All-in sustaining cost includes both operating and capital costs required to sustain gold production on an ongoing basis. Sustaining operating costs represent expenditures expected to be incurred at the Project that are considered necessary to maintain production. Sustaining capital represents expected capital expenditures comprising mine development costs, including capitalized waste, and ongoing replacement of mine equipment and other capital facilities, and does not include expected capital expenditures for major growth projects or enhancement capital for significant infrastructure improvements.
EBITDA
EBITDA stands for Earnings Before Interest, tax, Depreciation, and Amortization. It is a non-GAAP financial metric used to measure a company’s overall operating performance and profitability by stripping away certain expenses and non-cash charges. By adding back interest, taxes, depreciation, and amortization to a company’s net income (loss), EBITDA provides a way to analyze its earnings before the impact of financing, accounting, and asset-related decisions.
Cautionary Notes Regarding Forward-Looking Statements
This MD&A contains forward looking statements which reflect management’s expectations regarding the Company’s future growth, results from operations (including, without limitation, statements about the Company’s opportunities, strategies, competition, expected activities and expenditures as the Company pursues its business plan, the adequacy of the Company’s available cash resources and other statements about future events or results), performance (both operational and financial) and business prospects, future business plans and opportunities. Wherever possible, words such as “expects”, “plans”, “anticipates”, “believes”, “interpreted”, “intends”, “estimates”, “projects”, “aims”, “suggests”, “appears”, “indicate”, “often”, “target”, “future”, “likely”, “pending”, “potential”, “goal”, “objective”, “prospective”, “possibly”, “preliminary”, “initial”, and similar expressions or statements that certain actions, events or results “may”, “could”, “would”, “might” or “will” be taken, occur or be achieved, or the negative or grammatical variation thereof or other variations thereof, or comparable terminology have been used to identify forward-looking statements.
These forward-looking statements include, among other things, statements relating to the Queensway Project; mineralization on the Queensway Project; the interpretation of the results and benefits of the drilling program; future drilling and the related timing and expected benefits thereof; the transactions with each of Maritime and Exploits, the merits of each and related timing; an updated MRE and related timing; the PEA; the completion of a feasibility study and related timing and costs; assay results; the interpretation of assay results; the extent of mineralization and the discovery of zones of high-grade gold mineralization; plans for future exploration and drilling and the focus and timing of same; the merits of the Queensway Project; production at the Queensway Project and related timing; submission of Environmental Assessment and related timing; the Company’s areas of focus; estimates related to the PEA; future press releases by the Company; the Company’s future business plans; expectations regarding the ability to raise further capital; the market price of gold; expectations regarding any environmental issues that may affect planned or future exploration and development programs and the potential impact of complying with existing and proposed environmental laws and regulations; the ability to retain and/or maintain any required permits, licenses or other necessary approvals for the exploration or development of its mineral properties; government regulation of mineral exploration and development operations in the Province of Newfoundland and Labrador; the Company’s compensation policy and practices; the Company’s expected reliance on key management personnel, advisors and consultants and the potential impact of any tariffs, countervailing duties or other trade restrictions.
Management’s Discussion and Analysis
For the three and nine months ended September 30, 2025 and 2024
Forward-looking statements are not a guarantee of future performance and are based upon a number of estimates and assumptions of management in light of management’s experience and perception of trends, current conditions and expected developments, as well as other factors that management believes to be relevant and reasonable in the circumstances.
As of the date of this MD&A, these include, without limitation, assumptions about: the ability to raise any necessary additional capital on reasonable terms to advance exploration and development of the Company’s mineral properties; future prices of gold and other metal prices; the timing and results of exploration and drilling programs; the demand for, and price of gold; that general business and economic conditions will not change in a material adverse manner; the Company’s ability to procure equipment and operating supplies in sufficient quantities and on a timely basis; the geology of the Queensway Project as described in the Queensway Technical Report; the accuracy of budgeted exploration and development costs and expenditures; future currency exchange rates and interest rates; operating conditions being favourable such that the Company is able to operate in a safe, efficient and effective manner; the Company’s ability to attract and retain skilled personnel; political and regulatory stability; the receipt of governmental, regulatory and third-party approvals, licenses and permits on favourable terms; obtaining required renewals for existing approvals, licenses and permits on favourable terms; requirements under applicable laws; sustained labour stability; stability in financial and capital goods markets and availability of equipment.
Furthermore, such forward-looking information involves a variety of known and unknown risks, uncertainties and other factors which may cause the actual plans, intentions, activities, results, performance or achievements of the Company to be materially different from any future plans, intentions, activities, results, performance or achievements expressed or implied by such forward-looking statements. Such risks include, without limitation: the Company may fail to find a commercially viable deposit at any of its mineral properties; there are no mineral reserves on any of the properties in which the Company has an interest; the Company’s plans may be adversely affected by the Company’s reliance on historical data compiled by previous parties involved with its mineral properties; mineral exploration and development are inherently risky; the mineral exploration industry is intensely competitive; additional financing may not be available to the Company when required or, if available, the terms of such financing may not be favourable to the Company; fluctuations in the demand for gold; the Company may not be able to identify, negotiate or finance any future acquisitions successfully, or to integrate such acquisitions with its current business; the Company’s exploration activities are dependent upon the grant of appropriate licenses, concessions, leases, permits and regulatory consents, which may be withdrawn or not granted; the Company’s operations could be adversely affected by possible future government legislation, policies and controls or by changes in applicable laws and regulations; there is no guarantee that title to the properties in which the Company has a material interest will not be challenged or impugned; the Company faces various risks associated with mining exploration that are not insurable or may be the subject of insurance which is not commercially feasible for the Company; the volatility of global capital markets over the past several years has generally made the raising of capital more difficult; compliance with environmental regulations can be costly; social and environmental activism can negatively impact exploration, development and mining activities; the success of the Company is largely dependent on the performance of its directors and officers; the Company’s operations may be adversely affected by First Nations land claims; the Company and/or its directors and officers may be subject to a variety of legal proceedings, the results of which may have a material adverse effect on the Company’s business; the Company may be adversely affected if potential conflicts of interests involving its directors and officers are not resolved in favour of the Company; the Company’s future profitability may depend upon the world market prices of gold; dilution from future equity financing could negatively impact holders of the Company’s securities; failure to adequately meet infrastructure requirements could have a material adverse effect on the Company’s business; the Company’s projects now or in the future may be adversely affected by risks outside the control of the Company; acquisitions may not be completed as anticipated; the Company is subject to various risks associated with climate change; other factors discussed in the Company’s Annual Information Form filed under the Company’s Annual Information Form filed under the Company’s profile at www.sedarplus.ca.
Management’s Discussion and Analysis
For the three and nine months ended September 30, 2025 and 2024
Although the Company has attempted to identify important factors that could cause actual actions, events, conditions, results, performance or achievements to differ materially from those described in forward-looking statements, there may be other factors that cause actions, events, conditions, results, performance or achievements to differ from those anticipated, estimated or intended.
The Company cautions that the foregoing lists of important assumptions and factors are not exhaustive. Other events or circumstances could cause actual results to differ materially from those estimated or projected and expressed in, or implied by, the forward-looking statements contained herein. There can be no assurance that forward-looking statements will prove to be accurate, as actual results and future events could differ materially from those anticipated in such information. Accordingly, readers should not place undue reliance on forward-looking statements.
Forward-looking statements contained herein are made as of the date of this MD&A and the Company disclaims any obligation to update or revise any forward-looking statements, whether as a result of new information, future events or results or otherwise, except as and to the extent required by applicable securities laws.
Cautionary Note for United States Investors
Disclosure regarding the Company’s mineral properties, including with respect to mineral resource estimates included in this MD&A, was prepared in accordance with NI 43-101. NI 43-101 is a rule developed by the Canadian Securities Administrators that establishes standards for all public disclosure an issuer makes of scientific and technical information concerning mineral projects. NI 43-101 differs significantly from the disclosure requirements of the SEC generally applicable to U.S. companies. Accordingly, information contained in this MD&A is not comparable to similar information made public by U.S. companies reporting pursuant to SEC disclosure requirements.
Off-Balance Sheet Arrangements
The Company does not utilize off-balance sheet arrangements.
Proposed Transactions
Acquisition of Maritime Resources Corp.
On September 5, 2025, the Company and Maritime announced that they had entered into a definitive agreement, pursuant to which the Company agreed to acquire all of the issued and outstanding common shares of Maritime that it does not already own by way of a plan of arrangement (the “Arrangement”).
Under the terms of the arrangement agreement, each holder of the common shares of Maritime will receive 0.75 of a New Found common share in exchange for each Maritime common share at the effective time of the Arrangement.
In addition to Maritime shareholder and court approval, the Arrangement is also subject to the satisfaction of certain other closing conditions customary for a transaction of this nature, including receipt of customary stock exchange approvals. The Arrangement is expected to be completed in the fourth quarter of 2025.
Management’s Discussion and Analysis
For the three and nine months ended September 30, 2025 and 2024
Acquisition of mineral claims from Exploits Discovery Corp.
On September 8, 2025, the Company announced that it had entered into a property purchase agreement with Exploits providing for the purchase by the Company of a 100% interest in certain mineral claims in Newfoundland and Labrador held by Exploits (the “Claims”). The Claims adjoin New Found’s Queensway Gold project and increase the size of the Project by 58,600 hectares.
As consideration for the Claims, New Found Gold will (i) issue 2,821,556 common shares of the Company to Exploits; (ii) grant to Exploits a 1% NSR Royalty; and (iii) within 10 business days following a final determination by the Supreme Court of Newfoundland and Labrador with respect to certain disputed mineral claims, issue 725,543 common shares to Exploits.
The transaction was approved by holders of common shares of Exploits at a shareholder meeting called by Exploits and remains subject to customary closing conditions. The transaction is expected to close in the fourth quarter of 2025.
Additional Information
Additional information relating to the Company, including the Company’s Annual Information Form, is available under the Company’s profile on SEDAR+ at www.sedarplus.ca.