June 30
UNITED STATES
SECURITIES AND EXCHANGE COMMISSION
Washington, D.C. 20549
FORM 8-K
CURRENT REPORT
Pursuant to Section 13 or 15(d) of The Securities Exchange Act of 1934
Date of Report (Date of earliest event reported): November 5, 2025 (November 5, 2025)
ARCBEST CORPORATION
(Exact name of registrant as specified in its charter)
Delaware |
0-19969 |
71-0673405 |
(State or other jurisdiction of incorporation) |
(Commission File Number) |
(IRS Employer Identification No.) |
|
8401 McClure Drive Fort Smith, Arkansas (Address of principal executive offices) |
|
72916 (Zip Code) |
| ||
Registrant’s telephone number, including area code: (479) 785-6000
Not Applicable
(Former name or former address, if changed since last report)
Check the appropriate box below if the Form 8-K filing is intended to simultaneously satisfy the filing obligation of the registrant under any of the following provisions.
☐ |
Written communication pursuant to Rule 425 under the Securities Act (17 CFR 230.425) |
☐ |
Soliciting material pursuant to Rule 14a-12 under the Exchange Act (17 CFR 240.14a-12) |
☐ |
Pre-commencement communications pursuant to Rule 14d-2(b) under the Exchange Act (17 CFR 240.14d-2(b)) |
☐ |
Pre-commencement communications pursuant to Rule 13e-4(c) under the Exchange Act (17 CFR 240.13e-4(c)) |
Securities registered pursuant to Section 12(b) of the Securities Exchange Act of 1934:
Title of each class |
Trading Symbol(s) |
Name of each exchange on which registered |
Common Stock $0.01 Par Value |
ARCB |
Nasdaq |
Indicate by check mark whether the registrant is an emerging growth company as defined in Rule 405 of the Securities Act of 1933 (§230.405 of this chapter) or Rule 12b-2 of the Securities Exchange Act of 1934 (§240.12b-2 of this chapter).
Emerging growth company☐
If an emerging growth company, indicate by check mark if the registrant has elected not to use the extended transition period for complying with any new or revised financial accounting standards provided pursuant to Section 13(a) of the Exchange Act.☐
ITEM 2.02 – RESULTS OF OPERATIONS AND FINANCIAL CONDITION
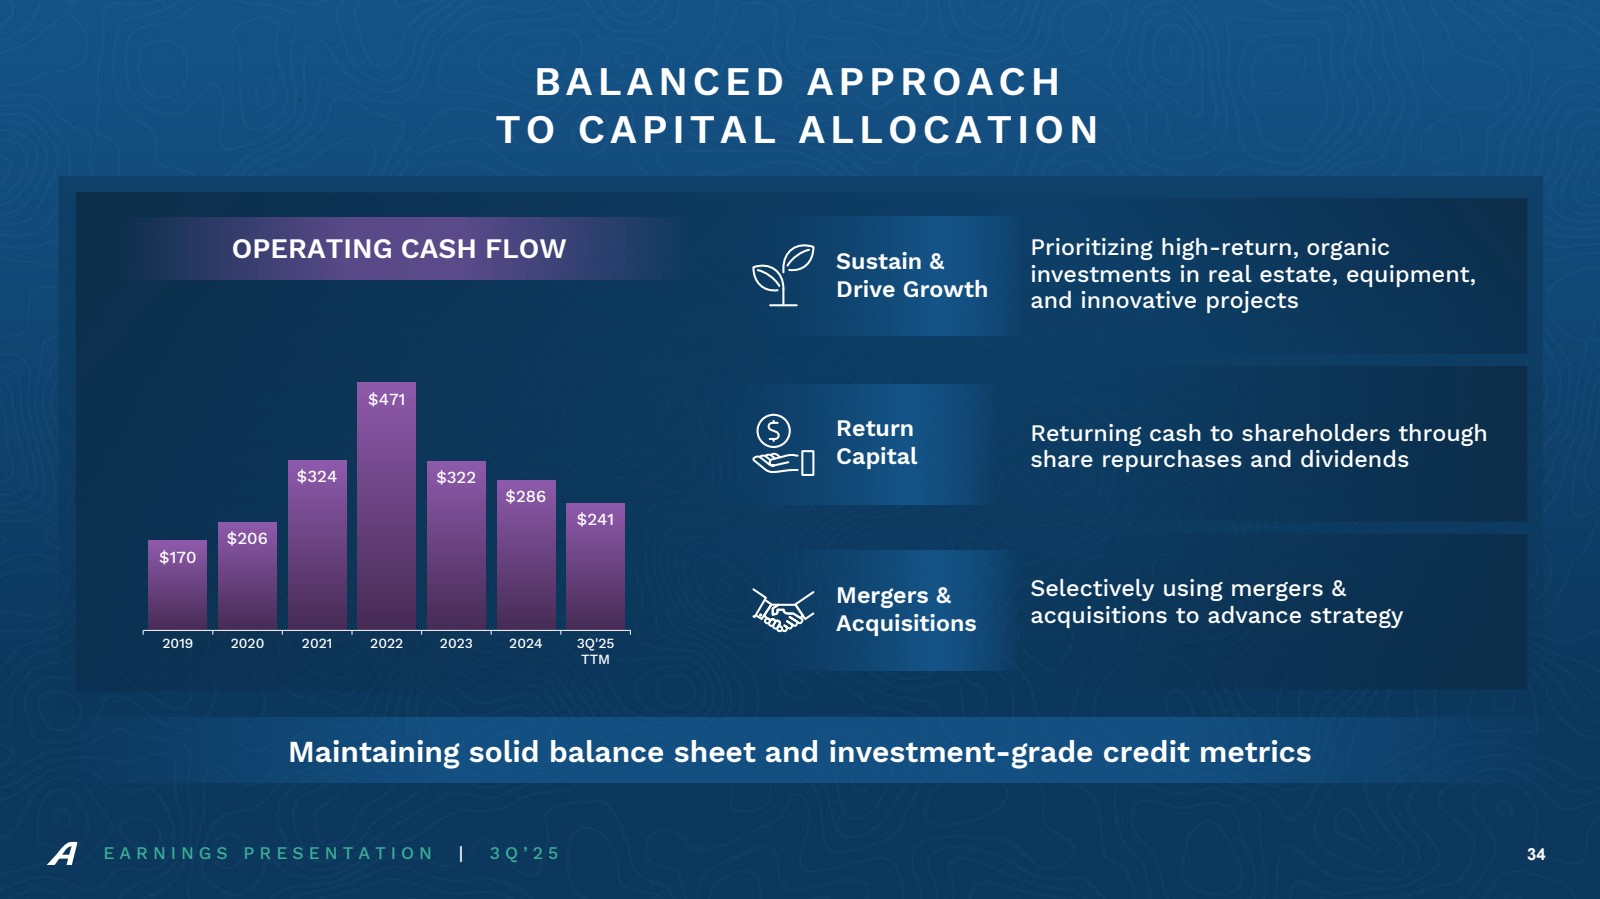
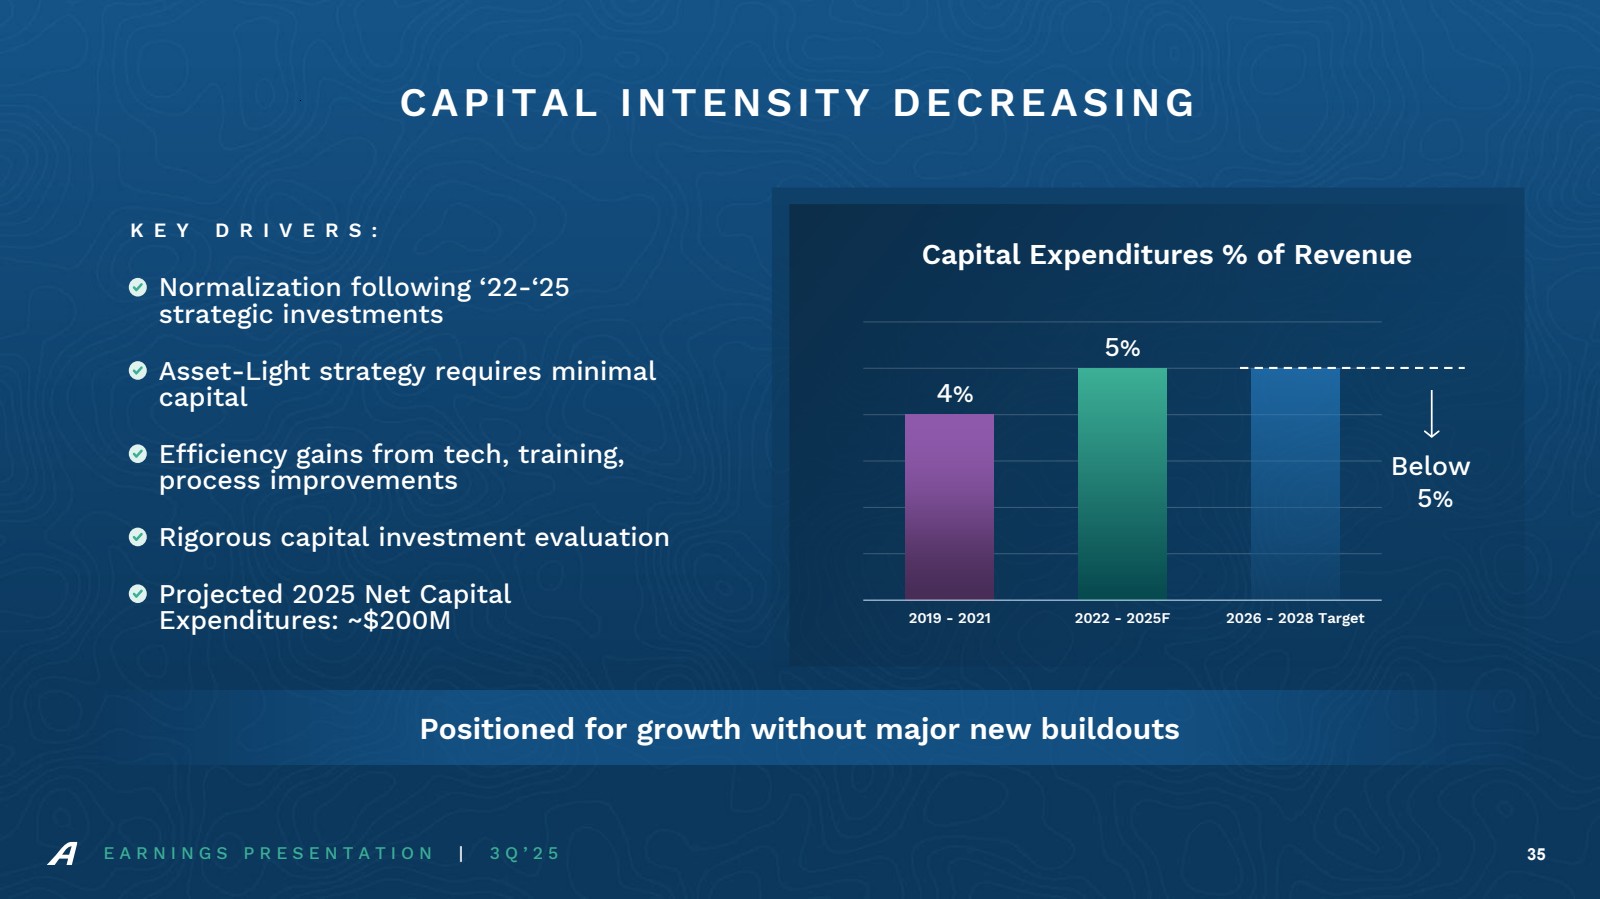
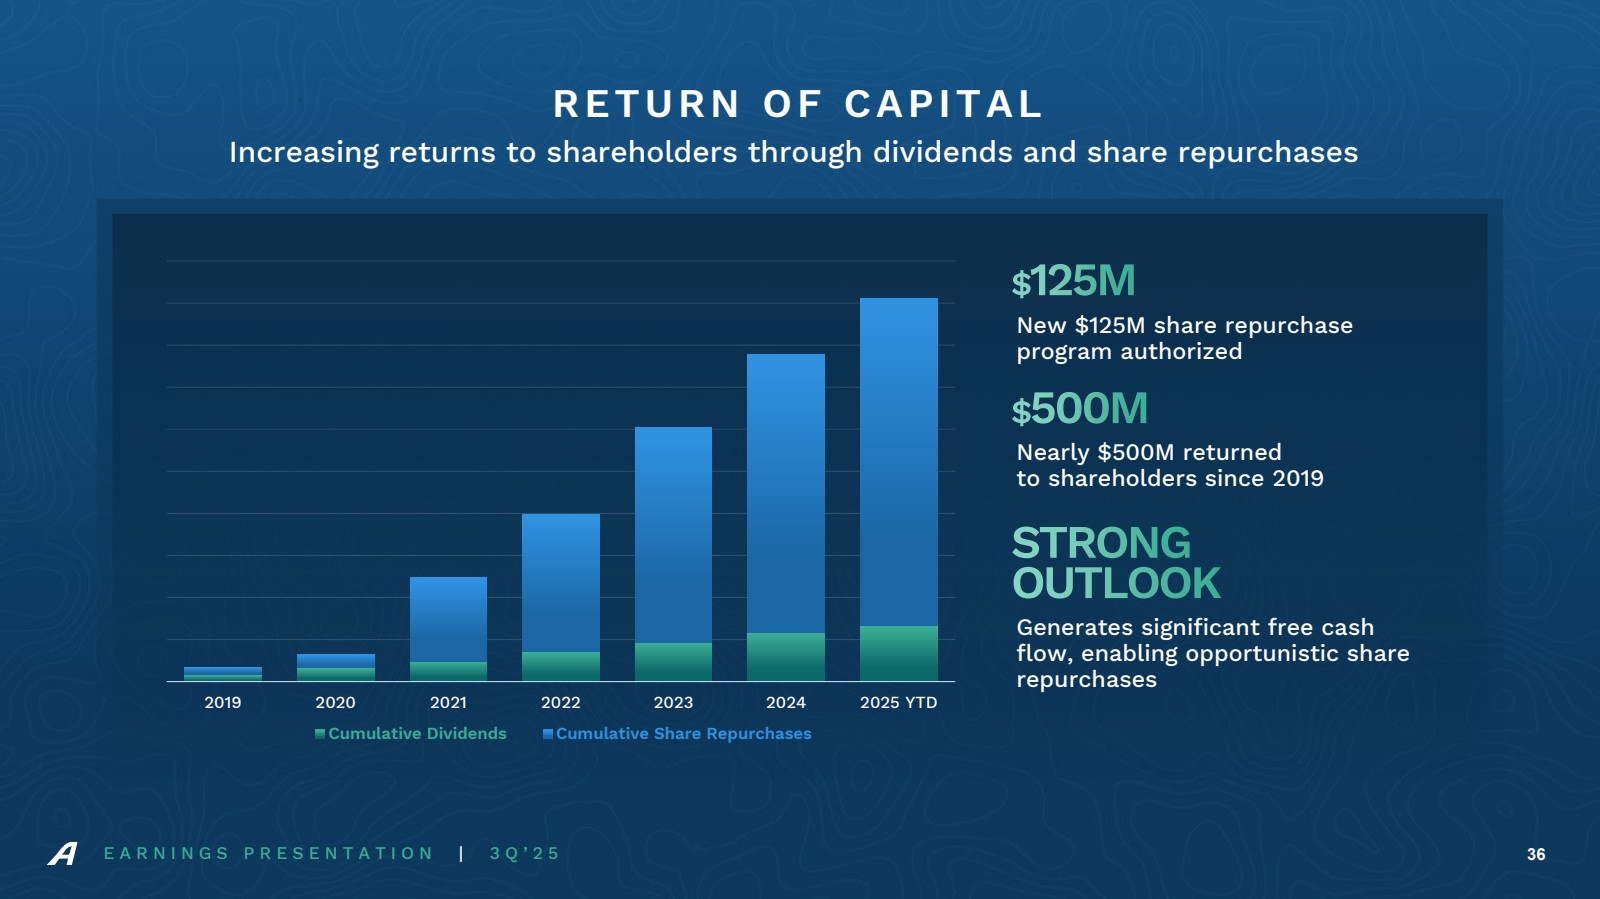
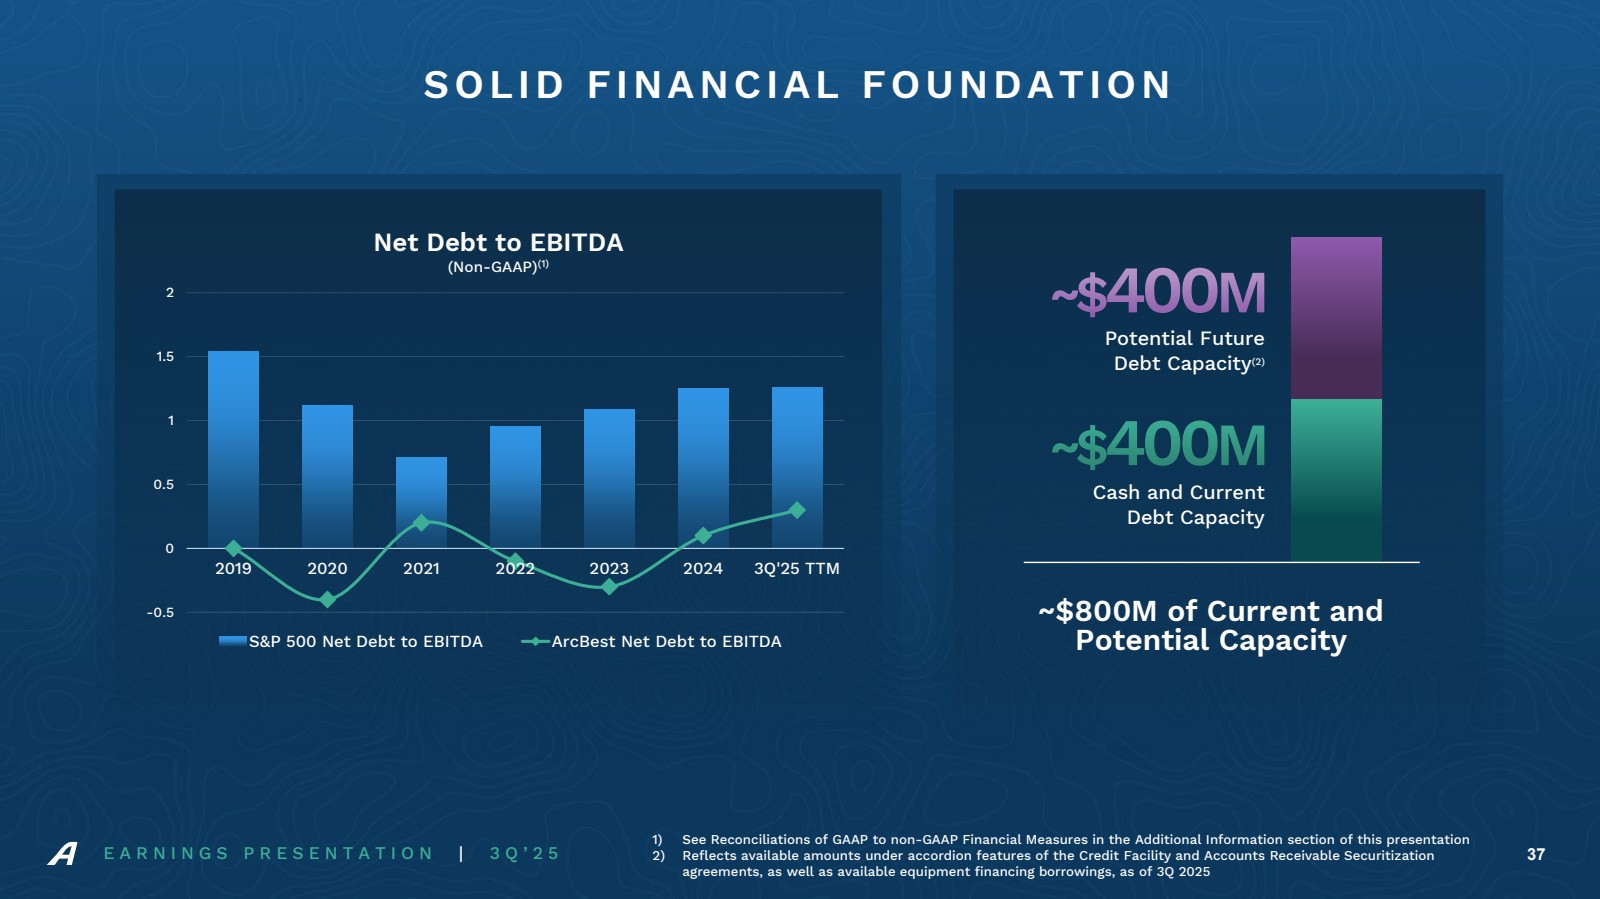
On November 5, 2025, ArcBest® (Nasdaq: ARCB) (the “Company”) issued a press release announcing its unaudited third quarter 2025 results. A copy of the press release is furnished as Exhibit 99.1 to this Current Report on Form 8-K and incorporated herein by reference. Additional supplemental information and presentation slides to be used in connection with the scheduled conference call to discuss the third quarter results are furnished as Exhibit 99.2 and Exhibit 99.3 to this Current Report on Form 8-K and incorporated herein by reference.
The Company reports its financial results in accordance with generally accepted accounting principles (“GAAP”). However, management believes that certain non-GAAP financial measures and ratios and other information utilized for internal analysis provide analysts, investors, and others the same information that we use internally for purposes of assessing the Company’s core operating performance and provide meaningful comparisons between current and prior period results, as well as important information regarding performance trends. The use of certain non-GAAP measures improves comparability in analyzing ArcBest’s performance because it removes the impact of items from operating results that, in management’s opinion, do not reflect ArcBest’s core operating performance.
The press release in Exhibit 99.1, the supplemental information in Exhibit 99.2, and the presentation slides in Exhibit 99.3 include certain non-GAAP information. Certain information discussed in the scheduled conference call could also be considered non-GAAP measures. Reconciliations of the non-GAAP measures to the most directly comparable financial measures calculated and presented in accordance with GAAP are included in Exhibit 99.1 herein, including reconciliations of GAAP earnings and earnings per share to non-GAAP financial measures, reconciliations of GAAP to non-GAAP effective tax rates, and calculations of adjusted earnings before interest, taxes, depreciation and amortization (“Adjusted EBITDA”). Reconciliations of non-GAAP measures included in the presentation slides to the most directly comparable GAAP financial measures are also included within Exhibit 99.3 herein.
Management believes EBITDA and Adjusted EBITDA to be relevant and useful information as EBITDA is a standard measure commonly reported and widely used by analysts, investors and others to measure financial performance and ability to service debt obligations. Additionally, Adjusted EBITDA is a primary component of the financial covenants contained in ArcBest’s credit agreement. Other companies may calculate EBITDA and Adjusted EBITDA differently; therefore, ArcBest’s calculation of EBITDA and Adjusted EBITDA may not be comparable to similarly titled measures of other companies. Non-GAAP financial measures should be viewed in addition to, and not as an alternative for, ArcBest’s reported results. These financial measures should not be construed as better measurements than operating income, operating cash flow, net income or earnings per share, as determined under GAAP.
ITEM 9.01 – FINANCIAL STATEMENTS AND EXHIBITS
Exhibit No. |
|
Description of Exhibit |
|
|
|
99.1 |
|
|
99.2 |
|
|
99.3 |
|
Earnings conference call presentation dated November 5, 2025 |
104 |
|
Cover Page Interactive Data File – The cover page interactive data file does not appear in the Interactive Data File because its XBRL tags are embedded within the Inline XBRL document |
SIGNATURES
Pursuant to the requirements of the Securities Exchange Act of 1934, the registrant has duly caused this report to be signed on its behalf by the undersigned hereunto duly authorized.
|
|
|
ARCBEST CORPORATION |
|
|
|
|
|
|
|
(Registrant) |
|
|
|
|
Date: |
November 5, 2025 |
|
/s/ Michael R. Johns |
|
Michael R. Johns |
||
|
Chief Legal Officer and Corporate Secretary |
||
|
|||
Exhibit 99.1

Investor Relations Contact: Amy Mendenhall |
Media Contact: Autumnn Mahar |
Phone: 479-785-6200 |
Phone: 479-494-8221 |
Email: invrel@arcb.com |
Email: amahar@arcb.com |
ArcBest Announces Third Quarter 2025 Results
| ● | Asset-Based shipment and tonnage growth despite soft freight environment |
| ● | Asset-Light achieves record volumes and productivity |
| ● | Over $66 million returned to shareholders through share repurchases and dividends year-to-date |
FORT SMITH, Arkansas, November 5, 2025 — ArcBest® (Nasdaq: ARCB), a leader in supply chain logistics, today announced financial results for the third quarter ended September 30, 2025.
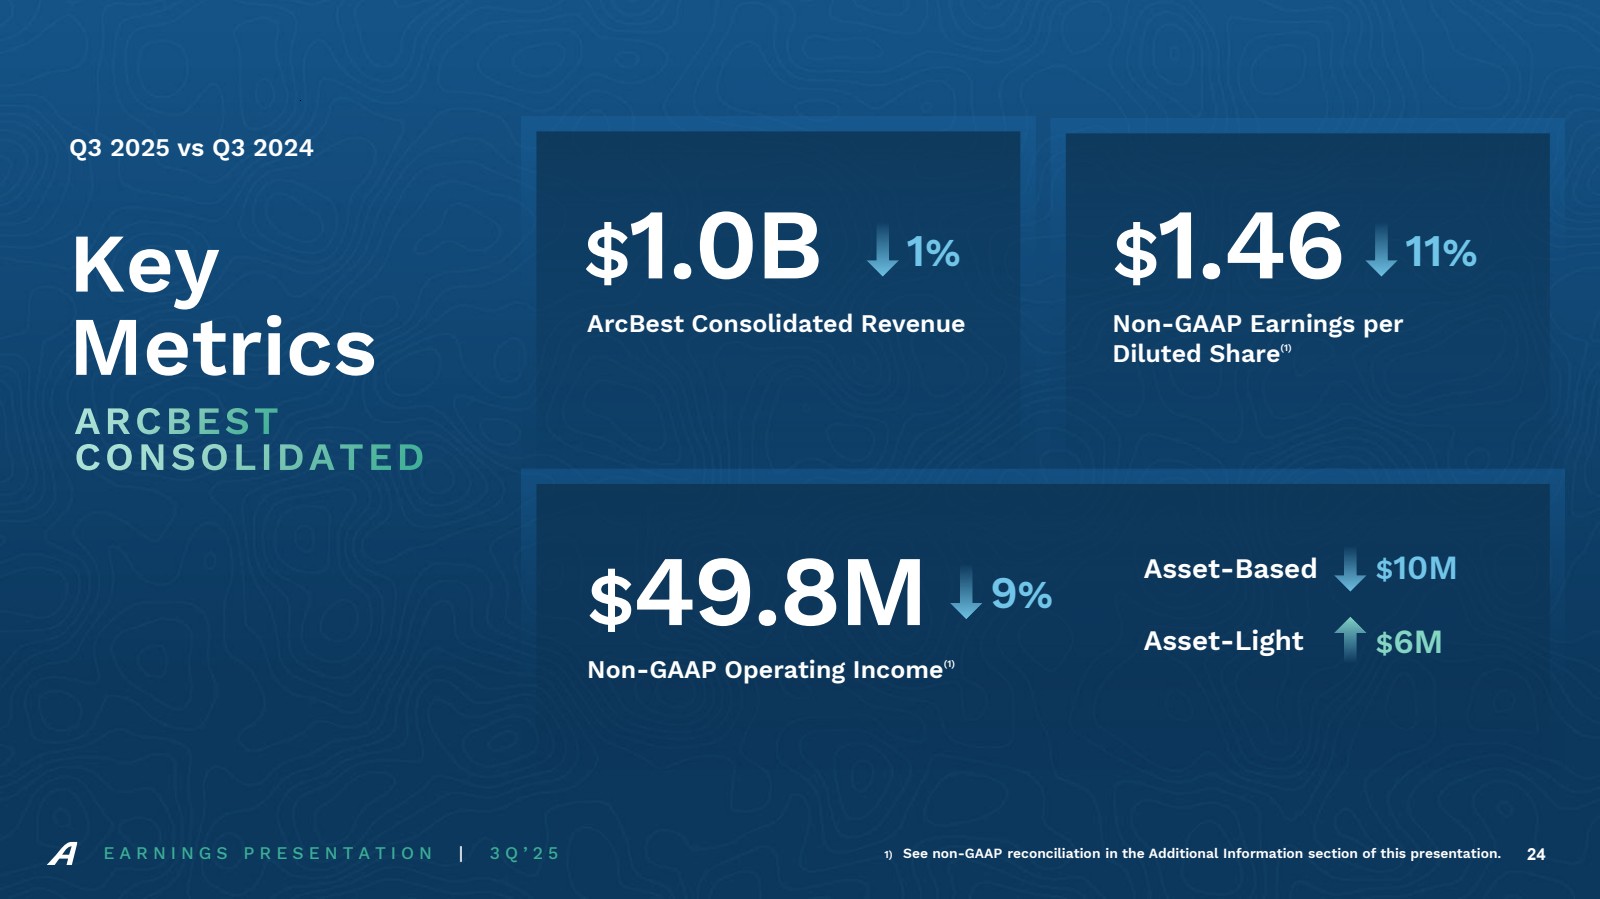
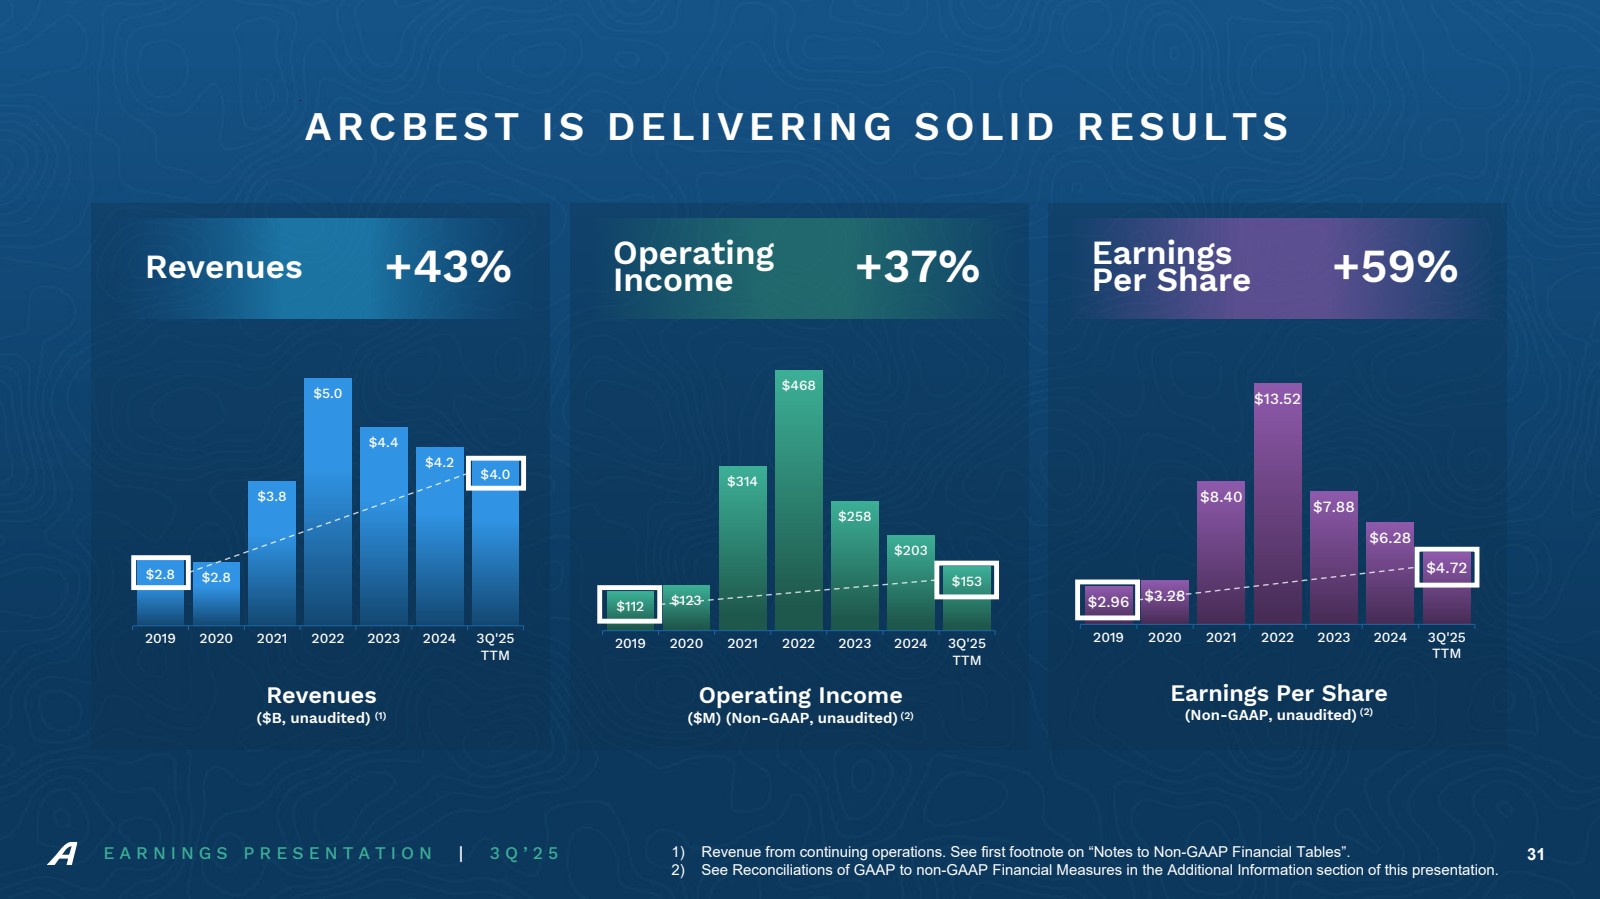
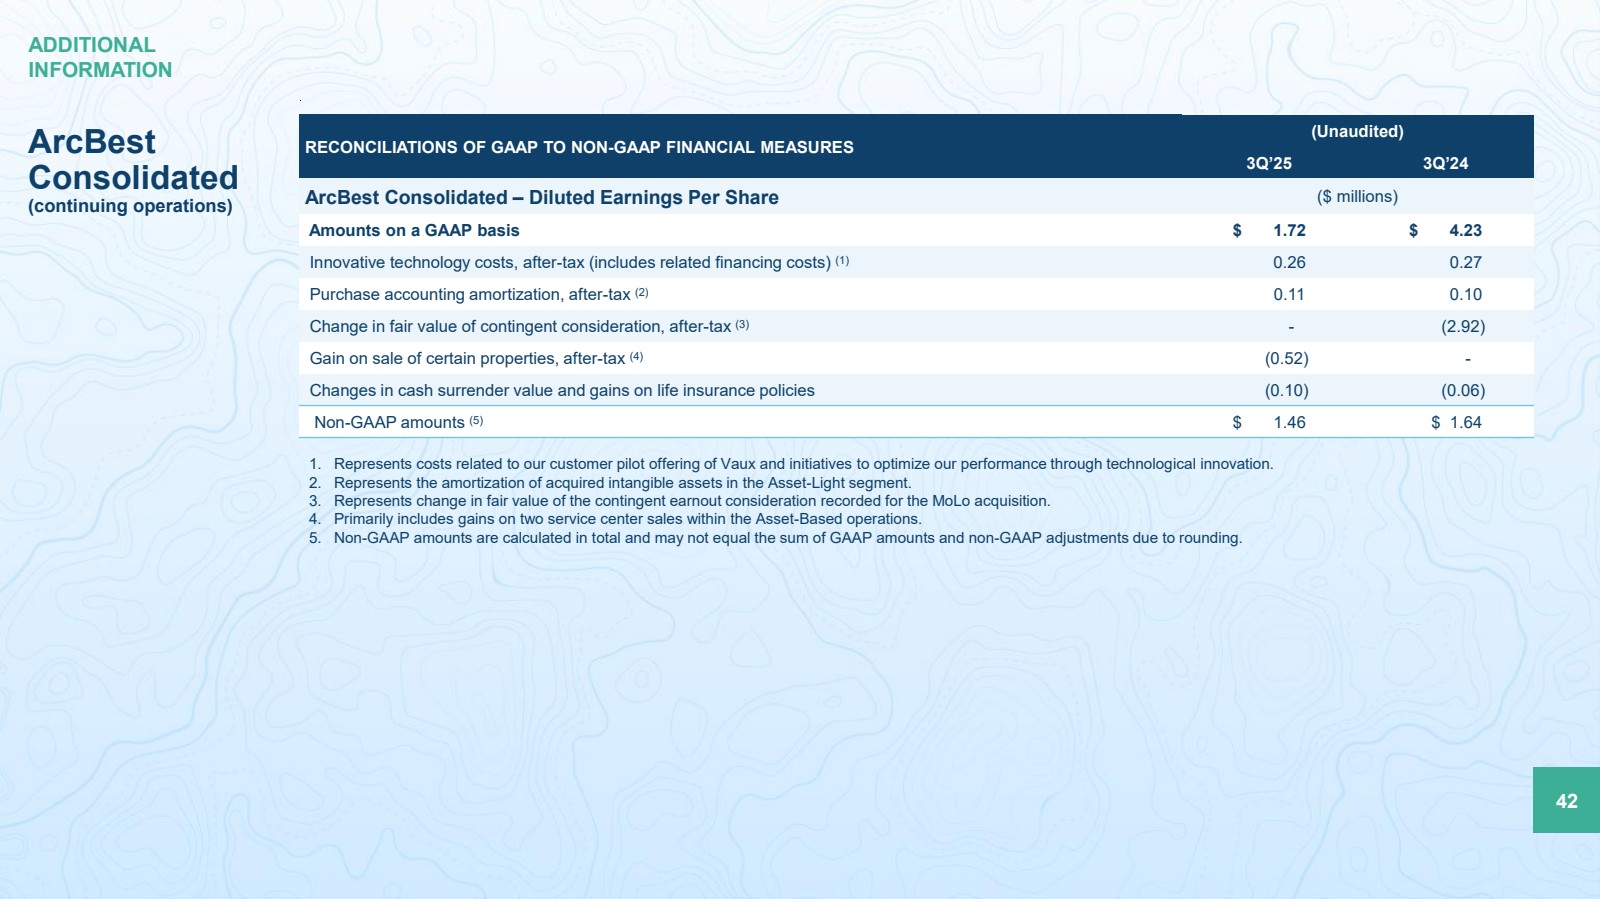
Third quarter 2025 revenue totaled $1.0 billion, compared to $1.1 billion in the prior-year period. Net income from continuing operations was $39.3 million, or $1.72 per diluted share, versus $100.3 million, or $4.23 per diluted share, in the third quarter of 2024, which included a $69.1 million after-tax benefit from the reduction in the fair value of contingent consideration related to the MoLo acquisition. On a non-GAAP basis, net income was $33.4 million, or $1.46 per diluted share, compared to $38.8 million, or $1.64 per diluted share, in the prior year.
“ArcBest continues to deliver, even in this challenging freight environment,” said Judy R. McReynolds, ArcBest Chairman and CEO. “We achieved growth in LTL shipments and tonnage, and our Asset-Light segment delivered record shipment volumes and productivity. These results underscore the strength of our customer relationships and the value of our integrated solutions.”
Results of Operations Comparisons
Asset-Based
Third Quarter 2025 Versus Third Quarter 2024
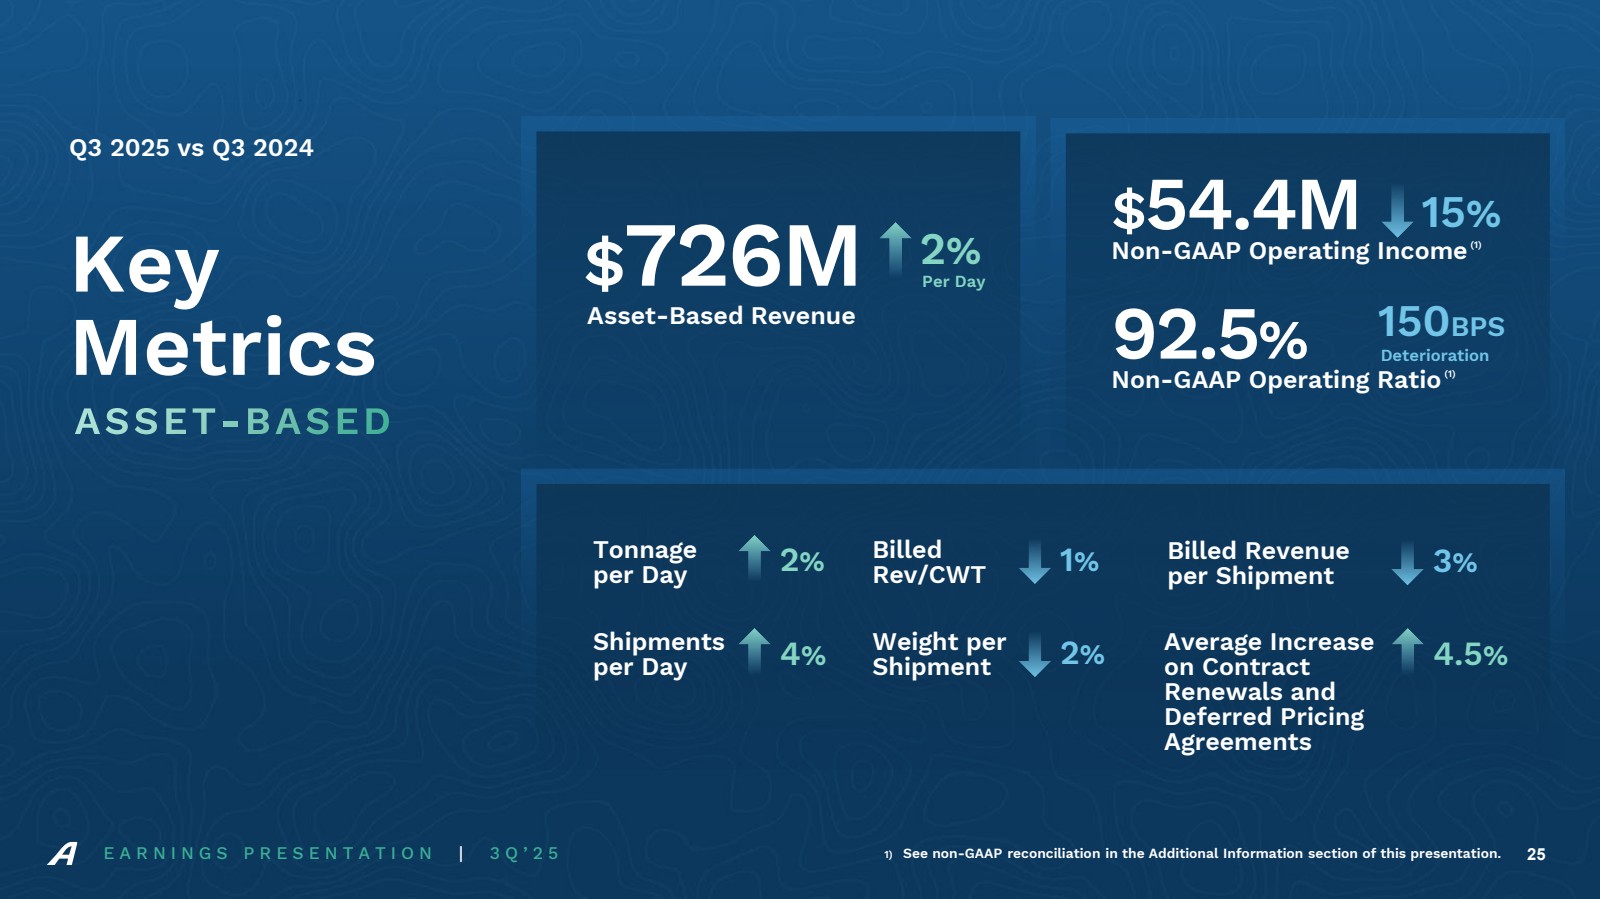
| ● | Revenue of $726.5 million compared to $709.7 million, a per-day increase of 1.6 percent |
| ● | Tonnage per day increase of 2.3 percent |
| ● | Shipments per day increase of 4.3 percent |
| ● | Billed revenue per hundredweight decrease of 1.1 percent |
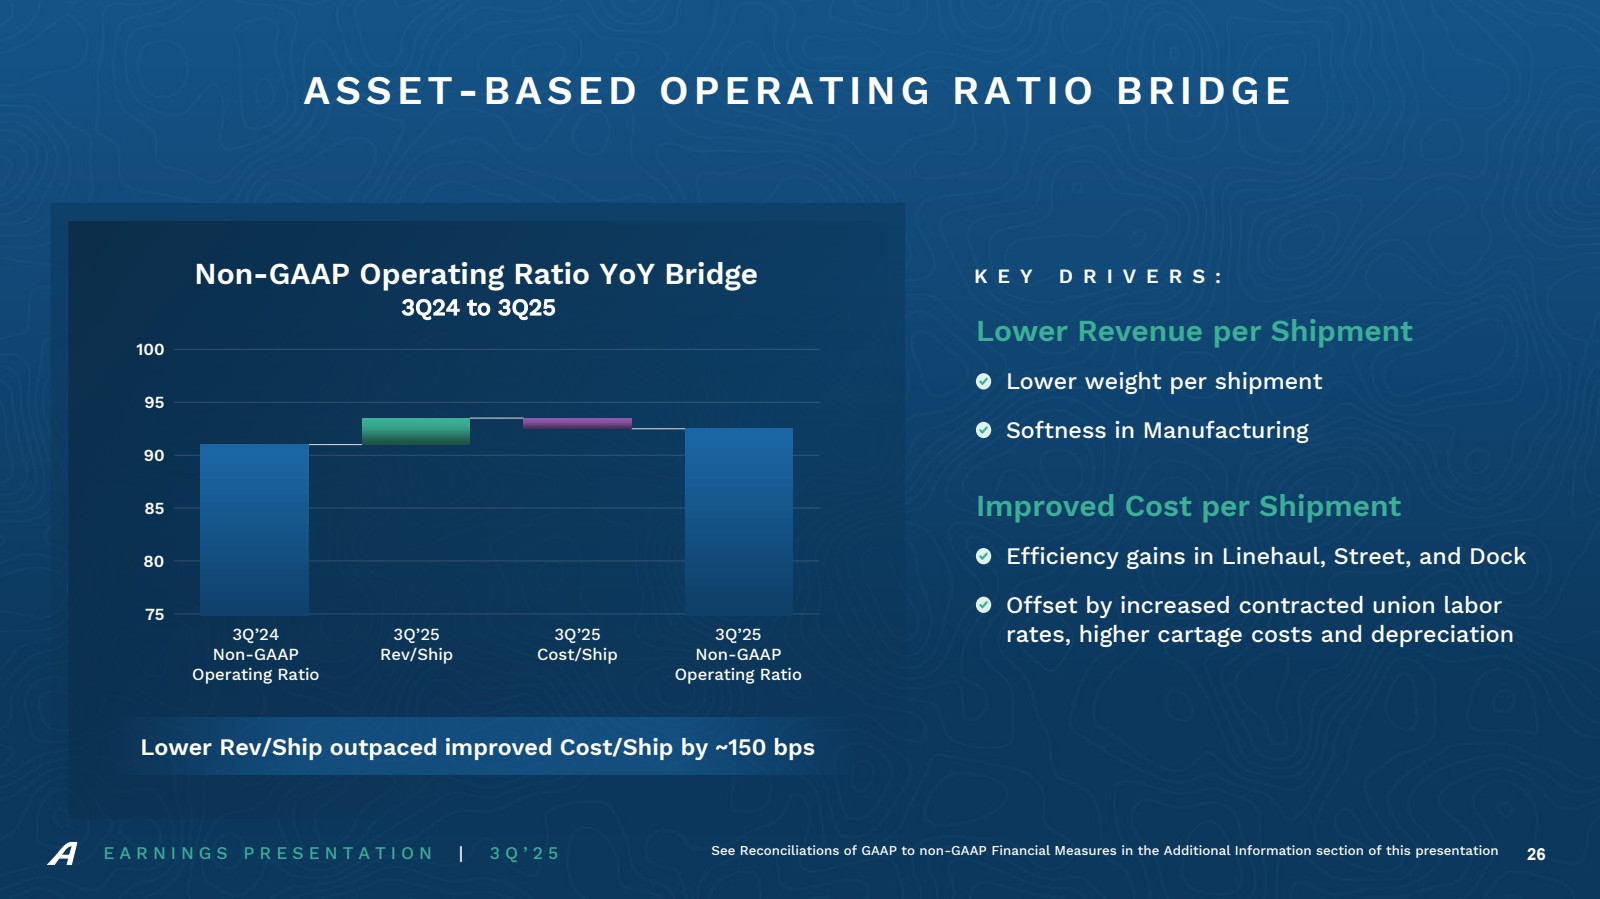
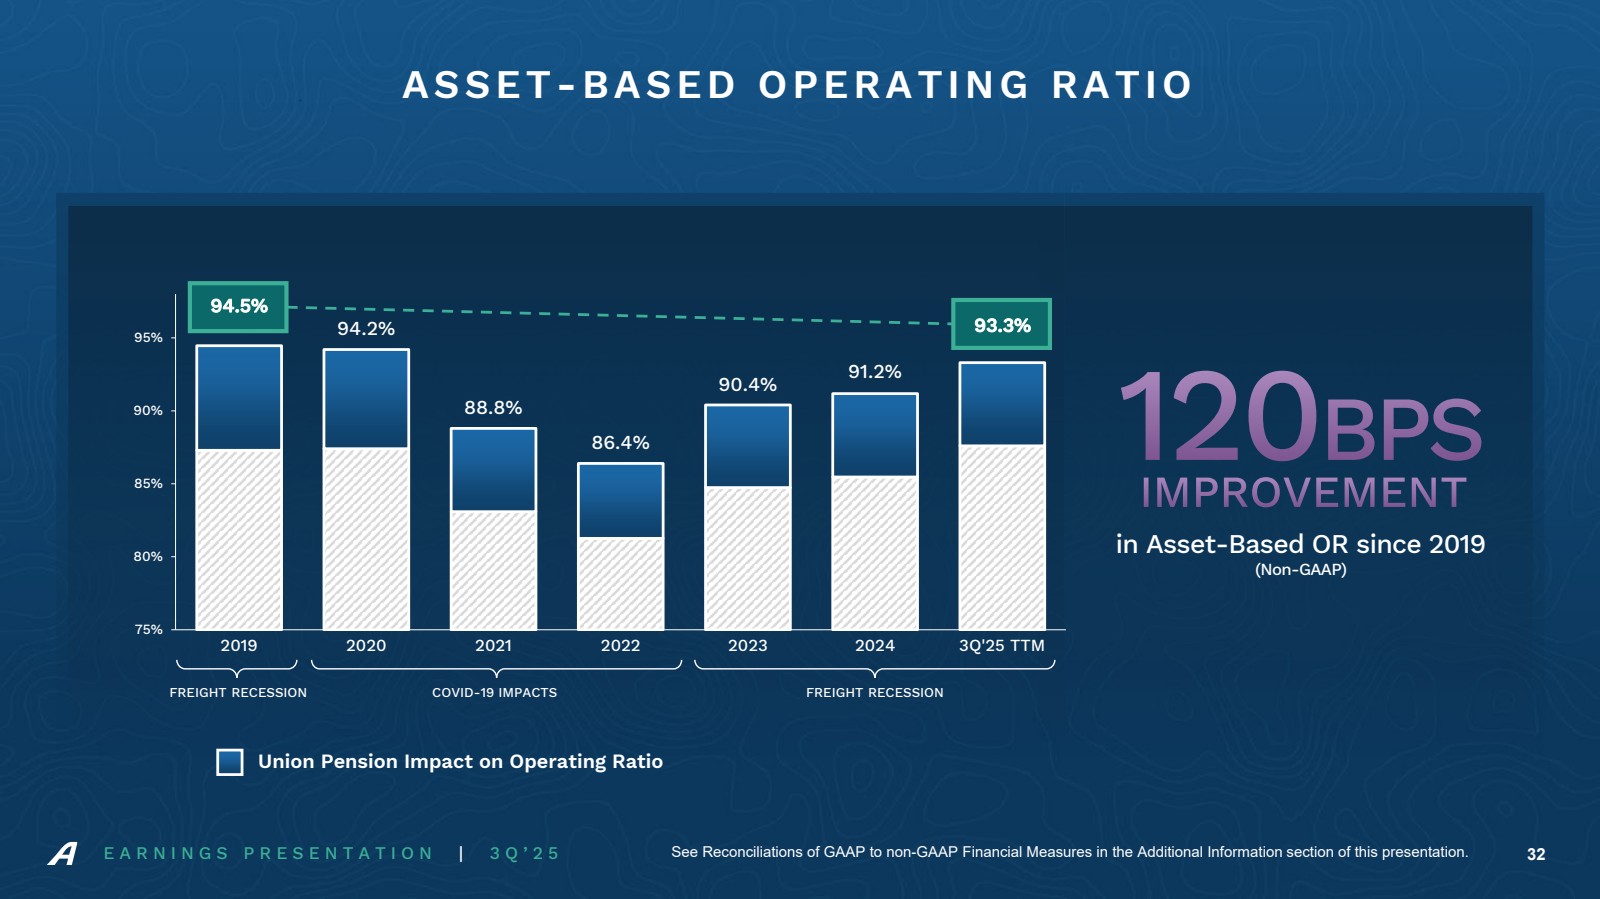
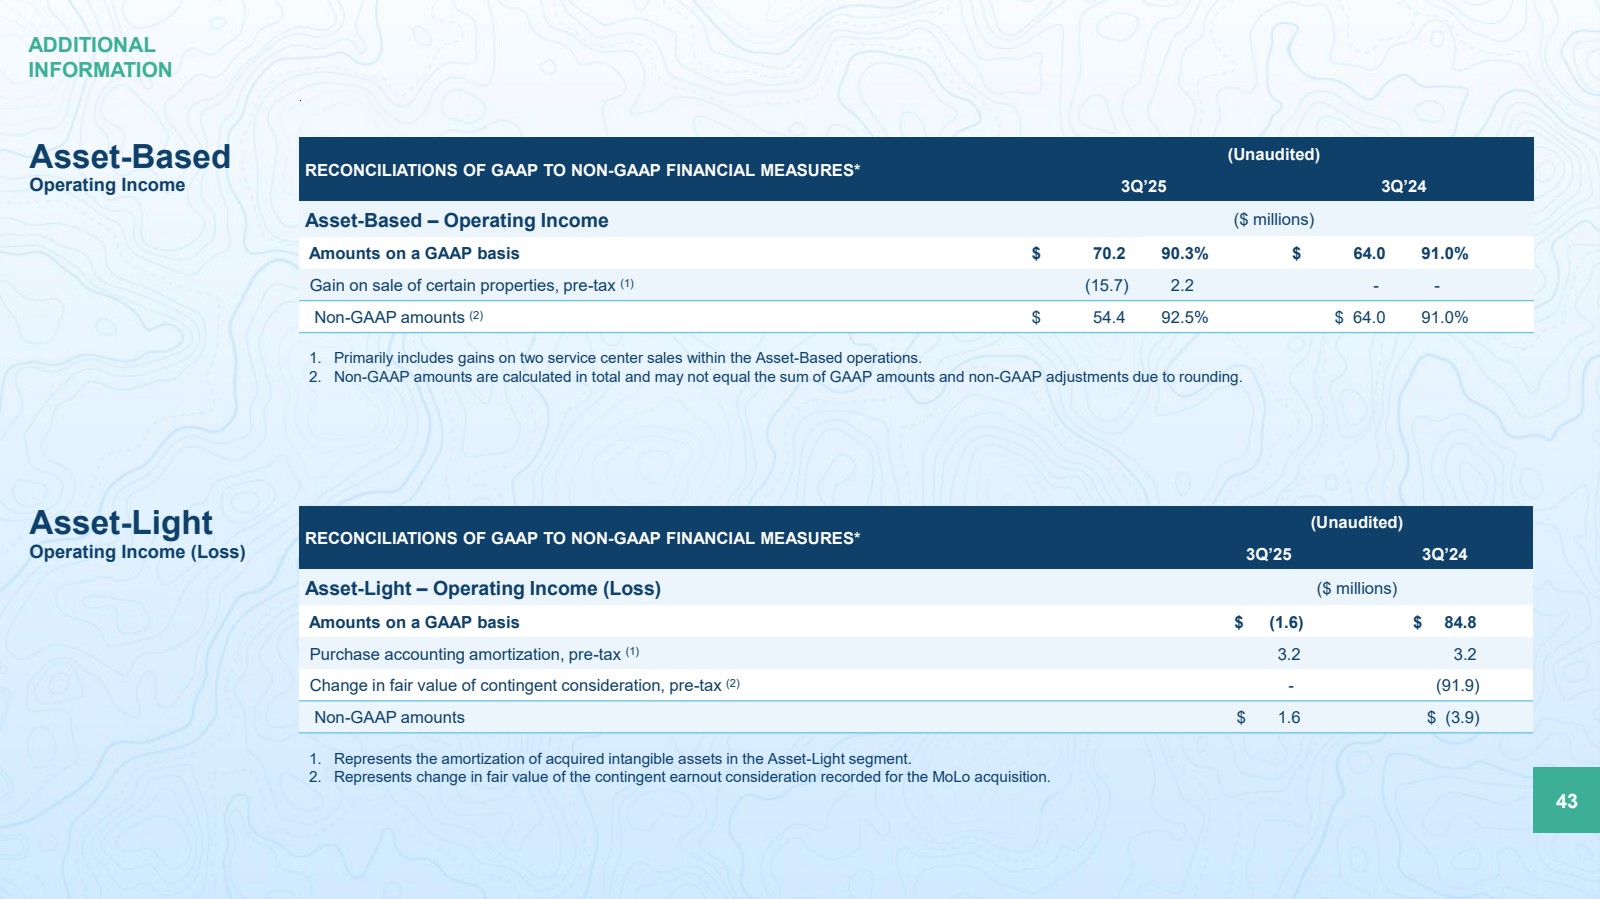
| ● | Operating income of $70.2 million and an operating ratio of 90.3 percent, which includes $15.9 million of net gains on asset sales, compared to $64.0 million and an operating ratio of 91.0 percent |
| ● | Excluding asset gains, non-GAAP operating income of $54.4 million and an operating ratio of 92.5 percent, compared to $64.0 million and an operating ratio of 91.0 percent |
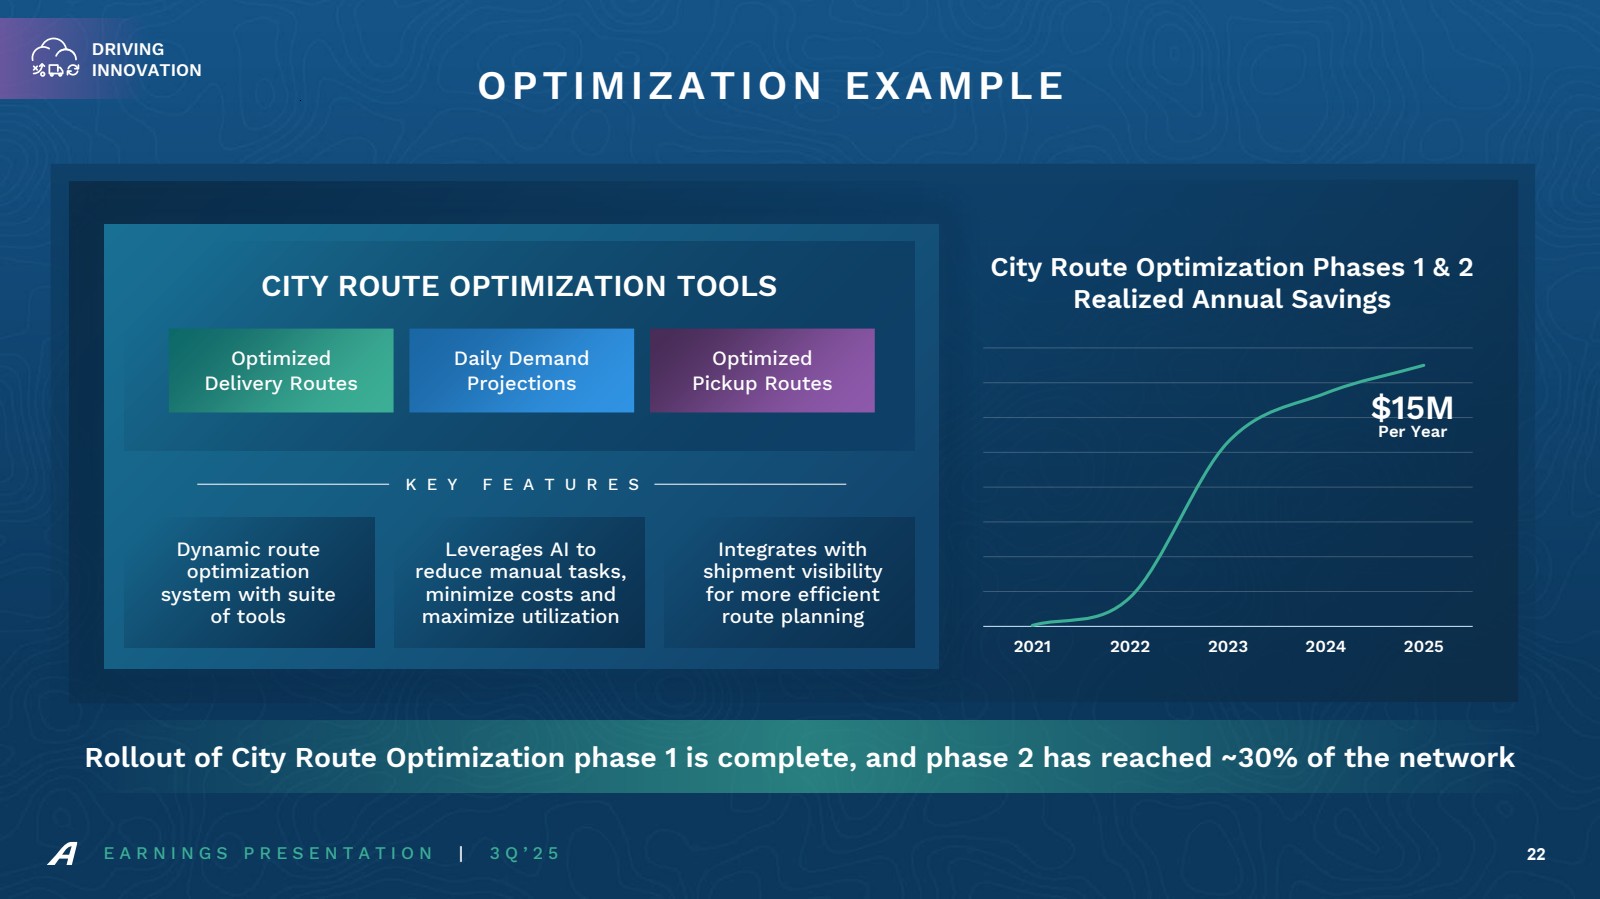
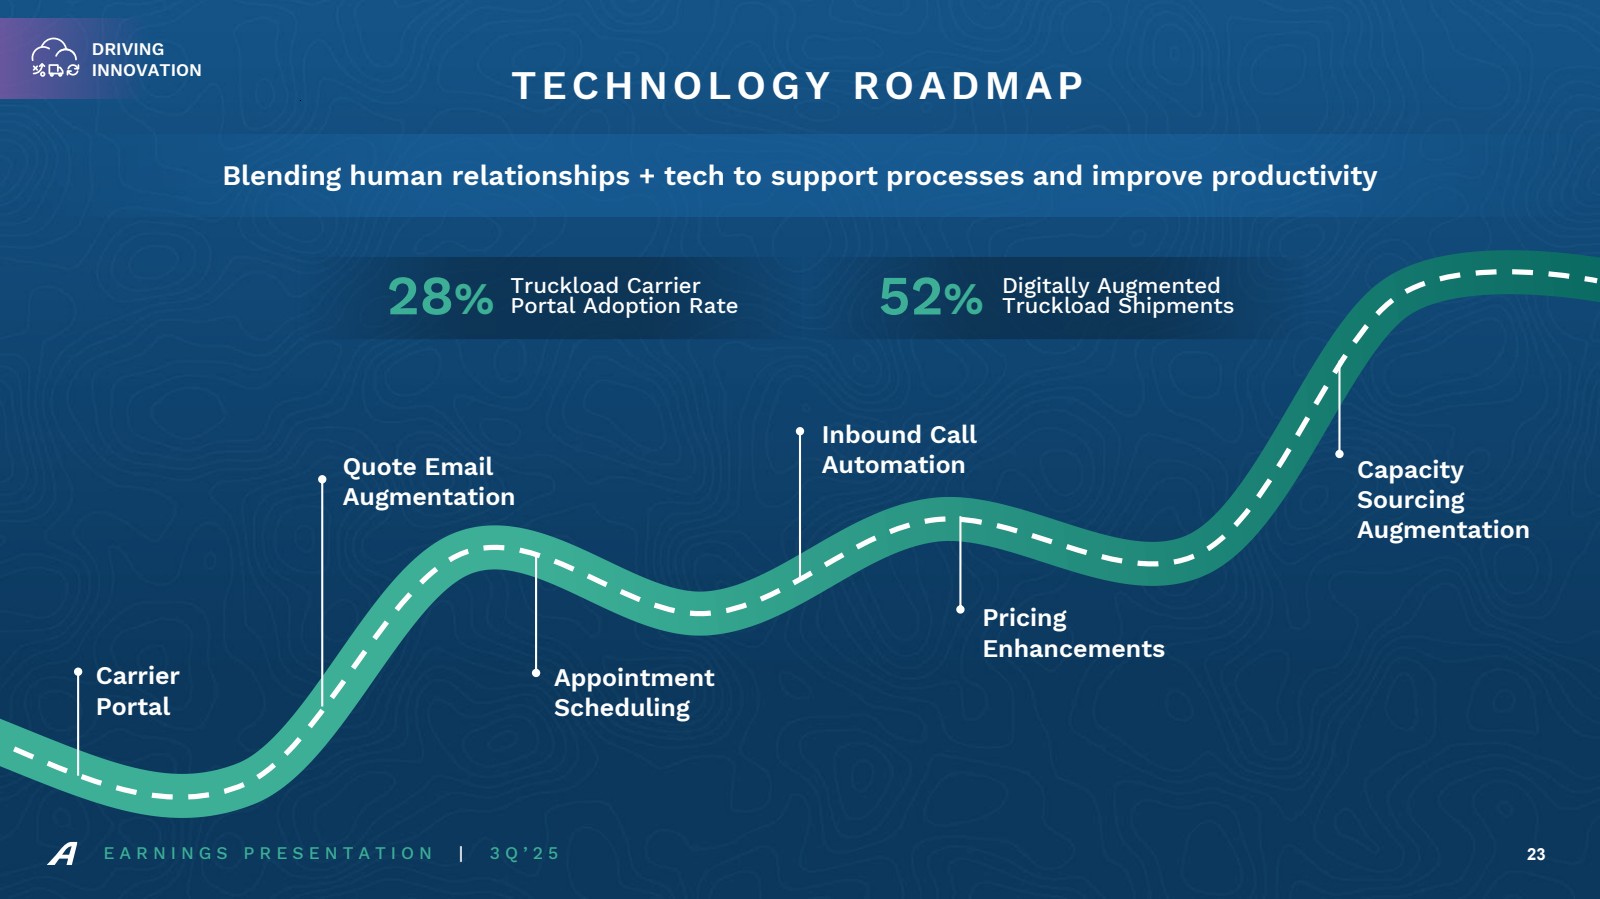
Tonnage growth was driven by a 4.3 percent increase in daily shipments, primarily from newly onboarded core LTL customers. This was partially offset by a 1.9 percent decline in total weight per shipment. While new shipments were generally heavier, ongoing weakness in the manufacturing sector continues to pressure weight per shipment metrics, reducing revenue per shipment without corresponding cost decreases.
To support shipment growth, labor was added, and network capacity was supplemented with purchased transportation and local cartage during peak vacation season. Annual increases in contracted union labor rates, combined with higher purchased transportation spending and equipment depreciation, drove operating expenses higher. Despite these pressures, cost per shipment improved one percent year-over-year as a result of continued productivity gains. Cartage and purchased transportation costs normalized in September after elevated activity in July and August.
1
Customer contract renewals and deferred pricing agreements averaged a 4.5 percent increase during the quarter. Billed revenue per hundredweight, including and excluding fuel, decreased by 1.1 percent in the third quarter, compared to the third quarter of 2024. Price improvements were offset by a shift in freight profile. Overall, LTL industry pricing remains rational.
Compared sequentially to the second quarter of 2025, third quarter revenue and shipments per day were flat, while weight per shipment declined 3.9 percent, resulting in a 3.7 percent decrease in tonnage per day. Billed revenue per shipment decreased 0.6 percent as price improvements were offset by lower-weight shipments. Billed revenue per hundredweight increased 3.4 percent, reflecting the lower-weight shipments, combined with higher prices and fuel surcharges. Excluding fuel surcharges, revenue per hundredweight increased in the low single digits. The sequential non-GAAP operating ratio improved by 30 basis points.
Asset-Light
Third Quarter 2025 Versus Third Quarter 2024
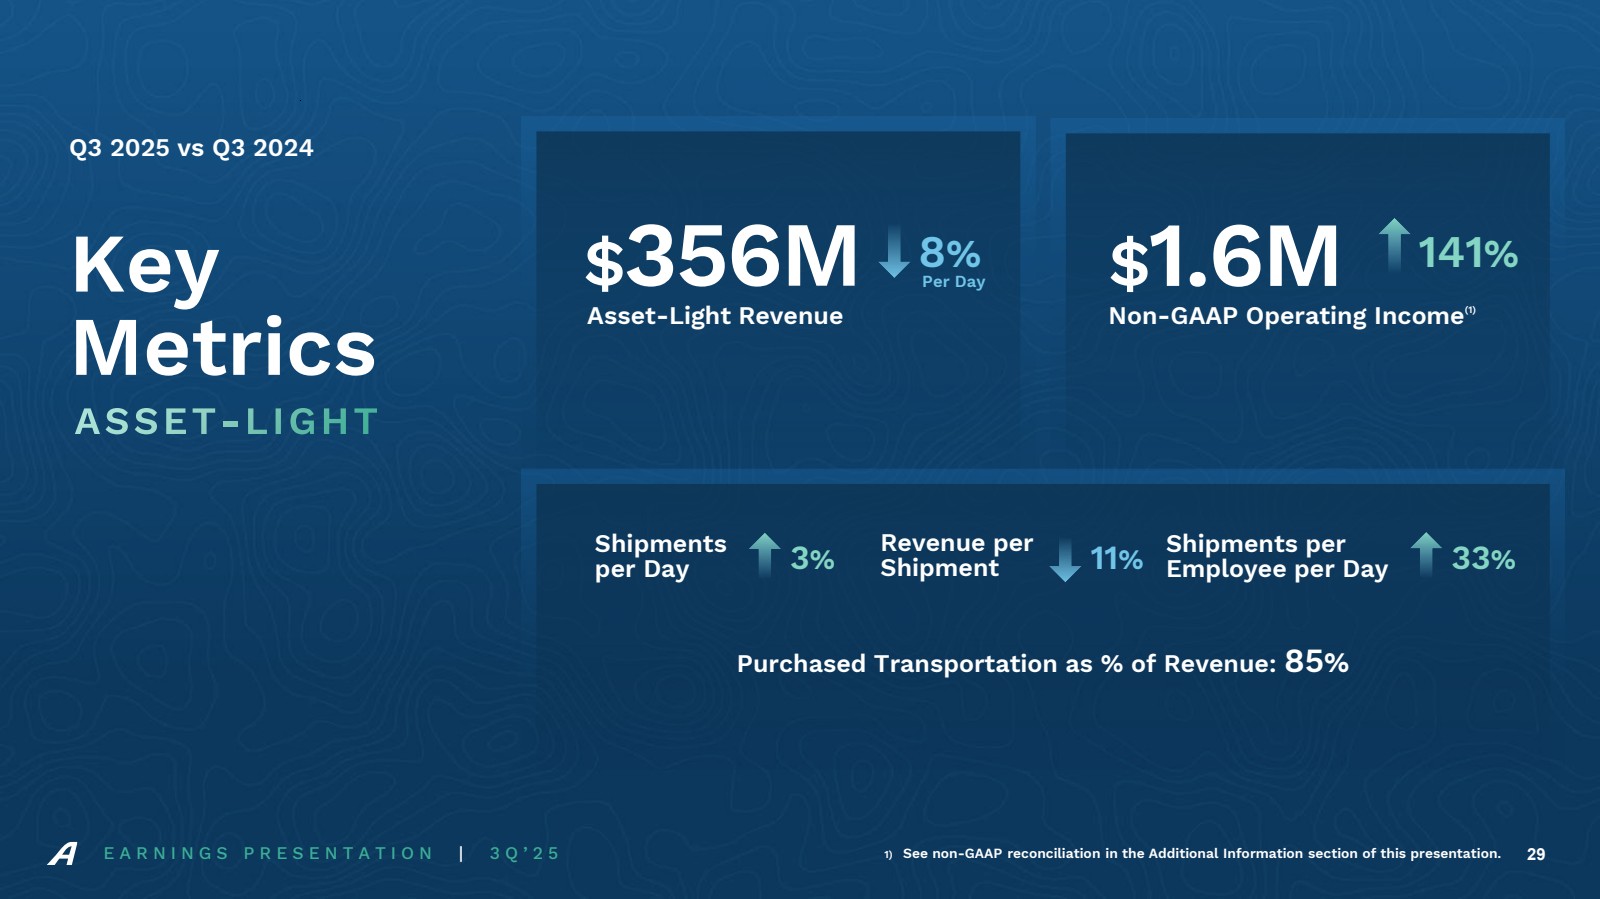
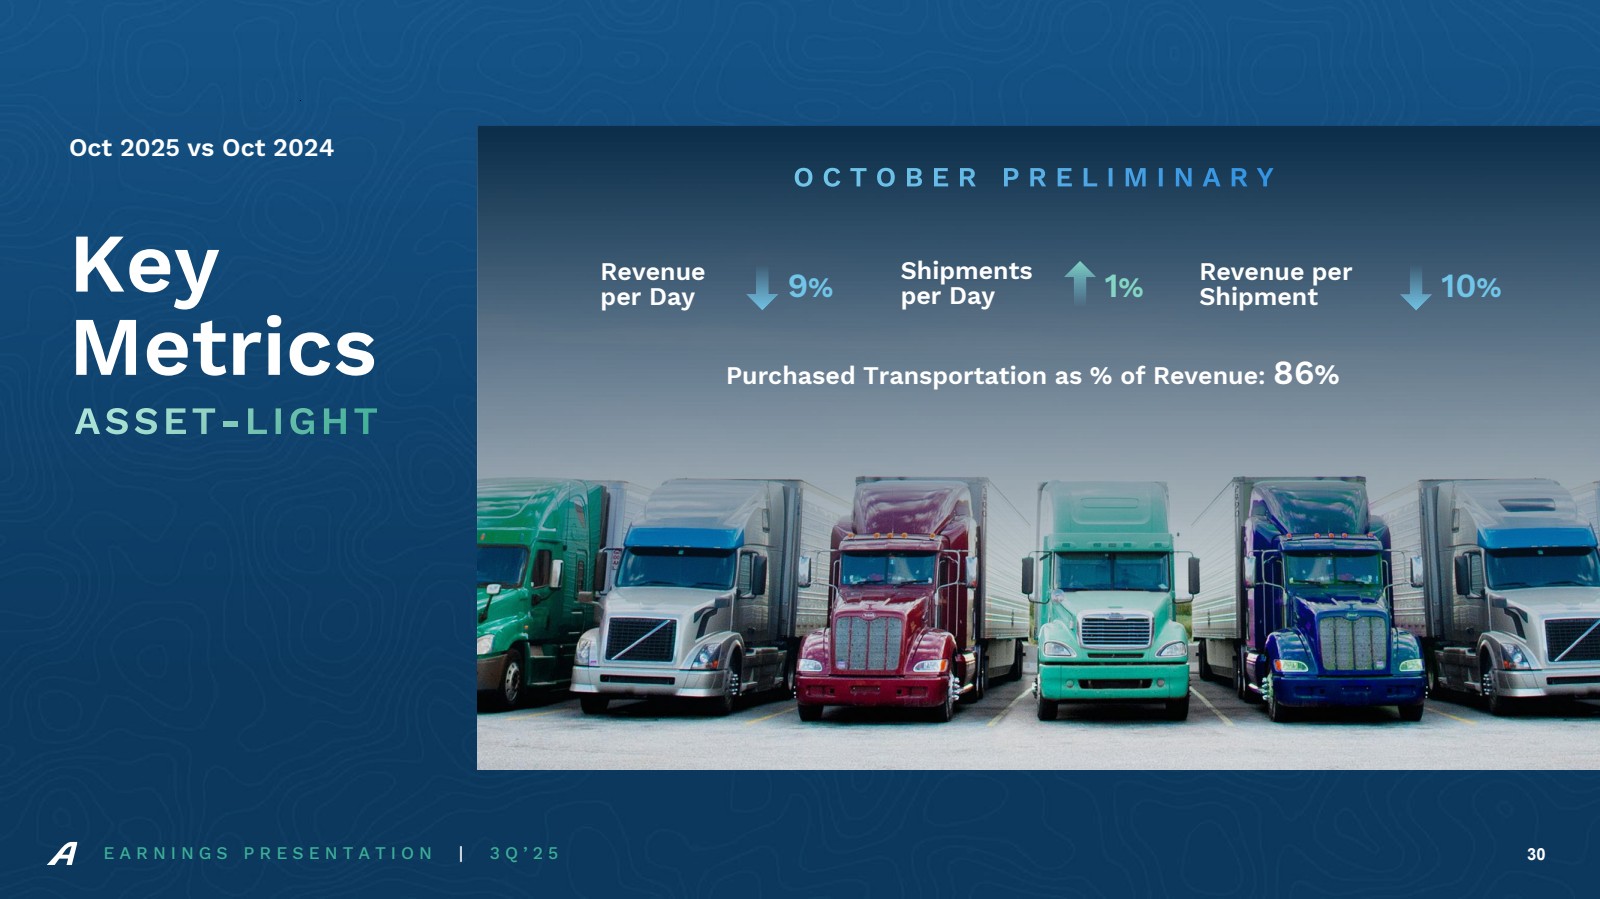
| ● | Revenue of $356.0 million compared to $385.3 million, a per-day decrease of 8.3 percent |
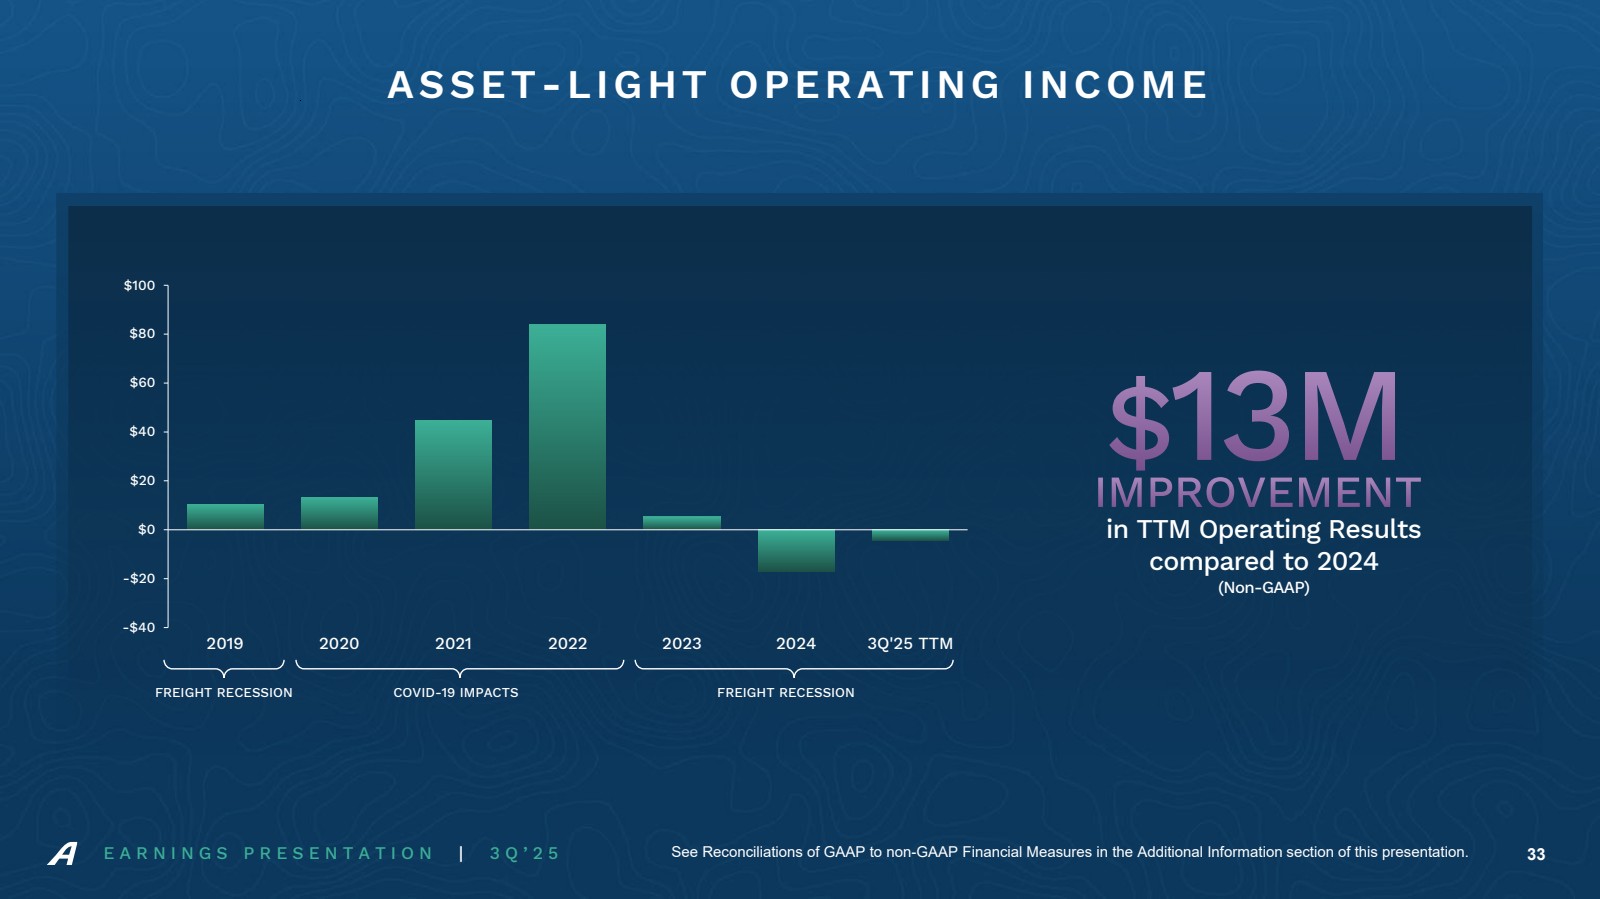
| ● | Operating loss of $1.6 million compared to operating income of $84.8 million, which included the $91.9 million pre-tax reduction in the fair value of contingent consideration related to the MoLo earnout |
| ● | On a non-GAAP basis, operating income of $1.6 million compared to operating loss of $3.9 million |
| ● | Adjusted earnings before interest, taxes, depreciation and amortization (“Adjusted EBITDA”), as defined in the attached non-GAAP reconciliation tables, of $3.1 million compared to negative $2.1 million |
Revenue decline was primarily due to lower revenue per shipment in a soft-rate environment and a higher mix of managed transportation business, which typically involves smaller, lower-revenue shipments. A 2.5 percent increase in shipments per day reflects continued growth in managed solutions, partially offset by a strategic reduction in less profitable truckload volumes.
Despite revenue declines, the Asset-Light segment delivered $1.6 million of non-GAAP operating income, supported by record volumes, improved margins and disciplined cost management. Productivity, measured by shipments per person per day, reached an all-time high during the quarter.
Compared sequentially to second quarter of 2025, daily revenue increased 3.3 percent, driven by a 10.1 percent increase in shipments per day. This increase was offset by a 6.2 percent decline in revenue per shipment, reflecting a higher proportion of smaller, lower-revenue managed solutions shipments. However, increased revenues combined with productivity gains contributed to improved financial performance.
Conference Call
ArcBest will host a conference call with company executives to discuss the quarterly results. The call will be today, Wednesday, November 5, 2025, at 9:30 a.m. ET (8:30 a.m. CT). Interested parties are invited to listen by calling (800) 715-9871 or by joining the webcast which can be found on ArcBest’s website at arcb.com. Slides to accompany this call are included in Exhibit 99.3 of the Form 8-K filed on November 5, 2025, will be posted and available to download on the company’s website prior to the scheduled conference time, and will be included in the webcast. Following the call, a recorded playback will be available through the end of the day on November 19, 2025. To listen to the playback, dial (800) 770-2030. The conference call ID for the live conference call and the playback is 6423434. The conference call and playback can also be accessed through November 19, 2025, on ArcBest’s website at arcb.com.
About ArcBest
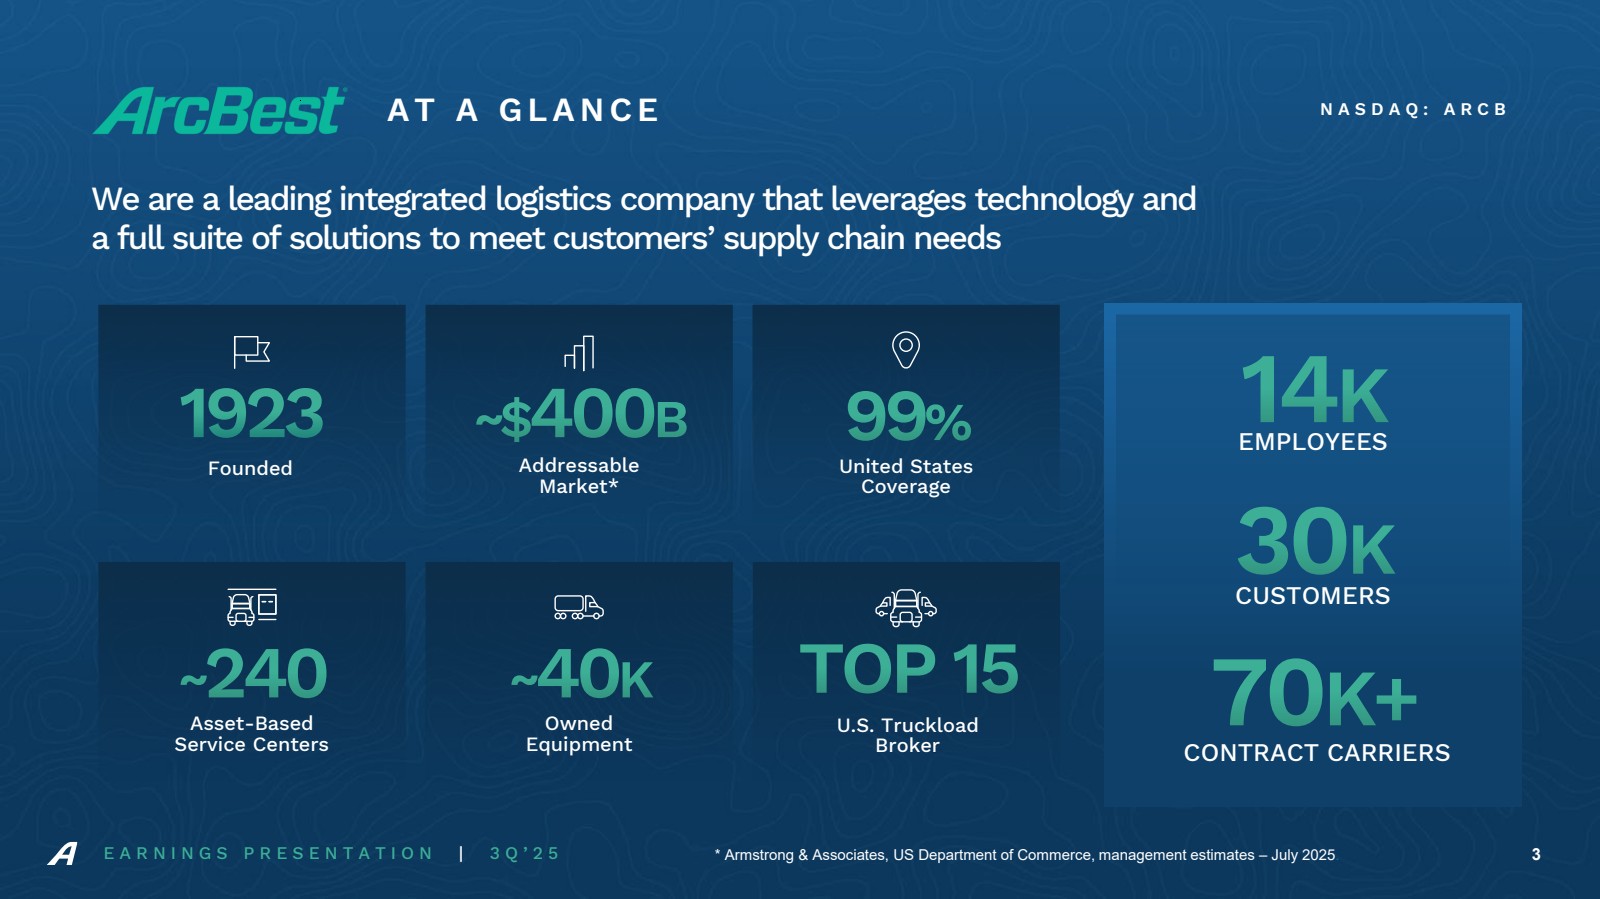
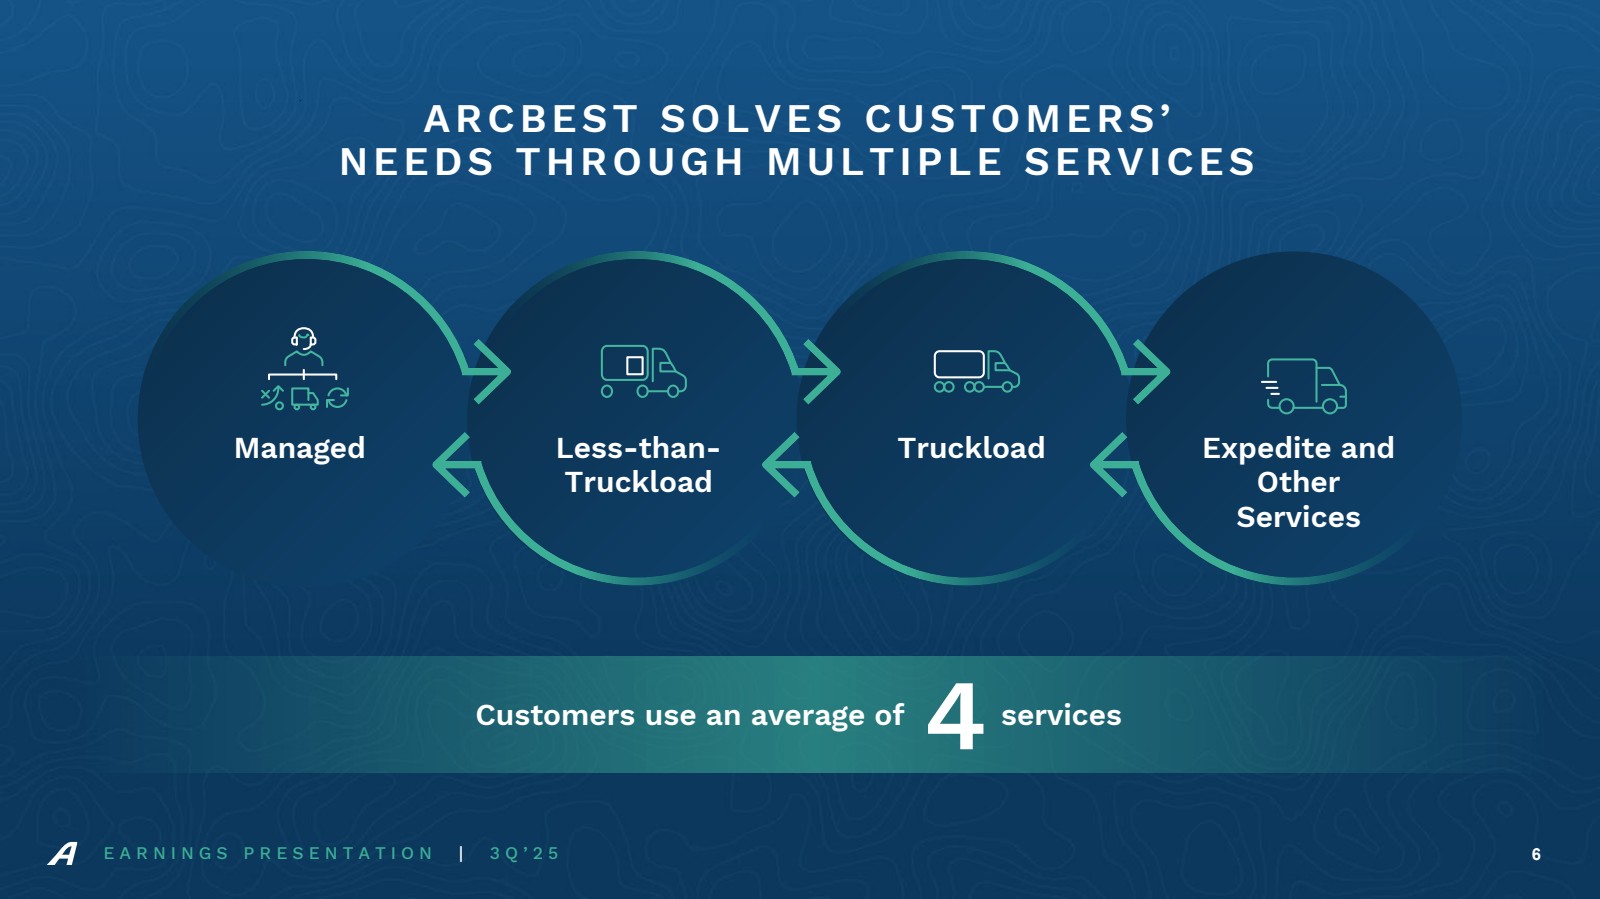
ArcBest® (Nasdaq: ARCB) is a multibillion-dollar integrated logistics company that helps keep the global supply chain moving. Founded in 1923 and now with 14,000 employees across 250 campuses and service centers, the company is a logistics powerhouse, using its technology, expertise and scale to connect shippers with the solutions they need — from ground, air and ocean transportation to fully managed supply chains. ArcBest has a long history of innovation that is enriched by deep customer relationships. With a commitment to helping customers navigate supply chain challenges now and in the future, the company is developing ground-breaking technology like Vaux™, one of the TIME Best Inventions of 2023. For more information, visit arcb.com.
2
The following is a “safe harbor” statement under the Private Securities Litigation Reform Act of 1995: Certain statements and information in this press release may constitute “forward-looking statements” within the meaning of the Private Securities Litigation Reform Act of 1995, including, among others, statements regarding (i) our expectations about our intrinsic value or our prospects for growth and value creation and (ii) our financial outlook, position, strategies, goals, and expectations. Terms such as “anticipate,” “believe,” “could,” “designed,” “estimate,” “expect,” “forecast,” “foresee,” “intend,” “likely,” “may,” “plan,” “predict,” “project,” “scheduled,” “seek,” “should,” “would,” and similar expressions and the negatives of such terms are intended to identify forward-looking statements. These statements are based on management’s beliefs, assumptions, and expectations based on currently available information, are not guarantees of future performance, and involve certain risks and uncertainties (some of which are beyond our control). Although we believe that the expectations reflected in these forward-looking statements are reasonable as and when made, we cannot provide assurance that our expectations will prove to be correct and caution the reader not to place undue reliance on our forward-looking statements. Actual outcomes and results could materially differ from what is expressed, implied, or forecasted in these statements due to a number of factors, including, but not limited to: data privacy breaches, cybersecurity incidents, and/or failures of our information systems, including disruptions or failures of services essential to our operations or upon which our information technology platforms rely; interruption or failure of third-party software or information technology systems, including but not limited to licensed software; untimely or ineffective development and implementation of, or failure to realize the potential benefits associated with, new or enhanced technology or processes; the loss or reduction of business from large customers or an overall reduction in our customer base; the timing and performance of growth initiatives and the ability to manage our cost structure; the cost, integration, and performance of acquisitions and the inability to realize the anticipated benefits of the acquisition within the expected time period or at all; unsolicited takeover proposals, proxy contests, and other proposals or actions by activist investors; maintaining our corporate reputation and intellectual property rights; establishing and maintaining adequate internal controls over financial reporting; nationwide or global disruption in the supply chain resulting in increased volatility in freight volumes; competitive initiatives and pricing pressures; increased prices for and decreased availability of equipment, including new revenue equipment, and higher costs of equipment-related operating expenses such as maintenance, fuel, and related taxes; availability of fuel, the effect of volatility in fuel prices and the associated changes in fuel surcharges on securing increases in base freight rates, and the inability to collect fuel surcharges; relationships with employees, including unions, and our ability to attract, retain, and upskill employees; unfavorable terms of, or the inability to reach agreement on, future collective bargaining agreements or a workforce stoppage by our employees covered under ABF Freight’s collective bargaining agreement; union employee wages and benefits, including changes in required contributions to multiemployer plans; availability and cost of reliable third-party services; our ability to secure independent owner-operators and/or operational or regulatory issues related to our use of their services; litigation or claims asserted against us; the effects, costs and potential liabilities related to changes in and compliance with, or violation of, existing or future governmental laws and regulations, including, but not limited to, environmental laws and regulations, such as emissions-control regulations and fuel efficiency regulations; default on covenants of financing arrangements and the availability and terms of future financing arrangements; our ability to generate sufficient cash from operations to support significant ongoing capital expenditure requirements and other business initiatives; self-insurance claims, insurance premium costs, and loss of our ability to self-insure; potential impairment of long-lived assets and goodwill and intangible assets; the effects of a widespread outbreak of an illness or disease or any other public health crisis, as well as regulatory measures implemented in response to such events; external events which may adversely affect us or the third parties who provide services for us, for which our business continuity plans may not adequately prepare us, including, but not limited to, the occurrence of natural disasters, health epidemics, geopolitical conflicts, acts of war, cybersecurity incidents, or trade restrictions; general economic conditions and related shifts in market demand that impact the performance and needs of industries we serve and/or limit our customers’ access to adequate financial resources; seasonal fluctuations, adverse weather conditions, natural disasters, and climate change; and other financial, operational, and legal risks and uncertainties detailed from time to time in ArcBest Corporation’s public filings with the Securities and Exchange Commission (“SEC”).
For additional information regarding known material factors that could cause our actual results to differ from those expressed in these forward-looking statements, please see our filings with the SEC, including our Annual Report on Form 10-K, Quarterly Reports on Form 10-Q, and Current Reports on Form 8-K.
Readers are cautioned not to place undue reliance on forward-looking statements, which speak only as of the date hereof. We undertake no obligation to publicly update or revise any forward-looking statements after the date they are made, whether as a result of new information, future events, or otherwise.
Financial Data and Operating Statistics
The following tables show financial data and operating statistics on ArcBest® and its reportable segments.
3
ARCBEST CORPORATION
CONSOLIDATED STATEMENTS OF OPERATIONS
|
|
Three Months Ended |
|
Nine Months Ended |
|
||||||||
|
|
September 30 |
|
September 30 |
|
||||||||
|
|
2025 |
|
2024 |
|
2025 |
|
2024 |
|
||||
|
|
(Unaudited) |
|
||||||||||
|
|
($ thousands, except share and per share data) |
|
||||||||||
REVENUES |
|
$ |
1,048,137 |
|
$ |
1,063,124 |
|
$ |
3,037,470 |
|
$ |
3,177,374 |
|
|
|
|
|
|
|
|
|
|
|
|
|
|
|
OPERATING EXPENSES |
|
|
993,510 |
|
|
928,131 |
|
|
2,938,904 |
|
|
2,971,101 |
|
|
|
|
|
|
|
|
|
|
|
|
|
|
|
OPERATING INCOME |
|
|
54,627 |
|
|
134,993 |
|
|
98,566 |
|
|
206,273 |
|
|
|
|
|
|
|
|
|
|
|
|
|
|
|
OTHER INCOME (COSTS) |
|
|
|
|
|
|
|
|
|
|
|
|
|
Interest and dividend income |
|
|
1,368 |
|
|
3,130 |
|
|
3,555 |
|
|
9,686 |
|
Interest and other related financing costs |
|
|
(3,334) |
|
|
(2,281) |
|
|
(9,045) |
|
|
(6,587) |
|
Other, net |
|
|
847 |
|
|
862 |
|
|
574 |
|
|
(28,118) |
|
|
|
|
(1,119) |
|
|
1,711 |
|
|
(4,916) |
|
|
(25,019) |
|
|
|
|
|
|
|
|
|
|
|
|
|
|
|
INCOME FROM CONTINUING OPERATIONS BEFORE INCOME TAXES |
|
|
53,508 |
|
|
136,704 |
|
|
93,650 |
|
|
181,254 |
|
|
|
|
|
|
|
|
|
|
|
|
|
|
|
INCOME TAX PROVISION |
|
|
14,234 |
|
|
36,390 |
|
|
25,436 |
|
|
36,928 |
|
|
|
|
|
|
|
|
|
|
|
|
|
|
|
NET INCOME FROM CONTINUING OPERATIONS |
|
|
39,274 |
|
|
100,314 |
|
|
68,214 |
|
|
144,326 |
|
|
|
|
|
|
|
|
|
|
|
|
|
|
|
INCOME FROM DISCONTINUED OPERATIONS, net of tax(1) |
|
|
— |
|
|
— |
|
|
— |
|
|
600 |
|
|
|
|
|
|
|
|
|
|
|
|
|
|
|
NET INCOME |
|
$ |
39,274 |
|
$ |
100,314 |
|
$ |
68,214 |
|
$ |
144,926 |
|
|
|
|
|
|
|
|
|
|
|
|
|
|
|
BASIC EARNINGS PER COMMON SHARE(2) |
|
|
|
|
|
|
|
|
|
|
|
|
|
Continuing operations |
|
$ |
1.73 |
|
$ |
4.25 |
|
$ |
2.97 |
|
$ |
6.12 |
|
Discontinued operations(1) |
|
|
— |
|
|
— |
|
|
— |
|
|
0.03 |
|
|
|
$ |
1.73 |
|
$ |
4.25 |
|
$ |
2.97 |
|
$ |
6.14 |
|
|
|
|
|
|
|
|
|
|
|
|
|
|
|
DILUTED EARNINGS PER COMMON SHARE(2) |
|
|
|
|
|
|
|
|
|
|
|
|
|
Continuing operations |
|
$ |
1.72 |
|
$ |
4.23 |
|
$ |
2.96 |
|
$ |
6.03 |
|
Discontinued operations(1) |
|
|
— |
|
|
— |
|
|
— |
|
|
0.03 |
|
|
|
$ |
1.72 |
|
$ |
4.23 |
|
$ |
2.96 |
|
$ |
6.06 |
|
|
|
|
|
|
|
|
|
|
|
|
|
|
|
AVERAGE COMMON SHARES OUTSTANDING |
|
|
|
|
|
|
|
|
|
|
|
|
|
Basic |
|
|
22,718,292 |
|
|
23,624,761 |
|
|
22,952,014 |
|
|
23,601,548 |
|
Diluted |
|
|
22,811,670 |
|
|
23,690,120 |
|
|
23,037,638 |
|
|
23,923,047 |
|
| 1) | Represents adjustments related to the gain on sale of FleetNet America® (“FleetNet”), which sold on February 28, 2023. |
| 2) | Earnings per common share is calculated in total and may not equal the sum of earnings per common share from continuing operations and discontinued operations due to rounding. |
4
ARCBEST CORPORATION
CONSOLIDATED BALANCE SHEETS
|
|
September 30 |
|
December 31 |
|
||
|
|
2025 |
|
2024 |
|
||
|
|
(Unaudited) |
|
||||
|
|
($ thousands, except share data) |
|
||||
ASSETS |
|
|
|
|
|
|
|
CURRENT ASSETS |
|
|
|
|
|
|
|
Cash and cash equivalents |
|
$ |
120,604 |
|
$ |
127,444 |
|
Short-term investments |
|
|
12,023 |
|
|
29,759 |
|
Accounts receivable, less allowances (2025 - $8,372; 2024 - $8,257) |
|
|
408,610 |
|
|
394,838 |
|
Other accounts receivable, less allowances (2025 - $648; 2024 - $648) |
|
|
23,538 |
|
|
36,055 |
|
Prepaid expenses |
|
|
35,365 |
|
|
47,860 |
|
Prepaid and refundable income taxes |
|
|
46,066 |
|
|
28,641 |
|
Other |
|
|
10,925 |
|
|
11,045 |
|
TOTAL CURRENT ASSETS |
|
|
657,131 |
|
|
675,642 |
|
|
|
|
|
|
|
|
|
PROPERTY, PLANT AND EQUIPMENT |
|
|
|
|
|
|
|
Land and structures |
|
|
550,883 |
|
|
520,119 |
|
Revenue equipment |
|
|
1,223,311 |
|
|
1,166,161 |
|
Service, office, and other equipment |
|
|
362,243 |
|
|
351,907 |
|
Software |
|
|
187,197 |
|
|
182,396 |
|
Leasehold improvements |
|
|
37,175 |
|
|
32,263 |
|
|
|
|
2,360,809 |
|
|
2,252,846 |
|
Less allowances for depreciation and amortization |
|
|
1,210,512 |
|
|
1,186,800 |
|
PROPERTY, PLANT AND EQUIPMENT, net |
|
|
1,150,297 |
|
|
1,066,046 |
|
|
|
|
|
|
|
|
|
GOODWILL |
|
|
304,753 |
|
|
304,753 |
|
INTANGIBLE ASSETS, net |
|
|
79,227 |
|
|
88,615 |
|
OPERATING RIGHT-OF-USE ASSETS |
|
|
226,033 |
|
|
192,753 |
|
DEFERRED INCOME TAXES |
|
|
7,825 |
|
|
9,536 |
|
OTHER LONG-TERM ASSETS |
|
|
75,915 |
|
|
92,386 |
|
TOTAL ASSETS |
|
$ |
2,501,181 |
|
$ |
2,429,731 |
|
|
|
|
|
|
|
|
|
LIABILITIES AND STOCKHOLDERS’ EQUITY |
|
|
|
|
|
|
|
CURRENT LIABILITIES |
|
|
|
|
|
|
|
Accounts payable |
|
$ |
164,266 |
|
$ |
168,943 |
|
Accrued expenses |
|
|
392,088 |
|
|
398,700 |
|
Current portion of long-term debt |
|
|
78,631 |
|
|
63,978 |
|
Current portion of operating lease liabilities |
|
|
35,470 |
|
|
34,364 |
|
TOTAL CURRENT LIABILITIES |
|
|
670,455 |
|
|
665,985 |
|
|
|
|
|
|
|
|
|
LONG-TERM DEBT, less current portion |
|
|
135,469 |
|
|
125,156 |
|
OPERATING LEASE LIABILITIES, less current portion |
|
|
210,958 |
|
|
189,978 |
|
POSTRETIREMENT LIABILITIES, less current portion |
|
|
13,400 |
|
|
13,361 |
|
DEFERRED INCOME TAXES |
|
|
113,999 |
|
|
78,649 |
|
OTHER LONG-TERM LIABILITIES |
|
|
33,982 |
|
|
42,240 |
|
|
|
|
|
|
|
|
|
STOCKHOLDERS’ EQUITY |
|
|
|
|
|
|
|
Common stock, $0.01 par value, authorized 70,000,000 shares; |
|
|
305 |
|
|
304 |
|
Additional paid-in capital |
|
|
336,484 |
|
|
329,575 |
|
Retained earnings |
|
|
1,495,194 |
|
|
1,435,250 |
|
Treasury stock, at cost, 2025: 7,892,752 shares; 2024: 7,114,844 shares |
|
|
(509,169) |
|
|
(451,039) |
|
Accumulated other comprehensive income |
|
|
104 |
|
|
272 |
|
TOTAL STOCKHOLDERS’ EQUITY |
|
|
1,322,918 |
|
|
1,314,362 |
|
TOTAL LIABILITIES AND STOCKHOLDERS' EQUITY |
|
$ |
2,501,181 |
|
$ |
2,429,731 |
|
5
ARCBEST CORPORATION
CONSOLIDATED STATEMENTS OF CASH FLOWS
|
|
Nine Months Ended |
|
||||
|
|
September 30 |
|
||||
|
|
2025 |
|
2024 |
|
||
|
|
(Unaudited) |
|
||||
|
|
($ thousands) |
|
||||
OPERATING ACTIVITIES |
|
|
|
|
|
|
|
Net income |
|
$ |
68,214 |
|
$ |
144,926 |
|
Adjustments to reconcile net income to net cash provided by operating activities: |
|
|
|
|
|
|
|
Depreciation and amortization |
|
|
115,690 |
|
|
100,104 |
|
Amortization of intangibles |
|
|
9,600 |
|
|
9,616 |
|
Share-based compensation expense |
|
|
8,904 |
|
|
9,040 |
|
Provision for losses on accounts receivable |
|
|
2,386 |
|
|
2,038 |
|
Change in deferred income taxes |
|
|
37,117 |
|
|
10,547 |
|
Gain on sale of property and equipment |
|
|
(15,684) |
|
|
(1,063) |
|
Pre-tax gain on sale of discontinued operations |
|
|
— |
|
|
(806) |
|
Change in fair value of contingent consideration |
|
|
(2,650) |
|
|
(80,740) |
|
Change in fair value of equity investment |
|
|
— |
|
|
28,739 |
|
Changes in operating assets and liabilities: |
|
|
|
|
|
|
|
Receivables |
|
|
(2,931) |
|
|
44,344 |
|
Prepaid expenses |
|
|
12,495 |
|
|
4,634 |
|
Other assets |
|
|
(4,994) |
|
|
(3,364) |
|
Income taxes |
|
|
(17,320) |
|
|
(2,870) |
|
Operating right-of-use assets and lease liabilities, net |
|
|
(11,194) |
|
|
(7,088) |
|
Accounts payable, accrued expenses, and other liabilities |
|
|
(15,342) |
|
|
(29,009) |
|
NET CASH PROVIDED BY OPERATING ACTIVITIES |
|
|
184,291 |
|
|
229,048 |
|
|
|
|
|
|
|
|
|
INVESTING ACTIVITIES |
|
|
|
|
|
|
|
Purchases of property, plant and equipment, net of financings |
|
|
(107,005) |
|
|
(169,839) |
|
Proceeds from sale of property and equipment |
|
|
32,518 |
|
|
6,187 |
|
Purchases of short-term investments |
|
|
(12,000) |
|
|
(29,236) |
|
Proceeds from sale of short-term investments |
|
|
30,226 |
|
|
55,874 |
|
Capitalization of internally developed software |
|
|
(9,958) |
|
|
(12,437) |
|
Other investing activities |
|
|
8,756 |
|
|
— |
|
NET CASH USED IN INVESTING ACTIVITIES |
|
|
(57,463) |
|
|
(149,451) |
|
|
|
|
|
|
|
|
|
FINANCING ACTIVITIES |
|
|
|
|
|
|
|
Borrowings under credit facilities |
|
|
25,000 |
|
|
— |
|
Payments on long-term debt |
|
|
(87,275) |
|
|
(102,366) |
|
Net change in book overdrafts |
|
|
(2,887) |
|
|
(1,676) |
|
Deferred financing costs |
|
|
(112) |
|
|
(65) |
|
Payment of common stock dividends |
|
|
(8,270) |
|
|
(8,485) |
|
Purchases of treasury stock |
|
|
(58,130) |
|
|
(56,108) |
|
Payments for tax withheld on share-based compensation |
|
|
(1,994) |
|
|
(22,662) |
|
NET CASH USED IN FINANCING ACTIVITIES |
|
|
(133,668) |
|
|
(191,362) |
|
|
|
|
|
|
|
|
|
NET DECREASE IN CASH AND CASH EQUIVALENTS |
|
|
(6,840) |
|
|
(111,765) |
|
Cash and cash equivalents at beginning of period |
|
|
127,444 |
|
|
262,226 |
|
CASH AND CASH EQUIVALENTS AT END OF PERIOD |
|
$ |
120,604 |
|
$ |
150,461 |
|
|
|
|
|
|
|
|
|
NONCASH INVESTING ACTIVITIES |
|
|
|
|
|
|
|
Equipment financed |
|
$ |
87,241 |
|
$ |
53,939 |
|
Accruals for equipment received |
|
$ |
1,333 |
|
$ |
5,114 |
|
Lease liabilities arising from obtaining right-of-use assets |
|
$ |
47,306 |
|
$ |
40,872 |
|
6
ARCBEST CORPORATION
FINANCIAL STATEMENT OPERATING SEGMENT DATA AND OPERATING RATIOS
|
Three Months Ended |
|
|
Nine Months Ended |
|
||||||||||||||||||
|
September 30 |
|
|
September 30 |
|
||||||||||||||||||
|
2025 |
|
|
2024 |
|
|
2025 |
|
|
2024 |
|
||||||||||||
|
(Unaudited) |
|
|||||||||||||||||||||
|
($ thousands, except percentages) |
|
|||||||||||||||||||||
REVENUES FROM CONTINUING OPERATIONS |
|
|
|
|
|
|
|
|
|
|
|
|
|
|
|
|
|
|
|
|
|
|
|
Asset-Based |
$ |
726,475 |
|
|
|
|
$ |
709,722 |
|
|
|
|
$ |
2,086,081 |
|
|
|
|
$ |
2,093,914 |
|
|
|
Asset-Light |
|
355,969 |
|
|
|
|
|
385,324 |
|
|
|
|
|
1,053,903 |
|
|
|
|
|
1,177,504 |
|
|
|
Other and eliminations |
|
(34,307) |
|
|
|
|
|
(31,922) |
|
|
|
|
|
(102,514) |
|
|
|
|
|
(94,044) |
|
|
|
Total consolidated revenues from continuing operations |
$ |
1,048,137 |
|
|
|
|
$ |
1,063,124 |
|
|
|
|
$ |
3,037,470 |
|
|
|
|
$ |
3,177,374 |
|
|
|
|
|
|
|
|
|
|
|
|
|
|
|
|
|
|
|
|
|
|
|
|
|
|
|
OPERATING EXPENSES FROM CONTINUING OPERATIONS |
|
|
|
|
|
|
|
|
|
|
|
|
|
|
|
||||||||
Asset-Based |
|
|
|
|
|
|
|
|
|
|
|
|
|
|
|
|
|
|
|
|
|
|
|
Salaries, wages, and benefits |
$ |
370,164 |
|
51.0 |
% |
|
$ |
358,469 |
|
50.5 |
% |
|
$ |
1,080,234 |
|
51.8 |
% |
|
$ |
1,056,146 |
|
50.4 |
% |
Fuel, supplies, and expenses |
|
81,861 |
|
11.3 |
|
|
|
79,170 |
|
11.2 |
|
|
|
239,337 |
|
11.5 |
|
|
|
243,152 |
|
11.6 |
|
Operating taxes and licenses |
|
13,373 |
|
1.8 |
|
|
|
13,538 |
|
1.9 |
|
|
|
40,330 |
|
1.9 |
|
|
|
40,624 |
|
1.9 |
|
Insurance |
|
18,560 |
|
2.5 |
|
|
|
19,819 |
|
2.8 |
|
|
|
54,176 |
|
2.6 |
|
|
|
51,265 |
|
2.4 |
|
Communications and utilities |
|
5,166 |
|
0.7 |
|
|
|
4,793 |
|
0.6 |
|
|
|
16,126 |
|
0.8 |
|
|
|
14,004 |
|
0.7 |
|
Depreciation and amortization |
|
35,054 |
|
4.8 |
|
|
|
26,967 |
|
3.8 |
|
|
|
97,308 |
|
4.7 |
|
|
|
80,620 |
|
3.9 |
|
Rents and purchased transportation |
|
81,142 |
|
11.2 |
|
|
|
73,600 |
|
10.4 |
|
|
|
224,501 |
|
10.8 |
|
|
|
209,586 |
|
10.0 |
|
Shared services |
|
66,892 |
|
9.2 |
|
|
|
69,463 |
|
9.8 |
|
|
|
199,203 |
|
9.5 |
|
|
|
206,622 |
|
9.9 |
|
Gain on sale of property and equipment(1) |
|
(15,874) |
|
(2.2) |
|
|
|
(1,688) |
|
(0.2) |
|
|
|
(16,010) |
|
(0.8) |
|
|
|
(1,630) |
|
(0.1) |
|
Other |
|
(25) |
|
— |
|
|
|
1,571 |
|
0.2 |
|
|
|
3,268 |
|
0.1 |
|
|
|
3,257 |
|
0.2 |
|
Total Asset-Based |
|
656,313 |
|
90.3 |
% |
|
|
645,702 |
|
91.0 |
% |
|
|
1,938,473 |
|
92.9 |
% |
|
|
1,903,646 |
|
90.9 |
% |
|
|
|
|
|
|
|
|
|
|
|
|
|
|
|
|
|
|
|
|
|
|
|
|
Asset-Light |
|
|
|
|
|
|
|
|
|
|
|
|
|
|
|
|
|
|
|
|
|
|
|
Purchased transportation |
$ |
302,309 |
|
84.9 |
% |
|
$ |
331,107 |
|
85.9 |
% |
|
$ |
895,503 |
|
85.0 |
% |
|
$ |
1,014,476 |
|
86.2 |
% |
Salaries, wages, and benefits |
|
24,913 |
|
7.0 |
|
|
|
30,150 |
|
7.8 |
|
|
|
76,091 |
|
7.2 |
|
|
|
91,490 |
|
7.8 |
|
Supplies and expenses |
|
1,970 |
|
0.6 |
|
|
|
2,702 |
|
0.7 |
|
|
|
5,448 |
|
0.5 |
|
|
|
8,279 |
|
0.7 |
|
Depreciation and amortization(2) |
|
4,647 |
|
1.3 |
|
|
|
5,037 |
|
1.3 |
|
|
|
13,870 |
|
1.3 |
|
|
|
15,154 |
|
1.3 |
|
Shared services |
|
18,657 |
|
5.2 |
|
|
|
17,547 |
|
4.6 |
|
|
|
55,232 |
|
5.2 |
|
|
|
51,118 |
|
4.3 |
|
Contingent consideration(3) |
|
— |
|
— |
|
|
|
(91,910) |
|
(23.9) |
|
|
|
(2,650) |
|
(0.2) |
|
|
|
(80,740) |
|
(6.9) |
|
Other |
|
5,068 |
|
1.4 |
|
|
|
5,912 |
|
1.6 |
|
|
|
15,793 |
|
1.5 |
|
|
|
17,704 |
|
1.5 |
|
Total Asset-Light |
|
357,564 |
|
100.4 |
% |
|
|
300,545 |
|
78.0 |
% |
|
|
1,059,287 |
|
100.5 |
% |
|
|
1,117,481 |
|
94.9 |
% |
|
|
|
|
|
|
|
|
|
|
|
|
|
|
|
|
|
|
|
|
|
|
|
|
Other and eliminations(4) |
|
(20,367) |
|
|
|
|
|
(18,116) |
|
|
|
|
|
(58,856) |
|
|
|
|
|
(50,026) |
|
|
|
Total consolidated operating expenses from continuing operations |
$ |
993,510 |
|
94.8 |
% |
|
$ |
928,131 |
|
87.3 |
% |
|
$ |
2,938,904 |
|
96.8 |
% |
|
$ |
2,971,101 |
|
93.5 |
% |
|
|
|
|
|
|
|
|
|
|
|
|
|
|
|
|
|
|
|
|
|
|
|
|
OPERATING INCOME (LOSS) FROM CONTINUING OPERATIONS |
|
|
|
|
|
|
|
|
|
|
|
|
|
|
|
||||||||
Asset-Based |
$ |
70,162 |
|
|
|
|
$ |
64,020 |
|
|
|
|
$ |
147,608 |
|
|
|
|
$ |
190,268 |
|
|
|
Asset-Light |
|
(1,595) |
|
|
|
|
|
84,779 |
|
|
|
|
|
(5,384) |
|
|
|
|
|
60,023 |
|
|
|
Other and eliminations(4) |
|
(13,940) |
|
|
|
|
|
(13,806) |
|
|
|
|
|
(43,658) |
|
|
|
|
|
(44,018) |
|
|
|
Total consolidated operating income from continuing operations |
$ |
54,627 |
|
|
|
|
$ |
134,993 |
|
|
|
|
$ |
98,566 |
|
|
|
|
$ |
206,273 |
|
|
|
| 1) | The 2025 periods include a net gain of $15.7 million, primarily related to two service center sales during third quarter 2025. |
| 2) | Includes amortization of intangibles associated with acquired businesses. |
| 3) | Represents the change in fair value of the contingent earnout consideration recorded for the MoLo acquisition. The liability for contingent consideration is remeasured at each quarterly reporting date, and any change in fair value as a result of the recurring assessments is recognized in operating income (loss). The Company reduced the contingent consideration for the MoLo acquisition to zero in second quarter 2025, reflecting the probability of no earnout payment based on projections of adjusted earnings before interest, taxes, depreciation, and amortization for 2025. |
| 4) | “Other and eliminations” includes corporate costs for certain unallocated shared service costs which are not attributable to any segment, additional investments to offer comprehensive transportation and logistics services across multiple operating segments, costs related to our customer pilot offering of Vaux, and other investments in ArcBest technology and innovations. |
7
ARCBEST CORPORATION
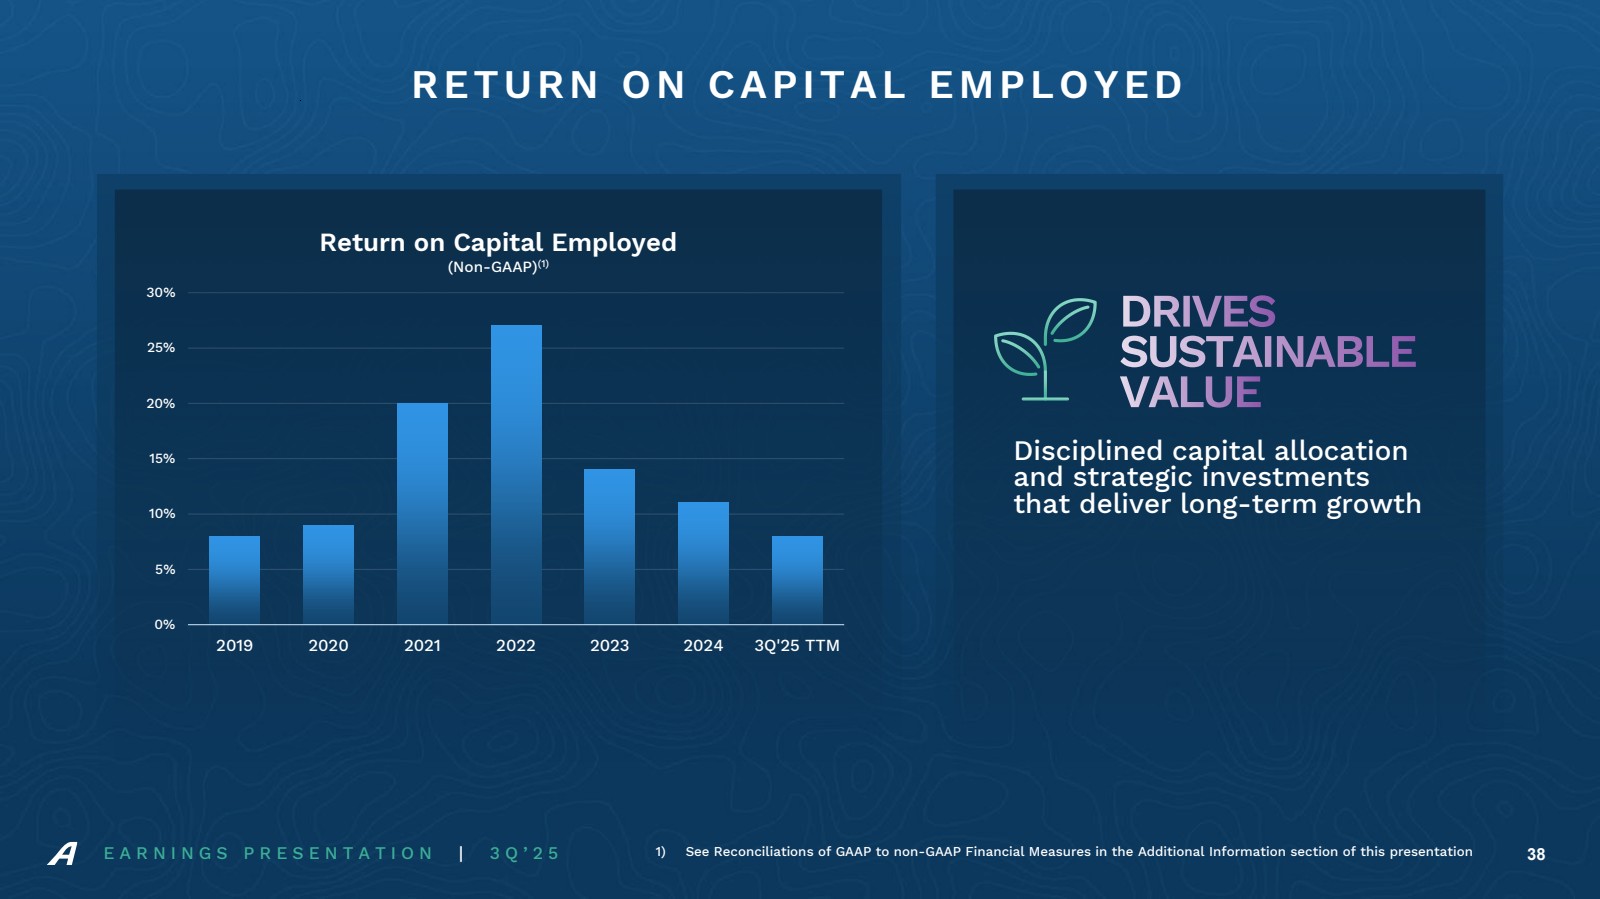
RECONCILIATIONS OF GAAP TO NON-GAAP FINANCIAL MEASURES
Non-GAAP Financial Measures
We report our financial results in accordance with U.S. generally accepted accounting principles (“GAAP”). However, management believes that certain non-GAAP performance measures and ratios utilized for internal analysis provide analysts, investors, and others the same information that we use internally for purposes of assessing our core operating performance and provides meaningful comparisons between current and prior period results, as well as important information regarding performance trends. Accordingly, non-GAAP results are presented on a continuing operations basis, excluding the discontinued operations of FleetNet, which sold on February 28, 2023. The use of certain non-GAAP measures improves comparability in analyzing our performance because it removes the impact of items from operating results that, in management's opinion, do not reflect our core operating performance. Other companies may calculate non-GAAP measures differently; therefore, our calculation may not be comparable to similarly titled measures of other companies. Certain information discussed in the scheduled conference call could be considered non-GAAP measures. Non-GAAP financial measures should be viewed in addition to, and not as an alternative for, our reported results. These financial measures should not be construed as better measurements than operating income, net income or earnings per share, as determined under GAAP.
|
|
Three Months Ended |
|
Nine Months Ended |
|||||||||
|
|
September 30 |
|
September 30 |
|
||||||||
|
|
2025 |
|
2024 |
|
2025 |
|
2024 |
|
||||
ArcBest Corporation — Consolidated |
|
(Unaudited) |
|
||||||||||
|
|
($ thousands, except per share data) |
|
||||||||||
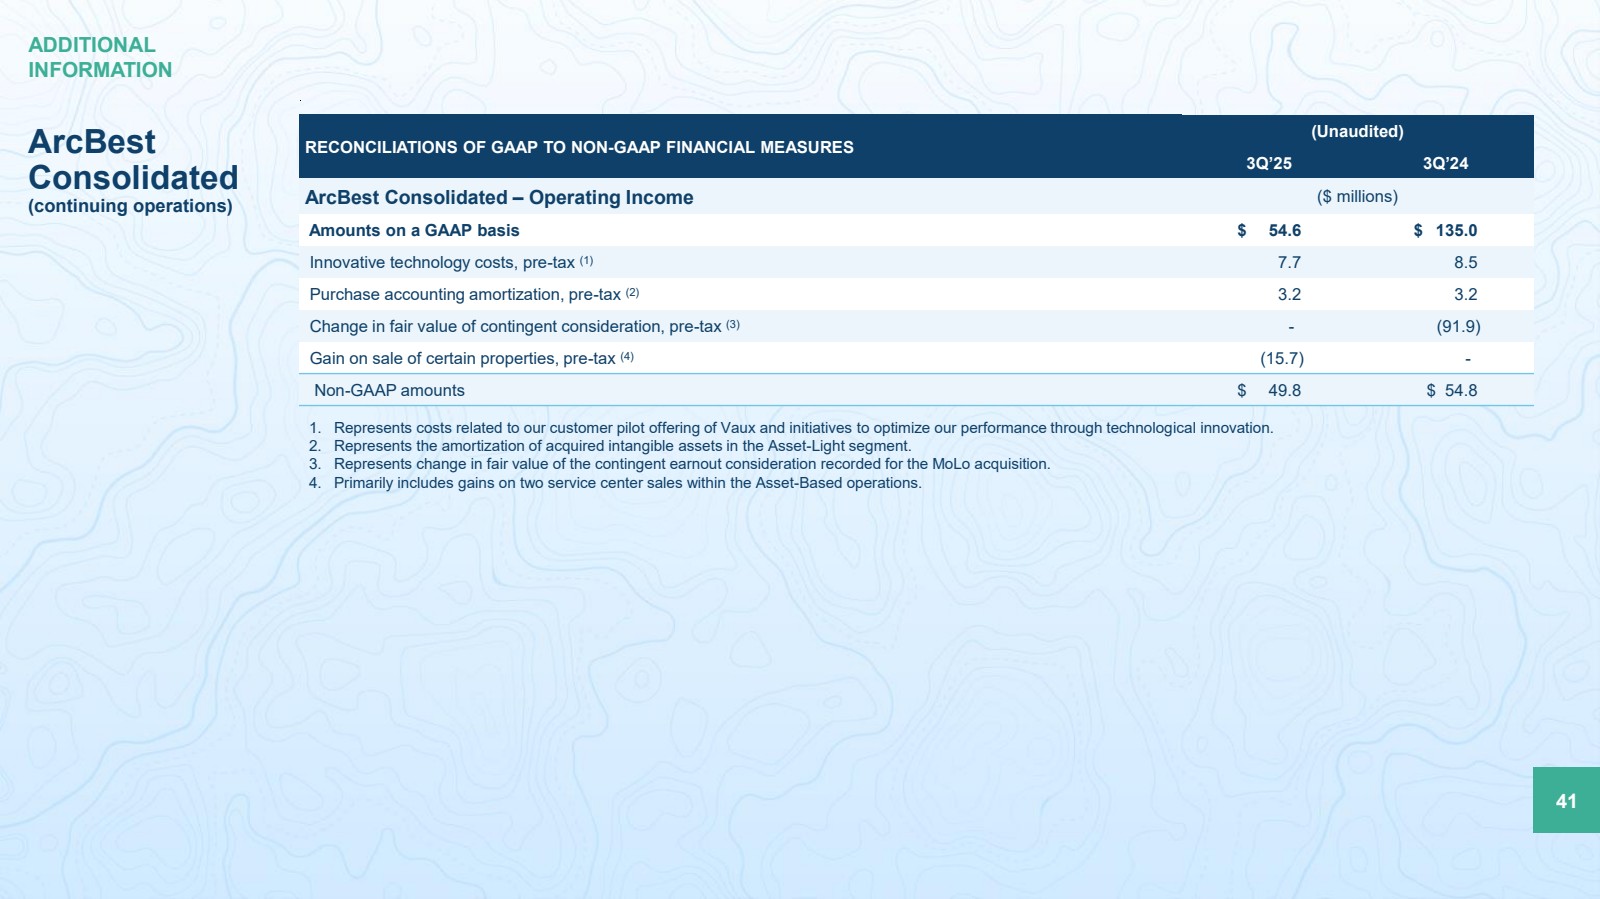
Operating Income from Continuing Operations |
|
|
|
|
|
|
|
|
|
|
|
|
|
Amounts on GAAP basis |
|
$ |
54,627 |
|
$ |
134,993 |
|
$ |
98,566 |
|
$ |
206,273 |
|
Innovative technology costs, pre-tax(1) |
|
|
7,713 |
|
|
8,512 |
|
|
22,349 |
|
|
26,521 |
|
Purchase accounting amortization, pre-tax(2) |
|
|
3,192 |
|
|
3,192 |
|
|
9,576 |
|
|
9,576 |
|
Change in fair value of contingent consideration, pre-tax(3) |
|
|
— |
|
|
(91,910) |
|
|
(2,650) |
|
|
(80,740) |
|
Gain on sale of certain properties, pre-tax(4) |
|
|
(15,726) |
|
|
— |
|
|
(15,726) |
|
|
— |
|
Non-GAAP amounts |
|
$ |
49,806 |
|
$ |
54,787 |
|
$ |
112,115 |
|
$ |
161,630 |
|
|
|
|
|
|
|
|
|
|
|
|
|
|
|
Net Income from Continuing Operations |
|
|
|
|
|
|
|
|
|
|
|
|
|
Amounts on GAAP basis |
|
$ |
39,274 |
|
$ |
100,314 |
|
$ |
68,214 |
|
$ |
144,326 |
|
Innovative technology costs, after-tax (includes related financing costs)(1) |
|
|
5,862 |
|
|
6,511 |
|
|
17,014 |
|
|
20,331 |
|
Purchase accounting amortization, after-tax(2) |
|
|
2,399 |
|
|
2,401 |
|
|
7,195 |
|
|
7,202 |
|
Change in fair value of contingent consideration, after-tax(3) |
|
|
— |
|
|
(69,124) |
|
|
(1,991) |
|
|
(60,723) |
|
Gain on sale of certain properties, after-tax(4) |
|
|
(11,778) |
|
|
— |
|
|
(11,778) |
|
|
— |
|
Change in fair value of equity investment, after-tax(5) |
|
|
— |
|
|
— |
|
|
— |
|
|
21,603 |
|
Changes in cash surrender value and gains on life insurance policies |
|
|
(2,348) |
|
|
(1,333) |
|
|
(3,089) |
|
|
(3,006) |
|
Tax expense (benefit) from vested RSUs(6) |
|
|
8 |
|
|
(9) |
|
|
1,000 |
|
|
(11,273) |
|
Non-GAAP amounts |
|
$ |
33,417 |
|
$ |
38,760 |
|
$ |
76,565 |
|
$ |
118,460 |
|
|
|
|
|
|
|
|
|
|
|
|
|
|
|
Diluted Earnings Per Share from Continuing Operations |
|
|
|
|
|
|
|
|
|
|
|
|
|
Amounts on GAAP basis |
|
$ |
1.72 |
|
$ |
4.23 |
|
$ |
2.96 |
|
$ |
6.03 |
|
Innovative technology costs, after-tax (includes related financing costs)(1) |
|
|
0.26 |
|
|
0.27 |
|
|
0.74 |
|
|
0.85 |
|
Purchase accounting amortization, after-tax(2) |
|
|
0.11 |
|
|
0.10 |
|
|
0.31 |
|
|
0.30 |
|
Change in fair value of contingent consideration, after-tax(3) |
|
|
— |
|
|
(2.92) |
|
|
(0.09) |
|
|
(2.54) |
|
Gain on sale of certain properties, after-tax(4) |
|
|
(0.52) |
|
|
— |
|
|
(0.51) |
|
|
— |
|
Change in fair value of equity investment, after-tax(5) |
|
|
— |
|
|
— |
|
|
— |
|
|
0.90 |
|
Changes in cash surrender value and gains on life insurance policies |
|
|
(0.10) |
|
|
(0.06) |
|
|
(0.13) |
|
|
(0.13) |
|
Tax expense (benefit) from vested RSUs(6) |
|
|
— |
|
|
— |
|
|
0.04 |
|
|
(0.47) |
|
Non-GAAP amounts(7) |
|
$ |
1.46 |
|
$ |
1.64 |
|
$ |
3.32 |
|
$ |
4.95 |
|
See “Notes to Non-GAAP Financial Tables” for footnotes to this ArcBest Corporation – Consolidated non-GAAP table.
8
ARCBEST CORPORATION
RECONCILIATIONS OF GAAP TO NON-GAAP FINANCIAL MEASURES – Continued
|
Three Months Ended |
|
Nine Months Ended |
|
||||||||||||||||||||
|
September 30 |
|
September 30 |
|
||||||||||||||||||||
|
2025 |
|
2024 |
|
2025 |
|
2024 |
|
||||||||||||||||
Segment Operating Income (Loss) Reconciliations |
(Unaudited) |
|
||||||||||||||||||||||
|
|
|
||||||||||||||||||||||
Asset-Based Segment |
|
|
|
|
||||||||||||||||||||
Operating Income ($) and Operating Ratio (% of revenues) |
|
|
|
|
|
|
|
|
|
|
|
|
|
|
|
|||||||||
Amounts on GAAP basis |
$ |
70,162 |
|
90.3 |
% |
|
$ |
64,020 |
|
91.0 |
% |
|
$ |
147,608 |
|
92.9 |
% |
|
$ |
190,268 |
|
90.9 |
% |
|
Gain on sale of certain properties, pre-tax(4) |
|
(15,726) |
|
2.2 |
|
|
|
— |
|
— |
|
|
|
(15,726) |
|
0.8 |
|
|
|
— |
|
— |
|
|
Non-GAAP amounts(7) |
$ |
54,436 |
|
92.5 |
% |
|
$ |
64,020 |
|
91.0 |
% |
|
$ |
131,882 |
|
93.7 |
% |
|
$ |
190,268 |
|
90.9 |
% |
|
|
|
|
|
|
|
|
|
|
|
|
|
|
|
|
|
|
|
|
|
|
|
|
|
|
Asset-Light |
|
|
|
|
||||||||||||||||||||
|
|
|
|
|
||||||||||||||||||||
Asset-Light Segment |
|
|
|
|
|
|
|
|
|
|
|
|
|
|
|
|
|
|
|
|
|
|
|
|
Operating Income (Loss) ($) and Operating Ratio (% of revenues) |
|
|
|
|
|
|
|
|
|
|
|
|
|
|
|
|||||||||
Amounts on GAAP basis |
$ |
(1,595) |
|
100.4 |
% |
|
$ |
84,779 |
|
78.0 |
% |
|
$ |
(5,384) |
|
100.5 |
% |
|
$ |
60,023 |
|
94.9 |
% |
|
Purchase accounting amortization, pre-tax(2) |
|
3,192 |
|
(0.9) |
|
|
|
3,192 |
|
(0.8) |
|
|
|
9,576 |
|
(0.9) |
|
|
|
9,576 |
|
(0.8) |
|
|
Change in fair value of contingent consideration, pre-tax(3) |
|
— |
|
— |
|
|
|
(91,910) |
|
23.9 |
|
|
|
(2,650) |
|
0.2 |
|
|
|
(80,740) |
|
6.9 |
|
|
Non-GAAP amounts(7) |
$ |
1,597 |
|
99.6 |
% |
|
$ |
(3,939) |
|
101.0 |
% |
|
$ |
1,542 |
|
99.9 |
% |
|
$ |
(11,141) |
|
100.9 |
% |
|
|
|
|
|
|
|
|
|
|
|
|
|
|
|
|
|
|
|
|
|
|
|
|
|
|
Other and Eliminations |
|
|
|
|
|
|
|
|
|
|
|
|
|
|
|
|
|
|
|
|
|
|
|
|
Operating Loss ($) |
|
|
|
|
|
|
|
|
|
|
|
|
|
|
|
|
||||||||
Amounts on GAAP basis |
$ |
(13,940) |
|
|
|
|
$ |
(13,806) |
|
|
|
|
$ |
(43,658) |
|
|
|
|
$ |
(44,018) |
|
|
|
|
Innovative technology costs, pre-tax(1) |
|
7,713 |
|
|
|
|
|
8,512 |
|
|
|
|
|
22,349 |
|
|
|
|
|
26,521 |
|
|
|
|
Non-GAAP amounts |
$ |
(6,227) |
|
|
|
|
$ |
(5,294) |
|
|
|
|
$ |
(21,309) |
|
|
|
|
$ |
(17,497) |
|
|
|
|
Note: See “Notes to Non-GAAP Financial Tables” for footnotes to this Segment Operating Income (Loss) Reconciliations non-GAAP table.
9
ARCBEST CORPORATION
RECONCILIATIONS OF GAAP TO NON-GAAP FINANCIAL MEASURES – Continued
Effective Tax Rate Reconciliation |
|
|
|
|
|
|
|
|
|
|
|
|
|
|
||||
ArcBest Corporation - Consolidated |
|
|
|
|
|
|
|
|
|
|
|
|
|
|
|
|
|
|
|
|
|
|
|
|
|
|
|
|
|
|
|
|
|
|
|
|
|
(Unaudited) |
|
|
|
|
|
|
|
|
|
|
|
|
|
|
|
|
|
|
($ thousands, except percentages) |
|
Three Months Ended September 30, 2025 |
||||||||||||||||
|
|
|
|
|
Other |
|
Income |
|
Income |
|
|
|
|
|
||||
CONTINUING OPERATIONS |
|
Operating |
|
Income |
|
Before Income |
|
Tax |
|
Net |
|
|
||||||
|
|
Income |
|
(Costs) |
|
Taxes |
|
Provision |
|
Income |
|
Tax Rate(8) |
||||||
Amounts on GAAP basis |
|
$ |
54,627 |
|
$ |
(1,119) |
|
$ |
53,508 |
|
$ |
14,234 |
|
$ |
39,274 |
|
26.6 |
% |
Innovative technology costs(1) |
|
|
7,713 |
|
|
81 |
|
|
7,794 |
|
|
1,932 |
|
|
5,862 |
|
24.8 |
|
Purchase accounting amortization(2) |
|
|
3,192 |
|
|
— |
|
|
3,192 |
|
|
793 |
|
|
2,399 |
|
24.9 |
|
Gain on sale of certain properties(4) |
|
|
(15,726) |
|
|
— |
|
|
(15,726) |
|
|
(3,948) |
|
|
(11,778) |
|
(25.1) |
|
Changes in cash surrender value and gains on life insurance policies |
|
|
— |
|
|
(2,348) |
|
|
(2,348) |
|
|
— |
|
|
(2,348) |
|
— |
|
Tax expense from vested RSUs(6) |
|
|
— |
|
|
— |
|
|
— |
|
|
(8) |
|
|
8 |
|
— |
|
Non-GAAP amounts |
|
$ |
49,806 |
|
$ |
(3,386) |
|
$ |
46,420 |
|
$ |
13,003 |
|
$ |
33,417 |
|
28.0 |
% |
|
|
Nine Months Ended September 30, 2025 |
||||||||||||||||
|
|
|
|
Other |
|
Income |
|
Income |
|
|
|
|
|
|
||||
|
|
Operating |
|
Income |
|
Before Income |
|
Tax |
|
Net |
|
|
||||||
|
|
Income |
|
(Costs) |
|
Taxes |
|
Provision |
|
Income |
|
Tax Rate(8) |
||||||
Amounts on GAAP basis |
|
$ |
98,566 |
|
$ |
(4,916) |
|
$ |
93,650 |
|
$ |
25,436 |
|
$ |
68,214 |
|
27.2 |
% |
Innovative technology costs(1) |
|
|
22,349 |
|
|
274 |
|
|
22,623 |
|
|
5,609 |
|
|
17,014 |
|
24.8 |
|
Purchase accounting amortization(2) |
|
|
9,576 |
|
|
— |
|
|
9,576 |
|
|
2,381 |
|
|
7,195 |
|
24.9 |
|
Change in fair value of contingent consideration(3) |
|
|
(2,650) |
|
|
— |
|
|
(2,650) |
|
|
(659) |
|
|
(1,991) |
|
(24.9) |
|
Gain on sale of certain properties(4) |
|
|
(15,726) |
|
|
— |
|
|
(15,726) |
|
|
(3,948) |
|
|
(11,778) |
|
(25.1) |
|
Changes in cash surrender value and gains on life insurance policies |
|
|
— |
|
|
(3,089) |
|
|
(3,089) |
|
|
— |
|
|
(3,089) |
|
— |
|
Tax expense from vested RSUs(6) |
|
|
— |
|
|
— |
|
|
— |
|
|
(1,000) |
|
|
1,000 |
|
— |
|
Non-GAAP amounts |
|
$ |
112,115 |
|
$ |
(7,731) |
|
$ |
104,384 |
|
$ |
27,819 |
|
$ |
76,565 |
|
26.7 |
% |
|
|
Three Months Ended September 30, 2024 |
||||||||||||||||
|
|
|
|
Other |
|
Income |
|
Income |
|
|
|
|
|
|||||
CONTINUING OPERATIONS |
|
Operating |
|
Income |
|
Before Income |
|
Tax |
|
Net |
|
|
||||||
|
|
Income |
|
(Costs) |
|
Taxes |
|
Provision |
|
Income |
|
Tax Rate(8) |
||||||
Amounts on GAAP basis |
|
$ |
134,993 |
|
$ |
1,711 |
|
$ |
136,704 |
|
$ |
36,390 |
|
$ |
100,314 |
|
26.6 |
% |
Innovative technology costs(1) |
|
|
8,512 |
|
|
145 |
|
|
8,657 |
|
|
2,146 |
|
|
6,511 |
|
24.8 |
|
Purchase accounting amortization(2) |
|
|
3,192 |
|
|
— |
|
|
3,192 |
|
|
791 |
|
|
2,401 |
|
24.8 |
|
Change in fair value of contingent consideration(3) |
|
|
(91,910) |
|
|
— |
|
|
(91,910) |
|
|
(22,786) |
|
|
(69,124) |
|
(24.8) |
|
Changes in cash surrender value and gains on life insurance policies |
|
|
— |
|
|
(1,333) |
|
|
(1,333) |
|
|
— |
|
|
(1,333) |
|
— |
|
Tax benefit from vested RSUs(6) |
|
|
— |
|
|
— |
|
|
— |
|
|
9 |
|
|
(9) |
|
— |
|
Non-GAAP amounts |
|
$ |
54,787 |
|
$ |
523 |
|
$ |
55,310 |
|
$ |
16,550 |
|
$ |
38,760 |
|
29.9 |
% |
|
|
Nine Months Ended September 30, 2024 |
||||||||||||||||
|
|
|
|
Other |
|
Income |
|
Income |
|
|
|
|
|
|
||||
|
|
Operating |
|
Income |
|
Before Income |
|
Tax |
|
Net |
|
|
||||||
|
|
Income |
|
(Costs) |
|
Taxes |
|
Provision |
|
Income |
|
Tax Rate(8) |
||||||
Amounts on GAAP basis |
|
$ |
206,273 |
|
$ |
(25,019) |
|
$ |
181,254 |
|
$ |
36,928 |
|
$ |
144,326 |
|
20.4 |
% |
Innovative technology costs(1) |
|
|
26,521 |
|
|
512 |
|
|
27,033 |
|
|
6,702 |
|
|
20,331 |
|
24.8 |
|
Purchase accounting amortization(2) |
|
|
9,576 |
|
|
— |
|
|
9,576 |
|
|
2,374 |
|
|
7,202 |
|
24.8 |
|
Change in fair value of contingent consideration(3) |
|
|
(80,740) |
|
|
— |
|
|
(80,740) |
|
|
(20,017) |
|
|
(60,723) |
|
(24.8) |
|
Change in fair value of equity investment(5) |
|
|
— |
|
|
28,739 |
|
|
28,739 |
|
|
7,136 |
|
|
21,603 |
|
24.8 |
|
Changes in cash surrender value and gains on life insurance policies |
|
|
— |
|
|
(3,006) |
|
|
(3,006) |
|
|
— |
|
|
(3,006) |
|
— |
|
Tax benefit from vested RSUs(6) |
|
|
— |
|
|
— |
|
|
— |
|
|
11,273 |
|
|
(11,273) |
|
— |
|
Non-GAAP amounts |
|
$ |
161,630 |
|
$ |
1,226 |
|
$ |
162,856 |
|
$ |
44,396 |
|
$ |
118,460 |
|
27.3 |
% |
Note: See “Notes to Non-GAAP Financial Tables” for footnotes to this Effective Tax Rate Reconciliation non-GAAP table.
10
ARCBEST CORPORATION
RECONCILIATIONS OF GAAP TO NON-GAAP FINANCIAL MEASURES – Continued
Adjusted Earnings Before Interest, Taxes, Depreciation, and Amortization (Adjusted EBITDA)
Management uses Adjusted EBITDA as a key measure of performance and for business planning. The measure is particularly meaningful for analysis of operating performance because it excludes amortization of acquired intangibles and software of the Asset-Light segment and changes in the fair values of contingent consideration and equity investment, which are significant expenses or gains resulting from strategic decisions or other factors rather than core daily operations. Additionally, Adjusted EBITDA is a primary component of the financial covenants contained in our credit agreement. The calculation of Consolidated Adjusted EBITDA as presented below begins with net income from continuing operations, which is the most directly comparable GAAP measure. The calculation of Asset-Light Adjusted EBITDA as presented below begins with operating income (loss), as other income (costs), income tax provision, and net income from continuing operations are reported at the consolidated level and not included in the operating segment financial information evaluated by management to make operating decisions.
|
|
Three Months Ended |
|
Nine Months Ended |
|||||||||
|
|
September 30 |
|
|
September 30 |
|
|||||||
|
|
2025 |
|
2024 |
|
2025 |
|
2024 |
|
||||
|
|
(Unaudited) |
|
||||||||||
|
|
($ thousands) |
|
||||||||||
ArcBest Corporation - Consolidated Adjusted EBITDA from Continuing Operations |
|
|
|||||||||||
Net Income from Continuing Operations |
|
$ |
39,274 |
|
$ |
100,314 |
|
$ |
68,214 |
|
$ |
144,326 |
|
Interest and other related financing costs |
|
|
3,334 |
|
|
2,281 |
|
|
9,045 |
|
|
6,587 |
|
Income tax provision |
|
|
14,234 |
|
|
36,390 |
|
|
25,436 |
|
|
36,928 |
|
Depreciation and amortization(9) |
|
|
44,400 |
|
|
36,611 |
|
|
125,290 |
|
|
109,720 |
|
Amortization of share-based compensation |
|
|
2,742 |
|
|
2,718 |
|
|
8,904 |
|
|
9,040 |
|
Change in fair value of contingent consideration(3) |
|
|
— |
|
|
(91,910) |
|
|
(2,650) |
|
|
(80,740) |
|
Change in fair value of equity investment(5) |
|
|
— |
|
|
— |
|
|
— |
|
|
28,739 |
|
Consolidated Adjusted EBITDA from Continuing Operations |
|
$ |
103,984 |
|
$ |
86,404 |
|
$ |
234,239 |
|
$ |
254,600 |
|
Note: See “Notes to Non-GAAP Financial Tables” for footnotes to this ArcBest Corporation – Consolidated Adjusted EBITDA from Continuing Operations non-GAAP table.
|
|
Three Months Ended |
|
Nine Months Ended |
|
||||||||
|
|
September 30 |
|
September 30 |
|
||||||||
|
|
2025 |
|
2024 |
|
2025 |
|
2024 |
|
||||
|
|
(Unaudited) |
|
||||||||||
|
|
($ thousands) |
|
||||||||||
Asset-Light Adjusted EBITDA |
|
|
|
|
|
|
|
|
|
|
|
|
|
Operating Income (Loss) |
|
$ |
(1,595) |
|
$ |
84,779 |
|
$ |
(5,384) |
|
$ |
60,023 |
|
Depreciation and amortization(9) |
|
|
4,647 |
|
|
5,037 |
|
|
13,870 |
|
|
15,154 |
|
Change in fair value of contingent consideration(3) |
|
|
— |
|
|
(91,910) |
|
|
(2,650) |
|
|
(80,740) |
|
Asset-Light Adjusted EBITDA |
|
$ |
3,052 |
|
$ |
(2,094) |
|
$ |
5,836 |
|
$ |
(5,563) |
|
Note: See “Notes to Non-GAAP Financial Tables” for footnotes to this Asset-Light Adjusted EBITDA non-GAAP table.
11
ARCBEST CORPORATION
RECONCILIATIONS OF GAAP TO NON-GAAP FINANCIAL MEASURES – Continued
Notes to Non-GAAP Financial Tables
The following footnotes apply to the non-GAAP financial tables presented in this press release.
| 1) | Represents costs related to our customer pilot offering of Vaux and initiatives to optimize our performance through technological innovation. |
| 2) | Represents the amortization of acquired intangible assets in the Asset-Light segment. |
| 3) | Represents change in fair value of the contingent earnout consideration recorded for the MoLo acquisition, as previously described in the footnotes to the Financial Statement Operating Segment Data and Operating Ratios table. |
| 4) | Primarily includes gains on two service center sales within the Asset-Based operations. |
| 5) | Represents a noncash impairment charge to write off an equity investment in Phantom Auto, a provider of human-centered remote operation software, which ceased operations during first quarter 2024. |
| 6) | Represents recognition of the tax impact for vesting of share-based compensation. |
| 7) | Non-GAAP amounts are calculated in total and may not equal the sum of GAAP amounts and non-GAAP adjustments due to rounding. |
| 8) | Tax rate for total “Amounts on GAAP basis” represents the effective tax rate. The tax effects of non-GAAP adjustments are calculated based on the statutory rate applicable to each item based on tax jurisdiction unless the nature of the item requires the tax effect to be estimated by applying a specific tax treatment. |
| 9) | Includes amortization of intangibles associated with acquired businesses. |
12
ARCBEST CORPORATION
OPERATING STATISTICS
|
|
Three Months Ended |
|
|
Nine Months Ended |
|
||||||||||||
|
|
September 30 |
|
|
September 30 |
|
||||||||||||
|
|
2025 |
|
2024 |
|
% Change |
|
|
2025 |
|
2024 |
|
% Change |
|
||||
|
|
(Unaudited) |
|
|||||||||||||||
Asset-Based |
|
|
|
|
|
|
|
|
|
|
|
|
|
|
|
|
|
|
|
|
|
|
|
|
|
|
|
|
|
|
|
|
|
|
|
|
|
Workdays |
|
|
64.0 |
|
|
63.5 |
|
|
|
|
|
190.5 |
|
|
191.0 |
|
|
|
|
|
|
|
|
|
|
|
|
|
|
|
|
|
|
|
|
|
|
Billed Revenue(1) / CWT |
|
$ |
50.19 |
|
$ |
50.76 |
|
(1.1%) |
|
|
$ |
49.37 |
|
$ |
49.81 |
|
(0.9%) |
|
|
|
|
|
|
|
|
|
|
|
|
|
|
|
|
|
|
|
|
Billed Revenue(1) / Shipment |
|
$ |
534.80 |
|
$ |
551.34 |
|
(3.0%) |
|
|
$ |
534.52 |
|
$ |
552.20 |
|
(3.2%) |
|
|
|
|
|
|
|
|
|
|
|
|
|
|
|
|
|
|
|
|
Tonnage / Day |
|
|
11,238 |
|
|
10,983 |
|
2.3% |
|
|
|
11,125 |
|
|
11,035 |
|
0.8% |
|
|
|
|
|
|
|
|
|
|
|
|
|
|
|
|
|
|
|
|
Shipments / Day |
|
|
21,095 |
|
|
20,221 |
|
4.3% |
|
|
|
20,550 |
|
|
19,907 |
|
3.2% |
|
|
|
|
|
|
|
|
|
|
|
|
|
|
|
|
|
|
|
|
Shipments / DSY hour |
|
|
0.446 |
|
|
0.445 |
|
0.2% |
|
|
|
0.448 |
|
|
0.445 |
|
0.7% |
|
|
|
|
|
|
|
|
|
|
|
|
|
|
|
|
|
|
|
|
Weight / Shipment |
|
|
1,065 |
|
|
1,086 |
|
(1.9%) |
|
|
|
1,083 |
|
|
1,109 |
|
(2.3%) |
|
|
|
|
|
|
|
|
|
|
|
|
|
|
|
|
|
|
|
|
Average Length of Haul (Miles) |
|
|
1,129 |
|
|
1,143 |
|
(1.2%) |
|
|
|
1,128 |
|
|
1,130 |
|
(0.2%) |
|
|
|
|
|
|
|
|
|
|
|
|
|
|
|
|
|
|
|
|
| 1) | Revenue for undelivered freight is deferred for financial statement purposes in accordance with the Asset-Based segment revenue recognition policy. Billed revenue used for calculating revenue per hundredweight measurements has not been adjusted for the portion of revenue deferred for financial statement purposes. |
|
|
|
Year Over Year % Change |
|||
|
|
|
Three Months Ended |
|
|
Nine Months Ended |
|
|
|
September 30, 2025 |
|
|
September 30, 2025 |
|
|
|
(Unaudited) |
|||
Asset-Light |
|
|
|
|
|
|
|
|
|
|
|
|
|
Revenue / Shipment |
|
|
(10.6%) |
|
|
(7.9%) |
|
|
|
|
|
|
|
Shipments / Day |
|
|
2.5% |
|
|
(2.6%) |
|
|
|
|
|
|
|
Shipments / Employee / Day |
|
|
32.6% |
|
|
23.6% |
###
13
Exhibit 99.2
ArcBest® is providing this exhibit as supplemental information to its scheduled conference call and the press release announcing the Company’s unaudited third quarter 2025 results filed as Exhibit 99.1 to the Company’s Current Report on Form 8-K. Certain statements and information in this exhibit may constitute “forward-looking statements” within the meaning of the Private Securities Litigation Reform Act of 1995. Refer to the “Forward-Looking Statements” disclosure at the end of this exhibit.
Non-GAAP Financial Measures
ArcBest reports its financial results in accordance with generally accepted accounting principles (“GAAP”); however, this exhibit includes certain non-GAAP information. Refer to the discussion of non-GAAP information included in Item 2.02 of the Current Report on Form 8-K to which this exhibit is included for further information, including reference to reconciliations of GAAP to non-GAAP financial measures provided by the Company.
Summary Operating and Financial Impacts
| ● | Statistics for October 2025 are preliminary but are not expected to differ materially from actual results. |
| ● | There are 23.0 workdays in October 2025, and there were 23.0 workdays in October 2024. |
| ● | There will be 61.0 workdays in 4Q’25, and there were 61.5 workdays in 4Q’24. |
Asset-Based Operating Segment
| ● | Average price increase on contract renewals and deferred pricing agreements negotiated during 3Q’25: +4.5% |
Year-over-Year Business Trends
|
|
|
July 2025 |
|
August 2025 |
|
September 2025 |
|
October 2025 |
||||
|
|
|
|
|
|
|
|
|
|
|
|
|
|
Billed Revenue(1) / Day |
|
|
flat |
|
|
+2.3 |
% |
|
+1.2 |
% |
|
-1 |
% |
Tonnage / Day |
|
|
+1.3 |
% |
|
+2.4 |
% |
|
+3.3 |
% |
|
-1 |
% |
Shipments / Day |
|
|
+3.6 |
% |
|
+5.2 |
% |
|
+4.1 |
% |
|
+1 |
% |
Billed Revenue(1) / CWT |
|
|
-1.2 |
% |
|
-0.1 |
% |
|
-2.0 |
% |
|
flat |
|
Billed Revenue(1) / Shipment |
|
|
-3.5 |
% |
|
-2.8 |
% |
|
-2.7 |
% |
|
-2 |
% |
Weight / Shipment |
|
|
-2.3 |
% |
|
-2.6 |
% |
|
-0.8 |
% |
|
-2 |
% |
| 1) | Revenue for undelivered freight is deferred for financial statement purposes in accordance with the Asset-Based segment revenue recognition policy. Billed revenue per day has not been adjusted for the portion of revenue deferred for financial statement purposes. |
In October 2025, Asset-Based daily shipment growth slowed and both weight per shipment and daily tonnage levels were down compared to the same period last year. Revenue per hundredweight, both including and excluding fuel, was flat. The pricing environment remains rational.
From September to October, shipments per day decreased approximately 5% and tonnage per day decreased 4%, while weight per shipment was flat. Revenue per hundredweight both including and excluding fuel, was down 1%.
Historically, ABF's non-GAAP operating ratio has deteriorated approximately 100-200 basis points from the third quarter to the fourth quarter. We currently expect our operating ratio to deteriorate by approximately 400 basis points sequentially, reflecting ongoing softness in the broader freight market.
1
Asset-Light Operating Segment
Business Trends
|
|
|
July 2025 |
|
August 2025 |
|
September 2025 |
|
October 2025 |
||||
|
|
|
|
|
|
|
|
|
|
|
|
|
|
Revenue / Day (Year-over-Year) |
|
|
-9.9 |
% |
|
-6.2 |
% |
|
-9.1 |
% |
|
-9 |
% |
Shipments / Day (Year-over-Year) |
|
|
-1.7 |
% |
|
+6.7 |
% |
|
+2.4 |
% |
|
+1 |
% |
Revenue / Shipment (Year-over-Year) |
|
|
-8.3 |
% |
|
-12.1 |
% |
|
-11.2 |
% |
|
-10 |
% |
Purchased Transportation Expense as a % of Revenue |
|
|
85.3 |
% |
|
84.6 |
% |
|
84.9 |
% |
|
86 |
% |
In October 2025, Asset-Light year-over-year daily revenue decreased due to lower revenue per shipment from soft freight market conditions and a higher proportion of Managed business with smaller shipment sizes. The increase in October shipments is driven by continued strength in our Managed solution.
Sequentially, from September to October, daily revenue decreased 3%, revenue per shipment increased 6%, and shipments per day decreased 9%. The slowdown is typical for this time of year, as the second and third quarters generally represent peak shipping periods for our customers.
Given seasonality and current market conditions, we anticipate a non-GAAP operating loss in the range of $1 million to $3 million for the fourth quarter of 2025. This estimate excludes GAAP impacts from changes in the fair value of contingent consideration, which we estimate will be zero, and purchase accounting amortization, which we expect to total $3 million for the fourth quarter of 2025.
Additional Detailed Information
Consolidated Capital Expenditures 2025 Projected
| ● | Capital Expenditures, net of sales proceeds and including financed equipment: approximately $200 million |
| o | Includes net revenue equipment purchases (primarily for Asset-Based) of approximately $130 million |
| o | Includes net real estate expenditures of approximately $35 million, which includes $25 million in proceeds from real estate sales |
| o | The remaining amount of capital expenditures includes items related to technology and miscellaneous dock equipment upgrades and enhancements. |
| ● | Depreciation and amortization costs on property, plant and equipment: approximately $158 million |
| ● | Intangible asset amortization, primarily reflecting purchase accounting amortization related to the MoLo acquisition: $13 million |
Share Repurchase Program
Based on repurchases settled through Friday, October 31, 2025, $116.5 million remains available under the current repurchase authorization for future common stock purchases.
Tax Rate
ArcBest’s third quarter 2025 effective GAAP tax rate for continuing operations was 26.6%. The “Effective Tax Rate Reconciliation” table of ArcBest’s third quarter 2025 earnings press release in Exhibit 99.1 shows the reconciliation of GAAP to non-GAAP effective tax rates. The effective non-GAAP tax rate for third quarter 2025 was 28.0%. Under the current tax laws, we expect our full year 2025 non-GAAP tax rate for continuing operations to be in a range of 26.0% to 27.0%. The effective tax rate may be impacted by discrete items that could occur throughout the year.
2
Asset-Based Annual Union Profit-Sharing Bonus
As provided in ABF Freight’s current Teamster labor contract, for the full years of 2024 through 2027, ABF Freight’s Teamster employees are eligible for an annual profit-sharing bonus, as shown in the following table. The operating ratio (“OR”) used to calculate the bonus amount is on a GAAP basis. The potential bonus would be based on full-year union employee earnings. While impacted by business and associated labor levels which are subject to change, the estimate of one percent of the annual earnings for the ABF Freight union employees who are eligible for this benefit approximates $6 million - $6.5 million of union bonus expense.
During years in which ArcBest’s internal forecasts indicate an expectation of paying the union bonus, we will accrue for this expense throughout the year, generally in proportion of the quarterly results as a percentage of the annual projection. As we do not provide public updates on our projected operating ratio or our expectations for paying the union bonus, any details of amounts accrued will not be provided. If financial models reflect an operating ratio that meets the payout thresholds shown below, ArcBest encourages analysts to include expenses for the union bonus in quarterly and annual earnings per share projections for the company.
ABF Freight Published Annual OR (GAAP basis) |
Bonus Amount |
91.1 to 93.0 |
1% |
89.1 to 91.0 |
2% |
87.1 to 89.0 |
3% |
87.0 or below |
4% |
3
“Other and eliminations” within Operating Income (Loss) on the Operating Segment Data and Operating Ratios statement
| ● | Includes innovative technology costs related to our freight handling pilot program with third-party customers and human-centered remote and automated operations, which are typically disclosed as a non-GAAP reconciling item. |
| ● | It also includes certain overhead costs not attributable to other operating segments, including legal, investor relations, and other strategic expenses and investments. |
| ● | Projected amounts for fourth quarter and full year 2025 and actual amounts for fourth quarter and full year 2024 are included below. |
|
|
Three Months Ended |
|
Year Ended |
|
||||||||
|
|
December 31 |
|
December 31 |
|
||||||||
|
|
2025 |
|
2024 |
|
2025 |
|
2024 |
|
||||
|
|
(in millions) |
|
||||||||||
Innovative technology costs, pre-tax |
|
$ |
7 |
|
$ |
8 |
|
$ |
29 |
|
$ |
34 |
|
Other costs, pre-tax |
|
$ |
8 |
|
$ |
5 |
|
$ |
29 |
|
$ |
23 |
|
Total other and eliminations |
|
$ |
15 |
|
$ |
13 |
|
$ |
58 |
|
$ |
57 |
|
Other Income (Costs) on the Consolidated Statements of Operations
| ● | Other income and costs include separate lines for interest income and interest expense. |
| ● | The “Other, net” line primarily includes changes in cash surrender value of life insurance, expenses associated with non-operating properties, and in first quarter 2024, a $28.7 million pre-tax noncash impairment charge to write off our equity investment in Phantom Auto, a provider of human-centered remote operation software, which ceased operations. |
| o | The changes in cash surrender value of life insurance and the equity investment impairment charge are typically disclosed as non-GAAP reconciling items. |
| o | As such, the non-GAAP amounts for “Other, net” are expected to be minimal. |
| ● | Projected amounts for fourth quarter and full year 2025 and actual amounts for fourth quarter and full year 2024 are included below. |
|
|
Three Months Ended |
|
Year Ended |
|
||||||||
|
|
December 31 |
|
December 31 |
|
||||||||
|
|
2025 |
|
2024 |
|
2025 |
|
2024 |
|
||||
|
|
(in millions) |
|
||||||||||
Interest and dividend income |
|
$ |
1 |
|
$ |
2 |
|
$ |
5 |
|
$ |
12 |
|
Interest and other related financing costs |
|
$ |
(3) |
|
$ |
(2) |
|
$ |
(12) |
|
$ |
(9) |
|
Other, net, excluding non-GAAP reconciling items |
|
$ |
(1) |
|
$ |
(1) |
|
$ |
(3) |
|
$ |
(3) |
|
4
Forward-Looking Statements
The following is a “safe harbor” statement under the Private Securities Litigation Reform Act of 1995: Certain statements and information in this exhibit may constitute “forward-looking statements” within the meaning of the Private Securities Litigation Reform Act of 1995, including, among others, statements regarding (i) our expectations about our intrinsic value or our prospects for growth and value creation and (ii) our financial outlook, position, strategies, goals, and expectations. Terms such as “anticipate,” “believe,” “could,” “designed,” “estimate,” “expect,” “forecast,” “foresee,” “intend,” “likely,” “may,” “plan,” “predict,” “project,” “scheduled,” “seek,” “should,” “would,” and similar expressions and the negatives of such terms are intended to identify forward-looking statements. These statements are based on management’s beliefs, assumptions, and expectations based on currently available information, are not guarantees of future performance, and involve certain risks and uncertainties (some of which are beyond our control). Although we believe that the expectations reflected in these forward-looking statements are reasonable as and when made, we cannot provide assurance that our expectations will prove to be correct and caution the reader not to place undue reliance on our forward-looking statements. Actual outcomes and results could materially differ from what is expressed, implied, or forecasted in these statements due to a number of factors, including, but not limited to: data privacy breaches, cybersecurity incidents, and/or failures of our information systems, including disruptions or failures of services essential to our operations or upon which our information technology platforms rely; interruption or failure of third-party software or information technology systems, including but not limited to licensed software; untimely or ineffective development and implementation of, or failure to realize the potential benefits associated with, new or enhanced technology or processes; the loss or reduction of business from large customers or an overall reduction in our customer base; the timing and performance of growth initiatives and the ability to manage our cost structure; the cost, integration, and performance of acquisitions and the inability to realize the anticipated benefits of the acquisition within the expected time period or at all; unsolicited takeover proposals, proxy contests, and other proposals or actions by activist investors; maintaining our corporate reputation and intellectual property rights; establishing and maintaining adequate internal controls over financial reporting; nationwide or global disruption in the supply chain resulting in increased volatility in freight volumes; competitive initiatives and pricing pressures; increased prices for and decreased availability of equipment, including new revenue equipment, and higher costs of equipment-related operating expenses such as maintenance, fuel, and related taxes; availability of fuel, the effect of volatility in fuel prices and the associated changes in fuel surcharges on securing increases in base freight rates, and the inability to collect fuel surcharges; relationships with employees, including unions, and our ability to attract, retain, and upskill employees; unfavorable terms of, or the inability to reach agreement on, future collective bargaining agreements or a workforce stoppage by our employees covered under ABF Freight’s collective bargaining agreement; union employee wages and benefits, including changes in required contributions to multiemployer plans; availability and cost of reliable third-party services; our ability to secure independent owner-operators and/or operational or regulatory issues related to our use of their services; litigation or claims asserted against us; the effects, costs and potential liabilities related to changes in and compliance with, or violation of, existing or future governmental laws and regulations, including, but not limited to, environmental laws and regulations, such as emissions-control regulations and fuel efficiency regulations; default on covenants of financing arrangements and the availability and terms of future financing arrangements; our ability to generate sufficient cash from operations to support significant ongoing capital expenditure requirements and other business initiatives; self-insurance claims, insurance premium costs, and loss of our ability to self-insure; potential impairment of long-lived assets and goodwill and intangible assets; the effects of a widespread outbreak of an illness or disease or any other public health crisis, as well as regulatory measures implemented in response to such events; external events which may adversely affect us or the third parties who provide services for us, for which our business continuity plans may not adequately prepare us, including, but not limited to, the occurrence of natural disasters, health epidemics, geopolitical conflicts, acts of war, cybersecurity incidents, or trade restrictions; general economic conditions and related shifts in market demand that impact the performance and needs of industries we serve and/or limit our customers’ access to adequate financial resources; seasonal fluctuations, adverse weather conditions, natural disasters, and climate change; and other financial, operational, and legal risks and uncertainties detailed from time to time in ArcBest Corporation’s public filings with the Securities and Exchange Commission (“SEC”).
For additional information regarding known material factors that could cause our actual results to differ from those expressed in these forward-looking statements, please see our filings with the SEC, including our Annual Report on Form 10-K, Quarterly Reports on Form 10-Q, and Current Reports on Form 8-K.
Readers are cautioned not to place undue reliance on forward-looking statements, which speak only as of the date hereof. We undertake no obligation to publicly update or revise any forward-looking statements after the date they are made, whether as a result of new information, future events, or otherwise.
5
|
3Q’25 Earnings Presentation |
|
E A R N I N G S P R E S E N T A T I O N | 3 Q ’ 2 5 Forward-Looking Statements The following is a “safe harbor” statement under the Private Securities Litigation Reform Act of 1995: Certain statements and information in this presentation may constitute “forward-looking statements” within the meaning of the Private Securities Litigation Reform Act of 1995, including, among others, statements regarding (i) our expectations about our intrinsic value or our prospects for growth and value creation and (ii) our financial outlook, position, strategies, goals, and expectations. Terms such as “anticipate,” “believe,” “could,” “estimate,” “expect,” “forecast,” “foresee,” “intend,” “may,” “plan,” “predict,” “project,” “scheduled,” “should,” “would,” and similar expressions and the negatives of such terms are intended to identify forward-looking statements. These statements are based on management’s beliefs, assumptions, and expectations based on currently available information, are not guarantees of future performance, and involve certain risks and uncertainties (some of which are beyond our control). Although we believe that the expectations reflected in these forward-looking statements are reasonable as and when made, we cannot provide assurance that our expectations will prove to be correct. Actual outcomes and results could materially differ from what is expressed, implied, or forecasted in these statements due to a number of factors, including, but not limited to: the effects of a widespread outbreak of an illness or disease or any other public health crisis, as well as regulatory measures implemented in response to such events; external events which may adversely affect us or the third parties who provide services for us, for which our business continuity plans may not adequately prepare us, including, but not limited to, acts of war or terrorism, or military conflicts; data privacy breaches, cybersecurity incidents, and/or failures of our information systems, including disruptions or failures of services essential to our operations or upon which our information technology platforms rely; interruption or failure of third-party software or information technology systems or licenses; untimely or ineffective development and implementation of, or failure to realize the potential benefits associated with, new or enhanced technology or processes, including our customer pilot offering of Vaux; the loss or reduction of business from large customers or an overall reduction in our customer base; the timing and performance of growth initiatives and the ability to manage our cost structure; the cost, integration, and performance of any recent or future acquisitions and the inability to realize the anticipated benefits of the acquisition within the expected time period or at all; unsolicited takeover proposals, proxy contests, and other proposals/actions by activist investors; maintaining our corporate reputation and intellectual property rights; nationwide or global disruption in the supply chain resulting in increased volatility in freight volumes; competitive initiatives and pricing pressures; increased prices for and decreased availability of equipment, including new revenue equipment, decreases in value of used revenue equipment, and higher costs of equipment-related operating expenses such as maintenance, fuel, and related taxes; availability of fuel, the effect of volatility in fuel prices and the associated changes in fuel surcharges on securing increases in base freight rates, and the inability to collect fuel surcharges; relationships with employees, including unions, and our ability to attract, retain, and upskill employees; unfavorable terms of, or the inability to reach agreement on, future collective bargaining agreements or a workforce stoppage by our employees covered under ABF Freight’s collective bargaining agreement; union employee wages and benefits, including changes in required contributions to multiemployer plans; availability and cost of reliable third-party services; our ability to secure independent owner-operators and/or operational or regulatory issues related to our use of their services; litigation or claims asserted against us; governmental regulations; environmental laws and regulations, including emissions-control regulations; default on covenants of financing arrangements and the availability and terms of future financing arrangements; our ability to generate sufficient cash from operations to support significant ongoing capital expenditure requirements and other business initiatives; self-insurance claims, insurance premium costs, and loss of our ability to self-insure; potential impairment of long-lived assets and goodwill and intangible assets; general economic conditions and related shifts in market demand that impact the performance and needs of industries we serve and/or limit our customers’ access to adequate financial resources; increasing costs due to inflation and higher interest rates; seasonal fluctuations, adverse weather conditions, natural disasters, and climate change; and other financial, operational, and legal risks and uncertainties detailed from time to time in ArcBest Corporation’s public filings with the Securities and Exchange Commission (“SEC”). For additional information regarding known material factors that could cause our actual results to differ from those expressed in these forward-looking statements, please see our filings with the SEC, including our Annual Report on Form 10-K, Quarterly Reports on Form 10-Q, and Current Reports on Form 8-K. Readers are cautioned not to place undue reliance on forward-looking statements, which speak only as of the date hereof. We undertake no obligation to publicly update or revise any forward-looking statements after the date they are made, whether as a result of new information, future events, or otherwise. |
|
E A R N I N G S P R E S E N T A T I O N | 3 Q ’ 2 5 We are a leading integrated logistics company that leverages technology and a full suite of solutions to meet customers’ supply chain needs 1923 Founded ~$400B Addressable Market* ~240 Asset-Based Service Centers ~40K Owned Equipment 70K+ CONTRACT CARRIERS 30K CUSTOMERS 14K EMPLOYEES AT A GLANCE N A S D A Q : A R C B 99% United States Coverage TOP 15 U.S. Truckload Broker * Armstrong & Associates, US Department of Commerce, management estimates – July 2025. 3 |
|
E A R N I N G S P R E S E N T A T I O N | 3 Q ’ 2 5 M I S S I O N To connect and positively impact the world through solving logistics challenges To be the leading logistics partner and innovator, working with customers to build better supply chains across the globe To drive long-term value by delivering a premium experience and growing informed, trusted, innovative relationships M O T T O : “We’ll find a way” V I S I O N S T R A T E G Y V A L U E S Creativity Integrity Collaboration Growth Excellence Wellness We create solutions We do the right thing We work together We grow our people and our business We exceed expectations We embrace total health 4 |
|
E A R N I N G S P R E S E N T A T I O N | 3 Q ’ 2 5 5 ARCBEST IS A STRATEGIC PARTNER TO CUSTOMERS Cost Savings Actionable Supply Chain Insights Operational Efficiencies P A R T N E R I N G W I T H C U S T O M E R S T O P R O V I D E C U S T O M E R S W A N T A N D N E E D Resiliency Flexibility Efficiency ArcBest Seamlessly Connects Customers & Capacity Reliability |
|
E A R N I N G S P R E S E N T A T I O N | 3 Q ’ 2 5 6 ARCBEST SOLVES CUSTOMERS’ NEEDS THROUGH MULTIPLE SERVICES Less-than- Truckload Truckload Managed Expedite and Other Services Customers use an average of 4services |
|
E A R N I N G S P R E S E N T A T I O N | 3 Q ’ 2 5 >3x Revenue & Profit per account is over 3X higher on cross-sold accounts Revenue & Profit >70% Over 70% of customers who use Asset-Light services also utilize Asset-Based services 5% Higher Customer Retention Asset-Light + Asset-Based Retention rates are 5 percentage points higher on cross-sold accounts than on single-solution accounts CUSTOMER-LED STRATEGY YIELDS RESULTS Shared resources provide scale and cost efficiencies Sales Technology Financial Services Human Resources 7 |
|
E A R N I N G S P R E S E N T A T I O N | 3 Q ’ 2 5 16-19% Margin Expansion and Growth Strong EPS Growth 2028 FINANCIAL TARGETS Annual Operating Cash Flow 8 87%-90% Asset-Based Non-GAAP Operating Ratio(1) $40M-$70M Asset-Light Non-GAAP Operating Income(1) $400M-$500M $12-$15 Non-GAAP Diluted EPS (1)(2) Non-GAAP Return on Capital Employed(1) 1) See Reconciliations of GAAP to non-GAAP Financial Measures in the Additional Information section of this presentation 2) Assumes consistent outstanding shares |
|
E A R N I N G S P R E S E N T A T I O N | 3 Q ’ 2 5 S T R A T E G I C P I L L A R S Increasing EFFICIENCY Driving INNOVATION Accelerating PROFITABLE GROWTH 9 ✓ Refined Go-to-Market Approach ✓ Maintaining Yield Discipline ✓ Expanding Quote Pool ✓ Enhancing Customer Service and Visibility Tools ✓ Network Capacity ✓ Fleet Optimization ✓ Continuous Improvement Training ✓ Innovation Portfolio ✓ Technology Roadmap |
|
E A R N I N G S P R E S E N T A T I O N | 3 Q ’ 2 5 ACCELERATING PROFITABLE GROWTH REFINED GO-TO-MARKET APPROACH Marketing Yield Sales Customer Service Customer Obsessed Revenue Engine Aligned Growth Engine Teams 10 Accelerating Managed Opportunities Growing Core LTL Business Growing Truckload Business & Optimizing Mix Enhancing Expedite Growth |
|
E A R N I N G S P R E S E N T A T I O N | 3 Q ’ 2 5 ACCELERATING PROFITABLE GROWTH GROWING CORE LTL BUSINESS Clear Prioritization Narrowing the focus on new core LTL shipment growth Focused Sales Campaign Launched in 2024, resulted in ~2,000 new core LTL shipments per day and growing Removing Barriers to Growth Including contract administration and EDI connections Greater Alignment With onboarding and retention resources to nurture customers 11 - 500 1,000 1,500 2,000 2,500 1Q'24 2Q'24 3Q'24 4Q'24 1Q'25 2Q'25 3Q'25 Focused Sales Campaign Shipments per Day Growth Average Shipments Per Day |
|
E A R N I N G S P R E S E N T A T I O N | 3 Q ’ 2 5 ACCELERATING PROFITABLE GROWTH 2017 2018 2019 2020 2021 2022 2023 2024 3Q'25 ACCELERATING MANAGED OPPORTUNITIES Average Managed Shipments Per Day 42% CAGR ‘17-25 As Managed Solutions grows, it benefits all solutions 12 Managed feeds LTL, Truckload and Expedite Retention Customers shipped in 2024, retained in 2025 90% P I P E L I N E $1B& G R O W I N G Growth initiatives, digital advertising and ArcBest View drive volume to Managed as of 3Q 2025 |
|
E A R N I N G S P R E S E N T A T I O N | 3 Q ’ 2 5 ACCELERATING PROFITABLE GROWTH Enterprise SMB Profit per Load TTM average at September 30, 2025 GROWING TRUCKLOAD BUSINESS AND OPTIMIZING MIX 2021 Current Near-Term Long-Term SMB Enterprise Sales teams to expand presence in SMB space Restructured to accelerate growth Generate higher margin revenue growth Revenue Diversification % of Total Truckload Revenue 40% 60% 50% 50% 60% 40% I N V E S T M E N T S T R U C T U R E F O C U S 80% 13 >1.5x * *as of MoLo acquisition in late 2021 |
|
E A R N I N G S P R E S E N T A T I O N | 3 Q ’ 2 5 ACCELERATING PROFITABLE GROWTH ENHANCING EXPEDITE GROWTH YoY Net Margin Expansion of 140 Basis Points As of 3Q’25 Provider of Expedite Services in the U.S. TOP 5 ON -TIME 98% S U C C E S S Growth in opportunity pipeline revenue since 1Q’25 +13% Best-in-class Expedite service that meets every customer deadline Measured within 15 minutes of the promised pick-up and delivery time 14 11% increase in customer retention New proprietary TMS since 2023 installation to drive further productivity gains |
|
E A R N I N G S P R E S E N T A T I O N | 3 Q ’ 2 5 ACCELERATING PROFITABLE GROWTH MAINTAINING YIELD DISCIPLINE THROUGH CENTRALIZED PRICING STRATEGY $0 $25 $50 Revenue/CWT $0 $275 $550 Revenue/Shipment Cost Market Value Strongest LTL Pricing Metrics Among Competitors Peers ABF Legend: ~1.6x ~1.4x 15 As of 3Q 2025 As of 3Q 2025 What is the market price? How much will it cost to handle? What additional value are we providing? |
|
E A R N I N G S P R E S E N T A T I O N | 3 Q ’ 2 5 ACCELERATING PROFITABLE GROWTH EXPANDING QUOTE POOL DRIVES PROFITABLE GROWTH Selectively fill capacity to optimize yield and profitability ArcBest View TMS Providers 3PLs NMFC Changes 16 Profitable Growth |
|
E A R N I N G S P R E S E N T A T I O N | 3 Q ’ 2 5 ACCELERATING PROFITABLE GROWTH More quotes, more choices DYNAMIC PRICE IMPROVES AS QUOTES GROW Drives additional incremental profit 17 K 50K 100K 150K 200K 250K 300K 2020 2021 2022 2023 2024 2025 Daily Dynamic Quotes ~50% More Rev/Ship Since 2020 |
|
E A R N I N G S P R E S E N T A T I O N | 3 Q ’ 2 5 INCREASING EFFICIENCY 8,820 8,820 8,955 9,254 9,497 135 299 243 138 2021 2022 2023 2024 2025 ~800 Net Door Expansion Since 2021 8,820 8,955 9,254 9,497 9,635 Existing Doors New Doors Strategically Adding Capacity NETWORK CAPACITY Disciplined investments in our long-term LTL network facility roadmap Revenue Growth E N A B L E S : Efficiency Productivity Service I M P R O V E S : 18 |
|
E A R N I N G S P R E S E N T A T I O N | 3 Q ’ 2 5 INCREASING EFFICIENCY FLEET OPTIMIZATION Fleet Efficiency Safety Sustainability • $160M annual reinvestment cycle • 40,000 owned and operated pieces of equipment • Maintaining young and modern fleet • Optimized total cost of ownership • Piloting speed limiter and control technology • Implemented advanced safety features • Testing electric vehicles • EPA SmartWay partner since 2006 Fleet Investment Disciplined investments in our fleet 19 |
|
E A R N I N G S P R E S E N T A T I O N | 3 Q ’ 2 5 INCREASING EFFICIENCY $20M CONTINUOUS IMPROVEMENT TRAINING COST SAVINGS IN 2025 Additional Runway to Expand Benefits by Training Additional Locations Positioning our people for success • Culture of continuous improvement • Deploying training teams • Expanding transfer capacity and performance management 20 Continuous improvement training successfully implemented across ~40% of the network 2024 2025 2026 |
|
DRIVING INNOVATION E A R N I N G S P R E S E N T A T I O N | 3 Q ’ 2 5 INNOVATION PORTFOLIO Idea Pilot Learn Refine Expand Operationalize Iterative approach for optimization efforts 70+ Projects 45% Implemented In Pilot Stages 25% Drives growth, ongoing cost savings and service improvements 21 |
|
DRIVING INNOVATION E A R N I N G S P R E S E N T A T I O N | 3 Q ’ 2 5 2021 2022 2023 2024 2025 Rollout of City Route Optimization phase 1 is complete, and phase 2 has reached ~30% of the network Dynamic route optimization system with suite of tools Optimized Delivery Routes Daily Demand Projections Optimized Pickup Routes CITY ROUTE OPTIMIZATION TOOLS Leverages AI to reduce manual tasks, minimize costs and maximize utilization Integrates with shipment visibility for more efficient route planning City Route Optimization Phases 1 & 2 Realized Annual Savings K E Y F E A T U R E S $15M Per Year OPTIMIZATION EXAMPLE 22 |
|
DRIVING INNOVATION E A R N I N G S P R E S E N T A T I O N | 3 Q ’ 2 5 Blending human relationships + tech to support processes and improve productivity TECHNOLOGY ROADMAP 23 Truckload Carrier 28% Portal Adoption Rate Digitally Augmented 52% Truckload Shipments Carrier Portal Quote Email Augmentation Appointment Scheduling Capacity Sourcing Augmentation Inbound Call Automation Pricing Enhancements |
|
E A R N I N G S P R E S E N T A T I O N | 3 Q ’ 2 5 24 Key Metrics Q3 2025 vs Q3 2024 $1.0B ArcBest Consolidated Revenue $49.8M Non-GAAP Operating Income(1) $1.46 Non-GAAP Earnings per Diluted Share(1) ARCBEST CONSOLIDATED 1) See non-GAAP reconciliation in the Additional Information section of this presentation. Asset-Based 1% Asset-Light 11% 9% $10M $6M |
|
E A R N I N G S P R E S E N T A T I O N | 3 Q ’ 2 5 Average Increase on Contract Renewals and Deferred Pricing Agreements 25 Key Metrics Q3 2025 vs Q3 2024 $ Asset 726M -Based Revenue $ Non 54.4M -GAAP Operating Income (1) ASSET-BASED Tonnage per Day Shipments per Day 15% 2% Per Day 92.5% Non-GAAP Operating Ratio (1) 150BPS Deterioration Billed Rev/CWT Weight per Shipment 4% 2% 4.5% 1% 2% 1) See non-GAAP reconciliation in the Additional Information section of this presentation. Billed Revenue per Shipment 3% |
|
E A R N I N G S P R E S E N T A T I O N | 3 Q ’ 2 5 75 80 85 90 95 100 Non-GAAP Operating Ratio YoY Bridge K E Y D R I V E R S : ASSET-BASED OPERATING RATIO BRIDGE 26 3Q24 to 3Q25 Lower Revenue per Shipment Lower weight per shipment Softness in Manufacturing Improved Cost per Shipment Efficiency gains in Linehaul, Street, and Dock Offset by increased contracted union labor rates, higher cartage costs and depreciation Lower Rev/Ship outpaced improved Cost/Ship by ~150 bps See Reconciliations of GAAP to non-GAAP Financial Measures in the Additional Information section of this presentation 3Q’24 Non-GAAP Operating Ratio 3Q’25 Rev/Ship 3Q’25 Cost/Ship 3Q’25 Non-GAAP Operating Ratio |
|
E A R N I N G S P R E S E N T A T I O N | 3 Q ’ 2 5 27 LABOR PLANNING ALIGNS HEADCOUNT AND SHIPMENTS 15000 16000 17000 18000 19000 20000 21000 22000 5,000 5,500 6,000 6,500 7,000 7,500 8,000 8,500 1Q'19 2Q'19 3Q'19 4Q'19 1Q'20 2Q'20 3Q'20 4Q'20 1Q'21 2Q'21 3Q'21 4Q'21 1Q'22 2Q'22 3Q'22 4Q'22 1Q'23 2Q'23 3Q'23 4Q'23 1Q'24 2Q'24 3Q'24 4Q'24 1Q'25 2Q'25 3Q'25 Shipments/Day Linehaul and DSY Headcount Linehaul, Dock, Street and Yard Headcount Shipments/Day Technology and Training Drives Productivity Gains |
|
E A R N I N G S P R E S E N T A T I O N | 3 Q ’ 2 5 28 Key Metrics Oct 2025 vs Oct 2024 ASSET-BASED O C T O B E R P R E L I M I N A R Y Revenue per Day Tonnage per Day Shipments per Day Billed Rev/CWT 1% flat Billed Revenue per Shipment Weight per Shipment 2% 2% 1% 1% |
|
E A R N I N G S P R E S E N T A T I O N | 3 Q ’ 2 5 33% $ Asset 356M -Light Revenue Per Day 29 Key Metrics Q3 2025 vs Q3 2024 $ Non 1.6M -GAAP Operating Income (1) ASSET-LIGHT Shipments per Day Revenue per Shipment 141% 1) See non-GAAP reconciliation in the Additional Information section of this presentation. 8% Shipments per Employee per Day Purchased Transportation as % of Revenue: 85% 3% 11% |
|
E A R N I N G S P R E S E N T A T I O N | 3 Q ’ 2 5 Revenue per Shipment 30 Key Metrics Oct 2025 vs Oct 2024 ASSET-LIGHT O C T O B E R P R E L I M I N A R Y 10% Revenue per Day Shipments per Day Purchased Transportation as % of Revenue: 86% 9% 1% |
|
E A R N I N G S P R E S E N T A T I O N | 3 Q ’ 2 5 31 $2.8 $2.8 $3.8 $5.0 $4.4 $4.2 $4.0 2019 2020 2021 2022 2023 2024 3Q'25 TTM Revenues $112 $123 $314 $468 $258 $203 $153 2019 2020 2021 2022 2023 2024 3Q'25 TTM $2.96 $3.28 $8.40 $13.52 $7.88 $6.28 $4.72 2019 2020 2021 2022 2023 2024 3Q'25 TTM +43% Revenues ($B, unaudited) (1) Operating Income ($M) (Non-GAAP, unaudited)(2) Operating Income +37% Earnings Per Share (Non-GAAP, unaudited)(2) Earnings Per Share +59% ARCBEST IS DELIVERING SOLID RESULTS 1) Revenue from continuing operations. See first footnote on “Notes to Non-GAAP Financial Tables”. 2) See Reconciliations of GAAP to non-GAAP Financial Measures in the Additional Information section of this presentation. |
|
E A R N I N G S P R E S E N T A T I O N | 3 Q ’ 2 5 94.5% 94.2% 88.8% 86.4% 90.4% 91.2% 93.3% 75% 80% 85% 90% 95% 2019 2020 2021 2022 2023 2024 3Q'25 TTM FREIGHT RECESSION COVID-19 IMPACTS Union Pension Impact on Operating Ratio ASSET-BASED OPERATING RATIO See Reconciliations of GAAP to non-GAAP Financial Measures in the Additional Information section of this presentation. 32 in Asset-Based OR since 2019 (Non-GAAP) 120BPS IMPROVEMENT FREIGHT RECESSION |
|
E A R N I N G S P R E S E N T A T I O N | 3 Q ’ 2 5 -$40 -$20 $0 $20 $40 $60 $80 $100 2019 2020 2021 2022 2023 2024 3Q'25 TTM FREIGHT RECESSION COVID-19 IMPACTS FREIGHT RECESSION ASSET-LIGHT OPERATING INCOME See Reconciliations of GAAP to non-GAAP Financial Measures in the Additional Information section of this presentation. 33 in TTM Operating Results compared to 2024 (Non-GAAP) IMPROVEMENT $13M |
|
E A R N I N G S P R E S E N T A T I O N | 3 Q ’ 2 5 BALANCED APPROACH TO CAPITAL ALLOCATION Prioritizing high-return, organic investments in real estate, equipment, and innovative projects Returning cash to shareholders through share repurchases and dividends Selectively using mergers & acquisitions to advance strategy Maintaining solid balance sheet and investment-grade credit metrics 34 Sustain & Drive Growth Return Capital Mergers & Acquisitions $170 $206 $324 $471 $322 $286 $241 2019 2020 2021 2022 2023 2024 3Q'25 TTM OPERATING CASH FLOW |
|
E A R N I N G S P R E S E N T A T I O N | 3 Q ’ 2 5 2019 - 2021 2022 - 2025F 2026 - 2028 Target Positioned for growth without major new buildouts CAPITAL INTENSITY DECREASING Normalization following ‘22-‘25 strategic investments Asset-Light strategy requires minimal capital Efficiency gains from tech, training, process improvements Rigorous capital investment evaluation Projected 2025 Net Capital Expenditures: ~$200M 35 Capital Expenditures % of Revenue 4% 5% Below 5% K E Y D R I V E R S : |
|
E A R N I N G S P R E S E N T A T I O N | 3 Q ’ 2 5 RETURN OF CAPITAL Increasing returns to shareholders through dividends and share repurchases 36 $125M New $125M share repurchase program authorized $500M Nearly $500M returned to shareholders since 2019 Generates significant free cash flow, enabling opportunistic share repurchases STRONG OUTLOOK 2019 2020 2021 2022 2023 2024 2025 YTD Cumulative Dividends Cumulative Share Repurchases |
|
E A R N I N G S P R E S E N T A T I O N | 3 Q ’ 2 5 SOLID FINANCIAL FOUNDATION 37 ~$800M of Current and Potential Capacity ~$400M Cash and Current Debt Capacity ~$400M Potential Future Debt Capacity(2) 1) See Reconciliations of GAAP to non-GAAP Financial Measures in the Additional Information section of this presentation 2) Reflects available amounts under accordion features of the Credit Facility and Accounts Receivable Securitization agreements, as well as available equipment financing borrowings, as of 3Q 2025 -0.5 0 0.5 1 1.5 2 2019 2020 2021 2022 2023 2024 3Q'25 TTM Net Debt to EBITDA (Non-GAAP)(1) S&P 500 Net Debt to EBITDA ArcBest Net Debt to EBITDA |
|
E A R N I N G S P R E S E N T A T I O N | 3 Q ’ 2 5 RETURN ON CAPITAL EMPLOYED 1) See Reconciliations of GAAP to non-GAAP Financial Measures in the Additional Information section of this presentation 38 0% 5% 10% 15% 20% 25% 30% 2019 2020 2021 2022 2023 2024 3Q'25 TTM Return on Capital Employed (Non-GAAP)(1) Disciplined capital allocation and strategic investments that deliver long-term growth DRIVES SUSTAINABLE VALUE |
|
ADDITIONAL INFORMATION Note: ArcBest Corporation reports its financial results in accordance with generally accepted accounting principles (“GAAP”). However, management believes that certain non-GAAP performance measures utilized for internal analysis provides analysts, investors, and others the same information that we use internally for purposes of assessing our core operating performance and provides meaningful comparisons between current and prior period results, as well as important information regarding performance trends. Accordingly, using these measures improves comparability in analyzing our performance because it removes the impact of items from operating results that, in management's opinion, do not reflect our core operating performance. Non-GAAP financial measures should be viewed in addition to, and not as an alternative for, our reported results. These financial measures should not be construed as better measurements than operating income, operating cash flow, net income or earnings per share, as determined under GAAP. Reconciliations of GAAP to Non-GAAP Financial Measures (Unaudited) 39 |
|
Forward-Looking Non-GAAP Financial Measures 40 All forward-looking financial targets in this presentation assume a consolidated tax rate of 25%. Consolidated non-GAAP earnings per share and non-GAAP return on capital employed are non-GAAP financial measures that most closely correlate with consolidated earnings per share and return on capital employed. These non-GAAP measures exclude purchase accounting amortization, which is expected to total $7M pre-tax in 2028. These non-GAAP measures also exclude innovative technology costs, life insurance proceeds, changes in cash surrender value of life insurance policies and income taxes related to the annual vesting of restricted stock units, each of which cannot be estimated for 2028 and could be material. As a result, we are unable to provide quantitative reconciliations to the most closely correlated GAAP measure. Non-GAAP Asset-Based Operating Ratio is a non-GAAP financial measure that most closely correlates with Asset-Based Operating Ratio. Non-GAAP Asset-Based OR could be adjusted for non-recurring infrequent or unusual items. Because the timing, amount and nature of any adjustments are unknown, and any adjustments could be material in future periods, we are unable to provide quantitative reconciliations to the most closely correlated GAAP measure. Asset-Light non-GAAP operating income range of $40M to $70M excludes GAAP impacts from purchase accounting amortization, which are expected to total $7M in 2028. Including these impacts, the Asset-Light GAAP operating income would range from $33M to $63M in 2028. See reconciliation table to the right. RECONCILIATIONS OF GAAP TO NON-GAAP FINANCIAL MEASURES (Unaudited) 2028 Target Asset-Light – Operating Income ($ millions) Amounts on a GAAP basis $ 33 - 63 Purchase accounting amortization, pre-tax (1) 7 Non-GAAP amounts $ 40 - 70 ADDITIONAL INFORMATION 1. Represents the amortization of acquired intangible assets in the Asset-Light segment. |
|
RECONCILIATIONS OF GAAP TO NON-GAAP FINANCIAL MEASURES (Unaudited) 3Q’25 3Q’24 ArcBest Consolidated – Operating Income ($ millions) Amounts on a GAAP basis $ 54.6 $ 135.0 Innovative technology costs, pre-tax (1) 7.7 8.5 Purchase accounting amortization, pre-tax (2) 3.2 3.2 Change in fair value of contingent consideration, pre-tax (3) - (91.9) Gain on sale of certain properties, pre-tax (4) (15.7) - Non-GAAP amounts $ 49.8 $ 54.8 41 ADDITIONAL INFORMATION ArcBest Consolidated (continuing operations) 1. Represents costs related to our customer pilot offering of Vaux and initiatives to optimize our performance through technological innovation. 2. Represents the amortization of acquired intangible assets in the Asset-Light segment. 3. Represents change in fair value of the contingent earnout consideration recorded for the MoLo acquisition. 4. Primarily includes gains on two service center sales within the Asset-Based operations. |
|
RECONCILIATIONS OF GAAP TO NON-GAAP FINANCIAL MEASURES (Unaudited) 3Q’25 3Q’24 ArcBest Consolidated – Diluted Earnings Per Share ($ millions) Amounts on a GAAP basis $ 1.72 $ 4.23 Innovative technology costs, after-tax (includes related financing costs) (1) 0.26 0.27 Purchase accounting amortization, after-tax (2) 0.11 0.10 Change in fair value of contingent consideration, after-tax (3) - (2.92) Gain on sale of certain properties, after-tax (4) (0.52) - Changes in cash surrender value and gains on life insurance policies (0.10) (0.06) Non-GAAP amounts (5) $ 1.46 $ 1.64 42 ADDITIONAL INFORMATION ArcBest Consolidated (continuing operations) 1. Represents costs related to our customer pilot offering of Vaux and initiatives to optimize our performance through technological innovation. 2. Represents the amortization of acquired intangible assets in the Asset-Light segment. 3. Represents change in fair value of the contingent earnout consideration recorded for the MoLo acquisition. 4. Primarily includes gains on two service center sales within the Asset-Based operations. 5. Non-GAAP amounts are calculated in total and may not equal the sum of GAAP amounts and non-GAAP adjustments due to rounding. |
|
RECONCILIATIONS OF GAAP TO NON-GAAP FINANCIAL MEASURES* (Unaudited) 3Q’25 3Q’24 Asset-Based – Operating Income ($ millions) Amounts on a GAAP basis $ 70.2 90.3% $ 64.0 91.0% Gain on sale of certain properties, pre-tax (1) (15.7) 2.2 - - Non-GAAP amounts (2) $ 54.4 92.5% $ 64.0 91.0% 43 ADDITIONAL INFORMATION Asset-Based Operating Income 1. Primarily includes gains on two service center sales within the Asset-Based operations. 2. Non-GAAP amounts are calculated in total and may not equal the sum of GAAP amounts and non-GAAP adjustments due to rounding. RECONCILIATIONS OF GAAP TO NON-GAAP FINANCIAL MEASURES* (Unaudited) 3Q’25 3Q’24 Asset-Light – Operating Income (Loss) ($ millions) Amounts on a GAAP basis $ (1.6) $ 84.8 Purchase accounting amortization, pre-tax (1) 3.2 3.2 Change in fair value of contingent consideration, pre-tax (2) - (91.9) Non-GAAP amounts $ 1.6 $ (3.9) Asset-Light Operating Income (Loss) 1. Represents the amortization of acquired intangible assets in the Asset-Light segment. 2. Represents change in fair value of the contingent earnout consideration recorded for the MoLo acquisition. |
|
RECONCILIATIONS OF GAAP TO NON-GAAP FINANCIAL MEASURES* (Unaudited) 2019 2020 2021 2022 2023 2024 3Q’25 TTM ArcBest Consolidated – Operating Income ($ millions) Amounts on a GAAP basis $57.9 $ 93.7 $ 277.0 $ 394.5 $ 172.6 $ 244.4 $ 136.7 Innovative technology costs, pre-tax (2) 20.7 25.6 32.8 40.8 52.4 34.1 29.9 Purchase accounting amortization, pre-tax (3) 4.2 3.7 5.3 12.9 12.8 12.8 12.8 Change in fair value of contingent consideration, pre-tax (4) - - - 18.3 (19.1) (90.3) (12.2) Asset impairment charges, pre-tax (5) 26.5 - - - 30.2 1.7 1.7 Legal settlement, pre-tax (6) - - - - 9.5 0.3 0.3 Gain on sale of certain properties, pre-tax (7) - - - - - - (15.7) Gain on sale of subsidiaries, pre-tax (8) - - (6.9) (0.4) - - - Nonunion vacation policy enhancement, pre-tax (9) - - - 2.0 - - - Transaction costs, pre-tax (10) - - 6.0 - - - - ELD conversion costs, pre-tax (11) 2.7 - - - - - - Nonunion pension termination costs, pre-tax (12) 0.3 - - - - - - Non-GAAP amounts (13) $ 112.3 $ 123.1 $ 314.1 $ 468.1 $ 258.3 $ 203.0 $ 153.5 44 ADDITIONAL INFORMATION ArcBest Consolidated (continuing operations)(1) *See “Notes to Non-GAAP Financial Tables” for footnotes to this ArcBest Consolidated non-GAAP table |
|
RECONCILIATIONS OF GAAP TO NON-GAAP FINANCIAL MEASURES* (Unaudited) 2019 2020 2021 2022 2023 2024 3Q’25 TTM ArcBest Consolidated – Diluted Earnings Per Share Amounts on a GAAP basis $ 1.33 $ 2.55 $ 7.86 $ 11.56 $ 5.77 $ 7.28 $ 4.26 Innovative technology costs, after-tax (includes related financing costs) (2) 0.59 0.74 0.93 1.21 1.61 1.10 1.00 Purchase accounting amortization, after-tax (3) 0.12 0.11 0.15 0.38 0.39 0.40 0.42 Life insurance proceeds and changes in cash surrender value (0.14) (0.09) (0.15) 0.11 (0.19) (0.14) (0.15) Tax expense (benefit) from vested RSUs (14) 0.02 0.02 (0.29) (0.32) (0.21) (0.47) 0.04 Asset impairment charges, after-tax (5) 0.75 - - - 0.92 0.05 0.06 Legal settlement, after-tax (6) - - - - 0.29 0.01 0.01 Change in fair value of equity investment, after-tax (15) - - - - (0.11) 0.91 (0.40) Gain on sale of certain properties, pre-tax (7) - - - - - - (0.52) Change in fair value of contingent consideration, after-tax (4) - - - 0.54 (0.58) (2.85) - Gain on sale of subsidiaries, after-tax (8) - - (0.20) (0.01) - - - Nonunion vacation policy enhancement, after-tax (9) - - - 0.06 - - - Tax credits (16) (0.10) (0.05) (0.06) 0.01 - - - Transaction costs, after-tax (10) - - 0.16 - - - - ELD conversion costs, after-tax (11) 0.08 - - - - - - Nonunion pension termination costs, after-tax (12) 0.01 - - - - - - Nonunion pension expense, including settlement expense, after-tax (17) 0.30 - - - - - - Non-GAAP amounts (13) $ 2.96 $ 3.28 $ 8.40 $ 13.52 $ 7.88 $ 6.28 $ 4.72 45 ADDITIONAL INFORMATION ArcBest Consolidated (continuing operations)(1) *See “Notes to Non-GAAP Financial Tables” for footnotes to this ArcBest Consolidated non-GAAP table |
|
RECONCILIATIONS OF GAAP TO NON-GAAP FINANCIAL MEASURES* (Unaudited) 2019 2020 2021 2022 2023 2024 3Q’25 TTM Asset-Based – Operating Income ($ millions, except percentages) Amounts on a GAAP basis $ 102.1 95.2% $ 98.9 95.3% $ 260.7 89.9% $ 381.1 87.3% $ 253.2 91.2% $ 242.6 91.2% $ 199.9 92.7% Gain on sale of certain properties, pre-tax (7) - - - - - - - - - - - - (15.7) 0.6 Innovative technology costs, pre-tax (2) 13.7 (0.6) 22.5 (1.1) 27.6 (1.1) 27.2 (0.9) 21.7 (0.8) - - - - Asset impairment charges, pre-tax (5) - - - - - - - - 0.7 - - - - - Nonunion vacation policy enhancement, pre-tax (9) - - - - - - 1.2 - - - - - - - ELD conversion costs, pre-tax (11) 2.7 (0.1) - - - - - - - - - - - - Nonunion pension termination costs, pre-tax (12) 0.3 - - - - - - - - - - - - - Non-GAAP amounts (13) $ 118.8 94.5% $ 121.3 94.2% $ 288.3 88.8% $ 409.6 86.4% $ 275.5 90.4% $ 242.6 91.2% $ 184.2 93.3% Asset-Based 46 *See “Notes to Non-GAAP Financial Tables” for footnotes to this Asset-Based non-GAAP table ADDITIONAL INFORMATION |
|
RECONCILIATIONS OF GAAP TO NON-GAAP FINANCIAL MEASURES* (Unaudited) 2019 2020 2021 2022 2023 2024 3Q’25 TTM Asset-Light – Operating Income (Loss) ($ millions) Amounts on a GAAP basis $ (20.2) $ 9.7 $ 46.4 $ 52.7 $ (12.3) $ 58.4 (7.0) Purchase accounting amortization, pre-tax (3) 4.2 3.8 5.3 12.9 12.8 12.8 12.8 Change in fair value of contingent consideration, pre-tax (4) - - - 18.3 (19.1) (90.3) (12.2) Legal settlement, pre-tax (6) - - - - 9.5 0.3 0.3 Asset impairment charges, pre-tax (5) 26.5 - - - 14.4 1.7 1.7 Gain on sale of subsidiaries, pre-tax (8) - - (6.9) (0.4) - - - Nonunion vacation policy enhancement, pre-tax (9) - - - 0.3 - - - Non-GAAP amounts (13) $ 10.5 $ 13.4 $ 44.7 $ 83.8 $ 5.3 $ (17.1) $ (4.4) 47 ADDITIONAL INFORMATION Asset-Light *See “Notes to Non-GAAP Financial Tables” for footnotes to this ArcBest Consolidated non-GAAP table |
|
RECONCILIATIONS OF GAAP TO NON-GAAP FINANCIAL MEASURES* (Unaudited) 2019 2020 2021 2022 2023 2024 3Q’25 TTM ArcBest Consolidated – Adjusted EBITDA (21) ($ millions) Net Income (Amounts on a GAAP basis from continuing operations) $ 35.2 $ 67.3 $ 210.5 $ 294.6 $ 142.2 $ 173.4 $ 97.2 Interest and other related financing costs 11.5 11.7 8.9 7.7 9.1 9.0 11.4 Income tax provision 10.1 20.4 62.6 93.7 44.8 45.4 33.9 Depreciation and amortization (19) 111.1 116.8 122.6 138.2 145.3 149.1 164.7 Amortization of share-based compensation 9.4 10.3 11.2 12.5 11.4 11.4 11.2 Change in fair value of contingent consideration (4) - - - 18.3 (19.1) (90.3) (12.2) Asset impairment charges (5) 26.5 - - - 30.2 1.7 1.7 Legal settlement (6) - - - - 9.5 0.3 0.3 Change in fair value of equity investment (15) - - - - (3.7) 28.7 - Gain on sale of subsidiaries, after-tax (8) - - (6.9) (0.4) - - - Transaction costs, after-tax (10) - - 6.0 - - - - Amortization of actuarial losses of benefit plans and pension settlement expense (20) 9.8 - - - - - - Consolidated Adjusted EBITDA (13) $ 213.6 $ 226.5 $ 414.8 $ 564.6 $ 369.6 $ 328.6 $ 308.2 48 ADDITIONAL INFORMATION ArcBest Consolidated (continuing operations)(1) *See “Notes to Non-GAAP Financial Tables” for footnotes to this ArcBest Consolidated non-GAAP table |
|
RETURN ON CAPITAL EMPLOYED (ROCE)(18) 2019 2020 2021 2022 2023 2024 3Q’25 TTM (Unaudited, $ millions) Net Income (Amounts on a GAAP basis from continuing operations) $ 35.2 $ 67.3 $ 210.5 $ 294.6 $ 142.2 $ 173.4 $ 97.2 Innovative technology costs, after-tax (includes related financing costs) (2) 15.7 19.6 24.9 30.8 39.7 26.1 22.8 Purchase accounting amortization, after-tax (3) 3.1 2.8 3.9 9.6 9.6 9.6 9.6 Changes in cash surrender value and gains on life insurance policies (3.7) (2.3) (4.1) 2.7 (4.6) (3.3) (3.4) Tax expense (benefit) from vested RSUs (14) 0.5 0.5 (7.6) (8.1) (5.3) (11.3) 1.0 Change in fair value of contingent consideration, after-tax (4) - - - 13.6 (14.4) (67.9) (9.1) Asset impairment charges, after-tax (5) 19.8 - - - 22.6 1.3 1.3 Legal settlement, after-tax (6) - - - - 7.1 0.2 0.2 Gain on sale of certain properties, after-tax (7) - - - - - - (11.8) Change in fair value of equity investment, after-tax (15) - - - - (2.8) 21.6 - Gain on sale of subsidiaries, after-tax (8) - - (5.4) (0.3) - - - Nonunion vacation policy enhancement, after-tax (9) - - - 1.5 - - - Tax credits (16) (2.5) (1.3) (1.5) 0.2 - - - Transaction costs, after-tax (10) - - 4.4 - - - - Nonunion pension expense, including settlement expense, after-tax (17) 8.0 0.1 - - - - - ELD conversion costs, after-tax (11) 2.0 - - - - - - Nonunion pension termination costs, after-tax (12) 0.3 - - - - - - After-tax interest expense (21) 8.7 8.8 6.5 5.7 6.7 6.6 8.5 ROCE Earnings (13) $ 87.1 $ 95.5 $ 231.5 $ 350.5 $ 200.8 $ 156.3 $ 116.3 Beginning equity 717.7 763.0 828.6 929.1 1,151.4 1,242.4 1,307.1 Ending equity 763.0 828.6 929.1 1,151.4 1,242.4 1,314.4 1,322.9 Average Total Equity (22) $ 740.4 $ 795.8 $ 878.8 $ 1,040.2 $ 1,196.9 $ 1,278.4 $ 1,315.0 Beginning debt 291.7 323.5 284.2 225.5 264.6 228.9 180.5 Ending debt 323.5 284.2 225.5 264.6 228.9 189.1 214.1 Average Total Debt (23) $ 307.6 $ 303.9 $ 254.9 $ 245.1 $ 246.8 $ 209.0 $ 197.3 Average Capital Employed $ 1,048.0 $ 1,099.7 $ 1,133.7 $ 1285.3 $ 1,443.7 $ 1,487.4 $ 1,512.3 ROCE (percent) 8% 9% 20% 27% 14% 11% 8% 49 ArcBest Consolidated (continuing operations)(1) *See “Notes to Non-GAAP Financial Tables” for footnotes to this ArcBest Consolidated non-GAAP table ADDITIONAL INFORMATION |
|
Notes to Non-GAAP Financial Tables The following footnotes apply to the non-GAAP financial tables on the previous six slides in this presentation: 1) Historical results of FleetNet have been excluded from results for all periods presented, and reclassifications have been made to the prior-period financial statements to conform to current-year presentation. 2) Represents costs related to our customer pilot offering of Vaux and initiatives to optimize our performance through technological innovation. The 2019-2023 periods also include costs associated with the freight handling pilot test program at ABF Freight, for which the decision was made to pause the pilot during third quarter 2023. Costs for 2019-2020 have been adjusted to conform to the current-year presentation. 3) Represents the amortization of acquired intangible assets in the Asset-Light segment. 4) Represents change in fair value of the contingent earnout consideration recorded for the MoLo acquisition. 5) The 2024 periods represent noncash asset impairment charges for certain revenue equipment and software recognized during fourth quarter 2024 as part of a strategic decision to adjust capacity within Asset-Light’s operations. The 2023 period represents noncash lease-related impairment charges for a freight handling pilot facility, an Asset-Based service center, and Asset-Light office spaces that were made available for sublease. The 2019 period represents a noncash impairment charge recognized in fourth quarter related to a portion of the goodwill, customer relationship intangible assets, and revenue equipment associated with the acquisition of truckload brokerage and truckload dedicated businesses within the Asset-Light segment. 6) Represents settlement expenses related to the classification of certain Asset-Light employees under the Fair Labor Standards Act, which were paid during first quarter 2025. 7) Primarily includes gains on two service center sales within the Asset-Based operations. 8) Gains associated with the April 2021 divestures of moving services subsidiaries for which the gains were recognized in second quarter 2021, respectively, when the contingent consideration was received on the transactions, as well as including the contingent amount recognized in second quarter 2022 when the funds were released to escrow. 9) Represents a one-time, noncash charge for enhancements to our nonunion vacation policy which were effective third quarter 2022. 10) Represents costs associated with the November 1, 2021, acquisition of MoLo Solutions, LLC. 11) Impairment charges related to equipment replacement and other one-time costs incurred to comply with the electronic logging device (“ELD”) mandate which became effective in December 2019. 12) Consulting fee incurred in third quarter 2019 associated with the termination of the nonunion defined benefit pension plan. 13) Non-GAAP amounts are calculated in total and may not equal the sum of the GAAP and the non-GAAP adjustments due to rounding. 14) Represents recognition of the tax impact for the vesting of share-based compensation. 15) For 2024, represents a noncash impairment charge to write off an equity investment in Phantom Auto, a provider of human-centered remote operation software, which ceased operations during first quarter 2024. For 2023, represents the increase in fair value of an investment in Phantom Auto based on observable price changes during second quarter 2023. 16) Represents tax credits recognized in the tax provision which relate to a prior tax year due to timing of recognition or retroactive reinstatement of the tax credits. Includes amounts related to alternative fuel tax credit in 2018, 2019 and 2022. Includes amounts related to research and development tax credit in 2019, 2020 and 2021. The 2022 period also includes amounts related to the alternative fuel tax credit for the year ended December 31, 2021 which were recorded in third quarter 2022. 17) Represents nonunion pension expense, including pension settlement and termination expense, related to the Company’s nonunion defined benefit pension plan for which plan termination was completed in 2019. Also includes pension settlement expense related to the Company’s supplemental benefit plan. 18) Management uses Adjusted Return on Capital Employed (ROCE) as a measure of the profitability of the company's capital employed in its business operations. ROCE is a good indicator of long-term company and management performance as it relates to capital efficiency. The calculation of ROCE as presented below begins with the numerator of Net Income from Continuing Operations and the denominator of Average Debt and Average Total Equity. The Net Income from Continuing Operations is adjusted for Non-GAAP items and after-tax interest expense. 19) Includes amortization of intangibles associated with acquired businesses. 20) Includes pre-tax pension settlement expense of $4.2 million related to the Company’s nonunion defined benefit pension plan, for which plan termination was completed as of December 31, 2019,and a $4.0 million noncash pension termination expense related to an amount which was stranded in accumulated other comprehensive income until the pension benefit obligation was settled upon plan termination. 21) After-tax interest expense is interest and other related financing costs, net of an assumed 25.7% tax rate 3Q’25 TTM. 22) Average total equity is the average of the beginning and ending total stockholders’ equity. 23) Average total debt is the average of the beginning and ending current portion of long-term debt and long-term debt, less current portion. 50 ADDITIONAL INFORMATION |