UNITED STATES
SECURITIES AND EXCHANGE COMMISSION
Washington, D.C. 20549
FORM 10-Q
(Mark One)
☒ |
QUARTERLY REPORT PURSUANT TO SECTION 13 OR 15(d) OF THE SECURITIES EXCHANGE ACT OF 1934 |
For the quarterly period ended September 30, 2025
☐ |
TRANSITION REPORT PURSUANT TO SECTION 13 OR 15(d) OF THE SECURITIES EXCHANGE ACT OF 1934 |
For the transition period from ______ to ______
Commission File Number: 001-34857

Gold Resource Corporation
(Exact Name of Registrant as Specified in its charter)
Colorado |
84-1473173 |
|
(State or other jurisdiction of incorporation or organization) |
(I.R.S. Employer Identification No.) |
7900 E. Union Ave, Suite 320, Denver, Colorado 80237
(Address of Principal Executive Offices) (Zip Code)
(303) 320-7708
(Registrant’s telephone number including area code)
Securities registered pursuant to Section 12(b) of the Act:
a |
||
Title of each class |
Trading Symbol |
Name of each exchange where registered |
Common Stock, $0.001 par value |
GORO |
NYSE American |
Indicate by check mark whether the registrant (1) has filed all reports required to be filed by Section 13 or 15(d) of the Securities Exchange Act of 1934 during the preceding 12 months (or for such shorter period that the registrant was required to file such reports), and (2) has been subject to such filing requirements for the past 90 days.Yes⌧No◻
Indicate by check mark whether the registrant has submitted electronically every Interactive Data File required to be submitted pursuant to Rule 405 of Regulation S-T (§232.405 of this chapter) during the preceding 12 months (or for such shorter period that the registrant was required to submit such files). Yes⌧No◻
Indicate by check mark whether the registrant is a large accelerated filer, an accelerated filer, a non-accelerated filer, a smaller reporting company, or an emerging growth company. See definitions of “large accelerated filer”, “accelerated filer”, “smaller reporting company”, and “emerging growth company” in Rule 12b-2 of the Exchange Act.
Large accelerated filer |
◻ |
Accelerated filer |
◻ |
|
|
|
|
Non-accelerated filer |
☒ |
Smaller reporting company |
☒ |
|
|
|
|
|
|
Emerging growth company |
☐ |
If an emerging growth company, indicate by check mark if the registrant has elected not to use the extended transition period for complying with any new or revised financial accounting standards provided pursuant to Section 13(a) of the Exchange Act◻
Indicate by check mark whether registrant is a shell company (as defined in Rule 12b-2 of the Exchange Act). Yes☐No⌧
Indicate the number of shares outstanding of each of the issuer’s classes of common stock, as of the latest practicable date: 161,765,685 shares of common stock outstanding as of October 31, 2025.
GOLD RESOURCE CORPORATION
FORM 10-Q
Table of Contents
|
|
|
Page |
|
|
3 |
|
|
|
|
|
|
|
5 |
|
Condensed Consolidated Interim Financial Statements and Notes |
5 |
||
|
|
5 |
|
|
|
6 |
|
|
|
7 |
|
|
|
9 |
|
|
|
10 |
|
|
Management’s Discussion and Analysis of Financial Condition and Results of Operations |
35 |
|
|
58 |
||
|
60 |
||
|
|
|
|
|
|
61 |
|
|
61 |
||
|
61 |
||
|
61 |
||
|
61 |
||
|
61 |
||
|
61 |
||
|
62 |
||
63 |
|||
|
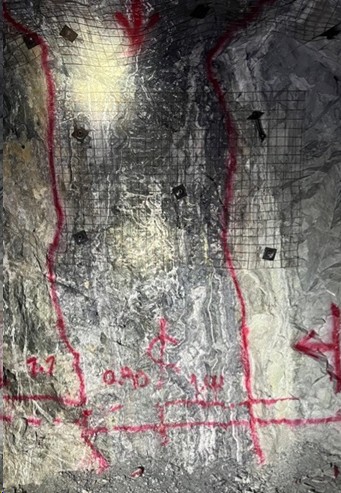
DDGM Processing Plant |
Gold Resource Corporation—Condensed Consolidated Interim Financial Statements and Notes (Unaudited) 2 A summary for the three months ended September 30, 2025 is presented below and discussed further under Item 2—Management’s Discussion and Analysis of Financial Condition and Results of Operations:
THIRD QUARTER 2025 SUMMARY
Don David Gold Mine (“DDGM”)
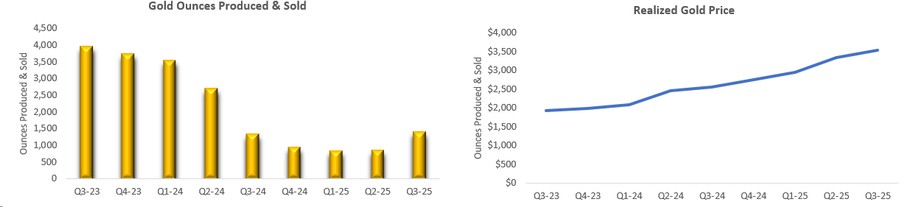
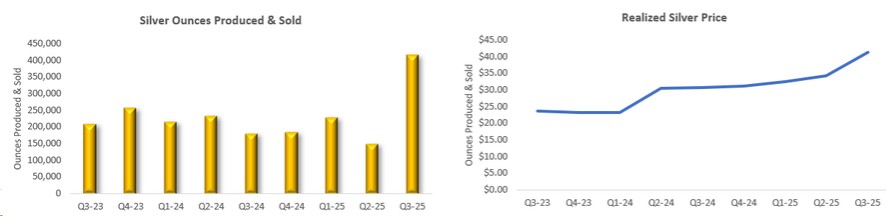
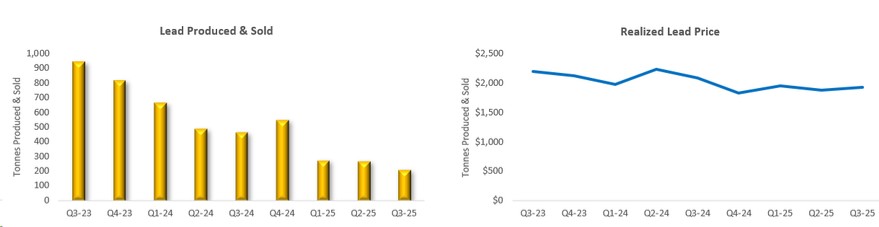
| ● | In the third quarter of 2025, DDGM, located in Mexico, produced and sold a total of 6,298 gold equivalent (“AuEq”) ounces, comprised of 1,422 gold ounces and 417,710 silver ounces, at an average sales price per ounce of $3,546 and $41.39, respectively. |
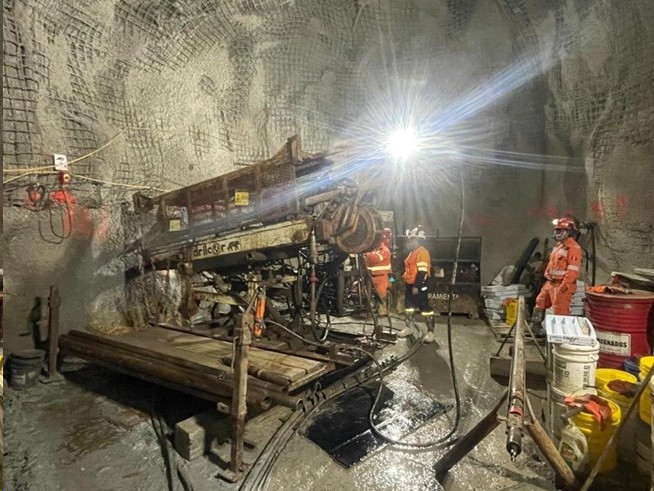
| ● | By the end of the third quarter, the Company began receiving newly acquired equipment and, when combined with the strategic use of third-party contractors, this enabled an increase in available headings and a subsequent improvement in production. |
| ● | Underground grade control and infill drilling advanced as planned at the Three Sisters vein system, focused on the Sandy and Sadie vein sets. Results from this work continue to refine and validate the geologic model, supporting near-term production planning. Additional drilling targeted the Splay 31, Marena North, Candelaria, and Viridiana veins in the Arista system, and the Soledad South vein in the Switchback system. These programs aim to optimize economic returns from near-term production across multiple vein systems. Underground exploration drilling remains on hold, with step-out targets at Three Sisters and Arista planned for future drill testing following completion of necessary development and improvements in the Company’s working capital position. |
Corporate and Financial
| ● | The Company has $12.8 million in working capital and $9.8 million in cash and cash equivalents as of September 30, 2025. |
| ● | On September 8, 2025, the Company closed on a $11.4 million registered direct offering for the sale of 25,315,954 shares of the Company’s common stock at a price of $0.45 per share. The Company issued 14,204,846 of these shares, for the fair value of approximately $6.4 million, to fully pay off the term loan received in June 2025 as a non-cash equity settlement. |
| ● | The Company had a net loss of $4.7 million, or $0.03 per share, for the quarter, which was primarily the result of lower tonnes produced and less ounces sold. Early in the quarter, output was constrained by limited access to critical mining equipment, stemming from an aging fleet, and by a shortage of alternative ore production headings, but by the end of the third quarter, as mentioned above, the Company made improvements to overcome some of these challenges, and thus increased production. |
| ● | Total cash cost after co-product credits for the quarter was $2,116 per AuEq ounce, and total all-in sustaining cost (“AISC”) after co-product credits for the quarter was $2,983 per AuEq ounce. (See Item 2—Management’s Discussion and Analysis of Financial Condition and Results of Operations—Non-GAAP Measures for a reconciliation of non-GAAP measures to applicable U.S. GAAP measures). |
Liquidity Update
Tonnes produced from the mining operations at DDGM year-to-date 2025 remain lower than in the previous year and, except for silver, grades were lower as well. The Company continued to encounter significant issues with equipment availability partway into the third quarter due to the age and condition of some of the critical mining equipment in use at the mine. Due to the challenges with equipment availability, the Company was not able to maintain its projected timeline for mine development and had limited flexibility to mine alternate headings. In addition, the mill continued to experience mechanical issues that resulted in lower throughput, and when combined with the lower tonnes mined, resulted in a production shortfall. To minimize the mechanical issues and return the mine to a cash positive position, the Company engaged a third-party contract miner during the third quarter of 2025
Gold Resource Corporation—Condensed Consolidated Interim Financial Statements and Notes (Unaudited) 3 and started to upgrade its mining fleet.
As a result, by the end of the third quarter, the Company was able to increase production from a number of production headings.
The Company believes that the mine has the potential to generate positive cash flow based on the information to date from the new Three Sisters area, as well as other zones that have been discovered near existing headings. The Company is in the process of developing access to and drill-defining these new areas. With the improvements mentioned above, the Company is expecting the remaining months of 2025 to result in positive operating income.
In 2025, the Company has been focused on improving its cash position through the issuance of debt and equity. The Company raised $2.5 million through a registered direct offering in January 2025. In September 2025, the Company closed on a second registered direct offering of $11.4 million for the sale of 25,315,954 shares of the Company’s common stock at a price of $0.45 per share. The Company issued 14,204,846 of these shares, for the fair value of approximately $6.4 million, to fully pay off the term loan received in June 2025 as a non-cash equity settlement. In February 2025, the Company sold its interest in Green Light Metals for $0.9 million in proceeds. On May 7, 2025, the Company received a tax refund of 79.6 million pesos (approximately $4.0 million) related to DDGM taxes paid in 2023. During the nine months ended September 30, 2025, the Company raised approximately $8.6 million through its At-The-Market Offering (“ATM”) Program, after deducting the agent’s commissions and other expenses.
Although the Company has significantly improved its financial position year to date, the lower production and grades from the mine through the third quarter of 2025 raise substantial doubt about the Company’s ability to continue as a going concern, as reflected by the year-to-date net losses of $24.5 million and the cash used in operations of $2.5 million. Although the Company believes that there is adequate financing in place to cover the planned underground development and equipment improvements, there can be no assurances that the Company will achieve short-term production targets and therefore may continue with liquidity concerns.
Gold Resource Corporation—Condensed Consolidated Interim Financial Statements and Notes (Unaudited) 4 PART I - FINANCIAL INFORMATION
ITEM 1. Financial Statements
GOLD RESOURCE CORPORATION
CONDENSED CONSOLIDATED INTERIM BALANCE SHEETS
(U.S. dollars in thousands, except share amounts)
(Unaudited)
|
|
As of |
|
As of |
||
|
|
September 30, |
|
December 31, |
||
|
Note |
2025 |
|
2024 |
||
ASSETS |
|
|
|
|
|
|
Current assets: |
|
|
|
|
|
|
Cash and cash equivalents |
|
$ |
9,797 |
|
$ |
1,628 |
Accounts receivable, net |
|
|
12,939 |
|
|
2,184 |
Inventories, net |
6 |
|
7,196 |
|
|
6,940 |
Prepaid expenses and other current assets |
8 |
|
1,293 |
|
|
5,828 |
Total current assets |
|
|
31,225 |
|
|
16,580 |
Property, plant, and mine development, net |
9 |
|
132,453 |
|
|
128,389 |
Other non-current assets |
10 |
|
661 |
|
|
905 |
Total assets |
|
$ |
164,339 |
|
$ |
145,874 |
LIABILITIES AND SHAREHOLDERS’ EQUITY |
|
|
|
|
|
|
Current liabilities: |
|
|
|
|
|
|
Accounts payable |
|
$ |
13,857 |
|
$ |
11,258 |
Mining royalty taxes payable, net |
|
|
632 |
|
|
195 |
Accrued expenses and other current liabilities |
11 |
|
3,908 |
|
|
3,031 |
Total current liabilities |
|
|
18,397 |
|
|
14,484 |
Reclamation and remediation liabilities |
13 |
|
12,494 |
|
|
10,669 |
Gold and silver stream agreements liability |
12 |
|
86,491 |
|
|
74,432 |
Deferred tax liabilities, net |
7 |
|
15,264 |
|
|
14,041 |
Contingent consideration |
15 |
|
3,501 |
|
|
3,389 |
Other non-current liabilities |
11 |
|
2,230 |
|
|
1,576 |
Total liabilities |
|
|
138,377 |
|
|
118,591 |
|
|
|
|
|
|
|
Commitments and contingencies |
15 |
|
|
|
|
|
|
|
|
|
|
|
|
Shareholders’ equity: |
|
|
|
|
|
|
Common stock - $0.001 par value, 200,000,000 shares authorized: |
|
|
162 |
|
|
96 |
Additional paid-in capital |
|
|
138,392 |
|
|
115,319 |
Accumulated deficit |
|
|
(105,537) |
|
|
(81,077) |
Treasury stock at cost, 336,398 shares |
|
|
(5,884) |
|
|
(5,884) |
Accumulated other comprehensive loss |
|
|
(1,171) |
|
|
(1,171) |
Total shareholders’ equity |
|
|
25,962 |
|
|
27,283 |
Total liabilities and shareholders’ equity |
|
$ |
164,339 |
|
$ |
145,874 |
The accompanying notes are an integral part of these Condensed Consolidated Interim Financial Statements.
Gold Resource Corporation—Condensed Consolidated Interim Financial Statements and Notes (Unaudited)
5
GOLD RESOURCE CORPORATION
CONDENSED CONSOLIDATED INTERIM STATEMENTS OF OPERATIONS
(U.S. dollars in thousands, except share and per share amounts)
(Unaudited)
|
|
For the three months ended |
|
For the nine months ended |
||||||||
|
|
September 30, |
|
September 30, |
||||||||
|
Note |
2025 |
|
2024 |
|
2025 |
|
2024 |
||||
|
|
|
|
Restated |
|
|
|
|
Restated |
|||
|
|
|
|
|
|
|
|
|
|
|
|
|
Sales, net |
5 |
$ |
24,878 |
|
$ |
13,272 |
|
$ |
48,460 |
|
$ |
52,756 |
Cost of sales: |
|
|
|
|
|
|
|
|
|
|
|
|
Production costs |
|
|
15,613 |
|
|
17,198 |
|
|
39,179 |
|
|
51,074 |
Depreciation and amortization |
|
|
2,610 |
|
|
4,178 |
|
|
7,670 |
|
|
14,221 |
Reclamation and remediation |
|
|
434 |
|
|
566 |
|
|
1,262 |
|
|
1,892 |
Total cost of sales |
|
|
18,657 |
|
|
21,942 |
|
|
48,111 |
|
|
67,187 |
Mine gross profit (loss) |
|
|
6,221 |
|
|
(8,670) |
|
|
349 |
|
|
(14,431) |
Costs and expenses: |
|
|
|
|
|
|
|
|
|
|
|
|
General and administrative expenses |
|
|
1,205 |
|
|
1,293 |
|
|
2,993 |
|
|
2,975 |
Mexico exploration expenses |
|
|
799 |
|
|
767 |
|
|
1,649 |
|
|
1,850 |
Michigan Back Forty Project expenses |
|
|
191 |
|
|
177 |
|
|
562 |
|
|
524 |
Stock-based compensation |
19 |
|
403 |
|
|
203 |
|
|
1,198 |
|
|
647 |
Other expense, net |
20 |
|
7,337 |
|
|
5,175 |
|
|
16,952 |
|
|
14,246 |
Total costs and expenses |
|
|
9,935 |
|
|
7,615 |
|
|
23,354 |
|
|
20,242 |
Loss before income taxes |
|
|
(3,714) |
|
|
(16,285) |
|
|
(23,005) |
|
|
(34,673) |
Income tax provision (benefit) |
7 |
|
941 |
|
|
(3,608) |
|
|
1,455 |
|
|
10,686 |
Net loss |
|
$ |
(4,655) |
|
$ |
(12,677) |
|
$ |
(24,460) |
|
$ |
(45,359) |
Net loss per common share: |
|
|
|
|
|
|
|
|
|
|
|
|
Basic and diluted net loss per common share |
21 |
$ |
(0.03) |
|
$ |
(0.14) |
|
$ |
(0.19) |
|
$ |
(0.50) |
|
|
|
|
|
|
|
|
|
|
|
|
|
Weighted average shares outstanding: |
|
|
|
|
|
|
|
|
|
|
|
|
Basic and diluted |
21 |
|
142,909,014 |
|
|
93,279,750 |
|
|
129,081,618 |
|
|
91,005,507 |
The accompanying notes are an integral part of these Condensed Consolidated Interim Financial Statements.
Gold Resource Corporation—Condensed Consolidated Interim Financial Statements and Notes (Unaudited)
6
GOLD RESOURCE CORPORATION
CONDENSED CONSOLIDATED INTERIM STATEMENTS OF CHANGES IN SHAREHOLDERS’ EQUITY
(U.S. dollars in thousands, except share amounts)
(Unaudited)
|
|
For the three months ended September 30, 2025 and 2024 |
||||||||||||||||||
|
|
Number of |
|
Par Value of |
|
Additional Paid- |
|
Accumulated Deficit |
|
Treasury |
|
Accumulated |
|
Total |
||||||
Balance, June 30, 2024 |
|
92,629,246 |
|
$ |
93 |
|
$ |
114,049 |
|
$ |
(57,258) |
|
$ |
(5,884) |
|
$ |
(1,171) |
|
$ |
49,829 |
Stock-based compensation |
|
- |
|
|
- |
|
|
184 |
|
|
- |
|
|
- |
|
|
- |
|
|
184 |
Issuance of common stock, net of issuance costs (1) |
|
1,230,180 |
|
|
1 |
|
|
598 |
|
|
- |
|
|
- |
|
|
- |
|
|
599 |
Net loss |
|
- |
|
|
- |
|
|
- |
|
|
(12,677) |
|
|
- |
|
|
- |
|
|
(12,677) |
Balance, September 30, 2024 - Restated |
|
93,859,426 |
|
$ |
94 |
|
$ |
114,831 |
|
$ |
(69,935) |
|
$ |
(5,884) |
|
$ |
(1,171) |
|
$ |
37,935 |
|
|
|
|
|
|
|
|
|
|
|
|
|
|
|
|
|
|
|
|
|
Balance, June 30, 2025 |
|
136,786,129 |
|
$ |
137 |
|
$ |
126,958 |
|
$ |
(100,882) |
|
$ |
(5,884) |
|
$ |
(1,171) |
|
$ |
19,158 |
Stock-based compensation |
|
- |
|
|
- |
|
|
72 |
|
|
- |
|
|
- |
|
|
- |
|
|
72 |
Registered Direct Offering (2) |
|
11,111,108 |
|
|
11 |
|
|
4,984 |
|
|
- |
|
|
- |
|
|
- |
|
|
4,995 |
Issuance of equity to settle the loan (2) |
|
14,204,846 |
|
|
14 |
|
|
6,378 |
|
|
- |
|
|
- |
|
|
- |
|
|
6,392 |
Net loss |
|
- |
|
|
- |
|
|
- |
|
|
(4,655) |
|
|
- |
|
|
- |
|
|
(4,655) |
Balance, September 30, 2025 |
|
162,102,083 |
|
$ |
162 |
|
$ |
138,392 |
|
$ |
(105,537) |
|
$ |
(5,884) |
|
$ |
(1,171) |
|
$ |
25,962 |
| (1) | No shares of the Company’s common stock were sold through the ATM Program during the three months ended September 30, 2025. 1,230,180 shares of the Company’s common stock were sold through the ATM Program during the three months ended September 30, 2024, for net proceeds of approximately $0.6 million to the Company, after deducting the agent’s commissions and other fees. Please also see Note—16 Shareholder’s Equity in Item 1—Condensed Consolidated Interim Financial Statements and Notes (unaudited) for additional information. |
| (2) | In September 2025, the Company closed on a $11.4 million registered direct offering for the sale of 25,315,954 shares of the Company’s common stock at a price of $0.45 per share. The Company issued 14,204,846 of these shares, for the fair value of approximately $6.4 million, to fully pay off the term loan received in June 2025 as a non-cash equity settlement. |
The accompanying notes are an integral part of these Condensed Consolidated Interim Financial Statements.
Gold Resource Corporation—Condensed Consolidated Interim Financial Statements and Notes (Unaudited)
7
GOLD RESOURCE CORPORATION
CONDENSED CONSOLIDATED INTERIM STATEMENTS OF CHANGES IN SHAREHOLDERS’ EQUITY
(U.S. dollars in thousands, except share amounts)
(Unaudited)
|
|
For the nine months ended September 30, 2025 and 2024 |
||||||||||||||||||
|
|
Number of |
|
Par Value of |
|
Additional Paid- |
|
Accumulated Deficit |
|
Treasury |
|
Accumulated |
|
Total |
||||||
Balance, December 31, 2023 |
|
89,030,436 |
|
$ |
89 |
|
$ |
111,970 |
|
$ |
(24,576) |
|
$ |
(5,884) |
|
$ |
(1,171) |
|
$ |
80,428 |
Stock-based compensation |
|
- |
|
|
- |
|
|
463 |
|
|
- |
|
|
- |
|
|
- |
|
|
463 |
Common stock issued for vested restricted stock units |
|
196,991 |
|
|
- |
|
|
- |
|
|
- |
|
|
- |
|
|
- |
|
|
- |
Issuance of common stock, net of issuance costs (1) |
|
4,708,993 |
|
|
5 |
|
|
2,429 |
|
|
- |
|
|
- |
|
|
- |
|
|
2,434 |
Surrender of common stock for taxes due on vesting |
|
(76,994) |
|
|
- |
|
|
(31) |
|
|
- |
|
|
- |
|
|
- |
|
|
(31) |
Net loss |
|
- |
|
|
- |
|
|
- |
|
|
(45,359) |
|
|
- |
|
|
- |
|
|
(45,359) |
Balance, September 30, 2024 - Restated |
|
93,859,426 |
|
$ |
94 |
|
$ |
114,831 |
|
$ |
(69,935) |
|
$ |
(5,884) |
|
$ |
(1,171) |
|
$ |
37,935 |
|
|
|
|
|
|
|
|
|
|
|
|
|
|
|
|
|
|
|
|
|
Balance, December 31, 2024 |
|
95,661,347 |
|
$ |
96 |
|
$ |
115,319 |
|
$ |
(81,077) |
|
$ |
(5,884) |
|
$ |
(1,171) |
|
$ |
27,283 |
Stock-based compensation |
|
- |
|
|
- |
|
|
278 |
|
|
- |
|
|
- |
|
|
- |
|
|
278 |
Common stock issued for vested restricted stock units |
|
577,529 |
|
|
- |
|
|
- |
|
|
- |
|
|
- |
|
|
- |
|
|
- |
Issuance of common stock, net of issuance costs (1) |
|
25,139,655 |
|
|
25 |
|
|
8,615 |
|
|
- |
|
|
- |
|
|
- |
|
|
8,640 |
Surrender of common stock for taxes due on vesting |
|
(283,642) |
|
|
- |
|
|
(93) |
|
|
- |
|
|
- |
|
|
- |
|
|
(93) |
Equity settlement of PSUs and DSUs (2) |
|
66,240 |
|
|
- |
|
|
42 |
|
|
- |
|
|
- |
|
|
- |
|
|
42 |
Registered Direct Offerings (3) |
|
26,736,108 |
|
|
27 |
|
|
7,468 |
|
|
- |
|
|
- |
|
|
- |
|
|
7,495 |
Issuance of equity to settle the loan (3) |
|
14,204,846 |
|
|
14 |
|
|
6,378 |
|
|
- |
|
|
- |
|
|
- |
|
|
6,392 |
Warrants (4) |
|
- |
|
|
- |
|
|
385 |
|
|
- |
|
|
- |
|
|
- |
|
|
385 |
Net loss |
|
- |
|
|
- |
|
|
- |
|
|
(24,460) |
|
|
- |
|
|
- |
|
|
(24,460) |
Balance, September 30, 2025 |
|
162,102,083 |
|
$ |
162 |
|
$ |
138,392 |
|
$ |
(105,537) |
|
$ |
(5,884) |
|
$ |
(1,171) |
|
$ |
25,962 |
| (1) | An aggregate of 25,139,655 shares of the Company’s common stock were sold through the ATM Program during the nine months ended September 30, 2025, for proceeds of approximately $8.6 million to the Company, after deducting the agent’s commissions and other fees. 4,708,993 shares of the Company’s common stock were sold through the ATM Program during the nine months ended September 30, 2024, for proceeds of approximately $2.4 million to the Company, after deducting the agent’s commissions and other fees. Please also see Note—15 Shareholder’s Equity in Item 1—Condensed Consolidated Interim Financial Statements and Notes (unaudited) for additional information. |
| (2) | In connection with the departure of Alberto Reyes, the Company’s former Chief Operating Officer, 90,311 of performance share units (“PSUs”) held by Mr. Reyes as of the date of his separation were immediately vested and paid out to Mr. Reyes in shares of the Company’s common stock in the amount equal to the value of such PSUs to which Mr. Reyes would have been entitled as if 100% of the target performance measures related to such PSUs were achieved. The PSUs were settled by issuing 42,265 shares of common stock, with 48,066 PSUs forfeited for taxes. Additionally, 51,242 outstanding deferred share units (“DSUs”) were paid out to Mr. Reyes in shares of the Company’s common stock by issuing 23,975 common shares, with 27,267 DSUs forfeited for taxes. |
| (3) | In January 2025, the Company closed a registered direct offering of 15,625,000 shares of the Company’s common stock at a price of $0.16 per share. In September 2025, the Company closed on a second registered direct offering of $11.4 million for the sale of 25,315,954 shares of the Company’s common stock at a price of $0.45 per share. The Company issued 14,204,846 of these shares, for the fair value of approximately $6.4 million, to fully pay off the term loan received in June 2025 as a non-cash equity settlement. |
| (4) | In connection to the loan the Company received on June 26, 2025, the Company issued a common stock purchase warrant for the purchase of up to 1,500,000 shares of the Company’s common stock at an exercise price per share of $0.65. These warrants qualified for equity accounting and were valued using a Black-Scholes model. |
The accompanying notes are an integral part of these Condensed Consolidated Interim Financial Statements.
Gold Resource Corporation—Condensed Consolidated Interim Financial Statements and Notes (Unaudited) 8 CONDENSED CONSOLIDATED INTERIM STATEMENTS OF CASH FLOWS
GOLD RESOURCE CORPORATION
(U.S. dollars in thousands)
(Unaudited)
|
|
For the nine months ended September 30, |
||||
|
Note |
2025 |
|
2024 |
||
|
|
|
|
|
Restated |
|
Cash flows from operating activities: |
|
|
|
|
|
|
Net loss |
|
$ |
(24,460) |
|
$ |
(45,359) |
Adjustments to reconcile net loss to net cash used in operating activities: |
|
|
|
|
|
|
Deferred income tax expense |
|
|
1,205 |
|
|
10,509 |
Depreciation and amortization |
|
|
8,423 |
|
|
15,589 |
Stock-based compensation |
|
|
1,198 |
|
|
647 |
Interest on streaming liabilities |
|
|
12,059 |
|
|
9,612 |
Other operating adjustments, net |
23 |
|
2,927 |
|
|
4,446 |
Changes in operating assets and liabilities: |
|
|
|
|
|
|
Accounts receivable |
|
|
(10,755) |
|
|
(1,078) |
Inventories |
|
|
(536) |
|
|
1,185 |
Prepaid expenses and other current assets |
|
|
879 |
|
|
(246) |
Other non-current assets |
|
|
(260) |
|
|
(154) |
Accounts payable and other accrued liabilities |
|
|
2,440 |
|
|
4,011 |
Cash settled liability awards |
|
|
(33) |
|
|
(67) |
Mining royalty and income taxes payable, net |
|
|
4,453 |
|
|
(1,048) |
Net cash used in operating activities |
|
|
(2,460) |
|
|
(1,953) |
|
|
|
|
|
|
|
Cash flows from investing activities: |
|
|
|
|
|
|
Capital expenditures |
|
|
(12,186) |
|
|
(6,353) |
Proceeds from the sale of investment in Green Light Metals |
|
|
854 |
|
|
1,178 |
Net cash used in investing activities |
|
|
(11,332) |
|
|
(5,175) |
|
|
|
|
|
|
|
Cash flows from financing activities: |
|
|
|
|
|
|
Net proceeds from note payable |
|
|
6,114 |
|
|
- |
Proceeds from ATM Program sales, net of issuance costs |
|
|
8,640 |
|
|
2,434 |
Net proceeds from the Registered Direct Offerings |
|
|
7,495 |
|
|
- |
Other financing activities |
|
|
(138) |
|
|
(33) |
Net cash provided by financing activities |
|
|
22,111 |
|
|
2,401 |
Effect of exchange rate changes on cash and cash equivalents |
|
|
(150) |
|
|
(175) |
|
|
|
|
|
|
|
Net increase (decrease) in cash and cash equivalents |
|
|
8,169 |
|
|
(4,902) |
Cash and cash equivalents at beginning of period |
|
|
1,628 |
|
|
6,254 |
Cash and cash equivalents at end of period |
|
$ |
9,797 |
|
$ |
1,352 |
|
|
|
|
|
|
|
Supplemental Cash Flow Information |
|
|
|
|
|
|
Income and mining taxes paid |
|
$ |
(71) |
|
$ |
1,088 |
Non-cash investing or financing activities: |
|
|
|
|
|
|
Value of common shares issued for share-based compensation redemption |
|
$ |
161 |
|
$ |
49 |
Value of common shares issued to extinguish term loan |
|
$ |
6,397 |
|
$ |
- |
Balance of capital expenditures in accounts payable |
|
$ |
1,226 |
|
$ |
386 |
Balance of equipment financing |
|
$ |
457 |
|
$ |
1,041 |
The accompanying notes are an integral part of these Condensed Consolidated Interim Financial Statements.
GOLD RESOURCE CORPORATION
NOTES TO THE CONDENSED CONSOLIDATED INTERIM FINANCIAL STATEMENTS
September 30, 2025
(Unaudited)
1. Basis of Preparation of Financial Statements
Gold Resource Corporation—Condensed Consolidated Interim Financial Statements and Notes (Unaudited) 9 The Condensed Consolidated Interim Financial Statements (“interim financial statements”) of Gold Resource Corporation and its subsidiaries (collectively, the “Company”) are unaudited and have been prepared in accordance with the rules of the Securities and Exchange Commission (“SEC”) for interim statements. Certain information and footnote disclosures required by United States Generally Accepted Accounting Principles (“U.S. GAAP”) have been condensed or omitted as permitted by such rules. However, the Company believes that the disclosures included are adequate to make the information presented not misleading. In the opinion of management, all adjustments (including normal recurring adjustments) and disclosures necessary for a fair presentation of these interim financial statements have been included. The results reported in these interim financial statements do not necessarily indicate the results that may be reported for the entire year. These interim financial statements should be read in conjunction with the audited consolidated financial statements for the year ended December 31, 2024, included in the Company’s annual report on Form 10-K (the “2024 Annual Report”). The year-end balance sheet data was derived from the audited financial statements. Unless otherwise noted, there have been no material changes to the footnotes from those accompanying the audited consolidated financial statements contained in the 2024 Annual Report.
2. Restatement of Financial Statements
The interim unaudited condensed consolidated financial statements include corrections to the three and nine months periods ended September 30, 2024, which were presented in Note 24 to the consolidated financial statements for the year ended December 31, 2024, in the Company’s 2024 Form 10-K filed on April 8, 2025. During the preparation of the consolidated financial statements for the year ended December 31, 2024, management of the Company identified that liabilities related to the Company’s Back Forty Project with respect to the Gold and Silver Stream Agreements with Osisko (the “Osisko Stream Agreements”) were incorrectly presented in the Company’s financial statements due to errors in the application of U.S. GAAP. The errors related to the calculation of interest accretion over the liabilities associated with the Osisko Stream Agreements (the “streaming liabilities”). It was determined that the streaming liabilities should be accounted for under Financial Accounting Standards Board’s Accounting Standards Codification 606, Revenue from Contracts with Customers, and that a significant financing component is present that should be accreted using the effective interest method. The resulting errors understated the streaming liabilities and net loss for all the impacted periods noted below.
The correction to the Company’s consolidated statements of operations also impacts the Company’s consolidated balance sheets, consolidated statements of changes in shareholders’ equity, consolidated statements of cash flows, and certain notes to the consolidated financial statements.
In the restated presentation, the Company also recorded previously uncorrected misstatements that were determined to be immaterial to the financial statements in prior periods.
Gold Resource Corporation—Condensed Consolidated Interim Financial Statements and Notes (Unaudited) 10 The following table presents the Company’s restatement impact in the unaudited condensed consolidated statement of operations for the three and nine months ended September 30, 2024:
|
|
|
|
|
|
|
|
|
|
|
|
|
|
|
|
|
|
|
|
|
UNAUDITED CONDENSED CONSOLIDATED STATEMENTS OF OPERATIONS |
||||||||||||||||
|
|
For the three months ended September 30, 2024 |
|
For the nine months ended September 30, 2024 |
||||||||||||||
|
|
As Previously |
|
Restatement |
|
Restated |
|
As Previously |
|
Restatement |
|
Restated |
||||||
|
|
(U.S. dollars in thousands, except share and per share amounts) |
||||||||||||||||
Sales, net |
|
$ |
13,272 |
|
$ |
- |
|
$ |
13,272 |
|
$ |
52,756 |
|
$ |
- |
|
$ |
52,756 |
Cost of sales: |
|
|
|
|
|
|
|
|
|
|
|
|
|
|
|
|
|
|
Production costs |
|
|
17,198 |
|
|
- |
|
|
17,198 |
|
|
51,074 |
|
|
- |
|
|
51,074 |
Depreciation and amortization |
|
|
4,178 |
|
|
- |
|
|
4,178 |
|
|
14,221 |
|
|
- |
|
|
14,221 |
Reclamation and remediation |
|
|
566 |
|
|
- |
|
|
566 |
|
|
1,892 |
|
|
- |
|
|
1,892 |
Total cost of sales |
|
|
21,942 |
|
|
- |
|
|
21,942 |
|
|
67,187 |
|
|
- |
|
|
67,187 |
Mine gross loss |
|
|
(8,670) |
|
|
- |
|
|
(8,670) |
|
|
(14,431) |
|
|
- |
|
|
(14,431) |
Costs and expenses: |
|
|
|
|
|
|
|
|
|
|
|
|
|
|
|
|
|
|
General and administrative expenses |
|
|
1,293 |
|
|
- |
|
|
1,293 |
|
|
2,975 |
|
|
- |
|
|
2,975 |
Mexico exploration expenses |
|
|
767 |
|
|
- |
|
|
767 |
|
|
1,850 |
|
|
- |
|
|
1,850 |
Michigan Back Forty Project expenses |
|
|
202 |
|
|
(25) |
|
|
177 |
|
|
549 |
|
|
(25) |
|
|
524 |
Stock-based compensation |
|
|
203 |
|
|
- |
|
|
203 |
|
|
647 |
|
|
- |
|
|
647 |
Other expense, net |
|
|
2,977 |
|
|
2,198 |
|
|
5,175 |
|
|
10,846 |
|
|
3,400 |
|
|
14,246 |
Total costs and expenses |
|
|
5,442 |
|
|
2,173 |
|
|
7,615 |
|
|
16,867 |
|
|
3,375 |
|
|
20,242 |
Loss before income taxes |
|
|
(14,112) |
|
|
(2,173) |
|
|
(16,285) |
|
|
(31,298) |
|
|
(3,375) |
|
|
(34,673) |
Income tax (benefit) provision |
|
|
(3,617) |
|
|
9 |
|
|
(3,608) |
|
|
10,952 |
|
|
(266) |
|
|
10,686 |
Net loss |
|
$ |
(10,495) |
|
$ |
(2,182) |
|
$ |
(12,677) |
|
$ |
(42,250) |
|
$ |
(3,109) |
|
$ |
(45,359) |
Net loss per common share: |
|
|
|
|
|
|
|
|
|
|
|
|
|
|
|
|
|
|
Basic and diluted net loss per common share |
|
$ |
(0.11) |
|
$ |
(0.03) |
|
$ |
(0.14) |
|
$ |
(0.46) |
|
$ |
(0.04) |
|
$ |
(0.50) |
|
|
|
|
|
|
|
|
|
|
|
|
|
|
|
|
|
|
|
Weighted average shares outstanding: |
|
|
|
|
|
|
|
|
|
|
|
|
|
|
|
|
|
|
Basic and diluted |
|
|
93,279,750 |
|
|
- |
|
|
93,279,750 |
|
|
91,005,507 |
|
|
- |
|
|
91,005,507 |
The following table presents the Company’s restatement impact in the unaudited condensed consolidated statement of changes in shareholders’ equity for the three months ended September 30, 2024:
|
|
|
|
|
|
|
|
|
|
|
|
|
|
|
|
|
|
|
|
|
|
|
UNAUDITED CONDENSED CONSOLIDATED STATEMENTS OF CHANGES IN SHAREHOLDERS' EQUITY |
||||||||||||||||||
|
|
For the three months ended September 30, 2024 |
||||||||||||||||||
|
|
Number of |
|
Par Value of |
|
Additional Paid- |
|
Retained |
|
Treasury |
|
Accumulated |
|
Total |
||||||
As Previously Reported |
|
(U.S. dollars in thousands, except share amounts) |
||||||||||||||||||
Balance, June 30, 2024 |
|
92,629,246 |
|
$ |
93 |
|
$ |
114,049 |
|
$ |
(40,066) |
|
$ |
(5,884) |
|
$ |
(1,171) |
|
$ |
67,021 |
Stock-based compensation |
|
- |
|
|
- |
|
|
184 |
|
|
- |
|
|
- |
|
|
- |
|
|
184 |
Issuance of common stock, net of issuance costs |
|
1,230,180 |
|
|
1 |
|
|
598 |
|
|
- |
|
|
- |
|
|
- |
|
|
599 |
Net loss |
|
- |
|
|
- |
|
|
- |
|
|
(10,495) |
|
|
- |
|
|
- |
|
|
(10,495) |
Balance, September 30, 2024 |
|
93,859,426 |
|
$ |
94 |
|
$ |
114,831 |
|
$ |
(50,561) |
|
$ |
(5,884) |
|
$ |
(1,171) |
|
$ |
57,309 |
|
|
|
|
|
|
|
|
|
|
|
|
|
|
|
|
|
|
|
|
|
Restatement Impacts |
|
|
|
|
|
|
|
|
|
|
|
|
|
|
|
|
|
|
|
|
Balance, June 30, 2024 |
|
- |
|
$ |
- |
|
$ |
- |
|
$ |
(17,192) |
|
$ |
- |
|
$ |
- |
|
$ |
(17,192) |
Stock-based compensation |
|
- |
|
|
- |
|
|
- |
|
|
- |
|
|
- |
|
|
- |
|
|
- |
Issuance of common stock, net of issuance costs |
|
- |
|
|
- |
|
|
- |
|
|
- |
|
|
- |
|
|
- |
|
|
- |
Net loss |
|
- |
|
|
- |
|
|
- |
|
|
(2,182) |
|
|
- |
|
|
- |
|
|
(2,182) |
Balance, September 30, 2024 |
|
- |
|
$ |
- |
|
$ |
- |
|
$ |
(19,374) |
|
$ |
- |
|
$ |
- |
|
$ |
(19,374) |
|
|
|
|
|
|
|
|
|
|
|
|
|
|
|
|
|
|
|
|
|
Restated |
|
|
|
|
|
|
|
|
|
|
|
|
|
|
|
|
|
|
|
|
Balance, June 30, 2024 |
|
92,629,246 |
|
$ |
93 |
|
$ |
114,049 |
|
$ |
(57,258) |
|
$ |
(5,884) |
|
$ |
(1,171) |
|
$ |
49,829 |
Stock-based compensation |
|
- |
|
|
- |
|
|
184 |
|
|
- |
|
|
- |
|
|
- |
|
|
184 |
Issuance of common stock, net of issuance costs |
|
1,230,180 |
|
|
1 |
|
|
598 |
|
|
- |
|
|
- |
|
|
- |
|
|
599 |
Net loss |
|
- |
|
|
- |
|
|
- |
|
|
(12,677) |
|
|
- |
|
|
- |
|
|
(12,677) |
Balance, September 30, 2024 |
|
93,859,426 |
|
$ |
94 |
|
$ |
114,831 |
|
$ |
(69,935) |
|
$ |
(5,884) |
|
$ |
(1,171) |
|
$ |
37,935 |
Gold Resource Corporation—Condensed Consolidated Interim Financial Statements and Notes (Unaudited) 11 The following table presents the Company’s restatement impact in the unaudited condensed consolidated statement of changes in shareholders’ equity for the nine months ended September 30, 2024:
|
|
|
|
|
|
|
|
|
|
|
|
|
|
|
|
|
|
|
|
|
|
|
UNAUDITED CONDENSED CONSOLIDATED STATEMENTS OF CHANGES IN SHAREHOLDERS' EQUITY |
||||||||||||||||||
|
|
For the nine months ended September 30, 2024 |
||||||||||||||||||
|
|
Number of |
|
Par Value of |
|
Additional Paid- |
|
Retained |
|
Treasury |
|
Accumulated |
|
Total |
||||||
As Previously Reported |
|
(U.S. dollars in thousands, except share amounts) |
||||||||||||||||||
Balance, December 31, 2023 |
|
89,030,436 |
|
$ |
89 |
|
$ |
111,970 |
|
$ |
(8,311) |
|
$ |
(5,884) |
|
$ |
(1,171) |
|
$ |
96,693 |
Stock-based compensation |
|
- |
|
|
- |
|
|
463 |
|
|
- |
|
|
- |
|
|
- |
|
|
463 |
Common stock issued for vested restricted stock units |
|
196,991 |
|
|
- |
|
|
- |
|
|
- |
|
|
- |
|
|
- |
|
|
- |
Issuance of common stock, net of issuance costs |
|
4,708,993 |
|
|
5 |
|
|
2,429 |
|
|
- |
|
|
- |
|
|
- |
|
|
2,434 |
Surrender of common stock for taxes due on vesting |
|
(76,994) |
|
|
- |
|
|
(31) |
|
|
- |
|
|
- |
|
|
- |
|
|
(31) |
Net loss |
|
- |
|
|
- |
|
|
- |
|
|
(42,250) |
|
|
- |
|
|
- |
|
|
(42,250) |
Balance, September 30, 2024 |
|
93,859,426 |
|
$ |
94 |
|
$ |
114,831 |
|
$ |
(50,561) |
|
$ |
(5,884) |
|
$ |
(1,171) |
|
$ |
57,309 |
|
|
|
|
|
|
|
|
|
|
|
|
|
|
|
|
|
|
|
|
|
Restatement Impacts |
|
|
|
|
|
|
|
|
|
|
|
|
|
|
|
|
|
|
|
|
Balance, December 31, 2023 |
|
- |
|
$ |
- |
|
$ |
- |
|
$ |
(16,265) |
|
$ |
- |
|
$ |
- |
|
$ |
(16,265) |
Stock-based compensation |
|
- |
|
|
- |
|
|
- |
|
|
- |
|
|
- |
|
|
- |
|
|
- |
Common stock issued for vested restricted stock units |
|
- |
|
|
- |
|
|
- |
|
|
- |
|
|
- |
|
|
- |
|
|
- |
Issuance of common stock, net of issuance costs |
|
- |
|
|
- |
|
|
- |
|
|
- |
|
|
- |
|
|
- |
|
|
- |
Surrender of common stock for taxes due on vesting |
|
- |
|
|
- |
|
|
- |
|
|
- |
|
|
- |
|
|
- |
|
|
- |
Net loss |
|
- |
|
|
- |
|
|
- |
|
|
(3,109) |
|
|
- |
|
|
- |
|
|
(3,109) |
Balance, September 30, 2024 |
|
- |
|
$ |
- |
|
$ |
- |
|
$ |
(19,374) |
|
$ |
- |
|
$ |
- |
|
$ |
(19,374) |
|
|
|
|
|
|
|
|
|
|
|
|
|
|
|
|
|
|
|
|
|
Restated |
|
|
|
|
|
|
|
|
|
|
|
|
|
|
|
|
|
|
|
|
Balance, December 31, 2023 |
|
89,030,436 |
|
$ |
89 |
|
$ |
111,970 |
|
$ |
(24,576) |
|
$ |
(5,884) |
|
$ |
(1,171) |
|
$ |
80,428 |
Stock-based compensation |
|
- |
|
|
- |
|
|
463 |
|
|
- |
|
|
- |
|
|
- |
|
|
463 |
Common stock issued for vested restricted stock units |
|
196,991 |
|
|
- |
|
|
- |
|
|
- |
|
|
- |
|
|
- |
|
|
- |
Issuance of common stock, net of issuance costs |
|
4,708,993 |
|
|
5 |
|
|
2,429 |
|
|
- |
|
|
- |
|
|
- |
|
|
2,434 |
Surrender of common stock for taxes due on vesting |
|
(76,994) |
|
|
- |
|
|
(31) |
|
|
- |
|
|
- |
|
|
- |
|
|
(31) |
Net loss |
|
- |
|
|
- |
|
|
- |
|
|
(45,359) |
|
|
- |
|
|
- |
|
|
(45,359) |
Balance, September 30, 2024 |
|
93,859,426 |
|
$ |
94 |
|
$ |
114,831 |
|
$ |
(69,935) |
|
$ |
(5,884) |
|
$ |
(1,171) |
|
$ |
37,935 |
Gold Resource Corporation—Condensed Consolidated Interim Financial Statements and Notes (Unaudited) 12 The following table presents the Company’s restatement impact in the unaudited condensed consolidated statement of cash flows for the nine months ended September 30, 2024:
|
UNAUDITED CONDENSED CONSOLIDATED STATEMENTS OF CASH FLOWS |
|||||||
|
For the nine months ended September 30, 2024 |
|||||||
|
As Previously |
|
Restatement |
|
Restated |
|||
|
(U.S. dollars in thousands) |
|||||||
Cash flows from operating activities: |
|
|
|
|
|
|
|
|
Net loss |
$ |
(42,250) |
|
$ |
(3,109) |
|
$ |
(45,359) |
Adjustments to reconcile net loss to net cash used in operating activities: |
|
|
|
|
|
|
|
|
Deferred income tax expense (benefit) |
|
10,775 |
|
|
(266) |
|
|
10,509 |
Depreciation and amortization |
|
15,589 |
|
|
- |
|
|
15,589 |
Stock-based compensation |
|
647 |
|
|
- |
|
|
647 |
Interest on streaming liabilities |
|
6,356 |
|
|
3,256 |
|
|
9,612 |
Other operating adjustments, net |
|
4,446 |
|
|
- |
|
|
4,446 |
Changes in operating assets and liabilities: |
|
|
|
|
|
|
|
|
Accounts receivable |
|
(1,078) |
|
|
- |
|
|
(1,078) |
Inventories |
|
1,185 |
|
|
- |
|
|
1,185 |
Prepaid expenses and other current assets |
|
(1,291) |
|
|
1,045 |
|
|
(246) |
Other non-current assets |
|
(154) |
|
|
- |
|
|
(154) |
Accounts payable and other accrued liabilities |
|
4,937 |
|
|
(926) |
|
|
4,011 |
Cash settled liability awards |
|
(67) |
|
|
- |
|
|
(67) |
Mining royalty and income taxes payable, net |
|
(1,048) |
|
|
- |
|
|
(1,048) |
Net cash used in operating activities |
|
(1,953) |
|
|
- |
|
|
(1,953) |
|
|
|
|
|
|
|
|
|
Cash flows from investing activities: |
|
|
|
|
|
|
|
|
Capital expenditures |
|
(6,353) |
|
|
- |
|
|
(6,353) |
Proceeds from the sale of investment in Maritime |
|
1,178 |
|
|
- |
|
|
1,178 |
Net cash used in investing activities |
|
(5,175) |
|
|
- |
|
|
(5,175) |
|
|
|
|
|
|
|
|
|
Cash flows from financing activities: |
|
|
|
|
|
|
|
|
Proceeds from the ATM sales, net of issuance costs |
|
2,434 |
|
|
- |
|
|
2,434 |
Other financing activities |
|
(33) |
|
|
- |
|
|
(33) |
Net cash provided by financing activities |
|
2,401 |
|
|
- |
|
|
2,401 |
Effect of exchange rate changes on cash and cash equivalents |
|
(175) |
|
|
- |
|
|
(175) |
|
|
|
|
|
|
|
|
|
Net decrease in cash and cash equivalents |
|
(4,902) |
|
|
- |
|
|
(4,902) |
Cash and cash equivalents at beginning of period |
|
6,254 |
|
|
- |
|
|
6,254 |
Cash and cash equivalents at end of period |
$ |
1,352 |
|
$ |
- |
|
$ |
1,352 |
|
|
|
|
|
|
|
|
|
Supplemental Cash Flow Information |
|
|
|
|
|
|
|
|
Income and mining taxes paid |
$ |
1,088 |
|
$ |
- |
|
$ |
1,088 |
Non-cash investing or financing activities: |
|
|
|
|
|
|
|
|
Value of common shares issued for RSU redemption |
$ |
49 |
|
$ |
- |
|
$ |
49 |
Balance of capital expenditures in accounts payable |
$ |
385 |
|
$ |
1 |
|
$ |
386 |
Balance of equipment financing |
$ |
1,041 |
|
$ |
- |
|
$ |
1,041 |
3. New Accounting Pronouncements
The FASB issued ASU 2023-09, Income Taxes (Topic 740): Improvement to Income Tax Disclosures in December 2023, amending income tax disclosure requirements for the effective tax rate reconciliation and income taxes paid. The amendments in ASU 2023-09 are effective for fiscal years beginning after December 15, 2024, and are applied prospectively with retrospective application permitted. The Company is evaluating the impact this guidance will have on the disclosures in the consolidated financial statements.
In November 2024, the FASB issued ASU 2024-03, Income Statement—Reporting Comprehensive Income—Expense Disaggregation Disclosures (Subtopic 220-40) to improve the disclosures about a public business entity’s expense and provide more detailed information about the types of expenses included in certain expense captions in the consolidated financial statements. The amendments in this update are effective for annual reporting periods beginning after December
Gold Resource Corporation—Condensed Consolidated Interim Financial Statements and Notes (Unaudited) 13 15, 2026, and interim reporting periods beginning after December 15, 2027.
Early adoption is permitted and the amendments in this update should be applied either prospectively or retrospectively. The Company is evaluating the impact this guidance will have on the disclosures in the consolidated financial statements.
4. Going Concern
In accordance with Accounting Standards Codification (“ASC”) 205-40, Going Concern, ("ASC 205-40"), the Company evaluated whether there are conditions and events, considered in the aggregate, that raise substantial doubt about the Company’s ability to continue as a going concern within one year after the date on which this Quarterly Report on Form 10-Q is filed. The accompanying interim financial statements have been prepared assuming that the Company will continue as a going concern. Although the Company made some improvement in 2025, the Company’s financial position and operating results, along with the Company’s inability to achieve its production estimates through the third quarter of 2025, raise substantial doubt about the Company’s ability to continue as a going concern, as reflected by the year-to-date net losses of $24.5 million and the cash used in operations of $2.5 million. The interim financial statements do not include any adjustments that might be necessary if the Company is unable to continue as a going concern.
To improve its cash position, during the nine months ended September 30, 2025, the Company raised approximately $8.6 million through its ATM Program, after deducting the agent’s commissions and other expenses. The Company has raised gross proceeds of approximately $2.5 million through a registered direct offering in January. In September 2025, the Company closed on a second registered direct offering of $11.4 million for the sale of 25,315,954 shares of the Company’s common stock at a price of $0.45 per share. The Company issued 14,204,846 of these shares, for the fair value of approximately $6.4 million, to fully pay off the term loan received in June 2025 as a non-cash equity settlement, as further described in Note 14. In February 2025, the Company sold its interest in Green Light Metals for $0.9 million, and on May 7, 2025, the Company received the previously disclosed tax refund of 76 million pesos from the overpayment of Mexico taxes by DDGM in 2023, plus an inflation adjustment, for a total of 79.6 million pesos (approximately $4.0 million). In connection with the loan agreement described in Note 14, the Company has issued a common stock purchase warrant to an affiliate of one of the private investors for the purchase of up to 1,500,000 shares of the Company’s common stock at an exercise price per share of $0.65, the aggregate exercise proceeds of which may provide additional funds for the Company.
For the nine months ended September 30, 2025, the Company has raised a net total of $27.2 million through these efforts. However, there can be no assurances that the mine revenue will be sufficient to generate profits and positive cash flows from operations in the future, and the Company may be compelled to place the mine on “care and maintenance” status and cease operations if additional sources of capital is required and not available at such time.
Gold Resource Corporation—Condensed Consolidated Interim Financial Statements and Notes (Unaudited) 14 The Company derives its revenue mainly from the sale of concentrates.
5. Revenue
The following table presents the Company’s net sales for each period presented, disaggregated by source:
|
|
For the three months ended September 30, |
|
For the nine months ended September 30, |
||||||||
|
|
2025 |
|
2024 |
|
2025 |
|
2024 |
||||
|
|
(in thousands) |
|
(in thousands) |
||||||||
Doré sales, net |
|
|
|
|
|
|
|
|
|
|
|
|
Gold |
|
$ |
126 |
|
$ |
- |
|
$ |
1,213 |
|
$ |
24 |
Silver |
|
|
9 |
|
|
- |
|
|
54 |
|
|
1 |
Less: Refining charges |
|
|
(1) |
|
|
- |
|
|
(10) |
|
|
(6) |
Total doré sales, net |
|
|
134 |
|
|
- |
|
|
1,257 |
|
|
19 |
Concentrate sales |
|
|
|
|
|
|
|
|
|
|
|
|
Gold |
|
|
4,858 |
|
|
3,416 |
|
|
9,166 |
|
|
17,173 |
Silver |
|
|
17,271 |
|
|
5,424 |
|
|
29,825 |
|
|
17,332 |
Copper |
|
|
659 |
|
|
917 |
|
|
1,545 |
|
|
5,099 |
Lead |
|
|
417 |
|
|
918 |
|
|
1,481 |
|
|
3,342 |
Zinc |
|
|
1,868 |
|
|
4,045 |
|
|
6,390 |
|
|
13,108 |
Less: Treatment and refining charges |
|
|
(607) |
|
|
(1,394) |
|
|
(1,602) |
|
|
(4,410) |
Total concentrate sales, net |
|
|
24,466 |
|
|
13,326 |
|
|
46,805 |
|
|
51,644 |
Realized gain - embedded derivative, net (1) |
|
|
20 |
|
|
344 |
|
|
76 |
|
|
1,333 |
Unrealized gain (loss) - embedded derivative, net |
|
|
258 |
|
|
(398) |
|
|
322 |
|
|
(240) |
Total sales, net |
|
$ |
24,878 |
|
$ |
13,272 |
|
$ |
48,460 |
|
$ |
52,756 |
| (1) | Copper lead, and zinc are co-products. In the realized gain - embedded derivative, net, there is $51 thousand loss and $139 thousand loss related to these co-products for the three and nine months ended September 30, 2025, respectively. There is $0.2 million and $0.5 million gain, in the realized gain - embedded derivative, net, related to the co-products for both the three and nine months ended September 30, 2024, respectively. |
6. Inventories, net
At September 30, 2025 and December 31, 2024, inventories, net, consisted of the following:
|
|
As of |
|
As of |
||
|
|
September 30, |
|
December 31, |
||
|
|
2025 |
|
2024 |
||
|
|
(in thousands) |
||||
Stockpiles - underground mine |
|
$ |
340 |
|
$ |
73 |
Concentrates |
|
|
1,859 |
|
|
902 |
Doré, net |
|
|
- |
|
|
169 |
Subtotal - product inventories |
|
|
2,199 |
|
|
1,144 |
Materials and supplies (1) |
|
|
4,997 |
|
|
5,796 |
Total |
|
$ |
7,196 |
|
$ |
6,940 |
| (1) | Net of reserve for obsolescence of $1.1 million and $0.7 million as of September 30, 2025 and December 31, 2024, respectively. |
7. Income Taxes
The Company recorded an income tax expense of $1.5 million for the nine months ended September 30, 2025. For the nine months ended September 30, 2024, the Company recorded an income tax expense of $10.7 million. In accordance with applicable accounting rules, the interim provision for taxes is calculated using the estimated consolidated annual effective tax rate. The consolidated effective tax rate is a function of the combined effective tax rates for the jurisdictions in which the Company operates. Variations in the relative proportions of jurisdictional income could result in fluctuations
Gold Resource Corporation—Condensed Consolidated Interim Financial Statements and Notes (Unaudited) 15 to the Company’s consolidated effective tax rate.
At the federal level, the Company’s income in the U.S. is taxed at 21%. Income in Mexico is taxed at 38.5% (30% income tax and 8.5% mining tax), and Canada’s income is taxed at a combined federal and provincial rate of 26.5%, which results in a consolidated effective tax rate above statutory U.S. Federal rates.
On July 4, 2025, the One Big Beautiful Bill Act (the “OBBBA”) was enacted in the U.S. The OBBBA permanently extends multiple tax provisions of the 2017 Tax Cuts and Jobs Act, as well as repeals, modifies, and introduces various other tax provisions. The legislation has multiple effective dates, with certain provisions effective in 2025 and others implemented through 2027. The Company does not anticipate the bill will have a material impact on the consolidated financial statements.
Mexico Valuation Allowance
The Company recorded a valuation allowance on all of the Mexico Income Tax net deferred tax assets in 2024 and has continued with a valuation allowance on all of the Mexico Income Tax net deferred tax assets as of September 30, 2025. In accordance with applicable accounting rules, a valuation allowance is recorded when it is more likely than not that some portion of the deferred tax assets will not be realized, after considering all available evidence, both positive and negative. The Company determined a valuation allowance on Mexico Income Tax deferred tax assets was necessary due primarily to the recent losses at the Mexico mine.
Mexico Mining Taxation
Mining entities in Mexico are subject to two mining duties, in addition to the 30% Mexico corporate income tax: (i) a “special” mining duty of 8.5%, effective January 1, 2025, of taxable income as defined under Mexican tax law (also referred to as “mining royalty tax”) on extraction activities performed by concession holders, and (ii) the “extraordinary” mining duty of 1.0%, also effective January 1, 2025, on gross revenue from the sale of gold, silver, and platinum. The mining royalty tax generally applies to earnings before income tax, depreciation, depletion, amortization, and interest. In calculating the mining royalty tax, there are no corporate deductions related to depreciable costs from operational fixed assets. However, prospecting and exploration expenses are amortized using a 10% rate in a 10-year straight line. Both duties are tax deductible for income tax purposes. As a result, the Company’s effective tax rate applicable to the Company’s Mexican operations is higher than Mexico’s statutory income tax rate.
The Company periodically transfers funds from its Mexican wholly owned subsidiary to the U.S. as dividends. Mexico requires a 10% Mexico withholding tax on all post-2013 earnings. The Company began distributing post-2013 earnings from Mexico in 2018. According to the existing U.S. – Mexico tax treaty, the dividend withholding tax between these countries is reduced to 5% if certain requirements are met. The Company determined that it had met such requirements and paid a 5% withholding tax on dividends received from Mexico, and as a result, $0.1 million in withholding taxes was paid for the nine months ended September 30, 2024. At the end of 2024, the Company reviewed the tax treaty and believes that it qualifies for a 0% tax withholding. Going forward, the Company will apply a 0% tax withholding on any dividend payments from its Mexico subsidiary. No dividends from Mexico were received by the Company for the nine months ended September 30, 2025.
In October 2023, the Company received a notification from the Mexican Tax Administration Services (“SAT”) with a sanction of 331 million pesos (approximately $18.0 million as of September 30, 2025) as the result of a 2015 tax audit that began in 2021. The 2015 tax audit performed by SAT encompassed various tax aspects, including but not limited to intercompany transactions, mining royalty tax, and extraordinary mining tax. Management is in process of disputing this tax notification and sent a letter of protest to the tax authorities along with providing all requested documentation. Management intends to pursue legal avenues of protest, including filing a lawsuit with the Mexico court system, if necessary, to ensure that these adjustments are removed. Management believes its position taken on the 2015 income tax return meets the more likely than not threshold and that as of September 30, 2025 and December 31, 2024, the Company has no liability for uncertain tax positions. If the Company were to determine there was an unrecognized tax benefit, the Company would recognize the liability and the related interest and penalties within income tax (benefit) provision.
Gold Resource Corporation—Condensed Consolidated Interim Financial Statements and Notes (Unaudited) 16 At September 30, 2025 and December 31, 2024, prepaid expenses and other current assets consisted of the following:
8. Prepaid Expenses and Other Current Assets
|
|
As of |
|
As of |
||
|
|
September 30, |
|
December 31, |
||
|
|
2025 |
|
2024 |
||
|
|
(in thousands) |
||||
Advances to suppliers |
|
$ |
56 |
|
$ |
46 |
Prepaid insurance |
|
|
684 |
|
|
1,121 |
Prepaid income tax |
|
|
- |
|
|
3,906 |
Other current assets |
|
|
553 |
|
|
755 |
Total |
|
$ |
1,293 |
|
$ |
5,828 |
Prepaid income tax
Mexican tax statutes specify that the current year tax prepayments be calculated based on a coefficient for prior year earnings, regardless of current year results. Starting in the third quarter of each year, these same statutes allow companies to request a reduction of the coefficient, which adjusts for losses experienced in the current year. During 2023, DDGM had to prepay approximately 76 million pesos despite the losses for the year. In 2024, some of these overpayments were reconciled and used to offset the required 2024 tax prepayments. Due to the 2024 losses, no income tax payments are expected in 2025. On May 7, 2025, the Company received the previously disclosed tax refund of 76 million pesos from the overpayment of Mexico taxes by DDGM in 2023, plus an inflation adjustment, for a total of 79.6 million pesos (approximately $4.0 million).
Other current assets
A value-added (“IVA”) tax in Mexico is assessed on the sales of products and purchases of materials and services. Businesses owe IVA taxes as the business sells a product and collects IVA taxes from its customers. Likewise, businesses are generally entitled to recover the taxes they have paid related to purchases of materials and services, either as a refund or credit to IVA tax payable. Amounts recorded as IVA taxes in the consolidated financial statements represent the net estimated IVA tax payable or receivable, since there is a legal right of offset of IVA taxes. As of September 30, 2025 and December 31, 2024, this resulted in a liability balance in accrued expenses and other liabilities of $1.2 million and an asset balance in other current assets of $0.5 million, respectively.
Gold Resource Corporation—Condensed Consolidated Interim Financial Statements and Notes (Unaudited)
17
9. Property, Plant, and Mine Development, net
At September 30, 2025 and December 31, 2024, property, plant, and mine development, net consisted of the following:
|
|
|
|
|
|
|
|
|
As of |
|
As of |
||
|
|
September 30, |
|
December 31, |
||
|
|
2025 |
|
2024 |
||
|
|
(in thousands) |
||||
Asset retirement costs (“ARO asset”) |
|
$ |
6,740 |
|
$ |
6,740 |
Construction-in-progress |
|
|
1,532 |
|
|
1,165 |
Furniture and office equipment |
|
|
1,858 |
|
|
1,722 |
Land |
|
|
9,033 |
|
|
9,033 |
Mineral interest |
|
|
79,543 |
|
|
79,543 |
Light vehicles and other mobile equipment |
|
|
2,134 |
|
|
2,118 |
Machinery and equipment |
|
|
46,412 |
|
|
44,858 |
Mill facilities and infrastructure |
|
|
36,456 |
|
|
36,463 |
Mine development |
|
|
131,382 |
|
|
120,906 |
Software and licenses |
|
|
1,554 |
|
|
1,554 |
Subtotal |
|
|
316,644 |
|
|
304,102 |
Accumulated depreciation and amortization |
|
|
(184,191) |
|
|
(175,713) |
Total |
|
$ |
132,453 |
|
$ |
128,389 |
The Company recorded depreciation and amortization expense of $2.6 million and $7.7 million for the three and nine months ended September 30, 2025, respectively, and $4.2 million and $14.2 million for the three and nine months ended September 30, 2024, respectively.
10. Other Non-current Assets
At September 30, 2025 and December 31, 2024, other non-current assets consisted of the following:
|
|
As of |
|
As of |
||
|
|
September 30, |
|
December 31, |
||
|
|
2025 |
|
2024 |
||
|
|
(in thousands) |
||||
Investment in Green Light Metals |
|
|
- |
|
|
852 |
Other non-current assets |
|
|
661 |
|
|
53 |
Total |
|
$ |
661 |
|
$ |
905 |
Investment in Green Light Metals
On December 28, 2022, the Company received 12.25 million common shares of Green Light Metals as a settlement for a promissory note receivable acquired with the Aquila Resources Inc. (“Aquila”) acquisition. This represented approximately 28.5% ownership in Green Light Metals at the time. In the first quarter of 2025, through its subsidiary, Aquila Resources USA Inc., the Company entered into a share purchase agreement with multiple purchasers to sell all of its interest in the Green Light Metals shares, for $0.10 Canadian dollars (“C$”) per share, for total net proceeds of C$1.2 million ($0.9 million), which was received on February 11, 2025. As of December 31, 2024, the fair value of this investment was $0.9 million.
Gold Resource Corporation—Condensed Consolidated Interim Financial Statements and Notes (Unaudited) 18 At September 30, 2025 and December 31, 2024, accrued expenses and other liabilities consisted of the following:
11. Accrued Expenses and Other Liabilities
|
|
As of |
|
As of |
||
|
|
September 30, |
|
December 31, |
||
|
|
2025 |
|
2024 |
||
|
|
(in thousands) |
||||
Accrued royalty payments |
|
$ |
584 |
|
$ |
650 |
Accrual for short-term incentive plan |
|
|
814 |
|
|
701 |
Liability for Aquila drillhole capping |
|
|
8 |
|
|
8 |
Share-based compensation liability - current |
|
|
189 |
|
|
33 |
Equipment financing |
|
|
- |
|
|
744 |
Employee profit sharing obligation |
|
|
1 |
|
|
5 |
Other payables (1) |
|
|
2,312 |
|
|
890 |
Total accrued expenses and other current liabilities |
|
$ |
3,908 |
|
$ |
3,031 |
|
|
|
|
|
|
|
Accrued non-current labor obligation |
|
$ |
1,138 |
|
$ |
1,251 |
Stock-based compensation liability |
|
|
960 |
|
|
318 |
Other lease liability |
|
|
132 |
|
|
- |
Other long-term liabilities |
|
|
- |
|
|
7 |
Total other non-current liabilities |
|
$ |
2,230 |
|
$ |
1,576 |
| (1) | Amounts recorded as IVA taxes in the condensed consolidated interim balance sheets represent the net estimated IVA tax payable or receivable, since there is a legal right of offset of IVA taxes. As of September 30, 2025 and December 31, 2024, this resulted in a liability balance in accrued expenses and other liabilities of $1.2 million and an asset balance in other current assets of $0.5 million, respectively. |
12. Gold and Silver Stream Agreements
The following table presents the Company’s liabilities related to the Company’s Gold and Silver Stream Agreements (the “Osisko Stream Agreements”) with Osisko Bermuda Limited (“Osisko”) as of September 30, 2025 and December 31, 2024:
|
|
|
|
|
|
|
|
|
As of |
|
As of |
||
|
|
September 30, |
|
December 31, |
||
|
|
2025 |
|
2024 |
||
|
|
(in thousands) |
||||
Liability related to the Osisko Gold Stream Agreement |
|
$ |
38,425 |
|
$ |
33,067 |
Liability related to the Osisko Silver Stream Agreement |
|
|
48,066 |
|
|
41,365 |
Total liability |
|
$ |
86,491 |
|
$ |
74,432 |
The Osisko Stream Agreements contain customary provisions regarding default and security. In the event that the Company defaults under the Osisko Stream Agreements, including by failing to achieve commercial production by an agreed upon date, it may be required to repay the deposit plus accumulated interest at a rate agreed with Osisko. If the Company fails to do so, Osisko may elect to enforce its remedies as a secured party and take possession of the assets that comprise the Back Forty Project.
Gold Stream Agreement
In November 2017, Aquila entered into a stream agreement with Osisko, pursuant to which Osisko agreed to commit approximately $55.0 million to Aquila through a gold stream purchase agreement (the “Osisko Gold Stream Agreement”). In June 2020, Aquila amended the Osisko Gold Stream Agreement, reducing the total committed amount to $50.0 million, as well as adjusting certain milestone dates under the gold stream to align with the current project development timeline. Aquila had received a total of $20.0 million of the funds committed at the time of the Company’s acquisition. Remaining deposits from Osisko are $5.0 million upon receipt of permits required for the development and operation of the Back Forty
Gold Resource Corporation—Condensed Consolidated Interim Financial Statements and Notes (Unaudited) 19 Project and $25.0 million upon the first drawdown of an appropriate project debt finance facility.
Osisko has been provided a general security agreement over the Back Forty Project, which consists of the subsidiaries of Gold Resource Acquisition Sub. Inc., a 100% owned subsidiary of the Company. The initial term of the Osisko Gold Stream Agreement is for 40 years, automatically renewable for successive ten-year periods. The Osisko Gold Stream Agreement is subject to certain operating and financial covenants, which are in good standing as of September 30, 2025. In March 2024, the Company secured an amendment to the Osisko Gold Stream Agreement that deferred the required completion of certain operational milestones related to permitting from 2024 to 2026.
The $20.0 million received from Osisko pursuant to the Osisko Gold Stream Agreement through December 31, 2024 is shown as a long-term liability on the Consolidated Balance Sheets. A periodic interest expense is calculated based on a fixed market rate of interest, which is reviewed quarterly if there are any contractual amendments relating to the Osisko Stream Agreements. The fixed interest rate is applied on the Osisko advance payments and calculated on the total expected life-of-mine production to be deliverable and was 22.2% per annum at September 30, 2025 and at December 31, 2024. As the remaining $30.0 million deposit is subject to the completion of specific milestones and the satisfaction of certain other conditions, this amount is not reflected on the Consolidated Balance Sheets.
Per the terms of the Osisko Gold Stream Agreement, Osisko will purchase 18.5% of the refined gold from Back Forty (the “Threshold Stream Percentage”) until the Company has delivered 105,000 gold ounces (the “Production Threshold”). Upon satisfaction of the Production Threshold, the Threshold Stream Percentage will be reduced to 9.25% of the refined gold (the “Tail Stream”). In exchange for the refined gold delivered under the Stream Agreement, Osisko will pay the Company ongoing payments equal to 30% of the spot price of gold on the day of delivery, subject to a maximum payment of $600 per ounce. Where the market price of gold is greater than the price paid, the difference realized from the sale of the gold will be applied against the deposit received from Osisko. Please see Note 15—Commitments and Contingencies in Item 1—Condensed Consolidated Interim Financial Statements and Notes (unaudited) for additional information.
Silver Stream Agreement
Through a series of contracts, Aquila executed a silver stream agreement with Osisko to purchase 85% of the silver produced and sold at the Back Forty Project (the “Osisko Silver Stream Agreement”). A total of $17.2 million has been advanced under the Osisko Silver Stream Agreement as of September 30, 2025. There are no future deposits remaining under the Osisko Silver Stream Agreement. The initial term of the Osisko Silver Stream Agreement is for 40 years, automatically renewable for successive ten-year periods. The Osisko Silver Stream Agreement is subject to certain operating and financial covenants, which are in good standing as of September 30, 2025. In March 2024, the Company secured an amendment to the Osisko Silver Stream Agreement that deferred the required completion of certain operational milestones related to permitting from 2024 to 2026.
Per the terms of the Osisko Silver Stream Agreement, Osisko will purchase 85% of the silver produced from the Back Forty Project at a fixed price of $4.00 per ounce of silver. Where the market price of silver is greater than $4.00 per ounce, the difference realized from the sale of the silver will be applied against the deposit received from Osisko.
The $17.2 million received from Osisko pursuant to the Osisko Silver Stream Agreement through December 31, 2024 is shown as a long-term liability on the Consolidated Balance Sheets. A periodic interest expense is calculated based on a fixed market rate of interest, which is reviewed quarterly if there are any contractual amendments relating to the Osisko Stream Agreements. The fixed interest rate is applied on the Osisko advance payments and calculated on the total expected life-of-mine production to be deliverable and was 22.2% per annum at September 30, 2025 and at December 31, 2024. Please see Note 15—Commitments and Contingencies in Item 1—Condensed Consolidated Interim Financial Statements and Notes (unaudited) for additional information.
Gold Resource Corporation—Condensed Consolidated Interim Financial Statements and Notes (Unaudited) 20 The following table presents the changes in reclamation and remediation obligations for the nine months ended September 30, 2025 and for the year ended December 31, 2024:
13. Reclamation and Remediation
|
|
2025 |
|
2024 |
||
|
|
(in thousands) |
||||
Reclamation liabilities – balance at beginning of period |
|
$ |
1,839 |
|
$ |
2,233 |
Foreign currency exchange loss (gain) |
|
|
213 |
|
|
(394) |
Reclamation liabilities – balance at end of period |
|
|
2,052 |
|
|
1,839 |
|
|
|
|
|
|
|
Asset retirement obligation – balance at beginning of period |
|
|
8,838 |
|
|
9,562 |
Changes in estimate (1) |
|
|
- |
|
|
512 |
Liability for Aquila drillhole capping |
|
|
- |
|
|
(329) |
Accretion |
|
|
565 |
|
|
793 |
Foreign currency exchange loss (gain) |
|
|
1,047 |
|
|
(1,700) |
Asset retirement obligation – balance at end of period |
|
|
10,450 |
|
|
8,838 |
Total period end balance |
|
$ |
12,502 |
|
$ |
10,677 |
| (1) | In 2024, the Company updated its closure plan study, which resulted in a $0.5 million increase in the estimated liability and ARO asset. |
The following table presents the reclamation and remediation obligations as of September 30, 2025 and December 31, 2024:
|
|
As of |
|
As of |
||
|
|
September 30, |
|
December 31, |
||
|
|
2025 |
|
2024 |
||
|
|
(in thousands) |
||||
Current reclamation and remediation liabilities (1) |
|
$ |
8 |
|
$ |
8 |
Non-current reclamation and remediation liabilities |
|
|
12,494 |
|
|
10,669 |
Total |
|
$ |
12,502 |
|
$ |
10,677 |
| (1) | The current portion of reclamation and remediation liabilities related to drill hole capping in Aquila, Michigan, are included in Accrued expenses and other current liabilities. Please see Note 11— Accrued Expenses and Other Liabilities in Item 1—Condensed Consolidated Interim Financial Statements and Notes (unaudited) for additional information. |
The Company’s undiscounted reclamation liabilities of $2.1 million and $1.8 million as of September 30, 2025 and December 31, 2024, respectively, are related to DDGM. These represent reclamation liabilities that were expensed through 2013 before proven and probable reserves were established and the Company was considered to be a development stage entity; therefore, most of the costs, including asset retirement costs, were not allowed to be capitalized as part of the Company’s property, plant, and mine development.
The Company’s asset retirement obligations reflect the additions to the asset for reclamation and remediation costs in Property, Plant, and Mine Development, post-2013 development stage status, which are discounted using a credit adjusted risk-free rate of 10%. As of September 30, 2025 and December 31, 2024, the Company’s asset retirement obligation was $10.5 million and $8.8 million, respectively, primarily related to DDGM in Mexico.
Gold Resource Corporation—Condensed Consolidated Interim Financial Statements and Notes (Unaudited) 21 On June 26, 2025, the Company executed a loan agreement in the amount of $6.28 million, to be used for working capital.
14. Loan Payable
The loan bears a simple interest at a rate per annum equal to the sum of (i) the published Secured Overnight Financing Rate for a 1-month interest period (“SOFR”) plus (ii) five percent (5.0%), with the initial interest rate of 9.32%. Principal and all interest are due and payable on December 26, 2026, but the Company repaid it without penalty in September from the proceeds of the Registered Direct Offering.
In connection with the loan agreement, the Company has issued a common stock purchase warrant to an affiliate of one of the private investors for the purchase of up to 1,500,000 shares of the Company’s common stock at an exercise price per share of $0.65. These warrants qualified for equity accounting and were valued using a Black-Scholes model. The loan and warrants were recorded on a relative fair value basis.
On September 3, 2025, the Company fully paid its outstanding term loan liability balance of $5.9 million, along with applicable interest, by issuing 14,204,846 shares of its common stock. The common stock issued had an aggregate fair value of approximately $6.4 million, based on the average spot price of the Company’s common stock on August 20, 2025. As a result, the Company recognized a loss on the extinguishment of the debt of $0.5 million, which is included in other income (expense) in the accompanying Condensed Consolidated Statements of Operations for the three and nine months ended September 30, 2025.
15. Commitments and Contingencies
Commitments
As of September 30, 2025 and December 31, 2024, the Company has equipment purchase commitments of $6.9 million and $1.5 million, respectively.
Contingent Consideration
With the Aquila acquisition, the Company assumed a contingent consideration. On December 30, 2013, Aquila’s shareholders approved the acquisition of 100% of the shares of HudBay Michigan Inc. (“HMI”), a subsidiary of HudBay Minerals Inc. (“HudBay”), effectively giving Aquila 100% ownership in the Back Forty Project (the “HMI Acquisition”). Pursuant to the HMI Acquisition, HudBay’s 51% interest in the Back Forty Project was acquired in consideration for the issuance of common shares of Aquila, future milestone payments tied to the development of the Back Forty Project and a 1% net smelter return royalty on production from certain land parcels in the project. The issuance of shares and 1% net smelter obligations were settled before the Company acquired Aquila.
The contingent consideration is composed of the following:
The value of future installments is based on C$9 million tied to the development of the Back Forty project as follows:
| a. | C$3 million payable on completion of any form of financing for purposes including the commencement of construction of Back Forty, up to 50% of the C$3 million can be paid, at the Company’s option in Gold Resource Corporation shares with the balance payable in cash; |
| b. | C$2 million payable in cash 90 days after the commencement of commercial production; |
| c. | C$2 million payable in cash 270 days after the commencement of commercial production, and; |
| a. | C$2 million payable in cash 450 days after the commencement of commercial production. |
Initially, the Company intended to pay the first C$3 million in 2023 to prevent HudBay’s 51% buy-back option in the Back Forty Project. Management later decided that it was more likely than not that HudBay would not exercise its buy-back option, and consequently, this amount was not paid. Additionally, since financing of the project is not expected in 2024, this liability was reclassified to long-term. As of the end of January 2024, by the contractual deadline, HudBay did not exercise its buy-back option, and thus, it is forfeited.
Gold Resource Corporation—Condensed Consolidated Interim Financial Statements and Notes (Unaudited) 22 The total value of the contingent consideration as of September 30, 2025 and December 31, 2024 was $3.5 million and $3.4 million, respectively.
The contingent consideration is adjusted for the time value of money and the likelihood of the milestone payments. Any future change in the value of the contingent consideration is recognized in other expense, net, in the Condensed Consolidated Interim Statements of Operations.
The following table shows the change in the balance of the contingent consideration for the nine months ended September 30, 2025 and for the year ended December 31, 2024:
|
|
2025 |
|
2024 |
||
|
|
(in thousands) |
||||
Beginning Balance of contingent consideration: |
|
|
|
|
|
|
Non-current contingent consideration |
|
$ |
3,389 |
|
$ |
3,404 |
|
|
|
|
|
|
|
Change in value of contingent consideration - Non-current |
|
|
112 |
|
|
(15) |
|
|
|
|
|
|
|
Ending Balance of contingent consideration: |
|
|
|
|
|
|
Non-current contingent consideration |
|
$ |
3,501 |
|
$ |
3,389 |
Other Contingencies
The Company has certain other contingencies resulting from litigation, claims, and other commitments and is subject to various environmental and safety laws and regulations incident to the ordinary course of business. The Company currently has no basis to conclude that any or all of such contingencies will materially affect its financial position, results of operations, or cash flows. However, in the future, there may be changes to these contingencies, or additional contingencies may occur, any of which might result in an accrual or a change in current accruals recorded by the Company. There can be no assurance that the ultimate disposition of contingencies will not have a material adverse effect on the Company’s financial position, results of operations, or cash flows.
With the acquisition of Aquila Resources Inc. on December 10, 2021, the Company assumed substantial liabilities that relate to the gold and silver stream agreements with Osisko. Under the agreements, Osisko deposited a total of $37.2 million upfront in exchange for a portion of the future gold and silver production from the Back Forty Project. The stream agreements contain customary provisions regarding default and security. In the event that the Company’s subsidiary defaults under the stream agreements, including failing to achieve commercial production at a future date, it may be required to repay the deposit plus accumulated interest at a rate agreed with Osisko. If it fails to do so, Osisko may be entitled to enforce its remedies as a secured party and take possession of the assets that comprise the Back Forty Project.
16. Shareholders’ Equity
Gold Resource Corporation—Condensed Consolidated Interim Financial Statements and Notes (Unaudited) 23 The Company’s At-The-Market Offering Agreement with H.C. Wainwright & Co., LLC (the “Agent”), which was entered into in November 2019, was amended in May 2023 and renewed in June 2023. Pursuant to the amended ATM Agreement, the Agent has agreed to act as the Company’s sales agent with respect to the offer and sale from time to time of the Company’s common stock having an aggregate gross sales price of up to the amount registered on the registration statement on Form S-3 relating to the ATM Program, which is $15.85 million as of April 11, 2025. No shares of the Company’s common stock were sold during the three months ended September 30, 2025. During the nine months ended September 30, 2025, an aggregate of 25,139,655 shares of the Company’s common stock were sold and settled through the ATM Program for proceeds to the Company of approximately $8.6 million, after deducting the agent’s commissions and other fees. During the three and nine months ended September 30, 2024, an aggregate of 1,230,180 and 4,708,993 shares, respectively, of the Company’s common stock were sold and settled through the ATM Program for net proceeds to the Company of approximately $0.6 million and $2.4 million, respectively, after deducting the agent’s commissions and other fees.
On January 21, 2025, the Company closed on a registered direct offering for the purchase of 15,625,000 shares of the Company’s common stock at a price of $0.16 per share, resulting in total gross proceeds to the Company of approximately $2.5 million. On September 3, 2025, the Company closed on a second registered direct offering of $11.4 million for the sale of 25,315,954 shares of the Company’s common stock at a price of $0.45 per share. The Company issued 14,204,846 of these shares, for the fair value of approximately $6.4 million, to fully pay off the term loan received in June 2025 as a non-cash equity settlement.
In connection to the loan the Company received on June 26, 2025, the Company issued 1,500,000 common stock purchase warrants for the purchase of up to 1,500,000 shares of the Company’s common stock at an exercise price per share of $0.65, subject to adjustment as provided in the warrant agreement. The warrants will expire on June 26, 2027. These warrants qualified for equity accounting and were valued using a Black-Scholes model.
17. Derivatives
Embedded Derivatives
Concentrate sales contracts contain embedded derivatives due to the provisional pricing terms for shipments pending final settlement. At the end of each reporting period, the Company records an adjustment to accounts receivable and sales to reflect the mark-to-market adjustments for outstanding provisional invoices based on forward metal prices. Please see Note—22 Fair Value Measurement in Item 1—Condensed Consolidated Interim Financial Statements and Notes (unaudited) for additional information on the realized and unrealized gain (loss) recorded to adjust accounts receivable and revenue.
The following table summarizes the Company’s unsettled sales contracts at September 30, 2025 with the quantities of metals under contract subject to final pricing expected to occur through January 2026:
|
|
Gold |
|
Silver |
|
Copper |
|
Lead |
|
Zinc |
|
|
Total |
|||||
|
|
(ounces) |
|
(ounces) |
|
(tonnes) |
|
(tonnes) |
|
(tonnes) |
|
|
|
|||||
Under contract |
|
|
1,643 |
|
|
493,509 |
|
|
81 |
|
|
448 |
|
|
1,176 |
|
|
|
Average forward price (per ounce or tonne) |
|
$ |
3,448 |
|
$ |
40.17 |
|
$ |
9,778 |
|
$ |
1,956 |
|
$ |
2,790 |
|
|
|
Unsettled sales contracts value (in thousands) |
|
$ |
5,665 |
|
$ |
19,824 |
|
$ |
792 |
|
$ |
876 |
|
$ |
3,281 |
|
$ |
30,438 |
The Company manages credit risk by entering into arrangements with counterparties believed to be financially strong, and by requiring other credit risk mitigants, as appropriate. The Company actively evaluates the implicit creditworthiness of its counterparties, and monitors credit exposures.
18. Employee Benefits
Gold Resource Corporation—Condensed Consolidated Interim Financial Statements and Notes (Unaudited) 24 Effective October 2012, the Company adopted a profit-sharing plan (the “Plan”), which covers all U.S. employees. The Plan meets the requirements of a qualified retirement plan pursuant to the provisions of Section 401(k) of the Internal Revenue Code. The Plan also allows eligible employees to make tax deferred contributions to a retirement trust account up to 90% of their qualified wages, subject to the IRS annual maximums.
On April 23, 2021, a decree that reforms labor outsourcing in Mexico was published in the Federation’s Official Gazette. This decree amended the outsourcing provisions, whereby operating companies can no longer source their labor resources used to carry out the core business functions from service entities or third-party providers. Under Mexican law, employees are entitled to receive statutory profit sharing (Participacion a los Trabajadores de las Utilidades or “PTU”) payments. The required cash payment to employees in the aggregate is equal to 10% of their employer’s profit subject to PTU, which differs from profit determined under U.S. GAAP. Please see Note 11—Accrued Expenses and Other Liabilities in Item 1—Condensed Consolidated Interim Financial Statements and Notes (unaudited) for additional information.
19. Stock-Based Compensation
The Company’s compensation program comprises three main elements: (1) base salary, (2) an annual short-term incentive plan (“STIP”) award which may be in the form of cash or deferred share units (“DSUs”) with immediate vesting, and (3) long-term equity-based incentive compensation (“LTIP”) in the form of stock options, restricted stock units (“RSUs”), and performance share units (“PSUs”).
The Gold Resource Corporation 2016 Equity Incentive Plan (the “Incentive Plan”) allows for the issuance of up to 5 million shares of common stock in the form of incentive and non-qualified stock options, stock appreciation rights, RSUs, stock grants, stock units, performance shares, PSUs, and DSUs.
The Company’s STIP provides for an annual cash bonus payable upon achievement of specified performance metrics for its management team. STIP may also be settled as cash payable through the issuance of fully vested equity awards (such as fully vested stock grants or DSUs), or a combination of cash and stock DSUs. As of September 30, 2025, the Company accrued $0.3 million in accrued expenses and other liabilities related to the program.
Stock-based compensation expense for the periods presented is as follows:
|
|
For the three months ended September 30, |
|
For the nine months ended September 30, |
||||||||
|
|
2025 |
|
2024 |
|
2025 |
|
2024 |
||||
|
|
(in thousands) |
|
(in thousands) |
||||||||
Stock options |
|
$ |
- |
|
$ |
- |
|
$ |
- |
|
$ |
22 |
Restricted stock units |
|
|
72 |
|
|
184 |
|
|
278 |
|
|
441 |
Performance share units |
|
|
106 |
|
|
9 |
|
|
318 |
|
|
137 |
Deferred share units |
|
|
225 |
|
|
10 |
|
|
602 |
|
|
47 |
Total |
|
$ |
403 |
|
$ |
203 |
|
$ |
1,198 |
|
$ |
647 |
Gold Resource Corporation—Condensed Consolidated Interim Financial Statements and Notes (Unaudited) 25 A summary of stock option activities under the Incentive Plan for the nine months ended September 30, 2025 and 2024 is presented below:
Stock Options
|
|
Stock |
|
Weighted |
|
Outstanding as of December 31, 2023 |
|
840,612 |
|
$ |
2.99 |
Granted, Exercised, Expired, or Forfeited |
|
- |
|
|
- |
Outstanding as of September 30, 2024 |
|
840,612 |
|
$ |
2.99 |
|
|
|
|
|
|
Outstanding as of December 31, 2024 |
|
840,612 |
|
$ |
2.99 |
Expired or Forfeited |
|
(80,204) |
|
|
2.45 |
Outstanding as of September 30, 2025 |
|
760,408 |
|
$ |
3.05 |
|
|
|
|
|
|
Vested and exercisable as of September 30, 2025 |
|
760,408 |
|
$ |
3.05 |
Restricted Stock Units
A summary of RSU activities under the Incentive Plan for the nine months ended September 30, 2025 and 2024 is presented below:
|
|
Restricted |
|
Fair |
|
Nonvested as of December 31, 2023 |
|
847,255 |
|
$ |
319 |
Granted |
|
832,091 |
|
|
|
Granted in lieu of bonus |
|
637,929 |
|
|
|
Vested but not redeemed (deferred) |
|
(134,257) |
|
|
|
Vested and redeemed |
|
(119,997) |
|
|
|
Vested and forfeited for net settlement |
|
(76,994) |
|
|
|
Forfeited |
|
(54,769) |
|
|
|
Nonvested as of September 30, 2024 |
|
1,931,258 |
|
$ |
675 |
|
|
|
|
|
|
Nonvested as of December 31, 2024 |
|
1,931,258 |
|
$ |
444 |
Vested but not redeemed (deferred) |
|
(258,618) |
|
|
|
Vested and redeemed |
|
(293,887) |
|
|
|
Vested and forfeited for net settlement |
|
(208,309) |
|
|
|
Forfeited |
|
(360,753) |
|
|
|
Nonvested as of September 30, 2025 |
|
809,691 |
|
$ |
677 |
Gold Resource Corporation—Condensed Consolidated Interim Financial Statements and Notes (Unaudited) 26 A summary of PSU activities under the Incentive Plan for the nine months ended September 30, 2025 and 2024 is presented below:
Performance Share Units
|
|
Performance |
|
|
Liability Balance |
Outstanding as of December 31, 2023 |
|
880,926 |
|
$ |
164 |
Granted |
|
682,367 |
|
|
|
Redeemed |
|
(201,258) |
|
|
|
Forfeited |
|
(33,113) |
|
|
|
Outstanding as of September 30, 2024 |
|
1,328,922 |
|
$ |
235 |
|
|
|
|
|
|
Outstanding as of December 31, 2024 |
|
1,328,922 |
|
$ |
148 |
Redeemed (1) |
|
(283,460) |
|
|
|
Forfeited for net settlement |
|
(48,066) |
|
|
|
Forfeited |
|
(236,330) |
|
|
|
Outstanding as of September 30, 2025 |
|
761,066 |
|
$ |
376 |
| (1) | In connection with the departure of Alberto Reyes, the Company’s former Chief Operating Officer, 90,311 of PSUs held by Mr. Reyes as of the date of his separation were immediately vested and paid out to Mr. Reyes in shares of the Company’s common stock in the amount equal to the value of such PSUs to which Mr. Reyes would have been entitled as if 100% of the target performance measures related to such PSUs were achieved. The PSUs were settled by issuing 42,265 shares of common stock, with 48,066 PSUs forfeited for taxes. |
Deferred Share Units
A summary of DSU activities under the Incentive Plan for the nine months ended September 30, 2025 and 2024 is presented below:
|
|
Deferred |
|
|
Liability Balance |
Outstanding as of December 31, 2023 |
|
586,291 |
|
$ |
223 |
Granted in lieu of board fees |
|
183,208 |
|
|
|
Outstanding as of September 30, 2024 |
|
769,499 |
|
$ |
269 |
|
|
|
|
|
|
Outstanding as of December 31, 2024 |
|
883,384 |
|
$ |
203 |
Granted in lieu of board fees |
|
92,427 |
|
|
|
Redeemed (1) |
|
(23,975) |
|
|
|
Forfeited for net settlement |
|
(27,267) |
|
|
|
Outstanding as of September 30, 2025 |
|
924,569 |
|
$ |
773 |
| (1) | In connection with the departure of Alberto Reyes, the Company’s former Chief Operating Officer, 51,242 outstanding DSUs were paid out to Mr. Reyes in shares of the Company’s common stock by issuing 23,975 common shares, with 27,267 DSUs forfeited for taxes. |
Gold Resource Corporation—Condensed Consolidated Interim Financial Statements and Notes (Unaudited) 27 Other expense, net, for the periods presented consisted of the following:
20. Other Expense, net
|
|
For the three months ended September 30, |
|
For the nine months ended September 30, |
||||||||
|
|
2025 |
|
2024 |
|
2025 |
|
2024 |
||||
|
|
|
|
|
Restated |
|
|
|
|
Restated |
||
|
|
(in thousands) |
|
(in thousands) |
||||||||
Unrealized currency exchange loss (1) |
|
$ |
363 |
|
$ |
889 |
|
$ |
1,334 |
|
$ |
2,220 |
Realized currency exchange loss (gain) |
|
|
175 |
|
|
75 |
|
|
472 |
|
|
(82) |
Realized and unrealized gain from gold and silver rounds, net |
|
|
(28) |
|
|
(19) |
|
|
(61) |
|
|
(35) |
Realized and unrealized losses from sale of investments (2) |
|
|
1 |
|
|
1,723 |
|
|
1 |
|
|
1,723 |
Interest on streaming liabilities (3) |
|
|
4,222 |
|
|
3,457 |
|
|
12,059 |
|
|
9,612 |
Severance |
|
|
- |
|
|
277 |
|
|
459 |
|
|
953 |
Interest on note payable |
|
|
170 |
|
|
- |
|
|
181 |
|
|
- |
Loss on loan payoff |
|
|
479 |
|
|
- |
|
|
479 |
|
|
- |
Other expense (income) |
|
|
1,955 |
|
|
(1,227) |
|
|
2,028 |
|
|
(145) |
Total |
|
$ |
7,337 |
|
$ |
5,175 |
|
$ |
16,952 |
|
$ |
14,246 |
| (1) | Gains and losses due to changes in fair value are non-cash in nature until such time that they are realized through cash transactions. For additional information regarding the Company’s fair value measurements and investments, please see Note 22—Fair Value Measurement in Item 1—Condensed Consolidated Interim Financial Statements and Notes (unaudited) for additional information. |
| (2) | In the first quarter of 2025, through its subsidiary, Aquila Resources USA Inc., the Company entered into a share purchase agreement with multiple purchasers to sell all of its interest in the Green Light Metals shares, for C$0.10 per share, for total net proceeds of C$1.2 million ($0.9 million), which was received on February 11, 2025. As of December 31, 2024, the fair value of the investment was $0.9 million. On September 23, 2024, all the common shares of Maritime were sold in a private placement transaction for C$0.034 per share to a related party, Dundee Corporation, for total proceeds of C$1.6 million (or $1.2 million). As of December 31, 2023, the fair value of the investment was $1.6 million. |
| (3) | Periodic interest expense is based on a fixed market rate of interest which is reviewed quarterly if there are any contractual amendments relating to the Osisko Stream Agreements. Please see Note 12— Gold and Silver Stream Agreements in Item 1—Condensed Consolidated Interim Financial Statements and Notes (unaudited) for additional information. |
21. Net Loss per Common Share
Basic net income or loss per common share is calculated based on the weighted average number of shares of common stock outstanding for the period. Diluted earnings or loss per common share are calculated based on the assumption that stock options and other dilutive securities outstanding, which have an exercise price less than the average market price of the Company’s common stock during the period, would have been exercised on the later of the beginning of the period or the date granted and that the funds obtained from the exercise were used to purchase common stock at the average market price during the period. All of the Company’s RSUs are anti-dilutive due to the Company’s net loss for the period. Since PSUs and DSUs are expected to be cash settled, they are not included in the dilutive calculation.
The effect of the Company’s dilutive securities is calculated using the treasury stock method, and only those instruments that result in a reduction in net income per common share are included in the calculation. Options to purchase 0.8 million shares of common stock at weighted average exercise price of $3.05 were outstanding as of September 30, 2025, but had no dilutive effect due to the net loss for the period. Options to purchase 0.8 million shares of common stock at a weighted average exercise price of $2.99 were outstanding as of September 30, 2024, but it had no dilutive effect due to the net loss for the period. A common stock purchase warrant that was issued on June 26, 2025, which allows the holder to purchase 1,500,000 shares of common stock at the exercise price of $0.65, was outstanding as of September 30, 2025, but had no dilutive effect due to the net loss for the period.
Gold Resource Corporation—Condensed Consolidated Interim Financial Statements and Notes (Unaudited) 28 Basic and diluted net income per common share is calculated as follows:
|
|
For the three months ended |
|
For the nine months ended |
||||||||
|
|
September 30, |
|
September 30, |
||||||||
|
|
2025 |
|
2024 |
|
2025 |
|
2024 |
||||
Numerator: |
|
|
|
|
|
|
|
|
|
|
|
|
Net loss (in thousands) |
|
$ |
(4,655) |
|
$ |
(12,677) |
|
$ |
(24,460) |
|
$ |
(45,359) |
|
|
|
|
|
|
|
|
|
|
|
|
|
Denominator: |
|
|
|
|
|
|
|
|
|
|
|
|
Basic and diluted weighted average common shares outstanding |
|
|
142,909,014 |
|
|
93,279,750 |
|
|
129,081,618 |
|
|
91,005,507 |
|
|
|
|
|
|
|
|
|
|
|
|
|
Basic and diluted net loss per common share |
|
$ |
(0.03) |
|
$ |
(0.14) |
|
$ |
(0.19) |
|
$ |
(0.50) |
22. Fair Value Measurement
Fair value accounting establishes a fair value hierarchy that prioritizes the inputs to valuation techniques used to measure fair value. The hierarchy gives the highest priority to unadjusted quoted prices in active markets for identical assets or liabilities (Level 1 measurements) and the lowest priority to unobservable inputs (Level 3 measurements). The three levels of the fair value hierarchy are described below:
Level 1 |
Unadjusted quoted prices in active markets that are accessible at the measurement date for identical, unrestricted assets or liabilities; |
Level 2 |
Quoted prices in markets that are not active or inputs that are observable, either directly or indirectly, for substantially the full term of the asset or liability; and |
Level 3 |
Prices or valuation techniques that require inputs that are both significant to the fair value measurement and unobservable (supported by little or no market activity). |
As required by accounting guidance, assets and liabilities are classified in their entirety based on the lowest level of input that is significant to the fair value measurement. These assets and liabilities are remeasured for each reporting period. The following tables set forth certain of the Company’s assets and liabilities measured at fair value by level within the fair value hierarchy as of September 30, 2025 and December 31, 2024:
|
|
As of |
|
As of |
|
|
||
|
|
September 30, |
|
December 31, |
|
Input Hierarchy Level |
||
|
|
2025 |
|
2024 |
|
|
||
|
|
(in thousands) |
|
|
||||
Cash and cash equivalents |
|
$ |
9,797 |
|
$ |
1,628 |
|
Level 1 |
Accounts receivable, net |
|
$ |
12,939 |
|
$ |
2,184 |
|
Level 2 |
Investment in equity securities-Green Light Metals |
|
$ |
- |
|
$ |
852 |
|
Level 3 |
The following methods and assumptions were used to estimate the fair value of each class of financial instrument:
Cash and cash equivalents: Cash and cash equivalents consist primarily of cash deposits and are valued at cost, approximating fair value.
Accounts receivable, net: Accounts receivable, net include amounts due to the Company for deliveries of concentrates and doré sold to customers. Concentrate sales contracts provide for provisional pricing as specified in such contracts. These sales contain an embedded derivative related to the provisional pricing mechanism which is bifurcated and accounted for as a derivative. At the end of each reporting period, the Company records an adjustment to sales to reflect the mark-to-market of outstanding provisional invoices based on the forward price curve. Because these provisionally priced sales have not yet settled as of the reporting date, the mark-to-market adjustment related to these invoices is included in accounts receivable as of each reporting date.
Gold Resource Corporation—Condensed Consolidated Interim Financial Statements and Notes (Unaudited) 29 At September 30, 2025 and December 31, 2024, the Company had an unrealized gain of $0.3 million and an unrealized loss of $7 thousand, respectively, included in its accounts receivable on the accompanying Condensed Consolidated Interim Balance Sheets related to mark-to-market adjustments on the embedded derivatives. Please see Note 17—Derivatives in Item 1—Condensed Consolidated Interim Financial Statements and Notes (unaudited) for additional information.
Investment in equity securities—Green Light Metals: Upon maturity on December 28, 2022, the Company received 12,250,000 private shares of Green Light Metals, which settled the promissory note receivable from Green Light Metals. The shares received represented approximately 28.5% ownership at the time. In the first quarter of 2025, through Aquila, the Company entered into a share purchase agreement with multiple purchasers to sell all of its interest in the Green Light Metals shares, for C$0.10 per share, for total net proceeds of C$1.2 million ($0.9 million), which was received on February 11, 2025. As of December 31, 2024, the value of this equity investment was $0.9 million.
Gains and losses related to changes in the fair value of embedded derivatives were included in the Condensed Consolidated Interim Statements of Operations, as shown in the following table (in thousands):
|
|
For the three months ended September 30, |
|
For the nine months ended September 30, |
|
Statements of Operations Classification |
|||||||||
|
|
2025 |
|
2024 |
|
|
2025 |
|
2024 |
|
|
||||
|
Note |
(in thousands) |
|
|
|||||||||||
Realized and unrealized derivative gain (loss), net |
17 |
$ |
278 |
|
$ |
(54) |
|
|
$ |
398 |
|
$ |
1,093 |
|
Sales, net |
Realized/Unrealized Derivatives
The following tables summarize the Company’s realized/unrealized derivatives for the periods presented (in thousands):
|
|
Gold |
|
Silver |
|
Copper |
|
Lead |
|
Zinc |
|
Total |
||||||
For the three months ended September 30, 2025 |
|
|
|
|
|
|
|
|
|
|
|
|
|
|
|
|
|
|
Realized gain (loss) |
|
$ |
61 |
|
$ |
10 |
|
$ |
(10) |
|
$ |
(5) |
|
$ |
(36) |
|
$ |
20 |
Unrealized gain |
|
|
37 |
|
|
164 |
|
|
11 |
|
|
- |
|
|
46 |
|
|
258 |
Total realized/unrealized derivatives, net |
|
$ |
98 |
|
$ |
174 |
|
$ |
1 |
|
$ |
(5) |
|
$ |
10 |
|
$ |
278 |
|
|
Gold |
|
Silver |
|
Copper |
|
Lead |
|
Zinc |
|
Total |
||||||
For the three months ended September 30, 2024 |
|
|
|
|
|
|
|
|
|
|
|
|
|
|
|
|
|
|
Realized gain (loss) |
|
$ |
57 |
|
$ |
130 |
|
$ |
(48) |
|
$ |
46 |
|
$ |
160 |
|
$ |
345 |
Unrealized (loss) gain |
|
|
(6) |
|
|
(215) |
|
|
34 |
|
|
(68) |
|
|
(144) |
|
|
(399) |
Total realized/unrealized derivatives, net |
|
$ |
51 |
|
$ |
(85) |
|
$ |
(14) |
|
$ |
(22) |
|
$ |
16 |
|
$ |
(54) |
|
|
|
|
|
|
|
|
|
|
|
|
|
|
|
|
|
|
|
|
|
Gold |
|
Silver |
|
Copper |
|
Lead |
|
Zinc |
|
Total |
||||||
For the nine months ended September 30, 2025 |
|
|
|
|
|
|
|
|
|
|
|
|
|
|
|
|
|
|
Realized gain (loss) |
|
$ |
145 |
|
$ |
70 |
|
$ |
(1) |
|
$ |
(16) |
|
$ |
(122) |
|
$ |
76 |
Unrealized gain |
|
|
93 |
|
|
148 |
|
|
16 |
|
|
22 |
|
|
43 |
|
|
322 |
Total realized/unrealized derivatives, net |
|
$ |
238 |
|
$ |
218 |
|
$ |
15 |
|
$ |
6 |
|
$ |
(79) |
|
$ |
398 |
|
|
Gold |
|
Silver |
|
Copper |
|
Lead |
|
Zinc |
|
Total |
||||||
For the nine months ended September 30, 2024 |
|
|
|
|
|
|
|
|
|
|
|
|
|
|
|
|
|
|
Realized gain |
|
$ |
443 |
|
$ |
415 |
|
$ |
79 |
|
$ |
39 |
|
$ |
358 |
|
$ |
1,334 |
Unrealized (loss) gain |
|
|
(42) |
|
|
(83) |
|
|
(13) |
|
|
6 |
|
|
(109) |
|
|
(241) |
Total realized/unrealized derivatives, net |
|
$ |
401 |
|
$ |
332 |
|
$ |
66 |
|
$ |
45 |
|
$ |
249 |
|
$ |
1,093 |
Gold Resource Corporation—Condensed Consolidated Interim Financial Statements and Notes (Unaudited) 30 Other operating adjustments, net within net cash provided by operating activities on the Condensed Consolidated Interim Statements of Cash Flows for the nine months ended September 30, 2025 and 2024 consisted of the following:
23. Supplementary Cash Flow Information
|
|
For the nine months ended September 30, |
||||
|
|
2025 |
|
2024 |
||
|
|
(in thousands) |
||||
Unrealized gain on gold and silver rounds |
|
$ |
(61) |
|
$ |
(35) |
Unrealized foreign currency exchange loss |
|
|
1,334 |
|
|
2,220 |
Unrealized loss on investments |
|
|
- |
|
|
1,168 |
Increase in reserve for inventory |
|
|
422 |
|
|
- |
Other, net |
|
|
1,232 |
|
|
1,093 |
Total other operating adjustments, net |
|
$ |
2,927 |
|
$ |
4,446 |
24. Segment Reporting
The Company has organized its operations into two operating segments: Oaxaca, Mexico, and Michigan, U.S.A. Oaxaca, Mexico represents the Company’s only operating segment with a production stage property that produces copper, lead, and zinc concentrates that also contain gold and silver. Michigan, U.S.A. is an advanced exploration stage property with no current metal production. Intercompany revenue and expense amounts have been eliminated within each segment in order to report the net income (loss) before income taxes on the basis that the chief operating decision maker (“CODM”) uses internally for evaluating segment performance. The Company’s business activities that are not considered to be distinct segments are included in the reconciliation under the title Corporate and Other.
The Company’s operating segments reflect the way in which internally reported financial information is used to make decisions and allocate resources. The Chief Executive Officer, who is considered to be the CODM, reviews financial information presented on both a consolidated and an operating segment basis for purposes of making decisions and assessing financial performance. Net income or loss before income taxes is the measure of segment profit or loss that is regularly reviewed and is most consistent with the measurement principles used in the consolidated financial statements. The most significant expenses reviewed by the CODM are production costs and exploration expenses. Please refer to the table below for other expenses reviewed by the CODM. The CODM uses this information to assess current and/or future performance expectations, and the result of this assessment may be a reallocation of financial and/or non-financial resources among the reportable segments.
Gold Resource Corporation—Condensed Consolidated Interim Financial Statements and Notes (Unaudited) 31 The following table shows selected information from the Condensed Consolidated Interim Statements of Operations relating to the Company’s segments (in thousands):
|
|
Oaxaca, |
|
Michigan, |
|
Corporate |
|
Total |
||||
For the three months ended September 30, 2025 |
|
|
|
|
|
|
|
|
|
|
|
|
Sales, net |
|
$ |
24,878 |
|
$ |
- |
|
$ |
- |
|
$ |
24,878 |
Production costs |
|
|
15,613 |
|
|
- |
|
|
- |
|
|
15,613 |
Depreciation and amortization |
|
|
2,584 |
|
|
26 |
|
|
- |
|
|
2,610 |
Reclamation and remediation |
|
|
434 |
|
|
- |
|
|
- |
|
|
434 |
Mining gross profit (loss) |
|
|
6,247 |
|
|
(26) |
|
|
- |
|
|
6,221 |
Exploration expense |
|
|
799 |
|
|
191 |
|
|
- |
|
|
990 |
G&A expenses, including Stock-based compensation |
|
|
- |
|
|
- |
|
|
1,608 |
|
|
1,608 |
Other segment items (1) |
|
|
2,651 |
|
|
4,150 |
|
|
536 |
|
|
7,337 |
Income (loss) before income taxes |
|
|
2,797 |
|
|
(4,367) |
|
|
(2,144) |
|
|
(3,714) |
Income tax provision |
|
|
|
|
|
|
|
|
|
|
|
941 |
Net loss |
|
|
|
|
|
|
|
|
|
|
$ |
(4,655) |
|
|
|
|
|
|
|
|
|
|
|
|
|
Expenditures for long-lived assets |
|
$ |
6,715 |
|
$ |
- |
|
$ |
- |
|
$ |
6,715 |
|
|
|
|
|
|
|
|
|
|
|
|
|
|
|
Oaxaca, |
|
Michigan, |
|
Corporate |
|
Total |
||||
|
|
|
Restated |
|
|
Restated |
|
|
Restated |
|
|
Restated |
For the three months ended September 30, 2024 |
|
|
|
|
|
|
|
|
|
|
|
|
Sales, net |
|
$ |
13,272 |
|
$ |
- |
|
$ |
- |
|
$ |
13,272 |
Production costs |
|
|
17,198 |
|
|
- |
|
|
- |
|
|
17,198 |
Depreciation and amortization |
|
|
4,143 |
|
|
28 |
|
|
7 |
|
|
4,178 |
Reclamation and remediation |
|
|
566 |
|
|
- |
|
|
- |
|
|
566 |
Mining gross loss |
|
|
(8,635) |
|
|
(28) |
|
|
(7) |
|
|
(8,670) |
Exploration expense |
|
|
767 |
|
|
177 |
|
|
- |
|
|
944 |
G&A expenses, including Stock-based compensation |
|
|
- |
|
|
- |
|
|
1,496 |
|
|
1,496 |
Other segment items (1) |
|
|
1,295 |
|
|
3,374 |
|
|
506 |
|
|
5,175 |
Loss before income taxes |
|
|
(10,697) |
|
|
(3,579) |
|
|
(2,009) |
|
|
(16,285) |
Income tax benefit |
|
|
|
|
|
|
|
|
|
|
|
(3,608) |
Net loss |
|
|
|
|
|
|
|
|
|
|
$ |
(12,677) |
|
|
|
|
|
|
|
|
|
|
|
|
|
Expenditures for long-lived assets |
|
$ |
3,269 |
|
$ |
- |
|
$ |
- |
|
$ |
3,269 |
| (1) | Please see Note 20—Other Expense, net in Item 1—Condensed Consolidated Interim Financial Statements and Notes (unaudited) for additional information. |
Gold Resource Corporation—Condensed Consolidated Interim Financial Statements and Notes (Unaudited)
32
|
|
Oaxaca, |
|
Michigan, |
|
Corporate |
|
Total |
||||
For the nine months ended September 30, 2025 |
|
|
|
|
|
|
|
|
|
|
|
|
Sales, net |
|
$ |
48,460 |
|
$ |
- |
|
$ |
- |
|
$ |
48,460 |
Production costs |
|
|
39,179 |
|
|
- |
|
|
- |
|
|
39,179 |
Depreciation and amortization |
|
|
7,585 |
|
|
78 |
|
|
7 |
|
|
7,670 |
Reclamation and remediation |
|
|
1,262 |
|
|
- |
|
|
- |
|
|
1,262 |
Mine gross profit (loss) |
|
|
434 |
|
|
(78) |
|
|
(7) |
|
|
349 |
Exploration expense |
|
|
1,649 |
|
|
562 |
|
|
- |
|
|
2,211 |
G&A expenses, including Stock-based compensation |
|
|
- |
|
|
- |
|
|
4,191 |
|
|
4,191 |
Other segment items (1) |
|
|
3,861 |
|
|
12,157 |
|
|
934 |
|
|
16,952 |
Loss before income taxes |
|
|
(5,076) |
|
|
(12,797) |
|
|
(5,132) |
|
|
(23,005) |
Income tax provision |
|
|
|
|
|
|
|
|
|
|
|
1,455 |
Net loss |
|
|
|
|
|
|
|
|
|
|
$ |
(24,460) |
|
|
|
|
|
|
|
|
|
|
|
|
|
Expenditures for long-lived assets |
|
$ |
12,647 |
|
$ |
- |
|
$ |
- |
|
$ |
12,647 |
|
|
|
|
|
|
|
|
|
|
|
|
|
|
|
Oaxaca, |
|
Michigan, |
|
Corporate |
|
Total |
||||
|
|
Restated |
|
Restated |
|
Restated |
|
Restated |
||||
For the nine months ended September 30, 2024 |
|
|
|
|
|
|
|
|
|
|
|
|
Sales, net |
|
$ |
52,756 |
|
$ |
- |
|
$ |
- |
|
$ |
52,756 |
Production costs |
|
|
51,074 |
|
|
- |
|
|
- |
|
|
51,074 |
Depreciation and amortization |
|
|
14,115 |
|
|
83 |
|
|
23 |
|
|
14,221 |
Reclamation and remediation |
|
|
1,892 |
|
|
- |
|
|
- |
|
|
1,892 |
Mine gross loss |
|
|
(14,325) |
|
|
(83) |
|
|
(23) |
|
|
(14,431) |
Exploration expense |
|
|
1,850 |
|
|
524 |
|
|
- |
|
|
2,374 |
G&A expenses, including Stock-based compensation |
|
|
- |
|
|
- |
|
|
3,622 |
|
|
3,622 |
Other segment items (1) |
|
|
2,909 |
|
|
10,975 |
|
|
362 |
|
|
14,246 |
Loss before income taxes |
|
|
(19,084) |
|
|
(11,582) |
|
|
(4,007) |
|
|
(34,673) |
Income tax provision |
|
|
|
|
|
|
|
|
|
|
|
10,686 |
Net loss |
|
|
|
|
|
|
|
|
|
|
$ |
(45,359) |
|
|
|
|
|
|
|
|
|
|
|
|
|
Expenditures for long-lived assets |
|
$ |
7,565 |
|
$ |
- |
|
$ |
- |
|
$ |
7,565 |
| (1) | Please see Note 20—Other Expense, net in Item 1—Condensed Consolidated Interim Financial Statements and Notes (unaudited) for additional information. |
Gold Resource Corporation—Condensed Consolidated Interim Financial Statements and Notes (Unaudited) 33 The following table shows selected information from the Condensed Consolidated Interim Balance Sheets relating to the Company’s segments (in thousands):
|
|
Oaxaca, |
|
Michigan, |
|
Corporate |
|
Total |
||||
As of September 30, 2025 |
|
|
|
|
|
|
|
|
|
|
|
|
Total current assets |
|
$ |
22,002 |
|
$ |
18 |
|
$ |
9,205 |
|
$ |
31,225 |
Total non-current assets (1) |
|
|
43,181 |
|
|
89,398 |
|
|
535 |
|
|
133,114 |
Total assets |
|
$ |
65,183 |
|
$ |
89,416 |
|
$ |
9,740 |
|
$ |
164,339 |
|
|
|
|
|
|
|
|
|
|
|
|
|
|
|
Oaxaca, |
|
Michigan, |
|
Corporate |
|
Total |
||||
As of December 31, 2024 |
|
|
|
|
|
|
|
|
|
|
|
|
Total current assets |
|
$ |
16,073 |
|
$ |
50 |
|
$ |
457 |
|
$ |
16,580 |
Total non-current assets (1) |
|
|
38,926 |
|
|
90,328 |
|
|
40 |
|
|
129,294 |
Total assets |
|
$ |
54,999 |
|
$ |
90,378 |
|
$ |
497 |
|
$ |
145,874 |
| (1) | As of September 30, 2025, the total non-current assets included capital investments of $12.6 million in Oaxaca, Mexico, nil in Michigan, USA, and nil in Corporate and Other. As of December 31, 2024, the total non-current assets included capital investments of $8.6 million in Oaxaca, Mexico, nil in Michigan, USA, and nil in Corporate and Other. |
Gold Resource Corporation—Condensed Consolidated Interim Financial Statements and Notes (Unaudited) 34 ITEM 2.
Management’s Discussion and Analysis of Financial Condition and Results of Operations
The following discussion summarizes the results of operations of Gold Resource Corporation and its subsidiaries (“we,” “our,” “us,” or the “Company”) for the three and nine months ended September 30, 2025 and compares those results with the three and nine months ended September 30, 2024. It also analyzes the Company’s financial condition as of September 30, 2025, and compares it to the financial condition as of December 31, 2024. This discussion should be read in conjunction with management’s discussion and analysis and the audited consolidated financial statements and footnotes contained in the 2024 Annual Report.
The discussion also presents certain non-GAAP financial measures that are important to management in its evaluation of the operating results, and which are used by management to compare the Company’s performance with what it perceives to be peer group mining companies and are relied on as part of management’s decision-making process. Management believes these measures may also be important to investors in evaluating the Company’s performance. For a detailed description of each of the non-GAAP financial measures and a reconciliation to U.S. GAAP financial measures, please see the discussion below under Non-GAAP Measures. Also see Forward-Looking Statements at the end of this Item 2 for important information regarding statements contained herein.
Overview
Gold Resource Corporation is a mining company focused on the development of precious and base metal projects that have the potential for high returns and limited development capital requirements. DDGM is the Company’s cornerstone operating asset comprised of six contiguous land parcels. The Company’s focus is unlocking the significant upside potential of DDGM through optimization of the current operations, growing the existing mineral resource by investing in exploration drilling, and identifying new opportunities near existing infrastructure. The primary mineral production comes from the Arista and Switchback underground mining areas, along with the recently added Three Sisters vein system. The mine and its processing facilities can produce gold and silver doré, as well as concentrates of copper, lead, and zinc.
The Back Forty Project, when developed, is expected to produce gold and silver doré and concentrates of copper and zinc bearing gold and silver. Optimization work related to metallurgy and the economic model was completed during the third quarter of 2023 and the Company filed the Back Forty Project Technical Report Summary, effective as of September 30, 2023, on October 26, 2023. Results of the work indicate a more robust economic project with no planned impacts to wetlands that is more protective of the environment, which should facilitate a successful mine permitting process. The Company is currently in discussions to complete a Feasibility Study and to move forward with the permitting process for The Back Forty Project. This work is planned to begin before the end of 2025.
Gold Resource Corporation
35
|
Underground Exposure of the Santa Helena vein Level 25 – Arista System |
|
During the third quarter of 2025, DDGM made meaningful progress in addressing production constraints stemming from limited equipment availability and an aging fleet. While these challenges impacted operational efficiency and reduced development rates early in the quarter, the Company responded decisively with a series of strategic initiatives aimed at enhancing productivity and positioning the mine for improved performance. To accelerate development, the Company engaged Cominvi Servicios S.A. de C.V. for contract mining services, successfully completing 1,435 meters of mine development in the Three Sisters zone. Early development work, including crosscuts and strike extensions, confirmed encouraging results with wide vein widths and high-grade mineralization. An ongoing grade control and infill drilling campaign is expected to further refine the block model and support updates to the mine plan. In parallel, the Company launched a targeted equipment acquisition program focused on sourcing lightly used, appropriately sized machinery to meet projected mining requirements. This initiative is already contributing to improved fleet reliability and availability. Additionally, DDGM is optimizing mining methods by introducing cut-and-fill techniques in narrow vein areas, complementing the traditional long-hole stoping approach to reduce dilution and maintain grade quality. By the end of the third quarter, these combined efforts—contractor support, equipment upgrades, and method optimization—enabled the Company to increase the number of active underground mine headings and initiate production from the Three Sisters zone. These enhancements are expected to yield continued operational benefits through the remainder of the year. While DDGM recorded four lost time accidents during the quarter, none had a material impact on operations. The team is focused on the Company’s commitment to safety, efficiency, and continuous improvement as part of its broader strategy to overcome current challenges and drive long-term success. |
DDGM Exploration Update
The Company’s portfolio of properties that are included in DDGM are located along a 55-kilometer stretch of the San Jose structural corridor in the Sierra Madre Sur mountain range in the state of Oaxaca, Mexico. This highly prospective district encompasses three historic mining centers, where the Company continues to engage in strategic planning and prioritization of regional surface exploration activities across multiple projects including Alta Gracia, Margaritas, Chamizo, El Rey, and Jabali (see map below). In addition, prospects near the Arista mine are re-evaluated for near-term potential to prioritize high-value near-mine drill targets. These efforts are focused on defining additional high-value drill targets and reinforce the Company’s long-term commitment to investment in the Oaxaca region and continued operations at DDGM.
Gold Resource Corporation
36
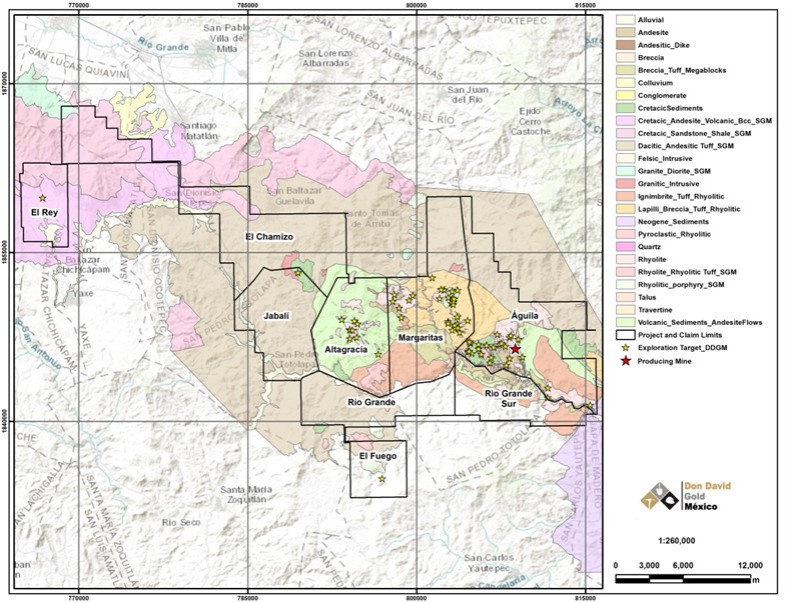
Regional Geologic Map Showing Advanced Project and Prospect Locations and Exploration Concessions Controlled by Don David Gold Mine
During the third quarter, a total of 23 underground diamond drill holes totaling 2,756 meters were completed, focused on grade control and infill drilling from accessible areas, supported by three diamond drill rigs, two contract and one owned and operated by DDGM. Drilling targeted veins in the upper levels of the Three Sisters system, as well as upper levels of the Marena North and Splay 31 veins, the down-dip extension of Viridiana, and deeper portions of the Candelaria vein within the Arista system. In addition, drilling commenced from Level 30 targeting the Soledad South vein in the Switchback system. These programs continue to improve the geologic model, refine variances in the mine plan, and identify production opportunities.
The primary objective of these drill programs is to increase confidence in the short-term geologic model, enabling the mine plan to prioritize ore delivery from each area with the highest potential net smelter return (“NSR”). Infill drilling successfully defined the up-dip, down-dip and northwest limits of the Three Sisters system, in addition to key veins within the Arista system. While the Company believes the mine has the potential to generate positive cash flow based on current information from the new areas in Three Sisters, as well as other areas that have been discovered near existing mining zones, in order to do so, it is critical that these new areas can be added to the life-of-mine plan. Exploration potential remains strong across all vein systems, particularly along northwest trending extensions of the Arista and Three Sisters vein systems, that remain open along strike as well as up- and down-dip.
Expansion (step-out) portion of the drill program remained suspended during the third quarter as the Company continued to manage expenditures and advance development of new underground drill stations necessary to support future step-out programs.
Gold Resource Corporation
37
However, grade control and infill drilling continued to refine the Three Sisters geologic model, addressing variability with the inferred mineral resource identified in the prior quarter.
Recent interim resource model updates reclassified certain vein structures and removed lower grade zones. While these changes are expected to reduce total inferred tonnes, they should have a positive impact on the resulting average NSR value. Information from the ongoing grade control and infill drilling programs are used to guide ongoing model updates in preparation for the year-end resource estimate.
During the third quarter, grade control and infill drilling at the Arista mine focused on the following key zones:
| o | Three Sisters vein system: Drilling continued to improve and validate the geological model confirming vein widths and grades along the central and northwestern portions of the system. Drilling targeted the Sandy and Sadie vein sets from drill stations on Level 3 developed earlier in the year. |
| o | Arista vein system: Drilling was completed from Level 3 targeting the upper-central portions of the Marena North and Splay 31 veins, from Level 17 on the Candelaria vein, and from Levels 24 and 25 on the Viridiana vein complex. These targets were selected to evaluate near-term production opportunities that had not been previously realized within the Arista system. Multiple high-quality exploration targets, both surface and underground, have been defined at the Arista mine, highlighting the potential for future mineral resource expansion; however, further exploration expenditures in 2025 will remain dependent on improvements in cash flow. |
| o | Switchback vein system: Drilling commenced during the quarter from Level 30 targeting the Soledad South and Sagrario veins to support near-term production planned in this zone. |
|
|
Hole No. 525061: Marena North vein (95.83 – 102.58 m; 6.75 m). Arista System Q3 2025. 5.23 m estimated true width at 5.06 g/t AuEq of $450/t NSR (3.21 g/t Au, 169 g/t Ag, 0.40% Cu, 2.88% Pb, 4.92% Zn) |
Gold Resource Corporation
38
Results of Operations
Don David Gold Mine
Mine activities during the third quarter of 2025 included development and ore extraction from the Arista mine.
The following table summarizes certain production statistics about DDGM for the periods indicated:
|
|
For the three months ended September 30, |
|
For the nine months ended September 30, |
||||||||
|
|
2025 |
|
2024 |
|
2025 |
|
2024 |
||||
Arista Mine |
|
|
|
|
|
|
|
|
|
|
|
|
Milled |
|
|
|
|
|
|
|
|
|
|
|
|
Tonnes Milled |
|
|
65,131 |
|
|
83,690 |
|
|
185,516 |
|
|
276,266 |
Grade |
|
|
|
|
|
|
|
|
|
|
|
|
Average Gold Grade (g/t) |
|
|
1.11 |
|
|
0.54 |
|
|
0.80 |
|
|
1.27 |
Average Silver Grade (g/t) |
|
|
250 |
|
|
83 |
|
|
179 |
|
|
91 |
Average Copper Grade (%) |
|
|
0.16 |
|
|
0.19 |
|
|
0.16 |
|
|
0.28 |
Average Lead Grade (%) |
|
|
0.63 |
|
|
1.01 |
|
|
0.74 |
|
|
1.09 |
Average Zinc Grade (%) |
|
|
1.57 |
|
|
2.63 |
|
|
2.00 |
|
|
2.69 |
Recoveries |
|
|
|
|
|
|
|
|
|
|
|
|
Average Gold Recovery (%) |
|
|
70.7 |
|
|
65.1 |
|
|
69.5 |
|
|
76.7 |
Average Silver Recovery (%) |
|
|
86.5 |
|
|
87.4 |
|
|
85.0 |
|
|
87.7 |
Average Copper Recovery (%) |
|
|
68.0 |
|
|
57.4 |
|
|
60.5 |
|
|
71.7 |
Average Lead Recovery (%) |
|
|
58.7 |
|
|
68.2 |
|
|
64.4 |
|
|
66.5 |
Average Zinc Recovery (%) |
|
|
76.9 |
|
|
79.1 |
|
|
77.3 |
|
|
81.8 |
Combined |
|
|
|
|
|
|
|
|
|
|
|
|
Tonnes Milled (1) |
|
|
65,131 |
|
|
83,690 |
|
|
185,516 |
|
|
276,266 |
Tonnes Milled per Day (2) |
|
|
1,124 |
|
|
1,244 |
|
|
1,144 |
|
|
1,293 |
Metal production |
|
|
|
|
|
|
|
|
|
|
|
|
Gold (ozs.) |
|
|
1,646 |
|
|
944 |
|
|
3,307 |
|
|
8,648 |
Silver (ozs.) |
|
|
453,057 |
|
|
194,525 |
|
|
906,777 |
|
|
709,255 |
Copper (tonnes) |
|
|
73 |
|
|
93 |
|
|
177 |
|
|
554 |
Lead (tonnes) |
|
|
241 |
|
|
576 |
|
|
886 |
|
|
2,004 |
Zinc (tonnes) |
|
|
784 |
|
|
1,741 |
|
|
2,863 |
|
|
6,071 |
Metal produced and sold |
|
|
|
|
|
|
|
|
|
|
|
|
Gold (ozs.) |
|
|
1,422 |
|
|
1,357 |
|
|
3,159 |
|
|
7,638 |
Silver (ozs.) |
|
|
417,710 |
|
|
181,434 |
|
|
798,395 |
|
|
632,529 |
Copper (tonnes) |
|
|
67 |
|
|
98 |
|
|
160 |
|
|
559 |
Lead (tonnes) |
|
|
212 |
|
|
467 |
|
|
761 |
|
|
1,625 |
Zinc (tonnes) |
|
|
645 |
|
|
1,473 |
|
|
2,322 |
|
|
4,926 |
Percentage payable metal (3) |
|
|
|
|
|
|
|
|
|
|
|
|
Gold (%) |
|
|
86 |
|
|
144 |
|
|
96 |
|
|
88 |
Silver (%) |
|
|
92 |
|
|
93 |
|
|
88 |
|
|
89 |
Copper (%) |
|
|
92 |
|
|
105 |
|
|
90 |
|
|
101 |
Lead (%) |
|
|
88 |
|
|
81 |
|
|
86 |
|
|
81 |
Zinc (%) |
|
|
82 |
|
|
85 |
|
|
81 |
|
|
81 |
| (1) | Based on actual days the mill operated during the period. |
| (2) | The difference between what the Company reports as “ounces/tonnes produced” and “payable ounces/tonnes sold” is attributable to the difference between the quantities of metals contained in the concentrates the Company produces versus the portion of those metals actually paid for according to the terms of the Company’s sales contracts. Differences can also arise from inventory changes incidental to shipping schedules, or variances in ore grades and recoveries, which impact the amounts of metals contained in concentrates produced and sold. |
| (3) | The difference between what the Company reports as “ounces/tonnes produced” and “payable ounces/tonnes sold” is attributable to the difference between the quantities of metals contained in the concentrates it produces versus the portion of those metals actually paid for according to the terms of the sales contracts. Differences can also arise from inventory changes incidental to shipping schedules, or variances in ore grades and recoveries, which impact the amount of metals contained in concentrates produced and sold. |
Gold Resource Corporation
39
Third quarter 2025 compared to third quarter 2024
Production
During the three months ended September 30, 2025, total tonnes milled of 65,131 were 22% lower than in the same period in 2024. Metal production for gold and silver increased 74% and 133%, respectively, while copper, lead, and zinc decreased by 22%, 58%, and 55% during the three months ended September 30, 2025, as compared to the same period last year. Although lower tonnes processed and lower metal grades for all metals, with the exception of silver, were expected in the 2025 mine plan, the third quarter production was still impacted by the limited availability of critical mining equipment and the lack of production headings. Additional production headings became available only near the end of the third quarter.
Grades & recoveries
During the three months ended September 30, 2025, all of the ore processed came from the Arista mine with an average gold grade of 1.11 g/t and silver grade of 250 g/t, compared to an average gold grade of 0.54 g/t and silver grade of 83 g/t, respectively, for the same period in 2024. For the three months ending September 30, 2025, the average gold grade was 106% higher and the average silver grade was 201% higher when compared to the same period in 2024. The increase in gold and silver grades is partly attributable to the commencement of production from the upper levels of the Three Sisters vein system. As shown in the updated Don David Gold Mine Technical Report Summary, effective as of December 31, 2024, which is incorporated by reference as Exhibit 96.2 to the 2024 Annual Report (the “DDGM Technical Report Summary”), the ore grades are generally expected to decline over time in line with the life of mine average shown in the estimates of mineral reserves (as defined by Subpart 1300 of Regulation S-K, “Mineral Reserves”) and mineral resources (as defined by Subpart 1300 of Regulation S-K, “Mineral Resources”) contained therein. However, as new areas are developed and the mine plan and the technical report is updated, the life of mine averages shown in the estimates of mineral reserves may either increase or decrease. As grades decline below certain lower limits, recoveries are generally expected to decline as well. The Company’s base metals average grades during the three months ended September 30, 2025 were 0.16% for copper, 0.63% for lead, and 1.57% for zinc. Copper, lead, and zinc grades were lower by 16%, 38%, and 40% respectively, as compared to same period in 2024.
Gold and silver recoveries for the three months ended September 30, 2025 were 70.7% and 86.5%, respectively, reflecting a 9% increase for gold and a 1% decrease for silver over the same period in 2024. Copper, lead, and zinc recoveries for the three months ended September 30, 2025 were 68.0%, 58.7%, and 76.9%, respectively. While recoveries for lead and zinc declined by 14% and 3%, respectively, in the three months ended September 30, 2025 when compared to the same period in 2024, copper recovery increased by 18%.
Year-to-date 2025 compared to year-to-date 2024
Production
During the nine months ended September 30, 2025, total tonnes milled of 185,516 were 33% lower than in the same period in 2024. Metal production for gold, copper, lead, and zinc decreased by 62%, 68%, 56%, and 53%, respectively, while silver production increased by 28% during the nine months ended September 30, 2025, as compared to the same period last year. Although lower tonnes processed and lower metal grades for all metals, with the exception of silver, were expected in the 2025 mine plan, the year-to-date production was still impacted by the limited availability of critical mining equipment and the lack of production headings faces headings. Additional production headings became available only near the end of the third quarter.
Grades & recoveries
During the nine months ended September 30, 2025, all of the ore processed came from the Arista mine with an average gold grade of 0.80 g/t and silver grade of 179 g/t, compared to an average gold grade of 1.27 g/t and silver grade of 91 g/t, respectively, for the same period in 2024. For the nine months ending September 30, 2025, the average gold grade was 37% lower and the average silver grade was 97% higher when compared to the same period in 2024. This reduction in gold grade is partly due to the additional dilution caused by mining narrower veins, as scheduled in the 2025 mine plan.
Gold Resource Corporation
40
As shown in the DDGM Technical Report Summary, the ore grades are generally expected to decline over time in line with the life of mine average shown in the estimates of Mineral Reserves and Mineral Resources contained therein. As grades decline below certain lower limits, recoveries are generally expected to decline as well. The Company’s base metals average grades during the nine months ended September 30, 2025 were 0.16% for copper, 0.74% for lead, and 2.00% for zinc. The copper, lead, and zinc grades were lower by 43%, 32%, and 26%, respectively, as compared to same period in 2024.
Gold and silver recoveries for the nine months ended September 30, 2025 were 69.5% and 85.0%, respectively, reflecting a 9% decrease for gold and a 3% decrease for silver over the same period in 2024. Copper, lead, and zinc recoveries for the nine months ended September 30, 2025 were 60.5%, 64.4%, and 77.3%, respectively. Recoveries for copper, lead, and zinc declined by 16%, 3%, and 6%, respectively, in the nine months ended September 30, 2025 when compared to the same period in 2024.
Sales Statistics
The following table summarizes certain sales statistics about DDGM operations for the periods indicated:
|
|
For the three months ended September 30, |
|
For the nine months ended September 30, |
||||||||
|
|
2025 |
|
2024 |
|
2025 |
|
2024 |
||||
Net sales (in thousands) |
|
|
|
|
|
|
|
|
|
|
|
|
Gold |
|
$ |
4,984 |
|
$ |
3,416 |
|
$ |
10,379 |
|
$ |
17,197 |
Silver |
|
|
17,280 |
|
|
5,424 |
|
|
29,879 |
|
|
17,333 |
Copper |
|
|
659 |
|
|
917 |
|
|
1,545 |
|
|
5,099 |
Lead |
|
|
417 |
|
|
918 |
|
|
1,481 |
|
|
3,342 |
Zinc |
|
|
1,868 |
|
|
4,045 |
|
|
6,390 |
|
|
13,108 |
Less: Treatment and refining charges |
|
|
(608) |
|
|
(1,394) |
|
|
(1,612) |
|
|
(4,416) |
Realized and unrealized gain (loss) - embedded derivative, net |
|
|
278 |
|
|
(54) |
|
|
398 |
|
|
1,093 |
Total sales, net |
|
$ |
24,878 |
|
$ |
13,272 |
|
$ |
48,460 |
|
$ |
52,756 |
Metal produced and sold |
|
|
|
|
|
|
|
|
|
|
|
|
Gold (ozs.) |
|
|
1,422 |
|
|
1,357 |
|
|
3,159 |
|
|
7,638 |
Silver (ozs.) |
|
|
417,710 |
|
|
181,434 |
|
|
798,395 |
|
|
632,529 |
Copper (tonnes) |
|
|
67 |
|
|
98 |
|
|
160 |
|
|
559 |
Lead (tonnes) |
|
|
212 |
|
|
467 |
|
|
761 |
|
|
1,625 |
Zinc (tonnes) |
|
|
645 |
|
|
1,473 |
|
|
2,322 |
|
|
4,926 |
Average metal prices realized (1) |
|
|
|
|
|
|
|
|
|
|
|
|
Gold ($ per oz.) |
|
$ |
3,546 |
|
$ |
2,561 |
|
$ |
3,331 |
|
$ |
2,309 |
Silver ($ per oz.) |
|
$ |
41.39 |
|
$ |
30.61 |
|
$ |
37.51 |
|
$ |
28.06 |
Copper ($ per tonne) |
|
$ |
9,690 |
|
$ |
8,832 |
|
$ |
9,660 |
|
$ |
9,260 |
Lead ($ per tonne) |
|
$ |
1,937 |
|
$ |
2,065 |
|
$ |
1,924 |
|
$ |
2,080 |
Zinc ($ per tonne) |
|
$ |
2,841 |
|
$ |
2,854 |
|
$ |
2,699 |
|
$ |
2,733 |
Gold equivalent ounces sold |
|
|
|
|
|
|
|
|
|
|
|
|
Gold Ounces |
|
|
1,422 |
|
|
1,357 |
|
|
3,159 |
|
|
7,638 |
Gold Equivalent Ounces from Silver |
|
|
4,876 |
|
|
2,169 |
|
|
8,991 |
|
|
7,687 |
Total AuEq oz |
|
|
6,298 |
|
|
3,526 |
|
|
12,150 |
|
|
15,325 |
| (1) | Average metal prices realized vary from the market metal prices due to final settlement adjustments from the Company’s provisional invoices when they are settled. The Company’s average metal prices realized will therefore differ from the average market metal prices in most cases. |
Gold Resource Corporation
41
Third quarter 2025 compared to third quarter 2024
Besides the expected lower tonnes mined and changes in metal grades and recoveries for the three months ended September 30, 2025, as compared to the same period in 2024, the key drivers of the production and financial results relate to the issues the Company continued to face in the third quarter of 2025, including the issues with equipment availability due to the age and condition of some of the critical mining equipment and the lack of other available production headings that were not available until late in the third quarter.
Metal sold
During the three months ended September 30, 2025, gold sales of 1,422 ounces and silver sales of 417,710 ounces increased by 5% and 130%, respectively, while copper sales of 67 tonnes, lead sales of 212 tonnes, and zinc sales of 645 tonnes decreased by 32%, 55%, and 56%, respectively, when compared to the same period in 2024. The lower metal production was partially expected due to mine sequencing, but challenges with equipment availability and the lack of production headings also negatively affected the Company’s metal sales and production.
Average metal prices realized
During the three months ended September 30, 2025, the average metal prices were $3,546 per gold ounce, $41.39 per silver ounce, $9,690 per tonne for copper, $1,937 per tonne for lead, and $2,841 per tonne for zinc. Compared to the same period in 2024, the average metal price for gold, silver, and copper increased by 38%, 35%, and 10% respectively. The average metal price for lead, and zinc decreased by 6% and less than 1%, respectively.
Year-to-date 2025 compared to year-to-date 2024
Besides the expected lower tonnes mined and changes in metal grades and recoveries for the nine months ended September 30, 2025, as compared to the same period in 2024, the key drivers of the production and financial results relate to the issues the Company continued to face even in the third quarter of 2025, including the issues with equipment availability due to the age and condition of some of the critical mining equipment and the lack of other available headings that were not available until late in the third quarter.
Metal sold
During the nine months ended September 30, 2025, gold sales of 3,159 ounces, copper sales of 160 tonnes, lead sales of 761 tonnes, and zinc sales of 2,322 tonnes decreased by 59%, 71%, 53%, and 53%, respectively, while silver sales of 798,395 ounces increased by 26% compared to the same period in 2024. The lower metal production was partially expected due to mine sequencing, but challenges with equipment availability and the lack of production headings also negatively affected the Company’s metal sales and production.
Average metal prices realized
During the nine months ended September 30, 2025, the average metal prices were $3,331 per gold ounce, $37.51 per silver ounce, $9,660 per tonne for copper, $1,924 per tonne for lead, and $2,699 per tonne for zinc. Compared to the same period in 2024, the average metal price for gold, silver and copper increased by 44%, 34%, and 4% respectively, while the average metal price for lead and zinc decreased by 8% and 1%, respectively.
Gold Resource Corporation
42
Financial Measures
The following table summarizes certain financial data of the Company for the periods indicated:
|
|
For the three months ended September 30, |
|
For the nine months ended September 30, |
||||||||
|
|
2025 |
|
2024 |
|
2025 |
|
2024 |
||||
|
|
|
|
Restated |
|
|
|
Restated |
||||
|
|
(in thousands) |
|
(in thousands) |
||||||||
Doré and concentrate sales |
|
$ |
25,208 |
|
$ |
14,720 |
|
$ |
49,674 |
|
$ |
56,079 |
Less: Treatment and refining charges |
|
|
(608) |
|
|
(1,394) |
|
|
(1,612) |
|
|
(4,416) |
Realized/unrealized derivatives, net |
|
|
278 |
|
|
(54) |
|
|
398 |
|
|
1,093 |
Sales, net |
|
|
24,878 |
|
|
13,272 |
|
|
48,460 |
|
|
52,756 |
Total cost of sales |
|
|
18,657 |
|
|
21,942 |
|
|
48,111 |
|
|
67,187 |
Mine gross profit (loss) |
|
|
6,221 |
|
|
(8,670) |
|
|
349 |
|
|
(14,431) |
Other costs and expenses, including taxes |
|
|
10,876 |
|
|
4,007 |
|
|
24,809 |
|
|
30,928 |
Net loss |
|
$ |
(4,655) |
|
$ |
(12,677) |
|
$ |
(24,460) |
|
$ |
(45,359) |
Third quarter 2025 compared to third quarter 2024
Sales, net
Net sales of $24.9 million for DDGM for the three months ended September 30, 2025 increased by $11.6 million, or 87%, when compared to the same period in 2024. The increase in 2025 net sales compared to the net sales in the third quarter of 2024 is the result of higher gold and silver prices and the 56% lower treatment and refining charges during the three months ended September 30, 2025 due to lower tonnes shipped and the improved contractual terms for treatment and refining charges in the sales agreements in 2025.
Total cost of sales
Total cost of sales of $18.7 million for the three months ended September 30, 2025 decreased by 15% from $21.9 million for the same period in 2024. The $3.2 million decrease was primarily related to a $1.6 million decrease in production cost and a $1.6 million decrease in depreciation expense. Production costs of $15.6 million for the three months ended September 30, 2025 are 9% lower than the production costs of $17.2 million for the same period in 2024.
Mine gross profit (loss)
For the three months ended September 30, 2025, the Company had a mine gross profit of $6.2 million, compared to a mine gross loss of $8.7 million for the three months ended September 30, 2024. Mine gross profit increased by $14.9 million, or 171%, compared to the same period in 2024. The increase in mine gross profit was primarily due to higher net sales that did not cause a proportional increase in production costs. While net sales increased by 87% in the quarter, the production costs decreased by 9%, or $1.6 million, compared to the third quarter of 2024.
The mine gross profit or loss maintains a limited correlation to tonnes of ore processed; however, multiple factors will impact the net sales and operating costs figures contained within the mine gross profit or loss in comparison to the tonnes of ore processed. For example, concerning net sales, attributes of the tonnes of ore processed (including ore grade and processing recoveries) along with metal commodity prices can result in lower or higher sales. Mine operating costs include variable costs that maintain a correlation to the tonnes both mined and processed (i.e., equipment usage, reagents, inventory consumables, royalties etc.) and further include fixed costs which maintain a lower correlation to the tonnes of ore processed (i.e. payroll, utilities, insurance, mining concessions, etc.).
Gold Resource Corporation
44
Net loss
For the three months ended September 30, 2025, the Company recorded a net loss of $4.7 million, compared to a net loss of $12.7 million during the same period in 2024. The $8.0 million decrease in net loss is mainly attributable to the income tax provision recorded in the third quarter of 2024 due to the valuation allowance for the deferred tax assets in DDGM.
Year-to-date 2025 compared to year-to-date 2024
Sales, net
Net sales of $48.5 million for DDGM for the nine months ended decreased by $4.3 million, or 8%, when compared to the same period in 2024. The decrease in net sales for 2025 is the result of decreased production volumes as outlined in the sales statistics table above, partially offset by a 63% decrease in treatment and refining charges during the nine months ended September 30, 2025, due to lower tonnes shipped and the improved contractual terms for treatment and refining charges in the sales agreements in 2025.
Total cost of sales
Total cost of sales of $48.1 million for the nine months ended September 30, 2025 decreased by 28% from $67.2 million for the same period in 2024. The $19.1 million decrease was primarily related to a $11.9 million decrease in production cost and a $6.6 million decrease in depreciation expense. Production costs of $39.2 million for the nine months ended September 30, 2025 are 23% lower than the production costs of $51.1 million for the same period in 2024.
Mine gross profit (loss)
For the nine months ended September 30, 2025, the Company had a mine gross profit of $0.3 million, compared to a mine gross loss of $14.4 million for the nine months ended September 30, 2024. Mine gross profit increased by $14.8 million, or 102%, compared to the same period in 2024. The increase in mining gross profit was primarily due to the fact that the lower net sales caused a higher than proportional decrease in production costs. While net sales decreased only by 8%, the production costs decreased by 23%, or $11.9 million, compared to the same period in 2024.
The mine gross profit or loss maintains a limited correlation to tonnes of ore processed; however, multiple factors will impact the net sales and operating costs figures contained within the mine gross profit or loss in comparison to the tonnes of ore processed. For example, concerning net sales, attributes of the tonnes of ore processed (including ore grade and processing recoveries) along with metal commodity prices can result in lower or higher sales. Mine operating costs include variable costs that maintain a correlation to the tonnes both mined and processed (i.e., equipment usage, reagents, inventory consumables, royalties etc.) and further include fixed costs which maintain a lower correlation to the tonnes of ore processed (i.e. payroll, utilities, insurance, mining concessions, etc.).
Net loss
For the nine months ended September 30, 2025, the Company recorded a net loss of $24.5 million, compared to a net loss of $45.4 million during the same period in 2024. The $20.9 million decrease in net loss is mainly attributable to the income tax provision recorded in the third quarter of 2024 due to the valuation allowance for the deferred tax assets in DDGM.
Gold Resource Corporation
45
Other Costs and Expenses, Including Taxes
|
|
For the three months ended September 30, |
|
For the nine months ended September 30, |
||||||||
|
|
2025 |
|
2024 |
|
2025 |
|
2024 |
||||
|
|
|
|
Restated |
|
|
|
Restated |
||||
|
|
(in thousands) |
|
(in thousands) |
||||||||
Other costs and expenses: |
|
|
|
|
|
|
|
|
|
|
|
|
General and administrative expenses |
|
$ |
1,205 |
|
$ |
1,293 |
|
$ |
2,993 |
|
$ |
2,975 |
Mexico exploration expenses |
|
|
799 |
|
|
767 |
|
|
1,649 |
|
|
1,850 |
Michigan Back Forty Project expenses |
|
|
191 |
|
|
177 |
|
|
562 |
|
|
524 |
Stock-based compensation |
|
|
403 |
|
|
203 |
|
|
1,198 |
|
|
647 |
Other expense, net |
|
|
7,337 |
|
|
5,175 |
|
|
16,952 |
|
|
14,246 |
Total other costs and expenses |
|
|
9,935 |
|
|
7,615 |
|
|
23,354 |
|
|
20,242 |
Income tax provision (benefit) |
|
|
941 |
|
|
(3,608) |
|
|
1,455 |
|
|
10,686 |
Total other costs and expenses, including taxes |
|
$ |
10,876 |
|
$ |
4,007 |
|
$ |
24,809 |
|
$ |
30,928 |
Third quarter 2025 compared to third quarter 2024
General and administrative expenses: For the three months ended September 30, 2025 and 2024, general and administrative expenses were $1.2 million and $1.3 million, respectively. In 2025, the Company continued the cost saving measures implemented in 2024.
Mexico exploration expenses: For the three months ended September 30, 2025, exploration expenses at DDGM totaled $0.8 million, compared to $0.8 million for the same period in 2024. Exploration expenditures in Oaxaca, Mexico, remained stable as drilling activity was comparable to the same period in 2024, and additional underground exploration development was offset by cost efficiencies.
Michigan Back Forty Project expenses: For the three months ended September 30, 2025, costs for the Back Forty Project were $0.2 million, compared to $0.2 million for the same period in 2024. The Company has not been actively progressing the project since the beginning of 2024.
Stock-based compensation: Stock-based compensation increased by $0.2 million for the three months ended September 30 2025, compared to the same period in 2024 due to the increase in share price in 2025.
Other expense, net: For the three months ended September 30, 2025, the Company incurred $7.3 million of other expenses, an increase of $2.2 million from the same period in 2024. This increase is largely driven by a $1.7 million higher expense in the third quarter of 2025 related to a VAT tax receivable in Mexico, a $0.8 million increase in interest on the streaming liabilities, and a $0.4 million increase in reserve for obsolescence, offset by $0.6 million lower realized loss on investment. Please see Note 20—Other Expense, net in Item 1—Condensed Consolidated Interim Financial Statements and Notes (unaudited) for additional details.
Income tax provision (benefit): For the three months ended September 30, 2025, income tax expense was $0.9 million, compared to a $3.6 million income tax benefit for the same period in 2024. The increase in income tax expense for the three months ended September 30, 2025 is primarily driven by the additional valuation allowance recorded during the third quarter of 2025 on the DDGM deferred tax assets.
Year-to-date 2025 compared to year-to-date 2024
General and administrative expenses: For the nine months ended September 30, 2025 and 2024, general and administrative expenses were $3.0 million and $3.0 million, respectively. In 2025, the Company continued the cost saving measures implemented in 2024.
Gold Resource Corporation
46
Mexico exploration expenses: For the nine months ended September 30, 2025, exploration expenses in DDGM totaled $1.6 million, compared to $1.9 million for the same period in 2024. Exploration expenditures in Oaxaca, Mexico, decreased compared to the same period in 2024 primarily due to the absence of expansion drilling in 2025, partially offset by ongoing underground exploration development costs.
Michigan Back Forty Project expenses: For the nine months ended September 30, 2025, costs for the Back Forty Project were $0.6 million, compared to $0.5 million in the same period in 2024. The Company has not been actively progressing the project since the beginning of 2024.
Stock-based compensation: Stock-based compensation increased by $0.6 million for the nine months ended September 30, 2025, compared to the same period in 2024 due to the increase in share price in 2025.
Other expense, net: For the nine months ended September 30, 2025, the Company incurred $17.0 million of other expenses, an increase of $2.7 million from the same period in 2024. This increase is largely driven by a $2.4 million increase in the interest on the streaming liabilities, a $0.5 million higher expense due to the interest on loan payable in 2025, a $0.3 million higher realized loss from investments in 2025, offset by $0.5 million lower severance costs. Please see Note 20—Other Expense, net in Item 1—Condensed Consolidated Interim Financial Statements and Notes (unaudited) for additional details.
Income tax provision (benefit): For the nine months ended September 30, 2025, income tax expense was $1.5 million, compared to $10.7 million for the same period in 2024. The decrease in income tax expense for the nine months ended September 30, 2025 is primarily driven by the valuation allowance that was recorded in the third quarter of 2024.
Other Non-GAAP Financial Measures
Certain non-GAAP financial measures are discussed below. For a detailed description of each of these measures and a reconciliation to U.S. GAAP financial measures, please see the discussion under Item 2. Management’s Discussion and Analysis of Financial Condition and Results of Operations—Non-GAAP Measures below.
|
|
For the three months ended September 30, |
|
For the nine months ended September 30, |
||||||||
|
|
2025 |
|
2024 |
|
2025 |
|
2024 |
||||
|
|
|
|
Restated |
|
|
|
Restated |
||||
Other Non-GAAP Financial Measures: |
|
|
|
|
|
|
|
(in thousands) |
||||
Total cash cost after co-product credits per AuEq oz sold (1) |
|
$ |
2,116 |
|
$ |
3,560 |
|
$ |
2,594 |
|
$ |
2,184 |
Total consolidated all-in sustaining cost after co-product credits per AuEq oz sold (1) |
|
$ |
2,983 |
|
$ |
5,072 |
|
$ |
3,542 |
|
$ |
3,037 |
Total all-in cost after co-product credits per AuEq oz sold (1) |
|
$ |
3,664 |
|
$ |
5,340 |
|
$ |
4,265 |
|
$ |
3,192 |
| (1) | For a detailed description of each of the non-GAAP financial measures and a reconciliation to U.S. GAAP financial measures, please see the discussion under Item 2. Management’s Discussion and Analysis of Financial Condition and Results of Operations—Non-GAAP Measures below. |
Gold Resource Corporation
47
Third quarter 2025 compared to third quarter 2024
Total cash cost after co-product credits per AuEq oz sold: For the three months ended September 30, 2025, the total cash cost after co-product credits per AuEq oz sold is $2,116 compared to $3,560 for the same period in 2024. The decrease in the total cash cost is due to the 52% lower co-product credits the Company received during the third quarter of 2025 and the 79% increase in the total number of AuEq ounces sold, offset by a 56% decrease in total treatment and refining charges and a 9% decrease in production costs as a result of the decline in third quarter 2025 production as compared to third quarter 2024 production.

Total consolidated all-in sustaining cost after co-product credits per AuEq oz sold: For the three months ended September 30, 2025, the total consolidated all-in sustaining cost after co-product credits per AuEq oz sold was $2,983 as compared to $5,072 for the same period in 2024. The decrease directly relates to the lower cash costs per ounce discussed above.
Total all-in cost after co-product credits per AuEq oz sold: For the three months ended September 30, 2025, the total all-in cost after co-product credits per AuEq oz sold was $3,664 compared to $5,340 for the same period in 2024. The decrease is due to the lower all-in sustaining costs discussed above.
Gold Resource Corporation
48
Year-to-date 2025 compared to year-to-date 2024
Total cash cost after co-product credits per AuEq oz sold: For the nine months ended September 30, 2025, the total cash cost after co-product credits per AuEq oz sold is $2,594 compared to $2,184 for the same period in 2024. The increase in the total cash cost is due to the 58% lower co-product credits the Company received during the third quarter of 2025 and the 21% decrease in the total number of AuEq ounces sold, offset by a 64% decrease in total treatment and refining charges and a 23% decrease in production costs as a result of the decline in the 2025 year-to-date production as compared to the 2024 production for the comparable period.
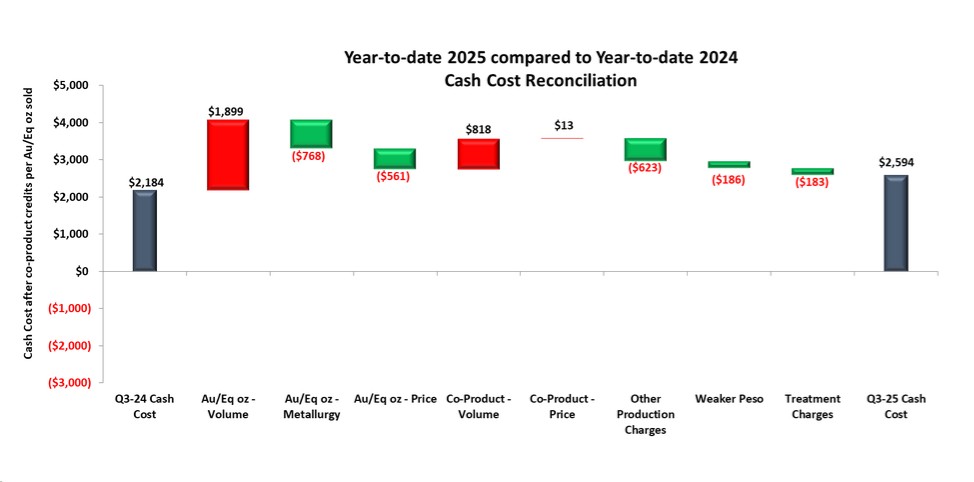
Total consolidated all-in sustaining cost after co-product credits per AuEq oz sold: For the nine months ended September 30, 2025, the total consolidated all-in sustaining cost after co-product credits per AuEq oz sold was $3,542 as compared to $3,037 for the same period in 2024. The increase directly relates to the higher cash costs per ounce discussed above.
Total all-in cost after co-product credits per AuEq oz sold: For the nine months ended September 30, 2025, the total all-in cost after co-product credits per AuEq oz sold was $4,265 compared to $3,192 for the same period in 2024. The increase is due to the higher all-in sustaining costs discussed above.
Gold Resource Corporation
49
2025 Sustaining and Growth Investments Summary
|
|
For the nine months ended September 30, 2025 |
||||
|
|
2025 |
|
2024 |
||
|
|
|
|
|
|
|
Sustaining Investments: |
|
|
|
|
|
|
Underground Development |
|
$ |
2,621 |
|
$ |
3,812 |
Other Sustaining Capital |
|
|
2,170 |
|
|
2,711 |
Infill Drilling |
|
|
670 |
|
|
977 |
Surface and Underground Exploration Development & Other |
|
|
602 |
|
|
65 |
Subtotal of Sustaining Investments: |
|
|
6,063 |
|
|
7,565 |
Growth Investments: |
|
|
|
|
|
|
DDGM growth: |
|
|
|
|
|
|
Surface Exploration / Other |
|
|
1,649 |
|
|
1,812 |
Underground Exploration Drilling |
|
|
- |
|
|
38 |
Underground Exploration Development |
|
|
6,584 |
|
|
- |
Back Forty growth: |
|
|
|
|
|
|
Back Forty Project Optimization & Permitting |
|
|
562 |
|
|
524 |
Subtotal of Growth Investments: |
|
|
8,795 |
|
|
2,374 |
Total Capital and Exploration: |
|
$ |
14,858 |
|
$ |
9,939 |
The Company’s year-to-date investment in Mexico in 2025 totaled $12.6 million. The Company’s investment in Mexico is focused on favorably impacting its environment, social, and governance programs while creating operational efficiencies and sustainability.
Gold Resource Corporation
50
Underground and Exploration Development:
During the third quarter of 2025, underground mine development included the construction of ramps, access to different areas of the deposit, and ventilation shafts. A total of 120 meters of exploration development was completed at a cost of $0.60 million. Of this, 13 meters were developed on Level 25 within the Arista system to facilitate infill drilling of the Viridiana vein, and 107 meters were completed on Level 3 in the Three Sisters system to provide access for infill and expansion drilling of the Sandy vein complex, as well as the Marena North and Splay 31 veins of the Arista system. Grade control and infill drilling completed during the third quarter utilized existing infrastructure developed in prior years, along with drill stations constructed on Level 3 in the first quarter to target the Three Sisters vein system. As part of ongoing safety initiatives, the Company also invested in additional ground support and improved ventilation for the mine. However, due to the continued reduction in equipment availability and decrease in cash flow, the Company is behind on its budgeted timeline for the development of future production headings.
|
Underground contract drill rig: Arista Mine – Level 3 – Three Sisters vein system. |
Gold Resource Corporation
51
Non-GAAP Measures
Throughout this report, the Company has provided information prepared or calculated according to U.S. GAAP and have referenced certain non-GAAP performance measures that the Company believes will assist with understanding the performance of its business. These measures are based on precious metal gold equivalent ounces sold and include (i) cash cost after co-product credits per ounce and (ii) all-in sustaining cost after co-product credits (“AISC”) per ounce, and (iii) all-in cost after co-product credits per ounce. Because the non-GAAP performance measures do not have any standardized meaning prescribed by U.S. GAAP, they may not be comparable to similar measures presented by other companies. Accordingly, these measures should not be considered in isolation or as a substitute for, measures of performance prepared in accordance with U.S. GAAP. These non-GAAP measures are not necessarily indicative of operating profit or cash flow from operations as determined under U.S. GAAP.
For financial reporting purposes, the Company reports the sale of base metals as part of its revenue. Revenue generated from the sale of base metals in the Company’s concentrates is considered a co-product of its gold and silver production for the purpose of calculating its total cash cost after co-product credits for DDGM. The Company periodically reviews its revenues to ensure that its reporting of primary products and co-products is appropriate. Because the Company considers copper, lead, and zinc to be co-products of its precious metal production, the value of these metals continues to be applied as a reduction to total cash costs in its calculation of total cash cost after co-product credits per precious metal gold equivalent ounce sold. Likewise, the Company believes identifying copper, lead, and zinc as co-product credits is appropriate due to their lower per unit economic value contribution compared to the precious metals and since gold and silver are the primary products it intends to produce.
Total cash cost after co-product credits is a measure developed by the Gold Institute to provide a uniform standard for industry comparison purposes, and it includes total cash cost before co-product credits, less co-product credits, or revenues earned from base metals.
AISC includes total cash cost after co-product credits plus other costs related to sustaining production, including allocated sustaining general and administrative expenses and sustaining capital expenditures. The Company determined sustaining capital expenditures as those capital expenditures that are necessary to maintain current production and execute the current mine plan. AISC is calculated based on the current guidance from the World Gold Council.
Total all-in cost after co-product credits includes total AISC as described above, plus other growth investments, including exploration expenses and non-sustaining capital expenditures.
Gold Resource Corporation
52
Reconciliations to U.S. GAAP
The table below present reconciliations between the most comparable U.S. GAAP measure of Total cost of sales to the non-GAAP measures of Cash cost after co-product credits, All-in sustaining cost after co-product credits for DDGM and for the Company, and All-in Cost after co-product credits for the three and nine months ended September 30, 2025 and 2024:
|
Note |
|
For the three months ended September 30, |
|
For the nine months ended September 30, |
||||||||
|
|
|
2025 |
|
2024 |
|
2025 |
|
2024 |
||||
|
|
|
|
|
Restated |
|
|
|
Restated |
||||
|
|
|
(in thousands, except oz and per AuEq oz sold) |
||||||||||
|
|
|
|
|
|
|
|
|
|
|
|
|
|
Total cost of sales (1) |
|
|
$ |
18,657 |
|
$ |
21,942 |
|
$ |
48,111 |
|
$ |
67,187 |
Less: Depreciation and amortization (1) |
|
|
|
(2,610) |
|
|
(4,178) |
|
|
(7,670) |
|
|
(14,221) |
Less: Reclamation and remediation (1) |
|
|
|
(434) |
|
|
(566) |
|
|
(1,262) |
|
|
(1,892) |
Refining charges for Doré sales |
5 |
|
|
1 |
|
|
- |
|
|
10 |
|
|
6 |
Treatment and refining charges for Concentrate sales |
5 |
|
|
607 |
|
|
1,394 |
|
|
1,602 |
|
|
4,410 |
Co-product credits: |
|
|
|
|
|
|
|
|
|
|
|
|
|
Concentrate sales - Copper |
5 |
|
|
(659) |
|
|
(917) |
|
|
(1,545) |
|
|
(5,099) |
Concentrate sales - Lead |
5 |
|
|
(417) |
|
|
(918) |
|
|
(1,481) |
|
|
(3,342) |
Concentrate sales - Zinc |
5 |
|
|
(1,868) |
|
|
(4,045) |
|
|
(6,390) |
|
|
(13,108) |
Realized loss (gain) for embedded derivatives - Copper |
22 |
|
|
10 |
|
|
48 |
|
|
1 |
|
|
(79) |
Realized loss (gain) for embedded derivatives - Lead |
22 |
|
|
5 |
|
|
(46) |
|
|
16 |
|
|
(39) |
Realized loss (gain) for embedded derivatives - Zinc |
22 |
|
|
36 |
|
|
(160) |
|
|
122 |
|
|
(358) |
Total cash cost after co-product credits |
|
|
$ |
13,328 |
|
$ |
12,554 |
|
$ |
31,514 |
|
$ |
33,465 |
Gold equivalent (AuEq) ounces sold (oz) |
|
|
|
6,298 |
|
|
3,526 |
|
|
12,150 |
|
|
15,325 |
Total cash cost after co-product credits per AuEq oz sold |
|
|
$ |
2,116 |
|
$ |
3,560 |
|
$ |
2,594 |
|
$ |
2,184 |
|
|
|
|
|
|
|
|
|
|
|
|
|
|
Total cash cost after co-product credits from above |
|
|
$ |
13,328 |
|
$ |
12,554 |
|
$ |
31,514 |
|
$ |
33,465 |
Sustaining Investments - Capital: |
|
|
|
|
|
|
|
|
|
|
|
|
|
Underground Development (2) |
|
|
|
1,191 |
|
|
1,155 |
|
|
2,621 |
|
|
3,812 |
Other Sustaining Capital (2) |
|
|
|
1,517 |
|
|
1,860 |
|
|
2,170 |
|
|
2,711 |
Sustaining Investments - Capitalized Exploration: |
|
|
|
|
|
|
|
|
|
|
|
|
|
Infill Drilling (2) |
|
|
|
251 |
|
|
191 |
|
|
670 |
|
|
977 |
Surface and Underground Exploration Development & Other (2) |
|
|
|
457 |
|
|
63 |
|
|
602 |
|
|
65 |
Reclamation and remediation (1) |
|
|
|
434 |
|
|
566 |
|
|
1,262 |
|
|
1,892 |
DDGM all-in sustaining cost after co-product credits |
|
|
$ |
17,178 |
|
$ |
16,389 |
|
$ |
38,839 |
|
$ |
42,922 |
AuEq ounces sold (oz) |
|
|
|
6,298 |
|
|
3,526 |
|
|
12,150 |
|
|
15,325 |
DDGM all-in sustaining cost after co-product credits per AuEq oz sold |
|
|
$ |
2,728 |
|
$ |
4,648 |
|
$ |
3,197 |
|
$ |
2,801 |
|
|
|
|
|
|
|
|
|
|
|
|
|
|
DDGM all-in sustaining cost after co-product credits from above |
|
|
$ |
17,178 |
|
$ |
16,389 |
|
$ |
38,839 |
|
$ |
42,922 |
Corporate Sustaining Expenses: |
|
|
|
|
|
|
|
|
|
|
|
|
|
General and administrative expenses (1) |
|
|
|
1,205 |
|
|
1,293 |
|
|
2,993 |
|
|
2,975 |
Stock-based compensation (1) |
|
|
|
403 |
|
|
203 |
|
|
1,198 |
|
|
647 |
Consolidated all-in sustaining cost after co-product credits |
|
|
$ |
18,786 |
|
$ |
17,885 |
|
$ |
43,030 |
|
$ |
46,544 |
AuEq ounces sold (oz) |
|
|
|
6,298 |
|
|
3,526 |
|
|
12,150 |
|
|
15,325 |
Total consolidated all-in sustaining cost after co-product credits per AuEq oz sold |
|
|
$ |
2,983 |
|
$ |
5,072 |
|
$ |
3,542 |
|
$ |
3,037 |
|
|
|
|
|
|
|
|
|
|
|
|
|
|
Consolidated all-in sustaining cost after co-product credits from above |
|
|
$ |
18,786 |
|
$ |
17,885 |
|
$ |
43,030 |
|
$ |
46,544 |
Underground Exploration Development (2) |
|
|
|
3,299 |
|
|
- |
|
|
6,584 |
|
|
- |
Growth Investments - Exploration: |
|
|
|
|
|
|
|
|
|
|
|
|
|
Mexico exploration expenses (1) |
|
|
|
799 |
|
|
767 |
|
|
1,649 |
|
|
1,850 |
Michigan Back Forty Project expenses (1) |
|
|
|
191 |
|
|
177 |
|
|
562 |
|
|
524 |
Total all-in cost after co-product credits |
|
|
$ |
23,075 |
|
$ |
18,829 |
|
$ |
51,825 |
|
$ |
48,918 |
AuEq ounces sold (oz) |
|
|
|
6,298 |
|
|
3,526 |
|
|
12,150 |
|
|
15,325 |
Total all-in cost after co-product credits per AuEq oz sold |
|
|
$ |
3,664 |
|
$ |
5,340 |
|
$ |
4,265 |
|
$ |
3,192 |
| (1) | Refer to Item 1—Condensed Consolidated Interim Financial Statements and Notes (unaudited): Condensed Consolidated Interim Statements of Operations. |
| (2) | Refer to Item 2—Management’s Discussion and Analysis of Financial Condition and Results of Operations – 2024 Capital and Exploration Investment Summary and the previously filed Item 2—Management’s Discussion and Analysis of Financial Condition and Results of Operations – 2024 Capital and Exploration Investment Summary. |
Gold Resource Corporation
53
Trending Highlights
|
2024 |
|
2025 |
|
2025 |
|||
|
Q1 |
Q2 |
Q3 |
Q4 |
|
Q1 |
Q2 |
Q3 |
Operating Data |
|
|
|
|
|
|
|
|
Total tonnes milled |
98,889 |
93,687 |
83,690 |
80,367 |
|
56,906 |
63,479 |
65,131 |
Average Grade |
|
|
|
|
|
|
|
|
Gold (g/t) |
1.89 |
1.27 |
0.54 |
0.64 |
|
0.70 |
0.56 |
1.11 |
Silver (g/t) |
88 |
102 |
83 |
94 |
|
169 |
115 |
250 |
Copper (%) |
0.37 |
0.26 |
0.19 |
0.20 |
|
0.18 |
0.13 |
0.16 |
Lead (%) |
1.25 |
1.00 |
1.01 |
1.12 |
|
0.72 |
0.88 |
0.63 |
Zinc (%) |
2.82 |
2.59 |
2.63 |
2.73 |
|
1.68 |
2.72 |
1.57 |
Metal production (before payable metal deductions) |
|
|
|
|
|
|
|
|
Gold (ozs.) |
4,757 |
2,947 |
944 |
1,258 |
|
903 |
758 |
1,646 |
Silver (ozs.) |
251,707 |
263,023 |
194,525 |
210,581 |
|
257,285 |
196,435 |
453,057 |
Copper (tonnes) |
280 |
181 |
93 |
88 |
|
54 |
50 |
73 |
Lead (tonnes) |
812 |
616 |
576 |
678 |
|
272 |
373 |
241 |
Zinc (tonnes) |
2,310 |
2,020 |
1,741 |
1,734 |
|
699 |
1,380 |
784 |
Metal produced and sold |
|
|
|
|
|
|
|
|
Gold (ozs.) |
3,557 |
2,724 |
1,357 |
960 |
|
859 |
878 |
1,422 |
Silver (ozs.) |
216,535 |
234,560 |
181,434 |
184,804 |
|
230,320 |
150,365 |
417,710 |
Copper (tonnes) |
264 |
197 |
98 |
82 |
|
50 |
43 |
67 |
Lead (tonnes) |
667 |
491 |
467 |
548 |
|
277 |
272 |
212 |
Zinc (tonnes) |
1,682 |
1,771 |
1,473 |
1,360 |
|
617 |
1,060 |
645 |
Average metal prices realized |
|
|
|
|
|
|
|
|
Gold ($ per oz.) |
$ 2,094 |
$ 2,465 |
$ 2,561 |
$ 2,706 |
|
$ 2,956 |
$ 3,350 |
$ 3,546 |
Silver ($ per oz.) |
$ 23.29 |
$ 30.49 |
$ 30.61 |
$ 31.11 |
|
$ 32.54 |
$ 34.35 |
$ 41.39 |
Copper ($ per tonne) |
$ 8,546 |
$ 10,428 |
$ 8,832 |
$ 8,969 |
|
$ 9,656 |
$ 9,619 |
$ 9,690 |
Lead ($ per tonne) |
$ 1,977 |
$ 2,235 |
$ 2,065 |
$ 1,897 |
|
$ 1,950 |
$ 1,887 |
$ 1,937 |
Zinc ($ per tonne) |
$ 2,483 |
$ 2,871 |
$ 2,854 |
$ 3,062 |
|
$ 2,710 |
$ 2,607 |
$ 2,841 |
Gold equivalent ounces sold |
|
|
|
|
|
|
|
|
Gold Ounces |
3,557 |
2,724 |
1,357 |
960 |
|
859 |
878 |
1,422 |
Gold Equivalent Ounces from Silver |
2,408 |
2,901 |
2,169 |
2,125 |
|
2,535 |
1,542 |
4,876 |
Total AuEq oz |
5,965 |
5,625 |
3,526 |
3,085 |
|
3,394 |
2,420 |
6,298 |
Gold Resource Corporation
54
Liquidity and Capital Resources
As of September 30, 2025, working capital was $12.8 million, consisting of current assets of $31.2 million and current liabilities of $18.4 million. This represents a $10.7 million, or a 510%, increase from the working capital balance of $2.1 million as of December 31, 2024. The main factors influencing the increase in the Company’s working capital is the increase in the cash and cash equivalents balance by $8.2 million, an increase in accounts receivable by $10.8 million, offset by a $4.5 million decrease in prepaid expenses and other current assets and a $3.9 million increase in current liabilities due to higher accounts payable. The increase in cash and cash equivalents is due to the $22.1 million cash inflows from financing activities—which includes $2.5 million raised through a registered direct offering in January 2025, $8.6 million net proceeds for sales of common shares through the ATM Program, $6.1 million net proceeds for the 18-month loan the Company closed in June, and in September, $5.0 million net proceeds from a second registered direct offering for the sale of 25,315,954 shares of the Company’s common stock at a price of $0.45 per share, after the Company issued 14,204,846 of these shares, for the fair value of approximately $6.4 million, to fully pay off the term loan received in June 2025 as a non-cash equity settlement—offset by the cash used in investing activities of $11.3 million and the $2.5 million cash outflows from operating activities, as reported in the Condensed Consolidated Interim Statements of Cash Flows. The Company’s working capital balance fluctuates as it uses cash to fund its operations, financing, and investing activities, including exploration, mine development, and income taxes.
Long-term liabilities assumed with the Aquila acquisition, capital requirements to develop the Back Forty Project, and potential project financing may have an impact on liquidity in the long term. These long-term liabilities are contingent upon the approval of the Back Forty Project by the Company’s Board of Directors and securing project financing. Project financing requirements will not be determined until the Company’s Board of Directors approves a decision to proceed on the Project. The Company’s Board of Directors continues to evaluate options that could lead to the development of the Project.
Of the $9.8 million cash and cash equivalents balance as of September 30, 2025, approximately $1.3 million was held in foreign subsidiaries, primarily held in U.S. dollar denominated accounts, with the remainder in foreign currencies readily convertible to U.S. dollars. DDGM’s primary source of liquidity is the sale of concentrates. DDGM has historically been self-sustaining and has been a source of cash for U.S. operations and projects. However, as a result of recent challenges encountered in mining and processing at DDGM, the Company is not currently generating positive cash flow from the Company’s mining operations.
Net cash used in operating activities for the three months ended September 30, 2025, was $2.5 million, compared to the $2.0 million net cash used by operating activities for the same period in 2024. The 25% increase in net cash used in operating activities is mainly attributable to the lower production and lower net sales in 2025.
Net cash used in investing activities was $11.3 million and $5.2 million, respectively, for the nine months ended September 30, 2025 and 2024. The increase in investing activities reflects the Company’s commitment to renewing its aging mining equipment and increasing mine development.
Net cash provided by financing activities for the nine months ended September 30, 2025 was $22.1 million compared to the $2.4 million net cash provided by financing activities for the same period in 2024. The 821% increase in net cash provided by financing activities is mainly attributable to the proceeds from the registered direct offerings and the higher ATM sales in 2025. Please see Note 16—Shareholders’ Equity in Item 1—Condensed Consolidated Interim Financial Statements and Notes (unaudited) above for additional information.
While current macro risk factors, such as economic uncertainties and supply chain interruptions have not had a significant adverse impact on exploration plans, results of operations, financial position, and cash flows during the current fiscal year, future impacts are unknown at this time.
Gold Resource Corporation
55
Tonnes produced from the mining operations at DDGM year-to-date 2025 remain lower than in the previous year, and except for silver, grades were lower as well. The Company continued to encounter significant issues with equipment availability part way into the third quarter due to the age and condition of some of the critical mining equipment in use at the mine. Due to the challenges with equipment availability, the Company was not able to maintain its projected timeline for mine development to access new production headings. In addition, the mill continued to experience mechanical issues that resulted in lower throughput, and when combined with the lower tonnes mined, resulted in a production shortfall. To minimize the mechanical issues and return the mine to a cash positive position, the Company engaged a third-party contract miner during the third quarter of 2025 and started to upgrade its mining fleet. As a result, by the end of the third quarter, the Company was able to increase production from a number of production headings.
The Company believes that the mine has the potential to generate positive cash flow based on the information to date from the new Three Sisters area, as well as other zones that have been discovered near existing headings. The Company is in the process of developing access and drill-defining these new areas. With the improvements mentioned above, the Company is expecting the remaining months of 2025 to result in positive operating income.
In 2025, the Company has been focused on improving its cash position through the issuance of debt and equity. The Company raised $2.5 million through a registered direct offering in January 2025. In September 2025, the Company closed on a second registered direct offering of $11.4 million for the sale of 25,315,954 shares of the Company’s common stock at a price of $0.45 per share. The Company issued 14,204,846 of these shares, for the fair value of approximately $6.4 million, to fully pay off the term loan received in June 2025 as a non-cash equity settlement. In February 2025, the Company sold its interest in Green Light Metals for $0.9 million in proceeds. On May 7, 2025, the Company received a tax refund of 79.6 million pesos (approximately $4.0 million) related DDGM taxes paid in 2023. During the nine months ended September 30, 2025, the Company raised approximately $8.6 million through its ATM Program, after deducting the agent’s commissions and other expenses.
Although the Company has significantly improved its financial position year to date, the lower production and grades from the mine through the third quarter of 2025 raise substantial doubt about the Company’s ability to continue as a going concern, as reflected by the year-to-date net losses of $24.5 million and the cash used in operations of $2.5 million. Although the Company believes that there is adequate financing in place to cover the planned underground development and equipment improvements, there can be no assurances that the Company will achieve short-term production targets and therefore may continue with liquidity concerns.
Accounting Developments
For a discussion of recently adopted and recently issued accounting pronouncements, please see Note 3—New Accounting Pronouncements in Item 1—Condensed Consolidated Interim Financial Statements and Notes (unaudited) above.
Critical Accounting Estimates
The preparation of financial statements in accordance with U.S. GAAP requires management to make estimates and assumptions that affect the reported amounts of assets, liabilities, revenues, expenses, and contingencies. These estimates and assumptions are inherently uncertain and involve judgments that may impact the Company’s financial position and results of operations. Management regularly evaluates these estimates based on historical experience, current conditions, and other relevant factors. Areas involving significant estimates that are considered critical to the Company’s financial condition and results of operations are discussed in Item 7—Management’s Discussion and Analysis of Financial Condition and Results of Operations in the 2024 Annual Report.
There have been no material changes to the critical accounting estimates disclosed in the 2024 Annual Report. While management believes the underlying assumptions and judgments are reasonable and appropriate, actual results may differ materially due to changes in conditions or additional information that becomes available.
Gold Resource Corporation
56
Forward-Looking Statements
This report contains “forward-looking statements” within the meaning of Section 27A of the Securities Act of 1933 and Section 21E of the Securities Exchange Act of 1934. The Company uses the words “anticipate,” “continue,” “likely,” “estimate,” “expect,” “may,” “could,” “will,” “project,” “should,” “believe,” and similar expressions (including negative and grammatical variations) to identify forward looking statements. Such forward-looking statements include, without limitation, statements regarding:
| ● | The Company’s ability to satisfy its financial and contractual obligations and other potential cash requirements over the next 12 months; |
| ● | The Company’s anticipated near-term capital requirements and potential sources of capital; |
| ● | Expectations regarding 2025 general and administrative costs; |
| ● | The Company’s expectations regarding whether dividends will be paid in the future; |
| ● | Compliance with existing legal and regulatory requirements, including future asset reclamation costs; |
| ● | The Company’s strategy for significant future investment in Oaxaca, Mexico, and in Michigan, USA, for development and exploration activities; |
| ● | Expectations regarding capital investment, exploration spending, and general and administrative costs, including the Company’s near-term estimates for the cost of additional mining equipment, mill upgrades, and working capital; |
| ● | The Company’s expectations regarding future grades and recoveries from mining at DDGM and its expectations regarding its ability to generate positive cash flow from future production at DDGM; |
| ● | Future exploration plans at DDGM, including vein systems targeted for future exploration activity; |
| ● | Estimates of Mineral Resources and Mineral Reserves; |
| ● | The Company’s expectation for the outcome of the 2015 DDGM tax audit; |
| ● | Expectations regarding 2025 DDGM and Back Forty capital investment; and |
| ● | The expected timing and success of the Back Forty Project with respect to permitting, detailed engineering, and project financing. |
Forward-looking statements are neither historical facts nor assurances of future performance. Rather, they are based only on the Company’s current beliefs, expectations, and assumptions regarding the future of its business, future plans and strategies, projections, anticipated events and trends, the economy, and other future conditions. Because forward-looking statements relate to the future, they are subject to inherent uncertainties, risks, and changes in circumstances that are difficult to predict, and many of which are outside of the Company’s control. The Company’s actual results and financial condition may differ materially from those indicated in the forward-looking statements. Therefore, you should not rely on any of these forward-looking statements. Important factors that could cause the Company’s actual results and financial condition to differ materially from those indicated in the forward-looking statements include, among others, the following:
| ● | Whether the Company is able to raise the necessary capital required to continue its business on terms acceptable to it or at all; |
| ● | The possibility of unforeseen production or processing challenges at DDGM, such as mechanical breakdowns, staffing shortages, weather events, unexpected decreases in grade, lower than anticipated production at existing mining faces, or inability or delays in the access and development of new mining faces; |
| ● | Commodity price fluctuations; |
| ● | Mine protests and work stoppages; |
| ● | Rock formations, faults and fractures, water flow and possible CO2 gas exhalation, or other unanticipated geological challenges; |
| ● | Unexpected changes in business and economic conditions, including supply chain challenges, the rate of inflation, and their impact on operating and capital costs; |
| ● | Changes in interest rates and currency exchange rates; |
| ● | Adverse technological changes and cybersecurity threats; |
| ● | Unanticipated increases in the Company’s operating costs and other costs of doing business; |
| ● | Access to land and availability of materials, equipment, supplies, labor and supervision, power, and water; |
Gold Resource Corporation
57
| ● | Results of current and future feasibility studies; |
| ● | Interpretation of drill hole results and the geology, grade, and continuity of mineralization; |
| ● | Litigation by private parties or regulatory action by governmental entities; |
| ● | Acts of God, such as excessively wet weather, floods, earthquakes, and any other natural disasters; |
| ● | Changes in investor perception of the Company and/or the mining industry; |
| ● | The inherent uncertainty of Mineral Resources and Mineral Reserves estimates; |
| ● | The Company’s internal controls over financial reporting, including its ability to remedy the identified material weakness as well as any potential future material weaknesses; and |
| ● | Such other factors are discussed below under Item 1A—Risk Factors in Part II—Other Information, and under Risk Factors in the 2024 Annual Report. |
Many of these factors are beyond the Company’s ability to control or predict. Although the Company believes that the expectations reflected in its forward-looking statements are based on reasonable assumptions, such expectations may prove to be materially incorrect due to known and unknown risks and uncertainties. You should not unduly rely on any of the Company’s forward-looking statements. These statements speak only as of the date of this quarterly report on Form 10-Q. Except as required by law, the Company is not obliged to publicly release any revisions to these forward-looking statements to reflect future events or developments. All subsequent written and oral forward-looking statements attributable to the Company and persons acting on its behalf are qualified in their entirety by the cautionary statements contained in this section and elsewhere in this quarterly report on Form 10-Q.
ITEM 3: Quantitative and Qualitative Disclosures about Market Risk
The Company’s exposure to market risks includes, but is not limited to, the following risks: changes in commodity prices, foreign currency exchange rates, provisional sales contract risks, changes in interest rates, and equity price risks. Currently, the Company does not use derivative financial instruments as part of an overall strategy to manage market risk. However, the Company may consider such arrangements in the future as it evaluates its business and financial strategy.
Commodity Price Risk
The results of the Company’s operations, cash flows, and financial condition largely depend upon the market prices of gold, silver, copper, lead, and zinc. Metal prices fluctuate widely and are affected by numerous factors beyond the Company’s control. The level of interest rates, the rate of inflation, government fiscal and monetary policy, the stability of exchange rates, and the world supply of and demand for gold, silver, and other metals, among other factors, can all cause significant fluctuations in commodity prices. Such external economic factors are, in turn, influenced by changes in international investment patterns, monetary systems, and political developments. The metal price markets have fluctuated widely in recent years, and future price declines could cause a mineral project to become uneconomic, thereby having a material adverse effect on the Company’s business and financial condition. Currently, the Company is not unitizing derivative contracts to protect the selling price for gold, silver, copper, lead, or zinc. The Company may, in the future, more actively manage its exposure through additional derivative contracts, although the Company has no intention of doing so in the near term.
In addition to materially adversely affecting the Company’s reserve estimates, results of operations and/or its financial condition, declining gold and silver prices could require a reassessment of the feasibility of a project. Even if a project is ultimately determined to be economically viable, the need to conduct such a reassessment may cause delays in the implementation of a project.
Foreign Currency Risk
The Company’s foreign operation sells its gold, silver, copper, lead, and zinc production based on U.S. dollar metal prices. Fluctuations in foreign currency exchange rates do not have a material impact on the Company’s revenue since gold, silver, copper, lead, and zinc are sold worldwide in U.S. dollars.
Gold Resource Corporation
58
Foreign currency exchange rate fluctuations can increase or decrease the Company’s costs to the extent that it pays costs in currencies other than the U.S. Dollar. The Company is primarily impacted by Mexican peso rate changes relative to the U.S. Dollar, as the Company incurs some costs in the Mexican peso. When the value of the peso rises in relation to the U.S. Dollar, some of the Company’s costs in Mexico may increase, thus materially adversely affecting the Company’s operating results. Alternatively, when the value of the peso drops in relation to the U.S. Dollar, peso-denominated costs in Mexico will decrease in U.S. Dollar terms. Future fluctuations may give rise to foreign currency exposure, which may affect the Company’s financial results. Approximately 50% to 60% of expenses are paid in currencies other than the U.S. dollar.
The Company has not utilized market-risk sensitive instruments to manage its exposure to foreign currency exchange rates. However, the Company may, in the future, actively manage its exposure to foreign currency exchange rate risk.
Provisional Sales Contract Risk
The Company enters into concentrate sales contracts, which, in general, provide for a provisional payment to the Company based upon provisional assays and prices. The provisionally priced sales contracts contain an embedded derivative that is required to be separated from the host contract for accounting purposes. The host contract is the receivable from the sale of concentrates determined at the quoted metal prices at the time of shipment delivery to the customer. The embedded derivative, which does not qualify for hedge accounting, is adjusted to market through revenue each period prior to settlement. Changes in the prices of metals between the shipment delivery and the final settlement date will result in adjustments to revenues related to the sales of concentrate previously recorded upon shipment delivery. Please see Note 17—Derivatives in Item 1—Condensed Consolidated Interim Financial Statements and Notes (unaudited) above for additional information.
Interest Rate Risk
The Company considers its interest rate risk exposure to be insignificant at this time, as the Company’s interest rate is related and embedded in immaterial payments for office leases.
Equity Price Risk
The Company has, in the past, and may in the future, seek to acquire additional funding through the sale of common stock and other equity. The price of the Company’s common stock has been volatile in the past and may also be volatile in the future. As a result, there is a risk that the Company may not be able to sell its common stock at an acceptable price should the need for new equity funding arise.
Gold Resource Corporation
59
ITEM 4: Controls and Procedures
Evaluation of Disclosure Controls and Procedures
The Company’s disclosure controls and procedures are designed to ensure that information required to be disclosed in the reports that the Company files under the Securities Exchange Act of 1934, as amended (the “Exchange Act”), is recorded, processed, summarized, and reported within the time periods specified in the rules and forms of the Securities and Exchange Commission, and that such information is accumulated and communicated to management, including the Chief Executive Officer and Chief Financial Officer, as appropriate, to allow timely decisions regarding required disclosure. The Chief Executive Officer and the Chief Financial Officer, with assistance from management, have evaluated the effectiveness of disclosure controls and procedures as of September 30, 2025. Based on that evaluation, the Chief Executive Officer and the Chief Financial Officer have concluded that the disclosure controls and procedures were not effective as of September 30, 2025 as a result of a material weakness in internal control over financial reporting described below.
As previously reported in the 2024 Annual Report, the Company has identified the following material weakness in internal control over financial reporting:
| ● | The Company did not have adequate policies and procedures to maintain effective internal control over the accounting treatment related to complex areas. |
Remediation Plan
The Company is in the process of implementing the following measures designed to improve its internal control over financial reporting and to remediate the deficiencies that led to the material weakness, including designing and implementing new controls activities, and enhancing existing control activities:
| ● | The Company will continue to evaluate and analyze in consultation with outside third-party accounting experts on non-routine, unusual, or complex transactions that are subject to technical accounting standards and significant judgement or differences in interpretation, in reaching technical accounting conclusions. |
| ● | The Company will subject its technical accounting conclusions to various quality control reviews prior to finalization for non-routine, unusual, or complex transactions that are subject to significant judgment or differences in interpretation. |
The Company has begun to remediate the material weakness and will continue to remediate the matter as efficiently and effectively as possible. However, management will not be able to conclude that it has remediated the material weakness until the applicable controls are fully implemented, operate for a sufficient period of time, and management has concluded, through formal testing, that these controls are operating effectively. The Company will continue to monitor the design and effectiveness of these and other processes, procedures, and controls and make any further changes management deems appropriate.
Changes in Internal Control over Financial Reporting
Except for the ongoing remediation efforts disclosed above, there have been no changes in internal control over financial reporting (as defined in Rule 13a-15(f) under the Exchange Act) that have materially affected, or are reasonably likely to materially affect, the Company’s internal control over financial reporting during the quarter ended September 30, 2025.
Gold Resource Corporation
60
PART II – OTHER INFORMATION
ITEM 1: Legal Proceedings
In February 2020, a local Ejido community (who claim to be an indigenous community) filed an injunction against the Mexican federal government through which the indigenous community demanded the cancellation of several DDGM concession titles. The federal government ordered a suspension to prevent work related to excavating, drilling, opening tunnels and exploiting the Mineral Resources on the surface and subsoil of the concessions named in the injunction. Presently, DDGM does not perform such works in the named concessions in lands of the indigenous community. The lawsuit filed in February 2020 has not progressed to a final ruling.
The Company knows of no other material, existing or pending legal proceedings against it, nor is it involved as a plaintiff in any material proceeding or pending litigation.
ITEM 1A: Risk Factors
Item 1A—Risk Factors of the 2024 Annual Report includes a discussion of the Company’s known material risk factors, other than risks that could apply to any issuer or offering. Other than the below, there have been no material changes in the Company’s risk factors from those described in the 2024 Annual Report.
We have issued warrants, which could result in dilution to our existing stockholders and may adversely affect the market price of our common stock.
In June 2025, we issued 1,500,000 warrants to purchase shares of our common stock to a private investor. The issuance and potential future exercise of these warrants may dilute the ownership interests of existing stockholders and may adversely affect the market price of our common stock. In addition, the existence of these warrants could make it more difficult or expensive for us to raise additional capital in the future.
ITEM 2: Unregistered Sales of Equity Securities and Use of Proceeds
None.
ITEM 3: Defaults upon Senior Securities
None.
ITEM 4: Mine Safety Disclosures
While the Company owns an advanced exploration project in Michigan, USA, the project is not yet subject to the Mine Safety and Health Administration jurisdiction and therefore, the mine safety disclosure requirements are not applicable.
ITEM 5: Other Information
Rule 10b5-1 Trading Arrangements
During the three months ended September 30, 2025, no director or Section 16 officer of the Company adopted, modified, or terminated a “Rule 10b5-1 trading arrangement” or “non-Rule 10b5-1 trading arrangement,” as each term is defined in Item 408(a) of Regulation S-K.
Gold Resource Corporation
61
ITEM 6: Exhibits
The following exhibits are filed or furnished herewith or incorporated herein by reference:
|
||
Exhibit |
|
Descriptions |
3.1 |
|
|
3.1.1 |
|
|
3.1.2 |
|
|
3.1.3 |
|
|
3.2 |
|
|
3.2.1 |
|
|
3.2.2 |
|
|
3.2.3 |
|
|
10.1 |
|
|
31.1* |
|
Certification pursuant to Section 302 of the Sarbanes-Oxley Act of 2002 for Allen Palmiere. |
31.2* |
|
Certification pursuant to Section 302 of the Sarbanes-Oxley Act of 2002 for Chet Holyoak. |
32** |
|
|
101 |
|
The following items from the Quarterly Report on Form 10-Q for the quarter ended September 30, 2025 are furnished herewith, formatted in inline XBRL: (A) the following financial statements: (i) the Condensed Consolidated Interim Balance Sheets, (ii) the Condensed Consolidated Interim Statements of Operations, (iii) the Condensed Consolidated Interim Statements of Changes in Shareholders’ Equity, (iv) the Condensed Consolidated Interim Statements of Cash Flows, and (v) the Notes to the Condensed Consolidated Interim Financial Statements; and (B) Rule 10b5-1 Trading Arrangements. |
104 |
|
Cover Page Interactive Data File (embedded within the XBRL document). |
* |
Filed herewith. |
** |
This document is not being “filed” for purposes of Section 18 of the Securities Exchange Act of 1934, as amended, or otherwise subject to the liabilities of that Section. Registration Statements or other documents filed with the SEC shall not incorporate this exhibit by reference, except as otherwise expressly stated in such filing. |
Gold Resource Corporation
62
SIGNATURES
In accordance with Section 13 or 15(d) of the Exchange Act of 1934, the Company has caused this Report to be signed on its behalf by the undersigned, thereunto duly authorized.
|
|
|
|
|
|
GOLD RESOURCE CORPORATION |
|
|
|
|
|
Dated: November 4, 2025 |
|
|
/s/ Allen Palmiere |
|
|
By: |
Allen Palmiere, |
|
|
|
Chief Executive Officer, |
|
|
|
|
|
|
|
|
|
|
||
|
|
|
|
|
Dated: November 4, 2025 |
|
|
/s/ Chet Holyoak |
|
|
By: |
Chet Holyoak, |
|
|
|
Chief Financial Officer |
Gold Resource Corporation
63
Exhibit 31.1
CERTIFICATION
PURSUANT TO SECTION 302 OF THE SARBANES-OXLEY ACT OF 2002
I, Allen Palmiere, certify that:
1. I have reviewed this Form 10-Q of Gold Resource Corporation;
2. Based on my knowledge, this report does not contain any untrue statement of a material fact or omit to state a material fact necessary to make the statements made, in light of the circumstances under which such statements were made, not misleading with respect to the period covered by this report;
3. Based on my knowledge, the financial statements, and other financial information included in this report, fairly present in all material respects the financial condition, results of operations and cash flows of the registrant as of, and for, the periods presented in this report;
4. The registrant’s other certifying officer(s) and I are responsible for establishing and maintaining disclosure controls and procedures (as defined in Exchange Act Rules 13a-15(e) and 15d-15(e)) and internal control over financial reporting (as defined in Exchange Act Rules 13a-15(f) and 15d-15(f)) for the registrant and have:
a. Designed such disclosure controls and procedures, or caused such disclosure controls and procedures to be designed under our supervision, to ensure that material information relating to the registrant, including its consolidated subsidiaries, is made known to us by others within those entities, particularly during the period in which this report is being prepared;
b. Designed such internal control over financial reporting, or caused such internal control over financial reporting to be designed under our supervision, to provide reasonable assurance regarding the reliability of financial reporting and the preparation of financial statements for external purposes in accordance with generally accepted accounting principles;
c. Evaluated the effectiveness of the registrant’s disclosure controls and procedures and presented in this report our conclusions about the effectiveness of the disclosure controls and procedures, as of the end of the period covered by this report based on such evaluation; and
d. Disclosed in this report any change in the registrant’s internal control over financial reporting that occurred during the registrant’s most recent fiscal quarter (the registrant’s fourth fiscal quarter in the case of an annual report) that has materially affected, or is reasonably likely to materially affect, the registrant’s internal control over financial reporting; and
5. The registrant’s other certifying officer(s) and I have disclosed, based on our most recent evaluation of internal control over financial reporting, to the registrant’s auditors and the audit committee of the registrant’s board of directors (or persons performing the equivalent functions):
a. All significant deficiencies and material weaknesses in the design or operation of internal control over financial reporting which are reasonably likely to adversely affect the registrant’s ability to record, process, summarize and report financial information; and
b. Any fraud, whether or not material, that involves management or other employees who have a significant role in the registrant’s internal control over financial reporting.
Date: November 4, 2025 |
|
|
|
/s/ Allen Palmiere |
|
Allen Palmiere |
|
Chief Executive Officer, President and Director |
|
Exhibit 31.2
CERTIFICATION
PURSUANT TO SECTION 302 OF THE SARBANES-OXLEY ACT OF 2002
I, Chet Holyoak, certify that:
1. I have reviewed this Form 10-Q of Gold Resource Corporation;
2. Based on my knowledge, this report does not contain any untrue statement of a material fact or omit to state a material fact necessary to make the statements made, in light of the circumstances under which such statements were made, not misleading with respect to the period covered by this report;
3. Based on my knowledge, the financial statements, and other financial information included in this report, fairly present in all material respects the financial condition, results of operations and cash flows of the registrant as of, and for, the periods presented in this report;
4. The registrant’s other certifying officer(s) and I are responsible for establishing and maintaining disclosure controls and procedures (as defined in Exchange Act Rules 13a-15(e) and 15d-15(e)) and internal control over financial reporting (as defined in Exchange Act Rules 13a-15(f) and 15d-15(f)) for the registrant and have:
a. Designed such disclosure controls and procedures, or caused such disclosure controls and procedures to be designed under our supervision, to ensure that material information relating to the registrant, including its consolidated subsidiaries, is made known to us by others within those entities, particularly during the period in which this report is being prepared;
b. Designed such internal control over financial reporting, or caused such internal control over financial reporting to be designed under our supervision, to provide reasonable assurance regarding the reliability of financial reporting and the preparation of financial statements for external purposes in accordance with generally accepted accounting principles;
c. Evaluated the effectiveness of the registrant’s disclosure controls and procedures and presented in this report our conclusions about the effectiveness of the disclosure controls and procedures, as of the end of the period covered by this report based on such evaluation; and
d. Disclosed in this report any change in the registrant’s internal control over financial reporting that occurred during the registrant’s most recent fiscal quarter (the registrant’s fourth fiscal quarter in the case of an annual report) that has materially affected, or is reasonably likely to materially affect, the registrant’s internal control over financial reporting; and
5. The registrant’s other certifying officer(s) and I have disclosed, based on our most recent evaluation of internal control over financial reporting, to the registrant’s auditors and the audit committee of the registrant’s board of directors (or persons performing the equivalent functions):
a. All significant deficiencies and material weaknesses in the design or operation of internal control over financial reporting which are reasonably likely to adversely affect the registrant’s ability to record, process, summarize and report financial information; and
b. Any fraud, whether or not material, that involves management or other employees who have a significant role in the registrant’s internal control over financial reporting.
Date: November 4, 2025 |
|
|
|
/s/ Chet Holyoak |
|
Chet Holyoak |
|
Chief Financial Officer |
|
Exhibit 32
CERTIFICATION
PURSUANT TO SECTION 906 OF THE SARBANES-OXLEY ACT OF 2002
I, Allen Palmiere, Chief Executive Officer, President and Director, and I, Chet Holyoak, Chief Financial Officer of Gold Resource Corporation (the “Company”) certify that:
1. I have reviewed the quarterly report on Form 10-Q of the Company;
2. Based on my knowledge, this quarterly report does not contain any untrue statement of a material fact or omit to state a material fact necessary to make the statements made, in light of the circumstances under which such statements were made, not misleading with respect to the period covered by this quarterly report; and
3. Based on my knowledge, the financial statements, and other financial information included in this quarterly report, fairly present in all material respects the financial condition, results of operations and cash flows of the Company as of, and for, the period presented in this quarterly report.
Date: November 4, 2025 |
|
|
|
/s/ Allen Palmiere |
|
Allen Palmiere |
|
Chief Executive Officer, President and Director |
|
|
|
|
|
Date: November 4, 2025 |
|
|
|
/s/ Chet Holyoak |
|
Chet Holyoak |
|
Chief Financial Officer |
|