SECURITIES AND EXCHANGE COMMISSION
Washington, D.C. 20549
FORM 6-K
REPORT OF FOREIGN PRIVATE ISSUER
Pursuant to Rule 13a-16 or 15d-16 of the
Securities Exchange Act of 1934
For the month of November 2025
Commission file number: 001-32749
FRESENIUS MEDICAL CARE AG
(Translation of registrant's name into English)
Else-Kröner Strasse 1
61346 Bad Homburg
Germany
(Address of principal executive offices)
Indicate by check mark whether the registrant files or will file annual reports under cover of Form 20-F or Form 40-F.
Form 20-F x Form 40-F ¨
On November 4, 2025, Fresenius Medical Care AG (the “Company”) issued a Press Release announcing its third quarter results for the period ending September 30, 2025. A copy of the Press Release is furnished as Exhibit 99.1 and the corresponding financial figures as Exhibit 99.2.
The attached Press Release contains non-GAAP financial measures. For purposes of Regulation G, a non-GAAP financial measure is a numerical measure of a company’s performance, financial position, or cash flows that either excludes or includes amounts that are not normally excluded or included in the most directly comparable measure calculated and presented in accordance with generally accepted accounting principles. To supplement our third quarter 2025 consolidated financial results presented in accordance with International Financial Reporting Standards, or IFRS, we have used non-GAAP financial measures, including (a) EBITDA, or operating income excluding interest, taxes, depreciation and amortization, (b) free cash flow, (c) net leverage ratio (ratio of net debt to adjusted EBITDA) and (d) results presented in constant currency and as adjusted for special items identified in the Press Release and associated tables. These non-GAAP measures are provided to enhance the user’s overall understanding of our current financial performance and our prospects for the future. In addition, because we have historically reported certain non-GAAP financial measures in our financial results, we believe the inclusion of these non-IFRS financial measures provides consistency and comparability in our financial reporting to prior periods for which these non-GAAP financial measures were previously reported. These non-GAAP financial measures should not be used as a substitute for or be considered superior to GAAP financial measures. Reconciliation of the non-GAAP financial measures to the most comparable IFRS financial measures are included in the attached Financial Statements. As the reconciliation of amounts stated in Constant Currency is inherent in the disclosure included in the Press Release, we believe that a separate reconciliation would not provide any additional benefit.
The Exhibits attached hereto, shall not be deemed “filed” for purposes of Section 18 of the Securities and Exchange Act of 1934 (the “Exchange Act”) or otherwise subject to the liabilities of that section, nor shall they be deemed incorporated by reference in any filing under the Securities Act of 1933 or the Exchange Act, regardless of any general incorporation language in such filing.
EXHIBITS
The following exhibits are being furnished with this Report:
| Exhibit 99.1 | Press release issued on November 4, 2025. |
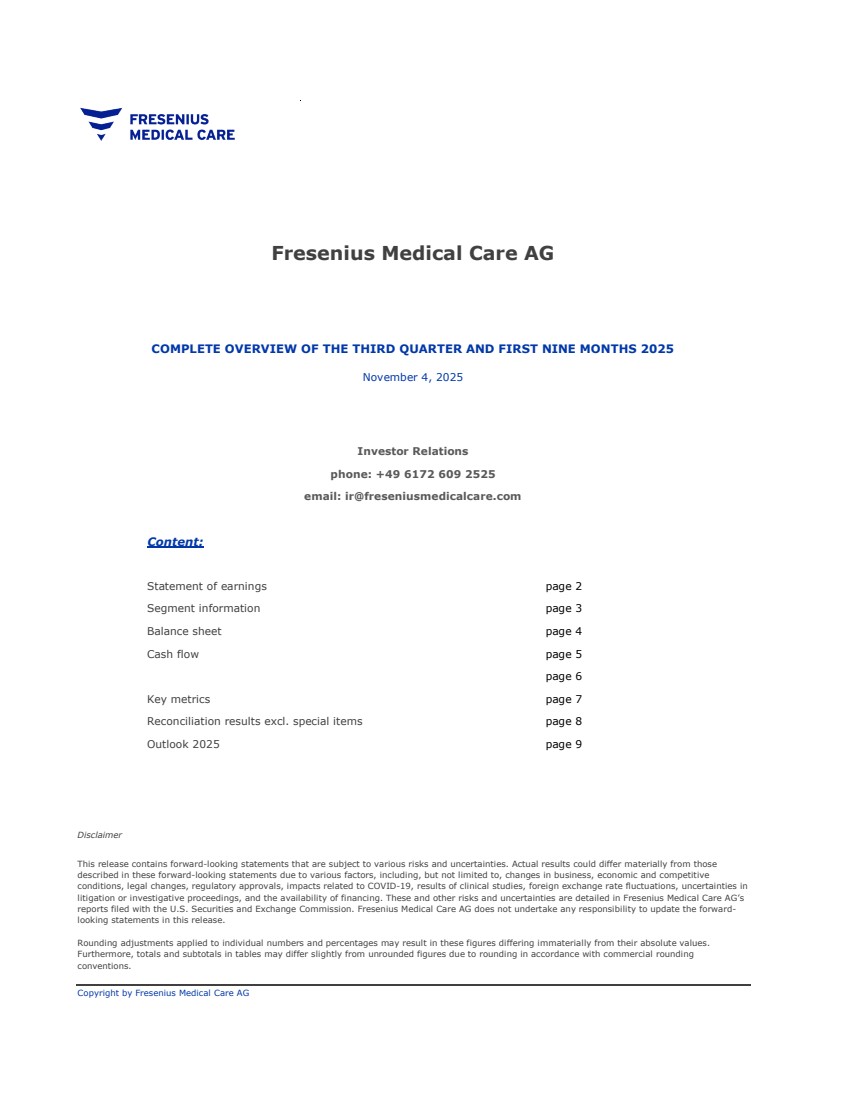
| Exhibit 99.2 | Complete overview of the third quarter 2025 and first nine months 2025. |
SIGNATURES
Pursuant to the requirements of the Securities Exchange Act of 1934, the Registrant has duly caused this report to be signed on its behalf by the undersigned thereunto duly authorized.
DATE: November 4, 2025
| Fresenius Medical Care AG |
| By: | /s/ Helen Giza | |
| Name: | Helen Giza | |
| Title: | Chief Executive Officer and Chair of the Management Board |
| By: | /s/ Martin Fischer | |
| Name: | Martin Fischer | |
| Title: | Chief Financial Officer and member of the Management Board |
Exhibit 99.1

| Press Release | Media contact |
| Christine Peters | |
| T +49 160 60 66 770 | |
| Christine.Peters@FreseniusMedicalCare.com | |
| Contact for analysts and investors | |
| Dr. Dominik Heger | |
| T +49 6172 609 2525 | |
| Dominik.Heger@FreseniusMedicalCare.com | |
| www.freseniusmedicalcare.com |
Fresenius Medical Care further accelerates organic revenue development and achieves an inflection in earnings growth, delivering 28% operating income growth in the third quarter of 2025
| · | Strong organic revenue growth1 of 10% driven by all operating segments |
| · | Positive U.S. same market treatment growth of 0.1 % in line with expectations |
| · | Accelerated operating income2 growth of 28% at constant currency, leading to a step-change in margin expansion to 11.7% |
| · | Reported operating income grew by 3%, reported net income3 by 29% |
| · | Net leverage ratio further improved to 2.6x, in parallel to share buyback and Value-Based Care investments |
| · | FY 2025 outlook confirmed |
Bad Homburg, Germany (November 4, 2025) – “In Q3 of 2025, we continued the momentum and further accelerated revenue growth. Conversion into operating income2 growth increased as planned for the third consecutive quarter, underlining our continued operational and financial progress. Our Group operating income2 margin of 11.7% extended well into the implied full year 2025 range of 11% to 12%. This demonstrates important progress on our trajectory to deliver our full year 2025 financial outlook”, said Helen Giza, Chief Executive Officer of Fresenius Medical Care AG. “All three operating segments contributed to the Group organic growth of 10%. U.S. same market treatment growth was slightly positive in Q3. Operating income2 in Care Enablement grew strongly by 38%, leading to a margin of 7.6%. In parallel, Care Delivery significantly improved profitability, reaching a strong margin of 14.5%, at the top end of its 2025 target margin band.” Helen Giza added: “We advanced our FME Reignite strategy for value creation with the launch of the first tranche of our initial share buyback program, the ownership increase in our Value-Based Care entity Interwell Health and the continued rollout of the 5008X in the U.S. For 2025, we are well on track to achieve our commitments, while we are excited about what lies ahead with FME Reignite.”
1 At constant currency, adjusted for certain reconciling items including revenue from acquisitions, closed or sold operations and differences in dialysis days
2 Adjusted for special items; growth rate at constant currency (if not stated otherwise); for further details please see the reconciliation attached to the press release
3 Net income attributable to shareholders of Fresenius Medical Care AG Fresenius Medical Care, the world’s leading provider of products and services for individuals with renal disease, continued to advance the FME Reignite strategy.
Page
Key figures Q3 and 9M 2025 (unaudited)
| Q3 2025 | Q3 2024 | Growth | Growth | 9M 2025 | 9M 2024 | Growth | Growth | |||||||||||||||||||||||||
| EUR m | EUR m | yoy | yoy, cc | EUR m | EUR m | yoy | yoy, cc | |||||||||||||||||||||||||
| Revenue | 4,885 | 4,760 | 3 | % | 8 | % | 14,558 | 14,251 | 2 | % | 5 | % | ||||||||||||||||||||
| Operating income | 477 | 463 | 3 | % | 8 | % | 1,233 | 1,133 | 9 | % | 11 | % | ||||||||||||||||||||
| excl. special items2 | 574 | 469 | 22 | % | 28 | % | 1,507 | 1,307 | 15 | % | 18 | % | ||||||||||||||||||||
| Net income3 | 275 | 213 | 29 | % | 34 | % | 651 | 471 | 38 | % | 41 | % | ||||||||||||||||||||
| excl. special items2 | 322 | 237 | 36 | % | 41 | % | 836 | 637 | 31 | % | 34 | % | ||||||||||||||||||||
| Basic EPS (EUR) | 0.94 | 0.73 | 30 | % | 35 | % | 2.22 | 1.61 | 38 | % | 41 | % | ||||||||||||||||||||
| excl. special items2 | 1.10 | 0.81 | 37 | % | 42 | % | 2.85 | 2.17 | 31 | % | 34 | % | ||||||||||||||||||||
yoy = year-on-year, cc = at constant currency, EPS = earnings per share
FME Reignite strategy advances
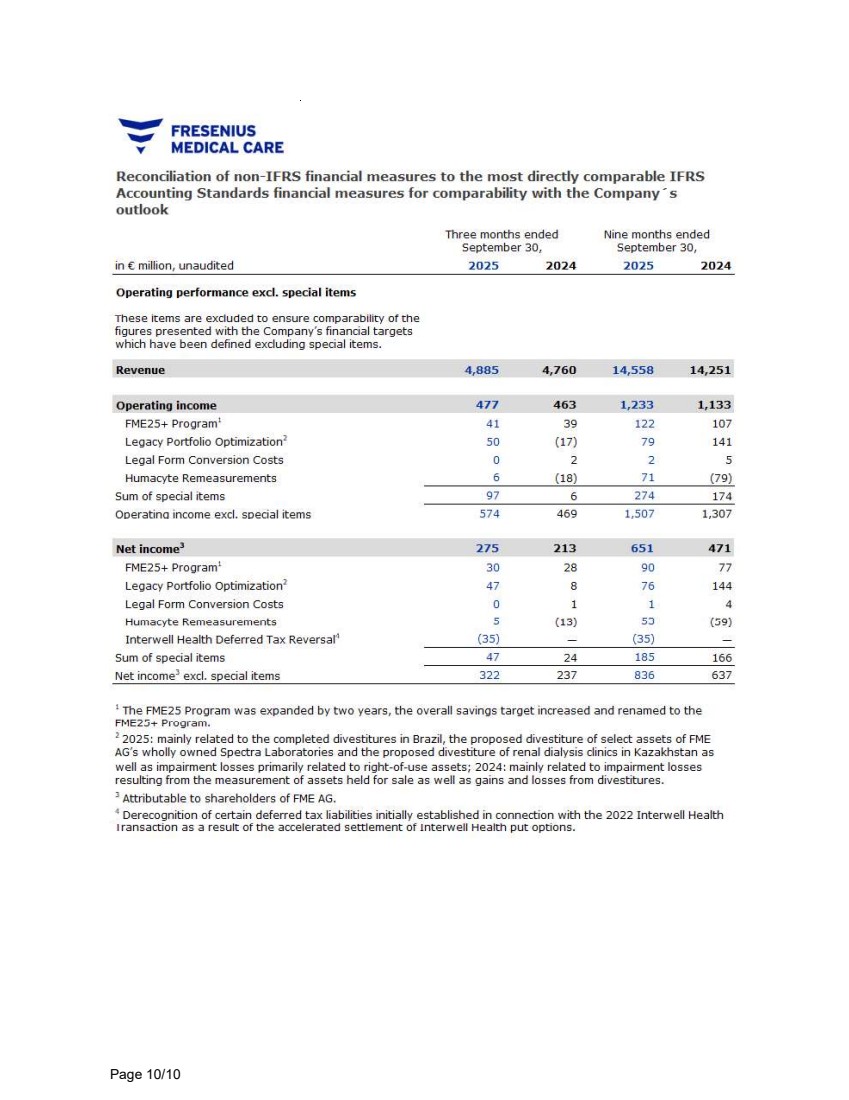
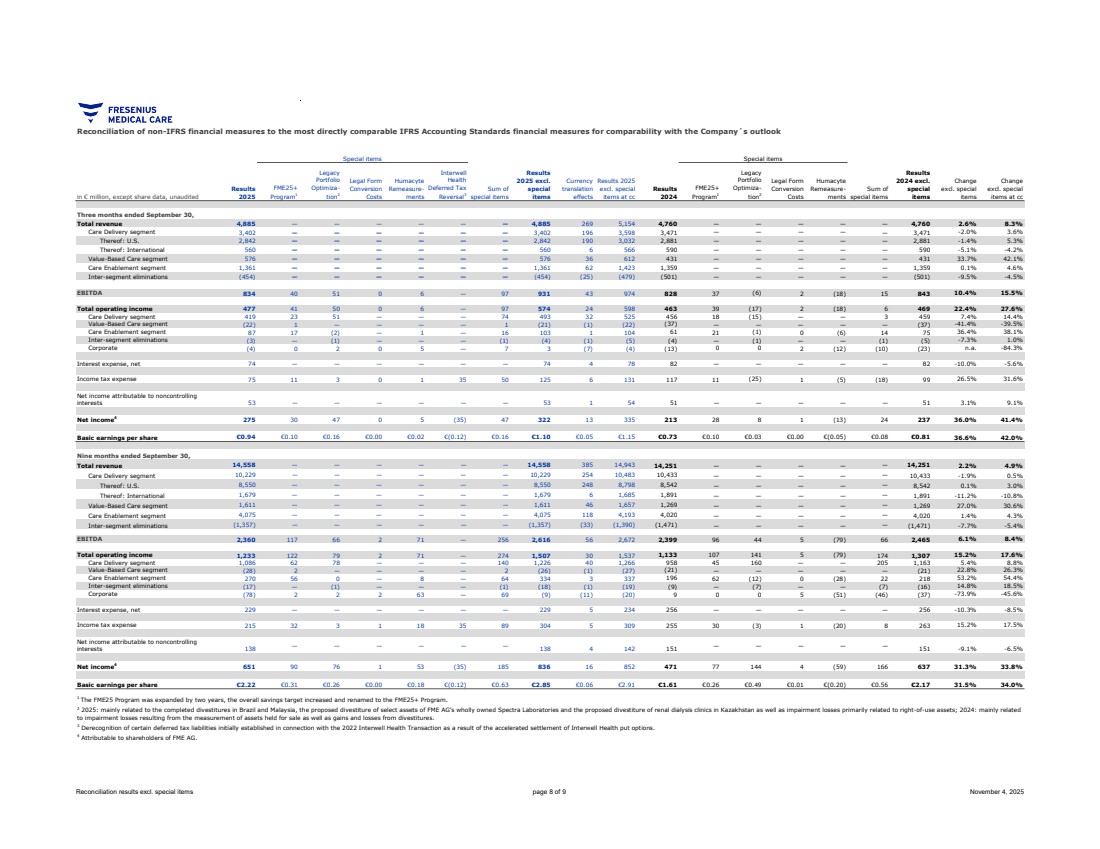
During the third quarter of 2025, the FME25+ transformation program continued its positive momentum, delivering EUR 47 million additional sustainable savings while related one-time costs, treated as special items, amounted to EUR 41 million. In the first nine months, the Company already delivered EUR 174 million of its full year FME25+ target of around EUR 180 million additional annual savings. FME25+ savings are expected to total EUR 1,050 million by year end 2027, while program cost of EUR 1,000 million to 1,050 million are anticipated in the same time frame.
During the third quarter, as part of the portfolio optimization plan, closed divestments included clinic operations in Brazil and Malaysia. Special items associated with portfolio optimization amounted to negative EUR 50 million in the third quarter.
All transactions realized as part of Fresenius Medical Care’s portfolio optimization plan in 2024 and 2025 are estimated to negatively impact full year 2025 Group revenue growth by around one percent. Related costs will be treated as special items in operating income.
Page
As part of the new capital allocation framework, Fresenius Medical Care announced an initial share buyback of EUR 1.0 billion as a commitment to return excess capital to shareholders. The program commenced in August with a first tranche of up to EUR 600 million. As of September 30, 2025, 3.6 million shares have been repurchased for a total investment amount of EUR 151 million.
Strong organic revenue growth1 across all segments
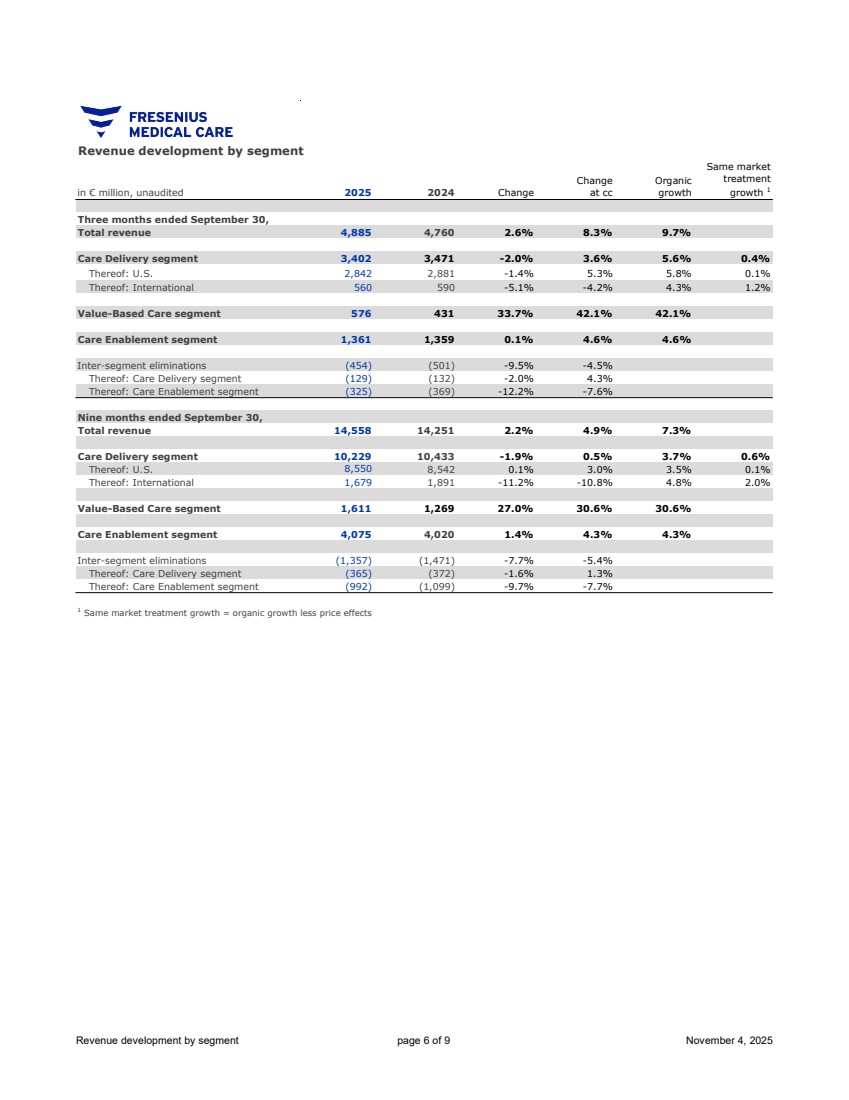
In the third quarter 2025, Group revenue increased by 3% (+8% at constant currency, +10% organic1) to EUR 4,885 million. Divestitures realized as part of the portfolio optimization plan affected the revenue development by -60 basis points.
Care Delivery revenue decreased by 2% (+4% at constant currency, +6% organic1) to EUR 3,402 million. Divestitures realized as part of the portfolio optimization plan affected the revenue development by -120 basis points.
In Care Delivery U.S., revenue decreased by 1% (+5% at constant currency, +6% organic1) to EUR 2,842 million. Reimbursement rate increases, a favorable payor mix development, the positive impact from phosphate binders and reduced implicit price concessions had a positive impact while exchange rates developed unfavorably. U.S. same market treatment growth slightly advanced to 0.1% year-on-year.
In Care Delivery International, revenue decreased by 5% (-4% at constant currency, +4% organic1) to EUR 560 million. The effects of closed or sold operations, mainly related to portfolio optimization and unfavorable exchange rates, were partially offset by organic growth1. Same market treatment growth amounted to 1.2%.
Value-Based Care revenue grew by 34% (+42% at constant currency, +42% organic1) to EUR 576 million, driven by a significantly higher number of member months mainly due to contract expansion, while exchange rates developed unfavorably.
Care Enablement revenue remained stable compared to prior year (+5% at constant currency, +5% organic1) at EUR 1,361 million. Volume growth and continued positive pricing momentum were offset by unfavorable exchange rate effects.
Within Inter-segment eliminations4, revenue for services provided and products transferred between the operating segments at fair market value came in at negative EUR 454 million.
In the first nine months, Group revenue increased by 2% (+5% at constant currency, +7% organic¹) to EUR 14,558 million. Divestitures realized as part of the portfolio optimization plan impacted the revenue development by -150 basis points. Care Delivery revenue decreased by 2% (0% at constant currency, +4% organic1) to EUR 10,229 million, with Care Delivery U.S. flat year-on-year (+3% at constant currency, +4% organic1) at EUR 8,550 million and Care Delivery International decreasing by 11% (-11% at constant currency, +5% organic1) to EUR 1,679 million. Divestitures realized as part of the portfolio optimization plan affected the revenue development of Care Delivery by -240 basis points and the revenue development of Care Delivery International by -1,350 basis points. U.S. same market treatment growth came in at 0.1% while international same market treatment growth amounted to 2.0%. Value-Based Care revenue increased by 27% (+31% at constant currency, +31% organic1) to EUR 1,611 million. Care Enablement revenue increased by 1% (+4% at constant currency, +4% organic1) to EUR 4,075 million. Inter-segment eliminations decreased to a deduction of EUR 1,357 million.
| 4 | The Company transfers products from the Care Enablement segment to the Care Delivery segment at fair market value. Services provided by the Care Delivery segment for patients managed under the Value-Based Care segment are also provided at fair market value. The associated internal revenues and expenses and all other consolidation of transactions are included within “Inter-segment eliminations”. |
Page
Accelerated earnings growth and double-digit operating income margin
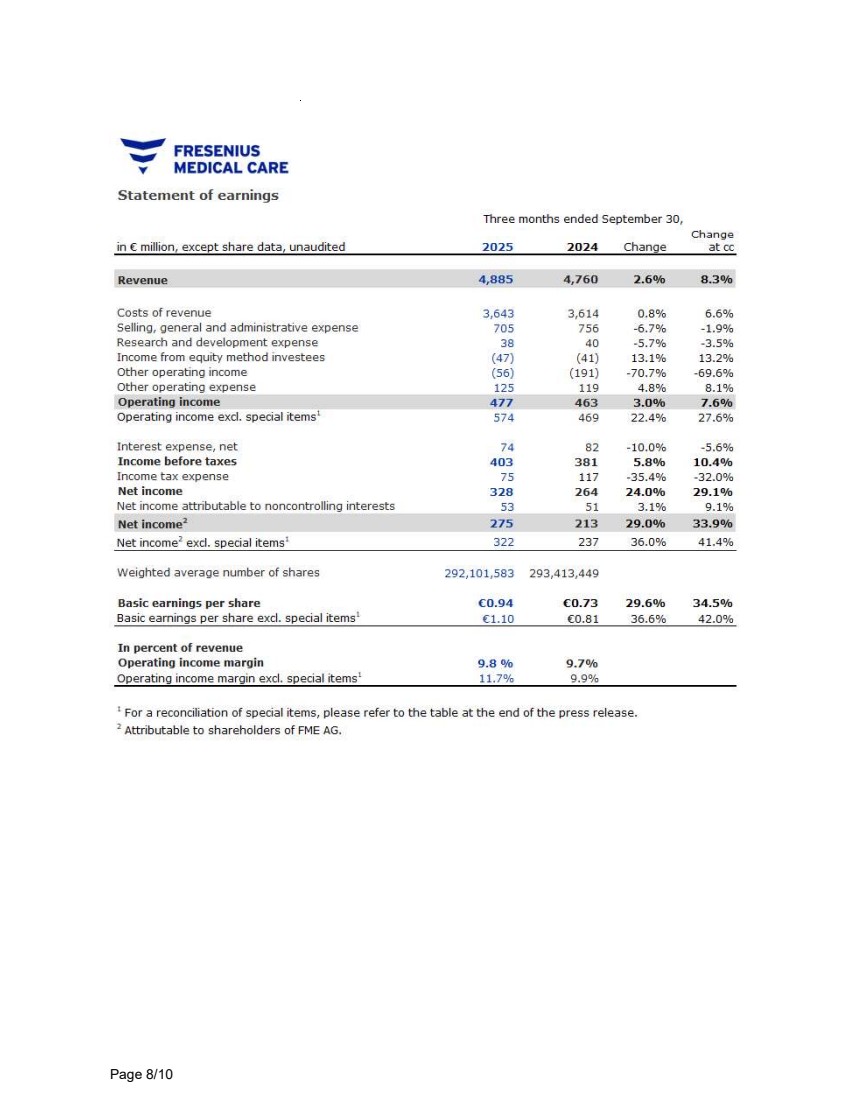
In the third quarter 2025, Group operating income increased by 3% (+8% at constant currency) to EUR 477 million, resulting in a margin of 9.8% (Q3 2024: 9.7%). Operating income excluding special items significantly increased by 22% (+28% at constant currency) to EUR 574 million, resulting in a margin2 of 11.7% (Q3 2024: 9.9%). Divestitures realized during the third quarter were neutral on operating income margin development.
Operating income in Care Delivery decreased by 8% (-1% at constant currency) to EUR 419 million, resulting in a margin of 12.3% (Q3 2024: 13.1%). Operating income excluding special items grew by 7% (+14% at constant currency) at EUR 493 million, resulting in a margin2 of 14.5% (Q3 2024: 13.2%). Compared to previous year, operating income development was driven by the positive impact from phosphate binders, positive rate and payor mix effects and savings from the FME25+ program. The development was negatively impacted by the absence of income attributable to a consent agreement on certain pharmaceuticals compared to the prior year, higher personnel expenses due to planned merit increases as well as other inflationary cost increases.
Operating income in Value-Based Care amounted to a loss of EUR 22 million, compared to a loss of EUR 37 million in the prior year, resulting in a margin of -3.8% (Q3 2024: -8.5%) and reflecting the quarterly earnings volatility, which is inherent to the business model. Operating income excluding special items amounted to a loss of EUR 21 million, compared to a loss of EUR 37 million in the prior year, resulting in a margin2 of -3.7% (Q3 2024: -8.5%). The improvement compared to the previous year’s quarter was driven by a favorable savings rate, partially offset by delayed CKCC reporting from CMS.
Operating income in Care Enablement increased by 43% (+44% at constant currency) to EUR 87 million, resulting in a margin of 6.4% (Q3 2024: 4.5%). Operating income excluding special items increased by 36% (+38% at constant currency) to EUR 103 million, resulting in a margin2 of 7.6% (Q3 2024: 5.6%). The improvement compared to the previous year’s quarter was mainly driven by higher volumes as well as positive pricing developments and savings from the FME25+ program. These positive effects were partially offset by higher-than-expected currency transaction effects as well as inflationary cost increases, which developed in line with expectations.
Operating income for Corporate amounted to a loss of EUR 4 million (Q3 2024: loss of EUR 13 million). Humacyte remeasurements, treated as special items in the Corporate line, amounted to EUR -5 million and virtual power purchase agreements amounted EUR -2 million. Operating income excluding special items amounted to EUR 3 million (Q3 2024: loss of EUR 23 million).
Page
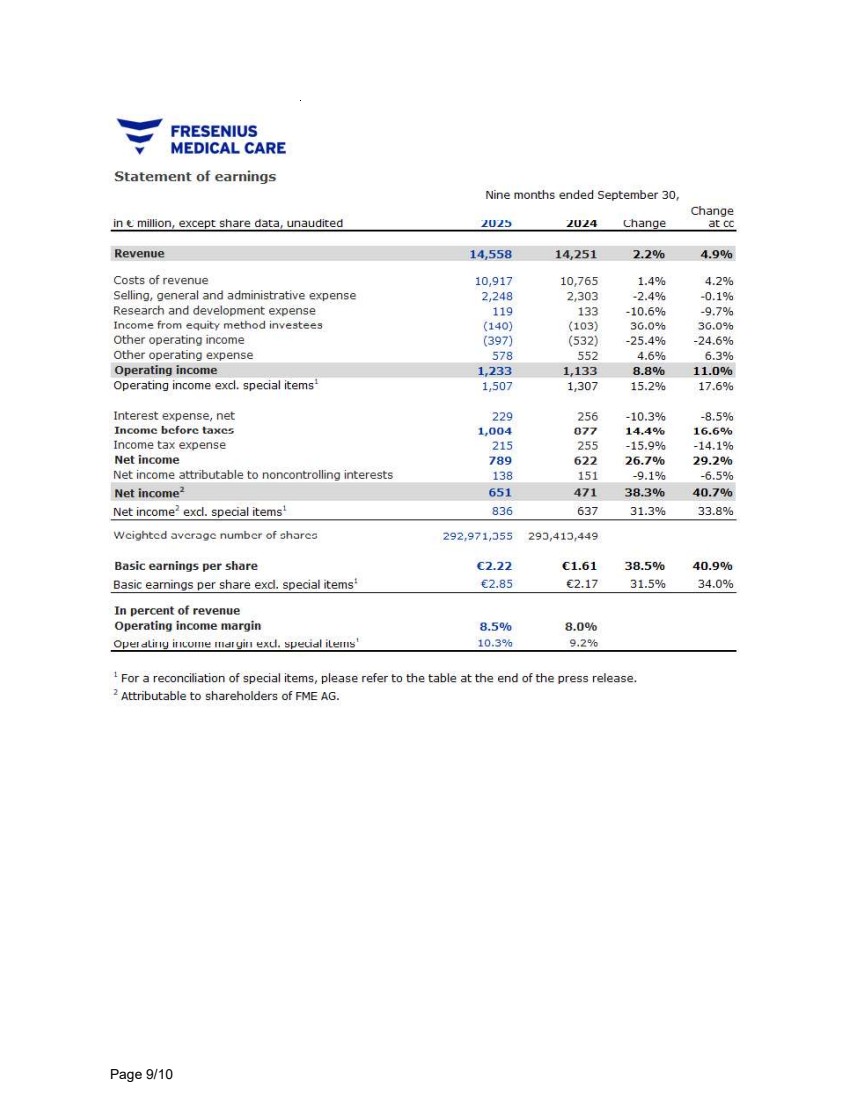
In the first nine months, Group operating income increased by 9% (+11% at constant currency) to EUR 1,233 million, resulting in a margin of 8.5% (9M 2024: 8.0%). Operating income excluding special items increased by 15% (+18% at constant currency) to EUR 1,507 million, resulting in a margin2 of 10.3% (9M 2024: 9.2%). Divestitures realized during the first nine months of the year were neutral on operating income margin development. In Care Delivery, operating income increased by 13% (+17% at constant currency) to EUR 1,086 million, resulting in a margin of 10.6% (9M 2024: 9.2%). Operating income excluding special items increased by 5% (+9% at constant currency) to EUR 1,226 million, resulting in a margin2 of 12.0% (9M 2024: 11.2%). In Value-Based Care operating income amounted to a loss of EUR 28 million compared to a loss of EUR 21 million in the prior year, resulting in a margin of -1.7% (9M 2024: -1.7%). Operating income excluding special items amounted to a loss of EUR 26 million compared to a loss of EUR 21 million in the prior year, resulting in a margin2 of -1.6% (9M 2024: -1.7%). In Care Enablement, operating income increased by 38% (+38% at constant currency) to EUR 270 million, resulting in a margin of 6.6% (9M 2024: 4.9%). Operating income excluding special items increased by 53% (+54% at constant currency) to EUR 334 million, resulting in a margin2 of 8.2% (9M 2024: 5.4%). Operating income for Corporate amounted to a loss of EUR 78 million (9M 2024: EUR 9 million). Operating income excluding special items amounted to a loss of EUR 9 million (9M 2024: loss of EUR 37 million).
Net income3 significantly increased by 29% (+34% at constant currency) to EUR 275 million in the third quarter 2025. Net income excluding special items increased by 36% (+41% at constant currency) to EUR 322 million.
In the first nine months, net income3 increased by 38% (+41% at constant currency) to EUR 651 million. Net income excluding special items increased by 31% (+34% at constant currency) to EUR 836 million.
Basic earnings per share (EPS) increased by 30% (+35% at constant currency) to EUR 0.94 in the third quarter 2025, based on 292,101,583 shares. Basic EPS excluding special items increased by 37% (+42% at constant currency) to EUR 1.10.
In the first nine months, basic EPS increased by 38% (+41% at constant currency) to EUR 2.22, based on 292,971,355 shares. Basic EPS excluding special items increased by 31% (+34% at constant currency) to EUR 2.85.
Cash flow development and net leverage ratio
In the third quarter 2025, operating cash flow decreased by 25% to EUR 742 million (Q3 2024: EUR 985 million), resulting in a margin of 15.2% (Q3 2024: 20.7%). Operating cash flow declined compared to prior year, which was inflated by around EUR 400 million catch-up following the cyber incident at Change Healthcare, while favorable working capital development contributed positively. In the first nine months, operating cashflow improved by 8% to EUR 1,679 million (9M 2024: EUR 1,554 million), resulting in a margin of 11.5% (9M 2024: 10.9%).
Page
Free cash flow5 significantly decreased by 33% to EUR 550 million in the third quarter 2025 (Q3 2024: EUR 815 million), resulting in a margin of 11.3% (Q3 2024: 17.1%). In the first nine months, Fresenius Medical Care increased free cash flow by 9% to EUR 1,199 million (9M 2024: EUR 1,102 million), resulting in a margin of 8.2% (9M 2024: 7.7%).
The ownership increase in our Value-Based Care entity Interwell Health by an investment of EUR 312 million was reflected in cash flow from financing activities.
Total net debt and lease liabilities were further reduced to EUR 9,218 million (Q3 2024: EUR 9,831 million). The net leverage ratio (net debt/EBITDA) further improved to 2.6x in Q3 2025 (Q2 2025: 2.7x).
Patients, clinics and employees
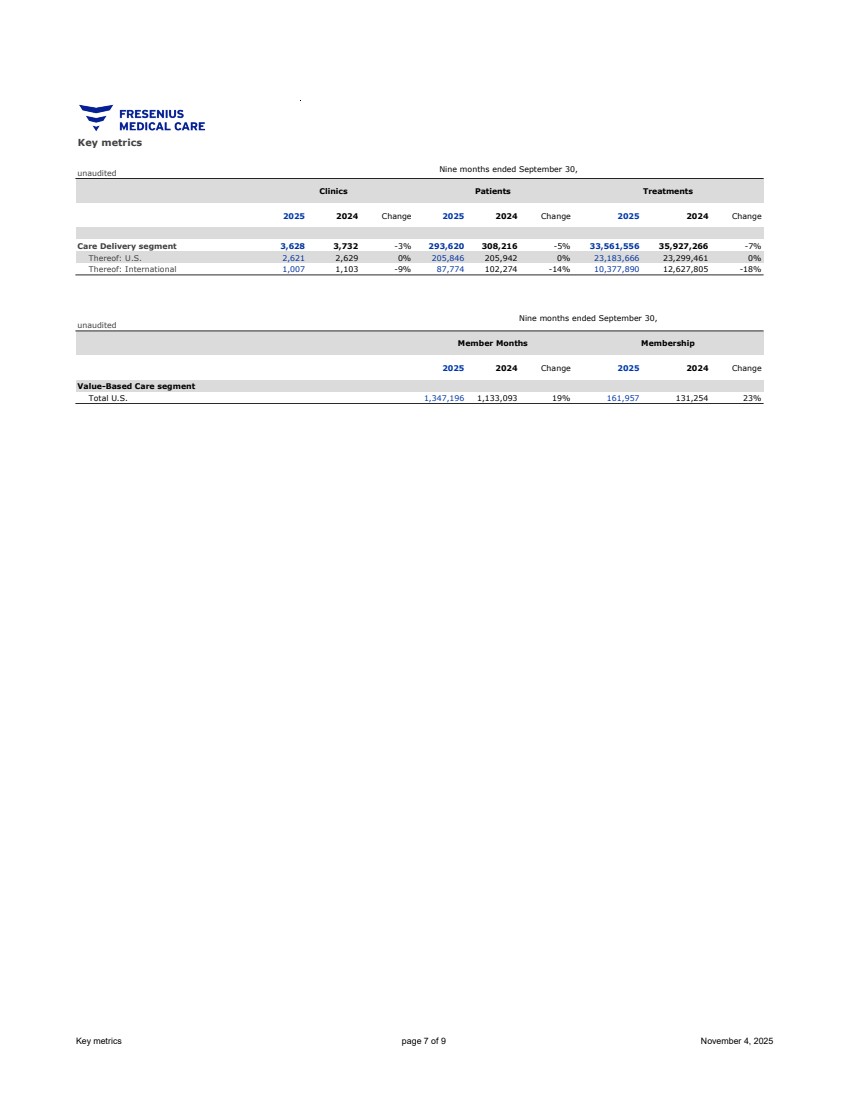
As of September 30, 2025, Fresenius Medical Care treated 293,620 patients in 3,628 dialysis clinics worldwide and had 109,916 employees (headcount) globally, compared to 112,445 employees as of June 30, 2025.
Outlook 2025 confirmed
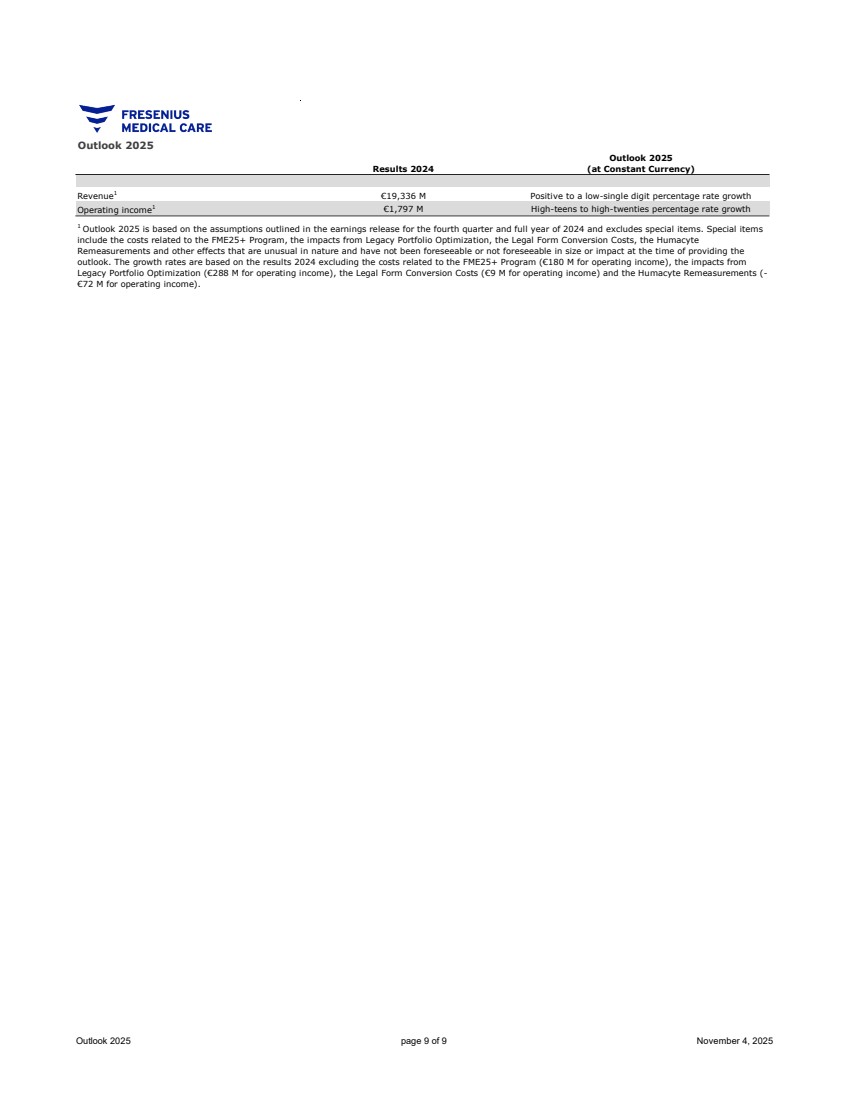
Fresenius Medical Care confirms its outlook for fiscal 2025 and expects revenue growth to be positive to a low-single digit percent rate compared to prior year. The Company expects operating income excluding special items to grow by a high-teens to high-twenties percent rate compared to prior year.
The expected growth rates for 2025 are at constant currency, excluding special items in operating income. The 2024 basis for the revenue outlook is EUR 19,336 million and for the operating income outlook is EUR 1,797 million.
Investor conference call
Fresenius Medical Care will host a conference call for analysts and investors to discuss the results of the third quarter 2025 today, November 4, 2025, at 2:00 p.m. CET / 8:00 a.m. ET. Details are available on the Fresenius Medical Care website in the “Investors” section. A replay and a transcript will be available shortly after the call.
Please refer to our statement of earnings included at the end of this press release and to the attachments as separate PDF files for a complete overview of the results of the third quarter 2025. Our form 6-K disclosure provides more details.
About Fresenius Medical Care:
Fresenius Medical Care is the world's leading provider of products and services for individuals with renal diseases of which around 4.2 million patients worldwide regularly undergo dialysis treatment. Through its network of 3,628 dialysis clinics, Fresenius Medical Care provides dialysis treatments for approx. 294,000 patients around the globe. Fresenius Medical Care is also the leading provider of dialysis products such as dialysis machines or dialyzers. Fresenius Medical Care is listed on the Frankfurt Stock Exchange (FME) and on the New York Stock Exchange (FMS).
For more information visit the Company’s website at www.freseniusmedicalcare.com.
5 Net cash provided by / used in operating activities, after capital expenditures, before acquisitions, investments, and dividends
Page
Disclaimer:
This release contains forward-looking statements that are subject to various risks and uncertainties. Actual results could differ materially from those described in these forward-looking statements due to various factors, including, but not limited to, changes in business, economic and competitive conditions, legal changes, regulatory approvals, results of clinical studies, foreign exchange rate fluctuations, uncertainties in litigation or investigative proceedings, and the availability of financing. These and other risks and uncertainties are detailed in Fresenius Medical Care’s reports filed with the U.S. Securities and Exchange Commission. Fresenius Medical Care does not undertake any responsibility to update the forward-looking statements in this release.
Page
|
Page 8/10 |
|
Page 9/10 |
|
Page 10/10 |
Exhibit 99.2
|
Content: Statement of earnings page 2 Segment information page 3 Balance sheet page 4 Cash flow page 5 page 6 Key metrics page 7 page 8 Outlook 2025 page 9 Disclaimer Fresenius Medical Care AG November 4, 2025 COMPLETE OVERVIEW OF THE THIRD QUARTER AND FIRST NINE MONTHS 2025 Investor Relations Copyright by Fresenius Medical Care AG email: ir@freseniusmedicalcare.com phone: +49 6172 609 2525 Reconciliation results excl. special items This release contains forward-looking statements that are subject to various risks and uncertainties. Actual results could differ materially from those described in these forward-looking statements due to various factors, including, but not limited to, changes in business, economic and competitive conditions, legal changes, regulatory approvals, impacts related to COVID-19, results of clinical studies, foreign exchange rate fluctuations, uncertainties in litigation or investigative proceedings, and the availability of financing. These and other risks and uncertainties are detailed in Fresenius Medical Care AG’s reports filed with the U.S. Securities and Exchange Commission. Fresenius Medical Care AG does not undertake any responsibility to update the forward-looking statements in this release. Rounding adjustments applied to individual numbers and percentages may result in these figures differing immaterially from their absolute values. Furthermore, totals and subtotals in tables may differ slightly from unrounded figures due to rounding in accordance with commercial rounding conventions. |
|
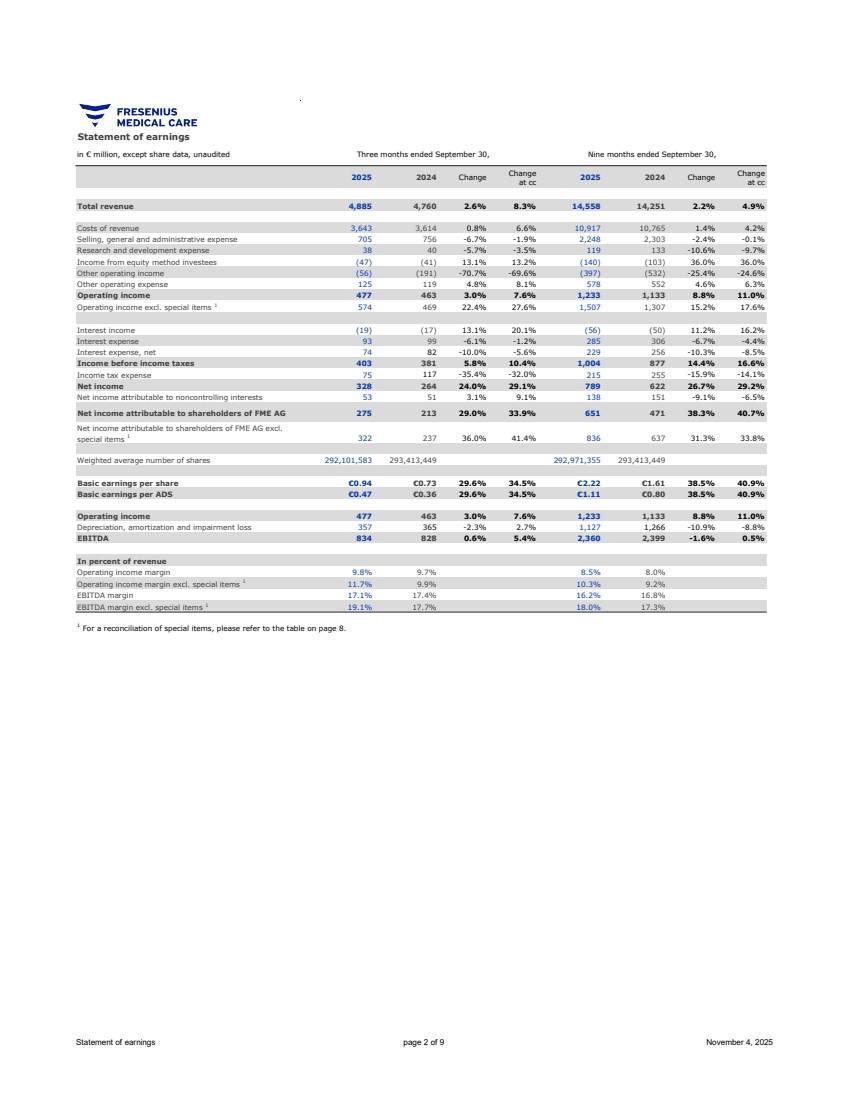
Statement of earnings in € million, except share data, unaudited 2025 2024 Change Change at cc 2025 2024 Change Change at cc Total revenue 4,885 4,760 2.6% 8.3% 14,558 14,251 2.2% 4.9% Costs of revenue 3,643 3,614 0.8% 6.6% 10,917 10,765 1.4% 4.2% Selling, general and administrative expense 705 756 -6.7% -1.9% 2,248 2,303 -2.4% -0.1% Research and development expense 38 40 -5.7% -3.5% 119 133 -10.6% -9.7% Income from equity method investees (47) (41) 13.1% 13.2% (140) (103) 36.0% 36.0% Other operating income (56) (191) -70.7% -69.6% (397) (532) -25.4% -24.6% Other operating expense 125 119 4.8% 8.1% 578 552 4.6% 6.3% Operating income 477 463 3.0% 7.6% 1,233 1,133 8.8% 11.0% Operating income excl. special items 1 574 469 22.4% 27.6% 1,507 1,307 15.2% 17.6% Interest income (19) (17) 13.1% 20.1% (56) (50) 11.2% 16.2% Interest expense 93 99 -6.1% -1.2% 285 306 -6.7% -4.4% Interest expense, net 74 82 -10.0% -5.6% 229 256 -10.3% -8.5% Income before income taxes 403 381 5.8% 10.4% 1,004 877 14.4% 16.6% Income tax expense 75 117 -35.4% -32.0% 215 255 -15.9% -14.1% Net income 328 264 24.0% 29.1% 789 622 26.7% 29.2% Net income attributable to noncontrolling interests 53 51 3.1% 9.1% 138 151 -9.1% -6.5% Net income attributable to shareholders of FME AG 275 213 29.0% 33.9% 651 471 38.3% 40.7% Net income attributable to shareholders of FME AG excl. special items 1 322 237 36.0% 41.4% 836 637 31.3% 33.8% Weighted average number of shares 292,101,583 293,413,449 292,971,355 293,413,449 Basic earnings per share €0.94 €0.73 29.6% 34.5% €2.22 €1.61 38.5% 40.9% Basic earnings per ADS €0.47 €0.36 29.6% 34.5% €1.11 €0.80 38.5% 40.9% Operating income 477 463 3.0% 7.6% 1,233 1,133 8.8% 11.0% Depreciation, amortization and impairment loss 357 365 -2.3% 2.7% 1,127 1,266 -10.9% -8.8% EBITDA 834 828 0.6% 5.4% 2,360 2,399 -1.6% 0.5% In percent of revenue Operating income margin 9.8% 9.7% 8.5% 8.0% Operating income margin excl. special items 1 11.7% 9.9% 10.3% 9.2% EBITDA margin 17.1% 17.4% 16.2% 16.8% EBITDA margin excl. special items 1 19.1% 17.7% 18.0% 17.3% 1 For a reconciliation of special items, please refer to the table on page 8. Three months ended September 30, Nine months ended September 30, Statement of earnings page 2 of 9 November 4, 2025 |
|
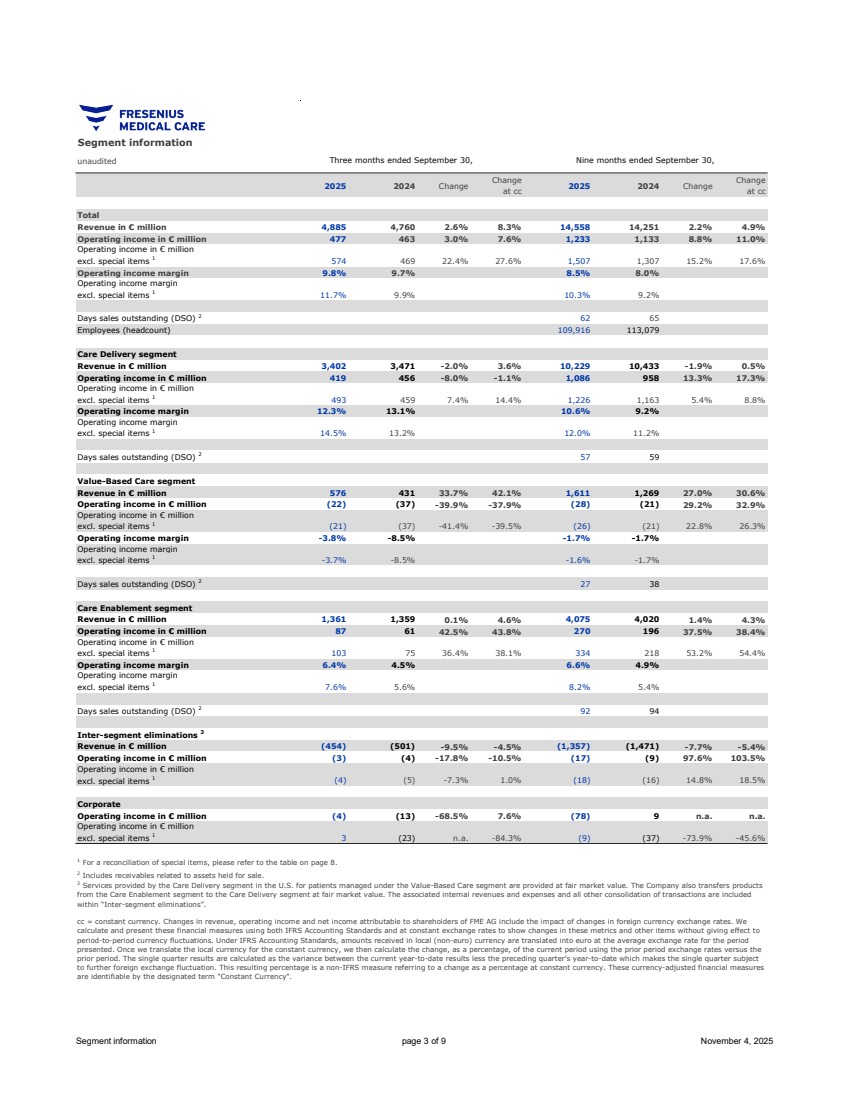
Segment information unaudited 2025 2024 Change Change at cc 2025 2024 Change Change at cc Total Revenue in € million 4,885 4,760 2.6% 8.3% 14,558 14,251 2.2% 4.9% Operating income in € million 477 463 3.0% 7.6% 1,233 1,133 8.8% 11.0% Operating income in € million excl. special items 1 574 469 22.4% 27.6% 1,507 1,307 15.2% 17.6% Operating income margin 9.8% 9.7% 8.5% 8.0% Operating income margin excl. special items 1 11.7% 9.9% 10.3% 9.2% Days sales outstanding (DSO) 2 62 65 Employees (headcount) 109,916 113,079 Care Delivery segment Revenue in € million 3,402 3,471 -2.0% 3.6% 10,229 10,433 -1.9% 0.5% Operating income in € million 419 456 -8.0% -1.1% 1,086 958 13.3% 17.3% Operating income in € million excl. special items 1 493 459 7.4% 14.4% 1,226 1,163 5.4% 8.8% Operating income margin 12.3% 13.1% 10.6% 9.2% Operating income margin excl. special items 1 14.5% 13.2% 12.0% 11.2% Days sales outstanding (DSO) 2 57 59 Value-Based Care segment Revenue in € million 576 431 33.7% 42.1% 1,611 1,269 27.0% 30.6% Operating income in € million (22) (37) -39.9% -37.9% (28) (21) 29.2% 32.9% Operating income in € million excl. special items 1 (21) (37) -41.4% -39.5% (26) (21) 22.8% 26.3% Operating income margin -3.8% -8.5% -1.7% -1.7% Operating income margin excl. special items 1 -3.7% -8.5% -1.6% -1.7% Days sales outstanding (DSO) 2 27 38 Care Enablement segment Revenue in € million 1,361 1,359 0.1% 4.6% 4,075 4,020 1.4% 4.3% Operating income in € million 87 61 42.5% 43.8% 270 196 37.5% 38.4% Operating income in € million excl. special items 1 103 75 36.4% 38.1% 334 218 53.2% 54.4% Operating income margin 6.4% 4.5% 6.6% 4.9% Operating income margin excl. special items 1 7.6% 5.6% 8.2% 5.4% Days sales outstanding (DSO) 2 92 94 Inter-segment eliminations 3 Revenue in € million (454) (501) -9.5% -4.5% (1,357) (1,471) -7.7% -5.4% Operating income in € million (3) (4) -17.8% -10.5% (17) (9) 97.6% 103.5% Operating income in € million excl. special items 1 (4) (5) -7.3% 1.0% (18) (16) 14.8% 18.5% Corporate Operating income in € million (4) (13) -68.5% 7.6% (78) 9 n.a. n.a. Operating income in € million excl. special items 1 3 (23) n.a. -84.3% (9) (37) -73.9% -45.6% Three months ended September 30, Nine months ended September 30, 2 Includes receivables related to assets held for sale. 3 Services provided by the Care Delivery segment in the U.S. for patients managed under the Value-Based Care segment are provided at fair market value. The Company also transfers products from the Care Enablement segment to the Care Delivery segment at fair market value. The associated internal revenues and expenses and all other consolidation of transactions are included within “Inter-segment eliminations”. cc = constant currency. Changes in revenue, operating income and net income attributable to shareholders of FME AG include the impact of changes in foreign currency exchange rates. We calculate and present these financial measures using both IFRS Accounting Standards and at constant exchange rates to show changes in these metrics and other items without giving effect to period-to-period currency fluctuations. Under IFRS Accounting Standards, amounts received in local (non-euro) currency are translated into euro at the average exchange rate for the period presented. Once we translate the local currency for the constant currency, we then calculate the change, as a percentage, of the current period using the prior period exchange rates versus the prior period. The single quarter results are calculated as the variance between the current year-to-date results less the preceding quarter’s year-to-date which makes the single quarter subject to further foreign exchange fluctuation. This resulting percentage is a non-IFRS measure referring to a change as a percentage at constant currency. These currency-adjusted financial measures are identifiable by the designated term "Constant Currency". 1 For a reconciliation of special items, please refer to the table on page 8. Segment information page 3 of 9 November 4, 2025 |
|
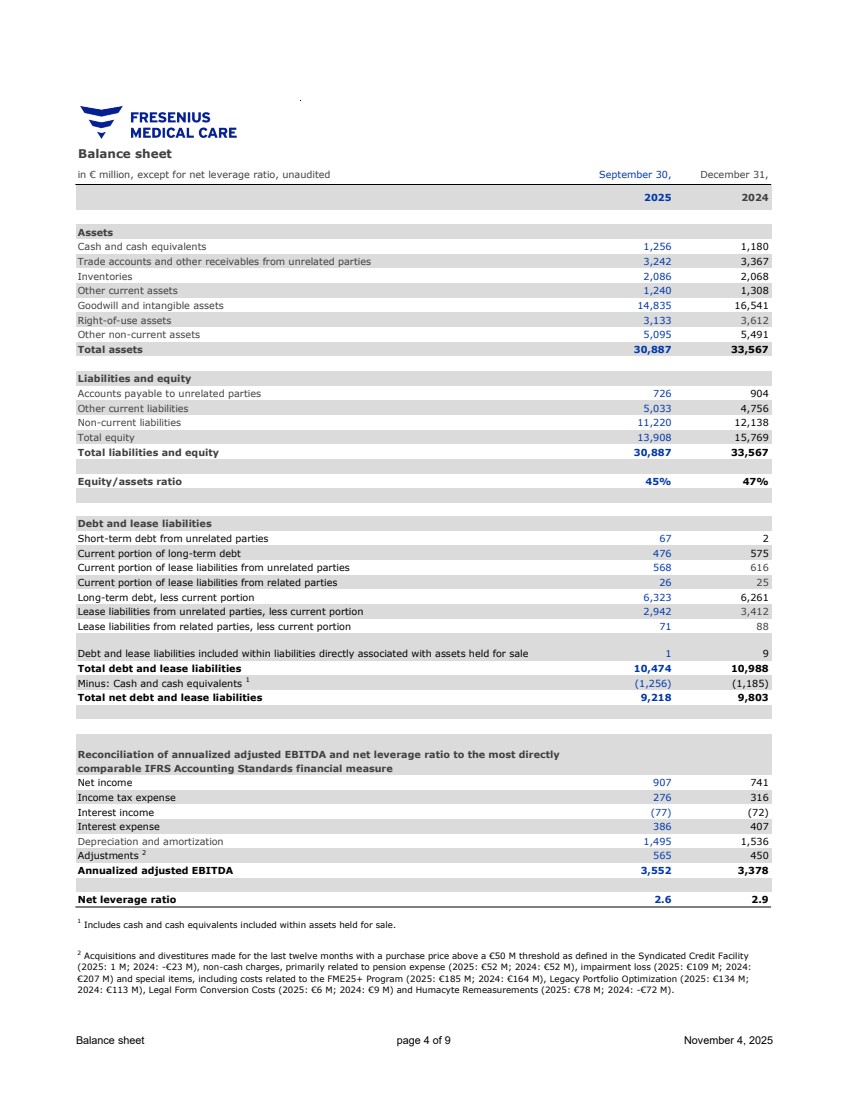
Balance sheet in € million, except for net leverage ratio, unaudited September 30, December 31, 2025 2024 Assets Cash and cash equivalents 1,256 1,180 Trade accounts and other receivables from unrelated parties 3,242 3,367 Inventories 2,086 2,068 Other current assets 1,240 1,308 Goodwill and intangible assets 14,835 16,541 Right-of-use assets 3,133 3,612 Other non-current assets 5,095 5,491 Total assets 30,887 33,567 Liabilities and equity Accounts payable to unrelated parties 726 904 Other current liabilities 5,033 4,756 Non-current liabilities 11,220 12,138 Total equity 13,908 15,769 Total liabilities and equity 30,887 33,567 Equity/assets ratio 45% 47% Debt and lease liabilities Short-term debt from unrelated parties 67 2 Current portion of long-term debt 476 575 Current portion of lease liabilities from unrelated parties 568 616 Current portion of lease liabilities from related parties 26 25 Long-term debt, less current portion 6,323 6,261 Lease liabilities from unrelated parties, less current portion 2,942 3,412 Lease liabilities from related parties, less current portion 71 88 Debt and lease liabilities included within liabilities directly associated with assets held for sale 1 9 Total debt and lease liabilities 10,474 10,988 Minus: Cash and cash equivalents 1 (1,256) (1,185) Total net debt and lease liabilities 9,218 9,803 Reconciliation of annualized adjusted EBITDA and net leverage ratio to the most directly comparable IFRS Accounting Standards financial measure Net income 907 741 Income tax expense 276 316 Interest income (77) (72) Interest expense 386 407 Depreciation and amortization 1,495 1,536 Adjustments 2 565 450 Annualized adjusted EBITDA 3,552 3,378 Net leverage ratio 2.6 2.9 2 Acquisitions and divestitures made for the last twelve months with a purchase price above a €50 M threshold as defined in the Syndicated Credit Facility (2025: 1 M; 2024: -€23 M), non-cash charges, primarily related to pension expense (2025: €52 M; 2024: €52 M), impairment loss (2025: €109 M; 2024: €207 M) and special items, including costs related to the FME25+ Program (2025: €185 M; 2024: €164 M), Legacy Portfolio Optimization (2025: €134 M; 2024: €113 M), Legal Form Conversion Costs (2025: €6 M; 2024: €9 M) and Humacyte Remeasurements (2025: €78 M; 2024: -€72 M). 1 Includes cash and cash equivalents included within assets held for sale. Balance sheet page 4 of 9 November 4, 2025 |
|
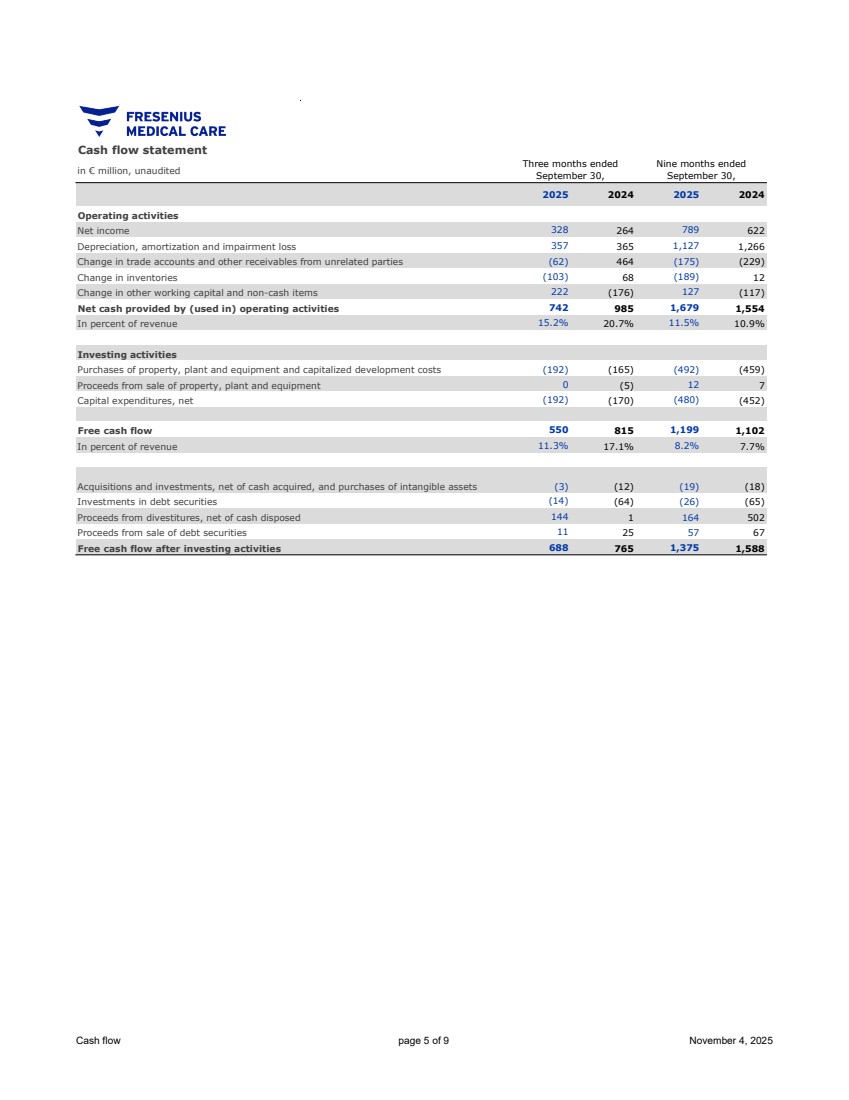
Cash flow statement in € million, unaudited 2025 2024 2025 2024 Operating activities Net income 328 264 789 622 Depreciation, amortization and impairment loss 357 365 1,127 1,266 Change in trade accounts and other receivables from unrelated parties (62) 464 (175) (229) Change in inventories (103) 68 (189) 12 Change in other working capital and non-cash items 222 (176) 127 (117) Net cash provided by (used in) operating activities 742 985 1,679 1,554 In percent of revenue 15.2% 20.7% 11.5% 10.9% Investing activities Purchases of property, plant and equipment and capitalized development costs (192) (165) (492) (459) Proceeds from sale of property, plant and equipment 0 (5) 12 7 Capital expenditures, net (192) (170) (480) (452) Free cash flow 550 815 1,199 1,102 In percent of revenue 11.3% 17.1% 8.2% 7.7% Acquisitions and investments, net of cash acquired, and purchases of intangible assets (3) (12) (19) (18) Investments in debt securities (14) (64) (26) (65) Proceeds from divestitures, net of cash disposed 144 1 164 502 Proceeds from sale of debt securities 11 25 57 67 Free cash flow after investing activities 688 765 1,375 1,588 Nine months ended September 30, Three months ended September 30, Cash flow page 5 of 9 November 4, 2025 |
|
in € million, unaudited 2025 2024 Change Change at cc Organic growth Same market treatment growth 1 Three months ended September 30, Total revenue 4,885 4,760 2.6% 8.3% 9.7% Care Delivery segment 3,402 3,471 -2.0% 3.6% 5.6% 0.4% Thereof: U.S. 2,842 2,881 -1.4% 5.3% 5.8% 0.1% Thereof: International 560 590 -5.1% -4.2% 4.3% 1.2% Value-Based Care segment 576 431 33.7% 42.1% 42.1% Care Enablement segment 1,361 1,359 0.1% 4.6% 4.6% Inter-segment eliminations (454) (501) -9.5% -4.5% Thereof: Care Delivery segment (129) (132) -2.0% 4.3% Thereof: Care Enablement segment (325) (369) -12.2% -7.6% Nine months ended September 30, Total revenue 14,558 14,251 2.2% 4.9% 7.3% Care Delivery segment 10,229 10,433 -1.9% 0.5% 3.7% 0.6% Thereof: U.S. 8,550 8,542 0.1% 3.0% 3.5% 0.1% Thereof: International 1,679 1,891 -11.2% -10.8% 4.8% 2.0% Value-Based Care segment 1,611 1,269 27.0% 30.6% 30.6% Care Enablement segment 4,075 4,020 1.4% 4.3% 4.3% Inter-segment eliminations (1,357) (1,471) -7.7% -5.4% Thereof: Care Delivery segment (365) (372) -1.6% 1.3% Thereof: Care Enablement segment (992) (1,099) -9.7% -7.7% 1 Same market treatment growth = organic growth less price effects Revenue development by segment Revenue development by segment page 6 of 9 November 4, 2025 |
|
unaudited 2025 2024 Change 2025 2024 Change 2025 2024 Change Care Delivery segment 3,628 3,732 -3% 293,620 308,216 -5% 33,561,556 35,927,266 -7% Thereof: U.S. 2,621 2,629 0% 205,846 205,942 0% 23,183,666 23,299,461 0% Thereof: International 1,007 1,103 -9% 87,774 102,274 -14% 10,377,890 12,627,805 -18% unaudited 2025 2024 Change 2025 2024 Change Value-Based Care segment Total U.S. 1,347,196 1,133,093 19% 161,957 131,254 23% Key metrics Clinics Patients Nine months ended September 30, Treatments Nine months ended September 30, Member Months Membership Key metrics page 7 of 9 November 4, 2025 |
|
in € million, except share data, unaudited Results 2025 FME25+ Program1 Legacy Portfolio Optimiza-tion2 Legal Form Conversion Costs Humacyte Remeasure-ments Interwell Health Deferred Tax Reversal3 Sum of special items Results 2025 excl. special items Currency translation effects Results 2025 excl. special items at cc Results 2024 FME25+ Program1 Legacy Portfolio Optimiza-tion2 Legal Form Conversion Costs Humacyte Remeasure-ments Sum of special items Results 2024 excl. special items Change excl. special items Change excl. special items at cc Three months ended September 30, Total revenue 4,885 — — — — — — 4,885 269 5,154 4,760 — — — — — 4,760 2.6% 8.3% Care Delivery segment 3,402 — — — — — — 3,402 196 3,598 3,471 — — — — — 3,471 -2.0% 3.6% Thereof: U.S. 2,842 — — — — — — 2,842 190 3,032 2,881 — — — — — 2,881 -1.4% 5.3% Thereof: International 560 — — — — — — 560 6 566 590 — — — — — 590 -5.1% -4.2% Value-Based Care segment 576 — — — — — — 576 36 612 431 — — — — — 431 33.7% 42.1% Care Enablement segment 1,361 — — — — — — 1,361 62 1,423 1,359 — — — — — 1,359 0.1% 4.6% Inter-segment eliminations (454) — — — — — — (454) (25) (479) (501) — — — — — (501) -9.5% -4.5% EBITDA 834 40 51 0 6 — 97 931 43 974 828 37 (6) 2 (18) 15 843 10.4% 15.5% Total operating income 477 41 50 0 6 — 97 574 24 598 463 39 (17) 2 (18) 6 469 22.4% 27.6% Care Delivery segment 419 23 51 — — — 74 493 32 525 456 18 (15) — — 3 459 7.4% 14.4% Value-Based Care segment (22) 1 — — — — 1 (21) (1) (22) (37) — — — — — (37) -41.4% -39.5% Care Enablement segment 87 17 (2) — 1 — 16 103 1 104 61 21 (1) 0 (6) 14 75 36.4% 38.1% Inter-segment eliminations (3) — (1) — — — (1) (4) (1) (5) (4) — (1) — — (1) (5) -7.3% 1.0% Corporate (4) 0 2 0 5 — 7 3 (7) (4) (13) 0 0 2 (12) (10) (23) n.a. -84.3% Interest expense, net 74 — — — — — — 74 4 78 82 — — — — — 82 -10.0% -5.6% Income tax expense 75 11 3 0 1 35 50 125 6 131 117 11 (25) 1 (5) (18) 99 26.5% 31.6% Net income attributable to noncontrolling interests 53 — — — — — — 53 1 54 51 — — — — — 51 3.1% 9.1% Net income4 275 30 47 0 5 (35) 47 322 13 335 213 28 8 1 (13) 24 237 36.0% 41.4% Basic earnings per share €0.94 €0.10 €0.16 €0.00 €0.02 €(0.12) €0.16 €1.10 €0.05 €1.15 €0.73 €0.10 €0.03 €0.00 €(0.05) €0.08 €0.81 36.6% 42.0% Nine months ended September 30, Total revenue 14,558 — — — — — — 14,558 385 14,943 14,251 — — — — — 14,251 2.2% 4.9% Care Delivery segment 10,229 — — — — — — 10,229 254 10,483 10,433 — — — — — 10,433 -1.9% 0.5% Thereof: U.S. 8,550 — — — — — — 8,550 248 8,798 8,542 — — — — — 8,542 0.1% 3.0% Thereof: International 1,679 — — — — — — 1,679 6 1,685 1,891 — — — — — 1,891 -11.2% -10.8% Value-Based Care segment 1,611 — — — — — — 1,611 46 1,657 1,269 — — — — — 1,269 27.0% 30.6% Care Enablement segment 4,075 — — — — — — 4,075 118 4,193 4,020 — — — — — 4,020 1.4% 4.3% Inter-segment eliminations (1,357) — — — — — — (1,357) (33) (1,390) (1,471) — — — — — (1,471) -7.7% -5.4% EBITDA 2,360 117 66 2 71 — 256 2,616 56 2,672 2,399 96 44 5 (79) 66 2,465 6.1% 8.4% Total operating income 1,233 122 79 2 71 — 274 1,507 30 1,537 1,133 107 141 5 (79) 174 1,307 15.2% 17.6% Care Delivery segment 1,086 62 78 — — — 140 1,226 40 1,266 958 45 160 — — 205 1,163 5.4% 8.8% Value-Based Care segment (28) 2 — — — — 2 (26) (1) (27) (21) — — — — — (21) 22.8% 26.3% Care Enablement segment 270 56 0 — 8 — 64 334 3 337 196 62 (12) 0 (28) 22 218 53.2% 54.4% Inter-segment eliminations (17) — (1) — — — (1) (18) (1) (19) (9) — (7) — — (7) (16) 14.8% 18.5% Corporate (78) 2 2 2 63 — 69 (9) (11) (20) 9 0 0 5 (51) (46) (37) -73.9% -45.6% Interest expense, net 229 — — — — — — 229 5 234 256 — — — — — 256 -10.3% -8.5% Income tax expense 215 32 3 1 18 35 89 304 5 309 255 30 (3) 1 (20) 8 263 15.2% 17.5% Net income attributable to noncontrolling interests 138 — — — — — — 138 4 142 151 — — — — — 151 -9.1% -6.5% Net income4 651 90 76 1 53 (35) 185 836 16 852 471 77 144 4 (59) 166 637 31.3% 33.8% Basic earnings per share €2.22 €0.31 €0.26 €0.00 €0.18 €(0.12) €0.63 €2.85 €0.06 €2.91 €1.61 €0.26 €0.49 €0.01 €(0.20) €0.56 €2.17 31.5% 34.0% Special items Reconciliation of non-IFRS financial measures to the most directly comparable IFRS Accounting Standards financial measures for comparability with the Company´s outlook Special items 1 The FME25 Program was expanded by two years, the overall savings target increased and renamed to the FME25+ Program. 4 Attributable to shareholders of FME AG. 2 2025: mainly related to the completed divestitures in Brazil and Malaysia, the proposed divestiture of select assets of FME AG’s wholly owned Spectra Laboratories and the proposed divestiture of renal dialysis clinics in Kazakhstan as well as impairment losses primarily related to right-of-use assets; 2024: mainly related to impairment losses resulting from the measurement of assets held for sale as well as gains and losses from divestitures. 3 Derecognition of certain deferred tax liabilities initially established in connection with the 2022 Interwell Health Transaction as a result of the accelerated settlement of Interwell Health put options. Reconciliation results excl. special items page 8 of 9 November 4, 2025 |
|
Outlook 2025 Spalte1 Results 2024 Outlook 2025 (at Constant Currency) Revenue1 €19,336 M Positive to a low-single digit percentage rate growth Operating income1 €1,797 M High-teens to high-twenties percentage rate growth 1 Outlook 2025 is based on the assumptions outlined in the earnings release for the fourth quarter and full year of 2024 and excludes special items. Special items include the costs related to the FME25+ Program, the impacts from Legacy Portfolio Optimization, the Legal Form Conversion Costs, the Humacyte Remeasurements and other effects that are unusual in nature and have not been foreseeable or not foreseeable in size or impact at the time of providing the outlook. The growth rates are based on the results 2024 excluding the costs related to the FME25+ Program (€180 M for operating income), the impacts from Legacy Portfolio Optimization (€288 M for operating income), the Legal Form Conversion Costs (€9 M for operating income) and the Humacyte Remeasurements (- €72 M for operating income). Outlook 2025 page 9 of 9 November 4, 2025 |