UNITED STATES
SECURITIES AND EXCHANGE COMMISSION
WASHINGTON, D.C. 20549
FORM 8-K
CURRENT REPORT
Pursuant to Section 13 or 15(d)
of the Securities Exchange Act of 1934
Date of Report (Date of earliest event reported): November 3, 2025
Innovative Industrial Properties, Inc.
(Exact name of registrant as specified in its charter)
| Maryland | 001-37949 | 81-2963381 | ||
|
(State or Other Jurisdiction of Incorporation) |
(Commission File No.) |
(I.R.S. Employer Identification No.) |
1389 Center Drive, Suite 200
Park City, UT 84098
(Address of principal executive offices, including zip code)
Registrant’s telephone number, including area code: (858) 997-3332
Check the appropriate box below if the Form 8-K filing is intended to simultaneously satisfy the filing obligation of the registrant under any of the following provisions (see General Instruction A.2. below):
| ¨ | Written communications pursuant to Rule 425 under the Securities Act (17 CFR 230.425) |
| ¨ | Soliciting material pursuant to Rule 14a-12 under the Exchange Act (17 CFR 240.14a-12) |
| ¨ | Pre-commencement communications pursuant to Rule 14d-2(b) under the Exchange Act (17 CFR 240.14d-2(b)) |
| ¨ | Pre-commencement communications pursuant to Rule 13e-4(c) under the Exchange Act (17 CFR 240.13e-4(c)) |
Indicate by check mark whether the registrant is an emerging growth company as defined in Rule 405 of the Securities Act of 1933 (§230.405 of this chapter) or Rule 12b-2 of the Securities Exchange Act of 1934 (§240.12b-2 of this chapter). Emerging growth company ¨
If an emerging growth company, indicate by check mark if the registrant has elected not to use the extended transition period for complying with any new or revised financial accounting standards provided pursuant to Section 13(a) of the Exchange Act. ¨
Securities Registered pursuant to Section 12(b) of the Act:
| Title of each class | Trading Symbol(s) | Name of each exchange on which registered |
||
| Common Stock, par value $0.001 per share | IIPR | New York Stock Exchange | ||
| Series A Preferred Stock, par value $0.001 per share | IIPR-PA | New York Stock Exchange |
Item 2.02 Results of Operations and Financial Condition.
On November 3, 2025, Innovative Industrial Properties, Inc. (the “Company”) issued a press release regarding its financial results for the third quarter ended September 30, 2025. A copy of the press release is attached hereto as Exhibit 99.1 and is incorporated by reference herein.
On November 3, 2025, the Company posted on its website, www.innovativeindustrialproperties.com, certain supplemental financial information for the third quarter ended September 30, 2025, which is attached hereto as Exhibit 99.2 and is incorporated by reference herein.
Item 7.01 Regulation FD Disclosure.
On November 3, 2025, the Company posted an investor presentation to its website located at http://investors.innovativeindustrialproperties.com. A copy of the investor presentation is attached hereto as Exhibit 99.3 and is incorporated by reference herein.
The information contained in this Current Report, including Exhibits 99.1, 99.2 and 99.3 referenced herein, is being furnished and shall not be deemed “filed” for purposes of Section 18 of the Securities Exchange Act of 1934, as amended, or otherwise subject to the liabilities of that section. Such information shall not be incorporated by reference into any filing of the Company, whether made before or after the date hereof, regardless of any general incorporation language in such filing.
Item 9.01 Financial Statements and Exhibits.
(d) Exhibits
| Exhibit Number |
Description of Exhibit | |
| 99.1 | Press Release issued by Innovative Industrial Properties, Inc. on November 3, 2025. | |
| 99.2 | Supplemental Financial Information for the quarter ended September 30, 2025. | |
| 99.3 | Innovative Industrial Properties, Inc. Investor Presentation dated November 3, 2025. | |
| 104 | Cover Page Interactive Data File (embedded within the Inline XBRL document). |
SIGNATURES
Pursuant to the requirements of the Securities Exchange Act of 1934, the registrant has duly caused this report to be signed on its behalf by the undersigned hereunto duly authorized.
| Date: November 3, 2025 | INNOVATIVE INDUSTRIAL PROPERTIES, INC. | |
| By: | /s/ David Smith | |
| Name: | David Smith | |
| Title: | Chief Financial Officer | |
Exhibit 99.1
Innovative Industrial Properties Reports Third Quarter 2025 Results
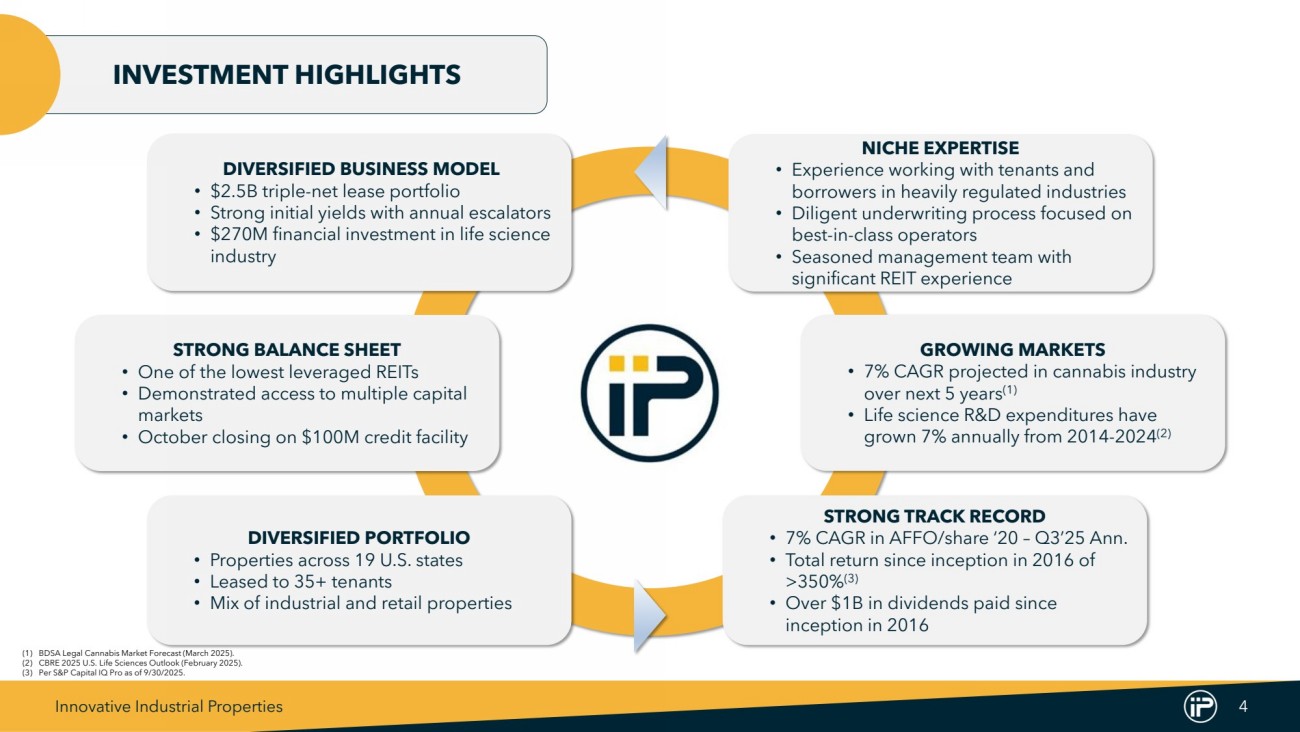
Announced $270 Million Commitment Into IQHQ, A Premier Life Science Real Estate Platform
Closed on a New $100 Million Secured Revolving Credit Facility
SAN DIEGO, CA – November 3, 2025 – Innovative Industrial Properties, Inc. (NYSE: IIPR) ("IIP" or the "Company") announced today results for the third quarter ended September 30, 2025.
Executive Chairman Remarks
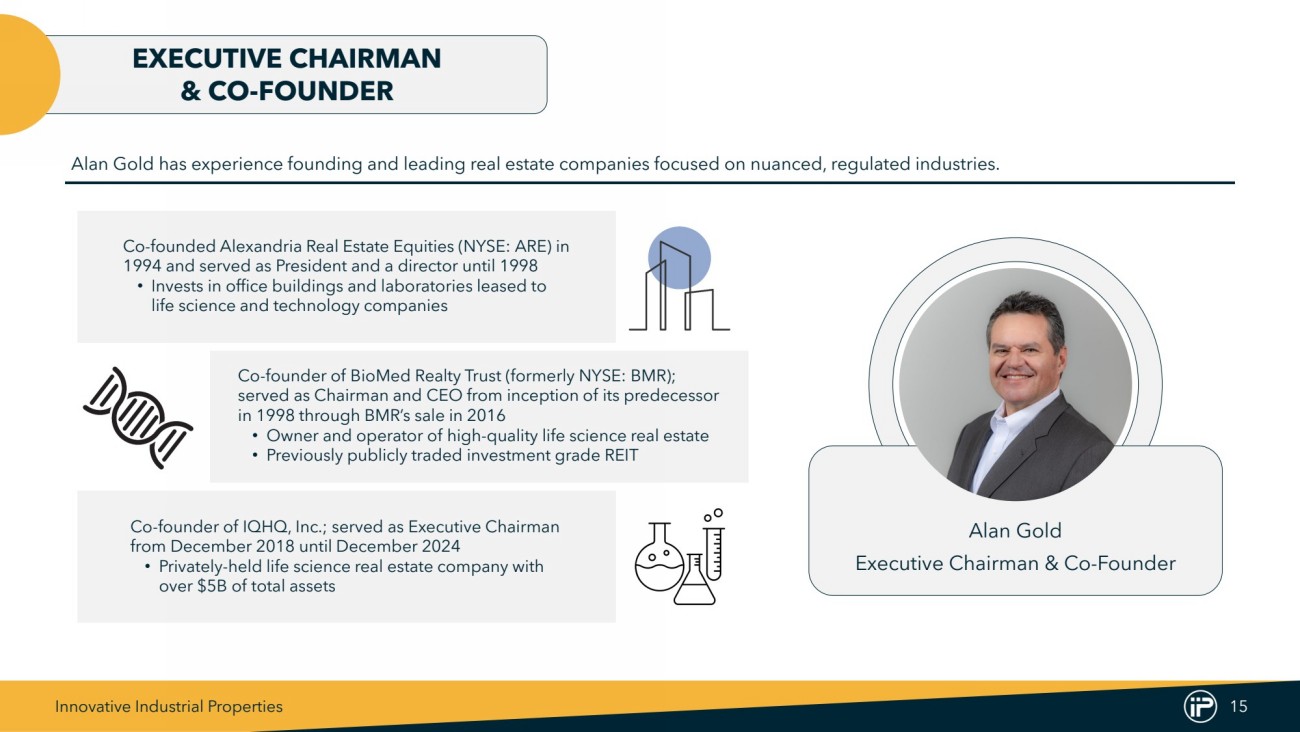
“We are pleased to have made our first investment outside of the cannabis industry during the third quarter with our $270 million financial investment into IQHQ, marking IIP’s return to growth and providing meaningful diversification and accretion for IIP's shareholders,” said Alan Gold, Executive Chairman of IIP. “In addition, the successful closing of our new $100 million credit facility reinforces our belief that our investment in the life science sector enhances both our access to, and cost of, capital. With a strong, low-leveraged balance sheet, this credit facility strengthens our financial flexibility and positions us to capitalize on the long-term growth of the life science industry.”
Third Quarter 2025 and Fourth Quarter to Date Highlights
Financial Results and Dividend
| • | Total revenues of $64.7 million and net income attributable to common stockholders of $28.3 million, or $0.97 per share (all per share amounts in this press release are reported on a diluted basis unless otherwise noted). |
| • | Adjusted funds from operations ("AFFO") and normalized funds from operations ("Normalized FFO") of $48.3 million and $45.2 million, respectively. |
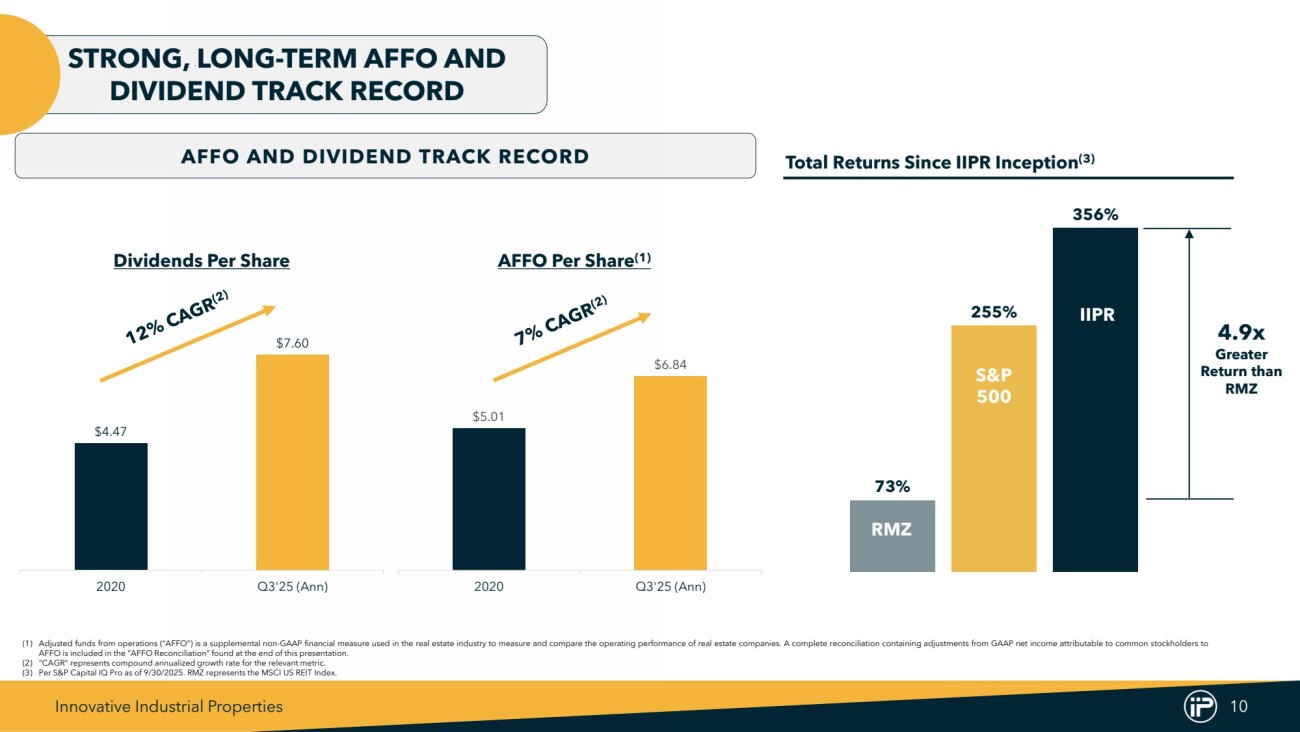
| • | Paid a quarterly dividend of $1.90 per common share on October 15, 2025 to stockholders of record as of September 30, 2025. Since its inception, IIP has paid over $1.0 billion in common stock dividends to its stockholders. |
| Three Months Ended September 30, 2025 |
Three Months Ended September 30, 2024 |
|||||||||||||||
| (in thousands, except per share amounts) | Amount | Per Share | Amount | Per Share | ||||||||||||
| Net income attributable to common stockholders | $ | 28,288 | $ | 0.97 | $ | 39,651 | $ | 1.37 | ||||||||
| Normalized FFO | 45,156 | 1.60 | 59,525 | 2.08 | ||||||||||||
| AFFO | 48,348 | 1.71 | 64,283 | 2.25 | ||||||||||||
Definitions of the above-mentioned non-GAAP financial measures, together with reconciliations to net income in accordance with GAAP and other definitions of capitalized terms used herein, appear at the end of this release.
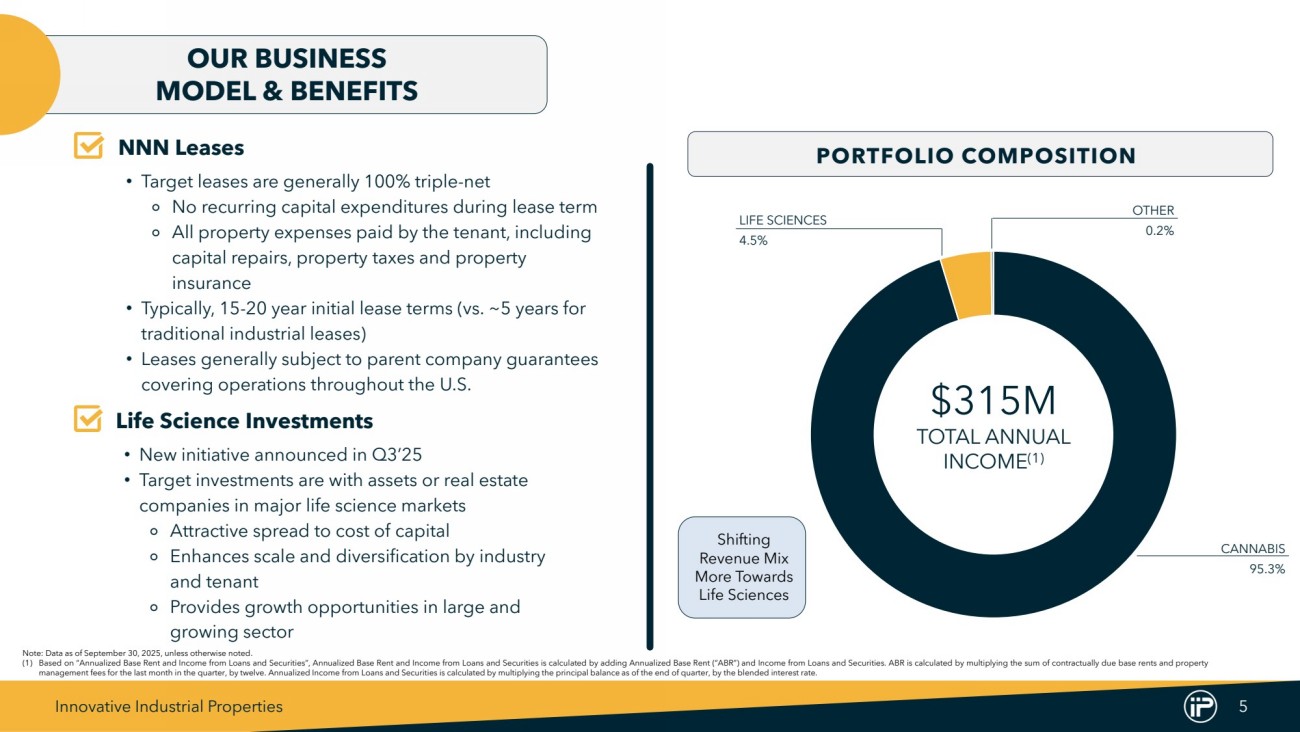
IQHQ Investment
| • | In August, the Company announced a strategic and diversifying $270 million commitment to invest in IQHQ, Inc. ("IQHQ"), a premier life science real estate platform with over $5 billion in total assets. The investment is comprised of two discrete financial investments that together are expected to earn a weighted average interest rate of greater than 14% per annum: |
| • | A $100 million commitment to a revolving credit facility ("RCF") with an initial term of three years, which can be extended for an additional 12 months upon payment of an extension fee. |
| • | A commitment to purchase up to $170 million of preferred stock ("Preferred Stock") of IQHQ. The Preferred Stock investment is expected to be funded in multiple tranches through the second quarter of 2027, subject to extensions at the option of IQHQ. |
| • | Warrants in IQHQ, subject to the satisfaction of certain funding milestones of the Preferred Stock. |
| • | In September, the Company closed on its initial investment into IQHQ, which totaled $105 million and was comprised of a $100 million investment into the RCF and a $5 million investment into the Preferred Stock. The remaining $165 million commitment of Preferred Stock is expected to be funded in multiple tranches between the fourth quarter of 2025 and the second quarter of 2027. |
|
|
Portfolio Update - Lease Defaults
| • | In March 2025, the Company launched a strategic initiative aimed at improving long-term financial performance by replacing certain underperforming tenants with more financially stable, long-term operators. As part of this effort, it declared several tenants, including 4Front Ventures, Gold Flora, and TILT Holdings, in default for nonpayment of rent and is pursuing its legal rights, which may include evictions. Additionally, the Company commenced litigation against PharmaCann for its lease defaults and continues to actively seek possession of the properties located in New York, Illinois, Pennsylvania, and Ohio. The Company took back one of the PharmaCann retail properties in Colorado in September, and PharmaCann continues to pay full rent under the remaining four retail leases in Colorado. As previously disclosed, the Company has re-leased one property located in Warren, Michigan to Berry Green and, in August, the lease for the cultivation property in Massachusetts with PharmaCann was terminated and the Company took back possession of the property. The Company is actively working to recover amounts due from these tenants and to re-lease vacated properties. |
| • | The Company previously declared a default under a secured promissory note in the aggregate principal amount of $16.1 million (the "MIH Note"). The MIH Note was issued to the Company by the purchaser of four properties in California, and the MIH Note was secured by such four properties. In September 2025, due to the borrower's continued default and voluntary surrender, the Company took back possession and ownership of the four properties through a deed in lieu of foreclosure. |
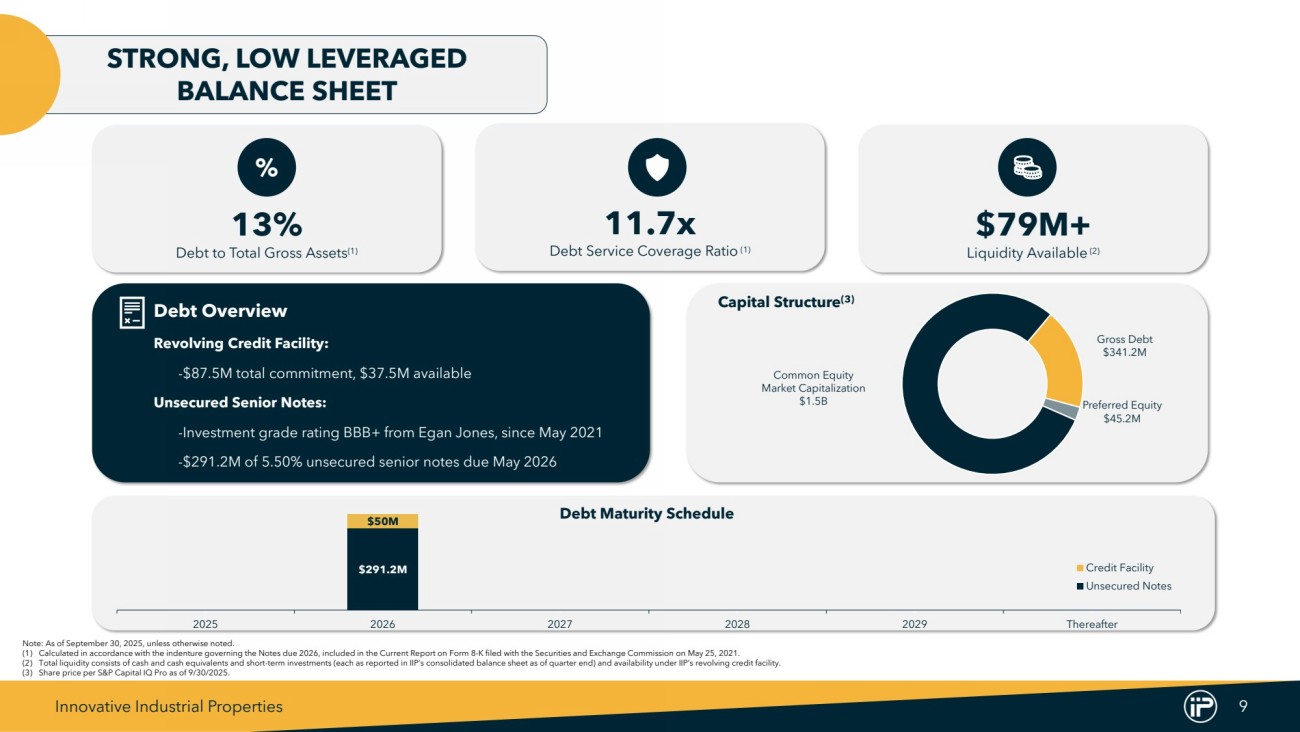
Balance Sheet Highlights (at September 30, 2025)
| • | 13% debt to total gross assets, with $2.7 billion in total gross assets. |
| • | Total liquidity was $79.4 million, consisting of cash and cash equivalents and short-term investments (each as reported in IIP’s consolidated balance sheet as of September 30, 2025) and availability under IIP’s revolving credit facility. |
• Debt service coverage ratio of 11.7x (calculated in accordance with IIP’s 5.50% Unsecured Senior Notes due 2026).
Financing Activity
| • | Issued 246,028 shares of Series A Preferred Stock under IIP’s “at-the-market” equity offering program for $5.9 million in net proceeds. |
| • | In October, closed on a new three-year, $100 million secured revolving credit facility (the “Secured Revolving Credit Facility”) with a federally regulated commercial bank. Borrowings under the Secured Revolving Credit Facility bear interest at one-month SOFR + 200 basis points (6.2% based on rates as of September 30, 2025) and is secured by the Company’s IQHQ investment. The Secured Revolving Credit Facility also includes a $35 million “accordion feature” that permits the Company to expand the borrowing capacity to a total of $135 million, subject to the addition of other lenders. |
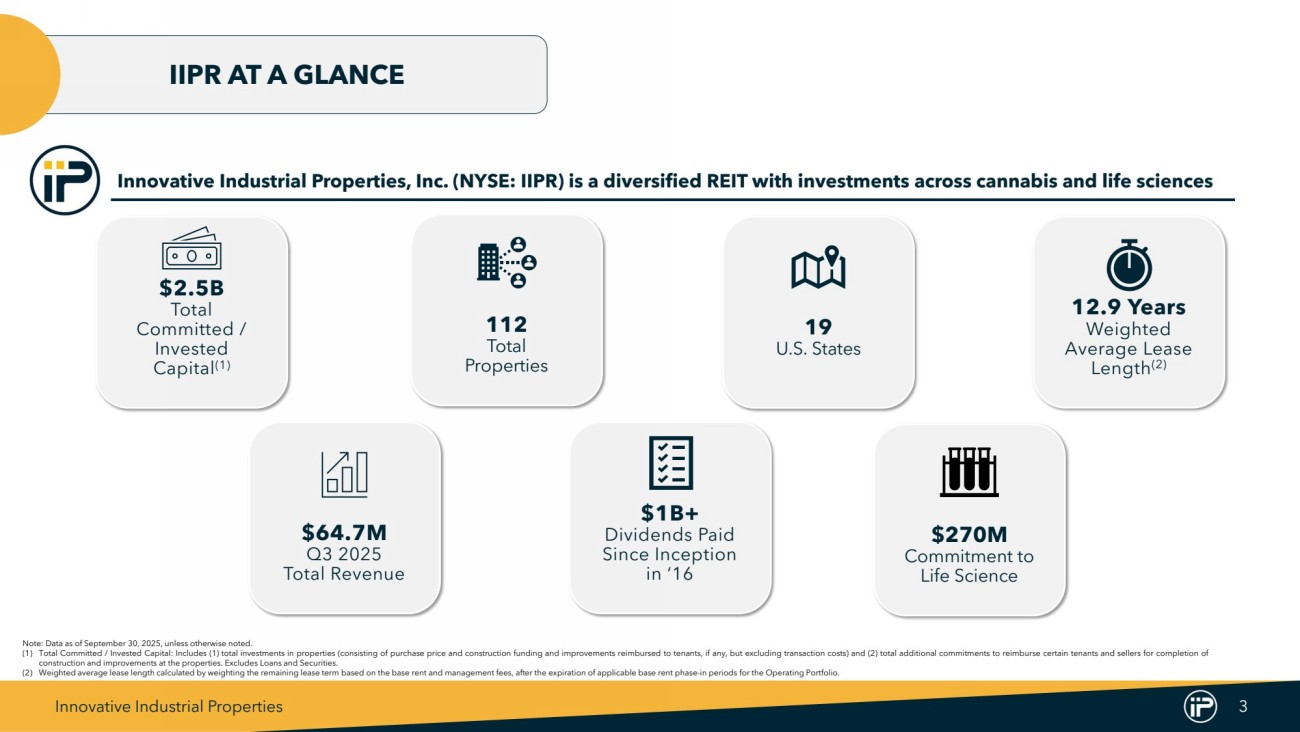
Property Portfolio Statistics (as of September 30, 2025)
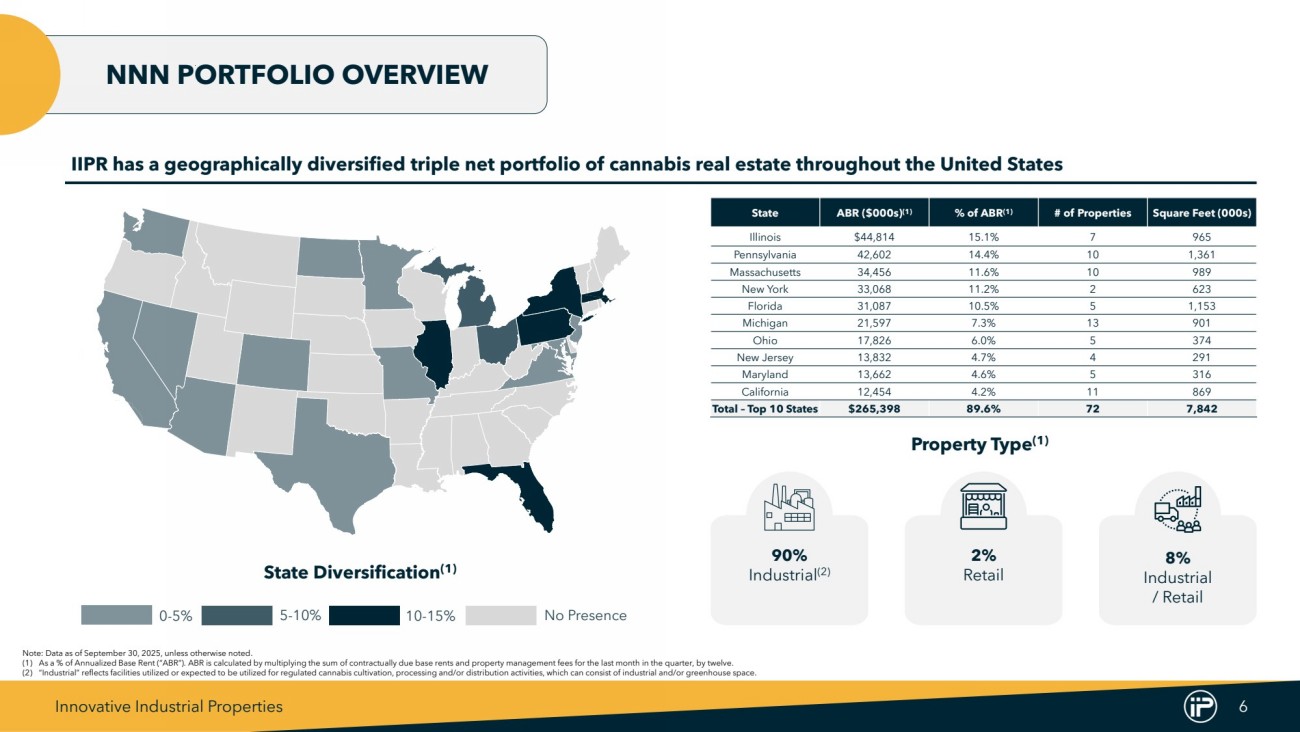
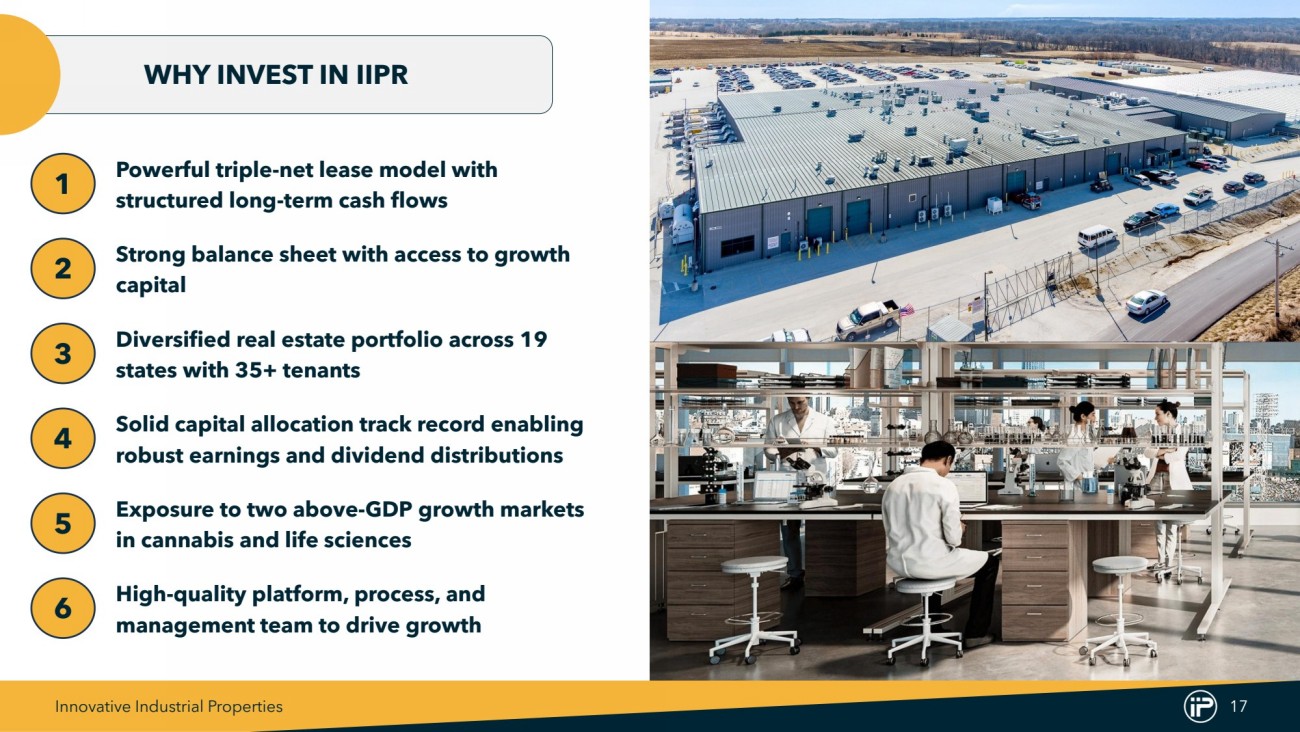
| • | Total property portfolio comprises 112 properties across 19 states, with 9.0 million rentable square feet "RSF" (including 483,000 RSF under development / redevelopment), consisting of: |
| • | Operating portfolio: 109 properties, representing 8.5 million RSF. |
| • | Under development / redevelopment portfolio consists of three properties expected to comprise 491,000 RSF at completion and is as follows: |
| • | 236,000 square feet located at 63795 19th Avenue in Palm Springs, California (pre-leased) |
| • | 192,000 square feet located at Inland Center Drive in San Bernardino, California |
| • | 12-acre development site located at Leah Avenue in San Marcos, Texas |
Financial Results
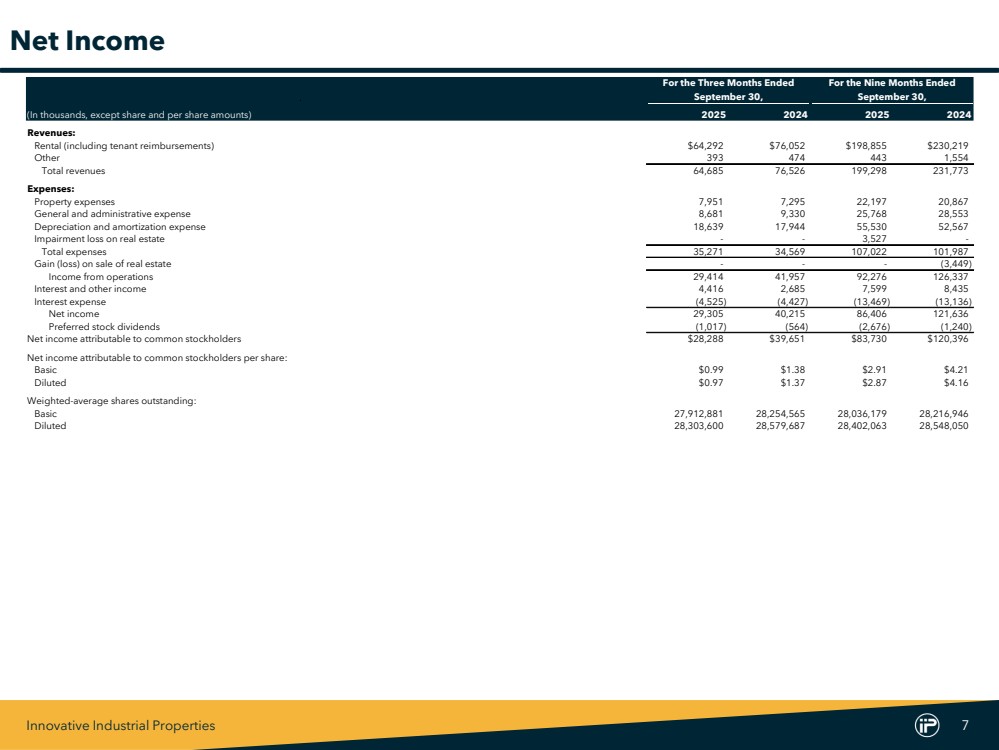
For the three months ended September 30, 2025, IIP generated total revenues of $64.7 million, compared to $76.5 million for the same period in 2024, a decrease of 15%. The decrease was primarily driven by a $14.9 million decrease due to tenant defaults for properties leased to PharmaCann, Gold Flora, TILT and 4Front. In addition, there was a decrease of $0.5 million related to properties that have been taken back or sold, and a decrease of $0.9 million in tenant reimbursement revenue primarily due to tenant defaults. These decreases were partially offset by a $1.4 million increase from the two properties acquired in 2024 and one property acquired in 2025, a $1.6 million increase from new leases on four existing properties, and a $1.6 million increase from annual contractual rent escalations.
|
|
For the three months ended September 30, 2025, IIP applied $0.8 million of security deposits for the payment of rent on two properties leased to Verdant and a Sacramento-based tenant. For the three months ended September 30, 2024, IIP applied $1.4 million of security deposits for payment of rent on six properties leased to 4Front, TILT and Emerald Growth.
For the three months ended September 30, 2025, interest and other income increased by $1.7 million to $4.4 million, compared to $2.7 million for the three months ended September 30, 2024. The increase was primarily driven by the recognition of $2.7 million of consideration previously received on the MIH Note, which was initially recorded as a deposit liability and included in other liabilities on our consolidated balance sheet as the transaction did not qualify for recognition as a completed sale under GAAP. In September 2025, IIP recognized $2.7 million of considerations received to date as interest and other income on our consolidated statements of income in connection with the termination of the MIH note.
Dividend
On September 15, 2025, the Board of Directors declared a third quarter 2025 dividend of $1.90 per common share, representing an annualized dividend of $7.60 per common share. The dividend was paid on October 15, 2025 to stockholders of record as of September 30, 2025.
Supplemental Information
Supplemental financial information is available in the Investor Relations section of IIP’s website at www.innovativeindustrialproperties.com.
Teleconference and Webcast
Innovative Industrial Properties, Inc. will conduct a conference call and webcast at 9:00 a.m. Pacific Time (12:00 p.m. Eastern Time) on Tuesday, November 4, 2025 to discuss IIP’s financial results and operations for the third quarter ended September 30, 2025. The call will be open to all interested investors through a live audio webcast at the Investor Relations section of IIP’s website at www.innovativeindustrialproperties.com, or live by calling 1-877-328-5514 (domestic) or 1-412-902-6764 (international) and asking to be joined to the Innovative Industrial Properties, Inc. conference call. The complete webcast will be archived for 90 days on IIP’s website. A telephone playback of the conference call will also be available from 12:00 p.m. Pacific Time on Tuesday, November 4, 2025 until 12:00 p.m. Pacific Time on Tuesday, November 11, 2025, by calling 1-877-344-7529 (domestic), 855-669-9658 (Canada) or 1-412-317-0088 (international) and using access code 9148523.
About Innovative Industrial Properties
Innovative Industrial Properties, Inc. is a real estate investment trust (REIT) focused on the acquisition, ownership and management of specialized industrial properties and life science real estate. Additional information is available at www.innovativeindustrialproperties.com.
This press release contains statements that IIP believes to be “forward-looking statements” within the meaning of the safe harbor provisions of the Private Securities Litigation Reform Act of 1995. All statements other than historical facts are forward-looking statements. When used in this press release, words such as IIP “expects,” “intends,” “plans,” “estimates,” “anticipates,” “believes” or “should” or the negative thereof or similar terminology are generally intended to identify forward-looking statements. Such forward-looking statements are subject to risks and uncertainties that could cause actual results to differ materially from those expressed in, or implied by, such statements. You should not rely on forward-looking statements since they involve known and unknown risks, uncertainties and other factors that are, in some cases, beyond the Company's control and which could materially affect actual results, performances or achievements. Factors that may cause actual results to differ materially from current expectations include, but are not limited to, the risk factors discussed in the Company's most recent Annual Report on Form 10-K for the year ended December 31, 2024, as updated by the Company’s subsequent reports filed with the Securities and Exchange Commission. Accordingly, there is no assurance that the Company's expectations will be realized. IIP disclaims any obligation to update or revise any forward-looking statements, whether as a result of new information, future events or otherwise, except as required by federal securities laws.
|
|
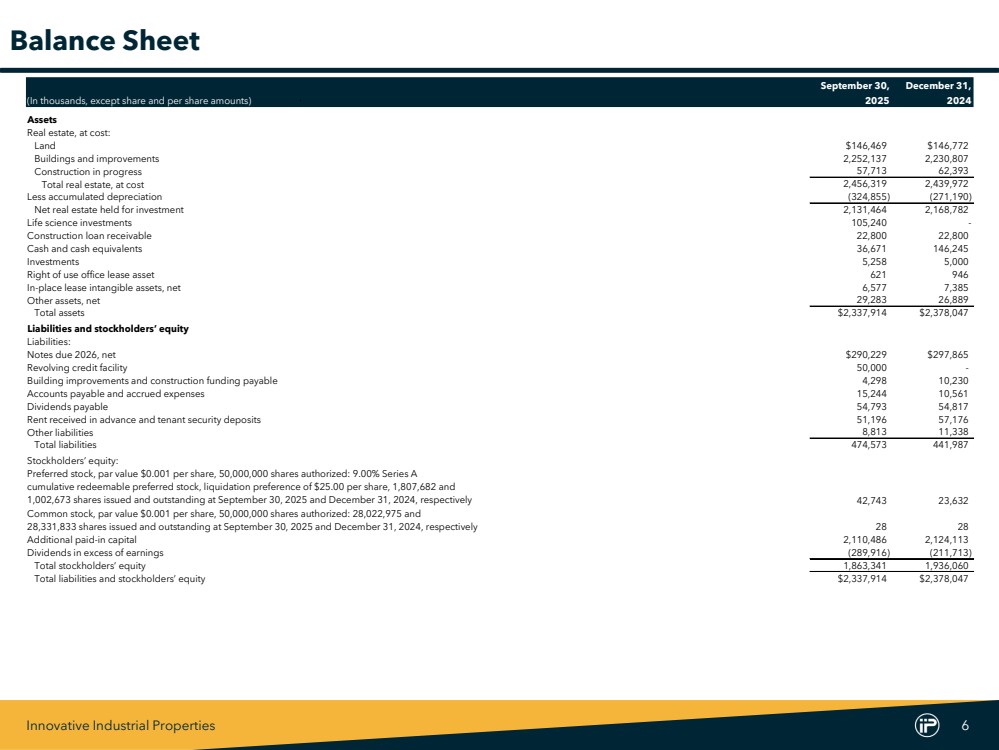
INNOVATIVE INDUSTRIAL PROPERTIES, INC.
CONSOLIDATED BALANCE SHEETS
(Unaudited)
(In thousands, except share and per share amounts)
| September 30, | December 31, | |||||||
| Assets | 2025 | 2024 | ||||||
| Real estate, at cost: | ||||||||
| Land | $ | 146,469 | $ | 146,772 | ||||
| Buildings and improvements | 2,252,137 | 2,230,807 | ||||||
| Construction in progress | 57,713 | 62,393 | ||||||
| Total real estate, at cost | 2,456,319 | 2,439,972 | ||||||
| Less accumulated depreciation | (324,855 | ) | (271,190 | ) | ||||
| Net real estate held for investment | 2,131,464 | 2,168,782 | ||||||
| Life science investments | 105,240 | — | ||||||
| Construction loan receivable | 22,800 | 22,800 | ||||||
| Cash and cash equivalents | 36,671 | 146,245 | ||||||
| Investments | 5,258 | 5,000 | ||||||
| Right of use office lease asset | 621 | 946 | ||||||
| In-place lease intangible assets, net | 6,577 | 7,385 | ||||||
| Other assets, net | 29,283 | 26,889 | ||||||
| Total assets | $ | 2,337,914 | $ | 2,378,047 | ||||
| Liabilities and stockholders’ equity | ||||||||
| Liabilities: | ||||||||
| Notes due 2026, net | $ | 290,229 | $ | 297,865 | ||||
| Revolving credit facility | 50,000 | — | ||||||
| Building improvements and construction funding payable | 4,298 | 10,230 | ||||||
| Accounts payable and accrued expenses | 15,244 | 10,561 | ||||||
| Dividends payable | 54,793 | 54,817 | ||||||
| Rent received in advance and tenant security deposits | 51,196 | 57,176 | ||||||
| Other liabilities | 8,813 | 11,338 | ||||||
| Total liabilities | 474,573 | 441,987 | ||||||
| Commitments and contingencies | ||||||||
| Stockholders’ equity: | ||||||||
| Preferred stock, par value $0.001 per share, 50,000,000 shares authorized: 9.00% Series A cumulative redeemable preferred stock, liquidation preference of $25.00 per share, 1,807,682 and 1,002,673 shares issued and outstanding at September 30, 2025 and December 31, 2024, respectively | 42,743 | 23,632 | ||||||
| Common stock, par value $0.001 per share, 50,000,000 shares authorized: 28,022,975 and 28,331,833 shares issued and outstanding at September 30, 2025 and December 31, 2024, respectively | 28 | 28 | ||||||
| Additional paid-in capital | 2,110,486 | 2,124,113 | ||||||
| Dividends in excess of earnings | (289,916 | ) | (211,713 | ) | ||||
| Total stockholders’ equity | 1,863,341 | 1,936,060 | ||||||
| Total liabilities and stockholders’ equity | $ | 2,337,914 | $ | 2,378,047 | ||||
|
|
INNOVATIVE INDUSTRIAL PROPERTIES, INC.
CONSOLIDATED STATEMENTS OF INCOME
For the Three and Nine Months Ended September 30, 2025 and 2024
(Unaudited)
(In thousands, except share and per share amounts)
| For the Three Months Ended September 30, |
For the Nine Months Ended September 30, |
|||||||||||||||
| 2025 | 2024 | 2025 | 2024 | |||||||||||||
| Revenues: | ||||||||||||||||
| Rental (including tenant reimbursements) | $ | 64,292 | $ | 76,052 | $ | 198,855 | $ | 230,219 | ||||||||
| Other | 393 | 474 | 443 | 1,554 | ||||||||||||
| Total revenues | 64,685 | 76,526 | 199,298 | 231,773 | ||||||||||||
| Expenses: | ||||||||||||||||
| Property expenses | 7,951 | 7,295 | 22,197 | 20,867 | ||||||||||||
| General and administrative expense | 8,681 | 9,330 | 25,768 | 28,553 | ||||||||||||
| Depreciation and amortization expense | 18,639 | 17,944 | 55,530 | 52,567 | ||||||||||||
| Impairment loss on real estate | — | — | 3,527 | — | ||||||||||||
| Total expenses | 35,271 | 34,569 | 107,022 | 101,987 | ||||||||||||
| Gain (loss) on sale of real estate | — | — | — | (3,449 | ) | |||||||||||
| Income from operations | 29,414 | 41,957 | 92,276 | 126,337 | ||||||||||||
| Interest and other income | 4,416 | 2,685 | 7,599 | 8,435 | ||||||||||||
| Interest expense | (4,525 | ) | (4,427 | ) | (13,469 | ) | (13,136 | ) | ||||||||
| Net income | 29,305 | 40,215 | 86,406 | 121,636 | ||||||||||||
| Preferred stock dividends | (1,017 | ) | (564 | ) | (2,676 | ) | (1,240 | ) | ||||||||
| Net income attributable to common stockholders | $ | 28,288 | $ | 39,651 | $ | 83,730 | $ | 120,396 | ||||||||
| Net income attributable to common stockholders per share: | ||||||||||||||||
| Basic | $ | 0.99 | $ | 1.38 | $ | 2.91 | $ | 4.21 | ||||||||
| Diluted | $ | 0.97 | $ | 1.37 | $ | 2.87 | $ | 4.16 | ||||||||
| Weighted-average shares outstanding: | ||||||||||||||||
| Basic | 27,912,881 | 28,254,565 | 28,036,179 | 28,216,946 | ||||||||||||
| Diluted | 28,303,600 | 28,579,687 | 28,402,063 | 28,548,050 | ||||||||||||
|
|
INNOVATIVE INDUSTRIAL PROPERTIES, INC.
FFO, NORMALIZED FFO AND AFFO
For the Three and Nine Months Ended September 30, 2025 and 2024
(Unaudited)
(In thousands, except share and per share amounts)
| For the Three Months Ended September 30, |
For the Nine Months Ended September 30, |
|||||||||||||||
| 2025 | 2024 | 2025 | 2024 | |||||||||||||
| Net income attributable to common stockholders | $ | 28,288 | $ | 39,651 | $ | 83,730 | $ | 120,396 | ||||||||
| Real estate depreciation and amortization | 18,639 | 17,944 | 55,530 | 52,567 | ||||||||||||
| Impairment loss on real estate | — | — | 3,527 | — | ||||||||||||
| Disposition-contingent lease termination fee, net of loss on sale of real estate(1) | — | — | — | (451 | ) | |||||||||||
| FFO attributable to common stockholders (basic) | 46,927 | 57,595 | 142,787 | 172,512 | ||||||||||||
| Cash and non-cash interest expense on Exchangeable Senior Notes | — | — | — | 28 | ||||||||||||
| FFO attributable to common stockholders (diluted) | 46,927 | 57,595 | 142,787 | 172,540 | ||||||||||||
| Litigation-related expense | 604 | 210 | 1,423 | 520 | ||||||||||||
| Loss (gain) on partial repayment of Notes due 2026 | — | — | (32 | ) | — | |||||||||||
| Income on seller-financed notes(2) | (2,375 | ) | 268 | (1,058 | ) | 1,074 | ||||||||||
| Deferred lease payments received on sales-type leases(3) | — | 1,452 | 25 | 4,370 | ||||||||||||
| Normalized FFO attributable to common stockholders (diluted) | 45,156 | 59,525 | 143,145 | 178,504 | ||||||||||||
| Stock-based compensation | 2,684 | 4,316 | 7,434 | 13,002 | ||||||||||||
| Non-cash interest expense | 485 | 419 | 1,431 | 1,208 | ||||||||||||
| Above-market lease amortization | 23 | 23 | 69 | 69 | ||||||||||||
| AFFO attributable to common stockholders (diluted) | $ | 48,348 | $ | 64,283 | $ | 152,079 | $ | 192,783 | ||||||||
| FFO per common share – diluted | $ | 1.66 | $ | 2.02 | $ | 5.03 | $ | 6.04 | ||||||||
| Normalized FFO per common share – diluted | $ | 1.60 | $ | 2.08 | $ | 5.04 | $ | 6.25 | ||||||||
| AFFO per common share – diluted | $ | 1.71 | $ | 2.25 | $ | 5.35 | $ | 6.75 | ||||||||
| Weighted average common shares outstanding – basic | 27,912,881 | 28,254,565 | 28,036,179 | 28,216,946 | ||||||||||||
| Restricted stock and RSUs | 390,719 | 299,770 | 365,884 | 293,105 | ||||||||||||
| PSUs | — | 25,352 | — | 25,352 | ||||||||||||
| Dilutive effect of Exchangeable Senior Notes | — | — | — | 12,647 | ||||||||||||
| Weighted average common shares outstanding – diluted | 28,303,600 | 28,579,687 | 28,402,063 | 28,548,050 | ||||||||||||
| (1) | Amount reflects the $3.9 million disposition-contingent lease termination fee received concurrently with the sale of IIP’s property in Los Angeles, California, net of the loss on sale of the property of $3.4 million. |
| (2) | Amounts represent non-refundable cash payments received pursuant to two seller-financed notes issued by IIP in connection with IIP's disposition of certain properties. As the transactions did not qualify for recognition as completed sales under GAAP, the payments were initially recorded as a deposit liability and included in other liabilities on IIP consolidated balance sheet. For both the three and nine months ended September 30, 2025, the negative amounts resulted from the recognition of $2.6 million of non-refundable cash payments received on the MIH Note as interest and other income in connection with the termination of the seller-financed note. |
| (3) | Amount reflects the non-refundable lease payments received on two sales-type leases which are recognized as a deposit liability starting on January 1, 2024, and is included in other liabilities in IIP’s consolidated balance sheet as of September 30, 2025, as the transactions did not qualify for recognition as completed sales. Prior to the lease modifications on January 1, 2024, which extended the initial lease terms, the leases were classified as operating leases and the lease payments received were recognized as rental revenue and therefore, included in net income attributable to common stockholders. |
|
|
Non-GAAP Financial Measures
Funds From Operations (FFO)
FFO and FFO per share are operating performance measures adopted by the National Association of Real Estate Investment Trusts, Inc. (NAREIT). NAREIT defines FFO as the most commonly accepted and reported measure of a REIT’s operating performance equal to net income, computed in accordance with accounting principles generally accepted in the United States (GAAP), excluding gains (or losses) from sales of property, depreciation, amortization and impairment related to real estate properties, and after adjustments for unconsolidated partnerships and joint ventures. IIP also excludes from FFO any disposition-contingent lease termination fee received in connection with a property sale.
Management believes that net income, as defined by GAAP, is the most appropriate earnings measurement. However, management believes FFO and FFO per share to be supplemental measures of a REIT’s performance because they provide an understanding of the operating performance of IIP's properties without giving effect to certain significant non-cash items, primarily depreciation expense. Historical cost accounting for real estate assets in accordance with GAAP assumes that the value of real estate assets diminishes predictably over time. However, real estate values instead have historically risen or fallen with market conditions. IIP believes that by excluding the effect of depreciation, FFO and FFO per share can facilitate comparisons of operating performance between periods. IIP reports FFO and FFO per share because these measures are observed by management to also be the predominant measures used by the REIT industry and by industry analysts to evaluate REITs and because FFO per share is consistently reported, discussed, and compared by research analysts in their notes and publications about REITs. For these reasons, management has deemed it appropriate to disclose and discuss FFO and FFO per share.
Normalized Funds from Operations (Normalized FFO)
IIP computes Normalized FFO by adjusting FFO, as defined by NAREIT, to exclude certain GAAP income and expense amounts that management believes are infrequent and unusual in nature and/or not related to IIP's core real estate operations. Exclusion of these items from similar FFO-type metrics is common within the equity REIT industry, and management believes that presentation of Normalized FFO and Normalized FFO per share provides investors with a metric to assist in their evaluation of IIP's operating performance across multiple periods and in comparison to the operating performance of other companies, because it removes the effect of unusual items that are not expected to impact IIP's operating performance on an ongoing basis. Normalized FFO is used by management in evaluating the performance of IIP's core business operations.
During the three months ended September 30, 2025, IIP revised its presentation of Normalized FFO to include two adjustments related to income on seller-financed notes and deferred lease payments received on sales-type leases that were previously reflected in adjusted funds from operations (“AFFO”), which has been reflected for all periods presented. Management believes this change better aligns the Company’s presentation with its assessment of core operating performance and improves comparability with industry peers. Items included in calculating FFO that may be excluded in calculating Normalized FFO include certain transaction-related gains, losses, income or expense or other non-core amounts as they occur.
Adjusted Funds from Operations (AFFO)
Management believes that AFFO and AFFO per share are also appropriate supplemental measures of a REIT’s operating performance. IIP calculates AFFO by adjusting Normalized FFO for certain non-cash items.
For the nine months ended September 30, 2024, FFO (diluted), Normalized FFO and AFFO, and FFO, Normalized FFO and AFFO per diluted share include the dilutive impact of the assumed full exchange of the Exchangeable Senior Notes for shares of common stock as of the Exchangeable Senior Notes were exchanged at the beginning of the respective reporting period. The Exchangeable Senior Notes matured in February 2024.
For the three and nine months ended September 30, 2024, the performance share units (“PSUs”) granted to certain employees were included in dilutive securities to the extent the performance thresholds for vesting of the PSUs were met as measured as of September 30, 2024. The PSUs expired on December 31, 2024.
|
|
IIP’s computation of FFO, Normalized FFO and AFFO may differ from the methodology for calculating FFO, Normalized FFO and AFFO utilized by other equity REITs and, accordingly, may not be comparable to such REITs. Further, FFO, Normalized FFO and AFFO do not represent cash flow available for management’s discretionary use. FFO, Normalized FFO and AFFO should not be considered as an alternative to net income (computed in accordance with GAAP) as an indicator of IIP’s financial performance or to cash flow from operating activities (computed in accordance with GAAP) as an indicator of IIP’s liquidity, nor is it indicative of funds available to fund IIP’s cash needs, including IIP’s ability to pay dividends or make distributions. FFO, Normalized FFO and AFFO should be considered only as supplements to net income computed in accordance with GAAP as measures of IIP’s operations.
Company Contact:
David Smith
Chief Financial Officer
Innovative Industrial Properties, Inc.
(858) 997-3332
|
|
|
Innovative Industrial Properties Third Quarter 2025 Supplemental Financial Information |
|
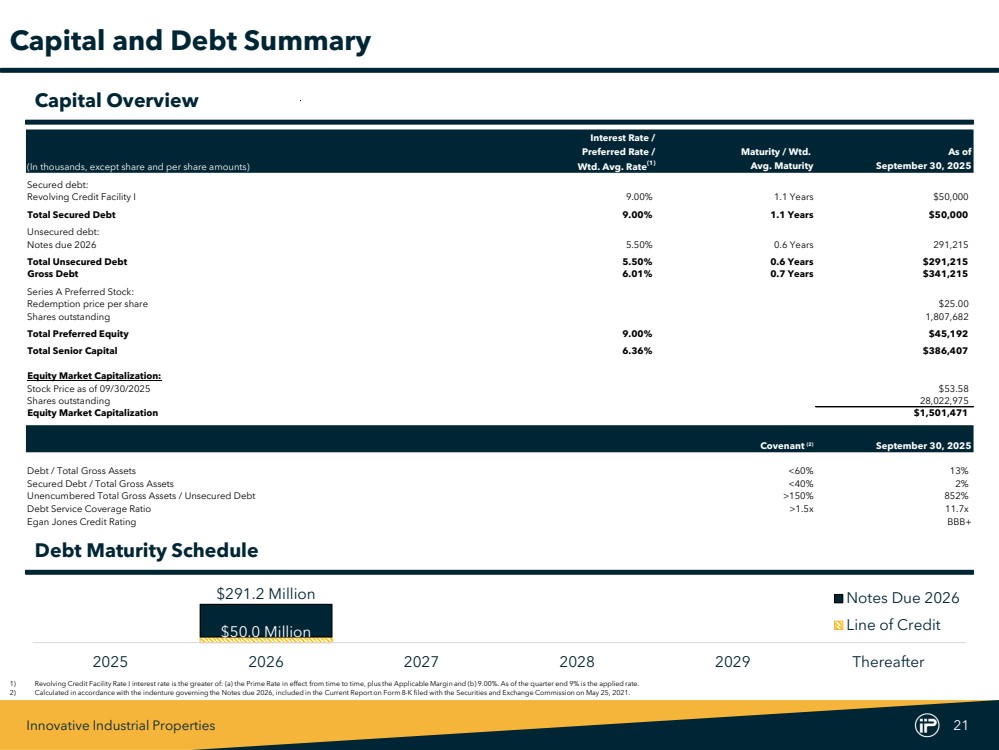
Innovative Industrial Properties 2 Overview Forward-Looking Statements 3 Company Overview 4 Financial Information Quarterly Performance Summary 5 Balance Sheet 6 Net Income 7 Statements of Cash Flows 8 FFO, Normalized FFO, and AFFO Reconciliation 9 Historical Net Income 10 Historical FFO, Normalized FFO, and AFFO Reconciliation 11 Portfolio Data Highlights 12 Geographic Concentration – Real Estate Portfolio 13 Annualized Base Rent and Income From Loans 14 Capital Commitments 15 Leasing Summary 16 Property List 17-19 Loans and Securities 20 Capitalization Capital and Debt Summary 21 Analyst Coverage 22 Definitions and Reconciliations 23-25 Table of Contents |
|
Innovative Industrial Properties 3 Forward-Looking Statements This Supplemental Financial Information Package includes "forward-looking statements" (within the meaning of the Private Securities Litigation Reform Act of 1995, Section 27A of the Securities Act of 1933, as amended, and Section 21E of the Securities Exchange Act of 1934, as amended) that are subject to risks and uncertainties. In particular, statements pertaining to our capital resources, portfolio performance and results of operations contain forward-looking statements. Likewise, our statements regarding anticipated growth in our funds from operations and anticipated market and regulatory conditions, our strategic direction, demographics, results of operations, plans and objectives are forward-looking statements. Forward-looking statements involve numerous risks and uncertainties, and you should not rely on them as predictions of future events. Forward-looking statements depend on assumptions, data or methods which may be incorrect or imprecise, and we may not be able to realize them. We do not guarantee that the transactions and events described will happen as described (or that they will happen at all). You can identify forward-looking statements by the use of forward-looking terminology such as “believes,” “expects,” “may,” “will,” “should,” “seeks,” “approximately,” “intends,” “plans,” “estimates” or “anticipates” or the negative of these words and phrases or similar words or phrases. You can also identify forward-looking statements by discussions of strategy, plans or intentions. The following factors, among others, could cause actual results and future events to differ materially from those set forth or contemplated in the forward-looking statements: rates of default on leases for our assets; our ability to re-lease properties upon tenant defaults or lease terminations for the rent we currently receive, or at all; concentration of our portfolio of assets and limited number of tenants; the estimated growth in and evolving market dynamics of the regulated cannabis market; anticipated funding sources for our investment in the preferred stock of IQHQ, Inc. ("IQHQ"); defaults on our investments in real estate-related assets, such as the IQHQ credit facility and IQHQ preferred stock; our ability to identify, acquire, or profitably operate life science properties; market dynamics in the life science sector; the demand for regulated cannabis cultivation and processing facilities; decreased economic activity due to fluctuations in trade policies, tariffs, and related government actions; inflation dynamics; the impact of pandemics on us, our business, our tenants, or the economy generally; war and other hostilities, including the conflicts in Ukraine and Israel; our business and investment strategy; our projected operating results; actions and initiatives of the U.S. or state governments and changes to government policies and the execution and impact of these actions, initiatives and policies, including the fact that cannabis remains illegal under federal law; availability of suitable investment opportunities in the regulated cannabis industry; our understanding of our competition and our potential tenants’ alternative financing sources; the expected medical-use or adult-use cannabis legalization in certain states; shifts in public opinion regarding regulated cannabis; the potential impact on us from litigation matters, including rising liability and insurance costs; the additional risks that may be associated with certain of our tenants cultivating, processing and/or dispensing adult-use cannabis in our facilities; the state of the U.S. economy generally or in specific geographic areas; economic trends and economic recoveries; our ability to access equity or debt capital; financing rates for our target assets; our level of indebtedness, which could reduce funds available for other business purposes and reduce our operational flexibility; covenants in our debt instruments, which may limit our flexibility and adversely affect our financial condition; our ability to maintain our investment grade credit rating; changes in the values of our assets; our expected portfolio of assets; our expected investments; interest rate mismatches between our assets and our borrowings used to fund such investments; changes in interest rates and the market value of our assets; the degree to which any interest rate or other hedging strategies may or may not protect us from interest rate volatility; the impact of and changes in governmental regulations, tax law and rates, accounting guidance and similar matters; how and when any forward equity sales may settle; our ability to maintain our qualification as a real estate investment trust (“REIT”) for U.S. federal income tax purposes; our ability to maintain our exemption from registration under the Investment Company Act of 1940; availability of qualified personnel; and market trends in our industry, interest rates, real estate values, the securities markets or the general economy. The risks included here are not exhaustive, and additional factors could adversely affect our business and financial performance. In addition, we discussed a number of material risks in our most recent Annual Report on Form 10-K and subsequent Quarterly Reports on Form 10-Q. Those risks continue to be relevant to our performance and financial condition. Moreover, we operate in a very competitive and rapidly changing environment. New risk factors emerge from time to time and it is not possible for management to predict all such risk factors, nor can it assess the impact of all such risk factors on our business or the extent to which any factor, or combination of factors, may cause actual results to differ materially from those contained in any forward-looking statements. Any forward-looking statement made by us speaks only of the date on which we make it. We undertake no obligation to publicly update or revise any forward-looking statements, whether as a result of new information, future events or otherwise, except as may be required by law. Stockholders and investors are cautioned not to unduly rely on such forward-looking statements when evaluating the information presented in our filings and reports. This supplemental financial information package includes certain non-GAAP financial measures. These non-GAAP measures are presented for supplemental information and should not be considered a substitute for financial information presented in accordance with GAAP. The definition of these non-GAAP measures is set forth under the section entitled "Definitions." Reconciliations of these non-GAAP measures to the most directly comparable GAAP measures are set forth in sections entitled “FFO, Normalized FFO, and AFFO Reconciliation” and “Reconciliations – EBITDA and Adjusted EBITDA.” Market and industry data are included in this presentation. We have obtained substantially all of this information from internal studies, public filings, other independent published industry sources and market studies prepared by third parties. We believe these internal studies, public filings, other independent published industry sources and market studies prepared by third parties are reliable. However, this information may prove to be inaccurate. No representation or warranty is made as to the accuracy of such information. All amounts shown in this report are unaudited. This Supplemental Financial Information Package is not an offer to sell or solicitation to buy securities of Innovative Industrial Properties, Inc. Any offers to sell or solicitations to buy securities of Innovative Industrial Properties, Inc. shall be made only by means of a prospectus approved for that purpose. |
|
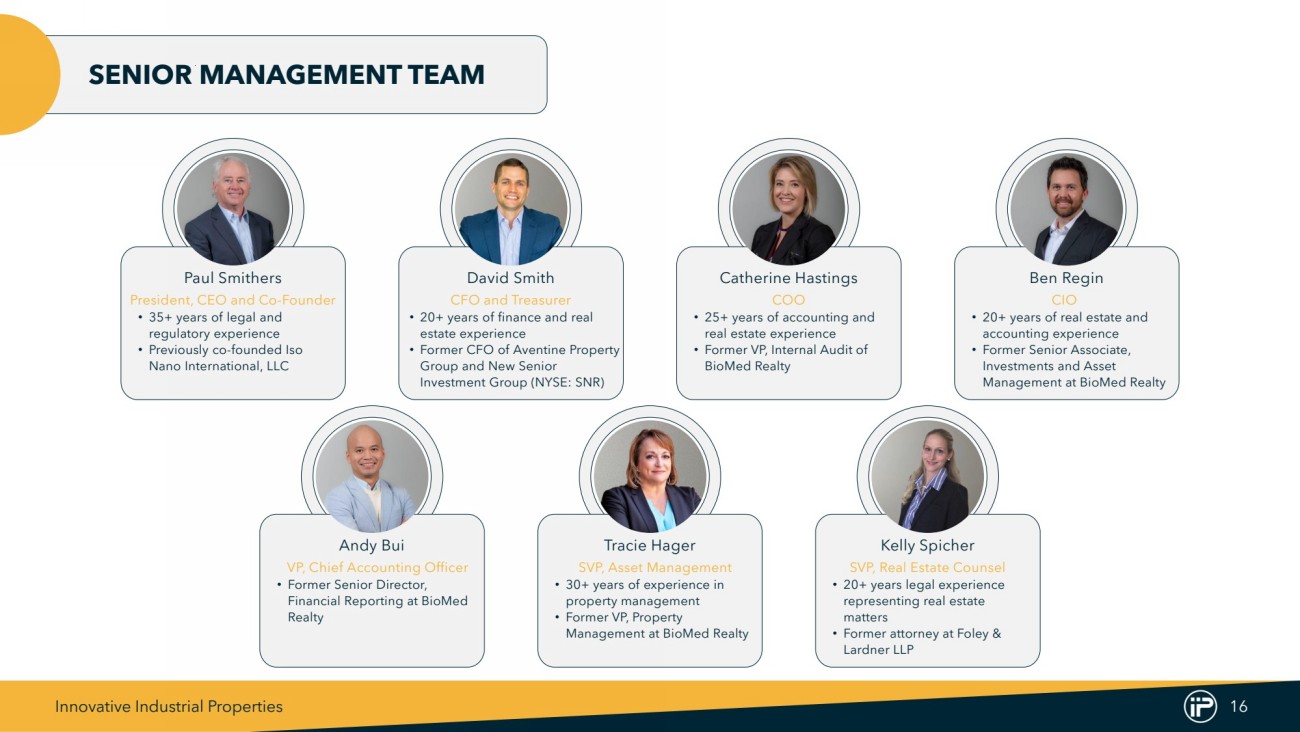
Innovative Industrial Properties 4 Senior Management Company Overview Innovative Industrial Properties, Inc. (NYSE: IIPR) is an internally managed real estate investment trust (REIT) focused on the acquisition, ownership and management of specialized industrial properties and financial investments in the life science industry. As of September 30, 2025, we owned 112 properties comprising an aggregate of approximately 9.0 million rentable square feet in 19 states. For additional information, please visit www.innovativeindustrialproperties.com. Board of Directors Contact Information Alan Gold Executive Chairman Paul Smithers President, Chief Executive Officer & Director David Smith Chief Financial Officer & Treasurer Catherine Hastings Chief Operating Officer Ben Regin Chief Investment Officer Tracie Hager Senior Vice President, Asset Management Kelly Spicher Senior Vice President, Real Estate Counsel Andy Bui Vice President, Chief Accounting Officer Alan Gold Director, Executive Chairman Paul Smithers Director, President & Chief Executive Officer Gary Kreitzer* Vice Chairman, Nominating and Corporate Governance Committee Chair Scott Shoemaker, MD* Director, Compensation Committee Chair David Boyle* Director, Audit Committee Chair Note: * Denotes independent director Corporate Headquarters – Innovative Industrial Properties, Inc. 11440 West Bernardo Court, STE 100 San Diego, California 92127 858-997-3332 Public Markets Detail Ticker: IIPR Exchange: NYSE Website www.innovativeindustrialproperties.com LinkedIn www.linkedin.com/company/innovative-industrial-properties Investor Relations Contact Eli Kanter Senior Associate, Finance eli.kanter@iipreit.com |
|
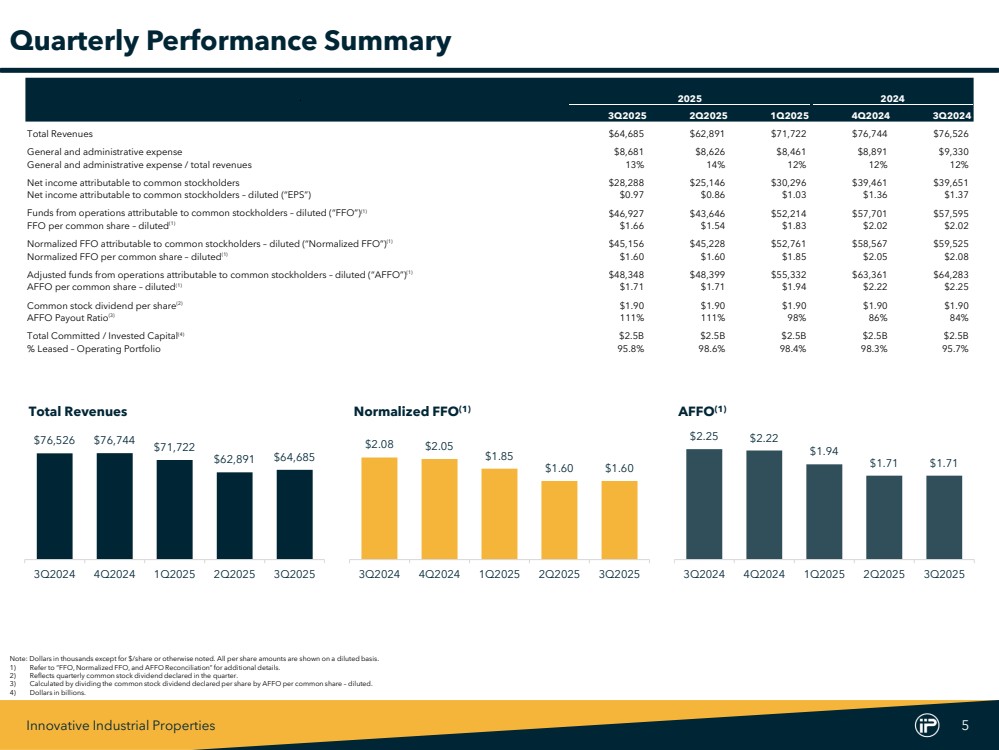
Innovative Industrial Properties 5 Delta 2025 2024 QoQ 3Q2025 2Q2025 1Q2025 4Q2024 3Q2024 Total Revenues $64,685 $62,891 $71,722 $76,744 $76,526 General and administrative expense $8,681 $8,626 $8,461 $8,891 $9,330 General and administrative expense / total revenues 13% 14% 12% 12% 12% Net income attributable to common stockholders $28,288 $25,146 $30,296 $39,461 $39,651 Net income attributable to common stockholders – diluted (“EPS”) $0.97 $0.86 $1.03 $1.36 $1.37 Funds from operations attributable to common stockholders – diluted (“FFO”) (1) $46,927 $43,646 $52,214 $57,701 $57,595 FFO per common share – diluted(1) $1.66 $1.54 $1.83 $2.02 $2.02 Normalized FFO attributable to common stockholders – diluted (“Normalized FFO”) (1) $45,156 $45,228 $52,761 $58,567 $59,525 Normalized FFO per common share – diluted(1) $1.60 $1.60 $1.85 $2.05 $2.08 Adjusted funds from operations attributable to common stockholders – diluted (“AFFO”) (1) $48,348 $48,399 $55,332 $63,361 $64,283 AFFO per common share – diluted(1) $1.71 $1.71 $1.94 $2.22 $2.25 Common stock dividend per share(2) $1.90 $1.90 $1.90 $1.90 $1.90 AFFO Payout Ratio(3) 111% 111% 98% 86% 84% Total Committed / Invested Capital(4) $2.5B $2.5B $2.5B $2.5B $2.5B % Leased – Operating Portfolio 95.8% 98.6% 98.4% 98.3% 95.7% Quarterly Performance Summary Note: Dollars in thousands except for $/share or otherwise noted. All per share amounts are shown on a diluted basis. 1) Refer to “FFO, NormalizedFFO, and AFFO Reconciliation”for additional details. 2) Reflects quarterly common stock dividend declared in the quarter. 3) Calculated by dividing the common stock dividend declared per share by AFFO per common share – diluted. 4) Dollars in billions. $2.25 $2.22 $1.94 $1.71 $1.71 3Q2024 4Q2024 1Q2025 2Q2025 3Q2025 AFFO(1) $2.08 $2.05 $1.85 $1.60 $1.60 3Q2024 4Q2024 1Q2025 2Q2025 3Q2025 Normalized FFO(1) $76,526 $76,744 $71,722 $62,891 $64,685 3Q2024 4Q2024 1Q2025 2Q2025 3Q2025 Total Revenues |
|
Innovative Industrial Properties 6 September 30, December 31, (In thousands, except share and per share amounts) 2025 2024 Assets Real estate, at cost: Land $146,469 $146,772 Buildings and improvements 2,252,137 2,230,807 Construction in progress 57,713 62,393 Total real estate, at cost 2,456,319 2,439,972 Less accumulated depreciation (324,855) (271,190) Net real estate held for investment 2,131,464 2,168,782 Life science investments 105,240 - Construction loan receivable 22,800 22,800 Cash and cash equivalents 36,671 146,245 Investments 5,258 5,000 Right of use office lease asset 621 946 In-place lease intangible assets, net 6,577 7,385 Other assets, net 29,283 26,889 Total assets $2,337,914 $2,378,047 Liabilities and stockholders’ equity Liabilities: Notes due 2026, net $290,229 $297,865 Revolving credit facility 50,000 - Building improvements and construction funding payable 4,298 10,230 Accounts payable and accrued expenses 15,244 10,561 Dividends payable 54,793 54,817 Rent received in advance and tenant security deposits 51,196 57,176 Other liabilities 8,813 11,338 Total liabilities 474,573 441,987 Stockholders’ equity: Preferred stock, par value $0.001 per share, 50,000,000 shares authorized: 9.00% Series A cumulative redeemable preferred stock, liquidation preference of $25.00 per share, 1,807,682 and 1,002,673 shares issued and outstanding at September 30, 2025 and December 31, 2024, respectively 42,743 23,632 Common stock, par value $0.001 per share, 50,000,000 shares authorized: 28,022,975 and 28,331,833 shares issued and outstanding at September 30, 2025 and December 31, 2024, respectively 28 28 Additional paid-in capital 2,110,486 2,124,113 Dividends in excess of earnings (289,916) (211,713) Total stockholders’ equity 1,863,341 1,936,060 Total liabilities and stockholders’ equity $2,337,914 $2,378,047 Balance Sheet |
|
Innovative Industrial Properties 7 For the Three Months Ended For the Nine Months Ended September 30, September 30, (In thousands, except share and per share amounts) 2025 2024 2025 2024 Revenues: Rental (including tenant reimbursements) $64,292 $76,052 $198,855 $230,219 Other 393 474 443 1,554 Total revenues 64,685 76,526 199,298 231,773 Expenses: Property expenses 7,951 7,295 22,197 20,867 General and administrative expense 8,681 9,330 25,768 28,553 Depreciation and amortization expense 18,639 17,944 55,530 52,567 Impairment loss on real estate - - 3,527 - Total expenses 35,271 34,569 107,022 101,987 Gain (loss) on sale of real estate - - - (3,449) Income from operations 29,414 41,957 92,276 126,337 Interest and other income 4,416 2,685 7,599 8,435 Interest expense (4,525) (4,427) (13,469) (13,136) Net income 29,305 40,215 86,406 121,636 Preferred stock dividends (1,017) (564) (2,676) (1,240) Net income attributable to common stockholders $28,288 $39,651 $83,730 $120,396 Net income attributable to common stockholders per share: Basic $0.99 $1.38 $2.91 $4.21 Diluted $0.97 $1.37 $2.87 $4.16 Weighted-average shares outstanding: Basic 27,912,881 28,254,565 28,036,179 28,216,946 Diluted 28,303,600 28,579,687 28,402,063 28,548,050 Net Income |
|
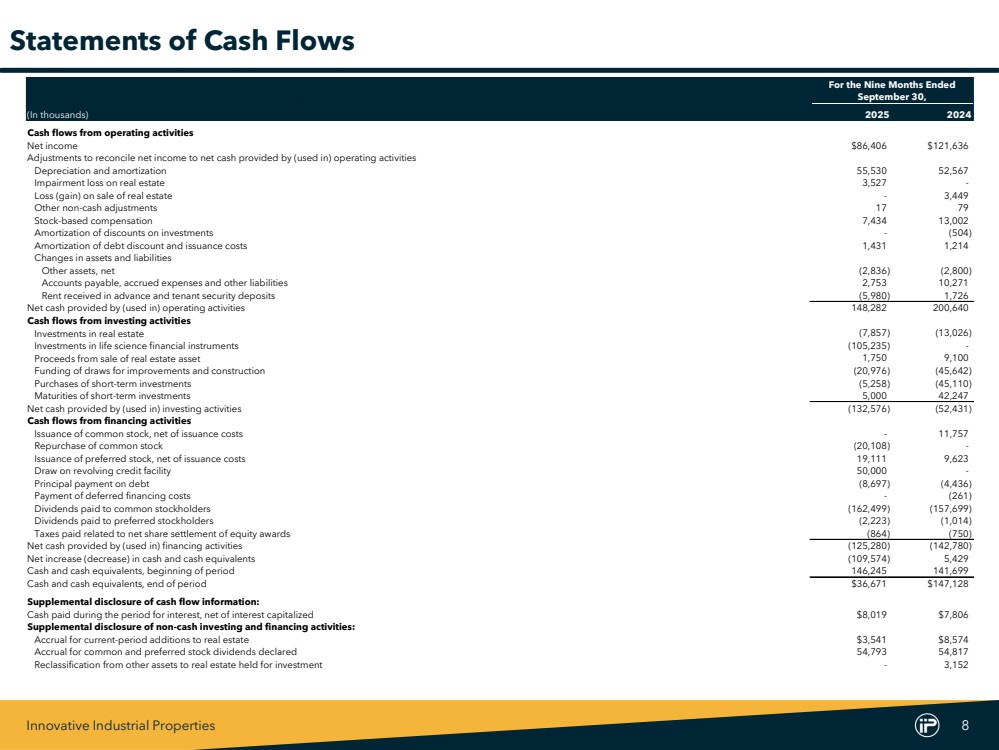
Innovative Industrial Properties 8 For the Nine Months Ended September 30, (In thousands) 2025 2024 Cash flows from operating activities Net income $86,406 $121,636 Adjustments to reconcile net income to net cash provided by (used in) operating activities Depreciation and amortization 55,530 52,567 Impairment loss on real estate 3,527 - Loss (gain) on sale of real estate - 3,449 Other non-cash adjustments 17 79 Stock-based compensation 7,434 13,002 Amortization of discounts on investments - (504) Amortization of debt discount and issuance costs 1,431 1,214 Changes in assets and liabilities Other assets, net (2,836) (2,800) Accounts payable, accrued expenses and other liabilities 2,753 10,271 Rent received in advance and tenant security deposits (5,980) 1,726 Net cash provided by (used in) operating activities 148,282 200,640 Cash flows from investing activities Investments in real estate (7,857) (13,026) Investments in life science financial instruments (105,235) - Proceeds from sale of real estate asset 1,750 9,100 Funding of draws for improvements and construction (20,976) (45,642) Purchases of short-term investments (5,258) (45,110) Maturities of short-term investments 5,000 42,247 Net cash provided by (used in) investing activities (132,576) (52,431) Cash flows from financing activities Issuance of common stock, net of issuance costs - 11,757 Repurchase of common stock (20,108) - Issuance of preferred stock, net of issuance costs 19,111 9,623 Draw on revolving credit facility 50,000 - Principal payment on debt (8,697) (4,436) Payment of deferred financing costs - (261) Dividends paid to common stockholders (162,499) (157,699) Dividends paid to preferred stockholders (2,223) (1,014) Taxes paid related to net share settlement of equity awards (864) (750) Net cash provided by (used in) financing activities (125,280) (142,780) Net increase (decrease) in cash and cash equivalents (109,574) 5,429 Cash and cash equivalents, beginning of period 146,245 141,699 Cash and cash equivalents, end of period $36,671 $147,128 Supplemental disclosure of cash flow information: Cash paid during the period for interest, net of interest capitalized $8,019 $7,806 Supplemental disclosure of non-cash investing and financing activities: Accrual for current-period additions to real estate $3,541 $8,574 Accrual for common and preferred stock dividends declared 54,793 54,817 Reclassification from other assets to real estate held for investment - 3,152 Statements of Cash Flows |
|
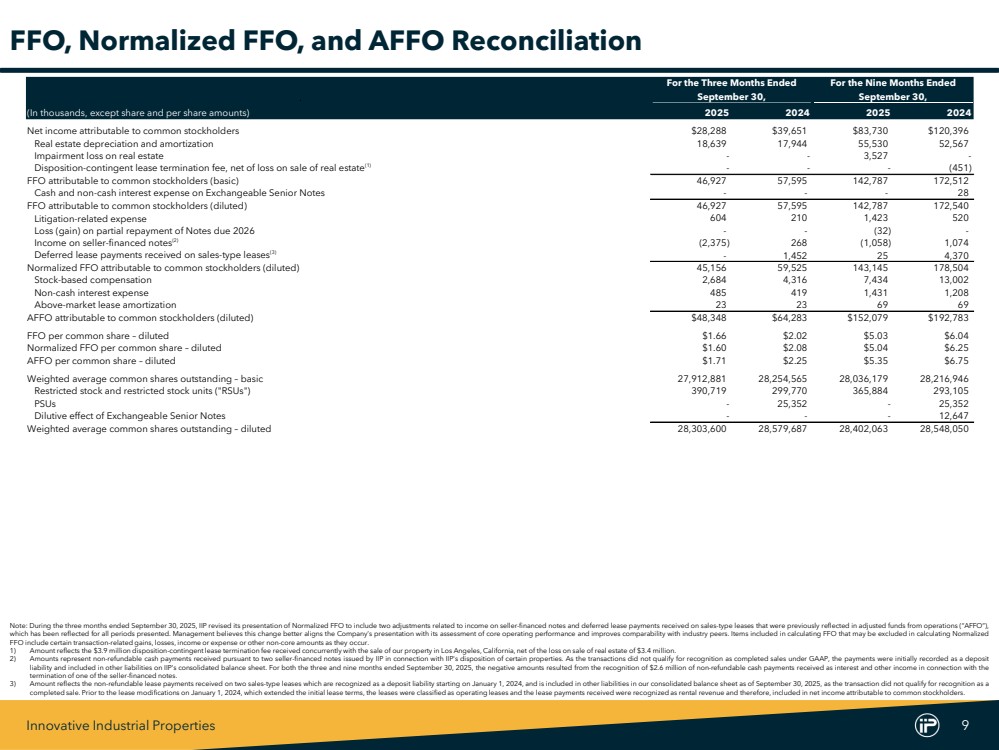
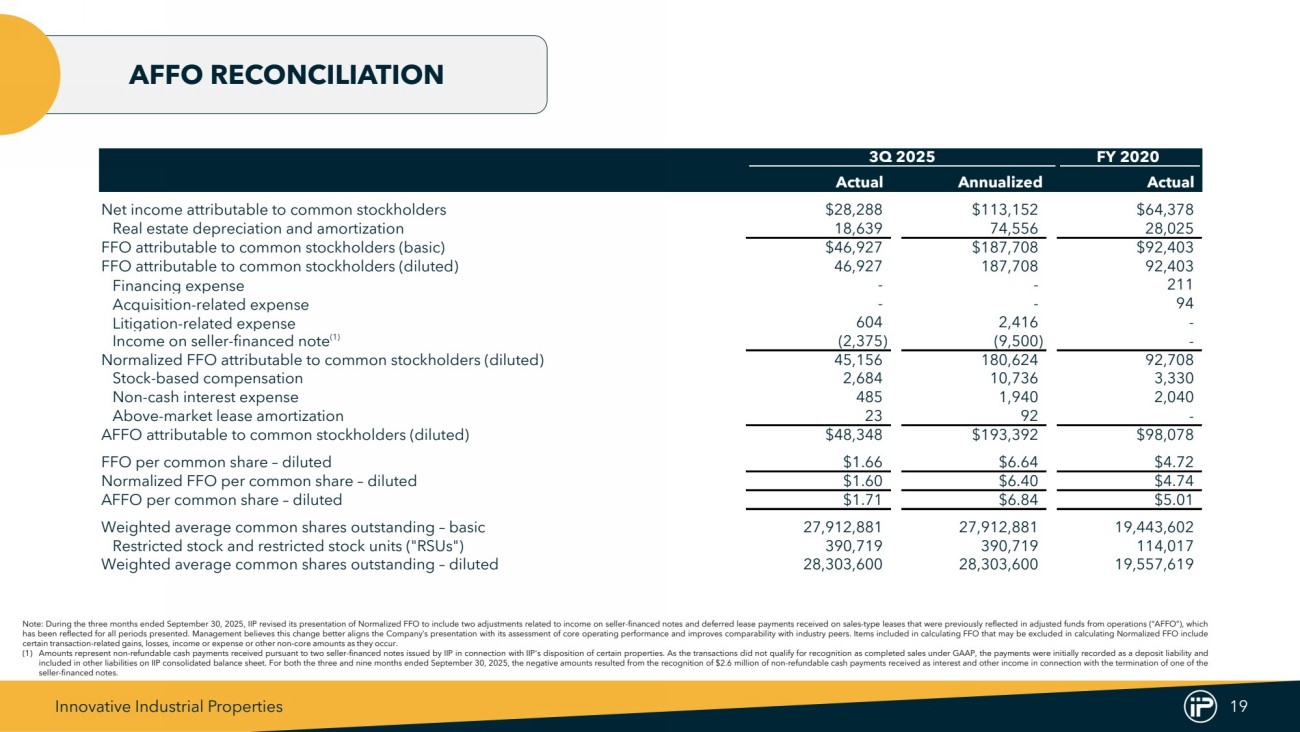
Innovative Industrial Properties 9 For the Three Months Ended For the Nine Months Ended September 30, September 30, (In thousands, except share and per share amounts) 2025 2024 2025 2024 Net income attributable to common stockholders $28,288 $39,651 $83,730 $120,396 Real estate depreciation and amortization 18,639 17,944 55,530 52,567 Impairment loss on real estate - - 3,527 - Disposition-contingent lease termination fee, net of loss on sale of real estate(1) - - - (451) FFO attributable to common stockholders (basic) 46,927 57,595 142,787 172,512 Cash and non-cash interest expense on Exchangeable Senior Notes - - - 28 FFO attributable to common stockholders (diluted) 46,927 57,595 142,787 172,540 Litigation-related expense 604 210 1,423 520 Loss (gain) on partial repayment of Notes due 2026 - - (32) - Income on seller-financed notes(2) (2,375) 268 (1,058) 1,074 Deferred lease payments received on sales-type leases(3) - 1,452 25 4,370 Normalized FFO attributable to common stockholders (diluted) 45,156 59,525 143,145 178,504 Stock-based compensation 2,684 4,316 7,434 13,002 Non-cash interest expense 485 419 1,431 1,208 Above-market lease amortization 23 23 69 69 AFFO attributable to common stockholders (diluted) $48,348 $64,283 $152,079 $192,783 FFO per common share – diluted $1.66 $2.02 $5.03 $6.04 Normalized FFO per common share – diluted $1.60 $2.08 $5.04 $6.25 AFFO per common share – diluted $1.71 $2.25 $5.35 $6.75 Weighted average common shares outstanding – basic 27,912,881 28,254,565 28,036,179 28,216,946 Restricted stock and restricted stock units ("RSUs") 390,719 299,770 365,884 293,105 PSUs - 25,352 - 25,352 Dilutive effect of Exchangeable Senior Notes - - - 12,647 Weighted average common shares outstanding – diluted 28,303,600 28,579,687 28,402,063 28,548,050 FFO, Normalized FFO, and AFFO Reconciliation Note: During the three months ended September 30, 2025, IIP revised its presentation of Normalized FFO to include two adjustments related to income on seller-financed notes and deferred lease payments received on sales-type leases that were previously reflected in adjusted funds from operations (“AFFO”), which has been reflected for all periods presented. Management believes this change better aligns the Company’s presentation with its assessment of core operating performance and improves comparability with industry peers. Items included in calculating FFO that may be excluded in calculating Normalized FFO include certain transaction-related gains, losses, income or expense or other non-core amounts as they occur. 1) Amount reflects the $3.9 million disposition-contingent lease termination fee received concurrently with the sale of our property in Los Angeles, California, net of the loss on sale of real estate of $3.4 million. 2) Amounts represent non-refundable cash payments received pursuant to two seller-financed notes issued by IIP in connection with IIP's disposition of certain properties. As the transactions did not qualify for recognition as completed sales under GAAP, the payments were initially recorded as a deposit liability and included in other liabilities on IIP’s consolidated balance sheet. For both the three and nine months ended September 30, 2025, the negative amounts resulted from the recognition of $2.6 million of non-refundable cash payments received as interest and other income in connection with the termination of one of the seller-financed notes. 3) Amount reflects the non-refundable lease payments received on two sales-type leases which are recognized as a deposit liability starting on January 1, 2024, and is included in other liabilities in our consolidated balance sheet as of September 30, 2025, as the transaction did not qualify for recognition as a completed sale. Prior to the lease modifications on January 1, 2024, which extended the initial lease terms, the leases were classified as operating leases and the lease payments received were recognized as rental revenue and therefore, included in net income attributable to common stockholders. |
|
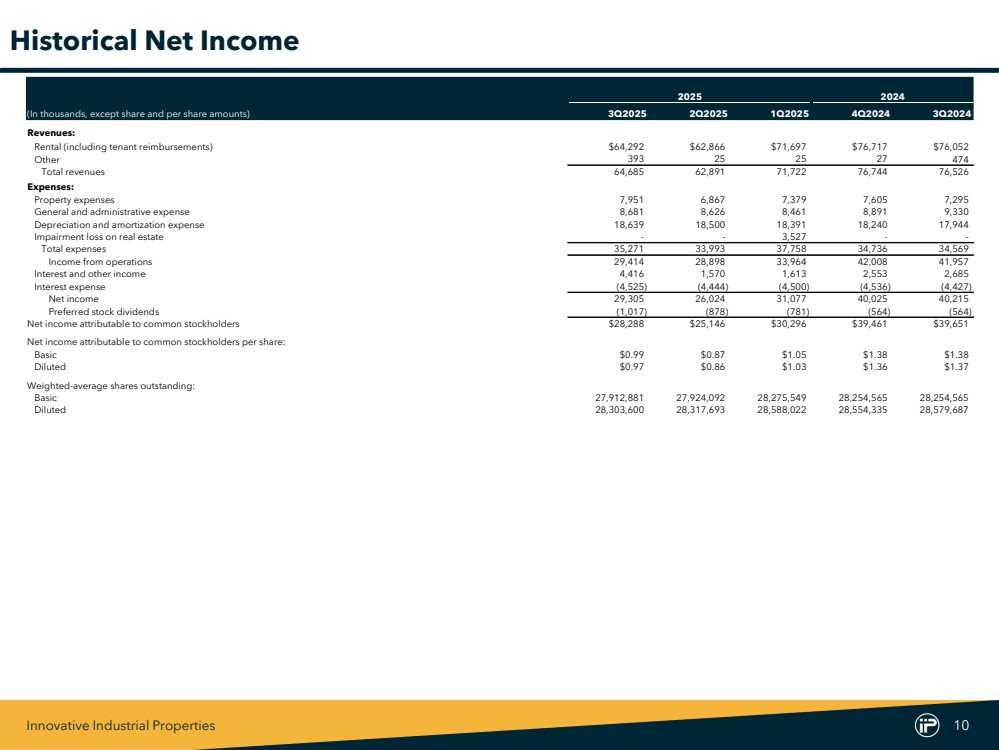
Innovative Industrial Properties 10 2025 2024 (In thousands, except share and per share amounts) 3Q2025 2Q2025 1Q2025 4Q2024 3Q2024 Revenues: Rental (including tenant reimbursements) $64,292 $62,866 $71,697 $76,717 $76,052 Other 393 25 25 27 474 Total revenues 64,685 62,891 71,722 76,744 76,526 Expenses: Property expenses 7,951 6,867 7,379 7,605 7,295 General and administrative expense 8,681 8,626 8,461 8,891 9,330 Depreciation and amortization expense 18,639 18,500 18,391 18,240 17,944 Impairment loss on real estate - - 3,527 - - Total expenses 35,271 33,993 37,758 34,736 34,569 Income from operations 29,414 28,898 33,964 42,008 41,957 Interest and other income 4,416 1,570 1,613 2,553 2,685 Interest expense (4,525) (4,444) (4,500) (4,536) (4,427) Net income 29,305 26,024 31,077 40,025 40,215 Preferred stock dividends (1,017) (878) (781) (564) (564) Net income attributable to common stockholders $28,288 $25,146 $30,296 $39,461 $39,651 Net income attributable to common stockholders per share: Basic $0.99 $0.87 $1.05 $1.38 $1.38 Diluted $0.97 $0.86 $1.03 $1.36 $1.37 Weighted-average shares outstanding: Basic 27,912,881 27,924,092 28,275,549 28,254,565 28,254,565 Diluted 28,303,600 28,317,693 28,588,022 28,554,335 28,579,687 Historical Net Income |
|
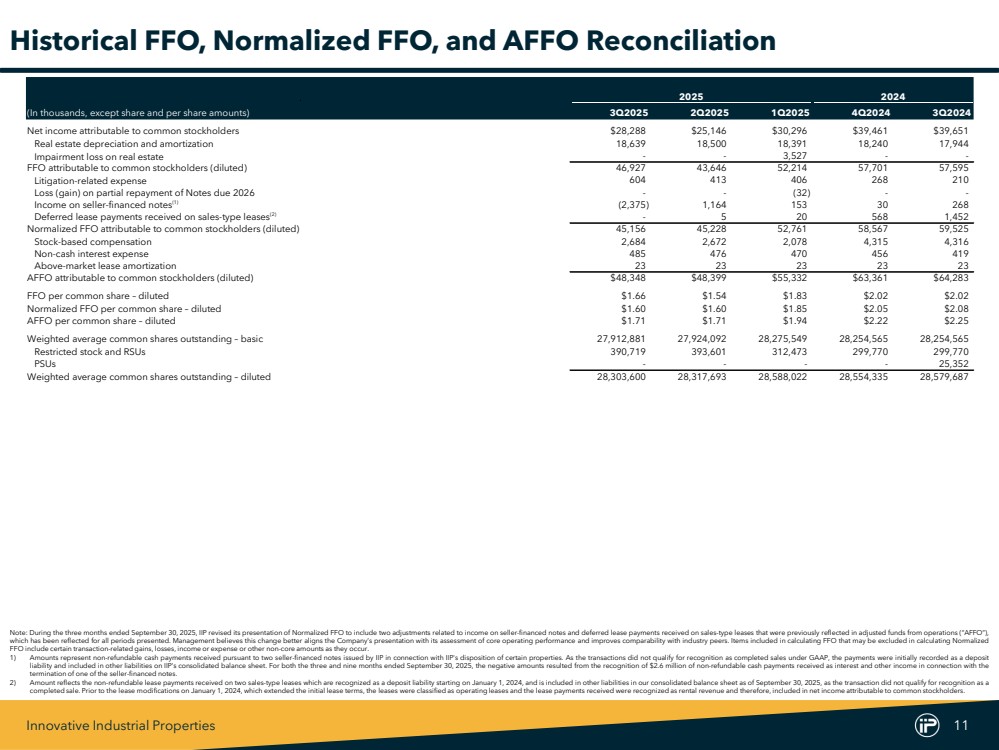
Innovative Industrial Properties 11 2025 2024 (In thousands, except share and per share amounts) 3Q2025 2Q2025 1Q2025 4Q2024 3Q2024 Net income attributable to common stockholders $28,288 $25,146 $30,296 $39,461 $39,651 Real estate depreciation and amortization 18,639 18,500 18,391 18,240 17,944 Impairment loss on real estate - - 3,527 - - FFO attributable to common stockholders (diluted) 46,927 43,646 52,214 57,701 57,595 Litigation-related expense 604 413 406 268 210 Loss (gain) on partial repayment of Notes due 2026 - - (32) - - Income on seller-financed notes(1) (2,375) 1,164 153 30 268 Deferred lease payments received on sales-type leases(2) - 5 20 568 1,452 Normalized FFO attributable to common stockholders (diluted) 45,156 45,228 52,761 58,567 59,525 Stock-based compensation 2,684 2,672 2,078 4,315 4,316 Non-cash interest expense 485 476 470 456 419 Above-market lease amortization 23 23 23 23 23 AFFO attributable to common stockholders (diluted) $48,348 $48,399 $55,332 $63,361 $64,283 FFO per common share – diluted $1.66 $1.54 $1.83 $2.02 $2.02 Normalized FFO per common share – diluted $1.60 $1.60 $1.85 $2.05 $2.08 AFFO per common share – diluted $1.71 $1.71 $1.94 $2.22 $2.25 Weighted average common shares outstanding – basic 27,912,881 27,924,092 28,275,549 28,254,565 28,254,565 Restricted stock and RSUs 390,719 393,601 312,473 299,770 299,770 PSUs - - - - 25,352 Weighted average common shares outstanding – diluted 28,303,600 28,317,693 28,588,022 28,554,335 28,579,687 Historical FFO, Normalized FFO, and AFFO Reconciliation Note: During the three months ended September 30, 2025, IIP revised its presentation of Normalized FFO to include two adjustments related to income on seller-financed notes and deferred lease payments received on sales-type leases that were previously reflected in adjusted funds from operations (“AFFO”), which has been reflected for all periods presented. Management believes this change better aligns the Company’s presentation with its assessment of core operating performance and improves comparability with industry peers. Items included in calculating FFO that may be excluded in calculating Normalized FFO include certain transaction-related gains, losses, income or expense or other non-core amounts as they occur. 1) Amounts represent non-refundable cash payments received pursuant to two seller-financed notes issued by IIP in connection with IIP's disposition of certain properties. As the transactions did not qualify for recognition as completed sales under GAAP, the payments were initially recorded as a deposit liability and included in other liabilities on IIP’s consolidated balance sheet. For both the three and nine months ended September 30, 2025, the negative amounts resulted from the recognition of $2.6 million of non-refundable cash payments received as interest and other income in connection with the termination of one of the seller-financed notes. 2) Amount reflects the non-refundable lease payments received on two sales-type leases which are recognized as a deposit liability starting on January 1, 2024, and is included in other liabilities in our consolidated balance sheet as of September 30, 2025, as the transaction did not qualify for recognition as a completed sale. Prior to the lease modifications on January 1, 2024, which extended the initial lease terms, the leases were classified as operating leases and the lease payments received were recognized as rental revenue and therefore, included in net income attributable to common stockholders. |
|
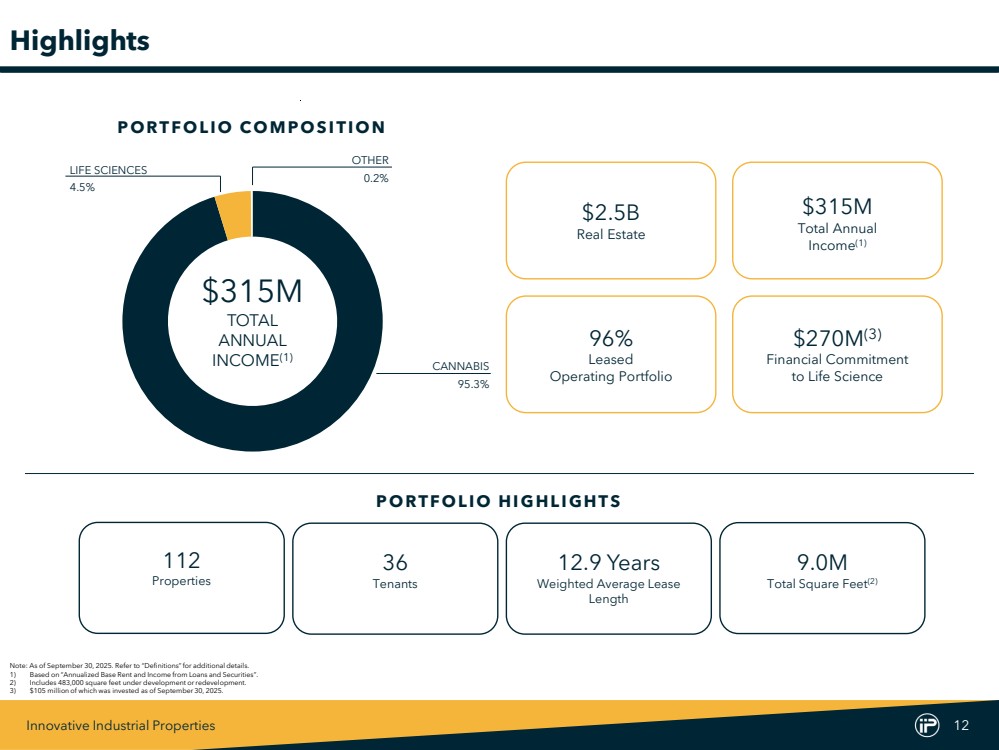
Innovative Industrial Properties 12 CANNABIS 95.3% LIFE SCIENCES 4.5% $315M TOTAL ANNUAL INCOME(1) P O RT F O LI O CO M P O S I T I O N 96% Leased Operating Portfolio $270M(3) Financial Commitment to Life Science P O RT F O LI O HI G HL I G HT S 36 Tenants 12.9 Years Weighted Average Lease Length 9.0M Total Square Feet(2) 112 Properties OTHER 0.2% Highlights Note: As of September 30, 2025. Refer to “Definitions”for additional details. 1) Based on “Annualized Base Rent and Income from Loans and Securities”. 2) Includes 483,000 square feet under development or redevelopment. 3) $105 million of which was invested as of September 30, 2025. $315M Total Annual Income(1) $2.5B Real Estate |
|
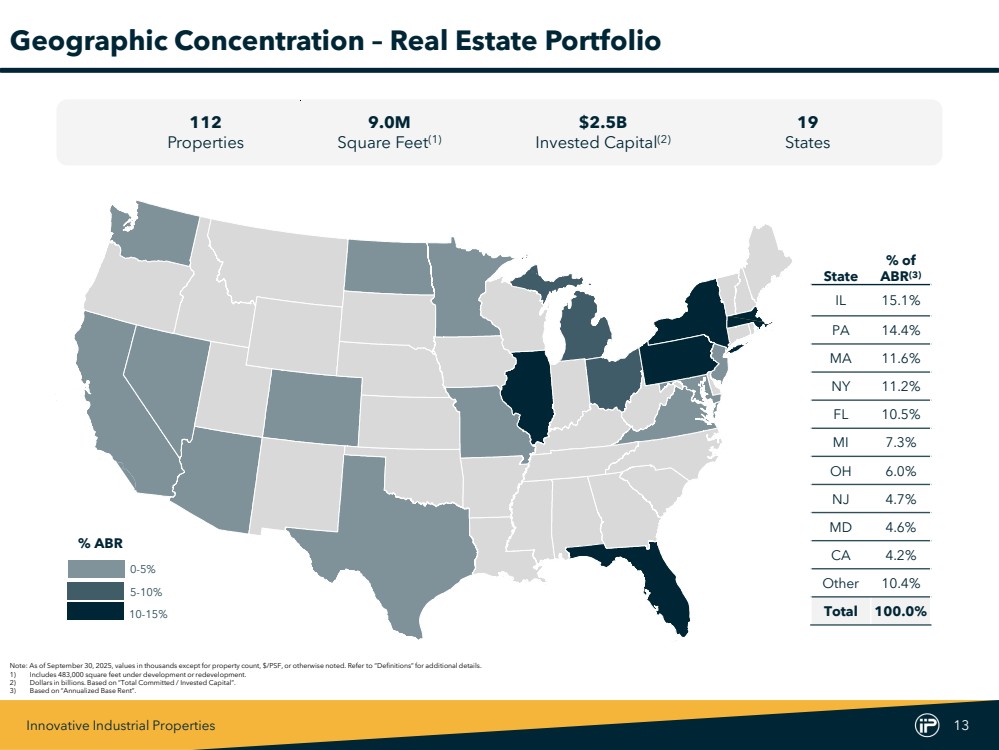
Innovative Industrial Properties 13 Geographic Concentration – Real Estate Portfolio Note: As of September 30, 2025, values in thousands except for property count, $/PSF, or otherwise noted. Refer to “Definitions”for additional details. 1) Includes 483,000 square feet under development or redevelopment. 2) Dollars in billions. Based on “Total Committed / Invested Capital”. 3) Based on “Annualized Base Rent”. 19 States 9.0M Square Feet(1) $2.5B Invested Capital(2) 112 Properties 10-15% 0-5% 5-10% % ABR State % of ABR(3) IL 15.1% PA 14.4% MA 11.6% NY 11.2% FL 10.5% MI 7.3% OH 6.0% NJ 4.7% MD 4.6% CA 4.2% Other 10.4% Total 100.0% |
|
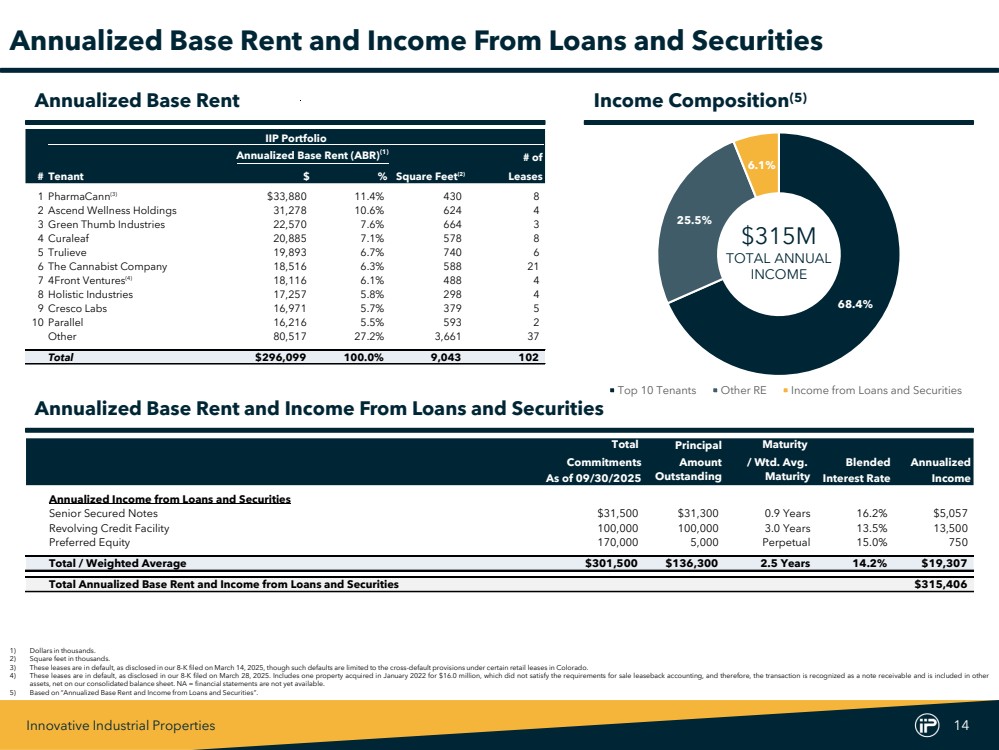
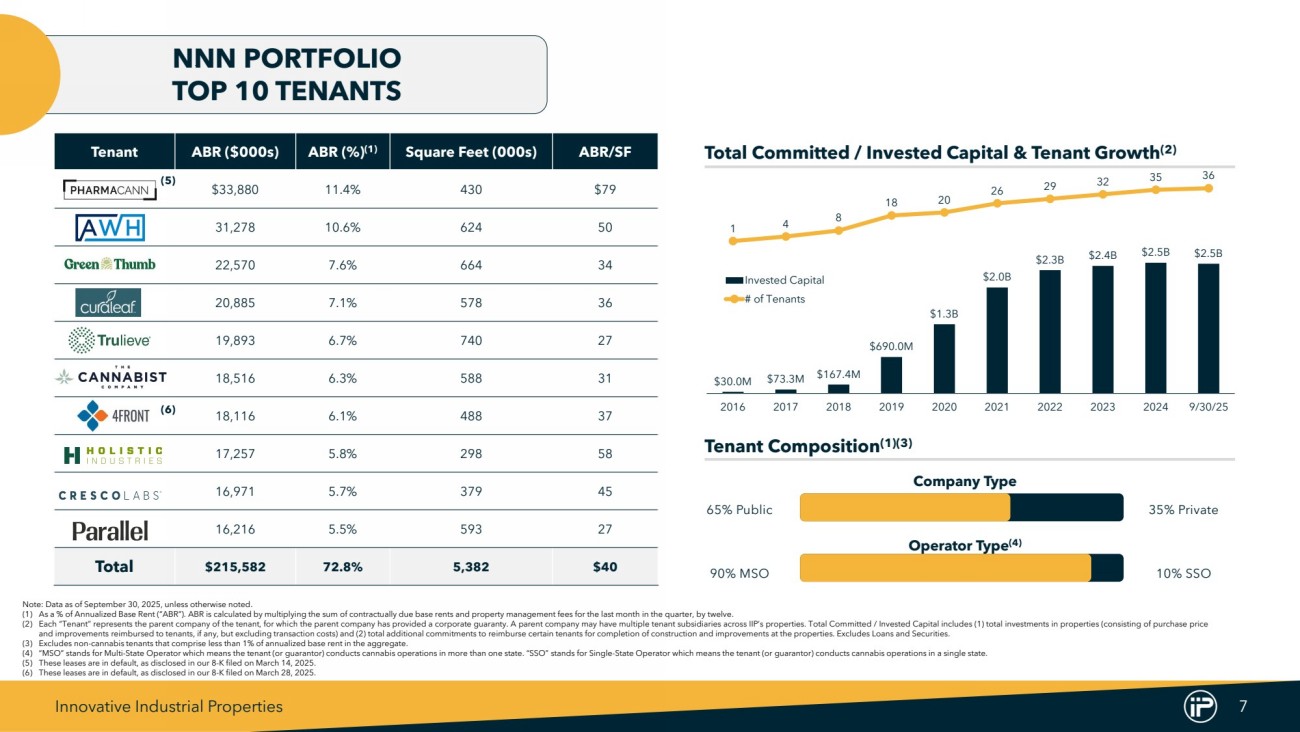
Innovative Industrial Properties 14 Total Principal Maturity Commitments Amount / Wtd. Avg. Blended Annualized As of 09/30/2025 Outstanding Maturity Interest Rate Income Annualized Income from Loans and Securities Senior Secured Notes $31,500 $31,300 0.9 Years 16.2% $5,057 Revolving Credit Facility 100,000 100,000 3.0 Years 13.5% 13,500 Preferred Equity 170,000 5,000 Perpetual 15.0% 750 Total / Weighted Average $301,500 $136,300 2.5 Years 14.2% $19,307 Total Annualized Base Rent and Income from Loans and Securities $315,406 IIP Portfolio First Quarter 2025(3) Annualized Base Rent (ABR)(1) # of # Tenant $ % Square Feet(2) Leases 1 PharmaCann(3) $33,880 11.4% 430 8 2 Ascend Wellness Holdings 31,278 10.6% 624 4 3 Green Thumb Industries 22,570 7.6% 664 3 4 Curaleaf 20,885 7.1% 578 8 5 Trulieve 19,893 6.7% 740 6 6 The Cannabist Company 18,516 6.3% 588 21 7 4Front Ventures(4) 18,116 6.1% 488 4 8 Holistic Industries 17,257 5.8% 298 4 9 Cresco Labs 16,971 5.7% 379 5 10 Parallel 16,216 5.5% 593 2 Other 80,517 27.2% 3,661 37 Total $296,099 100.0% 9,043 102 Annualized Base Rent and Income From Loans and Securities 1) Dollars in thousands. 2) Square feet in thousands. 3) These leases are in default, as disclosed in our 8-K filed on March 14, 2025, though such defaults are limited to the cross-default provisions under certain retail leases in Colorado. 4) These leases are in default, as disclosed in our 8-K filed on March 28, 2025. Includes one property acquired in January 2022 for $16.0 million, which did not satisfy the requirements for sale leaseback accounting, and therefore, the transaction is recognized as a note receivable and is included in other assets, net on our consolidated balance sheet. NA = financial statements are not yet available. 5) Based on “Annualized Base Rent and Income from Loans and Securities”. Annualized Base Rent Income Composition(5) Annualized Base Rent and Income From Loans and Securities 68.4% 25.5% 6.1% Top 10 Tenants Other RE Income from Loans and Securities $315M TOTAL ANNUAL INCOME |
|
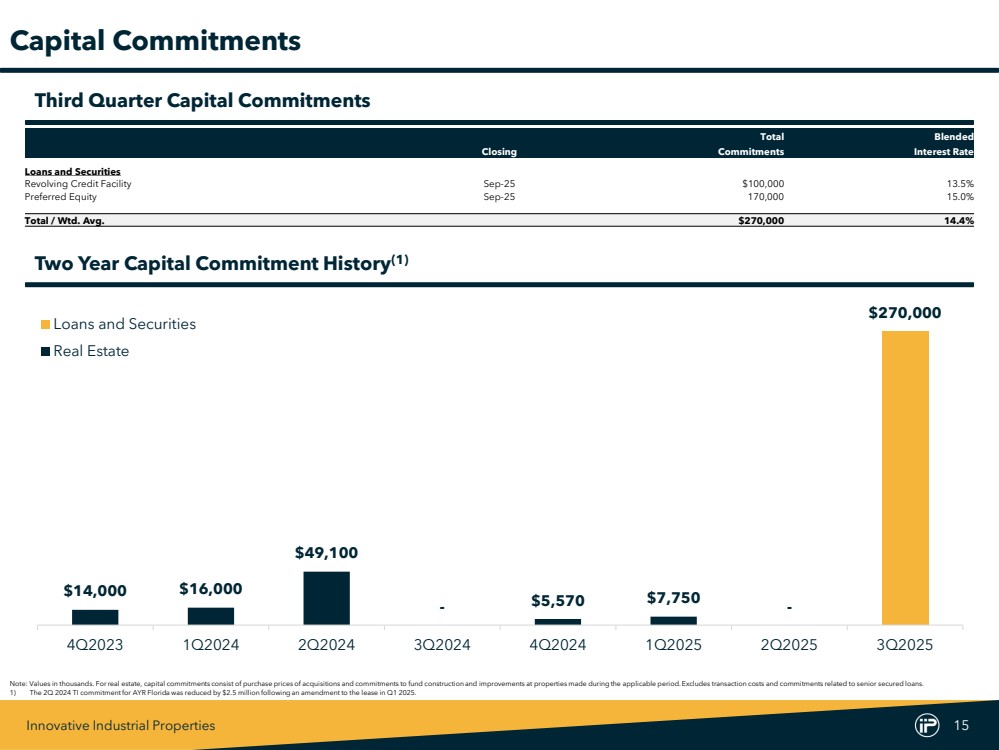
Innovative Industrial Properties 15 Total Blended Closing Commitments Interest Rate Loans and Securities Revolving Credit Facility Sep-25 $100,000 13.5% Preferred Equity Sep-25 170,000 15.0% Total / Wtd. Avg. $270,000 14.4% Capital Commitments Note: Values in thousands. Forreal estate, capital commitments consist of purchase prices of acquisitions and commitments to fund construction and improvements at properties made during the applicable period.Excludes transaction costs and commitments related to senior secured loans. 1) The 2Q 2024 TI commitment for AYR Florida was reduced by $2.5 million following an amendment to the lease in Q1 2025. Two Year Capital Commitment History(1) $14,000 $16,000 $49,100 - $5,570 $7,750 - $270,000 4Q2023 1Q2024 2Q2024 3Q2024 4Q2024 1Q2025 2Q2025 3Q2025 Loans and Securities Real Estate Third Quarter Capital Commitments |
|
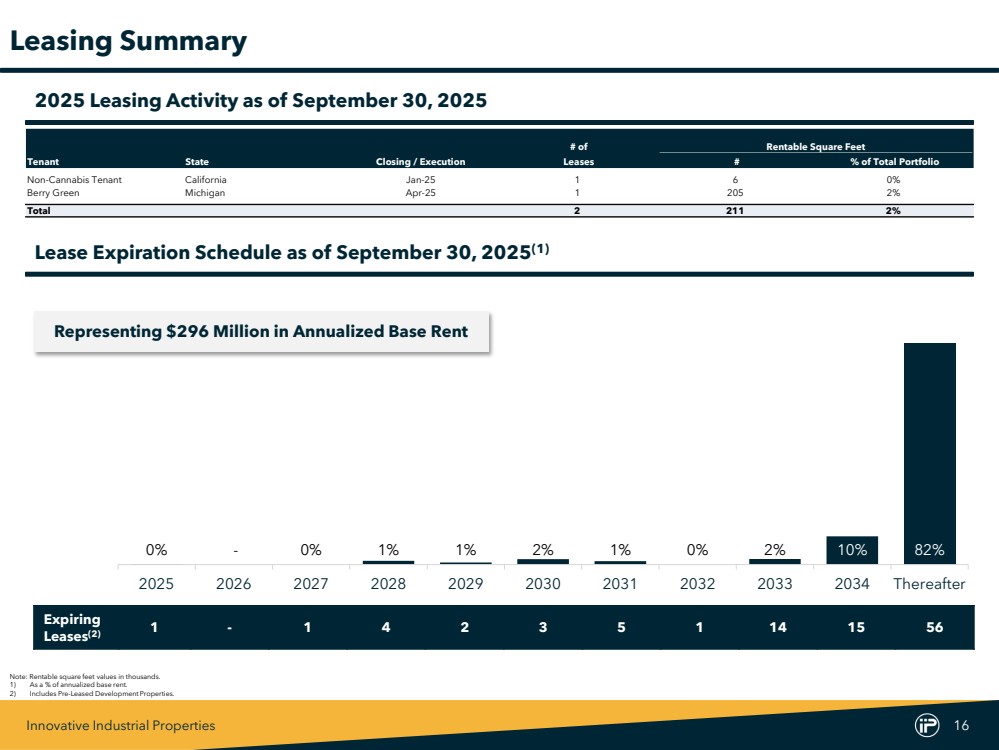
Innovative Industrial Properties 16 # of Rentable Square Feet Rentable Square Feet Tenant State Closing / Execution Leases # % of Total Portfolio Non-Cannabis Tenant California Jan-25 1 6 0% Berry Green Michigan Apr-25 1 205 2% Total 2 211 2% Note: Rentable square feet values in thousands. 1) As a % of annualized base rent. 2) Includes Pre-Leased Development Properties. Leasing Summary 2025 Leasing Activity as of September 30, 2025 0% - 0% 1% 1% 2% 1% 0% 2% 10% 82% 2025 2026 2027 2028 2029 2030 2031 2032 2033 2034 Thereafter Representing $296 Million in Annualized Base Rent Expiring Leases(2) 1 - 1 4 2 3 5 1 14 15 56 Lease Expiration Schedule as of September 30, 2025(1) |
|
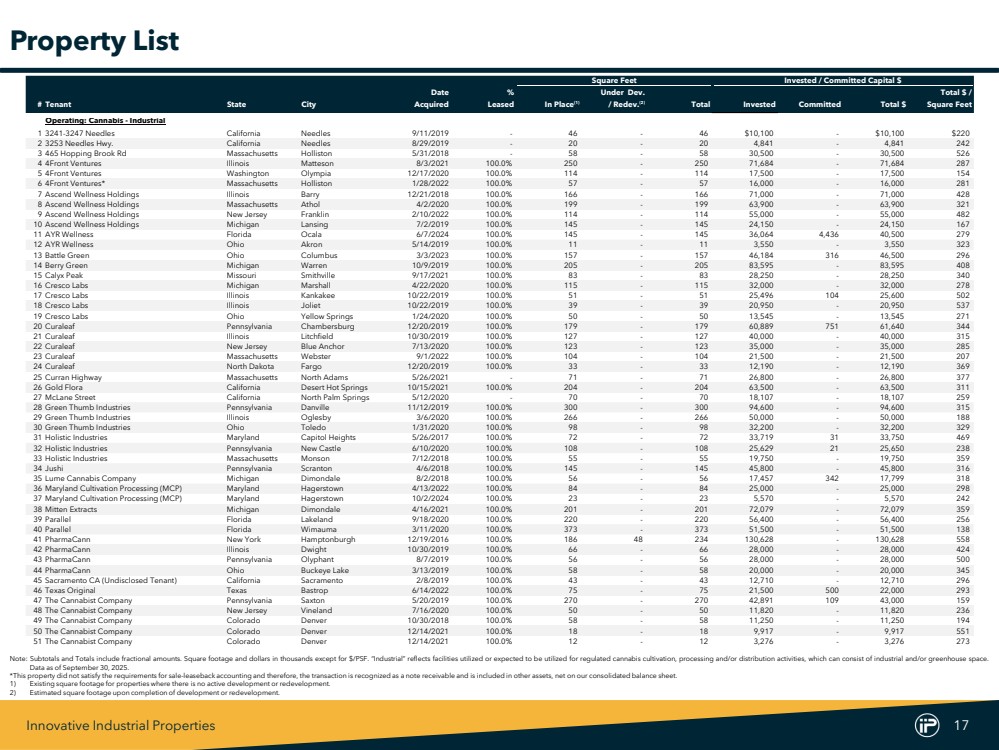
Innovative Industrial Properties 17 Square Feet Invested / Committed Capital $ Date % Under Dev. Total $ / # Tenant State City Acquired Leased In Place(1) / Redev.(2) Total Invested Committed Total $ Square Feet Operating: Cannabis - Industrial 1 3241-3247 Needles California Needles 9/11/2019 - 46 - 46 $10,100 - $10,100 $220 2 3253 Needles Hwy. California Needles 8/29/2019 - 20 - 20 4,841 - 4,841 242 3 465 Hopping Brook Rd Massachusetts Holliston 5/31/2018 - 58 - 58 30,500 - 30,500 526 4 4Front Ventures Illinois Matteson 8/3/2021 100.0% 250 - 250 71,684 - 71,684 287 5 4Front Ventures Washington Olympia 12/17/2020 100.0% 114 - 114 17,500 - 17,500 154 6 4Front Ventures* Massachusetts Holliston 1/28/2022 100.0% 57 - 57 16,000 - 16,000 281 7 Ascend Wellness Holdings Illinois Barry 12/21/2018 100.0% 166 - 166 71,000 - 71,000 428 8 Ascend Wellness Holdings Massachusetts Athol 4/2/2020 100.0% 199 - 199 63,900 - 63,900 321 9 Ascend Wellness Holdings New Jersey Franklin 2/10/2022 100.0% 114 - 114 55,000 - 55,000 482 10 Ascend Wellness Holdings Michigan Lansing 7/2/2019 100.0% 145 - 145 24,150 - 24,150 167 11 AYR Wellness Florida Ocala 6/7/2024 100.0% 145 - 145 36,064 4,436 40,500 279 12 AYR Wellness Ohio Akron 5/14/2019 100.0% 11 - 11 3,550 - 3,550 323 13 Battle Green Ohio Columbus 3/3/2023 100.0% 157 - 157 46,184 316 46,500 296 14 Berry Green Michigan Warren 10/9/2019 100.0% 205 - 205 83,595 - 83,595 408 15 Calyx Peak Missouri Smithville 9/17/2021 100.0% 83 - 83 28,250 - 28,250 340 16 Cresco Labs Michigan Marshall 4/22/2020 100.0% 115 - 115 32,000 - 32,000 278 17 Cresco Labs Illinois Kankakee 10/22/2019 100.0% 51 - 51 25,496 104 25,600 502 18 Cresco Labs Illinois Joliet 10/22/2019 100.0% 39 - 39 20,950 - 20,950 537 19 Cresco Labs Ohio Yellow Springs 1/24/2020 100.0% 50 - 50 13,545 - 13,545 271 20 Curaleaf Pennsylvania Chambersburg 12/20/2019 100.0% 179 - 179 60,889 751 61,640 344 21 Curaleaf Illinois Litchfield 10/30/2019 100.0% 127 - 127 40,000 - 40,000 315 22 Curaleaf New Jersey Blue Anchor 7/13/2020 100.0% 123 - 123 35,000 - 35,000 285 23 Curaleaf Massachusetts Webster 9/1/2022 100.0% 104 - 104 21,500 - 21,500 207 24 Curaleaf North Dakota Fargo 12/20/2019 100.0% 33 - 33 12,190 - 12,190 369 25 Curran Highway Massachusetts North Adams 5/26/2021 - 71 - 71 26,800 - 26,800 377 26 Gold Flora California Desert Hot Springs 10/15/2021 100.0% 204 - 204 63,500 - 63,500 311 27 McLane Street California North Palm Springs 5/12/2020 - 70 - 70 18,107 - 18,107 259 28 Green Thumb Industries Pennsylvania Danville 11/12/2019 100.0% 300 - 300 94,600 - 94,600 315 29 Green Thumb Industries Illinois Oglesby 3/6/2020 100.0% 266 - 266 50,000 - 50,000 188 30 Green Thumb Industries Ohio Toledo 1/31/2020 100.0% 98 - 98 32,200 - 32,200 329 31 Holistic Industries Maryland Capitol Heights 5/26/2017 100.0% 72 - 72 33,719 31 33,750 469 32 Holistic Industries Pennsylvania New Castle 6/10/2020 100.0% 108 - 108 25,629 21 25,650 238 33 Holistic Industries Massachusetts Monson 7/12/2018 100.0% 55 - 55 19,750 - 19,750 359 34 Jushi Pennsylvania Scranton 4/6/2018 100.0% 145 - 145 45,800 - 45,800 316 35 Lume Cannabis Company Michigan Dimondale 8/2/2018 100.0% 56 - 56 17,457 342 17,799 318 36 Maryland Cultivation Processing (MCP) Maryland Hagerstown 4/13/2022 100.0% 84 - 84 25,000 - 25,000 298 37 Maryland Cultivation Processing (MCP) Maryland Hagerstown 10/2/2024 100.0% 23 - 23 5,570 - 5,570 242 38 Mitten Extracts Michigan Dimondale 4/16/2021 100.0% 201 - 201 72,079 - 72,079 359 39 Parallel Florida Lakeland 9/18/2020 100.0% 220 - 220 56,400 - 56,400 256 40 Parallel Florida Wimauma 3/11/2020 100.0% 373 - 373 51,500 - 51,500 138 41 PharmaCann New York Hamptonburgh 12/19/2016 100.0% 186 48 234 130,628 - 130,628 558 42 PharmaCann Illinois Dwight 10/30/2019 100.0% 66 - 66 28,000 - 28,000 424 43 PharmaCann Pennsylvania Olyphant 8/7/2019 100.0% 56 - 56 28,000 - 28,000 500 44 PharmaCann Ohio Buckeye Lake 3/13/2019 100.0% 58 - 58 20,000 - 20,000 345 45 Sacramento CA (Undisclosed Tenant) California Sacramento 2/8/2019 100.0% 43 - 43 12,710 - 12,710 296 46 Texas Original Texas Bastrop 6/14/2022 100.0% 75 - 75 21,500 500 22,000 293 47 The Cannabist Company Pennsylvania Saxton 5/20/2019 100.0% 270 - 270 42,891 109 43,000 159 48 The Cannabist Company New Jersey Vineland 7/16/2020 100.0% 50 - 50 11,820 - 11,820 236 49 The Cannabist Company Colorado Denver 10/30/2018 100.0% 58 - 58 11,250 - 11,250 194 50 The Cannabist Company Colorado Denver 12/14/2021 100.0% 18 - 18 9,917 - 9,917 551 51 The Cannabist Company Colorado Denver 12/14/2021 100.0% 12 - 12 3,276 - 3,276 273 Note: Subtotals and Totals include fractional amounts. Square footage and dollars in thousands except for $/PSF. “Industrial” reflects facilities utilized or expected to be utilized for regulated cannabis cultivation, processing and/or distribution activities, which can consist of industrial and/or greenhouse space. Data as of September 30, 2025. *This property did not satisfy the requirements for sale-leaseback accounting and therefore, the transaction is recognized as a note receivable and is included in other assets, net on our consolidated balance sheet. 1) Existing square footage for properties where there is no active development or redevelopment. 2) Estimated square footage upon completion of development or redevelopment. Property List |
|
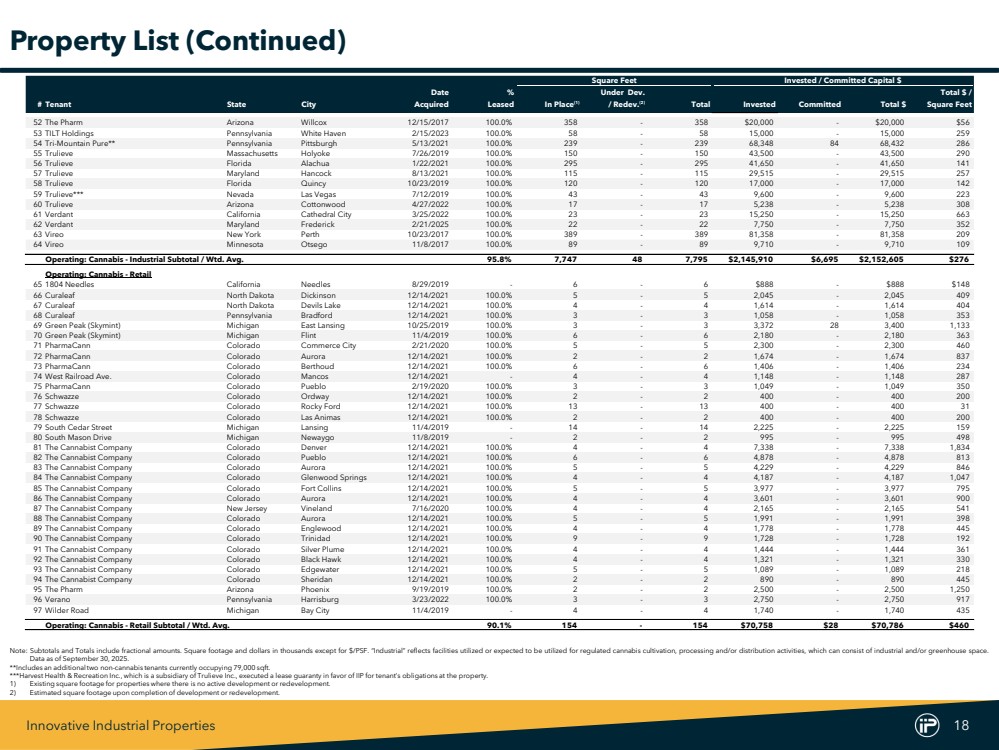
Innovative Industrial Properties 18 Square Feet Invested / Committed Capital $ Date % Under Dev. Total $ / # Tenant State City Acquired Leased In Place(1) / Redev.(2) Total Invested Committed Total $ Square Feet 52 The Pharm Arizona Willcox 12/15/2017 100.0% 358 - 358 $20,000 - $20,000 $56 53 TILT Holdings Pennsylvania White Haven 2/15/2023 100.0% 58 - 58 15,000 - 15,000 259 54 Tri-Mountain Pure** Pennsylvania Pittsburgh 5/13/2021 100.0% 239 - 239 68,348 84 68,432 286 55 Trulieve Massachusetts Holyoke 7/26/2019 100.0% 150 - 150 43,500 - 43,500 290 56 Trulieve Florida Alachua 1/22/2021 100.0% 295 - 295 41,650 - 41,650 141 57 Trulieve Maryland Hancock 8/13/2021 100.0% 115 - 115 29,515 - 29,515 257 58 Trulieve Florida Quincy 10/23/2019 100.0% 120 - 120 17,000 - 17,000 142 59 Trulieve*** Nevada Las Vegas 7/12/2019 100.0% 43 - 43 9,600 - 9,600 223 60 Trulieve Arizona Cottonwood 4/27/2022 100.0% 17 - 17 5,238 - 5,238 308 61 Verdant California Cathedral City 3/25/2022 100.0% 23 - 23 15,250 - 15,250 663 62 Verdant Maryland Frederick 2/21/2025 100.0% 22 - 22 7,750 - 7,750 352 63 Vireo New York Perth 10/23/2017 100.0% 389 - 389 81,358 - 81,358 209 64 Vireo Minnesota Otsego 11/8/2017 100.0% 89 - 89 9,710 - 9,710 109 Operating: Cannabis - Industrial Subtotal / Wtd. Avg. 95.8% 7,747 48 7,795 $2,145,910 $6,695 $2,152,605 $276 Operating: Cannabis - Retail 65 1804 Needles California Needles 8/29/2019 - 6 - 6 $888 - $888 $148 66 Curaleaf North Dakota Dickinson 12/14/2021 100.0% 5 - 5 2,045 - 2,045 409 67 Curaleaf North Dakota Devils Lake 12/14/2021 100.0% 4 - 4 1,614 - 1,614 404 68 Curaleaf Pennsylvania Bradford 12/14/2021 100.0% 3 - 3 1,058 - 1,058 353 69 Green Peak (Skymint) Michigan East Lansing 10/25/2019 100.0% 3 - 3 3,372 28 3,400 1,133 70 Green Peak (Skymint) Michigan Flint 11/4/2019 100.0% 6 - 6 2,180 - 2,180 363 71 PharmaCann Colorado Commerce City 2/21/2020 100.0% 5 - 5 2,300 - 2,300 460 72 PharmaCann Colorado Aurora 12/14/2021 100.0% 2 - 2 1,674 - 1,674 837 73 PharmaCann Colorado Berthoud 12/14/2021 100.0% 6 - 6 1,406 - 1,406 234 74 West Railroad Ave. Colorado Mancos 12/14/2021 - 4 - 4 1,148 - 1,148 287 75 PharmaCann Colorado Pueblo 2/19/2020 100.0% 3 - 3 1,049 - 1,049 350 76 Schwazze Colorado Ordway 12/14/2021 100.0% 2 - 2 400 - 400 200 77 Schwazze Colorado Rocky Ford 12/14/2021 100.0% 13 - 13 400 - 400 31 78 Schwazze Colorado Las Animas 12/14/2021 100.0% 2 - 2 400 - 400 200 79 South Cedar Street Michigan Lansing 11/4/2019 - 14 - 14 2,225 - 2,225 159 80 South Mason Drive Michigan Newaygo 11/8/2019 - 2 - 2 995 - 995 498 81 The Cannabist Company Colorado Denver 12/14/2021 100.0% 4 - 4 7,338 - 7,338 1,834 82 The Cannabist Company Colorado Pueblo 12/14/2021 100.0% 6 - 6 4,878 - 4,878 813 83 The Cannabist Company Colorado Aurora 12/14/2021 100.0% 5 - 5 4,229 - 4,229 846 84 The Cannabist Company Colorado Glenwood Springs 12/14/2021 100.0% 4 - 4 4,187 - 4,187 1,047 85 The Cannabist Company Colorado Fort Collins 12/14/2021 100.0% 5 - 5 3,977 - 3,977 795 86 The Cannabist Company Colorado Aurora 12/14/2021 100.0% 4 - 4 3,601 - 3,601 900 87 The Cannabist Company New Jersey Vineland 7/16/2020 100.0% 4 - 4 2,165 - 2,165 541 88 The Cannabist Company Colorado Aurora 12/14/2021 100.0% 5 - 5 1,991 - 1,991 398 89 The Cannabist Company Colorado Englewood 12/14/2021 100.0% 4 - 4 1,778 - 1,778 445 90 The Cannabist Company Colorado Trinidad 12/14/2021 100.0% 9 - 9 1,728 - 1,728 192 91 The Cannabist Company Colorado Silver Plume 12/14/2021 100.0% 4 - 4 1,444 - 1,444 361 92 The Cannabist Company Colorado Black Hawk 12/14/2021 100.0% 4 - 4 1,321 - 1,321 330 93 The Cannabist Company Colorado Edgewater 12/14/2021 100.0% 5 - 5 1,089 - 1,089 218 94 The Cannabist Company Colorado Sheridan 12/14/2021 100.0% 2 - 2 890 - 890 445 95 The Pharm Arizona Phoenix 9/19/2019 100.0% 2 - 2 2,500 - 2,500 1,250 96 Verano Pennsylvania Harrisburg 3/23/2022 100.0% 3 - 3 2,750 - 2,750 917 97 Wilder Road Michigan Bay City 11/4/2019 - 4 - 4 1,740 - 1,740 435 Operating: Cannabis - Retail Subtotal / Wtd. Avg. 90.1% 154 - 154 $70,758 $28 $70,786 $460 Note: Subtotals and Totals include fractional amounts. Square footage and dollars in thousands except for $/PSF. “Industrial” reflects facilities utilized or expected to be utilized for regulated cannabis cultivation, processing and/or distribution activities, which can consist of industrial and/or greenhouse space. Data as of September 30, 2025. **Includes an additionaltwo non-cannabis tenants currently occupying 79,000 sqft. ***Harvest Health & Recreation Inc., which is a subsidiary of Trulieve Inc., executed a lease guaranty in favor of IIP for tenant’s obligations at the property. 1) Existing square footage for properties where there is no active development or redevelopment. 2) Estimated square footage upon completion of development or redevelopment. Property List (Continued) |
|
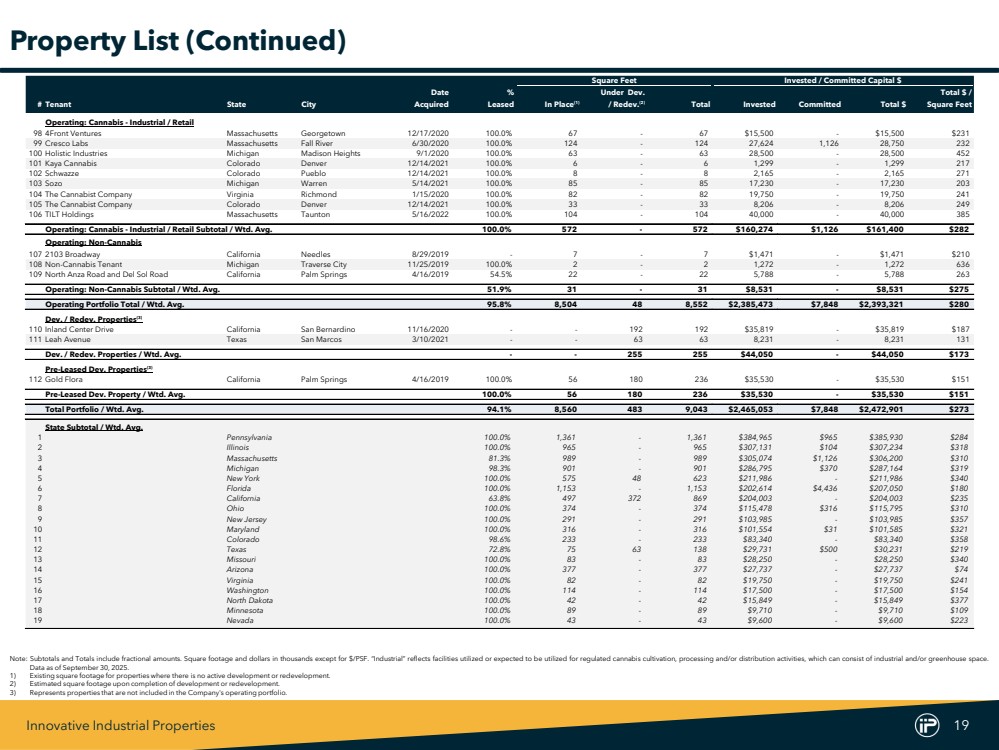
Innovative Industrial Properties 19 Square Feet Invested / Committed Capital $ Date % Under Dev. Total $ / # Tenant State City Acquired Leased In Place(1) / Redev.(2) Total Invested Committed Total $ Square Feet Operating: Cannabis - Industrial / Retail 98 4Front Ventures Massachusetts Georgetown 12/17/2020 100.0% 67 - 67 $15,500 - $15,500 $231 99 Cresco Labs Massachusetts Fall River 6/30/2020 100.0% 124 - 124 27,624 1,126 28,750 232 100 Holistic Industries Michigan Madison Heights 9/1/2020 100.0% 63 - 63 28,500 - 28,500 452 101 Kaya Cannabis Colorado Denver 12/14/2021 100.0% 6 - 6 1,299 - 1,299 217 102 Schwazze Colorado Pueblo 12/14/2021 100.0% 8 - 8 2,165 - 2,165 271 103 Sozo Michigan Warren 5/14/2021 100.0% 85 - 85 17,230 - 17,230 203 104 The Cannabist Company Virginia Richmond 1/15/2020 100.0% 82 - 82 19,750 - 19,750 241 105 The Cannabist Company Colorado Denver 12/14/2021 100.0% 33 - 33 8,206 - 8,206 249 106 TILT Holdings Massachusetts Taunton 5/16/2022 100.0% 104 - 104 40,000 - 40,000 385 Operating: Cannabis - Industrial / Retail Subtotal / Wtd. Avg. 100.0% 572 - 572 $160,274 $1,126 $161,400 $282 Operating: Non-Cannabis 107 2103 Broadway California Needles 8/29/2019 - 7 - 7 $1,471 - $1,471 $210 108 Non-Cannabis Tenant Michigan Traverse City 11/25/2019 100.0% 2 - 2 1,272 - 1,272 636 109 North Anza Road and Del Sol Road California Palm Springs 4/16/2019 54.5% 22 - 22 5,788 - 5,788 263 Operating: Non-Cannabis Subtotal / Wtd. Avg. 51.9% 31 - 31 $8,531 - $8,531 $275 Operating Portfolio Total / Wtd. Avg. 95.8% 8,504 48 8,552 $2,385,473 $7,848 $2,393,321 $280 Dev. / Redev. Properties(3) 110 Inland Center Drive California San Bernardino 11/16/2020 - - 192 192 $35,819 - $35,819 $187 111 Leah Avenue Texas San Marcos 3/10/2021 - - 63 63 8,231 - 8,231 131 Dev. / Redev. Properties / Wtd. Avg. - - 255 255 $44,050 - $44,050 $173 Pre-Leased Dev. Properties(3) 112 Gold Flora California Palm Springs 4/16/2019 100.0% 56 180 236 $35,530 - $35,530 $151 Pre-Leased Dev. Property / Wtd. Avg. 100.0% 56 180 236 $35,530 - $35,530 $151 Total Portfolio / Wtd. Avg. 94.1% 8,560 483 9,043 $2,465,053 $7,848 $2,472,901 $273 State Subtotal / Wtd. Avg. 1 Pennsylvania 100.0% 1,361 - 1,361 $384,965 $965 $385,930 $284 2 Illinois 100.0% 965 - 965 $307,131 $104 $307,234 $318 3 Massachusetts 81.3% 989 - 989 $305,074 $1,126 $306,200 $310 4 Michigan 98.3% 901 - 901 $286,795 $370 $287,164 $319 5 New York 100.0% 575 48 623 $211,986 - $211,986 $340 6 Florida 100.0% 1,153 - 1,153 $202,614 $4,436 $207,050 $180 7 California 63.8% 497 372 869 $204,003 - $204,003 $235 8 Ohio 100.0% 374 - 374 $115,478 $316 $115,795 $310 9 New Jersey 100.0% 291 - 291 $103,985 - $103,985 $357 10 Maryland 100.0% 316 - 316 $101,554 $31 $101,585 $321 11 Colorado 98.6% 233 - 233 $83,340 - $83,340 $358 12 Texas 72.8% 75 63 138 $29,731 $500 $30,231 $219 13 Missouri 100.0% 83 - 83 $28,250 - $28,250 $340 14 Arizona 100.0% 377 - 377 $27,737 - $27,737 $74 15 Virginia 100.0% 82 - 82 $19,750 - $19,750 $241 16 Washington 100.0% 114 - 114 $17,500 - $17,500 $154 17 North Dakota 100.0% 42 - 42 $15,849 - $15,849 $377 18 Minnesota 100.0% 89 - 89 $9,710 - $9,710 $109 19 Nevada 100.0% 43 - 43 $9,600 - $9,600 $223 Property List (Continued) Note: Subtotals and Totals include fractional amounts. Square footage and dollars in thousands except for $/PSF. “Industrial” reflects facilities utilized or expected to be utilized for regulated cannabis cultivation, processing and/or distribution activities, which can consist of industrial and/or greenhouse space. Data as of September 30, 2025. 1) Existing square footage for properties where there is no active development or redevelopment. 2) Estimated square footage upon completion of development or redevelopment. 3) Represents properties that are not included in the Company's operating portfolio. |
|
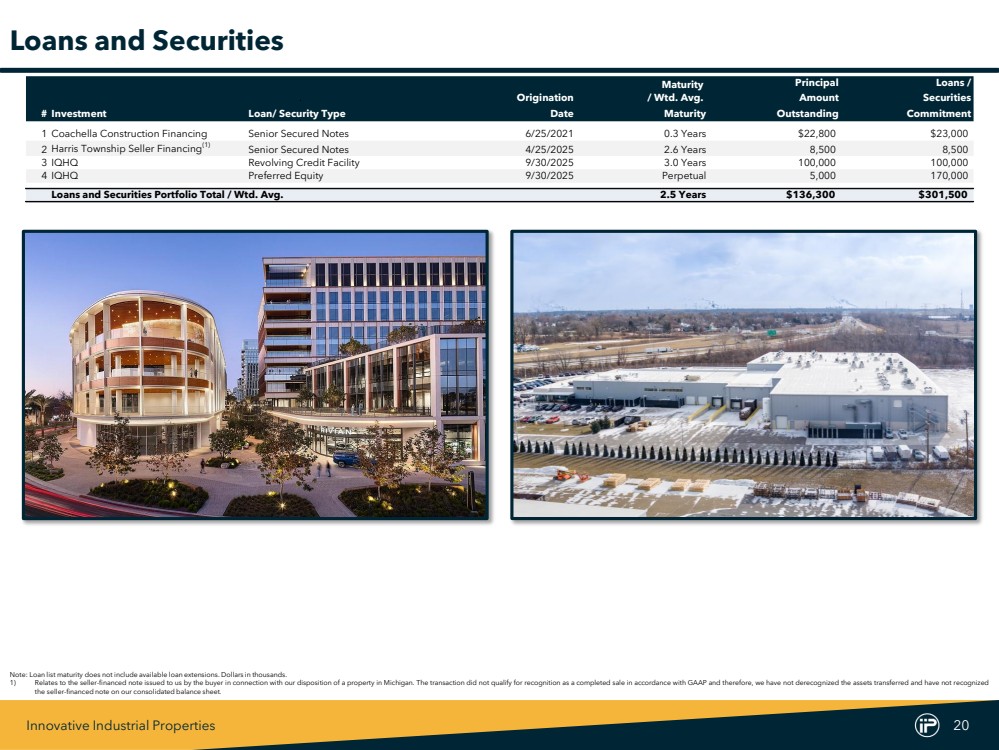
Innovative Industrial Properties 20 Maturity Principal Loans / Origination / Wtd. Avg. Amount Securities # Investment Loan/ Security Type Date Maturity Outstanding Commitment 1 Coachella Construction Financing Senior Secured Notes 6/25/2021 0.3 Years $22,800 $23,000 2 Harris Township Seller Financing(1) Senior Secured Notes 4/25/2025 2.6 Years 8,500 8,500 3 IQHQ Revolving Credit Facility 9/30/2025 3.0 Years 100,000 100,000 4 IQHQ Preferred Equity 9/30/2025 Perpetual 5,000 170,000 Loans and Securities Portfolio Total / Wtd. Avg. 2.5 Years $136,300 $301,500 Loans and Securities Note: Loan list maturity does not include available loan extensions. Dollars in thousands. 1) Relates to the seller-financed note issued to us by the buyer in connection with our disposition of a property in Michigan. The transaction did not qualify for recognition as a completed sale in accordance with GAAP and therefore, we have not derecognized the assets transferred and have not recognized the seller-financed note on our consolidated balance sheet. |
|
Innovative Industrial Properties 21 Interest Rate / Preferred Rate / Maturity / Wtd. As of (In thousands, except share and per share amounts) Wtd. Avg. Rate(1) Avg. Maturity September 30, 2025 Secured debt: Revolving Credit Facility I 9.00% 1.1 Years $50,000 Total Secured Debt 9.00% 1.1 Years $50,000 Unsecured debt: Notes due 2026 5.50% 0.6 Years 291,215 Total Unsecured Debt 5.50% 0.6 Years $291,215 Gross Debt 6.01% 0.7 Years $341,215 Series A Preferred Stock: Redemption price per share $25.00 Shares outstanding 1,807,682 Total Preferred Equity 9.00% $45,192 Total Senior Capital 6.36% $386,407 Equity Market Capitalization: Stock Price as of 09/30/2025 $53.58 Shares outstanding 28,022,975 Equity Market Capitalization $1,501,471 Covenant (2) September 30, 2025 Debt / Total Gross Assets <60% 13% Secured Debt / Total Gross Assets <40% 2% Unencumbered Total Gross Assets / Unsecured Debt >150% 852% Debt Service Coverage Ratio >1.5x 11.7x Egan Jones Credit Rating BBB+ Debt Maturity Schedule Capital and Debt Summary $50.0 Million $291.2 Million 2025 2026 2027 2028 2029 Thereafter Notes Due 2026 Line of Credit Capital Overview 1) Revolving Credit Facility Rate I interest rate is the greater of: (a) the Prime Rate in effect from time to time, plus the Applicable Margin and (b) 9.00%. As of the quarter end 9% is the applied rate. 2) Calculated in accordance with the indenture governing the Notes due 2026, included in the Current Report on Form 8-K filed with the Securities and Exchange Commission on May 25, 2021. |
|
Innovative Industrial Properties 22 Analyst Coverage Analyst Research Firms Contact Information Aaron Grey Alliance Global Partners Email: agrey@allianceg.com Phone: 888-543-4448 Tom Catherwood BTIG Email: tcatherwood@btig.com Phone: 212-738-6140 Merrill Ross Compass Point Research and Trading Email: mross@compasspointllc.com Phone: 202-534-1392 Alexander Goldfarb Piper Sandler Email: alexander.goldfarb@psc.com Phone: 212-466-7937 Bill Kirk Roth Capital Partners Email: bkirk@roth.com Phone: 203-355-3473 Andy Liu Wolfe Research Email: aliu@wolferesearch.com Phone: 646-582-9257 Investor Relations Email: ir@iipreit.com Phone: 858-997-3332 |
|
Innovative Industrial Properties 23 Definitions Definitions listed hereafter apply throughout the Supplemental unless otherwise specifically noted. • Adjusted Funds From Operations (“AFFO”): Management believes that AFFO and AFFO per share are appropriate supplemental measures of a REIT’s operating performance. We calculate AFFO by adjusting Normalized FFO for certain non-cash items. • Annualized Base Rent (“ABR”): ABR is calculated by multiplying the sum of contractually due base rents and property management fees for the last month in the quarter, by twelve. • Annualized Base Rent and Income from Loans and Securities: Annualized Base Rent and Income from Loans and Securities is calculated by adding ABR and Income from Loans and Securities. • Annualized Income from Loans and Securities: Annualized Income from Loans and Securities is calculated by multiplying the principal balance as of the end of quarter, by the blended interest rate. • Development / Redevelopment (“Dev. / Redev.”) Properties: Defined as non-operating assets under development that are not leased and not ready for their intended use. • EBITDA and Adjusted EBITDA: EBITDA is defined as earnings (net income per income statement) before interest expense, income taxes, deprecation and amortization (including non-cash stock-based compensation, above-market lease amortization and corporate asset deprecation). Adjusted EBITDA is EBITDA adjusted for gain (loss) on sale of real estate, impairment loss on real estate, gain (loss) on exchange of Exchangeable Senior Notes, income on seller-financed note and deferred lease payments received on sales-type lease. • Exchangeable Senior Notes: 3.75% Exchangeable Senior Notes paid off in full in February 2024. • Funds From Operations (“FFO”): FFO and FFO per share are operating performance measures adopted by the National Association of Real Estate Investment Trusts, Inc. (“NAREIT”). NAREIT defines FFO as the most commonly accepted and reported measure of a REIT’s operating performance equal to net income (computed in accordance with GAAP), excluding gains (or losses) from sales of property, depreciation, amortization and impairment related to real estate properties, and after adjustments for unconsolidated partnerships and joint ventures. Management also excludes from FFO any disposition-contingent lease termination fee received in connection with a property sale. Management believes that net income, as defined by GAAP, is the most appropriate earnings measurement. However, management believes FFO and FFO per share to be supplemental measures of a REIT’s performance because they provide an understanding of the operating performance of our properties without giving effect to certain significant non-cash items, primarily depreciation expense. Historical cost accounting for real estate assets in accordance with GAAP assumes that the value of real estate assets diminishes predictably over time. However, real estate values instead have historically risen or fallen with market conditions. We believe that by excluding the effect of depreciation, FFO and FFO per share can facilitate comparisons of operating performance between periods. We report FFO and FFO per share because these measures are observed by management to also be the predominant measures used by the REIT industry and by industry analysts to evaluate REITs and because FFO per share is consistently reported, discussed, and compared by research analysts in their notes and publications about REITs. For these reasons, management has deemed it appropriate to disclose and discuss FFO and FFO per share. |
|
Innovative Industrial Properties 24 Definitions (Continued) • GAAP: Accounting principles generally accepted in the United States. • Gross Debt: Calculated as the sum of the principal amount outstanding of the Notes due 2026 and borrowing on the Revolving Credit Facility. • Liquidity: Total liquidity consists of cash and cash equivalents and short-term investments (each as reported in IIP’s consolidated balance sheet as of quarter end) and availability under IIP’s revolving credit facility. • Maturity / Weighted Average Maturity (“Wtd. Avg. Maturity”): Based on initial maturity, not inclusive of applicable extension options. • Normalized Funds From Operations (“Normalized FFO”): We compute normalized funds from operations (“Normalized FFO”) by adjusting FFO, as defined by NAREIT, to exclude certain GAAP income and expense amounts that we believe are infrequent and unusual in nature and/or not related to our core real estate operations. Exclusion of these items from similar FFO-type metrics is common within the equity REIT industry, and management believes that presentation of Normalized FFO and Normalized FFO per share provides investors with a metric to assist in their evaluation of our operating performance across multiple periods and in comparison to the operating performance of other companies, because it removes the effect of unusual items that are not expected to impact our operating performance on an ongoing basis. Normalized FFO is used by management in evaluating the performance of our core business operations. Items included in calculating FFO that may be excluded in calculating Normalized FFO include certain transaction-related gains, losses, income or expense or other non-core amounts as they occur. • Notes due 2026: 5.50% Unsecured Senior Notes due 2026. • Operating Portfolio: All properties that (a) are leased or (b) are not leased but ready for their intended use. • Pre-Leased Development (“Dev.”) Properties: Defined as non-operating assets under development that are leased but not ready for their intended use. • Series A Preferred: 9.00% Series A Cumulative Redeemable Preferred Stock, $0.001 par value per share. • Total Committed / Invested Capital: Includes (1) total investments in properties (consisting of purchase price and construction funding and improvements reimbursed to tenants, if any, but excluding transaction costs) and (2) total additional commitments to reimburse certain tenants and sellers for completion of construction and improvements at the properties. Excludes Loans and Securities. • Total Portfolio: All properties, including Development / Redevelopment Properties, Pre-Leased Redevelopment Properties, and Operating Portfolio, as of quarter end. • Total Preferred Equity: Calculated by multiplying the total Series A Preferred shares outstanding by the $25 redemption price per share. • Total Senior Capital: Calculated as the sum of Gross Debt and the redemption value of the Series A Preferred Stock. • % Leased: The weighted average leased percentage of the Operating Portfolio by Total Committed / Invested Capital. Excludes Redevelopment Properties and Pre-Leased Redevelopment Properties. Includes leases that are in default, as disclosed in our 8-K's filed on March 14, 2025 and March 28, 2025. |
|
Innovative Industrial Properties 25 9/30/2025 6/30/2025 3/31/2025 12/31/2024 9/30/2025 9/30/2024 Net income $29,305 $26,024 $31,077 $40,025 $86,406 $121,636 Adjustments for EBITDA: Interest expense 4,525 4,444 4,500 4,536 13,469 13,136 Taxes (including corporate tax expense in G&A) (2) 88 121 - 206 162 Depreciation and amortization 18,639 18,500 18,391 18,240 55,530 52,567 Above-market lease amortization 23 23 23 23 69 69 Corp. asset depreciation (included in G&A expense) 27 27 31 31 84 97 EBITDA $52,517 $49,106 $54,143 $62,855 $155,764 $187,667 Adjustments for Adjusted EBITDA: Non-cash stock-based compensation expense 2,684 2,672 2,078 4,315 7,434 13,002 Impairment loss on real estate - - 3,527 - 3,527 - Income on seller-financed note (2,375) 1,164 153 30 (1,058) 1,074 Deferred lease payments received on sales-type lease - 5 20 568 25 4,370 Adjusted EBITDA $52,826 $52,947 $59,921 $67,768 $165,692 $206,113 For the Three Months Ended, For the Nine Months Ended, 12/31/2024 12/31/2023 12/31/2022 12/31/2021 12/31/2020 Net income $ 161,661 $ 165,588 $ 154,386 $ 113,990 $ 65,730 Adjustments for EBITDA: Interest expense 17,672 17,467 18,301 18,086 7,431 Taxes (including corporate tax expense in G&A) 162 250 184 142 116 Depreciation and amortization 70,807 67,194 61,303 41,776 28,025 Above-market lease amortization 92 92 91 4 - Corp. asset depreciation (included in G&A expense) 128 122 123 105 85 EBITDA $ 250,522 $ 250,713 $ 234,388 $ 174,103 $ 101,387 Adjustments for Adjusted EBITDA: Non-cash stock-based compensation expense 17,317 19,581 17,507 8,616 3,330 Gain (loss) on sale of real estate 3,449 - (3,601) - - Gain (loss) on exchange of Exchangeable Senior Notes - 22 (125) (3,692) - Income on seller-financed note 1,104 1,342 - - - Deferred lease payments received on sales-type lease 4,938 - - - - Adjusted EBITDA $ 277,330 $ 271,658 $ 248,169 $ 179,027 $ 104,717 For the Year Ended Reconciliations – EBITDA and Adjusted EBITDA |
|
Innovative Industrial Properties 1 INNOVATIVE INDUSTRIAL PROPERTIES NYSE: IIPR INNOVATIVEINDUSTRIALPROPERTIES.COM COMPANY PRESENTATION – NOVEMBER 2025 |
|
Innovative Industrial Properties 2 This presentation and our associated comments includes "forward-looking statements" (within the meaning of the Private Securities Litigation Reform Act of 1995, Section 27A of the Securities Act of 1933, as amended, and Section 21E of the Securities Exchange Act of 1934, as amended) that are subject to risks and uncertainties. In particular, statements pertaining to our capital resources, portfolio performance and results of operations contain forward-looking statements. Likewise, our statements regarding anticipated growth in our funds from operations and anticipated market and regulatory conditions, our strategic direction, demographics, results of operations, plans and objectives are forward-looking statements. Forward-looking statements involve numerous risks and uncertainties, and you should not rely on them as predictions of future events. Forward-looking statements depend on assumptions, data or methods which may be incorrect or imprecise, and we may not be able to realize them. We do not guarantee that the transactions and events described will happen as described (or that they will happen at all). You can identify forward-looking statements by the use of forward-looking terminology such as “believes,” “expects,” “may,” “will,” “should,” “seeks,” “approximately,” “intends,” “plans,” “estimates” or “anticipates” or the negative of these words and phrases or similar words or phrases. You can also identify forward-looking statements by discussions of strategy, plans or intentions. The following factors, among others, could cause actual results and future events to differ materially from those set forth or contemplated in the forward-looking statements: rates of default on leases for our assets; our ability to re-lease properties upon tenant defaults or lease terminations for the rent we currently receive, or at all; concentration of our portfolio of assets and limited number of tenants; the estimated growth in and evolving market dynamics of the regulated cannabis market; anticipated funding sources for our investment in the preferred stock of IQHQ, Inc. ("IQHQ"); defaults on our investments in real estate-related assets, such as the IQHQ credit facility and IQHQ preferred stock; our ability to identify, acquire or profitably operate life science properties; market dynamics in the life science sector; the demand for regulated cannabis cultivation and processing facilities; decreased economic activity due to fluctuations in trade policies, tariffs, and related government actions; inflation dynamics; the impact of pandemics on us, our business, our tenants, or the economy generally; war and other hostilities, including the conflicts in Ukraine and Israel; our business and investment strategy; our projected operating results; actions and initiatives of the U.S. or state governments and changes to government policies and the execution and impact of these actions, initiatives and policies, including the fact that cannabis remains illegal under federal law; availability of suitable investment opportunities in the regulated cannabis industry; our understanding of our competition and our potential tenants’ alternative financing sources; the expected medical-use or adult-use cannabis legalization in certain states; shifts in public opinion regarding regulated cannabis; the potential impact on us from litigation matters, including rising liability and insurance costs; the additional risks that may be associated with certain of our tenants cultivating, processing and/or dispensing adult-use cannabis in our facilities; the state of the U.S. economy generally or in specific geographic areas; economic trends and economic recoveries; our ability to access equity or debt capital; financing rates for our target assets; our level of indebtedness, which could reduce funds available for other business purposes and reduce our operational flexibility; covenants in our debt instruments, which may limit our flexibility and adversely affect our financial condition; our ability to maintain our investment grade credit rating; changes in the values of our assets; our expected portfolio of assets; our expected investments; interest rate mismatches between our assets and our borrowings used to fund such investments; changes in interest rates and the market value of our assets; the degree to which any interest rate or other hedging strategies may or may not protect us from interest rate volatility; the impact of and changes in governmental regulations, tax law and rates, accounting guidance and similar matters; how and when any forward equity sales may settle; our ability to maintain our qualification as a real estate investment trust (“REIT”) for U.S. federal income tax purposes; our ability to maintain our exemption from registration under the Investment Company Act of 1940; availability of qualified personnel; and market trends in our industry, interest rates, real estate values, the securities markets or the general economy. The risks included here are not exhaustive, and additional factors could adversely affect our business and financial performance. In addition, we discussed a number of material risks in our most recent Annual Report on Form 10-K and subsequent Quarterly Reports on Form 10-Q. Those risks continue to be relevant to our performance and financial condition. Moreover, we operate in a very competitive and rapidly changing environment. New risk factors emerge from time to time and it is not possible for management to predict all such risk factors, nor can it assess the impact of all such risk factors on our business or the extent to which any factor, or combination of factors, may cause actual results to differ materially from those contained in any forward-looking statements. Any forward-looking statement made by us speaks only of the date on which we make it. We undertake no obligation to publicly update or revise any forward-looking statements, whether as a result of new information, future events or otherwise, except as may be required by law. Stockholders and investors are cautioned not to unduly rely on such forward-looking statements when evaluating the information presented in our filings and reports. This presentation includes certain non-GAAP financial measures. These non-GAAP measures are presented for supplemental information and should not be considered a substitute for financial information presented in accordance with GAAP. A reconciliation of these non-GAAP measures to the most directly comparable GAAP measures is set forth in the Appendix to this presentation. Market and industry data are included in this presentation. We have obtained substantially all of this information from internal studies, public filings, other independent published industry sources and market studies prepared by third parties. We believe these internal studies, public filings, other independent published industry sources and market studies prepared by third parties are reliable. However, this information may prove to be inaccurate. No representation or warranty is made as to the accuracy of such information. All amounts shown in this presentation are unaudited. This is not an offer to sell or solicitation to buy securities of Innovative Industrial Properties, Inc. Any offers to sell or solicitations to buy securities of Innovative Industrial Properties, Inc. shall be made only by means of a prospectus approved for that purpose. FORWARD LOOKING STATEMENTS |
|
Innovative Industrial Properties 3 Note: Data as of September 30, 2025, unless otherwise noted. (1) Total Committed / Invested Capital: Includes (1) total investments in properties (consisting of purchase price and construction funding and improvements reimbursed to tenants, if any, but excluding transaction costs) and (2) total additional commitments to reimburse certain tenants and sellers for completion of construction and improvements at the properties. Excludes Loans and Securities. (2) Weighted average lease length calculated by weighting the remaining lease term based on the base rent and management fees, after the expiration of applicable base rent phase-in periods for the Operating Portfolio. IIPR AT A GLANCE $2.5B Total Committed / Invested Capital(1) 112 Total Properties 12.9 Years Weighted Average Lease Length (2) $64.7M Q3 2025 Total Revenue $270M Commitment to Life Science 19 U.S. States $1B+ Dividends Paid Since Inception in ‘16 Innovative Industrial Properties, Inc. (NYSE: IIPR) is a diversified REIT with investments across cannabis and life sciences |
|
Innovative Industrial Properties 4 INVESTMENT HIGHLIGHTS DIVERSIFIED BUSINESS MODEL • $2.5B triple-net lease portfolio • Strong initial yields with annual escalators • $270M financial investment in life science industry STRONG BALANCE SHEET • One of the lowest leveraged REITs • Demonstrated access to multiple capital markets • October closing on $100M credit facility DIVERSIFIED PORTFOLIO • Properties across 19 U.S. states • Leased to 35+ tenants • Mix of industrial and retail properties NICHE EXPERTISE • Experience working with tenants and borrowers in heavily regulated industries • Diligent underwriting process focused on best-in-class operators • Seasoned management team with significant REIT experience GROWING MARKETS • 7% CAGR projected in cannabis industry over next 5 years (1) • Life science R&D expenditures have grown 7% annually from 2014-2024 (2) STRONG TRACK RECORD • 7% CAGR in AFFO/share ‘20 – Q3’25 Ann. • Total return since inception in 2016 of >350%(3) • Over $1B in dividends paid since inception in 2016 (1) BDSA Legal Cannabis Market Forecast (March 2025). (2) CBRE 2025 U.S. Life Sciences Outlook (February 2025). (3) Per S&P Capital IQ Pro as of 9/30/2025. |
|
Innovative Industrial Properties 5 NNN Leases • Target leases are generally 100% triple-net ⚬ No recurring capital expenditures during lease term ⚬ All property expenses paid by the tenant, including capital repairs, property taxes and property insurance • Typically, 15-20 year initial lease terms (vs. ~5 years for traditional industrial leases) • Leases generally subject to parent company guarantees covering operations throughout the U.S. Life Science Investments • New initiative announced in Q3’25 • Target investments are with assets or real estate companies in major life science markets ⚬ Attractive spread to cost of capital ⚬ Enhances scale and diversification by industry and tenant ⚬ Provides growth opportunities in large and growing sector OUR BUSINESS MODEL & BENEFITS PORTFOLIO COMPOSITION CANNABIS 95.3% LIFE SCIENCES 4.5% $315M TOTAL ANNUAL INCOME (1) OTHER 0.2% Shifting Revenue Mix More Towards Life Sciences Note: Data as of September 30, 2025, unless otherwise noted. (1) Based on “Annualized Base Rent and Income from Loans and Securities”, Annualized Base Rent and Income from Loans and Securities is calculated by adding Annualized Base Rent (“ABR”) and Income from Loans and Securities. ABR is calculated by multiplying the sum of contractually due base rents and property management fees for the last month in the quarter, by twelve. Annualized Income from Loans and Securities is calculated by multiplying the principal balance as of the end of quarter, by the blended interest rate. |
|
Innovative Industrial Properties 6 NNN PORTFOLIO OVERVIEW IIPR has a geographically diversified triple net portfolio of cannabis real estate throughout the United States Note: Data as of September 30, 2025, unless otherwise noted. (1) As a % of Annualized Base Rent (“ABR”). ABR is calculated by multiplying the sum of contractually due base rents and property management fees for the last month in the quarter, by twelve. (2) “Industrial” reflects facilities utilized or expected to be utilized for regulated cannabis cultivation, processing and/or distribution activities, which can consist of industrial and/or greenhouse space. Property Type (1) State Diversification(1) State ABR ($000s)(1) % of ABR(1) # of Properties Square Feet (000s) Illinois $44,814 15.1% 7 965 Pennsylvania 42,602 14.4% 10 1,361 Massachusetts 34,456 11.6% 10 989 New York 33,068 11.2% 2 623 Florida 31,087 10.5% 5 1,153 Michigan 21,597 7.3% 13 901 Ohio 17,826 6.0% 5 374 New Jersey 13,832 4.7% 4 291 Maryland 13,662 4.6% 5 316 California 12,454 4.2% 11 869 Total – Top 10 States $265,398 89.6% 72 7,842 0-5% 5-10% 10-15% No Presence 2% Retail 90% Industrial(2) 8% Industrial / Retail |
|
Innovative Industrial Properties 7 Tenant ABR ($000s) ABR (%)(1) Square Feet (000s) ABR/SF $33,880 11.4% 430 $79 31,278 10.6% 624 50 22,570 7.6% 664 34 20,885 7.1% 578 36 19,893 6.7% 740 27 18,516 6.3% 588 31 18,116 6.1% 488 37 17,257 5.8% 298 58 16,971 5.7% 379 45 16,216 5.5% 593 27 Total $215,582 72.8% 5,382 $40 NNN PORTFOLIO TOP 10 TENANTS Note: Data as of September 30, 2025, unless otherwise noted. (1) As a % of Annualized Base Rent (“ABR”). ABR is calculated by multiplying the sum of contractually due base rents and property management fees for the last month in the quarter, by twelve. (2) Each “Tenant” represents the parent company of the tenant, for which the parent company has provided a corporate guaranty. A parent company may have multiple tenant subsidiaries across IIP’s properties. Total Committed / Invested Capital includes (1) total investments in properties (consisting of purchase price and improvements reimbursed to tenants, if any, but excluding transaction costs) and (2) total additional commitments to reimburse certain tenants for completion of construction and improvements at the properties. Excludes Loans and Securities. (3) Excludes non-cannabis tenants that comprise less than 1% of annualized base rent in the aggregate. (4) “MSO” stands for Multi-State Operator which means the tenant (or guarantor) conducts cannabis operations in more than one state. “SSO” stands for Single-State Operator which means the tenant (or guarantor) conducts cannabis operations in a single state. (5) These leases are in default, as disclosed in our 8-K filed on March 14, 2025. (6) These leases are in default, as disclosed in our 8-K filed on March 28, 2025. Company Type 65% Public 35% Private $30.0M $73.3M $167.4M $690.0M $1.3B $2.0B $2.3B $2.4B $2.5B $2.5B 1 4 8 18 20 26 29 32 35 36 2016 2017 2018 2019 2020 2021 2022 2023 2024 9/30/25 Invested Capital # of Tenants Total Committed / Invested Capital & Tenant Growth(2) Tenant Composition(1)(3) Operator Type (4) 90% MSO 10% SSO (5) (6) |
|
Innovative Industrial Properties 8 LIFE SCIENCES INVESTMENT • IQHQ – A Premier Life Science Real Estate Platform • $5B+ in total investments • 5+ million square feet of properties in leading life science markets including Boston, San Francisco and San Diego • Strategic and Financially Accretive Transaction • $270M total investment, comprised of: • $100M investment in a 3-year revolving credit facility: 13.5% yield • $170M investment in preferred stock: 15.0% yield • In addition, potential to receive warrants in IQHQ earned upon the satisfaction of certain funding milestones • IIP has a right of first offer on future asset sales of IQHQ • Expected to be significantly accretive to AFFO per share • Diversification and Life Science Expertise • Improves sector diversification with rental revenues from cannabis facilities decreasing to 88% of total(1) • IIP’s management team has decades of combined experience in the life science real state industry (1) As disclosed in the August 6, 2025 press release announcing a $270 million investment in IQHQ, figures are based on the pro forma annualized contractual base rent as of June 30, 2025, assuming a fully funded $270 million IQHQ investment. |
|
Innovative Industrial Properties 9 STRONG, LOW LEVERAGED BALANCE SHEET Debt Overview Revolving Credit Facility: • -$87.5M total commitment, $37.5M available Unsecured Senior Notes: • -Investment grade rating BBB+ from Egan Jones, since May 2021 • -$291.2M of 5.50% unsecured senior notes due May 2026 13% Debt to Total Gross Assets(1) 11.7x Debt Service Coverage Ratio (1) $79M+ Liquidity Available (2) - $291.2M - - - - $50M 2025 2026 2027 2028 2029 Thereafter Debt Maturity Schedule Credit Facility Unsecured Notes Gross Debt $341.2M Preferred Equity $45.2M Common Equity Market Capitalization $1.5B Capital Structure(3) % Note: As of September 30, 2025, unless otherwise noted. (1) Calculated in accordance with the indenture governing the Notes due 2026, included in the Current Report on Form 8-K filed with the Securities and Exchange Commission on May 25, 2021. (2) Total liquidity consists of cash and cash equivalents and short-term investments (each as reported in IIP’s consolidated balance sheet as of quarter end) and availability under IIP’s revolving credit facility. (3) Share price per S&P Capital IQ Pro as of 9/30/2025. |
|
Innovative Industrial Properties 10 STRONG, LONG-TERM AFFO AND DIVIDEND TRACK RECORD (1) Adjusted funds from operations (“AFFO”) is a supplemental non-GAAP financial measure used in the real estate industry to measure and compare the operating performance of real estate companies. A complete reconciliation containing adjustments from GAAP net income attributable to common stockholders to AFFO is included in the “AFFO Reconciliation” found at the end of this presentation. (2) "CAGR" represents compound annualized growth rate for the relevant metric. (3) Per S&P Capital IQ Pro as of 9/30/2025. RMZ represents the MSCI US REIT Index. $4.47 $7.60 2020 Q3'25 (Ann) Dividends Per Share $5.01 $6.84 2020 Q3'25 (Ann) AFFO Per Share(1) S&P 500 255% RMZ 73% 73% 255% 356% IIPR Total Returns Since IIPR Inception(3) S&P 500 RMZ 4.9x Greater Return than RMZ AFFO AND DIVIDEND TRACK RECORD |
|
Innovative Industrial Properties 11 1.0 1.2 1.4 1.6 1.8 2.0 2.2 Q4'15 Q1'16 Q2'16 Q3'16 Q4'16 Q1'17 Q2'17 Q3'17 Q4'17 Q1'18 Q2'18 Q3'18 Q4'18 Q1'19 Q2'19 Q3'19 Q4'19 Q1'20 Q2'20 Q3'20 Q4'20 Q1'21 Q2'21 Q3'21 Q4'21 Q1'22 Q2'22 Q3'22 Q4'22 Q1'23 Q2'23 Q3'23 Q4'23 Q1'24 Q2'24 Q3'24 Q4'24 Q1'25F Q2'25F Q3'25F Q4'25F Life Sciences Employment Forecast Cannabis Market Overview SERVING TWO CORE GROWTH MARKETS Life Sciences Market Overview Cannabis Industry Revenue Comparison(1) Life Sciences Employment Growth to Continue (3) $37B $37B $14B $31B $44B - $10 $20 $30 $40 $50 2024 US Spirits Market 2024 US Beer Market 2024 US Wine Market Est. 2024 US Legal Cannabis Sales Projected 2029 US Legal Cannabis Sales Forecast • Market Growth: U.S. legal cannabis sales market grew 6% to $31.4 billion in 2024 vs. a 1% decline for the U.S. Spirits Market to $37.2 billion in the same period(1) • Emerging Adult-Use Markets: Projected to drive meaningful growth through 2029, in particular NY, NJ, OH, PA, MN, CT, and MD(1) • Expansion of Legalization:. Approximately 79% of Americans live in a county where marijuana is legal for either recreational or medical use and 54% of Americans live in a state where the recreational use of marijuana is legal(2) • Market Growth: The U.S. Life Science Market continues to see strong growth in both employment and investment (3) • Nearshoring of BioPharma production: Tariffs in the pharmaceutical sector are driving a re-shoring of production, with 15 project investments totaling over $270B announced through mid-May 2025 (4) • Limited New Supply: Limited future class A new build is expected to tighten leasing markets as companies continue to expand their U.S. operations. (5) 94% of life sciences CEOs say they will increase headcount over the next three years 37% of the total think they will grow their workforce by 6% or more 19,000 new jobs in 2025 (1) BDSA Legal Cannabis Market Forecast (March 2025), Distilled Spirits Council of the United States. (2) Pew Research Center (July 2025). (3) CBRE 2025 U.S. Life Sciences Outlook (February 2025). (4) Jones Lang LaSalle U.S. Life Sciences Property Report (June 2025). (5) Cushman & Wakefield Life Sciences Update (September 2025). |
|
Innovative Industrial Properties 12 © GeoNames, Microsoft, TomTom Powered by Bing Long Term Growth Outlook U.S. CANNABIS MARKET CONTINUES TO GROW Increased Banking Services (4) Industry Revenue Projection(1) Growing U.S. Legalization(5) (1) BDSA Legal Cannabis Market Forecast (March 2025), Distilled Spirits Council of the United States. (2) 2020 US Census Data. (3) Pew Research Center (July 2025). (4) Treasury Department, FDIC data. (5) National Conference of State Legislatures (www.ncsl.org), MJBizDaily (mjbizdaily.com). Other, N/A Adult-Use Medical-Use $31B $44B 2024 2025E 2026E 2027E 2028E 2029E $44B Estimated Legal Cannabis Sales by 2029(1) 68% U.S. Population in States with an IIPR Presence(2) 87% U.S. adults say marijuana should be legal at some level(3) • Increasing trend in FDIC banks offering services to marijuana-related business (“MRBs”) (from 2014 to 2024) reaching an all-time high of ~13% of the total number of banks in 2024 • Steady growth in the number of depository institutions supporting MRBs • ~800 banks, credit unions and other institutions providing services to marijuana-related businesses |
|
Innovative Industrial Properties 13 $85B $165B 2014 2015 2016 2017 2018 2019 2020 2021 2022 2023 2024* U.S. Life Sciences Public Company R&D Expenditures Office Life Science San Diego Office Life Science Boston Office Life Science All US Strong Life Science Rent Premiums vs Office Rents(1) LIFE SCIENCES MARKET OPPORTUNITY Construction Pipeline Decelerating(1) Companies Ramping Investment(2) Strong Pipeline of Potential New Approvals (2) *2024 Annualized from H1 Actual (1) Cushman & Wakefield Life Sciences Update (September 2025). (2) CBRE 2025 U.S. Life Sciences Outlook (February 2025). 10% 9% 8% 8% 8% 9% 9% 10% 11% 17% 17% 15% 13% 10% 9% 8% 7% 4% 3% 2% 4% 6% 8% 10% 12% 14% 16% 18% - 5 10 15 20 25 30 35 40 Q4'20Q1'21Q2'21Q3'21Q4'21Q1'22Q2'22Q3'22Q4'22Q1'23Q2'23Q3'23Q4'23Q1'24Q2'24Q3'24Q4'24Q1'25Q2'25 Millions of Square Feet Inventory Under Construction Under Construction % of Total Inventory (RHS) – 1,000 2,000 3,000 4,000 5,000 6,000 Preclinical Phase I Phase I/II Phase II Phase II/III Phase III U.S. Life Sciences Products by Development Phase |
|
Innovative Industrial Properties 14 UNDERWRITING & MONITORING Diligent underwriting process with a focus on best-in-class operators Review of Management • Experienced management team • Alignment of management within ownership of the business Ability to Raise Capital • Evaluation of the macro environment surrounding strategic capital raising in the tenants’ and borrowers’ prospective markets • History of successful capital raising and a cash balance on hand today Financial Underwriting • Evaluation of financial projections utilizing existing knowledge of industry dynamics • Detailed review of financial statements, strategic initiatives, and growth plans Ongoing Monitoring • Quarterly financial and operational review of all properties • Meetings with tenants to talk through operations and financials |
|
Innovative Industrial Properties 15 Alan Gold Executive Chairman & Co-Founder Co-founder of BioMed Realty Trust (formerly NYSE: BMR); served as Chairman and CEO from inception of its predecessor in 1998 through BMR’s sale in 2016 • Owner and operator of high-quality life science real estate • Previously publicly traded investment grade REIT Co-founded Alexandria Real Estate Equities (NYSE: ARE) in 1994 and served as President and a director until 1998 • Invests in office buildings and laboratories leased to life science and technology companies Co-founder of IQHQ, Inc.; served as Executive Chairman from December 2018 until December 2024 • Privately-held life science real estate company with over $5B of total assets EXECUTIVE CHAIRMAN & CO-FOUNDER Alan Gold has experience founding and leading real estate companies focused on nuanced, regulated industries. |
|
Innovative Industrial Properties 16 David Smith • 20+ years of finance and real estate experience • Former CFO of Aventine Property Group and New Senior Investment Group (NYSE: SNR) CFO and Treasurer • 35+ years of legal and regulatory experience • Previously co-founded Iso Nano International, LLC Paul Smithers President, CEO and Co-Founder • 20+ years of real estate and accounting experience • Former Senior Associate, Investments and Asset Management at BioMed Realty CIO Catherine Hastings Ben Regin • 25+ years of accounting and real estate experience • Former VP, Internal Audit of BioMed Realty COO Andy Bui • Former Senior Director, Financial Reporting at BioMed Realty VP, Chief Accounting Officer • 20+ years legal experience representing real estate matters • Former attorney at Foley & Lardner LLP SVP, Real Estate Counsel Tracie Hager Kelly Spicher • 30+ years of experience in property management • Former VP, Property Management at BioMed Realty SVP, Asset Management SENIOR MANAGEMENT TEAM |
|
Innovative Industrial Properties 17 WHY INVEST IN IIPR Powerful triple -net lease model with structured long -term cash flows Strong balance sheet with access to growth capital Diversified real estate portfolio across 19 states with 35+ tenants Solid capital allocation track record enabling robust earnings and dividend distributions Exposure to two above -GDP growth markets in cannabis and life sciences High -quality platform, process, and management team to drive growth 123456 |
|
Innovative Industrial Properties 18 APPENDIX |
|
Innovative Industrial Properties 19 3Q 2025 FY 2020 Actual Annualized Actual Net income attributable to common stockholders $28,288 $113,152 $64,378 Real estate depreciation and amortization 18,639 74,556 28,025 FFO attributable to common stockholders (basic) $46,927 $187,708 $92,403 FFO attributable to common stockholders (diluted) 46,927 187,708 92,403 Financing expense - - 211 Acquisition-related expense - - 94 Litigation-related expense 604 2,416 - Income on seller-financed note(1) (2,375) (9,500) - Normalized FFO attributable to common stockholders (diluted) 45,156 180,624 92,708 Stock-based compensation 2,684 10,736 3,330 Non-cash interest expense 485 1,940 2,040 Above-market lease amortization 23 92 - AFFO attributable to common stockholders (diluted) $48,348 $193,392 $98,078 FFO per common share – diluted $1.66 $6.64 $4.72 Normalized FFO per common share – diluted $1.60 $6.40 $4.74 AFFO per common share – diluted $1.71 $6.84 $5.01 Weighted average common shares outstanding – basic 27,912,881 27,912,881 19,443,602 Restricted stock and restricted stock units ("RSUs") 390,719 390,719 114,017 Weighted average common shares outstanding – diluted 28,303,600 28,303,600 19,557,619 AFFO RECONCILIATION Note: During the three months ended September 30, 2025, IIP revised its presentation of Normalized FFO to include two adjustments related to income on seller-financed notes and deferred lease payments received on sales-type leases that were previously reflected in adjusted funds from operations (“AFFO”), which has been reflected for all periods presented. Management believes this change better aligns the Company’s presentation with its assessment of core operating performance and improves comparability with industry peers. Items included in calculating FFO that may be excluded in calculating Normalized FFO include certain transaction-related gains, losses, income or expense or other non-core amounts as they occur. (1) Amounts represent non-refundable cash payments received pursuant to two seller-financed notes issued by IIP in connection with IIP's disposition of certain properties. As the transactions did not qualify for recognition as completed sales under GAAP, the payments were initially recorded as a deposit liability and included in other liabilities on IIP consolidated balance sheet. For both the three and nine months ended September 30, 2025, the negative amounts resulted from the recognition of $2.6 million of non-refundable cash payments received as interest and other income in connection with the termination of one of the seller-financed notes. |