UNITED STATES
SECURITIES AND EXCHANGE COMMISSION
Washington, D.C. 20549
FORM 6-K
Report of Foreign Private Issuer Pursuant to
Rule 13a-16 or 15d-16
under the Securities Exchange Act of 1934
For the month of October 2025
Commission File Number 001-11444
| MAGNA INTERNATIONAL INC. |
| (Exact Name of Registrant as specified in its Charter) |
| 337 Magna Drive, Aurora, Ontario, Canada L4G 7K1 |
| (Address of principal executive office) |
Indicate by check mark whether the registrant files or will file annual reports under cover Form 20-F or Form 40-F.
Form 20-F ¨ Form 40-F x Pursuant to the requirements of the Securities Exchange Act of 1934, the registrant has duly caused this report to be signed on its behalf by the undersigned, thereunto duly authorized.
SIGNATURES
| MAGNA INTERNATIONAL INC. | ||
| (Registrant) | ||
| Date: October 31, 2025 | ||
| By: | /s/ “Bassem Shakeel” | |
| Bassem A. Shakeel, | ||
| Vice-President, Associate General Counsel and Corporate Secretary | ||
EXHIBITS
Exhibit 99.1
 |
PRESS RELEASE |
| MAGNA ANNOUNCES THIRD QUARTER 2025 RESULTS |
| · | Strong execution and operational excellence drove improved performance |
| · | Year-over-year comparison (third quarter of 2025 versus third quarter of 2024): |
| ̵ | Sales increased 2% to $10.5 billion, supported by a 3% rise in global light vehicle production | |
| ̵ | Income from operations before income taxes was $473 million, down 32%, as the prior year included recognition of Fisker deferred revenue as Other income | |
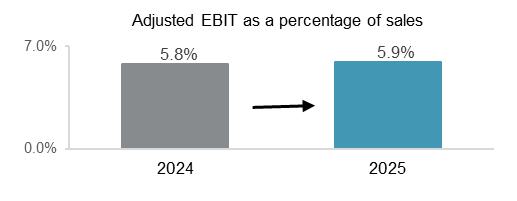
| ̵ | Adjusted EBIT increased 3% to $613 million, with a 10 basis-point improvement in Adjusted EBIT margin | |
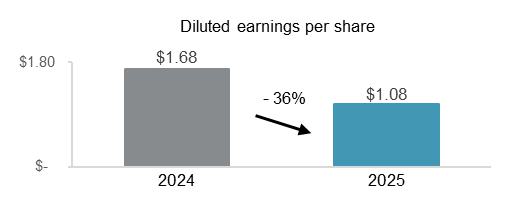
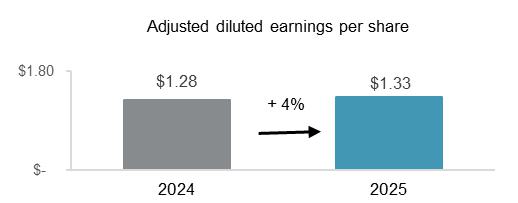
| ̵ | Diluted earnings per share were $1.08; Adjusted diluted earnings per share rose 4% to $1.33 |
| · | Increase 2025 outlook for Sales, Adjusted EBIT Margin, and Adjusted Net Income attributable to Magna, reflecting confidence in our strategic positioning and execution |
| · | Board approved Normal Course Issuer Bid to purchase up to 10% of our public float of Common Shares |
AURORA, Ontario, October 31, 2025 — Magna International Inc. (TSX: MG; NYSE: MGA) today reported financial results for the third quarter ended September 30, 2025.
 |
"Our strong third quarter performance exceeded our expectations and underscores the resilience of our business amid dynamic operating conditions and evolving macroeconomic trends. These results reflect the strength of our global team and the effectiveness of our strategic execution.
Looking ahead, our updated 2025 Outlook reflects continued confidence in our ability to execute and deliver a solid fourth quarter to finish the year. We anticipate robust free cash flow, which will support future growth opportunities and reinforce our disciplined approach to capital allocation – all with a focus on creating long-term value for shareholders.”
- Swamy Kotagiri, Magna’s Chief Executive Officer
|
| THREE MONTHS
ENDED SEPTEMBER 30, |
NINE MONTHS
ENDED SEPTEMBER 30, |
|||||||||||||||
| 2025 | 2024 | 2025 | 2024 | |||||||||||||
| Reported | ||||||||||||||||
| Sales | $ | 10,462 | $ | 10,280 | $ | 31,162 | $ | 32,208 | ||||||||
| Income from operations before income taxes | $ | 473 | $ | 700 | $ | 1,194 | $ | 1,161 | ||||||||
| Net Income attributable to Magna International Inc. | $ | 305 | $ | 484 | $ | 830 | $ | 806 | ||||||||
| Diluted earnings per share | $ | 1.08 | $ | 1.68 | $ | 2.94 | $ | 2.81 | ||||||||
| Non-GAAP Financial Measures(1) | ||||||||||||||||
| Adjusted EBIT | $ | 613 | $ | 594 | $ | 1,550 | $ | 1,640 | ||||||||
| Adjusted diluted earnings per share | $ | 1.33 | $ | 1.28 | $ | 3.55 | $ | 3.72 | ||||||||
All results are reported in millions of U.S. dollars, except per share figures, which are in U.S. dollars
| (1) | Adjusted EBIT and Adjusted diluted earnings per share are Non-GAAP financial measures that have no standardized meaning under U.S. GAAP, and as a result may not be comparable to the calculation of similar measures by other companies. Further information and a reconciliation of these Non-GAAP financial measures is included in the back of this press release. |
| MAGNA ANNOUNCES THIRD QUARTER 2025 RESULTS |
CONNECT WITH MAGNA
|
|
THREE MONTHS ENDED SEPTEMBER 30, 2025
We posted sales of $10.5 billion for the third quarter of 2025, an increase of 2% from the third quarter of 2024. The higher sales largely reflects:
| · | the launch of new programs; |
| · | the net strengthening of foreign currencies against the U.S. dollar; and |
| · | 3% higher global light vehicle production. |
These factors were partially offset by:
| · | the end of production of certain programs; |
| · | lower complete vehicle assembly volumes, substantially due to the end of production of the Jaguar I-Pace and E-Pace; |
| · | net customer price concessions subsequent to the third quarter of 2024; and |
| · | lower production on certain programs. |
Adjusted EBIT increased to $613 million in the third quarter of 2025 compared to $594 million in the third quarter of 2024. This mainly reflects:
| · | continued productivity and efficiency improvements, including the benefit of our operational excellence initiatives and recent restructuring activities; and |
| · | higher equity income. |
These were partially offset by:
| · | commercial items in the third quarters of 2025 and 2024, which had a net unfavourable impact on a year-over-year basis; and |
| · | higher tariff costs. |
Income from operations before income taxes decreased to $473 million for the third quarter of 2025 compared to $700 million in the third quarter of 2024, which includes Other expense (income), net(2) items and Amortization of acquired intangibles totaling $75 million and ($160) million in the third quarters of 2025 and 2024, respectively. The most significant item in Other expense (income) in either period was the positive impact of recognizing $196 million of Fisker deferred revenue in the third quarter of 2024 as the associated agreements were cancelled. Excluding Other expense (income), net and Amortization of acquired intangibles from both periods, income from operations before income taxes increased $8 million in the third quarter of 2025 compared to the third quarter of 2024, largely reflecting the increase in Adjusted EBIT.
Net income attributable to Magna International Inc. was $305 million for the third quarter of 2025 compared to $484 million in the third quarter of 2024. Excluding Other expense (income), net, after tax and Amortization of acquired intangibles from both periods, net income attributable to Magna International Inc. increased $6 million in the third quarter of 2025 compared to the third quarter of 2024.
Diluted earnings per share were $1.08 in the third quarter of 2025, compared to $1.68 in the comparable period. Adjusted diluted earnings per share were $1.33, compared to $1.28 for the third quarter of 2024, an increase of 4%. The increase in adjusted diluted earnings per share reflects the impacts of higher adjusted EBIT and a lower share count resulting from share repurchases over the past 12 months.
In the third quarter of 2025, we generated cash from operations before changes in operating assets and liabilities of $787 million and $125 million in operating assets and liabilities. Investment activities for the third quarter of 2025 included $267 million in fixed asset additions, a $100 million increase in investments, other assets and intangible assets, and $2 million in private equity investments.
| (2) | Other expense (income), net is comprised of restructuring activities, loss (gain) on sales of public equity investments, revaluations of certain public and private equity investments and public company warrants, asset impairments, Fisker Inc. ["Fisker"] related impacts (recognition of previously deferred revenue, restructuring, impairment of Fisker related net assets, and the impairment of Fisker warrants), and gain on business combination during the three and nine months ended September 30, 2025 & 2024. A reconciliation of these Non-GAAP financial measures is included in the back of this press release. |
| MAGNA ANNOUNCES THIRD QUARTER 2025 RESULTS |
CONNECT WITH MAGNA
|
|
NINE MONTHS ENDED SEPTEMBER 30, 2025
We posted sales of $31.2 billion for the nine months ended September 30, 2025, compared to $32.2 billion for the nine months ended September 30, 2024. The lower sales largely reflects:
| · | 2% lower light vehicle production in both North America and Europe; |
| · | lower complete vehicle assembly volumes, substantially due to the end of production of the Jaguar I-Pace and E-Pace; and |
| · | the end of production of certain programs. |
These were partially offset by the launch of new programs.
Adjusted EBIT decreased to $1.55 billion for the nine months ended September 30, 2025 compared to $1.64 billion for the nine months ended September 30, 2024 primarily due to:
| · | reduced earnings on lower sales; and |
| · | higher tariff costs. |
These were partially offset by continued productivity and efficiency improvements, including the benefit of our operational excellence initiatives and recent restructuring activities.
During the nine months ended September 30, 2025, income from operations before income taxes was $1.19 billion, and net income attributable to Magna International Inc. was $830 million, increases of $33 million and $24 million, respectively, each compared to the nine months ended September 30, 2024.
During the nine months ended September 30, 2025, diluted earnings per share were $2.94, compared to $2.81 in the nine months ended September 30, 2024. Adjusted diluted earnings per share were $3.55, compared to $3.72 for the nine months ended September 30, 2024.
During the nine months ended September 30, 2025, we generated cash from operations before changes in operating assets and liabilities of $2.10 billion and used $480 million in operating assets and liabilities. Investment activities included $781 million in fixed asset additions, a $342 million increase in investments, other assets and intangible assets, and $6 million in public and private equity investments.
RETURN OF CAPITAL TO SHAREHOLDERS
During the three months ended September 30, 2025, we paid $136 million in dividends to shareholders.
Our Board of Directors declared a fourth quarter dividend of $0.485 per Common Share, payable on November 28, 2025 to shareholders of record as of the close of business on November 14, 2025.
OTHER MATTERS
Subject to the approval by the Toronto Stock Exchange, our Board of Directors approved a new Normal Course Issuer Bid ("NCIB") to purchase up to approximately 25.3 million of our Common Shares, representing 10% of our public float of Common Shares. This NCIB is expected to be effective on November 7, 2025 and will terminate no later than November 6, 2026.
| MAGNA ANNOUNCES THIRD QUARTER 2025 RESULTS |
CONNECT WITH MAGNA
|
|
SEGMENT SUMMARY
| THREE MONTHS ENDED SEPTEMBER 30, | ||||||||||||||||||||||||
| ($Millions) | Sales | Adjusted EBIT | ||||||||||||||||||||||
| 2025 | 2024 | Change | 2025 | 2024 | Change | |||||||||||||||||||
| Body Exteriors & Structures | $ | 4,147 | $ | 4,038 | $ | 109 | $ | 305 | $ | 273 | $ | 32 | ||||||||||||
| Power & Vision | 3,854 | 3,837 | 17 | 236 | 279 | (43 | ) | |||||||||||||||||
| Seating Systems | 1,520 | 1,379 | 141 | 62 | 51 | 11 | ||||||||||||||||||
| Complete Vehicles | 1,085 | 1,159 | (74 | ) | 29 | 27 | 2 | |||||||||||||||||
| Corporate and Other | (144 | ) | (133 | ) | (11 | ) | (19 | ) | (36 | ) | 17 | |||||||||||||
| Total Reportable Segments | $ | 10,462 | $ | 10,280 | $ | 182 | $ | 613 | $ | 594 | $ | 19 | ||||||||||||
| THREE
MONTHS ENDED SEPTEMBER 30, |
||||||||||||
| Adjusted
EBIT as a percentage of sales |
||||||||||||
| 2025 | 2024 | Change | ||||||||||
| Body Exteriors & Structures | 7.4 | % | 6.8 | % | 0.6 | % | ||||||
| Power & Vision | 6.1 | % | 7.3 | % | (1.2 | )% | ||||||
| Seating Systems | 4.1 | % | 3.7 | % | 0.4 | % | ||||||
| Complete Vehicles | 2.7 | % | 2.3 | % | 0.4 | % | ||||||
| Consolidated Average | 5.9 | % | 5.8 | % | 0.1 | % | ||||||
| NINE MONTHS ENDED SEPTEMBER 30, | ||||||||||||||||||||||||
| ($Millions) | Sales | Adjusted EBIT | ||||||||||||||||||||||
| 2025 | 2024 | Change | 2025 | 2024 | Change | |||||||||||||||||||
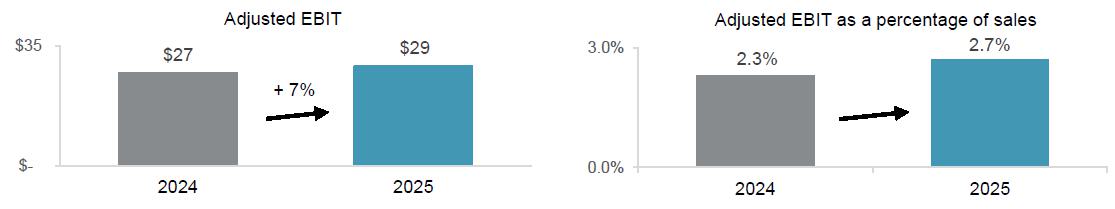
| Body Exteriors & Structures | $ | 12,366 | $ | 12,932 | $ | (566 | ) | $ | 882 | $ | 912 | $ | (30 | ) | ||||||||||
| Power & Vision | 11,357 | 11,605 | (248 | ) | 522 | 575 | (53 | ) | ||||||||||||||||
| Seating Systems | 4,265 | 4,289 | (24 | ) | 74 | 156 | (82 | ) | ||||||||||||||||
| Complete Vehicles | 3,587 | 3,784 | (197 | ) | 101 | 74 | 27 | |||||||||||||||||
| Corporate and Other | (413 | ) | (402 | ) | (11 | ) | (29 | ) | (77 | ) | 48 | |||||||||||||
| Total Reportable Segments | $ | 31,162 | $ | 32,208 | $ | (1,046 | ) | $ | 1,550 | $ | 1,640 | $ | (90 | ) | ||||||||||
| NINE MONTHS
ENDED SEPTEMBER 30, |
||||||||||||
| Adjusted
EBIT as a percentage of sales |
||||||||||||
| 2025 | 2024 | Change | ||||||||||
| Body Exteriors & Structures | 7.1 | % | 7.1 | % | — | |||||||
| Power & Vision | 4.6 | % | 5.0 | % | (0.4 | )% | ||||||
| Seating Systems | 1.7 | % | 3.6 | % | (1.9 | )% | ||||||
| Complete Vehicles | 2.8 | % | 2.0 | % | 0.8 | % | ||||||
| Consolidated Average | 5.0 | % | 5.1 | % | (0.1 | )% | ||||||
For further details on our segment results, please see our Management's Discussion and Analysis of Results of Operations and Financial Position and our Interim Financial Statements.
| MAGNA ANNOUNCES THIRD QUARTER 2025 RESULTS |
CONNECT WITH MAGNA
|
|
2025 OUTLOOK
We disclose a full-year Outlook annually in February with quarterly updates. The following Outlook is an update to our previous Outlook in August 2025.
Updated 2025 Outlook Assumptions
| Current | Previous | |||||||
| Light Vehicle Production (millions of units) | ||||||||
| North America | 15.0 | 14.7 | ||||||
| Europe | 16.6 | 16.6 | ||||||
| China | 31.5 | 30.8 | ||||||
| Average Foreign exchange rates: | ||||||||
| 1 Canadian dollar equals | U.S. $0.717 | U.S. $0.715 | ||||||
| 1 euro equals | U.S. $1.129 | U.S. $1.127 | ||||||
Light vehicle production assumptions reflect near-term original equipment manufacturer ["OEM"] production release information, including announced production downtime at certain OEM assembly facilities, but do not include the potential impact of tariffs and other trade measures on vehicle costs, vehicle affordability or consumer demand, nor the impact of these on vehicle production.
Updated 2025 Outlook
| Current | Previous | |||||||
| Segment Sales | ||||||||
| Body Exteriors & Structures | $16.2 - $16.6 billion | $16.0 - $16.6 billion | ||||||
| Power & Vision | $15.0 - $15.3 billion | $14.9 - $15.3 billion | ||||||
| Seating Systems | $5.6 - $5.8 billion | $5.4 - $5.7 billion | ||||||
| Complete Vehicles | $4.7 - $4.9 billion | $4.6 - $4.9 billion | ||||||
| Company Sales | $41.1 - $42.1 billion | $40.4 - $42.0 billion | ||||||
| Adjusted EBIT Margin(3) | 5.4% - 5.6% | 5.2% - 5.6% | ||||||
| Equity Income (included in Adj. EBIT) | $105 - $130 million | $75 - $105 million | ||||||
| Interest Expense, net | ~$215 million | ~$210 million | ||||||
| Income Tax Rate(4) | ~24% | ~25% | ||||||
| Adjusted Net Income attributable to Magna(5) | $1.45 - $1.55 billion | $1.35 - $1.55 billion | ||||||
| Capital Spending | ~$1.5 billion | $1.6 - $1.7 billion |
Notes
| (3) | Adjusted EBIT Margin is the ratio of Adjusted EBIT to Total Sales. Refer to the reconciliation of Non-GAAP financial measures in the back of this press release for further information | |
| (4) | The Income Tax Rate has been calculated using Adjusted EBIT less interest expense and is based on current tax legislation | |
| (5) | Adjusted Net Income attributable to Magna represents Net Income excluding Other expense, net and Amortization of acquired intangible assets, net of tax |
Our Outlook is intended to provide information about management's current expectations and plans and may not be appropriate for other purposes. Although considered reasonable by Magna as of the date of this document, the 2025 Outlook above and the underlying assumptions may prove to be inaccurate. Accordingly, our actual results could differ materially from our expectations as set forth herein. The risks identified in the “Forward-Looking Statements” section below represent the primary factors which we believe could cause actual results to differ materially from our expectations.
| MAGNA ANNOUNCES THIRD QUARTER 2025 RESULTS |
CONNECT WITH MAGNA
|
|
KEY DRIVERS OF OUR BUSINESS
Our business and operating results are dependent on light vehicle production by our customers in three key regions – North America, Europe, and China. While we supply systems and components to many OEMs globally, we do not supply systems and components for every vehicle, nor is the value of our content consistent from one vehicle to the next. As a result, customer and program mix relative to market trends, as well as the value of our content on specific vehicle production programs, are also important drivers of our results.
Ordinarily, OEM production volumes are aligned with vehicle sales levels and thus affected by changes in such levels. Aside from vehicle sales levels, production volumes are typically impacted by a range of factors, including: OEM, supplier or sub-supplier disruptions; free trade arrangements and tariffs; relative currency values; commodities prices; supply chains and infrastructure; labour disruptions and the availability and relative cost of skilled labour; regulatory frameworks; and other factors.
Overall vehicle sales levels are significantly affected by changes in consumer confidence levels, which may in turn be impacted by consumer perceptions and general trends related to the job, housing, and stock markets, as well as other macroeconomic and political factors. Other factors which typically impact vehicle sales levels and thus production volumes include: vehicle affordability; interest rates and/or availability of credit; fuel and energy prices; relative currency values; uncertainty as to the pace of EV adoption; and other factors.
| MAGNA ANNOUNCES THIRD QUARTER 2025 RESULTS |
CONNECT WITH MAGNA
|
|
NON-GAAP FINANCIAL MEASURES RECONCILIATION
In addition to the financial results reported in accordance with U.S. GAAP, this press release contains references to the Non-GAAP financial measures reconciled below. We believe the Non-GAAP financial measures used in this press release are useful to both management and investors in their analysis of the Company’s financial position and results of operations, and to improve comparability between fiscal periods. In particular, management believes that Adjusted EBIT and Adjusted diluted earnings per share are useful measures in assessing the Company’s financial performance by excluding certain items that are not indicative of the Company's core operating performance. The presentation of Non-GAAP financial measures should not be considered in isolation, or as a substitute for the Company’s related financial results prepared in accordance with U.S. GAAP.
The following table reconciles Net income to Adjusted EBIT:
Adjusted EBIT
| THREE MONTHS
ENDED SEPTEMBER 30, |
NINE MONTHS
ENDED SEPTEMBER 30, |
|||||||||||||||
| 2025 | 2024 | 2025 | 2024 | |||||||||||||
| Net income | $ | 333 | $ | 508 | $ | 880 | $ | 862 | ||||||||
| Add: | ||||||||||||||||
| Amortization of acquired intangible assets | 27 | 28 | 82 | 84 | ||||||||||||
| Interest expense, net | 65 | 54 | 167 | 159 | ||||||||||||
| Other expense (income), net | 48 | (188 | ) | 107 | 236 | |||||||||||
| Income taxes | 140 | 192 | 314 | 299 | ||||||||||||
| Adjusted EBIT | $ | 613 | $ | 594 | $ | 1,550 | $ | 1,640 | ||||||||
Adjusted EBIT as a percentage of sales (“Adjusted EBIT margin”)
| THREE MONTHS
ENDED SEPTEMBER 30, |
NINE MONTHS
ENDED SEPTEMBER 30, |
|||||||||||||||
| 2025 | 2024 | 2025 | 2024 | |||||||||||||
| Sales | $ | 10,462 | $ | 10,280 | $ | 31,162 | $ | 32,208 | ||||||||
| Adjusted EBIT | $ | 613 | $ | 594 | $ | 1,550 | $ | 1,640 | ||||||||
| Adjusted EBIT as a percentage of sales | 5.9 | % | 5.8 | % | 5.0 | % | 5.1 | % | ||||||||
Adjusted diluted earnings per share
| THREE MONTHS
ENDED SEPTEMBER 30, |
NINE MONTHS
ENDED SEPTEMBER 30, |
|||||||||||||||
| 2025 | 2024 | 2025 | 2024 | |||||||||||||
| Net income attributable to Magna International Inc. | $ | 305 | $ | 484 | $ | 830 | $ | 806 | ||||||||
| Add (deduct): | ||||||||||||||||
| Amortization of acquired intangible assets | 27 | 28 | 82 | 84 | ||||||||||||
| Other expense (income), net | 48 | (188 | ) | 107 | 236 | |||||||||||
| Tax effect on Amortization of acquired intangible assets and Other expense (income), net | (5 | ) | 45 | (18 | ) | (57 | ) | |||||||||
| Adjusted net income attributable to Magna International Inc. | $ | 375 | $ | 369 | $ | 1,001 | $ | 1,069 | ||||||||
| Diluted weighted average number of Common Shares outstanding during the period (millions): | 281.8 | 287.3 | 281.9 | 287.2 | ||||||||||||
| Adjusted diluted earnings per share | $ | 1.33 | $ | 1.28 | $ | 3.55 | $ | 3.72 | ||||||||
Certain of the forward-looking financial measures above are provided on a Non-GAAP basis. We do not provide a reconciliation of such forward-looking measures to the most directly comparable financial measures calculated and presented in accordance with U.S. GAAP. To do so would be potentially misleading and not practical given the difficulty of projecting items that are not reflective of ongoing operations in any future period. The magnitude of these items, however, may be significant.
| MAGNA ANNOUNCES THIRD QUARTER 2025 RESULTS |
CONNECT WITH MAGNA
|
|
This press release together with our Management’s Discussion and Analysis of Results of Operations and Financial Position and our Interim Financial Statements are available in the Investor Relations section of our website at www.magna.com/company/investors and filed electronically through the System for Electronic Document Analysis and Retrieval + (SEDAR+) which can be accessed at www.sedarplus.ca as well as on the United States Securities and Exchange Commission’s Electronic Data Gathering, Analysis and Retrieval System (EDGAR), which can be accessed at www.sec.gov.
We will hold a conference call for interested analysts and shareholders to discuss our third quarter ended September 30, 2025 results on Friday, October 31, 2025 at 8:00 a.m. ET. The conference call will be chaired by Swamy Kotagiri, Chief Executive Officer. The number to use for this call from North America is 1-800-715-9871. International callers should use 1-646-307-1963. Please call in at least 10 minutes prior to the call start time. We will also webcast the conference call at www.magna.com. The slide presentation accompanying the conference call as well as our financial review summary will be available on our website Friday prior to the call.
TAGS
Quarterly earnings, financial results, vehicle production
INVESTOR CONTACT
Louis Tonelli, Vice-President, Investor Relations
louis.tonelli@magna.com │ 905.726.7035
MEDIA CONTACT
Tracy Fuerst, Vice-President, Corporate Communications & PR
tracy.fuerst@magna.com │ 248.761.7004
TELECONFERENCE CONTACT
Nancy Hansford, Executive Assistant, Investor Relations
nancy.hansford@magna.com │ 905.726.7108
ABOUT MAGNA
Magna is one of the world’s largest automotive suppliers and a trusted partner to automakers in the industry’s most critical markets—North America, Europe, and China. With a global team and footprint spanning 28 countries, we bring unmatched scale, trusted reliability, and proven execution. Backed by nearly seven decades of experience, we combine deep manufacturing expertise with innovative vehicle systems to deliver performance, safety, and quality.
For further information about Magna (NYSE:MGA; TSX:MG), please visit www.magna.com or follow us on social.
| MAGNA ANNOUNCES THIRD QUARTER 2025 RESULTS |
CONNECT WITH MAGNA
|
|
FORWARD-LOOKING STATEMENTS
Certain statements in this press release constitute "forward-looking information" or "forward-looking statements" (collectively, "forward-looking statements"). Any such forward-looking statements are intended to provide information about management's current expectations and plans and may not be appropriate for other purposes. Forward-looking statements may include financial and other projections, as well as statements regarding our future plans, strategic objectives or economic performance, or the assumptions underlying any of the foregoing, and other statements that are not recitations of historical fact. We use words such as "may", "would", "could", "should", "will", "likely", "expect", "anticipate", "assume", "believe", "intend", "plan", "aim", "forecast", "outlook", "project", "potential", "estimate", "target" and similar expressions suggesting future outcomes or events to identify forward-looking statements. The following table identifies the material forward-looking statements contained in this document, together with the material potential risks that we currently believe could cause actual results to differ materially from such forward-looking statements. Readers should also consider all of the risk factors which follow below the table:
| Material Forward-Looking Statement | Material Potential Risks Related to Applicable Forward-Looking Statement |
|
Light Vehicle Production
|
· Light vehicle sales levels, including due to: - A decline in consumer confidence - Economic uncertainty - Elevated interest rates and availability of consumer credit - Deteriorating vehicle affordability · Tariffs and/or other actions that erode free trade agreements · Production deferrals, cancellations and volume reductions · Production and supply disruptions · Commodities prices · Availability and relative cost of skilled labour |
|
Total Sales Segment Sales |
· Same risks as for Light Vehicle Production above · Alignment of our product mix with production demand · Customer concentration · Uncertain pace of EV adoption. Including North American electric vehicle program deferrals, cancellations and volume reductions and growth with EV-focused OEMs, particularly Chinese OEMs · Shifts in market shares among vehicles or vehicle segments · Shifts in consumer "take rates" for products we sell · Relative currency values |
|
Adjusted EBIT Margin Net Income Attributable to Magna |
· Same risks as for Total Sales and Segment Sales above · Execution of critical program launches · Operational underperformance · Product warranty/recall risks · Production inefficiencies · Unmitigated incremental tariff costs · Restructuring costs and/or impairment charges, including due to the ‘reshoring’ of production to the U.S. · Inflation · Ability to secure planned cost recoveries from our customers and/or otherwise offset higher input costs · Price concessions · Risks of conducting business with newer EV-focused OEMs · Commodity cost volatility · Scrap steel price volatility · Tax risks |
| Equity Income |
· Same risks as Adjusted EBIT Margin and Net Income Attributable to Magna · Risks related to conducting business through joint ventures · Risks of doing business in foreign markets · Legal and regulatory proceedings · Changes in law |
Forward-looking statements are based on information currently available to us and are based on assumptions and analyses made by us in light of our experience and our perception of historical trends, current conditions and expected future developments, as well as other factors we believe are appropriate in the circumstances. While we believe we have a reasonable basis for making any such forward-looking statements, they are not a guarantee of future performance or outcomes. In addition to the factors in the table above, whether actual results and developments conform to our expectations and predictions is subject to a number of risks, assumptions, and uncertainties, many of which are beyond our control, and the effects of which can be difficult to predict, including, without limitation:
|
Macroeconomic, Geopolitical and Other Risks · unpredictable tariff and trade environment; · trade disputes and threats to free trade agreements; · consumer confidence levels; · increasing economic uncertainty; · interest rates and availability of consumer credit; · geopolitical risks;
Risks Related to the Automotive Industry · program deferrals, cancellations and volume reductions; · economic cyclicality; · regional production volume declines; · deteriorating vehicle affordability; · uncertain pace of EV adoption, including North American electric vehicle program deferrals, cancellations and volume reductions; · intense competition;
Strategic Risks · planning and forecasting challenges; · evolution of the vehicle; · evolving business risk profile; · technology and innovation; · investments in mobility and technology companies;
Customer-Related Risks · customer concentration; · market shifts; · growth of EV-focused OEMs, particularly Chinese OEMs; · risks of conducting business with newer EV-focused OEMs; · dependence on outsourcing; · customer cooperation and consolidation; · consumer take rate shifts; · customer purchase orders; · potential OEM production-related disruptions; |
Pricing Risks · quote/pricing assumptions; · customer pricing pressure/contractual arrangements; · commodity cost volatility; · scrap steel/aluminum price volatility;
Warranty/Recall Risks · repair/replace costs; · warranty provisions; · product liability;
Climate Change Risks · transition risks and physical risks; · strategic and other risks;
IT Security/Cybersecurity Risks · IT/cybersecurity breach; · product cybersecurity;
Acquisition Risks · inherent merger and acquisition risks; · acquisition integration and synergies;
Other Business Risks · joint ventures; · intellectual property; · risks of doing business in foreign markets; · relative foreign exchange rates; · pension risks; · tax risks; · returns on capital investments; · financial flexibility; · credit ratings changes; · stock price fluctuation; |
| MAGNA ANNOUNCES THIRD QUARTER 2025 RESULTS |
CONNECT WITH MAGNA
|
|
|
Supply Chain Risks · supply base; · supplier claims; · supply chain disruptions; · regional energy supply and pricing;
Manufacturing/Operational Risks · product launch; · operational underperformance; · restructuring costs and impairment charges, including those related to the ‘reshoring’ of production to the U.S.; · skilled labour attraction/retention; · leadership expertise and succession; |
Legal, Regulatory and Other Risks · legal and regulatory proceedings; · changes in laws; and · environmental compliance. |
In evaluating forward-looking statements or forward-looking information, we caution readers not to place undue reliance on any forward-looking statement. Additionally, readers should specifically consider the various factors which could cause actual events or results to differ materially from those indicated by such forward-looking statements, including the risks, assumptions and uncertainties above which are:
| · | discussed under the "Industry Trends and Risks" heading of our Management’s Discussion and Analysis; and |
| · | set out in our Annual Information Form filed with securities commissions in Canada, our annual report on Form 40-F with the United States Securities and Exchange commission, and subsequent filings. |
Readers should also consider discussion of our risk mitigation activities with respect to certain risk factors, which can be also found in our Annual Information Form. Additional information about Magna, including our Annual Information Form, is available through the System for Electronic Data Analysis and Retrieval + (SEDAR+) at www.sedarplus.ca, as well as on the United States Securities and Exchange Commission’s Electronic Data Gathering, Analysis and Retrieval System (EDGAR), which can be accessed at www.sec.gov.
| MAGNA ANNOUNCES THIRD QUARTER 2025 RESULTS |
CONNECT WITH MAGNA
|
|
Exhibit 99.2

Magna International Inc.
Third Quarter Report
2025
MAGNA INTERNATIONAL INC.
Management's Discussion and Analysis of Results of Operations and Financial Position
Unless otherwise noted, all amounts in this Management's Discussion and Analysis of Results of Operations and Financial Position ["MD&A"] are in U.S. dollars and all tabular amounts are in millions of U.S. dollars, except per share figures, which are in U.S. dollars. When we use the terms "we", "us", "our" or "Magna", we are referring to Magna International Inc. and its subsidiaries and jointly controlled entities, unless the context otherwise requires.
This MD&A should be read in conjunction with the unaudited interim consolidated financial statements for the three and nine months ended September 30, 2025 included in this Quarterly Report, and the audited consolidated financial statements and MD&A for the year ended December 31, 2024 included in our 2024 Annual Report to Shareholders.
This MD&A may contain statements that are forward looking. Refer to the "Forward-Looking Statements" section in this MD&A for a more detailed discussion of our use of forward-looking statements.
This MD&A has been prepared as at October 30, 2025.
HIGHLIGHTS
Comparing the third quarters of 2025 and 2024:
| · | Global light vehicle production increased 3%, including 6%, 4% and 4% higher production in North America, Europe, and China, respectively. |
| · | Total sales increased 2% to $10.5 billion, largely reflecting the launch of new programs, net strengthening of currencies against the U.S. dollar, partially offset by the end of production of certain programs, including our complete vehicle assembly of the Jaguar I-Pace and E-Pace. |
| · | In the third quarter of 2024 we recognized $196 million in Other income of previously deferred revenue related to our Fisker Inc. ["Fisker"] warrants since our agreement for manufacturing of the Fisker Ocean SUV was terminated. |
| · | Mainly as a result of the Other income item in the third quarter of 2024, income from operations before income taxes decreased to $473 million, from $700 million last year. |
| · | Adjusted EBIT(1) increased 3% to $613 million, largely reflecting continued productivity and efficiency improvements, including the benefit of operational excellence initiatives and recent restructuring activities, as well as higher equity income, partially offset by lower net favourable commercial items, and tariff costs not yet recovered from customers. |
| · | Adjusted EBIT as a percentage of sales(1) increased 10 basis points to 5.9%. |
| · | Diluted earnings per share were $1.08 and adjusted diluted earnings per share(1) were $1.33, an increase of 4%, mainly due to higher Adjusted EBIT and 2% lower average diluted shares outstanding as a result of share repurchases subsequent to the third quarter of 2024. |
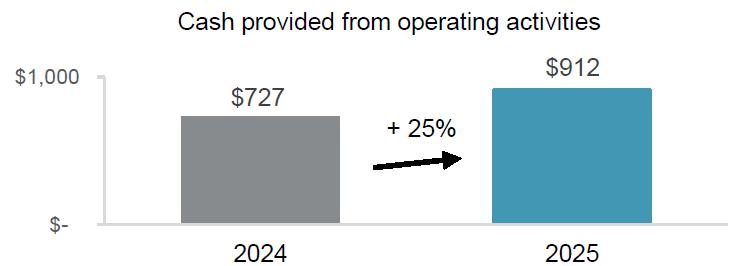
| · | Cash from operating activities increased $185 million to $912 million. |
In addition, in the third quarter of 2025, we:
| · | paid $136 million in dividends to shareholders; |
| · | repaid $650 million in Senior Notes scheduled to mature in October 2025; and |
| · | launched the first of two electric vehicle models for XPENG, a China-based OEM in our Complete Vehicle assembly facility in Graz, Austria. |
Subject to the approval by the Toronto Stock Exchange, our Board of Directors approved a new Normal Course Issuer Bid ["NCIB"] to purchase up to 25.3 million of our Common Shares, representing approximately 10% of our public float. This NCIB is expected to be effective on November 7, 2025 and will terminate no later than November 6, 2026.
OVERVIEW
OUR BUSINESS
Magna is one of the world’s largest automotive suppliers and a trusted partner to automakers in the industry’s most critical markets—North America, Europe, and China. With a global team and footprint spanning 28 countries, we bring unmatched scale, trusted reliability, and proven execution. Backed by nearly seven decades of experience, we combine deep manufacturing expertise with innovative vehicle systems to deliver performance, safety, and quality. For further information about Magna (NYSE:MGA; TSX:MG), please visit www.magna.com or follow us on social.
1 Adjusted EBIT, Adjusted EBIT as a percentage of sales, and Adjusted diluted earnings per share are Non-GAAP financial measures. Refer to the section “Use of Non-GAAP Measures”.
| Magna International Inc. Third Quarter Report 2025 |
|
INDUSTRY TRENDS & RISKS
Our business and operating results are dependent on light vehicle production by our customers in three key regions – North America, Europe, and China. While we supply systems and components to many original equipment manufacturers ["OEMs"] globally, we do not supply systems and components for every vehicle, nor is the value of our content consistent from one vehicle to the next. As a result, customer and program mix relative to market trends, as well as the value of our content on specific vehicle production programs, are also important drivers of our results.
Ordinarily, OEM production volumes are aligned with vehicle sales levels and thus affected by changes in such levels. Aside from vehicle sales levels, production volumes are typically impacted by a range of factors, including: OEM, supplier or sub-supplier disruptions; free trade arrangements and tariffs; relative currency values; commodities prices; supply chains and infrastructure; labour disruptions and the availability and relative cost of skilled labour; regulatory frameworks; and other factors.
Overall vehicle sales levels are significantly affected by changes in consumer confidence levels, which may in turn be impacted by consumer perceptions and general trends related to the job, housing, and stock markets, as well as other macroeconomic and political factors. Other factors which typically impact vehicle sales levels and thus production volumes include: vehicle affordability; interest rates and/or availability of credit; fuel and energy prices; relative currency values; uncertainty as to the pace of EV adoption; and other factors.
While the foregoing economic, political and other factors are part of the general context in which the global automotive industry operates, there are a number of significant industry trends that are shaping the future of the industry and creating opportunities and risks for automotive suppliers. We continue to implement a business strategy which is rooted in our best assessment as to the rate and direction of change in the automotive industry, including with respect to the imposition of tariffs on vehicles and components or materials incorporated therein and trends related to vehicle electrification and advanced driver assistance systems. Our short and medium-term operational success, as well as our ability to create long-term value through our business strategy, are subject to a number of risks and uncertainties. Significant industry trends, our business strategy and the major risks we face, are discussed in our Annual Information Form ["AIF"] and Annual Report on Form 40-F ["Form 40-F"] in respect of the year ended December 31, 2024, together with subsequent filings. Those industry trends and risk factors remain substantially unchanged in respect of the third quarter ended September 30, 2025, except as follows:
| · | Continuing Trade and Tariff Uncertainty: The overall climate of trade and tariff uncertainty continues to present a number of challenges for the entire automotive supply chain, including: |
| · | Planning, forecasting and efficient capital allocation – US tariff and trade policies risk disrupting integrated global and regional automotive supply chains, given the stated aim of repatriating manufacturing to the US. Continuing uncertainty may impact OEM production/footprint decision-making and presents industry-wide challenges with planning, forecasting and efficient capital allocation. |
| · | Input costs – US tariffs, together with retaliatory measures, risk increasing our input costs, the prices paid by our customers for our products, as well as the price consumers pay for vehicles. Significant or sustained unmitigated tariff cost increases which are not recoverable from our customers could have a material adverse effect on our profitability. |
| · | Vehicle affordability – to the extent tariffs erode vehicle affordability, consumer demand for vehicles may decline, prompting a reduction in vehicle production volumes, which is a material driver of our operations, sales and profitability. |
Other previously identified risks associated with an uncertain trade and tariff environment such as restructuring and impairment risks, have been detailed in our previous filings and remain relevant through the third quarter of 2025.
| · | Product Recall and Extended Warranty Program: Ford Motor Company ["Ford"] recently initiated recalls covering approximately 3.6 million vehicles equipped with rear-cameras supplied by us. Ford also recently announced a new 15-year extended warranty program for approximately 11.0 million other vehicles that were not the subject of these recalls but are also equipped with rear-cameras supplied by us. The rear-cameras were supplied across multiple vehicle programs, and as a result, additional recalls and/or extended warranty programs remain possible. |
The initiation of a recall or warranty extension program does not on its own imply or allocate liability among an OEM, Tier 1 supplier, and any sub-suppliers. Liability for defective products is based on a root cause determination, which can be a complex process that takes into account respective OEM and supplier roles and responsibilities for component and system design, engineering, sub-component sourcing, system assembly, as well as integration of the system into the vehicle. At this time, root cause determinations have not been completed for the vehicles covered by Ford’s recalls and warranty extension program.
Even after root causes have been determined, other challenges make it difficult to quantify our potential financial exposure, if any. In the case of the rear-camera recalls and warranty extension program, these challenges include: integration with other vehicle systems and non-camera components; the age of affected vehicles; duration of the original warranty; number of affected vehicles brought to Ford dealers for inspection; and dealer discretion to determine the nature of the remedy to be applied, which may range from software upgrades, inspection of the rear-camera and other components, repairs, or replacement of the rear-camera.
|
|
Magna International Inc. Third Quarter Report 2025 |
In the absence of certainty as to the scope of potentially affected vehicles, the root cause(s) of the alleged product failures, and/or the related costs of these service actions, we are unable to estimate our potential exposure, if any, for recall-related costs and the extension of product warranties by Ford to affected vehicle owners. If we are determined to be fully or partially responsible for defective rear-cameras, the related recall and extended warranty costs could have a material adverse effect on our profitability.
| · | Production Disruption: An aluminum supplier in the US experienced a fire at a facility which supplies approximately 40% of the aluminum sheet production used by the automotive industry. A number of our OEM customers have been impacted by the disruption – including Ford, which has paused production of certain vehicles. The inability of affected OEMs to mitigate the disruption by sourcing aluminum sheets from alternative suppliers may cause extended production disruptions to programs on which we have content, which in turn could have an adverse effect on our profitability. |
| · | Potential Supply Chain Disruption: Nexperia, a global supplier of electronic components and semiconductor chips, is currently subject to export restrictions imposed by the Chinese government. These restrictions prevent Nexperia from supplying any finished components or subassemblies from China. As a purchaser of affected Nexperia components, we are directly impacted since we maintain limited inventories of such items. Similarly, many other automotive suppliers and multiple OEMs maintain limited inventories of impacted components purchased from Nexperia. If export restrictions affecting Nexperia are prolonged and/or alternative sources cannot be secured in a timely manner or for sufficient quantities, industry-wide production disruptions or supply constraints will occur. Any prolonged disruptions could have a material adverse effect on our operations and profitability. |
USE OF NON-GAAP FINANCIAL MEASURES
In addition to results presented in accordance with accounting principles generally accepted in the United States of America ["U.S. GAAP"], this report includes the use of Adjusted earnings before interest and taxes ["Adjusted EBIT"], Adjusted EBIT as a percentage of sales, Adjusted diluted earnings per share, and Adjusted Return on Invested Capital [collectively, the "Non-GAAP Measures"]. We believe these Non-GAAP financial measures provide additional information that is useful to investors in understanding our underlying performance and trends through the same financial measures employed by our management. Readers should be aware that Non-GAAP Measures have no standardized meaning under U.S. GAAP and accordingly may not be comparable to the calculation of similar measures by other companies. We believe that Adjusted EBIT, Adjusted EBIT as a percentage of sales, Adjusted diluted earnings per share, and Adjusted Return on Invested Capital provide useful information to our investors for measuring our operational performance as they exclude certain items that are not reflective of ongoing operating profit and facilitate a comparison with prior periods. The presentation of any Non-GAAP Measures should not be considered in isolation or as a substitute for our related financial results prepared in accordance with U.S. GAAP. Non-GAAP financial measures are presented together with the most directly comparable U.S. GAAP financial measure, and a reconciliation to the most directly comparable U.S. GAAP financial measure, can be found in the "Non-GAAP Financial Measures Reconciliation" section of this MD&A.
| Magna International Inc. Third Quarter Report 2025 |
|
RESULTS OF OPERATIONS
AVERAGE FOREIGN EXCHANGE
| For the three months | For the nine months | |||||||||||||||||||||||
| ended September 30, | ended September 30, | |||||||||||||||||||||||
| 2025 | 2024 | Change | 2025 | 2024 | Change | |||||||||||||||||||
| 1 Canadian dollar equals U.S. dollars | 0.726 | 0.733 | - | 1 | % | 0.715 | 0.735 | - | 3 | % | ||||||||||||||
| 1 euro equals U.S. dollars | 1.169 | 1.099 | + | 6 | % | 1.118 | 1.087 | + | 3 | % | ||||||||||||||
| 1 Chinese renminbi equals U.S. dollars | 0.140 | 0.140 | — | 0.139 | 0.139 | — | ||||||||||||||||||
The preceding table reflects the average foreign exchange rates between the most common currencies in which we conduct business and our U.S. dollar reporting currency.
The results of operations for which the functional currency is not the U.S. dollar are translated into U.S. dollars using the average exchange rates for the relevant period. Throughout this MD&A, reference is made to the impact of translation of foreign operations on reported U.S. dollar amounts where relevant.
Our results can also be affected by the impact of movements in exchange rates on foreign currency transactions (such as raw material purchases or sales denominated in foreign currencies). However, as a result of hedging programs employed by us, foreign currency transactions in the current period have not been fully impacted by movements in exchange rates. We record foreign currency transactions at the hedged rate where applicable.
Finally, foreign exchange gains and losses on revaluation and/or settlement of monetary items denominated in a currency other than an operation's functional currency impact reported results. These gains and losses are recorded in selling, general and administrative expense.
LIGHT VEHICLE PRODUCTION VOLUMES
Our operating results are mostly dependent on light vehicle production in the regions reflected in the table below:
Light Vehicle Production Volumes (thousands of units)
| For the three months | For the nine months | |||||||||||||||||||||||
| ended September 30, | ended September 30, | |||||||||||||||||||||||
| 2025 | 2024 | Change | 2025 | 2024 | Change | |||||||||||||||||||
| North America | 3,875 | 3,669 | + | 6 | % | 11,474 | 11,734 | - | 2 | % | ||||||||||||||
| Europe | 3,847 | 3,705 | + | 4 | % | 12,461 | 12,711 | - | 2 | % | ||||||||||||||
| China | 7,626 | 7,298 | + | 4 | % | 22,526 | 20,789 | + | 8 | % | ||||||||||||||
| Rest of World | 6,820 | 6,748 | + | 1 | % | 20,735 | 20,050 | + | 3 | % | ||||||||||||||
| Global | 22,168 | 21,420 | + | 3 | % | 67,196 | 65,284 | + | 3 | % | ||||||||||||||
|
|
Magna International Inc. Third Quarter Report 2025 |
RESULTS OF OPERATIONS – FOR THE THREE MONTHS ENDED SEPTEMBER 30, 2025
SALES
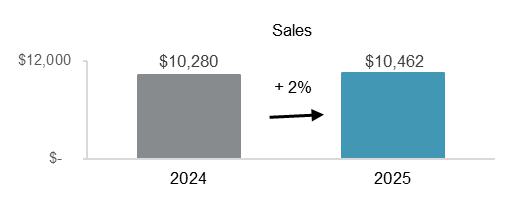
Sales increased 2%, or $182 million, to $10.46 billion for the third quarter of 2025 compared to $10.28 billion for the third quarter of 2024 primarily due to:
| · | the launch of new programs during or subsequent to the third quarter of 2024, including the Skoda Elroq, Ford Expedition and Lincoln Navigator, and Cadillac Vistiq; and |
| · | the net strengthening of foreign currencies against the U.S. dollar, which increased reported U.S. dollar sales by $210 million. |
These factors were partially offset by:
| · | the end of production of certain programs, including the Chevrolet Malibu; |
| · | lower complete vehicle assembly volumes, substantially due to the end of production of the Jaguar I-Pace and Jaguar E-Pace; |
| · | net customer price concessions subsequent to the third quarter of 2024; and |
| · | lower production on certain programs. |
COST OF GOODS SOLD
| For the three months | ||||||||||||
| ended September 30, | ||||||||||||
| 2025 | 2024 | Change | ||||||||||
| Material | $ | 6,374 | $ | 6,157 | $ | 217 | ||||||
| Direct labour | 743 | 757 | (14 | ) | ||||||||
| Overhead | 1,856 | 1,914 | (58 | ) | ||||||||
| Cost of goods sold | $ | 8,973 | $ | 8,828 | $ | 145 | ||||||
Cost of goods sold increased $145 million to $8.97 billion for the third quarter of 2025, compared to $8.83 billion for the third quarter of 2024, primarily due to:
| · | the net strengthening of foreign currencies against the U.S. dollar, which increased reported U.S. dollar costs of goods sold by $187 million; |
| · | higher material, direct labour, and overhead associated with higher production sales; |
| · | higher tariff costs; |
| · | commercial items in the third quarters of 2025 and 2024, which had a net unfavourable impact on a year-over-year basis; |
| · | higher pre-operating costs incurred at new facilities; and |
| · | higher production input costs net of customer recoveries, primarily for labour. |
These factors were partially offset by:
| · | productivity and efficiency improvements, including the benefit of operational excellence initiatives and recent restructuring activities; |
| · | lower net engineering costs; and |
| · | a decrease in material, direct labour, and overhead associated with lower sales in our Complete Vehicle segment, which has a higher material content compared to our consolidated average. |
| Magna International Inc. Third Quarter Report 2025 |
|
SELLING, GENERAL AND ADMINISTRATIVE ["SG&A"]
SG&A expense increased $44 million to $531 million for the third quarter of 2025, compared to $487 million for the third quarter of 2024, primarily as a result of:
| · | higher costs to accelerate our operational excellence initiatives; |
| · | the net strengthening of foreign currencies against the U.S. dollar, which increased SG&A by $13 million; |
| · | higher stock-based compensation, incentive compensation, and employee profit sharing; |
| · | higher consulting and legal costs; and |
| · | higher investments in research, development and new mobility. |
These factors were partially offset by net transactional foreign exchange gains in the third quarter of 2025 compared to net transactional foreign exchange losses in the third quarter of 2024.
DEPRECIATION
Depreciation increased $5 million to $389 million for the third quarter of 2025, compared to $384 million for the third quarter of 2024, primarily due to increased capital deployed at new and existing facilities, including to support the launch of programs, and the net strengthening of foreign currencies against the U.S. dollar, which increased depreciation by $8 million. These factors were partially offset by the end of production of certain programs.
AMORTIZATION OF ACQUIRED INTANGIBLE ASSETS
Amortization of acquired intangible assets decreased $1 million to $27 million for the third quarter of 2025, compared to $28 million for the third quarter of 2024.
INTEREST EXPENSE, NET
During the third quarter of 2025, we recorded net interest expense of $65 million compared to $54 million for the third quarter of 2024. The $11 million increase is primarily a result of interest incurred on a value added tax (“VAT”) reassessment; and higher net interest expense on Senior Notes issued during the second quarter of 2025, compared to Senior notes repaid during the second and third quarters of 2025. These factors were partially offset by lower interest expense on decreased short term borrowings and term loan balances, each at lower interest rates.
EQUITY INCOME
Equity income increased $31 million to $44 million for the third quarter of 2025, compared to $13 million for the third quarter of 2024, primarily as a result of:
| · | higher earnings due to higher sales and favourable product mix at certain equity-accounted entities; |
| · | commercial items in the third quarters of 2025 and 2024, which had a net favourable impact on a year-over-year basis; |
| · | productivity and efficiency improvements at certain equity-accounted entities; and |
| · | lower launch costs at certain facilities. |
These factors were partially offset by higher restructuring costs at an equity-accounted entity.
|
|
Magna International Inc. Third Quarter Report 2025 |
OTHER EXPENSE (INCOME), NET
| For the three months | ||||||||
| ended September 30, | ||||||||
| 2025 | 2024 | |||||||
| Restructuring activities (1) | $ | 46 | $ | — | ||||
| Investments (2) | 2 | 1 | ||||||
| Impacts related to Fisker Inc. ["Fisker"] (3) | — | (189 | ) | |||||
| $ | 48 | $ | (188 | ) | ||||
| (1) | Restructuring activities |
| For the three months | ||||||||
| ended September 30, | ||||||||
| 2025 | 2024 | |||||||
| Power & Vision (i) | $ | 34 | $ | — | ||||
| Complete Vehicles (ii) | 12 | — | ||||||
| Other expense, net | 46 | — | ||||||
| Tax effect | — | — | ||||||
| Net loss attributable to Magna | $ | 46 | $ | — | ||||
| (i) | During the third quarter of 2025, we recorded $24 million [$24 million after tax] of charges related to significant rightsizing activities and plant consolidations at facilities primarily in Europe, as well as $10 million [$10 million after tax] of equity losses related to our share of restructuring activities at an equity method investee. |
| (ii) | During the third quarter of 2025, we recorded $12 million [$12 million after tax] of charges related to rightsizing activities at two facilities in Europe. |
| (2) | Investments |
| For the three months | ||||||||
| ended September 30, | ||||||||
| 2025 | 2024 | |||||||
| Non-cash impairment charge (iii) | $ | 2 | $ | — | ||||
| Loss on sales of public equity investments | 1 | — | ||||||
| Net revaluation (gain) loss on public and private equity investments | (1 | ) | 8 | |||||
| Revaluation gain on public company warrants | — | (7 | ) | |||||
| Other expense, net | 2 | 1 | ||||||
| Tax effect | — | 2 | ||||||
| Net loss attributable to Magna | $ | 2 | $ | 3 | ||||
| (iii) | The $2 million [$1 million after tax] non-cash impairment charge relates to the impairment of a private equity investment. |
| (3) | Impacts related to Fisker |
During 2024, Fisker filed for Chapter 11 bankruptcy protection in the United States and for similar protection in Austria. As a result, we recorded impairment charges on our Fisker related net assets, including our Fisker warrants, which were received in connection with the agreements with Fisker for platform sharing, engineering and manufacturing of the Fisker Ocean SUV. We also recorded additional restructuring charges during 2024 related to our Fisker related assembly operations. In the course of such bankruptcy proceedings, we terminated our manufacturing agreement for the Fisker Ocean SUV and recognized the remaining $196 million of deferred revenue into income.
| For the three months | ||||||||
| ended September 30, | ||||||||
| 2025 | 2024 | |||||||
| Recognition of deferred revenue | $ | — | $ | (196 | ) | |||
| Impairment of Fisker related net assets | — | 7 | ||||||
| Other income, net | — | (189 | ) | |||||
| Tax effect | — | 49 | ||||||
| Net gain attributable to Magna | $ | — | $ | (140 | ) | |||
| Magna International Inc. Third Quarter Report 2025 |
|
INCOME FROM OPERATIONS BEFORE INCOME TAXES
Income from operations before income taxes was $473 million for the third quarter of 2025, compared to $700 million for the third quarter of 2024. This $227 million decrease is a result of the following changes, each as discussed above:
| For the three months | ||||||||||||
| ended September 30, | ||||||||||||
| 2025 | 2024 | Change (i) | ||||||||||
| Sales | $ | 10,462 | $ | 10,280 | $ | 182 | ||||||
| Costs and expenses | ||||||||||||
| Cost of goods sold | 8,973 | 8,828 | 145 | |||||||||
| Selling, general and administrative | 531 | 487 | 44 | |||||||||
| Depreciation | 389 | 384 | 5 | |||||||||
| Amortization of acquired intangible assets | 27 | 28 | (1 | ) | ||||||||
| Interest expense, net | 65 | 54 | 11 | |||||||||
| Equity income | (44 | ) | (13 | ) | (31 | ) | ||||||
| Other expense (income), net | 48 | (188 | ) | 236 | ||||||||
| Income from operations before income taxes | $ | 473 | $ | 700 | $ | (227 | ) | |||||
| (i) | Change represents the increase (decrease) on Income from operations before income taxes. |
INCOME TAXES
| For the three months ended September 30, | ||||||||||||||||
| 2025 | 2024 | |||||||||||||||
| Income Taxes as reported | $ | 140 | 29.6 | % | $ | 192 | 27.4 | % | ||||||||
| Tax effect on Other expense (income), net and Amortization of acquired intangible assets | 5 | (3.1 | ) | (45 | ) | (0.2 | ) | |||||||||
| $ | 145 | 26.5 | % | $ | 147 | 27.2 | % | |||||||||
Excluding the tax effect on Other expense (income), net and Amortization of acquired intangible assets, our effective income tax rate decreased to 26.5% for the third quarter of 2025, compared to 27.2% for the third quarter of 2024, primarily due to the net favourable impact of foreign exchange adjustments recognized for U.S. GAAP purposes on a year-over-year basis. This was partially offset by a change in mix of earnings, increases in our reserves for uncertain tax positions, and a decrease in the benefit of research and development credits.
On July 4, 2025, the US enacted H.R. 1 "A bill to provide for reconciliation pursuant to Title II of H. Con. Res. 14", commonly referred to as the One Big Beautiful Bill Act. The impact on Magna’s consolidated financial statements was not material.
INCOME ATTRIBUTABLE TO NON-CONTROLLING INTERESTS
Income attributable to non-controlling interests was $28 million for the third quarter of 2025 compared to $24 million for the third quarter of 2024. The $4 million increase was primarily due to higher income at our non-wholly owned operations in China.
NET INCOME ATTRIBUTABLE TO MAGNA INTERNATIONAL INC.
Net income attributable to Magna International Inc. was $305 million for the third quarter of 2025, compared to $484 million for the third quarter of 2024. This $179 million decrease was as a result of a decrease in income from operations before income taxes of $227 million, an increase in income attributable to non-controlling interests of $4 million, partially offset by a decrease in income taxes of $52 million.
|
|
Magna International Inc. Third Quarter Report 2025 |
EARNINGS PER SHARE
 |
 |
| For the three months | ||||||||||||
| ended September 30, | ||||||||||||
| 2025 | 2024 | Change | ||||||||||
| Earnings per Common Share | ||||||||||||
| Basic | $ | 1.08 | $ | 1.68 | - | 36 | % | |||||
| Diluted | $ | 1.08 | $ | 1.68 | - | 36 | % | |||||
| Weighted average number of Common Shares outstanding (millions) | ||||||||||||
| Basic | 281.8 | 287.3 | - | 2 | % | |||||||
| Diluted | 281.8 | 287.3 | - | 2 | % | |||||||
| Adjusted diluted earnings per share | $ | 1.33 | $ | 1.28 | + | 4 | % | |||||
Diluted earnings per share was $1.08 for the third quarter of 2025, compared to diluted earnings per share of $1.68 for the third quarter of 2024. The $0.60 decrease was substantially as a result of: lower net income attributable to Magna International Inc., as discussed above; partially offset by a decrease in the weighted average number of diluted shares outstanding. The decrease in the weighted average number of diluted shares outstanding was substantially due to the purchase and cancellation of Common Shares, subsequent to the third quarter of 2024, pursuant to our normal course issuer bid.
Other expense (income), net, and Amortization of acquired intangible assets, each after tax, negatively impacted diluted earnings per share by $0.25 in the third quarter of 2025 and positively impacted diluted earnings per share by $0.40 in the third quarter of 2024, respectively. Adjusted diluted earnings per share, as reconciled in the "Non-GAAP Financial Measures Reconciliation" section, was $1.33 for the third quarter of 2025, compared to $1.28 for the third quarter of 2024, an increase of $0.05.
| Magna International Inc. Third Quarter Report 2025 |
|
NON-GAAP PERFORMANCE MEASURES – FOR THE THREE MONTHS ENDED SEPTEMBER 30, 2025
ADJUSTED EBIT AS A PERCENTAGE OF SALES
The table below shows the change in Magna's Sales and Adjusted EBIT by segment, as well as the impact each segment's changes had on Magna's Adjusted EBIT as a percentage of sales, for the third quarter of 2025 compared to the third quarter of 2024:
| Adjusted EBIT | ||||||||||||
| Adjusted | as a percentage | |||||||||||
| Sales | EBIT | of sales | ||||||||||
| Third quarter of 2024 | $ | 10,280 | $ | 594 | 5.8 | % | ||||||
| Increase (decrease) related to: | ||||||||||||
| Body Exteriors & Structures | 109 | 32 | + | 0.2 | % | |||||||
| Power & Vision | 17 | (43 | ) | - | 0.4 | % | ||||||
| Seating Systems | 141 | 11 | — | |||||||||
| Complete Vehicles | (74 | ) | 2 | + | 0.1 | % | ||||||
| Corporate and Other | (11 | ) | 17 | + | 0.2 | % | ||||||
| Third quarter of 2025 | $ | 10,462 | $ | 613 | 5.9 | % | ||||||
Adjusted EBIT as a percentage of sales increased to 5.9% for the third quarter of 2025 compared to 5.8% for the third quarter of 2024 primarily due to:
| · | productivity and efficiency improvements, including the benefit of operational excellence initiatives and recent restructuring activities; |
| · | higher equity income; |
| · | net transactional foreign exchange gains in the third quarter of 2025 compared to net transactional foreign exchange losses in the third quarter of 2024; and |
| · | increased earnings on higher sales. |
These factors were partially offset by:
| · | commercial items in the third quarters of 2025 and 2024, which had a net unfavourable impact on a year-over-year basis; |
| · | higher tariff costs; |
| · | higher production input costs net of customer recoveries, primarily for labour; |
| · | higher employee profit sharing, stock-based compensation, and incentive compensation; and |
| · | higher
pre-operating costs incurred at new facilities. |
|
|
Magna International Inc. Third Quarter Report 2025 |
ADJUSTED RETURN ON INVESTED CAPITAL
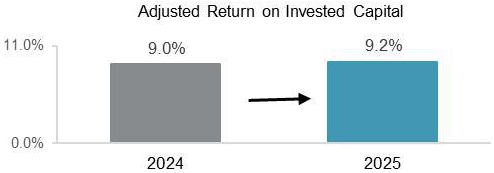
Adjusted Return on Invested Capital increased to 9.2% for the third quarter of 2025, compared to 9.0% for the third quarter of 2024, as a result of an increase in Adjusted After-tax operating profits, partially offset by higher Average Invested Capital.
Average Invested Capital increased $335 million to $19.58 billion for the third quarter of 2025, compared to $19.24 billion for the third quarter of 2024, primarily due to:
| · | the net strengthening of foreign currencies against the U.S. dollar; | |
| · | average investment in operating lease right-of-use assets in excess of average amortization expense on operating lease right-of-use assets; and | |
| · | average investment in fixed assets in excess of average depreciation expense on fixed assets. |
These factors were partially offset by:
| · | a decrease in average operating assets and liabilities; |
| · | long-lived asset impairments recorded in the fourth quarter of 2024; |
| · | divestitures during or subsequent to the third quarter of 2024; and |
| · | lower net investments in public and private equity companies and public company warrants. |
| Magna International Inc. Third Quarter Report 2025 |
|
SEGMENT ANALYSIS
We are a global automotive supplier that has complete vehicle engineering and contract manufacturing expertise, as well as product capabilities which include body, chassis, exterior, seating, powertrain, active driver assistance, electronics, mechatronics, mirrors, lighting and roof systems. We also have electronic and software capabilities across many of these areas.
Our reporting segments are: Body Exteriors & Structures; Power & Vision; Seating Systems; and Complete Vehicles.
| For the three months ended September 30, | ||||||||||||||||||||||||
| Sales | Adjusted EBIT | |||||||||||||||||||||||
| 2025 | 2024 | Change | 2025 | 2024 | Change | |||||||||||||||||||
| Body Exteriors & Structures | $ | 4,147 | $ | 4,038 | $ | 109 | $ | 305 | $ | 273 | $ | 32 | ||||||||||||
| Power & Vision | 3,854 | 3,837 | 17 | 236 | 279 | (43 | ) | |||||||||||||||||
| Seating Systems | 1,520 | 1,379 | 141 | 62 | 51 | 11 | ||||||||||||||||||
| Complete Vehicles | 1,085 | 1,159 | (74 | ) | 29 | 27 | 2 | |||||||||||||||||
| Corporate and Other | (144 | ) | (133 | ) | (11 | ) | (19 | ) | (36 | ) | 17 | |||||||||||||
| Total reportable segments | $ | 10,462 | $ | 10,280 | $ | 182 | $ | 613 | $ | 594 | $ | 19 | ||||||||||||
BODY EXTERIORS & STRUCTURES
| For
the three months ended September 30, |
||||||||||||||||
| 2025 | 2024 | Change | ||||||||||||||
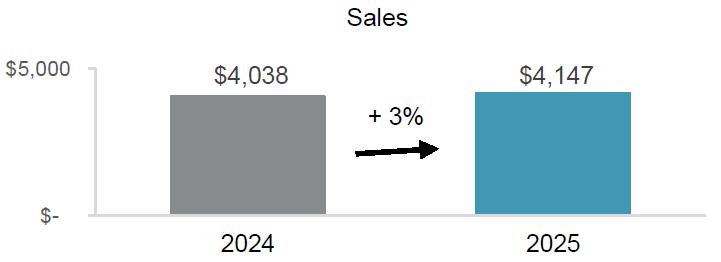
| Sales | $ | 4,147 | $ | 4,038 | $ | 109 | + | 3 | % | |||||||
| Adjusted EBIT | $ | 305 | $ | 273 | $ | 32 | + | 12 | % | |||||||
| Adjusted EBIT as a percentage of sales | 7.4 | % | 6.8 | % | + | 0.6 | % | |||||||||
Sales – Body Exteriors & Structures
Sales increased 3%, or $109 million, to $4.15 billion for the third quarter of 2025, compared to $4.04 billion for the third quarter of 2024 primarily due to:
| · | higher light vehicle production; |
| · | the launch of programs during or subsequent to the third quarter of 2024, including the: |
| · | Ford Expedition and Lincoln Navigator; |
| · | BMW X3; and |
| · | Skoda Elroq; and |
| · | the net strengthening of foreign currencies against the U.S. dollar, which increased reported U.S. dollar sales by $45 million. |
These factors were partially offset by:
| · | the end of production of certain programs, including the Chevrolet Malibu; and |
| · | net customer price concessions subsequent to the third quarter of 2024. |
|
|
Magna International Inc. Third Quarter Report 2025 |
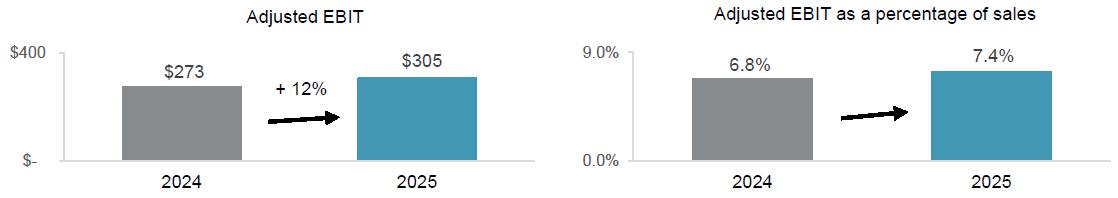
Adjusted EBIT and Adjusted EBIT as a percentage of sales – Body Exteriors & Structures
Adjusted EBIT increased $32 million to $305 million for the third quarter of 2025, compared to $273 million for the third quarter of 2024, and Adjusted EBIT as a percentage of sales increased to 7.4% from 6.8%. These increases were primarily due to:
| · | productivity and efficiency improvements, including the benefit of operational excellence initiatives and recent restructuring activities; |
| · | supply chain premiums in 2024, partially as a result of a supplier bankruptcy; and |
| · | increased earnings on higher sales. |
These factors were partially offset by:
| · | higher pre-operating costs incurred at new facilities; |
| · | higher tariff costs; and |
| · | lower net transactional foreign exchange gains in the third quarter of 2025 compared to the third quarter of 2024. |
POWER & VISION
| For
the three months ended September 30, |
||||||||||||||||
| 2025 | 2024 | Change | ||||||||||||||
| Sales | $ | 3,854 | $ | 3,837 | $ | 17 | — | |||||||||
| Adjusted EBIT | $ | 236 | $ | 279 | $ | (43 | ) | - | 15 | % | ||||||
| Adjusted EBIT as a percentage of sales | 6.1 | % | 7.3 | % | - | 1.2 | % | |||||||||
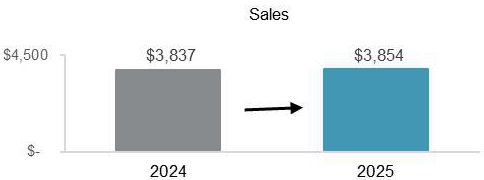
Sales – Power & Vision
Sales increased $17 million to $3.85 billion for the third quarter of 2025, compared to $3.84 billion for the third quarter of 2024 primarily due to:
| · | the launch of programs during or subsequent to the third quarter of 2024, including the: |
| · | Jetour T1; |
| · | BMW 1-Series; and |
| · | BMW X3; and |
| · | the net strengthening of foreign currencies against the U.S. dollar, which increased reported U.S. dollar sales by $85 million. |
These factors were partially offset by:
| · | net customer price concessions subsequent to the third quarter of 2024; |
| · | lower production on certain programs; |
| · | the end of production of certain programs, including the Subaru Legacy; and |
| · | commercial items in the third quarters of 2025 and 2024, which had a net unfavourable impact on a year-over-year basis. |
| Magna International Inc. Third Quarter Report 2025 |
|
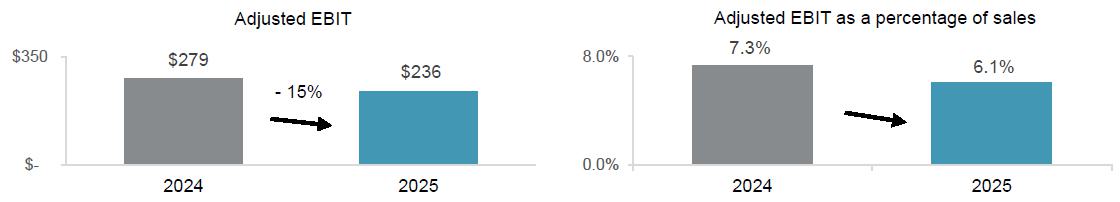
Adjusted EBIT and Adjusted EBIT as a percentage of sales – Power & Vision
Adjusted EBIT decreased $43 million to $236 million for the third quarter of 2025, compared to $279 million for the third quarter of 2024, and Adjusted EBIT as a percentage of sales decreased to 6.1% from 7.3%. These decreases were primarily due to:
| · | commercial items in the third quarters of 2025 and 2024, which had a net unfavourable impact on a year-over-year basis; |
| · | reduced earnings due to unfavourable product mix; |
| · | higher tariff costs; and |
| · | higher production input costs net of customer recoveries, primarily for labour. |
These factors were partially offset by:
| · | productivity and efficiency improvements, including the benefit of operational excellence initiatives and recent restructuring activities; |
| · | higher equity income; and |
| · | lower launch costs. |
SEATING SYSTEMS
| For
the three months ended September 30, |
||||||||||||||||
| 2025 | 2024 | Change | ||||||||||||||
| Sales | $ | 1,520 | $ | 1,379 | $ | 141 | + | 10 | % | |||||||
| Adjusted EBIT | $ | 62 | $ | 51 | $ | 11 | + | 22 | % | |||||||
| Adjusted EBIT as a percentage of sales | 4.1 | % | 3.7 | % | + | 0.4 | % | |||||||||
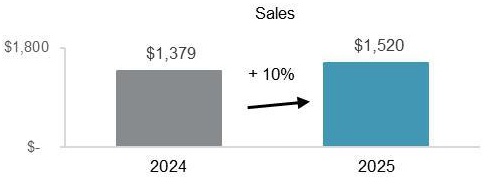
Sales – Seating Systems
Sales increased 10%, or $141 million, to $1.52 billion for the third quarter of 2025, compared to $1.38 billion for the third quarter of 2024 primarily due to:
| · | the launch of programs during or subsequent to the third quarter of 2024, including the: |
| · | Skoda Elroq; |
| · | Cadillac Vistiq; and |
| · | Ford Expedition and Lincoln Navigator; and |
| · | the net strengthening of foreign currencies against the U.S. dollar, which increased reported U.S. dollar sales by $22 million. |
These factors were partially offset by:
| · | lower production on certain programs; |
| · | the end of production of certain programs; |
| · | net customer price concessions subsequent to the third quarter of 2024; and |
| · | commercial items in the third quarters of 2025 and 2024, which had a net unfavourable impact on a year-over-year basis. |
|
|
Magna International Inc. Third Quarter Report 2025 |
Adjusted EBIT and Adjusted EBIT as a percentage of sales – Seating Systems
Adjusted EBIT increased $11 million to $62 million for the third quarter of 2025, compared to $51 million for the third quarter of 2024, and Adjusted EBIT as a percentage of sales increased to 4.1% from 3.7%. These increases were primarily due to:
| · | increased earnings on higher sales; |
| · | higher equity income; and |
| · | the benefit of government research and development incentives in the third quarter of 2025. |
These factors were partially offset by commercial items in the third quarters of 2025 and 2024, which had a net unfavourable impact on a year-over-year basis, and higher tariff costs.
COMPLETE VEHICLES
| For
the three months ended September 30, |
||||||||||||||||
| 2025 | 2024 | Change | ||||||||||||||
| Complete Vehicle Assembly Volumes (thousands of units)(i) | 14.7 | 15.5 | (0.8 | ) | - | 5 | % | |||||||||
| Sales | $ | 1,085 | $ | 1,159 | $ | (74 | ) | - | 6 | % | ||||||
| Adjusted EBIT | $ | 29 | $ | 27 | $ | 2 | + | 7 | % | |||||||
| Adjusted EBIT as a percentage of sales | 2.7 | % | 2.3 | % | + | 0.4 | % | |||||||||
| (i) | Vehicles produced at our Complete Vehicle operations are included in Europe Light Vehicle Production volumes. |
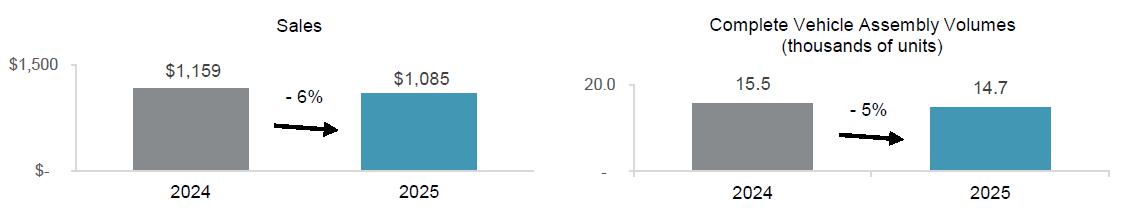
Sales – Complete Vehicles
Sales decreased 6%, or $74 million, to $1.09 billion for the third quarter of 2025, compared to $1.16 billion for the third quarter of 2024, and assembly volumes decreased 5%. The decrease in sales is primarily a result of: lower assembly volumes including the end of production of the Jaguar I-Pace and Jaguar E-Pace; and lower engineering revenue. These factors were partially offset by: the launch of the electric version of the Mercedes-Benz G-Class during fourth quarter of 2024; and a $64 million increase in reported U.S. dollar sales as a result of the strengthening of the euro against the U.S. dollar.
| Magna International Inc. Third Quarter Report 2025 |
|
Adjusted EBIT and Adjusted EBIT as a percentage of sales – Complete Vehicles
Adjusted EBIT increased $2 million to $29 million for the third quarter of 2025, compared to $27 million for the third quarter of 2024, and Adjusted EBIT as a percentage of sales increased to 2.7% from 2.3%. These increases were primarily due to:
| · | productivity and efficiency improvements, including the benefit of operational excellence initiatives and recent restructuring activities; |
| · | higher earnings due to favourable program mix; and |
| · | commercial items in the third quarters of 2025 and 2024, which had a net favourable impact on a year-over-year basis. |
These factors were partially offset by:
| · | lower engineering sales; |
| · | higher restructuring costs; and |
| · | reduced earnings on lower assembly volumes. |
CORPORATE AND OTHER
Adjusted EBIT was a loss of $19 million for the third quarter of 2025 compared to a loss of $36 million for the third quarter of 2024. The $17 million improvement was primarily the result of:
| · | net transactional foreign exchange gains in the third quarter of 2025, compared to net transactional foreign exchange losses in the third quarter of 2024; and |
| · | an increase in fees received from our divisions. |
These factors were partially offset by:
| · | higher consulting and legal costs; |
| · | higher investments in research, development and new mobility; and |
| · | higher stock-based compensation. |
|
|
Magna International Inc. Third Quarter Report 2025 |
FINANCIAL CONDITION, LIQUIDITY AND CAPITAL RESOURCES
OPERATING ACTIVITIES
| For the
three months ended September 30, |
||||||||||||
| 2025 | 2024 | Change | ||||||||||
| Net income | $ | 333 | $ | 508 | ||||||||
| Items not involving current cash flows | 454 | 277 | ||||||||||
| 787 | 785 | $ | 2 | |||||||||
| Changes in operating assets and liabilities | 125 | (58 | ) | 183 | ||||||||
| Cash provided from operating activities | $ | 912 | $ | 727 | $ | 185 | ||||||
Cash provided from operating activities
Comparing the third quarter of 2025 to 2024, cash provided from operating activities increased by $185 million primarily as a result of:
| · | a $360 million decrease in cash paid for materials and overhead; and |
| · | a $6 million increase in cash received from customers. |
These factors were partially offset by:
| · | a $127 million increase in cash paid for labour; |
| · | a $43 million increase in cash taxes; |
| · | an $8 million increase in cash interest paid; and |
| · | lower dividends received from equity investments of $1 million. |
Changes in operating assets and liabilities
During the third quarter of 2025, we generated $125 million for operating assets and liabilities primarily consisting of:
| · | a $158 million increase in accounts payable; |
| · | an $81 million increase in accrued wages and salaries; |
| · | a $48 million increase in other accrued liabilities; |
| · | a $40 million decrease in prepaids and other; and |
| · | a $16 million increase in taxes payable. |
These factors were partially offset by:
| · | a $105 million increase in production inventory; |
| · | a $76 million increase in production and other receivables; and |
| · | a $37 million increase in tooling investment for current and upcoming program launches. |
| Magna International Inc. Third Quarter Report 2025 |
|
INVESTING ACTIVITIES
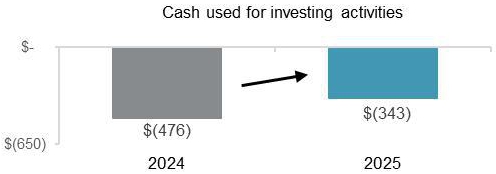
| For the
three months ended September 30, |
||||||||||||
| 2025 | 2024 | Change | ||||||||||
| Fixed asset additions | $ | (267 | ) | $ | (476 | ) | ||||||
| Increase in investments, other assets and intangible assets | (100 | ) | (115 | ) | ||||||||
| Increase in public and private equity investments | (2 | ) | (1 | ) | ||||||||
| Acquisitions | (1 | ) | — | |||||||||
| Proceeds from dispositions | 27 | 38 | ||||||||||
| Net cash inflow from disposal of facilities | — | 78 | ||||||||||
| Cash used for investing activities | $ | (343 | ) | $ | (476 | ) | $ | 133 | ||||
Cash used for investing activities in the third quarter of 2025 was $133 million lower compared to the third quarter of 2024. The change between the third quarter of 2025, and the third quarter of 2024, was primarily due to: a $209 million decrease in cash used for fixed assets; and a $15 million decrease in cash used for investments, other assets and intangible assets. These factors were partially offset by: the net cash inflow from the disposal of our Body Exteriors & Structures operations in India during the third quarter of 2024 and lower proceeds from dispositions.
FINANCING ACTIVITIES
| For the
three months ended September 30, |
||||||||||||
| 2025 | 2024 | Change | ||||||||||
| Repayments of debt | $ | (672 | ) | $ | (20 | ) | ||||||
| Dividends paid | (136 | ) | (138 | ) | ||||||||
| Acquisition of non-controlling interest | (40 | ) | — | |||||||||
| Dividends paid to non-controlling interests | (15 | ) | (10 | ) | ||||||||
| Increase (decrease) in short-term borrowings | 88 | (36 | ) | |||||||||
| Issues of debt | 1 | 9 | ||||||||||
| Cash used for financing activities | $ | (774 | ) | $ | (195 | ) | $ | 579 | ||||
On September 24, 2025, we repaid $650 million in Senior Notes, which were due in October 2025.
Cash dividends paid per Common Share were $0.485 for the third quarter of 2025, compared to $0.475 for the third quarter of 2024.
During the third quarter of 2025, we acquired the non-controlling 35% interest in a consolidated subsidiary, increasing our interest to 100%. The total purchase price was $134 million, of which $40 million was paid through a dividend distribution during the third quarter of 2025. The remaining $94 million is expected to be paid during the fourth quarter of 2025.
Short-term borrowings increased $88 million during the third quarter of 2025, primarily due to a $139 million increase in notes outstanding under the euro-commercial paper program. This was partially offset by a $51 million decrease in notes outstanding under the U.S. commercial paper program.
|
|
Magna International Inc. Third Quarter Report 2025 |
FINANCING RESOURCES
| As at September 30, 2025 |
As at December 31, 2024 |
Change | ||||||||||
| Liabilities | ||||||||||||
| Short-term borrowings | $ | 433 | $ | 271 | ||||||||
| Long-term debt due within one year | 33 | 708 | ||||||||||
| Current portion of operating lease liabilities | 323 | 293 | ||||||||||
| Long-term debt | 4,967 | 4,134 | ||||||||||
| Operating lease liabilities | 1,722 | 1,662 | ||||||||||
| $ | 7,478 | $ | 7,068 | $ | 410 | |||||||
Financial liabilities increased $410 million to $7.48 billion as at September 30, 2025, primarily as a result of the issuance of €575 million and $400 million of Senior Notes during the second quarter of 2025; an increase in notes outstanding under the euro commercial paper program; the strengthening of foreign currencies against the U.S. dollar; and renewing existing and entering into new operating lease agreements. These increases were partially offset by the repayments of $300 million and $650 million in Senior Notes during the second and third quarters of 2025, respectively, repayment of $100 million of the 3-year tranche Term Loan during the second quarter of 2025 and a decrease in notes outstanding under the U.S. commercial paper program.
CASH RESOURCES
In the third quarter of 2025, our cash resources decreased by $209 million to $1.3 billion, primarily as a result of cash used for financing and investing activities, partially offset by cash provided from operating activities. In addition to our cash resources at September 30, 2025, we had term and operating lines of credit totaling $4.4 billion, of which $3.5 billion was unused and available.
On July 8, 2025, we amended our syndicated, unsecured, delayed draw term loan (the "Term Loan") to reduce the 3-year tranche amount from $650 million to $350 million and extended the draw expiration date from July 12, 2025 to January 12, 2026. As at September 30, 2025, no amounts had been drawn.
MAXIMUM NUMBER OF SHARES ISSUABLE
The following table presents the maximum number of shares that would be outstanding if all of the outstanding options at October 30, 2025 were exercised:
| Common Shares | 281,814,257 | |||
| Stock options (i) | 6,012,349 | |||
| 287,826,606 |
| (i) | Options to purchase Common Shares are exercisable by the holder in accordance with the vesting provisions and upon payment of the exercise price as may be determined from time to time pursuant to our stock option plans. |
CONTRACTUAL OBLIGATIONS
There have been no material changes with respect to the contractual obligations requiring annual payments during the third quarter of 2025 that are outside the ordinary course of our business. Refer to our MD&A included in our 2024 Annual Report.
| Magna International Inc. Third Quarter Report 2025 |
|
RESULTS OF OPERATIONS – FOR THE NINE MONTHS ENDED SEPTEMBER 30, 2025
| For the nine months ended September 30, | ||||||||||||||||||||||||
| Sales | Adjusted EBIT | |||||||||||||||||||||||
| 2025 | 2024 | Change | 2025 | 2024 | Change | |||||||||||||||||||
| Body Exteriors & Structures | $ | 12,366 | $ | 12,932 | $ | (566 | ) | $ | 882 | $ | 912 | $ | (30 | ) | ||||||||||
| Power & Vision | 11,357 | 11,605 | (248 | ) | 522 | 575 | (53 | ) | ||||||||||||||||
| Seating Systems | 4,265 | 4,289 | (24 | ) | 74 | 156 | (82 | ) | ||||||||||||||||
| Complete Vehicles | 3,587 | 3,784 | (197 | ) | 101 | 74 | 27 | |||||||||||||||||
| Corporate and Other | (413 | ) | (402 | ) | (11 | ) | (29 | ) | (77 | ) | 48 | |||||||||||||
| Total reportable segments | $ | 31,162 | $ | 32,208 | $ | (1,046 | ) | $ | 1,550 | $ | 1,640 | $ | (90 | ) | ||||||||||
BODY EXTERIORS & STRUCTURES
| For the
nine months ended September 30, |
||||||||||||||||
| 2025 | 2024 | Change | ||||||||||||||
| Sales | $ | 12,366 | $ | 12,932 | $ | (566 | ) | - | 4 | % | ||||||
| Adjusted EBIT | $ | 882 | $ | 912 | $ | (30 | ) | - | 3 | % | ||||||
| Adjusted EBIT as a percentage of sales | 7.1 | % | 7.1 | % | — | |||||||||||
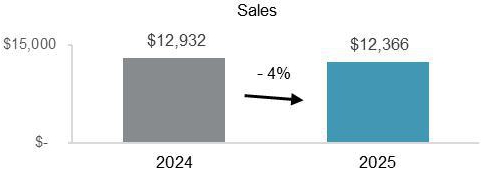
Sales – Body Exteriors & Structures
Sales decreased 4%, or $566 million, to $12.37 billion for the nine months ended September 30, 2025, compared to $12.93 billion for the nine months ended September 30, 2024, primarily due to:
| · | lower light vehicle production in North America and Europe; |
| · | the end of production of certain programs, including the: |
| · | Chevrolet Malibu; |
| · | Ford Edge; and |
| · | Citroen C3; |
| · | the divestiture of our operations in India subsequent to the first nine months of 2024, which decreased sales by $119 million; and |
| · | net customer price concessions subsequent to the first nine months of 2024. |
These factors were partially offset by:
| · | the launch of programs during or subsequent to the first nine months of 2024, including the: |
| · | GMC Acadia, Chevrolet Traverse and Buick Enclave; |
| · | Skoda Elroq; and |
| · | Jeep Wagoneer S; |
| · | commercial items in the first nine months of 2025 and 2024, which had a net favourable impact on a year-over-year basis; and |
| · | the net strengthening of foreign currencies against the U.S. dollar, which increased reported U.S. dollar sales by $10 million. |
|
|
Magna International Inc. Third Quarter Report 2025 |
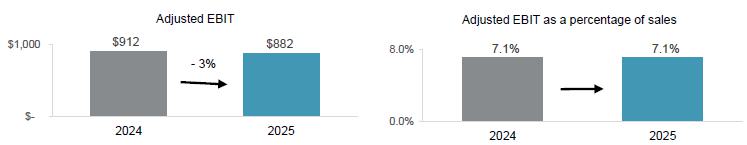
Adjusted EBIT and Adjusted EBIT as a percentage of sales – Body Exteriors & Structures
Adjusted EBIT decreased $30 million to $882 million for the nine months ended September 30, 2025, compared to $912 million for the nine months ended September 30, 2024, and Adjusted EBIT as a percentage of sales was 7.1% in both periods. Factors decreasing Adjusted EBIT and impacting Adjusted EBIT as a percentage of sales included:
| · | reduced earnings on lower sales; |
| · | higher pre-operating costs incurred at new facilities; |
| · | net transactional foreign exchange losses in the first nine months of 2025, compared to net transactional foreign exchange gains in the first nine months of 2024; |
| · | higher tariff costs; |
| · | higher launch costs; and |
| · | higher production input costs net of customer recoveries, primarily for labour. |
These factors were partially offset by:
| · | productivity and efficiency improvements, including the benefit of operational excellence initiatives and recent restructuring activities; |
| · | commercial items in the first nine months of 2025 and 2024, which had a net favourable impact on a year-over-year basis; and |
| · | supply chain premiums in 2024, partially as a result of a supplier bankruptcy. |
POWER & VISION
| For the nine months ended September 30, |
||||||||||||||||
| 2025 | 2024 | Change | ||||||||||||||
| Sales | $ | 11,357 | $ | 11,605 | $ | (248 | ) | - | 2 | % | ||||||
| Adjusted EBIT | $ | 522 | $ | 575 | $ | (53 | ) | - | 9 | % | ||||||
| Adjusted EBIT as a percentage of sales | 4.6 | % | 5.0 | % | - | 0.4 | % | |||||||||
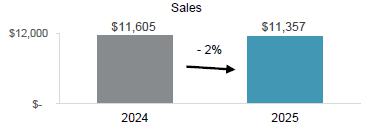
Sales – Power & Vision
Sales decreased 2%, or $248 million, to $11.36 billion for the nine months ended September 30, 2025, compared to $11.61 billion for the nine months ended September 30, 2024, primarily due to:
| · | lower light vehicle production in North America and Europe; |
| · | the end of production of certain programs, including the: |
| · | Jeep Compass; and |
| · | Subaru Legacy; and |
| · | net customer price concessions subsequent to the first nine months of 2024. |
| Magna International Inc. Third Quarter Report 2025 |
|
These factors were partially offset by:
| · | the launch of programs during or subsequent to the first nine months of 2024, including the: |
| · | GMC Acadia, Chevrolet Traverse and Buick Enclave; |
| · | Mercedes-Benz G-Class; and |
| · | Jetour T1; and |
| · | the net strengthening of foreign currencies against the U.S. dollar, which increased reported U.S. dollar sales by $93 million. |
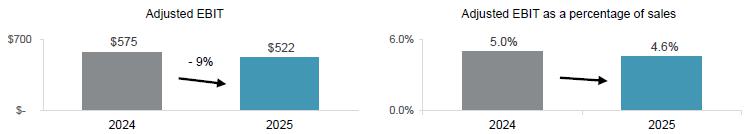
Adjusted EBIT and Adjusted EBIT as a percentage of sales – Power & Vision
Adjusted EBIT decreased $53 million to $522 million for the nine months ended September 30, 2025, compared to $575 million for the nine months ended September 30, 2024, and Adjusted EBIT as a percentage of sales decreased to 4.6% from 5.0%. These decreases were primarily due to:
| · | reduced earnings on lower sales; |
| · | higher tariff costs; |
| · | net transactional foreign exchange losses in the first nine months of 2025, compared to net transactional foreign exchange gains in the first nine months of 2024; and |
| · | commercial items in the first nine months of 2025 and 2024, which had a net unfavourable impact on a year-over-year basis. |
These factors were partially offset by:
| · | productivity and efficiency improvements, including the benefit of operational excellence initiatives and recent restructuring activities; |
| · | lower launch costs; and |
| · | higher equity income. |
SEATING SYSTEMS
| For the nine months ended September 30, |
||||||||||||||||
| 2025 | 2024 | Change | ||||||||||||||
| Sales | $ | 4,265 | $ | 4,289 | $ | (24 | ) | - | 1 | % | ||||||
| Adjusted EBIT | $ | 74 | $ | 156 | $ | (82 | ) | - | 53 | % | ||||||
| Adjusted EBIT as a percentage of sales | 1.7 | % | 3.6 | % | - | 1.9 | % | |||||||||
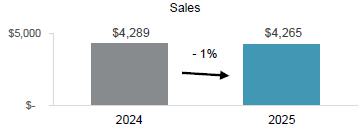
|
|
Magna International Inc. Third Quarter Report 2025 |
Sales – Seating Systems
Sales decreased 1%, or $24 million, to $4.27 billion for the nine months ended September 30, 2025, compared to $4.29 billion for the nine months ended September 30, 2024, primarily due to:
| · | lower light vehicle production in North America and Europe; |
| · | the end of production of certain programs, including the: |
| · | Ford Edge; and |
| · | Volkswagen Transporter; and |
| · | net customer price concessions subsequent to the first nine months of 2024. |
These factors were partially offset by:
| · | the launch of programs during or subsequent to the first nine months of 2024, including the: |
| · | Audi A5; |
| · | Skoda Elroq; and |
| · | GMC Acadia, Chevrolet Traverse and Buick Enclave; and |
| · | the net strengthening of foreign currencies against the U.S. dollar, which increased reported U.S. dollar sales by $21 million. |
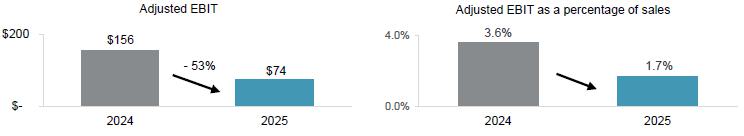
Adjusted EBIT and Adjusted EBIT as a percentage of sales – Seating Systems
Adjusted EBIT decreased $82 million to $74 million for the nine months ended September 30, 2025, compared to $156 million for the nine months ended September 30, 2024, and Adjusted EBIT as a percentage of sales decreased to 1.7% from 3.6%. These decreases were primarily due to:
| · | higher tariff costs; |
| · | higher net warranty costs of $28 million; |
| · | net transactional foreign exchange losses in the first nine months of 2025, compared to net transactional foreign exchange gains in the first nine months of 2024; |
| · | higher production input costs net of customer recoveries, primarily relating to labour and certain commodities; |
| · | commercial items in the first nine months of 2025 and 2024, which had a net unfavourable impact on a year-over-year basis; and |
| · | reduced earnings on lower sales. |
These factors were partially offset by higher equity income, and the benefit of government research and development incentives in the third quarter of 2025.
COMPLETE VEHICLES
| For
the nine months ended September 30, |
||||||||||||||||
| 2025 | 2024 | Change | ||||||||||||||
| Complete Vehicle Assembly Volumes (thousands of units)(i) | 48.4 | 56.4 | (8.0 | ) | - | 14 | % | |||||||||
| Sales | $ | 3,587 | $ | 3,784 | $ | (197 | ) | - | 5 | % | ||||||
| Adjusted EBIT | $ | 101 | $ | 74 | $ | 27 | + | 36 | % | |||||||
| Adjusted EBIT as a percentage of sales | 2.8 | % | 2.0 | % | + | 0.8 | % | |||||||||
(i) Vehicles produced at our Complete Vehicle operations are included in Europe Light Vehicle Production volumes.
| Magna International Inc. Third Quarter Report 2025 |
|
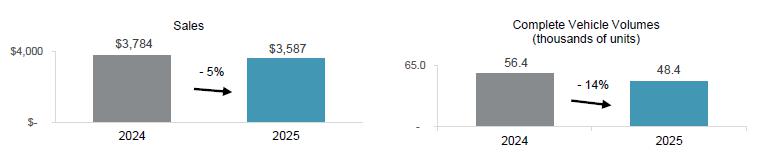
Sales – Complete Vehicles
Sales decreased 5%, or $197 million, to $3.59 billion for the nine months ended September 30, 2025, compared to $3.78 billion for the nine months ended September 30, 2024, and assembly volumes decreased 14%. The decrease in sales is primarily a result of: lower assembly volumes, including the end of production of the Jaguar I-Pace and Jaguar E-Pace; and lower engineering revenue. These factors were partially offset by: the launch of the electric version of the Mercedes-Benz G-Class during the fourth quarter of 2024; and a $85 million increase in reported U.S. dollar sales as a result of the strengthening of the euro against the U.S. dollar.
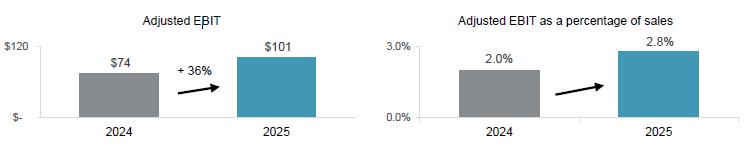
Adjusted EBIT and Adjusted EBIT as a percentage of sales – Complete Vehicles
Adjusted EBIT increased $27 million to $101 million for the nine months ended September 30, 2025, compared to $74 million for the nine months ended September 30, 2024, and Adjusted EBIT as a percentage of sales increased to 2.8% from 2.0%. These increases were primarily due to:
| · | productivity and efficiency improvements, including the benefit of operational excellence initiatives and recent restructuring activities; and |
| · | higher earnings due to favourable program mix. |
These factors were partially offset by reduced earnings on lower assembly volumes.
CORPORATE AND OTHER
Adjusted EBIT was a loss of $29 million for the nine months ended September 30, 2025, compared to a loss of $77 million for the nine months ended September 30, 2024. The $48 million improvement was primarily the result of:
| · | net transactional foreign exchange gains in the first nine months of 2025, compared to net transactional foreign exchange losses in the first nine months of 2024; |
| · | an increase in fees received from our divisions; and |
| · | higher equity income. |
These factors were partially offset by
| · | higher incentive and stock-based compensation; |
| · | a gain on the sale of an equity-method investment during the first nine months of 2024; |
| · | higher consulting and legal costs; and |
| · | higher costs to accelerate operational excellence initiatives. |
|
|
Magna International Inc. Third Quarter Report 2025 |
NON-GAAP PERFORMANCE MEASURES - FOR THE NINE MONTHS ENDED SEPTEMBER 30, 2025
ADJUSTED EBIT AS A PERCENTAGE OF SALES
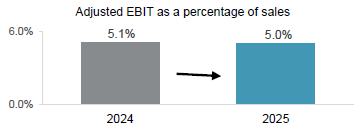
The table below shows the change in Magna's Sales and Adjusted EBIT by segment, as well as the impact each segment's changes have on Magna's Adjusted EBIT as a percentage of sales, for the nine months ended September 30, 2025 compared to the nine months ended September 30, 2024:
| Adjusted EBIT | ||||||||||||
| Adjusted | as a percentage | |||||||||||
| Sales | EBIT | of sales | ||||||||||
| Nine months ended September 30, 2024 | $ | 32,208 | $ | 1,640 | 5.1 | % | ||||||
| Increase (decrease) related to: | ||||||||||||
| Body Exteriors & Structures | (566 | ) | (30 | ) | — | |||||||
| Power & Vision | (248 | ) | (53 | ) | - | 0.1 | % | |||||
| Seating Systems | (24 | ) | (82 | ) | - | 0.3 | % | |||||
| Complete Vehicles | (197 | ) | 27 | + | 0.1 | % | ||||||
| Corporate and Other | (11 | ) | 48 | + | 0.2 | % | ||||||
| Nine months ended September 30, 2025 | $ | 31,162 | $ | 1,550 | 5.0 | % |
Adjusted EBIT as a percentage of sales decreased to 5.0% for the nine months ended September 30, 2025, compared to 5.1% for the nine months ended September 30, 2024, primarily due to:
| · | reduced earnings on lower sales; |
| · | higher tariff costs; |
| · | higher pre-operating costs incurred at new facilities; |
| · | higher employee profit sharing, stock-based and incentive compensation; |
| · | lower net transactional foreign exchange gains in the first nine months of 2025 compared to the first nine months of 2024; |
| · | higher production input costs net of customer recoveries, primarily for labour; and |
| · | reduced earnings on lower assembly volumes. |
These factors were partially offset by:
| · | productivity and efficiency improvements, including the benefit of operational excellence initiatives and recent restructuring activities; |
| · | higher equity income; and |
| · | supply chain premiums in 2024, partially as a result of a supplier bankruptcy. |
| Magna International Inc. Third Quarter Report 2025 |
|
ADJUSTED RETURN ON INVESTED CAPITAL
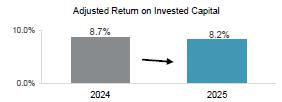
Adjusted Return on Invested Capital decreased to 8.2% for the nine months ended September 30, 2025, compared to 8.7% for the nine months ended September 30, 2024, as a result of a decrease in Adjusted After-tax operating profits and higher Average Invested Capital.
Average Invested Capital increased $22 million to $19.08 billion for the nine months ended September 30, 2025, compared to $19.06 billion for the nine months ended September 30, 2024, primarily due to:
| · | average investment in operating lease right-of-use assets in excess of average amortization expense on operating lease right-of-use assets; and |
| · | average investment in fixed assets in excess of average depreciation expense on fixed assets. |
These factors were partially offset by:
| · | a decrease in average operating assets and liabilities; |
| · | long-lived asset impairments during or subsequent to the first nine months of 2024; |
| · | the net weakening of foreign currencies against the U.S. dollar; |
| · | divestitures, net of acquisitions, during or subsequent to the first nine months of 2024; and |
| · | lower net investments in public and private equity companies and public company warrants. |
|
|
Magna International Inc. Third Quarter Report 2025 |
NON-GAAP FINANCIAL MEASURES RECONCILIATION
The reconciliation of Non-GAAP financial measures is as follows:
ADJUSTED EBIT
| For
the three months ended September 30, |
For
the nine months ended September 30, |
|||||||||||||||
| 2025 | 2024 | 2025 | 2024 | |||||||||||||
| Net income | $ | 333 | $ | 508 | $ | 880 | $ | 862 | ||||||||
| Add (deduct): | ||||||||||||||||
| Amortization of acquired intangible assets | 27 | 28 | 82 | 84 | ||||||||||||
| Interest expense, net | 65 | 54 | 167 | 159 | ||||||||||||
| Other expense (income), net | 48 | (188 | ) | 107 | 236 | |||||||||||
| Income taxes | 140 | 192 | 314 | 299 | ||||||||||||
| Adjusted EBIT | $ | 613 | $ | 594 | $ | 1,550 | $ | 1,640 | ||||||||
ADJUSTED EBIT AS A PERCENTAGE OF SALES
| For
the three months ended September 30, |
For
the nine months ended September 30, |
|||||||||||||||
| 2025 | 2024 | 2025 | 2024 | |||||||||||||
| Sales | $ | 10,462 | $ | 10,280 | $ | 31,162 | $ | 32,308 | ||||||||
| Adjusted EBIT | $ | 613 | $ | 594 | $ | 1,550 | $ | 1,640 | ||||||||
| Adjusted EBIT as a percentage of sales | 5.9 | % | 5.8 | % | 5.0 | % | 5.1 | % | ||||||||
ADJUSTED DILUTED EARNINGS PER SHARE
| For
the three months ended September 30, |
For
the nine months ended September 30, |
|||||||||||||||
| 2025 | 2024 | 2025 | 2024 | |||||||||||||
| Net income attributable to Magna International Inc. | $ | 305 | $ | 484 | $ | 830 | $ | 806 | ||||||||
| Add (deduct): | ||||||||||||||||
| Amortization of acquired intangible assets | 27 | 28 | 82 | 84 | ||||||||||||
| Other expense (income), net | 48 | (188 | ) | 107 | 236 | |||||||||||
| Tax effect on Amortization of acquired intangible assets and Other expense (income), net | (5 | ) | 45 | (18 | ) | (57 | ) | |||||||||
| Adjusted net income attributable to Magna International Inc. | 375 | 369 | 1,001 | 1,069 | ||||||||||||
| Diluted weighted average number of Common Shares outstanding during the period (millions) | 281.8 | 287.3 | 281.9 | 287.2 | ||||||||||||
| Adjusted diluted earnings per share | $ | 1.33 | $ | 1.28 | $ | 3.55 | $ | 3.72 | ||||||||
| Magna International Inc. Third Quarter Report 2025 |
|
ADJUSTED RETURN ON INVESTED CAPITAL
Adjusted Return on Invested Capital is calculated as annualized Adjusted After-tax operating profits divided by Average Invested Capital for the period. Average Invested Capital for the three month period is averaged on a two-fiscal quarter basis and for the nine month period is averaged on a four-fiscal quarter basis.
| For
the three months ended September 30, |
For
the nine months ended September 30, |
|||||||||||||||
| 2025 | 2024 | 2025 | 2024 | |||||||||||||
| Net income | $ | 333 | $ | 508 | $ | 880 | $ | 862 | ||||||||
| Add (deduct): | ||||||||||||||||
| Amortization of acquired intangible assets | 27 | 28 | 82 | 84 | ||||||||||||
| Interest expense, net | 65 | 54 | 167 | 159 | ||||||||||||
| Other expense (income), net | 48 | (188 | ) | 107 | 236 | |||||||||||
| Tax effect on Interest expense, net, Amortization of acquired intangible assets and Other expense (income), net | (22 | ) | 30 | (59 | ) | (95 | ) | |||||||||
| Adjusted After-tax operating profits | $ | 451 | $ | 432 | $ | 1,177 | $ | 1,246 | ||||||||
| As at September 30, | ||||||||
| 2025 | 2024 | |||||||
| Total Assets | $ | 32,907 | $ | 32,790 | ||||
| Excluding: | ||||||||
| Cash and cash equivalents | (1,327 | ) | (1,061 | ) | ||||
| Deferred tax assets | (920 | ) | (811 | ) | ||||
| Less Current Liabilities | (12,059 | ) | (12,600 | ) | ||||
| Excluding: | ||||||||
| Short-term borrowings | 433 | 828 | ||||||
| Long-term debt due within one year | 33 | 65 | ||||||
| Current portion of operating lease liabilities | 323 | 319 | ||||||
| Invested Capital | $ | 19,390 | $ | 19,530 | ||||
| For
the three months ended September 30, |
For
the nine months ended September 30, |
|||||||||||||||
| 2025 | 2024 | 2025 | 2024 | |||||||||||||
| Adjusted After-tax operating profits | $ | 451 | $ | 432 | $ | 1,177 | $ | 1,246 | ||||||||
| Average Invested Capital | $ | 19,575 | $ | 19,240 | $ | 19,077 | $ | 19,055 | ||||||||
| Adjusted Return on Invested Capital | 9.2 | % | 9.0 | % | 8.2 | % | 8.7 | % | ||||||||
|
|
Magna International Inc. Third Quarter Report 2025 |
SUBSEQUENT EVENT
NORMAL COURSE ISSUER BID
Subject to approval by the Toronto Stock Exchange ["TSX"], our Board of Directors approved a new normal course issuer bid to purchase up to 25.3 million of our Common Shares, representing approximately 10% of our public float. The primary purposes of the normal course issuer bid are purchases for cancellation as well as purchases to fund our stock-based compensation awards and programs. The normal course issuer bid is expected to be effective on November 7, 2025 and will terminate no later than November 6, 2026. All purchases of Common Shares will be made at the market price at the time of purchase in accordance with the rules and policies of the TSX or on the New York Stock Exchange ["NYSE"] in compliance with Rule 10b-18 under the U.S. Securities Exchange Act of 1934.
Purchases may also be made through alternative trading systems in Canada and the U.S., or by such other means permitted by the TSX, including by private agreement or specific share repurchase program at a discount to the prevailing market price, pursuant to an issuer bid exemption order issued by a securities regulatory authority.
COMMITMENTS AND CONTINGENCIES
From time to time, we may be contingently liable for litigation, legal and/or regulatory actions and proceedings, and other claims. Refer to Note 15, "Contingencies" of our unaudited interim consolidated financial statements for the three and nine months ended September 30, 2025.
For a discussion of risk factors relating to legal and other claims/actions against us, refer to "Item 5. Risk Factors" in our Annual Information Form, filed with the securities commissions in Canada, our Annual Report on Form 40-F, filed with the United States Securities and Exchange Commission, each in respect of the year ended December 31, 2024, and updated in our subsequent quarterly filings.
CONTROLS AND PROCEDURES
There have been no changes in our internal controls over financial reporting that occurred during the three months ended September 30, 2025, that have materially affected, or are reasonably likely to materially affect, our internal control over financial reporting.
| Magna International Inc. Third Quarter Report 2025 |
|
FORWARD-LOOKING STATEMENTS
Certain statements in this MD&A may constitute "forward-looking information" or "forward-looking statements" (collectively, "forward-looking statements"). Any such forward-looking statements are intended to provide information about management's current expectations and plans and may not be appropriate for other purposes. Forward-looking statements may include financial and other projections, as well as statements regarding our future plans, strategic objectives or economic performance, or the assumptions underlying any of the foregoing, and other statements that are not recitations of historical fact. We use words such as "may", "would", "could", "should", "will", "likely", "expect", "anticipate", "assume", "believe", "intend", "plan", "aim", "forecast", "outlook", "project", "potential", "estimate", "target" and similar expressions suggesting future outcomes or events to identify forward-looking statements.
Forward-looking statements are based on information currently available to us and are based on assumptions and analyses made by us in light of our experience and our perception of historical trends, current conditions and expected future developments, as well as other factors we believe are appropriate in the circumstances. While we believe we have a reasonable basis for making any such forward-looking statements, they are not a guarantee of future performance or outcomes. Whether actual results and developments conform to our expectations and predictions is subject to a number of risks, assumptions, and uncertainties, many of which are beyond our control, and the effects of which can be difficult to predict, including, without limitation:
|
Macroeconomic, Geopolitical and Other Risks
· unpredictable tariff and trade environment; · trade disputes and threats to free trade agreements; · consumer confidence levels; · increasing economic uncertainty; · interest rates and availability of consumer credit; · geopolitical risks;
Risks Related to the Automotive Industry
· program deferrals, cancellations and volume reductions; · economic cyclicality; · regional production volume declines; · deteriorating vehicle affordability; · uncertain pace of EV adoption, including North American electric vehicle program deferrals, cancellations and volume reductions; · intense competition;
Strategic Risks
· planning and forecasting challenges; · evolution of the vehicle; · evolving business risk profile; · technology and innovation; · investments in mobility and technology companies;
Customer-Related Risks
· customer concentration; · market shifts; · growth of EV-focused OEMs, particularly Chinese OEMs; · risks of conducting business with newer EV-focused OEMs; · dependence on outsourcing; · customer cooperation and consolidation; · consumer take rate shifts; · customer purchase orders; · potential OEM production-related disruptions;
Supply Chain Risks
· supply base; · supplier claims; · supply chain disruptions; · regional energy supply and pricing;
Manufacturing/Operational Risks
· product launch; · operational underperformance; · restructuring costs and impairment charges, including due to ‘reshoring’ of production to the U.S.; · skilled labour attraction/retention; · leadership expertise and succession; |
Pricing Risks
· quote/pricing assumptions; · customer pricing pressure/contractual arrangements; · commodity cost volatility; · scrap steel/aluminum price volatility;
Warranty/Recall Risks
· repair/replace costs; · warranty provisions; · product liability;
Climate Change Risks
· transition risks and physical risks; · strategic and other risks;
IT Security/Cybersecurity Risks
· IT/cybersecurity breach; · product cybersecurity;
Acquisition Risks
· inherent merger and acquisition risks; · acquisition integration and synergies;
Other Business Risks
· joint ventures; · intellectual property; · risks of doing business in foreign markets; · relative foreign exchange rates; · pension risks; · tax risks; · returns on capital investments; · financial flexibility; · credit ratings changes; · stock price fluctuation;
Legal, Regulatory and Other Risks
· legal and regulatory proceedings; · changes in laws; and · environmental compliance. |
|
|
Magna International Inc. Third Quarter Report 2025 |
In evaluating forward-looking statements, we caution readers not to place undue reliance on any forward-looking statement. Additionally, readers should specifically consider the various factors which could cause actual events or results to differ materially from those indicated by such forward-looking statements, including the risks, assumptions and uncertainties above which are:
| · | discussed under the "Industry Trends and Risks" heading of our Management's Discussion and Analysis; and |
| · | set out in our Annual Information Form filed with securities commissions in Canada, our annual report on Form 40-F filed with the United States Securities and Exchange Commission, and subsequent filings. |
Readers should also consider discussion of our risk mitigation activities with respect to certain risk factors, which can also be found in our Annual Information Form. Additional information about Magna, including our Annual Information Form, is available through the System for Electronic Data Analysis and Retrieval+ (SEDAR+) at www.sedarplus.ca, as well as on the United States Securities and Exchange Commission’s Electronic Data Gathering, Analysis and Retrieval System (EDGAR), which can be accessed at www.sec.gov.
| Magna International Inc. Third Quarter Report 2025 |
|
MAGNA INTERNATIONAL INC.
CONSOLIDATED STATEMENTS OF INCOME
[Unaudited]
[U.S. dollars in millions, except per share figures]
| Three months ended | Nine months ended | ||||||||||||||
| September 30, | September 30, | ||||||||||||||
| Note | 2025 | 2024 | 2025 | 2024 | |||||||||||
| Sales | 16 | $ | 10,462 | $ | 10,280 | $ | 31,162 | $ | 32,208 | ||||||
| Costs and expenses | |||||||||||||||
| Cost of goods sold | 8,973 | 8,828 | 26,927 | 27,964 | |||||||||||
| Selling, general and administrative | 531 | 487 | 1,635 | 1,526 | |||||||||||
| Depreciation | 389 | 384 | 1,146 | 1,134 | |||||||||||
| Amortization of acquired intangible assets | 27 | 28 | 82 | 84 | |||||||||||
| Interest expense, net | 65 | 54 | 167 | 159 | |||||||||||
| Equity income | (44 | ) | (13 | ) | (96 | ) | (56 | ) | |||||||
| Other expense (income), net | 2 | 48 | (188 | ) | 107 | 236 | |||||||||
| Income from operations before income taxes | 473 | 700 | 1,194 | 1,161 | |||||||||||
| Income taxes | 11 | 140 | 192 | 314 | 299 | ||||||||||
| Net income | 333 | 508 | 880 | 862 | |||||||||||
| Income attributable to non-controlling interests | (28 | ) | (24 | ) | (50 | ) | (56 | ) | |||||||
| Net income attributable to Magna International Inc. | $ | 305 | $ | 484 | $ | 830 | $ | 806 | |||||||
| Earnings per Common Share: | 3 | ||||||||||||||
| Basic | $ | 1.08 | $ | 1.68 | $ | 2.94 | $ | 2.81 | |||||||
| Diluted | $ | 1.08 | $ | 1.68 | $ | 2.94 | $ | 2.81 | |||||||
| Cash dividends paid per Common Share | $ | 0.485 | $ | 0.475 | $ | 1.455 | $ | 1.425 | |||||||
| Weighted average number of Common Shares outstanding during the period [in millions]: | 3 | ||||||||||||||
| Basic | 281.8 | 287.3 | 281.9 | 287.2 | |||||||||||
| Diluted | 281.8 | 287.3 | 281.9 | 287.2 | |||||||||||
See accompanying notes
|
|
Magna International Inc. Third Quarter Report 2025 |
MAGNA INTERNATIONAL INC.
CONSOLIDATED STATEMENTS OF COMPREHENSIVE INCOME
[Unaudited]
[U.S. dollars in millions]
| Three months ended | Nine months ended | ||||||||||||||
| September 30, | September 30, | ||||||||||||||
| Note | 2025 | 2024 | 2025 | 2024 | |||||||||||
| Net income | $ | 333 | $ | 508 | $ | 880 | $ | 862 | |||||||
| Other comprehensive income (loss), net of tax: | 13 | ||||||||||||||
| Net unrealized (loss) gain on translation of net investment in foreign operations | (41 | ) | 296 | 527 | (12 | ) | |||||||||
| Net unrealized gain (loss) on cash flow hedges | 15 | 3 | 162 | (16 | ) | ||||||||||
| Reclassification of net (gain) loss on cash flow hedges to net income | (6 | ) | 4 | 17 | (42 | ) | |||||||||
| Reclassification of net loss on pensions to net income | 1 | 1 | 3 | 2 | |||||||||||
| Other comprehensive (loss) income | (31 | ) | 304 | 709 | (68 | ) | |||||||||
| Comprehensive income | 302 | 812 | 1,589 | 794 | |||||||||||
| Comprehensive income attributable to non-controlling interests | (29 | ) | (37 | ) | (57 | ) | (56 | ) | |||||||
| Comprehensive income attributable to Magna International Inc. | $ | 273 | $ | 775 | $ | 1,532 | $ | 738 | |||||||
See accompanying notes
| Magna International Inc. Third Quarter Report 2025 |
|
MAGNA INTERNATIONAL INC.
CONSOLIDATED BALANCE SHEETS
[Unaudited]
[U.S. dollars in millions]
| As at | As at | ||||||||
| September 30, | December 31, | ||||||||
| Note | 2025 | 2024 | |||||||
| ASSETS | |||||||||
| Current assets | |||||||||
| Cash and cash equivalents | 4 | $ | 1,327 | $ | 1,247 | ||||
| Accounts receivable | 8,406 | 7,376 | |||||||
| Inventories | 6 | 4,233 | 4,151 | ||||||
| Prepaid expenses and other | 316 | 344 | |||||||
| 14,282 | 13,118 | ||||||||
| Investments | 7 | 1,098 | 1,045 | ||||||
| Fixed assets, net | 9,707 | 9,584 | |||||||
| Operating lease right-of-use assets | 2,024 | 1,941 | |||||||
| Intangible assets, net | 707 | 738 | |||||||
| Goodwill | 2,875 | 2,674 | |||||||
| Deferred tax assets | 920 | 819 | |||||||
| Other assets | 8 | 1,294 | 1,120 | ||||||
| $ | 32,907 | $ | 31,039 | ||||||
| LIABILITIES AND SHAREHOLDERS' EQUITY | |||||||||
| Current liabilities | |||||||||
| Short-term borrowings | 10 | $ | 433 | $ | 271 | ||||
| Accounts payable | 7,261 | 7,194 | |||||||
| Other accrued liabilities | 9 | 2,906 | 2,572 | ||||||
| Accrued salaries and wages | 994 | 867 | |||||||
| Income taxes payable | 109 | 192 | |||||||
| Long-term debt due within one year | 33 | 708 | |||||||
| Current portion of operating lease liabilities | 323 | 293 | |||||||
| 12,059 | 12,097 | ||||||||
| Long-term debt | 10 | 4,967 | 4,134 | ||||||
| Operating lease liabilities | 1,722 | 1,662 | |||||||
| Long-term employee benefit liabilities | 573 | 533 | |||||||
| Other long-term liabilities | 2 | 298 | 396 | ||||||
| Deferred tax liabilities | 353 | 277 | |||||||
| 19,972 | 19,099 | ||||||||
| Shareholders' equity | |||||||||
| Capital stock | |||||||||
| Common Shares | |||||||||
| [issued: 281,814,257; December 31, 2024 – 282,875,928] | 12 | 3,363 | 3,359 | ||||||
| Contributed surplus | 141 | 149 | |||||||
| Retained earnings | 9,975 | 9,598 | |||||||
| Accumulated other comprehensive loss | 13 | (880 | ) | (1,584 | ) | ||||
| 12,599 | 11,522 | ||||||||
| Non-controlling interests | 5 | 336 | 418 | ||||||
| 12,935 | 11,940 | ||||||||
| $ | 32,907 | $ | 31,039 | ||||||
See accompanying notes
|
|
Magna International Inc. Third Quarter Report 2025 |
MAGNA INTERNATIONAL INC.
CONSOLIDATED STATEMENTS OF CASH FLOWS
[Unaudited]
[U.S. dollars in millions]
| Three months ended | Nine months ended | ||||||||||||||
| September 30, | September 30, | ||||||||||||||
| Note | 2025 | 2024 | 2025 | 2024 | |||||||||||
| Cash provided from (used for): | |||||||||||||||
| OPERATING ACTIVITIES | |||||||||||||||
| Net income | $ | 333 | $ | 508 | $ | 880 | $ | 862 | |||||||
| Items not involving current cash flows | 4 | 454 | 277 | 1,216 | 1,195 | ||||||||||
| 787 | 785 | 2,096 | 2,057 | ||||||||||||
| Changes in operating assets and liabilities | 4 | 125 | (58 | ) | (480 | ) | (333 | ) | |||||||
| Cash provided from operating activities | 912 | 727 | 1,616 | 1,724 | |||||||||||
| INVESTMENT ACTIVITIES | |||||||||||||||
| Fixed asset additions | (267 | ) | (476 | ) | (781 | ) | (1,469 | ) | |||||||
| Acquisitions | 5 | (1 | ) | — | (1 | ) | (86 | ) | |||||||
| Increase in investments, other assets and intangible assets | (100 | ) | (115 | ) | (342 | ) | (410 | ) | |||||||
| Increase in public and private equity investments | (2 | ) | (1 | ) | (6 | ) | (22 | ) | |||||||
| Proceeds from dispositions | 27 | 38 | 67 | 182 | |||||||||||
| Net cash inflow from disposal of facilities | — | 78 | — | 82 | |||||||||||
| Cash used for investing activities | (343 | ) | (476 | ) | (1,063 | ) | (1,723 | ) | |||||||
| FINANCING ACTIVITIES | |||||||||||||||
| Issues of debt | 1 | 9 | 1,047 | 767 | |||||||||||
| Increase (decrease) in short-term borrowings | 88 | (36 | ) | 119 | 324 | ||||||||||
| Repayments of debt | (672 | ) | (20 | ) | (1,086 | ) | (797 | ) | |||||||
| Issue of Common Shares on exercise of stock options | — | — | — | 30 | |||||||||||
| Tax withholdings on vesting of equity awards | — | — | (4 | ) | (5 | ) | |||||||||
| Repurchase of Common Shares | 12 | — | — | (51 | ) | (5 | ) | ||||||||
| Acquisition of non-controlling interest | 5 | (40 | ) | — | (40 | ) | — | ||||||||
| Dividends paid to non-controlling interests | (15 | ) | (10 | ) | (40 | ) | (36 | ) | |||||||
| Dividends | (136 | ) | (138 | ) | (409 | ) | (406 | ) | |||||||
| Cash used for financing activities | (774 | ) | (195 | ) | (464 | ) | (128 | ) | |||||||
| Effect of exchange rate changes on cash and cash equivalents | (4 | ) | 6 | (9 | ) | (10 | ) | ||||||||
| Net (decrease) increase in cash, cash equivalents during the period | (209 | ) | 62 | 80 | (137 | ) | |||||||||
| Cash and cash equivalents, beginning of period | 1,536 | 999 | 1,247 | 1,198 | |||||||||||
| Cash and cash equivalents, end of period | 4 | $ | 1,327 | $ | 1,061 | $ | 1,327 | $ | 1,061 | ||||||
See accompanying notes
| Magna International Inc. Third Quarter Report 2025 |
|
MAGNA INTERNATIONAL INC.
CONSOLIDATED STATEMENTS OF CHANGES IN EQUITY
[Unaudited]
[U.S. dollars in millions]
| Nine months ended September 30, 2025 | |||||||||||||||||||||||
| Common Shares | Contributed | Retained | Non-controlling | Total | |||||||||||||||||||
| Note | Number | Stated Value | Surplus | Earnings | AOCL[i] | Interest | Equity | ||||||||||||||||
| [in millions] | |||||||||||||||||||||||
| Balance, December 31, 2024 | 282.9 | $ | 3,359 | $ | 149 | $ | 9,598 | $ | (1,584 | ) | $ | 418 | $ | 11,940 | |||||||||
| Net income | 830 | 50 | 880 | ||||||||||||||||||||
| Other comprehensive income | 702 | 7 | 709 | ||||||||||||||||||||
| Release of stock and stock units | 0.2 | 18 | (18 | ) | — | ||||||||||||||||||
| Tax withholdings on vesting of equity rewards | (0.1 | ) | (1 | ) | (3 | ) | (4 | ) | |||||||||||||||
| Repurchase and cancellation under normal course issuer bid | 12 | (1.3 | ) | (16 | ) | (38 | ) | 2 | (52 | ) | |||||||||||||
| Stock-based compensation expense | 45 | 45 | |||||||||||||||||||||
| Acquisition of non-controlling interest | (35 | ) | (99 | ) | (134 | ) | |||||||||||||||||
| Dividends paid to non-controlling interests | (40 | ) | (40 | ) | |||||||||||||||||||
| Dividends paid | 0.1 | 3 | (412 | ) | (409 | ) | |||||||||||||||||
| Balance, September 30, 2025 | 281.8 | $ | 3,363 | $ | 141 | $ | 9,975 | $ | (880 | ) | $ | 336 | $ | 12,935 | |||||||||
| Three months ended September 30, 2025 | |||||||||||||||||||||||
| Common Shares | Contributed | Retained | Non-controlling | Total | |||||||||||||||||||
| Note | Number | Stated Value | Surplus | Earnings | AOCL[i] | Interest | Equity | ||||||||||||||||
| [in millions] | |||||||||||||||||||||||
| Balance, June 30, 2025 | 281.7 | $ | 3,363 | $ | 161 | $ | 9,806 | $ | (848 | ) | $ | 421 | $ | 12,903 | |||||||||
| Net income | 305 | 28 | 333 | ||||||||||||||||||||
| Other comprehensive (loss) income | (32 | ) | 1 | (31 | ) | ||||||||||||||||||
| Stock-based compensation expense | 15 | 15 | |||||||||||||||||||||
| Acquisition of non-controlling interest | (35 | ) | (99 | ) | (134 | ) | |||||||||||||||||
| Dividends paid to non-controlling interests | (15 | ) | (15 | ) | |||||||||||||||||||
| Dividends paid | 0.1 | (136 | ) | (136 | ) | ||||||||||||||||||
| Balance, September 30, 2025 | 281.8 | $ | 3,363 | $ | 141 | $ | 9,975 | $ | (880 | ) | $ | 336 | $ | 12,935 | |||||||||
[i] AOCL is Accumulated Other Comprehensive Loss.
See accompanying notes
|
|
Magna International Inc. Third Quarter Report 2025 |
MAGNA INTERNATIONAL INC.
CONSOLIDATED STATEMENTS OF CHANGES IN EQUITY
[Unaudited]
[U.S. dollars in millions]
| Nine months ended September 30, 2024 | |||||||||||||||||||||||
| Common Shares | Contributed | Retained | Non-controlling | Total | |||||||||||||||||||
| Note | Number | Stated Value | Surplus | Earnings | AOCL[i] | Interest | Equity | ||||||||||||||||
| [in millions] | |||||||||||||||||||||||
| Balance, December 31, 2023 | 286.6 | $ | 3,354 | $ | 125 | $ | 9,303 | $ | (898 | ) | $ | 393 | $ | 12,277 | |||||||||
| Net income | 806 | 56 | 862 | ||||||||||||||||||||
| Other comprehensive loss | (68 | ) | (68 | ) | |||||||||||||||||||
| Shares issued on exercise of stock options | 0.7 | 36 | (6 | ) | 30 | ||||||||||||||||||
| Release of stock and stock units | 0.2 | 12 | (12 | ) | — | ||||||||||||||||||
| Tax withholdings on vesting of equity rewards | (0.2 | ) | (1 | ) | (4 | ) | (5 | ) | |||||||||||||||
| Repurchase and cancellation under normal course issuer bid | (0.1 | ) | (1 | ) | (4 | ) | (5 | ) | |||||||||||||||
| Stock-based compensation expense | 38 | 38 | |||||||||||||||||||||
| Dividends paid to non-controlling interests | (36 | ) | (36 | ) | |||||||||||||||||||
| Dividends paid | 0.1 | 4 | (410 | ) | (406 | ) | |||||||||||||||||
| Balance, September 30, 2024 | 287.3 | $ | 3,404 | $ | 145 | $ | 9,691 | $ | (966 | ) | $ | 413 | $ | 12,687 | |||||||||
| Three months ended September 30, 2024 | |||||||||||||||||||||||
| Common Shares | Contributed | Retained | Non-controlling | Total | |||||||||||||||||||
| Note | Number | Stated Value | Surplus | Earnings | AOCL[i] | Interest | Equity | ||||||||||||||||
| [in millions] | |||||||||||||||||||||||
| Balance, June 30, 2024 | 287.3 | $ | 3,404 | $ | 132 | $ | 9,345 | $ | (1,257 | ) | $ | 386 | $ | 12,010 | |||||||||
| Net income | 484 | 24 | 508 | ||||||||||||||||||||
| Other comprehensive income | 291 | 13 | 304 | ||||||||||||||||||||
| Stock-based compensation expense | 13 | 13 | |||||||||||||||||||||
| Dividends paid to non-controlling interests | (10 | ) | (10 | ) | |||||||||||||||||||
| Dividends paid | (138 | ) | (138 | ) | |||||||||||||||||||
| Balance, September 30, 2024 | 287.3 | $ | 3,404 | $ | 145 | $ | 9,691 | $ | (966 | ) | $ | 413 | $ | 12,687 | |||||||||
[i] AOCL is Accumulated Other Comprehensive Loss.
See accompanying notes
| Magna International Inc. Third Quarter Report 2025 |
|
MAGNA INTERNATIONAL INC.
NOTES TO INTERIM CONSOLIDATED FINANCIAL STATEMENTS
[Unaudited]
[All amounts in U.S. dollars and all tabular amounts in millions unless otherwise noted]
1. SIGNIFICANT ACCOUNTING POLICIES
[a] Basis of Presentation
The unaudited interim consolidated financial statements of Magna International Inc. and its subsidiaries [collectively "Magna" or the "Company"] have been prepared in U.S. dollars in accordance with accounting principles generally accepted in the United States of America ["GAAP"]. The unaudited interim consolidated financial statements do not conform in all respects to the requirements of GAAP for annual financial statements. Accordingly, these unaudited interim consolidated financial statements should be read in conjunction with the December 31, 2024 audited consolidated financial statements and notes thereto included in the Company's 2024 Annual Report.
The unaudited interim consolidated financial statements reflect all adjustments, which consist only of normal and recurring adjustments, necessary to present fairly the financial position as at September 30, 2025 and the results of operations, changes in equity, and cash flows for the three and nine-month periods ended September 30, 2025 and 2024.
[b] Use of Estimates
The preparation of the unaudited interim consolidated financial statements in conformity with GAAP requires management to make estimates and assumptions that affect the amounts reported and disclosed in the interim consolidated financial statements and accompanying notes. Due to the inherent uncertainty involved in making estimates, actual results could ultimately differ from those estimates.
The Company continues to closely monitor the two reporting units within its Body Exteriors & Structures and Power & Vision segments identified as having a heightened risk of impairment as at December 31, 2024 and March 31, 2025. As at September 30, 2025, no new indicators of impairment were identified.
|
|
Magna International Inc. Third Quarter Report 2025 |
MAGNA INTERNATIONAL INC.
NOTES TO INTERIM CONSOLIDATED FINANCIAL STATEMENTS
[Unaudited]
[All amounts in U.S. dollars and all tabular amounts in millions unless otherwise noted]
2. OTHER EXPENSE (INCOME), NET
| Three months ended | Nine months ended | |||||||||||||||||
| September 30, | September 30, | |||||||||||||||||
| 2025 | 2024 | 2025 | 2024 | |||||||||||||||
| Restructuring activities | [a] | $ | 46 | $ | — | $ | 103 | $ | 93 | |||||||||
| Investments | [b] | 2 | 1 | 4 | 6 | |||||||||||||
| Impacts related to Fisker Inc. [“Fisker”] | [c] | — | (189 | ) | — | 146 | ||||||||||||
| Gain on business combination | [d] | — | — | — | (9 | ) | ||||||||||||
| $ | 48 | $ | (188 | ) | $ | 107 | $ | 236 | ||||||||||
[a] Restructuring activities
| Three months ended | Nine months ended | |||||||||||||||
| September 30, | September 30, | |||||||||||||||
| 2025 | 2024 | 2025 | 2024 | |||||||||||||
| Power & Vision [i] | $ | 34 | $ | — | $ | 58 | $ | 55 | ||||||||
| Complete Vehicles[ii] | 12 | — | 45 | 26 | ||||||||||||
| Body Exteriors & Structures | — | — | — | 12 | ||||||||||||
| Other expense, net | 46 | — | 103 | 93 | ||||||||||||
| Tax effect | — | — | (4 | ) | (16 | ) | ||||||||||
| Net loss attributable to Magna | $ | 46 | $ | — | $ | 99 | $ | 77 | ||||||||
[i] During the third quarter of 2025, the Company recorded $24 million [$24 million after tax] of charges related to significant rightsizing activities and plant consolidations at facilities primarily in Europe, as well as $10 million [$10 million after tax] of equity losses related to the Company’s share of restructuring activities at an equity method investee.
[ii] During the third quarter of 2025, the Company recorded $12 million [$12 million after tax] of charges related to rightsizing activities at two facilities in Europe.
[b] Investments
| Three months ended | Nine months ended | |||||||||||||||
| September 30, | September 30, | |||||||||||||||
| 2025 | 2024 | 2025 | 2024 | |||||||||||||
| Non-cash impairment charge [iii] | $ | 2 | $ | — | $ | 2 | $ | — | ||||||||
| Loss (gain) on sales of public equity investments | 1 | — | (3 | ) | — | |||||||||||
| Net revaluation (gain) loss on public and private equity investments | (1 | ) | 8 | (3 | ) | 12 | ||||||||||
| Revaluation (gain) loss on public company warrants | — | (7 | ) | 8 | (6 | ) | ||||||||||
| Other expense, net | 2 | 1 | 4 | 6 | ||||||||||||
| Tax effect | — | 2 | 1 | — | ||||||||||||
| Net loss attributable to Magna | $ | 2 | $ | 3 | $ | 5 | $ | 6 | ||||||||
[iii] The $2 million [$1 million after tax] non-cash impairment charge relates to the impairment of a private equity investment.
| Magna International Inc. Third Quarter Report 2025 |
|
MAGNA INTERNATIONAL INC.
NOTES TO INTERIM CONSOLIDATED FINANCIAL STATEMENTS
[Unaudited]
[All amounts in U.S. dollars and all tabular amounts in millions unless otherwise noted]
2. OTHER EXPENSE (INCOME), NET (CONTINUED)
[c] Impacts related to Fisker
During 2024, Fisker filed for Chapter 11 bankruptcy protection in the United States and for similar protection in Austria. As a result, the Company recorded impairment charges on its Fisker related net assets, including its Fisker warrants, which were received in connection with the agreements with Fisker for platform sharing, engineering and manufacturing of the Fisker Ocean SUV. The Company also recorded additional restructuring charges during 2024 related to its Fisker related assembly operations. In the course of such bankruptcy proceedings, the Company terminated its manufacturing agreement for the Fisker Ocean SUV and recognized the remaining $196 million of deferred revenue into income.
| Three months ended
September 30, |
Nine months ended
September 30, |
|||||||||||||||
| 2025 | 2024 | 2025 | 2024 | |||||||||||||
| Recognition of deferred revenue | $ | — | $ | (196 | ) | $ | — | $ | (196 | ) | ||||||
| Impairment of Fisker related net assets | — | 7 | — | 287 | ||||||||||||
| Impairment of Fisker warrants | — | — | — | 33 | ||||||||||||
| Additional restructuring related to Complete Vehicles | — | — | — | 22 | ||||||||||||
| Other (income) expense, net | — | (189 | ) | — | 146 | |||||||||||
| Tax effect | — | 49 | — | (24 | ) | |||||||||||
| Net (gain) loss attributable to Magna | $ | — | $ | (140 | ) | $ | — | $ | 122 | |||||||
[d] Gain on business combination
During the second quarter of 2024, the Company acquired a business in the Body Exteriors & Structures segment for $5 million, resulting in a bargain purchase gain of $9 million [$9 million after tax].
3. EARNINGS PER SHARE
| Three months ended September 30, |
Nine months ended September 30, |
|||||||||||||||
| 2025 | 2024 | 2025 | 2024 | |||||||||||||
| Basic earnings per Common Share: | ||||||||||||||||
| Net income attributable to Magna International Inc. | $ | 305 | $ | 484 | $ | 830 | $ | 806 | ||||||||
| Weighted average number of Common Shares outstanding | 281.8 | 287.3 | 281.9 | 287.2 | ||||||||||||
| Basic earnings per Common Share | $ | 1.08 | $ | 1.68 | $ | 2.94 | $ | 2.81 | ||||||||
| Diluted earnings per Common Share [a]: | ||||||||||||||||
| Net income attributable to Magna International Inc. | $ | 305 | $ | 484 | $ | 830 | $ | 806 | ||||||||
| Weighted average number of Common Shares outstanding | 281.8 | 287.3 | 281.9 | 287.2 | ||||||||||||
| Diluted earnings per Common Share | $ | 1.08 | $ | 1.68 | $ | 2.94 | $ | 2.81 | ||||||||
| [a] | For the three and nine months ended September 30, 2025, diluted earnings per Common Share excluded 4.8 million [2024 – 6.1 million] and 5.4 million [2024 – 5.0 million] Common Shares, respectively, issuable under the Company's Incentive Stock Option Plan because these options were not "in-the-money". The dilutive effect of participating securities using the two-class method was excluded from the calculation of earnings per share because the effect would be immaterial. |
|
|
Magna International Inc. Third Quarter Report 2025 |
MAGNA INTERNATIONAL INC.
NOTES TO INTERIM CONSOLIDATED FINANCIAL STATEMENTS
[Unaudited]
[All amounts in U.S. dollars and all tabular amounts in millions unless otherwise noted]
4. DETAILS OF CASH FLOWS
| [a] | Cash, and cash equivalents: |
| September 30, | December 31, | |||||||
| 2025 | 2024 | |||||||
| Cash | $ | 753 | $ | 750 | ||||
| Bank term deposits and bankers' acceptances | 574 | 497 | ||||||
| $ | 1,327 | $ | 1,247 | |||||
| [b] | Items not involving current cash flows: |
| Three months ended |
Nine months ended |
|||||||||||||||
| September 30, | September 30, | |||||||||||||||
| 2025 | 2024 | 2025 | 2024 | |||||||||||||
| Depreciation | $ | 389 | $ | 384 | $ | 1,146 | $ | 1,134 | ||||||||
| Amortization of acquired intangible assets | 27 | 28 | 82 | 84 | ||||||||||||
| Other asset amortization | 58 | 68 | 164 | 160 | ||||||||||||
| Deferred revenue amortization | (54 | ) | (35 | ) | (188 | ) | (191 | ) | ||||||||
| Dividends received (less than) in excess of equity income | (3 | ) | 29 | 10 | 51 | |||||||||||
| Deferred tax recovery | (2 | ) | (13 | ) | (44 | ) | (165 | ) | ||||||||
| Other non-cash charges | 26 | 4 | 31 | 1 | ||||||||||||
| Non-cash portion of other expense (income), net [note 2] | 13 | (188 | ) | 15 | 121 | |||||||||||
| $ | 454 | $ | 277 | $ | 1,216 | $ | 1,195 | |||||||||
| [c] | Changes in operating assets and liabilities: |
| Three months ended | Nine months ended | |||||||||||||||
| September 30, | September 30, | |||||||||||||||
| 2025 | 2024 | 2025 | 2024 | |||||||||||||
| Accounts receivable | $ | (168 | ) | $ | (11 | ) | $ | (662 | ) | $ | (463 | ) | ||||
| Inventories | (34 | ) | (68 | ) | 136 | (116 | ) | |||||||||
| Prepaid expenses and other | 40 | 11 | 79 | (16 | ) | |||||||||||
| Accounts payable | 143 | (181 | ) | (255 | ) | (209 | ) | |||||||||
| Accrued salaries and wages | 81 | 81 | 71 | 55 | ||||||||||||
| Other accrued liabilities | 47 | (12 | ) | 310 | 317 | |||||||||||
| Income taxes payable | 16 | 122 | (159 | ) | 99 | |||||||||||
| $ | 125 | $ | (58 | ) | $ | (480 | ) | $ | (333 | ) | ||||||
| Magna International Inc. Third Quarter Report 2025 |
|
MAGNA INTERNATIONAL INC.
NOTES TO INTERIM CONSOLIDATED FINANCIAL STATEMENTS
[Unaudited]
[All amounts in U.S. dollars and all tabular amounts in millions unless otherwise noted]
5. ACQUISITION OF NON-CONTROLLING INTEREST
On August 29, 2025, the Company acquired the non-controlling 35% interest in a consolidated subsidiary, increasing the Company’s interest to 100%. The total purchase price was $134 million, of which $40 million was paid through a dividend distribution during the third quarter of 2025. The remaining $94 million is expected to be paid during the fourth quarter of 2025. The acquisition was accounted for as an equity transaction, and resulted in a reduction to the Company’s non-controlling interest of $99 million and contributed surplus of $35 million.
6. INVENTORIES
Inventories consist of:
| September 30, | December 31, | |||||||
| 2025 | 2024 | |||||||
| Raw materials and supplies | $ | 1,733 | $ | 1,672 | ||||
| Work-in-process | 486 | 446 | ||||||
| Finished goods | 655 | 664 | ||||||
| Tooling and engineering | 1,359 | 1,369 | ||||||
| $ | 4,233 | $ | 4,151 | |||||
Tooling and engineering inventory represents costs incurred on tooling and engineering services contracts in excess of billed and unbilled amounts included in accounts receivable.
7. INVESTMENTS
| September 30, | December 31, | |||||||
| 2025 | 2024 | |||||||
| Equity method investments | $ | 850 | $ | 794 | ||||
| Public and private equity investments | 219 | 206 | ||||||
| Debt investments | 29 | 31 | ||||||
| Warrants | — | 14 | ||||||
| $ | 1,098 | $ | 1,045 | |||||
Cumulative unrealized gains and losses on equity securities held as at September 30, 2025 were both $19 million [$29 million and $18 million as at December 31, 2024, respectively].
8. OTHER ASSETS
Other assets consist of:
| September 30, | December 31, | |||||||
| 2025 | 2024 | |||||||
| Preproduction costs related to long-term supply agreements | $ | 769 | $ | 697 | ||||
| Long-term receivables [i] | 307 | 310 | ||||||
| Unrealized gain on cash flow hedges | 81 | 11 | ||||||
| Pension overfunded status | 58 | 57 | ||||||
| Other, net [i] | 79 | 45 | ||||||
| $ | 1,294 | $ | 1,120 | |||||
[i] Certain amounts in the prior period have been reclassified to conform with current period presentation.
|
|
Magna International Inc. Third Quarter Report 2025 |
MAGNA INTERNATIONAL INC.
NOTES TO INTERIM CONSOLIDATED FINANCIAL STATEMENTS
[Unaudited]
[All amounts in U.S. dollars and all tabular amounts in millions unless otherwise noted]
9. WARRANTY
The following is a continuity of the Company's warranty accruals, included in Other accrued liabilities:
| 2025 | 2024 | |||||||
| Balance, beginning of year | $ | 309 | $ | 270 | ||||
| Expense, net | 55 | 33 | ||||||
| Settlements | (51 | ) | (18 | ) | ||||
| Foreign exchange and other | 5 | (1 | ) | |||||
| Balance, March 31 | 318 | 284 | ||||||
| Expense, net | 31 | 39 | ||||||
| Settlements | (28 | ) | (21 | ) | ||||
| Foreign exchange and other | 10 | (4 | ) | |||||
| Balance, June 30 | 331 | 298 | ||||||
| Expense, net | 23 | 28 | ||||||
| Settlements | (40 | ) | (26 | ) | ||||
| Foreign exchange and other | (1 | ) | 5 | |||||
| Balance, September 30 | $ | 313 | $ | 305 | ||||
10. DEBT
Short-term borrowings
[a] Commercial Paper Program
As at September 30, 2025, $210 million [$271 million as at December 31, 2024] of notes were outstanding under the U.S. commercial paper program, with a weighted average interest rate of 4.46% [4.74% as at December 31, 2024] and $222 million [no amounts outstanding as at December 31, 2024] of notes were outstanding under the euro-commercial paper program, with a weighted average interest rate of 2.09%. The U.S. and euro notes are backstopped by the Company's global credit facility.
[b] Credit Facilities
On March 21, 2025, the Company extended the maturity date of its $800 million 364-day syndicated revolving credit facility from June 24, 2025, to June 24, 2026. The facility can be drawn in U.S. dollars or Canadian dollars. As of September 30, 2025, no amounts are outstanding under this credit facility.
Long-term borrowings
[a] Senior Notes
The Company issued the following Senior Notes during 2025:
| Settlement Date | Net Cash Proceeds [i] |
Maturity Date | ||||
| €575 million Senior Notes at 3.625% | May 21, 2025 | €569 million | May 21, 2031 | |||
| $400 million Senior Notes at 5.875% | May 22, 2025 | $397 million | June 1, 2035 |
[i] Net cash proceeds represent the public offering price less the underwriting discount, before expenses.
The Senior Notes were issued for general corporate purposes, including the repayment on May 23, 2025 of the $300 million Senior Notes, which were due March 2026, and the repayment on September 24, 2025 of the $650 million Senior Notes, which were due October 2025.
The Senior Notes are unsecured obligations and do not include any financial covenants. The Company may redeem the notes in whole or in part at any time, and from time to time, at specified redemption prices determined in accordance with the terms of the indenture governing the Senior Notes.
| Magna International Inc. Third Quarter Report 2025 |
|
MAGNA INTERNATIONAL INC.
NOTES TO INTERIM CONSOLIDATED FINANCIAL STATEMENTS
[Unaudited]
[All amounts in U.S. dollars and all tabular amounts in millions unless otherwise noted]
10. DEBT (CONTINUED)
| [b] | Global Credit Facility |
On March 21, 2025, the Company extended the maturity date of its $2.7 billion syndicated revolving credit facility from June 25, 2029 to June 25, 2030. As at September 30, 2025, no amounts are outstanding under this credit facility.
| [c] | Term Loan Facilities |
On May 30, 2025, the Company repaid $100 million of the 3-year tranche Term Loan.
As at September 30, 2025, the Company had $300 million outstanding under the 5-year tranche of the Term Loan. The Term Loan is for general corporate purposes.
On March 21, 2025, the Company amended its syndicated, unsecured, delayed draw term loan facility with an additional 3-year tranche of $650 million. On July 8, 2025, the Company reduced the tranche amount from $650 million to $350 million and extended the draw expiration date from July 12, 2025, to January 12, 2026. As at September 30, 2025, no amounts had been drawn under this 3-year tranche.
11. INCOME TAX
For the three months ended September 30, 2025, the Company’s effective income tax rate is higher than the customary rate due to an unfavourable change in the mix of earnings and an increase in reserves for uncertain tax positions.
For the nine months ended September 30, 2025, the Company’s effective income tax rate is higher than the customary rate due to an unfavourable change in the mix of earnings and higher losses not benefited in Europe, partially offset by a decrease in reserves for uncertain tax positions.
For the three and nine months ended September 30, 2024, the Company’s effective income tax rate is higher than the customary rate due to unfavourable foreign exchange adjustments recognized for U.S. GAAP purposes. The three-month rate is also adversely affected by an increase in reserves for uncertain tax positions.
12. CAPITAL STOCK
| [a] | During the nine-month period ended September 30, 2025, the Company repurchased 1.3 million shares under a normal course issuer bid for cash consideration of $51 million. |
| [b] | The following table presents the maximum number of shares that would be outstanding if all the dilutive instruments outstanding at October 30, 2025 were exercised or converted: |
| Common Shares | 281,814,257 | |||
| Stock options [i] | 6,012,349 | |||
| 287,826,606 |
| [i] | Options to purchase Common Shares are exercisable by the holder in accordance with the vesting provisions and upon payment of the exercise price as may be determined from time to time pursuant to the Company's stock option plans. |
|
|
Magna International Inc. Third Quarter Report 2025 |
MAGNA INTERNATIONAL INC.
NOTES TO INTERIM CONSOLIDATED FINANCIAL STATEMENTS
[Unaudited]
[All amounts in U.S. dollars and all tabular amounts in millions unless otherwise noted]
13. ACCUMULATED OTHER COMPREHENSIVE LOSS
The following is a continuity schedule of accumulated other comprehensive loss:
| 2025 | 2024 | |||||||
| Accumulated net unrealized loss on translation of net investment in foreign operations | ||||||||
| Balance, beginning of year | $ | (1,368 | ) | $ | (836 | ) | ||
| Net unrealized gain (loss) | 186 | (235 | ) | |||||
| Repurchase of shares under normal course issuer bid | 2 | — | ||||||
| Balance, March 31 | (1,180 | ) | (1,071 | ) | ||||
| Net unrealized gain (loss) | 376 | (60 | ) | |||||
| Balance, June 30 | (804 | ) | (1,131 | ) | ||||
| Net unrealized (loss) gain | (42 | ) | 283 | |||||
| Balance, September 30 | (846 | ) | (848 | ) | ||||
| Accumulated net unrealized (loss) gain on cash flow hedges [i] | ||||||||
| Balance, beginning of year | (113 | ) | 43 | |||||
| Net unrealized gain (loss) | 49 | (13 | ) | |||||
| Reclassifications to net income | 16 | (29 | ) | |||||
| Balance, March 31 | (48 | ) | 1 | |||||
| Net unrealized gain (loss) | 98 | (6 | ) | |||||
| Reclassifications to net income | 7 | (17 | ) | |||||
| Balance, June 30 | 57 | (22 | ) | |||||
| Net unrealized gain | 15 | 3 | ||||||
| Reclassifications to net income | (6 | ) | 4 | |||||
| Balance, September 30 | 66 | (15 | ) | |||||
| Accumulated net unrealized loss on other long-term liabilities | ||||||||
| Balance, beginning of year | (103 | ) | (105 | ) | ||||
| Reclassifications to net income | 1 | 1 | ||||||
| Balance, March 31 | (102 | ) | (104 | ) | ||||
| Reclassifications to net income | 1 | — | ||||||
| Balance, June 30 | (101 | ) | (104 | ) | ||||
| Reclassifications to net income | 1 | 1 | ||||||
| Balance, September 30 | (100 | ) | (103 | ) | ||||
| Total accumulated other comprehensive loss | $ | (880 | ) | $ | (966 | ) | ||
| [i] | The amount of income tax recovery (expense) that has been netted in the accumulated net unrealized loss (gain) on cash flow hedges is as follows: |
| 2025 | 2024 | |||||||
| Balance, beginning of year | $ | 44 | $ | (16 | ) | |||
| Net unrealized (loss) gain | (17 | ) | 4 | |||||
| Reclassifications to net income | (7 | ) | 10 | |||||
| Balance, March 31 | 20 | (2 | ) | |||||
| Net unrealized (loss) gain | (39 | ) | 2 | |||||
| Reclassifications to net income | (3 | ) | 7 | |||||
| Balance, June 30 | (22 | ) | 7 | |||||
| Net unrealized loss | (8 | ) | (1 | ) | ||||
| Reclassifications to net income | 3 | (1 | ) | |||||
| Balance, September 30 | $ | (27 | ) | $ | 5 | |||
The amount of other comprehensive gain that is expected to be reclassified to net income over the next 12 months is $42 million.
| Magna International Inc. Third Quarter Report 2025 |
|
MAGNA INTERNATIONAL INC.
NOTES TO INTERIM CONSOLIDATED FINANCIAL STATEMENTS
[Unaudited]
[All amounts in U.S. dollars and all tabular amounts in millions unless otherwise noted]
14. FINANCIAL INSTRUMENTS
| [a] | Financial assets and liabilities |
The Company's financial assets and financial liabilities consist of the following:
| September 30, | December 31, | |||||||
| 2025 | 2024 | |||||||
| Financial assets | ||||||||
| Cash and cash equivalents | $ | 1,327 | $ | 1,247 | ||||
| Accounts receivable | 8,406 | 7,376 | ||||||
| Public and private equity investments | 219 | 206 | ||||||
| Debt investments | 29 | 31 | ||||||
| Long-term receivables included in other assets [i] | 307 | 310 | ||||||
| Warrants | — | 14 | ||||||
| $ | 10,288 | $ | 9,184 | |||||
| Financial liabilities | ||||||||
| Short-term borrowings | $ | 433 | $ | 271 | ||||
| Long-term debt (including current portion) | 5,000 | 4,842 | ||||||
| Operating lease liabilities (including current portion) | 2,045 | 1,955 | ||||||
| Accounts payable | 7,261 | 7,194 | ||||||
| $ | 14,739 | $ | 14,262 | |||||
| Derivatives designated as effective hedges, measured at fair value | ||||||||
| Foreign currency contracts | ||||||||
| Prepaid expenses | $ | 79 | $ | 33 | ||||
| Other assets | 80 | 10 | ||||||
| Other accrued liabilities | (32 | ) | (107 | ) | ||||
| Other long-term liabilities | (29 | ) | (83 | ) | ||||
| $ | 98 | $ | (147 | ) | ||||
[i] Certain amounts in the prior period have been reclassified to conform with current period presentation.
| [b] | Supplier financing program |
The Company has supplier financing programs with third-party financial institutions that provide financing to suppliers that provide tooling related materials. These arrangements allow these suppliers to elect to be paid by a financial institution at a discount earlier than the maturity date of the receivable, which may extend from 6 to 18 months. The Company pays the full amount owing to the financial institution on the maturity dates. Amounts outstanding under these programs as at September 30, 2025 were $103 million [$86 million as at December 31, 2024] and are presented within accounts payable.
| [c] | Fair value |
The Company determined the estimated fair values of its financial instruments based on valuation methodologies it believes are appropriate; however, considerable judgment is required to develop these estimates. Accordingly, these estimated fair values are not necessarily indicative of the amounts the Company could realize in a current market exchange. The estimated fair value amounts can be materially affected by the use of different assumptions or methodologies. The methods and assumptions used to estimate the fair value of financial instruments are described below:
Cash and cash equivalents, accounts receivable, accounts payable and short-term borrowings
Due to the short period to maturity of the instruments, the carrying values as presented in the consolidated balance sheets are reasonable estimates of fair values.
|
|
Magna International Inc. Third Quarter Report 2025 |
MAGNA INTERNATIONAL INC.
NOTES TO INTERIM CONSOLIDATED FINANCIAL STATEMENTS
[Unaudited]
[All amounts in U.S. dollars and all tabular amounts in millions unless otherwise noted]
14. FINANCIAL INSTRUMENTS (CONTINUED)
Publicly traded and private equity securities
The fair value of the Company’s investments in publicly traded equity securities is determined using the closing price on the measurement date, as reported on the stock exchange on which the securities are traded [Level 1 input based on the GAAP fair value hierarchy]. As a result, the Company’s public equity securities are subject to market price risk due to the risk of loss in value that would result from a decline in the market price of the common shares or underlying common shares.
Term Loans
The Company’s Term Loans consist of advances in the form of 1, 3 or 6-month loans that may be rolled over until the end of the 3 and 5-year terms. Due to the short-term maturity of each loan, the carrying value as presented in the consolidated balance sheets is a reasonable estimate of its fair value.
Senior Notes
At September 30, 2025, the net book value of the Company's Senior Notes was $4.6 billion and the estimated fair value was $4.7 billion. The fair value of the Senior Notes are classified as Level 1 when quoted prices in active markets are available and Level 2 when the quoted prices are from less active markets or when other observable inputs are used to determine fair value.
| [d] | Credit risk |
The Company's financial assets that are exposed to credit risk consist primarily of cash and cash equivalents, accounts receivable, debt investments, and foreign exchange and commodity forward contracts with positive fair values. Cash and cash equivalents, which consist of short-term investments, are only invested in bank term deposits and bank commercial paper with an investment grade credit rating. Credit risk is further reduced by limiting the amount which is invested in certain major financial institutions.
The Company is also exposed to credit risk from the potential default by any of its counterparties on its foreign exchange forward contracts. The Company mitigates this credit risk by dealing with counterparties who are major financial institutions that the Company anticipates will satisfy their obligations under the contracts.
In the normal course of business, the Company is exposed to credit risk from its customers, substantially all of which are in the automotive industry and are subject to credit risks associated with the automotive industry. For the three and nine months ended September 30, 2025, sales to the Company's six largest customers represented 77% and 76% of the Company's total sales; and substantially all of its sales are to customers with which the Company has ongoing contractual relationships. The Company conducts business with newer electric vehicle-focused customers, which poses incremental credit risk due to their relatively short operating histories; limited financial resources; less mature product development and validation processes; uncertain market acceptance of their products/services; and untested business models. These factors may elevate the Company’s risks in dealing with such customers, particularly with respect to recovery of: pre-production (including tooling, engineering, and launch) and production receivables; inventory; fixed assets and capitalized preproduction expenditures; as well as other third party obligations related to such items. As at September 30, 2025, the Company’s balance sheet exposure related to newer electric vehicle-focused customers was approximately $275 million [$300 million as at December 31, 2024] and sales to these customers represented less than 5% of the Company’s total sales. In determining the allowance for expected credit losses, the Company considers changes in customers’ credit ratings, liquidity, customers’ historical payments and loss experience, current economic conditions, and the Company's expectations of future economic conditions.
| [e] | Interest rate risk |
The Company is not exposed to significant interest rate risk due to the short-term maturity of its monetary current assets and current liabilities. In particular, the amount of interest income earned on cash and cash equivalents is impacted more by investment decisions made and the demands to have available cash on hand than by movements in interest rates over a given period.
| Magna International Inc. Third Quarter Report 2025 |
|
MAGNA INTERNATIONAL INC.
NOTES TO INTERIM CONSOLIDATED FINANCIAL STATEMENTS
[Unaudited]
[All amounts in U.S. dollars and all tabular amounts in millions unless otherwise noted]
14. FINANCIAL INSTRUMENTS (CONTINUED)
The Company is exposed to interest rate risk on its Term Loans as the interest rate is variable, however the Company is not exposed to interest rate risk on Senior Notes as the interest rates are fixed.
| [f] | Currency risk and foreign exchange contracts |
The Company is exposed to fluctuations in foreign exchange rates when manufacturing facilities have committed to the delivery of products for which the selling price has been quoted in currencies other than the facilities' functional currency, and when materials and equipment are purchased in currencies other than the facilities' functional currency. In an effort to manage this net foreign exchange exposure, the Company employs hedging programs, primarily through the use of foreign exchange forward contracts.
At September 30, 2025, the Company had outstanding foreign exchange forward contracts representing commitments to buy and sell various foreign currencies. Significant commitments are as follows:
| For Canadian dollars | For U.S. dollars | For Euros | ||||||||||||||||||||||
| U.S.
dollar amount |
Weighted average rate |
Peso amount |
Weighted average rate |
U.S.
dollar amount |
Weighted average rate |
Czech Koruna amount |
Weighted average rate |
|||||||||||||||||
| Buy | 172 | 1.35045 | 23,289 | 0.04779 | 595 | 0.85238 | 11,462 | 0.03957 | ||||||||||||||||
| (Sell) | (1,548 | ) | 0.74501 | (72 | ) | 20.53800 | (689 | ) | 1.16148 | (50 | ) | 25.27000 | ||||||||||||
Forward contracts mature at various dates through 2029. Foreign currency exposures are reviewed quarterly.
15. CONTINGENCIES
From time to time, the Company may become involved in regulatory proceedings, or become liable for legal, contractual and other claims by various parties, including customers, suppliers, former employees, class action plaintiffs and others. On an ongoing basis, the Company attempts to assess the likelihood of any adverse judgments or outcomes to these proceedings or claims, together with potential ranges of probable costs and losses. A determination of the provision required, if any, for these contingencies is made after analysis of each individual issue. The required provision may change in the future due to new developments in each matter or changes in approach such as a change in settlement strategy in dealing with these matters.
In the first quarter of 2025, management identified a potential exposure related to the reassessment of certain prior tax periods. This was a result of the proposed retroactive application of a 2023 judicial decision to tax periods prior to the date of the ruling within a jurisdiction in which the Company operates. This exposure pertained to previously claimed refundable value added tax (“VAT”) amounts, as well as associated interest, penalties, and other charges. During the quarter, the Company negotiated a resolution to this matter and recognized a provision for the estimated amount to settle, which is not considered material.
As a result of the bankruptcy of Fisker, Inc., owners of Fisker Ocean SUVs have asserted claims for alleged vehicle defects and breaches of state “lemon laws” against J.P. Morgan Chase, N.A. [“Chase”], the direct financer of approximately 2,000 such vehicles in the United States. Chase has indicated that it will seek indemnification from the Company, as contract manufacturer, for damages and legal costs incurred with the resolution of these claims. As the number, details and amount of these claims are all currently unknown, it is too early to determine the Company’s potential liability, if any, at this time.
In December 2023, the Company received a notification [the “Notification Letter”] from Ford Motor Company [“Ford”] informing the Company as to its initial determination that one of the Company’s operating groups bears responsibility for costs totaling $352 million related to two product recalls. The Notification Letter triggered a negotiation period regarding financial allocation of the total costs for the two recalls, which remains ongoing. In the event such negotiations are not concluded successfully, Ford has discretion under its Terms and Conditions to debit Magna up to 50% of the parts and labour costs actually incurred related to the recalls. The Company believes that the product in question met Ford’s specifications, and accordingly, is vigorously contesting Ford’s determination. Magna does not currently anticipate any material liabilities in relation to this claim.
|
|
Magna International Inc. Third Quarter Report 2025 |
MAGNA INTERNATIONAL INC.
NOTES TO INTERIM CONSOLIDATED FINANCIAL STATEMENTS
[Unaudited]
[All amounts in U.S. dollars and all tabular amounts in millions unless otherwise noted]
15. CONTINGENCIES (CONTINUED)
In the third quarter of 2025, Ford initiated recalls covering approximately 3.6 million vehicles equipped with rear-cameras supplied by the Company. Ford also announced a new 15-year extended warranty program for approximately 11.0 million other vehicles that were not the subject of these recalls but are also equipped with rear-cameras supplied by us. The rear-cameras were supplied across multiple vehicle programs, and as a result, additional recalls and/or extended warranty programs remain possible. At this time, root cause determinations have not been completed for the vehicles covered by Ford’s recalls and warranty extension program. Even after root causes have been determined, other challenges make it difficult to quantify the Company’s potential financial exposure, if any. These challenges include: integration with other vehicle systems and non-camera components; the age of affected vehicles; duration of the original warranty; number of affected vehicles brought to Ford dealers for inspection; and dealer discretion to determine the nature of the remedy to be applied, which may range from software upgrades, inspection of the rear-camera and other components, repairs, or replacement of the rear-camera. In the absence of certainty as to the scope of potentially affected vehicles, the root cause(s) of the alleged product failures, and/or the related costs of service actions, the Company is unable to estimate its potential exposure, if any, for recall-related costs and the extension of product warranties by Ford to affected vehicle owners. If the Company is determined to be fully or partially responsible for defective rear-cameras, the related recall and extended warranty costs could be material.
16. SEGMENTED INFORMATION
Magna is a global automotive supplier which has complete vehicle engineering and contract manufacturing expertise, as well as product capabilities which include body, chassis, exterior, seating, powertrain, active driver assistance, electronics, mirrors & lighting, mechatronics, and roof systems.
The Company is organized under four operating segments: Body Exteriors & Structures, Power & Vision, Seating Systems, and Complete Vehicles. These segments have been determined on the basis of technological opportunities, product similarities, market and operating factors, and are also the Company's reportable segments.
The Company's chief operating decision maker is the Chief Executive Officer. The chief operating decision maker uses Adjusted Earnings before Interest and Income Taxes ["Adjusted EBIT"] as the measure of segment profit or loss, since management believes Adjusted EBIT is the most appropriate measure of operational profitability or loss for its reporting segments. The chief operating decision maker uses Adjusted EBIT to assess operating performance, allocate resources, and to help plan the Company's long-term strategic direction and future global growth. Adjusted EBIT is calculated by taking Net income and adding back Amortization of acquired intangible assets, Income taxes, Interest expense, net and Other expense (income), net.
| [a] | The following tables show segment information for the Company's reporting segments and a reconciliation of Adjusted EBIT to the Company's consolidated net income: |
| Three months ended September 30, 2025 | ||||||||||||||||||||||||
| Fixed | ||||||||||||||||||||||||
| Total | External | Adjusted | Equity | asset | ||||||||||||||||||||
| sales | sales | EBIT [ii] | Depreciation | income | additions | |||||||||||||||||||
| Body Exteriors & Structures | $ | 4,147 | $ | 4,086 | $ | 305 | $ | 191 | $ | (1 | ) | $ | 120 | |||||||||||
| Power & Vision | 3,854 | 3,769 | 236 | 146 | (27 | ) | 112 | |||||||||||||||||
| Seating Systems | 1,520 | 1,518 | 62 | 27 | (16 | ) | 20 | |||||||||||||||||
| Complete Vehicles | 1,085 | 1,077 | 29 | 17 | — | 12 | ||||||||||||||||||
| Corporate & Other [i] | (144 | ) | 12 | (19 | ) | 8 | — | 3 | ||||||||||||||||
| Total Reportable Segments | $ | 10,462 | $ | 10,462 | $ | 613 | $ | 389 | $ | (44 | ) | $ | 267 | |||||||||||
| Magna International Inc. Third Quarter Report 2025 |
|
MAGNA INTERNATIONAL INC.
NOTES TO INTERIM CONSOLIDATED FINANCIAL STATEMENTS
[Unaudited]
[All amounts in U.S. dollars and all tabular amounts in millions unless otherwise noted]
16. SEGMENTED INFORMATION (CONTINUED)
| Three months ended September 30, 2024 | ||||||||||||||||||||||||
| Fixed | ||||||||||||||||||||||||
| Total | External | Adjusted | Equity | asset | ||||||||||||||||||||
| sales | sales | EBIT [ii] | Depreciation | income | additions | |||||||||||||||||||
| Body Exteriors & Structures | $ | 4,038 | $ | 3,981 | $ | 273 | $ | 186 | $ | (1 | ) | $ | 285 | |||||||||||
| Power & Vision | 3,837 | 3,769 | 279 | 145 | (4 | ) | 139 | |||||||||||||||||
| Seating Systems | 1,379 | 1,376 | 51 | 25 | (6 | ) | 27 | |||||||||||||||||
| Complete Vehicles | 1,159 | 1,150 | 27 | 20 | (2 | ) | 17 | |||||||||||||||||
| Corporate & Other [i] | (133 | ) | 4 | (36 | ) | 8 | — | 8 | ||||||||||||||||
| Total Reportable Segments | $ | 10,280 | $ | 10,280 | $ | 594 | $ | 384 | $ | (13 | ) | $ | 476 | |||||||||||
| Nine months ended September 30, 2025 | ||||||||||||||||||||||||
| Fixed | ||||||||||||||||||||||||
| Total | External | Adjusted | Equity | asset | ||||||||||||||||||||
| sales | sales | EBIT [ii] | Depreciation | income | additions | |||||||||||||||||||
| Body Exteriors & Structures | $ | 12,366 | $ | 12,185 | $ | 882 | $ | 566 | $ | (4 | ) | $ | 353 | |||||||||||
| Power & Vision | 11,357 | 11,128 | 522 | 427 | (57 | ) | 323 | |||||||||||||||||
| Seating Systems | 4,265 | 4,259 | 74 | 78 | (30 | ) | 56 | |||||||||||||||||
| Complete Vehicles | 3,587 | 3,562 | 101 | 52 | (3 | ) | 36 | |||||||||||||||||
| Corporate & Other [i] | (413 | ) | 28 | (29 | ) | 23 | (2 | ) | 13 | |||||||||||||||
| Total Reportable Segments | $ | 31,162 | $ | 31,162 | $ | 1,550 | $ | 1,146 | $ | (96 | ) | $ | 781 | |||||||||||
| Nine months ended September 30, 2024 | ||||||||||||||||||||||||
| Equity | Fixed | |||||||||||||||||||||||
| Total | External | Adjusted | (income) | asset | ||||||||||||||||||||
| sales | sales | EBIT [ii] | Depreciation | loss | additions | |||||||||||||||||||
| Body Exteriors & Structures | $ | 12,932 | $ | 12,745 | $ | 912 | $ | 548 | $ | (2 | ) | $ | 902 | |||||||||||
| Power & Vision | 11,605 | 11,416 | 575 | 431 | (37 | ) | 443 | |||||||||||||||||
| Seating Systems | 4,289 | 4,278 | 156 | 73 | (15 | ) | 65 | |||||||||||||||||
| Complete Vehicles | 3,784 | 3,760 | 74 | 63 | (5 | ) | 38 | |||||||||||||||||
| Corporate & Other [i] | (402 | ) | 9 | (77 | ) | 19 | 3 | 21 | ||||||||||||||||
| Total Reportable Segments | $ | 32,208 | $ | 32,208 | $ | 1,640 | $ | 1,134 | $ | (56 | ) | $ | 1,469 | |||||||||||
| [i] | Included in Corporate and Other Adjusted EBIT are intercompany fees charged to the automotive segments. |
| [ii] | The following table reconciles Net income to Adjusted EBIT: |
| Three months ended | Nine months ended | |||||||||||||||
| September 30, | September 30, | |||||||||||||||
| 2025 | 2024 | 2025 | 2024 | |||||||||||||
| Net income | $ | 333 | $ | 508 | $ | 880 | $ | 862 | ||||||||
| Add (deduct): | ||||||||||||||||
| Amortization of acquired intangible assets | 27 | 28 | 82 | 84 | ||||||||||||
| Interest expense, net | 65 | 54 | 167 | 159 | ||||||||||||
| Other expense (income), net | 48 | (188 | ) | 107 | 236 | |||||||||||
| Income taxes | 140 | 192 | 314 | 299 | ||||||||||||
| Adjusted EBIT | $ | 613 | $ | 594 | $ | 1,550 | $ | 1,640 | ||||||||
Other segment items constitute the difference between External sales by segment and Adjusted EBIT by segment, and are comprised of cost of goods sold, selling, general, and administrative expenses, depreciation, and equity income. No significant expense categories are being provided to the chief operating decision maker on a regular basis.
|
|
Magna International Inc. Third Quarter Report 2025 |
MAGNA INTERNATIONAL INC.
NOTES TO INTERIM CONSOLIDATED FINANCIAL STATEMENTS
[Unaudited]
[All amounts in U.S. dollars and all tabular amounts in millions unless otherwise noted]
16. SEGMENTED INFORMATION (CONTINUED)
| [b] | The following table shows segment information for Goodwill, Investments, and Net Assets for the Company's reporting segments: |
| September 30, 2025 | December 31, 2024 | |||||||||||||||||||||||
| Goodwill | Investments | Net Assets | Goodwill | Investments | Net Assets | |||||||||||||||||||
| Body Exteriors & Structures | $ | 457 | $ | 24 | $ | 9,337 | $ | 435 | $ | 24 | $ | 8,727 | ||||||||||||
| Power & Vision | 2,024 | 545 | 7,436 | 1,868 | 525 | 6,982 | ||||||||||||||||||
| Seating Systems | 257 | 213 | 1,249 | 250 | 193 | 1,401 | ||||||||||||||||||
| Complete Vehicles | 115 | 110 | 425 | 102 | 105 | 439 | ||||||||||||||||||
| Corporate & Other | 22 | 206 | 936 | 19 | 198 | 724 | ||||||||||||||||||
| Total Reportable Segments | $ | 2,875 | $ | 1,098 | $ | 19,383 | $ | 2,674 | $ | 1,045 | $ | 18,273 | ||||||||||||
| [c] | The following table reconciles Total Assets to Net Assets: |
| September 30, | December 31, | |||||||
| 2025 | 2024 | |||||||
| Total Assets | $ | 32,907 | $ | 31,039 | ||||
| Deduct assets not included in segment net assets: | ||||||||
| Cash and cash equivalents | (1,327 | ) | (1,247 | ) | ||||
| Deferred tax assets | (920 | ) | (819 | ) | ||||
| Long-term receivables from joint venture partners | (116 | ) | (67 | ) | ||||
| Deduct liabilities included in segment net assets: | ||||||||
| Accounts payable | (7,261 | ) | (7,194 | ) | ||||
| Accrued salaries and wages | (994 | ) | (867 | ) | ||||
| Other accrued liabilities | (2,906 | ) | (2,572 | ) | ||||
| Segment Net Assets | $ | 19,383 | $ | 18,273 | ||||
17. SUBSEQUENT EVENT
Normal Course Issuer Bid
Subject to approval by the Toronto Stock Exchange ["TSX"], the Company’s Board of Directors approved a new normal course issuer bid to purchase up to 25.3 million Common Shares of the Company, representing approximately 10% of the Company’s public float. The primary purposes of the normal course issuer bid are purchases for cancellation as well as purchases to fund the Company’s stock-based compensation awards and programs. The normal course issuer bid is expected to be effective on November 7, 2025 and will terminate no later than November 6, 2026. All purchases of Common Shares will be made at the market price at the time of purchase in accordance with the rules and policies of the TSX or on the New York Stock Exchange ["NYSE"] in compliance with Rule 10b-18 under the U.S. Securities Exchange Act of 1934.
Purchases may also be made through alternative trading systems in Canada and the U.S., or by such other means permitted by the TSX, including by private agreement or specific share repurchase program at a discount to the prevailing market price, pursuant to an issuer bid exemption order issued by a securities regulatory authority.
| Magna International Inc. Third Quarter Report 2025 |
|
Exhibit 99.3
FORM 52-109F2
CERTIFICATION OF INTERIM FILINGS
FULL CERTIFICATE
I, Seetarama (Swamy) Kotagiri, President and Chief Executive Officer of Magna International Inc., certify the following:
1. Review: I have reviewed the interim financial report and interim MD&A (together, the “interim filings”) of Magna International Inc. (the “issuer”) for the interim period ended September 30, 2025.
2. No misrepresentations: Based on my knowledge, having exercised reasonable diligence, the interim filings do not contain any untrue statement of a material fact or omit to state a material fact required to be stated or that is necessary to make a statement not misleading in light of the circumstances under which it was made, with respect to the period covered by the interim filings.
3. Fair presentation: Based on my knowledge, having exercised reasonable diligence, the interim financial report together with the other financial information included in the interim filings fairly present in all material respects the financial condition, financial performance and cash flows of the issuer, as of the date of and for the periods presented in the interim filings.
4. Responsibility: The issuer’s other certifying officer(s) and I are responsible for establishing and maintaining disclosure controls and procedures (DC&P) and internal control over financial reporting (ICFR), as those terms are defined in National Instrument 52-109 Certification of Disclosure in Issuer’s Annual and Interim Filings, for the issuer.
5. Design: Subject to the limitations, if any, described in paragraphs 5.2 and 5.3, the issuer’s other certifying officer(s) and I have, as at the end of the period covered by the interim filings
(a) designed DC&P, or caused it to be designed under our supervision, to provide reasonable assurance that
(i) material information relating to the issuer is made known to us by others, particularly during the period in which the interim filings are being prepared; and
(ii) information required to be disclosed by the issuer in its annual filings, interim filings or other reports filed or submitted by it under securities legislation is recorded, processed, summarized and reported within the time periods specified in securities legislation; and
(b) designed ICFR, or caused it to be designed under our supervision, to provide reasonable assurance regarding the reliability of financial reporting and the preparation of financial statements for external purposes in accordance with the issuer’s GAAP.
5.1 Control framework: The control framework the issuer’s other certifying officer(s) and I used to design the issuer’s ICFR is the Internal Control - Integrated Framework issued by the Committee of Sponsoring Organizations of the Treadway Commission (COSO).
5.2 N/A
5.3 N/A
6. Reporting changes in ICFR: The issuer has disclosed in its interim MD&A any change in the issuer’s ICFR that occurred during the period beginning on July 1, 2025, and ended on September 30, 2025, that has materially affected, or is reasonably likely to materially affect, the issuer’s ICFR.
| Date: October 31, 2025. | |
| /s/ Seetarama (Swamy) Kotagiri | |
| Seetarama (Swamy) Kotagiri | |
| President and Chief Executive Officer |
Exhibit 99.4
FORM 52-109F2
CERTIFICATION OF INTERIM FILINGS
FULL CERTIFICATE
I, Philip D. Fracassa, Executive Vice-President and Chief Financial Officer of Magna International Inc., certify the following:
1. Review: I have reviewed the interim financial report and interim MD&A (together, the “interim filings”) of Magna International Inc. (the “issuer”) for the interim period ended September 30, 2025.
2. No misrepresentations: Based on my knowledge, having exercised reasonable diligence, the interim filings do not contain any untrue statement of a material fact or omit to state a material fact required to be stated or that is necessary to make a statement not misleading in light of the circumstances under which it was made, with respect to the period covered by the interim filings.
3. Fair presentation: Based on my knowledge, having exercised reasonable diligence, the interim financial report together with the other financial information included in the interim filings fairly present in all material respects the financial condition, financial performance and cash flows of the issuer, as of the date of and for the periods presented in the interim filings.
4. Responsibility: The issuer’s other certifying officer(s) and I are responsible for establishing and maintaining disclosure controls and procedures (DC&P) and internal control over financial reporting (ICFR), as those terms are defined in National Instrument 52-109 Certification of Disclosure in Issuer’s Annual and Interim Filings, for the issuer.
5. Design: Subject to the limitations, if any, described in paragraphs 5.2 and 5.3, the issuer’s other certifying officer(s) and I have, as at the end of the period covered by the interim filings
(a) designed DC&P, or caused it to be designed under our supervision, to provide reasonable assurance that
(i) material information relating to the issuer is made known to us by others, particularly during the period in which the interim filings are being prepared; and
(ii) information required to be disclosed by the issuer in its annual filings, interim filings or other reports filed or submitted by it under securities legislation is recorded, processed, summarized and reported within the time periods specified in securities legislation; and
(b) designed ICFR, or caused it to be designed under our supervision, to provide reasonable assurance regarding the reliability of financial reporting and the preparation of financial statements for external purposes in accordance with the issuer’s GAAP.
5.1 Control framework: The control framework the issuer’s other certifying officer(s) and I used to design the issuer’s ICFR is the Internal Control - Integrated Framework issued by the Committee of Sponsoring Organizations of the Treadway Commission (COSO).
5.2 N/A
5.3 N/A
6. Reporting changes in ICFR: The issuer has disclosed in its interim MD&A any change in the issuer’s ICFR that occurred during the period beginning on July 1, 2025, and ended on September 30, 2025, that has materially affected, or is reasonably likely to materially affect, the issuer’s ICFR.
| Date: October 31, 2025. | |
| /s/ Philip D. Fracassa | |
| Philip D. Fracassa | |
| Executive Vice-President and Chief Financial Officer |