UNITED STATES
SECURITIES AND EXCHANGE COMMISSION
Washington, D.C. 20549
FORM 8-K
CURRENT REPORT
PURSUANT TO SECTION 13 OR 15(D) OF
THE SECURITIES EXCHANGE ACT OF 1934
Date of Report (Date of earliest event reported): October 30, 2025
Riot Platforms, Inc.
(Exact name of registrant as specified in its charter)
Nevada |
|
001-33675 |
|
84-1553387 |
(State or other jurisdiction of incorporation) |
|
(Commission File Number) |
|
(I.R.S. Employer Identification No.) |
3855 Ambrosia Street, Suite 301
Castle Rock, CO 80109
(Address of principal executive offices)
(303) 794-2000
(Registrant’s telephone number, including area code)
(Former name or former address, if changed since last report)
Check the appropriate box below if the Form 8-K filing is intended to simultaneously satisfy the filing obligation of the registrant under any of the following provisions:
☐ Written communications pursuant to Rule 425 under the Securities Act (17 CFR 230.425)
☐ Soliciting material pursuant to Rule 14a-12 under the Exchange Act (17 CFR 240.14a-12)
☐ Pre-commencement communications pursuant to Rule 14d-2(b) under the Exchange Act (17 CFR 240.14d-2(b))
☐ Pre-commencement communications pursuant to Rule 13e-4(c) under the Exchange Act (17 CFR 240.13e-4(c))
Securities registered pursuant to Section 12(b) of the Exchange Act:
Title of each class |
|
Trading Symbol(s) |
|
Name of each exchange on which |
Common Stock, no par value per share |
|
RIOT |
|
Nasdaq Capital Market |
Indicate by check mark whether the registrant is an emerging growth company as defined in Rule 405 of the Securities Act of 1933 (§230.405 of this chapter) or Rule 12b-2 of the Securities Exchange Act of 1934 (§240.12b-2 of this chapter).
Emerging growth company ☐
If an emerging growth company, indicate by check mark if the registrant has elected not to use the extended transition period for complying with any new or revised financial accounting standards provided pursuant to Section 13(a) of the Exchange Act. ☐
Item 2.02 – Results of Operations and Financial Condition.
On October 30, 2025, Riot Platforms, Inc. (together with its consolidated subsidiaries, the “Company”) issued a press release (the “Press Release”) and an update on the Company’s business and financial results and results of operations for the three months ended September 30, 2025 (the “Q3 2025 Earnings Deck”) on its website, www.riotplatforms.com, under the “Investor Relations” tab. The full text of the Press Release and the Q3 2025 Earnings Deck are attached to this Current Report on Form 8-K (this “Report”) as Exhibit 99.1 and 99.2, respectively.
The information under this Item 2.02 of this Report, including Exhibits 99.1 and 99.2 attached hereto, is furnished and shall not be deemed “filed” for purposes of Section 18 of the Securities Exchange Act of 1934, as amended, (the “Exchange Act”) nor shall it be deemed incorporated by reference in any filing under the Securities Act of 1933, as amended, or the Exchange Act, except as shall be expressly set forth by specific reference in such a filing.
Item 9.01 – Financial Statements and Exhibits.
(d)Exhibits.
EXHIBIT INDEX
Exhibit No. |
|
Description |
|
99.1 99.2 |
|
|
104 |
|
Cover Page Interactive Data File (embedded within the Inline XBRL document) |
S I G N A T U R E
Pursuant to the requirements of the Securities Exchange Act of 1934, as amended, the registrant has duly caused this report to be signed on its behalf by the undersigned hereunto duly authorized.
|
RIOT PLATFORMS, INC. |
|
|
|
|
|
|
|
|
|
|
|
By: |
/s/ Colin Yee |
|
|
Name: |
Colin Yee |
|
|
Title: |
Chief Financial Officer |
|
Date: October 30, 2025
Exhibit 99.1
Riot Platforms Reports Third Quarter 2025 Financial Results and Strategic Highlights
● Record quarterly revenue of $180.2 million
● Net income of $104.5 million, or $0.26 Diluted EPS
● Adjusted EBITDA of $197.2 million
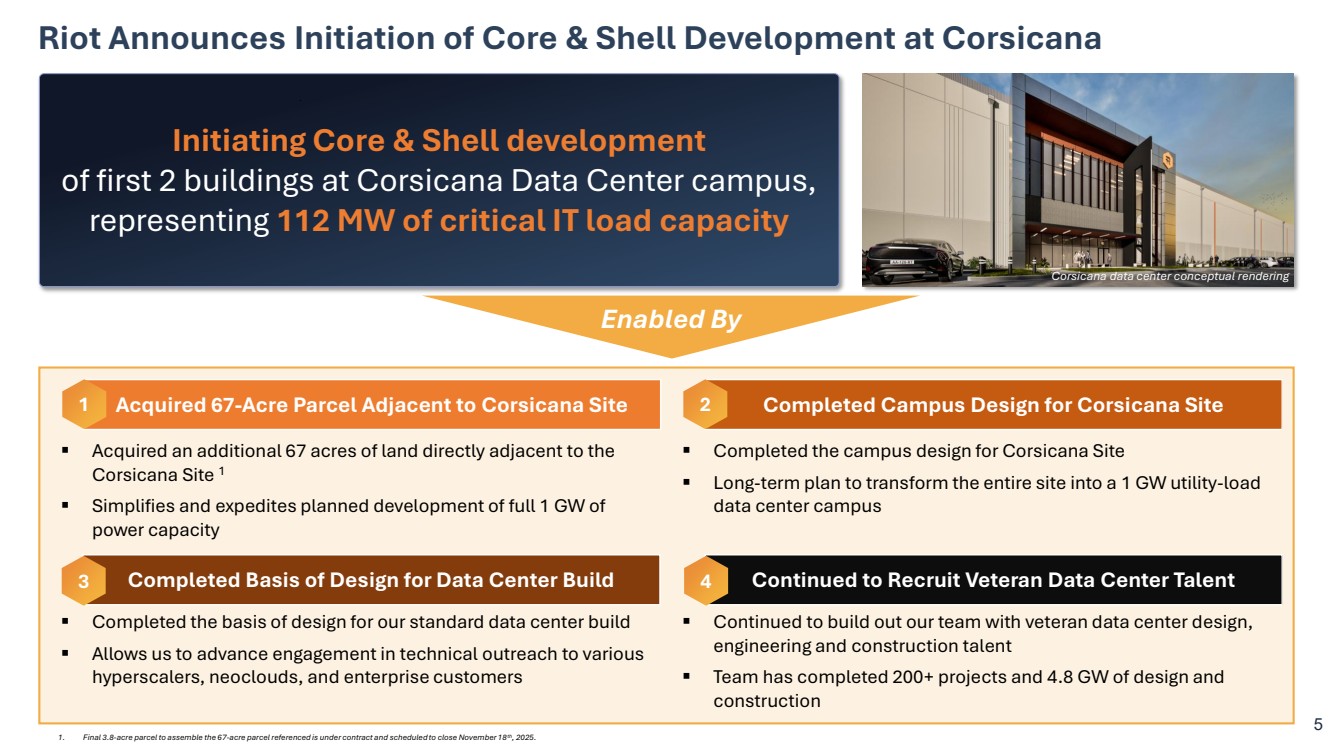
● Announces initiation of 112 MW of core and shell for data center campus
CASTLE ROCK, Colo., October 30, 2025 (GLOBE NEWSWIRE) -- Riot Platforms, Inc. (NASDAQ: RIOT) (“Riot” or “the Company”), a Bitcoin-driven industry leader in the development of large-scale data centers and bitcoin mining applications, reported financial results for the three-month period ended September 30, 2025. The accompanying presentation materials are available on Riot’s website.
“Riot made decisive progress in the development of our data center business this quarter,” said Jason Les, CEO of Riot. “This progress has culminated in announcing today the initiation of the core and shell development of the first two buildings at our Corsicana data center campus, representing 112 MW of total critical IT capacity. This development has been made possible by four key achievements this quarter, namely; (i) the acquisition of an additional 67-acre parcel of land directly adjacent to our original Corsicana site, (ii) the completion of the Campus Design for Corsicana, which will transform the entire site for data center development, (iii) the completion of the Basis of Design for our standard data center build, and (iv) the ongoing build out of our in-house data center team.
“Together, these developments represent key advancements in our efforts to transform Riot into a large-scale, multi-faceted data center operator, in line with our strategy of maximizing the value of our unique portfolio of land and power assets.”
Corsicana Data Center Campus Design
Third Quarter 2025 Financial and Operational Highlights
Key financial and operational highlights for the third quarter include:
| ● | Total revenue of $180.2 million, as compared to $84.8 million for the same three-month period in 2024. The increase was primarily driven by a $93.3 million increase in Bitcoin Mining revenue. |
| ● | Produced 1,406 bitcoin, as compared to 1,104 during the same three-month period in 2024. |
| ● | The average cost to mine bitcoin, excluding depreciation, was $46,324 in the quarter, as compared to $35,376 per bitcoin in the same three-month period in 2024. The increase was primarily driven by a 52% increase in the average global network hash rate as compared to the same period in 2024, partially offset by a 147% increase in power credits received in Q3 2025 compared to power credits received in Q3 2024. |
| ● | Bitcoin Mining revenue of $160.8 million for the quarter, as compared to $67.5 million for the same three-month period in 2024, primarily driven by higher average bitcoin prices and an increase in operational hash rate, partially offset by an increase in the average global network hash rate. |
| ● | Engineering revenue of $19.1 million for the quarter, as compared to $12.6 million for the same three-month period in 2024. Riot has realized $23.0 million in capex savings alone since the acquisition of ESS Metron in December 2021, demonstrating one of the key synergies resulting from this strategic operational asset. |
| ● | Net income of $104.5 million or $0.26 Diluted EPS, as compared to a net loss of $154.4 million or $(0.54) Diluted EPS in the same three-month period in 2024. |
| ● | Non-GAAP Adjusted EBITDA of $197.2 million for the quarter, which included a $133.1 million gain on Bitcoin held on the balance sheet. |
| ● | Maintained industry-leading financial position, with $170.0 million in working capital, including $330.7 million in unrestricted cash on hand, and $75.6 million in restricted cash. |
| ● | Held 19,287 bitcoin (of which 3,300 are currently held as collateral), equating to approximately $2.2 billion based on a market price for one bitcoin on September 30, 2025, of $114,068. |
About Riot Platforms, Inc.
Riot’s (NASDAQ: RIOT) vision is to be the world’s most trusted platform for powering and building digital infrastructure.
Riot’s mission is to empower the future of digital infrastructure by positively impacting the sectors, networks, and communities that we touch. We believe that the combination of an innovative spirit and strong community partnership allows the Company to achieve best-in-class execution and create successful outcomes.
Riot is a Bitcoin-driven industry leader in the development of large-scale data centers and bitcoin mining applications. The Company’s vertically integrated strategy spans Bitcoin mining, engineering, and the development of large-scale data center projects designed to support the growing demand for high-density computing. Riot currently operates Bitcoin mining facilities in central Texas and Kentucky, with engineering and fabrication capabilities in Denver and Houston. The Company is now expanding into data center development, strengthening its position as a foundational builder in the digital economy.
For more information, visit www.riotplatforms.com.
Safe Harbor
Statements in this press release that are not historical facts are forward-looking statements that reflect management’s current expectations, assumptions, and estimates of future performance and economic conditions. Such statements rely on the safe harbor provisions of Section 27A of the Securities Act of 1933, as amended, and Section 21E of the Securities Exchange Act of 1934, as amended. Because such statements are subject to risks and uncertainties, actual results may differ materially from those expressed or implied by such forward-looking statements. Words such as “anticipates,” “believes,” “plans,” “expects,” “intends,” “will,” “potential,” “hope,” similar expressions and their negatives are intended to identify forward-looking statements. These forward-looking statements may include, but are not limited to: plans to develop data centers; future land acquisitions; construction plans and expense forecasts in connection therewith; plans regarding expense reduction; forecasted capital expenditures and descriptions thereof; projected growth in installed hash rate; projected energization timelines; forecasted energy demand; and the Company’s other plans, projections, objectives, expectations, and intentions. These forward-looking statements are subject to a number of risks and uncertainties, including, without limitation: the feasibility of developing the Company’s power capacity for data center purposes, including artificial intelligence/high-performance computing uses; the anticipated demand for large data centers; our ability to attract and retain qualified third-party partners and customers; future economic conditions, performance, or outlooks; future political conditions; the outcome of contingencies; potential acquisitions or divestitures; our ability to maximize the value of our full power portfolio; the continued implementation of industrial-scale immersion-cooled Bitcoin mining hardware at our Bitcoin Mining facilities; the number and value of Bitcoin rewards and transaction fees we earn from our ongoing Bitcoin Mining operations; future self-mining hash rate capacity; timing of receipt and deployment of miners; expected cash flows or capital expenditures; our beliefs or expectations; activities, events or developments that we intend, expect, project, believe, or anticipate will or may occur in the future; unaudited estimates of bitcoin production; risks related to the success, schedule, cost and difficulty of integrating businesses we acquire; and our failure to realize anticipated efficiencies and strategic and financial benefits from our acquisitions. Detailed information regarding the factors identified by the Company’s management which they believe may cause actual results to differ materially from those expressed or implied by such forward-looking statements in this press release may be found in the Company’s filings with the U.S. Securities and Exchange Commission (the “SEC”), including the risks, uncertainties and other factors discussed under the sections entitled “Risk Factors” and “Cautionary Note Regarding Forward-Looking Statements” of the Company’s Annual Report on Form 10-K for the fiscal year ended December 31, 2024, as amended, and the other filings the Company makes with the SEC, copies of which may be obtained from the SEC’s website, www.sec.gov. All forward- looking statements included in this press release are made only as of the date of this press release, and the Company disclaims any intention or obligation to update or revise any such forward-looking statements to reflect events or circumstances that subsequently occur, or of which the Company hereafter becomes aware, except as required by law. Persons reading this press release are cautioned not to place undue reliance on such forward-looking statements.
For further information, please contact:
Investor Contact:
Phil McPherson / Joshua Kane
303-794-2000 ext. 110
IR@Riot.Inc
Media Contact: Alexis Brock 303-794-2000 ext.
Non-U.S. GAAP Measures of Financial Performance
118 PR@Riot.Inc In addition to financial measures presented under generally accepted accounting principles in the United States of America (“GAAP”), we consistently evaluate our use of and calculation of non-GAAP financial measures such as “Adjusted EBITDA.” EBITDA is computed as net income before interest, taxes, depreciation, and amortization. Adjusted EBITDA is a financial measure defined as EBITDA, adjusted to eliminate the effects of certain non-cash and/or non-recurring items that do not reflect our ongoing strategic business operations, which management believes results in a performance measurement that represents a key indicator of the Company’s core business operations of Bitcoin mining. The adjustments include fair value adjustments such as derivative power contract adjustments, equity securities fair value changes, and non-cash stock-based compensation expense, in addition to financing and legacy business income and expense items. We believe Adjusted EBITDA can be an important financial performance measure because it allows management, investors, and our board of directors to evaluate and compare our operating results, including our return on capital and operating efficiencies from period-to-period by making such adjustments. Additionally, Adjusted EBITDA is used as a performance metric for share-based compensation.
Adjusted EBITDA is provided in addition to, and should not be considered a substitute for, or superior to, net income, the most comparable measure under GAAP to Adjusted EBITDA. Further, Adjusted EBITDA should not be considered as an alternative to revenue growth, net income, diluted net income per share or any other performance measure derived in accordance with GAAP, or as an alternative to cash flow from operating activities as a measure of our liquidity. Adjusted EBITDA has limitations as an analytical tool, and you should not consider this financial measure either in isolation or as a substitute for analyzing our results as reported under GAAP.
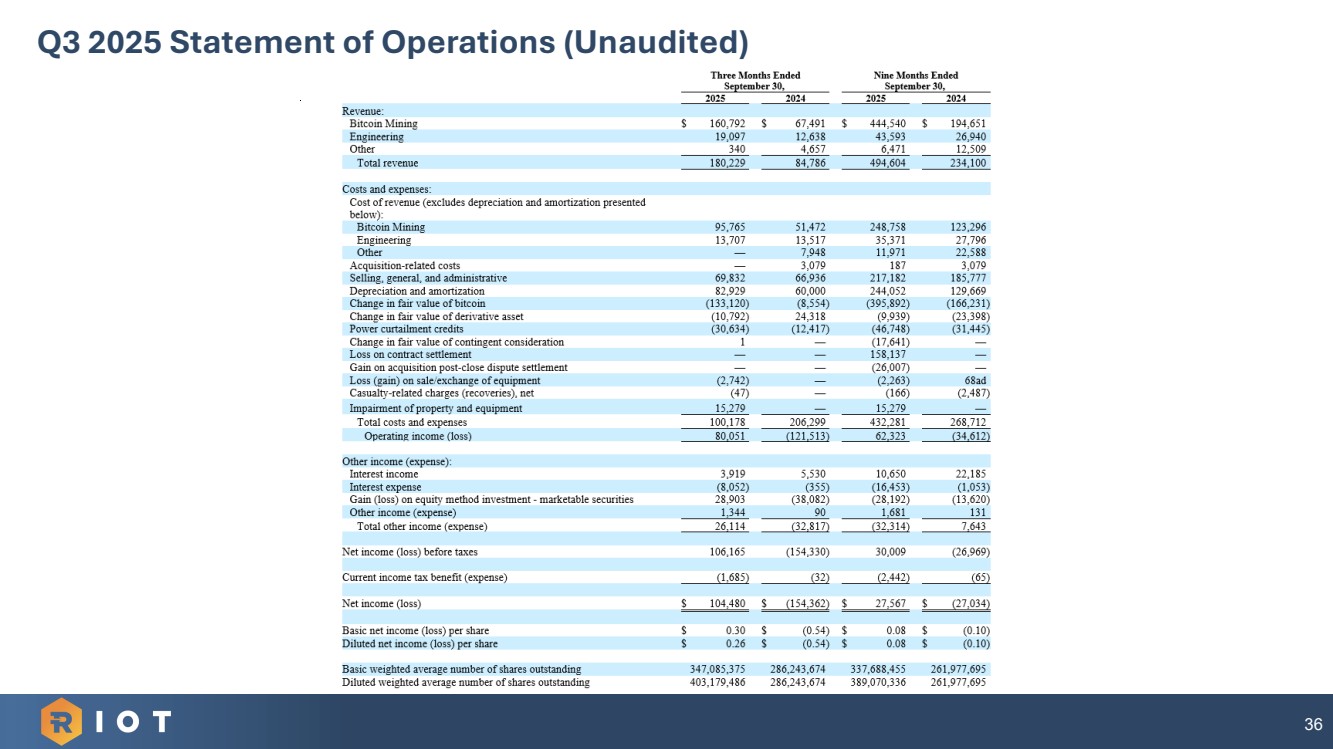
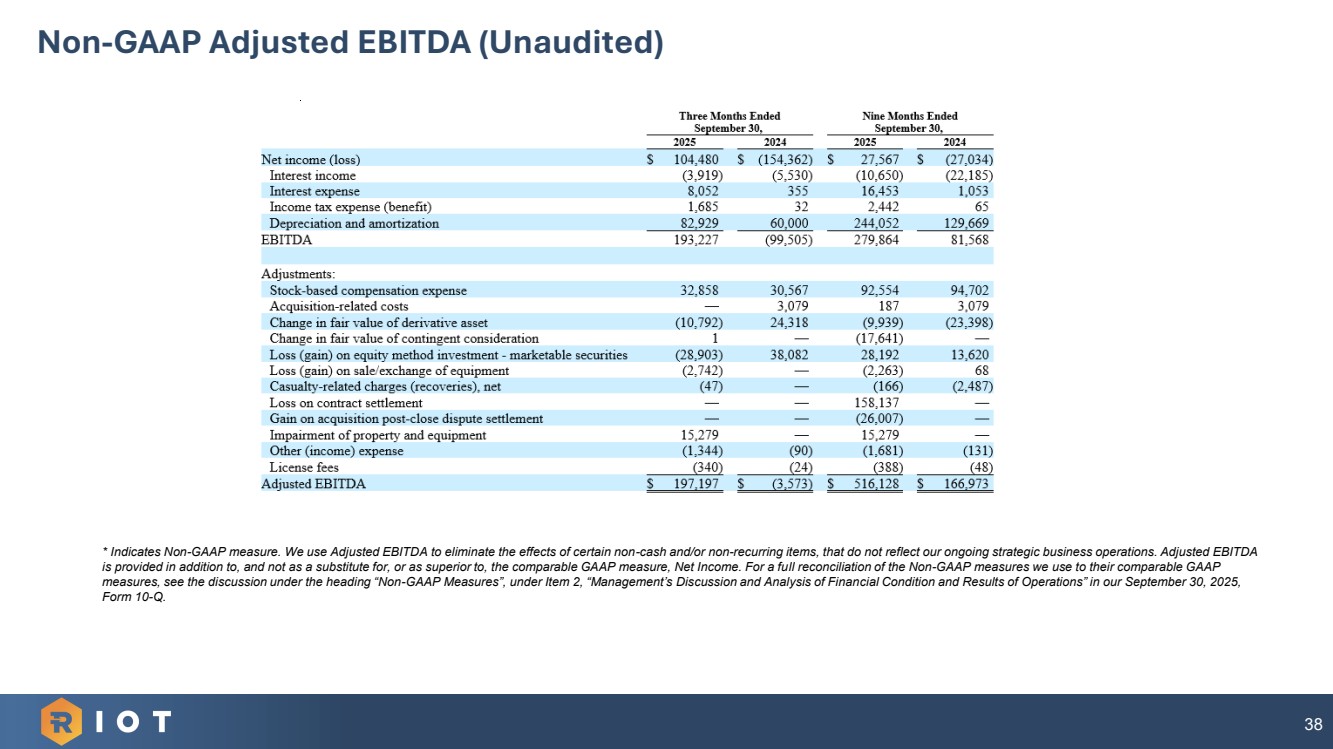
The following table reconciles Adjusted EBITDA to Net income (loss), the most comparable GAAP financial measure:
|
|
Three Months Ended |
|
Nine Months Ended |
||||||||
|
|
September 30, |
|
September 30, |
||||||||
|
|
2025 |
|
2024 |
|
2025 |
|
2024 |
||||
Net income (loss) |
|
$ |
104,480 |
|
$ |
(154,362) |
|
$ |
27,567 |
|
$ |
(27,034) |
Interest income |
|
|
(3,919) |
|
|
(5,530) |
|
|
(10,650) |
|
|
(22,185) |
Interest expense |
|
|
8,052 |
|
|
355 |
|
|
16,453 |
|
|
1,053 |
Income tax expense (benefit) |
|
|
1,685 |
|
|
32 |
|
|
2,442 |
|
|
65 |
Depreciation and amortization |
|
|
82,929 |
|
|
60,000 |
|
|
244,052 |
|
|
129,669 |
EBITDA |
|
|
193,227 |
|
|
(99,505) |
|
|
279,864 |
|
|
81,568 |
|
|
|
|
|
|
|
|
|
|
|
|
|
Adjustments: |
|
|
|
|
|
|
|
|
|
|
|
|
Stock-based compensation expense |
|
|
32,858 |
|
|
30,567 |
|
|
92,554 |
|
|
94,702 |
Acquisition-related costs |
|
|
— |
|
|
3,079 |
|
|
187 |
|
|
3,079 |
Change in fair value of derivative asset |
|
|
(10,792) |
|
|
24,318 |
|
|
(9,939) |
|
|
(23,398) |
Change in fair value of contingent consideration |
|
|
1 |
|
|
— |
|
|
(17,641) |
|
|
— |
Loss (gain) on equity method investment - marketable securities |
|
|
(28,903) |
|
|
38,082 |
|
|
28,192 |
|
|
13,620 |
Loss (gain) on sale/exchange of equipment |
|
|
(2,742) |
|
|
— |
|
|
(2,263) |
|
|
68 |
Casualty-related charges (recoveries), net |
|
|
(47) |
|
|
— |
|
|
(166) |
|
|
(2,487) |
Loss on contract settlement |
|
|
— |
|
|
— |
|
|
158,137 |
|
|
— |
Gain on acquisition post-close dispute settlement |
|
|
— |
|
|
— |
|
|
(26,007) |
|
|
— |
Impairment of property and equipment |
|
|
15,279 |
|
|
— |
|
|
15,279 |
|
|
— |
Other (income) expense |
|
|
(1,344) |
|
|
(90) |
|
|
(1,681) |
|
|
(131) |
License fees |
|
|
(340) |
|
|
(24) |
|
|
(388) |
|
|
(48) |
Adjusted EBITDA |
|
$ |
197,197 |
|
$ |
(3,573) |
|
$ |
516,128 |
|
$ |
166,973 |
The Company defines Cost to Mine as the cost to mine one Bitcoin, excluding Bitcoin miner depreciation, as calculated in the table below.
|
|
Three Months Ended |
|
Nine Months Ended |
||||||||||||
|
|
September 30, |
|
September 30, |
||||||||||||
|
|
2025 |
|
2024 |
|
2025 |
|
2024 |
||||||||
Cost of power for self-mining operations |
|
$ |
82,370 |
|
|
$ |
41,864 |
|
|
$ |
206,369 |
|
|
$ |
96,326 |
|
Other direct cost of revenue for self-mining operations(1)(2), excluding bitcoin miner depreciation |
|
|
13,395 |
|
|
|
9,608 |
|
|
|
42,389 |
|
|
|
26,970 |
|
Cost of revenue for self-mining operations, excluding bitcoin miner depreciation |
|
|
95,765 |
|
|
|
51,472 |
|
|
|
248,758 |
|
|
|
123,296 |
|
Less: power curtailment credits(3) |
|
|
(30,634) |
|
|
|
(12,417) |
|
|
|
(46,748) |
|
|
|
(31,445) |
|
Cost of revenue for self-mining operations, net of power curtailment credits, excluding bitcoin miner depreciation |
|
|
65,131 |
|
|
|
39,055 |
|
|
|
202,010 |
|
|
|
91,851 |
|
Bitcoin miner depreciation(4)(5) |
|
|
60,106 |
|
|
|
44,303 |
|
|
|
177,420 |
|
|
|
93,120 |
|
Cost of revenue for self-mining operations, net of power curtailment credits, including bitcoin miner depreciation |
|
$ |
125,237 |
|
|
$ |
83,358 |
|
|
$ |
379,430 |
|
|
$ |
184,971 |
|
|
|
|
|
|
|
|
|
|
|
|
|
|
|
|
|
|
Quantity of bitcoin mined |
|
|
1,406 |
|
|
|
1,104 |
|
|
|
4,362 |
|
|
|
3,312 |
|
Production value of one bitcoin mined(6) |
|
$ |
114,361 |
|
|
$ |
61,131 |
|
|
$ |
101,912 |
|
|
$ |
58,771 |
|
|
|
|
|
|
|
|
|
|
|
|
|
|
|
|
|
|
Cost to mine one bitcoin, excluding bitcoin miner depreciation |
|
$ |
46,324 |
|
|
$ |
35,376 |
|
|
$ |
46,311 |
|
|
$ |
27,733 |
|
Cost to mine one bitcoin, excluding bitcoin miner depreciation, as a % of production value of one bitcoin mined |
|
|
40.5 |
% |
|
|
57.9 |
% |
|
|
45.4 |
% |
|
|
47.2 |
% |
|
|
|
|
|
|
|
|
|
|
|
|
|
|
|
|
|
Cost to mine one bitcoin, including bitcoin miner depreciation |
|
$ |
89,074 |
|
|
$ |
75,505 |
|
|
$ |
86,985 |
|
|
$ |
55,849 |
|
Cost to mine one bitcoin, including bitcoin miner depreciation, as a % of production value of one bitcoin mined |
|
|
77.9 |
% |
|
|
123.5 |
% |
|
|
85.4 |
% |
|
|
95.0 |
% |
|
|
|
|
|
|
|
|
|
|
|
|
|
|
|
|
|
| (1) | Other direct cost of revenue includes compensation, insurance, repairs, and ground lease rent and related property tax. |
| (2) | During the three months ended September 30, 2025 and 2024, we paid cash of approximately $60.2 million and $44.1 million respectively, and during the nine months ended September 30, 2025 and 2024, $152.4 million and $235.0 million, respectively, in total deposits and payments for the purchase of miners. Costs to finance the purchase of miners were zero in all periods presented as the miners were paid for with cash from the Company’s cash balance. The seller did not provide any financing nor did the Company borrow from a third-party to purchase the miners. |
| (3) | Power curtailment credits are credited against our power invoices as a result of temporarily pausing our operations to participate in ERCOT’s Demand Response Service Programs. Our fixed-price power purchase contracts enable us to strategically curtail our mining operations and participate in these programs, which significantly lower our cost to mine bitcoin. These credits are recognized outside of cost of revenue in Power curtailment credits on our Condensed Consolidated Statements of Operations, but they significantly reduce our overall cost to mine bitcoin. |
| (4) | We capitalize the acquisition cost of our miners and include these costs in Property and equipment, net on our Condensed Consolidated Balance Sheets. The miners are depreciated over an estimated useful life of three years, during which time the miners are expected to generate bitcoin revenue. We do not consider depreciation expense in determining whether it is economical to operate our miners since depreciation is a non-cash expense and is not a variable operating cost that can be avoided even if we curtail operations temporarily. Depreciation expense incurred is disclosed for each respective period in the table above. |
| (5) | The following table presents the future depreciation expense of all of our bitcoin miners: |
Remainder of 2025 |
|
$ |
66,349 |
2026 |
|
|
234,643 |
2027 |
|
|
175,901 |
2028 |
|
|
39,726 |
Total |
|
$ |
516,619 |
| (6) | Computed as revenue recognized from bitcoin mined divided by the quantity of bitcoin mined during the same period. |
|
NASDAQ: RIOT Riot Platforms (NASDAQ: RIOT) Q3 2025 Update October 30, 2025 Corsicana data center conceptual rendering |
|
Statements in this presentation that are not statements of historical fact are forward-looking statements that reflect management’s current expectations, assumptions, and estimates of future performance and economic conditions, and are not guarantees of future performance or actual results. Such statements are made in reliance on the safe harbor provisions of Section 27A of the Securities Act of 1933, as amended, and Section 21E of the Securities Exchange Act of 1934, as amended. These forward-looking statements may include but are not limited to: plans to develop data centers; future land acquisitions; construction plans and expense forecasts in connection therewith; plans regarding expense reduction; forecasted capital expenditures and descriptions thereof; projected growth in installed hash rate; projected energization timelines; forecasted energy demand; and the Company’s other plans, objectives, expectations, and intentions. Words such as “anticipates,” “believes,” “plans,” “expects,” “intends,” “will,” “potential,” “hope,” and similar expressions are intended to identify forward-looking statements; however, forward-looking statements may be made without such signifying expressions. Because such forward-looking statements reflect management’s current expectations, assumptions and estimates of future performance and economic conditions, they are subject to risks and uncertainties that may cause actual results to differ materially from those expressed or implied by such forward-looking statements. These risks and uncertainties include, but are not limited to: the feasibility of developing the Company’s power capacity for data center purposes, including artificial intelligence (“AI”)/high-performance computing (“HPC”) uses; the anticipated demand for large data centers; our ability to attract and retain qualified third-party partners and customers; future economic conditions, performance, or outlooks; future political conditions; the outcome of contingencies; potential acquisitions or divestitures; our ability to maximize the value of our full energy portfolio; the continued implementation of industrial-scale immersion-cooled Bitcoin mining hardware at our Bitcoin Mining facilities; the number and value of Bitcoin rewards and transaction fees we earn from our ongoing Bitcoin Mining operations; future self-mining hash rate capacity; timing of receipt and deployment of miners; expected cash flows or capital expenditures; our beliefs or expectations; activities, events or developments that we intend, expect, project, believe, or anticipate will or may occur in the future; unaudited estimates of bitcoin production; risks related to the success, schedule, cost and difficulty of integrating businesses we acquire; and our failure to realize anticipated efficiencies and strategic and financial benefits from our acquisitions. Further information regarding the factors identified by the Company’s management which they believe may cause actual results to differ materially from those expressed or implied by the forward-looking statements contained in this presentation may be found in the Company’s filings with the U.S. Securities and Exchange Commission (the “SEC”), including the risks, uncertainties and other factors discussed under the sections entitled “Risk Factors” and “Cautionary Note Regarding Forward-Looking Statements” of the Company’s Annual Report on Form 10-K for the fiscal year ended December 31, 2024, and the other filings the Company makes with the SEC, copies of which may be obtained from the SEC’s website, www.sec.gov. In addition to these risks and those identified by the Company’s management and disclosed in the Company’s filings with the SEC, other risks, factors and uncertainties not identified by management, or which management does not presently believe to be material to the Company, its business or prospects, may also materially affect the Company’s actual future results, including in ways adverse to the Company’s business. All forward-looking statements included in this presentation are made only as of the date of this presentation, and the Company disclaims any intention or obligation to update or revise any such forward-looking statements to reflect events or circumstances that subsequently occur, or of which the Company hereafter becomes aware, except as required by law. Persons reading this presentation are cautioned not to place undue reliance on such forward-looking statements. 2 Forward Looking Statements |
|
Table of Contents • Q3 2025 KEY HIGHLIGHTS • BUSINESS UPDATE: DATA CENTERS • RIOT POWER PORTFOLIO • Q3 2025 FINANCIAL UPDATE • RIOT’S CLOSING REMARKS I II III IV V |
|
Q3 2025 KEY HIGHLIGHTS I |
|
Riot Announces Initiation of Core & Shell Development at Corsicana Initiating Core & Shell development of first 2 buildings at Corsicana Data Center campus, representing 112 MW of critical IT load capacity Acquired 67-Acre Parcel Adjacent to Corsicana Site ▪ Acquired an additional 67 acres of land directly adjacent to the Corsicana Site 1 ▪ Simplifies and expedites planned development of full 1 GW of power capacity 1 Completed Campus Design for Corsicana Site Completed Basis of Design for Data Center Build Continued to Recruit Veteran Data Center Talent ▪ Completed the campus design for Corsicana Site ▪ Long-term plan to transform the entire site into a 1 GW utility-load data center campus ▪ Completed the basis of design for our standard data center build ▪ Allows us to advance engagement in technical outreach to various hyperscalers, neoclouds, and enterprise customers ▪ Continued to build out our team with veteran data center design, engineering and construction talent ▪ Team has completed 200+ projects and 4.8 GW of design and construction 3 2 4 Enabled By 5 Corsicana data center conceptual rendering 1. Final 3.8-acre parcel to assemble the 67-acre parcel referenced is under contract and scheduled to close November 18th, 2025. |
|
BUSINESS UPDATE: DATA CENTERS II |
|
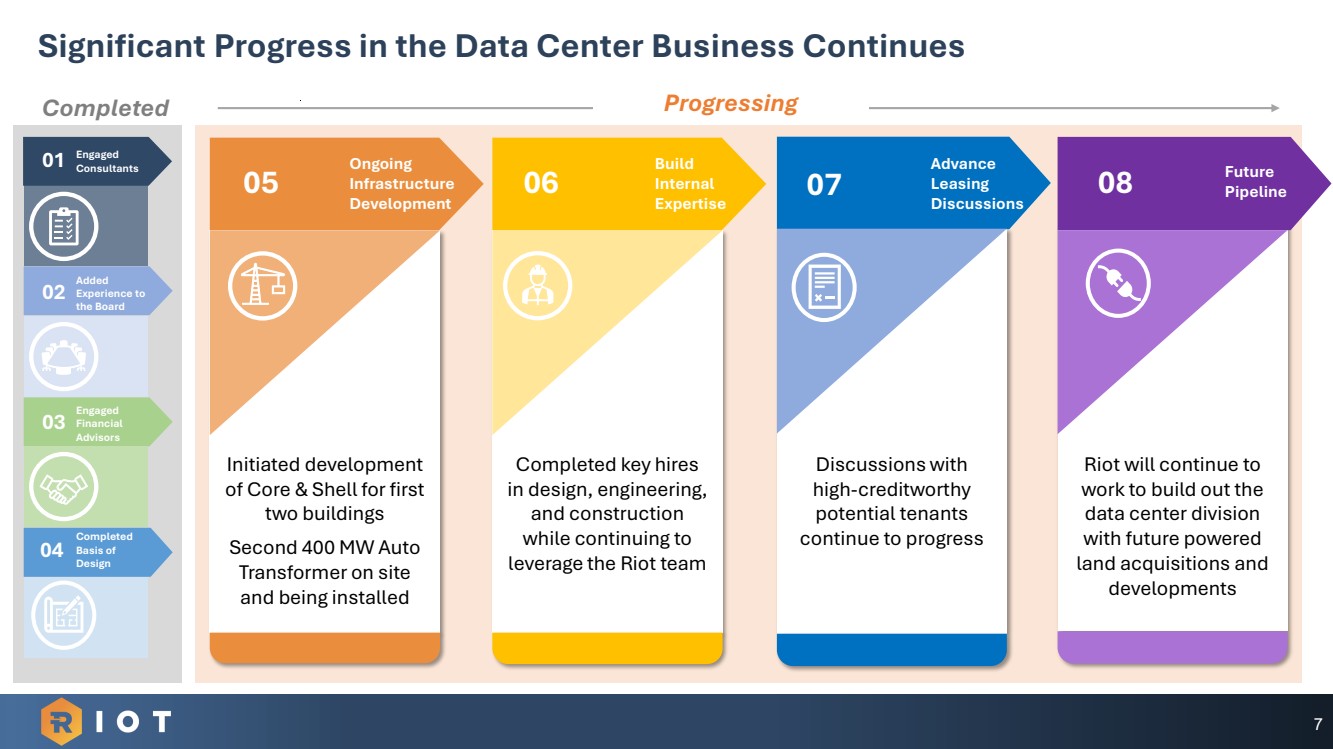
07 Advance Leasing Discussions Discussions with high-creditworthy potential tenants continue to progress Significant Progress in the Data Center Business Continues Completed 08 Future Pipeline Riot will continue to work to build out the data center division with future powered land acquisitions and developments Progressing 06 Build Internal Expertise 05 Ongoing Infrastructure Development 01 Engaged Consultants 02 Added Experience to the Board 03 Engaged Financial Advisors 04 Completed Basis of Design 7 Initiated development of Core & Shell for first two buildings Second 400 MW Auto Transformer on site and being installed Completed key hires in design, engineering, and construction while continuing to leverage the Riot team |
|
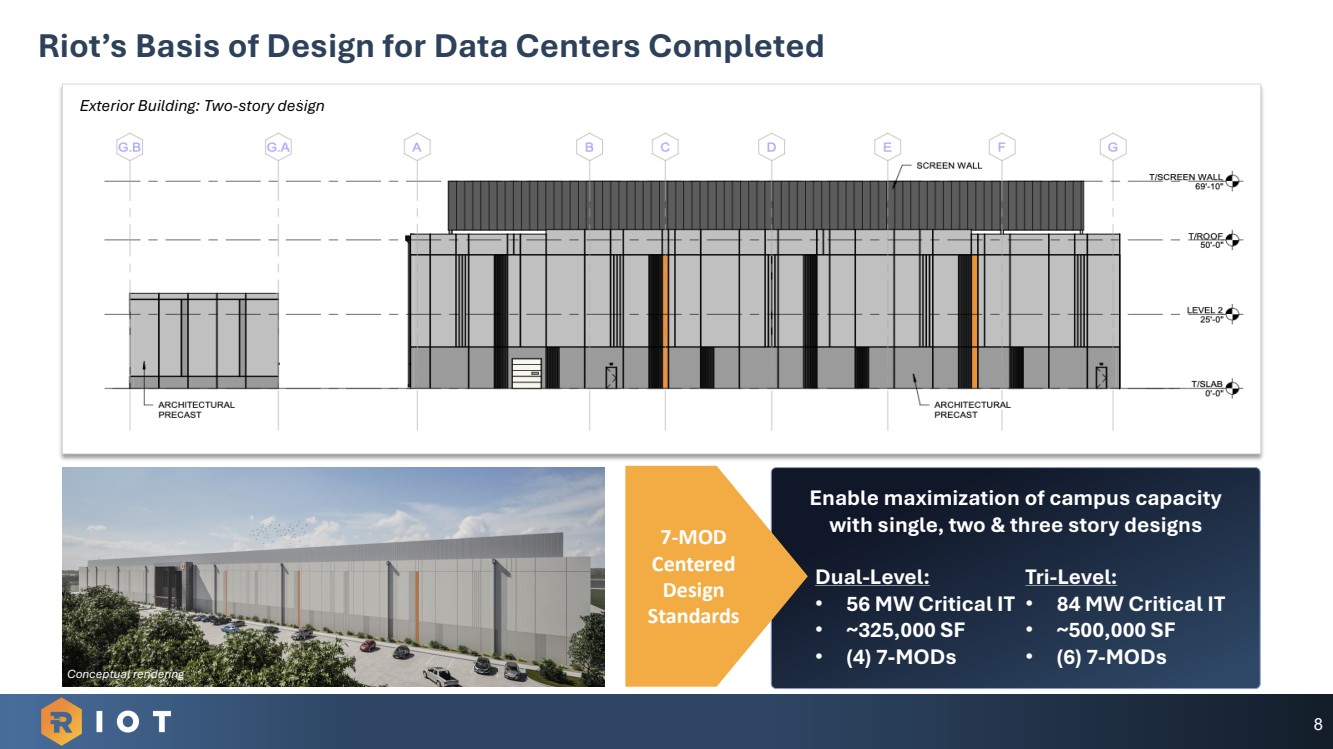
8 Riot’s Basis of Design for Data Centers Completed Exterior Building: Two-story design Enable maximization of campus capacity with single, two & three story designs Dual-Level: • 56 MW Critical IT • ~325,000 SF • (4) 7-MODs Tri-Level: • 84 MW Critical IT • ~500,000 SF • (6) 7-MODs Conceptual rendering 7-MOD Centered Design Standards |
|
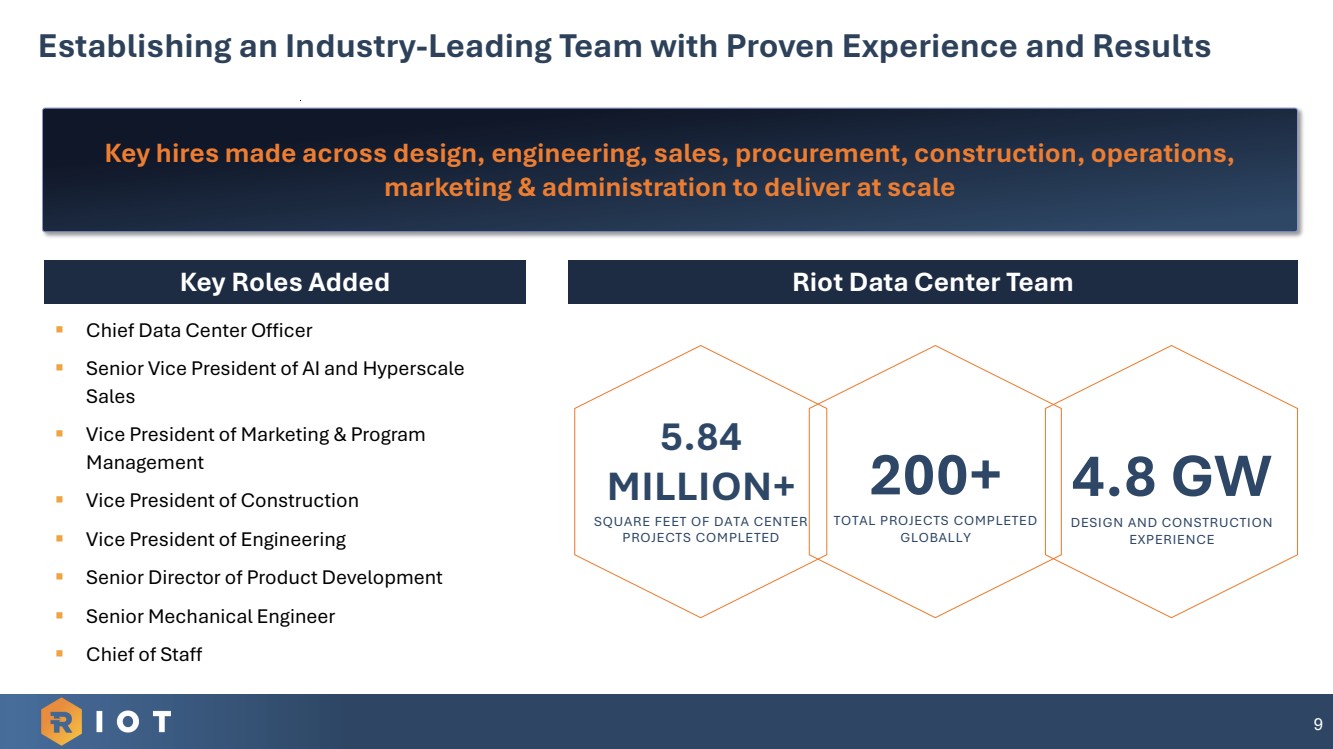
9 Establishing an Industry-Leading Team with Proven Experience and Results Key hires made across design, engineering, sales, procurement, construction, operations, marketing & administration to deliver at scale ▪ Chief Data Center Officer ▪ Senior Vice President of AI and Hyperscale Sales ▪ Vice President of Marketing & Program Management ▪ Vice President of Construction ▪ Vice President of Engineering ▪ Senior Director of Product Development ▪ Senior Mechanical Engineer ▪ Chief of Staff Key Roles Added 5.84 MILLION+ SQUARE FEET OF DATA CENTER PROJECTS COMPLETED 200+ TOTAL PROJECTS COMPLETED GLOBALLY 4.8 GW DESIGN AND CONSTRUCTION EXPERIENCE Riot Data Center Team |
|
10 Corsicana Site Now Ideally Positioned to Fully Utilize 1 GW of Power Corsicana Land Holdings Now Total 925 Acres Original 265 Acre Corsicana Site 593 Acre Parcel (Acquired in Q2 2025) 67 Acre Parcel 1. Final 3.8-acre parcel to assemble the 67-acre parcel referenced is under contract and scheduled to close November 18th, 2025. 67 Acre Parcel In September 2025, Riot entered a contract to acquire an additional 67-acre parcel contiguous with the existing 265-acre Corsicana site for $40 million1 ✓ No easements required to bring existing power and water to the parcel ✓ Located entirely outside of the flood plain ✓ Ensures full deployment of 1.0 GW of utility load on Riot-owned land Corsicana data center campus conceptual rendering |
|
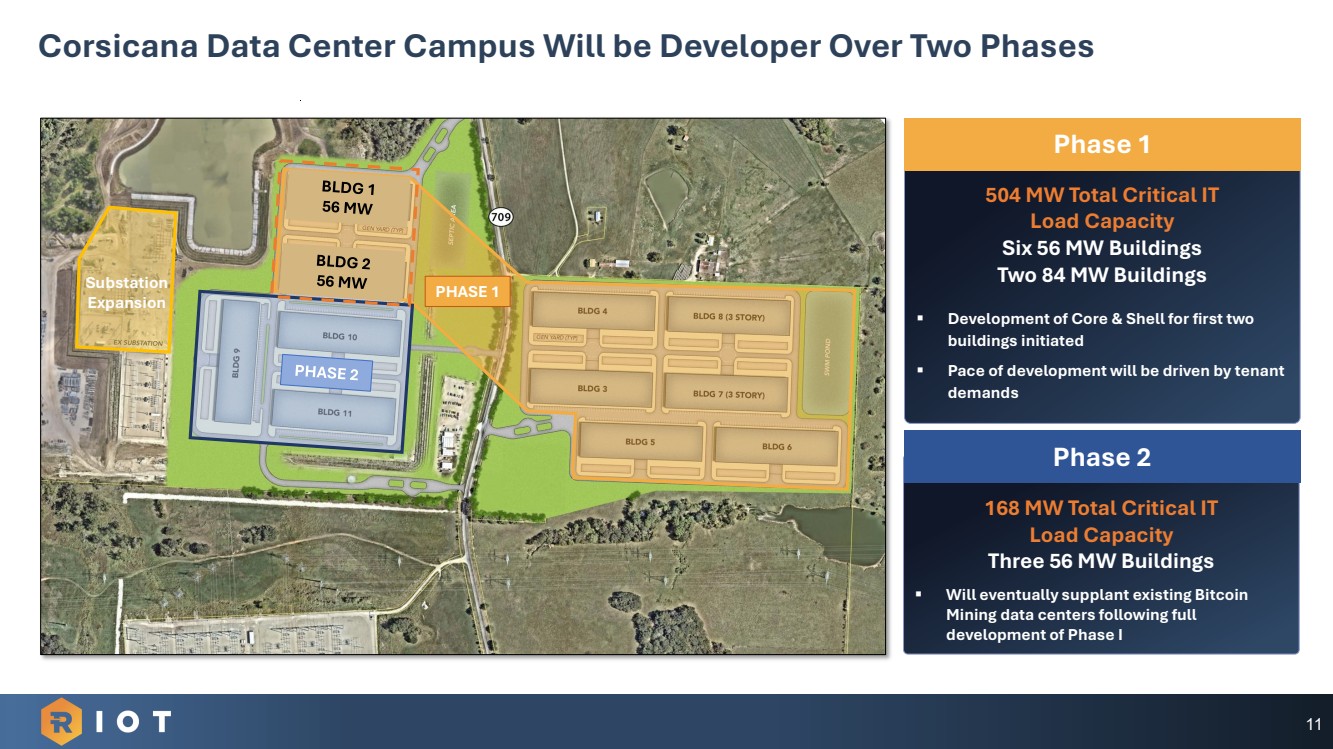
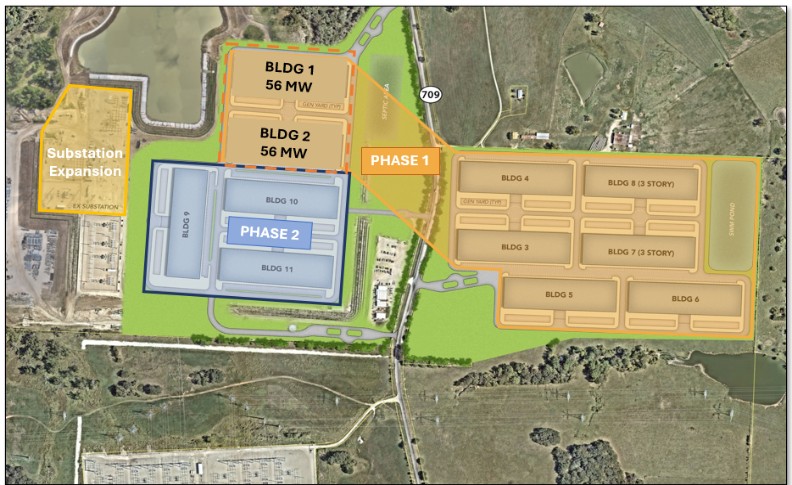
168 MW Total Critical IT Load Capacity Three 56 MW Buildings ▪ Will eventually supplant existing Bitcoin Mining data centers following full development of Phase I 504 MW Total Critical IT Load Capacity Six 56 MW Buildings Two 84 MW Buildings ▪ Development of Core & Shell for first two buildings initiated ▪ Pace of development will be driven by tenant demands 11 Corsicana Data Center Campus Will be Developer Over Two Phases PHASE 1 Phase 1 Phase 2 Substation Expansion |
|
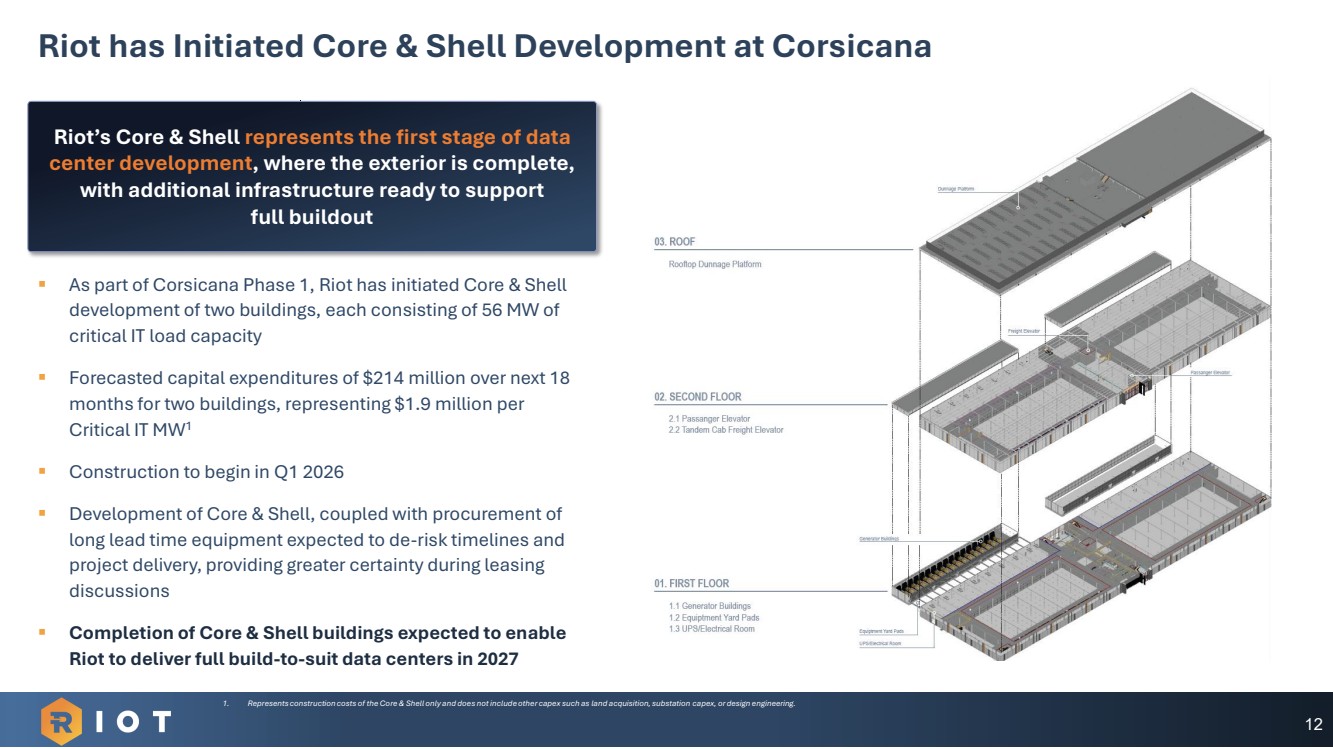
12 Riot has Initiated Core & Shell Development at Corsicana Riot’s Core & Shell represents the first stage of data center development, where the exterior is complete, with additional infrastructure ready to support full buildout ▪ As part of Corsicana Phase 1, Riot has initiated Core & Shell development of two buildings, each consisting of 56 MW of critical IT load capacity ▪ Forecasted capital expenditures of $214 million over next 18 months for two buildings, representing $1.9 million per Critical IT MW1 ▪ Construction to begin in Q1 2026 ▪ Development of Core & Shell, coupled with procurement of long lead time equipment expected to de-risk timelines and project delivery, providing greater certainty during leasing discussions ▪ Completion of Core & Shell buildings expected to enable Riot to deliver full build-to-suit data centers in 2027 1. Represents construction costs of the Core & Shell only and does not include other capex such as land acquisition, substation capex, or design engineering. |
|
RIOT POWER PORTFOLIO III |
|
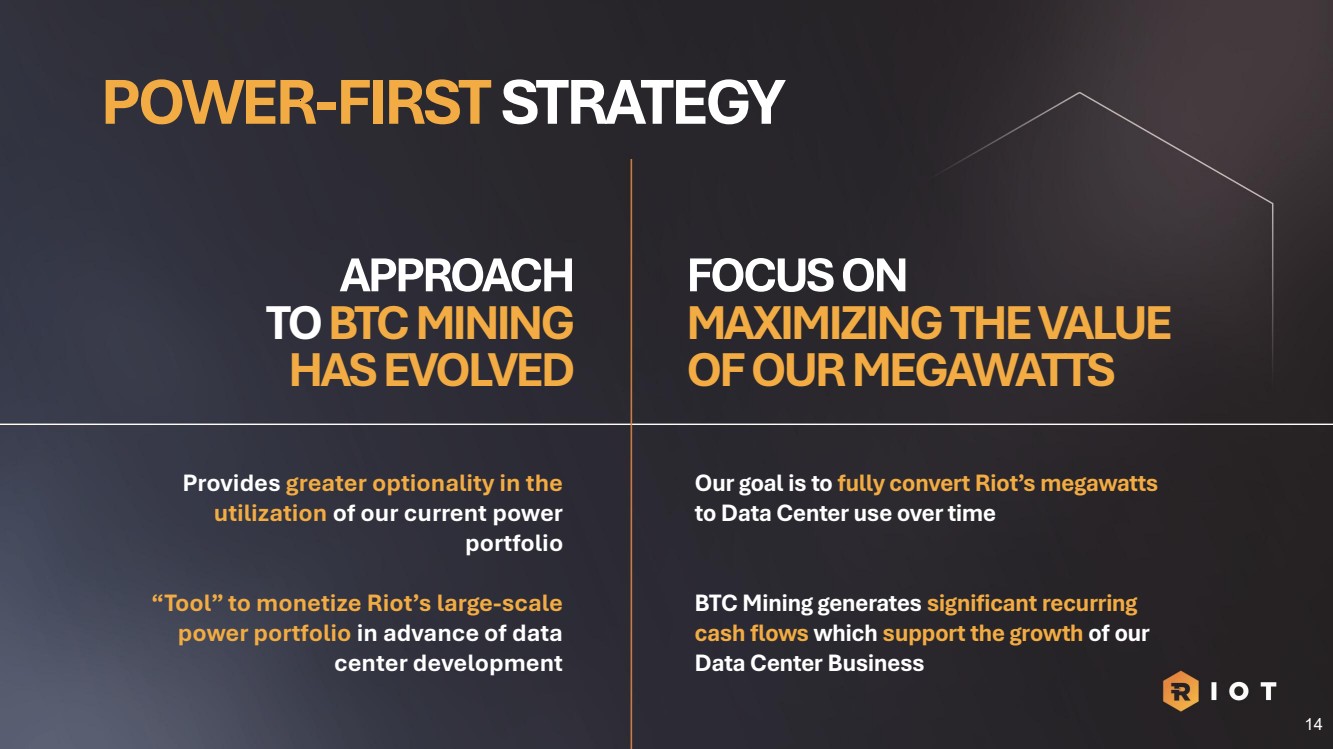
POWER-FIRST STRATEGY Provides greater optionality in the utilization of our current power portfolio Our goal is to fully convert Riot’s megawatts to Data Center use over time BTC Mining generates significant recurring cash flows which support the growth of our Data Center Business APPROACH TO BTC MINING HAS EVOLVED FOCUS ON MAXIMIZING THE VALUE OF OUR MEGAWATTS “Tool” to monetize Riot’s large-scale power portfolio in advance of data center development 14 |
|
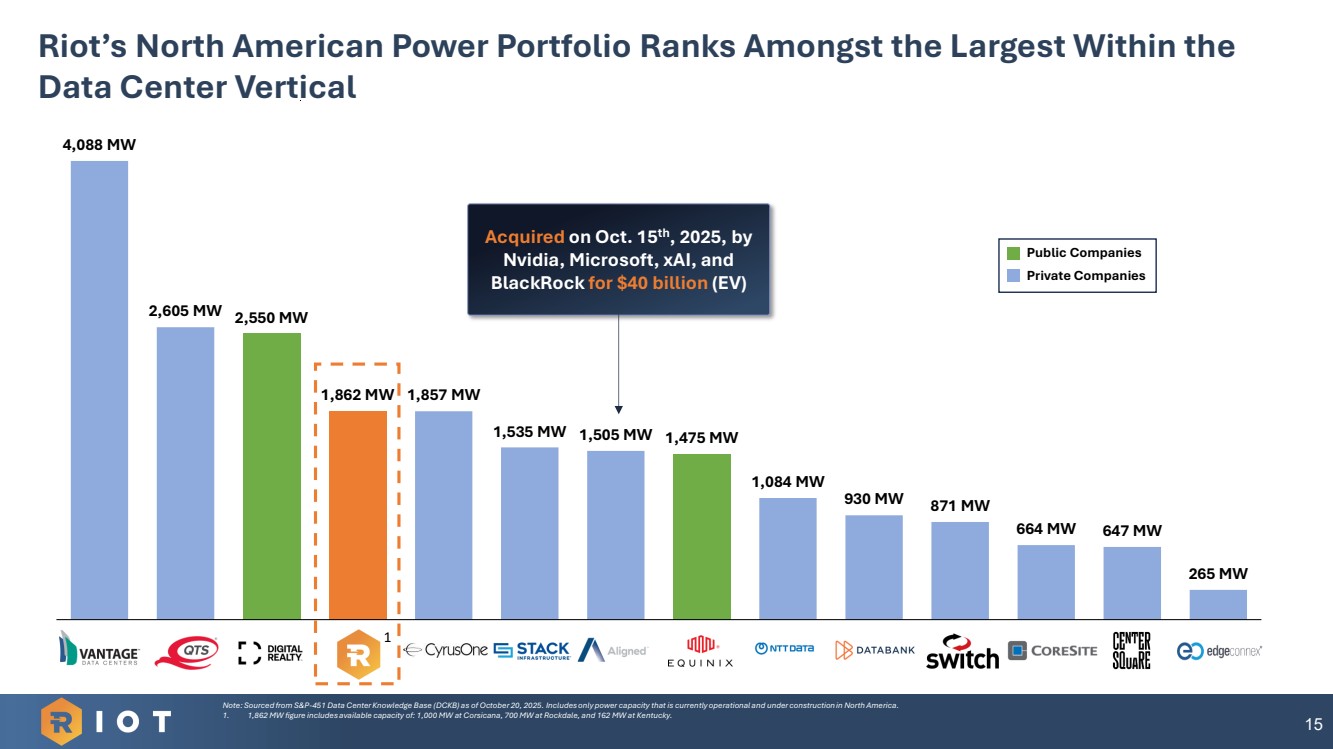
4,088 MW 2,605 MW 2,550 MW 1,862 MW 1,857 MW 1,535 MW 1,505 MW 1,475 MW 1,084 MW 930 MW 871 MW 664 MW 647 MW 265 MW Public Companies 15 Riot’s North American Power Portfolio Ranks Amongst the Largest Within the Data Center Vertical Note: Sourced from S&P-451 Data Center Knowledge Base (DCKB) as of October 20, 2025. Includes only power capacity that is currently operational and under construction in North America. 1. 1,862 MW figure includes available capacity of: 1,000 MW at Corsicana, 700 MW at Rockdale, and 162 MW at Kentucky. Acquired on Oct. 15th, 2025, by Nvidia, Microsoft, xAI, and BlackRock for $40 billion (EV) Public Companies Private Companies 1 |
|
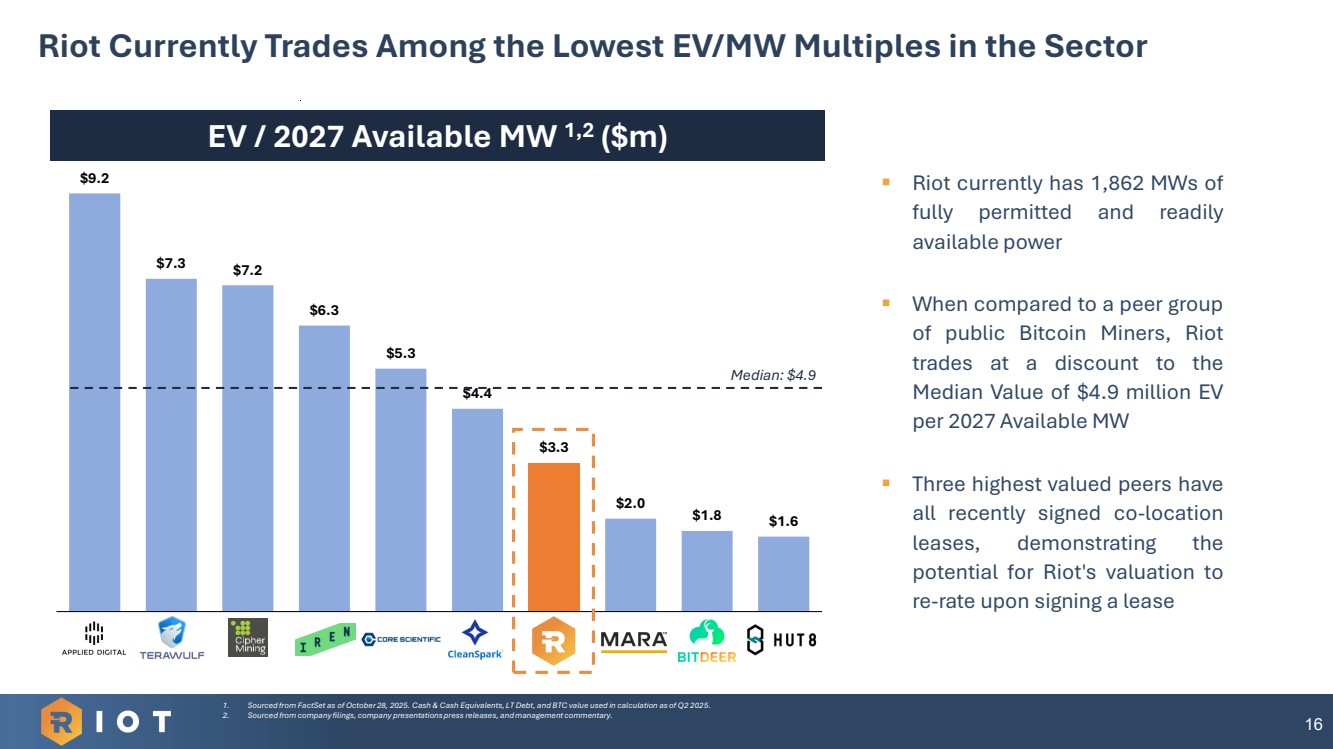
16 Riot Currently Trades Among the Lowest EV/MW Multiples in the Sector ▪ Riot currently has 1,862 MWs of fully permitted and readily available power ▪ When compared to a peer group of public Bitcoin Miners, Riot trades at a discount to the Median Value of $4.9 million EV per 2027 Available MW ▪ Three highest valued peers have all recently signed co-location leases, demonstrating the potential for Riot's valuation to re-rate upon signing a lease $9.2 $7.3 $7.2 $6.3 $5.3 $4.4 $3.3 $2.0 $1.8 $1.6 1 2 3 4 5 6 7 8 9 10 EV / 2027 Available MW 1,2 ($m) 1. Sourced from FactSet as of October 28, 2025. Cash & Cash Equivalents, LT Debt, and BTC value used in calculation as of Q2 2025. 2. Sourced from company filings, company presentations press releases, and management commentary. Median: $4.9 |
|
Q3 2025 FINANCIAL UPDATE IV |
|
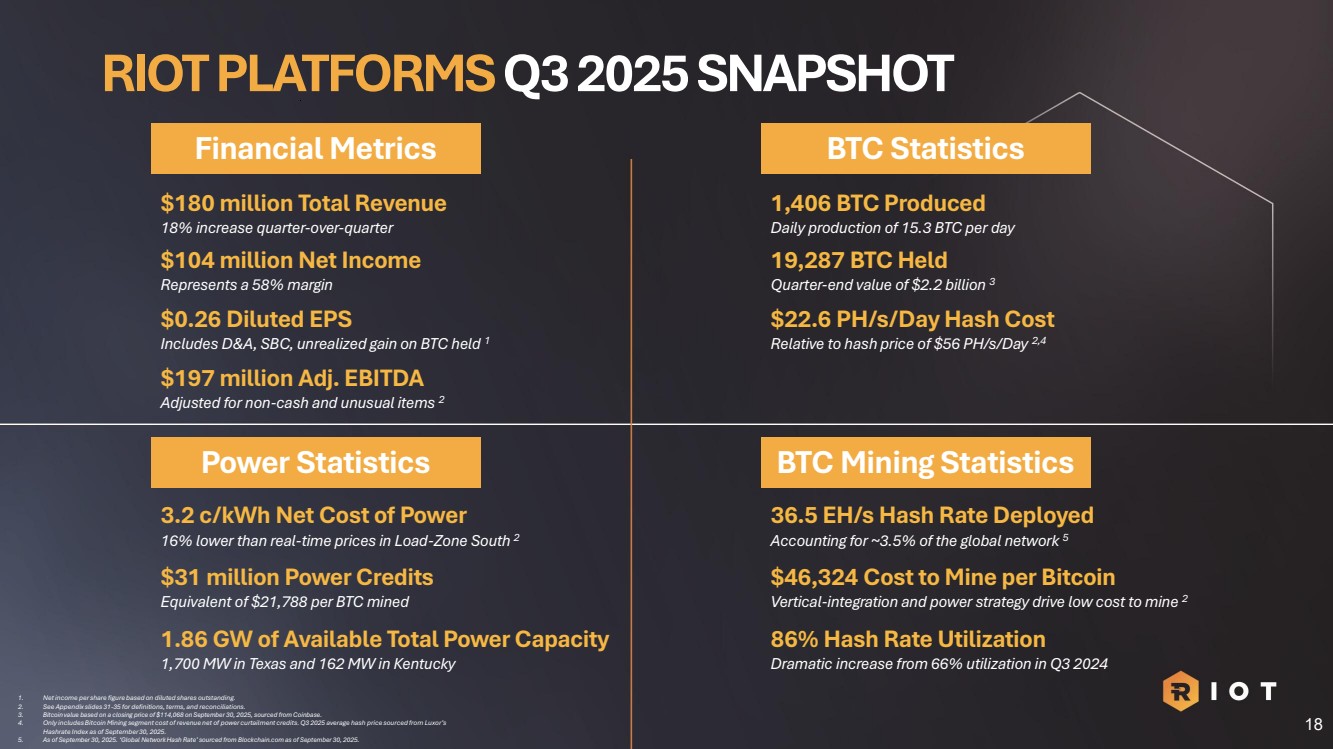
1,406 BTC Produced Daily production of 15.3 BTC per day RIOT PLATFORMS Q3 2025 SNAPSHOT 19,287 BTC Held Quarter-end value of $2.2 billion 3 $22.6 PH/s/Day Hash Cost Relative to hash price of $56 PH/s/Day 2,4 36.5 EH/s Hash Rate Deployed Accounting for ~3.5% of the global network 5 $46,324 Cost to Mine per Bitcoin Vertical-integration and power strategy drive low cost to mine 2 86% Hash Rate Utilization Dramatic increase from 66% utilization in Q3 2024 3.2 c/kWh Net Cost of Power 16% lower than real-time prices in Load-Zone South 2 $31 million Power Credits Equivalent of $21,788 per BTC mined $180 million Total Revenue 18% increase quarter-over-quarter $104 million Net Income Represents a 58% margin $0.26 Diluted EPS Includes D&A, SBC, unrealized gain on BTC held 1 $197 million Adj. EBITDA Adjusted for non-cash and unusual items 2 BTC Statistics Power Statistics BTC Mining Statistics Financial Metrics 1. Net income per share figure based on diluted shares outstanding. 2. See Appendix slides 31-35 for definitions, terms, and reconciliations. 3. Bitcoin value based on a closing price of $114,068 on September 30, 2025, sourced from Coinbase. 4. Only includes Bitcoin Mining segment cost of revenue net of power curtailment credits. Q3 2025 average hash price sourced from Luxor’s Hashrate Index as of September 30, 2025. 5. As of September 30, 2025. ‘Global Network Hash Rate’ sourced from Blockchain.com as of September 30, 2025. 1.86 GW of Available Total Power Capacity 1,700 MW in Texas and 162 MW in Kentucky 18 |
|
Period Q4 2024 Q1 2025 Q2 2025 Q3 2025 LTM Global Network Hash Rate (Avg.) 728 EH/s 801 EH/s 876 EH/s 948 EH/s 838 EH/s Riot Operating Hash Rate (Avg.) 26.1 EH/s 29.7 EH/s 30.2 EH/s 31.3 EH/s 29.3 EH/s Uptime / Utilization Rate (%) 83% 88% 87% 86% 86% Avg. BTC Price ($/BTC) $ 83,311 $ 93,385 $ 98,800 $ 114,361 $ 97,464 Avg. BTC Network Hash Price ($/PH/s/Day) $ 5 4 $ 5 4 $ 5 1 $ 5 6 $ 5 4 BTC Production (# BTC) 1,516 BTC 1,530 BTC 1,426 BTC 1,406 BTC 5,878 BTC BTC Mining Revenue ($m) $ 126.3 $ 142.9 $ 140.9 $ 160.8 $ 570.9 Total Direct Costs per BTC ($) $ 42,011 $ 43,808 $ 48,992 $ 46,324 $ 45,204 Gross Profit - Bitcoin Mining 2 ($m) $ 62.6 $ 75.9 $ 71.0 $ 95.7 $ 305.2 Gross Margin - Bitcoin Mining 2 (%) 50% 53% 50% 59% 53% Total Riot SG&A ($m) $ 81.1 $ 71.4 $ 75.9 $ 69.8 $ 298.3 Non-Cash Stock-Based Compensation ($m) $ (30.5) $ (29.6) $ (30.1) $ (32.9) $ (123.0) Total Riot Cash SG&A including: 2 ($m) $ 50.6 $ 41.9 $ 45.8 $ 37.0 $ 175.2 Litigation & Advisory Fees ($m) $ (24.1) $ (11.9) $ (16.1) $ (7.5) $ (59.6) Bitcoin Mining Driving Strong Cashflows Supporting the Data Center Platform1 Improvements in operational uptime and economies of scale continue to be realized 19 Note: ‘BTC Network Hash Price’ sourced from Hash Price Index by Luxor as of September 30, 2025. ‘Global Network Hash Rate’ sourced from Blockchain.com as of September 30, 2025. Average over each period sourced from Blockchain.com as of September 30, 2025. 1. Riot is currently selling its approximate monthly bitcoin production to generate cash flows. 2. See Appendix on slides 31-35 for definitions, terms, and reconciliations. |
|
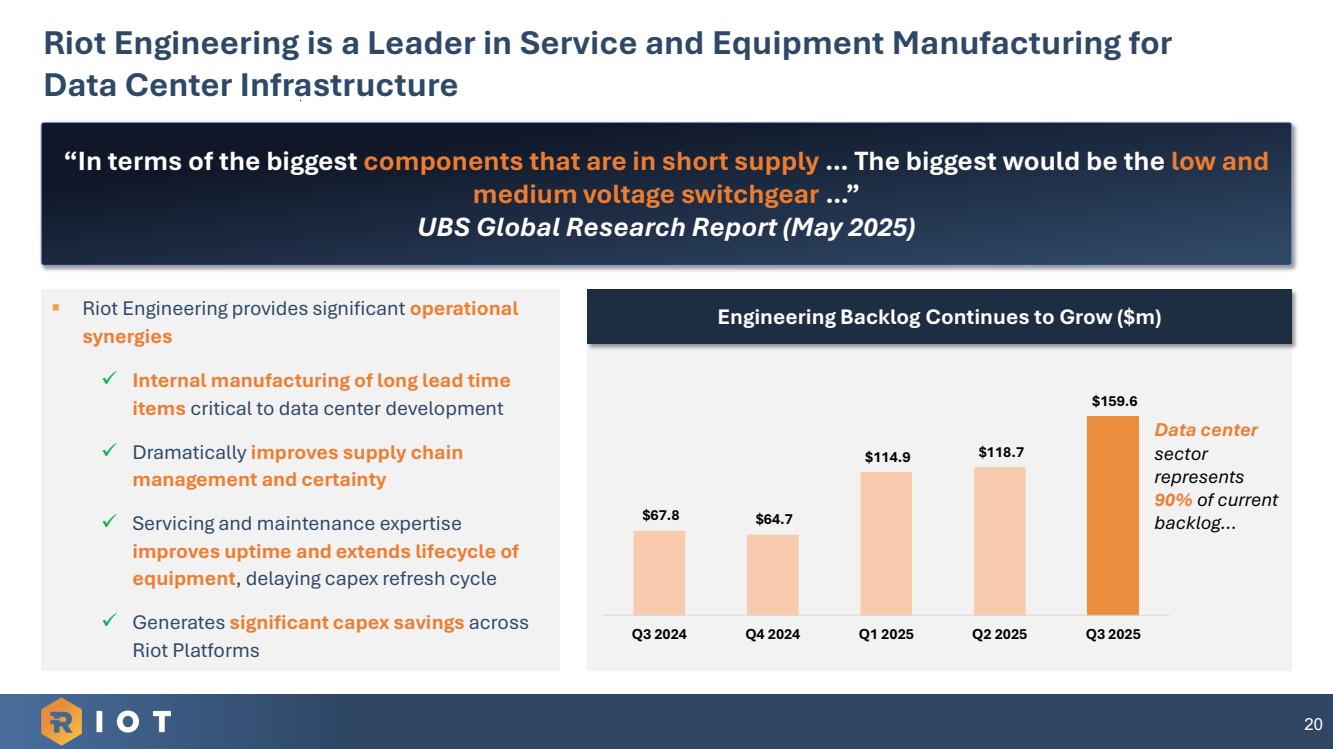
Riot Engineering is a Leader in Service and Equipment Manufacturing for Data Center Infrastructure 20 $67.8 $64.7 $114.9 $118.7 $159.6 Q3 2024 Q4 2024 Q1 2025 Q2 2025 Q3 2025 “In terms of the biggest components that are in short supply … The biggest would be the low and medium voltage switchgear …” UBS Global Research Report (May 2025) ▪ Riot Engineering provides significant operational synergies ✓ Internal manufacturing of long lead time items critical to data center development ✓ Dramatically improves supply chain management and certainty ✓ Servicing and maintenance expertise improves uptime and extends lifecycle of equipment, delaying capex refresh cycle ✓ Generates significant capex savings across Riot Platforms Engineering Backlog Continues to Grow ($m) Data center sector represents 90% of current backlog… |
|
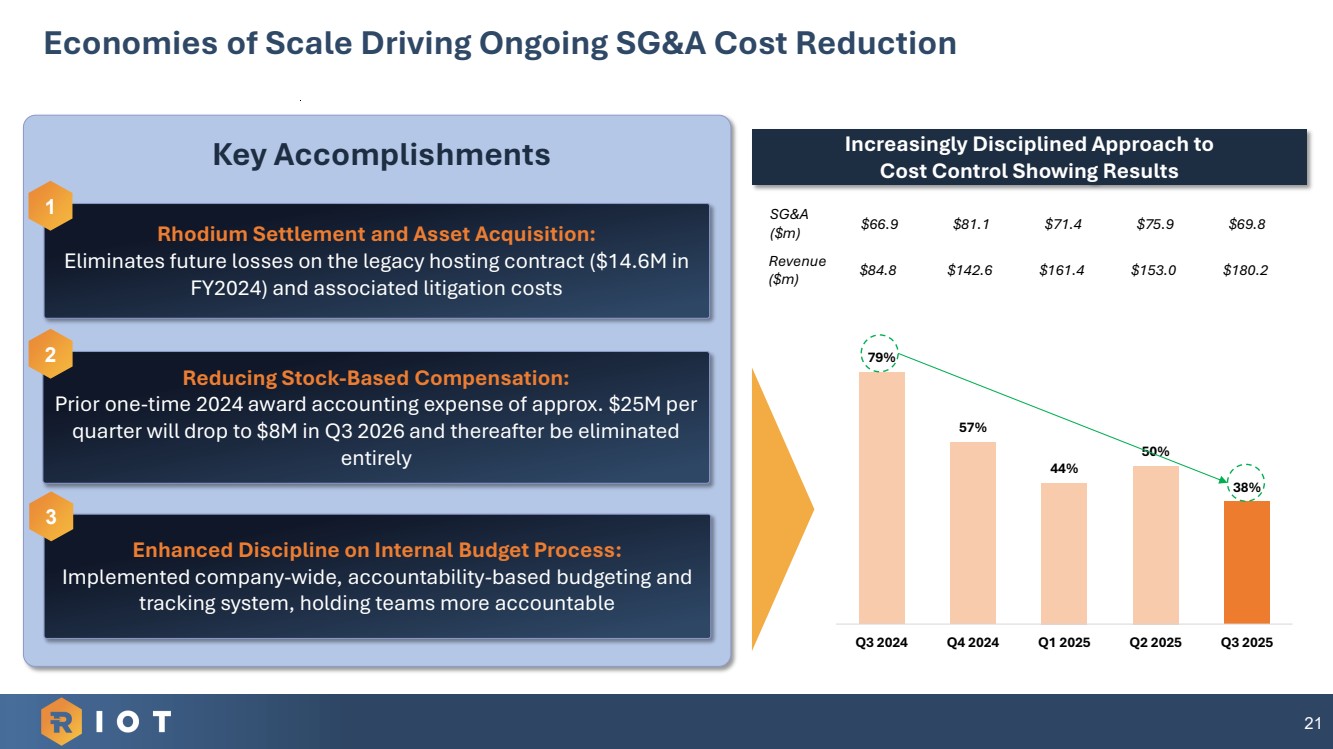
21 Economies of Scale Driving Ongoing SG&A Cost Reduction Rhodium Settlement and Asset Acquisition: Eliminates future losses on the legacy hosting contract ($14.6M in FY2024) and associated litigation costs 1 Reducing Stock-Based Compensation: Prior one-time 2024 award accounting expense of approx. $25M per quarter will drop to $8M in Q3 2026 and thereafter be eliminated entirely 2 Enhanced Discipline on Internal Budget Process: Implemented company-wide, accountability-based budgeting and tracking system, holding teams more accountable 3 79% 57% 44% 50% 38% Q3 2024 Q4 2024 Q1 2025 Q2 2025 Q3 2025 Increasingly Disciplined Approach to Cost Control Showing Results Key Accomplishments $66.9 $81.1 $71.4 $75.9 $69.8 SG&A ($m) $84.8 $142.6 $161.4 $153.0 $180.2 Revenue ($m) |
|
V RIOT CLOSING REMARKS |
|
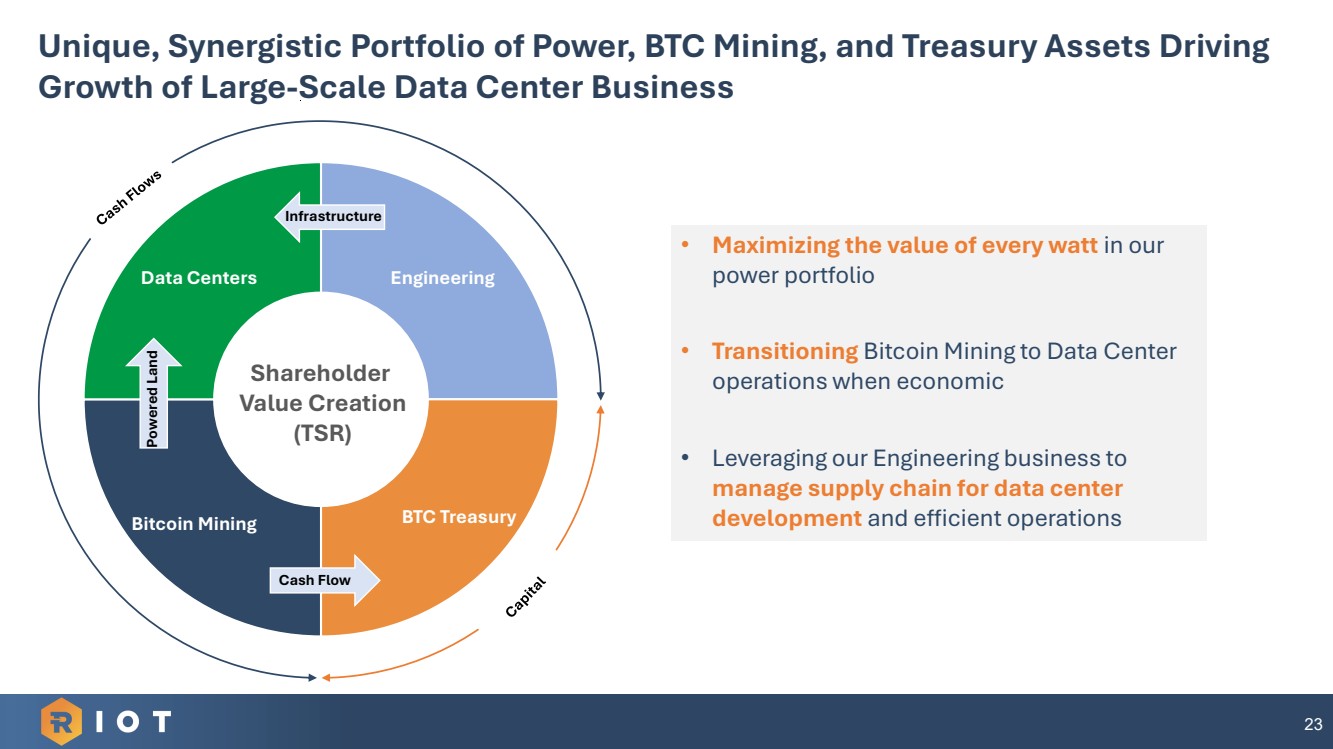
23 Unique, Synergistic Portfolio of Power, BTC Mining, and Treasury Assets Driving Growth of Large-Scale Data Center Business Engineering BTC Treasury Bitcoin Mining Data Centers Shareholder Value Creation (TSR) • Maximizing the value of every watt in our power portfolio • Transitioning Bitcoin Mining to Data Center operations when economic • Leveraging our Engineering business to manage supply chain for data center development and efficient operations Cash Flow Powered Land Infrastructure |
|
APPENDIX Q3 OPERATIONAL DATA |
|
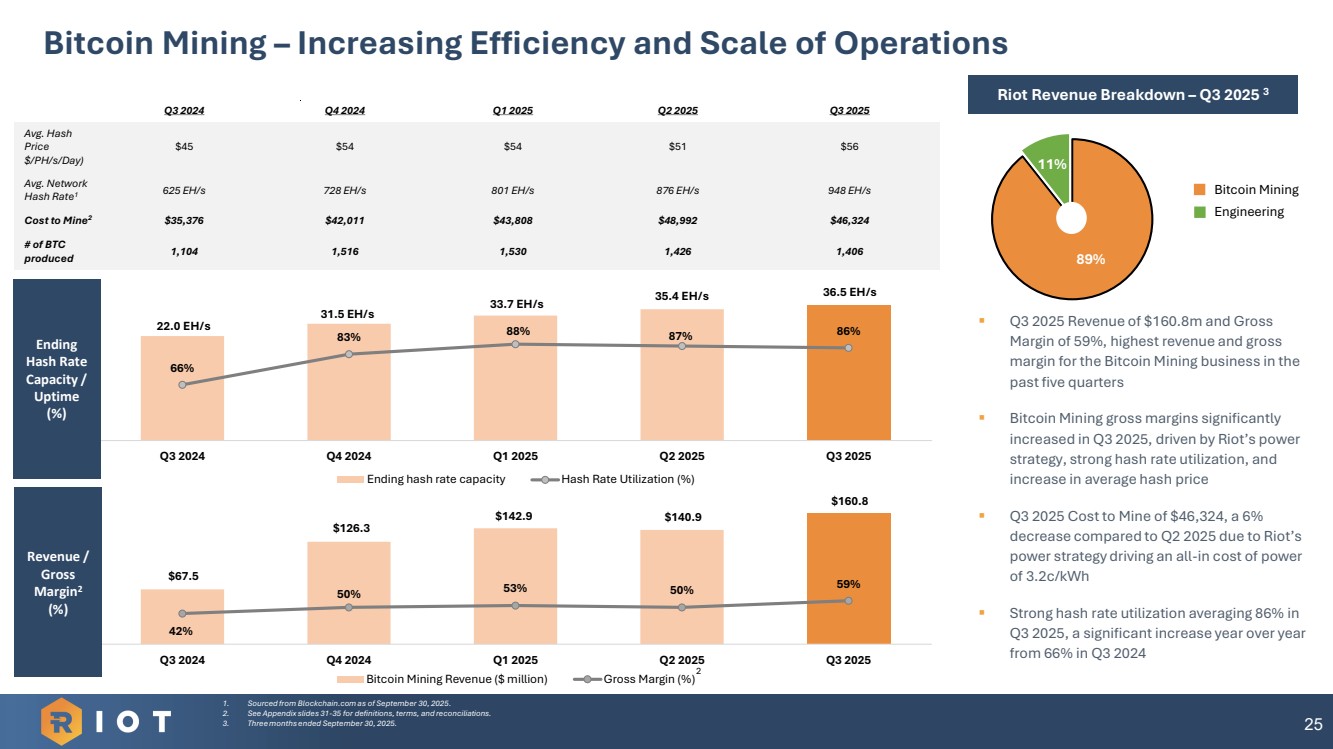
22.0 EH/s 31.5 EH/s 33.7 EH/s 35.4 EH/s 36.5 EH/s 66% 83% 88% 87% 86% 30% 40% 50% 60% 70% 80% 90% 100% 110% 120% -$3 m $2 m $7 m $12 m $17 m $22 m $27 m $32 m $37 m $42 m Q3 2024 Q4 2024 Q1 2025 Q2 2025 Q3 2025 Ending hash rate capacity Hash Rate Utilization (%) $67.5 $126.3 $142.9 $140.9 $160.8 42% 50% 53% 50% 59% 0% 50% 100% 150% 200% $0 m $20 m $40 m $60 m $80 m $100 m $120 m $140 m $160 m $180 m Q3 2024 Q4 2024 Q1 2025 Q2 2025 Q3 2025 Bitcoin Mining Revenue ($ million) Gross Margin (%) Bitcoin Mining – Increasing Efficiency and Scale of Operations 25 ▪ Q3 2025 Revenue of $160.8m and Gross Margin of 59%, highest revenue and gross margin for the Bitcoin Mining business in the past five quarters ▪ Bitcoin Mining gross margins significantly increased in Q3 2025, driven by Riot’s power strategy, strong hash rate utilization, and increase in average hash price ▪ Q3 2025 Cost to Mine of $46,324, a 6% decrease compared to Q2 2025 due to Riot’s power strategy driving an all-in cost of power of 3.2c/kWh ▪ Strong hash rate utilization averaging 86% in Q3 2025, a significant increase year over year from 66% in Q3 2024 1. Sourced from Blockchain.com as of September 30, 2025. 2. See Appendix slides 31-35 for definitions, terms, and reconciliations. 3. Three months ended September 30, 2025. Q3 2024 Q4 2024 Q1 2025 Q2 2025 Q3 2025 Avg. Hash Price $/PH/s/Day) $45 $54 $54 $51 $56 Avg. Network Hash Rate1 625 EH/s 728 EH/s 801 EH/s 876 EH/s 948 EH/s Cost to Mine2 $35,376 $42,011 $43,808 $48,992 $46,324 # of BTC produced 1,104 1,516 1,530 1,426 1,406 Riot Revenue Breakdown – Q3 2025 3 Ending Hash Rate Capacity / Uptime (%) Revenue / Gross Margin2 (%) 89% 11% 2 Bitcoin Mining Engineering |
|
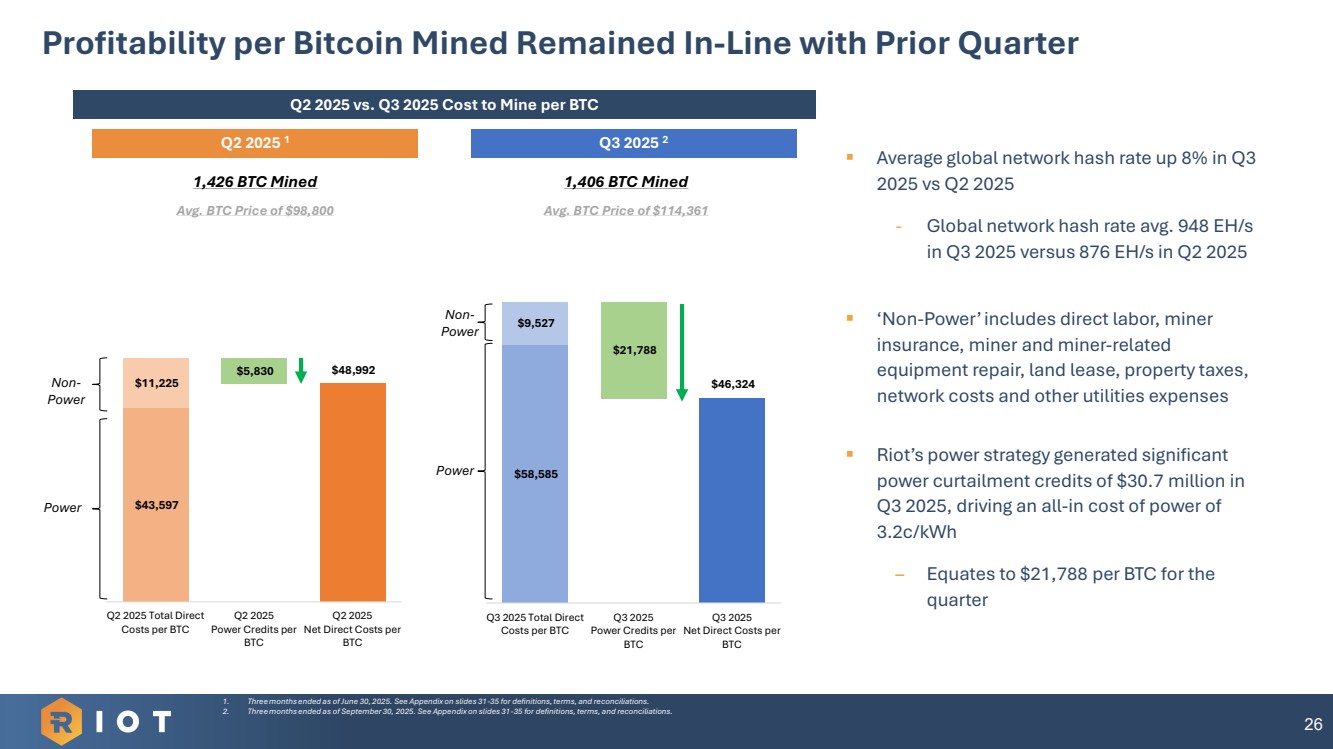
26 Profitability per Bitcoin Mined Remained In-Line with Prior Quarter Q2 2025 vs. Q3 2025 Cost to Mine per BTC 1. Three months ended as of June 30, 2025. See Appendix on slides 31-35 for definitions, terms, and reconciliations. 2. Three months ended as of September 30, 2025. See Appendix on slides 31-35 for definitions, terms, and reconciliations. ▪ Average global network hash rate up 8% in Q3 2025 vs Q2 2025 - Global network hash rate avg. 948 EH/s in Q3 2025 versus 876 EH/s in Q2 2025 ▪ ‘Non-Power’ includes direct labor, miner insurance, miner and miner-related equipment repair, land lease, property taxes, network costs and other utilities expenses ▪ Riot’s power strategy generated significant power curtailment credits of $30.7 million in Q3 2025, driving an all-in cost of power of 3.2c/kWh – Equates to $21,788 per BTC for the quarter Q2 2025 1 1,426 BTC Mined Avg. BTC Price of $98,800 Q3 2025 2 1,406 BTC Mined Avg. BTC Price of $114,361 $43,597 $11,225 $5,830 $48,992 Q2 2025 Total Direct Costs per BTC Q2 2025 Power Credits per BTC Q2 2025 Net Direct Costs per BTC $58,585 $9,527 $21,788 $46,324 Q3 2025 Total Direct Costs per BTC Q3 2025 Power Credits per BTC Q3 2025 Net Direct Costs per BTC Power Non-Power Power Non-Power |
|
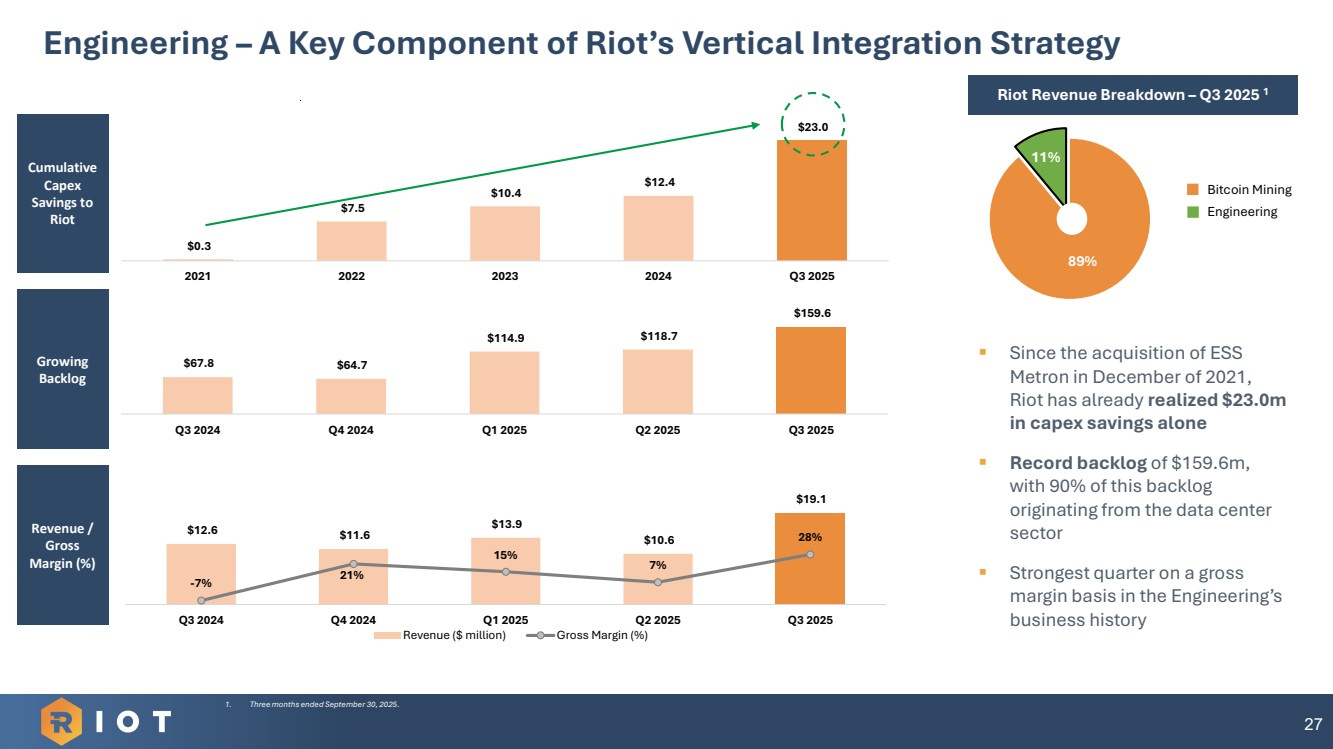
Engineering – A Key Component of Riot’s Vertical Integration Strategy 27 ▪ Since the acquisition of ESS Metron in December of 2021, Riot has already realized $23.0m in capex savings alone ▪ Record backlog of $159.6m, with 90% of this backlog originating from the data center sector ▪ Strongest quarter on a gross margin basis in the Engineering’s business history Riot Revenue Breakdown – Q4 20231 1. Three months ended September 30, 2025. Cumulative Capex Savings to Riot Riot Revenue Breakdown – Q3 2025 1 89% 11% Bitcoin Mining Engineering Growing Backlog Revenue / Gross Margin (%) $67.8 $64.7 $114.9 $118.7 $159.6 Q3 2024 Q4 2024 Q1 2025 Q2 2025 Q3 2025 $0.3 $7.5 $10.4 $12.4 $23.0 2021 2022 2023 2024 Q3 2025 $12.6 $11.6 $13.9 $10.6 $19.1 -7% 21% 15% 7% 28% Q3 2024 Q4 2024 Q1 2025 Q2 2025 Q3 2025 Revenue ($ million) Gross Margin (%) |
|
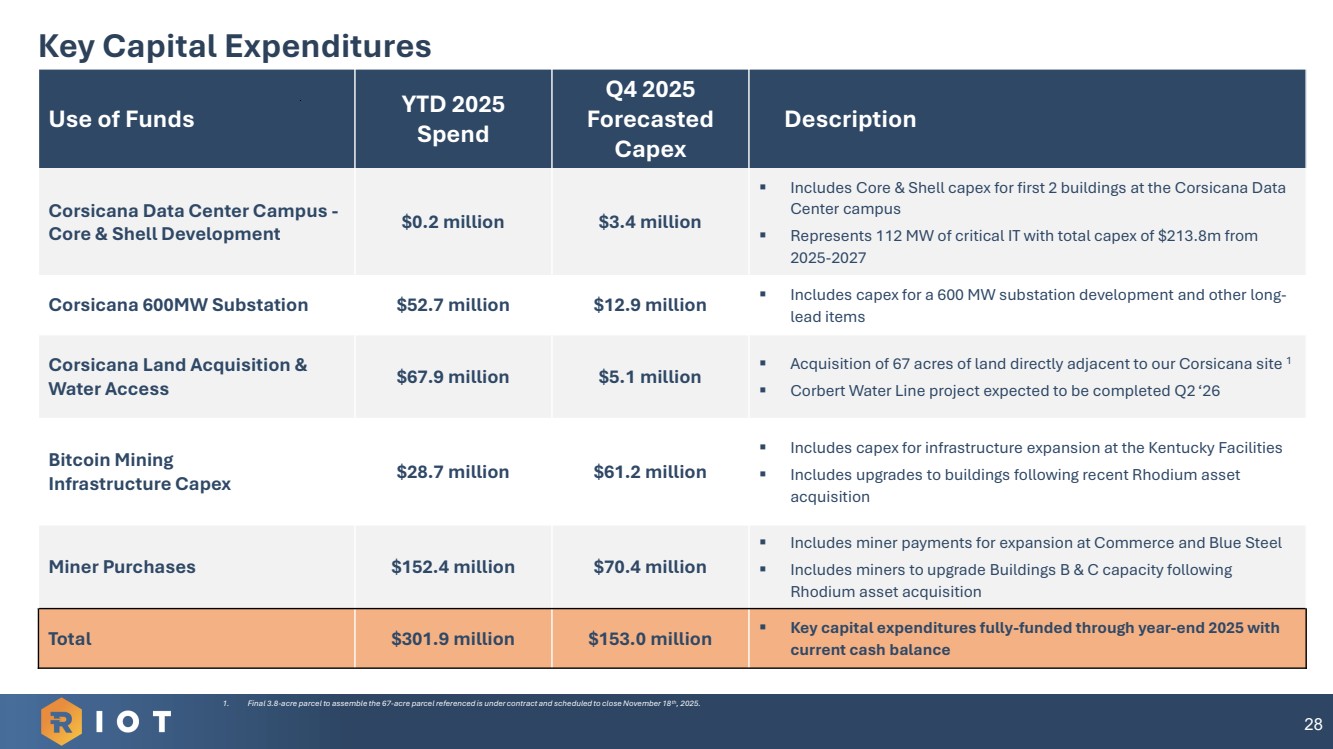
Key Capital Expenditures Use of Funds YTD 2025 Spend Q4 2025 Forecasted Capex Description Corsicana Data Center Campus - Core & Shell Development $0.2 million $3.4 million ▪ Includes Core & Shell capex for first 2 buildings at the Corsicana Data Center campus ▪ Represents 112 MW of critical IT with total capex of $213.8m from 2025-2027 Corsicana 600MW Substation $52.7 million $12.9 million ▪ Includes capex for a 600 MW substation development and other long-lead items Corsicana Land Acquisition & Water Access $67.9 million $5.1 million ▪ Acquisition of 67 acres of land directly adjacent to our Corsicana site 1 ▪ Corbert Water Line project expected to be completed Q2 ‘26 Bitcoin Mining Infrastructure Capex $28.7 million $61.2 million ▪ Includes capex for infrastructure expansion at the Kentucky Facilities ▪ Includes upgrades to buildings following recent Rhodium asset acquisition Miner Purchases $152.4 million $70.4 million ▪ Includes miner payments for expansion at Commerce and Blue Steel ▪ Includes miners to upgrade Buildings B & C capacity following Rhodium asset acquisition Total $301.9 million $153.0 million ▪ Key capital expenditures fully-funded through year-end 2025 with current cash balance 28 1. Final 3.8-acre parcel to assemble the 67-acre parcel referenced is under contract and scheduled to close November 18th, 2025. |
|
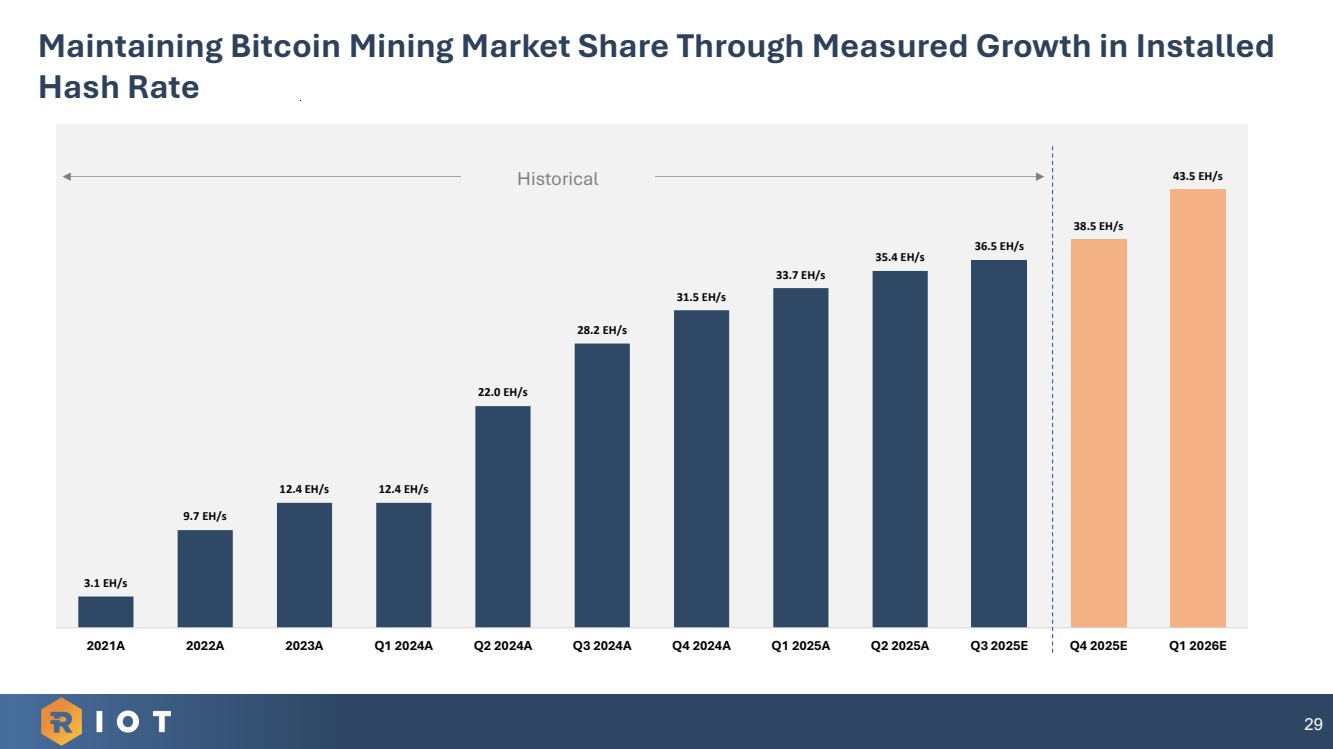
29 Maintaining Bitcoin Mining Market Share Through Measured Growth in Installed Hash Rate 3.1 EH/s 9.7 EH/s 12.4 EH/s 12.4 EH/s 22.0 EH/s 28.2 EH/s 31.5 EH/s 33.7 EH/s 35.4 EH/s 36.5 EH/s 38.5 EH/s 43.5 EH/s 2021A 2022A 2023A Q1 2024A Q2 2024A Q3 2024A Q4 2024A Q1 2025A Q2 2025A Q3 2025E Q4 2025E Q1 2026E Historical |
|
APPENDIX Q3 FINANCIAL DATA |
|
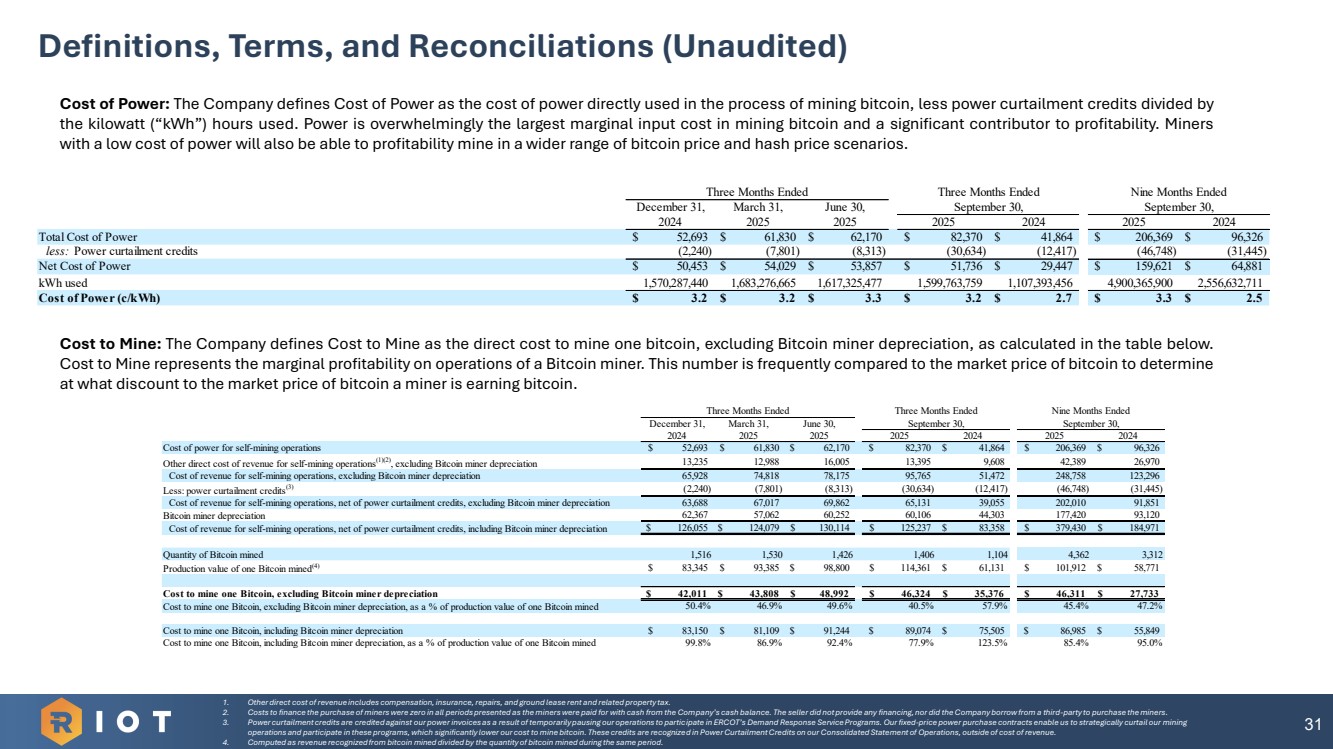
31 Definitions, Terms, and Reconciliations (Unaudited) 1. Other direct cost of revenue includes compensation, insurance, repairs, and ground lease rent and related property tax. 2. Costs to finance the purchase of miners were zero in all periods presented as the miners were paid for with cash from the Company’s cash balance. The seller did not provide any financing, nor did the Company borrow from a third-party to purchase the miners. 3. Power curtailment credits are credited against our power invoices as a result of temporarily pausing our operations to participate in ERCOT’s Demand Response Service Programs. Our fixed-price power purchase contracts enable us to strategically curtail our mining operations and participate in these programs, which significantly lower our cost to mine bitcoin. These credits are recognized in Power Curtailment Credits on our Consolidated Statement of Operations, outside of cost of revenue. 4. Computed as revenue recognized from bitcoin mined divided by the quantity of bitcoin mined during the same period. Cost of Power: The Company defines Cost of Power as the cost of power directly used in the process of mining bitcoin, less power curtailment credits divided by the kilowatt (“kWh”) hours used. Power is overwhelmingly the largest marginal input cost in mining bitcoin and a significant contributor to profitability. Miners with a low cost of power will also be able to profitability mine in a wider range of bitcoin price and hash price scenarios. Cost to Mine: The Company defines Cost to Mine as the direct cost to mine one bitcoin, excluding Bitcoin miner depreciation, as calculated in the table below. Cost to Mine represents the marginal profitability on operations of a Bitcoin miner. This number is frequently compared to the market price of bitcoin to determine at what discount to the market price of bitcoin a miner is earning bitcoin. December 31, March 31, June 30, 2024 2025 2025 2025 2024 2025 2024 Total Cost of Power $ 52,693 $ 61,830 $ 62,170 $ 82,370 $ 41,864 $ 206,369 $ 96,326 less: Power curtailment credits (2,240) (7,801) (8,313) (30,634) (12,417) (46,748) (31,445) Net Cost of Power $ 50,453 $ 54,029 $ 53,857 $ 51,736 $ 29,447 $ 159,621 $ 64,881 kWh used 1,570,287,440 1,683,276,665 1,617,325,477 1,599,763,759 1,107,393,456 4,900,365,900 2,556,632,711 Cost of Power (c/kWh) $ 3.2 $ 3.2 $ 3.3 $ 3.2 $ 2.7 $ 3.3 $ 2.5 Three Months Ended September 30, Three Months Ended Nine Months Ended September 30, December 31, March 31, June 30, 2024 2025 2025 2025 2024 2025 2024 Cost of power for self-mining operations $ 52,693 $ 61,830 $ 62,170 $ 82,370 $ 41,864 $ 206,369 $ 96,326 Other direct cost of revenue for self-mining operations(1)(2), excluding Bitcoin miner depreciation 13,235 12,988 16,005 13,395 9,608 42,389 26,970 Cost of revenue for self-mining operations, excluding Bitcoin miner depreciation 65,928 74,818 78,175 95,765 51,472 248,758 123,296 Less: power curtailment credits(3) (2,240) (7,801) (8,313) (30,634) (12,417) (46,748) (31,445) Cost of revenue for self-mining operations, net of power curtailment credits, excluding Bitcoin miner depreciation 63,688 67,017 69,862 65,131 39,055 202,010 91,851 Bitcoin miner depreciation 62,367 57,062 60,252 60,106 44,303 177,420 93,120 Cost of revenue for self-mining operations, net of power curtailment credits, including Bitcoin miner depreciation $ 126,055 $ 124,079 $ 130,114 $ 125,237 $ 83,358 $ 379,430 $ 184,971 Quantity of Bitcoin mined 1,516 1,530 1,426 1,406 1,104 4,362 3,312 Production value of one Bitcoin mined(4) $ 83,345 $ 93,385 $ 98,800 $ 114,361 $ 61,131 $ 101,912 $ 58,771 Cost to mine one Bitcoin, excluding Bitcoin miner depreciation $ 42,011 $ 43,808 $ 48,992 $ 46,324 $ 35,376 $ 46,311 $ 27,733 Cost to mine one Bitcoin, excluding Bitcoin miner depreciation, as a % of production value of one Bitcoin mined 50.4% 46.9% 49.6% 40.5% 57.9% 45.4% 47.2% Cost to mine one Bitcoin, including Bitcoin miner depreciation $ 83,150 $ 81,109 $ 91,244 $ 89,074 $ 75,505 $ 86,985 $ 55,849 Cost to mine one Bitcoin, including Bitcoin miner depreciation, as a % of production value of one Bitcoin mined 99.8% 86.9% 92.4% 77.9% 123.5% 85.4% 95.0% Three Months Ended September 30, Three Months Ended September 30, Nine Months Ended |
|
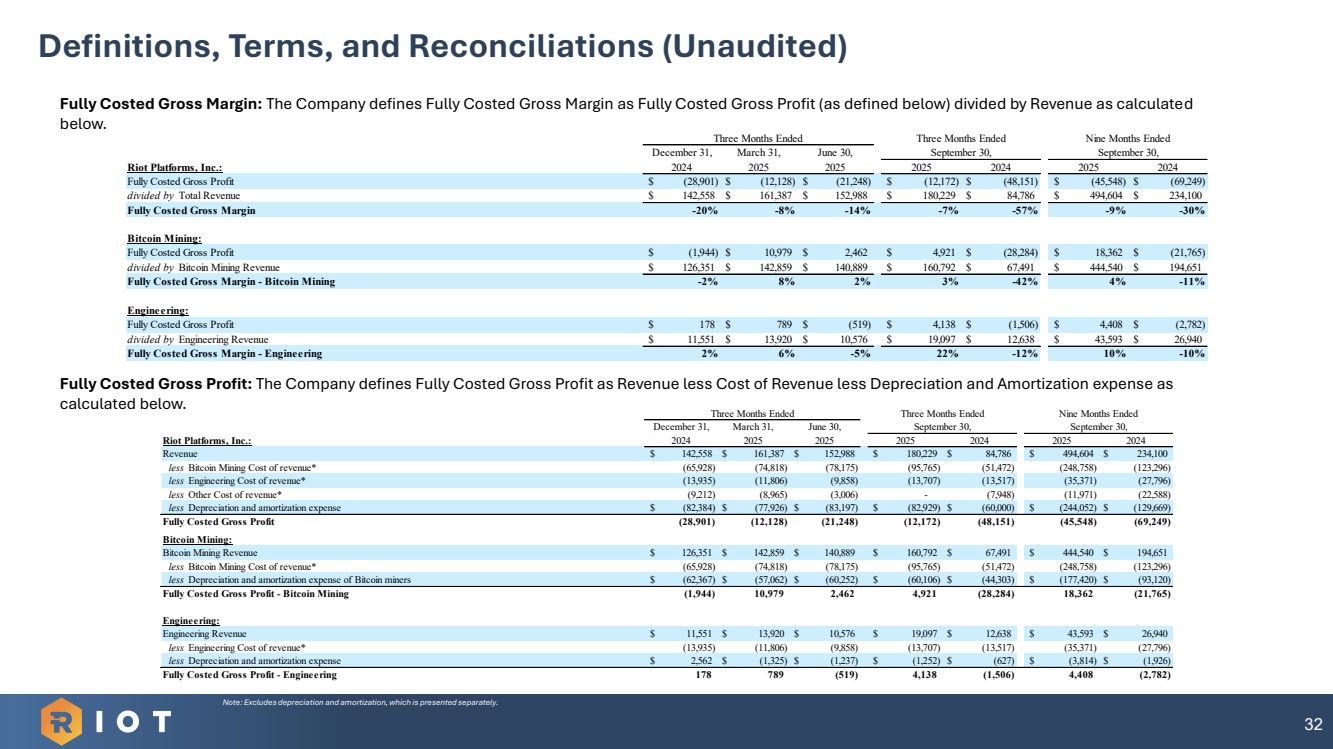
Fully Costed Gross Margin: The Company defines Fully Costed Gross Margin as Fully Costed Gross Profit (as defined below) divided by Revenue as calculated below. Fully Costed Gross Profit: The Company defines Fully Costed Gross Profit as Revenue less Cost of Revenue less Depreciation and Amortization expense as calculated below. 32 Definitions, Terms, and Reconciliations (Unaudited) Note: Excludes depreciation and amortization, which is presented separately. December 31, March 31, June 30, Riot Platforms, Inc.: 2024 2025 2025 2025 2024 2025 2024 Fully Costed Gross Profit $ (28,901) $ (12,128) $ (21,248) $ (12,172) $ (48,151) $ (45,548) $ (69,249) divided by Total Revenue $ 142,558 $ 161,387 $ 152,988 $ 180,229 $ 84,786 $ 494,604 $ 234,100 Fully Costed Gross Margin -20% -8% -14% -7% -57% -9% -30% Bitcoin Mining: Fully Costed Gross Profit $ (1,944) $ 10,979 $ 2,462 $ 4,921 $ (28,284) $ 18,362 $ (21,765) divided by Bitcoin Mining Revenue $ 126,351 $ 142,859 $ 140,889 $ 160,792 $ 67,491 $ 444,540 $ 194,651 Fully Costed Gross Margin - Bitcoin Mining -2% 8 % 2 % 3 % -42% 4 % -11% Engineering: Fully Costed Gross Profit $ 178 $ 789 $ (519) $ 4,138 $ (1,506) $ 4,408 $ (2,782) divided by Engineering Revenue $ 11,551 $ 13,920 $ 10,576 $ 19,097 $ 12,638 $ 43,593 $ 26,940 Fully Costed Gross Margin - Engineering 2 % 6 % -5% 22% -12% 10% -10% Three Months Ended Three Months Ended September 30, Nine Months Ended September 30, December 31, March 31, June 30, Riot Platforms, Inc.: 2024 2025 2025 2025 2024 2025 2024 Revenue $ 142,558 $ 161,387 $ 152,988 $ 180,229 $ 84,786 $ 494,604 $ 234,100 less Bitcoin Mining Cost of revenue* (65,928) (74,818) (78,175) (95,765) (51,472) (248,758) (123,296) less Engineering Cost of revenue* (13,935) (11,806) (9,858) (13,707) (13,517) (35,371) (27,796) less Other Cost of revenue* (9,212) (8,965) (3,006) - (7,948) (11,971) (22,588) less Depreciation and amortization expense $ (82,384) $ (77,926) $ (83,197) $ (82,929) $ (60,000) $ (244,052) $ (129,669) Fully Costed Gross Profit (28,901) (12,128) (21,248) (12,172) (48,151) (45,548) (69,249) Bitcoin Mining: Bitcoin Mining Revenue $ 126,351 $ 142,859 $ 140,889 $ 160,792 $ 67,491 $ 444,540 $ 194,651 less Bitcoin Mining Cost of revenue* (65,928) (74,818) (78,175) (95,765) (51,472) (248,758) (123,296) less Depreciation and amortization expense of Bitcoin miners $ (62,367) $ (57,062) $ (60,252) $ (60,106) $ (44,303) $ (177,420) $ (93,120) Fully Costed Gross Profit - Bitcoin Mining (1,944) 10,979 2,462 4,921 (28,284) 18,362 (21,765) Engineering: Engineering Revenue $ 11,551 $ 13,920 $ 10,576 $ 19,097 $ 12,638 $ 43,593 $ 26,940 less Engineering Cost of revenue* (13,935) (11,806) (9,858) (13,707) (13,517) (35,371) (27,796) less Depreciation and amortization expense $ 2,562 $ (1,325) $ (1,237) $ (1,252) $ (627) $ (3,814) $ (1,926) Fully Costed Gross Profit - Engineering 178 789 (519) 4,138 (1,506) 4,408 (2,782) Three Months Ended Nine Months Ended September 30, Three Months Ended September 30, |
|
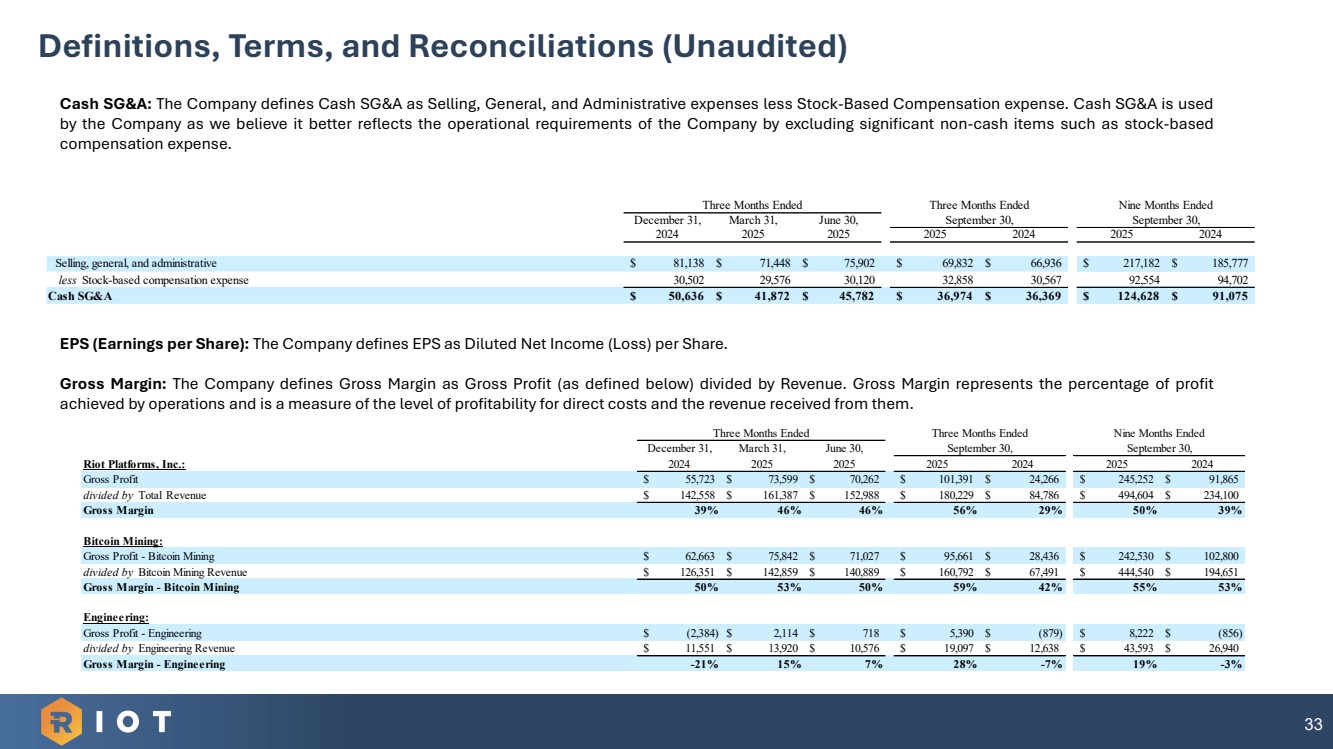
33 Definitions, Terms, and Reconciliations (Unaudited) Cash SG&A: The Company defines Cash SG&A as Selling, General, and Administrative expenses less Stock-Based Compensation expense. Cash SG&A is used by the Company as we believe it better reflects the operational requirements of the Company by excluding significant non-cash items such as stock-based compensation expense. EPS (Earnings per Share): The Company defines EPS as Diluted Net Income (Loss) per Share. Gross Margin: The Company defines Gross Margin as Gross Profit (as defined below) divided by Revenue. Gross Margin represents the percentage of profit achieved by operations and is a measure of the level of profitability for direct costs and the revenue received from them. December 31, March 31, June 30, 2024 2025 2025 2025 2024 2025 2024 Selling, general, and administrative $ 81,138 $ 71,448 $ 75,902 $ 69,832 $ 66,936 $ 217,182 $ 185,777 less Stock-based compensation expense 30,502 29,576 30,120 32,858 30,567 92,554 94,702 Cash SG&A $ 50,636 $ 41,872 $ 45,782 $ 36,974 $ 36,369 $ 124,628 $ 91,075 Three Months Ended Three Months Ended September 30, Nine Months Ended September 30, December 31, March 31, June 30, Riot Platforms, Inc.: 2024 2025 2025 2025 2024 2025 2024 Gross Profit $ 55,723 $ 73,599 $ 70,262 $ 101,391 $ 24,266 $ 245,252 $ 91,865 divided by Total Revenue $ 142,558 $ 161,387 $ 152,988 $ 180,229 $ 84,786 $ 494,604 $ 234,100 Gross Margin 39% 46% 46% 56% 29% 50% 39% Bitcoin Mining: Gross Profit - Bitcoin Mining $ 62,663 $ 75,842 $ 71,027 $ 95,661 $ 28,436 $ 242,530 $ 102,800 divided by Bitcoin Mining Revenue $ 126,351 $ 142,859 $ 140,889 $ 160,792 $ 67,491 $ 444,540 $ 194,651 Gross Margin - Bitcoin Mining 50% 53% 50% 59% 42% 55% 53% Engineering: Gross Profit - Engineering $ (2,384) $ 2,114 $ 718 $ 5,390 $ (879) $ 8,222 $ (856) divided by Engineering Revenue $ 11,551 $ 13,920 $ 10,576 $ 19,097 $ 12,638 $ 43,593 $ 26,940 Gross Margin - Engineering -21% 15% 7 % 28% -7% 19% -3% Three Months Ended Nine Months Ended September 30, Three Months Ended September 30, |
|
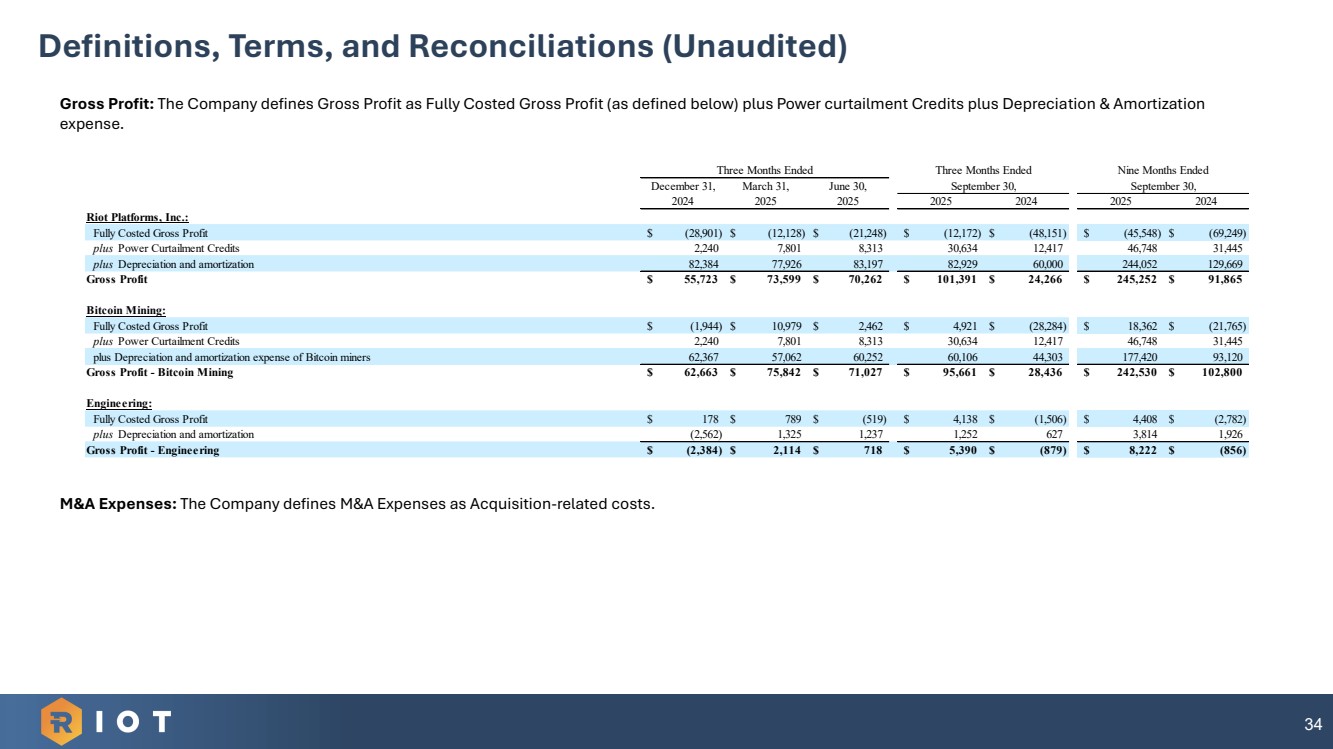
34 Definitions, Terms, and Reconciliations (Unaudited) Gross Profit: The Company defines Gross Profit as Fully Costed Gross Profit (as defined below) plus Power curtailment Credits plus Depreciation & Amortization expense. M&A Expenses: The Company defines M&A Expenses as Acquisition-related costs. December 31, March 31, June 30, 2024 2025 2025 2025 2024 2025 2024 Riot Platforms, Inc.: Fully Costed Gross Profit $ (28,901) $ (12,128) $ (21,248) $ (12,172) $ (48,151) $ (45,548) $ (69,249) plus Power Curtailment Credits 2,240 7,801 8,313 30,634 12,417 46,748 31,445 plus Depreciation and amortization 82,384 77,926 83,197 82,929 60,000 244,052 129,669 Gross Profit $ 55,723 $ 73,599 $ 70,262 $ 101,391 $ 24,266 $ 245,252 $ 91,865 Bitcoin Mining: Fully Costed Gross Profit $ (1,944) $ 10,979 $ 2,462 $ 4,921 $ (28,284) $ 18,362 $ (21,765) plus Power Curtailment Credits 2,240 7,801 8,313 30,634 12,417 46,748 31,445 plus Depreciation and amortization expense of Bitcoin miners 62,367 57,062 60,252 60,106 44,303 177,420 93,120 Gross Profit - Bitcoin Mining $ 62,663 $ 75,842 $ 71,027 $ 95,661 $ 28,436 $ 242,530 $ 102,800 Engineering: Fully Costed Gross Profit $ 178 $ 789 $ (519) $ 4,138 $ (1,506) $ 4,408 $ (2,782) plus Depreciation and amortization (2,562) 1,325 1,237 1,252 627 3,814 1,926 Gross Profit - Engineering $ (2,384) $ 2,114 $ 718 $ 5,390 $ (879) $ 8,222 $ (856) Three Months Ended Three Months Ended Nine Months Ended September 30, September 30, |
|
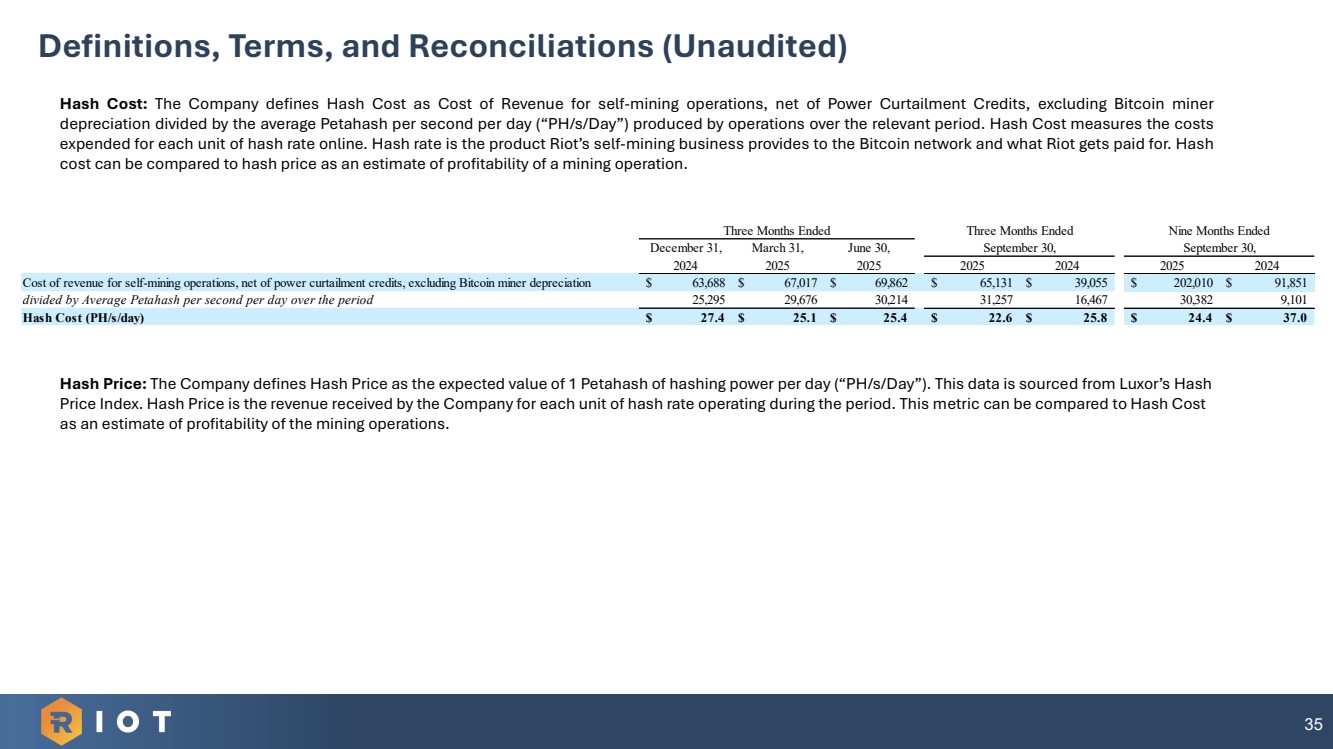
35 Definitions, Terms, and Reconciliations (Unaudited) Hash Cost: The Company defines Hash Cost as Cost of Revenue for self-mining operations, net of Power Curtailment Credits, excluding Bitcoin miner depreciation divided by the average Petahash per second per day (“PH/s/Day”) produced by operations over the relevant period. Hash Cost measures the costs expended for each unit of hash rate online. Hash rate is the product Riot’s self-mining business provides to the Bitcoin network and what Riot gets paid for. Hash cost can be compared to hash price as an estimate of profitability of a mining operation. Hash Price: The Company defines Hash Price as the expected value of 1 Petahash of hashing power per day (“PH/s/Day”). This data is sourced from Luxor’s Hash Price Index. Hash Price is the revenue received by the Company for each unit of hash rate operating during the period. This metric can be compared to Hash Cost as an estimate of profitability of the mining operations. December 31, March 31, June 30, 2024 2025 2025 2025 2024 2025 2024 Cost of revenue for self-mining operations, net of power curtailment credits, excluding Bitcoin miner depreciation $ 63,688 $ 67,017 $ 69,862 $ 65,131 $ 39,055 $ 202,010 $ 91,851 divided by Average Petahash per second per day over the period 25,295 29,676 30,214 31,257 16,467 30,382 9,101 Hash Cost (PH/s/day) $ 27.4 $ 25.1 $ 25.4 $ 22.6 $ 25.8 $ 24.4 $ 37.0 Three Months Ended Three Months Ended September 30, Nine Months Ended September 30, |
|
36 Q3 2025 Statement of Operations (Unaudited) |
|
37 Q3 2025 Balance Sheet (Unaudited) |
|
38 * Indicates Non-GAAP measure. We use Adjusted EBITDA to eliminate the effects of certain non-cash and/or non-recurring items, that do not reflect our ongoing strategic business operations. Adjusted EBITDA is provided in addition to, and not as a substitute for, or as superior to, the comparable GAAP measure, Net Income. For a full reconciliation of the Non-GAAP measures we use to their comparable GAAP measures, see the discussion under the heading “Non-GAAP Measures”, under Item 2, “Management’s Discussion and Analysis of Financial Condition and Results of Operations” in our September 30, 2025, Form 10-Q. Non-GAAP Adjusted EBITDA (Unaudited) |
|
APPENDIX INDUSTRY DATA |
|
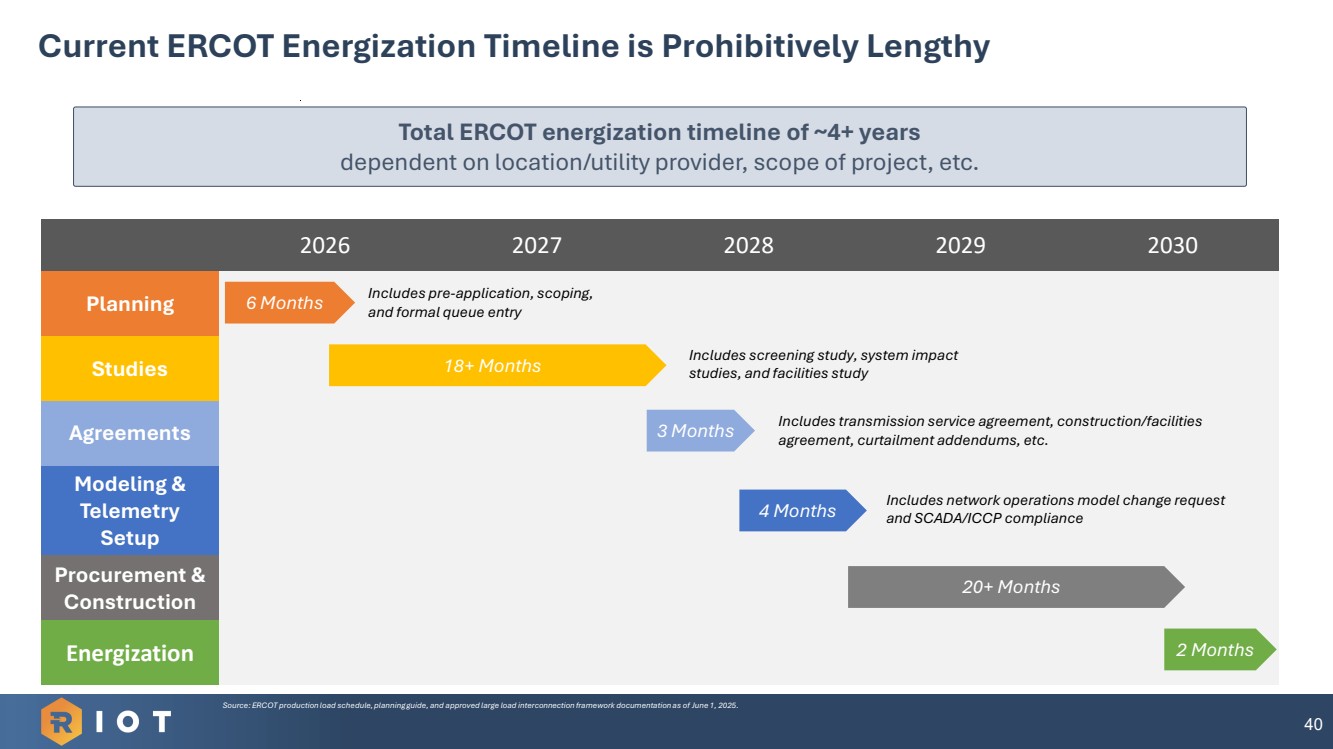
40 Current ERCOT Energization Timeline is Prohibitively Lengthy Source: ERCOT production load schedule, planning guide, and approved large load interconnection framework documentation as of June 1, 2025. 2026 2027 2028 2029 2030 Planning Studies Agreements Modeling & Telemetry Setup Procurement & Construction Energization 6 Months 18+ Months 3 Months 4 Months 20+ Months 2 Months Total ERCOT energization timeline of ~4+ years dependent on location/utility provider, scope of project, etc. Includes pre-application, scoping, and formal queue entry Includes screening study, system impact studies, and facilities study Includes transmission service agreement, construction/facilities agreement, curtailment addendums, etc. Includes network operations model change request and SCADA/ICCP compliance |
|
Market Market Share By Net UPS Power¹ Months² Pittsburgh, PA 0.3% 36 Chicago, IL 7.7% 36 Houston, TX 1.7% 36 Dallas, TX 6.6% 36 Cleveland, OH 0.5% 36 NYC Metro 5.7% 42 San Antonio, TX 0.% 42 Austin, TX 0.90% 42 Minneapolis, MN 0.7% 42 Salt Lake City, UT 1.9% 42 Northern Virginia 29.2% 42 Las Vegas, NV 1.3% 42 Raleigh/Durham, NC 0.3% 48 Seattle, WA 1.8% 48 Central Washington State 2.0% 48 Nashville, TN 0.3% 48 41 2008-2023: Electricity demand growth relatively flat. As a result, electric utilities have not invested in upgrading grid infrastructure over the last 15 years to support an accelerated demand growth scenario 2024-2030: New wave of demand growth driven in large part by infrastructure enabling the digital economy (i.e., data centers) 400 450 500 550 600 2005 2010 2015 2020 2025 2030 Historical Current Forecast US On-Grid Annual Electricity Demand (GW) 1 2008-2023 0.2% CAGR 2 2024-2030 2.2% CAGR Grid Bottleneck Existing Grid Infrastructure is Not Sufficient to Meet Forecasted Demand 1 2 Significant Lead Times to Procure Power2 “Dallas represents the 5th Largest Data Center Market in the U.S., and energy demand has already exceeded supply…” - Vacancy rates for Dallas data centers currently at 3.5% Corsicana Rockdale 41 Source: McKinsey Data Center Demand Model (2023, 2025); S&P Global Power & Renewable Market Outlook (2024). Wall Street research, CBRE, Bloomberg. 1. Uninterruptible Power Supplies. 2. Per TD Cowen, lead times are indicative of the time it would take to receive power from the local utility for a hyperscale data center to the extent a request for power were submitted today. |
|
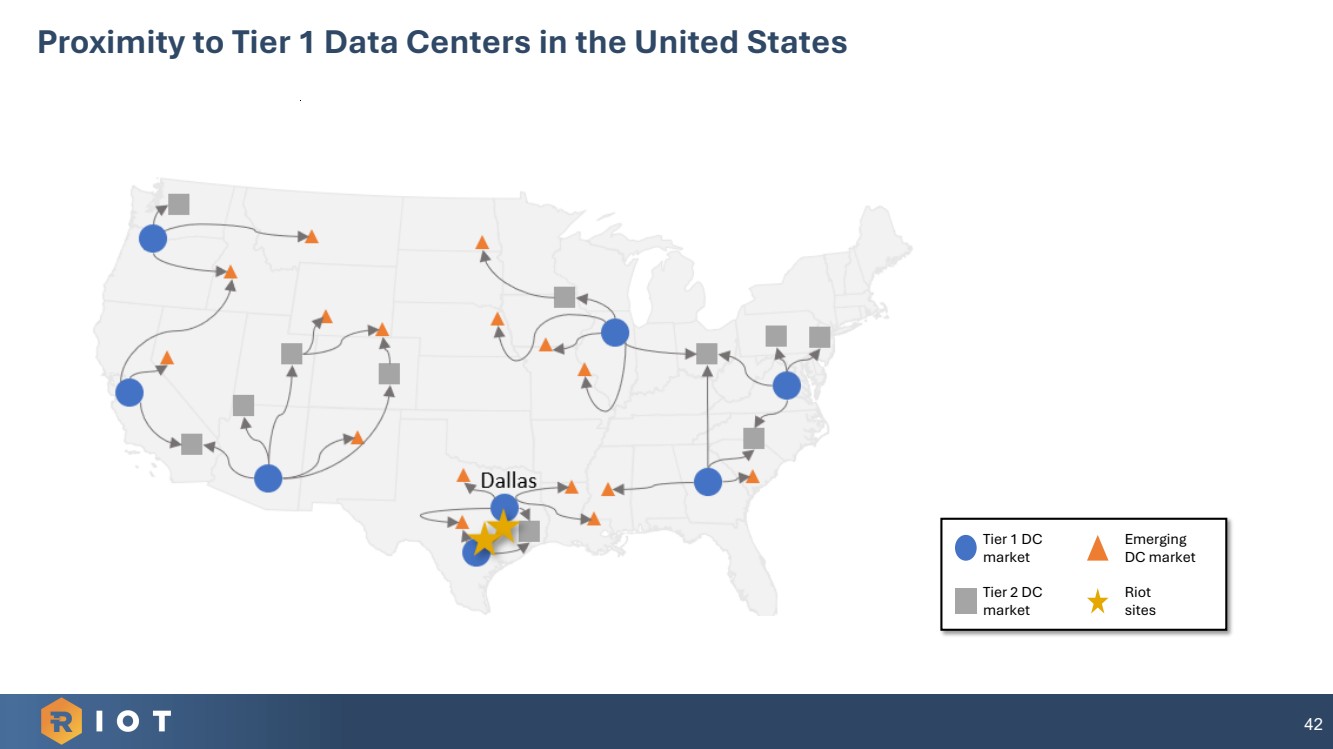
Proximity to Tier 1 Data Centers in the United States Tier 2 DC market Tier 1 DC market Emerging DC market Riot sites 42 |
|
APPENDIX MANAGEMENT TEAM & BOARD OF DIRECTORS |
|
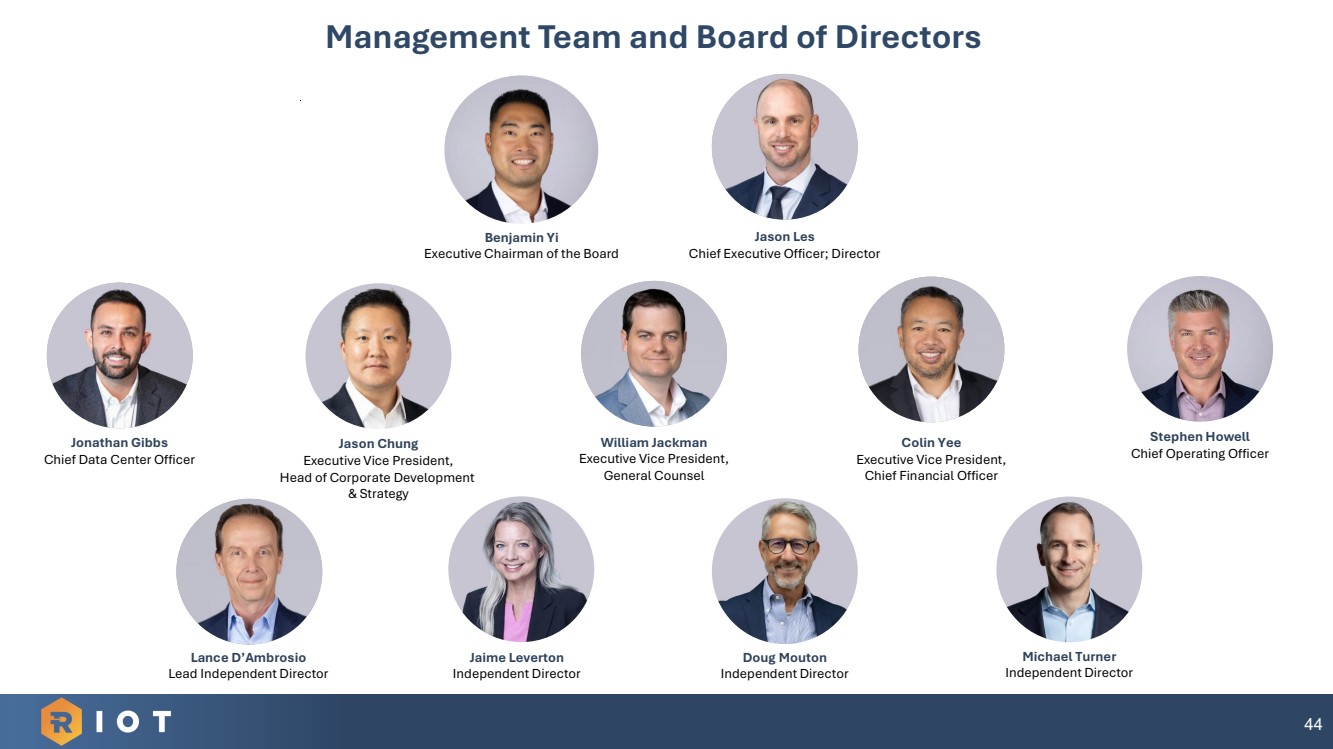
44 Management Team and Board of Directors Jason Les Chief Executive Officer; Director Benjamin Yi Executive Chairman of the Board William Jackman Executive Vice President, General Counsel Colin Yee Executive Vice President, Chief Financial Officer Lance D’Ambrosio Lead Independent Director Jason Chung Executive Vice President, Head of Corporate Development & Strategy Stephen Howell Chief Operating Officer Jaime Leverton Independent Director Doug Mouton Independent Director Michael Turner Independent Director Jonathan Gibbs Chief Data Center Officer |