UNITED STATES
SECURITIES AND EXCHANGE COMMISSION
Washington, D.C. 20549
FORM 8-K
Current Report Pursuant to Section 13
or 15(d) of
The Securities Exchange Act of 1934
Date of Report (date of earliest event reported): October 30, 2025
CALIFORNIA WATER SERVICE GROUP
(Exact name of Registrant as Specified in its Charter)
| Delaware (State or other jurisdiction of incorporation) |
1-13883 (Commission file number) |
77-0448994 (I.R.S. Employer Identification Number) |
| 1720 North First Street San Jose, California (Address of principal executive offices) |
95112 (Zip Code) |
(408) 367-8200
(Registrant’s telephone number, including area code)
N/A
(Former name or former address, if changed since last report)
Check the appropriate box below if the Form 8-K filing is intended to simultaneously satisfy the filing obligation of the registrant under any of the following provisions:
| ¨ | Written communications pursuant to Rule 425 under the Securities Act (17 CFR 230.425) |
| ¨ | Soliciting material pursuant to Rule 14a-12 under the Exchange Act (17 CFR 240.14a-12) |
| ¨ | Pre-commencement communications pursuant to Rule 14d-2(b) under the Exchange Act (17 CFR 240.14d-2(b)) |
| ¨ | Pre-commencement communications pursuant to Rule 13e-4(c) under the Exchange Act (17 CFR 240.13e-4(c)) |
Securities registered pursuant to Section 12(b) of the Act:
| Title of each class | Trading Symbol(s) | Name of each exchange on which registered | ||
| Common Shares, par value $0.01 | CWT | New York Stock Exchange |
Indicate by check mark whether the registrant is an emerging growth company as defined by Rule 405 of the Securities Act of 1933 (§230.405 of this chapter) or Rule 12b-2 of the Securities Exchange Act of 1934 (§240.12b-2 of this chapter).
Emerging growth company ¨
If an emerging growth company, indicate by check mark if the registrant has elected not to use the extended transition period for complying with any new or revised financial accounting standards provided pursuant to Section 13(a) of the Exchange Act. ¨
| Item 2.02. | Results of Operations and Financial Condition |
On October 30, 2025, California Water Service Group (the “Company”) issued a press release (a copy of which is attached hereto as Exhibit 99.1 and incorporated herein by reference) announcing its financial results for the third quarter of 2025, ended September 30, 2025.
As announced, the Company will host a conference call on Thursday, October 30, 2025, at 11:00 am EDT to discuss financial results and management’s business outlook. The financial results announcement contains information about how to access the conference call and webcast. A slide presentation, which includes supplemental information relating to the Company, will be used by management during the conference call. A copy of the slide presentation is attached hereto as Exhibit 99.2 and is incorporated by reference herein. The Exhibits will be posted on the Company’s website at www.calwatergroup.com under the “Investor Relations” tab.
The information furnished pursuant to Item 2.02 of this Current Report shall not be deemed “filed” for the purposes of Section 18 of the Securities Exchange Act of 1934, as amended (the “Exchange Act”), or incorporated by reference in any filing under the Securities Act of 1933, as amended, or the Exchange Act, except as expressly set forth by specific reference in such a filing.
| Item 9.01. | Financial Statements and Exhibits. |
We hereby furnish the following exhibits, which shall not be deemed “filed” for the purposes of Section 18 of the Exchange Act, with this report:
| Exhibit No. | Description | |
| 99.1 | Press Release issued October 30, 2025 | |
| 99.2 | Slide presentation relating to conference call | |
| 104 | Cover Page Interactive Data File (embedded within the Inline XBRL document) |
SIGNATURES
Pursuant to the requirements of the Securities Exchange Act of 1934, the Registrant has duly caused this report to be signed on its behalf by the undersigned hereunto duly authorized.
| CALIFORNIA WATER SERVICE GROUP | ||
| Date: October 30, 2025 | By: | /s/ James P. Lynch |
| Name: | James P. Lynch | |
| Title: | Senior Vice President, Chief Financial Officer and Treasurer | |
Exhibit 99.1
 |
 |
Leading Water Utility California Water Service Group Reports Strong Third Quarter 2025 Results
SAN JOSE, Calif., October 30, 2025 -- California Water Service Group (Group or Company, NYSE: CWT), a leading publicly traded water utility serving California, Hawaii, New Mexico, Washington, and Texas, today reported strong financial results for the third quarter 2025.
Financial highlights included:
| · | Net income of $61.2 million in Q3 2025 and diluted EPS of $1.03, consistent with net income and diluted EPS reported in Q3 2024. |
| · | $135.2 million invested in water system infrastructure during Q3 2025, a 14.8% increase over water system infrastructure investments in Q3 2024. |
| · | Authorization of inflation-based interim rate increases for California Water Service (Cal Water) effective January 1, 2026, until a final decision is issued in its 2024 General Rate Case, as well as approval to track and recover revenues that would have been collected had a decision by the California Public Utilities Commission (CPUC) been issued by January 1, 2026. |
| · | Approval from the Hawaii Public Utilities Commission to increase rates in Hawaii Water Service’s five Waikoloa water and wastewater systems to increase annual revenues by $4.7 million. |
| · | Declaration of the 323rd consecutive quarterly dividend in the amount of $0.30 per share. The Company has increased its dividend for 58 consecutive years and has a five-year compound annual dividend growth rate of 7.7%. |
According to Chairman, President, and Chief Executive Officer Martin A. Kropelnicki, the Company’s strong financial performance reflects continued focus on expense control, investment in water infrastructure, and excellent customer service.
“I am pleased with the continued strong execution by our team as we continue to pursue fair and affordable rates for customers, particularly in light of the fact that Cal Water is in the third year of a three-year rate case cycle, which is typically the leanest, most financially challenging year as we wait for regulatory relief,” he said.
Q3 2025 Financial Results
| · | Q3 2025 revenue increased $11.6 million or 3.9% to $311.2 million, compared to revenue of $299.6 million in Q3 2024. |
| ◦ | Rate changes and changes in the Monterey-Style Water Revenue Adjustment Mechanism (M-WRAM) added $12.7 million and $3.7 million of revenue, respectively. |
| ◦ | Declining customer water usage decreased revenue by $8.1 million, partially offset by a $2.0 million increase in unbilled water sales. |
| · | Q3 2025 operating expenses increased $7.8 million or 3.4% to $240.6 million compared to operating expenses of $232.8 million in Q3 2024. |
| ◦ | Water production costs increased by $7.6 million, primarily due to increases in wholesale water rates. |
| ◦ | Depreciation and amortization increased $3.1 million due to new capital assets placed in service. |
| ◦ | These increases were partially offset by a decrease in operating income tax expense of $4.8 million, primarily due to a decrease in the effective tax rate. |
YTD 2025 Financial Results
| · | YTD 2025 net income was $116.7 million or $1.96 per diluted share, a decrease of 31.8% or $54.4 million and $0.97 per diluted share compared to YTD 2024 net income of $171.1 million or $2.93 per diluted share. Compared to YTD 2024 non-GAAP net income, YTD 2025 increased 9.9% or $9.8 million and $0.12 per diluted share. The GAAP to non-GAAP difference in YTD 2024 is due to $64.0 million, net of tax, of 2023 interim rate relief related to the 2021 California GRC recorded YTD in 2024. |
| · | YTD 2025 revenue decreased $34.4 million or 4.2% to $780.2 million, compared to YTD revenue of $814.6 million in 2024. Compared to YTD 2024 non-GAAP revenue of $727.1 million, YTD 2025 revenue increased $53.1 million or 7.3%. |
| ◦ | Rate changes added $57.5 million in revenue, offset by a decrease in M-WRAM revenue of $13.4 million. M-WRAM revenue in 2024 includes $17.4 million of interim rate relief attributable to 2023. |
| ◦ | Customer usage and unbilled water sales contributed additional revenue of $2.0 million and $3.2 million, respectively. |
| ◦ | Regulatory approval of amounts in the Palos Verdes Pipeline Memorandum Account added YTD revenue of $3.8 million. |
| ◦ | Revenue increases were offset by $88.6 million in Interim Rates Memorandum Account (IRMA) revenue recorded in YTD 2024 results that included $67.6 million of interim rate relief attributable to 2023. |
| · | YTD 2025 operating expenses increased $13.6 million or 2.2% to $635.4 million compared to YTD operating expenses of $621.8 million in 2024. |
| ◦ | Water production costs increased by $14.3 million, primarily due to increases in wholesale water rates and an increase in customer usage. |
| ◦ | Other operations expenses increased $7.8 million, primarily due to an increase in labor costs and bad debt expenses. The bad debt expense increase was primarily due to the application of California state arrearage funds to eligible past due and written off accounts in 2024. |
| ◦ | Depreciation and amortization increased $9.2 million due to new capital assets placed in service. |
| ◦ | Operating expense increases were offset by a $21.1 million decrease in operating income tax expense due to lower pre-tax earnings in 2025 compared to 2024 as a result of recording the 2021 California GRC decision in March of 2024. |
Non-GAAP Financial Information
As a result of the delayed 2021 California GRC decision, interim rate relief related to 2023, including revenue of $87.5 million and net income of $64.0 million, or $1.09 per share, was recorded in Q1 2024 and finalized in Q2 2024. Non-GAAP financial measures adjust for the impact of 2023 interim rate relief on 2024 results. For more information on these non-GAAP financial measures, see the reconciliation of results and related explanations under “Non-GAAP Financial Measures” below.
Liquidity, Financing, and Capital Investment
As of September 30, 2025, Group’s cash and cash equivalents totaled $76.0 million and restricted cash was $45.6 million. Group had an additional short-term borrowing capacity of $255.0 million, subject to meeting the borrowing conditions on its Group and Group subsidiary, Cal Water, lines of credit.
On October 1, 2025, the Company announced the sale and issuance of $170.0 million in aggregate principal amount of Senior Unsecured Notes (the Notes) by Group and $200.0 million in aggregate principal amount of First Mortgage Bonds (the Bonds) by Cal Water in private placement transactions.
The Notes consist of $70.0 million of 4.87% senior unsecured notes, Series A, due October 1, 2032 and $100.0 million of 5.22% senior unsecured notes, Series B, due October 1, 2035. The Notes received an “A” rating by S&P Global (S&P) in advance of the sale. The Bonds consist of $200.0 million of 5.64% first mortgage bonds, Series 3, maturing October 1, 2055. The Bonds have an S&P rating of “AA-.” The sale and issuance of the Notes and the Bonds closed on October 1, 2025.
Group capital investments for the nine months ending September 30, 2025, were $364.7 million, up 9.8% compared to September 30, 2024 YTD investments of $332.2 million.
Regulatory Update
The assigned Commissioner in Cal Water’s 2024 General Rate Case has expressed his intent that the decision be issued on time. However, the Administrative Law Judge (ALJ) has indicated that he may need additional time, given the size and complexity of the case. To lessen the impact of any delay, the ALJ has authorized inflation-based interim rate increases from January 1, 2026, until the decision is issued. The ALJ has also approved a mechanism that will enable Cal Water to recover the revenue it would have collected had the decision become effective on the due date of January 1, 2026.
On October 7, 2025, Hawaii Water Service received authorization to increase annual revenues by $4.7 million, in its five Waikoloa systems, a reflection of the investments Hawaii Water has made in its systems needed to provide a safe, reliable water supply.
In Washington, the Company has filed a General Rate Case that seeks to increase annual revenues by $4.9 million to recover higher operating and maintenance expenses and costs associated with water system improvements made over the past two years. If approved, the new rates would take effect as early as December 15, 2025.
PFAS Settlement
The Company is a party to four separate class-action settlements with the following companies: 3M Company; E.I. Du Pont de Nemours and Company (n/k/a EIDP, Inc.), DuPont de Nemours, Inc., The Chemours Company, The Chemours Company FC, LLC, and Corteva, Inc. (collectively, DuPont); Tyco Fire Products LP; and BASF Corporation. These settlements are designed to resolve certain claims for PFAS contamination of drinking water in active public water systems. The Company plans to use settlement proceeds received, net of fees and expenses, to directly offset capital expenditures required to comply with PFAS drinking water regulations. In the third quarter, the Company received $24.2 million in additional proceeds, bringing the year-to-date total to $34.8 million, net of legal fees and expenses.
Community and Employee Engagement
In the third quarter, Group continued to advance its commitment to community partnership and employee engagement. On September 29, 2025, the Company opened its seventh annual Firefighter Grant Program to fire departments across its service areas, reinforcing its ongoing collaboration with local first responders.
Earlier in the quarter, Group was once again recognized among the “World’s Most Trustworthy Companies” by Newsweek and Statista Inc., marking the third consecutive year the Company has received this global distinction. The Company was also certified as a Great Place To Work® for the tenth consecutive year.
Dividend
The Group Board of Directors has declared the 323rd consecutive quarterly dividend in the amount of $0.30 per common share, which is expected to yield an annual dividend of $1.20 per common share. In addition, in January 2025, the Group Board of Directors declared a one-time special dividend in the amount of $0.04 per common share.
For additional details, please see the Form 10-Q which will be available at:
https://www.calwatergroup.com/investors/financials-filings-reports/sec-filings, or listen to the earnings teleconference or teleconference replay.
Quarterly Earnings Teleconference
The quarterly teleconference will take place on Thursday, October 30, 2025, at 8 a.m. PT/11 a.m. ET by dialing 1-800-715-9871 or 1-646-307-1963 and keying in ID# 2071195, or accessing the live audio webcast at https://edge.media-server.com/mmc/p/cvkp7i34/. Please join at least 15 minutes in advance to ensure a timely connection to the call. A replay of the call will be available from 2:00 p.m. ET on Thursday, October 30, 2025, through Saturday, November 29, 2025, at 1-800-770-2030 or 1-609-800-9909 and key in ID# 2071195, or by accessing the webcast above. The call will be hosted by Chairman, President and Chief Executive Officer Martin A. Kropelnicki, Senior Vice President, Chief Financial Officer and Treasurer James P. Lynch, and Vice President Rates and Regulatory Affairs, Greg A. Milleman. Prior to the call, Group will furnish a slide presentation on its website.
About California Water Service Group
Group is the parent company of regulated utilities Cal Water, Hawaii Water Service, New Mexico Water Service, and Washington Water Service, as well as Texas Water Service, a utility holding company. Together, these companies provide regulated and non-regulated water and wastewater service to more than 2.1 million people in California, Hawaii, New Mexico, Washington, and Texas. Group’s common stock trades on the New York Stock Exchange under the symbol “CWT.” Additional information is available online at www.calwatergroup.com.
This news release contains forward-looking statements within the meaning established by the Private Securities Litigation Reform Act of 1995 (“PSLRA”). The forward-looking statements are intended to qualify under provisions of the federal securities laws for “safe harbor” treatment established by the PSLRA. Forward-looking statements in this news release are based on currently available information, expectations, estimates, assumptions and projections, and our management’s beliefs, assumptions, judgments and expectations about us, the water utility industry and general economic conditions. These statements are not statements of historical fact. When used in our documents, statements that are not historical in nature, including words like will, would, expects, intends, plans, believes, may, could, estimates, assumes, anticipates, projects, progress, predicts, hopes, targets, forecasts, should, seeks or variations of these words or similar expressions are intended to identify forward-looking statements. Examples of forward-looking statements in this news release include, but are not limited to, statements describing Group’s expected financial performance, investments in infrastructure projects, receipt of and us of PFAS settlement proceeds, and expectations regarding Group’s plans and proposals pursuant to and progress of the 2024 CA GRC and Washington GRC, and annual dividend yield. Forward-looking statements are not guarantees of future performance. They are based on numerous assumptions that we believe are reasonable, but they are open to a wide range of uncertainties and business risks. Consequently, actual results or outcomes may vary materially from what is contained in a forward-looking statement. Factors that may cause actual results or outcomes to be different than those expected or anticipated include, but are not limited to: the outcome and timeliness of regulatory commissions’ actions concerning rate relief and other matters, including with respect to the 2024 CA GRC and Washington GRC; the impact of opposition to rate increases; our ability to recover costs; federal governmental and state regulatory commissions’ decisions, including decisions on proper disposition of property; changes in state regulatory commissions’ policies and procedures, such as the CPUC’s decision in 2020 to preclude companies from proposing full decoupling, which impacted the 2021 California GRC Filing; changes in California State Water Resources Control Board water quality standards; changes in environmental compliance and water quality requirements, such as the United States Environmental Protection Agency’s (EPA) finalization of a National Primary Drinking Water Regulation establishing legally enforceable maximum contaminant levels (MCL) for PFAS in drinking water in 2024 as well as legal challenges to such MCLs; the impact of weather, climate change, natural disasters, including wildfires and landslides, and actual or threatened public health emergencies, including disease outbreaks, on our operations, water quality, water availability, water sales, and operating results and the adequacy of our emergency preparedness; electric power interruptions, especially as a result of public safety power shutoff programs; availability of water supplies; our ability to invest or apply the proceeds from the issuance of common stock in an accretive manner; consequences of eminent domain actions relating to our water systems; increased risk of inverse condemnation losses as a result of the impact of weather, climate change, and natural disasters, including wildfires and landslides; housing and customer growth; issues with the implementation, maintenance or security of our information technology systems; our ability to renew leases to operate water systems owned by others on beneficial terms; civil disturbances or terrorist threats or acts; the adequacy of our efforts to mitigate physical and cyber security risks and threats; the ability of our enterprise risk management processes to identify or address risks adequately; labor relations matters as we negotiate with the unions; changes in customer water use patterns and the effects of conservation, including as a result of drought conditions; our ability to complete, in a timely manner or at all, successfully integrate and achieve anticipated benefits from announced acquisitions; restrictive covenants in or changes to the credit ratings on our current or future debt that could increase our financing costs or affect our ability to borrow, make payments on debt or pay dividends; risks associated with expanding our business and operations geographically; the impact of stagnating or worsening business and economic conditions, including inflationary pressures, general economic slowdown or a recession, changes in tariff policy and uncertainty regarding tariffs and other retaliatory trade measures, the interest rate environment, changes in monetary policy, adverse capital markets activity or macroeconomic conditions as a result of geopolitical conflicts and the shutdown of the U.S. federal government; the impact of market conditions and volatility on unrealized gains or losses on our non-qualified benefit plan investments and our operating results; the impact of weather and timing of meter reads on our accrued unbilled revenue; the impact of evolving legal and regulatory requirements, including emerging environmental, social and governance requirements; the impact of the evolving U.S. political environment that has led to, in some cases, legal challenges and uncertainty around the funding, functioning, and policy priorities of the U.S. federal regulatory agencies and the status of current and future regulations; and other risks and unforeseen events described in our Securities and Exchange Commission (“SEC”) filings. In light of these risks, uncertainties and assumptions, investors are cautioned not to place undue reliance on forward-looking statements, which speak only as of the date of this news release. When considering forward-looking statements, you should keep in mind the cautionary statements included in this paragraph, as well as the Annual Report on Form 10-K, Quarterly 10-Q, and other reports filed from time-to-time with the SEC. We are not under any obligation, and we expressly disclaim any obligation to update or alter any forward-looking statements, whether as a result of new information, future events or otherwise. A credit rating is not a recommendation to buy, sell or hold any securities, may be changed at any time by the applicable ratings agency and should be evaluated independently of any other information.
Contacts:
James P. Lynch (408) 367-8200 (analysts)
Shannon Dean (408) 367-8243 (media)
CALIFORNIA WATER SERVICE GROUP
CONDENSED CONSOLIDATED BALANCE SHEETS
Unaudited
| (In thousands, except per share data) | September 30, 2025 |
December 31, 2024 |
||||||
| ASSETS | ||||||||
| Utility plant: | ||||||||
| Utility plant | $ | 5,762,800 | $ | 5,400,489 | ||||
| Less accumulated depreciation and amortization | (1,318,798 | ) | (1,241,785 | ) | ||||
| Net utility plant | 4,444,002 | 4,158,704 | ||||||
| Current assets: | ||||||||
| Cash and cash equivalents | 75,990 | 50,121 | ||||||
| Restricted cash | 45,620 | 45,566 | ||||||
| Receivables: | ||||||||
| Customers, net | 79,986 | 58,585 | ||||||
| Regulatory balancing accounts | 74,028 | 55,917 | ||||||
| Other, net | 19,418 | 33,976 | ||||||
| Accrued and unbilled revenue, net | 61,654 | 39,718 | ||||||
| Materials and supplies | 20,069 | 20,511 | ||||||
| Taxes, prepaid expenses, and other assets | 22,547 | 19,742 | ||||||
| Total current assets | 399,312 | 324,136 | ||||||
| Other assets: | ||||||||
| Regulatory assets | 326,519 | 357,406 | ||||||
| Goodwill | 37,063 | 37,063 | ||||||
| Other assets | 312,521 | 302,974 | ||||||
| Total other assets | 676,103 | 697,443 | ||||||
| TOTAL ASSETS | $ | 5,519,417 | $ | 5,180,283 | ||||
| CAPITALIZATION AND LIABILITIES | ||||||||
| Capitalization: | ||||||||
| Common stock, $0.01 par value; 136,000 shares authorized, 59,591 and 59,484 outstanding on September 30, 2025 and December 31, 2024, respectively | $ | 596 | $ | 595 | ||||
| Additional paid-in capital | 970,960 | 966,975 | ||||||
| Retained earnings | 735,673 | 674,918 | ||||||
| Accumulated other comprehensive loss | (6,755 | ) | (7,217 | ) | ||||
| Noncontrolling interests | 2,421 | 3,015 | ||||||
| Total equity | 1,702,895 | 1,638,286 | ||||||
| Long-term debt, net | 1,103,819 | 1,104,571 | ||||||
| Total capitalization | 2,806,714 | 2,742,857 | ||||||
| Current liabilities: | ||||||||
| Current maturities of long-term debt, net | 72,490 | 72,422 | ||||||
| Short-term borrowings | 345,000 | 205,000 | ||||||
| Accounts payable | 188,176 | 167,533 | ||||||
| Regulatory balancing accounts | 23,443 | 22,648 | ||||||
| Accrued other taxes | 17,886 | 6,084 | ||||||
| Accrued interest | 19,478 | 8,406 | ||||||
| Other accrued liabilities | 63,446 | 56,271 | ||||||
| Total current liabilities | 729,919 | 538,364 | ||||||
| Deferred income taxes | 407,562 | 411,083 | ||||||
| Regulatory liabilities | 870,620 | 814,551 | ||||||
| Pension | 82,427 | 81,665 | ||||||
| Advances for construction | 210,412 | 202,614 | ||||||
| Contributions in aid of construction | 295,649 | 294,970 | ||||||
| Other | 116,114 | 94,179 | ||||||
| Commitments and contingencies | ||||||||
| TOTAL CAPITALIZATION AND LIABILITIES | $ | 5,519,417 | $ | 5,180,283 | ||||
CALIFORNIA WATER SERVICE GROUP
CONDENSED CONSOLIDATED STATEMENTS OF OPERATIONS
Unaudited
| Three Months Ended September 30, |
Nine Months Ended September 30, |
|||||||||||||||
| (In thousands, except per share data) | 2025 | 2024 | 2025 | 2024 | ||||||||||||
| Operating revenue | $ | 311,235 | $ | 299,563 | $ | 780,162 | $ | 814,611 | ||||||||
| Operating expenses: | ||||||||||||||||
| Operations: | ||||||||||||||||
| Water production costs | 102,703 | 95,091 | 251,197 | 236,920 | ||||||||||||
| Administrative and general | 36,237 | 35,453 | 103,728 | 103,091 | ||||||||||||
| Other operations | 33,455 | 33,618 | 93,986 | 86,169 | ||||||||||||
| Maintenance | 9,812 | 9,264 | 26,523 | 26,064 | ||||||||||||
| Depreciation and amortization | 36,118 | 33,065 | 108,103 | 98,887 | ||||||||||||
| Income tax expense | 10,639 | 15,483 | 18,589 | 39,710 | ||||||||||||
| Property and other taxes | 11,656 | 10,841 | 33,267 | 30,962 | ||||||||||||
| Total operating expenses | 240,620 | 232,815 | 635,393 | 621,803 | ||||||||||||
| Net operating income | 70,615 | 66,748 | 144,769 | 192,808 | ||||||||||||
| Other income and expenses: | ||||||||||||||||
| Non-regulated revenue | 5,349 | 4,133 | 15,341 | 14,744 | ||||||||||||
| Non-regulated expenses | (2,456 | ) | (934 | ) | (8,790 | ) | (7,013 | ) | ||||||||
| Other components of net periodic benefit credit | 4,548 | 4,451 | 13,937 | 12,062 | ||||||||||||
| Allowance for equity funds used during construction | 2,145 | 1,691 | 5,840 | 5,252 | ||||||||||||
| Income tax expense on other income and expenses | (1,960 | ) | (1,939 | ) | (5,415 | ) | (4,566 | ) | ||||||||
| Net other income | 7,626 | 7,402 | 20,913 | 20,479 | ||||||||||||
| Interest expense: | ||||||||||||||||
| Interest expense | 18,113 | 14,384 | 52,086 | 45,024 | ||||||||||||
| Allowance for borrowed funds used during construction | (988 | ) | (788 | ) | (2,772 | ) | (2,358 | ) | ||||||||
| Net interest expense | 17,125 | 13,596 | 49,314 | 42,666 | ||||||||||||
| Net income | 61,116 | 60,554 | 116,368 | 170,621 | ||||||||||||
| Net loss attributable to noncontrolling interests | (114 | ) | (126 | ) | (361 | ) | (527 | ) | ||||||||
| Net income attributable to California Water Service Group | $ | 61,230 | $ | 60,680 | $ | 116,729 | $ | 171,148 | ||||||||
| Earnings per share of common stock: | ||||||||||||||||
| Basic | $ | 1.03 | $ | 1.03 | $ | 1.96 | $ | 2.93 | ||||||||
| Diluted | $ | 1.03 | $ | 1.03 | $ | 1.96 | $ | 2.93 | ||||||||
| Weighted average shares outstanding: | ||||||||||||||||
| Basic | 59,585 | 58,931 | 59,557 | 58,321 | ||||||||||||
| Diluted | 59,653 | 58,982 | 59,615 | 58,358 | ||||||||||||
| Dividends per share of common stock | $ | 0.30 | $ | 0.28 | $ | 0.94 | $ | 0.84 | ||||||||
Non-GAAP Financial Measures
The Company’s revenue, net income, and diluted earnings per share are prepared in accordance with GAAP and represent amounts reported on filings with the Securities and Exchange Commission. Adjusted revenue, net income, and diluted earnings per share are non-GAAP financial measures representing GAAP balances that, in this earnings release, are adjusted to exclude the effects of 2023 interim rate relief related to the delayed 2021 California GRC decision recorded by the Company in March 2024 and finalized in the second quarter of 2024. These non-GAAP financial measures are provided as additional information for investors and analysts to better assess the Company’s 2025 financial performance as compared to 2024 without the impact of the 2023 interim rate relief on 2024 results. Management also uses these non-GAAP financial measures in evaluating the Company’s performance. These non-GAAP financial measures may be different from non-GAAP financial measures used by other companies, even when the same or similarly titled terms are used to identify such measures, limiting their usefulness for comparative purposes. Further, these non-GAAP financial measures should be considered as a supplement to the financial information prepared on a GAAP basis rather than an alternative to the respective GAAP measures.
Reconciliation of Non-GAAP Financial Measures
| Nine Months Ended September 30, |
||||||||
| (in millions, except per share amounts) | 2025 | 2024 | ||||||
| Reported GAAP Revenue | $ | 780,162 | $ | 814,611 | ||||
| Adjustments: | ||||||||
| 2023 interim rate relief related to the 2021 California General Rate Case recorded in 2024 | — | (87,482 | ) | |||||
| Adjusted Revenue (non-GAAP) | $ | 780,162 | $ | 727,129 | ||||
| Reported GAAP Net Income | $ | 116,729 | $ | 171,148 | ||||
| Adjustments: | ||||||||
| 2023 interim rate relief related to the 2021 California General Rate Case recorded in 2024 | — | (63,980 | ) | |||||
| Adjusted Net Income (non-GAAP) | $ | 116,729 | $ | 107,168 | ||||
| Reported GAAP Diluted Earnings Per Share | $ | 1.96 | $ | 2.93 | ||||
| Adjustments: | ||||||||
| 2023 interim rate relief related to the 2021 California General Rate Case recorded in 2024 | — | (1.09 | ) | |||||
| Adjusted Diluted Earnings Per Share (non-GAAP) | $ | 1.96 | $ | 1.84 | ||||
Exhibit 99.2
©2025 California Water Service Group 1 ©2025 California Water Service Group Investing for Life Third Quarter 2025 Earnings Presentation October 30, 2025 ©2025 California Water Service Group ©2025 California Water Service Group 2 ©2025 California Water Service Group Today’s Speakers Marty Kropelnicki Chairman & CEO James Lynch Sr.
Vice President, CFO & Treasurer Greg Milleman Vice President, Rates & Regulatory Affairs ©2025 California Water Service Group 3 Forward - Looking Statements and Other Important Information This presentation contains forward - looking statements within the meaning established by the Private Securities Litigation Reform Act of 1995 (“ PSLRA ”).
The forward - looking statements are intended to qualify under provisions of the federal securities laws for “safe harbor” treatment established by the PSLRA . Forward - looking statements in this presentation are based on currently available information, expectations, estimates, assumpt ions and projections, and our management’s beliefs, assumptions, judgments and expectations about us, the water utility industry and g ene ral economic conditions. These statements are not statements of historical fact. When used in our documents, statements that are not historical in nature, including words like will, would, expects, intends, plans, belie ves , may, could, estimates, assumes, anticipates, projects, progress, predicts, hopes, targets, forecasts, should, seeks or variations of these words or similar expressions are intended to identify forward - looking statements. Examples of forward - looking statements in this presentation include, but are not limited to, statements describing expectations regarding financial performance, operating plans, capital investments and expenditures, depreciation, ex pectations regarding California Water Service Group’s (Group or Company) plans and proposals pursuant to and progress of the California Water Service Company’s (Cal Water) 2024 General Rate Case, the anticipated transf er of ownership pursuant to and expected benefits resulting from the Silverwood agreement, PFAS - related investments and receipt of PFAS settlement proceeds, rate base growth, customer growth potential, compound annual g rowth rate, sufficiency of cash and liquidity to support capital investment and growth, and annual dividend yield. Forward - looking statements are not guarantees of future performance. They are based on numerous assumptio ns that we believe are reasonable, but they are open to a wide range of uncertainties and business risks. Consequently, actual results or outcomes may vary materially from what is contained in a forward - looking stateme nt. Factors that may cause actual results or outcomes to be different than those expected or anticipated include, but are not limited to: the outcome and timeliness of regulatory commissions’ actions concerning rate re lie f and other matters, including with respect to the 2024 GRC ; the impact of opposition to rate increases; our ability to recover costs; Federal governmental and state regulatory commissions’ decisions, including decision s o n proper disposition of property; changes in state regulatory commissions’ policies and procedures, such as the CPUC’s decision in 2020 to preclude companies from proposing fully decoupled WRAMs , which impacted the 2021 GRC Filing; changes in California State Water Resources Control Board water quality standards; changes in environmental compliance and water quality requirements, such as the United States Environmental Protection Agency ’s (EPA) finalization of a National Primary Drinking Water Regulation establishing legally enforceable maximum contaminant levels (MCL) for six PFAS in drinking water in 2024; the impact of weather, climate change, n atu ral disasters, including wildfires and landslides, and actual or threatened public health emergencies, including disease outbreaks, on our operations, water quality, water availability, water sales and operating res ult s and the adequacy of our emergency preparedness; electric power interruptions, especially as a result of public safety power shutoff programs; availability of water supplies; our ability to invest or apply the proceeds f rom the issuance of common stock in an accretive manner; consequences of eminent domain actions relating to our water systems; our ability to renew leases to operate water systems owned by others on beneficial terms; incr eas ed risk of inverse condemnation losses as a result of the impact of weather, climate change, and natural disasters, including wildfires and landslides; housing and customer growth; issues with the implementation, maintenan ce or security of our information technology systems; civil disturbances or terrorist threats or acts; the adequacy of our efforts to mitigate physical and cyber security risks and threats; the ability of our enterprise risk man age ment processes to identify or address risks adequately; labor relations matters as we negotiate with the unions; changes in customer water use patterns and the effects of conservation, including as a result of drought conditio ns; our ability to complete, in a timely manner or at all, successfully integrate and achieve anticipated benefits from announced acquisitions; restrictive covenants in or changes to the credit ratings on our current or future debt th at could increase our financing costs or affect our ability to borrow, make payments on debt or pay dividends; risks associated with expanding our business and operations geographically; the impact of stagnating or worsening bus iness and economic conditions, including inflationary pressures, general economic slowdown or a recession, changes in tariff policy and uncertainty regarding tariffs and other retaliatory trade measures, the interest rate environment, changes in monetary policy, adverse capital markets activity or macroeconomic conditions as a result of geopolitical conflicts; the impact of market conditions and volatility on unrealized gains or losse s o n our non - qualified benefit plan investments and our operating results; the impact of weather and timing of meter reads on our accrued unbilled revenue; the impact of evolving legal and regulatory requirements, including em erg ing environmental, social and governance requirements; the impact of the evolving U.S. political environment that has led to, in some cases, legal challenges and uncertainty around the funding, functioning and policy prior iti es of U.S. federal regulatory agencies and the status of current and future regulations; and other risks and unforeseen events described in our Securities and Exchange Commission (“SEC”) filings. In light of these risks, unc ert ainties and assumptions, investors are cautioned not to place undue reliance on forward - looking statements, which speak only as of the date of this presentation. When considering forward - looking statements, you should keep i n mind the cautionary statements included in this paragraph, as well as the Annual Report on Form 10 - K, Quarterly 10 - Q, and other reports filed from time - to - time with the SEC. We are not under any obligation, and we expre ssly disclaim any obligation to update or alter any forward - looking statements, whether as a result of new information, future events or otherwise. A credit rating is not a recommendation to buy, sell, or hold any secu rit ies, and may be changed at any time by the applicable ratings agency and should be evaluated independently of any other information.

©2025 California Water Service Group 4 ©2025 California Water Service Group Executing Strategy in Q3 2025 4 Delivered strong performance through first nine months of 2025* Invested $135.2 million in Q3 in water system infrastructure; $364.7 million YTD Issued combination of Notes and Bonds in aggregate principal amount of $370 million 1 2 Advanced regulatory proceedings in multiple states Received $24.2 million net in PFAS settlement payments, bringing YTD total to $34.8 million net 5 Continued progress in Texas on rate case and utility plant expansion 6 *As a result of the delayed 2021 California GRC decision, interim rate relief related to 2023 was recorded in Q1 2024 and fin ali zed in Q2 2024. Non - GAAP measures adjust for the impact of 2023 interim rate relief on 2024 YTD results. For more information, please see the reconciliation of results and related explanations in the Appendix.
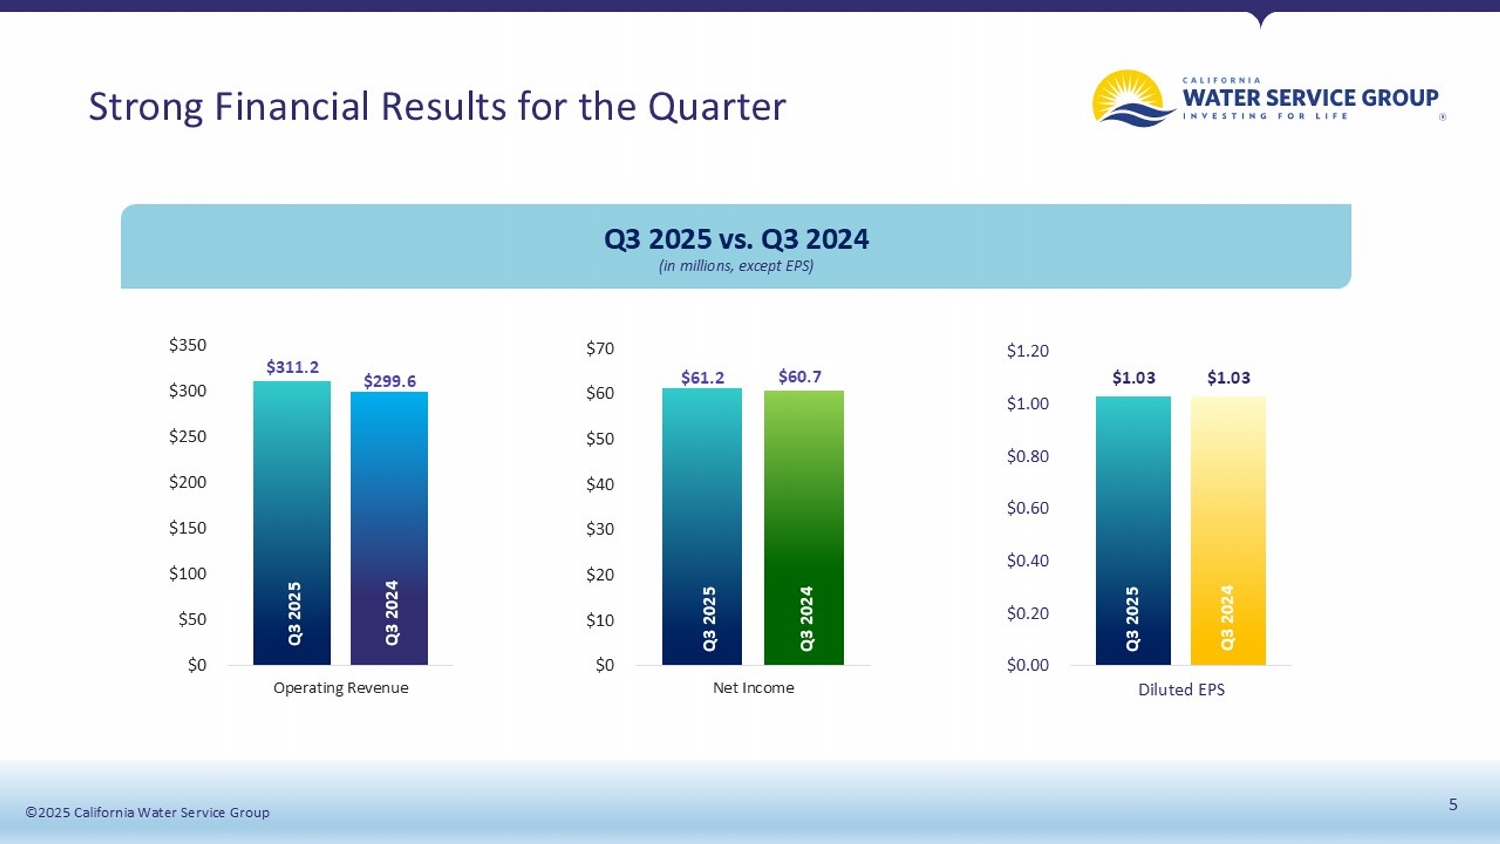
3 4 ©2025 California Water Service Group 5 ©2025 California Water Service Group Strong Financial Results for the Quarter $311.2 $299.6 $0 $50 $100 $150 $200 $250 $300 $350 Operating Revenue $61.2 $60.7 $0 $10 $20 $30 $40 $50 $60 $70 Net Income $1.03 $1.03 $0.00 $0.20 $0.40 $0.60 $0.80 $1.00 $1.20 Diluted EPS Q3 2025 vs. Q3 2024 Q3 2024 Q3 2025 Q3 2024 Q3 2025 Q3 2024 Q3 2025 (in millions, except EPS)

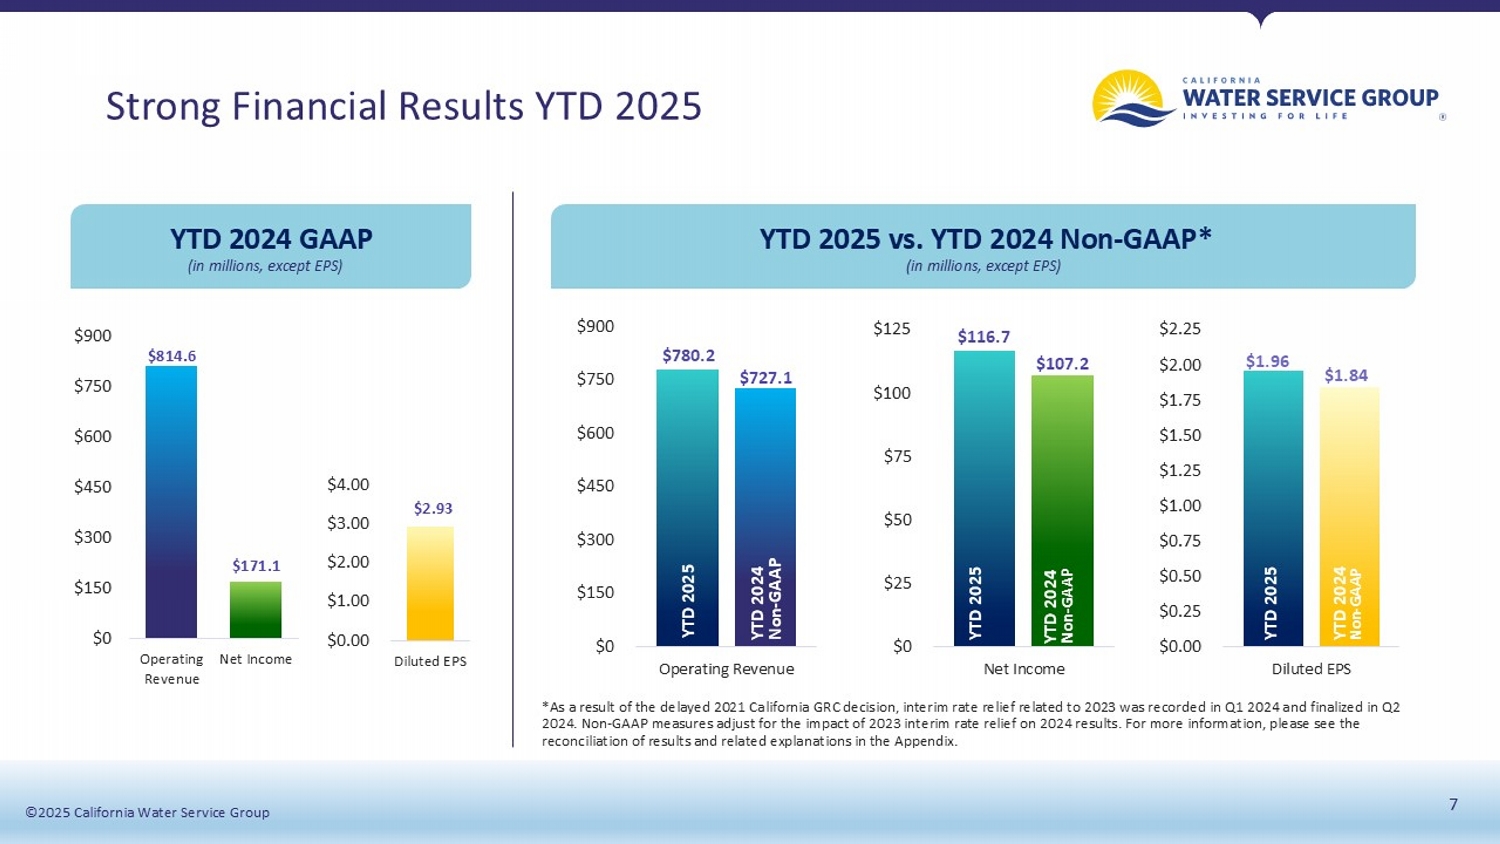
©2025 California Water Service Group 6 Diluted EPS Q3 2024 to Q3 2025 Bridge $1.03 $0.23 $0.07 - $0.08 - $0.11 - $0.04 - $0.05 - $0.02 $0.00 $0.20 $0.40 $0.60 $0.80 $1.00 $1.20 $1.40 $1.03 ©2025 California Water Service Group 7 ©2025 California Water Service Group Strong Financial Results YTD 2025 (in millions, except EPS) $814.6 $171.1 $0 $150 $300 $450 $600 $750 $900 Operating Revenue Net Income $2.93 $0.00 $1.00 $2.00 $3.00 $4.00 Diluted EPS $780.2 $727.1 $0 $150 $300 $450 $600 $750 $900 Operating Revenue $116.7 $107.2 $0 $25 $50 $75 $100 $125 Net Income $0.00 $0.25 $0.50 $0.75 $1.00 $1.25 $1.50 $1.75 $2.00 $2.25 Diluted EPS $1.96 $1.84 YTD 2025 vs. YTD 2024 Non - GAAP* *As a result of the delayed 2021 California GRC decision, interim rate relief related to 2023 was recorded in Q1 2024 and finalized in Q2 2024. Non - GAAP measures adjust for the impact of 2023 interim rate relief on 2024 results. For more information, please see the reconciliation of results and related explanations in the Appendix. YTD 2024 Non - GAAP YTD 2025 YTD 2024 GAAP YTD 2024 Non - GAAP YTD 2025 YTD 2024 Non - GAAP YTD 2025 (in millions, except EPS)
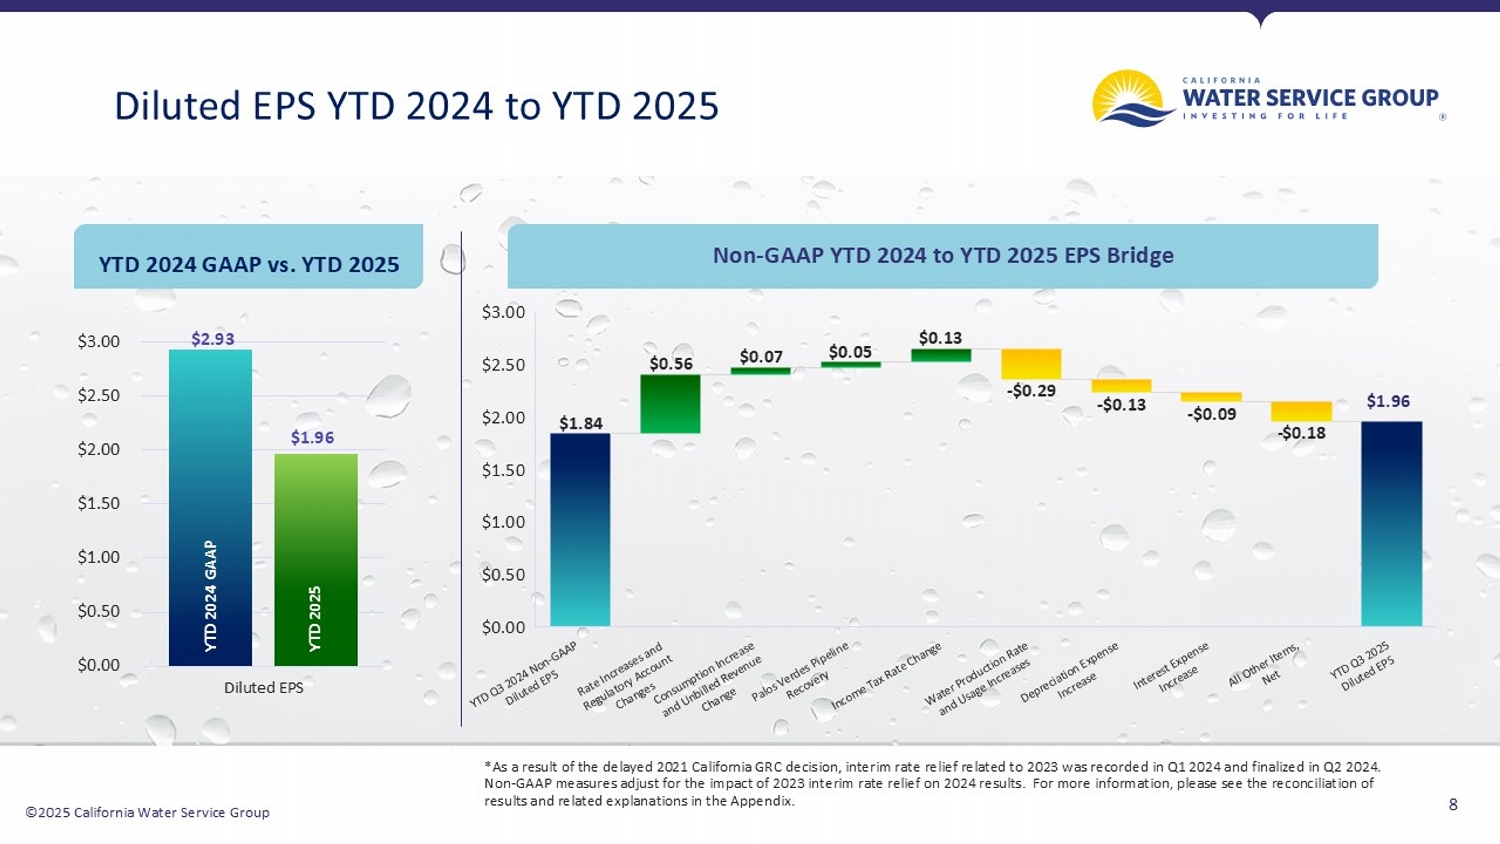
©2025 California Water Service Group 8 Diluted EPS YTD 2024 to YTD 2025 $2.93 $1.96 $0.00 $0.50 $1.00 $1.50 $2.00 $2.50 $3.00 Diluted EPS YTD 2024 GAAP vs. YTD 2025 Non - GAAP YTD 2024 to YTD 2025 EPS Bridge *As a result of the delayed 2021 California GRC decision, interim rate relief related to 2023 was recorded in Q1 2024 and finalized in Q2 2024. Non - GAAP measures adjust for the impact of 2023 interim rate relief on 2024 results. For more information, please see the recon ciliation of results and related explanations in the Appendix.
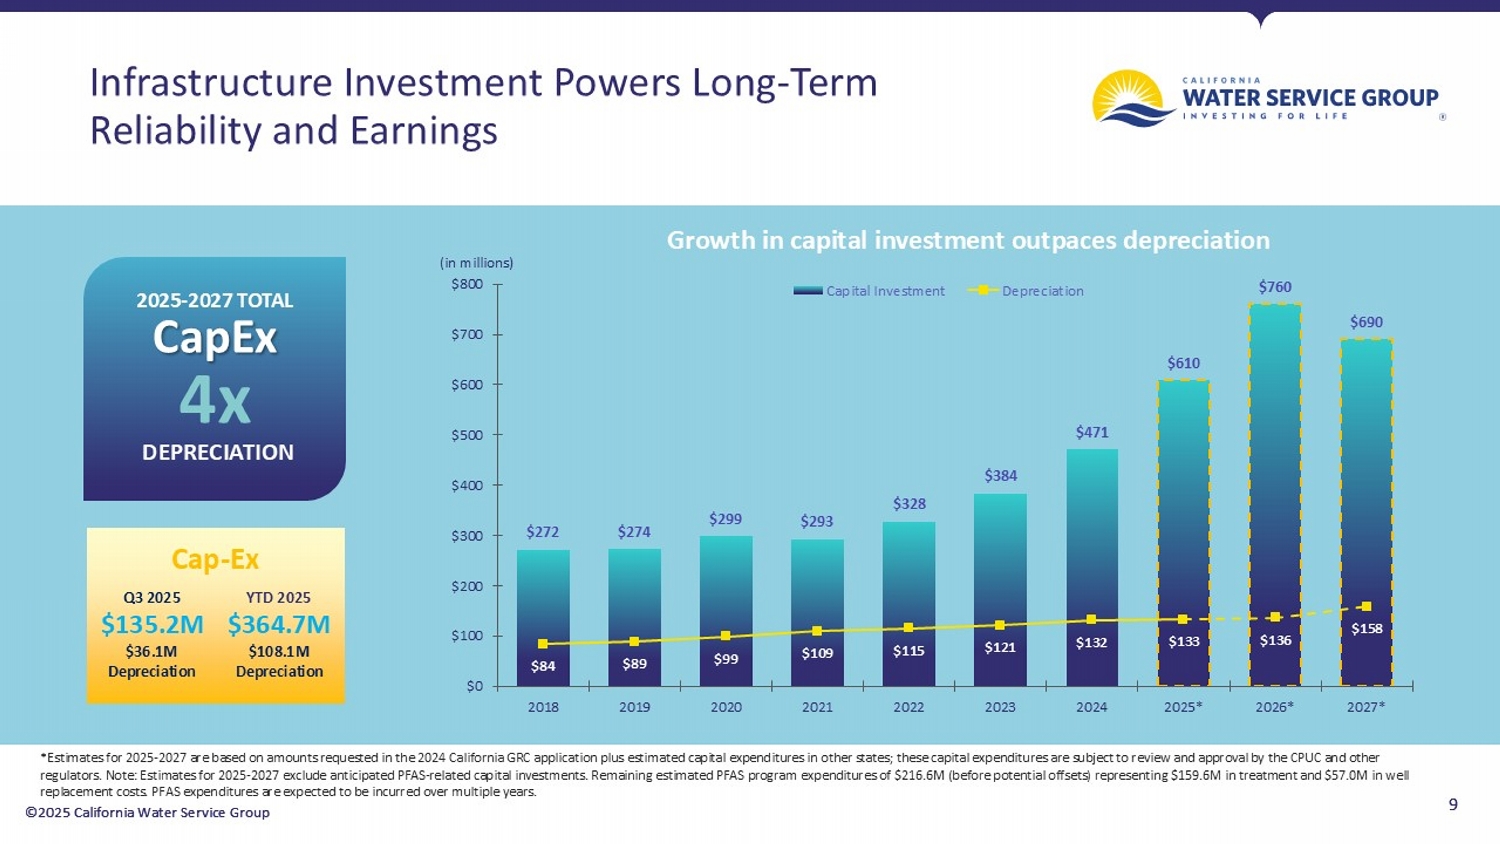
YTD 2024 GAAP YTD 2025 $1.84 $0.56 $0.07 $0.05 $0.13 - $0.29 - $0.13 - $0.09 - $0.18 $0.00 $0.50 $1.00 $1.50 $2.00 $2.50 $3.00 $1.96 ©2025 California Water Service Group 9 Infrastructure Investment Powers Long - Term Reliability and Earnings 9 ©2025 California Water Service Group $272 $274 $299 $293 $328 $384 $471 $610 $760 $690 $84 $89 $99 $109 $115 $121 $132 $133 $136 $158 $0 $100 $200 $300 $400 $500 $600 $700 $800 2018 2019 2020 2021 2022 2023 2024 2025* 2026* 2027* Capital Investment Depreciation 2025 - 2027 TOTAL CapEx 4x DEPRECIATION (in millions) *Estimates for 2025 - 2027 are based on amounts requested in the 2024 California GRC application plus estimated capital expenditures in other states; these capital expenditures are subject to review and approva l by the CPUC and other regulators. Note: Estimates for 2025 - 2027 exclude anticipated PFAS - related capital investments. Remaining estimated PFAS program expenditures of $216.6M (before potential offsets) representing $159.6M in treatment and $57.0M in well replacement costs. PFAS expenditures are expected to be incurred over multiple years.
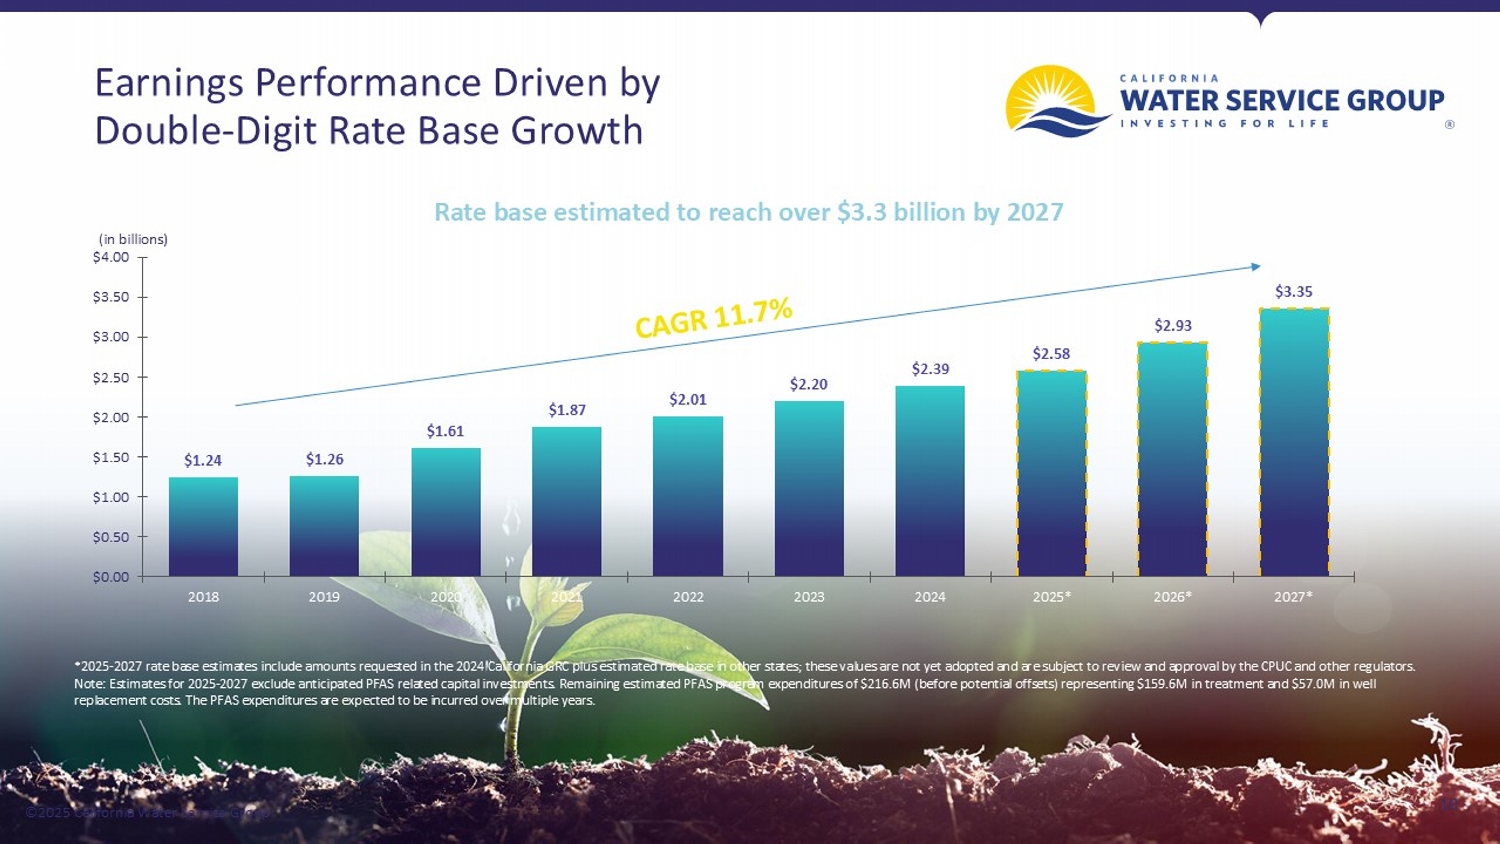
Growth in capital investment outpaces depreciation Q3 2025 $135.2M $36.1M Depreciation YTD 2025 $364.7M $108.1M Depreciation Cap - Ex ©2025 California Water Service Group Earnings Performance Driven by Double - Digit Rate Base Growth 10 ©2025 California Water Service Group $1.24 $1.26 $1.61 $1.87 $2.01 $2.20 $2.39 $2.58 $2.93 $3.35 $0.00 $0.50 $1.00 $1.50 $2.00 $2.50 $3.00 $3.50 $4.00 2018 2019 2020 2021 2022 2023 2024 2025* 2026* 2027* Rate base estimated to reach over $3.3 billion by 2027 (in billions) *2025 - 2027 rate base estimates include amounts requested in the 2024 California GRC plus estimated rate base in other states; these values are not yet adopted and are subject to review and approval by the CPUC a nd other regulators. Note: Estimates for 2025 - 2027 exclude anticipated PFAS related capital investments. Remaining estimated PFAS program expenditure s of $216.6M (before potential offsets) representing $159.6M in treatment and $57.0M in well replacement costs. The PFAS expenditures are expected to be incurred over multiple years.
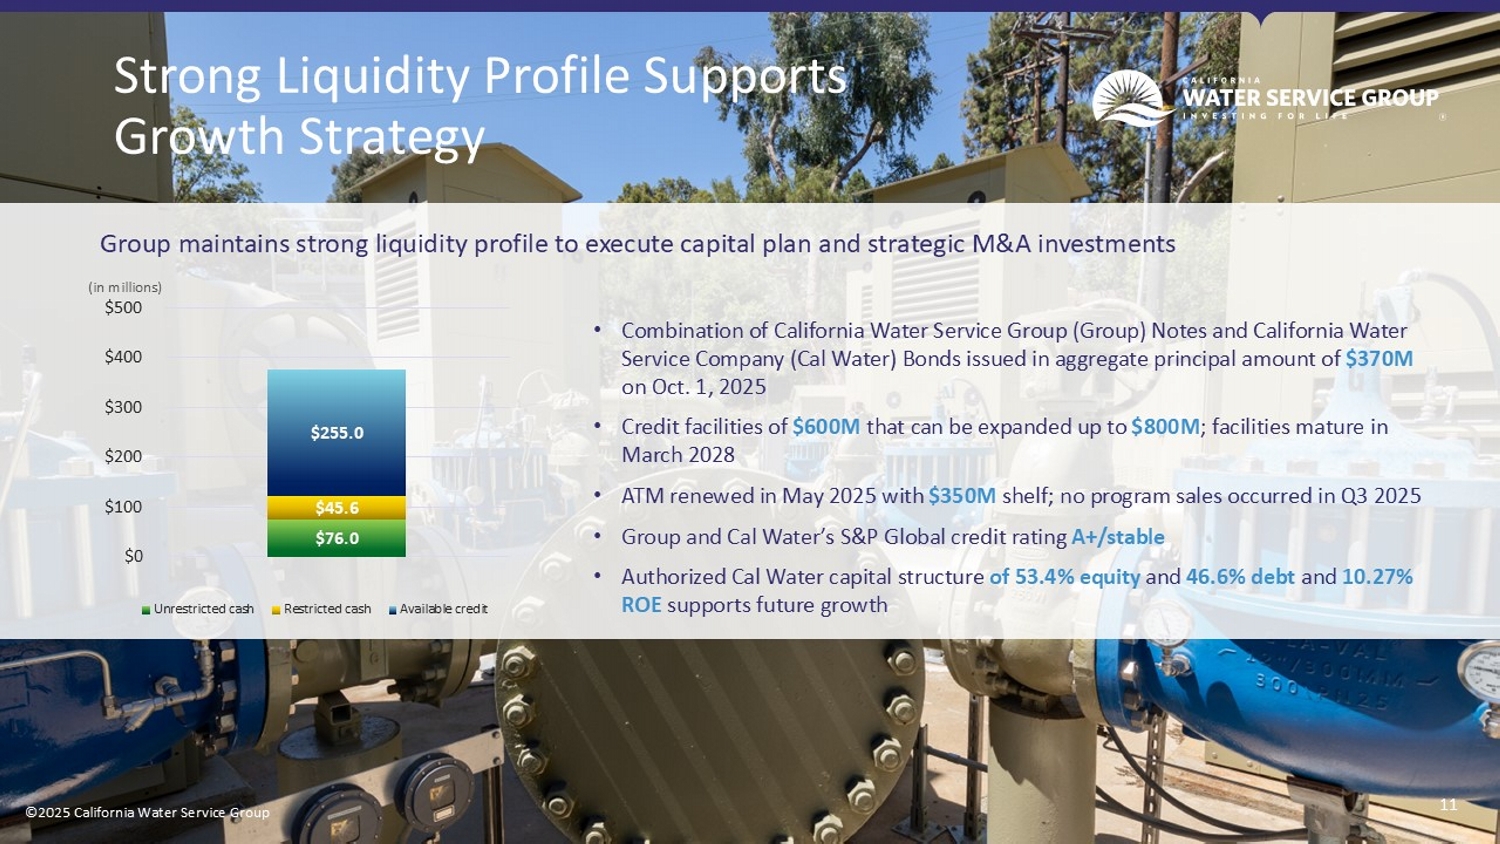
©2025 California Water Service Group 11 ©2025 California Water Service Group Strong Liquidity Profile Supports Growth Strategy Group maintains strong liquidity profile to execute capital plan and strategic M&A investments • Combination of California Water Service Group (Group) Notes and California Water Service Company (Cal Water) Bonds issued in aggregate principal amount of $370M on Oct.
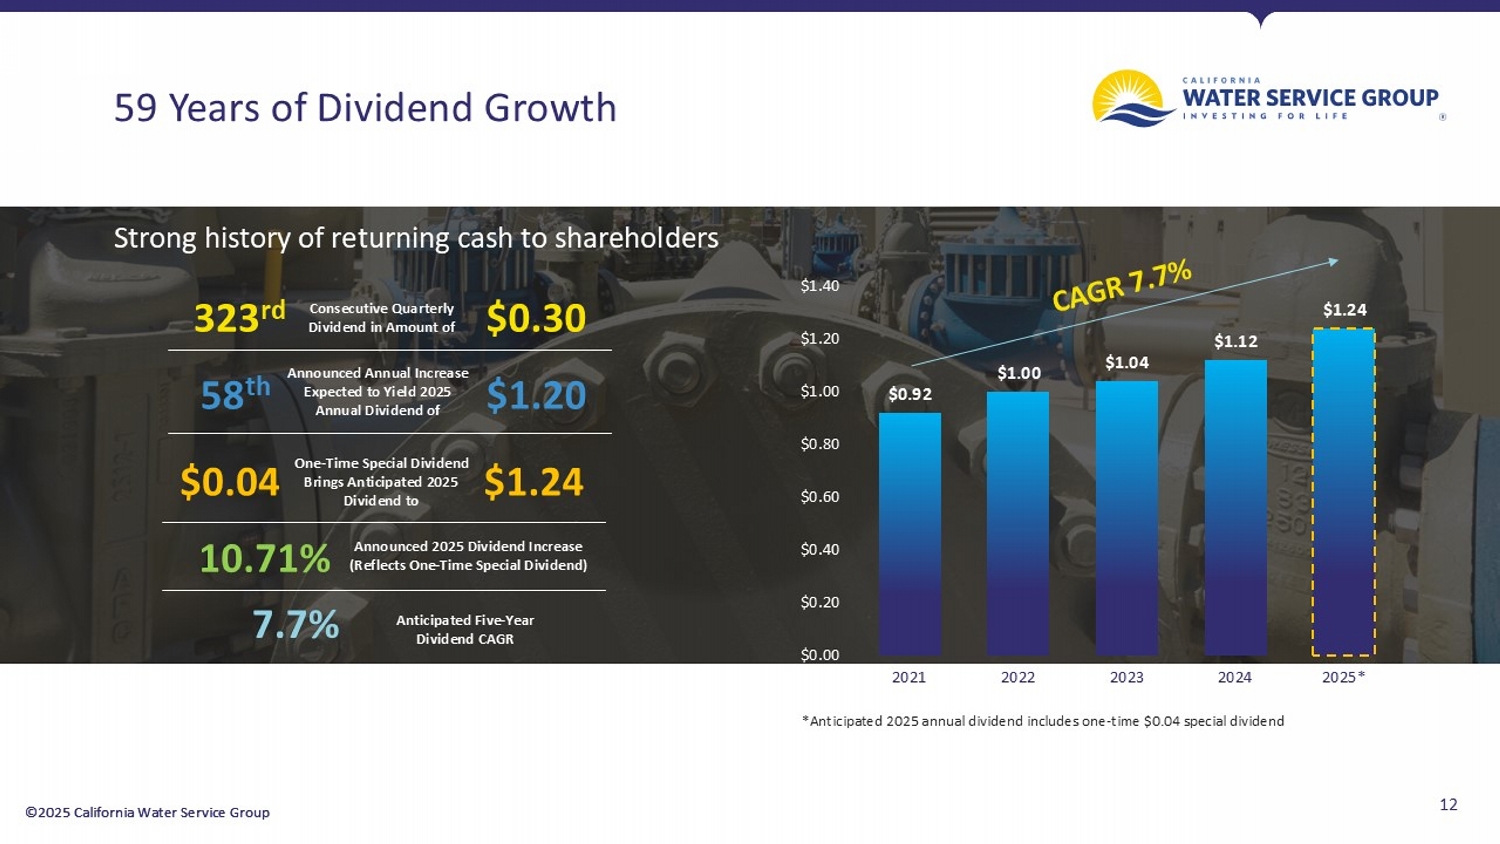
1, 2025 • Credit facilities of $600M that can be expanded up to $ 800M ; facilities mature in March 2028 • ATM renewed in May 2025 with $350M shelf; no program sales occurred in Q3 2025 • Group and Cal Water’s S&P Global credit rating A+/stable • Authorized Cal Water capital structure of 53.4% equity and 46.6% debt and 10.27% ROE supports future growth (in millions) $76.0 $45.6 $255.0 $0 $100 $200 $300 $400 $500 Unrestricted cash Restricted cash Available credit ©2025 California Water Service Group 12 ©2025 California Water Service Group 59 Years of Dividend Growth Strong history of returning cash to shareholders $0.92 $1.00 $1.04 $1.12 $1.24 $0.00 $0.20 $0.40 $0.60 $0.80 $1.00 $1.20 $1.40 2021 2022 2023 2024 2025* *Anticipated 2025 annual dividend includes one - time $0.04 special dividend 323 rd $0.30 Consecutive Quarterly Dividend in Amount of 58 th $1.20 Announced Annual Increase Expected to Yield 2025 Annual Dividend of $0.04 $1.24 One - Time Special Dividend Brings Anticipated 2025 Dividend to 10.71% Announced 2025 Dividend Increase (Reflects One - Time Special Dividend) 7.7% Anticipated Five - Year Dividend CAGR ©2025 California Water Service Group 13 Expanding Footprint in a Priority Growth Region: Texas 19,000+ Total connected & committed customers in 2025 20,000+ Additional likely customers in existing service areas 100,000+ Additional potential customers near existing service areas 2,000 2,000 2,800 4,200 5,000 2,000 3,000 8,500 10,000 14,000 0 5,000 10,000 15,000 20,000 2021 2022 2023 2024 2025* Anticipated Customer Growth Connected Committed *Estimated customer counts based on developer buildout schedules and connection deposits.
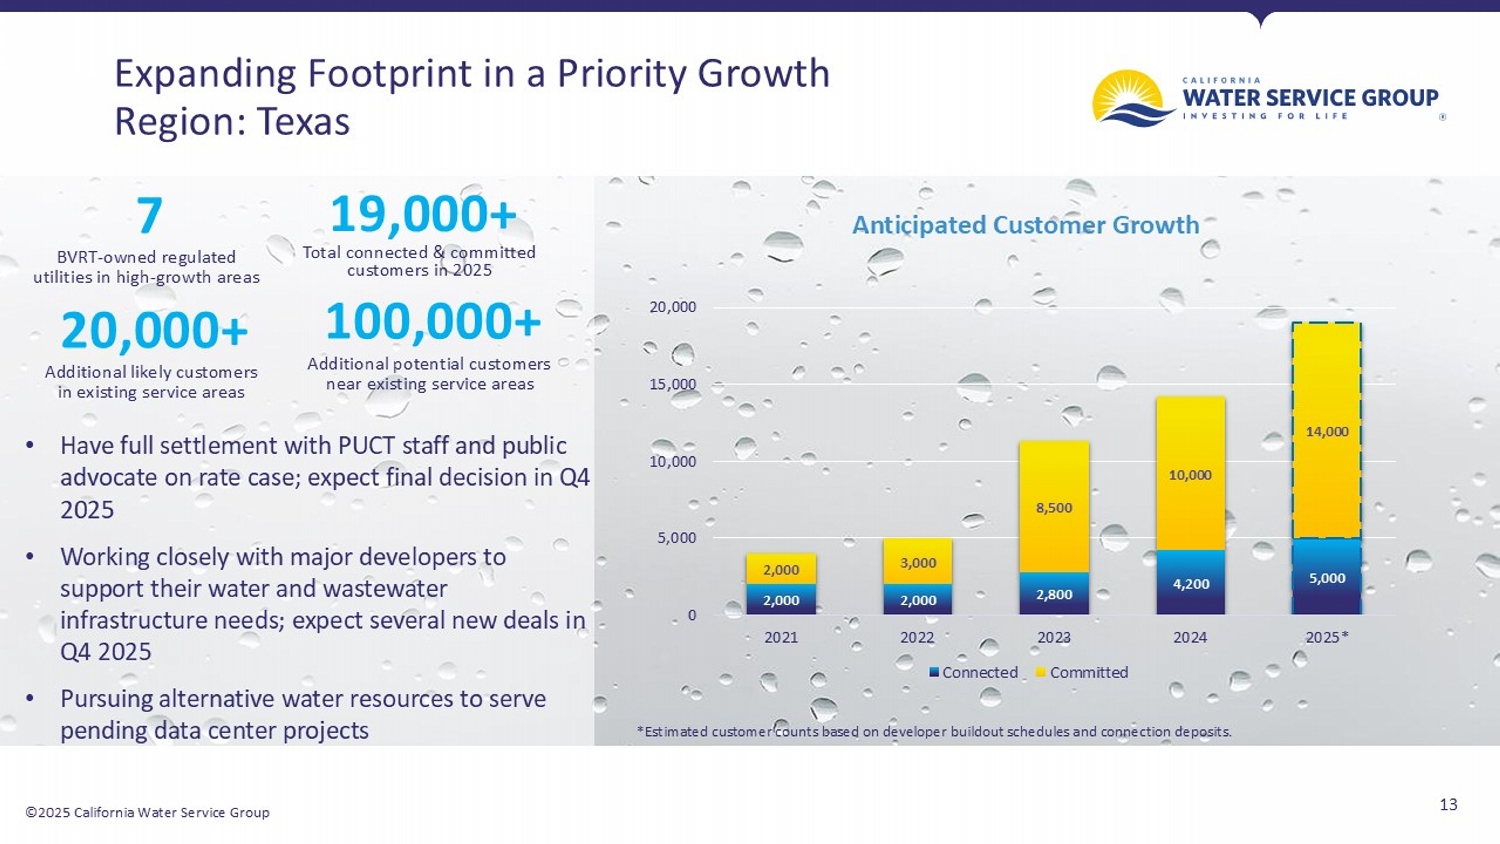
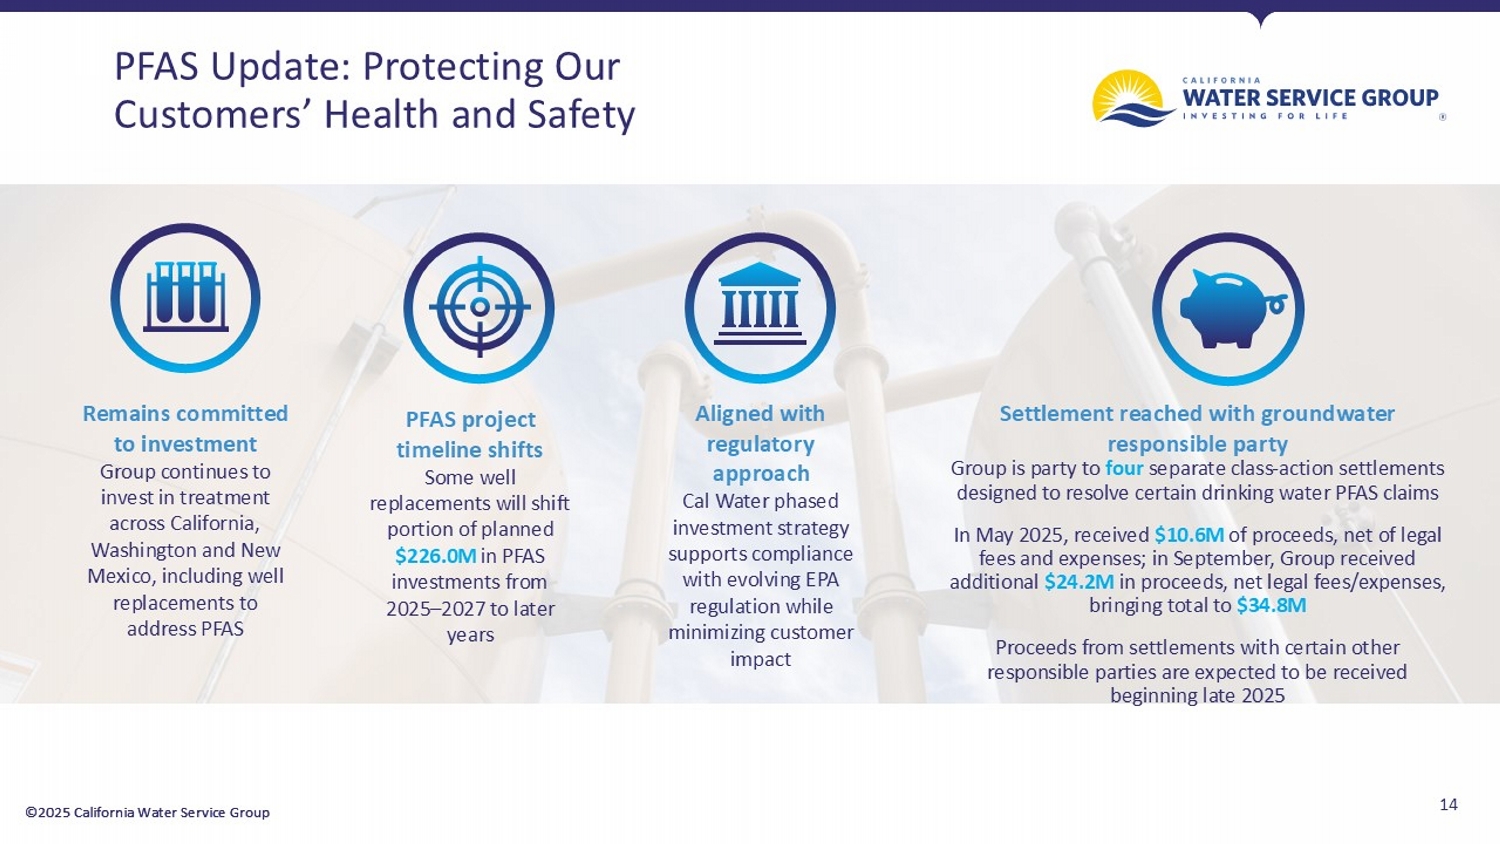
7 BVRT - owned regulated utilities in high - growth areas • Have full settlement with PUCT staff and public advocate on rate case; expect final decision in Q4 2025 • Working closely with major developers to support their water and wastewater infrastructure needs; expect several new deals in Q4 2025 • Pursuing alternative water resources to serve pending data center projects ©2025 California Water Service Group 14 ©2025 California Water Service Group PFAS Update: Protecting Our Customers’ Health and Safety Remains committed to investment Group continues to invest in treatment across California, Washington and New Mexico, including well replacements to address PFAS PFAS project timeline shifts Some well replacements will shift portion of planned $ 226.0M in PFAS investments from 2025 – 2027 to later years Aligned with regulatory approach Cal Water phased investment strategy supports compliance with evolving EPA regulation while minimizing customer impact Settlement reached with groundwater responsible party Group is party to four separate class - action settlements designed to resolve certain drinking water PFAS claims In May 2025, received $10.6M of proceeds, net of legal fees and expenses; in September, Group received additional $24.2M in proceeds, net legal fees/expenses, bringing total to $34.8M Proceeds from settlements with certain other responsible parties are expected to be received beginning late 2025 ©2025 California Water Service Group 15 ©2025 California Water Service Group 2024 California General Rate Case $ 1.6B Investment proposed in Cal Water from 2025 - 2027 18 (anticipated) Month - long process underway for triennial rate case filing with CPUC LUWEP Application proposes Low - Use Water Equity Program that would decouple revenue from water sales to enhance affordability May 2025 June 2025 July 2025 August 2025 October 2025 Key updates since filing Hearings are held before Administrative Law Judge (ALJ) Parties to proceeding respond to ALJ’s request for additional information Parties file briefs & reply briefs Final law & motion hearing; ALJ to draft Proposed Decision Requests rate adjustments necessary to generate total revenue increases of: 2026 2027 2028 $ 140.6M (17.1%) $ 83.6M (8.1%) $ 72.4M (7.7%) ALJ requests more time, approves interim rates & memo account

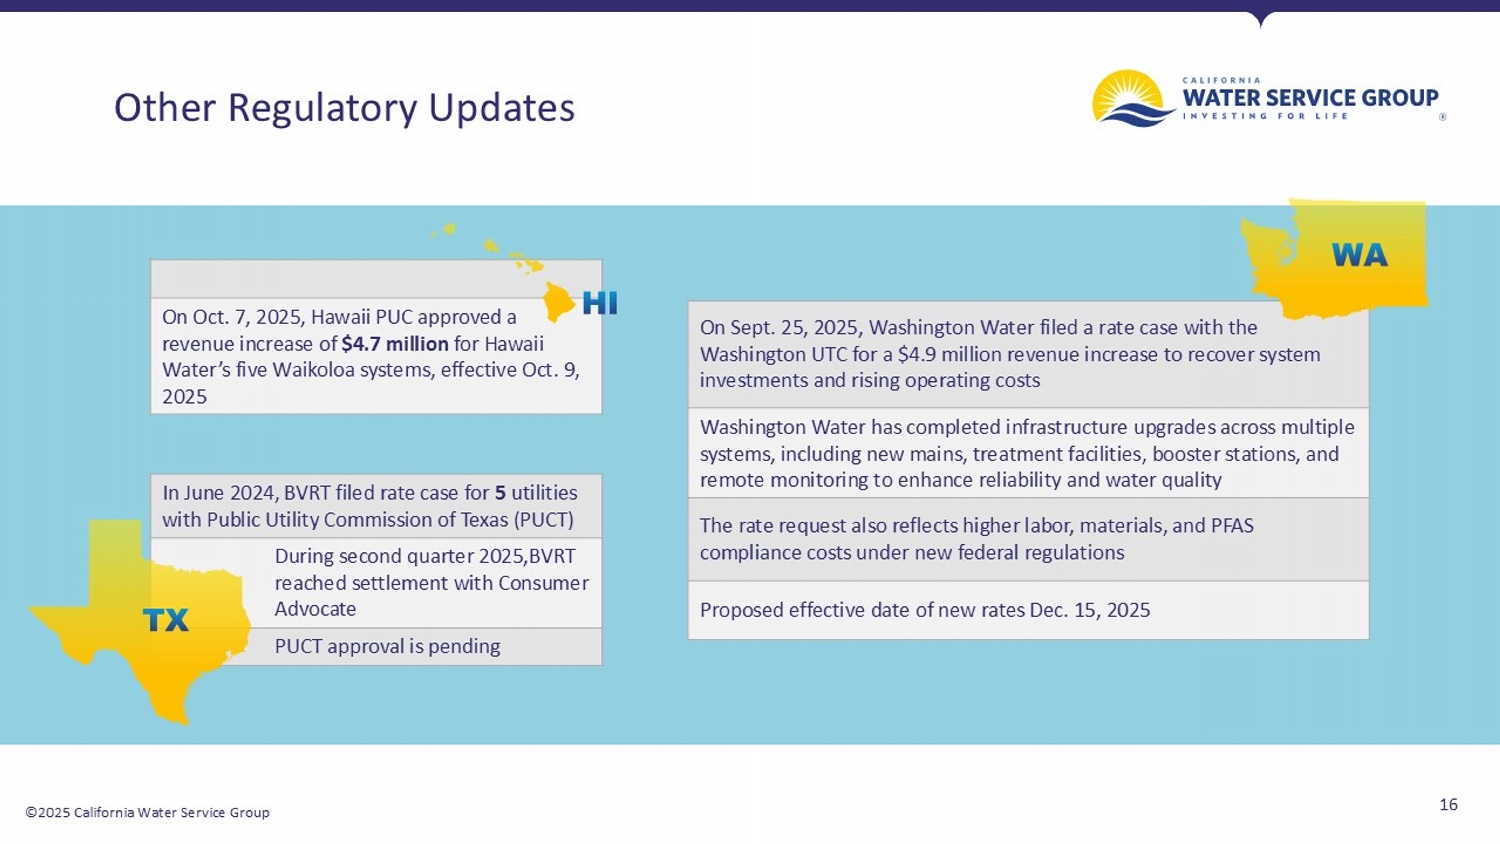
©2025 California Water Service Group 16 Other Regulatory Updates On Oct. 7, 2025, Hawaii PUC approved a revenue increase of $4.7 million for Hawaii Water’s five Waikoloa systems, effective Oct. 9, 2025 In June 2024, BVRT filed rate case for 5 utilities with Public Utility Commission of Texas ( PUCT ) During second quarter 2025,BVRT reached settlement with Consumer Advocate PUCT approval is pending On Sept. 25, 2025, Washington Water filed a rate case with the Washington UTC for a $4.9 million revenue increase to recover system investments and rising operating costs Washington Water has completed infrastructure upgrades across multiple systems, including new mains, treatment facilities, booster stations, and remote monitoring to enhance reliability and water quality The rate request also reflects higher labor, materials, and PFAS compliance costs under new federal regulations Proposed effective date of new rates Dec . 15, 2025 ©2025 California Water Service Group 17 ©2025 California Water Service Group APPENDIX

©2025 California Water Service Group 18 The Company’s revenue, net income, and diluted earnings per share are prepared in accordance with Generally Accepted Accounting Principles (GAAP) and represent amounts reported on filings with the Securities and Exchange Commission. Adjusted revenue, net income, and diluted earnings per share in YTD 2024 are non - GAAP financial measures representing GAAP balances that, in this presentation, are adjusted for the effects of 2023 interim rate relief related to the delayed 2021 California GRC recorded by the Company in March 2024. These non - GAAP financial measures are provided as additional information for investors and analysts to better assess the Company’s 2024 financial performance normalize for the impact of the 2023 interim rate relief on 2024 reported results. Management also uses these non - GAAP financial measures in evaluating the Company’s performance. These non - GAAP financial measures may be different from non - GAAP financial measures used by other companies, even when the same or similarly titled terms are used to identify such measures, limiting their usefulness for comparative purposes. Further, these non - GAAP financial measures should be considered as a supplement to the financial information prepared on a GAAP basis rather than an alternative to the respective GAAP measures.
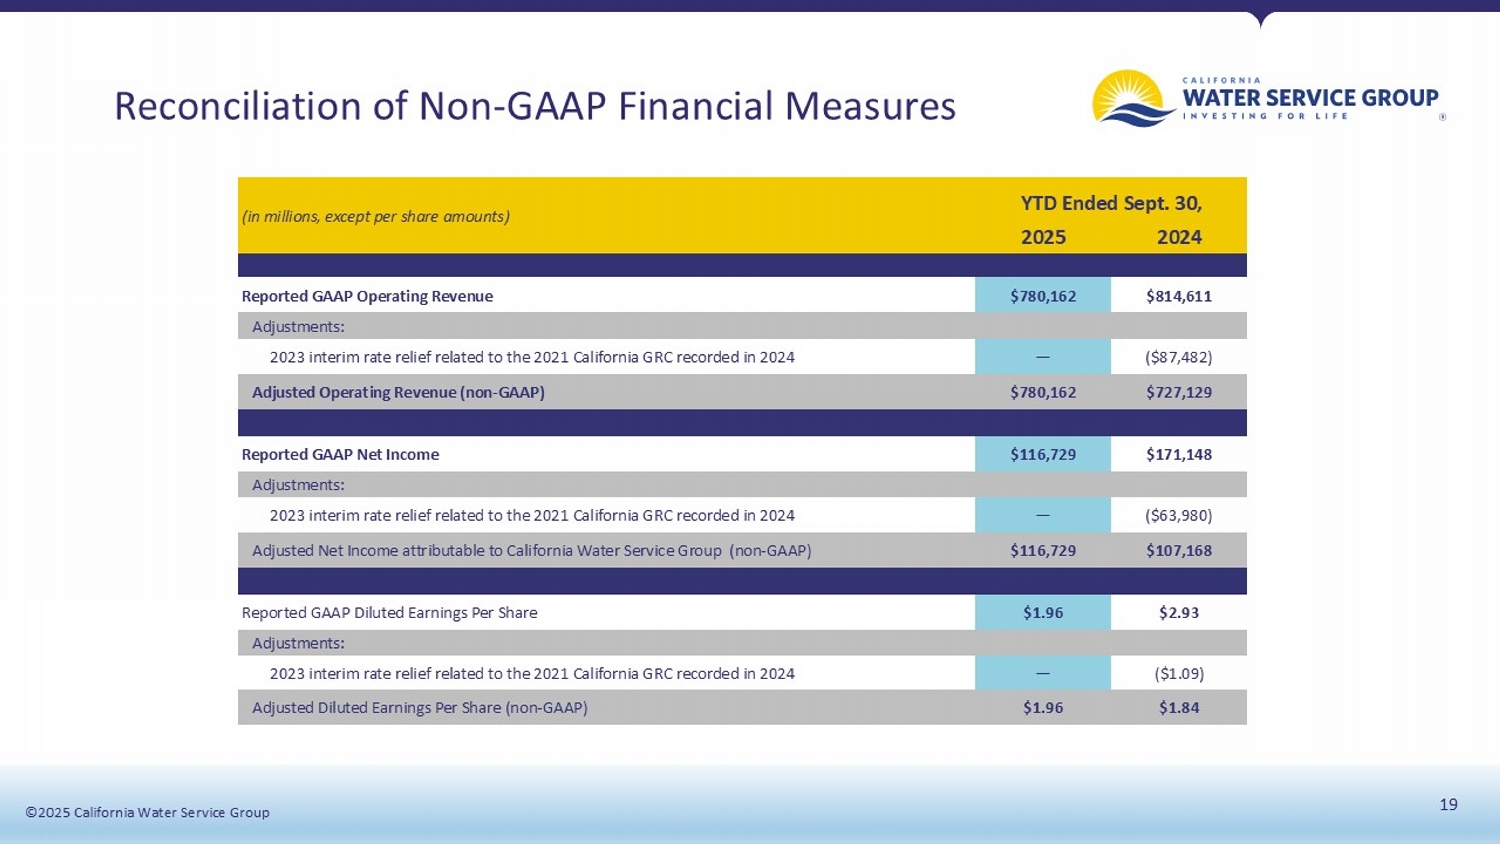
Non - GAAP Financial Measures ©2025 California Water Service Group ©2025 California Water Service Group 19 Reconciliation of Non - GAAP Financial Measures YTD Ended Sept. 30, (in millions, except per share amounts) 2024 2025 $814,611 $780,162 Reported GAAP Operating Revenue Adjustments: ($87,482) — 2023 interim rate relief related to the 2021 California GRC recorded in 2024 $727,129 $780,162 Adjusted Operating Revenue (non - GAAP) $171,148 $116,729 Reported GAAP Net Income Adjustments: ($63,980) — 2023 interim rate relief related to the 2021 California GRC recorded in 2024 $107,168 $116,729 Adjusted Net Income attributable to California Water Service Group (non - GAAP) $2.93 $1.96 Reported GAAP Diluted Earnings Per Share Adjustments: ($1.09) — 2023 interim rate relief related to the 2021 California GRC recorded in 2024 $1.84 $1.96 Adjusted Diluted Earnings Per Share (non - GAAP)