UNITED STATES
SECURITIES AND EXCHANGE COMMISSION
Washington, D.C. 20549
FORM 8-K
CURRENT REPORT
PURSUANT TO SECTION 13 OR 15(d) OF
THE SECURITIES EXCHANGE ACT OF 1934
Date of Report (Date of earliest event reported) October 30, 2025
| Commission | Registrant; State of Incorporation; | IRS Employer | ||
| File Number | Address; and Telephone Number | Identification No. | ||
| 1-9513 |
CMS ENERGY CORPORATION (A Michigan Corporation) |
38-2726431 | ||
| 1-5611 |
CONSUMERS ENERGY COMPANY (A
Michigan Corporation) |
38-0442310 |
Check the appropriate box below if the Form 8-K filing is intended to simultaneously satisfy the filing obligation of the registrant under any of the following provisions:
¨ Written communications pursuant to Rule 425 under the Securities Act (17 CFR 230.425)
¨ Soliciting material pursuant to Rule 14a-12 under the Exchange Act (17 CFR 240.14a-12)
¨ Pre-commencement communications pursuant to Rule 14d-2(b) under the Exchange Act (17 CFR 240.14d-2(b))
¨ Pre-commencement communications pursuant to Rule 13e-4(c) under the Exchange Act (17 CFR 240.13e-4(c))
Securities registered pursuant to Section 12(b) of the Act:
| Title of each class | Trading Symbol(s) | Name of each exchange on which registered |
||
| CMS Energy Corporation Common Stock, $0.01 par value | CMS | New York Stock Exchange | ||
| CMS Energy Corporation 5.625% Junior Subordinated Notes due 2078 | CMSA | New York Stock Exchange | ||
| CMS Energy Corporation 5.875% Junior Subordinated Notes due 2078 | CMSC | New York Stock Exchange | ||
| CMS Energy Corporation 5.875% Junior Subordinated Notes due 2079 | CMSD | New York Stock Exchange | ||
| CMS Energy Corporation, Depositary Shares, each representing a 1/1,000th interest in a share of 4.200% Cumulative Redeemable Perpetual Preferred Stock, Series C | CMS PRC | New York Stock Exchange | ||
| Consumers Energy Company Cumulative Preferred Stock, $100 par value: $4.50 Series | CMS-PB | New York Stock Exchange |
Indicate by check mark whether the registrant is an emerging growth company as defined in Rule 405 of the Securities Act of 1933 (§230.405 of this chapter) or Rule 12b-2 of the Securities Exchange Act of 1934 (§240.12b-2 of this chapter). Emerging growth company: CMS Energy Corporation ¨ Consumers Energy Company ¨
If an emerging growth company, indicate by check mark if the registrant has elected not to use the extended transition period for complying with any new or revised financial accounting standards provided pursuant to Section 13(a) of the Exchange Act. CMS Energy Corporation ¨ Consumers Energy Company ¨
Item 2.02. Results of Operations and Financial Condition.
On October 30, 2025, CMS Energy Corporation (“CMS Energy”) issued a News Release, in which it announced its 2025 third quarter results. Attached as Exhibit 99.1 to this report and incorporated herein by reference is a copy of the CMS Energy News Release, furnished as a part of this report.
Exhibit 99.1 contains certain financial measures that are considered “non-GAAP financial measures” as defined in Securities and Exchange Commission rules. Other than forward-looking earnings guidance, Exhibit 99.1 contains a reconciliation of these non-GAAP financial measures to their most directly comparable financial measures calculated and presented in accordance with accounting principles generally accepted in the United States. Adjustments could include items such as discontinued operations, asset sales, impairments, restructuring costs, business optimization initiative, major enterprise resource planning software implementations, changes in accounting principles, voluntary separation program, changes in federal and state tax policy, regulatory items from prior years, unrealized gains or losses from mark-to-market adjustments, recognized in net income related to NorthStar Clean Energy's interest expense, or other items. Management views adjusted earnings as a key measure of CMS Energy’s present operating financial performance and uses adjusted earnings for external communications with analysts and investors. Internally, CMS Energy uses adjusted earnings to measure and assess performance. Because CMS Energy is not able to estimate the impact of specific line items, which have the potential to significantly impact, favorably or unfavorably, reported earnings in future periods, Exhibit 99.1 does not contain reported earnings guidance nor a reconciliation for the comparable future period earnings. The adjusted earnings should be considered supplemental information to assist in understanding our business results, rather than as a substitute for the reported earnings. All references to net income refer to net income available to common stockholders and references to earnings per share are on a diluted basis.
Item 7.01. Regulation FD Disclosure.
The information set forth in the CMS Energy News Release dated October 30, 2025, attached as Exhibit 99.1, is incorporated by reference in response to this Item 7.01.
CMS Energy will hold a webcast to discuss its 2025 third quarter results and provide a business and financial outlook on October 30 at 9:30 a.m. (ET). A copy of the CMS Energy presentation is furnished as Exhibit 99.2 to this report. A webcast of the presentation will be available on the CMS Energy website, www.cmsenergy.com.
In accordance with General Instruction B.2 of Form 8-K, the information in this Current Report on Form 8-K, including Exhibits 99.1 and 99.2, shall not be deemed “filed” for the purposes of Section 18 of the Securities Exchange Act of 1934, or otherwise subject to the liabilities of that section, nor shall it be deemed incorporated by reference in any filing under the Securities Act of 1933.
Investors and others should note that CMS Energy routinely posts important information on its website and considers the Investor Relations section, www.cmsenergy.com/investor-relations, a channel of distribution.
Item 9.01. Financial Statements and Exhibits.
(d) Exhibits.
| Exhibit Index | ||
| 99.1 | CMS Energy News Release dated October 30, 2025 | |
| 99.2 | CMS Energy presentation dated October 30, 2025 | |
| 104 | Cover Page Interactive Data File (the cover page XBRL tags are embedded in the Inline XBRL document). | |
SIGNATURES
Pursuant to the requirements of the Securities Exchange Act of 1934, the Registrants have duly caused this report to be signed on their behalf by the undersigned hereunto duly authorized.
| CMS ENERGY CORPORATION | ||
| Dated: October 30, 2025 | By: | /s/ Rejji P. Hayes |
| Rejji P. Hayes | ||
| Executive Vice President and Chief Financial Officer | ||
| CONSUMERS ENERGY COMPANY | ||
| Dated: October 30, 2025 | By: | /s/ Rejji P. Hayes |
| Rejji P. Hayes | ||
| Executive Vice President and Chief Financial Officer | ||
Exhibit 99.1

CMS Energy Announces Strong Third Quarter Results, Raises 2025 Adjusted EPS, Initiates 2026 Guidance
JACKSON, Mich., Oct. 30, 2025 – CMS Energy announced today reported earnings per share of $0.92 for the third quarter of 2025, compared to $0.84 per share for 2024. The company’s adjusted earnings per share for the third quarter were $0.93, compared to $0.84 per share for the same quarter in 2024. For the first nine months of the year, the company reported $2.59 per share compared to $2.45 per share for the same timeframe in 2024. The company’s adjusted earnings per share on a year-to-date basis were $2.66 in 2025, compared to $2.47 in 2024, largely due to constructive regulatory outcomes and favorable weather.
CMS Energy raised its 2025 adjusted earnings guidance to $3.56 to $3.60 per share from $3.54 to $3.60 per share* (*See below for important information about non-GAAP measures). The company also initiated 2026 adjusted earnings guidance of $3.80 to $3.87 per share and reaffirmed its long-term adjusted EPS growth of 6 to 8 percent, with continued confidence toward the high end.
“CMS Energy continues to build on its strong track record of constructive regulatory outcomes, as demonstrated by recent orders in our natural gas rate case and Renewable Energy Plan filing,” said Garrick Rochow, President and CEO of CMS Energy and Consumers Energy. “With a clear plan for long-term customer value and earnings growth, the company is well positioned to achieve our operational and financial goals for all stakeholders.”
CMS Energy (NYSE: CMS) is a Michigan-based energy provider featuring Consumers Energy as its primary business. It also owns and operates independent power generation businesses.
# # #
CMS Energy will hold a webcast to discuss its 2025 third quarter results and provide a business and financial outlook on Thursday, October 30 at 9:30 a.m. (EDT). To participate in the webcast, go to CMS Energy’s homepage (cmsenergy.com) and select “Events and Presentations.”
Important information for investors about non-GAAP measures and other disclosures.
This news release contains non-Generally Accepted Accounting Principles (non-GAAP) measures, such as adjusted earnings. All references to net income refer to net income available to common stockholders and references to earnings per share are on a diluted basis. Adjustments could include items such as discontinued operations, asset sales, impairments, restructuring costs, business optimization initiative, major enterprise resource planning software implementations, changes in accounting principles, voluntary separation program, changes in federal and state tax policy, regulatory items from prior years, unrealized gains or losses from mark-to-market adjustments, recognized in net income related to NorthStar Clean Energy's interest expense, or other items. Management views adjusted earnings as a key measure of the company's present operating financial performance and uses adjusted earnings for external communications with analysts and investors. Internally, the company uses adjusted earnings to measure and assess performance. Because the company is not able to estimate the impact of specific line items, which have the potential to significantly impact, favorably or unfavorably, the company's reported earnings in future periods, the company is not providing reported earnings guidance nor is it providing a reconciliation for the comparable future period earnings. The company's adjusted earnings should be considered supplemental information to assist in understanding our business results, rather than as a substitute for the reported earnings.
This news release contains "forward-looking statements." The forward-looking statements are subject to risks and uncertainties that could cause CMS Energy's and Consumers Energy's results to differ materially. All forward-looking statements should be considered in the context of the risk and other factors detailed from time to time in CMS Energy's and Consumers Energy's Securities and Exchange Commission filings.
Investors and others should note that CMS Energy routinely posts important information on its website and considers the Investor Relations section, www.cmsenergy.com/investor-relations, a channel of distribution.
Media Contacts: Katie Carey, 517/740-1739
Investment Analyst Contact: Travis Uphaus, 517/817-9241
Page 1 of 3
CMS ENERGY CORPORATION
Consolidated Statements of Income
(Unaudited)
| In Millions, Except Per Share Amounts | ||||||||||||||||
| Three Months Ended | Nine Months Ended | |||||||||||||||
| 9/30/25 | 9/30/24 | 9/30/25 | 9/30/24 | |||||||||||||
| Operating revenue | $ | 2,021 | $ | 1,743 | $ | 6,306 | $ | 5,526 | ||||||||
| Operating expenses | 1,540 | 1,376 | 5,014 | 4,464 | ||||||||||||
| Operating Income | 481 | 367 | 1,292 | 1,062 | ||||||||||||
| Other income | 62 | 84 | 249 | 283 | ||||||||||||
| Interest charges | 203 | 178 | 588 | 528 | ||||||||||||
| Income Before Income Taxes | 340 | 273 | 953 | 817 | ||||||||||||
| Income tax expense | 68 | 26 | 193 | 125 | ||||||||||||
| Net Income | 272 | 247 | 760 | 692 | ||||||||||||
| Loss attributable to noncontrolling interests | (5 | ) | (6 | ) | (22 | ) | (46 | ) | ||||||||
| Net Income Attributable to CMS Energy | 277 | 253 | 782 | 738 | ||||||||||||
| Preferred stock dividends | 2 | 2 | 7 | 7 | ||||||||||||
| Net Income Available to Common Stockholders | $ | 275 | $ | 251 | $ | 775 | $ | 731 | ||||||||
| Diluted Earnings Per Average Common Share | $ | 0.92 | $ | 0.84 | $ | 2.59 | $ | 2.45 | ||||||||
Page 2 of 3
CMS ENERGY CORPORATION
Summarized Consolidated Balance Sheets
(Unaudited)
| In Millions | ||||||||
| As of | ||||||||
| 9/30/25 | 12/31/24 | |||||||
| Assets | ||||||||
| Current assets | ||||||||
| Cash and cash equivalents | $ | 362 | $ | 103 | ||||
| Restricted cash and cash equivalents | 70 | 75 | ||||||
| Other current assets | 2,313 | 2,612 | ||||||
| Total current assets | 2,745 | 2,790 | ||||||
| Non-current assets | ||||||||
| Plant, property, and equipment | 29,690 | 27,461 | ||||||
| Other non-current assets | 5,573 | 5,669 | ||||||
| Total Assets | $ | 38,008 | $ | 35,920 | ||||
| Liabilities and Equity | ||||||||
| Current liabilities (1) | $ | 1,890 | $ | 2,261 | ||||
| Non-current liabilities (1) | 8,614 | 8,345 | ||||||
| Capitalization | ||||||||
| Debt and finance leases (excluding securitization debt) (2) | 17,473 | 15,866 | ||||||
| Preferred stock and securities | 224 | 224 | ||||||
| Noncontrolling interests | 567 | 518 | ||||||
| Common stockholders' equity | 8,640 | 8,006 | ||||||
| Total capitalization (excluding securitization debt) | 26,904 | 24,614 | ||||||
| Securitization debt (2) | 600 | 700 | ||||||
| Total Liabilities and Equity | $ | 38,008 | $ | 35,920 | ||||
| (1) | Excludes debt and finance leases. |
| (2) | Includes current and non-current portions. |
CMS ENERGY CORPORATION
Summarized Consolidated Statements of Cash Flows
(Unaudited)
| In Millions | ||||||||
| Nine Months Ended | ||||||||
| 9/30/25 | 9/30/24 | |||||||
| Beginning of Period Cash and Cash Equivalents, Including Restricted Amounts | $ | 178 | $ | 248 | ||||
| Net cash provided by operating activities | 1,757 | 1,967 | ||||||
| Net cash used in investing activities | (2,926 | ) | (2,101 | ) | ||||
| Cash flows from operating and investing activities | (1,169 | ) | (134 | ) | ||||
| Net cash provided by financing activities | 1,423 | 353 | ||||||
| Total Cash Flows | $ | 254 | $ | 219 | ||||
| End of Period Cash and Cash Equivalents, Including Restricted Amounts | $ | 432 | $ | 467 | ||||
Page 3 of 3
CMS ENERGY CORPORATION
Reconciliation of GAAP Net Income to Non-GAAP Adjusted Net Income
(Unaudited)
| In Millions, Except Per Share Amounts | ||||||||||||||||
| Three Months Ended | Nine Months Ended | |||||||||||||||
| 9/30/25 | 9/30/24 | 9/30/25 | 9/30/24 | |||||||||||||
| Net Income Available to Common Stockholders | $ | 275 | $ | 251 | $ | 775 | $ | 731 | ||||||||
| Reconciling items: | ||||||||||||||||
| Other exclusions from adjusted earnings** | 6 | * | 14 | 6 | ||||||||||||
| Tax impact | (2 | ) | (*) | (4 | ) | (1 | ) | |||||||||
| State tax policy change | - | - | 12 | - | ||||||||||||
| Voluntary separation program | - | - | - | * | ||||||||||||
| Tax impact | - | - | - | (*) | ||||||||||||
| Adjusted net income – non-GAAP | $ | 279 | $ | 251 | $ | 797 | $ | 736 | ||||||||
| Average Common Shares Outstanding - Diluted | 300.4 | 298.8 | 299.4 | 298.2 | ||||||||||||
| Diluted Earnings Per Average Common Share | ||||||||||||||||
| Reported net income per share | $ | 0.92 | $ | 0.84 | $ | 2.59 | $ | 2.45 | ||||||||
| Reconciling items: | ||||||||||||||||
| Other exclusions from adjusted earnings** | 0.02 | * | 0.04 | 0.02 | ||||||||||||
| Tax impact | (0.01 | ) | (*) | (0.01 | ) | (*) | ||||||||||
| State tax policy change | - | - | 0.04 | - | ||||||||||||
| Voluntary separation program | - | - | - | * | ||||||||||||
| Tax impact | - | - | - | (*) | ||||||||||||
| Adjusted net income per share – non-GAAP | $ | 0.93 | $ | 0.84 | $ | 2.66 | $ | 2.47 | ||||||||
| * | Less than $0.5 million or $0.01 per share. |
| ** | Includes restructuring costs and business optimization initiative. |
Management views adjusted (non-Generally Accepted Accounting Principles) earnings as a key measure of the Company's present operating financial performance and uses adjusted earnings for external communications with analysts and investors. Internally, the Company uses adjusted earnings to measure and assess performance. Adjustments could include items such as discontinued operations, asset sales, impairments, restructuring costs, business optimization initiative, major enterprise resource planning software implementations, changes in accounting principles, voluntary separation program, changes in federal and state tax policy, regulatory items from prior years, unrealized gains or losses from mark-to-market adjustments, recognized in net income related to NorthStar Clean Energy's interest expense, or other items. The adjusted earnings should be considered supplemental information to assist in understanding our business results, rather than as a substitute for reported earnings.
Exhibit 99.2

LEADING THE CLEAN ENERGY TRANSFORMATION 2025 Third Quarter Results & Outlook October 30, 2025
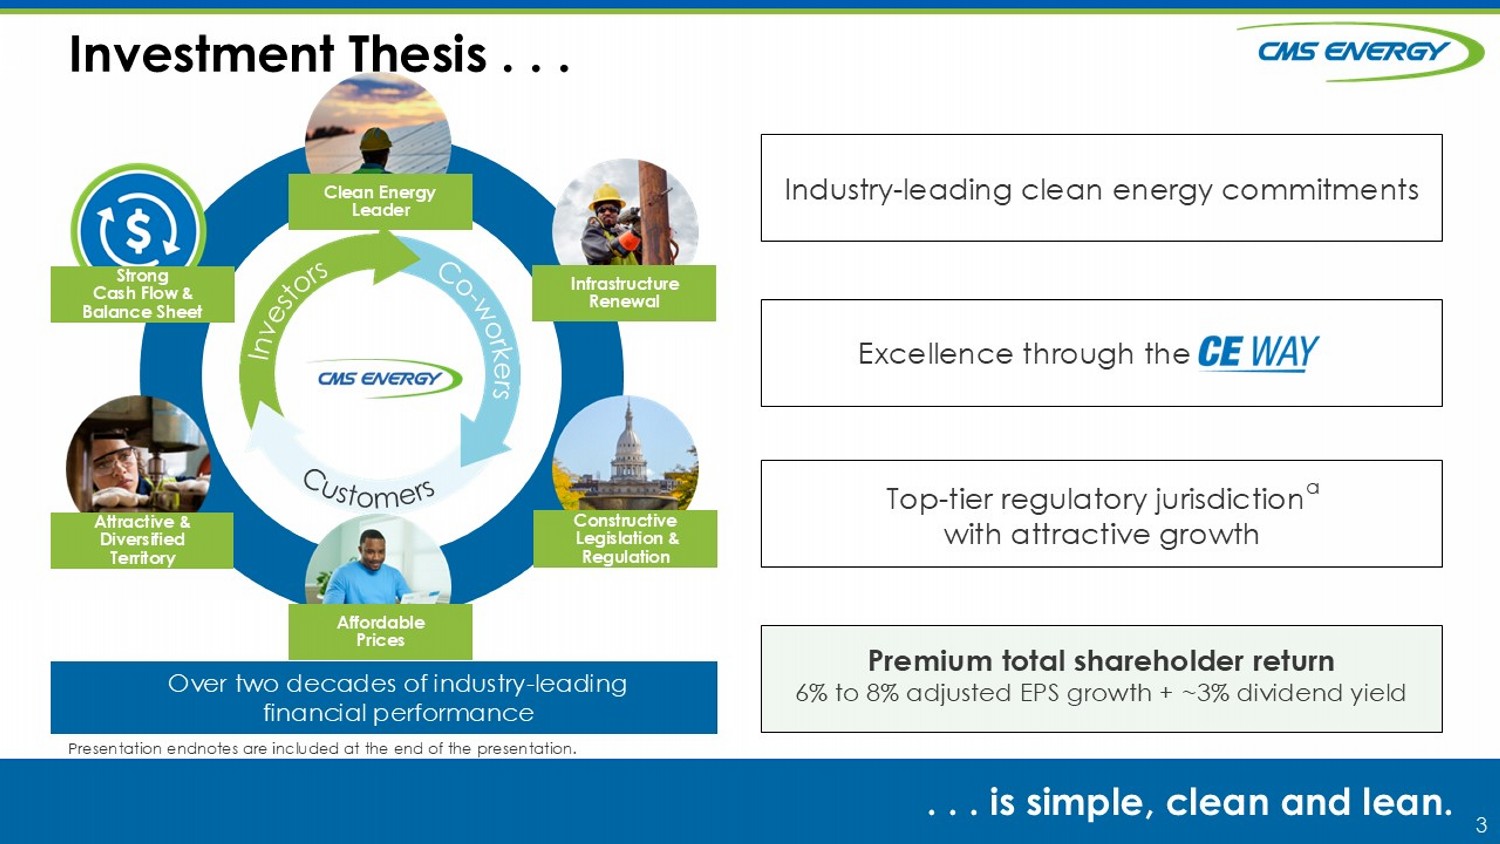
2 Enter “so what” if necessary – Century Gothic, Bold, Size 18 or smaller This presentation is made as of the date hereof and contains “forward - looking statements” as defined in Rule 3b - 6 of the Securit ies Exchange Act of 1934, Rule 175 of the Securities Act of 1933, and relevant legal decisions. The forward - looking statements are subject to risks and uncertainties. All forward - lo oking statements should be considered in the context of the risk and other factors detailed from time to time in CMS Energy’s and Consumers Energy’s Securities and Exchange Commissi on filings. Forward - looking statements should be read in conjunction with “FORWARD - LOOKING STATEMENTS AND INFORMATION” and “RISK FACTORS” sections of CMS Energy’s and Consumers Energy’s most recent Form 10 - K and as updated in reports CMS Energy and Consumers Energy file with the Securities and Exchange Commission. CMS Energy’s and Cons ume rs Energy’s “FORWARD - LOOKING STATEMENTS AND INFORMATION” and “RISK FACTORS” sections are incorporated herein by reference and discuss important factors th at could cause CMS Energy’s and Consumers Energy’s results to differ materially from those anticipated in such statements. CMS Energy and Consumers Energy undertake no ob ligation to update any of the information presented herein to reflect facts, events or circumstances after the date hereof. The presentation also includes non - GAAP measures when describing CMS Energy’s results of operations and financial performance. A reconciliation of each of these measures to the most directly comparable GAAP measure is included in the appendix and posted on our website at www.cmsenergy.com . Investors and others should note that CMS Energy routinely posts important information on its website and considers the Inves tor Relations section, www.cmsenergy.com/investor - relations , a channel of distribution. Presentation endnotes are included after the appendix. 2 3 Investment Thesis . . . . . . is simple, clean and lean. Over two decades of industry - leading financial performance Industry - leading c lean e nergy commitments Excellence through the Top - tier regulatory jurisdiction a with attractive growth Premium total shareholder r eturn 6% to 8% adjusted EPS growth + ~3% dividend yield Presentation endnotes are included at the end of the presentation. Strong Cash Flow & Balance Sheet Attractive & Diversified Territory Clean Energy Leader Infrastructure Renewal Constructive Legislation & Regulation Affordable Prices
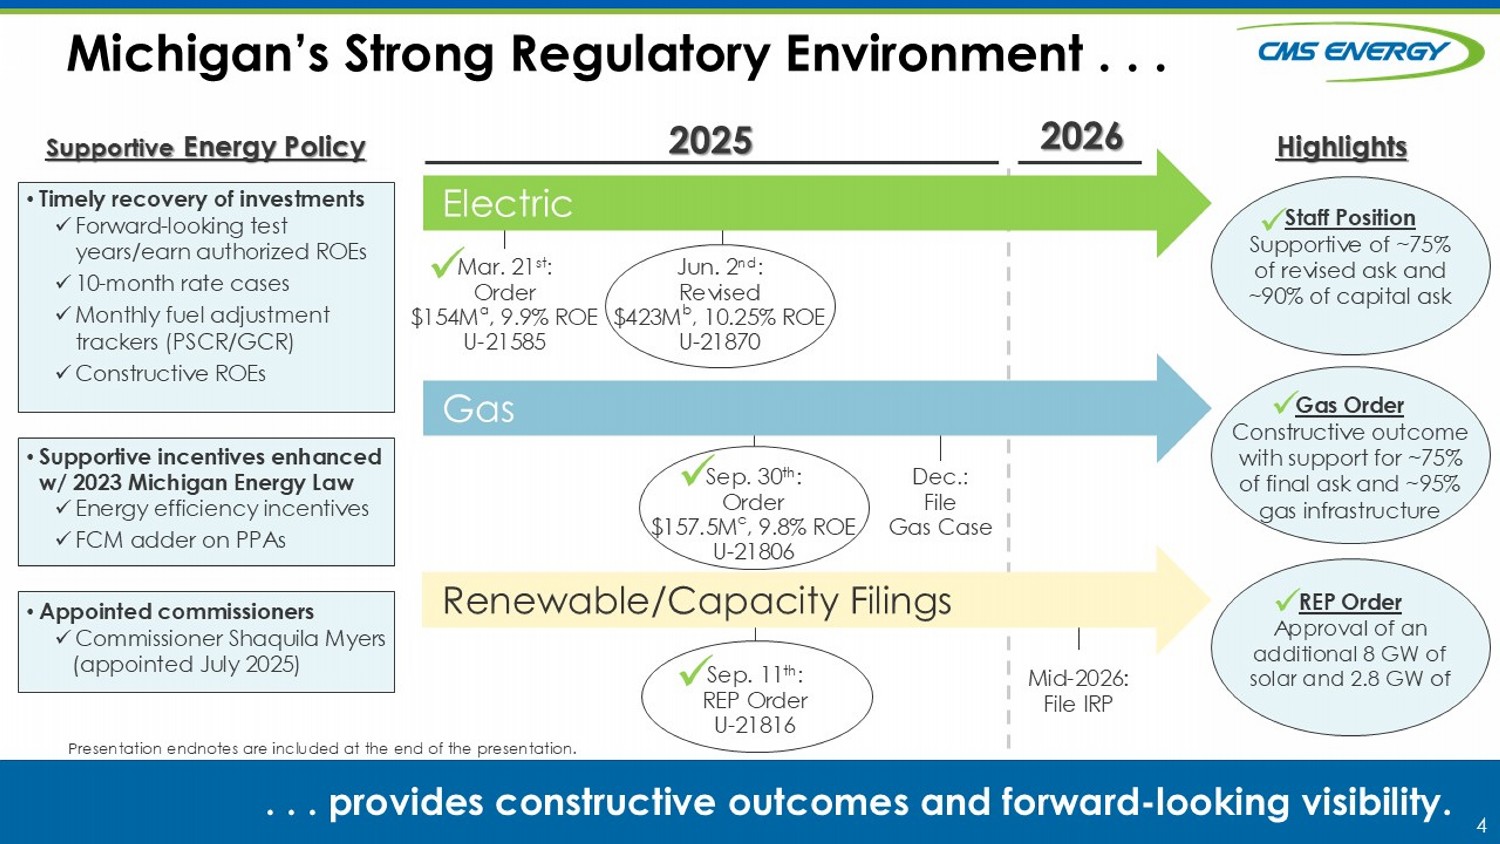
4 Dec.: File Gas Case Michigan’s Strong Regulatory Environment . . . . . . provides constructive outcomes and forward - looking visibility. Electric Gas Supportive Energy Policy • Timely recovery of investments x Forward - looking test years/earn authorized ROEs x 10 - month rate cases x Monthly fuel adjustment trackers (PSCR/GCR) x Constructive ROEs • Supportive incentives enhanced w/ 2023 Michigan Energy Law x Energy efficiency incentives x FCM adder on PPAs • Appointed commissioners x Commissioner Shaquila Myers (appointed July 2025) Renewable/Capacity Filings 2025 Mar. 21 st : Order $154M a , 9.9% ROE U - 21585 x Jun. 2 nd : Revised $423M b , 10.25% ROE U - 21870 Highlights x Staff Position Supportive of ~75% of revised ask and ~90% of capital ask REP Order Approval of an additional 8 GW of solar and 2.8 GW of x Gas Order Constructive outcome with support for ~7 5 % of final ask and ~95% gas infrastructure Sep. 11 th : REP Order U - 21816 x Sep . 30 th : Order $157.5M c , 9.8% ROE U - 21806 x x 2026 Mid - 2026: File IRP Presentation endnotes are included at the end of the presentation.
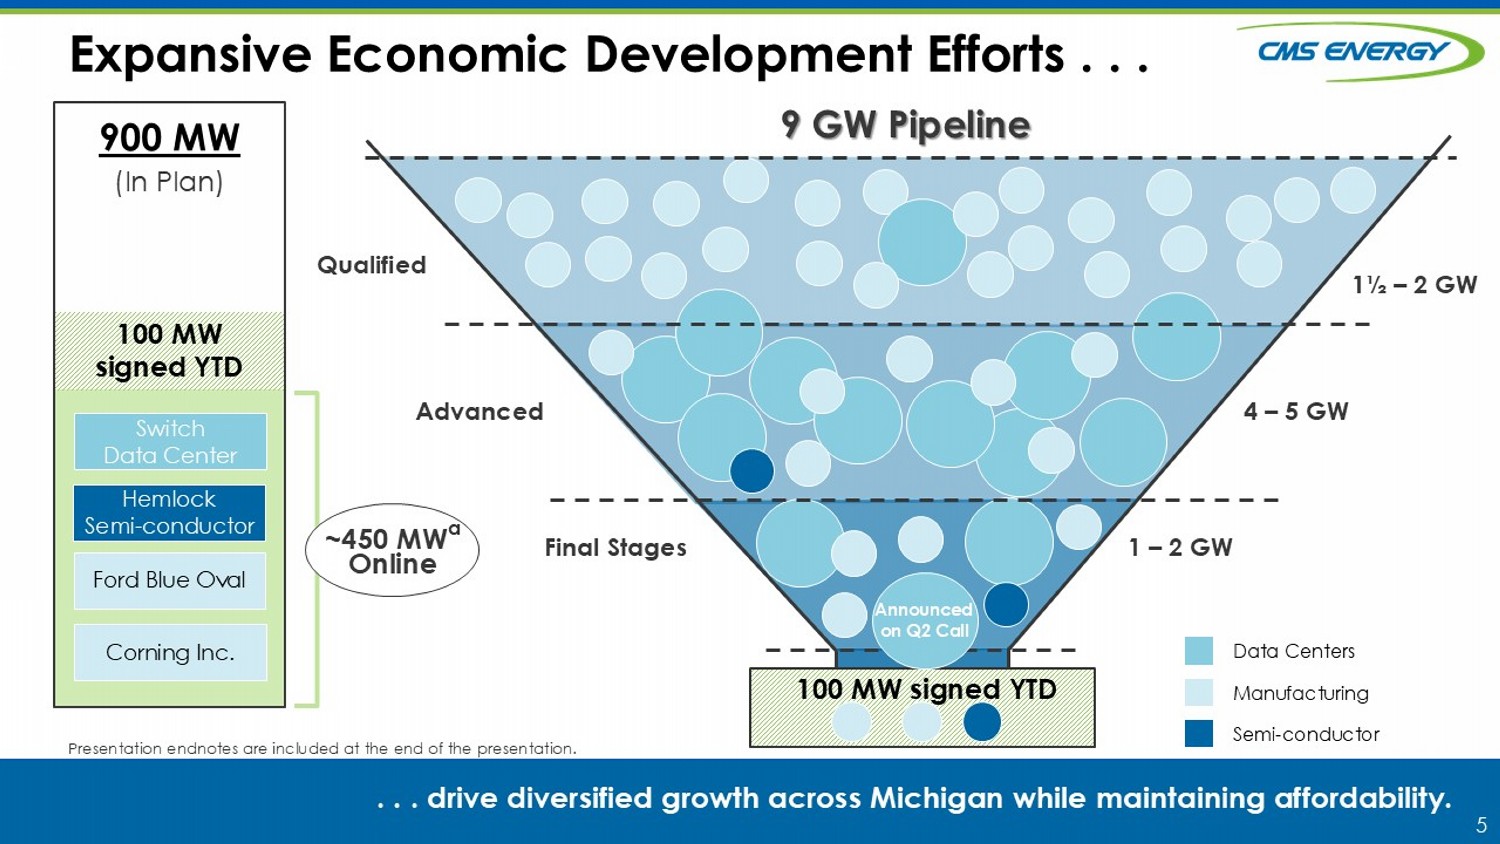
5 Expansive Economic Development Efforts . . . . . . drive diversified growth across Michigan while maintaining affordability. 9 GW Pipeline Data Centers Manufacturing Semi - conductor Advanced Final Stages 4 – 5 GW 1½ – 2 GW 1 – 2 GW Qualified Hemlock Semi - conductor Switch Data Center Ford Blue Oval (In Plan) 900 MW Corning Inc. ~450 MW a Online 100 MW signed YTD 100 MW signed YTD Announced on Q2 Call Presentation endnotes are included at the end of the presentation.
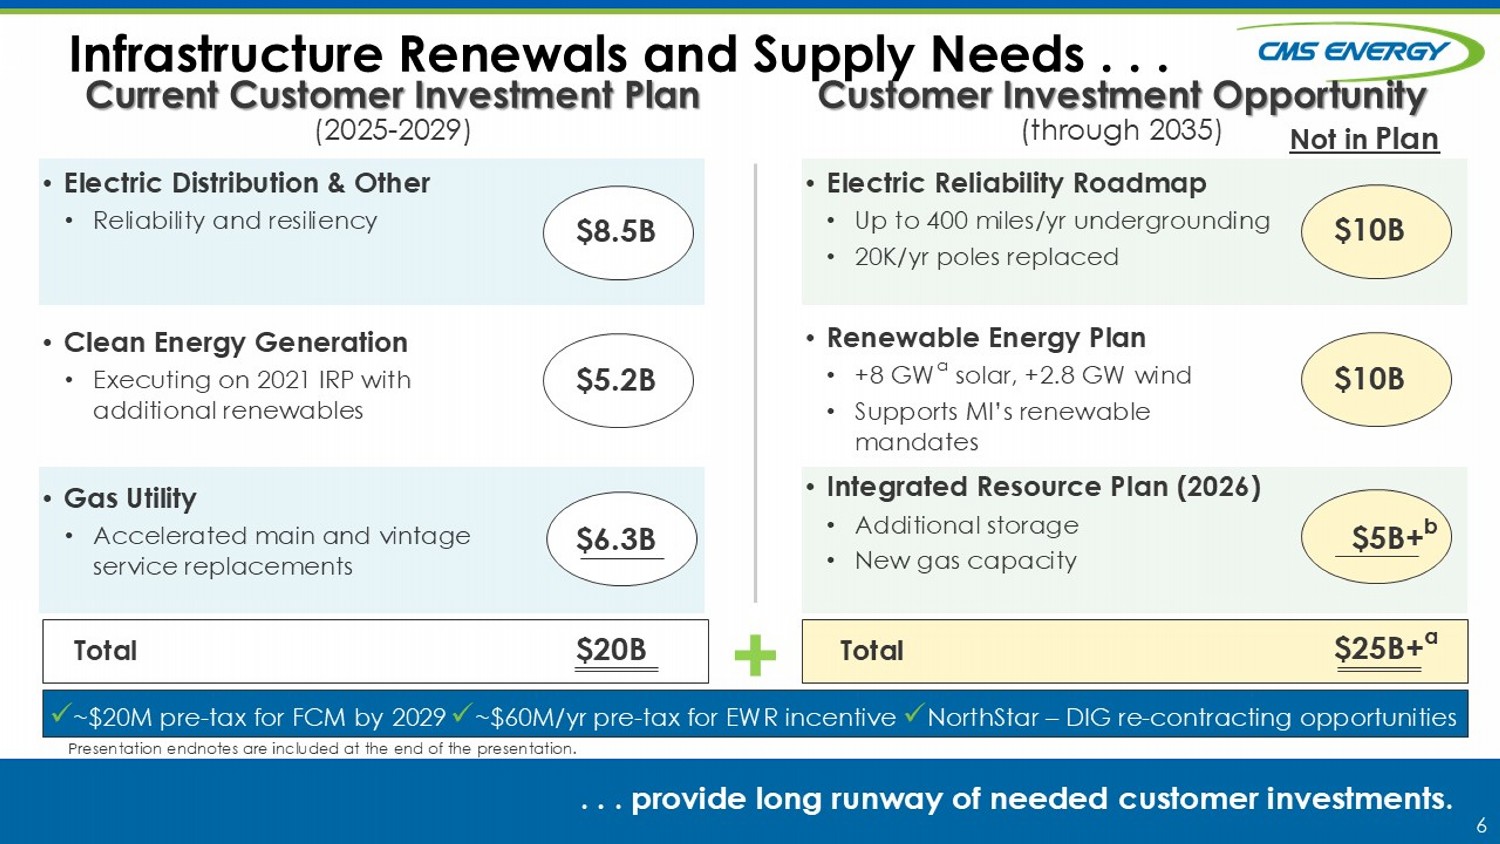
6 $ 8.5 B $5.2B $6.3B $20B Infrastructure Renewals and Supply Needs . . . . . . provide long runway of needed customer investments . Current Customer Investment Plan (2025 - 2029) • Electric Reliability Roadmap • Up to 400 miles/yr undergrounding • 20K/yr poles replaced • Renewable Energy Plan • +8 GW a solar, +2.8 GW wind • Supports MI’s renewable mandates • Integrated Resource Plan (2026) • Additional storage • New gas capacity Total Not in Plan $10B $10B $5B+ b $25B+ a • Electric Distribution & Other • Reliability and resiliency • Clean Energy Generation • Executing on 2021 IRP with additional renewables • Gas Utility • Accelerated main and vintage service replacements Total Customer Investment Opportunity (through 2035) + x ~$20M pre - tax for FCM by 2029 x ~$60M/yr pre - tax for EWR incentive x NorthStar – DIG re - contracting opportunities Presentation endnotes are included at the end of the presentation.
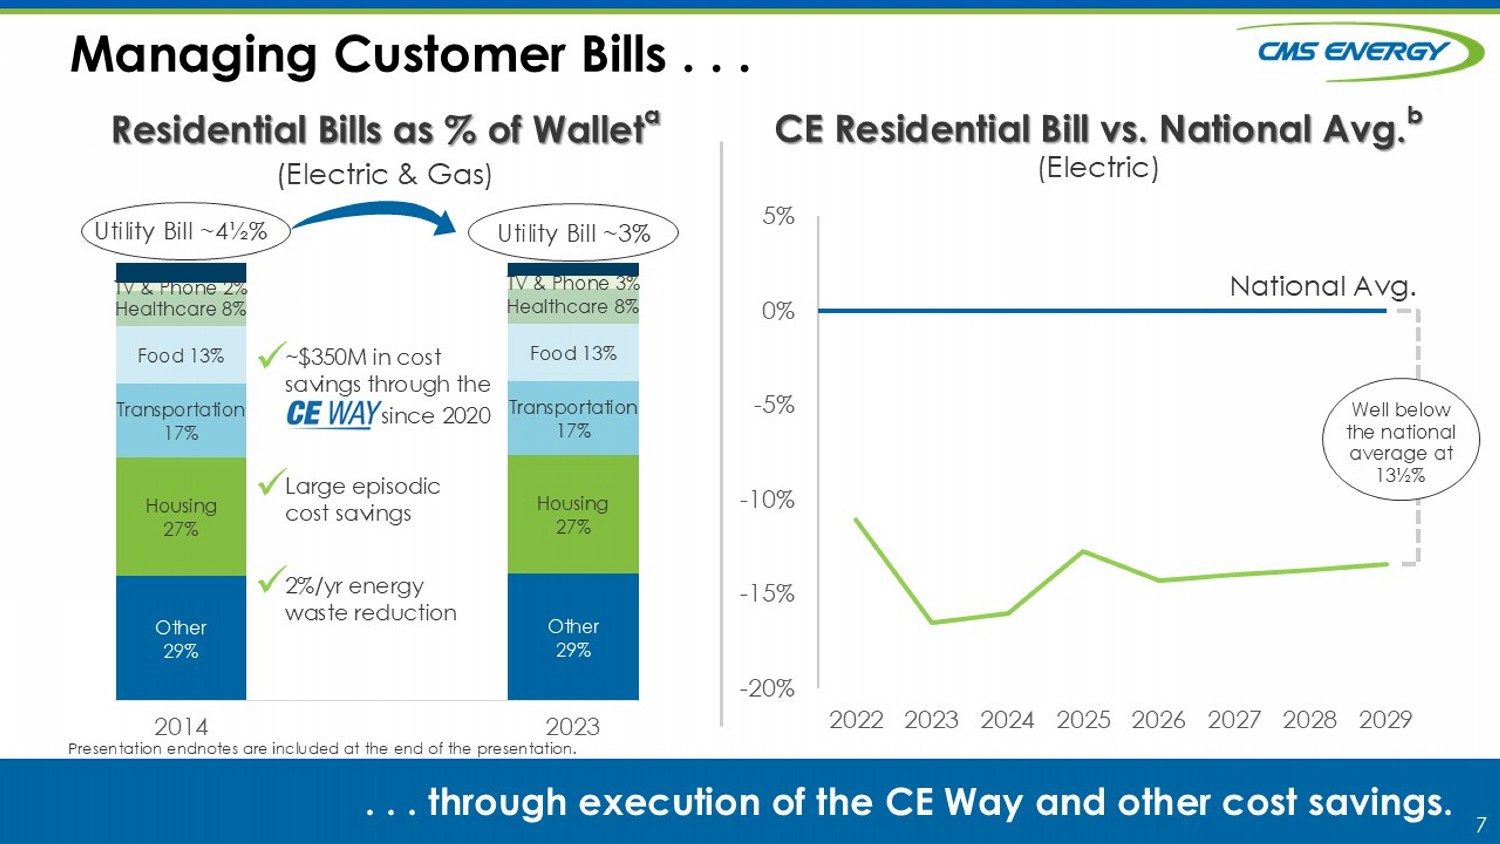
7 Managing Customer Bills . . . . . . through execution of the CE Way and other cost savings. -20% -15% -10% -5% 0% 5% 2022 2023 2024 2025 2026 2027 2028 2029 CE Residential Bill vs. National Avg. b (Electric) Other 29% Other 29% Housing 27% Housing 27% Transportation 17% Transportation 17% Food 13% Food 13% Healthcare 8% Healthcare 8% TV & Phone 2% TV & Phone 3% 2014 2023 Residential Bills as % of Wallet a (Electric & Gas) Utility Bill ~3% Utility Bill ~4½% ~$350M in cost savings through the since 2020 2%/yr energy waste reduction Large episodic cost savings x x x Well below the national average at 13½% National Avg. Presentation endnotes are included at the end of the presentation.
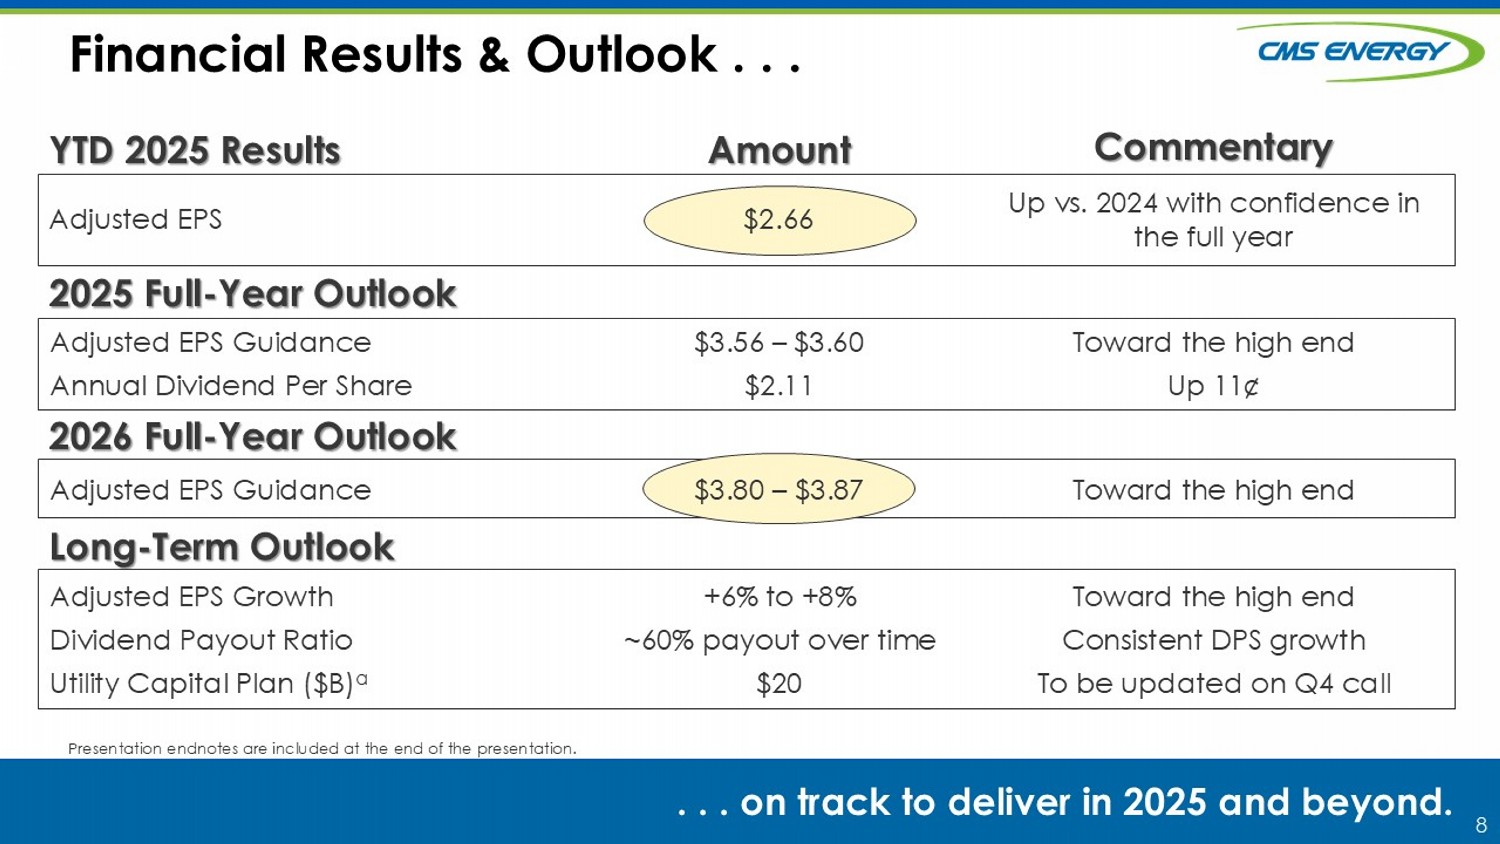
8 . . . on track to deliver in 2025 and beyond. Commentary Amount Financial Results & Outlook . . . YTD 2025 Results ` Long - Term Outlook 2025 Full - Year Outlook 2026 Full - Year Outlook Adjusted EPS $2 .66 Up vs. 2024 with confidence in the full year Adjusted EPS Guidance Annual Dividend Per Share $3.56 – $3.60 $2.11 Toward the high end Up 11¢ Adjusted EPS Guidance $3.80 – $3. 87 Toward the high end Adjusted EPS Growth Dividend Payout Ratio Utility Capital Plan ($B) a +6% to +8% ~60% payout over time $ 20 Toward the high end Consistent DPS growth To be updated on Q4 call Presentation endnotes are included at the end of the presentation.
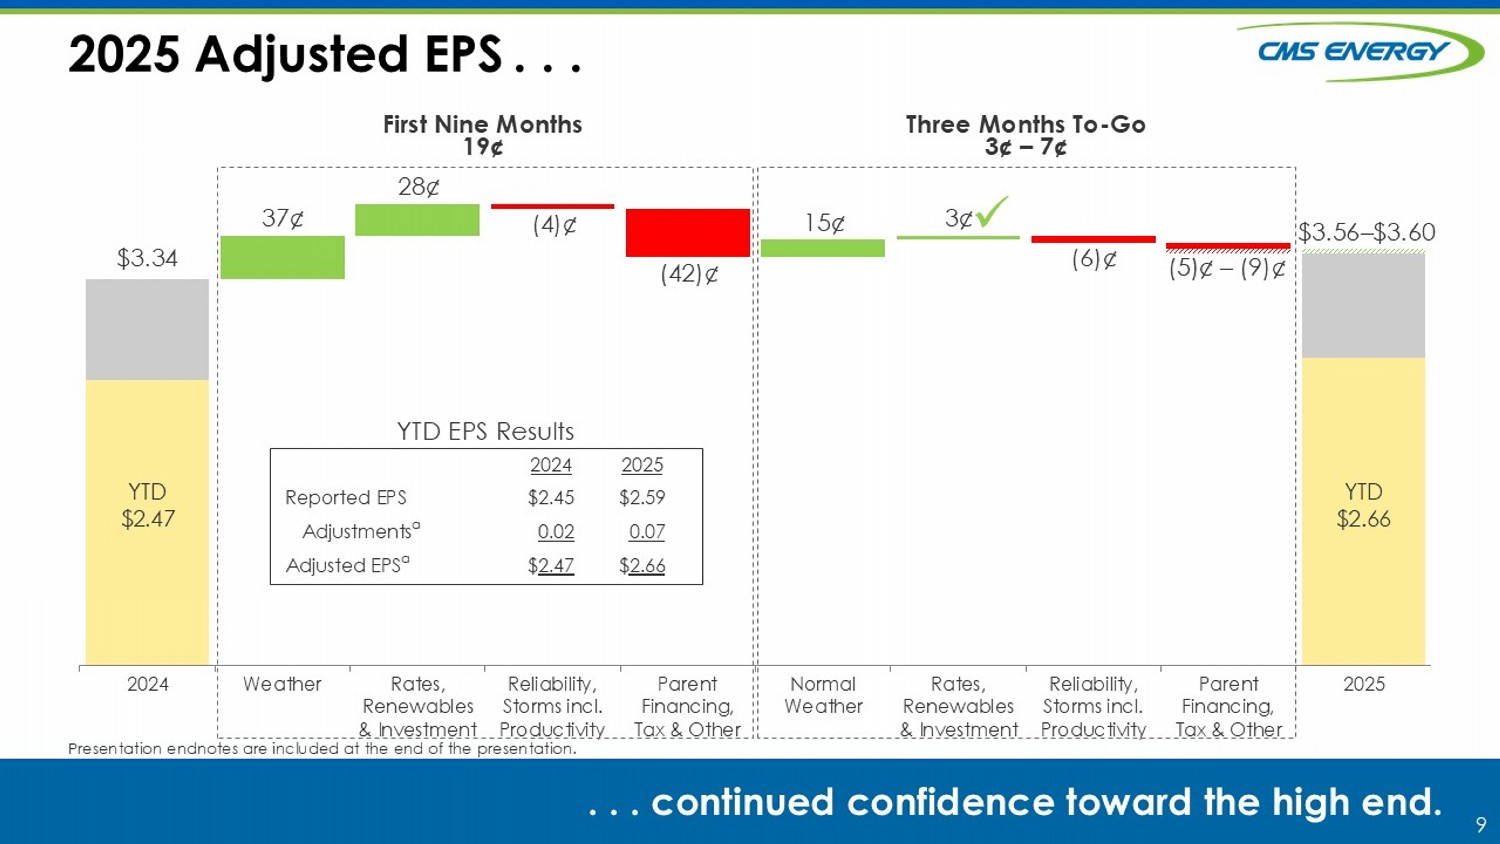
9 2024 Weather Rates, Renewables & Investment Reliability, Storms incl. Productivity Parent Financing, Tax & Other Normal Weather Rates, Renewables & Investment Reliability, Storms incl. Productivity Parent Financing, Tax & Other 2025 2025 Adjusted EPS . . . . . . continued confidence toward the high end. First Nine Months 19 ¢ Three Months To - Go 3 ¢ – 7 ¢ $3.56 – $ 3.60 37 ¢ $3.34 28¢ (4 2 )¢ 15¢ 3¢ (5) ¢ – (9)¢ ( 4 )¢ (6)¢ YTD $2.66 YTD $2 .47 2025 2024 $2.59 $2.45 Reported EPS 0.07 0.02 Adjustments a $ 2.66 $ 2.47 Adjusted EPS a YTD EPS Results x Presentation endnotes are included at the end of the presentation.
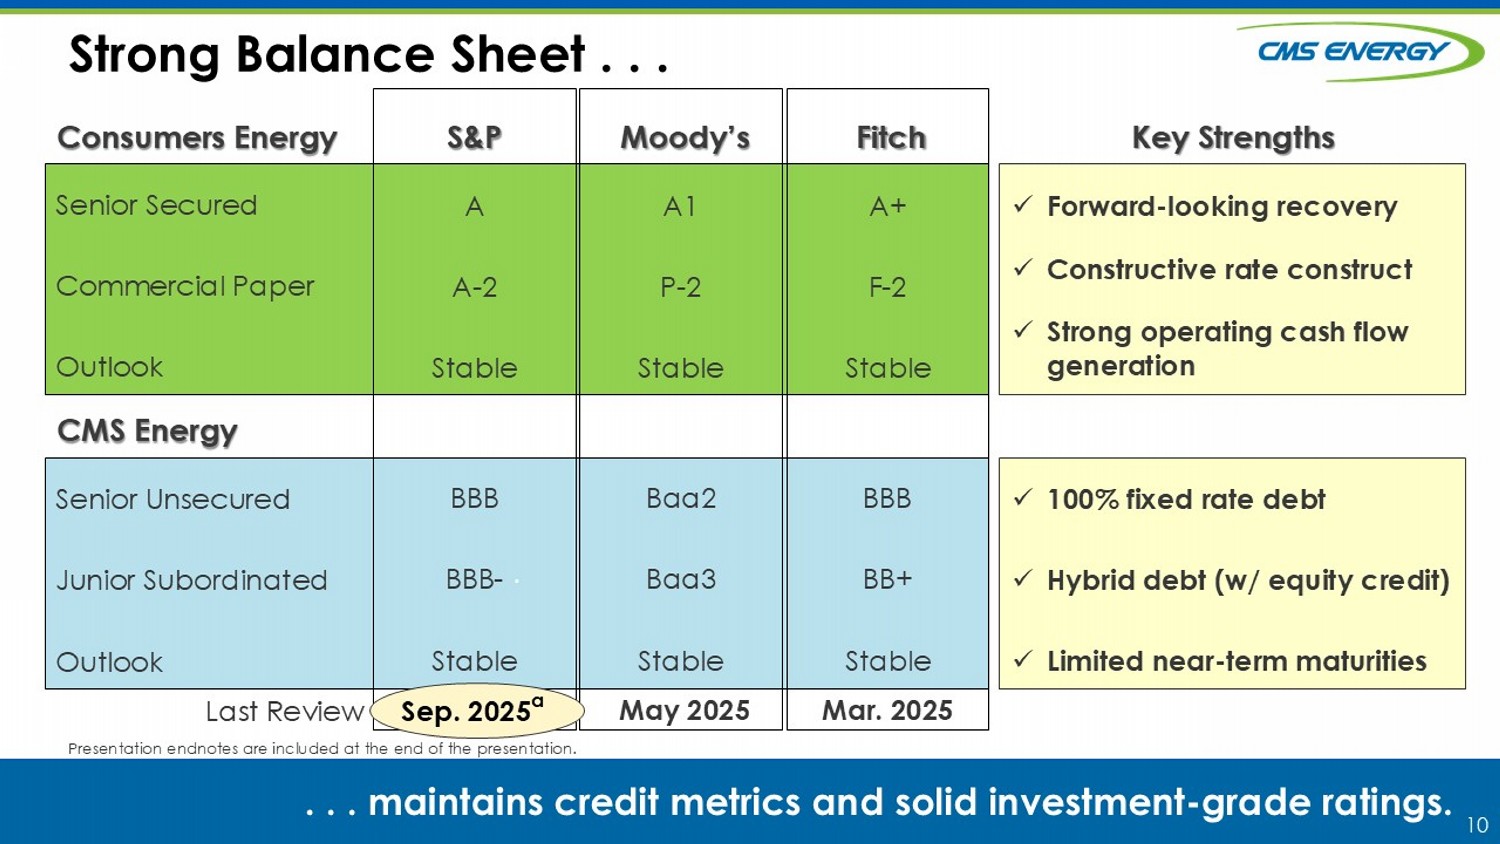
10 . Strong Balance Sheet . . . . . . m aintains credit metrics and solid investment - grade ratings. Consumers Energy CMS Energy Senior Secured Commercial Paper Outlook Senior Unsecured Junior Subordinated Outlook Last Review A1 P - 2 Stable Baa2 Baa3 Stable May 2025 A+ F - 2 Stable BBB BB+ Stable Mar. 2025 S&P Moody’s Fitch x Forward - looking recovery x Constructive rate construct x Strong operating cash flow generation x 100% fixed rate debt x Hybrid debt (w/ equity credit) x Limited near - term maturities Key Strengths A A - 2 Stable BBB BBB - Stable Sept . 2025 a Sep. 2025 a Presentation endnotes are included at the end of the presentation.
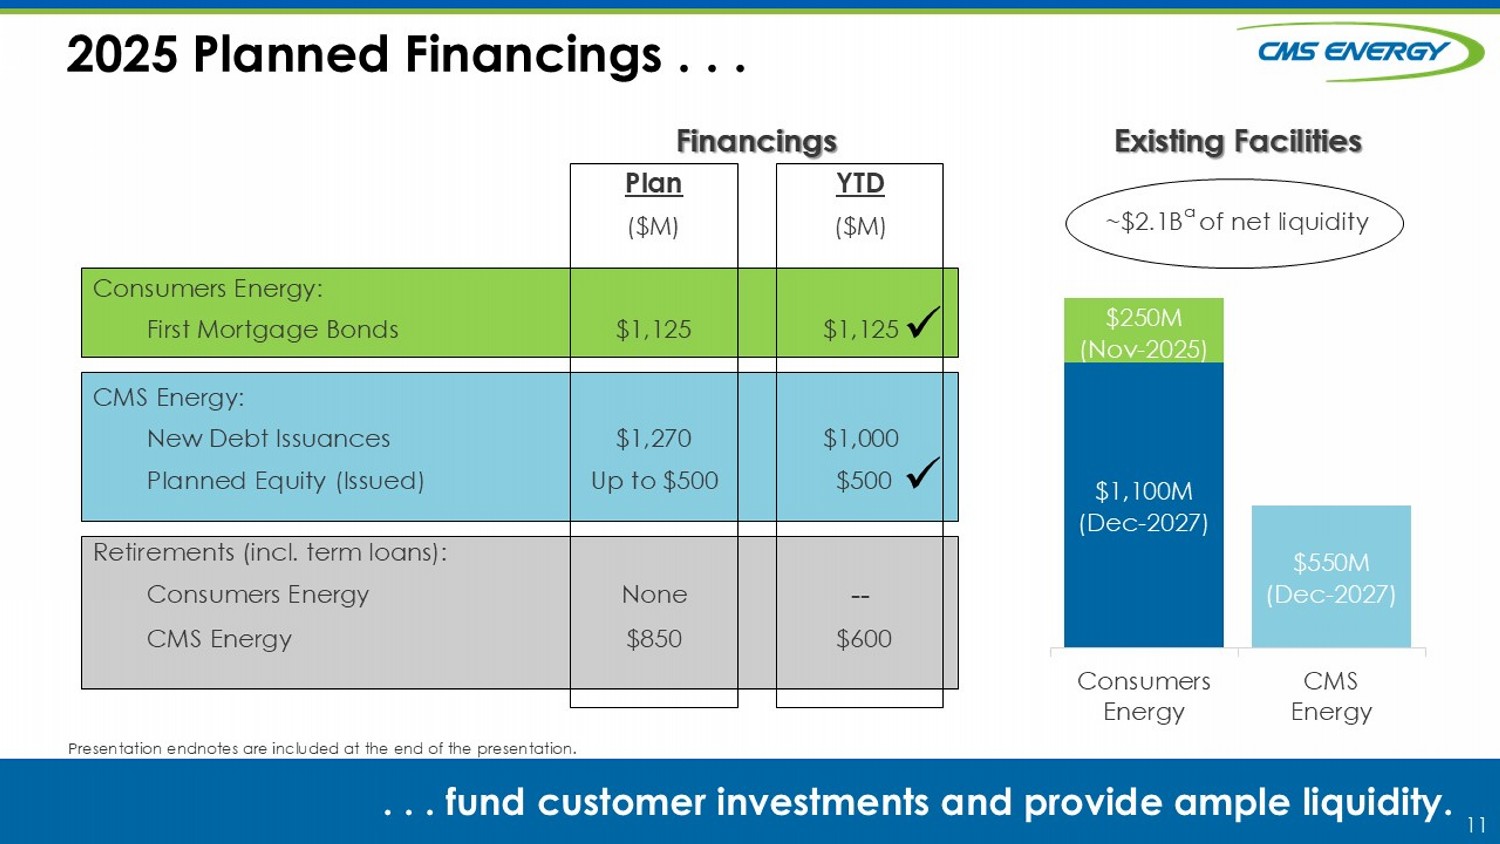
11 YTD Plan ($M) ($M) Consumers Energy: $1,125 $1,125 First Mortgage Bonds CMS Energy: $1,000 $1,270 New Debt Issuances $500 Up to $500 Planned Equity (Issued) Retirements (incl. term loans): -- None Consumers Energy $600 $850 CMS Energy Existing Facilities $1,100M (Dec - 2027) $550M (Dec - 2027) $250M (Nov - 2025) Consumers Energy CMS Energy Financings 2025 Planned Financings . . . . . . fund customer investments and provide ample liquidity. ~$2.1B a of net liquidity x x Presentation endnotes are included at the end of the presentation.
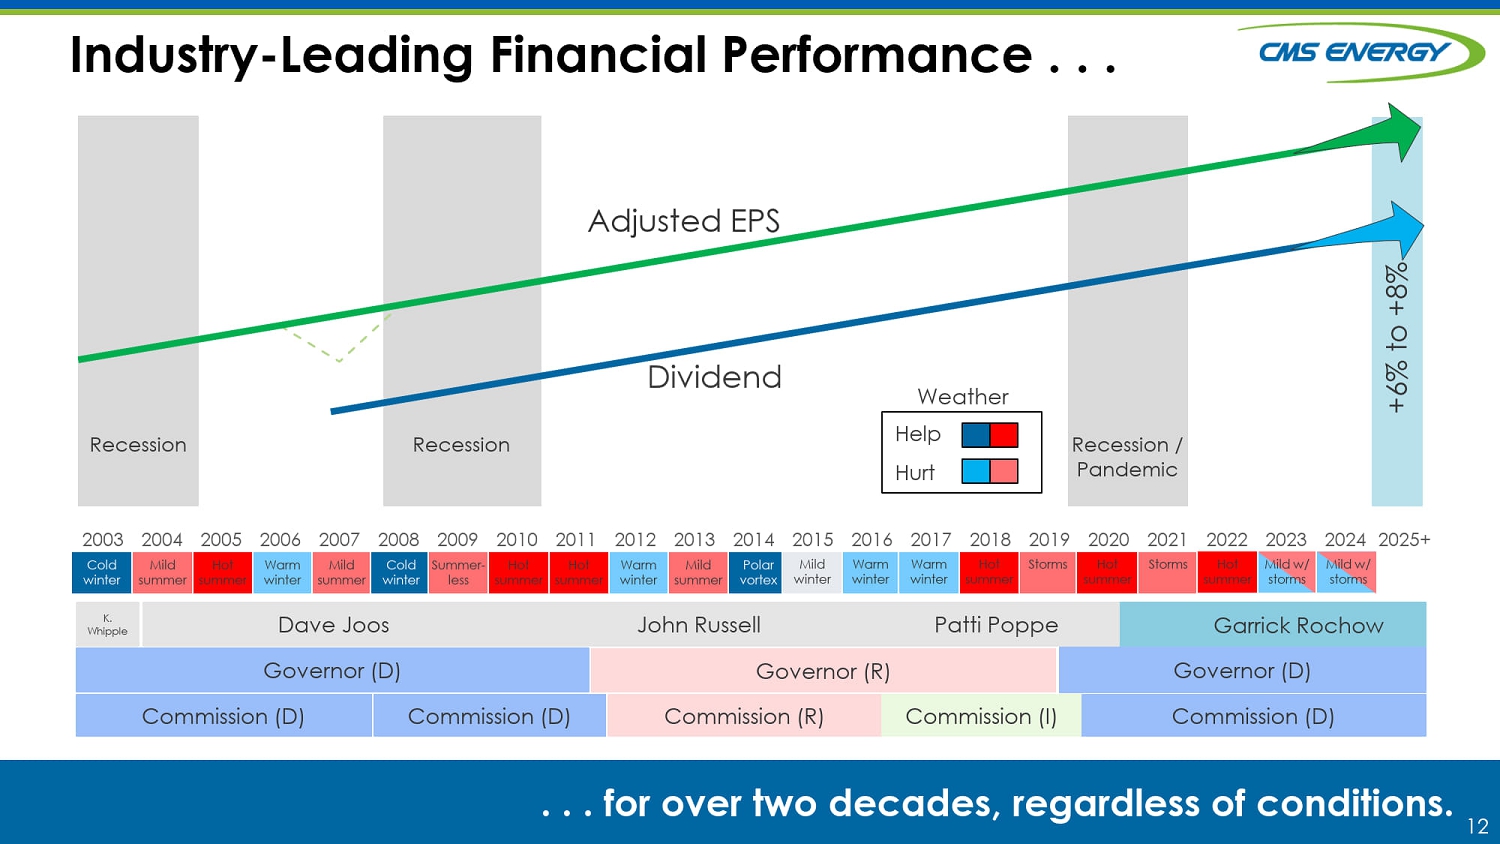
12 Recession Industry - Leading Financial Performance . . . . . . for over two decades, regardless of conditions. 2003 2004 2005 2006 2007 2008 2009 2010 2011 2012 2013 2014 2015 2016 2017 2018 2019 2020 2021 2022 2023 2024 2025+ Recession Adjusted EPS Dividend +6% to +8% Weather Help Hurt Cold winter Mild summer Warm winter Hot summer Mild summer Cold winter Polar vortex Mild summer Warm winter Hot summer Hot summer Summer - less Storms Hot summer Storms Hot summer Warm winter Warm winter Mild winter Governor (D) Governor (R) Governor (D) Commission (D) Commission (D) Commission (R) Commission (I) Commission (D) Dave Joos John Russell Patti Poppe K. Whipple Recession / Pandemic Garrick Rochow Mild w/ storms Hot summer Mild w/ storms 13 13 Q&A Thank You! See you at EEI!

14 14 Endnotes
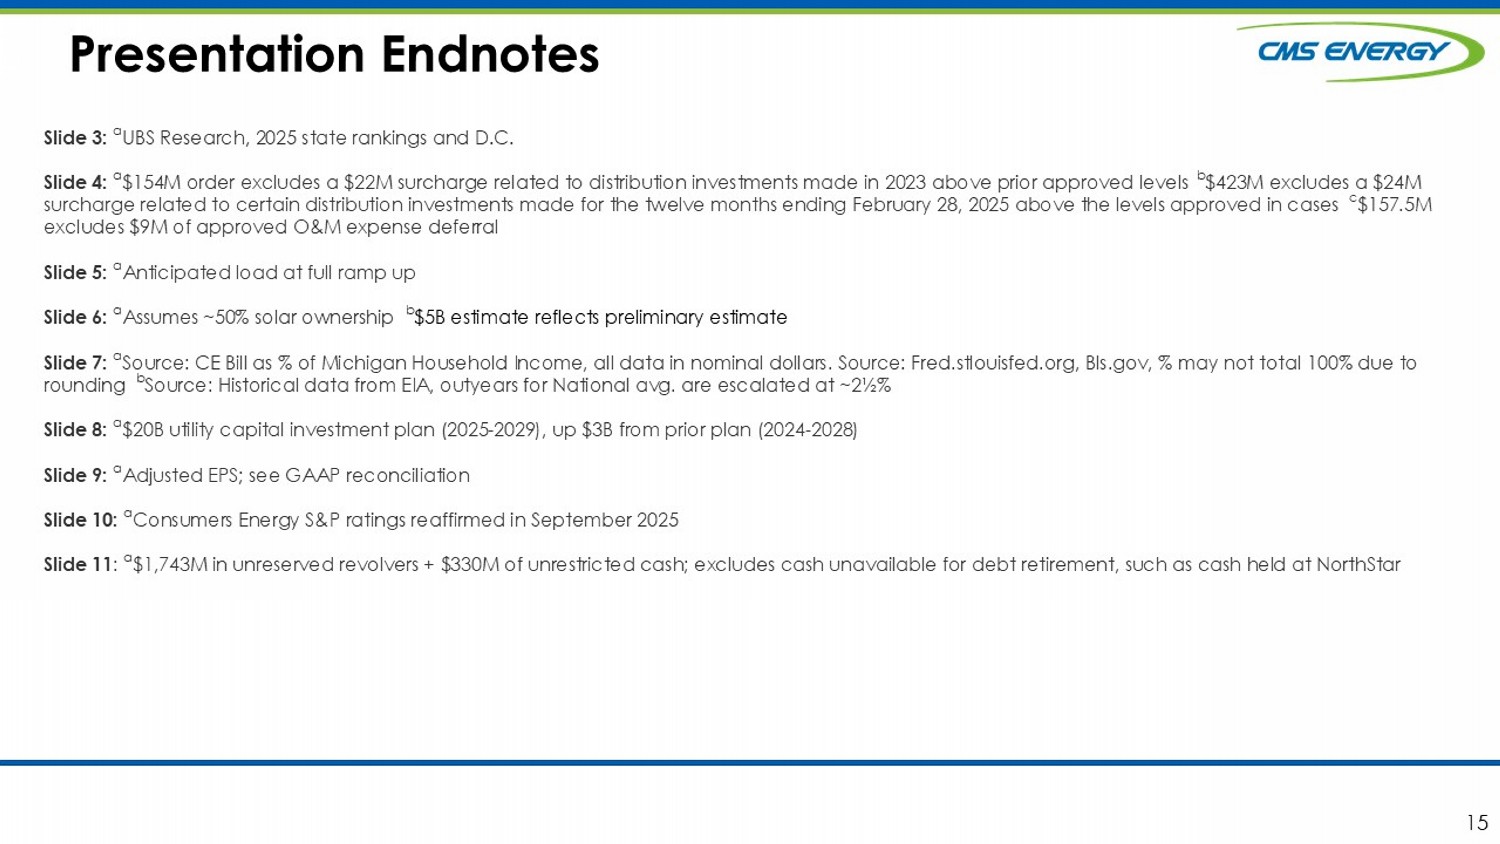
15 Presentation Endnotes Slide 3: a UBS Research, 2025 state rankings and D.C. Slide 4: a $154M order excludes a $22M surcharge related to distribution investments made in 2023 above prior approved levels b $423M excludes a $24M surcharge related to certain distribution investments made for the twelve months ending February 28, 2025 above the levels ap pro ved in cases c $157.5M excludes $9M of approved O&M expense deferral Slide 5: a Anticipated load at full ramp up Slide 6: a Assumes ~50% solar ownership b $5B estimate reflects preliminary estimate Slide 7: a Source : CE Bill as % of Michigan Household Income, all data in nominal dollars. Source: Fred.stlouisfed.org, Bls.gov, % may not tot al 100% due to rounding b Source : Historical data from EIA, outyears for National avg. are escalated at ~2½% Slide 8: a $20B utility capital investment plan (2025 - 2029), up $3B from prior plan (2024 - 2028) Slide 9: a Adjusted EPS; see GAAP reconciliation Slide 10: a Consumers Energy S&P ratings reaffirmed in September 2025 Slide 11 : a $1,743M in unreserved revolvers + $330M of unrestricted cash; excludes cash unavailable for debt retirement, such as cash hel d a t NorthStar 15 16 GAAP Reconciliation CMS Energy provides historical financial results on both a reported (GAAP) and adjusted (non - GAAP) basis and provides forward - lo oking guidance on an adjusted basis.
During an oral presentation, references to “earnings” are on an adjusted basis. All references to net income ref er to net income available to common stockholders and references to earnings per share are on a diluted basis. Adjustments could include items such as disc ont inued operations, asset sales, impairments, restructuring costs, business optimization initiative, major enterprise resource planning software implementatio ns, changes in accounting principles, voluntary separation program, changes in federal and state tax policy, regulatory items from prior years, unrealized gains or lo sses from mark - to - market adjustments, recognized in net income related to NorthStar Clean Energy's interest expense, or other items. Management views adj usted earnings as a key measure of the company’s present operating financial performance and uses adjusted earnings for external communications with ana lysts and investors. Internally, the company uses adjusted earnings to measure and assess performance. Because the company is not able to estimate th e impact of specific line items, which have the potential to significantly impact, favorably or unfavorably, the company's reported earnings in future per iods, the company is not providing reported earnings guidance nor is it providing a reconciliation for the comparable future period earnings. The adju ste d earnings should be considered supplemental information to assist in understanding our business results, rather than as a substitute for the reported earnin gs. 16 CMS ENERGY CORPORATION Reconciliation of GAAP Net Income to Non - GAAP Adjusted Net Income (Unaudited) 17 Net Income Available to Common Stockholders $ 275 $ 251 $ 775 $ 731 Reconciling items: Other exclusions from adjusted earnings** 6 * 14 6 Tax impact (2) (*) (4) (1) State tax policy change - - 12 - Voluntary separation program - - - * Tax impact - - - (*) Adjusted net income – non-GAAP $ 279 $ 251 $ 797 $ 736 Average Common Shares Outstanding - Diluted 300.4 298.8 299.4 298.2 Diluted Earnings Per Average Common Share Reported net income per share $ 0.92 $ 0.84 $ 2.59 $ 2.45 Reconciling items: Other exclusions from adjusted earnings** 0.02 * 0.04 0.02 Tax impact (0.01) (*) (0.01) (*) State tax policy change - - 0.04 - Voluntary separation program - - - * Tax impact - - - (*) Adjusted net income per share – non-GAAP $ 0.93 $ 0.84 $ 2.66 $ 2.47 * Less than $0.5 million or $0.01 per share.
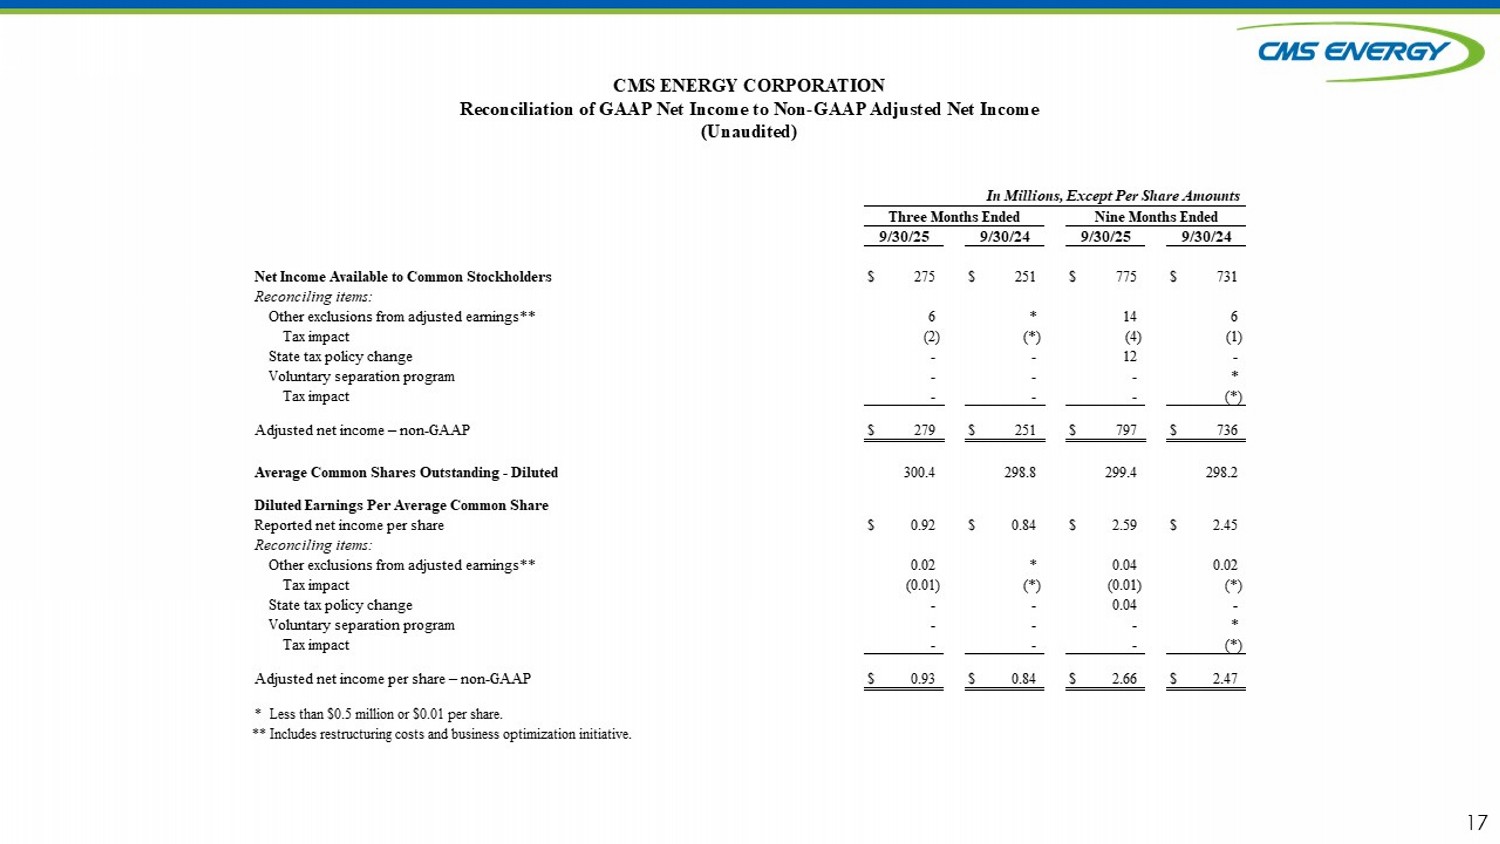
**Includes restructuring costs and business optimization initiative.
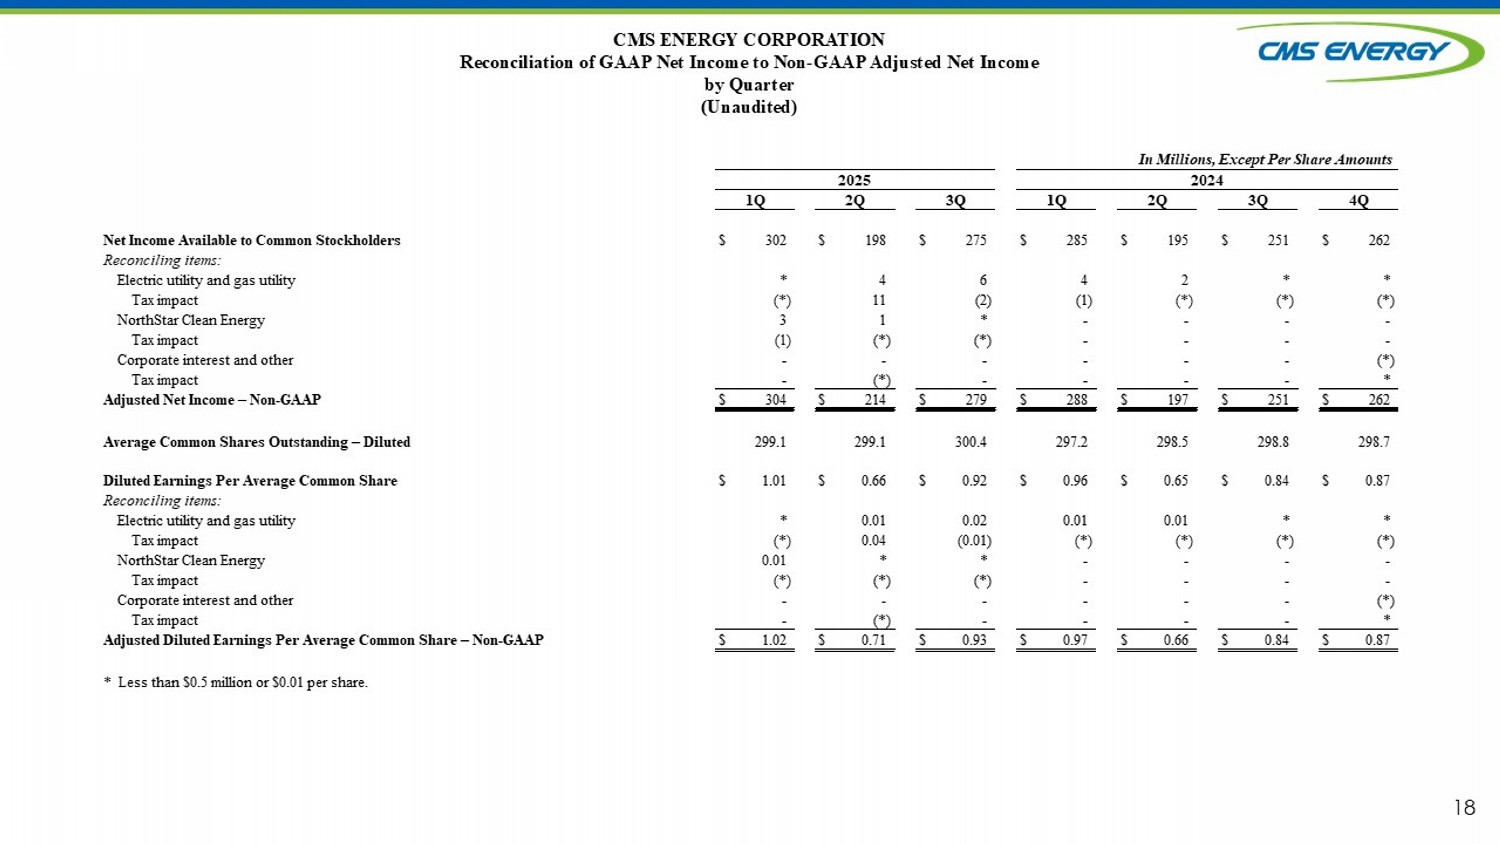
In Millions, Except Per Share Amounts Three Months Ended Nine Months Ended 9/30/25 9/30/24 9/30/25 9/30/24 18 CMS ENERGY CORPORATION Reconciliation of GAAP Net Income to Non - GAAP Adjusted Net Income by Quarter (Unaudited) Net Income Available to Common Stockholders $ 302 $ 198 $ 275 $ 285 $ 195 $ 251 $ 262 Reconciling items: Electric utility and gas utility * 4 6 4 2 * * Tax impact (*) 11 (2) (1) (*) (*) (*) NorthStar Clean Energy 3 1 * - - - - Tax impact (1) (*) (*) - - - - Corporate interest and other - - - - - - (*) Tax impact - (*) - - - - * Adjusted Net Income – Non-GAAP $ 304 $ 214 $ 279 $ 288 $ 197 $ 251 $ 262 Average Common Shares Outstanding – Diluted 299.1 299.1 300.4 297.2 298.5 298.8 298.7 Diluted Earnings Per Average Common Share $ 1.01 $ 0.66 $ 0.92 $ 0.96 $ 0.65 $ 0.84 $ 0.87 Reconciling items: Electric utility and gas utility * 0.01 0.02 0.01 0.01 * * Tax impact (*) 0.04 (0.01) (*) (*) (*) (*) NorthStar Clean Energy 0.01 * * - - - - Tax impact (*) (*) (*) - - - - Corporate interest and other - - - - - - (*) Tax impact - (*) - - - - * Adjusted Diluted Earnings Per Average Common Share – Non-GAAP $ 1.02 $ 0.71 $ 0.93 $ 0.97 $ 0.66 $ 0.84 $ 0.87 * Less than $0.5 million or $0.01 per share. 2024 2Q 3Q 4Q 1Q 2Q 3Q 1Q 2025 In Millions, Except Per Share Amounts