UNITED STATES
SECURITIES AND EXCHANGE COMMISSION
Washington, D.C. 20549
FORM 6-K
REPORT OF FOREIGN PRIVATE ISSUER
PURSUANT TO RULE 13a-16 OR 15d-16
UNDER THE SECURITIES EXCHANGE ACT OF 1934
For the month of October 2025
Commission File Number: 001-41794
Aris Mining Corporation
(Translation of registrant’s name into English)
SUITE 2400 - 1021 WEST HASTINGS ST., VANCOUVER, BC, CANADA V6E 0C3
(Address of principal executive offices)
Indicate by check mark whether the registrant files or will file annual reports under cover of Form 20-F or Form 40-F.
Form 20-F ¨ Form 40-F x Pursuant to the requirements of the Securities Exchange Act of 1934, the registrant has duly caused this report to be signed on its behalf by the undersigned, thereunto duly authorized.
SIGNATURES
| ARIS MINING CORPORATION | ||
| By: | (s) Ashley Baker | |
| Ashley Baker | ||
| General Counsel and Corporate Secretary | ||
Date: October 28, 2025
EXHIBIT INDEX
See the Exhibits listed below.
| Exhibit Number | Description |
| 99.1 | NI 43-101 Technical Report Preliminary Economic Assessment for the Toroparu Project, Cuyuni-Mazaruni Region, Guyana, dated October 28, 2025 |
Exhibit 99.1
NI 43-101 Technical Report
Preliminary Economic Assessment for the Toroparu Project
Cuyuni-Mazaruni Region, Guyana
 |
|
 |
 |
Prepared by:
Vaughn Duke, Pr.Eng.
Jan Eklund, P.E.
Pamela De Mark, P.Geo.
Prepared for:
Aris Mining Corporation
1021 West Hastings Street
Suite 2400
Vancouver BC V6E 0C3
Canada
Effective Date: October 21, 2025
Report Date: October 28, 2025
NI 43-101 Technical Report Preliminary economic assessment for the Toroparu Project, Cuyuni-Mazaruni Region, Guyana.
Forward looking information
This technical report may contain or incorporate by reference information that constitutes “forward-looking information” or “forward-looking statements” (collectively, forward-looking information) within the meaning of the applicable securities legislation. All statements, other than statements of historical fact, contained or incorporated by reference in this technical report including, but not limited to, statements related to those items listed below, constitute forward-looking information. Forward-looking information involves known and unknown risks, uncertainties, and other factors that may cause the actual results, performance or achievements of Aris Mining to be materially different from the forward-looking information contained herein. When used in this technical report, such information uses words such as “aims”, “anticipates”, “assumes”, “believes”, “budget”, “committed”, “continue”, “plans”, “project”, “endeavors”, “ensures”, “estimates”, “expects”, “focus”, “forecasts”, “forward”, “guidance”, “intends”, “likely”, “opportunity”, “outlook”, “pending”, “possible”, “potentially”, “predicts”, “proposed”, “scheduled”, “seeks”, “strives”, “targets” or variations of such words and phrases or statements that certain actions, events or results “can”, “could”, “generally”, “may”, “might”, “should”, “will” or “would” occur or be achieved and any other similar terminology.
The forward-looking information contained herein reflects current expectations regarding future events and operating performance and speaks only as of the date of this technical report. Generally, forward-looking information involves significant risks and uncertainties; therefore, it should not be read as a guarantee of future performance or results and will not necessarily be an accurate indication of whether or not such results will be achieved. Undue reliance should not be placed on such statements. A number of factors could cause the actual results to differ materially from the results discussed in the forward-looking information. Although the forward-looking information is based on what management of Aris Mining believes are reasonable assumptions, Aris Mining cannot assure readers that actual results will be consistent with the forward-looking information.
This technical report includes forward-looking information pertaining to, among other factors, the following: the projections, assumptions and estimates related to the Project, including, without limitation, those relating to development, capital and operating costs, production, grade, recoveries, metal prices, life of mine, mine sequencing, economic assumptions such as capital expenditures, cash flow and revenue, mine design, permitting and licensing, mining techniques and processes, timing of estimated production, equipment, staffing, emissions, use of land, estimates of mineral resources, use of energy storage technologies, the timing and expectations for other future studies, the operation of Aris Mining, the development and future operation of the Project, and the ability to secure permits for the Project.
Forward-looking information is based upon a number of estimates and assumptions that, while considered reasonable by Aris Mining as of the date of such statements, are inherently subject to significant business, economic and competitive uncertainties and contingencies. With respect to forward-looking information contained herein, the assumptions made by Aris Mining include but are not limited to:
| · | the environmental liabilities to which the Project is subject; |
| · | political developments in any jurisdiction in which Aris Mining operates being consistent with Aris Mining’s current expectations; |
| · | the validity of its existing title to the Property and mineral claims; |
| · | Aris Mining’s ability to maintain surface rights and legal access to the Property and mineral claims; |
| · | experts retained by Aris Mining, technical and otherwise, being appropriately reputable and qualified; |
| · | the viability, economically and otherwise, of developing the Project; |
| · | Aris Mining’s ability to obtain qualified staff and equipment in a timely and cost-efficient manner to meet Aris Mining’s demand; and |
| · | the impact of acquisitions, dispositions, suspensions or delays on Aris Mining’s business. |
Forward-looking information is based on current expectations, estimates and projections that involve a number of risks which could cause the actual results to vary and, in some instances, to differ materially from those described in the forward-looking information contained in this technical report. These material risks include, but are not limited to:
| Effective October 21, 2025 | Page |
Aris Mining Corporation |
NI 43-101 Technical Report Preliminary economic assessment for the Toroparu Project, Cuyuni-Mazaruni Region, Guyana.
| · | local environmental and regulatory requirements and delays in obtaining required environmental and other licenses, including delays associated with local communities and indigenous peoples; |
| · | changes in national and local government legislation, taxation, controls, regulations and political or economic developments in Canada or Guyana; |
| · | uncertainties and hazards associated with gold exploration, development and mining, including but not limited to, environmental hazards, industrial accidents, unusual or unexpected formations, pressures, cave-ins, flooding, polymetallic concentrate losses, and blockades and operational stoppages; |
| · | risks associated with costs, supply chain disruptions, and financial risks due to changes in tariffs, trade policies, international trade disputes, or regulatory shifts; |
| · | economic and political risks associated with operating in foreign jurisdictions, including emerging country risks, exchange controls, expropriation risks, political instability and corruption; |
| · | risks associated with capital and operating cost estimates; |
| · | dependence of operations on construction and maintenance of adequate infrastructure; |
| · | fluctuations in foreign exchange or interest rates and stock market volatility; |
| · | operational and technical problems; |
| · | Aris Mining’s ability to maintain good relations with employees and contractors; |
| · | reliance on key personnel; |
| · | competition for, among other things, capital, and the acquisition of mining properties and undeveloped lands; |
| · | uncertainties relating to title to property and mineral resource and mineral reserve estimates; |
| · | risks associated with acquisitions and integration; |
| · | risks associated with Aris Mining’s ability to meet its financial obligations as they fall due; |
| · | volatility in the price of salable metal or certain other commodities relevant to Aris Mining’s operations, such as diesel fuel and electricity; |
| · | risks that Aris Mining’s actual production may be less than is currently estimated; |
| · | risks associated with servicing Aris Mining’s indebtedness and additional funding requirements for exploration, operational programs or expansion properties, as well as to complete any large scale development projects; |
| · | risks associated with general economic factors, including ongoing economic conditions, investor sentiment, market accessibility and market perception; |
| · | changes in the accessibility and availability of insurance for mining operations and property; |
| · | environmental, sustainability and governance practices and performance; |
| · | risks associated with climate change; |
| · | risks associated with the reliance on experts outside of Canada; |
| · | costs associated with the decommissioning of Aris Mining’s mines and exploration properties; |
| · | potential conflicts of interest among the directors of Aris Mining; |
| · | uncertainties relating to the enforcement of civil labilities and service of process outside of Canada; |
| · | risks associated with keeping adequate cyber-security measures; |
| · | risks associated with operating a joint venture; and |
| · | other factors further discussed in the section entitled "Risk Factors" in Aris Mining’s Annual Information Form for the year ended December 31, 2024 which is available on Aris Mining’s website at www.aris-mining.com, on SEDAR+ at www.sedarplus.ca and included as part of Aris Mining’s Annual Report on Form 40-F, filed with the SEC at www.sec.gov. |
Readers are cautioned that the foregoing lists of factors are not exhaustive. There can be no assurance that forward-looking information will prove to be accurate. Forward-looking information is provided for the purpose of providing information about management’s expectations and plans relating to the future. The forward-looking information included in this technical report is qualified by these cautionary statements and those made in Aris Mining’s other filings with the securities regulators of Canada including, but not limited to, the cautionary statements made in the “Risks and Uncertainties” section of Aris Mining’s Management’s Discussion and Analysis for the three and six months ended June 30, 2025 which is available on Aris Mining’s website at www.aris-mining.com, on SEDAR+ at www.sedarplus.ca and on Aris Mining’s profile with the SEC at www.sec.gov.
| Effective October 21, 2025 | Page |
Aris Mining Corporation |
NI 43-101 Technical Report Preliminary economic assessment for the Toroparu Project, Cuyuni-Mazaruni Region, Guyana.
The forward-looking information contained herein is made as of the date of this technical report and Aris Mining assumes no obligations to update or revise it to reflect new events or circumstances, other than as required by applicable securities laws.
Non-GAAP financial measures
This technical report refers to a number of non-GAAP financial measures, which are not measures recognized under International Financial Reporting Standards (IFRS) and do not have a standardized meaning prescribed by IFRS. These non-GAAP financial measures described below do not have standardized meanings under IFRS, may differ from those used by other issuers, and may not be comparable to similar financial measures reported by other issuers. Accordingly, these measures are intended to provide additional information and should not be considered in isolation or as a substitute for measures of performance prepared in accordance with IFRS.
Cash costs – Cash cost and cash cost per ounce ($ per oz) are a common financial performance measure and ratio in the mining industry; however, they have no standard meaning under IFRS. Cash cost ($ per oz) is calculated by dividing total cash costs by the number of gold ounces projected to be produced on a payable basis.
All-in sustaining costs (AISC) – AISC and AISC ($ per oz) sold are a common financial performance measure and ratio in the mining industry; however, they have no standard meaning under IFRS. AISC is calculated by dividing AISC by the number of gold ounces projected to be produced on a payable basis.
Earnings before interest, taxes, depreciation and amortization (EBITDA) – EBITDA is a common financial performance measure in the mining industry; however, it has no standard meaning under IFRS. EBITDA represents earnings before interest, income taxes and depreciation, depletion and amortization.
| Effective October 21, 2025 | Page |
Aris Mining Corporation |
NI 43-101 Technical Report Preliminary Economic Assessment for the Toroparu Project, Cuyuni-Mazaruni Region, Guyana
Contents
| 1 Summary | 11 |
| 1.1 Introduction | 11 |
| 1.2 Property description, location, and access | 13 |
| 1.2.1 Location and access | 13 |
| 1.2.2 Mineral tenure, Aris Mining’s interest, surface rights, and obligations | 13 |
| 1.2.3 Agreements and encumbrances | 14 |
| 1.2.4 Royalties | 14 |
| 1.2.5 Significant factors and risks | 15 |
| 1.3 History | 15 |
| 1.4 Geological setting, mineralization, and deposit types | 16 |
| 1.4.1 Regional, local, and property geology | 16 |
| 1.4.2 Mineralization | 16 |
| 1.4.3 Deposit types | 17 |
| 1.5 Exploration | 17 |
| 1.6 Drilling | 17 |
| 1.7 Sampling, analysis, and data verification | 18 |
| 1.7.1 Sample preparation and security measures | 18 |
| 1.7.2 Quality assurance and quality control | 18 |
| 1.7.3 Analytical procedures | 18 |
| 1.7.4 Data verification | 19 |
| 1.8 Mineral processing and metallurgical testing | 19 |
| 1.8.1 Testwork history | 19 |
| 1.8.2 Mineralogical testwork | 20 |
| 1.8.3 Comminution testwork | 20 |
| 1.8.4 Flotation, cyanidation, and gravity recovery testwork | 20 |
| 1.8.5 Metallurgical recovery | 20 |
| 1.8.6 Deleterious elements | 20 |
| 1.9 Mineral resource estimate | 20 |
| 1.10 Mining operations | 21 |
| 1.11 Processing and recovery operations | 22 |
| Effective October 21, 2025 | Page |
NI 43-101 Technical Report Preliminary Economic Assessment for the Toroparu Project, Cuyuni-Mazaruni Region, Guyana
| 1.12 Infrastructure, permitting, and compliance activities | 22 |
| 1.12.1 Infrastructure | 23 |
| 1.12.2 Tailings management facility | 23 |
| 1.12.3 Waste rock management facilities | 25 |
| 1.12.4 Water sources and management | 25 |
| 1.12.5 Offsite logistics | 26 |
| 1.12.6 Power | 26 |
| 1.12.7 Environmental factors | 26 |
| 1.12.8 Permitting factors | 28 |
| 1.12.9 Social or community factors | 28 |
| 1.13 Capital and operating costs | 29 |
| 1.13.1 Capital cost estimates | 29 |
| 1.13.2 Operating cost estimates | 30 |
| 1.14 Economic analysis | 31 |
| 1.15 Exploration, development, and production | 34 |
| 1.16 Conclusions | 34 |
| 1.17 Recommendations | 34 |
| 1.17.1 Drilling recommendations | 34 |
| 1.17.2 Mineral processing and metallurgical testing recommendations | 34 |
| 1.17.3 Mining recommendations | 35 |
| 1.17.4 Surface infrastructure recommendations | 37 |
| 1.17.5 Tailings management facility recommendations | 37 |
| 1.17.6 Environmental recommendations | 38 |
| 2 Introduction | 39 |
| 2.1 Issuer and purpose of the technical report | 39 |
| 2.2 Source information | 39 |
| 2.3 Qualified persons and personal property inspections | 39 |
| 2.4 Currencies, units, and coordinate system | 40 |
| 3 Reliance on other experts | 41 |
| 4 Property description and location | 42 |
| 4.1 Property location | 42 |
| 4.2 Mineral tenure and Aris Mining’s interest | 42 |
| 4.3 Royalties, agreements, and encumbrances | 43 |
| Effective October 21, 2025 | Page |
NI 43-101 Technical Report Preliminary Economic Assessment for the Toroparu Project, Cuyuni-Mazaruni Region, Guyana
| 4.3.1 The Alphonso Joint Venture | 43 |
| 4.3.2 The Godette Joint Venture | 44 |
| 4.3.3 The Toroparu Precious Metals Purchase Agreement (the Toroparu PMPA) | 44 |
| 4.3.4 The Consulting Agreement | 44 |
| 4.3.5 Royalties | 45 |
| 4.4 Environmental liabilities | 45 |
| 4.5 Permits | 45 |
| 4.6 Significant factors and risks | 45 |
| 5 Accessibility, climate, local resources, infrastructure, and physiography | 46 |
| 5.1 Topography, elevation, vegetation, and climate | 46 |
| 5.2 Property access, transport, population centres, and mining personnel | 46 |
| 5.3 Surface rights | 46 |
| 5.4 Infrastructure | 47 |
| 5.5 Power and water | 47 |
| 6 History | 48 |
| 6.1 Early work | 48 |
| 6.2 ETK – 1999 to 2009 | 48 |
| 6.3 Sandspring – 2010 to 2021 | 48 |
| 6.4 GCM Mining (renamed to Aris Mining) – 2021 to present | 50 |
| 6.5 Historical mineral resource and mineral reserve estimates | 50 |
| 6.6 Past production | 50 |
| 7 Geological setting and mineralization | 51 |
| 7.1 Regional geology | 51 |
| 7.2 Local geology | 51 |
| 7.3 Property geology | 53 |
| 7.4 Mineralization and alteration | 54 |
| 7.5 Structure | 56 |
| 8 Deposit types | 57 |
| 9 Exploration | 58 |
| 9.1 Geological mapping | 58 |
| 9.2 Surface sampling | 58 |
| 9.3 Geophysics | 59 |
| 10 Drilling | 60 |
| 10.1 Drilling summary | 60 |
| 10.2 Drilling procedures | 62 |
| Effective October 21, 2025 | Page |
NI 43-101 Technical Report Preliminary Economic Assessment for the Toroparu Project, Cuyuni-Mazaruni Region, Guyana
| 10.2.1 Drillhole collar and downhole surveys | 62 |
| 10.2.2 Diamond drilling procedures | 62 |
| 10.2.3 Geological logging | 62 |
| 10.2.4 Core recovery | 62 |
| 10.2.5 Reverse circulation drilling procedures | 62 |
| 10.3 Recommendations | 63 |
| 10.4 Material impact on the accuracy and reliability of drilling results | 63 |
| 11 Sample preparation, analysis, and security | 64 |
| 11.1 Introduction | 64 |
| 11.2 Core sampling and security | 64 |
| 11.3 Laboratory sample preparation procedures and analytical methods | 64 |
| 11.4 Quality assurance and quality control procedures | 65 |
| 11.5 Bulk density | 65 |
| 11.6 Material impact on the accuracy and reliability of sample data | 65 |
| 12 Data verification | 66 |
| 12.1 Geology data reviews | 66 |
| 12.2 Metallurgical and mineral processing data reviews | 66 |
| 12.3 Mining data reviews | 66 |
| 13 Mineral processing and metallurgical testing | 67 |
| 13.1 Introduction | 67 |
| 13.2 Samples | 67 |
| 13.3 Mineralogy, gold deportment, and liberation studies | 68 |
| 13.4 Comminution | 69 |
| 13.4.1 Toroparu | 69 |
| 13.4.2 Sona Hill | 69 |
| 13.5 Flotation, cyanidation, and gravity recovery | 69 |
| 13.5.1 Toroparu | 69 |
| 13.5.2 Sona Hill | 71 |
| 13.6 Detoxification | 71 |
| 13.7 Metallurgical recovery | 71 |
| 13.8 Deleterious elements | 72 |
| 13.9 Conclusions | 72 |
| 13.10 Recommendations | 73 |
| 14 Mineral resource estimates | 75 |
| Effective October 21, 2025 | Page |
NI 43-101 Technical Report Preliminary Economic Assessment for the Toroparu Project, Cuyuni-Mazaruni Region, Guyana
| 14.1 Disclosure | 75 |
| 14.2 Available data | 75 |
| 14.3 Geological interpretation | 75 |
| 14.4 Mineralization interpretation | 75 |
| 14.5 Statistics, compositing, and treatment of extreme grades | 75 |
| 14.6 Block model | 77 |
| 14.7 Composite search and interpolation parameters | 77 |
| 14.8 Estimation validation | 77 |
| 14.9 Mineral resource classification | 78 |
| 14.10 Cut-off grade and mineral resource constraint | 78 |
| 14.11 Mineral resource tabulation | 79 |
| 15 Mineral reserve estimates | 80 |
| 16 Mining methods | 81 |
| 16.1 Introduction | 81 |
| 16.2 Geotechnical parameters | 81 |
| 16.3 Hydrogeology, hydrology, and mine water management | 82 |
| 16.3.1 Site description | 82 |
| 16.3.2 Hydrogeology | 82 |
| 16.3.3 Hydrology and mine water management | 83 |
| 16.4 Open pit optimization | 84 |
| 16.5 Open pit design | 85 |
| 16.6 Mine planning and schedule | 87 |
| 16.7 Material handling | 89 |
| 16.8 Mine equipment | 89 |
| 16.9 Mine personnel | 90 |
| 16.10 Recommendations | 92 |
| 17 Recovery methods | 94 |
| 17.1 Introduction | 94 |
| 17.2 Primary run of mine handling and crushing | 94 |
| 17.3 Grinding circuit | 94 |
| 17.4 Gold recovery circuits | 95 |
| 17.4.1 Gravity concentration and intensive leach circuit | 95 |
| 17.4.2 Pre-leach thickening circuit | 95 |
| 17.4.3 Carbon in leach circuit | 95 |
| Effective October 21, 2025 | Page |
NI 43-101 Technical Report Preliminary Economic Assessment for the Toroparu Project, Cuyuni-Mazaruni Region, Guyana
| 17.4.4 Flotation circuit | 96 |
| 17.5 Reagents and consumables | 97 |
| 17.6 Power, water, and air | 97 |
| 17.7 Conclusions | 98 |
| 17.8 Recommendations | 98 |
| 18 Project infrastructure | 100 |
| 18.1 Introduction | 100 |
| 18.2 Site access | 100 |
| 18.3 Accommodation camp and site buildings | 101 |
| 18.4 Mine support facilities | 101 |
| 18.5 Process support facilities | 102 |
| 18.6 Tailings management facilities | 102 |
| 18.6.1 Site description | 102 |
| 18.6.2 Site investigations and engineering analyses | 102 |
| 18.6.3 Design | 102 |
| 18.6.4 Construction and tailings placement | 103 |
| 18.6.5 Tailings geochemical characterization | 103 |
| 18.6.6 Water management | 103 |
| 18.6.7 Monitoring | 104 |
| 18.6.8 Closure and reclamation | 104 |
| 18.7 Waste rock management facilities | 105 |
| 18.8 Stormwater management | 105 |
| 18.9 Utilities | 105 |
| 18.10 On site roads | 106 |
| 18.11 Off site logistics | 106 |
| 18.12 Recommendations | 107 |
| 19 Market studies and contracts | 109 |
| 19.1 Market studies | 109 |
| 19.1.1 Indicative commercial terms for the copper concentrates | 109 |
| 19.2 Contracts | 109 |
| 19.3 Review and confirmation by the qualified person | 109 |
| 20 Environmental studies, permitting, and social or community impact | 110 |
| 20.1 Environmental setting, studies, and issues | 110 |
| 20.1.1 Environmental setting | 110 |
| Effective October 21, 2025 | Page |
NI 43-101 Technical Report Preliminary Economic Assessment for the Toroparu Project, Cuyuni-Mazaruni Region, Guyana
| 20.1.2 Environmental studies | 110 |
| 20.1.3 Environmental issues | 111 |
| 20.1.4 Environmental management approach | 111 |
| 20.2 Social setting and community requirements | 111 |
| 20.2.1 Social setting | 111 |
| 20.2.2 Community engagement | 111 |
| 20.2.3 Community employment, diversity, and socioeconomic opportunities | 112 |
| 20.3 Tailings and waste rock management facilities | 112 |
| 20.4 Site monitoring | 113 |
| 20.5 Water management | 113 |
| 20.6 Permitting requirements | 114 |
| 20.7 Mine closure requirements | 114 |
| 20.8 Recommendations | 115 |
| 21 Capital and operating costs | 116 |
| 21.1 Introduction | 116 |
| 21.2 Contingency and treatment of uncertainty | 116 |
| 21.3 Capital costs | 116 |
| 21.3.1 Mining capital costs | 116 |
| 21.3.2 Processing capital costs | 117 |
| 21.3.3 Capital cost summary | 117 |
| 21.4 Operating costs | 118 |
| 21.4.1 Mining operating costs | 118 |
| 21.4.2 Processing operating costs | 119 |
| 21.4.3 G&A operating costs | 120 |
| 21.4.4 Operating cost summary | 120 |
| 22 Economic analysis | 123 |
| 22.1 Estimate methodology | 123 |
| 22.2 Project schedule | 123 |
| 22.3 Taxes, royalties, and the Toroparu PMPA | 127 |
| 22.4 Marketing assumptions | 127 |
| 22.5 Commodity prices and gross revenue | 127 |
| 22.6 Economic analysis results | 130 |
| 22.7 Sensitivity analysis | 134 |
| Effective October 21, 2025 | Page |
NI 43-101 Technical Report Preliminary Economic Assessment for the Toroparu Project, Cuyuni-Mazaruni Region, Guyana
| 22.8 Conclusions | 135 |
| 23 Other relevant data and information | 136 |
| 24 Adjacent properties | 137 |
| 25 Interpretation and conclusions | 138 |
| 26 Recommendations | 139 |
| 26.1 Drilling recommendations | 139 |
| 26.2 Mineral processing and metallurgical testing recommendations | 139 |
| 26.3 Mining recommendations | 140 |
| 26.4 Surface infrastructure recommendations | 141 |
| 26.5 Tailings management facility recommendations | 142 |
| 26.6 Environmental recommendations | 142 |
| 27 References | 144 |
| 28 Date, signatures, and certificates of qualified persons | 145 |
| Appendix A – Toroparu mineral titles | 148 |
| Table 1-1 | Sensitivity of key economic indicators to gold price | 12 |
| Table 1-2 | Upper Puruni Concession list | 13 |
| Table 1-3 | Toroparu mineral resources effective October 21, 2025 | 21 |
| Table 1-4 | Life of mine production | 22 |
| Table 1-5 | Estimated initial capital costs | 29 |
| Table 1-6 | Estimated deferred and sustaining capital costs, including contingency | 29 |
| Table 1-7 | Estimated operating costs | 30 |
| Table 1-8 | Estimated life of mine unit operating costs | 30 |
| Table 1-9 | Total mine production | 32 |
| Table 1-10 | Total metal production | 32 |
| Table 1-11 | Economic evaluation results | 32 |
| Table 1-12 | Sensitivity of NPV to discount rate | 33 |
| Table 1-13 | Sensitivity of key economic indicators to gold price | 33 |
| Table 2-1 | Responsibilities of each Qualified Person | 39 |
| Table 4-1 | Upper Puruni Concession list | 43 |
| Table 10-1 | Project drill summary table | 60 |
| Table 13-1 | Proposed processing parameters | 72 |
| Table 14-1 | Composited and top cut composited data statistics | 75 |
| Table 14-2 | Bulk density values applied to the block model | 77 |
| Table 14-3 | Mineral resource cut-off grades | 78 |
| Table 14-4 | Toroparu mineral resources effective October 21, 2025 | 79 |
| Table 16-1 | Recommended pit slope configurations | 81 |
| Table 16-2 | Pit optimization parameters | 84 |
| Table 16-3 | Life of mine production schedule | 88 |
| Table 16-4 | Fleet requirements | 89 |
| Table 16-5 | Labour requirements | 90 |
| Table 21-1 | Estimated initial capital costs | 117 |
| Table 21-2 | Estimated deferred and sustaining capital costs, including contingency | 118 |
| Effective October 21, 2025 | Page |
NI 43-101 Technical Report Preliminary Economic Assessment for the Toroparu Project, Cuyuni-Mazaruni Region, Guyana
| Table 21-3 | Estimated capital expenditure schedule | 118 |
| Table 21-4 | Estimated capital expenditure per depreciation class | 118 |
| Table 21-5 | Estimated operating costs | 120 |
| Table 21-6 | Estimated life of mine unit operating costs | 121 |
| Table 21-7 | Estimated life of mine operating cost schedule | 122 |
| Table 22-1 | Total mine production | 124 |
| Table 22-2 | Total metal production | 124 |
| Table 22-3 | Mining and processing schedule | 126 |
| Table 22-4 | Copper concentrate marketing terms | 127 |
| Table 22-5 Annual payable metals, gold revenue, by-product credits, and treatment and refining charges, penalties, and freight | 129 | |
| Table 22-6 | Economic evaluation results | 130 |
| Table 22-7 | Sensitivity of NPV to discount rate | 131 |
| Table 22-8 | Annual after tax cash flow schedule | 132 |
| Table 22-9 | Sensitivity of key economic indicators to gold price | 134 |
| Table 22-10 | Sensitivity of NPV5% to operating and capital costs and gold price | 135 |
| Figure 4-1 | Toroparu location map | 42 |
| Figure 4-2 | Map of Property titles | 43 |
| Figure 7-1 | Regional geology map | 52 |
| Figure 7-2 | Local geology map | 52 |
| Figure 7-3 | Aeromagnetic data interpretation plan | 53 |
| Figure 7-4 | Property geology map | 54 |
| Figure 7-5 | Plan of Property gold and copper mineralization | 55 |
| Figure 7-6 | Schematic structural model for Toroparu | 56 |
| Figure 10-1 | Plan of Project drill collar locations | 61 |
| Figure 10-2 | Typical cross section of drilling at the Project | 61 |
| Figure 13-1 | Location of metallurgical samples within Project pit designs | 67 |
| Figure 14-1 | Example cross section of Toroparu gold estimate | 78 |
| Figure 16-1 | Plan and long sections of open pit design and optimized pits | 86 |
| Figure 18-1 | Project infrastructure plan | 100 |
| Figure 22-1 | Annual tonnes mined | 124 |
| Figure 22-2 | Annual processed grade and gold produced | 125 |
| Figure 22-3 | Sensitivity of NPV5% to operating and capital costs and gold price | 134 |
| Effective October 21, 2025 | Page |
NI 43-101 Technical Report Preliminary Economic Assessment for the Toroparu Project, Cuyuni-Mazaruni Region, Guyana
| 1 | Summary |
| 1.1 | Introduction |
This technical report has been prepared for Aris Mining Corporation (Aris Mining) in compliance with the disclosure requirements of National Instrument 43-101 – Standards of Disclosure for Mineral Projects (NI 43-101) to disclose material updates to the Toroparu Project (Toroparu, the Project, or the Property) resulting from updated mineral resource estimates and the results of a preliminary economic assessment (PEA).
The Project contains two gold deposits with mineral resources, referred to as the Toroparu deposit and the Sona Hill deposit (collectively Toroparu unless otherwise indicated). The Sona Hill deposit is located approximately 5 km to the southeast of the Toroparu deposit. The Project and adjacent properties are collectively known as the Upper Puruni Concessions. Toroparu is an undeveloped, PEA stage open pit gold project.
This PEA outlines a long life open pit gold mine with robust economics and low operating costs. The Project will generate significant long term benefits for Guyana.
The Toroparu and Sona Hill deposits have been defined by nearly 800 drillholes. The mineralization at the main Toroparu pit has been defined over a strike length of 1.3 km, 500 m across strike, down to a depth of approximately 550 m below surface. Two smaller pits are located to the northwest and southeast of the main Toroparu pit. Sona Hill has been defined over a strike length of 950 m, 300 m across strike, down to a depth of around 200 m below surface.
A conventional open pit mining operation has been designed to mine mill feed from three pits at Toroparu and one pit at Sona Hill at a rate of 7 million tonnes per annum (Mtpa) utilizing an owner operated mining fleet.
The processing plant has been designed to separately treat surface oxidized material and underlying sulphide mill feed types on a campaign basis at a rate of 7 Mtpa using industry standard gravity concentration, carbon in leach, and flotation methods. The gravity concentrator will produce a gold and silver doré from oxide material and gold, silver, and copper doré from sulphide material. The carbon in leach circuit will produce a gold and silver doré from both oxide and sulphide material. The flotation circuit will produce a gold and silver rich copper concentrate from sulphide material at Toroparu only as Sona Hill has a low copper content. The oxide processing circuit enables stable operating conditions with predictable reagent use and minimal logistical overhead and provides a low cost, high recovery gold profile for early stage production. The operating cost for the sulphide processing operation is primarily driven by additional power and reagent requirements and high concentrate handling costs, but results in greater overall revenue at moderate incremental cost. The sulphide circuit is competitive with solid metallurgical recoveries and commercially marketable concentrate quality. Both processing routes deliver positive operating margins, confirming the economic robustness of the Project under the current design and energy assumptions. The results reinforce the scalability of the processing plant.
There is readily available water within the Project area for all aspects of the operation including mining, processing, the camp, and other activities. Water will be sourced from the Puruni River, which passes through the mining area, as well as from groundwater, rainwater, and water recycled from the processing plant and tailings management facility.
The peak workforce during Project construction is estimated at 1,763. During operations, the peak workforce is estimated at 744. The Project will target a high percentage of the workforce to be hired from within Guyana.
The Project’s expected mine life of 21.3 years is based on measured, indicated, and inferred material in the current mineral resource estimate, and there are opportunities for future mine extension if additional mineral resources are defined through continued exploration. The production profile is supported by a consistent milled grade ranging from 1.0 to 1.3 grams per tonne (g/t) gold. The long, steady production profile highlights the grade continuity of the deposit. In addition, the optimized pits and designs were constrained using a gold price assumption of $1,950 per ounce and a cut-off grade of 0.45 g/t Au. This conservative approach indicates meaningful upside potential for resource and mine-life expansion in a higher gold price environment.
Over its life, the Project is expected to produce doré and copper concentrates containing 5.0 million ounces (Moz) of gold, 4.9 Moz of silver, and 260 million pounds (Mlb) of copper. The average annual gold production is estimated at 235 thousand ounces (koz) over the mine life.
| Effective October 21, 2025 | Page |
NI 43-101 Technical Report Preliminary Economic Assessment for the Toroparu Project, Cuyuni-Mazaruni Region, Guyana
The total estimated upfront capital expenditure is $820.3 million, including pre-production costs and $96 million of contingency. This reflects a $38 million initial capital reduction compared to a mining fleet purchase scenario, as the $73 million cost of the initial mining fleet is reduced to approximately $35 million of upfront and construction period lease payments. The strategy is to maintain access to modern, well supported equipment under comprehensive maintenance and parts supply programs over the long +20 year mine life. In addition, the Project has a historic precious metals purchase agreement (PMPA) with Wheaton Precious Metals International Ltd (WPMI) for an additional $138 million of committed funding, further reducing upfront funding requirements to $682 million.
The original PMPA was entered into in 2013 and amended in 2015, when the Project was owned by Sandspring Resources Ltd. (Sandspring), a single-asset junior developer. Under this agreement, WPMI may elect to provide $138 million in construction funding following completion of a full development plan, in exchange for the right to purchase 10% of the Project’s gold production and 50% of its silver production at fixed prices of $400 per ounce of gold and $3.90 per ounce of silver, with both prices subject to escalation beginning on the fourth anniversary of commercial production. The parties intend to explore opportunities for amending the terms of the agreement to align with the updated Project parameters.
Plant throughput is expected to ramp up quickly following mechanical completion and commissioning, supported by a large stockpile of pre-strip and pre-production mill feed accumulated during the construction period. By the end of the three year construction phase, approximately 6.1 million tonnes of mineralized material are expected to be stockpiled adjacent to the process plant. This stockpile represents the majority of the first year’s mill feed and provides operational flexibility during the start up period.
The pre-production stockpile enables a low risk transition into operations, ensuring consistent mill feed as mining advances and allowing for controlled optimization of the crushing and processing circuits and confirmation of metallurgical recoveries of near surface mill feed.
With this strategy, plant throughput is forecast to reach nameplate capacity of 7.0 Mtpa within the first operating year, maintaining steady state production thereafter. The approach minimizes start up risk, smooths working capital requirements, and enhances the reliability of early year cashflow projections presented in the economic analysis.
The cumulative after tax net cash flow is estimated at $3.9 billion, including all initial capital costs, PMPA financing, pre-production costs, sustaining capital costs, closure costs, and contingency. At the base case assumption of $3,000 per ounce of gold, the life of mine average cash costs per ounce of gold are estimated at $826 and all in sustaining costs (AISC) per ounce of gold are estimated at $1,289. The project has an after tax net present value at a 5% discount rate (NPV5%) of $1.8 billion, an internal rate of return (IRR) of 25.2%, and a pay back period of 3.0 years.
The Project is estimated to contribute $2.2 billion in income taxes and $1.2 billion in royalty payments to the Guyanese government.
The sensitivity analysis shows that at higher gold prices, returns increase substantially beyond the attractive levels of the base case scenario, as shown in Table 1-1.
| Table 1-1 | Sensitivity of key economic indicators to gold price |
| Gold price | $2,400/oz | $2,600/oz | $2,800/oz | $3,000/oz Base case |
$3,200/oz | $3,400/oz | $3,600/oz |
| Indicator | |||||||
| After-tax NPV5% ($M) | 944 | 1,231 | 1,518 | 1,805 | 2,091 | 2,378 | 2,664 |
| After-tax IRR (%) | 16.6 | 19.6 | 22.5 | 25.2 | 27.7 | 30.2 | 32.6 |
| Payback period (years) | 4.4 | 3.7 | 3.3 | 3.0 | 2.7 | 2.5 | 2.3 |
All dollar amounts presented in this technical report are expressed in U.S. dollars, unless otherwise indicated.
| Effective October 21, 2025 | Page |
NI 43-101 Technical Report Preliminary Economic Assessment for the Toroparu Project, Cuyuni-Mazaruni Region, Guyana
| 1.2 | Property description, location, and access |
| 1.2.1 | Location and access |
The Project is located in the Cuyuni-Mazaruni Region of Guyana, approximately 215 kilometres (km) southwest of the capital city of Georgetown.
Road access to the Property from Georgetown is via 110 km of paved highway south to the town of Linden, then 18 km of public gravel road to Bartica, a ferry crossing of the Essequibo River at Bartica to Itaballi, then 200 km of public gravel road to the south gate at Toroparu Junction, then 25 km north to the Project site. Overland travel time is approximately 10 to 12 hours in the dry season.
The Project can also be accessed via a one hour, 220 km charter flight from Eugene Correia International (Ogle) Airport in Georgetown to the 650 m long unpaved airstrip at the Project, which can accommodate Cessna Caravan flights holding up to 13 persons or 1,200 kg of cargo. The airstrip is licensed and certified by the Guyana Aviation Agency.
Heavy equipment and cargo may be transported by small ocean-going vessels and barges on the Essequibo River to Itaballi, then loaded on to trucks for the 230 km overland journey to Toroparu, crossing the Puruni River at the town of Puruni Landing, located approximately 60 km from Itaballi, on a company operated 40 tonne ferry barge.
| 1.2.2 | Mineral tenure, Aris Mining’s interest, surface rights, and obligations |
The Project is 100% owned by Aris Mining through its indirect, wholly owned subsidiary, ETK, Inc. (ETK).
A summary of the Upper Puruni Concessions is provided in Table 1-1. Mineral properties in Guyana allow for four scales of operation. ETK holds or has applied for each of the four types of titles, including Mining Permits (MPs), Prospecting Permits Medium Scale (PPMSs), and Small Scale Claims, and two open Prospecting Licenses (PLs) applications which have been with the Guyana Geology and Mines Commission (GGMC) for approval since February 2020. Rentals on the claims and permits controlled by ETK are payable annually by the expiry date of each claim and permit. A work performance bond equal to 10% of the approved budget is required for mining licenses.
The four scales are defined as follows:
| · | Small Scale Claim licenses are 460 by 245 metres (m) or a river claim consisting of one mile of a navigable river. The cost is $1,000 Guyanese dollars per year for a land claim and $2,000 Guyanese dollars per year for a river claim. |
| · | MPs for medium scale mining operations and PPMSs cover between 150 and 1,200 acres each and are restricted to Guyanese ownership or by a joint venture between a Guyanese and a foreigner, whereby the two parties jointly develop the Property. The rental rates for each of the MPs are $1.00 per acre per year and the rental rates for each of the PPMSs are $0.25 per acre for the first year with an increment of $0.10 per acre for every additional year. |
| · | PLs cover between 500 and 12,800 acres and are granted to local or foreign companies. Rental rates for PLs are $0.50 per acre for the first year, $0.60 per acre for the second year, and $1.00 per acre for the third year with an increase of $0.50 per acre for the fourth and fifth years. Large areas for geological surveys are granted as Permission for Geological and Geophysical Surveys with the objective of applying for PLs over the favourable ground. |
| · | Mining Licenses are granted for large scale mining operations and cost $5.00 per acre per year. |
| Table 1-2 | Upper Puruni Concession list |
| Title Description | Number | Area (Acres) |
| Mining Permits | 26 | 25,402.0 |
| Prospecting Permits Medium Scale | 65 | 63,256.0 |
| Small Scale Claims | 16 | 202.5 |
| Prospecting License Applications | 2 | 16,824.0 |
| Total | 109 | 105,684.5 |
ETK is the beneficial holder of all right, title and interest in the lands subject to the Project and therefore also has all surface rights.
| Effective October 21, 2025 | Page |
NI 43-101 Technical Report Preliminary Economic Assessment for the Toroparu Project, Cuyuni-Mazaruni Region, Guyana
| 1.2.3 | Agreements and encumbrances |
The Toroparu deposit is located on property that was originally subject to the Mining Joint Venture Agreement (as defined herein) dated effective August 1, 1999, and as amended and restated in 2008 by the A&R Joint Venture Agreement (as defined herein).
In March 2020, ETK exercised its option under the A&R Joint Venture Agreement to purchase all of Mr. Alfro Alphonso’s right, title and interest to the claims and permits on the Property listed in Appendix A hereto and all minerals and mineral deposits, ores, concentrates, metals, materials, tailings, dumps and mine wastes, in, on and under the claims (the Option Interest) excepting and reserving only to Mr. Alphonso the right to conduct the alluvial mining activities on certain lands not associated with the Project, all as more particularly described in the A&R Joint Venture Agreement, and the use by Mr. Alphonso of certain roads and an airstrip constructed by ETK. ETK paid $20 million to exercise the option to acquire the Option Interest and extinguish its obligations to make further payments under the A&R.
In connection with the option exercise, Mr. Alphonso delivered to ETK a written affirmation, declaration of trust and receipt acknowledging that he hold all lands and permits subject to the A&R Joint Venture Agreement in trust for the exclusive benefit of ETK until such time that the GGMC (as defined herein) and the Minister of Natural Resources of Guyana convert certain of the Small Scale Claim licenses and Mining Permits that are subject to the A&R Joint Venture Agreement to large scale Mining Licenses, and issue the same in the name of ETK. Mr. Alphonso further acknowledged that he is obligated to take any such action as may be reasonably requested by ETK, the GGMC or the Minister of Natural Resources to complete such conversion.
The Sona Hill deposit is located on property that was originally subject to the Godette Joint Venture (as defined herein) effective April 1, 2008. The Godette Heirs remain the registered owners of four mining permits but have irrevocably contributed and committed all their right, title, and interest in the mining permits for the benefit of ETK and the Godette Joint Venture and have granted ETK the exclusive right to conduct operations until such time as the large scale mining licenses have been secured. The cost of such conversion process is the responsibility of ETK but the Godette Heirs have agreed to execute such documents and agreements and take such actions as are reasonably necessary to assist in the transition of the mining permits to large scale mining licenses.
The Toroparu PMPA refers to the Amended and Restated Precious Metals Purchase Agreement among WPMI, Aris Mining Toroparu Holdings Ltd. (formerly GoldHeart Investment Holdings Ltd. (GoldHeart)), a wholly-owned subsidiary of Aris Mining, and Aris Mining Guyana Holdings Corp. (formerly Sandspring, an indirect, wholly-owned subsidiary of Aris Mining) dated April 22, 2015.
Pursuant to the terms and conditions of the Toroparu PMPA, WPMI has agreed to purchase 10% of the gold and 50% of the silver production from the Project in exchange for cash deposits totalling $153.5 million. WPMI has made initial payments totalling $15.5 million, with the remaining $138.0 million to be paid in instalments during construction of the Project, subject to WPMI’s election to proceed following receipt of a final feasibility study for the Project, environmental study and impact assessment and other project related documents.
A consulting agreement was executed between ETK and Alphonso & Sons (A&S) on November 1,2013 (the Consulting Agreement) and which survived the exercise by ETK of the option under the A&R Joint Venture Agreement as described above. Pursuant to the consulting agreement, A&S is to be paid, commencing on the first anniversary of ETK receiving cashflow sufficient to develop and construct a conventional open pit mining and flotation and cyanide leach process operation on the Property with on-site and off-site support operations (with such cash flow to be determined in a definitive feasibility study), eight annual payments of a minimum of $1.0 million adjusted upwards in accordance with the indexing formula set out in the Consulting Agreement (to a maximum of $2.0 million), followed by five extended payments of a maximum of $1.0 million (provided the daily price of gold averaged over a twelve-month period or a calendar month period, as applicable, exceeds $1,750 per ounce) subject to downward indexation based on a formula set out in the Consulting Agreement. Under the base case gold price of $3,000 per ounce applied in this study, the aggregate amount payable to the consultant under the Consulting Agreement is estimated at $21 million and has been considered in the financial analysis.
| 1.2.4 | Royalties |
ETK executed a mineral agreement with the Government of Guyana on November 9, 2011 (the Mineral Agreement) that details all fiscal, property, import-export procedures, taxation provisions, and other related conditions for the continued
| Effective October 21, 2025 | Page |
NI 43-101 Technical Report Preliminary Economic Assessment for the Toroparu Project, Cuyuni-Mazaruni Region, Guyana
exploration and future mine development and operation of an open pit mine at Toroparu. The Mineral Agreement implements a two-tiered gold royalty structure of 5% of gold sales at gold prices up to $1,000 per ounce and 8% of gold sales at gold prices above $1,000 per ounce, as well as a royalty of 1.5% on sales of other valuable metals and minerals.
To the extent known, there are no other royalties, back-in rights, payments, or other agreements and or encumbrances to which the Property is subject.
| 1.2.5 | Significant factors and risks |
Aris Mining is not aware of any significant factors or risks that may affect access, title, or the right or ability to perform on-going work programs on the Property.
| 1.3 | History |
The first known gold mining in the Project area was by alluvial mining methods around 1887. Regional and local mapping was undertaken in 1950. In 1997 Mr. Alphonso began mining old tailings and river alluvium at Toroparu and by 1999 the alluvial material was mostly exhausted and work proceeded deeper into the underlying saprolite, which eventually developed into the Toroparu saprolite open pit. This operation continued until 2001.
Exploration by ETK at Toroparu began in 1999 with the Alphonso Joint Venture, which named ETK as the Project operator. Between 1999 and 2018, ETK conducted extensive auger drill sampling campaigns, geochemical and trench sampling, and geophysical surveys around the Toroparu saprolite open pit and on a regional scale. ETK conducted intermittent, seasonal test mining from saprolite at the saprolite open pit from late 2004 to early 2007. The first diamond drilling on the Property began in late 2006 and the first mineral resource estimate was prepared in 2008. In 2009, ETK conducted an initial metallurgical scoping test program on core samples from the Toroparu deposit.
On November 24, 2009, Sandspring acquired 100% of GoldHeart, which through its wholly owned subsidiary ETK held the mineral and prospecting rights to the Project and adjacent properties.
Sandspring began a diamond drilling program in 2010, conducted geophysical surveys over the Toroparu deposit and reconnaissance grids over other prospects, and completed two mineral resource estimates in 2010. In 2011, Sandspring conducted a mineral resource definition diamond drilling campaign that identified the main lithologies and controls on mineralization. Additional diamond drilling was conducted later in 2011 to explore for nearby satellite deposits. In 2011, Sandspring prepared an updated mineral resource estimate and PEA and a prefeasibility study (PFS) level pit slope design report. Other exploration work conducted by Sandspring in 2011 included a regional saprolite geochemistry sampling program, semi-regional and detailed geochemical sampling, geophysical surveys, and a light detection and ranging (LIDAR) survey. In 2012, Sandspring completed diamond drilling programs and prepared an updated mineral resource estimate and PEA. Other exploration work in 2012 included regional and detailed auger sampling, geochemical sampling surveys, and reverse circulation drilling. In 2013, Sandspring completed a mineral resource estimate and the first mineral reserve estimate for an open pit project as part of a PFS (the 2013 PFS).
On November 11, 2013, Sandspring completed a $148.5 million precious metals streaming agreement with Silver Wheaton (now WMPI), with the capital commitment representing approximately 30% of the $464 million project finance required for the Toroparu Project as determined in the 2013 PFS. The precious metals streaming agreement was subsequently amended in 2015.
Following the 2013 PFS, Sandspring continued to conduct exploration to evaluate other areas on the Property, including auger and soil sampling of regional targets and exploration diamond drilling. Diamond drillhole programs were conducted at Sona Hill in 2015, 2016, and 2018, and utilized for the first mineral resource estimate for Sona Hill in 2018. Other work at Sona Hill included geochemical sampling and geophysical surveys conducted between 2015 and 2016. Additional diamond drillholes were completed at other exploration targets in 2016 and 2018. Sandspring changed its name to Gold X Mining Corp. (Gold X) on November 29, 2019. Diamond drilling programs were undertaken in 2020 and 2021.
On June 4, 2021, Gran Colombia Mining Corp. (Gran Colombia) acquired all of the issued and outstanding shares of Gold X, and indirectly, the Project. On November 29, 2021 Gran Colombia changed its name to GCM Mining Corp (GCM Mining). GCM Mining completed an updated mineral resource estimate and PEA on the Project in 2021. GCM Mining also began pre-construction activities in 2021, undertook infill drilling, and worked with the local governmental agencies to finalize the
| Effective October 21, 2025 | Page |
NI 43-101 Technical Report Preliminary Economic Assessment for the Toroparu Project, Cuyuni-Mazaruni Region, Guyana
amended mining license for a large-scale mining license incorporating an open pit and underground mine operating plan as outlined in the 2021 PEA.
On September 26, 2022, Aris Gold Corporation completed a business combination with GCM Mining, and the combined entity was renamed Aris Mining. Following the business combination, Aris Mining started a re-evaluation and optimization process for the Project, reduced the previously planned construction expenditures, and undertook a new detailed structural analysis and in early 2023 prepared an updated geological model and mineral resource estimate.
None of these historical estimates and studies are considered to be current. They should not be relied on and have been superseded by the current mineral resource estimate and PEA disclosed in this technical report.
| 1.4 | Geological setting, mineralization, and deposit types |
| 1.4.1 | Regional, local, and property geology |
Regionally, the Toroparu and Sona Hill deposits are located in the Amazonian Craton of the Guiana Shield, within the northwest trending Puruni volcano-sedimentary belt, in a sequence of meta-sedimentary and meta-volcanic rocks located along the contact of a small intra-belt pluton. Other gold deposits in Guyana related to similar intrusive bodies include Aurora, located approximately 50 km to the northeast of Toroparu, Oko and Oko West, located approximately 140 km to the east of Toroparu, and Omai, located approximately 180 km to the southeast of Toroparu.
Locally, the Toroparu and Sona Hill deposits are hosted in a sequence of meta-sedimentary and meta-volcanic rocks in a greenstone belt between Proterozoic aged granitoid batholiths.
At the Property, thin, discontinuous mineralized shear zones at the Toroparu deposit are developed mainly in volcanic rocks. Higher grade, discontinuous shear zone hosted mineralization is narrow and mostly parallel to the schistosity. The main controls on mineralization are the west-northwest striking axial planar schistosity and vein swarms that are well developed in the volcanic rocks, and the folded contact between an intrusive complex and the volcanic rocks, particularly the contact of an igneous breccia that forms an important rheological contrast, similar to many other orogenic gold deposits that are strongly controlled by competency contrasts. The Toroparu deposit dips roughly 55° to the west. The Sona Hill deposit has similar controls on mineralization but strikes to the north and dips around 30° to the west.
Two dyke phases are present including hornblende porphyritic andesite dykes and dolerite dykes. Most dykes have an apparent thickness of less than 0.5 m, but some dykes up to 2.5 m thick also occur. Despite being sheared and folded, the dykes are mostly non-mineralized, although some mineralized veins occur along the contacts. Some of these dykes are cut by mineralized shear zones. The dykes are less abundant and more discontinuous at Sona Hill compared to Toroparu.
A thick, gradational, 10 to 35 m thick layer of saprolite with preserved mineralized quartz veins and veinlets, showing evidence of some gold leaching, is present at the surface at Toroparu and reaches up to 60 m thick at Sona Hill. The overburden has abundant low grade gold mineralization but little high grade.
| 1.4.2 | Mineralization |
Mineralization at the Toroparu deposit estimated as mineral resources in the main zone has a volume of around 1.3 km along strike, around 500 m across strike, and a depth of 550 m. There is a zone of mineral resources approximately 1.1 km to the southeast of the main zone with a volume of around 400 m along strike, 230 m across strike, and a depth of 250 m. There are a few other small zones of mineral resources on the order of 100 m long along strike of and parallel to the main zone. The mineralized shear zones are narrow and discontinuous. Sona Hill has a volume of around 950 m along strike, up to 300 m wide, and a depth of around 200 m. Sona Hill is characterized by a lower copper content. Both deposits are open at depth.
The main body of mineralization at Toroparu is characterized by three different vein assemblages including:
| · | gold mineralized quartz and chalcopyrite or bornite veinlets occur both in the volcanic and intrusive rocks and appear to be focused on the boundary between them, particularly within a marginal igneous breccia. Chalcopyrite and quartz are commonly coarse and intergrown. The veinlets are more abundant and thinner in the volcanic rocks, are parallel to the schistosity, and tend to have lower gold grades. The veins are less continuous in the intrusive rocks and igneous |
| Effective October 21, 2025 | Page |
NI 43-101 Technical Report Preliminary Economic Assessment for the Toroparu Project, Cuyuni-Mazaruni Region, Guyana
| breccia but tend to be of higher gold grade and contain molybdenite. Within the intrusive rocks, the veins show an intense chlorite alteration halo. Vein swarms in the volcanic rocks are in zones up to tens of metres thick with low to medium gold grades, with scattered high grades coinciding with high chalcopyrite content. In places, the veins are folded and boudinaged, with chalcopyrite often concentrated in the boudin necks. Veins range between less than 1 mm up to a few centimetres thick. There are rare 0.4 to 0.5 m thick veins. |
| · | gold mineralized chalcopyrite only veinlets occur in the volcanic and intrusive rocks. These veinlets are up to a few millimetres thick and are strongly transposed and dismembered parallel to schistosity and are also folded. In places, chalcopyrite veinlets form a scattered network in quartz veins. |
| · | gold mineralized quartz and molybdenite veins are also present, mostly in the igneous breccia along the intrusive-volcanic contact. These veins are scattered and contain high gold grades. |
| 1.4.3 | Deposit types |
The interpretation of the deposit type at Toroparu is uncertain, with possibilities including an unusually copper rich orogenic gold deposit on the basis of the host greenschist metamorphic rocks and a strong control of mineralization due to competency contrasts, as well as a metamorphosed porphyry gold-copper deposit. Recent structural interpretation work suggests that Toroparu is not a classic lode type orogenic gold deposit and is unlikely to be a deformed porphyry deposit (Pratt and Smeraglia, 2022). A disseminated or sheeted vein type deposit can be used as a guide for exploration planning purposes.
| 1.5 | Exploration |
Exploration at the Property followed a typical progression from mapping, surface sampling and geophysical surveys to generate drilling targets, short auger drilling of the targets, and mineral resource drilling by reverse circulation and diamond drilling.
Regional and local mapping has been undertaken in phases since 1950, both by the title holders and by external parties, including the GGMC. The GGMC undertook regional mapping supported by geochemical drainage sampling in 2000, which showed gold and copper anomalies in the immediate Toroparu area.
ETK began auger drill sampling in 1999 and further auger drilling was completed by ETK and Sandspring between 2001 and 2018. Trench channel samples were completed by ETK in 2005, 2006, and 2009. In 2006 and 2007, ETK conducted a high resolution tri-sensor magnetic and radiometric airborne survey around the Toroparu saprolite open pit area. This identified a magnetic low area just to the north of a large magnetic high area of unknown origin. The survey outlined a number of magnetic and radiometric anomalies in the areas adjacent to the Toroparu saprolite open pit.
In 2010 and 2011, Sandspring conducted gradient array induced polarization and magnetometer surveys over the Toroparu deposit area and other prospects. The induced polarization surveys showed anomalies corresponding to the Toroparu granodiorite pluton. Chargeability was low over areas of high gold-copper mineralization despite the presence of sulfides. At Sona Hill, Sandspring conducted an induced polarization survey in 2015 to 2016 over the saprolite geochemical sampling grid, which suggested an extension of the shear zone to the west, with the potential for additional mineralization in the hangingwall. The chargeability survey did not reveal any significant results due to the low sulfide content of the Sona Hill mineralization. Resistivity did not provide reliable information to differentiate lithology, due to the similar mineralogy of the intrusives and volcanics. In 2011 and 2012, Sandspring conducted a regional saprolite geochemistry sampling campaign in the Upper Puruni area. Semi-regional and detailed geochemical sampling was performed on areas where alluvial mining activities showed gold potential. At Sona Hill, Sandspring conducted geochemical sampling and geophysical surveys during 2015 and 2016. In 2011, Sandspring flew a LIDAR survey over the Toroparu deposit to produce a detailed topographic contour map.
| 1.6 | Drilling |
Drilling has taken place at the Property from 2006 to 2022, mostly for resource definition at the Toroparu and Sona Hill deposits, and for exploration at other prospects. All drilling at the Project has been undertaken on behalf of the Property owners by Orbit Garant Drilling Services (Orbit) of Canada. All diamond drilling was undertaken using a triple tube initiated as HQ diameter (77 mm) and completed through the first 30 to 40 m of saprolite into hard rock, and then reduced to NQ diameter (60 mm) for the remainder of the drillhole. There are no details available regarding the reverse circulation drilling
| Effective October 21, 2025 | Page |
NI 43-101 Technical Report Preliminary Economic Assessment for the Toroparu Project, Cuyuni-Mazaruni Region, Guyana
procedure. However, these holes are mostly located in non-mineralized or very low grade zones and have minimal impact on the mineral resource estimates.
A total of 1,326 drillholes for 265,948 m are present in the Project drilling database. The drillholes in the Toroparu and Sona Hill deposits have adequate spacing between holes to define mineral resources for the mineralization style. Some of the drillholes at the periphery of the deposits or with a wider drilling grid have not been considered for the mineral resources estimate. Drilling considered for the mineral resource estimate corresponds to 617 diamond drill holes at Toroparu and 152 diamond and 29 reverse circulation holes at Sona Hill. Both deposits are open at depth.
As the drillhole intersections through the mineralized zones are used as an input into the mineral resource estimate, the relevancy of the raw drillhole sample assay results are superseded by the mineral resource estimate and are more meaningfully described in the context of the mineral resource estimate.
| 1.7 | Sampling, analysis, and data verification |
| 1.7.1 | Sample preparation and security measures |
The sample intervals were marked by the geologist and the core was cut in half with a diamond bladed saw. Saprolite samples were split with a trowel. Both the diamond bladed saw and trowel were cleaned before each sample. The majority of sample lengths are 1.5 m, with a minimum width of 0.5 m respecting lithological contacts. There are unmineralized narrow dykes less than 0.5 m, and in this case the sample was proportionally completed with wall rock up to 0.50 m.
The sampled half of the core was placed in a labelled bag with a tag number, and the remaining half of the core was retained as reference core kept in the core boxes and photographed.
All on-site sampling was conducted by company employees who managed the security and chain of custody throughout the receipt of the core at the drill rig, the logging, sampling, and delivery to the laboratory.
| 1.7.2 | Quality assurance and quality control |
Sandspring initiated a QAQC protocol in 2010 for Toroparu and Sona Hill that included the submission of one coarse duplicate, two certified standards, and a blank sample for each 32 regular samples. Monthly QAQC reports of assay results were subject to a pass/fail process where QAQC data were evaluated against set parameters and were either passed or failed. Where the QAQC sample failed the evaluation, a corrective action was taken which sometimes included re-assay of the entire batch. Re-assays were subject to the same evaluation process.
QAQC data submitted with the Toroparu deposit drill samples prior to 2020 included 4,220 submissions from a pool of 14 different gold/copper certified standards, 2,784 coarse blanks, and 1,252 core duplicates. Ninety-two sample swaps or laboratory failures were identified in the results returned for the certified standards. The blank results returned indicate possible short-term calibration issues at the laboratory, but no significant grade contamination is evident. No issues are identified with the duplicate sample results.
During the 2020 to 2021 drilling campaigns at the Toroparu deposit, QAQC data submissions included 622 samples from a pool of five different gold/copper/silver certified standards and 854 coarse blanks. No issues were identified with the standard results, and no significant grade contamination is evident.
Drill samples from the Sona Hill deposit submitted during 2012 and 2017 to 2018 included 421 submissions from a pool of six different certified standards, 216 coarse blanks, and 257 core duplicate samples. No issues were identified with the standards, blank samples, and the duplicate samples.
| 1.7.3 | Analytical procedures |
Between June 1, 2011, to 2014, sample preparation was completed at the on-site facility managed and operated directly by Acme. The prepared samples were then flown to Acme Laboratories in Georgetown, Guyana, and from there shipped to either Acme of Santiago, Chile, or Acme of Vancouver, Canada, for analysis.
| Effective October 21, 2025 | Page |
NI 43-101 Technical Report Preliminary Economic Assessment for the Toroparu Project, Cuyuni-Mazaruni Region, Guyana
Before Acme was acquired by Bureau Veritas, it was accredited under the general ISO 9001:2000. Most of the sample were prepared on-site by Acme and analyzed at their facility in Chile. Acme is ISO 9001:2008 and ISO/IEC 17025:2005 certified, and sample preparation and analyses were done at their facility in Canada.
The samples sent to the MSA Laboratory were prepared and analyzed at their Georgetown facility. MSA has ISO 45001:2018 and ISO 9001 certifications, and ISO 17025 accreditation.
There are no records of accreditation for ACT. All the samples analyzed by ACT underwent preparation and analysis at their Georgetown facility.
Acme, MSA and ACT operate as independent commercial certified laboratories both locally and internationally and have no relationship with the past or present Project operators.
Sample preparation at Acme involved initial weighing and drying each sample. The entire sample was then crushed to 80% passing -10 mesh and a 250 gram split was taken and pulverized to 85% passing -200 mesh.
At MSA, the entire sample was dried and crushed to 70% passing -10 mesh. A 250 gram sample split was taken for each sample and pulverized to 85% passing -200 mesh.
There are no records of the sample preparation method used at the ACT facility.
All samples were assayed for gold using by fire assay on a 50 gram charge with atomic absorption spectrometry (AAS) finish. Any sample with an assay greater than 10 g/t Au was re-analyzed using fire assay with gravimetric finish. Most of the Toroparu samples were assayed for copper while at Sona Hill, copper analysis was performed selectively, given the low copper content at the deposit. Samples were not regularly assayed for silver. For copper and silver, the samples were analyzed by four acid digest with AAS finish on a 0.5 gram charge.
| 1.7.4 | Data verification |
The qualified person responsible for geology verified the geological data supporting the mineral resource estimate through the personal inspections and through collaboration with the Project team, including:
| · | reviews of the geological and geographic environment of the Project; |
| · | reviews of the nature and extent of exploration work completed by the Project owners; |
| · | reviews of mineralized and non-mineralized core intersections; |
| · | reviews of the sample storage facilities for core, coarse rejects, and pulp rejects; |
| · | reviews of the geology database; |
| · | reviews of the QAQC results; |
| · | reviews of the geological interpretations; and |
| · | reviews of the grade estimation parameters and results. |
In the opinion of the qualified person, the data used for the purpose of estimating the mineral resources are sufficiently reliable.
| 1.8 | Mineral processing and metallurgical testing |
| 1.8.1 | Testwork history |
Numerous metallurgical testwork programs starting in 2009 have been undertaken to characterize the feed grade mineralization of the Toroparu and Sona Hill deposits, including both oxidized saprolite and sulphide fresh rock, and the material’s response to comminution, gravity concentration, rougher and cleaner flotation, and cyanide leaching. The testwork utilized samples that were representative of the growing mineral resource as it was known at the time of the studies. These studies included processing method trade off studies as well as refinements of the selected operating parameters, as the properties and response of the samples under the testwork conditions were increasingly better understood.
| Effective October 21, 2025 | Page |
NI 43-101 Technical Report Preliminary Economic Assessment for the Toroparu Project, Cuyuni-Mazaruni Region, Guyana
| 1.8.2 | Mineralogical testwork |
A mineralogical assessment showed that the sample was dominated by silicates and with chalcopyrite the predominant sulphide mineral.
Gold deportment studies at a P80 of 150 microns showed that the majority of the gold was present as native gold, indicating that gravity recovery should be considered in the process flowsheet. Other gold minerals included electrum, maldonite, petzite, and hessite.
Liberation studies showed that the liberation of copper minerals improves substantially at grinds finer than 150 microns. In contrast pyrite is widely distributed with significant liberation in the range of 80 to over 90% at all size fractions. Copper minerals and pyrite have negligible mutual association, so producing a marketable concentrate was expected to be possible.
| 1.8.3 | Comminution testwork |
Comminution test results on samples from the Toroparu pits showed that the feed material is in the moderate to hard category and within the abrasive range. Testwork on saprolite samples from Sona Hill showed the feed material to be very soft and not abrasive. Testwork on sulphide rock samples from Sona Hill showed the feed material to be moderately hard and mildly abrasive.
Processing saprolitic material will add viscosity considerations, and the softness will reduce the power demand in the milling circuit. High saprolite blends may allow elevated processing rates of hard material.
| 1.8.4 | Flotation, cyanidation, and gravity recovery testwork |
The testwork includes flotation testwork, gravity recovery, cyanidation, flowsheet testing, the response of recovery to grind size, reagent consumption and optimization, detoxification.
The flotation, cyanidation, and gravity recovery testwork shows that the Toroparu and Sona Hill mill feed responds well to flotation and gravity recovery.
| 1.8.5 | Metallurgical recovery |
The combined metallurgical recoveries for sulphide material are estimated at 93% for gold, 78% for silver, and 88% for copper. For oxide material the combined metallurgical recoveries are estimated at 97% for gold and 46% for silver. Overall, recoveries are estimated at 93.6% for gold, 77.0% for silver, and 86.1% for copper.
| 1.8.6 | Deleterious elements |
There are no known processing factors or deleterious elements that could have a significant effect on the economic extraction of the mill feed that have not been considered and accounted for in the processing plan and economic model. Mineral analysis on the copper concentrates produced from the Toroparu deposit identified deleterious elements that may have some penalty on concentrates, including bismuth, selenium, tellurium, and arsenic.
| 1.9 | Mineral resource estimate |
The mineral resource estimate for open pit resources has been tabulated using a cut-off grade of 0.45 g/t gold, based on a gold price of $1,950 per ounce, an overall gold metallurgical recovery of 95%, a mining cost of $3.20 per tonne, a processing and surface infrastructure cost of $14.70 per tonne, a general and administration (G&A) cost of $4.60 per tonne, and an 8% gold royalty. The mineral resource estimate for underground resources has been tabulated using a cut-off grade of 1.5 g/t gold, based on the same assumptions as open pit resources with the exception of mining costs of $60 per tonne and G&A costs of $5 per tonne.
The mineral resource estimate is constrained within optimized pit and optimized stopes created using a gold price of $1,950 per ounce and cut-off grades of 0.45 g/t gold for open pit mineral resources and 1.5 g/t gold for underground mineral resources.
The Toroparu mineral resource estimate effective October 21, 2025, is shown in Table 1-2.
| Effective October 21, 2025 | Page |
NI 43-101 Technical Report Preliminary Economic Assessment for the Toroparu Project, Cuyuni-Mazaruni Region, Guyana
| Table 1-3 | Toroparu mineral resources effective October 21, 2025 |
| Area | Classification | Tonnes Mt |
Grade gold (g/t) |
Grade silver (g/t) |
Grade copper (%) |
Contained gold (koz) |
Contained silver (koz) |
Contained copper (Mlb) |
| Open pit | Measured | 48.4 | 1.31 | 1.8 | 0.14 | 2,030 | 2,747 | 150 |
| Indicated | 74.9 | 1.26 | 1.2 | 0.08 | 3,041 | 3,008 | 127 | |
| Measured + Indicated | 123.3 | 1.28 | 1.5 | 0.10 | 5,071 | 5,755 | 276 | |
| Inferred | 11.4 | 1.13 | 0.7 | 0.04 | 414 | 275 | 9 | |
| Underground | Measured | 0.1 | 1.89 | 0.4 | 0.03 | 8 | 2 | - |
| Indicated | 3.5 | 2.05 | 0.7 | 0.05 | 231 | 74 | 4 | |
| Measured + Indicated | 3.6 | 2.05 | 0.7 | 0.05 | 239 | 76 | 4 | |
| Inferred | 11.5 | 2.07 | 0.7 | 0.04 | 763 | 263 | 10 | |
| Total | Measured | 48.5 | 1.31 | 1.8 | 0.14 | 2,038 | 2,749 | 150 |
| Indicated | 78.4 | 1.30 | 1.2 | 0.08 | 3,272 | 3,082 | 131 | |
| Measured + Indicated | 126.9 | 1.30 | 1.4 | 0.10 | 5,310 | 5,831 | 280 | |
| Inferred | 22.9 | 1.60 | 0.7 | 0.04 | 1,177 | 538 | 19 | |
|
Notes: 1. Mineral resources are not mineral reserves and have no demonstrated economic viability. 2. The mineral resource estimate was prepared under the supervision of or was reviewed by Pamela De Mark, P.Geo., Senior Vice President Geology and Exploration of Aris Mining, who is a qualified person as defined by NI 43-101. 3. Totals may not add up due to rounding. 4. Mineral resources were estimated using a gold price of $1,950 per ounce. Open pit mineral resources are reported above a cut-off grade of 0.45 g/t gold within an optimized pit shell and underground mineral resources are reported above a cut-off grade of 1.5 g/t gold within optimized stope shapes. 5. There are no known legal, political, environmental, or other risks that could materially affect the potential development of the mineral resources.
|
||||||||
| 1.10 | Mining operations |
The Toroparu and Sona Hill deposits will be mined using conventional open pit mining methods. The operation will utilize conventional drill rigs, excavators, haul trucks, dozers, graders, water trucks, and utility vehicles.
Run of mine material from the Toroparu pits will be hauled from the pit benches to a dedicated run of mine stockpile located close to the Toroparu open pit area and processing plant. Run of mine material from the Sona Hill pit will be hauled approximately 8 km to the run of mine stockpile at the processing plant. Waste material will be hauled from the Toroparu and Sona Hill pits to their designated waste storage facilities located in close proximity around the two open pit areas. Topsoil will be stored separately for future rehabilitation requirements.
Material will typically be blasted in benches ranging from 10 to 20 m high, with 10 m benches assumed for the smaller equipment mining overburden and most saprolite, and 20 m benches for the larger equipment mining transition, sulphide rock, and selected areas of saprolite. Given the softness of the overburden and near surface oxidized saprolite, free digging and ripping opportunities will be considered where possible. Most of the overburden and approximately 75% of the saprolite is expected to be excavated without blasting.
The general mining related layout includes the Toroparu main, northwest, and southeast pits, the Sona Hill pit, a waste rock storage facility located to the northeast of the Toroparu pits, a waste rock storage facility located to the east of the Sona Hill pit, a low grade stockpile located to the west of the Toroparu northwest pit, a run of mine stockpile located at the processing plant, and haul roads.
Key considerations for the strategic mine plan and schedule included a 7.0 Mtpa mining and processing rate over a 21.3 year
| Effective October 21, 2025 | Page |
NI 43-101 Technical Report Preliminary Economic Assessment for the Toroparu Project, Cuyuni-Mazaruni Region, Guyana
mine life. Mining will be prioritized at the Toroparu main pit while production at the Toroparu northwest, Toroparu southeast, and Sona Hill pits will be delayed as long as possible to delay the required capital expenditures. The Toroparu main pit is planned to be mined in four phases to optimize access to higher gold grades, while the Toroparu northwest, Toroparu southeast, and Sona Hill pits are all planned to be mined in a single phase.
There is a three year construction period during which mill feed will be stockpiled for processing in year one. Production reaches 7.0 Mtpa in Year 2 and continues until year 21. The final 2 Mt of mill feed are mined in year 22.
The life of mine production is shown in Table 1-4.
| Table 1-4 | Life of mine production |
| Type | Total |
| Mill feed (Mt) | 149.0 |
| Waste (Mt) | 694.0 |
| Strip ratio (waste to mill feed) | 4.7 |
| Gold grade (g/t) | 1.12 |
| Silver grade (g/t) | 1.3 |
| Copper grade (%) | 0.09 |
| Contained gold (koz) | 5,343 |
| Contained silver (koz) | 6,316 |
| Contained copper (kt) | 137 |
| 1.11 | Processing and recovery operations |
The process plant design criteria and flowsheet are based on extensive metallurgical testwork as described in Section 13, and are based on an industry standard practice metallurgical flowsheet to treat two primary gold bearing rock types, including the oxidized saprolite and other near surface oxidized material and deeper sulphide rock, to produce two doré products and a copper-gold flotation concentrate. The two oxide and sulphide mill feed types will be stockpiled and processed separately during designated campaigns.
The process plant is designed to nominally treat 7.0 Mtpa of run of mine feed and will consist of crushing, grinding, an upfront gravity gold concentration circuit to produce doré, followed by a carbon in leach circuit to produce a second doré, and sulphide flotation for the sulphide feed type only to produce a copper-gold concentrate.
Cyanide contained in the tailings from the gravity concentrate and intensive cyanidation circuits will be neutralized by dosing with a hydrogen peroxide solution before recirculation to the milling circuit, ensuring a safe operating environment. Cyanide present in the carbon in leach tailings stream will be treated in an SO2/air cyanide destruction circuit to meet the environmental compliance requirements before being pumped to the tailings management facility.
The combined metallurgical recoveries for sulphide material are estimated at 93% for gold, 78% for silver, and 88% for copper. For oxide material the combined metallurgical recoveries are estimated at 97% for gold and 46% for silver. Overall, the operation is designed to recover 93.6% of the gold, 77.0% of the silver, and 88.4% of the copper contained in the total life of mine material.
There are no known processing factors or deleterious elements that could have a significant effect on the economic extraction of the mill feed that have not been considered and accounted for in the processing plan and economic model. Mineral analysis on the copper concentrates produced from the Toroparu deposit identified deleterious elements that may have some penalty on concentrates, including bismuth, selenium, tellurium, and arsenic. Further metallurgical testwork is required to better define the potential concentrate quality and therefore no penalties have been considered in the economic analysis.
| Effective October 21, 2025 | Page |
NI 43-101 Technical Report Preliminary Economic Assessment for the Toroparu Project, Cuyuni-Mazaruni Region, Guyana
| 1.12 | Infrastructure, permitting, and compliance activities |
| 1.12.1 | Infrastructure |
The Project site infrastructure will be organized into primary areas including the Toroparu and Sona Hill open pits and processing plant with supporting services, the tailings management facilities, and the site-wide infrastructure including access roads, tailings pipeline, airstrip, and camp area.
The terrain presents challenges due to its low lying riverine areas and expansive flat regions between hills. Heavy rainfall periods increase the risk of inundation, requiring the open pits to be protected from flooding. Land reclamation strategies have been planned to optimize land use and enhance safety. These measures include diverting the rivers to protect the open pits from potential flooding and thereby ensuring operational stability and environmental safety.
Off-site infrastructure will also be required including access and logistical infrastructure located outside of the mining titles. The mine support facilities will comprise the typical components of an open pit mine, including an assay laboratory, core shacks, an independently operated vehicle fuelling facility, a secure explosive storage facility, lighting,
The process facilities will be supported by a primary terrace located on relatively level ground in close proximity to the Toroparu pits to minimize haulage distances and to minimize the required construction fill. The strategic placement offers enhanced access, security, and personnel movement and facilitates the easy supply of utilities such as the water and power to support both production operations and overall site efficiency. The process support facilities include the power plant and all required support infrastructure including stores, workshops, fuel station, medical services, and administration blocks. A helipad located close to the medical facility is also planned to facilitate the rapid medical evacuation of any injured personnel and can also double as emergency gold transport.
The current Project infrastructure includes a 200 person capacity camp, kitchen and mess hall, gym, security fencing and checkpoints, maintenance and welding workshops, carpentry shop, warehouse, water pump and water tank, freshwater pond, core sheds, drilling contractor’s facilities, the 650 m long airstrip, diesel generators and a 70,000 litre capacity fuel farm, and satellite internet. ETK also owns additional facilities along the Puruni road.
| 1.12.2 | Tailings management facility |
The tailings management facility is advantageously located relatively close to the processing plant within a natural valley, bounded by steep hills on the north, east, and west sides, requiring the construction of an embankment only along the southern perimeter, simplifying the engineering design and reducing both construction complexity and material requirements. The general topography slopes southward and the design takes advantage of this natural gradient with most of the drainage and conveyance infrastructure operating under gravity to direct flow to the southern side of the facility. The site is located outside of the one in one thousand year flood line and therefore mitigates the risk of flooding and ensures long term operational resilience.
The design aligns with the Global Industry Standard on Tailings Management, the Canadian Dam Association guidelines, and the requirements of the environmental permits.
The design was developed to a Class 5 level of accuracy as defined by the recommendations of the Association for the Advancement of Cost Engineering, which is considered appropriate for the PEA level study.
The design is inherently conservative and is based on maximum mining rates of 7.0 Mt per annum. The design is for a spigot deposition, downstream constructed, conventional thickened tailings management facility. The required capacity is 154 Mt over a 21.3 year mine life, but the design allows for a conservative total of 161.4 Mt over a 23 year period with a final embankment height of approximately 39 m.
The saprolite in the area of the planned facility basin, which averages approximately 10 m thick, has a low permeability and will serve as a natural barrier. It is envisaged that saprolite material will be used above the upstream face of the embankment to prevent seepage through the embankment, thereby protecting the structural integrity. The design also includes a comprehensive basin drainage system and stormwater management structures to effectively separate contact and non-contact water.
| Effective October 21, 2025 | Page |
NI 43-101 Technical Report Preliminary Economic Assessment for the Toroparu Project, Cuyuni-Mazaruni Region, Guyana
A return water dam will be built to collect and store water released from the tailings facility, providing a controlled pond for recycling water back to the process plant. It will be located to the southeast of the tailings facility within a natural valley, bounded by hills on its eastern and western sides, with the general topography sloping southward. It will be lined with a 1.5 mm thick HDPE liner to prevent seepage and groundwater contamination.
A service road will provide operational access around both the facility and the return water dam.
The tailings facility embankment will be developed in three sequential stages to optimize construction cost. The initial stage provides for 17.6 Mt of capacity representing around 2.5 years of tailings storage with two subsequent raises to contain an additional 35.8 and 108 Mt. The construction period for the first stage will be 12 months, after which deposition will begin. The construction period of the second stage will be 18 months and the third stage will be 50.5 months. The downstream containment embankment and the return water dam embankments will be constructed using overburden rock sourced from the facility basin, selected rockfill, gravel, and crusher dust.
Tailings thickened to a solids content of 50% will be pumped from a central feed tank, located downstream of the thickener, to the facility via a slurry delivery pipeline. A ring main will be installed around the facility perimeter, and the tailings will be deposited into the facility through open ended spigots.
The water balance demonstrates that the proposed contact water management system, including the pool, return water dam, pump sump, and transfers, is sized to appropriately manage inflows within operating bands without exceeding the full supply level, provided the assumed treatment and pumping capacities are maintained.
A cut-off drain will be installed along the northern, eastern, and western perimeters of the site. Upstream groundwater collected in the cut-off drain will be conveyed and discharged into the clean water channels and outlet structures.
A network of drains will be installed throughout the tailings facility basin area. The drainage alignments follow the natural topography and meander within existing valleys. The drains will assist in controlling the phreatic zone within the tailings facility.
A floating pontoon system will pump supernatant water from the pool area into the return water dam. The tailings delivery system will operate in parallel with the return water system, in the opposite direction, with tailings conveyed from the processing plant to the tailings facility while the reclaimed supernatant water will be returned from the return water dam to the plant for make-up water. The return water dam levels will be optimized for storage and operational flexibility, and will be as empty as practically possible under normal conditions to provide sufficient surge capacity for accommodating a simulated one in 5,000 year storm event. On average, the return water dam will maintain a storage volume of approximately 20% of its total capacity to mitigate the risk of overflow.
Surface storm water management infrastructure will be designed, managed, and operated. Contact and non-contact water will be separated into dedicated water systems. Clean water diversion berms and channels will be installed along the tailings facility perimeter to accommodate the one in 100 year peak flow and safely divert non-contact run off to the natural watercourses. The contact water channels will lead to the sump and return water dam. A water treatment plant will treat excess water prior to being returned to the processing plant.
Standpipes will be installed initially in situ, in the embankment, and the formed beach to provide early monitoring of pore water pressures. Once the facility reaches a sufficient height, vibrating wire piezometers will be installed within the basin and embankments along monitoring lines to monitor phreatic surface activity and contribute to slope stability assessments. Continuous flow measurements will be conducted at all outlet drains to assess the effectiveness of phreatic zone drawdown within the facility. Flow meters will be installed on the decant system for continuous flow measurement. This ongoing monitoring will provide valuable data to evaluate overall facility performance against historical trends and facilitate proactive management of water pressures and slope stability.
Aris Mining will appoint an engineer of record to undertake quarterly and annual inspections and reporting of the dam status. ETK will submit all monthly monitoring data to the engineer of record for review and comment.
The tailings facility closure design will be aligned with recent, government approved projects in Guyana, and will include limited basin interventions and the construction of a spillway capable of conveying the regional maximum flood consisting of rock-lined channels terminating in a stilling basin at the downstream end. This basin will safely discharge flows.
| Effective October 21, 2025 | Page |
NI 43-101 Technical Report Preliminary Economic Assessment for the Toroparu Project, Cuyuni-Mazaruni Region, Guyana
Physical stability measures will be undertaken including final crest geometry and slope regrading to target long term factors of safety, buttressing or recontouring the embankment slopes if required. Water management will include surface water diversion channels around the facility to reduce inflows, a water treatment strategy for collected seepage, and a closure water balance. Monitoring and scheduled maintenance will be undertaken including the use of piezometers, inclinometers, survey monuments, seepage flow meters, and visual inspections of vegetation and erosion. Maintenance will include spillway clearing and drainage upkeep. Water quality monitoring of surface and groundwater will be undertaken to ensure compliance with the closure plan
The closure plan outlines closure objectives and design components to ensure long term physical and chemical stability, minimize seepage, protect downstream receptors, and support future sustainable land uses, aligned with regulatory and stakeholder commitments. The closure design criteria will be reassessed during the operation of the facility to improve geotechnical and hydrological criteria to ensure facility stability and to reduce the risk of failure over the extended closure period.
| 1.12.3 | Waste rock management facilities |
Two waste rock management facilities will be constructed for the Toroparu pits, including an 86.8 Mt capacity low grade mineralized waste rock management facility containing material between 0.30 to 0.45 g/t gold and a 591.4 Mt capacity waste rock management facility containing material less than 0.30 g/t of gold. The waste rock storage facility is located just to the northeast of the three Toroparu pits and the low grade storage facility is located to the west of the Toroparu northwest pit.
A single 41.7 Mt capacity facility will be constructed for the Sona Hill pit to contain all material that is less than 0.45 g/t of gold, located to the east of the open pit.
The facility locations were selected to minimize haulage distances and to accommodate infrastructure and surface water management. The facilities at the Toroparu pits also provide protection against extreme flood events.
The facilities were designed for long term stability and rehabilitation, with overall slopes of 21 to 23° to account for high rainfall conditions. Vertical expansion will be limited through controlled lift heights. The maximum height of the low grade facility is 68 m, 89 m at the Toroparu waste rock facility, and 70 m at the Sona Hill waste rock facility. The facilities have been designed to accommodate more material than is present in the current mine plan, at 20% additional capacity for the low grade facility, 9% for the Toroparu waste rock facility, and 5% for the Sona Hill waste rock facility.
| 1.12.4 | Water sources and management |
The mine site has very low relief with shallow groundwater levels. The Project is drained by the Puruni and Wynamu rivers, the confluence of which was historically at the Toroparu southeast pit location, but has been altered by artisanal and small scale mining activities. The predominant flow direction is to the south-southeast over very flat surface topography. The rivers directly influence the proposed Project infrastructure, with all of the open pits located within the floodplain areas of the two rivers. The rivers will be diverted to allow for proper surface water management and to mitigate safety concerns associated with flood events by constructing stream diversion canals and levees. These rivers are the main receptors.
A water management strategy was developed to support the proposed open pit mining, incorporating the pit dewatering requirements and the necessary surface water diversion, water quality management, and infrastructure. Dewatering will be undertaken using in pit sumps to capture pit inflows into each pit and a series of pumps and piping. All water will be directed through a pipeline network placed close to the haulage roads to minimize interference with mining operations and to facilitate safe access for inspection and maintenance. The design includes flexibility to pump water to different destinations to cater for seasonal changes and water quality.
During commissioning, all plant water will be pumped at a rate of 561 litres per second from the Puruni River, and during operations the demand will drop to 53 litres per second. The water will be pumped to the process plant for use as reagent make-up, potable water, gland water, and process water.
The peak make up water demand for mining is 359,334 cubic metres per month and can be sourced from rainwater harvesting, abstracted from the Puruni and or the Wynamu rivers, as well as boreholes. Excess contact and mine water will be managed and treated if required before being discharged to the environment.
| Effective October 21, 2025 | Page |
NI 43-101 Technical Report Preliminary Economic Assessment for the Toroparu Project, Cuyuni-Mazaruni Region, Guyana
| 1.12.5 | Offsite logistics |
Offsite infrastructure includes the Project access road and the use of port access near Itaballi, from where all goods will be transported via road freight to the Project.
The primary access route to the Project begins at Camp 4 and extends to the Project site. This road is approximately 30 km long and in good condition, and will be upgraded to accommodate increased traffic. Road construction activities will be scheduled as part of routine road maintenance, utilizing waste rock material as it becomes available during construction. It is anticipated that the maintenance and widening process will be ongoing throughout the life of the mine.
From Camp 4, the main road continues to Georgetown via the Puruni Road. The section from Itaballi to Puruni has been largely rehabilitated with regular maintenance ongoing to ensure reliability. The remaining segment from Puruni to Toroparu, a distance of approximately 105 km, has been largely rehabilitated but heavy rainfall periodically affects the road’s drivability and requires ongoing maintenance.
The road will continue to be maintained during the mine’s operational life. Waste rock from the site can be used to reinforce weak zones and improve drainage, ensuring sustained access for the timely delivery of resources to the processing plant and to support ongoing operations. Alternatively, closer borrow pits should be identified in following studies to significantly reduce the cost of material transport.
Studies on offsite logistics for the transportation of concentrates from the Project were completed in 2013 and 2022. The proposed port facilities are located near Itaballi at a location on the south bank of the Cuyuni River, approximately 3.2 km upstream of the confluence with the Mazaruni River known as Pine Tree. The Pine Tree Landing port operation is planned to support the mine construction and operation, specifically for the transportation of equipment, materials, and supplies. The port will also function as a transhipment for import and export goods. Supplies will be delivered by barge from Georgetown Harbour to a newly constructed port/wharf at Pine Tree for storage and subsequent road transportation to the Project by truck. Trucks from the Project will return with copper concentrate to the Pine Tree Landing for storage and for both roll on, roll off and crane loading on barges destined for Georgetown.
The proposed port facility will include wharf loading and discharge areas, forklifts, reach stackers, cranes, logistics, truck maintenance, accommodation buildings, container and equipment laydown areas, third party fuel storage and fuelling facilities, and power generation and related utilities. The port facility will accommodate ocean going barges to transfer cargo between Georgetown and Pine Tree Landing via the Essequibo, Mazaruni, and Cuyuni rivers.
The potential exists to engage in strategic conversations with G Mining Ventures to share in capital and operating costs at their planned dedicated wharf and storage facility and associated barging systems serving their Oko West project.
| 1.12.6 | Power |
There is no nearby power grid. The estimated power requirements for the planned process plant are approximately 50 MW, which will be supplied by a 50 MVA, 13.8 kV onsite heavy fuel oil power plant. The plant will consist of six generator sets rated at 9.28 MW, configured to provide an operational capacity of 46MW and an installed capacity of 55 MW, including one standby unit. The generating sets will comprise a four-stroke, V-type, 16 cylinder, turbocharged, and intercooled diesel engine capable of operating on heavy fuel oil, marine diesel oil, or light fuel oil.
The fuel system will manage the unloading, storage, treatment, and delivery of heavy fuel oil transported by road from Georgetown to the Project. Deliveries will be made using four daily 50,000 litre (50 cubic metre) capacity fuel tankers to sustain continuous operations at full load. The power plant’s average fuel consumption will be approximately 196 cubic metres per day. The site fuel storage system will consist of two main heavy fuel oil storage tanks, each with a 2,200 cubic metre capacity, providing approximately three weeks supply of full load operation.
Power will be distributed by overhead power line to the primary crushing area, tailings facility, as well as the open pit mine, accommodation area, and the main access gate.
| 1.12.7 | Environmental factors |
The Project is located near the equator with year round high temperatures and humidity and seasonal tropical weather and climate. Site conditions are wet as a result of high humidity and bimodal annual rainfall ranging from 2,000 to 3,500 mm.
| Effective October 21, 2025 | Page |
NI 43-101 Technical Report Preliminary Economic Assessment for the Toroparu Project, Cuyuni-Mazaruni Region, Guyana
The topography is flat to gently undulating to hilly, with elevations ranging from 80 to 170 m above sea level at the Toroparu deposit and from 80 to 135 m above sea level at the Sona Hill deposit. In places there are hills with steep relief. The Project is located in an area of low seismic activity.
The majority of the Project is covered by secondary growth dense tropical forest and low lying swamps Four types of terrestrial ecosystems are represented at the Project, including mixed forests, liana forest, high hills, and low swamp forest. The area is considered to have a low species diversity relative to tropical rainforests with a total of 55 plant species comprised of 38 timber tree species and 17 plant species.
A total of 19 mammal species have been identified at the Project, the majority of which are fairly common in Guyana. A total of 52 fish species have been identified, none of which are endemic to Guyana, but several have economic and social values as important food sources. No endangered avifauna were identified. The jaguar, lesser seed finch, lowland tapir, red and green macaw, black headed parrot, and the blue headed parrot were identified and have a special classification by the Convention on International Trade in Endangered Species of Wild Fauna and Florida and the International Union for Conservation of Nature, however, there are known known locally rare, critically endangered, or endangered species at the Project.
The Project is located between the Mazaruni River and the Cuyuni River, about 40 km to the north, which are major tributaries of the Essequibo River that flows north to the Atlantic Ocean. In the immediate Project area, the main rivers are the Puruni River and the Wynamu River. The Puruni River flows southeast from its upper reaches near the Project site and the Wynamu River flows south to the confluence with the Puruni River, immediately south of the Project. The confluence of the two rivers has been disturbed by historical and present day artisanal mining which has blocked the natural course of the Wynamu River. Flooded areas occur in low lying areas of the Project site and where artisanal mining is present.
An ESIA was prepared in 2012 and an updated Environmental Management Plan (EMP) was prepared in 2021 as part of the Guyana Environmental Protection Agency (EPA) environmental permitting process for the Project.
Initial environmental baseline studies to support the development of the 2012 ESIA were conducted during wet and dry seasons in 2007, 2008, and 2010 that included characterization of the site and regional vegetation, wildlife, biodiversity, rare and threatened species, topsoil, geology, surface water, groundwater, water quality, groundwater pit inflows modelling, geochemical characterization studies, historic cultural properties, climate, air quality, odor, noise, and dust, and meteorological conditions.
Expanded environmental and social baseline studies were conducted in 2020 to 2021 to support an application for an environmental authorization variance. An updated biodiversity baseline survey was conducted during the wet season of mid 2022 and the dry season of late 2022 to record environmental conditions and seasonal variability. No critically endangered or endangered faunal species were recorded during the surveys.
The most significant environmental issue within the Project area relates to the disturbance caused by historic and on-going illegal artisanal and small scale mining activities. These activities have altered portions of the Wynamu and Puruni river channels and banks within the Project. Abandoned artisanal mining pits containing stagnant water have also created conditions conducive to the proliferation of malaria carrying mosquitoes. Baseline soil chemistry assessments completed in 2022 on historical artisanal tailings within the Project area identified elevated mercury concentrations.
The illegal artisanal and small scale miners gain access to the Project area either via unauthorized footpaths through the surrounding forests or through the Project’s main gate by misrepresenting themselves as members of groups holding legitimate mining claims adjacent to the Property. The Project works closely with the Guyana Environmental Protection Agency (EPA) and the GGMC to address illegal mining within the Project titles by regulating access, conducting regular security patrols, monitoring and documenting all unauthorized mining activities and associated environmental impacts, and submitting monthly reports to both the Guyana EPA and the GGMC. However, the Project does not have the legal authority to remove illegal artisanal miners or their equipment; this authority resides exclusively with the GGMC, the Guyana Police Force, and the Guyana EPA. Enforcement actions by these agencies occur intermittently and typically only provide a short term deterrence, as illegal miners often return to the area following the conclusion of such exercises.
To the extent known, there are no environmental liabilities to which the Property is subject.
| Effective October 21, 2025 | Page |
| NI 43-101 Technical Report Preliminary Economic Assessment for the Toroparu Project, Cuyuni-Mazaruni Region, Guyana |
| 1.12.8 | Permitting factors |
The key permits necessary for Project construction and operation include an environmental permit and a mining license.
On October 15, 2024, ETK was granted a renewed environmental permit based on an application for permit renewal submitted on December 15, 2023. The renewed permit incorporates all Project activities, including the access road and Puruni Pontoon Crossing, and includes design, construction, operational, and monitoring and reporting compliance conditions. The renewed permit is valid for five years and will expire on September 30, 2029. Following the filing of this PEA, ETK will undertake the normal course notifications and consultations with the EPA before commencing construction, ensuring that the existing permit is updated to reflect the final Project plans.
ETK holds additional environmental permits for the Itaballi Landing Facility proposed fuel depot and wharf on the Mazaruni River and the Itaballi Laydown Support Facility at Aremu Junction. The permit was granted by the EPA on December 13, 2023, and expires on October 31, 2028.
All relevant Project environmental compliance thresholds and limits are specified in the 2012 ESIA, the 2021 updated environmental management plan, and the Project environmental permit, which were approved and granted in accordance with the Guyana Environmental Protection Act and Regulations, the Mining Act and Regulations, and other Guyana legislation and regulations relevant to the Project.
Where there are no applicable thresholds and/or limits specified in the Guyana regulations, the Project is mandated under the environmental permit to incorporate the IFC World Bank Group Environment, Health, and Safety Guidelines for Mining in the final design of all facilities and processes, as well as other applicable international best management practice.
A mining license is required to conduct commercial scale mining operations in Guyana. The application must include a technical and economic feasibility study, detailed mine and processing plans, an EIA, and an environmental management plan. A mining license is typically valid for 20 years, or for the life of the mine, whichever is shorter, and may be renewed at upon expiry if required. The license holder is required to pay an annual rental fee for each acre covered by the mining permit. An application for a mining license for the Project was first submitted in 2020 and resubmitted in 2022. The application remains under review by the Ministry of Natural Resources and the GGMC.
| 1.12.9 | Social or community factors |
There are no formal or established communities or settlements within or in the immediate vicinity of the Project area and no established communities in proximity to the associated Project components, and accordingly there are no resettlement obligations. Mercury levels were not above detectable levels in soil, sediment, or water samples from the Project, which supports the interpretation that the areas has not been subject to extensive historical mining activity. No remnants of historical mining activity are present other than the existing former open pit mine. There are no known historical buildings, former settlement sites, or cultural heritage features within the Project area.
There are no villages or communities dependent on groundwater within the Project area, with the nearest village located at Puruni approximately 100 km away.
Development of the Project will provide a diversity of employment and socioeconomic opportunities to the country of Guyana. The Project will require skilled mine workers, services, material suppliers, contractors, and skills training. The direct income benefits of the Project will result in opportunities for indirect benefits such as support to local business, career opportunities for young adults, investment in non-mining related enterprises, and traditional agricultural, cultural, and artisan pursuits.
ETK currently employs 68 persons, including 65 Guyanese and three expatriates, with 13 based in Georgetown, 14 based in Itaballi, 3 based at the pontoon operation in Puruni, and 38 based at the Project camp. The employment numbers are approximately equal between basic and semi-skilled, skilled and professional, and supervisory roles, and 27% of the employees are female.
The peak workforce during Project construction is estimated at 1,763. During operations, the peak workforce is estimated at 744. The Project will target a high percentage of the workforce to be hired from within Guyana.
| Effective October 21, 2025 | Page |
| NI 43-101 Technical Report Preliminary Economic Assessment for the Toroparu Project, Cuyuni-Mazaruni Region, Guyana |
| 1.13 | Capital and operating costs |
| 1.13.1 | Capital cost estimates |
The capital cost estimate was prepared in accordance with the American Association of Cost Engineers Class 4 level, with an expected accuracy of -30% on the low side and +50% on the high side, suitable for a PEA level study. A summary of the estimated initial capital expenditures, including contingency and any operating costs incurred during the pre-production period, is shown in Table 1-4 and a summary of the estimated deferred and sustaining capital costs, including contingency, are shown in Table 1-5.
| Table 1-5 | Estimated initial capital costs |
| Amount ($M) | |
| Mining | |
| Pre-production mining cost | 148.7 |
| Fleet purchase | 34.6 |
| Waste rock and low grade mill feed storage facilities | 21.0 |
| Other mining structures | 20.7 |
| Mining total | 225.0 |
| Processing and surface | |
| Processing plant | 193.3 |
| Earthworks | 85.8 |
| Power | 46.5 |
| Tailings management facility | 42.5 |
| Site and offsite infrastructure | 20.9 |
| Water management | 20.3 |
| Surface total | 409.3 |
| Other | |
| Owners cost | 90.0 |
| Other start up cost | - |
| Contingency | 96.0 |
| Other total | 186.0 |
| Total | 820.3 |
| Table 1-6 | Estimated deferred and sustaining capital costs, including contingency |
| Amount ($M) | |
| Capitalized stripping | 542.7 |
| Fleet purchase – lease payments for replacement fleet | 398.8 |
| Fleet maintenance | 127.6 |
| Fleet purchase – lease payments for remaining initial fleet | 114.7 |
| Site and offsite infrastructure | 47.9 |
| Closure | 34.5 |
| Owners cost and other | 35.5 |
| Total | 1,301.7 |
| Effective October 21, 2025 | Page |
| NI 43-101 Technical Report Preliminary Economic Assessment for the Toroparu Project, Cuyuni-Mazaruni Region, Guyana |
| 1.13.2 | Operating cost estimates |
The operating cost estimates have an overall accuracy +/-35%, suitable for the PEA level. The life of mine operating costs, excluding capitalized operating costs, were estimated for mining, surface infrastructure, processing, G&A including other costs, realization, and royalties.
Royalties due to Guyana include an 8% royalty on gold sales and a 1.5% royalty on each of silver and copper sales.
The summary of the estimated life of mine operating costs is shown in Table 1-6 and the estimated life of mine unit operating cost estimate is shown in Table 1-7.
| Table 1-7 | Estimated operating costs |
| Total life of mine ($M) | Pre-production
($M) |
Production
($M) |
|
| Fleet | 1,468.3 | 91.3 | 1,377.0 |
| Explosives | 448.9 | 21.3 | 427.6 |
| Consumables | 198.3 | 13.3 | 185.1 |
| Labour | 185.5 | 15.5 | 170.0 |
| Pit dewatering | 121.3 | 7.1 | 114.2 |
| Power | 3.4 | 0.2 | 3.2 |
| Contingency (10%) | 242.6 | 14.9 | 227.7 |
| Mining subtotal | 2,668.3 | 163.6 | 2,504.7 |
| Less: capitalized stripping | (706.2) | (163.6) | (542.7) |
| Mining total | 1,962.1 | - | 1,962.1 |
| Reagents | 836.7 | - | 836.7 |
| Power | 815.6 | - | 815.6 |
| Tailings management facility | 273.7 | - | 273.7 |
| Plant maintenance | 86.0 | - | 86.0 |
| Labour | 131.4 | - | 131.4 |
| Plant consumables | 37.4 | - | 37.4 |
| Replacement cost | 18.7 | - | 18.7 |
| Contingency (10%) | 219.9 | 219.9 | |
| Processing and surface total | 2,419.4 | - | 2,419.4 |
| Freight | 173.7 | - | 173.7 |
| Treatment charges | 29.2 | - | 29.2 |
| Refining charges | 49.1 | - | 49.1 |
| Penalties | - | - | - |
| Realization total | 252.0 | - | 252.0 |
| Mine site G&A | 650.0 | - | 650.0 |
| Royalties | 1,192.7 | - | 1,192.7 |
| Total | 7,182.5 | 163.6 | 7,018.9 |
| Table 1-8 | Estimated life of mine unit operating costs |
| Units | Total | |
| Pre-production mining costs | $M | 148.7 |
| Mining costs | $M | 1,783.7 |
| Capitalized stripping | $M | 493.3 |
| Contingency (10%) | $M | 242.6 |
| Effective October 21, 2025 | Page |
| NI 43-101 Technical Report Preliminary Economic Assessment for the Toroparu Project, Cuyuni-Mazaruni Region, Guyana |
| Total mining cost | $M | 2,668.3 |
| Total tonnes moved | Mt | 843.0 |
| Total mining cost per tonne moved | $/t moved | 3.17 |
| $/t processed | ||
| Mining | 16.29 | |
| Processing and surface | 14.77 | |
| Contingency (10%) | 3.11 | |
| Mining and processing costs including contingency | 34.16 | |
| G&A | 4.36 | |
| Royalties | 8.01 | |
| Treatment, refining, and freight | 1.69 | |
| Total operating cost per tonne processed | 48.22 | |
| 1.14 | Economic analysis |
Readers are cautioned that this preliminary economic assessment is considered preliminary in nature. It includes inferred mineral resources which are considered too speculative geologically to have the economic considerations applied to them that would enable them to be categorized and mineral reserves. Therefore, there is no certainty that the conclusions within this preliminary economic analysis will be realised. Mineral resources that are not mineral reserves do not have demonstrated economic viability.
The economic analysis was undertaken to assess and confirm the proposed mine plan described in this technical report, utilizing the production schedule and the associated capital and operating cost estimates included herein. The economic analysis has been conducted on a post-tax, 100% equity (i.e., no debt financing) basis, in constant dollar terms. Sunk costs, such as exploration and the cost of previous studies, were excluded from the analysis.
The economic model incorporates both the historic precious metals purchase agreement with WPMI and the owner operated mining fleet leasing strategy assumed for this study. The WPMI streaming agreement provides for the sale of a portion of the Project’s gold and silver production under fixed-price terms, while the leasing approach reflects the use of an owner-operated fleet financed through OEM-affiliated captive lease programs, which reduces initial capital requirements and ensures consistent equipment availability by maintaining access to new and well-supported equipment throughout the operating period.
The economic viability of the mine plan has been evaluated using key economic indicators, including annual and cumulative cash flows, NPV, and IRR. The NPV presented in this technical report should not be interpreted as the definitive value of the Project and must be considered in conjunction with the accompanying sensitivity analysis.
The key economic results are presented on a pre-tax basis to facilitate comparison with other projects in different jurisdictions by removing the effect of local tax regimes, and on an after-tax basis incorporating the applicable tax rates and economic terms for the Project, providing a more accurate reflection of the potential economic benefits to the Project owners.
The processing facility has been designed with a 7.0 Mtpa capacity. The construction period is scheduled for 12 quarters (3 years). The first mining of mill feed is planned during the first 12 months of Project construction, with all material stockpiled until the process plant is commissioned. The pre-production stockpile is scheduled to supplement run of mine mill feed during Year 1, supporting the rapid production ramp up. Plant throughput will ramp up and reach steady state operations in Year 2. Based on the current mining inventory, the Project has a planned mine life extending to Year 22, providing a long operational horizon and a stable production base following the initial ramp up period.
The total life of mine production is shown in Table 1-8 and the total life of mine metal production is shown in Table 1-9.
| Effective October 21, 2025 | Page |
| NI 43-101 Technical Report Preliminary Economic Assessment for the Toroparu Project, Cuyuni-Mazaruni Region, Guyana |
| Table 1-9 | Total mine production |
| Units | Total | |
| Waste | Mt | 694.0 |
| Mill feed | Mt | 149.0 |
| Total material mined | Mt | 843.0 |
| Strip ratio (waste to mill feed) | 4.66 | |
| Mined gold grade | g/t Au | 1.12 |
| Mined silver grade | g/t Ag | 1.32 |
| Mined copper grade | % Cu | 0.09 |
| Contained mined gold | koz | 5,343 |
| Contained mined silver | koz | 6,316 |
| Contained mined copper | Mlb | 301.5 |
| Table 1-10 | Total metal production |
| Concentrates | Units | Copper concentrate | Doré | Total |
| Concentrate mass | DMT1 | 584,808 | - | |
| Gold recovered | koz | 2,114 | 2,886 | 4,999 |
| Silver recovered | koz | 2,892 | 1,971 | 4,863 |
| Copper recovered | Mlb | 260 | - | 260 |
| Gold grade | g/t | 112 | - | - |
| Silver grade | g/t | 154 | - | - |
| Copper grade | % | 20.1 | - | - |
| Note 1: Dry metric tonnes | ||||
The financial analysis utilized the following metal price assumptions for the base case:
| · | Gold: $3,000/oz | |
| · | Silver: $40/oz | |
| · | Copper: $4.30/lb |
These metal prices were selected as being in line with the long term forecasts, as of October 2025.
The results of the economic analysis are summarized in Table 1-10. The NPV at a range of discount rates is shown in Table 1-11.
| Table 1-11 | Economic evaluation results |
| Key indicators | Units | Total |
| Total life of mine gold produced | Moz | 5.0 |
| Life of mine | Years | 21.3 |
| Average annual gold production | koz | 235 |
| Life of mine average cash cost | $/oz Au | 826 |
| Life of mine average all in sustaining cost | $/oz Au | 1,289 |
| Life of mine average annual EBITDA | $M | 443 |
| Summary cash flow for the life of mine ($M) at $3,000/oz gold price | ||
| Revenue from payable gold sales | $M | 14,677 |
| Less: royalties | $M | 1,193 |
| Effective October 21, 2025 | Page |
| NI 43-101 Technical Report Preliminary Economic Assessment for the Toroparu Project, Cuyuni-Mazaruni Region, Guyana |
| Less: operating costs, net of by-product silver and copper | $M | 4,043 |
| Less: sustaining capital | $M | 1,069 |
| Operating margin | $M | 8,372 |
| Less: income tax | $M | 2,174 |
| After-tax cash flow | $M | 6,198 |
| Less initial capital including pre-production costs, VAT, and contingency | $M | 820 |
| Credit: construction funding, Precious Metals Purchase Agreement financing | $M | (138) |
| Less: other non-sustaining capital expenditures over the life of mine | $M | 198 |
| Less: closure costs | $M | 35 |
| Net cash flow, before losses from PMPA financing | $M | 5,283 |
| Less: losses from PMPA financing | $M | 1,356 |
| Net cash flow | $M | 3,927 |
| Pre-tax indicators at $3,000/oz gold price (base case) | ||
| NPV at 5% discount rate | $M | 2,879 |
| IRR | % | 31.9 |
| Payback period (from start of operations) | Years | 2.4 |
| After-tax indicators at $3,000 gold price (base case) | ||
| NPV at 5% discount rate | $M | 1,805 |
| IRR | % | 25.2 |
| Payback period (from start of operations) | Years | 3.0 |
| After-tax indicators at $3,600/oz gold price | ||
| NPV at 5% discount rate | $M | 2,664 |
| IRR | % | 32.6 |
| Payback period (from start of operations) | Years | 2.3 |
| Table 1-12 | Sensitivity of NPV to discount rate |
| Discount rate | Units | Pre-tax NPV | After-tax NPV |
| 0.0% | $M | 6,102 | 3,927 |
| 5.0% (base case) | $M | 2,879 | 1,805 |
| 10.0% | $M | 1,460 | 865 |
The sensitivity of the after-tax NPV5%, after-tax IRR, and after-tax payback period to a range of gold prices is shown in Table 1-12.
| Table 1-13 | Sensitivity of key economic indicators to gold price |
| Gold price | $2,400/oz | $2,600/oz | $2,800/oz | $3,000/oz | $3,200/oz | $3,400/oz | $3,600/oz |
| Indicator | Base case | ||||||
| After-tax NPV5% ($M) | 944 | 1,231 | 1,518 | 1,805 | 2,091 | 2,378 | 2,664 |
| After-tax IRR (%) | 16.6 | 19.6 | 22.5 | 25.2 | 27.7 | 30.2 | 32.6 |
| Payback period (years) | 4.4 | 3.7 | 3.3 | 3.0 | 2.7 | 2.5 | 2.3 |
The result of the economic analysis indicates that the Project is economically viable under the base case assumptions, based on the current mining inventory and the assumptions described herein. At a $3,000 per ounce gold price, the after-tax NPV5% is $1.8 billion, the after-tax IRR is 25.2%, and the payback period is 3.0 years from the start of operations. The economic results are not a measure of the Project’s fair market value.
| Effective October 21, 2025 | Page |
| NI 43-101 Technical Report Preliminary Economic Assessment for the Toroparu Project, Cuyuni-Mazaruni Region, Guyana |
| 1.15 | Exploration, development, and production |
There are no current exploration or production plans for the Project. Aris Mining has initiated a PFS for Toroparu, targeted for completion in 2026 with a goal of advancing toward construction.
| 1.16 | Conclusions |
This PEA outlines the technical and economic benefits of the Project and justifies the continuation to PFS level studies.
The mine is designed to produce 7.0 Mtpa of mill feed using conventional open pit methods. The process plant will use a conventional flowsheet to produce doré and copper concentrates for export, containing 5.0 Moz of gold, 4.9 Moz of silver, and 260 Mlb of copper over the life of mine. The oxide processing circuit enables stable operating conditions with predictable reagent use and minimal logistical overhead and provides a low cost, high recovery gold profile for early stage production. The operating cost for the sulphide processing operation is primarily driven by additional power and reagent requirements and high concentrate handling costs, but results in greater overall revenue at moderate incremental cost. The sulphide circuit is competitive with solid metallurgical recoveries and commercially marketable concentrate quality. Both processing routes deliver positive operating margins, confirming the economic robustness of the Project under the current design and energy assumptions. The results reinforce the scalability of the processing plant.
The peak workforce during Project construction is estimated at 1,763. During operations, the peak workforce is estimated at 744. The Project will target a high percentage of the workforce to be hired from within Guyana.
The Project mine life is estimated at 21.3 years based on the current mining inventory. There are opportunities for future mine extension if additional mineral resources are defined through continued exploration.
At the base case assumption of $3,000 per ounce of gold, the Project is estimated to contribute $2.2 billion in income taxes and $1.2 billion in royalty payments to the Guyanese government. The estimated initial capital expenditure is $820 million. The cumulative after-tax net cash flow is $3.9 billion, including initial capital costs, pre-production costs, contingency, construction funding, PMPA financing, other growth capital expenditures, closure, and losses from PMPA financing. Cash costs per ounce of gold are estimated at $826 and AISC per ounce of gold are estimated at $1,289. At the base case assumption of $3,000 per ounce of gold, the Project has an after-tax NPV5% of $1.8 billion, an IRR of 25.2%, and a payback period of 3.0 years.
With the PEA complete, Aris Mining intends to complete a PFS in 2026 with a goal of advancing toward construction.
| 1.17 | Recommendations |
| 1.17.1 | Drilling recommendations |
The qualified person responsible for Section 10 recommends condemnation drilling in the area of planned Project infrastructure to ensure that no potentially economic mineralization underlies the proposed infrastructure. A first pass 400 by 400 m grid is recommended in the areas of the tailings facility, camp area, airstrip, processing plant, and waste dumps. The program will comprise approximately 100 drillholes for 6,000 m, for an estimated cost of $1.5 million.
| 1.17.2 | Mineral processing and metallurgical testing recommendations |
The qualified person responsible for Section 13 notes that the current PEA has been based on testwork conducted over the past decade using similar, but not identical, samples and objectives. To progress the Project to a Preliminary Feasibility Study level, a comprehensive metallurgical testwork program is recommended to confirm the chosen process criteria for both oxide and sulphide mill feed. The focus of this work should be on the Toroparu deposit, with all testwork performed on representative samples from within the mining schedule to ensure a reliable PFS level design can be further developed.
The recommended studies and testwork include:
| · | Mineralogical and liberation studies |
| o | undertake detailed mineralogical and liberation studies on head samples to characterize mineral associations, grain size distribution, and liberation characteristics; and |
| Effective October 21, 2025 | Page |
| NI 43-101 Technical Report Preliminary Economic Assessment for the Toroparu Project, Cuyuni-Mazaruni Region, Guyana |
| o | undertake comprehensive chemical analysis of the head samples to determine the complete elemental composition, including potential deleterious elements and key assay values. |
| · | Comminution studies |
| o | undertake comminution and material characterization tests for oxide, sulphide, and composite materials, including bulk and solid densities, uniaxial compressive strength, Bond crushability (Impact) work index, JKTech Drop Weight Test, Bond abrasion index, Bond ball mill work index, and SAG mill test (Starkey); and |
| o | assess whether high saprolite blends in the mill feed could allow for elevated processing rates. |
| · | Gravity and intensive leach testwork |
| o | evaluate the mill feed performance in a Knelson gravity concentration circuit with intensive cyanidation of the gravity concentrate. Assess the effect of hydrogen peroxide doxing for cyanide destruction of the intensive leach residue across oxide, sulphide, and composite materials. |
| · | Flotation testwork |
| o | undertake flotation testwork to evaluate desulphurization of the mill feed, selective copper recovery to concentrate, and gold recovery to tailings; |
| o | confirm and optimize the reagent suit, including hydrated lime pH modifier, primary collector, secondary collector, frother, and gangue depressant; |
| o | complete flotation testing in both open circuit and locked cycle modes for a four stage flotation configuration including rougher, regrind, cleaner, recleaner, and re-recleaner, in line with the proposed process flowsheet; and |
| o | conduct comparative assessments of flotation recovery versus primary grind size and regrind size. |
| · | Leaching testwork |
| o | leaching studies including both bottle roll and tank leach tests to compare carbon in pulp and carbon in leach performance. Leach testwork should include leach gravity tailings on oxide only material, leach flotation tailings on sulphide only material, and leach flotation tailings on composite oxide and sulphide material; and |
| o | use key test parameters to monitor reagent consumption, oxygen consumption, adsorption kinetics, and leach performance versus grind size. The feasibility of cold cyanide stripping for copper removal from loaded carbon should be assessed. |
| · | Detoxification testwork |
| o | evaluate the INCO SO2/air cyanide detoxification process focussing on reagent and oxygen consumption, including lime, sodium metabisulphite, copper sulphate pentahydrate, and caustic soda. |
| · | Settling, flocculation, and underflow rheology testwork |
| o | evaluate colloidal stability to determine achievable underflow density, optimum flocculant dosage, and solids loading rates using a bench scale dynamic thickener; and |
| o | undertake static thickening and flocculant screening tests to determine flocculant type, optimum dosage, and feed solids concentration for maximum settling efficiency. |
| · | Water quality assessment |
| o | verify the quality and suitability of the Puruni River water as the primary process water source. Conduct full water analysis to determine its chemical composition, suspended solids content, and compatibility with process reagents and plant equipment. The results will inform process water treatment requirements and potential impacts on metallurgical performance. |
| · | Integration and laboratory requirements |
| o | conduct all testwork at a single accredited laboratory to ensure consistency and comparability of results. All testwork should yield comparative insights for oxide only, sulphide only, and composite oxide-sulphide operations. |
The cost to complete this testwork and the PFS is estimated at $1.25 million.
| 1.17.3 | Mining recommendations |
The qualified person responsible for Section 16 recommends the following additional testwork and studies to advance the Project to a PFS level and to support the development of PFS level engineering designs and cost estimates.
| · | Mining and infrastructure |
| o | undertake surface drilling to verify geotechnical data and related assumptions and update the geotechnical and slope stability analyses for PFS open pit slope designs and waste rock management facility slope stability; |
| Effective October 21, 2025 | Page |
| NI 43-101 Technical Report Preliminary Economic Assessment for the Toroparu Project, Cuyuni-Mazaruni Region, Guyana |
| o | update the input parameters for the pit optimization process following trade-off studies on the pit selection; |
| o | assess alternative material handling options; |
| o | undertake the mine design, pushback sequencing, life of mine schedule, and waste rock management facilities to a PFS level of accuracy. Consider the potential mining mix in terms of selectivity or flexibility, in the context of the rainy seasons and other logistical challenges while maximizing early operating margins in the shorter term, and to accommodate the processing of mineralized waste material over the longer term; |
| o | assess the transition zone between surface to underground mining operations to demonstrate additional upside potential; and |
| o | develop an appropriate contractor tender package to secure accurate contractor mining rates from reputable contractors for the operating cost estimates as an alternative to owner mining. |
The cost to complete the testwork and studies is estimated at approximately $0.7 million.
| · | Hydrogeology |
| o | continuously monitor site rainfall data; |
| o | continue monitoring site surface water and groundwater quality for analysis at an accredited laboratory to acquire additional pre-mining baseline water quality data and in particular to evaluate the effect of artisanal mining on the site water quality; |
| o | undertake site tests to quantify the vertical hydraulic conductivity of the saprolite, and update the 3D numerical groundwater flow model; |
| o | update the site wide water balance to include chemical mass load modelling as well as the expected water quality to be discharged to the environment. Simulate the catchment runoff in more detail to determine the abstraction requirements for mine water supply and yield of the rivers in case of lower than expected rainfall years; |
| o | update the numerical groundwater model and run additional sensitivities with the inclusion of faults acting as sub surface conduits; |
| o | model the tailings and waste rock management facilities in more detail to determine the potential for chemical mass release and downstream environmental impacts. Undertake site specific adsorption tests on arsenic and related chemical constituents to inform a hydrogeochemical model to quantify the waste source release and downstream migration rates to potential environmental receptors such as the Puruni River. Update the Source-Pathway-Receptor model based on a detailed tailings management facility water balance and the hydrogeochemical model outputs to quantify the potential risks of contaminant migration potential. Evaluate the potential impacts against environmental risk limits; |
| o | verify the presence of potential sub-surface groundwater flow zones such as fault zones with a surface geophysical survey. Target, drill, and aquifer test any identified sub surface groundwater flow zones and consider their use as dewatering boreholes; |
| o | drill groundwater monitoring boreholes within the vicinity of the Sona Hill pit to acquire site specific groundwater monitoring data; |
| o | evaluate the possibility and potential effect of mud rush into the pits; |
| o | progress the hydrogeological model through the following studies and technical workstreams: |
| § | vertical hydraulic conductivity and transmissivity saprolite pumping tests |
| § | electrical resistivity tomography geophysical surveys within the vicinity of the planned tailings management facility and open pits; |
| § | update the 3D numerical Finite Element subsurface flow system model; |
| § | model the static site wide water and salt balance; and |
| § | undertake adsorption tests and update the geochemical model; |
| § | complete three additional groundwater monitoring boreholes near Sona Hill. |
The cost to complete the testwork and studies is estimated at approximately $0.2 million.
| · | Hydrology |
| o | undertake geotechnical and soils studies of the Project area, including particle soil distribution of the upper soils in the catchment area to determine soil texture, permeability tests of the upper soils in the catchment area, geotechnical test pits along the proposed protection levees and at culvert locations, and laboratory tests |
| Effective October 21, 2025 | Page |
| NI 43-101 Technical Report Preliminary Economic Assessment for the Toroparu Project, Cuyuni-Mazaruni Region, Guyana |
on the saprolite material to assess whether it can be made more impermeable and used as a clay core for the protection levees;
| o | continue the monitoring of rainfall and flow in the Puruni and Wynamu rivers, ensure regular calibration of the flow measuring devices, and report on outages, changes, and issues with the monitoring; |
| o | extend the LIDAR survey further to the southeast of the Project to minimize assumptions for the flood modelling and levee designs; |
The cost to complete the testwork and studies is estimated at approximately $0.04 million.
| 1.17.4 | Surface infrastructure recommendations |
The qualified person responsible for surface infrastructure recommends the following work and studies to advance to a preliminary feasibility study:
| · | Surface infrastructure |
| o | undertake further investigations into the local regulations for the airstrip to assess whether the airstrip width could be reduced, which would lower bulk fill material requirements and costs; |
| o | investigate whether a more economical route located closer to the tailings management facility is available for the tailings access road, which would lower material requirements and costs; |
| o | conduct test pits and rotary core drilling on the road centrelines and 30 m on either side of the roads at intervals no more than 200 m to obtain more detailed geotechnical information; |
| o | conduct oriented diamond drillholes oriented perpendicular to the horizontal alignment of the roads, typically extending at least 5 m below the roadway elevation, to characterize the soil and rock mass properties for the deep cutting designs (of what). Determine the rock mass properties using downhole geophysics such as an acoustic televiewer; |
| o | conduct laboratory testwork on soil and rock samples collected from the pits and drill core. For soil samples, the testwork should include particle size distribution, Atterberg Limits, specific gravity, moisture-density, California Bearing Ratio, oedometer, and triaxial isotropically consolidated, drained, and undrained tests. For rock samples, the testwork should include unconfined compression method tests and triaxial compressive strength; |
| o | undertake a similar testing scope for all terrace locations where heavily loaded structures will be constructed, as well as for those with planned deep cuts and high fill slopes. The geotechnical properties of all materials in cut slopes, as well as those planned for use as engineered fill, should be determined using the recommended soil laboratory testing scope; and |
| o | undertake material testing on in situ rock for suitability in the use of concrete as fine and coarse aggregate. Fine aggregate testwork should include particle size distribution, dust content, and fineness modulus while coarse aggregate testwork should include particle size distribution, dust content, fineness modulus, 10% fines aggregate crushing test, aggregate crushing value, flakiness index, chloride content, organic impurities, and soluble deleterious materials. |
The cost to complete this testwork is estimated at $1 million.
| 1.17.5 | Tailings management facility recommendations |
The qualified person responsible for the tailings management facility recommends the following work and studies to advance to a preliminary feasibility study:
| · | develop an interdisciplinary knowledge base; |
| · | undertake site characterization including climate, geomorphology, hydrology, and hydrogeology; |
| · | undertake geotechnical site investigations including desktop assessments benchmarked against similar projects, geophysical studies, and seismic hazard assessment to confirm the embankment founding conditions, and the geotechnical character of the embankment zones, facility basin, return water dam, and centrelines of the channels and access roads; |
| · | undertake tailings characterization studies such as particle size distribution, foundation indicators, specific gravity, drained and undrained strength behaviour, geochemical properties, and rheology; |
| Effective October 21, 2025 | Page |
| NI 43-101 Technical Report Preliminary Economic Assessment for the Toroparu Project, Cuyuni-Mazaruni Region, Guyana |
| · | undertake a tailings dam breach assessment incorporating credible failure modes and with contour data that represent the natural ground level of the areas that were inundated in the analysis and slightly beyond, as well as the site specific rheological data; |
| · | undertake confidence classification in accordance with regulatory and industry standards; |
| · | design the tailings management facility based on the determined consequence classification; |
| · | update the design basis report, including a failure modes and effects analysis; |
| · | undertake stability assessments, including seepage analysis and 2D limit equilibrium analysis using available site specific data; |
| · | develop a dynamic site wide water balance to optimize the water management infrastructure and water treatment plant sizing; |
| · | develop a conceptual closure design for the facility; |
| · | further optimize the facility footprint and stage development; |
| · | undertake a water quality chemical mass balance study for the facility effluent considering the water quality of supernatant within the tailings stormwater run off, baseline water quality in the area, and allowable water quality for release; |
| · | conduct a detailed surface topographical survey of the Project site; |
| · | perform a waste classification and geochemical assessment; |
| · | undertake design reviews and optimization of the barrier systems, drainage systems, channel designs, and return water dam barrier systems to assess potentials for cost and construction time savings; |
| · | develop and plan the decant system; |
| · | identify and confirm borrow areas for sourcing suitable construction materials; |
| · | investigate the raising of the stage 2 footprint for the full life of mine to reduce the facility footprint and construction costs; |
| · | assess the barrier system requirements on the basis of the geochemical and water quality chemical mass balance; and |
| · | assess whether the capital and operating costs can be reduced by considering the rheology and adjusting the water balance. |
The cost to complete this testwork is estimated at $1.5 million.
| 1.17.6 | Environmental recommendations |
The qualified person responsible for Section 20 makes the following recommendations:
| · | install additional weather monitoring stations at the Project to improve data collection and quality control; |
| · | resume biennial biodiversity monitoring programs within the proposed Project footprint; |
| · | undertake additional humidity cell testing to further assess metal leaching of waste rock, low-grade economic material, and the open pit walls under alkaline conditions; and |
| · | assess the potential environmental impacts of elevated metal discharge concentration relevant to the background water quality of the receptor. |
This work can be undertaken as part of the future Project permitting work and will be accounted for within the existing environmental budget.
| Effective October 21, 2025 | Page |
| NI 43-101 Technical Report Preliminary Economic Assessment for the Toroparu Project, Cuyuni-Mazaruni Region, Guyana |
| 2 | Introduction |
| 2.1 | Issuer and purpose of the technical report |
This technical report has been prepared for Aris Mining in compliance with the disclosure requirements of NI 43-101 to disclose material changes to the Project resulting from updated mineral resource estimates and the results of a PEA.
The effective date of this technical report is October 21, 2025. No new material information has become available between this date and the signature date given on the certificate of the qualified persons. The quality of information, conclusions, and estimates contained in this technical report is based on information available at the time of the effective date and the assumptions, conditions, and qualifications set forth in this technical report. Except for the purposes legislated under Canadian securities law, any other uses of this technical report by any third party is at that party’s sole risk. The user of this technical report should ensure that this is the most recent technical report for the Property and that it has not been superseded by a new technical report. Any previous technical reports for the Project are no longer current.
Aris Mining is a Canadian mining company with its common shares listed on the Toronto Stock Exchange under the symbol ARIS and the NYSE American LLC under the symbol ARMN.
| 2.2 | Source information |
Unless otherwise stated, information, data, and illustrations contained in this technical report or used in its preparation have been prepared by the authors for the purpose of this technical report.
| 2.3 | Qualified persons and personal property inspections |
This technical report was prepared by Vaughn Duke, Pr. Eng., Founding Partner and Director of Sound Mining International Limited; Jan Eklund, P.E., Process Consultant of LogiProc Pty. Ltd. (LogiProc); and Pamela De Mark, P. Geo., Senior Vice President of Geology and Exploration of Aris Mining, all of whom are Qualified Persons as defined by NI 43-101 and are independent of Aris Mining for the purpose of NI 43-101, with the exception of Pamela De Mark, who is an employee of Aris Mining. The qualified persons for the technical report and sections for which each qualified person is responsible are presented in Table 2-1.
Mr. Duke conducted a personal inspection of the Project from June 10 to 12, 2025. Mr. Duke reviewed the proposed locations of the open pit operation, the processing plant, and tailings management facility, as well as the environmental setting, road access, and logistics for mining.
Mr. Eklund did not conduct a personal inspection of the Project.
Ms. De Mark conducted a personal inspection of the Project from June 10 to 12, 2025, and from July 4 to 6, 2025. During the visit Ms. De Mark reviewed representative core intersections across the deposits, reviewed the core cutting and storage facilities, and reviewed the site layout and logistics for future mining and processing and the environmental layout.
| Table 2-1 | Responsibilities of each Qualified Person |
| Qualified Person | Section responsibility |
| Vaughn Duke | 2: Introduction; 12.3: Data Verification; 15: Mineral reserve estimates; 16: Mining methods, 18: Project infrastructure related to mining and the tailings management facility, 19: Market studies and contracts; 21: Capital and operating costs related to mining and tailings management facility; 22: Economic analysis; 24: Other Relevant Data and Information; 27: References; and the relevant summaries of those sections included in 1: Summary; 2: Introduction; 25: Interpretation and Conclusions; and 26: Recommendations. |
| Jan Eklund | 2: Introduction; 12: Data Verification; 13: Mineral Processing and Metallurgical Testing; 17: Recovery methods: 18: Project infrastructure related to processing and surface infrastructure with the exception of the tailings management facility; 21: Capital and operating costs related to processing and surface infrastructure with |
| Effective October 21, 2025 | Page |
| NI 43-101 Technical Report Preliminary Economic Assessment for the Toroparu Project, Cuyuni-Mazaruni Region, Guyana |
| Qualified Person | Section responsibility |
| the exception of the tailings management facility; 24: Other Relevant Data and Information; 27: References; and the relevant summaries of those sections included in 1: Summary; 2: Introduction; 25: Interpretation and Conclusions; and 26: Recommendations. | |
|
Pamela De Mark
|
2: Introduction; 3: Reliance On Other Experts; 4: Property Description and Location; 5: Accessibility, Climate, Local Resources, Infrastructure and Physiography; 6: History; 7: Geological Setting and Mineralization; 8: Deposit Types; 9: Exploration; 10: Drilling; 11: Sample Preparation, Analyses and Security; 12: Data Verification; 14: Mineral Resource Estimates; 20: Environmental studies, permitting, and social or community impact; 23: Adjacent Properties; 24: Other Relevant Data and Information; 27: References; and the relevant summaries of those sections included in 1: Summary; 25: Interpretation and Conclusions; and 26: Recommendations. |
| 2.4 | Currencies, units, and coordinate system |
Unless expressly stated otherwise in this technical report, all currency amounts are in United States Dollars and quantities are in metric units. Project data coordinates are in the Universal Transversal Mercator (UTM) grid Zone 20N: 1956 Provisional South American Datum.
| Effective October 21, 2025 | Page |
| NI 43-101 Technical Report Preliminary Economic Assessment for the Toroparu Project, Cuyuni-Mazaruni Region, Guyana |
| 3 | Reliance on other experts |
In preparing this technical report, Pamela De Mark has relied on information provided by employees of Aris Mining in 2025, regarding environmental and permitting matters described in Section 20. The qualified person has not independently verified this information and disclaims responsibility for such information used in Section 20.
Except for the purposes legislated under applicable securities laws, any use of this technical report by any third party is at that third party’s risk.
| Effective October 21, 2025 | Page |
| NI 43-101 Technical Report Preliminary Economic Assessment for the Toroparu Project, Cuyuni-Mazaruni Region, Guyana |
| 4 | Property description and location |
| 4.1 | Property location |
The Property is located in the Cuyuni-Mazaruni Region of Guyana, approximately 215 km southwest of the capital city of Georgetown, at approximately 6°27′1″ N and 60°3′11″ W. A map showing the location of the Property is shown in Figure 4-1 (source: Aris Mining, 2025).
| Figure 4-1 | Toroparu location map |

| 4.2 | Mineral tenure and Aris Mining’s interest |
The Project is 100% owned by Aris Mining through its indirect, wholly owned subsidiary, ETK.
A summary of the Upper Puruni Concessions is provided in Table 4-1, a map showing the location of the titles is shown in Figure 4-2 (source: Aris Mining, 2025), and a list of the Project titles is provided in Appendix A. Mineral properties in Guyana allow for four scales of operation. ETK holds or has applied for each of the four types of titles, including MPs, PPMSs, and Small Scale Claims, and two open PL applications which have been with the GGMC for approval since February 2020. Rentals on the claims and permits controlled by ETK are payable annually by the expiry date of each claim and permit. A work performance bond equal to 10% of the approved budget is required for mining licenses.
The four scales are defined as follows:
| · | Small Scale Claim licenses are 460 by 245 m or a river claim consisting of one mile of a navigable river. The cost is $1,000 Guyanese dollars per year for a land claim and $2,000 Guyanese dollars per year for a river claim. |
| · | MPs for medium scale mining operations and PPMSs cover between 150 and 1,200 acres each and are restricted to Guyanese ownership or by a joint venture between a Guyanese and a foreigner, whereby the two parties jointly develop the Property. The rental rates for each of the MPs are $1.00 per acre per year and the rental rates for each of the PPMSs are $0.25 per acre for the first year with an increment of $0.10 per acre for every additional year. |
| · | PLs cover between 500 and 12,800 acres and are granted to local or foreign companies. Rental rates for PLs are $0.50 per acre for the first year, $0.60 per acre for the second year, and $1.00 per acre for the third year with an increase of |
| Effective October 21, 2025 | Page |
| NI 43-101 Technical Report Preliminary Economic Assessment for the Toroparu Project, Cuyuni-Mazaruni Region, Guyana |
$0.50 per acre for the fourth and fifth years. Large areas for geological surveys are granted as Permission for Geological and Geophysical Surveys with the objective of applying for PLs over the favourable ground.
| · | Mining Licenses are granted for large scale mining operations and cost $5.00 per acre per year. |
| Table 4-1 | Upper Puruni Concession list |
| Title Description | Number | Area (Acres) |
| Mining Permits | 26 | 25,402.0 |
| Prospecting Permits Medium Scale | 65 | 63,256.0 |
| Small Scale Claims | 16 | 202.5 |
| Prospecting License Applications | 2 | 16,824.0 |
| Total | 109 | 105,684.5 |
| Figure 4-2 | Map of Property titles |
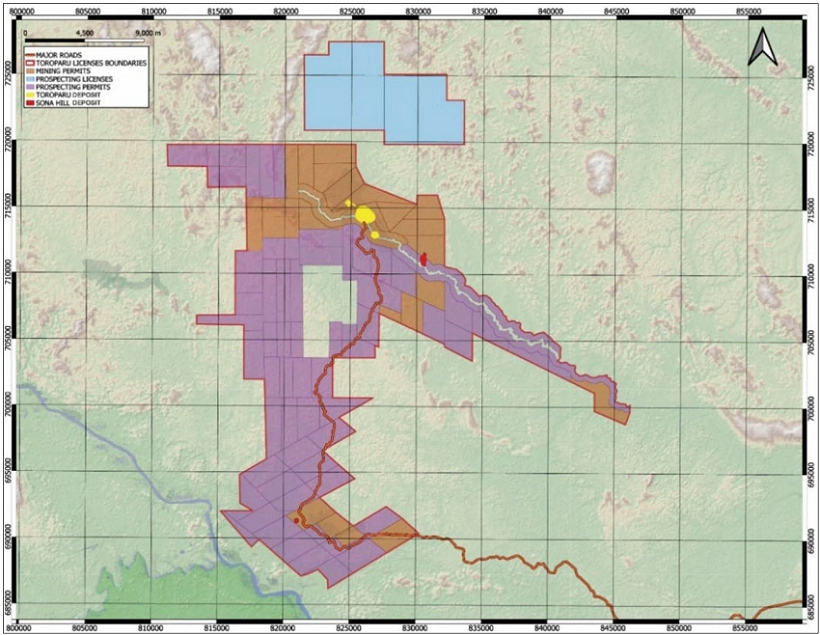
| 4.3 | Royalties, agreements, and encumbrances |
| 4.3.1 | The Alphonso Joint Venture |
The Toroparu deposit is located on property that was originally subject to the Mining Joint Venture Agreement which documented the terms and conditions of the Alphonso joint venture, then known as the Upper Puruni Venture (the Mining Joint Venture Agreement). The Mining Joint Venture Agreement was entered into between Mr. Alfro Alphonso and Mr. Gregory K. Graham effective August 1, 1999. This original agreement was amended and restated in its entirety effective January 1, 2008 pursuant to the terms of an amended and restated joint venture agreement between Mr. Alfro Alphonso and ETK (the A&R Joint Venture Agreement).
In March 2020, ETK exercised its option under the A&R Joint Venture Agreement and acquired the Option Interest excepting and reserving only to Mr. Alphonso the right to conduct the alluvial mining activities on certain lands not associated with the Project, as set out in the A&R Joint Venture Agreement, and the use by Mr. Alphonso of certain roads and an airstrip constructed by ETK. ETK paid $20 million to exercise the option to acquire the Option Interest and extinguish its obligations to make further payments under the A&R.
| Effective October 21, 2025 | Page |
| NI 43-101 Technical Report Preliminary Economic Assessment for the Toroparu Project, Cuyuni-Mazaruni Region, Guyana |
In connection with the option exercise, Mr. Alphonso delivered to ETK a written affirmation, declaration of trust and receipt acknowledging that he hold all lands and permits subject to the A&R Joint Venture Agreement in trust for the exclusive benefit of ETK until such time that the GGMC and the Minister of Natural Resources of Guyana convert the Small Scale Claim licenses and MPs that are subject to the A&R Joint Venture Agreement to large scale Mining Licenses, and the same are issued in the sole name of ETK. ETK is required to pay any and all costs, including any fees or rentals, associated with such lands and permits. Mr. Alphonso further acknowledged that he is obligated to take any such action as may be reasonably requested by ETK, the GGMC or the Minister of Natural Resources to complete such conversion.
| 4.3.2 | The Godette Joint Venture |
The Sona Hill deposit is located on property that is subject to the Godette joint venture (the Godette Joint Venture). Through its wholly owned subsidiary ETK, Aris Mining has rights to four MPs (the Godette MPs) pursuant to the joint venture agreement effective April 1, 2008 (the Godette Agreement). ETK has sole operatorship and sole decision-making discretion in all matters pertaining to gold exploration on the lands subject to the Godette Agreement. ETK also has the sole and exclusive right to sell all gold, other precious metals, or gemstones it may recover from the properties. On December 21, 2012, ETK purchased 100% of the Godette’s’ interest in the Godette Agreement for $300,000. The Godette Heirs remain the registered owner of the Godette MPs; however, under the Godette Agreement, the Godette Heirs have irrevocably contributed and committed all their right, title, and interest in the Godette MPs for the benefit of ETK and the Godette Joint Venture and have granted ETK the exclusive right to conduct operations. Further, the Godette Heirs have agreed that during the term of the Godette Agreement, the Godette Heirs will not deal or attempt to deal with any right, title, or interest in the Godette MPs or in their interest in the Godette Agreement in any way that would or might affect the right of ETK to conduct operations on the lands subject to the Godette MP. Finally, the Godette Heirs have agreed to execute such documents and agreements and take such actions as are reasonably necessary to assist in the conversion of the Godette MPs to large scale mining licenses which shall be issued solely in the name of ETK.
ETK holds an irrevocable power of attorney from the Godette Heirs, providing ETK, with among other powers, the right to take any action that the Government of Guyana may require to issue a Mining Permit covering the Godette MP’s.
| 4.3.3 | The Toroparu Precious Metals Purchase Agreement (the Toroparu PMPA) |
The Toroparu PMPA refers to the amended and restated precious metals purchase agreement among WPMI, Aris Mining Toroparu Holdings Ltd. (formerly GoldHeart), a wholly-owned subsidiary of Aris Mining, and Aris Mining Guyana Holdings Corp. (formerly Sandspring, an indirect, wholly-owned subsidiary of Aris Mining) dated April 22, 2015.
WPMI originally entered in the Toroparu PMPA in 2013, which was subsequently amended in 2015, at a time when the Project was owned by Sandspring Resources, a single-asset junior developer. Under this terms of the PMPA, WMPI may elect to provide $138 million in construction funding following completion of a full development plan, in exchange for the right to purchase 10% of Toroparu’s gold production and 50% of its silver production at fixed prices of $400/oz and $3.90/oz, respectively, with both prices subject to escalation beginning on the fourth anniversary of commercial production. The capital commitment represented approximately 30% of the $464 million project finance required as determined in the 2013 PFS.
WPMI has made initial payments totalling $15.5 million, with the remaining $138.0 million to be paid in instalments during construction of the Toroparu Project, subject to WPMI’s election to proceed following receipt of a final feasibility study for the Toroparu Project, environmental study and impact assessment and other Project related documents.
The parties intend to explore opportunities for amending the terms of the agreement to align with the updated project parameters.
| 4.3.4 | The Consulting Agreement |
The Consulting Agreement between ETK and A&S was executed on November 1, 2013, and which survived the exercise by ETK of the option under the A&R Joint Venture Agreement as described above. Pursuant to the Consulting Agreement, A&S is to be paid, commencing on the first anniversary of ETK receiving cashflow sufficient to develop and construct a conventional open pit mining and flotation and cyanide leach process operation on the Property with on-site and off-site support operations (with such cash flow to be determined in a definitive feasibility study), eight annual payments of a minimum of $1.0 million adjusted upwards in accordance with the indexing formula set out in the Consulting Agreement (to
| Effective October 21, 2025 | Page |
| NI 43-101 Technical Report Preliminary Economic Assessment for the Toroparu Project, Cuyuni-Mazaruni Region, Guyana |
a maximum of $2.0 million), followed by five extended payments of a maximum of $1.0 million (provided the daily price of gold averaged over a twelve-month period or a calendar month period, as applicable, exceeds $1,750 per ounce) subject to downward indexation based on a formula set out in the Consulting Agreement. Using the base case gold price of $3,000 per ounce applied in this study, the aggregate amount payable to the consultant under the Consulting Agreement is estimated at $21 million.
| 4.3.5 | Royalties |
ETK is a party to a Mineral Agreement with the Government of Guyana that details all fiscal, property, import-export procedures, taxation provisions, and other related conditions for the continued exploration and future mine development and operation of an open pit mine at Toroparu. The Mineral Agreement implements a two-tiered gold royalty structure of 5% of gold sales at gold prices up to $1,000 per ounce and 8% of gold sales at gold prices above $1,000 per ounce, as well as a royalty of 1.5% on sales of copper and other valuable minerals.
To the extent known, there are no other royalties, back-in rights, payments, or other agreements and or encumbrances to which the Property is subject.
| 4.4 | Environmental liabilities |
The most significant environmental issue within the Project area relates to the disturbance caused by historic and on-going illegal artisanal and small scale mining activities. These activities have altered portions of the Wynamu and Puruni river channels and banks within the Project. Abandoned artisanal mining pits containing stagnant water have also created conditions conducive to the proliferation of malaria carrying mosquitoes. Baseline soil chemistry assessments completed in 2022 on historical artisanal tailings within the Project area identified elevated mercury concentrations.
To the extent known, there are no environmental liabilities to which the Property is subject.
| 4.5 | Permits |
ETK holds all the necessary permits and permissions currently required to conduct its exploration work and medium-scale mining and gravity recovery of gold and other minerals on the Project. In order to advance the Project, ETK has applied to the GGMC and the Minister of Natural Resources of Guyana to convert the Small Scale Claim licenses, Mining Permits and Prospecting Permits it presently holds through the A&R Joint Venture Agreement and the Godette Agreement to large scale mining licenses and to issue the same in the name of ETK (the Conversion).
ETK has a renewed environmental permit for the Project effective for the period between October 2024 and September 2029. The environmental permit must be renewed by submitting a completed Application Form for Renewal of Environmental Authorization to the Environmental Protection Agency of Guyana no later than March 31, 2029. Following the filing of this PEA, ETK will undertake the normal course notifications and consultations with the EPA before commencing construction, ensuring that the existing permit is updated to reflect the final Project plans.
The Ministry of Natural Resources of Guyana and the Ministry of Public Infrastructure of Guyana (the Ministries) have also settled on the terms of a road users’ agreement to be entered into upon completion of the Conversion, wherein, among other things, the Ministries will facilitate any arrangements that are required by ETK in order to enjoy unhindered and reasonable access to a road built on public lands leading to the Project and ETK will maintain and rehabilitate sections of such road, subject to the final terms of such agreement.
ETK has negotiated the terms of an Investment Agreement with GO-Invest which governs the terms by which the Company, directly or indirectly through contractors, undertake the activities as set out in the Mineral Agreement such as importing vehicles, machinery, equipment and materials required for building the Project and also governs the terms by which the Guyana Revenue Authority will extend certain tax exemptions. It is expected that ETK and GO-Invest will enter into the Investment Agreement once the Conversion is complete.
| 4.6 | Significant factors and risks |
Aris Mining is not aware of any other significant factors or risks that may affect access, title, or the right or ability to perform on-going work programs on the Property.
| Effective October 21, 2025 | Page |
| NI 43-101 Technical Report Preliminary Economic Assessment for the Toroparu Project, Cuyuni-Mazaruni Region, Guyana |
| 5 | Accessibility, climate, local resources, infrastructure, and physiography |
| 5.1 | Topography, elevation, vegetation, and climate |
The topography is flat to gently undulating to hilly, with elevations ranging from 80 to 170 m above sea level at the Toroparu deposit and from 80 to 135 m above sea level at the Sona Hill deposit. In places there are hills with steep relief.
The Project is located within a poorly drained tropical rain forest characterized by dense vegetation. Vegetation has been cleared in the areas developed for the current site infrastructure, including the camp, airstrip, and access roads.
Weather records are based on data measurements collected from a meteorological base station established during baseline environmental studies in 2007, and two regional weather stations managed by the Guyanese Hydrometeorological Agency at Mazaruni, located 200 km from the Project, and at Enachu, located 75 km from the Project. The average temperature on site is around 28°C with a minimum of 18°C and a maximum of 32°C. Humidity is high with an average of 82%, with values ranging from between 64 and 100%. Annual rainfall ranges from 2,000 to 3,500 mm with two wet seasons occurring between December to February and between May to July. The dry season is the ideal time to carry out geochemical sampling, drilling, and geophysical surveys, but exploration can be carried out on a year-round basis. The same is assumed for any future mining operations.
| 5.2 | Property access, transport, population centres, and mining personnel |
Road access to the Property from Georgetown is via 110 km of paved highway south to the town of Linden, then 18 km of public gravel road to Bartica, a ferry crossing of the Essequibo River at Bartica to Itaballi, then 200 km of public gravel road to the south gate at Toroparu Junction, then 25 km north to the Project site. Overland travel time is approximately 10 to 12 hours in the dry season. ETK is exploring possible partnerships with other road stakeholders to coordinate road maintenance and stewardship and is working on a road use and maintenance agreement with G Mining Ventures for the Itaballi to Puruni Landing section of the road.
The Project can also be accessed via a one hour, 220 km charter flight from Ogle Airport in Georgetown to the 650 m long airstrip at the Project, which can accommodate Cessna Caravan flights holding up to 13 persons or 1,200 kg of cargo. The Project airstrip is licensed and certified by the Guyana Aviation Agency.
Equipment and supplies come from Georgetown. Heavy equipment and cargo may be transported by small ocean-going vessels and barges on the Essequibo River to Itaballi, then loaded on to trucks for the 230 km overland journey to Toroparu, crossing the Puruni River at the town of Puruni Landing, located approximately 60 km from Itaballi, on a company operated 40 tonne ferry barge. ETK maintains and operates the Puruni River pontoon crossing.
Heavy equipment operators are available from Georgetown, which has a population of around 235,000, and the town of Linden located approximately 110 km south of Georgetown, which has a population of approximately 45,000, and from other population centres in Guyana. The nearest population centre is at Bartica, which is located 230 km away from the Project and has a population of approximately 11,000.
| 5.3 | Surface rights |
ETK is the beneficial holder of all right, title and interest in the lands subject to the Project and therefore also has all surface rights. The titles are also covered by logging concessions that allow the concession holder the right to remove any merchantable timber when the Property is cleared of vegetation for Project development.
ETK has initiated the acquisition of land leases from the Guyana Lands and Surveys Commission for the Project off site facilities, including the proposed port facility at Pine Tree Landing located near Itaballi, the Itaballi landing facility, and the Itaballi laydown support facility at Aremu Junction.
| Effective October 21, 2025 | Page |
| NI 43-101 Technical Report Preliminary Economic Assessment for the Toroparu Project, Cuyuni-Mazaruni Region, Guyana |
| 5.4 | Infrastructure |
The Property has sufficient area to allow for future tailings management areas, waste disposal areas, and processing plant sites.
The current Project infrastructure includes the camp, kitchen and mess hall, gym, security fencing and checkpoints, maintenance and welding workshops, carpentry shop, warehouse, water pump and water tank, freshwater pond, core sheds, drilling contractor’s facilities, a 650 m long unpaved airstrip that can accommodate Cessna Caravan flights holding up to 13 persons or 1,200 kg of cargo, diesel generators and a 70,000 litre capacity fuel farm, and satellite internet.
The Project camp can accommodate up to 200 persons and has an onsite health centre staffed by qualified medics. The health centre is equipped to provide emergency first response clinical care for employees, the provision of mosquito bed nets, malaria treatment, and daily checks of blood pressure, blood oxygen, and sugar levels. The centre also provides health care assistance to sick camp visitors as well as emergency evacuations via a 24 hour standby medivac flight in the event of a serious injury.
ETK also owns additional facilities along the Puruni road. At Itaballi Landing, there is a security outpost with a water pump and tank, and a wharf for the transport of people and materials by fast boats. At Itaballi Camp, located 3 km along the Puruni road, there is a camp facility to accommodate 45 people, a kitchen and mess hall, gym, maintenance workshop, warehouse, water well and pump, health post, security fencing and checkpoint, a diesel generator and 30,000 litre capacity fuel farm, and internet. At Puruni, located 100 km along the Puruni road, there is a pontoon for crossing people, vehicles, and equipment across the Puruni River, and accommodation for three people in a house located within G2 Goldfield’s Peter’s Mine compound. At Camp 106, located 106 km along the Puruni road, there is a camp facility to accommodate 30 people, a kitchen and mess, a diesel generator, and water well and pump. At Toroparu Camp 4, located 200 km along the Puruni road, there is a security outpost and gate, satellite internet, and a water well and pump.
| 5.5 | Power and water |
Water is available through the year from the Wynamu River, its creeks, and from rainfall run off. Water for the camp is available throughout the year from a groundwater fed supply pond, supply wells, and from rainfall run off.
During commissioning, all plant water will be pumped at a rate of 561 litres per second from the Puruni River, and during operations the demand will drop to 53 litres per second. The water will be pumped to the process plant for use as reagent make-up, potable water, gland water, and process water.
The peak make up water demand for mining is 359,334 cubic metres per month and can be sourced from rainwater harvesting, abstracted from the Puruni and or the Wynamu rivers, as well as boreholes. Excess contact and mine water will be managed and treated if required before being discharged to the environment.
There is no nearby power grid. The estimated power requirements for the planned process plant are approximately 50 MW, which will be supplied by a 50 MVA, 13.8 kV onsite heavy fuel oil power plant. The plant will consist of six generator sets rated at 9.28 MW, configured to provide an operational capacity of 46MW and an installed capacity of 55 MW, including one standby unit. The generating sets will comprise a four-stroke, V-type, 16 cylinder, turbocharged, and intercooled diesel engine capable of operating on heavy fuel oil, marine diesel oil, or light fuel oil.
The fuel system will manage the unloading, storage, treatment, and delivery of heavy fuel oil transported by road from Georgetown to the Project. Deliveries will be made using four daily 50,000 litre (50 cubic metre) capacity fuel tankers to sustain continuous operations at full load. The power plant’s average fuel consumption will be approximately 196 cubic metres per day. The site fuel storage system will consist of two main heavy fuel oil storage tanks, each with a 2,200 cubic metre capacity, providing approximately three weeks supply of full load operation.
Power will be distributed by overhead power line to the primary crushing area, tailings facility, as well as the open pit mine, accommodation area, and the main access gate.
| Effective October 21, 2025 | Page |
| NI 43-101 Technical Report Preliminary Economic Assessment for the Toroparu Project, Cuyuni-Mazaruni Region, Guyana |
| 6 | History |
| 6.1 | Early work |
The first known gold mining in the Project area was by alluvial mining methods around 1887. Regional and local mapping was undertaken in 1950. Mr. Alphonso began mining old tailings and river alluvium at Toroparu in 1997 using high pressure water jets to wash the material into a pit and then pumped the slurry up to a sluice box. The alluvial material was mostly exhausted by 1999 and work proceeded deeper into the underlying saprolite, which eventually developed into the Toroparu saprolite open pit. This operation, which utilized up to 15 dredges, continued until 2001.
| 6.2 | ETK – 1999 to 2009 |
Exploration by ETK at Toroparu began in 1999 with the Alphonso Joint Venture, which named ETK as the Project operator.
Between 1999 and 2018, ETK conducted extensive auger drill sampling campaigns around the Toroparu saprolite open pit and on a regional scale for the purpose of evaluating the possibility of re-working the mine tailings, to test the saprolites beneath alluvial cover in areas of historic gold workings, to determine regional gold potential, and to identify surface mineralization for follow up by diamond drilling. Geochemical and trench sampling and geophysical surveys were also conducted during this period to identify gold mineralization targets.
In 2000, ETK commenced rehabilitation and upgrade of the 240 km access road into the Property.
In 2004, ETK commissioned a gravity circuit to test mine the tailings and saprolite and conducted intermittent, seasonal test mining from saprolite at the saprolite open pit from late 2004 to early 2007 using hydraulic sluicing and a gravity circuit with screens, ball mill, centrifugal concentrators, and shaker tables.
The first diamond drilling on the Property began in late 2006, comprised of 23 drillholes that identified gold mineralization over a volume of 600 by 300 by 300 m around the Toroparu saprolite open pit. In 2008 a further seven drillholes were completed, which expanded the known mineralization to 650 by 350 by 425 m. The first mineral resource estimate was prepared effective October 26, 2008, utilizing 27 drillholes for 9,492 m.
In 2009, ETK conducted an initial metallurgical scoping test program from saprolite and hard rock samples collected from core from the Toroparu deposit, in order to assess the amenability of the saprolite and bedrock for typical gold and copper recovery.
On November 24, 2009, Sandspring acquired 100% of GoldHeart, which through its wholly owned subsidiary ETK held the mineral and prospecting rights to the Project and adjacent properties.
| 6.3 | Sandspring – 2010 to 2021 |
Sandspring began a diamond drilling program in 2010 for resource definition and infill of the main mineralization zone, to step out drilling to the east-southeast, west-northwest, and west of the Toroparu saprolite open pit, and to expand and upgrade the mineral resource categories of mineralization identified in previous drill programs. Five geotechnical drillholes were completed for pit slope geotechnical design. Sandspring also conducted geophysical surveys over the Toroparu deposit and reconnaissance grids over the Ameeba, Manx, and Timmermans prospects.
Sandspring completed two mineral resource estimates in 2010, effective May 12, 2010, and September 12, 2010.
In 2010, CM Power Inc. undertook an evaluation of the hydro power capacity of the Kumarau Falls on the Kumurung River, which was a former United Nations Development Program sponsored project, located 35 km southwest of the Project.
In 2011, Sandspring conducted a mineral resource definition diamond drilling program focussed on the eastern main mineralized zone of the Toroparu deposit to increase the mineral resources and to upgrade inferred mineral resources to measured and/or indicated resources. This work identified the main lithologies and controls on mineralization. By this time the drilling database contained 225 drillholes for 111,668 m completed between 2006 and 2011. Additional drilling was conducted later in 2011 adjacent to the main zone area to explore for nearby satellite deposits, as well as reconnaissance
| Effective October 21, 2025 | Page |
| NI 43-101 Technical Report Preliminary Economic Assessment for the Toroparu Project, Cuyuni-Mazaruni Region, Guyana |
drilling over prospective areas with promising surface exploration results, including Ameeba and Manx, located several kilometres to the northwest and northeast of the Toroparu deposit, respectively.
Sandspring prepared an updated mineral resource estimate and PEA of the Toroparu deposit effective April 30, 2011, utilizing drilling data available up to December 31, 2010. A PFS level pit slope design report was prepared in October 2011.
Other exploration work conducted by Sandspring in 2011 included a regional saprolite geochemistry sampling program focussed on high gold potential areas and semi-regional and detailed geochemical sampling where alluvial mining activities showed gold potential, geophysical surveys over several gold prospects including Ameeba, Timmermans, Manx, and northwest of the Toroparu deposit to complete the 2010 grids, and a LIDAR survey to produce a detailed topographic contour map. Additionally, SGS completed a metallurgy gold deportment study for Sandspring on a 400 kg composite sample of the Toroparu mineralization collected from 23 diamond drillholes, to determine gold occurrences and to identify and evaluate any mineralogical factors that might affect gold recovery.
In mid-2011 the access road to the Project was improved and rehabilitated over a total distance of 240 km. A road work contract was signed with the GGMC in 2012 to finance part of the total road rehabilitation costs. Approximately 100 km of the road rehabilitation work was conducted by a local construction company.
Sandspring signed a Mineral Agreement on November 9, 2011 with the Government of Guyana, which defined all fiscal, property, import-export procedures, taxation provision, and other related conditions for the continued exploration, mine development, and mining and processing operations at the Property. The Government of Guyana agreed to grant a large scale mining license which allows the start of commercial production once economic feasibility is demonstrated.
In 2012, 142 holes were completed for the Toroparu deposit area, bringing the drilling database to a total of 367 holes for 145,723 m completed between 2006 and 2012. Sandspring completed an updated mineral resource estimate and PEA of the Toroparu deposit, effective January 30, 2012, utilizing the drilling data available up to October 2011.
Exploration work in 2012 included regional and detailed auger sampling to assess regional gold potential and to identify local gold anomalies, geochemical sampling surveys, and re-analyses of previous geophysical survey data. Reverse circulation drilling was also conducted to test gold anomalies identified by the saprolite geochemistry samples. The results for Ameeba were limited. Sandspring also conducted reverse circulation and diamond drilling at Sona Hill, which showed encouraging but scattered gold intercepts with no significant copper.
Project work in 2012 included a preliminary design study on the access road reconstruction from the Itaballi port facility to the Project, a distance of 230 km, including a conceptual roadway reconstruction design plan, cost estimates, and preliminary solicitation of qualified contractors. In June 2012 the environmental permit was granted by the Environmental Protection Agency. A monitoring program commenced to assess the upstream and downstream Kumurung River flow characteristics as well as rainfall in the Project watershed.
In 2013, Sandspring completed a mineral resource estimate and the first mineral reserve estimate for an open pit project as part of a PFS effective May 8, 2013.
Following the 2013 PFS, Sandspring continued to conduct exploration to evaluate other areas on the Property, including auger and soil sampling of regional targets, past and current alluvial gold prospecting, and by exploration diamond drilling. This work included infill saprolite sampling at Sona Hill prior to diamond drilling. The Wynamu Hill gold anomaly was discovered by geochemical surveys in 2012 and 2013.
Three diamond drilling programs comprising 184 holes for 21,963 m were conducted at Sona Hill in 2015, 2016, and 2018, which were utilized for the first mineral resource estimate for Sona Hill, effective September 20, 2018. Other work at Sona Hill included geochemical sampling and geophysical surveys conducted between 2015 and 2016.
Sixty-two diamond drillholes were also completed at the Wynamu exploration target in 2016 and 2018, with promising results. In 2018, additional diamond drilling was undertaken at Ameeba focussed on saprolite hosted gold mineralization, which returned narrow and scattered results.
| Effective October 21, 2025 | Page |
| NI 43-101 Technical Report Preliminary Economic Assessment for the Toroparu Project, Cuyuni-Mazaruni Region, Guyana |
Sandspring changed its name to Gold X on November 29, 2019. A diamond drilling program was undertaken in 2020 and 2021, consisting of 114 holes for 20,750 m at the Toroparu main and southeast areas to test a new geological interpretation of narrow, cross-cutting high grade structures, compared to the previous interpretations of a large, low-grade deposit.
On June 4, 2021 Gran Colombia acquired all of the issued and outstanding shares of Gold X, and indirectly, the Project. On November 29, 2021 Gran Colombia changed its name to GCM Mining.
| 6.4 | GCM Mining (renamed to Aris Mining) – 2021 to present |
In June 2021, GCM Mining began refining the Project development options. GCM Mining completed an updated mineral resource estimate and PEA on the Project, effective December 2, 2021, utilizing drillholes and trenches completed between 2006 and 2021 for the Toroparu and Sona Hill deposits.
GCM Mining began pre-construction activities in 2021, including hiring the Project team and key contractors, preparation of camp facilities, rehabilitation of the Project airstrip, design and civil works related to the camp, road, and water management, electrical network design, permitting, design of initial environmental and social governance initiatives, and various environmental studies. Following the 2021 PEA, GCM Mining undertook additional infill drilling, prepared for a PFS, and worked with the local governmental agencies to finalize the amended mining license for a large-scale mining license incorporating an open pit and underground mine operating plan as outlined in the 2021 PEA.
On September 26, 2022, Aris Gold Corporation completed a business combination with GCM Mining, and the combined entity was renamed Aris Mining. Aris Mining indirectly holds 100% of the Property through its wholly owned subsidiary, ETK. Following the business combination, Aris Mining started a re-evaluation and optimization process for the Project, and reduced the previously planned expenditures until such time as the development plan is fully defined. As part of this review process, Aris Mining undertook a new detailed structural analysis and updated geological model and prepared an updated mineral resource estimate effective February 10, 2023.
In 2024, Aris Mining advanced optimization studies focussed on power and site access options, and in 2025 commenced this PEA.
| 6.5 | Historical mineral resource and mineral reserve estimates |
The first mineral resource estimate for the Project was completed by ETK effective October 26, 2008. Mineral resource estimate updates were prepared by Sandspring effective May 12, 2010 and September 12, 2010. The first PEA was completed by Sandspring effective April 30, 2011. This was followed by an updated mineral resource estimate and PEA by Sandspring effective January 30, 2012. An updated mineral resource estimate was completed by Sandspring effective March 31, 2013, and a PFS to support the first mineral reserve estimate was completed by Sandspring effective May 8, 2013. An updated mineral resource estimate was completed by Sandspring effective September 20, 2018, and a PEA was completed by Sandspring effective June 11, 2019. This was followed by an updated mineral resource estimate and a PEA by GCM Mining (renamed to Aris Mining) effective December 1, 2021. The most recent historical mineral resource estimate was by Aris Mining and effective February 10, 2023.
None of these historical estimates and studies are considered to be current and should not be relied upon.
| 6.6 | Past production |
Historical gold production from the Project has been from shallow alluvial and saprolite mining and placer processing of free gold. Undocumented small-scale sluice and riffle table processing of alluvium and shallow lag gravels continues to the present day. There are no records of the gold production.
ETK undertook intermittent, seasonal test mining between late 2004 to early 2007 from the saprolite open pit using hydraulic sluicing and a gravity circuit with screens, ball mill, centrifugal concentrators, and shaker tables. There are no records of the gold production.
| Effective October 21, 2025 | Page |
| NI 43-101 Technical Report Preliminary Economic Assessment for the Toroparu Project, Cuyuni-Mazaruni Region, Guyana |
| 7 | Geological setting and mineralization |
| 7.1 | Regional geology |
The Project is located in the northern half of the Amazonian Craton of the Guiana Shield and is mainly underlain by supracrustal Paleo-Proterozoic aged volcano-sedimentary belts and large granitoid batholiths of the Barama-Mazaruni Supergroup. These belts form the northwest trending Puruni volcano-sedimentary belt comprised of basal mafic tholeiitic basalts and minor ultramafic rocks overlain by alternating mafic to intermediate volcanic rocks and sedimentary rocks, generally metapelites and greywackes. The Puruni volcano-sedimentary belt extends between the Aurora batholith to the north of the Project and the Putareng batholith to the southwest. The Putareng batholith corresponds to a calc-alkaline intrusive complex with small, elongate intra-belt plutons. The Toroparu and Sona Hill deposits are developed along the contact of one of these small intrusive bodies. Other gold deposits in Guyana related to similar intrusive bodies include Aurora, located approximately 50 km to the northeast of Toroparu, Oko and Oko West, located approximately 140 km to the east, and Omai, located approximately 180 km to the southeast. Younger irregularly shaped mafic intrusions are widespread in the area. The northwest trending features follow lithological contact zones and show a sigmoidal flexure zone to the northwest of the Project. The Toroparu deposits occur close to the crossing of the west-northwest trending Puruni lineament and the north-northwest trending Wynamu lineament, as shown in Figure 7-1 (source: Aris Mining, 2025).
| 7.2 | Local geology |
The Toroparu and Sona Hill deposits are hosted in a sequence of meta-sedimentary and meta-volcanic rocks in a greenstone belt between Proterozoic granitoid batholiths. A plan of the local geology is shown in Figure 7-2 (source: Aris Mining, 2025).
Regional aeromagnetic-radiometric lineament data indicates the presence of major folds that are likely to also occur at a smaller, deposit scale. The upright fold axial planes appear to strike northwest and plunge both northwest and southeast, as shown in Figure 7-3 (source: Pratt and Smeraglia, 2022). Local aeromagnetic data show similar curved magnetic lineaments and probable folds with an interpreted northwest to west-northwest strike and plunging both northwest and southeast. It is possible that Toroparu is located along a northwest striking and southeast plunging fold. Sona Hill is located along north trending and west dipping lithologies and structures. Evidence of folding is widespread in the geophysical data, drillhole data, and rare surface exposures.
Mineralization at the Toroparu deposit has been intersected in drillholes for up to 2.5 km along strike, up to 250 m across strike, and up to 600 m in depth, and at Sona Hill for up to 900 m along strike, up to 250 m across strike, and up to 300 m in depth. Recent structural interpretation work indicates that the main body of mineralization at Toroparu is likely part of a major regional fold structure striking west-northwest to northwest, with a distinct sigmoidal shape and higher gold grades within the bend (Pratt and Smeraglia, 2022). Folding and ductile deformation resulted in a west-northwest to northwest striking schistosity and parallel mineralized veins, dykes, and shear zones.
| Effective October 21, 2025 | Page |
| NI 43-101 Technical Report Preliminary Economic Assessment for the Toroparu Project, Cuyuni-Mazaruni Region, Guyana |
| Figure 7-1 | Regional geology map |

| Figure 7-2 | Local geology map |

| Effective October 21, 2025 | Page |
| NI 43-101 Technical Report Preliminary Economic Assessment for the Toroparu Project, Cuyuni-Mazaruni Region, Guyana |
| Figure 7-3 | Aeromagnetic data interpretation plan |

| 7.3 | Property geology |
Thin, discontinuous mineralized shear zones at the Toroparu deposit are developed mainly in volcanic rocks. Higher grade, discontinuous shear zone hosted mineralization is narrow and mostly parallel to the schistosity. The main controls on mineralization are the west-northwest striking axial planar schistosity and vein swarms that are well developed in the volcanic rocks, and the folded contact between an intrusive complex and volcanic rocks, particularly the contact of an igneous breccia that forms an important rheological contrast, similar to many other orogenic gold deposits that are strongly controlled by competency contrasts. The Toroparu deposit dips roughly 55° to the west. The Sona Hill deposit has similar controls on mineralization but strikes to the north and dips around 30° to the west.
Two dyke phases are present including hornblende porphyritic andesite dykes and dolerite dykes. Most dykes have an apparent thickness of less than 0.5 m, but some dykes up to 2.5 m thick also occur. The hornblende porphyritic andesite dykes are weakly to intensely deformed with schistosity roughly parallel to that of the host rock. In places, these dykes are folded. Despite being sheared and folded, the dykes are mostly non-mineralized, although some mineralized veins occur along the contacts. Some of these dykes are cut by mineralized shear zones. The dolerite dykes are fine grained, non-sheared, and non-mineralized. They crosscut gold mineralized veins, silicified zones, and shear zones and postdate both the deformation and the gold mineralizing events. The dykes are less abundant and more discontinuous at Sona Hill compared to Toroparu.
A thick, gradational, 10 to 35 m thick layer of saprolite with preserved mineralized quartz veins and veinlets, showing evidence of some gold leaching, is present at the surface at Toroparu and reaches up to 60 m thick at Sona Hill. A weathering profile comprised of overburden, saprolite, and a transition zone has been interpreted for the mineral resource estimate. The overburden has abundant low grade gold mineralization but little high grade.
A plan of the property geology is shown in Figure 7-4 (source: Aris Mining, 2025).
| Effective October 21, 2025 | Page |
| NI 43-101 Technical Report Preliminary Economic Assessment for the Toroparu Project, Cuyuni-Mazaruni Region, Guyana |
| Figure 7-4 | Property geology map |

| 7.4 | Mineralization and alteration |
Mineralization at the Toroparu deposit estimated as mineral resources in the main zone has a volume of around 1.3 km along strike, around 500 m across strike, and a depth of 550 m. There is a zone of mineral resources approximately 1.1 km to the southeast of the main zone with a volume of around 400 m along strike, 230 m across strike, and a depth of 250 m. There are a few other small zones of mineral resources on the order of 100 m long along strike of and parallel to the main zone. The mineralized shear zones are narrow and discontinuous. Sona Hill has a volume of around 950 m along strike, up to 300 m across strike, and a depth of around 200 m. Sona Hill is characterized by a lower copper content compared to Toroparu. Both deposits are open at depth.
The main body of mineralization at Toroparu is characterized by three different vein assemblages including:
| · | Gold mineralized quartz and chalcopyrite or bornite veinlets occur both in the volcanic and intrusive rocks and appear to be focused on the boundary between them, particularly within a marginal igneous breccia. Chalcopyrite and quartz are commonly coarse and intergrown. The veinlets are more abundant and thinner in the volcanic rocks, are parallel to the schistosity, and tend to have lower gold grades. The veins are less continuous in the intrusive rocks and igneous breccia but tend to be of higher gold grade and contain molybdenite. Within the intrusive rocks, the veins show an intense chlorite alteration halo. Vein swarms in the volcanic rocks occur in zones up to tens of metres thick with low to medium gold grades, with scattered high grades coinciding with high chalcopyrite content. In places, the veins are folded and boudinaged, with chalcopyrite often concentrated in the boudin necks. Veins range between less than 1 mm up to a few centimetres thick. There are rare 0.4 to 0.5 m thick veins. |
| · | Gold mineralized chalcopyrite only veinlets occur in the volcanic and intrusive rocks. These veinlets are up to a few millimetres thick and are strongly transposed and dismembered parallel to schistosity and are also folded. In places, chalcopyrite veinlets form a scattered network in quartz veins. |
| · | Gold mineralized quartz and molybdenite veins are also present, mostly in the igneous breccia along the intrusive-volcanic contact. These veins are scattered and contain high gold grades. |
Local gold mineralized silica alteration occurs as discrete patches or as zones up to tens of metres thick that affect volcanics, intrusives, and igneous breccias. In places the silica is associated with epidote. Silica alteration is characterized by disseminated chalcopyrite and is crosscut by quartz chalcopyrite veins and chalcopyrite veinlets. In contrast with the
| Effective October 21, 2025 | Page |
| NI 43-101 Technical Report Preliminary Economic Assessment for the Toroparu Project, Cuyuni-Mazaruni Region, Guyana |
schistose rocks, the veinlets have an apparent random orientation. Silica alteration halos occur around the chalcopyrite veinlets and have higher gold grades.
Plans of the Property gold and copper mineralization interpretations are shown in Figure 7-5 (source: Aris Mining, 2025).
| Figure 7-5 | Plan of Property gold and copper mineralization |


| Effective October 21, 2025 | Page |
| NI 43-101 Technical Report Preliminary Economic Assessment for the Toroparu Project, Cuyuni-Mazaruni Region, Guyana |
| 7.5 | Structure |
The mineralized veins are folded, sheared, transposed, and boudinaged, and are rotated by shearing parallel to the schistosity in both volcanic and intrusive rocks. Mineralized veins, shear zones, schistosity, and the hornblende porphyritic andesite dykes show a consistent west-northwest to northwest strike and moderate to steep southwest dip, consistent with the regional northwest strike of folds interpreted from the aeromagnetic data. This fractal similarity suggests that the main pit mineralization is part of a major regional fold structure. It is likely that these folds are tight, and most limbs and contacts are parallel to schistosity. Fold areas may be areas of high grade and likely have a shallow plunge and present an exploration target. Figure 7-6 (source: Pratt and Smeraglia, 2022) shows a schematic structural model for Toroparu in the main zone area.
| Figure 7-6 | Schematic structural model for Toroparu |

Shear zones with a distinctive intense schistosity and sigmoidal shape ranging in thickness from 0.1 m to up to a few metres are common in the Toroparu main pit area, especially in the volcanic rocks. Gold mineralized quartz and chalcopyrite veins are sheared, transposed to parallel and are folded along the shear zones. Some of the shear zones are flooded by silica alteration. Non-mineralized shear zones are characterized by smectic and carbonate, possibly ankerite. Most of the gold mineralized veins, shear zones, non-mineralized shear zones, schistosity, and bedding show a northwest strike and a steep to moderate southwest dip.
The main tectonic event in the Toroparu area is interpreted to be regional folding of volcanic rocks and a pre-existing intrusion. Folding and shortening rotated the mineralized veins and hornblende porphyritic andesite dykes parallel with schistosity. Mineralized veins may have initially formed as tension gashes in the early stages of deformation. A flattened, deformed porphyry vein system is another possible interpretation. Continued folding and flattening rotated the veinlets, resulting in shearing, transposition, and boudinage along schistosity. When shortening intensity reached a critical point and the folds locked, shear zones developed, possibly under a transpressional stress regime. The timing of the silica alteration event is uncertain but is associated with higher gold grades. Finally, non-deformed and non-mineralized dolerite dykes crosscut the folds. They are considered too thin to significantly dilute the gold resource.
| Effective October 21, 2025 | Page |
| NI 43-101 Technical Report Preliminary Economic Assessment for the Toroparu Project, Cuyuni-Mazaruni Region, Guyana |
| 8 | Deposit types |
The interpretation of the deposit type at Toroparu is uncertain, with possibilities including an unusually copper rich orogenic gold deposit on the basis of the host greenschist metamorphic rocks and a strong control of mineralization due to competency contrasts, as well as a metamorphosed porphyry gold-copper deposit. Recent structural interpretation work suggests that Toroparu is not a classic lode type orogenic gold deposit and is unlikely to be a deformed porphyry deposit (Pratt and Smeraglia, 2022). A disseminated or sheeted vein type deposit can be used as a guide for exploration planning purposes.
| Effective October 21, 2025 | Page |
NI 43-101 Technical Report Preliminary Economic Assessment for the Toroparu Project, Cuyuni-Mazaruni Region, Guyana
| 9 | Exploration |
The first activity at the Project was alluvial placer mining by Mr. Alphonso that commenced in 1997. ETK began exploration in 1999, and following the Mining Joint Venture Agreement with Mr. Alphonso in 2000, commenced rehabilitating and upgrading the 240 km access road into the Property to facilitate the transport of mining equipment and supplies.
Systematic exploration activities at Toroparu commenced in 2011 and include mapping, surface geochemical sampling, near surface auger drilling, geophysical surveys, reverse circulation drilling, and diamond drilling. The surface sampling initiated on a wide grid spacing and was tightened around areas of interest, and was utilized, along with initial reverse circulation drilling, to identify high value targets for diamond drilling. The geochemical sampling work identified geochemical markers for specific lithological units and the geophysical surveys showed that magnetic highs overlap the mineralized zones. The geochemical sampling identified the Toroparu northwest area, Sona Hill, Sona Hill South, Majuba located to the south and southeast of the Toroparu deposit, and the Ameeba Hills anomalies. Work in the Otomung area resulted in weak findings, possibly due to masking of the saprolite by overlying clay layers several metres thick. None of the exploration samples described in this section have been used for the current mineral resource estimate.
| 9.1 | Geological mapping |
Regional and local mapping has been undertaken in phases since 1950, both by the title holders and by external parties, including the GGMC. The GGMC undertook regional mapping supported by geochemical drainage sampling in 2000, which showed gold and copper anomalies in the immediate Toroparu area.
| 9.2 | Surface sampling |
ETK began auger drill sampling in 1999 to the east and west of the Toroparu deposit saprolite pit to evaluate re-processing the tailings from previous mining. Further auger drilling was carried out between 2001 and 2003 in the same area. In 2008 mechanized auger drilling was conducted over a 2 by 3 km area to the northwest of the Toroparu saprolite open pit. Nine northeast trending lines of auger samples were collected, spaced 500 m apart, to test the saprolitic rocks beneath the alluvial cover in an area of historic gold workings. In 2009 approximately 2,500 saprolite samples were collected from hand and power augers from depths of 1 to 15 m. The sample grids were oriented perpendicular to regional structures, extending approximately 4.5 km to the west-northwest of the Toroparu resource area, and identified several gold anomalies along the geological trends. In 2012, Sandspring collected 3,480 regional saprolite samples using a hand auger. Between 2013 and 2018, Sandspring conducted auger sampling to follow up on targets identified by regional structure and geology trends, and past and present alluvial gold prospecting.
Drainage geochemical sampling was conducted by the GGMC between 2003 and 2004 in the PL blocks to the north of the Toroparu saprolite pit and around the pit and reported that gold mineralization could extend at least 6 km to the northwest and 1 km to the southeast of the Toroparu saprolite pit. In 2011 Sandspring conducted a regional saprolite geochemistry sampling campaign in the Upper Puruni area, focussing on areas considered to be prospective for gold, including the surrounding northwest, north, and northeast areas of Toroparu, including the Ameeba, Manx, and Timmermans alluvial prospects. 2,891 samples were collected. Semi-regional and detailed geochemical sampling was performed on areas where alluvial mining activities showed gold potential, for a total of 4,390 samples. Additional work by Sandspring was completed in 2012, which increased the samples to a total of 7,850 covering an area of around 450 square km. In 2013 Sandspring collected 378 saprolite samples from the Makapa area over a grid of 200 by 100 m, which confirmed a north-northeast oriented, 1 km long and 500 m wide gold anomaly covering two small hills. At Sona Hill, Sandspring conducted concurrent geochemical sampling and geophysical surveys during 2015 and 2016 on a 100 by 50 m grid, but there were very few exposed alluvial sediments.
Geochemical samples collected during 2010 and 2011 were taken from the soil layer, and if possible, from the laterite layer, at a depth of approximately 0.3 and 0.5 m, using a hand auger. QAQC samples comprising blanks, standards, and field duplicates were submitted for every 20 routine sample intervals. The samples were dried and prepared at the onsite Acme preparation laboratory and assayed using inductively coupled plasma (ICP) analysis.
Geochemical samples collected during 2015, 2016, 2017, and 2018 were submitted to Bureau Veritas Commodities Laboratory (Bureau Veritas) for assay by aqua regia digestion and ultratrace ICP analysis.
| Effective October 21, 2025 | Page |
NI 43-101 Technical Report Preliminary Economic Assessment for the Toroparu Project, Cuyuni-Mazaruni Region, Guyana
Trench channel samples were completed by ETK in 2005 and 2006 to investigate gold mineralization in the saprolites of the pit area over an area of about 180 by 100 m. In 2009, ETK completed 41 trenches totalling 6,000 m, spaced at regular intervals and oriented perpendicular to the regional structural trend, over a 5 km strike length to the northwest of the Toroparu saprolite open pit.
| 9.3 | Geophysics |
In 2006 and 2007, TerraQuest conducted a 5 by 4.5 km high resolution tri-sensor magnetic and radiometric airborne survey for ETK around the Toroparu saprolite open pit area. This work identified a magnetic low area just to the north of a large magnetic high area of unknown origin. The survey outlined a number of magnetic and radiometric anomalies in the areas adjacent to the Toroparu saprolite open pit.
In 2010, 85-line kilometres of gradient array induced polarization and magnetometer surveys were performed by Insight Geophysics for Sandspring over the Toroparu deposit area and at the Ameeba, Manx, and Timmermans prospects. The surveys were done along 200 m spaced lines over an area of 4.8 by 2.8 km. The induced polarization surveys showed anomalies corresponding to the Toroparu granodiorite pluton. Chargeability was low over areas of high gold-copper mineralization despite the presence of sulfides. In 2011, 17 line kilometres of combined gradient array induced polarization and magnetometer surveys were carried out at Ameeba, Timmermans, Manx, and northwest of the Toroparu deposit, to complete the grids begun in 2010. At Sona Hill, Sandspring conducted an 18-line km induced polarization survey in 2015 to 2016 over the saprolite geochemical sampling grid, which suggested an extension of the west dipping, low angle, strongly altered shear zone to the west, with the potential for additional mineralization in the hangingwall. The chargeability survey did not reveal any significant results due to the low sulfide content of the Sona Hill mineralization. Resistivity did not provide reliable information to differentiate lithology, due to the similar mineralogy of the intrusives and volcanics.
In 2011, Sandspring flew a LIDAR survey over a 250 square km area around the Toroparu deposit to produce a detailed topographic contour map.
| Effective October 21, 2025 | Page |
NI 43-101 Technical Report Preliminary Economic Assessment for the Toroparu Project, Cuyuni-Mazaruni Region, Guyana
| 10 | Drilling |
| 10.1 | Drilling summary |
Drilling has taken place at the Property from 2006 to 2022, mostly for resource definition at the Toroparu and Sona Hill deposits, and for exploration at the Wynamu, Ameeba, Red Dragon, Majuba, and Timmermans prospects. A total of 1,326 drillholes for 265,948 m are present in the Project drilling database. A drill summary table is provided in Table 10-1.
Additionally, 13 geotechnical and 110 condemnation drillholes were drilled between 2021 and 2022.
The drillholes in the Toroparu and Sona Hill deposits have adequate spacing between holes to define mineral resources for the mineralization style. Some of the drillholes at the periphery of the deposits or with a wider drilling grid have not been considered for the mineral resources estimate. Drilling considered for the mineral resource estimate corresponds to 617 diamond drill holes at Toroparu and 152 diamond and 29 reverse circulation holes at Sona Hill. Both deposits are open at depth.
As the drillhole intersections through the mineralized zones are used as an input into the mineral resource estimate, the relevancy of the raw drillhole sample assay results are superseded by the mineral resource estimate and are more meaningfully described in the context of the mineral resource estimate.
| Table 10-1 | Project drill summary table |
| Target | Operator | Years Drilled | Hole Type | Number
of Holes |
Total Metres |
| Toroparu | ETK | 2006 to 2009 | Diamond | 52 | 20,336 |
| Sandspring | 2010 to 2014 | Diamond | 469 | 161,715 | |
| 2012 | Reverse circulation | 81 | 6,330 | ||
| 2014 | Air core | 174 | 6,186 | ||
| Gold X | 2020 to 2021 | Diamond | 114 | 20,751 | |
| GCM Mining | 2021 to 2022 | Diamond | 50 | 5,135 | |
| Sona Hill | Sandspring | 2012 to 2018 | Diamond | 154 | 18,994 |
| 2012 | Reverse circulation | 30 | 2,969 | ||
| Wynamu | Sandspring | 2016 to 2018 | Diamond | 62 | 6,430 |
| 2014 | Air core | 26 | 689 | ||
| Ameeba | Sandspring | 2011 to 2018 | Diamond | 33 | 7,219 |
| 2012 | Reverse circulation | 29 | 2,920 | ||
| Red Dragon | Sandspring | 2012 | Reverse circulation | 37 | 3,503 |
| Majuba | GCM Mining | 2021 to 2022 | Diamond | 12 | 1,676 |
| Timmermans | Sandspring | 2010 | Diamond | 3 | 1,095 |
| Total | 1,326 | 265,948 |
A plan of the drillhole collars is provided in Figure 10-1 (source: Aris Mining, 2025) and a representative cross section of the drillhole spacing with the lithological and weathering model is provided in Figure 10-2 (source: Aris Mining, 2025), with a view to the northwest.
| Effective October 21, 2025 | Page |
NI 43-101 Technical Report Preliminary Economic Assessment for the Toroparu Project, Cuyuni-Mazaruni Region, Guyana
| Figure 10-1 | Plan of Project drill collar locations |
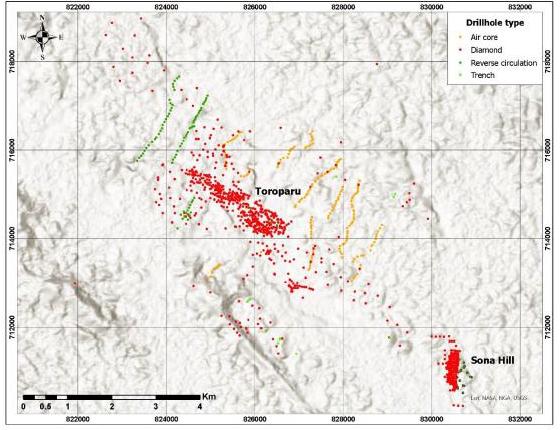
| Figure 10-2 | Typical cross section of drilling at the Project |
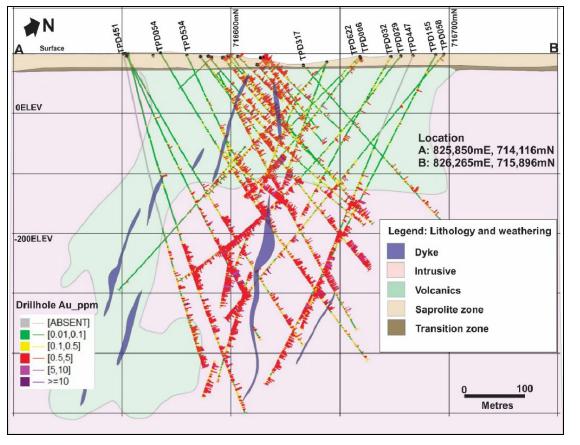
| Effective October 21, 2025 | Page |
NI 43-101 Technical Report Preliminary Economic Assessment for the Toroparu Project, Cuyuni-Mazaruni Region, Guyana
| 10.2 | Drilling procedures |
All drilling at the Project has been undertaken on behalf of the Property owners by Orbit Garant Drilling Services (Orbit) of Canada.
| 10.2.1 | Drillhole collar and downhole surveys |
Drillholes were initially collared in the field using a mobile handheld GPS. Downhole surveying was carried out by Orbit using a digital EZ Track single/multi-shot instrument at 50 m intervals. The first downhole survey measurement was conducted at 15 m down the drillhole and compared with the initial surface compass measurement. On completion of the drillholes, the drillhole collars were marked in the field with steel pipe or steel bar monuments marked with the drillhole identification numbers. Finally, all the drillhole collars were accurately surveyed by differential GPS and validated against the LIDAR topography.
| 10.2.2 | Diamond drilling procedures |
All diamond drilling was undertaken using triple tube initiated at HQ diameter (77 mm) and completed through the first 30 to 40 m of saprolite into hard rock, then reduced to NQ diameter (60 mm) for the remainder of the drillhole.
Core was produced in 3 m core runs and to a lesser extent 1.5 m and placed into core boxes. Blocks were placed at the end of each drill run by the driller to record hole depths. Core was marked and oriented to check against the driller’s depth blocks, ensuring that all core loss was considered. Core recoveries were recorded at the drill site by drill run. The core boxes were then transported by the field technician to the core logging facility.
| 10.2.3 | Geological logging |
The core was cleaned and checked for continuity, and downhole depths were marked. The geologist completed geological logging for all drillholes, including lithology, alteration, structural characteristics and rock quality designation, and recorded in a digital format following standard procedures and geological codes. Data was recorded onto software to manage the geology database with a customized lithology, alteration, and mineralization code library.
All core, where possible, was oriented by field technicians at the drill rig using an ACT III NQ3 orientation tool in unweathered rock, usually from 50 m downhole. The oriented parts of the core were pieced together, an orientation line was drawn on all core pieces, and the structural data was recorded onto Reflex IQ-Logger.
Structural measurements included the orientation of fractures, lithology contacts, foliation, and veins/veinlets, and alpha and beta angles of structural features were recorded from oriented core. In situ quartz vein and other structural orientations were also obtained from 45 drillholes at Sona Hill in 2016.
In 2012 nine drillholes were surveyed by Terratec-Geoservices, measuring optical image, ultrasonic image, natural gamma ray emissions, electrical resistivity, induced polarization, azimuth and dip, and total magnetic field, and provided an interpretation of the images identifying the fractures-foliation contacts and veins.
In 2014 Sandspring carried out a relogging campaign to maintain the consistency of the logging of the different drilling campaigns, which has been maintained to date.
All cores were photographed both wet and dry prior to sampling.
| 10.2.4 | Core recovery |
Average core recoveries of 93% were achieved. Minor instances of low recovery were recorded, typically within the first 10 m of drilling related to the saprolite zone.
| 10.2.5 | Reverse circulation drilling procedures |
There are no details available regarding the reverse circulation drilling procedure, although they are likely to have been completed using industry standard methods. These holes are mostly located in non-mineralized or very low grade zones and have minimal impact on the mineral resource estimates.
| Effective October 21, 2025 | Page |
NI 43-101 Technical Report Preliminary Economic Assessment for the Toroparu Project, Cuyuni-Mazaruni Region, Guyana
| 10.3 | Recommendations |
Condemnation drilling is recommended in the area of planned Project infrastructure to ensure that no potentially economic mineralization underlies the proposed infrastructure. A first pass 400 by 400 m grid is recommended in the areas of the tailings facility, camp area, airstrip, processing plant, and waste dumps. The program will comprise approximately 100 drillholes for 6,000 m, for an estimated cost of $1.5 million.
| 10.4 | Material impact on the accuracy and reliability of drilling results |
There are no known drilling, sampling, or recovery factors that could materially impact the accuracy and reliability of the results, and the data is considered suitable for the estimation of mineral resources.
| Effective October 21, 2025 | Page |
NI 43-101 Technical Report Preliminary Economic Assessment for the Toroparu Project, Cuyuni-Mazaruni Region, Guyana
| 11 | Sample preparation, analysis, and security |
| 11.1 | Introduction |
The sample preparation methods, quality control, security, and chain of custody measures were maintained over the drilling periods with some slight changes as a result of continuous improvement. Sample preparation, assaying and analytical procedures were carried out by MS Analytical (MSA), Acme Analytical Laboratories (Chile) S.A. (Acme, now Bureau Veritas), and Actlabs Guyana Inc. (ACT). Approximately 71% of the samples used in the mineral resource estimate were analyzed by Acme, 16% by MSA, and 8% by Acme. Acme was the main laboratory for Sona Hill.
| 11.2 | Core sampling and security |
The sample intervals were marked by the geologist and the core was cut in half with a diamond bladed saw. Saprolite samples were split with a trowel. Both the diamond bladed saw and trowel were cleaned before each sample. The majority of sample lengths are 1.5 m, with a minimum length of 0.5 m respecting lithological contacts. There are unmineralized narrow dykes less than 0.5 m, and in this case the sample was proportionally completed with wall rock up to 0.50 m.
The sampled half of the core was placed in a labelled bag with a tag number, and the remaining half of the core was retained as reference core kept in the core boxes and photographed.
All on-site sampling was conducted by company employees who managed the security and chain of custody throughout the receipt of the core at the drill rig, the logging, sampling, and delivery to the laboratory.
| 11.3 | Laboratory sample preparation procedures and analytical methods |
Between June 1, 2011, to 2014, sample preparation was completed at the on-site facility managed and operated directly by Acme. The prepared samples were then flown to Acme Laboratories in Georgetown and from there shipped to either Acme of Santiago, Chile, or Vancouver, Canada, for analysis.
Before Acme was acquired by Bureau Veritas, it was accredited under the ISO 9001:2000. Most of the sample were prepared on-site by Acme and analyzed at their facility in Chile. Acme is ISO 9001:2008 and ISO/IEC 17025:2005 certified, and sample preparation and analyses were done at their facility in Canada.
The samples sent to the MSA Laboratory were prepared and analyzed at their Georgetown facility. MSA has ISO 45001:2018 and ISO 9001 certifications, and ISO 17025 accreditation.
There are no records of accreditation for ACT. All the samples analyzed by ACT were prepared and analyzed at their Georgetown facility.
Acme, MSA and ACT operate as independent commercial certified laboratories both locally and internationally and have no relationship with the past or present Project operators.
Sample preparation at Acme involved initial weighing and drying each sample. The entire sample was then crushed to 80% passing -10 mesh and a 250 gram split was taken and pulverized to 85% passing -200 mesh.
At MSA, the entire sample was dried and crushed to 70% passing -10 mesh. A 250 gram sample split was taken for each sample and pulverized to 85% passing -200 mesh.
There are no records of the sample preparation method used at the ACT facility.
All samples were assayed for gold using fire assay on a 50 gram charge with atomic absorption spectrometry (AAS) finish. Any sample with an assay greater than 10 g/t Au was re-analyzed using fire assay with gravimetric finish. Most of the Toroparu samples were assayed for copper while at Sona Hill, copper analysis was performed selectively, given the low copper content at the deposit. Samples were not regularly assayed for silver. For copper and silver, the samples were analyzed by four acid digest with AAS finish on a 0.5 gram charge.
| Effective October 21, 2025 | Page |
NI 43-101 Technical Report Preliminary Economic Assessment for the Toroparu Project, Cuyuni-Mazaruni Region, Guyana
In 2014, a campaign was initiated to assay existing sample pulps, by compositing two existing typically 1.5 m intervals into one 3.0 m interval. These samples were assayed mainly using aqua regia digestion of a 15 gram split, with an ICP finish.
In 2016, 973 pulp samples were assayed by Acme for cyanide soluble copper for metallurgical processing and mine planning. The data was insufficiently representative for the intended purpose and the work was abandoned.
| 11.4 | Quality assurance and quality control procedures |
Sandspring initiated a QAQC protocol in 2010 that included the submission of one coarse duplicate, two certified standards, and a blank sample for each 32 regular samples. Monthly QAQC reports of assay results were subject to a pass/fail process where QAQC data were evaluated against set parameters and were either passed or failed. When the QAQC sample failed the evaluation, a corrective action was taken which sometimes included re-assay of the entire batch. Re-assays were subject to the same evaluation process.
QAQC data submitted with drill samples from Toroparu prior to 2020 included 4,220 submissions from a pool of 14 different certified standards, 2,784 coarse blanks, and 1,252 core duplicates. Ninety-two sample swaps or laboratory failures were identified in the results returned for the certified standards. The blank results indicate possible short-term calibration issues at the laboratory, but no significant grade contamination is evident. No issues were identified with the duplicate sample results.
During the 2020 to 2021 drilling campaigns at Toroparu, QAQC data submissions included 622 samples from a pool of five different certified standards and 854 coarse blanks. No issues were identified with the standard results, and no significant grade contamination is evident.
Drill samples from the Sona Hill deposit submitted during 2012 and 2017 to 2018 included 421 submissions from a pool of six different certified standards, 216 coarse blanks, and 257 core duplicate samples. No issues were identified with the standards, blank samples, and the duplicate samples.
| 11.5 | Bulk density |
Bulk density measurements were completed on 0.1 m lengths of core, at 15 and 25 m depths downhole, and subsequently every 25 m in saprolite. In bedrock the measurement was taken at every 50 m intervals. All measurements were completed onsite by company employees, using the weight in air, weight in water method. In the saprolite zone the core was covered with plastic to seal the pores before measuring the wet weight. The paraffin wax sealing method was not used as the core was mostly in unweathered rock and has little or no porosity.
| 11.6 | Material impact on the accuracy and reliability of sample data |
It is the opinion of the Qualified Person that the sampling, sample preparation and analysis, security, and QAQC protocols are consistent with generally accepted industry best practices and are suitable for the mineral resource estimate. The Qualified Person’s review of the QAQC data has shown that there is no indication of any material bias in the assays, there is no evidence of material sample contamination, and the duplicate samples show the expected variability for the mineralization style.
| Effective October 21, 2025 | Page |
NI 43-101 Technical Report Preliminary Economic Assessment for the Toroparu Project, Cuyuni-Mazaruni Region, Guyana
| 12 | Data verification |
| 12.1 | Geology data reviews |
The qualified person responsible for geology verified the geological data supporting the mineral resource estimate through the personal inspections and through collaboration with the Project team, including:
| · | reviews of the geological and geographic environment of the Project; |
| · | reviews of the nature and extent of exploration work completed by the Project owners; |
| · | reviews of mineralized and non-mineralized core intersections; |
| · | reviews of the sample storage facilities for core, coarse rejects, and pulp rejects; |
| · | reviews of the geology database; |
| · | reviews of the QAQC results; |
| · | reviews of the geological interpretations; and |
| · | reviews of the grade estimation parameters and results. |
In the opinion of the qualified person, the data used for the purpose of estimating the mineral resources are sufficiently reliable.
| 12.2 | Metallurgical and mineral processing data reviews |
The qualified person responsible for metallurgy verified the metallurgical and processing factors supporting the mineral resource estimate and the results of the PEA through collaboration with the Project team. The metallurgical testwork reports supports:
| · | the development of a robust processing plan for the Project mill feed; |
| · | the establishment of associated metallurgical recovery estimates; |
| · | the determination of the gold, silver, and copper production estimates; |
| · | power and water requirements and costs; and |
| · | processing and surface infrastructure requirements and costs. |
It is noted that all testwork was conducted by accredited laboratories, and that in the opinion of the qualified person, the testwork meets best industry practices and the results indicate no evidence of significant bias that could adversely impact the developed process plan. In the opinion of the qualified person, the assumptions used for the purpose of estimating the mineral resources, the processing and production schedule, and the results of the PEA are sufficiently reliable.
| 12.3 | Mining data reviews |
The qualified person verified the mining factors supporting the mineral resource estimate, the optimized and designed pits, and the results of the PEA through the personal inspection and collaboration with the Project team, including reviews of:
| · | the pit optimization and pit design assumptions, including mining recovery and dilution estimates; |
| · | the geotechnical, hydrogeological, and hydrological studies; |
| · | the waste rock and low grade mineralized stockpile requirements, assumptions, and designs; |
| · | the production rates, equipment selection, mining schedule, and mining cost estimates; |
| · | the tailings management facility location; |
| · | the tailings management facility design, construction, operation, and cost assumptions; and |
| · | the assumptions for the economic analysis of the life of mine plan. |
In the opinion of the qualified person, the data used to support the mineral resource estimate and the results of the PEA are adequate and suitable for that purpose.
| Effective October 21, 2025 | Page |
NI 43-101 Technical Report Preliminary Economic Assessment for the Toroparu Project, Cuyuni-Mazaruni Region, Guyana
| 13 | Mineral processing and metallurgical testing |
| 13.1 | Introduction |
Numerous metallurgical testwork programs starting in 2009 have been undertaken to characterize the feed grade mineralization of the Toroparu and Sona Hill deposits, including both oxidized saprolite and sulphide fresh rock, and the material’s response to comminution, gravity concentration, rougher and cleaner flotation, and cyanide leaching. The testwork utilized samples that were representative of the growing mineral resource as it was known at the time of the studies. These studies included processing method trade off studies as well as refinements of the selected operating parameters, as the properties and response of the samples under the testwork conditions were increasingly better understood.
Beginning in 2012, testwork was undertaken on average and low copper grade composites to support the proposal that two geographically distinct types of gold mineralization distinguishable by sulphide and copper content could be mined, stockpiled, and processed separately to improve processing efficiency and overall recovery. As this geographic distinction is not currently demonstrated by the drillhole assays, the proposed separation of average and low grade copper mineralization has not been considered in the current PEA.
The following is a summary of the relevant testwork programs and results for samples representative of the material included in the economic analysis that have been utilized for the current assumptions in this technical report.
Testwork programs were undertaken by SGS on core samples from Toroparu in 2009, 2011, 2012, and 2013, by Inspectorate in 2012 and 2013, FLSmidth in 2014, and by ALS in 2015. Testwork programs were undertaken on core samples from Sona Hill by Base Metallurgical Laboratories in 2019, 2020, and 2022. These testwork programs supported PEAs completed in 2011, 2012, 2019, and 2021, and a preliminary feasibility study in 2013.
| 13.2 | Samples |
The metallurgical database includes samples from 310 drillholes at Toroparu and 61 drillholes at Sona Hill, representing a range of lithologies, weathering types, and grades. 273 of these samples are located within the pit design at Toroparu and 56 are located within the Sona Hill pit design. The spatial representativity of the samples is good, as shown in the plans and long sections in Figure 13-1.
| Figure 13-1 | Location of metallurgical samples within Project pit designs |
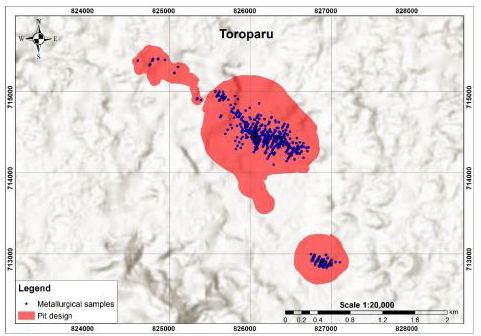
| Effective October 21, 2025 | Page |
NI 43-101 Technical Report Preliminary Economic Assessment for the Toroparu Project, Cuyuni-Mazaruni Region, Guyana
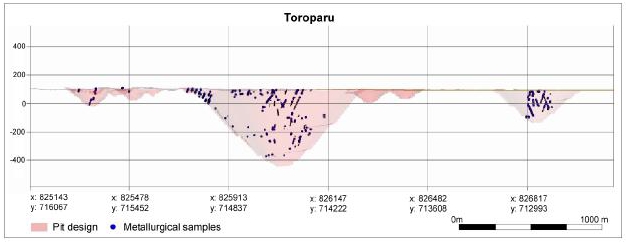

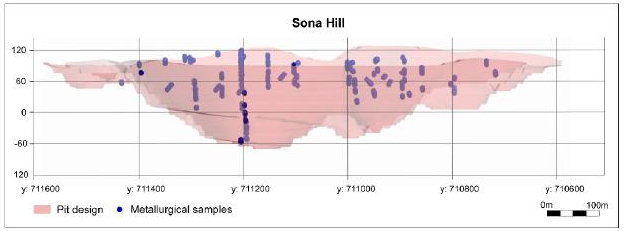
| 13.3 | Mineralogy, gold deportment, and liberation studies |
A mineralogical assessment of the master composite used in the SGS 2011 testwork showed that the sample was dominated by silicates and with chalcopyrite the predominant sulphide mineral.
Gold deportment studies at a P80 of 150 microns showed that the majority of the gold (85.6%) was present as native gold, indicating that gravity recovery should be considered in the process flowsheet. Other gold minerals included electrum, maldonite, petzite, and hessite.
| Effective October 21, 2025 | Page |
NI 43-101 Technical Report Preliminary Economic Assessment for the Toroparu Project, Cuyuni-Mazaruni Region, Guyana
Liberation studies showed that the liberation of copper minerals improves substantially at grinds finer than 150 microns. In contrast pyrite is widely distributed with significant liberation in the range of 80 to over 90% at all size fractions. Copper minerals and pyrite have negligible mutual association, so producing a marketable concentrate was expected to be possible.
| 13.4 | Comminution |
| 13.4.1 | Toroparu |
Semi autogenous grinding (SAG) mill comminution test results from SGS in 2011 on samples from the Toroparu main pit showed an average JK drop weight test A x b value of 23.3 and drop weight index (Dwi) value of 11.8, indicating that the feed material is in the hard category relative to values in the JK Tech Dwi database. The Bond ball mill work index (Bwi) was 18.2 kWh/t and the Bond rod mill work index (Rwi) was 19.3 kWh/t, which confirmed the hardness. The Bond abrasion index (Ai) was reported as 0.294 g, within the abrasive range.
Testwork by Base Metallurgical Laboratories in 2022 tested a series of variability samples from the northwest and southeast pits. The Bwi test results from the southeast zone averaged 15.8 kWh/t, indicating a moderate to hard feed material, and the northwest samples averaged 18.3 kWh/t, indicating a hard feed material. Similarly, A x b averaged 28.5, which is considered competent. Abrasion testing averaged 0.23 g.
| 13.4.2 | Sona Hill |
Testwork by Base Metallurgical Laboratories in 2019 on saprolite samples from Sona Hill returned a Bwi of 8.6 kWh/t and an Ai of 0.011, indicating the feed material to be very soft and not abrasive. Samples of granodiorite returned a Bwi of 12.3 kWh/t, an Rmi of 14.1 kWh/t, and an Ai of 0.186, which classified the sample as moderately hard and mildly abrasive.
| 13.5 | Flotation, cyanidation, and gravity recovery |
| 13.5.1 | Toroparu |
SGS’s testwork in 2009 on the Toroparu samples resulted in an overall gold recovery in the flotation rougher concentrate and cyanidation of the flotation tailings of approximately 98%. Cyanidation of the saprolite gravity tailings showed that more than 95% of the gold was extracted using conventional cyanidation conditions with low cyanide consumption. Further testing by SGS in 2011 indicated that gravity recovery of gold in the range of 30 to 50% could be possible at a primary grind size of 150 microns.
Flotation testwork was undertaken to test different flowsheets and grind sizes. This work showed that with standard flotation chemicals, rougher recovery was sensitive to grind size. The flotation of gravity tails showed that 120 to 150 microns would be a suitable primary grind size for the rougher flotation stage and that gold and copper were effectively recovered at mass recoveries in the range of 5 to 11%. In an alternative flowsheet, flotation of the residual copper minerals led to copper rougher concentrate recoveries ranging from 60 to 80%. A gravity tail flotation flowsheet with three open circuit rougher-cleaner tests found that 150 microns was the optimal grind size for recovery while maintaining a good mass pull for the cleaner circuits. The best recoveries of 83.3% copper, 76.1% gold, and 52.8% silver were obtained in the 150 micron grind size.
Cyanidation testwork conducted by SGS in 2011 was undertaken on the whole ore at a P80 target of 150 and 75 microns, as well as on rougher concentrate with 90% gold extractions on whole ore and 97% on the rougher concentrate. Regrinding led to increased leaching of copper in the rougher concentrate cyanidation. Cyanidation testwork was also completed on gravity tailings, rougher tailings, rougher concentrate, and Mozley gravity concentrate. This work concluded that direct cyanidation of the gravity tailing considerably improved gold recovery by 8.5% while copper recovery was improved through rougher flotation. Cyanide leaching was performed on gravity tailings at a range of grind sizes, as well as cyanidation of cleaner concentrate and tailings. The cyanidation of the cleaner tailing was excellent with a gold extraction of 88.2% while cyanidation of the cleaner concentrate was poor with a gold extraction of 59.0%. A cyanidation test on the cleaner scavenger tailings resulted in a final gold extraction of about 81%.
Later testwork by SGS in 2012 to 2013 was undertaken on average and low copper grade composites. The testwork of the average grade copper composites included gravity separation, flotation, and cyanidation of the flotation and gravity separation products, and the low grade copper composite testwork included gravity separation, rougher flotation, and
| Effective October 21, 2025 | Page |
NI 43-101 Technical Report Preliminary Economic Assessment for the Toroparu Project, Cuyuni-Mazaruni Region, Guyana
cyanidation of the gravity separation concentrate. The objective of this program was to compare the performance of direct cyanide leaching of the gravity tailing and cyanide leaching of a flotation product.
Gravity separation tests on the average copper grade material showed that gold recovery increased with reduction in P80 and was consistent over 150 microns, consistent with the 2011 test results, which indicate gravity gold recoveries in the range of 30 to 50%. Bulk rougher flotation was performed on the gravity tailings products for evaluation of grind size, and a P80 of 150 microns was selected for subsequent flotation testwork. Open circuit cleaning flotation tests showed that regrind had little to no effect on the performance of the cleaner flotation, and that the dosage of non-sulphide gangue depressant was critical. The response of the gravity concentrate, gravity tailings, and cleaner scavenger tailings streams to cyanide leaching was examined in a series of tests. Intensive cyanidation of the gravity concentrate resulted in gold extraction of 99% and 97% for silver. The results showed that the feed size had no effect on leaching recovery. Bulk cyanidation of the gravity tailings showed an increase in gold extraction with decreasing feed size while copper extractions were low and not influenced by feed size. Cyanide leaching of the gravity separation tailing offered higher gold and silver recovery than rougher flotation and also cleaner flotation combined with leaching of the cleaner tailing, however the cyanide consumption was much lower and copper extraction was much higher from the cleaner flotation processing route compared to the gravity tailing leaching route.
Gravity concentrate gold recovery for the low copper grade material ranged from 28.9% at a P80 grind size of 225 microns to 58.9% for a P80 grind size of 75 microns. Scoping rougher flotation tests were performed on gravity tailings produced at three different grind sizes, which showed that the recovery of copper and gold increased as a function of finer grind size, while the recovery of silver did not display the trend. The overall combined gravity and flotation gold recovery of all samples was 91.9%. Rougher concentrate obtained from the flotation tests were submitted for carbon in pulp cyanidation tests, which showed that gold extraction from combined gravity separation, rougher flotation, and rougher concentrate leaching ranged from 89 to 95%, silver extraction ranged from 60 to 82%, and copper did not exceed 14%.
The results showed that gravity separation and leaching of the gravity separation tailing for all grind sizes offered higher overall gold recovery. However, the cyanide consumption and capital cost of the direct leaching are essential factors in choosing the optimized method for gold recovery, as elevated dissolved copper levels in the loaded solution require additional treatment downstream. The results showed that cyanide consumption and copper extraction for the case of cyanide leaching of the cleaner tailing for the average copper grade composite was considerably lower than the direct cyanide leaching of the gravity separation tailing case. Conversely, in the case of the low copper grade composites, the cyanide consumption and copper extraction of the rougher concentrate was higher than the direct gravity tailing case.
Testwork by Inspectorate in 2012 and 2013 focussed on gold recovery from saprolites. The saprolite samples were subjected to gravity concentration using a 3 inch Knelson concentrator followed by Mozley table. Gold recoveries were 50% for the fine samples and 27% for the coarse samples. Intensive cyanide leaching of the gravity concentrates resulted in recoveries of 97% from both samples. Flotation tests on the fine saprolite sample were performed to investigate different P80 and reagent schemes on the recovery of gold, with the resulting recoveries ranging between 70 to 86.7%. Cyanide and carbon in leach tests showed that varying sodium cyanide dosages had no effect on gold recovery, and the carbon in leach tests achieved slightly higher recoveries than cyanide leach.
Flotation tests were conducted by FLSmidth in 2014 on average copper grade samples at a target grind size of 150 microns to evaluate the use of copper selective collectors to produce a high copper grade rougher concentrate followed by a bulk rougher scavenger float to maximize recovery. Extended rougher scavenger flotation reached overall flotation recovery of approximately 97% copper, 86% gold, 78% silver, and 98% total sulphur. Leach tests were also conducted to evaluate the impact of grind size on overall gold recovery, which showed that gravity gold appeared to peak at around 120 microns in the low copper grade composites, while both leach and overall recovery steadily improved with finer grind. Diagnostic leach tests were used to determine the association of the unrecovered gold from these tests, which showed that more of the unrecovered gold was found to be cyanide extractable at grind sizes finer than P80 of 159 microns. Testwork was also conducted on saprolite samples which showed that overall, approximately 99% of the gold was recovered from each of the bulk composites with between 29 and 52% of the gold recovered in the gravity circuit and the remainder recovered through the cyanide leach. Overall gold recovery from the sub composites ranged from approximately 93 to 99% with gravity recovery ranging from 5 to 38% and cyanide extractions accounting for a further 61 to 88%.
A series of batch rougher and cleaner tests and regrind tests were conducted by ALS in 2014 to develop a flowsheet and reagent scheme for copper recovery. A gravity stage on the flotation flowsheet was not found to increase the overall gold
| Effective October 21, 2025 | Page |
NI 43-101 Technical Report Preliminary Economic Assessment for the Toroparu Project, Cuyuni-Mazaruni Region, Guyana
or silver recovery; however, it was considered that the revenue from gold from a gravity concentrate would probably be greater than the losses attributed to the gold sales from a mixed concentrate. The optimal test results in terms of copper performance utilized potassium amyl xanthate (PAX) and a split regrind configuration.
Testwork by Base Metallurgical Laboratories in 2022 on variability samples from the northwest zone was conducted via a gravity leach flowsheet, with half of the 18 samples returning recoveries lower than 85%. Samples from the southeast zone under the same flowsheet were much better with an average recovery of 92.1%. Gravity rougher tests on the northwest samples showed an 82% gold recovery and an 83% copper recovery. Poor copper recoveries were linked to low sulphur levels. The southeast zone had an average gold recovery of 85.5% and an average copper recovery of 84.4%. The poor performing samples also had a low sulphur content. Gravity leach and gravity rougher underwent three stage diagnostic leach tests which showed the majority of gold as cyanide leachable, and copper consistently locked in acid digestible minerals with minor cyanide leachable components.
| 13.5.2 | Sona Hill |
Testwork by Base Metallurgical Laboratories in 2019 followed flowsheets including a primary grinding stage followed by Knelson gravity concentration and cyanide leaching of the gravity tailings. The flowsheets evaluated implemented a rougher flotation stage prior to leaching the gravity tailings, as well as cyanide leaching of the rougher concentrate with and without a regrind stage. The testwork further investigated the effect of cyanide leaching with gravity concentrate, with and without a regrind stage. The test results with a gravity leach flowsheet showed high extractions of 94 to 98% from the saprolite sample, 81 to 85% for the granodiorite sample, and between 74 and 85% for the high quartz granodiorite. Finer primary grinding of the samples resulted in a minor improvement in leach kinetics and gold extraction. At a primary grind size of P80 53 microns, testwork showed a significant increase to gold extraction and leach kinetics of the gravity tailings at a pH of 12.5. Implementing a rougher flotation stage after the gravity concentration and regrinding the rougher concentrate prior to leaching resulted in a significant increase in overall gold recovery of up to 96% for the granodiorite sample and up to 97% for the high quartz granodiorite.
Leach residues were subjected to a multi-stage diagnostic leach test to determine the gold deportment in the leach residues, and the results indicated that the majority of the gold may be associated with arsenical minerals or minerals that are attacked by nitric acid. However, it was considered most likely that the association with tellurides was responsible for the bulk of the residual gold.
Trace mineral search in rougher concentrates showed that gold occurred mainly as minerals containing tellurium and locked binaries with pyrite and sulphide gangue, so further regrinding would be necessary to expose the gold surface for cyanide leaching, and extended times may be required as tellurium minerals are slower in leaching. Further testing explored the effect of fine grind and high pH leaching on tellurium samples, which showed some grind sensitivity to leach extraction at a pH of 10. However, the benefit was observed to be limited and potentially not economic to chase finer and finer grinds. Coarser grind sizes in the range of 106 to 125 microns at an elevated pH of 12.5 typically presented higher extractions than those achieved at finer grinds and low pH.
Testwork by Base Metallurgical Laboratories in 2020 blending Sona Hill and Toroparu samples showed high extractions under the elevated pH conditions with mid to high 80% and low 90% extractions. The work suggested that there is some synergistic benefit in blending the material types with the potential that the lower pH saprolite is partially neutralized by the other samples. Leaching was observed to be substantially complete at 48 hours and several percent points of additional leach extraction were achieved over the 24 to 48 hour period.
| 13.6 | Detoxification |
Continuous SO2/air cyanide detoxification tests were undertaken in 2014 by ALS on a master cyanidation tailings composite. The weak acid dissociable (WAD) cyanide target for the treated effluent was less than 5 mg per litre. The key findings of the testwork were that the material is amenable to the SO2/air process and that the target was achieved.
| 13.7 | Metallurgical recovery |
The combined metallurgical recoveries for sulphide material are estimated at 93% for gold, 78% for silver, and 88% for copper. For oxide material the combined metallurgical recoveries are estimated at 97% for gold and 46% for silver. Overall, recoveries are estimated at 93.6% for gold, 77.0% for silver, and 86.1% for copper.
| Effective October 21, 2025 | Page |
NI 43-101 Technical Report Preliminary Economic Assessment for the Toroparu Project, Cuyuni-Mazaruni Region, Guyana
| 13.8 | Deleterious elements |
Copper concentrate analyses were undertaken by ALS in 2014 to identify deleterious elements that may invoke penalty upon sale, identifying bismuth (380 to 631 g/t), selenium (500 to 770 g/t), and tellurium (292 to 396 g/t). Arsenic content was close to typical penalty thresholds. Further metallurgical testwork is required to better define potential concentrate quality, and therefore no penalties have been included in the current economic analysis.
| 13.9 | Conclusions |
The metallurgical testwork to date has been conducted on a wide range of samples representative of the material expected to be processed in the life of mine plan. The studies have been conducted to a sufficient quality and extent to support the process flow sheet, cost estimates, and economic analyses presented in this PEA.
There are no known processing factors or deleterious elements that could have a significant effect on the economic extraction of the mill feed that have not been considered and accounted for in the processing plan and economic model.
No fatal or significant flaws were detected during the review of the testwork and the current proposed flowsheet. The level of testwork conducted to date that supports the development of a process design criteria document that has resulted in a flowsheet that recovers the required amount of gold, silver, and copper at saleable grades and meets the typical expectation for a PEA level of study.
The Project metallurgical testwork has confirmed that flotation and free milling cyanidation process routes are capable of achieving higher recoveries of both gold and copper as well as payable silver values.
Processing saprolitic material will add viscosity considerations, and the softness will reduce the power demand in the milling circuit. High saprolite blends may allow elevated processing rates of hard material.
Soluble cyanide copper will need to be managed for the Toroparu mill feed. The impact of copper on the carbon circuit should be evaluated at a range of soluble copper concentrations.
Mineral analysis on the copper concentrates produced from the Toroparu deposit identified deleterious elements that may have some penalty on concentrates, including bismuth, selenium, tellurium, and arsenic.
Auriferous tellurides from Sona Hill material are slower leaching and require a finer grind and elevated pH to achieve high extractions. Blending Sona Hill material with Toroparu material will increase the operating cost of the Toroparu material, which will be managed in the processing schedule. Telluride leach kinetics should be tested in future studies. The high pH regimes required to process the Sona Hill material will influence the carbon circuit performance, which should be considered in the design of the elution technology and the process selection. It is also a consideration for the cyanide detoxification process and the design and capacity of reagent systems, notably the pH modifier.
The key assumptions utilized for the development of the current proposed flow sheet are shown in Table 13-1.
| Table 13-1 | Proposed processing parameters |
| Parameter | Unit | Sulphide rock | Oxide rock |
| Dwi | kWh/m3 | 11.8 | - |
| A x b | n/a | 23.3 | - |
| Cwi | kWh/t | 23.3 | - |
| BRWi | kWh/t | 19.3 | - |
| BBWi | kWh/t | 18.03 | 9.30 |
| Ai | g | 0.29 | |
| Gold recovery in gravity concentration circuit | % | 38 | 35 |
| Silver recovery in gravity concentration circuit | % | 16 | 9 |
| Copper recovery in gravity concentration circuit | % | 0.004 | - |
| Gold recovery in carbon in leach circuit | % | 68 | 95 |
| Effective October 21, 2025 | Page |
NI 43-101 Technical Report Preliminary Economic Assessment for the Toroparu Project, Cuyuni-Mazaruni Region, Guyana
| Parameter | Unit | Sulphide rock | Oxide rock |
| Silver recovery in carbon in leach circuit | % | 40 | 40 |
| Copper recovery in carbon in leach circuit | % | - | - |
| Gold recovery in flotation circuit | % | 66.8 | - |
| Silver recovery in flotation circuit | % | 56.8 | - |
| Copper recovery in flotation circuit | % | 88.4 | - |
| Cyanide consumption | kg/t | 1.12 | 1.07 |
| 13.10 | Recommendations |
The current PEA is based on testwork conducted over the past decade using similar, but not identical, samples and objectives. To progress the Project to a Preliminary Feasibility Study level, a comprehensive metallurgical testwork program is recommended to confirm the chosen process criteria for both oxide and sulphide mill feed. The focus of this work should be on the Toroparu deposit, with all testwork performed on representative samples from within the mining schedule to ensure a reliable PFS level design can be further developed.
The recommended studies and testwork include:
| · | Mineralogical and liberation studies |
| o | detailed mineralogical and liberation studies on head samples to characterize mineral associations, grain size distribution, and liberation characteristics; and |
| o | comprehensive chemical analysis of the head samples to determine the complete elemental composition, including potential deleterious elements and key assay values. |
| · | Comminution studies |
| o | comminution and material characterization tests for oxide, sulphide, and composite materials, including bulk and solid densities, uniaxial compressive strength, Bond crushability (Impact) work index, JKTech Drop Weight Test, Bond abrasion index, Bond ball mill work index, and SAG mill test (Starkey); and |
| o | assess whether high saprolite blends in the mill feed could allow for elevated processing rates. |
| · | Gravity and intensive leach testwork |
| o | evaluate the mill feed performance in a Knelson gravity concentration circuit with intensive cyanidation of the gravity concentrate. Assess the effect of hydrogen peroxide doxing for cyanide destruction of the intensive leach residue across oxide, sulphide, and composite materials. |
| · | Flotation testwork |
| o | flotation testwork to evaluate desulphurization of the mill feed, selective copper recovery to concentrate, and gold recovery to tailings; |
| o | confirm and optimize the reagent suit, including hydrated lime pH modifier, primary collector, secondary collector, frother, and gangue depressant; |
| o | the flotation testing should be completed in both open circuit and locked cycle modes for a four stage flotation configuration including rougher, regrind, cleaner, recleaner, and re-recleaner, in line with the proposed process flowsheet; and |
| o | conduct comparative assessments of flotation recovery versus primary grind size and regrind size. |
| · | Leaching testwork |
| o | leaching studies including both bottle roll and tank leach tests to compare carbon in pulp and carbon in leach performance. Leach testwork should include leach gravity tailings on oxide only material, leach flotation tailings on sulphide only material, and leach flotation tailings on composite oxide and sulphide material; and |
| o | key test parameters to monitor reagent consumption, oxygen consumption, adsorption kinetics, and leach performance versus grind size. The feasibility of cold cyanide stripping for copper removal from loaded carbon should be assessed. |
| · | Detoxification testwork |
| o | evaluate the INCO SO2/air cyanide detoxification process focussing on reagent and oxygen consumption, including lime, sodium metabisulphite, copper sulphate pentahydrate, and caustic soda. |
| · | Settling, flocculation, and underflow rheology testwork |
| o | evaluate colloidal stability to determine achievable underflow density, optimum flocculant dosage, and solids loading rates using a bench scale dynamic thickener; and |
| Effective October 21, 2025 | Page |
NI 43-101 Technical Report Preliminary Economic Assessment for the Toroparu Project, Cuyuni-Mazaruni Region, Guyana
| o | static thickening and flocculant screening tests to determine flocculant type, optimum dosage, and feed solids concentration for maximum settling efficiency. |
| · | Water quality assessment |
| o | verify the quality and suitability of the Puruni River water as the primary process water source. Conduct full water analysis to determine its chemical composition, suspended solids content, and compatibility with process reagents and plant equipment. The results will inform process water treatment requirements and potential impacts on metallurgical performance. |
| · | Integration and laboratory requirements |
| o | all testwork should yield comparative insights for oxide only, sulphide only, and composite oxide-sulphide operations. All testwork should be conducted at a single accredited laboratory to ensure consistency and comparability of results. |
The cost to complete this testwork and the PFS is estimated at $1.25 million.
| Effective October 21, 2025 | Page |
NI 43-101 Technical Report Preliminary Economic Assessment for the Toroparu Project, Cuyuni-Mazaruni Region, Guyana
| 14 | Mineral resource estimates |
| 14.1 | Disclosure |
The current mineral resource estimate for the Project was prepared under the supervision of or was reviewed by Pamela De Mark, P. Geo., Senior Vice President of Geology and Exploration of Aris Mining. The mineral resource estimate has been prepared in compliance with the CIM Estimation of Mineral Resources and Mineral Reserves Best Practice Guidelines of 2019 (CIM, 2019) and reported in compliance with the CIM Definition Standards for Mineral Resources and Mineral Reserves of 2014 (CIM, 2014). The mineral resource estimate utilizes a cut-off grade calculation with an effective date of October 21, 2025.
There are no known environmental, permitting, legal, title, taxation, socio-economic, marketing, political, or other relevant factors that could materially affect the mineral resource estimate.
| 14.2 | Available data |
The data available for the mineral resource estimate is shown in Table 10-1. A total of 1,077 drillholes was used for the geological interpretation for the Toroparu deposit and a total of 212 drillholes was used for the Sona Hill deposit. Data validation was conducted including ensuring all drillholes have all of the appropriate logging information, final assay and logging depths match the end of hole depth in the drill collar table, checks for overlapping or gaps in the assay and logging tables, checks for duplicate drillhole names and duplicate coordinates, checks for null data, checks for integer survey values indicating a lack of detailed survey data, and checks for extreme variations in drillhole azimuth or dip between consecutive downhole survey records. A number of errors, including poorly oriented holes, were identified and managed by removing that data from the database used for the mineral resource estimate.
| 14.3 | Geological interpretation |
The drillhole geological logging data and sample assays, supplemented with core photographs, regional aeromagnetic data, and mapping were used to create wireframe interpretations of weathering and lithology. The weathering and lithology codes were grouped based on recommendations from Pratt and Smeraglia (2022). The weathering codes include transported/overburden, oxide/saprolite, transitional, and fresh zones. The lithology codes include dykes, gabbro, intrusives, volcanics, undifferentiated volcanics, and sediments. A plan of the interpretations is shown in Figure 7-4 (source: Aris Mining, 2025).
| 14.4 | Mineralization interpretation |
The Project mineralization exhibits anastomosing, sigmoidal patterns in core and outcrop. These small-scale patterns were used to interpret the larger scale patterns for the mineralization domains used to estimate gold, copper, and silver grades. The mineralized veins have been folded, sheared, transposed and boudinaged at scales ranging from 0.1 m to a few metres. Mineralization interpretations, including zones of internal waste, were created for low and high grade gold domains at Toroparu and Sona Hill, and high grade copper at Toroparu. Silver grades were estimated from within the gold and copper domains. Plans of the gold and copper mineralization are shown in Figure 7-5 (source: Aris Mining, 2025).
| 14.5 | Statistics, compositing, and treatment of extreme grades |
The drillhole data was selected and coded with the lithological and mineralization interpretation wireframes, and then composited to a 1 m length. Top cuts were applied to the 1 m composites and additional restrictions were applied to values close to the 95th percentile of the population by using a high-grade restriction rule when estimating grades into the block model.
The statistics for gold, copper, and silver of the composited and top cut composited data are shown in Table 14-1.
| Table 14-1 | Composited and top cut composited data statistics |
| Toroparu high grade gold | Gold | Copper | Silver |
| Number of composites | 10,458 | 10,388 | 3,451 |
| Effective October 21, 2025 | Page |
NI 43-101 Technical Report Preliminary Economic Assessment for the Toroparu Project, Cuyuni-Mazaruni Region, Guyana
| Mean | 2.45 g/t | 0.17% | 2.9 g/t |
| Coefficient of variation | 2.8 | 1.1 | 1.1 |
| Top cut value | 30 g/t | 2% | 30 g/t |
| Top cut data mean | 2.29 g/t | 0.17% | 2.8 g/t |
| Top cut data coefficient of variation | 1.2 | 1.1 | 1.1 |
| Toroparu low grade gold | Gold | Copper | Silver |
| Number of composites | 69,173 | 68,550 | 19,929 |
| Mean | 0.43 g/t | 0.06% | 0.9 g/t |
| Coefficient of variation | 8.8 | 1.5 | 1.6 |
| Top cut value | 20 g/t | 1% | 18 g/t |
| Top cut data mean | 0.40 g/t | 0.06% | 0.9 g/t |
| Top cut data coefficient of variation | 1.9 | 1.3 | 1.3 |
| Toroparu high grade copper | Gold | Copper | Silver |
| Number of composites | 16,415 | 16,417 | 6,818 |
| Mean | 1.10 g/t | 0.21% | 2.5 g/t |
| Coefficient of variation | 6.3 | 0.8 | 1.1 |
| Top cut value | 10 g/t | None | 15 g/t |
| Top cut data mean | 1.00 g/t | - | 2.5 g/t |
| Top cut data coefficient of variation | 1.3 | - | 0.9 |
| Toroparu low grade copper | Gold | Copper | Silver |
| Number of composites | 79,790 | 79,801 | 19,926 |
| Mean | 0.37 g/t | 0.04% | 0.7 g/t |
| Coefficient of variation | 4.1 | 1.3 | 1.4 |
| Top cut value | 20 g/t | 1.5% | 10 g/t |
| Top cut data mean | 0.36 g/t | 0.04% | 0.67 g/t |
| Top cut data coefficient of variation | 2.6 | 1.1 | 1.1 |
| Sona Hill high grade gold | Gold | Copper | Silver |
| Number of composites | 4,161 | 753 | 753 |
| Mean | 1.13 g/t | 0.01% | 1.1 g/t |
| Coefficient of variation | 2.3 | 0.8 | 1.7 |
| Top cut value | 30 g/t | None | 11.7 g/t |
| Top cut data mean | 1.12 g/t | - | 1.0 g/t |
| Top cut data coefficient of variation | 2.2 | - | 1.5 |
| Sona Hill low grade gold | Gold | Copper | Silver |
| Number of composites | 3,148 | 559 | 559 |
| Mean | 0.17 g/t | 0.01% | 0.4 g/t |
| Coefficient of variation | 2.9 | 1.1 | 1.3 |
| Top cut value | 4.6 g/t | None | 2.7 g/t |
| Top cut data mean | 0.16 g/t | - | 0.4 g/t |
| Top cut data coefficient of variation | 2.6 | - | 1.1 |
| Sona Hill copper | Gold | Copper | Silver |
| Number of composites | 2,003 | 1,873 | 1,873 |
| Mean | 0.30 g/t | 0.01% | 0.5 g/t |
| Coefficient of variation | 3.80 | 1.10 | 2.1 |
| Top cut value | None | None | None |
| Effective October 21, 2025 | Page |
NI 43-101 Technical Report Preliminary Economic Assessment for the Toroparu Project, Cuyuni-Mazaruni Region, Guyana
| 14.6 | Block model |
At the Toroparu deposit, two parent block sizes were utilized, including a size of 10 mE x 10 mN x 5 mRL where the average drillhole spacing is within 25 m and a 20 mE x 20 mN x 5 mRL parent block size for all other areas. A single block size of 12.5 mE x 25 mN x 10 m RL was used for Sona Hill. The geology and mineralization interpretation wireframes were used to code the block model for each of the features.
Bulk density measurements were taken from 7,067 samples from the Toroparu deposit and 723 samples from Sona Hill. The average bulk densities were applied to the block model as shown Table 14-2.
| Table 14-2 | Bulk density values applied to the block model |
| Deposit | Lithology | Bulk density (g/cm3) | ||
| Oxide | Transition | Fresh | ||
| Toroparu | Dykes | 1.82 | 2.36 | 2.76 |
| Gabbro | 1.82 | 2.36 | 2.97 | |
| Intrusive | 1.82 | 2.36 | 2.72 | |
| Volcanics | 1.82 | 2.36 | 2.73 | |
| Undifferentiated Volcanic | 1.82 | 2.36 | 2.73 | |
| Sona Hill | Dykes | 1.74 | 2.75 | 2.81 |
| Gabbro | 1.74 | 2.75 | 2.76 | |
| Intrusive | 1.74 | 2.75 | 2.81 | |
| Volcanics | 1.74 | 2.75 | 2.75 | |
| Undifferentiated Volcanic | 1.74 | 2.75 | 2.75 | |
| 14.7 | Composite search and interpolation parameters |
Variograms were completed on the composited data for each mineralized zone to characterize the spatial continuity of each element and validated with the mineralization interpretations to ensure that the correct orientation of strike, dip and plunge directions of the search ellipsoid created from the variograms were compatible with the mineralization or structural orientations.
Ordinary kriging was used to estimate gold, silver, and copper grades into the block model utilizing dynamic anisotropy to adjust the search orientations with changes in the strike and dip of the mineralization. Three searches were used at Toroparu, with the first search utilizing a minimum of five or eight and a maximum of 30 composites within the first 60% of the range of the element’s variogram. The second search used a minimum of four or eight and a maximum of 15 to 25 composites and extended to the full extent of the variogram. The third search was allowed to fill any other un-estimated blocks. Less than 10% of the blocks were estimated in the third search with a minimum of one and a maximum of 5 composites. At Sona Hill, a minimum of six and a maximum of 20 composites were used for the first and second searches. The third search used a minimum of two and a maximum of 20, and a fourth search used a minimum of two and a maximum of 10 composites. A maximum of five composites per drill hole was applied for all searches.
| 14.8 | Estimation validation |
Standard block model grade estimation validation was completed using visual and numerical methods, including visually comparing estimated grades with input composite grades, the assessment of swath plots, and global statistical comparison of estimated grades with declustered composite grades. An example cross section of the Toroparu gold estimate compared to input composite grades is shown in Figure 14-1 (source: Aris Mining, 2025).
| Effective October 21, 2025 | Page |
NI 43-101 Technical Report Preliminary Economic Assessment for the Toroparu Project, Cuyuni-Mazaruni Region, Guyana
| Figure 14-1 | Example cross section of Toroparu gold estimate |
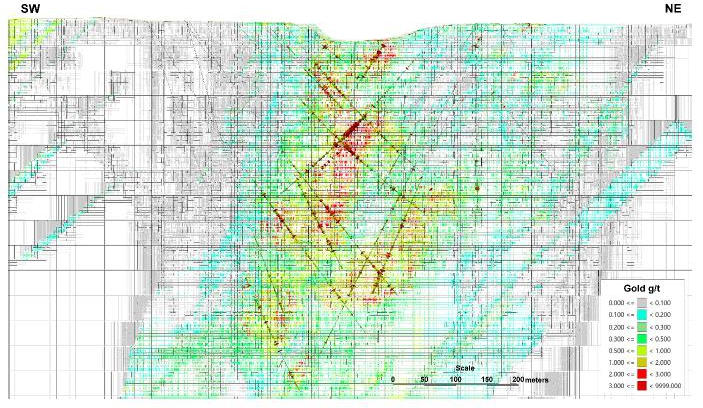
| 14.9 | Mineral resource classification |
The mineral resource has been classified as either measured, indicated, or inferred based on confidence in the geological interpretation, grade continuity, sample spacing, and volume constraint.
Measured classification was applied at Toroparu only where the drill grid spacing was less than 30 m along strike and 40 m down dip, estimated within the first search pass, and with a minimum of 90% of the blocks with a slope of regression greater than 0.4. Indicated was applied at Toroparu where the drill grid spacing was less than 60 m along strike and 80 m down dip, estimated within the second search pass, and with a minimum of 80% of the blocks with a slope of regression greater than 0.2. At Sona Hill, indicated was applied where the drill spacing was less than 40 m along strike and down dip, estimated within the first or second search, and with a kriging efficiency of greater than 50%. Inferred was applied at Toroparu where the drill grid spacing was less than 150 m along strike and down dip, and estimated within the third search pass. At Sona Hill, inferred was applied where the drill grid spacing was less than 100 m along strike and down dip and estimated within the second or third search pass. Strings were digitized on drill sections considering this criteria to construct volumes used to code the mineral resource category to the block model.
| 14.10 | Cut-off grade and mineral resource constraint |
The mineral resource estimate has been tabulated using a cut-off grade of 0.45 g/t Au for open pit resources and 1.5 g/t Au for underground resources, based on the assumptions shown in Table 14-3. The optimized pits used for constraining the mineral resource estimate are shown in Figure 16-1.
| Table 14-3 | Mineral resource cut-off grades |
| Parameter | Open pit value | Underground value |
| Gold price ($/oz) | 1,950 | 1,950 |
| Gold smelting and refining ($/oz) | 9 | 9 |
| Gold royalty (%) | 8 | 8 |
| Gold recovery (%) | 95 | 95 |
| Effective October 21, 2025 | Page |
NI 43-101 Technical Report Preliminary Economic Assessment for the Toroparu Project, Cuyuni-Mazaruni Region, Guyana
| Parameter | Open pit value | Underground value |
| Mining operating cost ($/tonne ore) | 3.2 | 60.0 |
| Processing and surface infrastructure cost ($/tonne ore) | 14.7 | 14.7 |
| Sustaining capital cost ($/tonne ore) | 1.3 | 4.0 |
| G&A cost ($/tonne ore) | 4.6 | 5.0 |
| Rehandling, closure ($/tonne ore) | 0.4 | 0.5 |
| Gold cut-off grade (g/t Au) | 0.45 | 1.5 |
| 14.11 | Mineral resource tabulation |
An optimized pit and optimized stopes were created to constrain the open pit and underground mineral resources using a gold price of $1,950 per ounce and gold cut-off grades of 0.45 g/t for open pit mineral resources and 1.5 g/t for underground mineral resources. The Toroparu mineral resource estimate effective October 21, 2025 is shown in Table 14-4.
| Table 14-4 | Toroparu mineral resources effective October 21, 2025 |
| Area | Classification |
Tonnes Mt |
Grade gold (g/t) |
Grade silver (g/t) |
Grade copper (%) |
Contained gold (koz) |
Contained silver (koz) |
Contained copper (Mlb) |
| Open pit | Measured | 48.4 | 1.31 | 1.8 | 0.14 | 2,030 | 2,747 | 150 |
| Indicated | 74.9 | 1.26 | 1.2 | 0.08 | 3,041 | 3,008 | 127 | |
| Measured + Indicated | 123.3 | 1.28 | 1.5 | 0.10 | 5,071 | 5,755 | 276 | |
| Inferred | 11.4 | 1.13 | 0.7 | 0.04 | 414 | 275 | 9 | |
| Underground | Measured | 0.1 | 1.89 | 0.4 | 0.03 | 8 | 2 | - |
| Indicated | 3.5 | 2.05 | 0.7 | 0.05 | 231 | 74 | 4 | |
| Measured + Indicated | 3.6 | 2.05 | 0.7 | 0.05 | 239 | 76 | 4 | |
| Inferred | 11.5 | 2.07 | 0.7 | 0.04 | 763 | 263 | 10 | |
| Total | Measured | 48.5 | 1.31 | 1.8 | 0.14 | 2,038 | 2,749 | 150 |
| Indicated | 78.4 | 1.30 | 1.2 | 0.08 | 3,272 | 3,082 | 131 | |
| Measured + Indicated | 126.9 | 1.30 | 1.4 | 0.10 | 5,310 | 5,831 | 280 | |
| Inferred | 22.9 | 1.60 | 0.7 | 0.04 | 1,177 | 538 | 19 | |
|
Notes: 1. Mineral resources are not mineral reserves and have no demonstrated economic viability. 2. The mineral resource estimate was prepared under the supervision of or was reviewed by Pamela De Mark, P.Geo., Senior Vice President Geology and Exploration of Aris Mining, who is a qualified person as defined by NI 43-101. 3. Totals may not add up due to rounding. 4. Mineral resources were estimated using a gold price of $1,950 per ounce. Open pit mineral resources are reported above a cut-off grade of 0.45 g/t gold within an optimized pit shell and underground mineral resources are reported above a cut-off grade of 1.5 g/t gold within optimized stope shapes. 5. There are no known legal, political, environmental, or other risks that could materially affect the potential development of the mineral resources.
|
||||||||
| Effective October 21, 2025 | Page |
NI 43-101 Technical Report Preliminary Economic Assessment for the Toroparu Project, Cuyuni-Mazaruni Region, Guyana
| 15 | Mineral reserve estimates |
This section is not applicable to this technical report.
| Effective October 21, 2025 | Page |
NI 43-101 Technical Report Preliminary Economic Assessment for the Toroparu Project, Cuyuni-Mazaruni Region, Guyana
| 16 | Mining methods |
| 16.1 | Introduction |
The Toroparu and Sona Hill deposits will be mined using conventional open pit mining methods. The operation will utilize conventional drill rigs, excavators, haul trucks, dozers, graders, water trucks, and utility vehicles.
Run of mine material from the Toroparu pits will be hauled from the pit benches to a dedicated run of mine stockpile located close to the Toroparu open pit area and processing plant. Run of mine material from the Sona Hill pit will be hauled approximately 8 km to the run of mine stockpile at the processing plant. Waste material will be hauled from the Toroparu and Sona Hill pits to their designated waste storage facilities located in close proximity around the two open pit areas. Topsoil will be stored separately for future rehabilitation requirements.
Material will typically be blasted in benches ranging from 10 to 20 m high, with 10 m benches assumed for the smaller equipment mining overburden and most saprolite, and 20 m benches for the larger equipment mining transition, sulphide rock, and selected areas of saprolite. Given the softness of the overburden and near surface saprolite, free digging and ripping opportunities will be considered where possible. Most of the overburden and approximately 75% of the saprolite is expected to be excavated without blasting.
The general mining related layout includes the Toroparu main, northwest, and southeast pits, the Sona Hill pit, a waste rock storage facility located to the northeast of the Toroparu pits, a waste rock storage facility located to the east of the Sona Hill pit, a low grade stockpile located to the west of the Toroparu northwest pit, a run of mine stockpile located at the processing plant, and haul roads. A plan of the general layout is shown in Figure 18-1.
| 16.2 | Geotechnical parameters |
The existing geotechnical work that has been considered for the pit design includes work undertaken by Knight Piésold in 2013, 2014, and 2018. The work included visual inspections, core logging and sampling, permeability testing, piezometer instrumentation and monitoring, laboratory rock/soil testing, and downhole televiewer surveys. The data collected allowed geotechnical models to be developed to assess pit slope stability to provide pit slope design parameters for benches, inter-ramp slopes, and the maximum overall pit slope angles that can be accommodated in each of the pit design sectors in the softer saprolite and harder underlying bedrock.
The recommended pit slope configurations are shown in Table 16-1.
| Table 16-1 | Recommended pit slope configurations |
| Rock type | Pit sector | Wall
dip direction (°) |
Bench
face angle (°) |
Bench
height (m) |
Bench
width (m) |
Inter
ramp angle (°) |
| Saprolite | All | - | 65 | 10 | 8 | 38 |
| Sulphide bedrock | Toroparu main (N) and Toroparu northwest | 160 to 240 | 65 | 20 | 9.5 | 47 |
| Toroparu main I | 240 to 340 | 70 | 20 | 9.5 | 50 | |
| Toroparu main (S) | 340 to 060 | 75 | 20 | 10 | 53 | |
| Toroparu main (W) | 060 to 160 | 75 | 20 | 10 | 53 | |
| Toroparu southeast (NE) | 160 to 250 | 65 | 20 | 9.5 | 47 | |
| Toroparu southeast (SE) | 250 to 030 | 65 | 20 | 9.5 | 47 | |
| Toroparu southeast (NW) | 030 to 160 | 70 | 20 | 9.5 | 50 | |
| Sona Hill (NE) | 180 to 270 | 70 | 20 | 10 | 49 | |
| Sona Hill (SE) | 270 to 315 | 70 | 20 | 10 | 49 | |
| Sona Hill (SW) | 315 to 090 | 75 | 20 | 10 | 53 | |
| Sona Hill (NW) | 090 to 180 | 75 | 20 | 10 | 53 |
| Effective October 21, 2025 | Page |
NI 43-101 Technical Report Preliminary Economic Assessment for the Toroparu Project, Cuyuni-Mazaruni Region, Guyana
| 16.3 | Hydrogeology, hydrology, and mine water management |
| 16.3.1 | Site description |
The Project is drained by the Puruni and Wynamu rivers, the confluence of which was historically at the Toroparu southeast pit location, but has been altered by artisanal mining activities. The predominant flow direction is to the south-southeast over very flat surface topography. The rivers directly influence the proposed Project infrastructure, with all of the open pits located within the floodplain areas of the two rivers. The rivers will be diverted to allow for proper surface water management and to mitigate safety concerns associated with flood events by constructing stream diversion canals and levees. These rivers are the main receptors.
The mine site has very low relief with shallow groundwater levels. There are no villages or communities dependent on groundwater within the Project area, with the nearest village located at Puruni approximately 100 km away.
The mean annual precipitation is high at 2,130 mm based on statistical analysis of approximately 26 years of daily rainfall data. There are two drier periods and two periods of higher precipitation, with the first dry period from February to April, the main rainy season from May to August, a second dry period from September to October, and a secondary rainy season in November to January. The average annual rainfall exceeds 200 mm per month. The estimated annual evaporation is 1,500 mm per year. From a hydrological perspective it is expected that sustained baseflows and high soil moisture will be prevalent, with peak runoff and flood risk in May to August.
| 16.3.2 | Hydrogeology |
The Project area consists of a shallow weathered aquifer consisting mainly of saprolite ranging from 0 to 40 m in depth that is underlain by a higher permeable transition zone at a depth of 40 to 45 m, and then by less permeable bedrock that typically gets less permeable with depth.
Large scale faults and lineaments may act as preferential groundwater flow pathways with enhanced permeability and groundwater flow typically occurring along and parallel to the strike of the structures and adjacent fractured zones. Structures may also act as barriers to flow across their strike due to disturbance zones, commonly with clay gouge, that inhibits groundwater flow.
Groundwater level transducers monitoring groundwater level changes since June 2022 in 12 drillholes indicate that the groundwater levels are in quasi steady state with no significant change over time in the saprolite, transition, and bedrock zones. Groundwater levels range between 2.4 to 24.7 m below ground level, with an average groundwater level depth of 11.7 m.
Water quality data from 2024 indicates that both surface and groundwater total dissolved solids are very good. None of the groundwater samples exceeded IFC guidelines for mining effluent. Half of the surface water samples exceeded IFC limits for iron, a single cadmium and mercury exceedance were found, as well as two suspended solids exceedances.
Thirty nine in situ packer tests were conducted in 2010 to determine site specific information on the rock permeability with depth. The subsurface was divided into five geological and hydro-stratigraphic zones with the saprolite zone overlying the transition zone and the upper, lower, and deep bedrock. The test results indicated that the hydraulic conductivity generally decreases with depth with the notable exception being the transition zone between the saprolite and the bedrock. The packer testing results were used to develop and calibrate a three dimensional numerical model.
A calibrated three-dimensional numerical groundwater flow model simulated the regional and local groundwater system in its pre-mining and life of mine state. Rainwater runoff from the pits were superimposed on the simulated groundwater inflows for each pit to account for fissure and rainwater separately. The numerical model further informed on the potential groundwater flow directions, pore pressure, and hydrogeological impacts of the mining infrastructure on the groundwater regime over the life of mine. Conservative assumptions were made to ensure simulated impacts are larger than in the actual expected case.
Pore pressures are expected to be elevated on the weathered and bedrock contact as well as on the pit slopes during mining. Pore pressures must be monitored during mining to determine if the slope stability is sensitive to pore pressures, and if the stability is sensitive, the active dewatering/depressurization measures could be enhanced to reduce pore pressures.
| Effective October 21, 2025 | Page |
NI 43-101 Technical Report Preliminary Economic Assessment for the Toroparu Project, Cuyuni-Mazaruni Region, Guyana
The main Toroparu pit is expected to experience the highest pit inflows from groundwater and rainwater over the life of mine with a maximum expected inflow rate of 39,606 cubic metres per day. The Toroparu northwest pit is expected to have the lowest inflow rate with a maximum expected inflow rate of 6,770 cubic metres per day. Surface water ingress will be mitigated using outer pit stormwater cutoff trenches and berms to capture and divert surface water runoff away from the pits and site infrastructure. In pit sump pumps and trenches will be used to manage in-pit water. Boreholes will be drilled to target any geological structures that could act as subsurface conduits of groundwater flow. Aquifer testing will be done to quantify the vertical hydraulic conductivity of the saprolite and used to update the numerical model.
Following mine development, the pits are expected to accumulate water as precipitation exceeds evaporation by approximately 600 mm per year with decanting expected. Post operational pit lake water quality should be evaluated in future studies but is not expected to be significantly degraded given the high annual precipitation rate and expected dynamic flowthrough relative to evaporation and stagnation.
The peak make up water demand for mining is 359,334 cubic metres per month and can be sourced from rainwater harvesting, abstracted from the Puruni and or the Wynamu rivers, as well as boreholes. Excess contact and mine water will be managed and treated if required before being discharged to the environment.
The potential for chemical mass migration from mine residue facilities and the impact on receptors was evaluated with specific reference to sulphate and arsenic that were used as tracer constituents for potential mass migration. There are no known groundwater users that can be influenced by mass migration and the only known receptors are the Wynamu and Puruni rivers. Cutoff and surface water diversion trenches and scavenger wells will limit the extent of mass migration to the rivers. A model was developed to evaluate the potential risks from chemical mass leach and transport potential via the surface water and groundwater pathways at the tailings management facility. From a hydrogeological contaminant transport risk perspective, the tailings facility does not require a synthetic liner.
| 16.3.3 | Hydrology and mine water management |
Flood hydraulics were modelled with a two dimensional flood model to determine the sizing of the stream diversion canals and levees.
The Wynamu River is completely impeded by the proposed mining activities, requiring a stream diversion to direct the flow around them and to ensure that there is no standing water adjacent to the open pit mines that could require dewatering. The Wynamu stream diversion was designed with a bottom width of 30 m, side slopes of 1 in 3, and a depth that varies between 1 and 3 m. Two canals will be cut through localized higher areas to allow the river to bypass the waste rock facility and to ensure free drainage of the Wynamu River to the Puruni River. Protection levees will be incorporated into the toe of the waste rock management facilities to ensure the water is diverted appropriately. As the existing Sona Hill road running from the Toroparu southeast pit to the Sona Hill pit obstructs the natural flow path of the river, a culvert crossing has been included in the design to safely convey flows beneath the road and to ensure the diversion operates as intended.
The flow of the Puruni River, the larger of the two rivers, will be impeded by the mining activities at the Toroparu southeast pit, the Puruni levee, the airstrip, the Sona Hill pit, the road to Sona Hill, and the low water bridge that provides access to the airstrip. A large protection levee will be constructed to protect the mining infrastructure and the Toroparu main pit from the river and the water levels expected during extreme flood events, and will also double as an access road to the southeast Toroparu pit, where another large levee will be constructed.
The airstrip will be built up to higher than the one thousand year flood line and the toe of the airfield fill will be utilized as the levee. Two hills will be closed to ensure that any flood from the Puruni River does not inundate the area behind the airstrip. Access to the airstrip will be via a built up road with culverts and a low water bridge.
Simulated flood velocities are quite low due to the very flat topography. Energy dissipation structures built with gabions or rip rap are therefore required only for the culverts at the airstrip access road and the Sona Hill access road.
A water management strategy was developed to support the proposed open pit mining, incorporating the pit dewatering requirements and the necessary surface water diversion, water quality management, and infrastructure. Dewatering will be undertaken using in pit sumps to capture pit inflows into each pit and a series of pumps and piping. All water will be directed through a pipeline network placed close to the haulage roads to minimize interference with mining operations and to
| Effective October 21, 2025 | Page |
NI 43-101 Technical Report Preliminary Economic Assessment for the Toroparu Project, Cuyuni-Mazaruni Region, Guyana
facilitate safe access for inspection and maintenance. The design includes flexibility to pump water to different destinations to cater for seasonal changes and water quality.
A site wide water balance was developed to quantify the mine water demand and identify excess water volumes and water management options. It was found that sufficient water is available to conduct the life of mine operations with excess water likely to be generated that will need to be monitored, treated, and discharged to the environment in compliance with the environmental permit. The water use management of the Project will be based on a principle of responsible water use and sustainable development, minimizing the impact of development on water quality and the environment. Clean and contact water will be separated, and process water will be recycled and re-used as much as possible. Contact water will be kept in a closed circuit to minimize spillages. The water demand will be supplied by internal sources from dewatering and rainwater harvesting, with rainwater accounting for approximately 70% of the water sources. Abstraction from river water may be required during lower than normal rainfall conditions.
| 16.4 | Open pit optimization |
The sub-celled mineral resource estimate block model was imported into pit optimization software and regularized to a selective mining unit with dimensions of 10 m easting, 20 m northing, and 5 m elevation to represent the smallest selective mining unit that can appropriately define the expected mill feed and waste boundaries during mining, considering the mining method, fleet size, and estimated productivity, and to account for dilution and mill feed losses incurred during mining. The block model lithology codes were used to separate the material into categories including oxidized overburden and saprolite waste rock, sulphide waste rock, transition waste rock, mineralized overburden and saprolite, mineralized transition rock, and mineralized sulphide rock. Following the regularization process, the diluted block grades were assigned into waste and mill feed categories using a gold cut-off grade of 0.45 g/t utilizing the parameters shown in Table 14-3.
A factor of approximately 3% was assumed for both unplanned dilution and unplanned mining losses. The planned dilution component is reflected in the use of a regularized block model for the pit optimization process, which results in 9% dilution at Toroparu and 10% dilution at Sona Hill, when compared with the block model used for the mineral resource estimate above a 0.45 g/t Au cut-off grade. Similarly, the mining losses are 0% at Toroparu and 15% at Sona Hill.
The unit mining costs reflect the difference between the softer near surface oxidized material, some of which can be mechanically removed without having to drill and blast, and the harder underlying sulphide material. Mining costs are higher at Sona Hill due to the lower mining rate, the need for a separate waste rock storage facility at Sona Hill, and the longer haulage distance between the Sona Hill pit and the processing plant.
The onsite overhead costs at Sona Hill reflect the lower G&A costs considering the management team’s concurrent costs at Toroparu.
The open pit optimization process utilized the initial assumptions shown in Table 16-2.
| Table 16-2 | Pit optimization parameters |
| Parameter | Unit | Toroparu | Sona Hill |
| Discount rate | % | 10 | 10 |
| Gold price | $/oz | 1,950 | 1,950 |
| Payability | % | 99.95 | 99.95 |
| Gold royalty | % | 8 | 8 |
| Processing rate | Mtpa | 7 | 0.5 |
| Oxide gold recovery | % | 94.0 | 95.0 |
| Sulphide gold recovery | % | 95.0 | 90 |
| Processing and tailings cost | $/t processed | 8.07 | 8.07 |
| Onsite overhead costs (rehandling, power, G&A, refining, sustaining, and closure) | $/t processed | 11.97 | 9.13 |
| Effective October 21, 2025 | Page |
NI 43-101 Technical Report Preliminary Economic Assessment for the Toroparu Project, Cuyuni-Mazaruni Region, Guyana
| Parameter | Unit | Toroparu | Sona Hill |
| Oxidized waste mining cost | $/t | 2.16 | 2.59 |
| Sulphide waste mining cost | $/t | 2.40 | 2.88 |
| Oxide mill feed mining cost | $/t | 2.40 | 3.64 |
| Sulphide mill feed mining cost | $/t | 2.64 | 3.90 |
| Incremental cost per 10 m bench | $/t | 0.04 | 0.04 |
| Unplanned mining recovery | % | 97 | 97 |
| Unplanned mine dilution | % | 3 | 3 |
| Oxide slope angle | ° | 30 | 30 |
| Sulphide slope angle | ° | 45 | 45 |
| Oxide bench height | m | 10 | 10 |
| Sulphide bench height | m | 20 | 20 |
A Lerchs-Grossmann algorithm based pit optimization process was run on the regularized blocks classified as measured, indicated, and inferred to calculate a series of nested pit shells over a range of revenue factors in 1% increments from 1 to 100%, with 100% representing the point at which mining and processing costs are equal to the revenue that can be generated from the sale of the gold produced within the maximum pit shell. The process utilized a 10% discount factor in real monetary terms.
Considering the conservative gold price assumption of $1,950 per ounce, the ultimate pits at Toroparu and Sona Hill were selected for the design phase to capture maximum value and to recover as much gold as possible. The conservative approach also allows for meaningful upside potential for mineral resource and mine life expansion in a higher gold price environment.
| 16.5 | Open pit design |
The open pit design considered the topographic data, pit slope parameters as shown in Table 16-1, and haul road design criteria.
The haul roads were designed as a double haul road with a 27 m width and a 54 m turning radius for the switchbacks. The last three benches were designed with a single 17 m haul road to minimize the amount of waste mined and to account for the fewer number of trucks required at the pit bottom. All pit ramps are assumed to have gradients of one in ten. The average round trip distance from the open pit to the run of mine stockpile is 4.2 km at Toroparu and 17.2 km at Sona Hill.
Plans and long sections of the pit designs relative to the optimized pits are shown in Figure 16-1 (Source: Aris Mining, 2025).
| Effective October 21, 2025 | Page |
NI 43-101 Technical Report Preliminary Economic Assessment for the Toroparu Project, Cuyuni-Mazaruni Region, Guyana
| Figure 16-1 | Plan and long sections of open pit design and optimized pits |
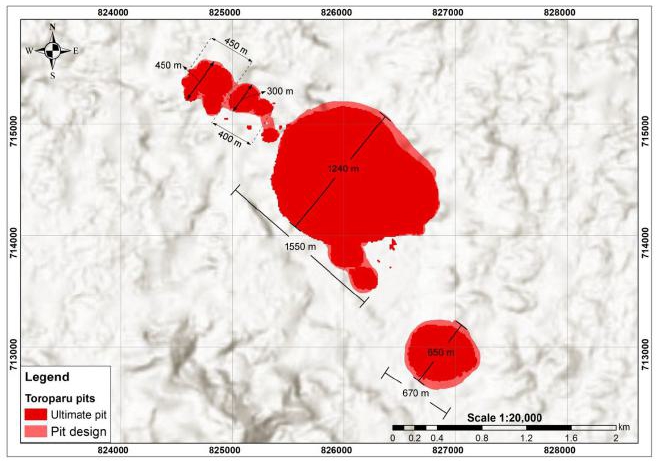
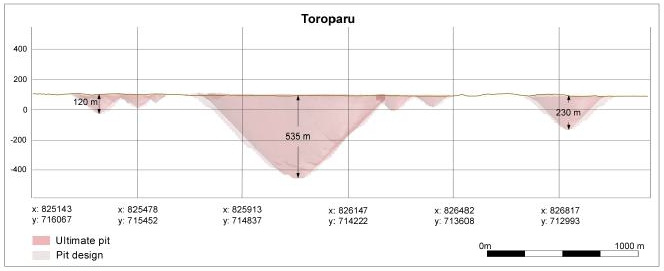
| Effective October 21, 2025 | Page |
NI 43-101 Technical Report Preliminary Economic Assessment for the Toroparu Project, Cuyuni-Mazaruni Region, Guyana


| 16.6 | Mine planning and schedule |
Key considerations for the strategic mine plan and schedule included a 7.0 Mtpa mining and processing rate over a 21.3 year mine life. Mining will be prioritized at the Toroparu main pit while production at the Toroparu northwest, Toroparu southeast, and Sona Hill pits will be delayed as long as possible to delay the required capital expenditures. The Toroparu main pit is planned to be mined in four phases to optimize access to higher gold grades, while the Toroparu northwest, Toroparu southeast, and Sona Hill pits are all planned to be mined in a single phase. There is a three year construction period during which mill feed will be stockpiled for processing in year one. Production reaches 7.0 Mtpa in Year 2 and continues until year 21. The final 2 Mt of mill feed are mined in year 22.
The combined life of mine production schedule, including the three year pre-production period, is shown in Table 16-3.
| Effective October 21, 2025 | Page |
NI 43-101 Technical Report Preliminary Economic Assessment for the Toroparu Project, Cuyuni-Mazaruni Region, Guyana
| Table 16-3 | Life of mine production schedule |
| Total | Y-3 | Y-2 | Y-1 | Y1 | Y2 | Y3 | Y4 | Y5 | Y6 | Y7 | Y8 | Y9 | Y10 | Y11 | Y12 | Y13 | Y14 | Y15 | Y16 | Y17 | Y18 | Y19 | Y20 | Y21 | Y22 | |
| Mill feed (Mt) | 149.0 | 1.1 | 2.9 | 2.2 | 1.1 | 7.0 | 7.0 | 7.1 | 7.0 | 7.0 | 6.8 | 7.3 | 7.1 | 7.0 | 7.1 | 6.4 | 7.1 | 6.9 | 7.1 | 7.0 | 7.1 | 7.0 | 7.0 | 7.0 | 7.0 | 2.0 |
| Waste (Mt) | 694.0 | 10.1 | 20.1 | 20.0 | 20.3 | 50.1 | 60.5 | 60.3 | 60.0 | 59.3 | 61.8 | 45.5 | 40.9 | 40.0 | 31.4 | 19.6 | 20.4 | 20.5 | 15.4 | 7.1 | 7.1 | 7.0 | 7.0 | 5.3 | 3.4 | 1.0 |
| Strip ratio (waste to mill feed) | 4.7 | 9.5 | 7.0 | 9.2 | 19.1 | 7.2 | 8.6 | 8.5 | 8.6 | 8.5 | 9.1 | 6.3 | 5.8 | 5.7 | 4.4 | 3.1 | 2.9 | 3.0 | 2.2 | 1.0 | 1.0 | 1.0 | 1.0 | 0.8 | 0.5 | 0.5 |
| Gold grade (g/t) | 1.12 | 0.96 | 1.02 | 0.97 | 0.92 | 1.06 | 1.08 | 1.16 | 1.14 | 1.15 | 1.06 | 1.00 | 1.02 | 1.02 | 1.04 | 1.15 | 1.02 | 1.09 | 1.04 | 1.09 | 1.22 | 1.31 | 1.23 | 1.31 | 1.31 | 0.99 |
| Silver grade (g/t) | 1.3 | 1.5 | 1.5 | 1.6 | 1.2 | 1.6 | 1.7 | 1.8 | 1.7 | 1.4 | 1.3 | 1.3 | 1.0 | 1.0 | 0.9 | 0.8 | 1.1 | 1.2 | 1.3 | 1.7 | 1.4 | 1.3 | 1.5 | 1.1 | 1.0 | 0.9 |
| Copper grade (%) | 0.09 | 0.11 | 0.13 | 0.15 | 0.11 | 0.14 | 0.15 | 0.15 | 0.14 | 0.11 | 0.09 | 0.09 | 0.07 | 0.06 | 0.05 | 0.03 | 0.05 | 0.06 | 0.06 | 0.11 | 0.09 | 0.09 | 0.09 | 0.08 | 0.07 | 0.06 |
| Contained gold (koz) | 5,343.2 | 32.7 | 94.0 | 67.7 | 31.7 | 238.9 | 243.0 | 263.4 | 257.4 | 259.6 | 231.8 | 232.9 | 233.7 | 229.7 | 235.6 | 235.1 | 230.8 | 240.7 | 236.7 | 244.4 | 276.9 | 297.5 | 276.1 | 294.5 | 294.2 | 64.3 |
| Contained silver (koz) | 6,315.7 | 49.7 | 133.7 | 114.2 | 41.8 | 361.6 | 384.7 | 418.5 | 390.2 | 324.7 | 276.9 | 306.6 | 234.2 | 217.1 | 198.2 | 158.4 | 260.5 | 269.6 | 291.9 | 379.9 | 327.9 | 304.4 | 336.9 | 248.1 | 227.8 | 58.2 |
| Contained copper (kt) | 136.8 | 1.1 | 3.8 | 3.2 | 1.2 | 10.1 | 10.6 | 10.6 | 9.5 | 7.8 | 6.4 | 6.7 | 5.1 | 4.3 | 3.8 | 2.0 | 3.6 | 4.0 | 4.6 | 7.5 | 6.4 | 6.0 | 6.4 | 5.6 | 5.2 | 1.3 |
| Effective October 21, 2025 | Page |
NI 43-101 Technical Report Preliminary Economic Assessment for the Toroparu Project, Cuyuni-Mazaruni Region, Guyana
| 16.7 | Material handling |
All run of mine material above 0.45 g/t Au will be hauled to the 1.14 Mt capacity run of mine stockpile located at the processing plant.
Any material between 0.30 and 0.45 g/t Au from the Toroparu pits will be hauled to one of two low grade stockpiles for potential processing at a later date. The two low grade stockpiles have a capacity of 86.8 Mt and 12.1 Mt. During the construction phase, approximately 5 Mt of mill feed will be temporarily stockpiled at the 12.1 Mt capacity low grade stockpile. During the operation phase, any higher grade low grade material will also be stored at the 12.1 Mt capacity low grade stockpile. The material in the low grade stockpiles has not been considered in the economic analysis.
All Toroparu material less than 0.30 g/t Au is classified as waste and will be hauled to the 591.4 Mt waste rock facility located adjacent to the Toroparu pits. All Sona Hill material less than 0.45 g/t Au is classified as waste and will be hauled to the waste rock facility located adjacent to the Sona Hill open pit. The waste material from the open pits is not planned to be used in the construction of the tailings management facility.
| 16.8 | Mine equipment |
The estimated mine equipment requirements were selected based on operating factors such as availability, effective utilization, equipment life, and productivity assumptions. Hydraulic excavators will serve as the primary loading equipment with different configurations to cater for differences in rock hardness and required volumes. Front end loaders will be used for rehandling material from the low grade stockpile to the primary crusher and for loading run of mine trucks at Sona Hill for haulage to the primary crusher or low grade stockpile as required. The haul truck fleet is matched to the excavator fleet. Where possible, equipment will be shared between the three Toroparu pits and the Sona Hill pit to optimize utilization.
The blasthole drilling fleet will be equipped to drill 152 mm blastholes on 10 or 20 m benches with a nominal 5.75 by 5.75 m spacing in both waste and mill feed material, and adjusted as necessary to suit the ground conditions during operations.
Bulk emulsion explosives will be used for all production blastholes. Blasting is planned for 25% of the saprolite mill feed and for all of the remaining transition and sulphide mill feed. The remaining 75% of the saprolite is expected to be free digging. Bulk emulsion and associated blasting accessories will be transported to site and stored in appropriately secure and licensed explosives magazines. Emulsion trucks will be used to charge blastholes. The blasting fleet will also include a dedicated stemming truck and crew transport vehicles.
In pit loading will be undertaken using hydraulic excavators loading into trucks with configurations to suit material hardness and volumes.
Haul distances from the pits to the run of mine pad, waste rock storage facilities, and mineralized waste rock storage facilities were derived from the pit designs and ramp gradients.
The auxiliary fleet includes tracked dozers, wheel dozers, graders, water trucks, and smaller excavators for drains, sumps, and non-production activities such as drill site preparation, road and ramp development and maintenance, maintenance of loading areas, waste stockpiles, and other duties. Shared support equipment will include charging vehicles, transport movers, maintenance vehicles, fuel and lubrication trucks, and tire service vehicles. Dedicated dozers are allocated to each of the two waste rock storage facilities.
The expected mining fleet requirements during the construction and operational phases, including allowances for scheduled maintenance, are summarized in Table 16-4. Equipment purchases are progressively scheduled in line with production ramp-up and increasing haul distances.
| Table 16-4 | Fleet requirements |
| Description | Construction phase | Operational phase |
| Epiroc D65 drill rig | 3 | 6 |
| CAT 390/395 hydraulic excavator | 2 | 3 |
| CAT 740 articulated dump truck | 3 | 4 |
| Effective October 21, 2025 | Page |
NI 43-101 Technical Report Preliminary Economic Assessment for the Toroparu Project, Cuyuni-Mazaruni Region, Guyana
| Description | Construction phase | Operational phase |
| CAT 6040 hydraulic excavator | 3 | 7 |
| CAT 785 truck | 7 | 28 |
| Charging vehicle | 1 | 2 |
| Stemming vehicle | 2 | 3 |
| CAT D9T track dozer | 3 | 7 |
| CAT 834K wheel dozer | 2 | 4 |
| CAT 844H wheel dozer | 2 | 3 |
| CAT 16M (24 M) grader | 2 | 5 |
| CAT 330 backhoe loader | 2 | 4 |
| Water truck | 2 | 4 |
| CAT D10 waste dump dozer | 3 | 4 |
| Transport mover | 1 | 1 |
| Blasting flatbed truck | 1 | 1 |
| Small backhoe utility vehicle | 1 | 1 |
| Crane truck | 1 | 1 |
| Fuel truck | 2 | 4 |
| Oil lube truck | 2 | 3 |
| Mechanics truck | 2 | 4 |
| Welding truck | 1 | 1 |
| Tire service truck | 1 | 1 |
| Forklift | 1 | 1 |
| Flatbed truck | 1 | 1 |
| Hi-Ace 16 seater personnel bus | 2 | 4 |
| 4 x 4 utility vehicle | 10 | 20 |
| Secondary blasting drill rig / rock breaker | 1 | 1 |
| Mobile lighting mast | 8 | 18 |
| 16.9 | Mine personnel |
The mining fleet requirements were used to estimate the labour requirements and to determine the likely mining operating costs. All mining activities will be carried out by an owner mining workforce. The labour requirements were estimated for all mining related activities, including direct mining operations, support fleet, maintenance, technical services, and mining management during steady state operations. Labour requirements for direct mining and the support fleet were based on two 12 hour shifts operating seven days per week and utilizing four crews. Maintenance personnel will work primarily on day shift with a smaller breakdown crew available on night shift. Technical services and mining management personnel will operate on a day shift basis only.
The peak mining workforce during the construction phase is estimated at approximately 243 personnel. During steady state operations the peak workforce is expected to increase to approximately 531 personnel. This peak is anticipated to occur when all three Toroparu pits are operating concurrently. The labour requirements are shown in Table 16-5.
| Table 16-5 | Labour requirements |
| Description | Construction phase | Operational phase |
| Operators | ||
| Drill operator | 8 | 20 |
| CAT 390/395 hydraulic excavator operator | 4 | 8 |
| CAT 740 articulated dump truck operator | 8 | 12 |
| Effective October 21, 2025 | Page |
NI 43-101 Technical Report Preliminary Economic Assessment for the Toroparu Project, Cuyuni-Mazaruni Region, Guyana
| Description | Construction phase | Operational phase |
| CAT 6040 hydraulic excavator operator | 8 | 24 |
| CAT 785 truck operator | 24 | 100 |
| Pit spotters | 8 | 24 |
| Charging crew | 16 | 32 |
| Stemming vehicle operator | 4 | 8 |
| Explosives magazine master | 1 | 1 |
| CAT D9T track dozer operator | 8 | 24 |
| CAT 834K wheel dozer operator | 4 | 12 |
| CAT 844H wheel dozer operator | 4 | 8 |
| CAT 16M (24 M) grader operator | 4 | 16 |
| CAT 330 backhoe loader operator | 4 | 12 |
| Water truck operator | 4 | 12 |
| CAT D10 waste dump dozer operator | 8 | 12 |
| Transport mover operator | 4 | 4 |
| Small backhoe utility vehicle operator | 4 | 4 |
| Fuel truck operator | 8 | 16 |
| Lube truck operator | 8 | 12 |
| Tire service truck operator | 4 | 4 |
| Personnel bus operator | 8 | 16 |
| Secondary blasting drill rig / rock breaker operator | 4 | 4 |
| Total operator requirement | 157 | 385 |
| Maintenance | ||
| Day shift fleet maintenance | 18 | 44 |
| Day shift maintenance assistants | 9 | 22 |
| Night shift breakdown crew | 3 | 7 |
| Maintenance planners | 1 | 2 |
| Mechanical team lead | 2 | 2 |
| Electrical team lead | 1 | 1 |
| Maintenance data entry | 1 | 1 |
| Diesel clerk | 1 | 1 |
| Maintenance stores personnel | 3 | 3 |
| Pumping crew | 3 | 6 |
| Total maintenance requirement | 42 | 89 |
| Mine supervision | ||
| Shift supervisor | 4 | 4 |
| Blasters | 4 | 4 |
| Maintenance engineer | 1 | 1 |
| Total mine supervision requirement | 9 | 9 |
| Technical services | ||
| Surveyors | 2 | 3 |
| Survey assistants | 2 | 3 |
| Grade control officer | 2 | 4 |
| Grade control assistants | 4 | 8 |
| Production geologist | 1 | 2 |
| Drawing geologist | 1 | 1 |
| Resource geologist | 1 | 1 |
| Effective October 21, 2025 | Page |
NI 43-101 Technical Report Preliminary Economic Assessment for the Toroparu Project, Cuyuni-Mazaruni Region, Guyana
| Description | Construction phase | Operational phase |
| Geotechnical officer | 1 | 2 |
| Geotechnical assistant | 1 | 2 |
| Mine planner | 2 | 2 |
| Data entry clerk | 1 | 1 |
| Drill and blast engineer | 1 | 2 |
| Drawing mining engineer | 1 | 2 |
| Trainers | 4 | 4 |
| Safety and health officers | 2 | 2 |
| Planning manager | 1 | 1 |
| Geohydrology manager | 1 | 1 |
| Geology manager | 1 | 1 |
| Survey manager | 1 | 1 |
| Geotechnical manager | 1 | 1 |
| Mineral resources manager | 1 | 1 |
| Total technical services requirement | 32 | 45 |
| Other mining supervision | ||
| Pit superintendent | 1 | 1 |
| Explosives magazine supervisor | 1 | 1 |
| Mining manager | 1 | 1 |
| Total other mining supervision requirement | 3 | 3 |
| Total labour requirement | 243 | 531 |
| 16.10 | Recommendations |
The following additional work is recommended to advance the Project to a PFS level and to support the development of PFS level engineering designs and cost estimates.
| · | Mining and infrastructure |
| o | undertake surface drilling to verify geotechnical data and related assumptions and update the geotechnical and slope stability analyses for PFS open pit slope designs and waste rock management facility slope stability; |
| o | update the input parameters for the pit optimization process following trade-off studies on the pit selection; |
| o | assess alternative material handling options; |
| o | undertake the mine design, pushback sequencing, life of mine schedule, and waste rock management facilities to a PFS level of accuracy. Consider the potential mining mix in terms of selectivity or flexibility, in the context of the rainy seasons and other logistical challenges while maximizing early operating margins in the shorter term, and to accommodate the processing of mineralized waste material over the longer term; |
| o | assess the transition zone between surface to underground mining operations to demonstrate additional upside potential; and |
| o | develop an appropriate contractor tender package to secure accurate contractor mining rates from reputable contractors for the operating cost estimates as an alternative to owner mining. |
The cost to complete the testwork and studies is estimated at approximately $0.7 million.
| · | Hydrogeology |
| o | continuously monitor site rainfall data; |
| o | continue monitoring site surface water and groundwater quality for analysis at an accredited laboratory to acquire additional pre-mining baseline water quality data and in particular to evaluate the effect of artisanal mining on the site water quality; |
| o | undertake site tests to quantify the vertical hydraulic conductivity of the saprolite, and update the 3D numerical groundwater flow model; |
| Effective October 21, 2025 | Page |
NI 43-101 Technical Report Preliminary Economic Assessment for the Toroparu Project, Cuyuni-Mazaruni Region, Guyana
| o | update the site wide water balance to include chemical mass load modelling as well as the expected water quality to be discharged to the environment. Simulate the catchment runoff in more detail to determine the abstraction requirements for mine water supply and yield of the rivers in case of lower than expected rainfall years; |
| o | update the numerical groundwater model and run additional sensitivities with the inclusion of faults acting as sub surface conduits; |
| o | model the tailings and waste rock management facilities in more detail to determine the potential for chemical mass release and downstream environmental impacts. Undertake site specific adsorption tests on arsenic and related chemical constituents to inform a hydrogeochemical model to quantify the waste source release and downstream migration rates to potential environmental receptors such as the Puruni River. Update the Source-Pathway-Receptor model based on a detailed tailings management facility water balance and the hydrogeochemical model outputs to quantify the potential risks of contaminant migration potential. Evaluate the potential impacts against environmental risk limits; |
| o | verify the presence of potential sub-surface groundwater flow zones such as fault zones with a surface geophysical survey. Target, drill, and aquifer test any identified sub surface groundwater flow zones and consider their use as dewatering boreholes; |
| o | drill groundwater monitoring boreholes within the vicinity of the Sona Hill pit to acquire site specific groundwater monitoring data; |
| o | evaluate the possibility and potential effect of mud rush into the pits; |
| o | progress the hydrogeological model through the following studies and technical workstreams: |
| § | vertical hydraulic conductivity and transmissivity saprolite pumping tests |
| § | electrical resistivity tomography geophysical surveys within the vicinity of the planned tailings management facility and open pits; |
| § | update the 3D numerical Finite Element subsurface flow system model; |
| § | model the static site wide water and salt balance; and |
| § | undertake adsorption tests and update the geochemical model; |
| § | complete three additional groundwater monitoring boreholes near Sona Hill. |
The cost to complete the testwork and studies is estimated at approximately $0.2 million.
| · | Hydrology |
| o | Undertake geotechnical and soils studies of the Project area, including particle soil distribution of the upper soils in the catchment area to determine soil texture, permeability tests of the upper soils in the catchment area, geotechnical test pits along the proposed protection levees and at culvert locations, and laboratory tests on the saprolite material to assess whether it can be made more impermeable and used as a clay core for the protection levees; |
| o | Continue the monitoring of rainfall and flow in the Puruni and Wynamu rivers, ensure regular calibration of the flow measuring devices, and report on outages, changes, and issues with the monitoring; |
| o | Extend the LIDAR survey further to the southeast of the Project to minimize assumptions for the flood modelling and levee designs; |
The cost to complete the testwork and studies is estimated at approximately $0.04 million.
| Effective October 21, 2025 | Page |
NI 43-101 Technical Report Preliminary Economic Assessment for the Toroparu Project, Cuyuni-Mazaruni Region, Guyana
| 17 | Recovery methods |
| 17.1 | Introduction |
The process plant design criteria and flowsheet are based on extensive metallurgical testwork as described in Section 13, and are based on an industry standard practice metallurgical flowsheet to treat two primary gold bearing rock types, including the oxidized saprolite and other near surface oxidized material and deeper sulphide rock, to produce two doré products and a copper-gold flotation concentrate. The two oxide and sulphide mill feed types will be stockpiled and processed separately during designated campaigns.
The process plant is designed for a nominal throughput of 7.0 Mtpa of run of mine feed. The plant flowsheet includes crushing, grinding, an upfront gravity gold concentration circuit to produce doré, followed by a carbon in leach circuit to produce a second doré, and sulphide flotation for the sulphide feed type only to produce a copper-gold concentrate.
Cyanide contained in the tailings from the gravity concentrate and intensive cyanidation circuits will be neutralized by dosing with a hydrogen peroxide solution before recirculation to the milling circuit, ensuring a safe operating environment. Cyanide present in the carbon in leach tailings stream will be treated in an SO2/air cyanide destruction circuit to meet the environmental compliance requirements before being pumped to the tailings management facility.
The combined metallurgical recoveries for sulphide material are estimated at 93% for gold, 78% for silver, and 88% for copper. For oxide material the combined metallurgical recoveries are estimated at 97% for gold and 46% for silver. Overall, the operation is designed to recover 93.6% of the gold, 77.0% of the silver, and 86.1% of the copper contained in the total life of mine material.
The workforce during the construction phase is estimated at between 1,292 to 1,520 personnel. During steady state operations the workforce is expected to increase to between approximately 185 to 213 personnel.
| 17.2 | Primary run of mine handling and crushing |
Run of mine material, including the oxide and sulphide rock types, will be mined, stockpiled, and processed in separate dedicated campaigns according to the mine plan.
The run of mine material will be trucked to the process plant and discharged directly onto a 450 kW gyratory crusher for size reduction to a product of P80 150 mm. A water mist dust suppression system will contain dust emissions. Any run of mine material greater than 800 mm will be broken by a rock breaker prior to entering the crusher. An apron feeder will extract the feed from the crusher discharge and feed onto a crusher sacrificial conveyor fitted with an overhead tramp metal magnet. A transfer chute will discharge the feed onto an overland conveyor fitted with a weightometer for metallurgical accounting and sampled for analysis in the metallurgical laboratory. The crusher and the apron feeder discharge chutes will be fitted with dust extraction hoods.
The crushed feed will be discharged via two parallel streams of vibrating feeders onto the final 45,425 tonne capacity run of mine stockpile, which represents 52.6 hours of storage. When a feed type campaign is concluded, the stockpile pad will be cleaned in preparation for the next feed type campaign.
| 17.3 | Grinding circuit |
The grinding circuit will comprise a SAG mill operating in closed circuit with a pebble crusher, followed by a ball mill operating in closed circuit with a hydrocyclone cluster. The reclaimed crushed mill feed will be combined with water and fed directly into a 34 foot by 18.25 foot, 12.5 MW, 3,024 tonnes per hour capacity SAG mill. The mill product will pass over a discharge vibrating screen to remove any pebbles greater than 20 mm, which will report to a pebble cone crusher via a feed bin. The crushed pebbles will then report back to the mill feed conveyor. A pebble stockpile will be located next to the pebble crusher allowing the pebbles to be reclaimed directly from the stockpile and fed back onto the pebble crusher discharge conveyor in the event of a crusher shut down.
The 3,023.6 tonnes per hour grinding mill product of -20 mm will report to a cyclone feed hopper then pumped to a cyclone classifying cluster with an overflow P80 of 75 microns. The +75 micron underflow will be split into two streams. An amount
| Effective October 21, 2025 | Page |
NI 43-101 Technical Report Preliminary Economic Assessment for the Toroparu Project, Cuyuni-Mazaruni Region, Guyana
equivalent to the fresh feed rate of 863.9 tonnes per hour will discharge onto a gravity scalping vibrating screen with 2 mm aperture panels, from where the +2 mm feed will be sent to the ball mill and the -2 mm feed will report to the gravity recovery circuit. The remaining 1,295.8 tonnes per hour split will report directly to the 26 ft by 42.5 ft, 18 MW ball mill. The ball mill discharge will be fitted with a trommel with 12 mm apertures, and any oversize material will report to the scats bin for disposal. The undersize material will be discharged onto the cyclone feed hopper.
The classifying cyclones overflow will pass over a single deck vibrating trash screen with 500 micron aperture screen panels. Any oversize material will be collected in a trash bin for disposal and the undersize will report to a high rate pre-leach primary thickener, with the underflow reporting to the sulphide flotation circuit when processing sulphide mill feed and to the carbon in leach circuit when processing oxide mill feed.
| 17.4 | Gold recovery circuits |
| 17.4.1 | Gravity concentration and intensive leach circuit |
Slurry from the cyclone cluster feed hopper will be pumped to the classifying cyclone with the +75 micron underflow reporting to the scalping screen fitted with 2 mm apertures. The -2 mm material will report to two Knelson gravity gold concentrators operating in parallel. The resulting gravity concentrate stream from the gravity concentration circuit will be pumped to the intensive cyanide leach circuit and the tailings stream will be detoxified prior to being sent back to the cyclone classification cluster for further liberation in the ball mill.
At the intensive cyanide leach circuit, 36.7 kg/t of sodium cyanide will be added with oxidant to the gravity concentrate to commence the gold leaching reaction in a horizontal drum leach reactor. 5 kg/t of lime will be added to maintain the slurry pH at 10 and 71 kg/t of flocculant will be added to facilitate the removal of particulates from the loaded solution.
The pregnant gold leach solution will be pumped to a dedicated intensive cyanide leach pregnant solution tank from where the solution will be transferred to the electrowinning circuit. The solution can also be diverted to the electrowinning circuit via the carbon in leach pregnant solution tank. The leached solid residue will be neutralized by the addition of hydrogen peroxide in an agitated tank to prevent cyanide from reporting to the flotation circuit, before being pumped back to the ball mill circuit for further grinding.
In the secure gold room, the pregnant solution from the intensive cyanide leach and carbon in leach process will be plated out on to separate dedicated electrowinning cell cathodes operating on a single pass basis to produce a gold sludge. The cathodes will be transferred from the cells to the cathode washing tank where a high pressure washer will be used to dislodge the gold sludge from the cathode surface. The barren solution will be collected in the barren solution tank then pumped back to the carbon in leach circuit.
The gold sludge will be filtered in a plate and frame filter press to produce cake gold, then dried in an oven, mixed with fluxes, and fired in a furnace to produce doré. The doré will be cleaned, sampled, and transferred to a safe for safekeeping prior to transport to the refinery.
The expected recoveries for oxide material from the gravity concentration and intensive cyanide leach circuit are 35% for gold and 9% for silver, and the expected recoveries for sulphide material are 38% for gold, 16% for silver, and 0.004% for copper.
| 17.4.2 | Pre-leach thickening circuit |
The cyclone overflow from the ball mill, at 864 tonnes per hour equivalent to the fresh feed, will be transferred to the primary thickener feed box which will direct the feed to a high rate thickener together with flocculant to aid the solids settling rate. When processing sulphide material, the thickened underflow slurry will be pumped to the agitated sulphide rougher conditioning tank in the rougher flotation circuit. When processing oxide material, the underflow will be pumped directly to the carbon in leach circuit. The thickener overflow water will be transferred to a holding tank and then transferred to the rougher flotation conditioning tank or to the process water storage tank for reuse throughout the plant.
| 17.4.3 | Carbon in leach circuit |
Oxide and sulphide mill feed will be separately processed in the hybrid carbon in leach circuit with the first tank in the eight tank train operating solely as a leach tank. The carbon in leach circuit will comprise eight cascading agitated adsorption tanks
| Effective October 21, 2025 | Page |
NI 43-101 Technical Report Preliminary Economic Assessment for the Toroparu Project, Cuyuni-Mazaruni Region, Guyana
for 48 hours of leaching time. The first tank provides elevated solution grades and activated carbon loads, resulting in a reduced elution capacity demand. The pH will be maintained at 10.2 with lime, and 1.05 kg/t of sodium cyanide will be dosed into the first tank to dissolve the gold and silver in the slurry. The slurry will then pass sequentially through the remaining seven tanks, each of which contains activated carbon. Adsorption will occur in a counter-current configuration with fresh carbon entering at tank 8 and advanced upstream by transfer pumps toward tank 2. As the carbon moves against the slurry flow, its metal loading capacity progressively increases, until reaching tank 2 as loaded carbon. The loaded carbon is then removed for gold elution and carbon reactivation.
After adsorption, the slurry will be discharged onto a carbon in leach tailings screen ensuring that any stray carbon is captured in the oversize and returned to the circuit. The carbon free screen undersize will be pumped to the detoxification circuit for cyanide destruction before being pumped to the tailings management facility. Each of the adsorption stages contains an interstage screen to retain and control the carbon in each of the tanks.
The Anglo American Research Laboratories elution method was selected. The loaded carbon from the first adsorption tank will be sent for acid washing via the loaded carbon screen, with the underflow slurry transferred to the tailings screen of the leach circuit while the carbon from the screen oversize gravitates to a single acid wash column. The diluted acid solution will remove the scale from the surface and from within the fine pores of the carbon to restore its adsorption efficiency before it is recycled back to the leaching circuit. Once the carbon has been adequately washed, it will be rinsed with filtered water and transferred to a single elution column.
The elution circuit will use a cold sodium cyanide soak to prepare the carbon and load the solution with free cyanide, followed by a steady state eluting phase to desorb the gold and silver from the carbon and return it to the solution phase to produce a pregnant solution for transfer to the pregnant solution tanks.
The pregnant solution will then be pumped to dedicated carbon in leach electrowinning cells where the metals will be plated out as sludge on the cell cathodes. The cathodes will be transferred to the cathode washing tank to dislodge the gold sludge from the cathode surface.
Following elution, the barren carbon will be thermally reactivated in a 2.9 MW rotary kiln to restore its adsorption capacity, stored in a product hopper, then reintroduced into the leach circuit in the final adsorption stage.
The Inco SO2/air process will be used for tailings cyanide detoxification. The solid residue remaining from the carbon in the leach circuit will be directed over a carbon safety screen to remove carbon then directed to the detoxification circuit comprising three tanks operating in series with a residence time of 82.5 minutes with sodium metabisulfite, copper sulphate, lime, dilution water, air, and lime. The detoxified slurry with an expected CNWAD of 0.07 mg per litre, below the required discharge limits, will be pumped to the tailings management facility. The cyanide content in the tailings will be further reduced by natural cyanide degradation and dilution from rainwater to meet IFC standards.
The expected recoveries for oxide material from the carbon in leach process circuit are 95% for gold and 40% for silver, and the expected recoveries for sulphide material are 68% for gold and 40% for silver.
| 17.4.4 | Flotation circuit |
When processing oxide mill feed, the 864 tonnes per hour pre-leach thickener underflow will be pumped directly to the carbon in leach circuit. When processing sulphide mill feed, the underflow will be pumped to the sulphide rougher flotation conditioning tank where two collectors, a frothing agent, lime slurry, and process water will be added and pumped to six rougher flotation cells for a 40 minute residence time. The rougher concentrate collected from the flotation cells will gravitate to a sulphide sump where a froth pump will deliver the slurry to the sulphide regrind mill cyclone feed tank via a sampler. A cyclone cluster of 14 units and 1 standby unit will operate in a closed circuit with a single 1.5 MW regrind mill. The cyclone overflow will discharge to the sulphide cleaner flotation feed box and the underflow will report back to the regrind mill. The tailings from the final rougher flotation cell will report to the sulphide rougher tailings pump via a sampler and pumped to the carbon in leach circuit.
The reground flotation rougher concentrate will report to four cleaner flotation cells for a 20 minute residence time at a pH of 11 with sulphide thickener overflow process water, sulphide cleaner tailings, and cleaner flotation reagents. The cleaner concentrate will be pumped via froth pumps to four recleaner flotation cells for a 20 minute residence time at a pH of 11 with the recleaner tails and recleaner flotation reagents.
| Effective October 21, 2025 | Page |
NI 43-101 Technical Report Preliminary Economic Assessment for the Toroparu Project, Cuyuni-Mazaruni Region, Guyana
The recleaner tails will be recycled back to the cleaner circuit and the concentrate will be pumped via froth pumps to a single Jameson recleaner flotation cell at a pH of 11 with recleaner flotation reagents. The recleaner tails will be recycled back to the recleaner flotation while the concentrate will be pumped via froth pumps to the concentrate thickener.
All concentrates and tailings will be sampled through online samplers for metallurgical accounting.
The copper sulphide concentrate will be dewatered in a high rate thickener with an underflow solids density of 55%. The slurry will be pumped to either of two horizontal plate filter presses, including one standby, to reduce the moisture to 10%. The filter cake will then be transferred to a storage bin with a 7 day production capacity. The cake will then be discharged directly into 20 ft containers for transport. The concentrate will be weighed and sampled for metal accounting, covered with a tarpaulin, and dispatched to a smelter.
Recoveries from the flotation circuit are expected at 67% for gold, 56.8% for silver, and 88% for copper. Final concentrate grades are expected at 112 g/t gold, 154 g/t silver, and 20.1% copper.
Following commissioning, the operating parameters of the flotation circuit can be optimized to ensure a minimum copper grade in the final product to improve the saleable value of the concentrate to the potential smelter. Adjustments to the operating parameters to the benefit of a lower copper grade could result in a lower gold content in the concentrate, however, any gold lost in the flotation tailings will be recovered by the carbon in leach process, ensuring a holistic gold recovery strategy.
| 17.5 | Reagents and consumables |
The reagents consumed at the process plant will be prepared on site and distributed via various reagent handling and makeup systems. The reagents include sodium cyanide, hydrated lime, hydrochloric acid, sodium hydroxide, copper sulphate, sodium metabisulphite, flotation reagents, flocculant, hydrogen peroxide, and activated carbon. The reagents will be delivered in dry form except for hydrochloric acid, secondary flotation collector, frothing agent, and hydrogen peroxide, which will be delivered in solution form.
The reagent preparation and storage facilities will be located within containment areas designed to accommodate greater than the maximum capacity of the largest tank for the management of unexpected spills. As required, each reagent system will be located within its own containment area to facilitate its return to its respective storage vessel and to avoid the mixing of incompatible reagents. Storage tanks will be equipped with level indicators, instrumentation, and alarms for operational and safety purposes. Appropriate ventilation, fire and safety protection, eye wash stations and showers, and Material Safety Data Sheet stations will be located throughout the facilities. Sumps and sump pumps will be provided for spillage control.
The reagents will be mixed, stored, and delivered to the intensive cyanide leach, flotation, pre-leach thickener, carbon in leach, acid wash, elution, and cyanide destruction circuits with the dosages controlled by flow meters and control valves. The capacity of the storage tanks will be sized to handle one day of production.
Purified oxygen will be used in the intensive cyanide leach and carbon in leach circuits, and generated on site.
Other reagents and consumables include borax, sodium carbonate, manganese dioxide, and silica for the gold room fluxes, diesel fuel for the elution heater, reactivation kiln, and smelting furnace, and grinding media for the SAG mill, ball mill, and regrind mill.
| 17.6 | Power, water, and air |
The estimated power requirements for the process plant are approximately 50 MW, which will be supplied by a 50 MVA, 13.8 kV onsite power plant. Power will be distributed by overhead power line to the primary crushing area, tailings facility, as well as the open pit mine, accommodation area, and the main access gate.
During commissioning, all plant water will be pumped at a rate of 561 litres per second from the Puruni River, and during operations the demand will drop to 55 litres per second. The water will be pumped to the process plant for use as reagent make-up, potable water, gland water, and process water. The reagent raw water will be pumped to a reagent water tank. The potable water will be pumped through a dedicated potable water treatment facility with the treated water reporting to the potable water tank, then pumped to safety showers throughout the plant and washrooms. The gland water will be
| Effective October 21, 2025 | Page |
NI 43-101 Technical Report Preliminary Economic Assessment for the Toroparu Project, Cuyuni-Mazaruni Region, Guyana
pumped to the gland water tank then pumped to slurry pumping applications throughout the plant via an inline filter. Some of the gland water will be processed through a demineralization water treatment facility for use in the elution tank. Process raw water along with cyclone thickener overflow and water from the process plant cleaned through a process water treatment facility will report to a plant water tank for re-use throughout the plant. Water supplied and used in the various areas will be continuously monitored.
Three compressors will supply the required air for plant instruments, and three dedicated blowers will supply the flotation circuit.
| 17.7 | Conclusions |
The process plant design criteria and flowsheet are derived from extensive metallurgical testwork as described in Section 13. The design follows industry standard metallurgical practices to treat two primary gold bearing rock types, including the oxidized saprolite and other near surface oxidized material and deeper sulphide material. The plant will produce two doré products and a copper-gold flotation concentrate. The two oxide and sulphide mill feed types will be stockpiled and processed separately during designated campaigns.
The process plant is designed to treat a nominal 7.0 Mtpa of run of mine feed. The flowsheet includes crushing, grinding, an upfront gravity gold concentration circuit to produce doré, followed by a carbon in leach circuit to produce a second doré. For sulphide material, a flotation circuit will recover a copper-gold concentrate. Cyanide contained in the tailings from the gravity concentrate and intensive cyanidation circuits will be neutralized by dosing with a hydrogen peroxide solution before recirculation to the milling circuit, ensuring a safe operating environment. Cyanide present in the carbon in leach tailings stream will be treated in an SO2/air cyanide destruction circuit to meet the applicable environmental compliance standards before the treated tailings are pumped to the tailings management facility.
Mineralogical analysis of the copper concentrates from the Toroparu deposit identified the presence of deleterious elements such as bismuth, selenium, tellurium, and arsenic, which may result in smelter penalties.
The combined metallurgical recoveries for sulphide material are estimated at 93% for gold, 78% for silver, and 88% for copper, and for oxide material the combined recoveries are estimated at 97% for gold and 46% for silver.
Overall, the operation is designed to recover 93.6% of the gold, 77.0% of the silver, and 88.4% of the copper over the life of mine.
| 17.8 | Recommendations |
The following recommendations are made for future studies related to processing:
| · | Mineralogical and liberation studies |
| o | undertake detailed mineralogical and liberation studies on head samples to characterize mineral associations, grain size distribution, and liberation characteristics; and |
| o | undertake comprehensive chemical analysis of the head samples to determine the complete elemental composition, including potential deleterious elements and key assay values. |
| · | Comminution studies |
| o | undertake comminution and material characterization tests for oxide, sulphide, and composite materials, including bulk and solid densities, uniaxial compressive strength, Bond crushability (Impact) work index, JKTech Drop Weight Test, Bond abrasion index, Bond ball mill work index, and SAG mill test (Starkey); and |
| o | assess whether high saprolite blends in the mill feed could allow for elevated processing rates. |
| · | Gravity and intensive leach testwork |
| o | evaluate the mill feed performance in a Knelson gravity concentration circuit with intensive cyanidation of the gravity concentrate. Assess the effect of hydrogen peroxide doxing for cyanide destruction of the intensive leach residue across oxide, sulphide, and composite materials. |
| · | Flotation testwork |
| o | undertake flotation testwork to evaluate desulphurization of the mill feed, selective copper recovery to concentrate, and gold recovery to tailings; |
| o | confirm and optimize the reagent suit, including hydrated lime pH modifier, primary collector, secondary collector, frother, and gangue depressant; |
| Effective October 21, 2025 | Page |
NI 43-101 Technical Report Preliminary Economic Assessment for the Toroparu Project, Cuyuni-Mazaruni Region, Guyana
| o | complete the flotation testing in both open circuit and locked cycle modes for a four stage flotation configuration including rougher, regrind, cleaner, recleaner, and re-recleaner, in line with the proposed process flowsheet; and |
| o | conduct comparative assessments of flotation recovery versus primary grind size and regrind size. |
| · | Leaching testwork |
| o | undertake leaching studies including both bottle roll and tank leach tests to compare carbon in pulp and carbon in leach performance. Leach testwork should include leach gravity tailings on oxide only material, leach flotation tailings on sulphide only material, and leach flotation tailings on composite oxide and sulphide material; and |
| o | use key test parameters to monitor reagent consumption, oxygen consumption, adsorption kinetics, and leach performance versus grind size. The feasibility of cold cyanide stripping for copper removal from loaded carbon should be assessed. |
| · | Detoxification testwork |
| o | evaluate the INCO SO2/air cyanide detoxification process focussing on reagent and oxygen consumption, including lime, sodium metabisulphite, copper sulphate pentahydrate, and caustic soda. |
| · | Settling, flocculation, and underflow rheology testwork |
| o | evaluate colloidal stability to determine achievable underflow density, optimum flocculant dosage, and solids loading rates using a bench scale dynamic thickener; and |
| o | undertake static thickening and flocculant screening tests to determine flocculant type, optimum dosage, and feed solids concentration for maximum settling efficiency. |
| · | Water quality assessment |
| o | verify the quality and suitability of the Puruni River water as the primary process water source. Conduct full water analysis to determine its chemical composition, suspended solids content, and compatibility with process reagents and plant equipment. The results will inform process water treatment requirements and potential impacts on metallurgical performance. |
| · | Integration and laboratory requirements |
| o | conduct all testwork at a single accredited laboratory to ensure consistency and comparability of results; all testwork should yield comparative insights for oxide only, sulphide only, and composite oxide-sulphide operations. |
For energy and utilities, investigate opportunities for waste-heat recovery from the power plant for use within the process plant. Evaluate hybrid power integration options, including renewable resources such as photovoltaic systems or small scale hydroelectric facilities on nearby rivers. Assess the availability and suitability of alternative fuels in Guyana for use in the power generation plant.
New technology should be considered, including the adoption of energy efficient equipment, particularly high efficiency motors. Evaluate next generation communication systems, comparing satellite based solutions with conventional technologies.
| Effective October 21, 2025 | Page |
NI 43-101 Technical Report Preliminary Economic Assessment for the Toroparu Project, Cuyuni-Mazaruni Region, Guyana
| 18 | Project infrastructure |
| 18.1 | Introduction |
The Project site infrastructure will be organized into primary areas including the Toroparu and Sona Hill open pits and processing plant with supporting services, the tailings management facilities, and the site-wide infrastructure including access roads, tailings pipeline, airstrip, and camp area.
The terrain presents challenges associated with low lying riverine areas and expansive flat regions between hills. During periods of heavy rainfall, these areas are at an increased risk of inundation, requiring protective measures to prevent flooding of the open pits. Land reclamation and water management strategies have been incorporated into the Project design to optimize land use and maintain safe operating conditions. These measures include planned river diversions and drainage control systems to protect the open pits from potential flooding, thereby supporting operational stability and environmental protection.
Off-site infrastructure will also be required including access and logistical infrastructure located outside of the mining titles.
A plan of the Project infrastructure is shown in Figure 18-1 (Source: Aris Mining 2025).
Figure 18-1 Project infrastructure plan

| 18.2 | Site access |
Two security access points are planned. The first access point will be located on the main access road to site, adjacent to the side of the relocated airstrip, and will feature a truck parking and staging area and a security and logistics offices for deliveries to the site. All travel and transport of goods by air freight and all visiting contractors or personnel will report to this security point before entering the site. An aircraft hanger will provide temporary storage for freight and for emergency overnight harbour for the plane. The second access point will be located at the processing plant and will act as the separation
| Effective October 21, 2025 | Page |
NI 43-101 Technical Report Preliminary Economic Assessment for the Toroparu Project, Cuyuni-Mazaruni Region, Guyana
between low and high security areas. This location features a security office as well as a change house where all personnel will gain access to the high security and mining area.
The current airstrip is located within the footprint of the Toroparu main pit and will be relocated to an appropriate site. It will serve as a key logistics hub for the transport of personnel and goods to and from the Project. The planned 1,750 m long airstrip will be constructed to meet international standards and will accommodate larger aircraft. The runway will be aligned parallel to the prevailing southeast wind direction, and will be enclosed within a 70 m boundary zone on both sides along the runway’s centreline, to restrict the height of structures within this area. The total width of the runway will be 60 m of clear space, ensuring compliance with safety and operational standards.
| 18.3 | Accommodation camp and site buildings |
An accommodation camp is planned to house a total of 1,200 personnel and is divided into two main unit types, including double units with ensuite bathroom suitable for general staff and single units with ensuite bathrooms intended for mid-management personnel, consultants, and visitors. The double units can accommodate 1,008 persons and can be changed to single accommodation post construction activities and will then provide accommodation for a total of 504 persons. The single units can accommodate 216 persons, bringing the total accommodation post construction to 720 persons. The single units are self catering and include a dining/living area, kitchen, and attached carport for vehicle parking.
Additional buildings at the camp are planned, including an administration block, laundry services, and recreational amenities. These amenities include a soccer field, games room, and multi-purpose sports courts. Access to the camp is from the airfield and allows for visitors to first obtain security clearance and access prior to proceeding to the camp.
| 18.4 | Mine support facilities |
A pre-engineered, steel framed mining workshop with multiple bays for mining fleet and other mobile equipment repair will be constructed adjacent to an administration building and a fenced outdoor laydown area for equipment and bulk supplies. It will be equipped with an overhead crane capable of servicing the larger haul trucks. It will also accommodate repair and maintenance equipment, a machine shop, a tire servicing area, and dedicated repair workspaces. The mine warehouse, electrical room, and air compressor room will be housed in an adjacent building connected to the workshop. A truck wash bay equipped with a washing system and a water/oil separator for heavy mining equipment will be constructed outdoors.
A pre-engineered, steel framed assay laboratory will be located adjacent to the main processing facilities and will house sample preparation, assaying, and testing facilities, as well as supporting sample and chemical storage rooms.
A dedicated core shack will be located near the laboratory for handling, logging, and temporary storage of drill core samples prior to their transfer to the assay laboratory. It will accommodate the full range of core processing activities, including reception, detailed logging, photography, and physical preparation.
The vehicle fuelling facility will be located at the entrance to the processing plant adjacent to the main haul road access to the open pits. The facility has been designed to accommodate both light and heavy vehicles and will include eight 125,000 litre diesel tanks providing approximately seven days of supply for mobile equipment operations and one 16,000 litre capacity gasoline tank to provide fuel for light vehicles. The facility will be operated by an independent fuel distributor in compliance with Guyanese and international standards.
The explosive storage facility designed to separate bulk emulsion, blasting materials, and detonators will support all blasting activities and will accommodate bulk emulsion storage and the mixing and loading of explosives into delivery trucks for direct transport to blast sites. The modular facility will be located along the tailings management facility access road approximately 400 m south of the Puruni River and will be accessible via the site road network and can be relocated as required during the life of mine. The route to the facility will experience minimal traffic following construction. The site is located more than 1 km from critical infrastructure and personnel facilities, ensuring safety and security. A perimeter security fence with lighting will enclose the site to ensure safety and controlled access. The facility including the explosives magazine will be constructed and operated in accordance with Guyanese regulations.
Ligh emitting diode (LED) lighting will be installed for all building interiors, high mast area lighting, and pit floodlighting. The high mast area lighting will be mounted on concrete plinths while the pit floodlights will be mounted on towable skids for repositioning as the pit develops.
| Effective October 21, 2025 | Page |
NI 43-101 Technical Report Preliminary Economic Assessment for the Toroparu Project, Cuyuni-Mazaruni Region, Guyana
| 18.5 | Process support facilities |
A primary terrace is planned to support the processing plant infrastructure and is located on relatively level ground in close proximity to the Toroparu pits to minimize haulage distances and to minimize the required construction fill. A 500 m offset from the open pits is planned to protect infrastructure and personnel during blasting at the open pits. The strategic placement offers enhanced access, security, and personnel movement and facilitates the easy supply of utilities such as the water and power to support both production operations and overall site efficiency.
The process support facilities include the power plant and all required support infrastructure Including stores, workshops, fuel station, medical services, and administration blocks. A helipad located close to the medical facility is also planned to facilitate the rapid medical evacuation of any injured personnel and can also double as emergency gold transport.
| 18.6 | Tailings management facilities |
| 18.6.1 | Site description |
The tailings management facility is advantageously located relatively close to the processing plant within a natural valley, bounded by steep hills on the north, east, and west sides, requiring the construction of an embankment only along the southern perimeter, simplifying the engineering design and reducing both construction complexity and material requirements. The general topography slopes southward and the design takes advantage of this natural gradient with most of the drainage and conveyance infrastructure operating under gravity to direct flow to the southern side of the facility. The site is located outside of the one in one thousand year flood line and therefore mitigates the risk of flooding and ensures long term operational resilience.
| 18.6.2 | Site investigations and engineering analyses |
The site selection is supported by existing geotechnical investigations conducted by Klohn Crippen Berger in 2012, and preliminary findings indicate favourable foundation conditions. No critical flaws have been identified.
Four test pits and three boreholes drilled across the facility show that the site is underlain by topsoil ranging in thickness from 0 to 0.2 m, then 0.2 m of alluvial/colluvial deposits of transported sand, then 0.2 to 1.5 m of laterite comprised of medium plastic silts and clays, then 1.5 to 13.5 m of saprolite comprised of soft to firm sandy silts or clays and with increasing sand content with depth, then 13.5 to 15.0 m of transition zone comprised of heavily weathered rock clasts embedded in silty clay or sandy silt, and finally bedrock comprised of granodiorite, metamorphosed pyroclastic/volcanic flow rock, diabase, and andesite. Groundwater seepage was encountered across the site from depths between 0.9 to 9.5 m.
Other testing included in-situ tests such as Vane Shear testing and hydraulic conductivity testing as well as laboratory testing in the form of basic soil index tests, direct shear, foundation indicator, and specific gravity.
No site-specific probabilistic seismic hazard assessment has yet been conducted, but the site is located in a low-seismic activity area. Based on available maps, peak horizontal ground accelerations at the site are estimated to be less than 0.1 g at a return period of one in 10,000 years. For the preparation of the pseudo-static models, a conservative value of 0.1 g was assumed.
A breach analysis was conducted to assess any downstream impacts on the Puruni River located to the north and east of the facility.
A two dimension limit equilibrium slope stability analysis was conducted to evaluate the resistance of the tailings facility and the return water dam to potential slope and foundation failure. This analysis considered various loading conditions, including long-term drained, pseudo-static (earthquake), and residual shear strength scenarios. The findings indicate that the design satisfies the required safety factor for all loading conditions, leading to the conclusion that the proposed designs have sufficient resistance to slope failure.
| 18.6.3 | Design |
The design aligns with the Global Industry Standard on Tailings Management, the Canadian Dam Association guidelines, and the requirements of the environmental permits.
| Effective October 21, 2025 | Page |
NI 43-101 Technical Report Preliminary Economic Assessment for the Toroparu Project, Cuyuni-Mazaruni Region, Guyana
The design was developed to a Class 5 level of accuracy as defined by the recommendations of the Association for the Advancement of Cost Engineering, which is considered appropriate for the PEA level study.
The design is inherently conservative and is based on maximum mining rates of 7.0 Mt per annum. The design is for a spigot deposition, downstream constructed, conventional thickened tailings management facility. The required capacity is 154 Mt over a 21.3 year mine life, but the design allows for a conservative total of 161.4 Mt over a 23 year period with a final embankment height of approximately 39 m.
The saprolite in the area of the planned facility basin, which averages approximately 10 m thick, has a low permeability and will serve as a natural barrier. It is envisaged that saprolite material will be used above the upstream face of the embankment to prevent seepage through the embankment, thereby protecting the structural integrity. The design also includes a comprehensive basin drainage system and stormwater management structures to effectively separate contact and non-contact water.
A return water dam will be built to collect and store water released from the tailings facility, providing a controlled pond for recycling water back to the process plant. It will be located to the southeast of the tailings facility within a natural valley, bounded by hills on its eastern and western sides, with the general topography sloping southward. It will be lined with a 1.5 mm thick HDPE liner to prevent seepage and groundwater contamination.
A service road will provide operational access around both the facility and the return water dam.
| 18.6.4 | Construction and tailings placement |
The tailings facility embankment will be developed in three sequential stages to optimize construction cost. The initial stage provides for 17.6 Mt of capacity representing around 2.5 years of tailings storage with two subsequent raises to contain an additional 35.8 and 108 Mt. The construction period for the first stage will be 12 months, after which deposition will begin. The construction period of the second stage will be 18 months and the third stage will be 50.5 months. The downstream containment embankment and the return water dam embankments will be constructed using overburden rock sourced from the facility basin, selected rockfill, gravel, and crusher dust.
Tailings thickened to a solids content of 50% will be pumped from a central feed tank, located downstream of the thickener, to the facility via a slurry delivery pipeline. A ring main will be installed around the facility perimeter, and the tailings will be deposited into the facility through open ended spigots.
| 18.6.5 | Tailings geochemical characterization |
Geochemical characterization studies were conducted by Klohn Crippen Berger in 2017. The tailings samples exhibited negligible to low sulfide-sulphur concentrations and were classified as non potentially acid generating. The saprolite tailings contained minimal to no reactive carbonate minerals, indicating that the observed neutralization potential is primarily attributable to lime additions during metallurgical batch processing. The results from laboratory humidity cell tests and subaqueous column tests were consistent with the static test findings. The kinetic test data further support the findings that the saprolite tailings are capable of maintaining a close to neutral leachate pH over time.
The predicted effluent quality results indicate a limited number of low-significance exceedances for arsenic in both magnitude and duration relative to the International Finance Corporation Environmental, Health and Safety Guidelines for Mining, but the differences are more pronounced compared to the Project background surface water quality. Relative to background surface water, predicted concentrations of arsenic, fluoride, molybdenum, selenium, sulphate, and zinc were up to an order of magnitude higher. While these findings suggest potential water quality impacts, a more detailed evaluation of environmental significance is required for future study stages to appropriately inform the water treatment plans.
| 18.6.6 | Water management |
The water balance demonstrates that the proposed contact water management system, including the pool, return water dam, pump sump, and transfers, is sized to appropriately manage inflows within operating bands without exceeding the full supply level, provided the assumed treatment and pumping capacities are maintained.
A cut-off drain will be installed along the northern, eastern, and western perimeters of the site. Upstream groundwater collected in the cut-off drain will be conveyed and discharged into the clean water channels and outlet structures.
| Effective October 21, 2025 | Page |
NI 43-101 Technical Report Preliminary Economic Assessment for the Toroparu Project, Cuyuni-Mazaruni Region, Guyana
A network of drains will be installed throughout the tailings facility basin area. The drainage alignments follow the natural topography and meander within existing valleys. The drains will assist in controlling the phreatic zone within the tailings facility. The stage 1 and 2 drains will collect seepage water from the tailings mass, from where it will be conveyed and discharged into the contact water channel draining into the return water dam. The stage 3 drains will convey water to the sump from where it will be pumped to the return water dam.
A floating pontoon system will pump supernatant water from the pool area into the return water dam. The tailings delivery system will operate in parallel with the return water system, in the opposite direction, with tailings conveyed from the processing plant to the tailings facility while the reclaimed supernatant water will be returned from the return water dam to the plant for make-up water. The return water dam levels will be optimized for storage and operational flexibility, and will be as empty as practically possible under normal conditions to provide sufficient surge capacity for accommodating a simulated one in 5,000 year storm event. On average, the return water dam will maintain a storage volume of approximately 20% of its total capacity to mitigate the risk of overflow.
Surface storm water management infrastructure will be designed, managed, and operated. Contact and non-contact water will be separated into dedicated water systems. Clean water diversion berms and channels will be installed along the tailings facility perimeter to accommodate the one in 100 year peak flow and safely divert non-contact run off to the natural watercourses. The contact water channels will lead to the sump and return water dam. A water treatment plant will treat excess water prior to being returned to the processing plant.
| 18.6.7 | Monitoring |
Standpipes will be installed initially in situ, in the embankment, and the formed beach to provide early monitoring of pore water pressures. Once the facility reaches a sufficient height, vibrating wire piezometers will be installed within the basin and embankments along monitoring lines to monitor phreatic surface activity and contribute to slope stability assessments. Continuous flow measurements will be conducted at all outlet drains to assess the effectiveness of phreatic zone drawdown within the facility. Flow meters will be installed on the decant system for continuous flow measurement. This ongoing monitoring will provide valuable data to evaluate overall facility performance against historical trends and facilitate proactive management of water pressures and slope stability.
ETK will appoint an engineer of record to undertake quarterly and annual inspections and reporting of the dam status. ETK will submit all monthly monitoring data to the engineer of record for review and comment.
| 18.6.8 | Closure and reclamation |
The tailings facility closure design will be aligned with recent, government approved projects in Guyana, and will include limited basin interventions and the construction of a spillway capable of conveying the regional maximum flood consisting of rock-lined channels terminating in a stilling basin at the downstream end. This basin will safely discharge flows. In its final configuration, the spillway will be located to the east of the stage 3 embankment.
Physical stability measures will be undertaken including final crest geometry and slope regrading to target long term factors of safety, buttressing or recontouring the embankment slopes if required. Water management will include surface water diversion channels around the facility to reduce inflows, a water treatment strategy for collected seepage, and a closure water balance. Monitoring and scheduled maintenance will be undertaken including the use of piezometers, inclinometers, survey monuments, seepage flow meters, and visual inspections of vegetation and erosion. Maintenance will include spillway clearing and drainage upkeep. Water quality monitoring of surface and groundwater will be undertaken to ensure compliance with the closure plan
The closure plan outlines closure objectives and design components to ensure long term physical and chemical stability, minimize seepage, protect downstream receptors, and support future sustainable land uses, aligned with regulatory and stakeholder commitments. The closure design criteria will be reassessed during the operation of the facility to improve geotechnical and hydrological criteria to ensure facility stability and to reduce the risk of failure over the extended closure period.
The closure and reclamation plan developed for the facility will likely include:
| · | a general description of the facility including deposition plans, construction techniques, and operational history; |
| Effective October 21, 2025 | Page |
NI 43-101 Technical Report Preliminary Economic Assessment for the Toroparu Project, Cuyuni-Mazaruni Region, Guyana
| · | assessment of the status of the structure and contained tailings; |
| · | evaluation of the current landform with final storage geometry and closure design; |
| · | survey plans showing past and future earthworks; |
| · | assessment of the embankment condition considering long term weathering effects and drainage performance; |
| · | analysis of the long term water balance and climate change considerations; |
| · | water management plans including seepage collection, surface water management, and treatment design; |
| · | flood management strategies and containment plans for design flood events; |
| · | identification and properties of materials used for decommissioning, closure, and reclamation; |
| · | proposed surface drainage works, including engineering design and maintenance needs; |
| · | risk management of extreme events such as droughts, floods, fires, and earthquakes; |
| · | closure and reclamation strategy addressing rainfall retention, cover types, and revegetation; |
| · | surface treatments to minimize erosion, sustain vegetation, and support rehabilitation; |
| · | monitoring and audit requirements for closure and post-closure phases; |
| · | achieve stable landform resistant to erosion and seismic loading; |
| · | minimize long term seepage impacts to groundwater and surface water; |
| · | reduce the risk of overtopping through permanent water management infrastructure; |
| · | establish sustainable vegetation cover compatible with regional land use; and |
| · | provide for long term monitoring and maintenance with financial assurance. |
| 18.7 | Waste rock management facilities |
Two waste rock management facilities will be constructed for the Toroparu pits, including an 86.8 Mt capacity low grade mineralized waste rock management facility containing material between 0.30 to 0.45 g/t gold and a 591.4 Mt capacity waste rock management facility containing material less than 0.30 g/t of gold. The waste rock storage facility is located just to the northeast of the three Toroparu pits and the low grade storage facility is located to the west of the Toroparu northwest pit.
A single 41.7 Mt capacity facility will be constructed for the Sona Hill pit to contain all material that is less than 0.45 g/t of gold, located to the east of the Sona Hill open pit.
The facility locations were selected to minimize haulage distances and to accommodate infrastructure and surface water management. The facilities at the Toroparu pits also provide protection against extreme flood events.
The facilities were designed for long term stability and rehabilitation, with overall slopes of 21 to 23° to account for high rainfall conditions. Vertical expansion will be limited through controlled lift heights. The maximum height of the low grade facility is 68 m, 89 m at the Toroparu waste rock facility, and 70 m at the Sona Hill waste rock facility. The facilities have been designed to accommodate more material than is present in the current mine plan, at 20% additional capacity for the low grade facility, 9% for the Toroparu waste rock facility, and 5% for the Sona Hill waste rock facility.
| 18.8 | Stormwater management |
The Project’s stormwater management is divided into two main sections including the processing plant stormwater and general site stormwater.
Processing plant stormwater will be collected through surface inlets and directed to catchment dams located south of the processing plant. The final size and location of these dams should be determined in the next Project study phase.
Non-contact water runoff will be diverted via cut-off drains to the Puruni River to prevent contamination and effectively manage water flow.
General site stormwater management involves handling runoff from the Puruni and Wynamu rivers. The Wynamu River will be diverted using strategically placed berms and drainage ditches.
| 18.9 | Utilities |
The Puruni River will serve as the primary source of water, and will have a pontoon pump installed in the river to supply
| Effective October 21, 2025 | Page |
NI 43-101 Technical Report Preliminary Economic Assessment for the Toroparu Project, Cuyuni-Mazaruni Region, Guyana
water to the processing plant. The operation is expected to be water-positive, as water will be reclaimed from various plant processes to reduce overall water consumption.
A water treatment facility will be located near the edge of the main processing plant terrace. A raw water dam will be constructed in this area to store intake water. After treatment, the water will be released back into the Puruni River as required, in compliance with the environmental permit.
All sewage will be collected via buried sewer pipes and conveyed by gravity to a dedicated pump station. A modular sewage treatment facility will be installed on site to treat and safely dispose of the solid waste in an approved location. Treated clean water will be recirculated back to the water treatment plant, where it will be used for process activities or discharged to the river after meeting environmental standards.
The estimated power requirements for the process plant are approximately 50 MW, which will be supplied by a 50 MVA, 13.8 kV onsite heavy fuel oil power plant. The plant will consist of six generator sets rated at 9.28 MW, configured to provide an operational capacity of 46MW and an installed capacity of 55 MW, including one standby unit. The generating sets will comprise a four-stroke, V-type, 16 cylinder, turbocharged, and intercooled diesel engine capable of operating on heavy fuel oil, marine diesel oil, or light fuel oil.
The power plant complex will include an engine hall to house the engines and generators; a fuel treatment building containing the purifiers, heaters, and fuel pumps; a control room for centralized monitoring and controlling of all plant systems; workshops and stores for maintenance, overhauls, and spare parts management; and a substation building to house the main switchboard, generator synchronization and protection equipment, and power distribution to the plant main substation.
The fuel system will manage the unloading, storage, treatment, and delivery of heavy fuel oil transported by road from Georgetown to the Project. Deliveries will be made using four daily 50,000 litre (50 cubic metre) capacity fuel tankers to sustain continuous operations at full load. The power plant’s average fuel consumption will be approximately 196 cubic metres per day. The site fuel storage system will consist of two main heavy fuel oil storage tanks, each with a 2,200 cubic metre capacity, providing approximately three weeks supply of full load operation.
Power will be distributed by overhead power line to the primary crushing area, tailings facility, as well as the open pit mine, accommodation area, and the main access gate.
| 18.10 | On site roads |
On site roads will include pit access and haul roads for all four pits. The roads are designed to be 25 m wide with a 3% cross slope. They will feature shoulders and drainage ditches on both sides to facilitate stormwater management with the drainage systems connected to cut-off drains that lead to natural water courses.
An access road to the tailings management facility will originate from the airstrip. The road will be 10 m wide with a 3% cross slope and will include drainage ditches on both sides. It will function as the main conduit for piping to the tailings facility and will carry overhead power lines supplying power to the site infrastructure.
| 18.11 | Off site logistics |
Offsite infrastructure includes the Project access road and the use of port access near Itaballi, from where all goods will be transported via road freight to the Project.
The primary access route to the Project begins at Camp 4 and extends to the Project. This road is approximately 30 km long and in good condition, and will be upgraded by widening to approximately 10 m wide to allow for dual lanes to accommodate increased traffic. Road construction activities will be scheduled as part of routine road maintenance, utilizing waste rock material as it becomes available during construction. It is anticipated that the maintenance and widening process will be ongoing throughout the life of the mine.
From Camp 4, the main road continues to Georgetown via the Puruni Road. The section from Itaballi to Puruni has been largely rehabilitated with regular maintenance ongoing to ensure reliability. The remaining segment from Puruni to Toroparu, a distance of approximately 105 km, has been largely rehabilitated but heavy rainfall affects the road’s drivability.
| Effective October 21, 2025 | Page |
NI 43-101 Technical Report Preliminary Economic Assessment for the Toroparu Project, Cuyuni-Mazaruni Region, Guyana
The road will continue to be maintained during the mine’s operational life. Waste rock from the site can be used to reinforce weak zones and improve drainage, ensuring sustained access for the timely delivery of resources to the processing plant and to support ongoing operations. Alternatively, closer borrow pits should be identified in following studies to significantly reduce the cost of material transport.
Studies on offsite logistics for the transportation of concentrates from the Project were completed in 2013 and 2022. The proposed port facilities are located near Itaballi at a location on the south bank of the Cuyuni River, approximately 3.2 km upstream of the confluence with the Mazaruni River known as Pine Tree. The Pine Tree Landing port operation is planned to support the mine construction and operation, specifically for the transportation of equipment, materials, and supplies. The port will also function as a transhipment for import and export goods. Supplies will be delivered by barge from Georgetown Harbour to a newly constructed port/wharf at Pine Tree for storage and subsequent road transportation to the Project by truck. Trucks from the Project will return with copper concentrate to the Pine Tree Landing for storage and for both roll on, roll off and crane loading on barges destined for Georgetown.
The proposed port facility will include wharf loading and discharge areas, forklifts, reach stackers, cranes, logistics, truck maintenance, accommodation buildings, container and equipment laydown areas, third party fuel storage and fuelling facilities, and power generation and related utilities. The port facility will accommodate ocean going barges to transfer cargo between Georgetown and Pine Tree Landing via the Essequibo, Mazaruni, and Cuyuni rivers.
The potential exists to engage in strategic conversations with G Mining Ventures to share in capital and operating costs at their planned dedicated wharf and storage facility and associated barging systems serving their Oko West project.
The assumptions used for the economic analysis in this technical report are based on 70 units of 20 foot, 20 t capacity containers imported and exported per week from the Project to Georgetown and from Georgetown to Miami.
| 18.12 | Recommendations |
The following work and studies are recommended to advance to a preliminary feasibility study:
| · | Surface infrastructure |
| o | undertake further investigations into the local regulations for the airstrip to assess whether the airstrip width could be reduced, which would lower bulk fill material requirements and costs; |
| o | investigate whether a more economical route located closer to the tailings management facility is available for the tailings access road, which would lower material requirements and costs; |
| o | conduct test pits and rotary core drilling on the road centrelines and 30 m on either side of the roads at intervals no more than 200 m to obtain more detailed geotechnical information; |
| o | conduct oriented diamond drillholes oriented perpendicular to the horizontal alignment of the roads, typically extending at least 5 m below the roadway elevation, to characterize the soil and rock mass properties for the deep cutting designs of the road. Determine the rock mass properties using downhole geophysics such as an acoustic televiewer; |
| o | conduct laboratory testwork on soil and rock samples collected from the pits and drill core. For soil samples, the testwork should include particle size distribution, Atterberg Limits, specific gravity, moisture-density, California Bearing Ratio, oedometer, and triaxial isotropically consolidated, drained, and undrained tests. For rock samples, the testwork should include unconfined compression method tests and triaxial compressive strength; |
| o | undertake a similar testing scope for all terrace locations where heavily loaded structures will be constructed, as well as for those with planned deep cuts and high fill slopes. The geotechnical properties of all materials in cut slopes, as well as those planned for use as engineered fill, should be determined using the recommended soil laboratory testing scope; and |
| o | undertake material testing on in situ rock for suitability in the use of concrete as fine and coarse aggregate. Fine aggregate testwork should include particle size distribution, dust content, and fineness modulus while coarse aggregate testwork should include particle size distribution, dust content, fineness modulus, 10% fines aggregate crushing test, aggregate crushing value, flakiness index, chloride content, organic impurities, and soluble deleterious materials. |
The cost to complete this testwork is estimated at $1 million.
| Effective October 21, 2025 | Page |
NI 43-101 Technical Report Preliminary Economic Assessment for the Toroparu Project, Cuyuni-Mazaruni Region, Guyana
| · | Tailings management facility |
| o | develop an interdisciplinary knowledge base; |
| o | undertake site characterization including climate, geomorphology, hydrology, and hydrogeology; |
| o | undertake geotechnical site investigations including desktop assessments benchmarked against similar projects, geophysical studies, and seismic hazard assessment to confirm the embankment founding conditions, and the geotechnical character of the embankment zones, facility basin, return water dam, and centrelines of the channels and access roads; |
| o | undertake tailings characterization studies such as particle size distribution, foundation indicators, specific gravity, drained and undrained strength behaviour, geochemical properties, and rheology; |
| o | undertake a tailings dam breach assessment incorporating credible failure modes and with contour data that represent the natural ground level of the areas that were inundated in the analysis and slightly beyond, as well as the site specific rheological data; |
| o | undertake confidence classification in accordance with regulatory and industry standards; |
| o | design the tailings management facility based on the determined consequence classification; |
| o | update the design basis report, including a failure modes and effects analysis; |
| o | undertake stability assessments, including seepage analysis and 2D limit equilibrium analysis using available site specific data; |
| o | develop a dynamic site wide water balance to optimize the water management infrastructure and water treatment plant sizing; |
| o | develop a conceptual closure design for the facility; |
| o | further optimize the facility footprint and stage development; |
| o | undertake a water quality chemical mass balance study for the facility effluent considering the water quality of supernatant within the tailings stormwater run off, baseline water quality in the area, and allowable water quality for release; |
| o | conduct a detailed surface topographical survey of the Project site; |
| o | perform a waste classification and geochemical assessment; |
| o | undertake design reviews and optimization of the barrier systems, drainage systems, channel designs, and return water dam barrier systems to assess potentials for cost and construction time savings; |
| o | develop and plan the decant system; |
| o | identify and confirm borrow areas for sourcing suitable construction materials; |
| o | investigate the raising of the stage 2 footprint for the full life of mine to reduce the facility footprint and construction costs; |
| o | assess the barrier system requirements on the basis of the geochemical and water quality chemical mass balance; and |
| o | assess whether the capital and operating costs can be reduced by considering the rheology and adjusting the water balance. |
The cost to complete this testwork is estimated at $1.5 million.
| Effective October 21, 2025 | Page |
NI 43-101 Technical Report Preliminary Economic Assessment for the Toroparu Project, Cuyuni-Mazaruni Region, Guyana
| 19 | Market studies and contracts |
| 19.1 | Market studies |
Current indicative commercial terms for the type of precious metals rich copper concentrates that will be produced at the Project were obtained from market participants and metal traders. The terms received from the various parties were broadly consistent with each other. Sensitivity analysis indicates that using any set of sales terms results in only minimal impacts to the economic analysis of the Project. For the purpose of the analysis, the final commercial terms were selected from the market participant that was considered to be the most relevant to the Project’s technical requirements.
The gold and silver contained in the doré produced at the Project are expected to be sold to international refineries under standard sales agreements. There are numerous refineries capable of processing doré, resulting in a highly competitive market that is expected to provide favourable refining terms and logistics options for the Project.
Gold and silver are freely traded commodities with a broad and diverse global market.
| 19.1.1 | Indicative commercial terms for the copper concentrates |
The copper concentrates are expected to have a grade of approximately 20% copper, which is slightly below the typical copper content of global traded seaborne concentrates (approximately 22 to 30% Cu). The concentrate is also expected to have a gold grade of approximately 112 g/t and a silver grade of approximately 154 g/t. These grades are considered commercially acceptable for marketing as a gold-bearing concentrate, particularly Chinese smelters, which have strong demand for precious metals rich copper concentrates.
Analyses of representative concentrate samples indicate the presence of deleterious elements, including bismuth (380–631 g/t), selenium (500–770 g/t), and tellurium (292–396 g/t), while arsenic levels were found to be near typical penalty thresholds. Further metallurgical test work and concentrate marketing assessments are planned to better define potential smelter penalties and establish suitable blending or processing strategies.
The marketing terms assumed for the economic analysis are:
| · | Gold – payability of 96.0%; refining charges estimated at $8.00 per ounce. |
| · | Copper – payability of 96.5%, with a minimum deduction of 1.1% Cu; refining charges estimated at $0.05 per pound. |
| · | Silver – payability of 93.0%; refining charges estimated at $1.0 per ounce. |
The overall treatment charge is estimated at $50 per dry tonne of concentrate.
| 19.2 | Contracts |
No material contracts required for the development of the Project are currently in place or under negotiation. It is expected that Aris Mining will negotiate and enter into contracts in the normal course that would be typical of a mining project similar to the Project, including contracts for specialized workers, consumables, engineering and design, and refining and transportation.
| 19.3 | Review and confirmation by the qualified person |
The qualified person responsible for this section of this technical report has reviewed the indicative commercial terms provided in this section and confirms that the results support the assumptions in this technical report.
| Effective October 21, 2025 | Page |
NI 43-101 Technical Report Preliminary Economic Assessment for the Toroparu Project, Cuyuni-Mazaruni Region, Guyana
| 20 | Environmental studies, permitting, and social or community impact |
| 20.1 | Environmental setting, studies, and issues |
| 20.1.1 | Environmental setting |
The Project is located near the equator with year round high temperatures and humidity and seasonal tropical weather and climate. Site conditions are wet as a result of high humidity and significant bimodal annual rainfall ranging from 2,000 to 3,500 mm.
The topography is flat to gently undulating to hilly, with elevations ranging from 80 to 170 m above sea level at the Toroparu deposit and from 80 to 135 m above sea level at the Sona Hill deposit. In places there are hills with steep relief. The Project is located in an area of low seismic activity.
The majority of the Project is covered by secondary growth dense tropical forest and low lying swamps. Four types of terrestrial ecosystems are represented at the Project, including mixed forests, liana forest, high hills, and low swamp forest. The area is considered to have a low species diversity relative to tropical rainforests with a total of 55 plant species comprised of 38 timber tree species and 17 plant species.
A total of 19 mammal species have been identified at the Project, the majority of which are fairly common in Guyana. A total of 52 fish species have been identified, none of which are endemic to Guyana, but several have economic and social values as important food sources. No endangered avifauna were identified. The jaguar, lesser seed finch, lowland tapir, red and green macaw, black headed parrot, and the blue headed parrot were identified and have a special classification by the Convention on International Trade in Endangered Species of Wild Fauna and Florida and the International Union for Conservation of Nature, however, there are no known, locally rare, critically endangered, or endangered species at the Project.
The Project is located between the Mazaruni River, 30 km to the south, and the Cuyuni River, about 40 km to the north, which are major tributaries of the Essequibo River that flows north to the Atlantic Ocean. In the immediate Project area, the main rivers are the Puruni River and the Wynamu River. The Puruni River flows southeast from its upper reaches near the Project site and the Wynamu River flows south to the confluence with the Puruni River, immediately south of the Project. The confluence of the two rivers has been disturbed by historical and present day artisanal mining which has blocked the natural course of the Wynamu River. Flooded areas occur in low lying areas of the Project site and where artisanal mining is present.
Given the remote location of the Project, there are no significant sources of fixed or mobile atmospheric emissions. Aerial emissions are mostly attributable to gases from rotting trees and other vegetation. Due to the high humidity and significant rainfall, dust levels on the roadways are generally low. Airborne discharges and particulate matter are not expected to exceed emission guidance established by the World Bank or WHO Ambient Air Quality guidelines.
| 20.1.2 | Environmental studies |
An ESIA was prepared in 2012 and an updated Environmental Management Plan (EMP) was prepared in 2021 as part of the Guyana Environmental Protection Agency (EPA) environmental permitting process for the Project.
Initial environmental baseline studies to support the development of the 2012 ESIA were conducted during wet and dry seasons in 2007, 2008, and 2010 that included characterization of the site and regional vegetation, wildlife, biodiversity, rare and threatened species, topsoil, geology, surface water, groundwater, water quality, groundwater pit inflows modelling, geochemical characterization studies, historic cultural properties, climate, air quality, odor, noise, and dust, and meteorological conditions.
Expanded environmental and social baseline studies were conducted in 2020 to 2021 by Ground Structures Engineering Consultants to support an application for an environmental authorization variance. An updated biodiversity baseline survey was conducted by the University of Guyana during the wet season of mid 2022 and the dry season of late 2022 to record
| Effective October 21, 2025 | Page |
NI 43-101 Technical Report Preliminary Economic Assessment for the Toroparu Project, Cuyuni-Mazaruni Region, Guyana
environmental conditions and seasonal variability. No critically endangered or endangered faunal species were recorded during the surveys.
| 20.1.3 | Environmental issues |
The most significant environmental issue within the Project area relates to the disturbance caused by historic and ongoing illegal artisanal and small scale mining activities within the Project site. These activities have altered portions of the Wynamu and Puruni river channels and banks within the Project site. Abandoned artisanal mining pits containing stagnant water have created conditions conducive to the proliferation of malaria carrying mosquitoes. Baseline soil chemistry assessments completed in 2022 on historical artisanal tailings at the Project area identified elevated mercury concentrations.
Illegal artisanal and small scale miners gain access to the Project area either via unauthorized footpaths through the surrounding forests or through the Project’s main gate by misrepresenting themselves as members of groups holding legitimate mining claims adjacent to the Property. The Project works closely with the Guyana Environmental Protection Agency (EPA) and the GGMC to address illegal mining within the Project titles by regulating access, conducting regular security patrols, monitoring and documenting all unauthorized mining activities and associated environmental impacts, and submitting monthly reports to both the Guyana EPA and the GGMC. However, the Project does not have the legal authority to remove illegal artisanal miners or their equipment; this authority resides exclusively with the GGMC, the Guyana Police Force, and the Guyana EPA. Enforcement actions by these agencies occur intermittently and typically only provide a short term deterrence, as illegal miners often return to the area following the conclusion of such exercises.
| 20.1.4 | Environmental management approach |
The Project will establish and maintain documented, comprehensive environmental and social management plans over the construction, operation, and closure phases of the Project based on international standards. Each of the plans will have a monitoring component and an adaptive management process to evaluate the plan effectiveness and inform plan updates as required, and reporting requirements to regulators, communities in the indirect area of influence, and other stakeholders.
| 20.2 | Social setting and community requirements |
| 20.2.1 | Social setting |
Guyana is divided into ten administrative regions. The Project is located in Region 7, the second largest in Guyana, which is administered by a Regional Democratic Council based in the town of Bartica. Region 7 is further divided into three sub-districts including the Upper, Middle, and Lower Mazaruni. The Project straddles both the middle and lower Mazaruni sub-districts. The population of Region 7 is estimated at 20,500 persons with a mixed population comprising Guyanese, and Brazilian and Venezuelan migrants in search of economic opportunities. Amerindians account for approximately 37% of the inhabitants of the region. Most of the persons residing in Region 7 are involved in mining. Some communities engage in planting cash crops, fishing, hunting, and poultry rearing.
There are no formal or established communities or settlements within or in the immediate vicinity of the Project area and no established communities in proximity to the associated Project components, and accordingly there are no resettlement obligations. Mercury levels were not above detectable levels in soil, sediment, or water samples from the Project, which supports the interpretation that the areas has not been subject to extensive historical mining activity. No remnants of historical mining activity are present other than the existing former open pit mine. There are no known historical buildings, former settlement sites, or cultural heritage features within the Project area.
| 20.2.2 | Community engagement |
ETK maintains good corporate social engagement with all relevant stakeholders as part of its ongoing resource development program to communicate the Project development progress and to address matters of concern. ETK continues to actively consult and engage with artisanal miners who enter the Project titles to discourage the influx of settlers within the site. The current social management plan involves ETK working with stakeholders and the communities to develop an open and continuous consultation process with the following objectives:
| · | to maintain dialogue with the communities in proximity of the access roads to understand their expectations and create strategies to generate local employment; |
| Effective October 21, 2025 | Page |
NI 43-101 Technical Report Preliminary Economic Assessment for the Toroparu Project, Cuyuni-Mazaruni Region, Guyana
| · | to promote community development projects that enhance local benefits and which create skills, capacities, improve education, health, and infrastructure of the communities; |
| · | to take measures that are reasonably practical to ensure that residents continue their current traditional practices for easy transition at the end of the mine life; |
| · | to work with stakeholders representing indigenous groups and the communities during the operation phase to ensure that the Project related concerns of indigenous communities are addressed; |
| · | to partner with the government of Guyana and other companies to plan sustainable development and growth of the way station communities and contiguous areas; and |
| · | to promote and run health awareness campaigns among the workers and local communities upstream and downstream of the Project. |
| 20.2.3 | Community employment, diversity, and socioeconomic opportunities |
Development of the Project will provide a diversity of employment and socioeconomic opportunities to the country of Guyana. The Project will require skilled mine workers, services, material suppliers, contractors, and skills training. The direct income benefits of the Project will result in opportunities for indirect benefits such as support to local business, career opportunities for young adults, investment in non-mining related enterprises, and traditional agricultural, cultural, and artisan pursuits.
ETK currently employs 68 persons, including 65 Guyanese and three expatriates, with 13 based in Georgetown, 14 based in Itaballi, 3 based at the pontoon operation in Puruni, and 38 based at the Project camp. The employment numbers are approximately equal between basic and semi-skilled, skilled and professional, and supervisory roles, and 27% of the employees are female.
The peak workforce during Project construction is estimated at 1,763. During operations, the peak workforce is estimated at 744. The Project will target a high percentage of the workforce to be hired from within Guyana.
| 20.3 | Tailings and waste rock management facilities |
The planned tailings and waste rock management facilities are located where surface water flows are minimal. The environmental studies of the proposed areas will be concluded and the results will be used to inform the advancement of engineering design and environmental mitigations, including the conceptual closure and reclamation plans.
Geochemical characterization studies were completed by Klohn Crippen Berger from 2011 to 2013 on the dominant bedrock lithologies representing waste and low grade economic material, and metallurgical tailings representing the three main economic material types at the Toroparu deposit. The results indicated that the major lithologies are alkaline with the exception of the saprolite and transition zones. The saprolite zone is slightly acidic to neutral while the transition zone is neutral to alkaline. These results indicate that no acidity was released from any of the samples except for the saprolite samples, and that the alkaline nature of the other rock types could indicate effective carbonate buffering. The net acid generation results confirmed the non-potentially acid generating and non acid rock drainage risk of waste rock and low grade economic materials. The tailings samples were classified as non potentially acid generating and are considered to have negligible risk of acid rock drainage.
The samples contained high concentrations of silver, arsenic, cobalt, chromium, copper, nickel, molybdenum, sulphur, and selenium in comparison to the average crustal abundance of high calcium granite, with a wide variation between the different lithologies. The elevated concentrations of these elements in the solid phase may be at risk of leaching under site specific field conditions. Short term leaching tests reported elevated leaching levels of phosphorus, chromium, and silver in saprolite and elevated aluminum, selenium, chromium, and copper from the hard waste rock.
The metallurgical tailings leachate extraction test results indicated elevated concentrations of elements that may be soluble and mobile under laboratory test conditions. The tailings water quality will be influenced by a combination of precipitation, water treatment plant brine, and supernatant from the tailings slurry. The natural low permeability of the surficial soils and the lower concentration of elements in the tailings pond due to attenuation from natural degradation, settling, and mixing with precipitation will reduce concentrations in the discharge effluent to the aquatic receiving environment. Additional analysis such as predictive water quality modelling will be required in later phases to verify this assumption.
Geochemical characterization studies were completed by Klohn Crippen Berger in 2018 and 2019 on the dominant bedrock
| Effective October 21, 2025 | Page |
NI 43-101 Technical Report Preliminary Economic Assessment for the Toroparu Project, Cuyuni-Mazaruni Region, Guyana
lithologies and saprolite representing waste rock and economic material from the Sona Hill deposit. The results were predominantly in the non potentially acid generating classification and not likely to become acid generating.
| 20.4 | Site monitoring |
ETK has established a compliance monitoring plan as part of the environmental management system designed to support the Project, and any further applications for a variance of the environmental Permit, to incorporate adaptive management, updated reports, and any changes in the Project design. The purpose of the monitoring plan is to establish guidelines to comply with the relevant articles of the environmental permit, corporate commitments, and local and international legislative and regulatory requirements. Preliminary compliance monitoring plans have been established relating to environmental compliance procedures for contractors, waste management procedures, fuel handling and spill response procedures, and wildlife interaction and ecology protection plans. Compliance monitoring plans will be established upon completion of the mine design and will include a erosion and sediment control plans, waste rock and overburden management plans, and mine tailings management plans.
Site compliance monitoring currently includes continuously monitoring surface water levels at monitoring stations and monthly water level measurements of groundwater wells, and continuous weather monitoring including wind speed and direction, rainfall, intensity, humidity, temperature, and pressure. Regular inspections of the facilities are also conducted including fuel handling and storage, drum pads, tanks, and the use of spill trays. Bridges and culverts are checked, cleared of any obstructions, and maintained if required. Field parameters are record including observations of artisanal mining activity.
All data is reported to the EPA with the submission of an annual environmental report. Biannual waste management reports are also submitted to the EPA. Records of all illegal artisanal activities and the associated environmental impacts are reported monthly to the GGMC and EPA.
During the construction phase, water samples will be collected quarterly from groundwater wells and surface water stations. When the mine is in production, the sampling frequency will increase to weekly and additional sampling points will be installed to include the tailings management areas, sedimentation ponds, and any other sensitive receptors.
The final environmental and social management plans will have a monitoring component and an adaptive management process to evaluate the plan effectiveness and to inform updates as required, as well as requirements for reporting to regulators and stakeholders. The monitoring components will be in effect during construction, operation, closure, and post closure.
| 20.5 | Water management |
To maintain the quality and quantity of water, all impacts associated with the Project works and activities will be identified, assessed, and prioritized. Measurements will be implemented to prevent, control, mitigate, correct, and/or compensate them during operations. The final water management plan will be developed in compliance with the environmental permits and international best practices.
A full groundwater investigation was undertaken by Knight Piésold in 2014, including packer testing, construction of multi-level groundwater wells, and the development of a numerical groundwater model. The conceptual model was interpreted as a thick confining layer of saprolite up to 90 m thick overlying bedrock, with an extensively fractured paleosurface of relatively higher hydraulic conductivity. The water table at the Project is close to the ground surface and is a subdued replica of the surface topography. Precipitation is interpreted to be the primary source of groundwater recharge in the Project area. Given the low topographic relief in the Project area, shallow groundwater levels and relatively shallow depth to lower permeability bedrock in the Project area, local scale ground water flow systems are estimated to largely control the overall flow patterns, with recharge occurring on the relatively higher ground and with discharge focussed in adjacent localized topographic lows in swamp lowlands and small seasonal tributaries as well as in the Puruni and Wynamu rivers.
Klohn Crippen Berger conducted a site wide water balance – water quality model for the Project in 2019 to predict water quality and Project discharge points and at the intermixing of discharges with the receiving environment. Groundwater samples had slight exceedances of iron and pH and very high exceedances of total suspended solids relative to IFC effluent requirements for mining operations, which is out of the ordinary for naturally occurring groundwater, suggesting that the sampling wells may have been inadequately installed.
| Effective October 21, 2025 | Page |
NI 43-101 Technical Report Preliminary Economic Assessment for the Toroparu Project, Cuyuni-Mazaruni Region, Guyana
As there are no formal or established communities or settlements in the immediate vicinity of the Project, or in proximity to associated Project components, there are no direct groundwater users in the Project area and no sensitive social receptors that could potentially be influenced by the Project’s water management activities. Water for present day small scale alluvial mining is provided by streamflow.
| 20.6 | Permitting requirements |
The key permits necessary for Project construction and operation include an environmental permit and a mining license.
The environmental regulatory framework of the Project is mandated by the Environmental Protection Act of 1996, under which the Guyana EPA was established, the Environmental Protection Regulations of 2000, the Mining Act of 1989, which governs the establishment of a mine and appoints the GGMC as the state agency with responsibility for mining in Guyana, and the Mining Environmental Regulations of 2005. The Amerindian Act, the National Trust Act, the Occupational Safety and Health Act, the Pesticide and Toxic Chemicals Act, and the Explosives and Blasting Operations Acts also set conditions relevant to the Project.
On October 15, 2024, ETK was granted a renewed environmental permit based on an application for permit renewal submitted on December 15, 2023. The renewed permit incorporates all Project activities, including the access road and Puruni Pontoon Crossing, and includes design, construction, operational, and monitoring and reporting compliance conditions. The renewed permit is valid for five years and will expire on September 30, 2029. Following the filing of this PEA, ETK will undertake the normal course notifications and consultations with the EPA before commencing construction, ensuring that the existing permit is updated to reflect the final Project plans.
ETK holds additional environmental permits for the Itaballi Landing Facility proposed fuel depot and wharf on the Mazaruni River and the Itaballi Laydown Support Facility at Aremu Junction. The permit was granted by the EPA on December 13, 2023, and expires on October 31, 2028.
All relevant Project environmental compliance thresholds and limits are specified in the 2012 ESIA, the 2021 updated environmental management plan, and the Project environmental permit, which were approved and granted in accordance with the Guyana Environmental Protection Act and Regulations, the Mining Act and Regulations, and other Guyana legislation and regulations relevant to the Project.
Where there are no applicable thresholds and/or limits specified in the Guyana regulations, the Project is mandated under the environmental permit to incorporate the IFC World Bank Group Environment, Health, and Safety Guidelines for Mining in the final design of all facilities and processes, as well as other applicable international best management practice.
A mining license is required to conduct commercial scale mining operations in Guyana. The application must include a technical and economic feasibility study, detailed mine and processing plans, an EIA, and an environmental management plan. A mining license is typically valid for 20 years, or for the life of the mine, whichever is shorter, and may be renewed at upon expiry if required. The license holder is required to pay an annual rental fee for each acre covered by the mining permit. An application for a mining license for the Project was first submitted in 2020 and resubmitted in 2022. The application remains under review by the Ministry of Natural Resources and the GGMC.
Other permits that will be required for production include a permit to use cyanide and a permit to transport, store, handle, and use explosives.
A performance bond, often at around 10% of the planned first year expenditure, is required by the GGMC as security and deterrent.
| 20.7 | Mine closure requirements |
The Project will be closed and restored in compliance with a detailed mine closure and restoration plan that will be submitted to the EPA two years prior to closure, in accordance with the mandate of the environmental permit.
The mine reclamation and closure components are anticipated to include the tailings management area; the waste rock storage facilities; the open pits; the plant site and ancillary facilities including the processing plant, stockpiles, administration
| Effective October 21, 2025 | Page |
NI 43-101 Technical Report Preliminary Economic Assessment for the Toroparu Project, Cuyuni-Mazaruni Region, Guyana
buildings, warehouse, and camps; explosives storage areas; internal mine roads; power lines; and water management infrastructure.
Progressive closure and reclamation of infrastructure during the life of the Project may be undertaken as opportunities arise, and will address all environmental aspects and the environmental management plan measures, including soils, water resources, and biota. The final closure plan will include the closure of the Project and facilities that have been used since the beginning of operations, including rehabilitation and/or recovery of areas effected by mine development; dismantling and removal of equipment, materials, and facilities that if not sold, will be treated and disposed of as waste, recycled, or re-purposed; demolition of remaining structures after dismantling, aside from those that contribute to the physical stability of the environment; and maintaining or restoring physical and chemical stability of the site to stable conditions. The open pits will be allowed to fill with groundwater and surface run off and the perimeters will be safely secured with fencing and berms.
Conceptual level mine closure and reclamation plans have been developed to achieve the Project objectives for restoring the site and aquatic environment to a high ecological value. The objectives of the closure plan are to:
| · | prevent, reduce, or mitigate any adverse environmental effects associated with the Project; |
| · | provide for the reclamation of all affected sites and landscapes to a stable and safe condition; |
| · | provide for the return of all affected ecosystems to a healthy and sustainable function; |
| · | reduce the need for long term monitoring and maintenance by designing for closure and instituting progressive reclamation; |
| · | provide for long term monitoring and maintenance of the sites affected by the Project as required; and |
| · | provide for mine closure using the most current available proven technologies in a manner consistent with sustainable development. |
Performance standards will be developed to measure closure success, including physical stability of any remaining facilities, biological stability of areas intended for revegetation, chemical stability of mine waste to prevent water degradation and any impact to humans or wildlife, and water quality similar to or improved when compared to background pre-mining baseline data.
Post closure plans will consider the activities ETK must develop to ensure the physical and chemical stability of the remaining facilities and avoid risks to the environment. The post closure plans will be focussed on the maintenance of control structures, the management of water from the tailings management facility, and monitoring to evaluate the measures.
Closure and post-closure monitoring and maintenance will be conducted to assess performance against the closure objectives. The monitoring and maintenance type and frequency will be adapted to address progressive reclamation as it proceeds and will be conducted in coordination with the EPA and the Guyana Forestry Commission, including annual reporting of conditions and results, until the Project reaches a safe, stable, and non-polluting state, in accordance with the identified success criteria. The existing monitoring programs for surface and groundwater will continue and will be updated as the Project plans develop.
The financial model includes closure and post-closure costs to be incurred at the end of the mine life.
| 20.8 | Recommendations |
The following recommendations are made:
| · | install additional weather monitoring stations at the Project to improve data collection and quality control; |
| · | resume biennial biodiversity monitoring programs within the proposed Project footprint; |
| · | undertake additional humidity cell testing to further assess metal leaching of waste rock, low-grade economic material, and the open pit walls under alkaline conditions; and |
| · | assess the potential environmental impacts of elevated metal discharge concentration relevant to the background water quality of the receptor. |
This work can be undertaken as part of the future Project permitting work and will be accounted for within the existing environmental budget.
| Effective October 21, 2025 | Page |
NI 43-101 Technical Report Preliminary Economic Assessment for the Toroparu Project, Cuyuni-Mazaruni Region, Guyana
| 21 | Capital and operating costs |
| 21.1 | Introduction |
The estimates of processing and surface infrastructure capital and operating costs were prepared by LogiProc while the estimates of mining, mine support, and tailings management facility capital and operating costs were prepared by Sound Mining. These cost estimates form the basis of the Project’s economic analysis presented in this technical report.
| 21.2 | Contingency and treatment of uncertainty |
The cost estimates incorporate a total initial capital funding contingency of $96 million, which represents allowances for normal estimating uncertainties consistent with a PEA level of study. A 15% contingency has been applied to all direct and indirect capital cost items incurred during the construction period, excluding pre-production mining and the leased mining fleet. A separate 10% contingency has been applied to pre-production mining costs, which are estimated using detailed unit rates.
These allowances are intended to address uncertainties typical at this stage of project definition, including potential variations in quantities, labour productivity, vendor pricing, indirect cost escalation, and early-stage scope refinements as the Project advances toward a PFS level of engineering.
Operating costs were developed from first principles using zero-based estimates for major cost components such as consumables, power, maintenance, and labour. These were benchmarked and indexed against comparable Latin American and Guiana Shield gold operations to ensure that the estimates reflect current regional conditions. To account for remaining uncertainty in these operating cost projections, an additional 10% contingency has been applied to mining and processing operating costs.
| 21.3 | Capital costs |
| 21.3.1 | Mining capital costs |
The mining capital cost estimate was prepared in accordance with the American Association of Cost Engineers Class 4 level, with an expected accuracy of -30% on the low side and +50% on the high side, suitable for a PEA level study. All costs are expressed in real 2025 U.S. dollars.
The assumptions used while developing the capital cost estimate included that construction materials will be readily available with knowledgeable and experienced teams to arrange transport in the region. Project execution is expected to commence in the current economic climate where equipment and labour are readily available to supply equipment and perform the works, and the market is competitively in favour of the purchasers. The relative political stability in the region is assumed to allow relative ease of transport stays as at the time of preparing the estimate. No cost escalations were assumed during construction.
Appropriate equipment for the Project was specified and corresponding unit rates were applied to estimate the total provision for the mining operation based on the forecast production schedule and the required number of equipment units required. All mining units are assumed to be new equipment purchases. Freight costs were estimated at 4% of the purchase price and no import duties were applied. Equipment rebuild costs were estimated at 50% of the original purchase cost. No contingencies were included in the equipment cost estimate.
The economic analysis has been developed on the basis that the mining fleet will be leased, rather than purchased outright. To efficiently manage the owner operated mining fleet over the Project’s long life, the initial mining fleet, including excavators, dozers, haul trucks, and support equipment—is expected to be secured through OEM lease financing ahead of first production. Replacement equipment will be renewed on a scheduled basis under similar arrangements, ensuring access to modern, reliable, and well supported equipment throughout the pre-production and 21.3-year operating periods. The leasing and service agreements with the OEM are expected to include comprehensive maintenance and parts supply programs, providing consistent technical support, minimizing downtime, and optimizing equipment availability and lifecycle performance across the Project’s operations.
| Effective October 21, 2025 | Page |
NI 43-101 Technical Report Preliminary Economic Assessment for the Toroparu Project, Cuyuni-Mazaruni Region, Guyana
Lease costs and terms were estimated using recently quoted terms obtained by Aris Mining for comparable mining equipment in a similar jurisdiction and cost environment. These terms reflect typical marketing parameters for large mining equipment, including fixed lease periods aligned with equipment operating life, residual value provisions, and full maintenance coverage.
The capital cost estimate for the tailings management facility assumes that construction will take place in three stages. Construction of the first stage takes place in Year -1 and takes one year to complete, construction of the second stage takes place in Year 1 and Year 2 and takes approximately two years to complete, and construction of the third stage takes place in Year 3 to Year 6 and takes approximately four years to complete. The cost estimate includes water diversions, channels, and outlet structures; access roads; facility embankments and basin; return water dam; instrumentation; borrow pit development; water treatment plant; tailings delivery system; decant system; return water system; stormwater return to the return water dam; and profession design fees.
| 21.3.2 | Processing capital costs |
The processing capital cost estimate was prepared in accordance with the American Association of Cost Engineers Class 4 level, with an expected accuracy of -30% on the low side and +50% on the high side, suitable for a PEA level study. All costs are expressed in Q3 2024 dollars with no allowances for inflation or escalation beyond that time. No contingencies have been considered in the costs.
The estimate is based on first principles estimates based cost databases from similar projects. It does not reflect discounts for negotiated prices, bulk purchases, or used equipment purchases where appropriate. Freight costs are included in the estimate of plant equipment costs.
The processing plant has been sized for a throughput of 7.0 Mtpa. The estimate assumes that borrow pits will be available for bulk earthworks were fill material is required, with average haulage distances of 2.5 km with an average elevation change of 70 m. Communication is expected to be via Starlink towers powered by generators.
| 21.3.3 | Capital cost summary |
A summary of the estimated initial capital expenditures, including contingency and any operating costs incurred during the pre-production period, is shown in Table 21-1, the estimated deferred and sustaining capital costs are shown in Table 21-2, the estimated initial capital expenditure schedule, broken down by half years during the construction period, is shown in Table 21-3, and the estimated capital expenditure per depreciation class is shown in Table 21-4.
The initial capital cost estimate reflects a $38 million reduction compared to a full mining fleet purchase scenario, as the $73 million cost of the initial mining fleet is reduced to approximately $35 million of upfront and construction-period lease payments. The strategy is to maintain access to modern, well-supported equipment under comprehensive maintenance and parts-supply programs over the long +20 year mine life.
The final closure plan will address the dismantling, disposal, and rehabilitation of all Project facilities and affected areas, ensuring physical and chemical stability is restored across the site. The financial model includes capital cost expenditures related to closure and post-closure costs to be incurred at the end of the mine life.
| Table 21-1 | Estimated initial capital costs |
| Amount ($M) | |
| Mining | |
| Pre-production mining cost | 148.7 |
| Fleet purchase – lease payments during construction period | 34.6 |
| Waste rock and low grade mill feed storage facilities |
21.0 |
| Other mining structures | 20.7 |
| Mining total | 225.0 |
| Processing and surface | |
| Effective October 21, 2025 | Page |
NI 43-101 Technical Report Preliminary Economic Assessment for the Toroparu Project, Cuyuni-Mazaruni Region, Guyana
| Amount ($M) | |
| Processing plant | 193.3 |
| Earthworks | 85.8 |
| Power | 46.5 |
| Tailings management facility | 42.5 |
| Site and offsite infrastructure | 20.9 |
| Water management | 20.3 |
| Surface total | 409.3 |
| Other | |
| Owners cost | 90.0 |
| Other start up cost | - |
| Contingency | 96.0 |
| Other total | 186.0 |
| Total | 820.3 |
| Table 21-2 | Estimated deferred and sustaining capital costs, including contingency |
| Amount ($M) | |
| Capitalized stripping | 542.7 |
| Fleet purchase – lease payments for replacement fleet | 398.8 |
| Fleet maintenance | 127.6 |
| Fleet purchase – lease payments for remaining initial fleet | 114.7 |
| Site and offsite infrastructure | 47.9 |
| Closure | 34.5 |
| Owners cost and other | 35.5 |
| Total | 1,301.7 |
| Table 21-3 | Estimated capital expenditure schedule |
| Total | -Y3 H1 | -Y3 H2 | -Y2 H1 | -Y2 H2 | -Y1 H1 | -Y1 H2 |
|
| Surface ($M) | 409.3 | 34.4 | 34.4 | 32.7 | 95.0 | 116.2 | 96.6 |
| Mining ($M) | 190.4 | 12.7 | 48.9 | 36.4 | 36.4 | 28.0 | 28.0 |
| Fleet leases ($M) | 34.6 | 7.8 | 3.9 | 6.9 | 5.3 | 5.3 | 5.3 |
| Other ($M) | 90.0 | 15.0 | 15.0 | 15.0 | 15.0 | 15.0 | 15.0 |
| Contingency ($M) | 96.0 | 9.3 | 12.9 | 11.2 | 20.5 | 22.5 | 19.5 |
| Initial total ($M) | 820.3 | 79.3 | 115.1 | 102.1 | 172.2 | 187.0 | 164.5 |
| Table 21-4 | Estimated capital expenditure per depreciation class |
| Depreciation class | Capital expenditure ($M) | Annual depreciation rate (%) |
| Life of mine | 1,381.3 | 20.00 |
| Capitalized stripping and pre-production mining costs | 706.2 | 100.00 |
| Total | 2,087.5 |
| 21.4 | Operating costs |
| 21.4.1 | Mining operating costs |
The mine operating cost forecast is based on the production schedule, which includes a three construction period followed by a 21.3 year operating life, utilizing an owner operated mining fleet under leased financing arrangements. The mining
| Effective October 21, 2025 | Page |
NI 43-101 Technical Report Preliminary Economic Assessment for the Toroparu Project, Cuyuni-Mazaruni Region, Guyana
equipment will be operated and maintained by the owner’s personnel, with the fleet itself leased through OEM affiliated captive leasing programs to reduce initial capital expenditures and ensure consistent equipment availability.
The operating cost estimates were developed from first principles. Where appropriate, unit cost estimates were obtained from similar operations. Internal databases and suitable benchmarks enabled the overall accuracy of the operating cost to be aligned with a Class 4 estimate with an expected accuracy of +/-35%, suitable for a PEA level study.
The equipment and consumable operating costs, excluding power and labour, were derived from the recommended equipment fleet required to achieve the forecast production, using standard operating hours and apportioned maintenance costs for each specific machine. Staffing levels, major consumables, and expenditures according to the mine production schedule were considered in the estimate. Equipment operating efficiencies, utilization rates, and availabilities have also been incorporated. The annual labour cost profile aligns with increases in staffing requirements at the crew level as production ramps up to forecast levels.
The explosives costs were estimated based on powder factors applied to the total material movement forecast, incorporating the expected proportion of mill feed and waste material and the associated blasting requirements.
Pit dewatering costs are based on diesel consumption and pump maintenance for the pit dewatering activities throughout the life of mine.
The operating cost for the tailings management facility includes tailings delivery and return water systems, stormwater management, engineer of record, water treatment plant, power, monitoring, and closure.
| 21.4.2 | Processing operating costs |
The operating cost estimate is based on a plant throughput of 7.0 Mtpa at a 92.5% availability. Separate operating cost values were developed for the oxide and sulphide mill feed based on their respective processing routes.
Costs were provided by vendors, and where unavailable, alternative costing sources were from either LogiProc’s internal costing database or from Aris Mining. The onsite labour force structure considered the process operations and maintenance, and weighed against similar operations of a similar size and structure. Personnel salaries and associated overheads were estimated using publicly available data from employment websites. Power costs were developed assuming that the process plant will be powered by a heavy fuel oil fired power generation system, with a fuel cost of $441 per metric tonne. Power consumption was calculated based on the installed power ratings for each processing plant area and the average throughput. Reagent consumption was obtained directly from the Project testwork and the process design criteria, with unit costs determined based on the average market prices. Consumable costs were factored into the total cost per tonne of all fixed operating cost items that contain consumable components. Maintenance costs were calculated as a percentage of the total capital expenditure for each equipment section, scaled by maintenance frequency, operational demands, and wear-specific factors. Doré transportation costs were estimated assuming air freight and copper concentrate transportation costs were estimated assuming containerized transport to port and then export to the refinery.
The operating costs were categorized as fixed and variable, with fixed costs including plant labour, reagents, power, and maintenance, and with variable costs including consumables and replacement capital.
The operating cost for the oxide processing operation is primarily driven by power and reagent consumption. The oxide processing circuit enables stable operating conditions with predictable reagent use and minimal logistical overhead and provides a low cost, high recovery gold profile for early stage production. The operating cost for the sulphide processing operation is primarily driven by additional power and reagent requirements and high concentrate handling costs, but results in greater overall revenue at moderate incremental cost. The sulphide circuit is competitive with solid metallurgical recoveries and commercially marketable concentrate quality. Both processing routes deliver positive operating margins, confirming the economic robustness of the Project under the current design and energy assumptions. The results reinforce the scalability of the processing plant.
No allowance has been made for VAT.
| Effective October 21, 2025 | Page |
NI 43-101 Technical Report Preliminary Economic Assessment for the Toroparu Project, Cuyuni-Mazaruni Region, Guyana
| 21.4.3 | G&A operating costs |
G&A expenses were estimated to include mine site, corporate, and general other. Mine site G&A costs relate to on site expenses including insurance taxes, software and technology, consultancy and services, travel and transport, leases, labour, recruitment, and variable compensation. Corporate G&A costs relate to allocated overheads related to off site expenses including consultants, insurance, travel, agreements, training and recruitment, taxes and fees, memberships and associations, statutory and government fees, media plans and events, stakeholder engagement, leases, software and hardware, stationary, utilities, materials, and other services. General other operating costs include security, mine site administration, and other shared services and administration.
G&A costs also include fees related to the Consulting Agreement. Pursuant to the Consulting Agreement, A&S is to be paid, commencing on the first anniversary of ETK receiving cashflow sufficient to develop and construct a conventional open pit mining and flotation and cyanide leach process operation on the Property with on-site and off-site support operations (with such cash flow to be determined in a definitive feasibility study), eight annual payments of a minimum of $1.0 million adjusted upwards in accordance with the indexing formula set out in the Consulting Agreement (to a maximum of $2.0 million), followed by five extended payments of a maximum of $1.0 million (provided the daily price of gold averaged over a twelve-month period or a calendar month period, as applicable, exceeds $1,750 per ounce) subject to downward indexation based on a formula set out in the Consulting Agreement. Using the base case gold price of $3,000 per ounce applied in this study, the aggregate amount payable to the consultant under the Consulting Agreement is estimated at $21 million.
| 21.4.4 | Operating cost summary |
The life of mine operating costs, excluding capitalized operating costs, were estimated for mining, surface infrastructure, processing, G&A including other costs, realization, and royalties.
Royalties due to the government of Guyana include an 8% royalty on gold sales and a 1.5% royalty on each of silver and copper sales.
The summary of the estimated life of mine operating costs is shown in Table 21-5, the estimated life of mine unit operating cost estimate is shown in Table 21-6, and the estimated annual life of mine operating cost schedule is shown in Table 21-7.
| Table 21-5 | Estimated operating costs |
| Total life of mine ($M) | Pre-production ($M) | Production ($M) |
|
| Fleet | 1,468.3 | 91.3 | 1,377.0 |
| Explosives | 448.9 | 21.3 | 427.6 |
| Consumables | 198.3 | 13.3 | 185.1 |
| Labour | 185.5 | 15.5 | 170.0 |
| Pit dewatering | 121.3 | 7.1 | 114.2 |
| Power | 3.4 | 0.2 | 3.2 |
| Contingency (10%) | 242.6 | 14.9 | 227.7 |
| Mining subtotal | 2,668.3 | 163.6 | 2,504.7 |
| Less: capitalized stripping | (706.2) | (163.6) | (542.7) |
| Mining total | 1,962.1 | - | 1,962.1 |
| Reagents | 836.7 | - | 836.7 |
| Power | 815.6 | - | 815.6 |
| Tailings management facility | 273.7 | - | 273.7 |
| Plant maintenance | 86.0 | - | 86.0 |
| Labour | 131.4 | - | 131.4 |
| Plant consumables | 37.4 | - | 37.4 |
| Replacement cost | 18.7 | - | 18.7 |
| Effective October 21, 2025 | Page |
NI 43-101 Technical Report Preliminary Economic Assessment for the Toroparu Project, Cuyuni-Mazaruni Region, Guyana
| Total life of mine ($M) | Pre-production ($M) | Production ($M) |
|
| Contingency (10%) | 219.9 | 219.9 | |
| Processing and surface total | 2,419.4 | - | 2,419.4 |
| Freight | 173.7 | - | 173.7 |
| Treatment charges | 29.2 | - | 29.2 |
| Refining charges | 49.1 | - | 49.1 |
| Penalties | - | - | - |
| Realization total | 252.0 | - | 252.0 |
| Mine site G&A | 650.0 | - | 650.0 |
| Royalties | 1,192.7 | - | 1,192.7 |
| Total | 7,182.5 | 163.6 | 7,018.9 |
| Table 21-6 | Estimated life of mine unit operating costs |
| Units | Total | |
| Pre-production mining costs | $M | 148.7 |
| Mining costs | $M | 1,783.7 |
| Capitalized stripping | $M | 493.3 |
| Contingency (10%) | $M | 242.6 |
| Total mining cost | $M | 2,668.3 |
| Total tonnes moved | Mt | 843.0 |
| Cost mining cost per tonne moved | $/t moved | 3.17 |
| $/t processed | ||
| Mining | 16.29 | |
| Processing and surface | 14.77 | |
| Contingency (10%) | 3.11 | |
| Mining and processing costs including contingency | 34.16 | |
| G&A | 4.36 | |
| Royalties | 8.01 | |
| Treatment, refining, and freight | 1.69 | |
| Total operating cost per tonne processed | 48.22 | |
| Effective October 21, 2025 | Page |
NI 43-101 Technical Report Preliminary Economic Assessment for the Toroparu Project, Cuyuni-Mazaruni Region, Guyana
| Table 21-7 | Estimated life of mine operating cost schedule |
| Total | Y1 | Y2 | Y3 | Y4 | Y5 | Y6 | Y7 | Y8 | Y9 | Y10 | Y11 | Y12 | Y13 | Y14 | Y15 | Y16 | Y17 | Y18 | Y19 | Y20 | Y21 | Y22 | |
| Mining ($M) | 1,962.1 | 21.3 | 101.1 | 101.2 | 104.6 | 101.1 | 104.3 | 102.9 | 120.0 | 120.2 | 123.8 | 139.5 | 109.9 | 106.1 | 109.5 | 97.3 | 66.6 | 67.9 | 67.7 | 67.6 | 60.9 | 56.3 | 12.4 |
| Processing and surface ($M) | 2,419.4 | 110.0 | 110.4 | 112.6 | 113.7 | 112.3 | 112.8 | 110.0 | 117.9 | 114.5 | 113.8 | 116.0 | 103.1 | 113.9 | 112.7 | 116.6 | 115.1 | 115.9 | 115.8 | 115.1 | 115.4 | 115.1 | 36.4 |
| G&A ($M) | 650.0 | 30.3 | 29.5 | 29.6 | 31.9 | 31.6 | 31.5 | 30.7 | 32.7 | 32.0 | 31.5 | 31.9 | 27.8 | 30.8 | 30.0 | 31.0 | 30.5 | 29.8 | 29.7 | 29.5 | 29.6 | 29.5 | 8.5 |
| Royalties ($M) | 1,192.7 | 51.4 | 54.1 | 54.7 | 59.3 | 57.9 | 58.0 | 51.7 | 52.0 | 52.2 | 51.2 | 52.2 | 52.3 | 51.5 | 53.4 | 52.6 | 54.6 | 61.6 | 66.0 | 61.4 | 65.3 | 65.2 | 14.3 |
| Treatment, refining, and freight ($M) | 252.0 | 9.6 | 11.3 | 12.5 | 12.7 | 12.3 | 12.5 | 11.9 | 12.6 | 11.0 | 11.2 | 12.0 | 9.2 | 10.8 | 11.6 | 12.1 | 12.4 | 12.6 | 12.7 | 12.5 | 12.6 | 12.5 | 3.4 |
| Total ($M) | 6,476.2 | 222.5 | 306.4 | 310.6 | 322.2 | 315.0 | 319.1 | 307.3 | 335.3 | 329.9 | 331.5 | 351.5 | 302.4 | 313.1 | 317.2 | 309.6 | 279.3 | 287.8 | 292.0 | 286.2 | 283.8 | 278.7 | 75.0 |
| Effective October 21, 2025 | Page |
NI 43-101 Technical Report Preliminary Economic Assessment for the Toroparu Project, Cuyuni-Mazaruni Region, Guyana
| 22 | Economic analysis |
| 22.1 | Estimate methodology |
Readers are cautioned that this preliminary economic assessment is considered preliminary in nature. It includes inferred mineral resources which are considered too speculative geologically to have the economic considerations applied to them that would enable them to be categorized and mineral reserves. Therefore, there is no certainty that the conclusions within this preliminary economic analysis will be realised. Mineral resources that are not mineral reserves do not have demonstrated economic viability.
The economic analysis was undertaken to assess and confirm the proposed mine plan described in this technical report, utilizing the production schedule and the associated capital and operating cost estimates. The economic analysis has been conducted on a post-tax, 100% equity (i.e., no debt financing) basis, in constant dollar terms. Sunk costs, such as exploration and the cost of previous studies, were excluded from the analysis.
The economic model incorporates both the historic precious metals purchase agreement with WPMI and the owner operated mining fleet leasing strategy assumed for this study. The WPMI streaming agreement provides for the sale of a portion of the Project’s gold and silver production under fixed-price terms, while the leasing approach reflects the use of an owner-operated fleet financed through OEM-affiliated captive lease programs, which reduces initial capital requirements and ensures consistent equipment availability by maintaining access to new and well-supported equipment throughout the operating period.
The economic viability of the mine plan has been evaluated using key economic indicators, including annual and cumulative cash flows, NPV, and IRR. The NPV presented in this technical report should not be interpreted as the definitive value of the Project and must be considered in conjunction with the accompanying sensitivity analysis.
The key economic results are presented on a pre-tax basis to facilitate comparison with other projects in different jurisdictions by removing the effect of local tax regimes, and on an after-tax basis incorporating the applicable tax rates and fiscal terms for the Project, providing a more accurate reflection of the potential economic benefits to the Project owners.
| 22.2 | Project schedule |
The processing facility has been designed with a 7.0 Mtpa capacity. The construction period is scheduled for 12 quarters (3 years). The first mining of mill feed is planned during the first 12 months of Project construction, with all material stockpiled until the process plant is commissioned. The pre-production stockpile is scheduled to supplement run of mine mill feed during Year 1, supporting the rapid production ramp up.
Plant throughput is planned to ramp up smoothly and achieve steady state operations within the first year, supported by the availability of a large pre-production stockpile of approximately 6.1 million tonnes of mill feed at the end of the construction period. This stockpile provides the majority of the material required for the first year of processing and significantly reduces start-up risk by ensuring continuous mill feed availability during the commissioning and ramp-up phases, independent of initial mine production rates. The presence of this stockpile allows for a controlled start up, stable plant utilization, and early generation of cash flow.
Based on the current mining inventory, the Project has a planned mine life extending to Year 22, providing a long operational horizon and stable production base following the initial ramp up period.
The total life of mine production is shown in Table 22-1, the total life of mine metal production is shown in Table 22-2, the annual tonnes mined over the life of mine are shown in Figure 22-1, the annual processed grade and gold produced is shown in Figure 22-2, and the annual life of mine mining and processing schedule is shown in Table 22-3, where Year 1 includes the initial mill feed production from mining activities planned during the three years of construction.
| Effective October 21, 2025 | Page |
NI 43-101 Technical Report Preliminary Economic Assessment for the Toroparu Project, Cuyuni-Mazaruni Region, Guyana
| Table 22-1 | Total mine production |
| Units | Total | |
| Waste | Mt | 694.0 |
| Mill feed | Mt | 149.0 |
| Total material mined | Mt | 843.0 |
| Strip ratio (waste to mill feed) | 4.66 | |
| Mined gold grade | g/t Au | 1.12 |
| Mined silver grade | g/t Ag | 1.32 |
| Mined copper grade | % Cu | 0.09 |
| Contained mined gold | koz | 5,343 |
| Contained mined silver | koz | 6,316 |
| Contained mined copper | Mlb | 301.5 |
| Table 22-2 | Total metal production |
| Concentrates | Units | Copper concentrate | Doré | Total |
| Concentrate mass | DMT | 584,808 | - | 584,808 |
| Gold recovered | koz | 2,114 | 2,886 | 4,999 |
| Silver recovered | koz | 2,892 | 1,971 | 4,863 |
| Copper recovered | Mlb | 260 | - | 260 |
| Gold grade | g/t | 112 | - | - |
| Silver grade | g/t | 154 | - | - |
| Copper grade | % | 20.1 | - | - |
| Figure 22-1 | Annual tonnes mined |

| Effective October 21, 2025 | Page |
NI 43-101 Technical Report Preliminary Economic Assessment for the Toroparu Project, Cuyuni-Mazaruni Region, Guyana
| Figure 22-2 | Annual processed grade and gold produced |

| Effective October 21, 2025 | Page |
NI 43-101 Technical Report Preliminary Economic Assessment for the Toroparu Project, Cuyuni-Mazaruni Region, Guyana
| Table 22-3 | Mining and processing schedule |
| Units | LOM | Y-3 | Y-2 | Y-1 |
Y1 | Y2 | Y3 | Y4 | Y5 | Y6 | Y7 | Y8 | Y9 | Y10 | Y11 | Y12 | Y13 | Y14 | Y15 | Y16 | Y17 | Y18 | Y19 | Y20 | Y21 | Y22 | |
| Mining | |||||||||||||||||||||||||||
| Waste | Mt | 694.0 | 10.1 | 20.1 | 20.0 | 20.3 | 50.1 | 60.5 | 60.3 | 60.0 | 59.3 | 61.8 | 45.5 | 40.9 | 40.0 | 31.4 | 19.6 | 20.4 | 20.5 | 15.4 | 7.1 | 7.1 | 7.0 | 7.0 | 5.3 | 3.4 | 1.0 |
| Mill feed | Mt | 149.0 | 1.1 | 2.9 | 2.2 | 1.1 | 7.0 | 7.0 | 7.1 | 7.0 | 7.0 | 6.8 | 7.3 | 7.1 | 7.0 | 7.1 | 6.4 | 7.1 | 6.9 | 7.1 | 7.0 | 7.1 | 7.0 | 7.0 | 7.0 | 7.0 | 2.0 |
| Total | Mt | 843.0 | 11 | 23 | 22 | 21 | 57 | 67 | 67 | 67 | 66 | 69 | 53 | 48 | 47 | 38 | 26 | 27 | 27 | 23 | 14 | 14 | 14 | 14 | 12 | 10 | 3 |
| Strip ratio (waste to mill feed) | 4.66 | 9.5 | 7.0 | 9.2 | 19.1 | 7.2 | 8.6 | 8.5 | 8.6 | 8.5 | 9.1 | 6.3 | 5.8 | 5.7 | 4.4 | 3.1 | 2.9 | 3.0 | 2.2 | 1.0 | 1.0 | 1.0 | 1.0 | 0.8 | 0.5 | 0.5 | |
| Mill feed grade | |||||||||||||||||||||||||||
| Gold | g/t | 1.12 | 0.96 | 1.02 | 0.97 | 0.92 | 1.06 | 1.08 | 1.16 | 1.14 | 1.15 | 1.06 | 1.00 | 1.02 | 1.02 | 1.04 | 1.15 | 1.02 | 1.09 | 1.04 | 1.09 | 1.22 | 1.31 | 1.23 | 1.31 | 1.31 | 0.99 |
| Silver | g/t | 1.32 | 1.45 | 1.45 | 1.63 | 1.22 | 1.61 | 1.71 | 1.84 | 1.73 | 1.44 | 1.27 | 1.31 | 1.03 | 0.97 | 0.87 | 0.77 | 1.15 | 1.22 | 1.28 | 1.69 | 1.45 | 1.34 | 1.50 | 1.10 | 1.01 | 0.90 |
| Copper | % | 0.09 | 0.11 | 0.13 | 0.15 | 0.11 | 0.14 | 0.15 | 0.15 | 0.14 | 0.11 | 0.09 | 0.09 | 0.07 | 0.06 | 0.05 | 0.03 | 0.05 | 0.06 | 0.06 | 0.11 | 0.09 | 0.09 | 0.09 | 0.08 | 0.07 | 0.06 |
| Processing | |||||||||||||||||||||||||||
| Throughput | Mt | 149.0 | - | - | - | 7.2 | 7.0 | 7.0 | 7.1 | 7.0 | 7.0 | 6.8 | 7.3 | 7.1 | 7.0 | 7.1 | 6.4 | 7.1 | 6.9 | 7.1 | 7.0 | 7.1 | 7.0 | 7.0 | 7.0 | 7.0 | 2.0 |
| Feed grade | |||||||||||||||||||||||||||
| Gold | g/t | 1.12 | - | - | - | 0.98 | 1.07 | 1.08 | 1.16 | 1.15 | 1.16 | 1.06 | 1.00 | 1.03 | 1.02 | 1.04 | 1.15 | 1.02 | 1.10 | 1.04 | 1.09 | 1.23 | 1.32 | 1.23 | 1.31 | 1.31 | 0.99 |
| Silver | g/t | 1.32 | - | - | - | 1.48 | 1.61 | 1.71 | 1.85 | 1.74 | 1.45 | 1.27 | 1.32 | 1.03 | 0.97 | 0.88 | 0.78 | 1.15 | 1.23 | 1.28 | 1.70 | 1.45 | 1.35 | 1.50 | 1.10 | 1.02 | 0.90 |
| Copper | % | 0.09 | - | - | - | 0.13 | 0.14 | 0.15 | 0.15 | 0.14 | 0.11 | 0.09 | 0.09 | 0.07 | 0.06 | 0.05 | 0.03 | 0.05 | 0.06 | 0.06 | 0.11 | 0.09 | 0.09 | 0.09 | 0.08 | 0.07 | 0.06 |
| Copper concentrate (recovered metal) | |||||||||||||||||||||||||||
| Gold | koz | 2,114 | - | - | - | 68 | 85 | 99 | 106 | 102 | 107 | 96 | 96 | 86 | 87 | 97 | 81 | 84 | 98 | 97 | 101 | 115 | 123 | 114 | 122 | 122 | 27 |
| Silver | koz | 2,892 | - | - | - | 115 | 153 | 182 | 198 | 183 | 154 | 132 | 146 | 102 | 100 | 94 | 58 | 113 | 127 | 138 | 181 | 156 | 145 | 161 | 118 | 109 | 28 |
| Copper | Mlb | 260 | - | - | - | 14 | 18 | 20 | 21 | 18 | 15 | 12 | 13 | 9 | 8 | 7 | 4 | 7 | 8 | 9 | 15 | 12 | 12 | 12 | 11 | 10 | 2 |
| Doré | |||||||||||||||||||||||||||
| Gold | koz | 2,886 | - | - | - | 146 | 139 | 128 | 140 | 139 | 136 | 121 | 121 | 133 | 128 | 123 | 140 | 133 | 127 | 124 | 127 | 144 | 155 | 144 | 153 | 153 | 33 |
| Silver | koz | 1,971 | - | - | - | 118 | 117 | 118 | 129 | 120 | 100 | 85 | 94 | 75 | 67 | 61 | 54 | 83 | 83 | 90 | 116 | 100 | 93 | 103 | 76 | 70 | 18 |
| Total metal produced | |||||||||||||||||||||||||||
| Gold | koz | 4,999 | - | - | - | 213 | 224 | 227 | 246 | 241 | 243 | 217 | 218 | 219 | 215 | 220 | 221 | 217 | 225 | 221 | 228 | 259 | 278 | 258 | 275 | 275 | 60 |
| Silver | koz | 4,863 | - | - | - | 234 | 270 | 300 | 326 | 303 | 254 | 217 | 240 | 177 | 168 | 155 | 112 | 196 | 210 | 228 | 297 | 257 | 238 | 264 | 194 | 178 | 46 |
| Copper | Mlb | 260 | - | - | - | 14 | 18 | 20 | 21 | 18 | 15 | 12 | 13 | 9 | 8 | 7 | 4 | 7 | 8 | 9 | 15 | 12 | 12 | 12 | 11 | 10 | 2 |
| Effective October 21, 2025 | Page |
NI 43-101 Technical Report Preliminary Economic Assessment for the Toroparu Project, Cuyuni-Mazaruni Region, Guyana
| 22.3 | Taxes, royalties, and the Toroparu PMPA |
The economic analysis incorporates a statutory corporate income tax rate of 30%. Depreciation rates are as defined in Section 21, and royalties are deductible from taxable income.
Under the Mineral Agreement with the Government of Guyana, the Project is required to pay the following royalties:
| · | Gold: 8% royalty on gold sales | |
| · | Silver: 1.5% royalty on silver sales | |
| · | Copper: 1.5% royalty on copper sales |
The Project has a historic precious metals purchase agreement with WMPI, originally entered into in 2013 and amended in 2015, when the Project was owned by Sandspring, a single-asset junior developer. Under this agreement, WPMI may elect to provide $138 million in construction funding following completion of a full development plan, in exchange for the right to purchase 10% of the Project’s gold production and 50% of its silver production at fixed prices of $400 per ounce of gold and $3.90 per ounce of silver, respectively, with both prices subject to escalation beginning on the fourth anniversary of commercial production.
| 22.4 | Marketing assumptions |
The gold and silver contained in the doré produced at the Project are expected to be sold to international refineries under standard sales agreements. There are numerous refineries capable of processing doré, resulting in a highly competitive market that is expected to provide favourable refining terms and logistics options for the Project.
The copper–gold concentrates are expected to be marketed internationally, with indicative commercial terms established based on offers received from multiple metal traders and smelters. These offers reflected typical terms for gold-bearing copper concentrates and were used to derive the life-of-mine average marketing assumptions summarized in Table 22-4.
The concentrate grade is projected at approximately 20% copper, 1,122 g/t gold, and 154 g/t silver. The terms include grade based deductions and payabilities for copper, gold, and silver that are reflected in gross revenue, while treatment and refining charges and freight are captured within operating costs.
For revenue recognition in the economic analysis, payment terms were assumed at 10 days post-bill at the port of Georgetown, with final settlement based on smelter assays.
| Table 22-4 | Copper concentrate marketing terms |
| Marketing terms | Unit | Copper concentrate |
| Applied payability | ||
| Gold | % | 95 |
| Silver | % | 93 |
| Copper | % | 96.5 |
| Charges, penalties, and freight | ||
| Treatment charges | $/DMT | 50 |
| Gold refining charge | $/oz | 8 |
| Silver refining charge | $/oz | 1.00 |
| Copper refining charge | $/lb | 0.05 |
| Penalties | $/DMT | 0 |
| Freight | $/WMT | 270 |
| 22.5 | Commodity prices and gross revenue |
The financial analysis utilized the following metal price assumptions for the base case:
| Effective October 21, 2025 | Page |
NI 43-101 Technical Report Preliminary Economic Assessment for the Toroparu Project, Cuyuni-Mazaruni Region, Guyana
| · | Gold: $3,000/oz | |
| · | Silver: $40.0/oz | |
| · | Copper: $4.30/lb |
These metal prices were selected as being in line with the long term forecasts, as of October 2025.
The annual payable metals, the projected payable gold revenue, silver and copper by-product credits, and treatment and refining charges, penalties, and freight are shown in Table 22-5.
| Effective October 21, 2025 | Page |
NI 43-101 Technical Report Preliminary Economic Assessment for the Toroparu Project, Cuyuni-Mazaruni Region, Guyana
| Table 22-5 | Annual payable metals, gold revenue, by-product credits, and treatment and refining charges, penalties, and freight |
| Units | Total | Y1 | Y2 | Y3 | Y4 | Y5 | Y6 | Y7 | Y8 | Y9 | Y10 | Y11 | Y12 | Y13 | Y14 | Y15 | Y16 | Y17 | Y18 | Y19 | Y20 | Y21 | Y22 | |
| Doré | ||||||||||||||||||||||||
| Gold | koz | 2,884 | 146 | 139 | 128 | 140 | 138 | 136 | 121 | 121 | 133 | 128 | 123 | 140 | 133 | 127 | 124 | 127 | 144 | 155 | 143 | 153 | 153 | 33 |
| Silver | koz | 1,969 | 118 | 117 | 118 | 129 | 120 | 99 | 85 | 94 | 75 | 67 | 61 | 54 | 83 | 83 | 90 | 116 | 100 | 93 | 103 | 76 | 70 | 18 |
| Copper concentrate | ||||||||||||||||||||||||
| Gold | koz | 2,008 | 64 | 81 | 94 | 101 | 97 | 101 | 91 | 92 | 82 | 83 | 92 | 76 | 80 | 93 | 92 | 96 | 109 | 117 | 109 | 116 | 116 | 25 |
| Silver | koz | 2,675 | 107 | 141 | 168 | 183 | 169 | 143 | 122 | 135 | 95 | 93 | 87 | 53 | 104 | 117 | 128 | 167 | 145 | 134 | 148 | 109 | 100 | 26 |
| Copper | Mlb | 245 | 14 | 17 | 20 | 20 | 18 | 15 | 12 | 12 | 9 | 8 | 7 | 3 | 6 | 7 | 8 | 14 | 12 | 11 | 12 | 10 | 9 | 2 |
| Total payable metals | ||||||||||||||||||||||||
| Gold | koz | 4,892 | 210 | 220 | 222 | 241 | 236 | 237 | 212 | 213 | 215 | 211 | 215 | 217 | 212 | 220 | 216 | 223 | 253 | 272 | 252 | 269 | 269 | 59 |
| Silver | koz | 4,644 | 225 | 258 | 286 | 311 | 289 | 242 | 207 | 229 | 169 | 160 | 148 | 107 | 188 | 200 | 217 | 284 | 245 | 227 | 252 | 185 | 170 | 43 |
| Copper | Mlb | 245 | 14 | 17 | 20 | 20 | 18 | 15 | 12 | 12 | 9 | 8 | 7 | 3 | 6 | 7 | 8 | 14 | 12 | 11 | 12 | 10 | 9 | 2 |
| Gold revenue by product | ||||||||||||||||||||||||
| Copper concentrate | $M | 6,024 | 192 | 243 | 283 | 303 | 291 | 304 | 273 | 275 | 246 | 249 | 276 | 229 | 239 | 279 | 277 | 289 | 327 | 351 | 326 | 348 | 347 | 76 |
| Doré | $M | 8,653 | 437 | 417 | 384 | 420 | 415 | 407 | 362 | 363 | 398 | 384 | 370 | 421 | 398 | 381 | 372 | 381 | 432 | 464 | 430 | 459 | 459 | 100 |
| Total | $M | 14,677 | 629 | 660 | 666 | 723 | 707 | 711 | 635 | 638 | 644 | 632 | 646 | 651 | 637 | 660 | 649 | 669 | 759 | 815 | 756 | 807 | 806 | 176 |
| Silver revenue by product | ||||||||||||||||||||||||
| Copper concentrate | $M | 107 | 4 | 6 | 7 | 7 | 7 | 6 | 5 | 5 | 4 | 4 | 3 | 2 | 4 | 5 | 5 | 7 | 6 | 5 | 6 | 4 | 4 | 1 |
| Doré | $M | 79 | 5 | 5 | 5 | 5 | 5 | 4 | 3 | 4 | 3 | 3 | 2 | 2 | 3 | 3 | 4 | 5 | 4 | 4 | 4 | 3 | 3 | 1 |
| Total | $M | 186 | 9 | 10 | 11 | 12 | 12 | 10 | 8 | 9 | 7 | 6 | 6 | 4 | 8 | 8 | 9 | 11 | 10 | 9 | 10 | 7 | 7 | 2 |
| Copper revenue by product | ||||||||||||||||||||||||
| Copper concentrate | $M | 1,055 | 60 | 75 | 85 | 85 | 76 | 62 | 51 | 53 | 37 | 33 | 28 | 15 | 28 | 31 | 35 | 60 | 51 | 47 | 51 | 44 | 41 | 10 |
| Treatment and refining charges, penalties, and freight | ||||||||||||||||||||||||
| Treatment charges | $M | 29 | 1 | 1 | 1 | 1 | 1 | 1 | 1 | 1 | 1 | 1 | 1 | 1 | 1 | 1 | 1 | 1 | 1 | 1 | 1 | 1 | 1 | 0 |
| Refining charges | $M | 49 | 2 | 3 | 3 | 3 | 3 | 3 | 2 | 2 | 2 | 2 | 2 | 2 | 2 | 2 | 2 | 2 | 3 | 3 | 3 | 3 | 2 | 1 |
| Penalties | - | - | - | - | - | - | - | - | - | - | - | - | - | - | - | - | - | - | - | - | - | - | - | |
| Freight | $M | 174 | 6 | 7 | 8 | 8 | 8 | 9 | 8 | 9 | 8 | 8 | 9 | 6 | 8 | 8 | 9 | 9 | 9 | 9 | 9 | 9 | 9 | 2 |
| Total | $M | 252 | 10 | 11 | 13 | 13 | 12 | 12 | 12 | 13 | 11 | 11 | 12 | 9 | 11 | 12 | 12 | 12 | 13 | 13 | 13 | 13 | 12 | 3 |
| Effective October 21, 2025 | Page |
NI 43-101 Technical Report Preliminary Economic Assessment for the Toroparu Project, Cuyuni-Mazaruni Region, Guyana
| 22.6 | Economic analysis results |
The results of the economic analysis are summarized in Table 22-6. The economic results presented are inclusive of the OEM equipment leasing and Wheaton stream financing arrangements. The cash flow model reflects all lease payments in place of direct fleet purchases and incorporates both the inflow of the $138 million stream funding and the associated delivery obligations at fixed gold and silver prices, labeled as losses from PMPA financing in Table 22-6.
The NPV at a range of discount rates is shown in Table 22-7, and the annual cash flows are shown in Table 22 8.
| Table 22-6 | Economic evaluation results |
| Key indicators | Units | Total |
| Total life of mine gold produced | Moz | 5.0 |
| Life of mine | Years | 21.3 |
| Average annual gold production | koz | 235 |
| Life of mine average cash cost | $/oz Au | 826 |
| Life of mine average all in sustaining cost | $/oz Au | 1,289 |
| Life of mine average annual EBITDA | $M | 443 |
| Summary cash flow for the life of mine ($M) at $3,000/oz gold price | ||
| Revenue from payable gold sales | $M | 14,677 |
| Less: royalties | $M | 1,193 |
| Less: operating costs, net of by-product silver and copper | $M | 4,043 |
| Less: sustaining capital | $M | 1,069 |
| Operating margin | $M | 8,372 |
| Less: income tax | $M | 2,174 |
| After-tax cash flow | $M | 6,198 |
| Less initial capital including pre-production costs, VAT, and contingency | $M | 820 |
| Credit: construction funding, Precious Metals Purchase Agreement financing | $M | (138) |
| Less: additional growth capital | $M | 198 |
| Less: closure costs | $M | 35 |
| Net cash flow, before losses from PMPA financing | $M | 5,283 |
| Less: losses from PMPA financing | $M | 1,356 |
| Net cash flow | $M | 3,927 |
| Pre-tax indicators at $3,000/oz gold price (base case) | ||
| NPV at 5% discount rate | $M | 2,879 |
| IRR | % | 31.9 |
| Payback period (from start of operations) | Years | 2.4 |
| After-tax indicators at $3,000 gold price (base case) | ||
| NPV at 5% discount rate | $M | 1,805 |
| IRR | % | 25.2 |
| Payback period (from start of operations) | Years | 3.0 |
| After-tax indicators at $3,600/oz gold price | ||
| NPV at 5% discount rate | $M | 2,664 |
| IRR | % | 32.6 |
| Payback period (from start of operations) | Years | 2.3 |
| Effective October 21, 2025 | Page |
NI 43-101 Technical Report Preliminary Economic Assessment for the Toroparu Project, Cuyuni-Mazaruni Region, Guyana
| Table 22-7 | Sensitivity of NPV to discount rate |
| Discount rate | Units | Pre-tax NPV | After-tax NPV |
| 0.0% | $M | 6,102 | 3,927 |
| 5.0% (base case) | $M | 2,879 | 1,805 |
| 10.0% | $M | 1,460 | 865 |
| Effective October 21, 2025 | Page |
NI 43-101 Technical Report Preliminary Economic Assessment for the Toroparu Project, Cuyuni-Mazaruni Region, Guyana
| Table 22-8 | Annual after tax cash flow schedule |
| Parameter | Units | Total | Construction (3 years) |
Y1 | Y2 | Y3 | Y4 | Y5 | Y6 | Y7 | Y8 | Y9 | Y10 | Y11 | Y12 | Y13 |
| Revenue from payable gold | $M | 14,677 | - | 629 | 660 | 666 | 723 | 707 | 711 | 635 | 638 | 644 | 632 | 646 | 651 | 637 |
| Royalties | $M | (1,193) | - | (51) | (54) | (55) | (59) | (58) | (58) | (52) | (52) | (52) | (51) | (52) | (52) | (51) |
| Net gold revenue | $M | 13,484 | - | 578 | 606 | 611 | 663 | 649 | 653 | 583 | 586 | 592 | 581 | 594 | 598 | 585 |
| Mining costs | $M | (1,962) | - | (21) | (101) | (101) | (105) | (101) | (104) | (103) | (120) | (120) | (124) | (139) | (110) | (106) |
| Processing and surface costs | $M | (2,419) | (110) | (110) | (113) | (114) | (112) | (113) | (110) | (118) | (115) | (114) | (116) | (103) | (114) | |
| G&A | $M | (650) | - | (30) | (30) | (30) | (32) | (32) | (32) | (31) | (33) | (32) | (32) | (32) | (28) | (31) |
| Add: by-product credits, net of treatment and refining costs and freight | $M | 989 | - | 59 | 74 | 84 | 85 | 75 | 60 | 47 | 49 | 33 | 28 | 22 | 10 | 24 |
| Total operating costs (By-product) | $M | (4,043) | - | (102) | (168) | (160) | (165) | (170) | (189) | (197) | (221) | (234) | (241) | (265) | (231) | (227) |
| Working capital movements | $M | - | - | (11) | 12 | (2) | (2) | 2 | 4 | 5 | 5 | 2 | 2 | 4 | (7) | (0) |
| Capitalized stripping | $M | (543) | (54) | (45) | (71) | (71) | (70) | (70) | (81) | (34) | (23) | (23) | - | - | - | |
| Lease payments and mining fleet rebuilds | $M | (526) | - | (25) | (10) | - | (12) | (79) | (49) | (37) | (30) | (42) | (44) | (34) | (37) | (31) |
| Operating margin | $M | 8,372 | - | 385 | 395 | 379 | 413 | 332 | 349 | 275 | 306 | 295 | 275 | 299 | 324 | 328 |
| Income taxes | $M | (2,174) | - | (23) | (69) | (61) | (73) | (64) | (99) | (74) | (83) | (85) | (80) | (86) | (99) | (96) |
| After-tax cash-flow | $M | 6,198 | - | 362 | 326 | 318 | 341 | 267 | 249 | 201 | 223 | 210 | 195 | 213 | 225 | 232 |
| Initial capital, including VAT and working capital | $M | (820) | (820) | - | - | - | - | - | - | - | - | - | - | - | - | - |
Other non-sustaining capital |
$M | (198) | - | (40) | (59) | (42) | (37) | (8) | (8) | - | (0) | (0) | (0) | (4) | (0) | (0) |
| Closure costs | $M | (35) | - | - | - | - | - | - | - | - | - | - | - | - | - | - |
Net cash flow before PMPA |
$M | 5,145 | (820) | 322 | 267 | 276 | 304 | 260 | 242 | 201 | 223 | 210 | 195 | 209 | 225 | 232 |
Credit: construction funding, PMPA financing |
$M | 138 | 138 | - | - | - | - | - | - | - | - | - | - | - | - | - |
| Less: losses from PMPA financing | $M | (1,356) | - | (59) | (62) | (63) | (68) | (66) | (67) | (59) | (60) | (59) | (58) | (59) | (59) | (58) |
| Net cash flow | $M | 3,927 | (682) | 263 | 205 | 213 | 235 | 193 | 175 | 142 | 163 | 150 | 137 | 149 | 166 | 173 |
| Cumulative net cash flow | $M | 3,927 | (682) | (419) | (214) | (1) | 234 | 428 | 603 | 745 | 908 | 1,058 | 1,195 | 1,344 | 1,510 | 1,683 |
| Cash cost | $/oz Au | $826 | $487 | $762 | $719 | $686 | $721 | $797 | $929 | $1,040 | $1,088 | $1,144 | $1,231 | $1,065 | $1,067 | |
| AISC cost | $/oz Au | $1,289 | $1,111 | $1,255 | $1,285 | $1,276 | $1,599 | $1,544 | $1,729 | $1,584 | $1,636 | $1,707 | $1,631 | $1,475 | $1,454 |
| Effective October 21, 2025 | Page |
NI 43-101 Technical Report Preliminary Economic Assessment for the Toroparu Project, Cuyuni-Mazaruni Region, Guyana
| Parameter | Units | Y14 | Y15 | Y16 | Y17 | Y18 | Y19 | Y20 | Y21 | Y22 | Y23 |
| Revenue from payable gold | $M | 660 | 649 | 669 | 759 | 815 | 756 | 807 | 806 | 176 | - |
| Royalties | $M | (53) | (53) | (55) | (62) | (66) | (61) | (65) | (65) | (14) | - |
| Net gold revenue | $M | 607 | 596 | 615 | 697 | 749 | 695 | 742 | 741 | 162 | - |
| Mining costs | $M | (110) | (97) | (67) | (68) | (68) | (68) | (61) | (56) | (12) | - |
| Processing and surface costs | $M | (113) | (117) | (115) | (116) | (116) | (115) | (115) | (115) | (36) | - |
| G&A | $M | (30) | (31) | (31) | (30) | (30) | (30) | (30) | (30) | (9) | - |
| Add: by-product credits, net of treatment and refining costs and freight | $M | 27 | 32 | 59 | 48 | 44 | 48 | 39 | 35 | 8 | - |
| Total operating costs (By-product) | $M | (225) | (213) | (154) | (166) | (170) | (164) | (167) | (166) | (49) | - |
| Working capital movements | $M | (1) | (2) | (13) | (2) | (2) | 2 | (2) | (0) | 8 | (1) |
| Capitalized stripping | $M | - | - | - | - | - | - | - | - | - | - |
| Lease payments and mining fleet rebuilds | $M | (28) | (22) | (12) | (7) | (6) | (7) | (7) | (6) | (3) | - |
| Operating margin | $M | 353 | 359 | 437 | 522 | 572 | 525 | 565 | 568 | 118 | (1) |
| Income taxes | $M | (103) | (104) | (129) | (152) | (168) | (155) | (169) | (170) | (32) | - |
| After-tax cash-flow | $M | 250 | 255 | 308 | 370 | 404 | 371 | 396 | 398 | 86 | (1) |
| Initial capital, including VAT and working capital | $M | - | - | - | - | - | - | - | - | - | - |
|
Other non-sustaining capital |
$M | (0) | (0) | - | - | (0) | - | - | - | - | - |
| Closure costs | $M | - | - | - | - | - | - | - | - | - | (35) |
|
Net cash flow before PMPA |
$M | 250 | 255 | 308 | 370 | 404 | 371 | 396 | 398 | 86 | (35) |
|
Credit: construction funding, PMPA financing |
$M | - | - | - | - | - | - | - | - | - | - |
| Less: losses from PMPA financing | $M | (61) | (60) | (62) | (70) | (74) | (69) | (73) | (73) | (16) | - |
| Net cash flow | $M | 189 | 195 | 246 | 301 | 329 | 301 | 323 | 325 | 70 | (35) |
| Cumulative net cash flow | $M | 1,872 | 2,067 | 2,313 | 2,614 | 2,943 | 3,245 | 3,568 | 3,893 | 3,963 | 3,927 |
| Cash cost | $/oz Au | $1,023 | $985 | $688 | $655 | $625 | $651 | $622 | $618 | $839 | |
| AISC cost | $/oz Au | $1,390 | $1,330 | $985 | $927 | $888 | $923 | $891 | $885 | $1,137 |
| Effective October 21, 2025 | Page |
NI 43-101 Technical Report Preliminary Economic Assessment for the Toroparu Project, Cuyuni-Mazaruni Region, Guyana
| 22.7 | Sensitivity analysis |
A range of gold prices, operating costs, and capital expenditures, which include contingencies of 15% on direct and indirect capital items, 10% on pre-production mining, and 10% on mining and processing operating costs, were assessed to evaluate the sensitivity of the Project’s key economic indicators, including after-tax NPV5%, after-tax IRR, and the after-tax pay-back period.
The sensitivity of the after-tax NPV5%, to +/-30% changes in gold price, operating costs, and capital costs are shown in Figure 22-3, which indicate that the Project is most sensitive to gold price.
| Figure 22-3 | Sensitivity of NPV5% to operating and capital costs and gold price |

The sensitivity of the after-tax NPV5%, after-tax IRR, and after-tax payback period to a range of gold prices is shown in Table 22-9. The sensitivity of the after-tax NPV5% to operating and capital costs and gold price is shown in Table 22-10.
| Table 22-9 | Sensitivity of key economic indicators to gold price |
| Gold price | $2,400/oz | $2,600/oz | $2,800/oz | $3,000/oz | $3,200/oz | $3,400/oz | $3,600/oz |
| Indicator | Base case | ||||||
| After-tax NPV5% ($M) | 944 | 1,231 | 1,518 | 1,805 | 2,091 | 2,378 | 2,664 |
| After-tax IRR (%) | 16.6 |
19.6 | 22.5 | 25.2 | 27.7 | 30.2 | 32.6 |
| Payback period (years) | 4.4 | 3.7 | 3.3 | 3.0 | 2.7 | 2.5 | 2.3 |
| Effective October 21, 2025 | Page |
NI 43-101 Technical Report Preliminary Economic Assessment for the Toroparu Project, Cuyuni-Mazaruni Region, Guyana
| Table 22-10 | Sensitivity of NPV5% to operating and capital costs and gold price |
| Indicator | -30% | -20% | -10% | 0% | +10% | +20% | +30% |
| Change in % | |||||||
| Gold price – impact on after-tax NPV5% ($M) | 514 | 944 | 1,375 | 1,805 | 2,234 | 2,664 | 3,094 |
| Capital cost – impact on after-tax NPV5% ($M) | 1,974 | 1,917 | 1,861 | 1,805 | 1,748 | 1,692 | 1,635 |
| Operating cost – impact on after-tax NPV5% ($M) | 2,369 | 2,181 | 1,993 | 1,805 | 1,616 | 1,428 | 1,239 |
| 22.8 | Conclusions |
The result of the economic analysis indicates that the Project is economically viable under the base case assumptions, based on the current mining inventory and the assumptions described herein. The results demonstrate that the Project remains economically robust across a reasonable range of cost and metal price scenarios, with after-tax NPV5% and IRR outcomes retaining positive margins under adverse conditions. At a $3,000 per ounce gold price, the after-tax NPV5% is $1.8 billion, the after-tax IRR is 25.2%, and the payback period is 3.0 years from the start of operations. The economic results are not a measure of the Project’s fair market value.
| Effective October 21, 2025 | Page |
NI 43-101 Technical Report Preliminary Economic Assessment for the Toroparu Project, Cuyuni-Mazaruni Region, Guyana
| 23 | Other relevant data and information |
There are no other relevant data and additional information to report.
| Effective October 21, 2025 | Page |
NI 43-101 Technical Report Preliminary Economic Assessment for the Toroparu Project, Cuyuni-Mazaruni Region, Guyana
| 24 | Adjacent properties |
There is no relevant information on adjacent properties to report.
| Effective October 21, 2025 | Page |
NI 43-101 Technical Report Preliminary Economic Assessment for the Toroparu Project, Cuyuni-Mazaruni Region, Guyana
| 25 | Interpretation and conclusions |
This PEA outlines the technical and economic benefits of the Project and justifies the continuation to PFS level studies.
The mine is designed to produce 7.0 Mtpa of mill feed using conventional open pit methods. The process plant will use a conventional flowsheet to produce doré and copper concentrates for export, containing 5.0 Moz of gold, 4.9 Moz of silver, and 260 Mlb of copper over the life of mine.
The peak workforce during Project construction is estimated at 1,763. During operations, the peak workforce is estimated at 744. The Project will target a high percentage of the workforce to be hired from within Guyana.
The Project mine life is estimated at 21.3 years based on the current mining inventory. There are opportunities for future mine extension if additional mineral resources are defined through continued exploration.
At the base case assumption of $3,000 per ounce of gold, the Project is estimated to contribute $2.2 billion in income taxes and $1.2 billion in royalty payments to the Guyanese government. The estimated initial capital expenditure is $820 million. The cumulative after-tax net cash flow is $3.9 billion, including initial capital costs, pre-production costs, contingency, construction funding PMPA financing, other growth capital expenditures, closure, and losses from PMPA financing. Cash costs per ounce of gold are estimated at $826 and AISC per ounce of gold are estimated at $1,289. At the base case assumption of $3,000 per ounce of gold, the Project has an after-tax NPV5% of $1.8 billion, an IRR of 25.2%, and a payback period of 3.0 years.
There are no known significant risks and uncertainties that could reasonably be expected to affect the reliability or confidence in the exploration information or mineral resource estimate. The outcomes of the economic analysis are based on assumptions including gold price and capital and operating costs, the impact of which are shown in the sensitivity analysis provided in Section 22.
With the PEA complete, Aris Mining intends to complete a PFS in 2026 with a goal of advancing toward construction.
| Effective October 21, 2025 | Page |
NI 43-101 Technical Report Preliminary Economic Assessment for the Toroparu Project, Cuyuni-Mazaruni Region, Guyana
| 26 | Recommendations |
| 26.1 | Drilling recommendations |
The qualified person responsible for Section 10 recommends condemnation drilling in the area of planned Project infrastructure to ensure that no potentially economic mineralization underlies the proposed infrastructure. A first pass 400 by 400 m grid is recommended in the areas of the tailings facility, camp area, airstrip, processing plant, and waste dumps. The program will comprise approximately 100 drillholes for 6,000 m, for an estimated cost of $1.5 million.
| 26.2 | Mineral processing and metallurgical testing recommendations |
The qualified person responsible for Section 13 notes that the current PEA has been based on testwork conducted over the past decade using similar, but not identical, samples and objectives. To progress the Project to a Preliminary Feasibility Study level, a comprehensive metallurgical testwork program is recommended to confirm the chosen process criteria for both oxide and sulphide mill feed. The focus of this work should be on the Toroparu deposit, with all testwork performed on representative samples from within the mining schedule to ensure a reliable PFS level design can be further developed.
The recommended studies and testwork include:
| · | Mineralogical and liberation studies |
| o | undertake detailed mineralogical and liberation studies on head samples to characterize mineral associations, grain size distribution, and liberation characteristics; and |
| o | undertake comprehensive chemical analysis of the head samples to determine the complete elemental composition, including potential deleterious elements and key assay values. |
| · | Comminution studies |
| o | undertake comminution and material characterization tests for oxide, sulphide, and composite materials, including bulk and solid densities, uniaxial compressive strength, Bond crushability (Impact) work index, JKTech Drop Weight Test, Bond abrasion index, Bond ball mill work index, and SAG mill test (Starkey); and |
| o | assess whether high saprolite blends in the mill feed could allow for elevated processing rates. |
| · | Gravity and intensive leach testwork |
| o | evaluate the mill feed performance in a Knelson gravity concentration circuit with intensive cyanidation of the gravity concentrate. Assess the effect of hydrogen peroxide doxing for cyanide destruction of the intensive leach residue across oxide, sulphide, and composite materials. |
| · | Flotation testwork |
| o | undertake flotation testwork to evaluate desulphurization of the mill feed, selective copper recovery to concentrate, and gold recovery to tailings; |
| o | confirm and optimize the reagent suit, including hydrated lime pH modifier, primary collector, secondary collector, frother, and gangue depressant; |
| o | complete the flotation testing in both open circuit and locked cycle modes for a four stage flotation configuration including rougher, regrind, cleaner, recleaner, and re-recleaner, in line with the proposed process flowsheet; and |
| o | conduct comparative assessments of flotation recovery versus primary grind size and regrind size. |
| · | Leaching testwork |
| o | undertake leaching studies including both bottle roll and tank leach tests to compare carbon in pulp and carbon in leach performance. Leach testwork should include leach gravity tailings on oxide only material, leach flotation tailings on sulphide only material, and leach flotation tailings on composite oxide and sulphide material; and |
| o | use key test parameters to monitor reagent consumption, oxygen consumption, adsorption kinetics, and leach performance versus grind size. The feasibility of cold cyanide stripping for copper removal from loaded carbon should be assessed. |
| · | Detoxification testwork |
| o | evaluate the INCO SO2/air cyanide detoxification process focussing on reagent and oxygen consumption, including lime, sodium metabisulphite, copper sulphate pentahydrate, and caustic soda. |
| · | Settling, flocculation, and underflow rheology testwork |
| Effective October 21, 2025 | Page |
NI 43-101 Technical Report Preliminary Economic Assessment for the Toroparu Project, Cuyuni-Mazaruni Region, Guyana
| o | evaluate colloidal stability to determine achievable underflow density, optimum flocculant dosage, and solids loading rates using a bench scale dynamic thickener; and |
| o | undertake static thickening and flocculant screening tests to determine flocculant type, optimum dosage, and feed solids concentration for maximum settling efficiency. |
| · | Water quality assessment |
| o | verify the quality and suitability of the Puruni River water as the primary process water source. Conduct full water analysis to determine its chemical composition, suspended solids content, and compatibility with process reagents and plant equipment. The results will inform process water treatment requirements and potential impacts on metallurgical performance. |
| · | Integration and laboratory requirements |
| o | Conduct all testwork at a single accredited laboratory to ensure consistency and comparability of results. All testwork should yield comparative insights for oxide only, sulphide only, and composite oxide-sulphide operations. |
The cost to complete this testwork and the PFS is estimated at $1.25 million.
| 26.3 | Mining recommendations |
The qualified person responsible for Section 16 recommends the following additional testwork and studies to advance the Project to a PFS level and to support the development of PFS level engineering designs and cost estimates.
| · | Mining and infrastructure |
| o | undertake surface drilling to verify geotechnical data and related assumptions and update the geotechnical and slope stability analyses for PFS open pit slope designs and waste rock management facility slope stability; | |
| o | update the input parameters for the pit optimization process following trade-off studies on the pit selection; | |
| o | assess alternative material handling options; | |
| o | undertake the mine design, pushback sequencing, life of mine schedule, and waste rock management facilities to a PFS level of accuracy. Consider the potential mining mix in terms of selectivity or flexibility, in the context of the rainy seasons and other logistical challenges while maximizing early operating margins in the shorter term, and to accommodate the processing of mineralized waste material over the longer term; | |
| o | assess the transition zone between surface to underground mining operations to demonstrate additional upside potential; and |
develop an appropriate contractor tender package to secure accurate contractor mining rates from reputable contractors for the operating cost estimates, as an alternative to owner mining. The cost to complete the testwork and studies is estimated at approximately $0.7 million.
| · | Hydrogeology |
| o | continuously monitor site rainfall data; | |
| o | continue monitoring site surface water and groundwater quality for analysis at an accredited laboratory to acquire additional pre-mining baseline water quality data and in particular to evaluate the effect of artisanal mining on the site water quality; | |
| o | undertake site tests to quantify the vertical hydraulic conductivity of the saprolite, and update the 3D numerical groundwater flow model; | |
| o | update the site wide water balance to include chemical mass load modelling as well as the expected water quality to be discharged to the environment. Simulate the catchment runoff in more detail to determine the abstraction requirements for mine water supply and yield of the rivers in case of lower than expected rainfall years; | |
| o | update the numerical groundwater model and run additional sensitivities with the inclusion of faults acting as sub surface conduits; | |
| o | model the tailings and waste rock management facilities in more detail to determine the potential for chemical mass release and downstream environmental impacts. Undertake site specific adsorption tests on arsenic and related chemical constituents to inform a hydrogeochemical model to quantify the waste source release and downstream migration rates to potential environmental receptors such as the Puruni River. Update the Source-Pathway-Receptor model based on a detailed tailings management facility water balance and the |
| Effective October 21, 2025 | Page |
NI 43-101 Technical Report Preliminary Economic Assessment for the Toroparu Project, Cuyuni-Mazaruni Region, Guyana
| hydrogeochemical model outputs to quantify the potential risks of contaminant migration potential. Evaluate the potential impacts against environmental risk limits; |
| o | verify the presence of potential sub-surface groundwater flow zones such as fault zones with a surface geophysical survey. Target, drill, and aquifer test any identified sub surface groundwater flow zones and consider their use as dewatering boreholes; | |
| o | drill groundwater monitoring boreholes within the vicinity of the Sona Hill pit to acquire site specific groundwater monitoring data; | |
| o | evaluate the possibility and potential effect of mud rush into the pits; | |
| o | progress the hydrogeological model through the following studies and technical workstreams: |
| § | vertical hydraulic conductivity and transmissivity saprolite pumping tests | |
| § | electrical resistivity tomography geophysical surveys within the vicinity of the planned tailings management facility and open pits; | |
| § | update the 3D numerical Finite Element subsurface flow system model; | |
| § | model the static site wide water and salt balance; and | |
| § | undertake adsorption tests and update the geochemical model; | |
| § | complete three additional groundwater monitoring boreholes near Sona Hill. |
The cost to complete the testwork and studies is estimated at approximately $0.2 million.
| · | Hydrology |
| o | Undertake geotechnical and soils studies of the Project area, including particle soil distribution of the upper soils in the catchment area to determine soil texture, permeability tests of the upper soils in the catchment area, geotechnical test pits along the proposed protection levees and at culvert locations, and laboratory tests on the saprolite material to assess whether it can be made more impermeable and used as a clay core for the protection levees; | |
| o | Continue the monitoring of rainfall and flow in the Puruni and Wynamu rivers, ensure regular calibration of the flow measuring devices, and report on outages, changes, and issues with the monitoring; | |
| o | Extend the LIDAR survey further to the southeast of the Project to minimize assumptions for the flood modelling and levee designs; |
The cost to complete the testwork and studies is estimated at approximately $0.04 million.
| 26.4 | Surface infrastructure recommendations |
The qualified person responsible for surface infrastructure recommends the following work and studies to advance to a preliminary feasibility study:
| · | Surface infrastructure |
| o | undertake further investigations into the local regulations for the airstrip to assess whether the airstrip width could be reduced, which would lower bulk fill material requirements and costs; | |
| o | investigate whether a more economical route located closer to the tailings management facility is available for the tailings access road, which would lower material requirements and costs; | |
| o | conduct test pits and rotary core drilling on the road centrelines and 30 m on either side of the roads at intervals no more than 200 m to obtain more detailed geotechnical information; | |
| o | conduct oriented diamond drillholes oriented perpendicular to the horizontal alignment of the roads, typically extending at least 5 m below the roadway elevation, to characterize the soil and rock mass properties for the deep cutting designs (of what). Determine the rock mass properties using downhole geophysics such as an acoustic televiewer; | |
| o | conduct laboratory testwork on soil and rock samples collected from the pits and drill core. For soil samples, the testwork should include particle size distribution, Atterberg Limits, specific gravity, moisture-density, California Bearing Ratio, oedometer, and triaxial isotropically consolidated, drained, and undrained tests. For rock samples, the testwork should include unconfined compression method tests and triaxial compressive strength; | |
| o | undertake a similar testing scope for all terrace locations where heavily loaded structures will be constructed, as well as for those with planned deep cuts and high fill slopes. The geotechnical properties of all materials in |
| Effective October 21, 2025 | Page |
NI 43-101 Technical Report Preliminary Economic Assessment for the Toroparu Project, Cuyuni-Mazaruni Region, Guyana
| cut slopes, as well as those planned for use as engineered fill, should be determined using the recommended soil laboratory testing scope; and |
| o | undertake material testing on in situ rock for suitability in the use of concrete as fine and coarse aggregate. Fine aggregate testwork should include particle size distribution, dust content, and fineness modulus while coarse aggregate testwork should include particle size distribution, dust content, fineness modulus, 10% fines aggregate crushing test, aggregate crushing value, flakiness index, chloride content, organic impurities, and soluble deleterious materials. |
The cost to complete this testwork is estimated at $1 million.
| 26.5 | Tailings management facility recommendations |
The qualified person responsible for the tailings management facility recommends the following work and studies to advance to a preliminary feasibility study:
| · | develop an interdisciplinary knowledge base; | |
| · | undertake site characterization including climate, geomorphology, hydrology, and hydrogeology; | |
| · | undertake geotechnical site investigations including desktop assessments benchmarked against similar projects, geophysical studies, and seismic hazard assessment to confirm the embankment founding conditions, and the geotechnical character of the embankment zones, facility basin, return water dam, and centrelines of the channels and access roads; | |
| · | undertake tailings characterization studies such as particle size distribution, foundation indicators, specific gravity, drained and undrained strength behaviour, geochemical properties, and rheology; | |
| · | undertake a tailings dam breach assessment incorporating credible failure modes and with contour data that represent the natural ground level of the areas that were inundated in the analysis and slightly beyond, as well as the site specific rheological data; | |
| · | undertake confidence classification in accordance with regulatory and industry standards; | |
| · | design the tailings management facility based on the determined consequence classification; | |
| · | update the design basis report, including a failure modes and effects analysis; | |
| · | undertake stability assessments, including seepage analysis and 2D limit equilibrium analysis using available site specific data; | |
| · | develop a dynamic site wide water balance to optimize the water management infrastructure and water treatment plant sizing; | |
| · | develop a conceptual closure design for the facility; | |
| · | further optimize the facility footprint and stage development; | |
| · | undertake a water quality chemical mass balance study for the facility effluent considering the water quality of supernatant within the tailings stormwater run off, baseline water quality in the area, and allowable water quality for release; | |
| · | conduct a detailed surface topographical survey of the Project site; | |
| · | perform a waste classification and geochemical assessment; | |
| · | undertake design reviews and optimization of the barrier systems, drainage systems, channel designs, and return water dam barrier systems to assess potentials for cost and construction time savings; | |
| · | develop and plan the decant system; | |
| · | identify and confirm borrow areas for sourcing suitable construction materials; | |
| · | investigate the raising of the stage 2 footprint for the full life of mine to reduce the facility footprint and construction costs; | |
| · | assess the barrier system requirements on the basis of the geochemical and water quality chemical mass balance; and | |
| · | assess whether the capital and operating costs can be reduced by considering the rheology and adjusting the water balance; |
The cost to complete this testwork is estimated at $1.5 million.
| 26.6 | Environmental recommendations |
The qualified person responsible for Section 20 makes the following recommendations:
| Effective October 21, 2025 | Page |
NI 43-101 Technical Report Preliminary Economic Assessment for the Toroparu Project, Cuyuni-Mazaruni Region, Guyana
| · | install additional weather monitoring stations at the Project to improve data collection and quality control; |
| · | resume biennial biodiversity monitoring programs within the proposed Project footprint; |
| · | undertake additional humidity cell testing to further assess metal leaching of waste rock, low-grade economic material, and the open pit walls under alkaline conditions; and |
| · | assess the potential environmental impacts of elevated metal discharge concentration relevant to the background water quality of the receptor. |
This work can be undertaken as part of the future Project permitting work and will be accounted for within the existing environmental budget.
| Effective October 21, 2025 | Page |
NI 43-101 Technical Report Preliminary Economic Assessment for the Toroparu Project, Cuyuni-Mazaruni Region, Guyana
| 27 | References |
| Author and Date | Title |
| CIM, 2014 | CIM Definition Standards for Mineral Resources and Mineral Reserves. Prepared by the CIM Standing Committee on Reserve Definitions, adopted by CIM Council 19 May 2014. |
| CIM, 2019 | CIM Estimation of Mineral Resources and Mineral Reserves Best Practice Guidelines. Prepared by the CIM Mineral Resource and Mineral Reserve Committee, adopted by the CIM Council on 29 November 2019. |
| Pratt and Smeraglia, 2022 | Geological model for the Toroparu gold deposit, Guyana. Report prepared by Warren Pratt and Luca Smeraglia of Specialised Geological Mapping Ltd for Aris Mining, dated October 2022. |
| Effective October 21, 2025 | Page |
NI 43-101 Technical Report Preliminary Economic Assessment for the Toroparu Project, Cuyuni-Mazaruni Region, Guyana
| 28 | Date, signatures, and certificates of qualified persons |
Certificate of Qualified Person
Vaughn Duke
2nd Floor, The Axis, 26 CyberCity, Ebene 72201, Mauritius
I, Vaughn Duke, Pr. Eng., do hereby certify that:
| 1. | I am the Founding Partner and Director of Sound Mining International Limited in Mauritius at 2nd Floor, The Axis, 26 CyberCity, Ebene 72201. |
| 2. | This certificate applies to the technical report titled “NI 43-101 Technical Report Preliminary Economic Assessment for the Toroparu Project, Cuyuni-Mazaruni Region, Guyana” with an effective date of October 21, 2025 (the Technical Report). |
| 3. | I obtained a Bachelor of Science degree in Mining Engineering from the University of Witwatersrand, Johannesburg, South Africa in 1986 and an MBA in Business Administration from the Gordon Institute of Business Science in Sandton, South Africa in 2002. I am a Fellow of the South African Institute of Mining and Metallurgy. I have practiced as a mining engineer since my graduation in 1986. |
| 4. | I have read the definition of “qualified person” set out in National Instrument 43-101 Standards of Disclosure for Mineral Projects (NI 43 101) and certify that by reason of my education, affiliation with a professional association (as defined in NI 43-101) and past relevant work experience, I am a “qualified person” for the purposes of NI 43-101. |
| 5. | I visited the Toroparu Project from June 10 to 12, 2025 (three days). |
| 6. | I am responsible for Sections 2, 12, 15, 16, 18, 19, 21, 22, 24, and 27, and the relevant summaries of those sections in Sections 1, 25, and 26 of the Technical Report. |
| 7. | I am independent of Aris Mining Corporation as described in section 1.5 of NI 43-101. |
| 8. | I have not had any prior involvement with the property that is the subject of the Technical Report. |
| 9. | I have read NI 43-101 and Form 43-101F1 and the sections of the Technical Report I am responsible for have been prepared in compliance with that instrument and form. |
| 10. | As of the effective date of the Technical Report, to the best of my knowledge, information and belief, the sections of the Technical Report I am responsible for contain all scientific and technical information that is required to be disclosed to make the Technical Report not misleading. |
Dated this 28th day of October, 2025
“Vaughn Duke” (signed)
| Effective October 21, 2025 | Page |
NI 43-101 Technical Report Preliminary Economic Assessment for the Toroparu Project, Cuyuni-Mazaruni Region, Guyana
Certificate of Qualified Person
Jan Eklund
Block E, Lonehill Office Park, 3 Lone Close, Lonehill, Sandton, 2062, South Africa
I, Jan Eklund, P.E., do hereby certify that:
| 1. | I am employed as a Process Consultant of LogiProc Pty. Ltd. at Block E, Lonehill Office Park, 3 Lone Close, Lonehill, Sandton, 2062 South Africa. |
| 2. | This certificate applies to the technical report titled “NI 43-101 Technical Report Preliminary Economic Assessment for the Toroparu Project, Cuyuni-Mazaruni Region, Guyana” with an effective date of October 21, 2025 (the Technical Report). |
| 3. | I obtained a Bachelor of Science degree in Metallurgical Engineering from the University of Witwatersrand, Johannesburg, South Africa in 1988. I am a Fellow of the South African Institute of Mining and Metallurgy. I have practiced as an extractive metallurgist since my graduation in 1989. |
| 4. | I have read the definition of “qualified person” set out in National Instrument 43-101 Standards of Disclosure for Mineral Projects (NI 43 101) and certify that by reason of my education, affiliation with a professional association (as defined in NI 43-101) and past relevant work experience, I am a “qualified person” for the purposes of NI 43-101. |
| 5. | I did not conduct a personal inspection of Toroparu Project. |
| 6. | I am responsible for Sections 2, 12, 13, 17, 18, 24, and 27, and the relevant summaries of those sections in Sections 1, 25, and 26 of the Technical Report. |
| 7. | I am independent of Aris Mining Corporation as described in section 1.5 of NI 43-101. |
| 8. | I have not had any prior involvement with the property that is the subject of the Technical Report. |
| 9. | I have read NI 43-101 and Form 43-101F1 and the sections of the Technical Report I am responsible for have been prepared in compliance with that instrument and form. |
| 10. | As of the effective date of the Technical Report, to the best of my knowledge, information and belief, the sections of the Technical Report I am responsible for contain all scientific and technical information that is required to be disclosed to make the Technical Report not misleading. |
Dated this 28th Day of October, 2025
“Jan Eklund” (signed)
| Effective October 21, 2025 | Page |
NI 43-101 Technical Report Preliminary Economic Assessment for the Toroparu Project, Cuyuni-Mazaruni Region, Guyana
Certificate of Qualified Person
Pamela De Mark
2400-1021 West Hastings Street, Vancouver, V6E 0C3, British Columbia, Canada
I, Pamela De Mark, P.Geo., do hereby certify that:
| 1. | I am the Senior Vice President of Geology and Exploration of Aris Mining Corporation in Vancouver, British Columbia, Canada at 2400-1021 West Hastings Street, Vancouver, V6E 0C3. |
| 2. | This certificate applies to the technical report titled “NI 43-101 Technical Report Preliminary Economic Assessment for the Toroparu Project, Cuyuni-Mazaruni Region, Guyana” with an effective date of October 21, 2025 (the Technical Report). |
| 3. | I obtained an Honours Bachelor of Applied Science degree in Applied Geology from the University of Technology, Sydney, Australia in 1994. I am a registered Professional Geoscientist with Engineers and Geoscientists British Columbia. I have practiced as a mine geologist since my graduation in 1994. |
| 4. | I have read the definition of “qualified person” set out in National Instrument 43-101 Standards of Disclosure for Mineral Projects (NI 43 101) and certify that by reason of my education, affiliation with a professional association (as defined in NI 43-101) and past relevant work experience, I am a “qualified person” for the purposes of NI 43-101. |
| 5. | I visited the Toroparu Project most recently from July 4 to 6, 2025 (three days). |
| 6. | I am responsible for Sections 2, 3, 4, 5, 6, 7, 8, 9, 10, 11, 12, 14, 20, 23, 24, and 27, and the relevant summaries of those sections in Sections 1, 25, and 26 of the Technical Report. |
| 7. | I am not independent of Aris Mining Corporation as described in section 1.5 of NI 43-101. |
| 8. | I have been involved with the property that is the subject of the Technical Report since September 26, 2022 when Aris Gold Corporation completed a business combination with GCM Mining. |
| 9. | I have read NI 43-101 and Form 43-101F1 and the sections of the Technical Report I am responsible for have been prepared in compliance with that instrument and form. |
| 10. | As of the effective date of the Technical Report, to the best of my knowledge, information and belief, the sections of the Technical Report I am responsible for contain all scientific and technical information that is required to be disclosed to make the Technical Report not misleading. |
Dated this 28th day of October, 2025
“Pamela De Mark” (signed)
| Effective October 21, 2025 | Page |
NI 43-101 Technical Report Preliminary Economic Assessment for the Toroparu Project, Cuyuni-Mazaruni Region, Guyana
| Appendix A – Toroparu mineral titles |
The permits listed in the table below are subject to the A&R Joint Venture Agreement and are held in trust for the exclusive benefit of ETK until such time that the GGMC and the Minister of Natural Resources of Guyana convert such permits to large scale mining licenses and issue the same in the name of ETK.
| Permit type | GS8 number | MP number | Area (Acres) | Location | Map number | Renewal anniversary |
| Mining Permit | A-4/MP/000 | 007/2004 | 1,123 | Mazaruni | 24NE | 28-Apr |
| Mining Permit | A-4/MP/001 | 008/2004 | 1,117 | Mazaruni | 24NE | 28-Apr |
| Mining Permit | A-4/MP/002 | 009/2004 | 1,200 | Mazaruni | 24NE | 28-Apr |
| Mining Permit | A-4/MP/003 | 010/2004 | 1,145 | Mazaruni | 24NE | 28-Apr |
| Mining Permit | A-4/MP/004 | 011/2004 | 603 | Mazaruni | 24NE | 28-Apr |
| Mining Permit | A-4/MP/005 | 012/2004 | 858 | Mazaruni | 24NE | 28-Apr |
| Mining Permit | A-4/MP/006 | 013/2004 | 1,098 | Mazaruni | 24NE | 28-Apr |
| Mining Permit | A-4/MP/007 | 014/2004 | 992 | Mazaruni | 24NE | 28-Apr |
| Mining Permit | A-4/MP/008 | 015/2004 | 1,145 | Mazaruni | 24NE | 28-Apr |
| Mining Permit | A-4/MP/009 | 016/2004 | 893 | Mazaruni | 24NE | 28-Apr |
| Mining Permit | A-182/MP/000 | 161/2014 | 291 | Mazaruni | 24NE | 1-Jun |
| Mining Permit | A-183/MP/000 | 162/2014 | 996 | Mazaruni | 24NE | 1-Jun |
| Mining Permit | A-194/MP/000 | 609/2014 | 1,199 | Mazaruni | 24NE | 1-Aug |
| Mining Permit | A-195/MP/000 | 610/2014 | 955 | Mazaruni | 24NE | 1-Aug |
| Mining Permit | A-196/MP/000 | 611/2014 | 1,119 | Mazaruni | 24NE | 1-Aug |
| Mining Permit | A-95/MP/000 | 313/2013 | 1,000 | Mazaruni | 24NE | 1-Sep |
| Mining Permit | A-111/MP/000 | 415/2013 | 1,026 | Mazaruni | 24NE | 1-Oct |
| Mining Permit | A-116/MP/000 | 419/2013 | 449 | Mazaruni | 24SE | 1-Oct |
| Mining Permit | A-117/MP/000 | 420/2013 | 686 | Mazaruni | 24SE | 1-Oct |
| Mining Permit | A-40/MP/000 | 253/2010 | 1,158 | Mazaruni | 24SE | 1-Nov |
| Mining Permit | A-89/MP/000 | 410/2013 | 1,132 | Mazaruni | 24SE/24NE | 1-Nov |
| Mining Permit | A-1022/MP/000 | 171/2017 | 1,200 | Mazaruni | 24SE | 27-Dec |
| Total | 21,385 |
The permits listed in the table below are subject to the Godette Agreement and are held in trust for the exclusive benefit of ETK until such time that the GGMC and the Minister of Natural Resources of Guyana convert such permits to large scale mining licenses and issue the same in the name of ETK.
| Permit type | GS8 number | MP number | Area (Acres) |
Location | Map number | Renewal anniversary |
| Mining Permit | G-6/MP/000 | 007/2003 | 1,190 | Toroparu | 24NE | 9-Aug |
| Mining Permit | G-6/MP/001 | 008/2003 | 1,118 | Toroparu | 24NE | 9-Aug |
| Mining Permit | G-6/MP/002 | 009/2003 | 962 | Toroparu | 24NE | 9-Aug |
| Mining Permit | G-23/MP/000 | 278/2010 | 747 | Toroparu | 24NE | 9-Dec |
| Total | 4,017 |
| Effective October 21, 2025 | Page |
NI 43-101 Technical Report Preliminary Economic Assessment for the Toroparu Project, Cuyuni-Mazaruni Region, Guyana
The small claims listed in the table below are subject to the Godette Agreement and are held in trust for the exclusive benefit of ETK until such time that the GGMC and the Minister of Natural Resources of Guyana convert such permits to large scale mining licenses and issue the same in the name of ETK.
| Permit type | HO number | Claim name | Area (Acres) |
Location | Map number | Renewal anniversary |
| Small Claim | 34/2011/041 | OZ #5 | 1.43 | Toroparu | 24NE | 12-Mar |
| Small Claim | 34/2011/042 | OZ #6 | 1.32 | Toroparu | 24NE | 12-Mar |
| Small Claim | 34/2011/043 | OZ #7 | 1.67 | Toroparu | 24NE | 12-Mar |
| Small Claim | 34/2011/044 | OZ #8 | 1.44 | Toroparu | 24NE | 12-Mar |
| Small Claim | 34/2011/045 | OZ #9 | 1.51 | Toroparu | 24NE | 12-Mar |
| Small Claim | 34/2011/046 | OZ #10 | 1.69 | Toroparu | 24NE | 12-Mar |
| Small Claim | 34/2011/047 | OZ #11 | 1.8 | Toroparu | 24NE | 12-Mar |
| Small Claim | 34/2011/048 | OZ #12 | 1.23 | Toroparu | 24NE | 12-Mar |
| Small Claim | 34/2011/049 | OZ #13 | 1.39 | Toroparu | 24NE | 12-Mar |
| Total | 13.48 |
The permits listed in the table below are subject to the A&R Joint Venture Agreement and are held in trust for the exclusive benefit of ETK until such time that the GGMC and the Minister of Natural Resources of Guyana convert such permits to large scale mining licenses and issue the same in the name of ETK.
| Permit type | GS8 number | PPMS number | Area (Acres) |
Location | Map number | Renewal anniversary |
| Prospecting Permit | A-140/011/258/97 | 0090/2000 | 1,105 | Upper Mazaruni | 24NE | 10-Feb |
| Prospecting Permit | A140/023/270/97 | 0091/2000 | 1,058 | Puruni River | 24NE/24SE | 10-Feb |
| Prospecting Permit | A-140/024/271/97 | 0092/2000 | 1,180 | Puruni River | 24SE | 10-Feb |
| Prospecting Permit | A-140/025/272/95 | 0093/2000 | 1,126 | Puruni River | 24SE | 10-Feb |
| Prospecting Permit | A-140/026/273/97 | 0094/2000 | 957 | Puruni River | 24SE | 10-Feb |
| Prospecting Permit | A-140/027/274/97 | 0095/2000 | 828 | Puruni River | 24SE | 10-Feb |
| Prospecting Permit | A-140/028/0275/97 | 0195/2001 | 1,120 | Puruni River | 24SE | 13-Mar |
| Prospecting Permit | A-184/000/0394/99 | 0264/2001 | 848 | Puruni River | 24NE | 11-Mar |
| Prospecting Permit | A-184/002/0396/99 | 0266/2001 | 1134 | Ikuk River | 24NE | 11-Mar |
| Prospecting Permit | A-185/003/0411/99 | 0227/2001 | 1,009 | Puruni River | 24NE | 7-Mar |
| Prospecting Permit | A-185/007/0415/99 | 0330/2001 | 1,107 | Upper Puruni | 24NE | 6-Mar |
| Prospecting Permit | A-185/008/0416/99 | 0331/2001 | 1,067 | Upper Puruni | 24NE | 6-Mar |
| Prospecting Permit | A-185/013/0421/99 | 0333/2001 | 1,078 | Upper Puruni | 24NE | 7-Mar |
| Prospecting Permit | A-185/014/0422/99 | 0334/2001 | 1,136 | Upper Puruni | 24NE | 6-Mar |
| Prospecting Permit | A-185/015/0423/99 | 0335/2001 | 1,200 | Ikuk River | 24NE | 6-Mar |
| Prospecting Permit | A-185/016/0424/99 | 0336/2001 | 649 | Ikuk River | 24NE | 6-Mar |
| Prospecting Permit | A-185/019/0427/99 | 0339/2001 | 622 | Upper Puruni | 24NE | 6-Mar |
| Prospecting Permit | A-185/020/0428/99 | 0340/2001 | 689 | Upper Puruni | 24NE | 6-Mar |
| Prospecting Permit | A-185/021/0429/99 | 0341/2001 | 660 | Upper Puruni | 24NE | 6-Mar |
| Prospecting Permit | A-185/024/0432/99 | 0344/2001 | 1,199 | Ikuk River | 24NE | 7-Mar |
| Prospecting Permit | A-185/025/0433/99 | 0345/2001 | 1,067 | Ikuk River | 24NE | 8-Mar |
| Effective October 21, 2025 | Page |
NI 43-101 Technical Report Preliminary Economic Assessment for the Toroparu Project, Cuyuni-Mazaruni Region, Guyana
| Permit type | GS8 number | PPMS number | Area (Acres) |
Location | Map number | Renewal anniversary |
| Prospecting Permit | A-185/026/0426/99 | 0346/2001 | 742 | Putaring | 24NE | 8-Mar |
| Prospecting Permit | A-185/028/0436/99 | 0347/2001 | 1,150 | Putaring | 24NE | 7-Mar |
| Prospecting Permit | A-185/029/0437/99 | 0348/2001 | 1,139 | Putaring | 24NE | 7-Mar |
| Prospecting Permit | A-185/030/0438/99 | 0349/2001 | 1,035 | Putaring | 24NE | 8-Mar |
| Prospecting Permit | A-185/031/0439/99 | 0350/2001 | 1,081 | Putaring | 24NE | 8-Mar |
| Prospecting Permit | A-185/032/0440/99 | 0351/2001 | 1,200 | Putaring | 24NE | 6-Mar |
| Prospecting Permit | A-185/033-0441/99 | 0352/2001 | 1,200 | Putaring | 24NE | 6-Mar |
| Prospecting Permit | A-185/035/0443/99 | 0354/2001 | 1,066 | Puruni River | 24NE | 8-Mar |
| Prospecting Permit | A-185/009/0417/99 | 0424/2001 | 1,190 | Upper Puruni | 24NE | 27-May |
| Prospecting Permit | A-106/014/500/95 | 164/2000 | 846 | Puruni River | 25NW | 6-Jun |
| Prospecting Permit | A-106/015/501/95 | 165/2000 | 1,051 | Puruni River | 25NW | 6-Jun |
| Prospecting Permit | A-106/016/502/95 | 166/2000 | 936 | Puruni River | 25NW | 6-Jun |
| Prospecting Permit | A-106/017/503/95 | 167/2000 | 963 | Puruni River | 24NE/25NW | 6-Jun |
| Prospecting Permit | A-106/018/504/95 | 168/2000 | 728 | Puruni River | 24NE/25NW | 6-Jun |
| Prospecting Permit | A-140/012/97 | 0467/2002 | 1,120 | Upper Mazaruni | 24NE | 7-Jul |
| Prospecting Permit | A-140/021/268/97 | 0523/2001 | 948 | Tamakay | 24NE/24SE | 27-Aug |
| Prospecting Permit | A-184/009/99 | 0579/2002 | 804 | Upper Puruni | 24NE | 15-Aug |
| Prospecting Permit | A-184/010/99 | 0580/2002 | 780 | Upper Puruni | 24NE | 15-Aug |
| Prospecting Permit | A-184/011/99 | 0581/2002 | 780 | Upper Puruni | 24NE | 15-Aug |
| Prospecting Permit | A-184/012/99 | 0582/2002 | 1058 | Upper Puruni | 24NE | 15-Aug |
| Prospecting Permit | A-184/013/99 | 0583/2002 | 1170 | Upper Puruni | 24NE | 15-Aug |
| Prospecting Permit | A-185/001/99 | 0577/2002 | 795 | Upper Puruni | 24NE | 15-Aug |
| Prospecting Permit | A-185/002/99 | 0578/2002 | 1,143 | Upper Puruni | 24NE | 14-Aug |
| Prospecting Permit | A-199/000/2000 | 620/2001 | 1,016 | Puruni River | 25NW | 19-Sep |
| Prospecting Permit | A-199/021/2000 | 639/2001 | 1,011 | Puruni River | 24NE | 20-Sep |
| Prospecting Permit | A-199/022/2000 | 640/2001 | 995 | Puruni River | 24NE | 20-Sep |
| Prospecting Permit | A-199/023/2000 | 641/2001 | 965 | Puruni River | 24NE | 20-Sep |
| Prospecting Permit | A-199/024/2000 | 642/2001 | 958 | Puruni River | 24NE | 20-Sep |
| Prospecting Permit | A-199/025/2000 | 643/2001 | 1,024 | Puruni River | 24NE | 20-Sep |
| Prospecting Permit | A-140/013/97 | 0659/2002 | 1,065 | Upper Puruni | 24NE | 6-Oct |
| Prospecting Permit | A-140/014/97 | 0660/2002 | 1,085 | Upper Puruni | 24NE | 6-Oct |
| Prospecting Permit | A-140/018/97 | 0663/2002 | 1,035 | Tamakay | 24NE | 6-Oct |
| Prospecting Permit | A-140/019/97 | 0664/2002 | 1,106 | Tamakay | 24NE | 6-Oct |
| Prospecting Permit | A-140/020/97 | 0665/2002 | 1,133 | Upper Puruni | 24NE | 6-Oct |
| Prospecting Permit | A-140/030/97 | 0667/2002 | 1,012 | Tamakay | 24NE/24SE | 6-Oct |
| Prospecting Permit | A-185/027/99 | 0697/2002 | 868 | Upper Puruni | 24NE | 16-Oct |
| Prospecting Permit | A-199/033/2000 | 0644/2002 | 1,047 | Tamakay | 24NE | 7-Oct |
| Prospecting Permit | A-199/035/2000 | 0646/2002 | 721 | Tamakay | 24NE | 7-Oct |
| Prospecting Permit | A-199/038/00 | 0649/2002 | 1,113 | Upper Puruni | 25NW | 8-Oct |
| Prospecting Permit | A-199/039/00 | 0686/2002 | 912 | Upper Puruni | 25NW | 8-Oct |
| Prospecting Permit | A-199/040/00 | 0687/2002 | 896 | Upper Puruni | 25NW | 8-Oct |
| Effective October 21, 2025 | Page |
NI 43-101 Technical Report Preliminary Economic Assessment for the Toroparu Project, Cuyuni-Mazaruni Region, Guyana
| Permit type | GS8 number | PPMS number | Area (Acres) |
Location | Map number | Renewal anniversary |
| Prospecting Permit | A-218/001/2001 | 0678/2002 | 585 | Tamakay | 24SE | 15-Oct |
| Prospecting Permit | A-302/001 | 0672/2003 | 389 | Puruni River | 24SE | 5-Nov |
| Prospecting Permit | A-302/002 | 0671/2003 | 556 | Puruni River | 24SE | 5-Nov |
| Total | 63,256 |
The Small Claim permits listed in the table below are subject to the A&R Joint Venture Agreement and are held in trust for the exclusive benefit of ETK until such time that the GGMC and the Minister of Natural Resources of Guyana convert such permits to large scale mining licenses and issue the same in the name of ETK.
| Permit type | HO number | Claim name | Area
(Acres) |
Location | Map number | Renewal anniversary |
| Small Claim | 31/1994/501 | JOY #1 | 27 | Toroparu | 24NE | 1-Mar |
| Small Claim | 31/1994/502 | JOY #2 | 27 | Toroparu | 24NE | 1-Mar |
| Small Claim | 31/1994/503 | JOY #3 | 27 | Toroparu | 24NE | 1-Mar |
| Small Claim | 31/1994/504 | JOY #4 | 27 | Toroparu | 24NE | 1-Mar |
| Small Claim | 31/1994/505 | PAM #1 | 27 | Toroparu | 24NE | 1-Mar |
| Small Claim | 31/1994/506 | PAM #2 | 27 | Toroparu | 24NE | 1-Mar |
| Small Claim | 31/1994/507 | PAM #3 | 27 | Toroparu | 24NE | 1-Mar |
| Total | 189 |
| Permit type | GS8 number | PL number | Area (Acres) |
Location | Map number | Renewal anniversary |
| Prospecting License Application | GS14:E-26 | 32/2013 | 9,570 | Wynamu | 16SE | Applied in Feb 2020 |
| Prospecting License Application | GS14:E-27 | 33/2013 | 7,254 | Wynamu East | 16SE/17SW | Applied in Feb 2020 |
| Total | 16,824 |
| Effective October 21, 2025 | Page |