UNITED STATES
SECURITIES AND EXCHANGE COMMISSION
Washington, D.C. 20549
FORM 8-K
CURRENT REPORT
Pursuant to Section 13 or 15(d) of the Securities Exchange Act of 1934
Date of Report (Date of earliest event reported) October 28, 2025
ECOLAB INC.
(Exact name of registrant as specified in its charter)
Delaware |
|
1-9328 |
|
41-0231510 |
(State or other jurisdiction |
|
(Commission |
|
(IRS Employer |
1 Ecolab Place, Saint Paul, Minnesota |
|
|
|
55102 |
(Address of principal executive offices) |
|
|
|
(Zip Code) |
Registrant’s telephone number, including area code 1-800-232-6522 | ||
(Not applicable)
(Former name or former address, if changed since last report.)
Check the appropriate box below if the Form 8-K filing is intended to simultaneously satisfy the filing obligation of the registrant under any of the following provisions (see General Instruction A.2. below):
☐ Written communications pursuant to Rule 425 under the Securities Act (17 CFR 230.425)
☐ Soliciting material pursuant to Rule 14a-12 under the Exchange Act (17 CFR 240.14a-12)
☐ Pre-commencement communications pursuant to Rule 14d-2(b) under the Exchange Act (17 CFR 240.14d-2(b))
☐ Pre-commencement communications pursuant to Rule 13e-4(c) under the Exchange Act (17 CFR 240.13e-4(c))
Securities registered pursuant to Section 12(b) of the Act:
Title of each class |
|
Trading symbol(s) |
|
Name of each exchange on which registered |
Common Stock, $1.00 par value |
|
ECL |
|
New York Stock Exchange |
Indicate by check mark whether the registrant is an emerging growth company as defined in Rule 405 of the Securities Act of 1933 (§230.405 of this chapter) or Rule 12b-2 of the Securities Exchange Act of 1934 (§240.12b-2 of this chapter).
Emerging growth company ☐
If an emerging growth company, indicate by check mark if the registrant has elected not to use the extended transition period for complying with any new or revised financial accounting standards provided pursuant to Section 13(a) of the Exchange Act. ☐
Item 2.02 Results of Operations and Financial Condition.
On October 28, 2025, Ecolab Inc. (“Ecolab”) announced earnings for the third quarter ended September 30, 2025. A copy of the (i) News Release issued by Ecolab in connection with this report under Item 2.02 is furnished and attached as Exhibit (99.1) and (ii) Supplemental Data to be used in connection with the conference call to be held discussing the first quarter results is furnished and attached as Exhibit (99.2), each of which is incorporated by reference herein. Ecolab also will publish the attached exhibits on its website located at www.ecolab.com.
Item 9.01 Financial Statements and Exhibits.
(d) |
Exhibits. |
The following exhibits are furnished pursuant to Item 2.02 of Form 8-K and should not be deemed to be “filed” under the Securities Exchange Act of 1934.
Exhibit No. |
|
Description |
|
Method Of Filing |
|
|
|
|
|
|
|
(99.1) |
|
|
Filed herewith electronically. |
|
|
|
|
|
|
|
|
(99.2) |
|
|
Filed herewith electronically. |
|
|
|
|
|
|
|
|
(104) |
|
Cover Page Interactive Data File. |
|
Embedded within the Inline XBRL document. |
|
2
SIGNATURE
Pursuant to the requirements of the Securities Exchange Act of 1934, the registrant has duly caused this report to be signed on its behalf by the undersigned hereunto duly authorized.
|
ECOLAB INC. |
|
|
|
|
|
|
|
Date: October 28, 2025 |
By: |
/s/ Youhao Dong |
|
|
Youhao Dong |
|
|
Assistant Secretary |
3
Exhibit 99.1
News Release
Investor Contact: |
Media Contact: |
|
Andrew Hedberg (651) 250-2185 |
Nigel Glennie (651) 250-2576 |
|
Andrew Pearson (651) 250-3654 |
|
|
ECOLAB DELIVERS ANOTHER STRONG QUARTER OF DOUBLE-DIGIT EPS GROWTH
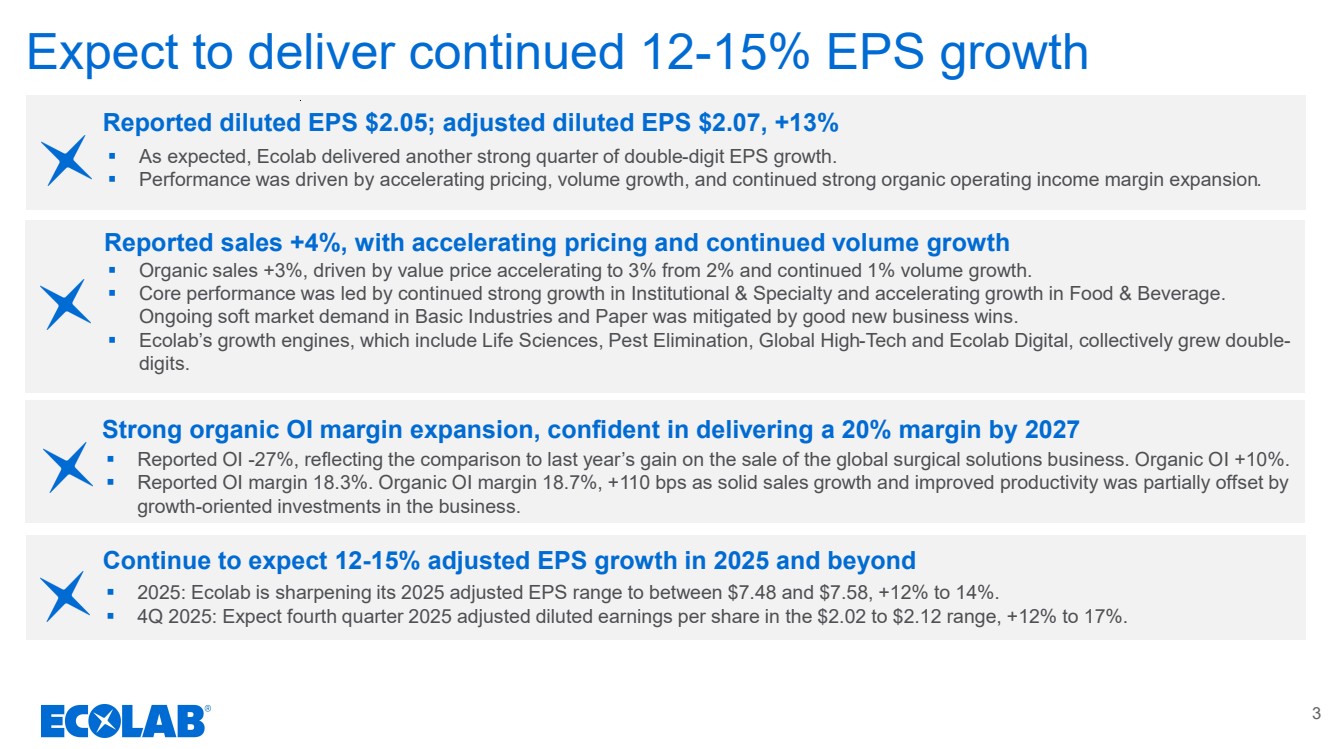
REPORTED DILUTED EPS $2.05; ADJUSTED DILUTED EPS $2.07, +13%
2025 ADJUSTED DILUTED EPS OUTLOOK: $7.48 - $7.58, +12% - 14%
THIRD QUARTER HIGHLIGHTS
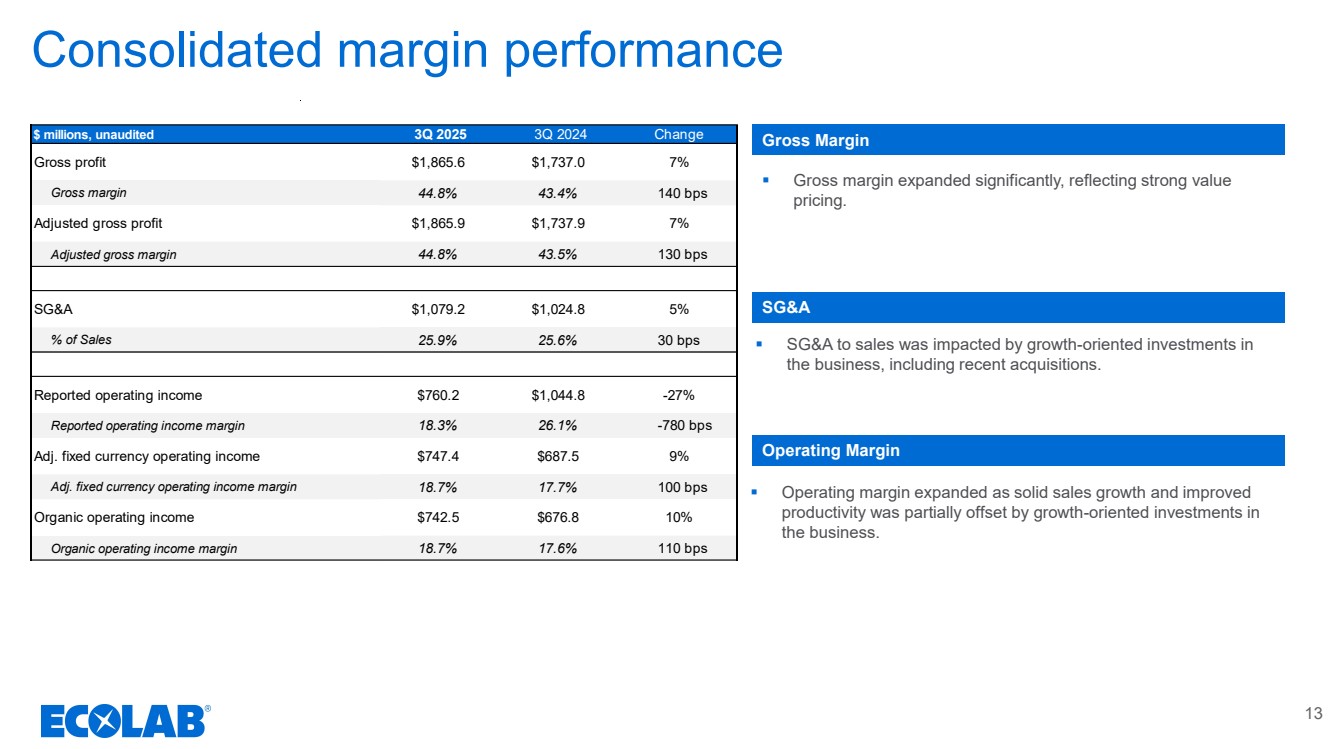
| ● | Ecolab delivered another strong quarter of double-digit EPS growth. This superior performance was fueled by accelerating pricing, continued volume growth, and strong organic operating income margin expansion. |
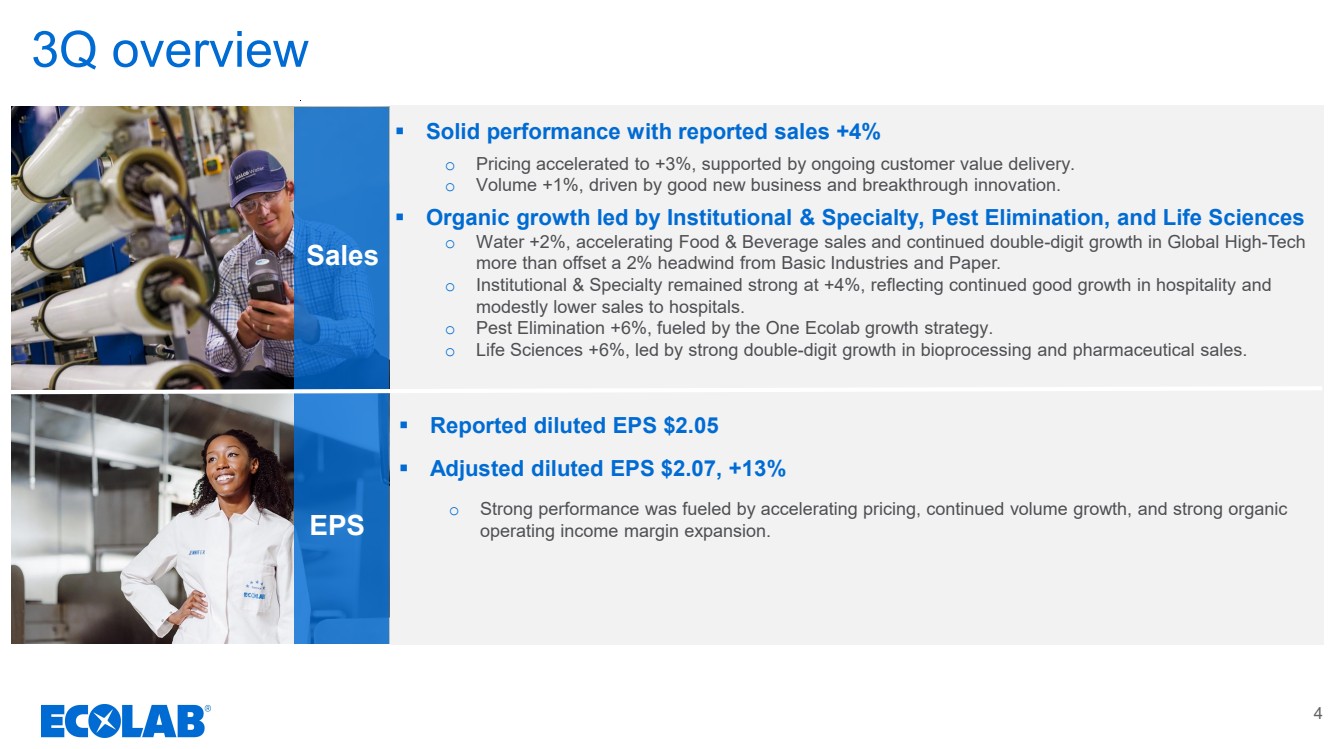
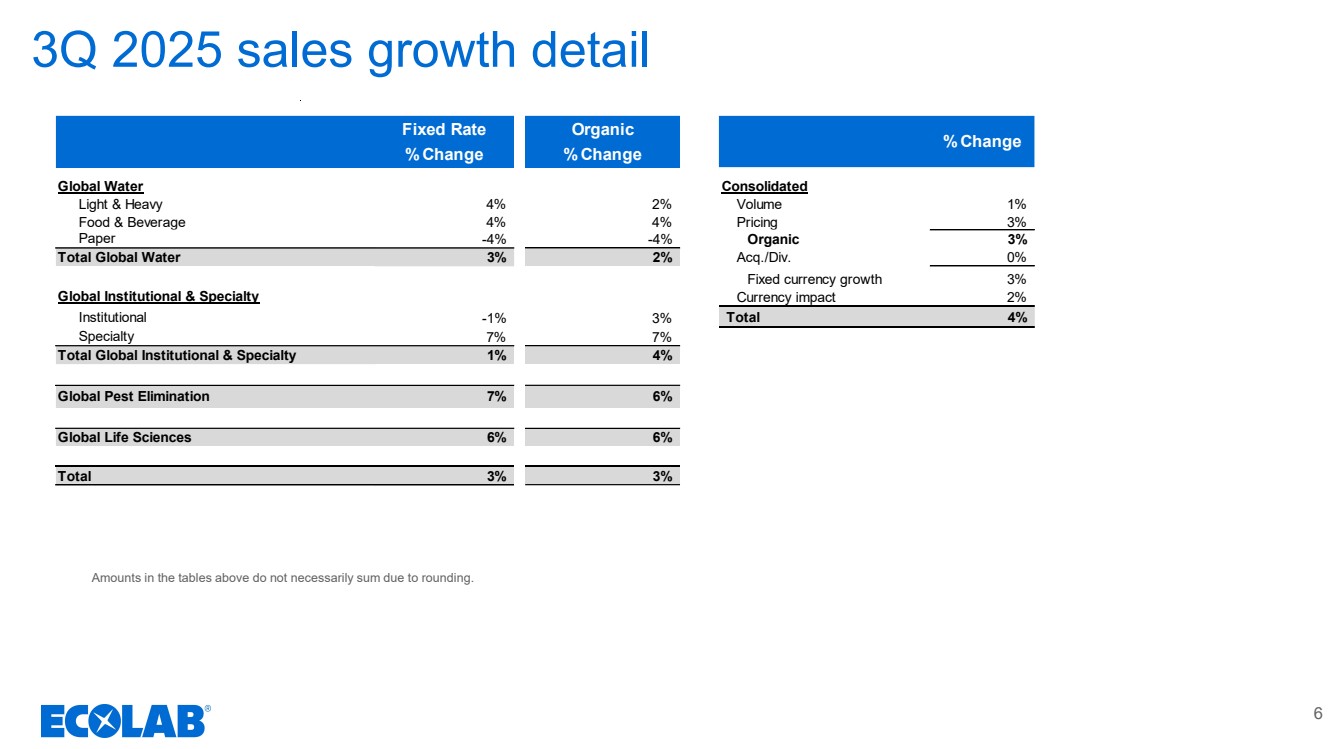
| ● | Reported sales $4.2 billion, +4%. Organic sales +3%, driven by value price accelerating from 2% to 3%, and continued 1% volume growth. |
| ● | Performance was led by continued strong growth in the Institutional & Specialty, Pest Elimination, and Life Sciences segments. The Water segment’s sales growth was driven by accelerating Food & Beverage growth and continued double-digit growth in Global High-Tech, which more than offset ongoing soft end-market trends in Basic Industries and Paper. |
| ● | Reported operating income margin 18.3%. Organic operating income margin 18.7%, +110 bps as solid sales growth and improved productivity was partially offset by growth-oriented investments in the business. |
| ● | Reported diluted EPS $2.05, -21%, reflecting the comparison to last year’s gain on the sale of the global surgical solutions business. Adjusted diluted EPS, excluding special gains and charges and discrete tax items were $2.07, +13%. |
OUTLOOK
| ● | 2025: Ecolab is sharpening its 2025 adjusted EPS range to between $7.48 and $7.58, +12% to 14%. |
| ● | 4Q 2025: Expect fourth quarter 2025 adjusted diluted EPS in the $2.02 to $2.12 range, +12% to 17%. |
|
|
Third Quarter Ended September 30 |
||||||||||||||||
|
|
Reported |
|
|
|
|
Adjusted |
|
|
|
||||||||
(unaudited) |
|
Public Currency Rates |
|
% |
|
Public Currency Rates |
|
% |
||||||||||
(millions, except per share) |
|
2025 |
|
2024 |
|
Change |
|
2025 |
|
|
2024 |
|
Change |
|||||
Net sales |
|
$4,165.0 |
|
|
$3,998.5 |
|
|
4 |
% |
|
$4,165.0 |
|
|
$3,998.5 |
|
|
4 |
% |
Operating income |
|
760.2 |
|
|
1,044.8 |
|
|
(27) |
% |
|
786.7 |
|
|
713.1 |
|
|
10 |
% |
Net income attributable to Ecolab |
|
585.0 |
|
|
736.5 |
|
|
(21) |
% |
|
590.7 |
|
|
522.0 |
|
|
13 |
% |
|
|
|
|
|
|
|
|
|
|
|
|
|
|
|
|
|
|
|
Diluted earnings per share attributable to Ecolab |
|
$2.05 |
|
|
$2.58 |
|
|
(21) |
% |
|
$2.07 |
|
|
$1.83 |
|
|
13 |
% |
|
|
|
|
|
|
|
|
|
|
|
|
|
|
|
|
|
|
|
|
|
Organic |
|
% |
|
|
|
|
|
|
|
|
|
|||||
|
|
2025 |
|
2024 |
|
Change |
|
|
|
|
|
|
|
|
|
|||
Net sales |
|
$3,966.1 |
|
|
$3,844.2 |
|
|
3 |
% |
|
|
|
|
|
|
|
|
|
Operating income |
|
742.5 |
|
|
676.8 |
|
|
10 |
% |
|
|
|
|
|
|
|
|
|
1
|
|
|
|
|
|
|
|
|
|
|
|
|
|
|
|
|
|
|
ST. PAUL, Minn., October 28, 2025
CEO Comment
Christophe Beck, Ecolab’s chairman and chief executive officer, said, “Our team once again delivered a strong and consistent quarter of double-digit earnings growth, driven by value pricing accelerating from 2% to 3%, volume growth of 1%, and strong operating income margin expansion. Ecolab’s growth engines, which include Life Sciences, Pest Elimination, Global High-Tech and Ecolab Digital, collectively grew double digits. Performance in our core businesses was led by mid-single digit growth in Institutional & Specialty and accelerating Food & Beverage growth, as we leveraged our breakthrough innovations and the power of our One Ecolab enterprise growth strategy. This very strong performance was partially offset by ongoing soft market demand in our underperforming businesses, Basic Industries and Paper. While continued new business wins are mitigating the impact of soft market demand, together these businesses had an unfavorable 1% impact on third quarter sales growth. Importantly, with strong performance across our high margin businesses, Ecolab’s organic operating income margin continued to expand significantly, reaching 18.7%.
“As we approach the end of another year of double-digit earnings growth, we are very well positioned for strong and steady 12-15% earnings growth in 2026, beginning in the first quarter. We are confident in the strength of our business, fundamental drivers and ability to execute. Our strategic focus remains on delivering best-in-class customer performance to drive improved core growth and sustainable value pricing. We will also continue to build our growth engines, which are compounding at double-digit rates with attractive long-term operating income margins. Our ongoing investments in our team, breakthrough innovation, and growth engines position us very well to create exceptional value for customers and deliver superior returns to shareholders for the years to come.”
Third Quarter 2025 Consolidated Results
Ecolab’s third quarter reported sales increased 4%. Organic sales increased 3% when compared to the prior year. Ecolab Digital sales grew 25% to $96 million, with double-digit growth across both software and enabling hardware subscriptions.
Third quarter 2025 reported operating income decreased 27% including the impact of special gains and charges. The decrease was driven by the comparison to last year’s gain on sale of Ecolab’s global surgical solutions business. Organic operating income increased 10%, as solid sales growth and improved productivity was partially offset by growth-oriented investments in the business.
2
Reported other income in the third quarter of 2025 was stable. Reported net interest expense decreased $15 million reflecting lower interest expense due to lower interest rates and higher cash balances.
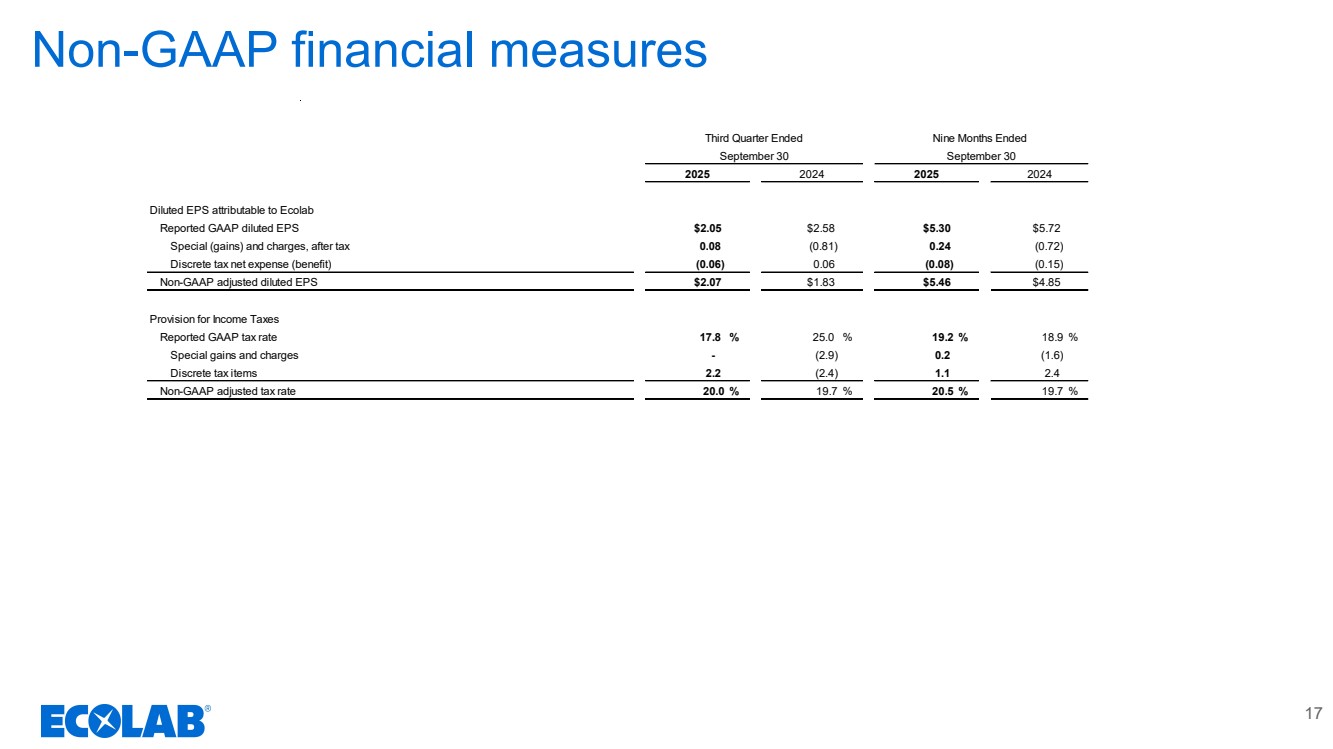
The reported income tax rate for the third quarter of 2025 was 17.8% compared with the reported rate of 25.0% in the third quarter of 2024. Excluding special gains and charges and discrete tax items, the adjusted tax rate for the third quarter of 2025 was 20.0% compared with the adjusted tax rate of 19.7% in the third quarter of 2024. The higher adjusted tax rate reflected changes in geographic income mix.
Reported net income decreased 21% versus the prior year. Excluding the impact of special gains and charges and discrete tax items, adjusted net income increased 13% versus the prior year.
Reported diluted earnings per share decreased 21% versus the prior year. Adjusted diluted earnings per share increased 13% when compared against the third quarter of 2024.
Currency translation had a $0.04 favorable impact on earnings per share in the third quarter of 2025.
Ecolab repurchased approximately 0.6 million shares of its common stock during the third quarter of 2025.
3
Third Quarter 2025 Segment Review
Global Water |
|
|
|
|
|
|
|
|
|
|
|
|
|
|
|
|
|
|
|
|
|
|
|
|
|
(unaudited) |
|
Third Quarter Ended September 30 |
|
|
|
|
Organic |
|||||
(millions) |
|
2025 |
|
2024 |
|
% Change |
|
% Change |
||||
|
|
|
|
|
|
|
|
|
|
|
|
|
Fixed currency |
|
|
|
|
|
|
|
|
|
|
|
|
Sales |
|
$1,953.5 |
|
|
$1,897.6 |
|
|
3 |
% |
|
2 |
% |
Operating income |
|
336.0 |
|
|
324.8 |
|
|
3 |
% |
|
2 |
% |
Operating income margin |
|
17.2 |
% |
|
17.1 |
% |
|
|
|
|
|
|
Organic operating income margin |
|
17.2 |
% |
|
17.1 |
% |
|
|
|
|
|
|
|
|
|
|
|
|
|
|
|
|
|
|
|
Public currency |
|
|
|
|
|
|
|
|
|
|
|
|
Sales |
|
$2,054.6 |
|
|
$1,966.4 |
|
|
4 |
% |
|
|
|
Operating income |
|
358.8 |
|
|
340.6 |
|
|
5 |
% |
|
|
|
The Global Water segment includes Light and Heavy, Food & Beverage, and Paper
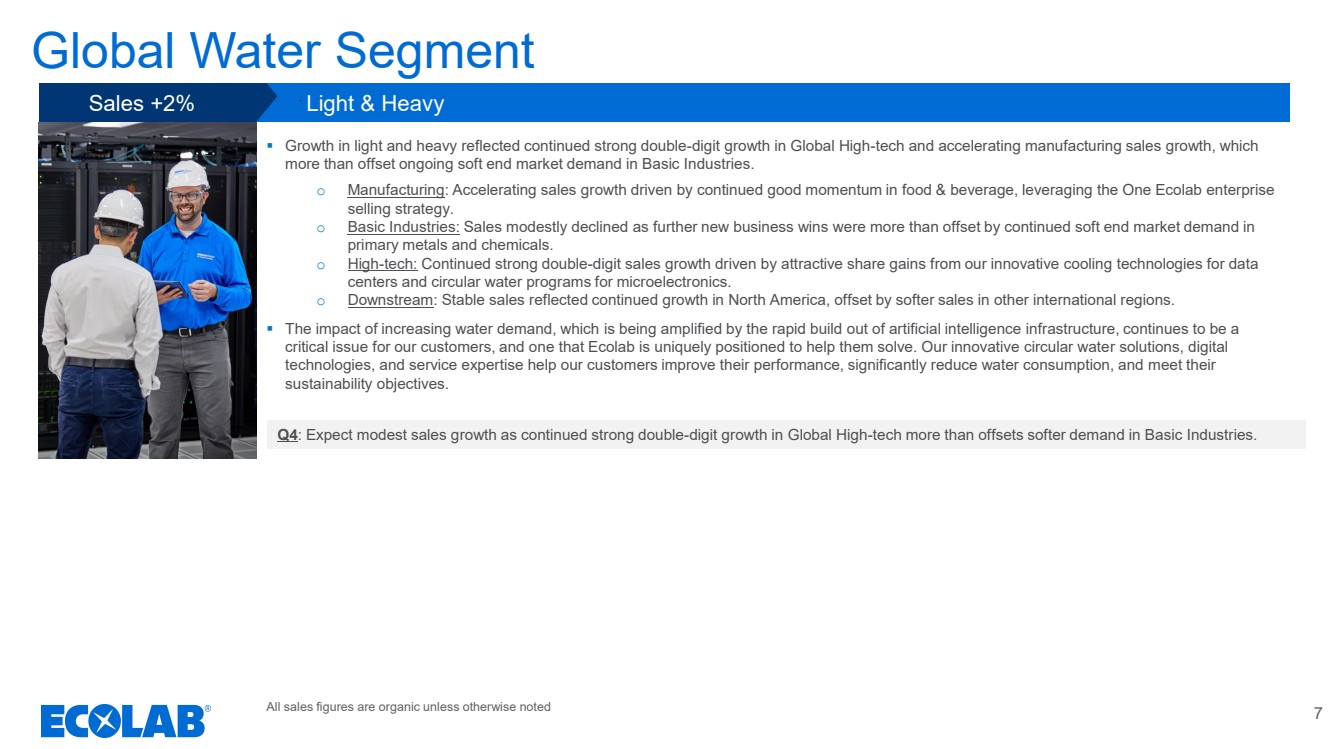
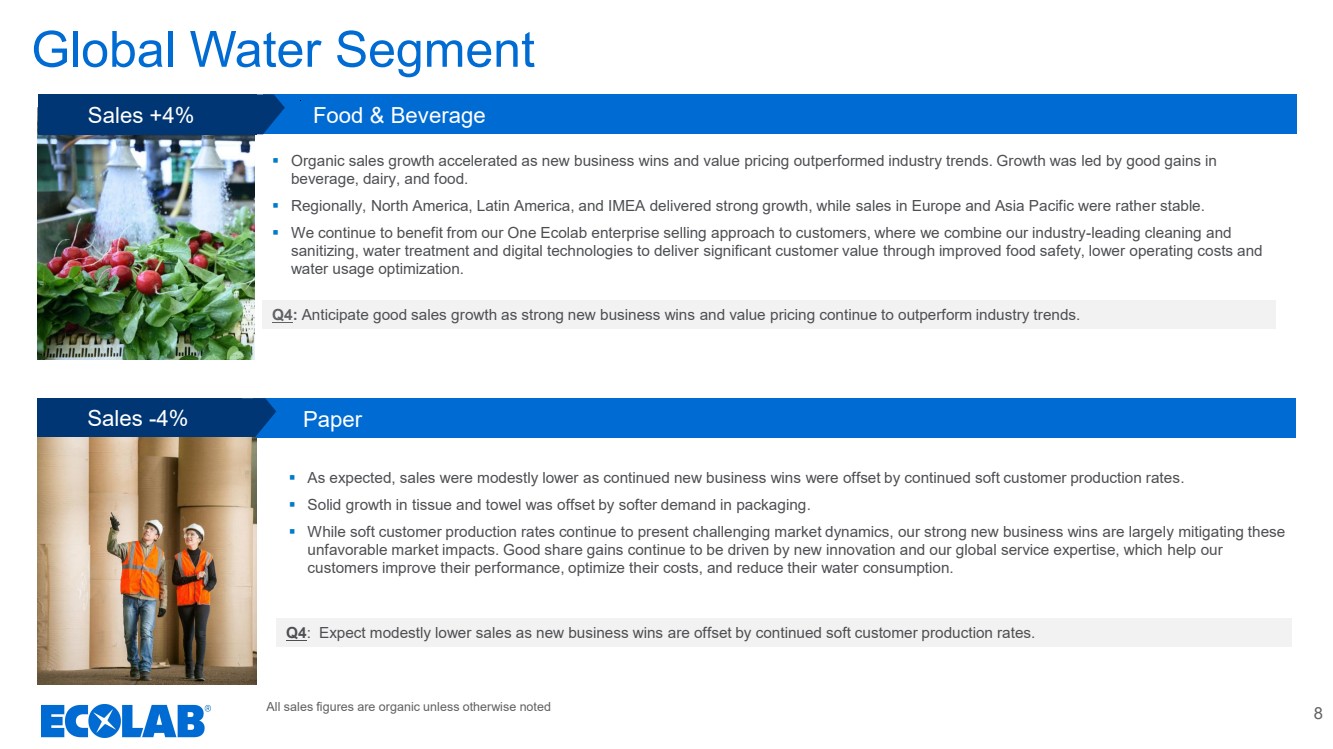
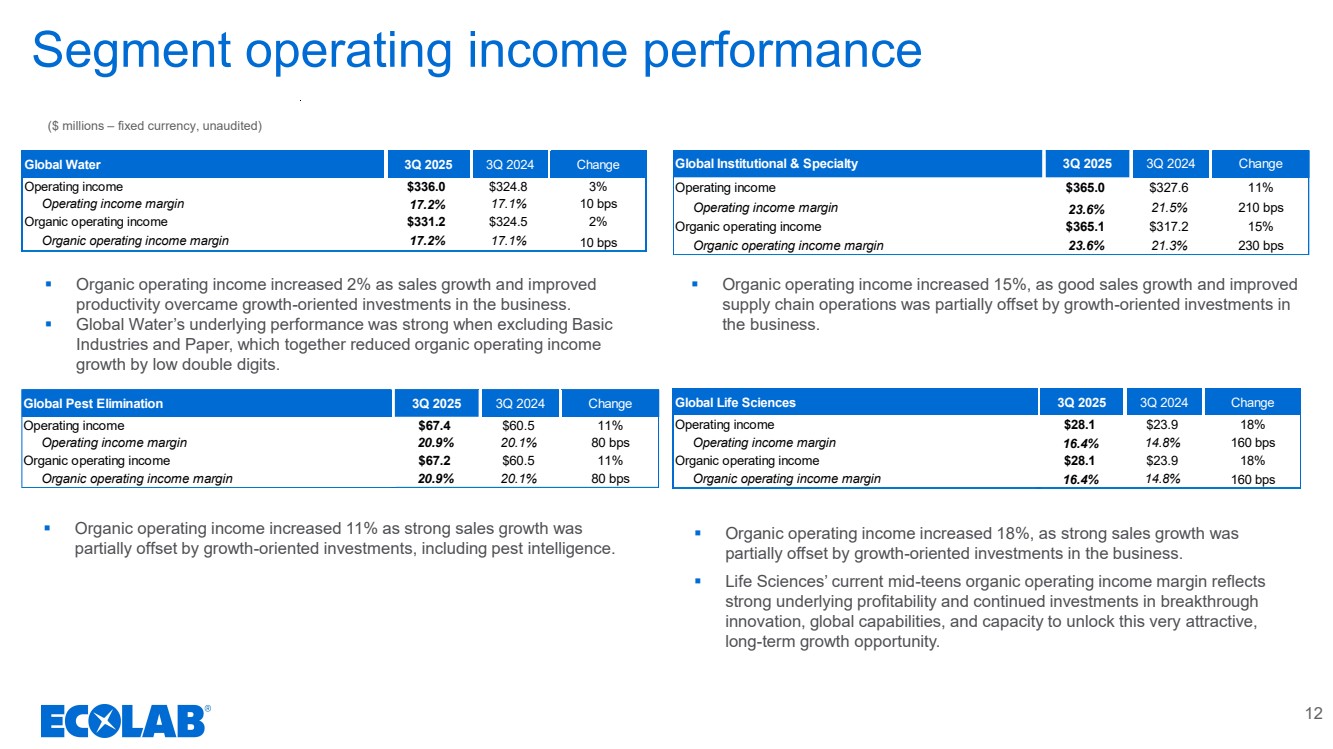
Fixed currency sales increased 3% and organic sales increased 2%, reflecting accelerating Food & Beverage sales growth and continued growth in Light & Heavy, which was partially offset by lower Paper sales. Light & Heavy’s growth was led by double-digit growth in Global High-Tech and solid gains in Manufacturing, which more than offset softer sales in Basic Industries. Robust new business gains in Food & Beverage, which leveraged our One Ecolab growth strategy, drove a further acceleration in sales growth. Lower Paper sales reflected new business wins that were more than offset by soft customer production rates. Organic operating income increased 2% as sales growth and improved productivity overcame growth-oriented investments in the business. Global Water’s underlying performance was strong when excluding Basic Industries and Paper, which together reduced organic sales growth by 2% and organic operating income growth by low double digits.
4
Global Institutional & Specialty |
|
|
|
|
|
|
|
|
|
|
|
|
|
|
|
|
|
|
|
|
|
|
|
|
|
(unaudited) |
|
Third Quarter Ended September 30 |
|
|
|
|
Organic |
|||||
(millions) |
|
2025 |
|
2024 |
|
% Change |
|
% Change |
||||
|
|
|
|
|
|
|
|
|
|
|
|
|
Fixed currency |
|
|
|
|
|
|
|
|
|
|
|
|
Sales |
|
$1,544.8 |
|
|
$1,525.7 |
|
|
1 |
% |
|
4 |
% |
Operating income |
|
365.0 |
|
|
327.6 |
|
|
11 |
% |
|
15 |
% |
Operating income margin |
|
23.6 |
% |
|
21.5 |
% |
|
|
|
|
|
|
Organic operating income margin |
|
23.6 |
% |
|
21.3 |
% |
|
|
|
|
|
|
|
|
|
|
|
|
|
|
|
|
|
|
|
Public currency |
|
|
|
|
|
|
|
|
|
|
|
|
Sales |
|
$1,593.9 |
|
|
$1,556.7 |
|
|
2 |
% |
|
|
|
Operating income |
|
375.2 |
|
|
334.7 |
|
|
12 |
% |
|
|
|
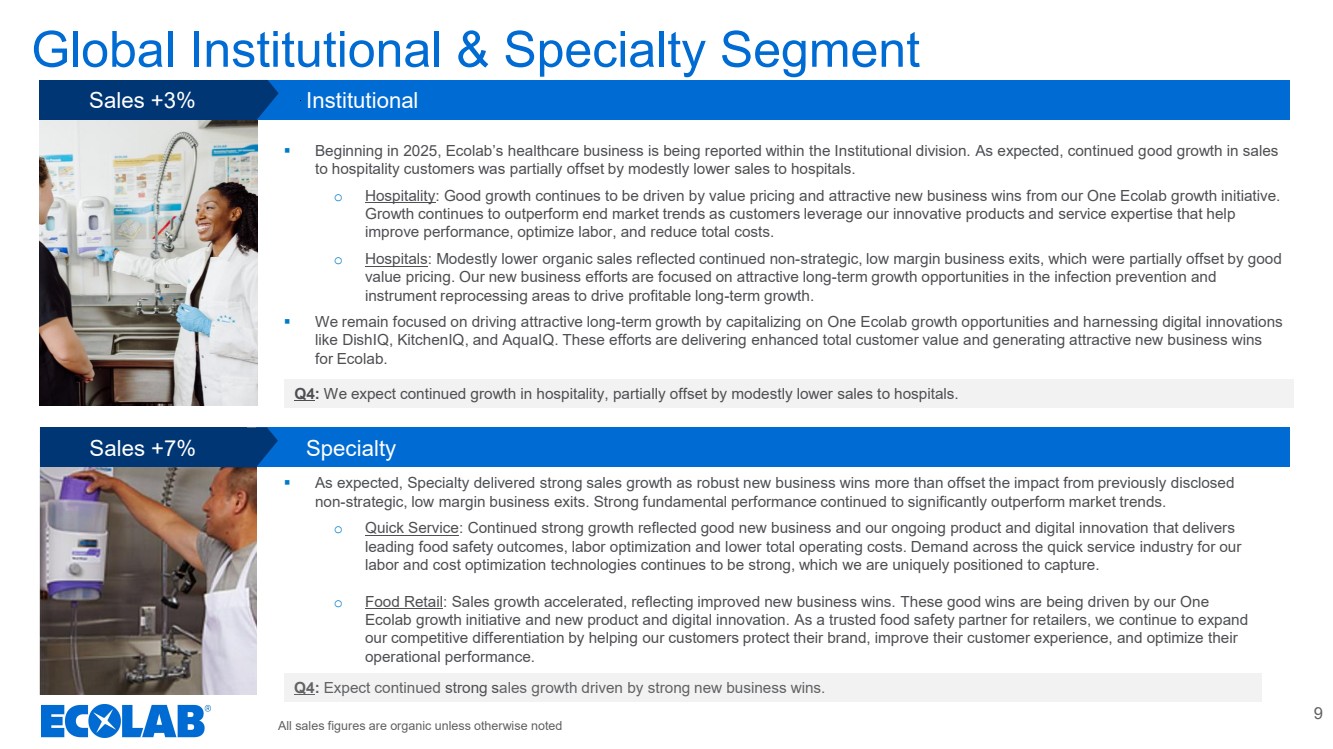
Fixed currency sales increased 1% reflecting the impact of the sale of the global surgical solutions business last year. Organic sales grew 4%, continuing to outperform end market trends. Within Institutional, good growth in sales to hospitality customers was partially offset by modestly lower sales to hospitals. Specialty delivered strong sales growth, reflecting robust new business wins and continued value pricing. Organic operating income increased 15%, as good sales growth and improved supply chain operations was partially offset by growth-oriented investments in the business.
Global Pest Elimination |
|
|
|
|
|
|
|
|
|
|
|
|
|
|
|
|
|
|
|
|
|
|
|
|
|
(unaudited) |
|
Third Quarter Ended September 30 |
|
|
|
|
Organic |
|||||
(millions) |
|
2025 |
|
2024 |
|
% Change |
|
% Change |
||||
|
|
|
|
|
|
|
|
|
|
|
|
|
Fixed currency |
|
|
|
|
|
|
|
|
|
|
|
|
Sales |
|
$322.6 |
|
|
$301.7 |
|
|
7 |
% |
|
6 |
% |
Operating income |
|
67.4 |
|
|
60.5 |
|
|
11 |
% |
|
11 |
% |
Operating income margin |
|
20.9 |
% |
|
20.1 |
% |
|
|
|
|
|
|
Organic operating income margin |
|
20.9 |
% |
|
20.1 |
% |
|
|
|
|
|
|
|
|
|
|
|
|
|
|
|
|
|
|
|
Public currency |
|
|
|
|
|
|
|
|
|
|
|
|
Sales |
|
$331.8 |
|
|
$307.2 |
|
|
8 |
% |
|
|
|
Operating income |
|
69.5 |
|
|
61.5 |
|
|
13 |
% |
|
|
|
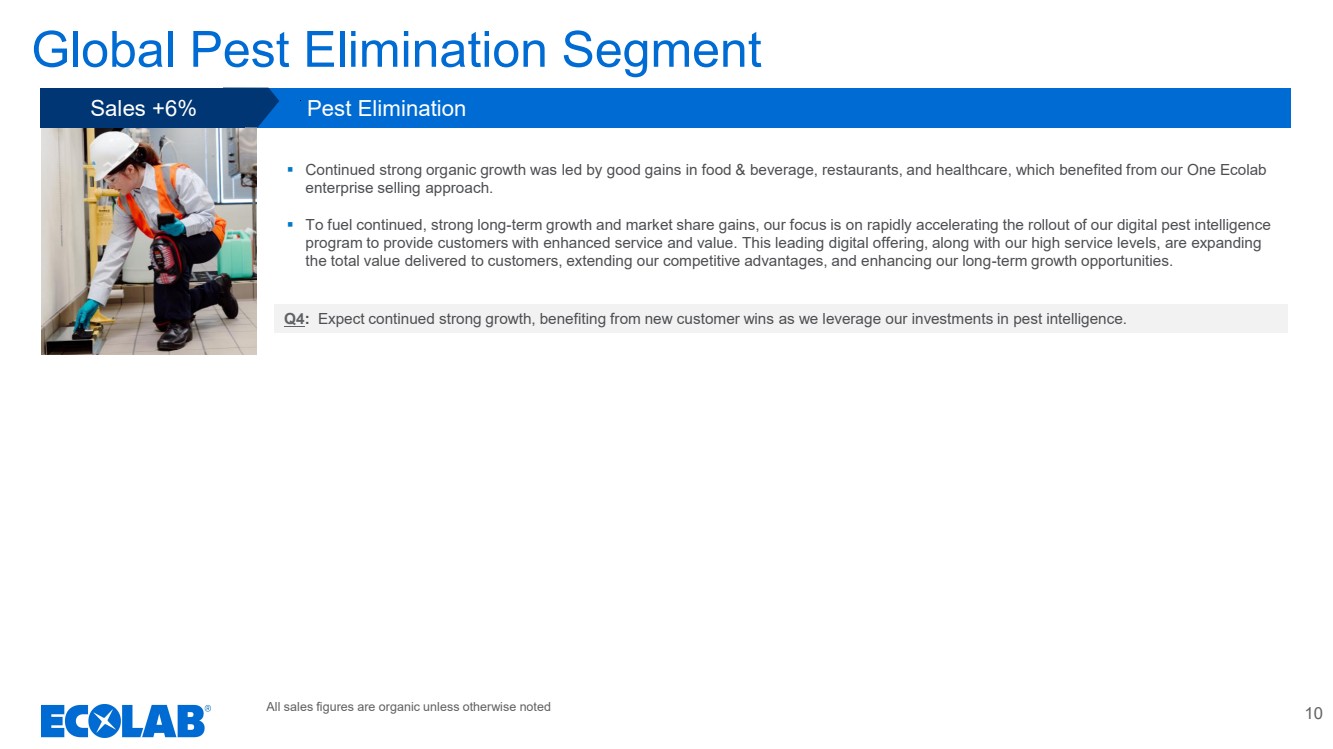
Fixed currency sales increased 7%, reflecting 6% organic growth and a 1% benefit from attractive,
targeted acquisitions in North America. Strong organic sales growth was led by good gains in food & beverage, restaurants, and healthcare, which continue to benefit from our One Ecolab growth strategy. Organic operating income increased 11% as strong sales growth was partially offset by growth-oriented investments, including pest intelligence.
5
Global Life Sciences |
|
|
|
|
|
|
|
|
|
|
|
|
|
|
|
|
|
|
|
|
|
|
|
|
|
|
|
(unaudited) |
|
|
Third Quarter Ended September 30 |
|
|
|
|
Organic |
|||||
(millions) |
|
2025 |
|
|
2024 |
|
% Change |
|
% Change |
||||
|
|
|
|
|
|
|
|
|
|
|
|
|
|
Fixed currency |
|
|
|
|
|
|
|
|
|
|
|
|
|
Sales |
|
$171.0 |
|
|
|
$161.7 |
|
|
6 |
% |
|
6 |
% |
Operating income |
|
28.1 |
|
|
|
23.9 |
|
|
18 |
% |
|
18 |
% |
Operating income margin |
|
16.4 |
% |
|
|
14.8 |
% |
|
|
|
|
|
|
Organic operating income margin |
|
16.4 |
% |
|
|
14.8 |
% |
|
|
|
|
|
|
|
|
|
|
|
|
|
|
|
|
|
|
|
|
Public currency |
|
|
|
|
|
|
|
|
|
|
|
|
|
Sales |
|
$184.7 |
|
|
|
$168.2 |
|
|
10 |
% |
|
|
|
Operating income |
|
33.2 |
|
|
|
26.3 |
|
|
26 |
% |
|
|
|
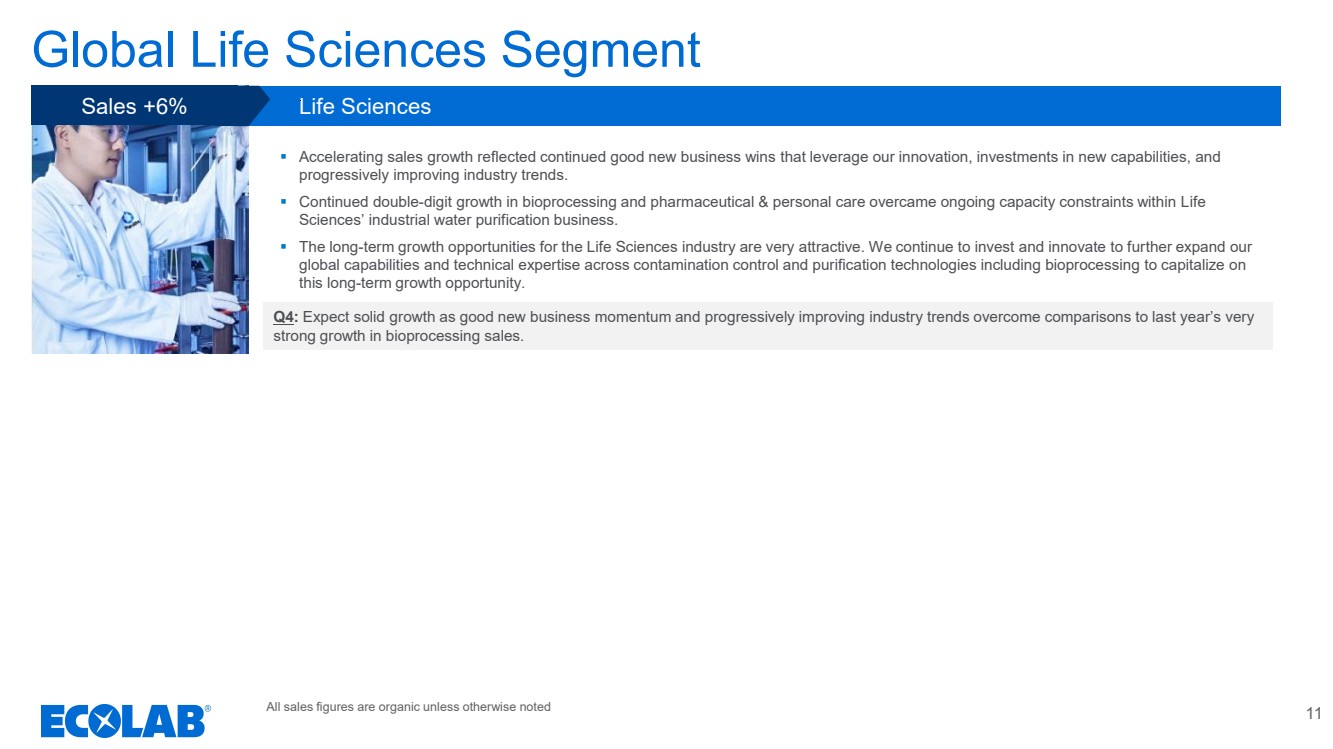
Fixed currency and organic sales growth both improved to 6% as continued double-digit growth in bioprocessing and pharmaceutical & personal care overcame ongoing capacity constraints within Life Sciences’ industrial water purification business. Organic operating income increased 18%, as strong sales growth was partially offset by growth-oriented investments in the business. Life Sciences’ current mid-teens organic operating income margin reflects strong underlying profitability and continued investments in breakthrough innovation, global capabilities, and capacity to unlock this very attractive, long-term growth opportunity.
Corporate |
|
|
|
|
|
|
|
|
|
|
|
|
|
(unaudited) |
|
Third Quarter Ended September 30 |
||||
(millions) |
|
2025 |
|
2024 |
||
|
|
|
|
|
|
|
Public currency |
|
|
|
|
|
|
Corporate operating expense |
|
|
|
|
|
|
Nalco and Purolite amortization |
|
$50.0 |
|
|
$50.0 |
|
Special (gains) and charges |
|
26.5 |
|
|
(331.7) |
|
Total Corporate operating expense (income) |
|
$76.5 |
|
|
($281.7) |
|
Third quarter of 2025 corporate segment includes:
| ● | amortization expense of $28 million related to the Nalco merger intangible assets and $22 million related to Purolite acquisition intangible assets |
| ● | special gains and charges were a net charge of $26.5 million, primarily related to One Ecolab and acquisition costs for our pending acquisition of Ovivo Electronics ultra-pure water business |
6
Special gains and charges for the third quarter of 2024 impacting operating expense were a net gain of $332 million primarily related to the gain on sale of the global surgical solutions business.
Business Outlook
2025
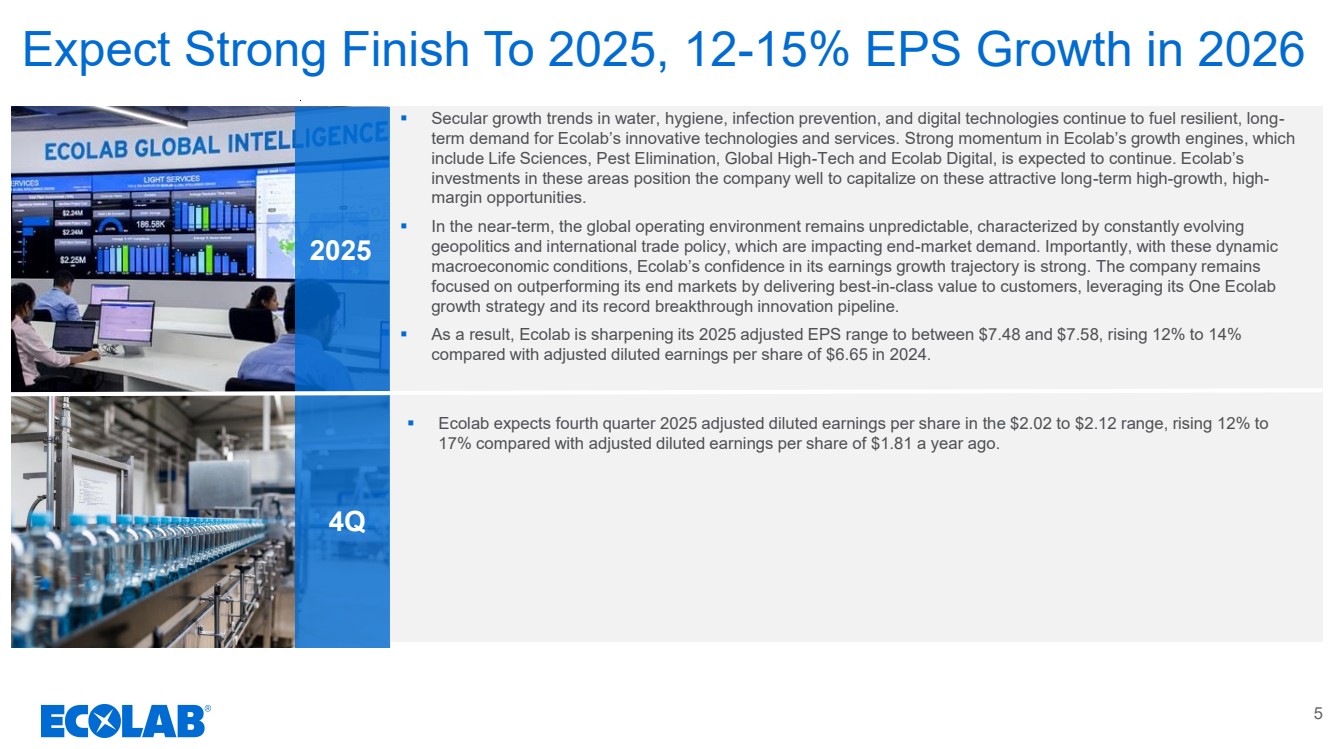
Secular growth trends in water, hygiene, infection prevention, and digital technologies continue to fuel resilient, long-term demand for Ecolab’s innovative technologies and services. Strong momentum in Ecolab’s growth engines, which include Life Sciences, Pest Elimination, Global High-Tech and Ecolab Digital, is expected to continue. Ecolab’s investments in these areas position the company well to capitalize on these attractive long-term high-growth, high-margin opportunities.
In the near-term, the global operating environment remains unpredictable, characterized by constantly evolving geopolitics and international trade policy, which are impacting end-market demand. Importantly, with these dynamic macroeconomic conditions, Ecolab’s confidence in its earnings growth trajectory is strong. The company remains focused on outperforming its end markets by delivering best-in-class value to customers, leveraging its One Ecolab growth strategy and its record breakthrough innovation pipeline.
As a result, Ecolab is sharpening its 2025 adjusted EPS range to between $7.48 and $7.58, rising 12% to 14% compared with adjusted diluted earnings per share of $6.65 in 2024.
The company currently anticipates quantifiable special charges in 2025 to be approximately $0.34 per share, principally related to restructuring charges. Other than the special gains and charges noted above, other such amounts are not currently quantifiable.
2025 – Fourth Quarter
Ecolab expects fourth quarter 2025 adjusted diluted earnings per share in the $2.02 to $2.12 range, rising 12% to 17% compared with adjusted diluted earnings per share of $1.81 a year ago.
The company currently expects quantifiable special charges in the fourth quarter of 2025 to be $0.10 per share, principally related to restructuring charges. Other than the special gains and charges noted above, other such amounts are not currently quantifiable.
7
About Ecolab
A trusted partner for millions of customers, Ecolab (NYSE:ECL) is a global sustainability leader offering water, hygiene and infection prevention solutions and services that protect people and the resources vital to life. Building on more than a century of innovation, Ecolab has annual sales of $16 billion, employs approximately 48,000 associates and operates in more than 170 countries around the world. The company delivers comprehensive science-based solutions, data-driven insights and world-class service to advance food safety, maintain clean and safe environments, and optimize water and energy use. Ecolab’s innovative solutions improve operational efficiencies and sustainability for customers in the food, healthcare, high-tech, life sciences, hospitality and industrial markets. www.ecolab.com
Ecolab will host a live webcast to review the third quarter earnings announcement today at 1:00 p.m. Eastern Time. The webcast, along with related materials, will be available to the public on Ecolab's website at www.ecolab.com/investor. A replay of the webcast and related materials will be available at that site.
Cautionary Statements Regarding Forward-Looking Information
This news release contains certain statements relating to future events and our intentions, beliefs, expectations and predictions for the future which are forward-looking statements as that term is defined in the Private Securities Litigation Reform Act of 1995. Words or phrases such as “will likely result,” “are expected to,” “will continue,” “is anticipated,” “we believe,” “we expect,” “estimate,” “project,” “may,” “will,” “intend,” “plan,” “believe,” “target,” “forecast” (including the negative or variations thereof) or similar terminology used in connection with any discussion of future plans, actions or events generally identify forward-looking statements. These forward-looking statements include, but are not limited to, statements regarding macroeconomic conditions and our financial and business performance and prospects, including sales, earnings, special gains and charges, raw material costs, margins, pricing, currency translation, productivity, investments and new business. These statements are based on the current expectations of management of the company. There are a number of risks and uncertainties that could cause actual results to differ materially from the forward-looking statements included in this news release. In particular, the ultimate results of any restructuring initiative depend on a number of factors, including the development of final plans, the impact of local regulatory requirements regarding employee terminations, the time necessary to develop and implement the restructuring initiatives and the level of success achieved through such actions in improving competitiveness, efficiency and effectiveness.
8
Additional risks and uncertainties that may affect operating results and business performance are set forth under Item 1A of our most recent Form 10-K, and our other public filings with the Securities and Exchange Commission (the "SEC"), and include the impact of economic factors such as the worldwide economy, interest rates, foreign currency risk, reduced sales and earnings in our international operations resulting from the weakening of local currencies versus the U.S. dollar, demand uncertainty, supply chain challenges and inflation; the vitality of the markets we serve; exposure to global economic, political and legal risks related to our international operations, including international trade policies, geopolitical instability and the escalation of armed conflicts; our ability to successfully execute organizational change and management transitions; information technology infrastructure failures or breaches in data security; difficulty in procuring raw materials or fluctuations in raw material costs; our increasing reliance on artificial intelligence technologies in our products, services and operations; the occurrence of severe public health outbreaks not limited to COVID-19; our ability to acquire complementary businesses and to effectively integrate such businesses; our ability to execute key business initiatives; our ability to successfully compete with respect to value, innovation and customer support; pressure on operations from consolidation of customers or vendors; restraints on pricing flexibility due to contractual obligations and our ability to meet our contractual commitments; the costs and effects of complying with laws and regulations, including those relating to the environment, climate change standards, and to the manufacture, storage, distribution, sale and use of our products, as well as to the conduct of our business generally, including labor and employment and anti-corruption; potential chemical spill or release; potential to incur significant tax liabilities or indemnification liabilities relating to the separation and split-off of our ChampionX business; the occurrence of litigation or claims, including class action lawsuits; the loss or insolvency of a major customer or distributor; repeated or prolonged government and/or business shutdowns or similar events; acts of war or terrorism; natural or man-made disasters; water shortages; severe weather conditions; our commitments, goals, targets, objectives and initiatives related to sustainability, and our public statements and disclosures regarding them; changes in tax laws and unanticipated tax liabilities; potential loss of deferred tax assets; our indebtedness, and any failure to comply with covenants that apply to our indebtedness; potential losses arising from the impairment of goodwill or other assets; and other uncertainties or risks reported from time to time in our reports to the SEC. In light of these risks, uncertainties, assumptions and factors, the forward-looking events discussed in this news release may not occur. We caution that undue reliance should not be placed on forward-looking statements, which speak only as of the date made. Ecolab does not undertake, and expressly disclaims, any duty to update any forward-looking statement whether as a result of new information, future events or changes in expectations, except as required by law.
9
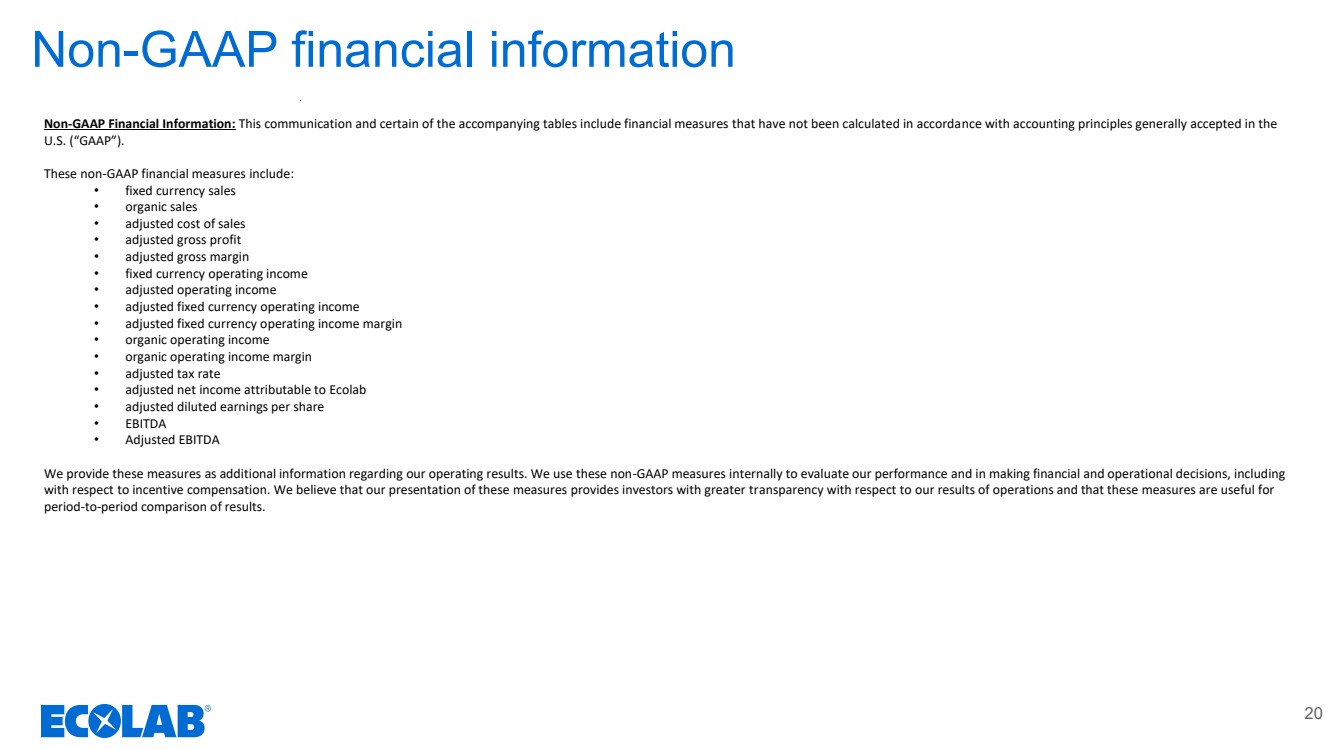
Non-GAAP Financial Information
This news release and certain of the accompanying tables include financial measures that have not been calculated in accordance with accounting principles generally accepted in the U.S. (“GAAP”).
These non-GAAP financial measures include:
| ● | fixed currency sales |
| ● | organic sales |
| ● | adjusted cost of sales |
| ● | adjusted gross profit |
| ● | adjusted gross margin |
| ● | fixed currency operating income |
| ● | fixed currency operating income margin |
| ● | adjusted operating income |
| ● | adjusted fixed currency operating income |
| ● | adjusted fixed currency operating income margin |
| ● | organic operating income |
| ● | organic operating income margin |
| ● | adjusted tax rate |
| ● | adjusted net income attributable to Ecolab |
| ● | adjusted diluted earnings per share |
| ● | free cash flow |
We provide these measures as additional information regarding our operating results. We use these non-GAAP measures internally to evaluate our performance and in making financial and operational decisions, including with respect to incentive compensation. We believe that our presentation of these measures provides investors with greater transparency with respect to our results of operations and that these measures are useful for period-to-period comparison of results.
Our non-GAAP financial measures for adjusted cost of sales, adjusted gross margin, adjusted gross profit and adjusted operating income exclude the impact of special (gains) and charges and our non-GAAP financial measures for adjusted tax rate, adjusted net income attributable to Ecolab and adjusted diluted earnings per share further exclude the impact of discrete tax items.
10
We include items within special (gains) and charges and discrete tax items that we believe can significantly affect the period-over-period assessment of operating results and not necessarily reflect costs and/or income associated with historical trends and future results. After tax special (gains) and charges are derived by applying the applicable local jurisdictional tax rate to the corresponding pre-tax special (gains) and charges.
We evaluate the performance of our international operations based on fixed currency rates of foreign exchange, which eliminate the translation impact of exchange rate fluctuations on our international results. Fixed currency amounts included in this release are based on translation into U.S. dollars at the fixed foreign currency exchange rates established by management at the beginning of 2025. We also provide our segment results based on public currency rates for informational purposes.
Our reportable segments do not include the impact of intangible asset amortization from the Nalco and Purolite transactions or the impact of special (gains) and charges as these are not allocated to the Company’s reportable segments.
Our non-GAAP financial measures for organic sales, organic operating income and organic operating income margin are at fixed currency and exclude the impact of special (gains) and charges, the results of our acquired businesses from the first twelve months post acquisition and the results of divested businesses from the twelve months prior to divestiture. Further, due to the sale of the global surgical solutions business on August 1, 2024, we have excluded the results of the business for the nine-month period ended September 30, 2024 from these organic measures to remain comparable to the corresponding period in 2025. In addition, as part of the separation of ChampionX in 2020, we continue to provide certain products to ChampionX, which are recorded in product and equipment sales in the Global Water segment along with the related cost of sales. These transactions are removed from the consolidated results as part of the calculation of the impact of acquisitions and divestitures.
We define free cash flow as net cash provided by operating activities less cash outlays for capital expenditures. It should not be inferred that the entire free cash flow amount is available for discretionary expenditures. It should not be considered a substitute for income or cash flow data prepared in accordance with U.S. GAAP and may not be comparable to similarly titled measures used by other companies.
11
We believe free cash flow is meaningful to investors as it functions as a useful measure of performance and we use this measure as an indication of the strength of the Company and its ability to generate cash.
These non-GAAP financial measures are not in accordance with, or an alternative to, GAAP and may be different from non-GAAP measures used by other companies. Investors should not rely on any single financial measure when evaluating our business. We recommend that investors view these measures in conjunction with the GAAP measures included in this news release. Reconciliations of our non-GAAP measures are included in the following "Supplemental Non-GAAP Reconciliations" and “Supplemental Diluted Earnings per Share Information” tables included in this news release.
We do not provide reconciliations for non-GAAP estimates on a forward-looking basis (including those contained in this news release) when we are unable to provide a meaningful or accurate calculation or estimation of reconciling items and the information is not available without unreasonable effort. This is due to the inherent difficulty of forecasting the timing and amount of various items that have not yet occurred, are out of our control and/or cannot be reasonably predicted, and that would impact reported earnings per share and the reported tax rate, the most directly comparable forward-looking GAAP financial measures to adjusted earnings per share and the adjusted tax rate. For the same reasons, we are unable to address the probable significance of the unavailable information.
###
|
|
(ECL-E) |
12
ECOLAB INC.
CONSOLIDATED STATEMENTS OF INCOME
(unaudited)
|
|
Third Quarter Ended |
|
|
|
Nine Months Ended |
|
|
||||||
|
|
September 30 |
|
% |
|
September 30 |
|
% |
||||||
(millions, except per share) |
|
2025 |
|
2024 |
|
Change |
|
2025 |
|
2024 |
|
Change |
||
|
|
|
|
|
|
|
|
|
|
|
|
|
|
|
Product and equipment sales |
|
$3,262.6 |
|
$3,156.0 |
|
|
|
|
$9,321.3 |
|
$9,315.6 |
|
|
|
Service and lease sales |
|
902.4 |
|
842.5 |
|
|
|
|
2,563.9 |
|
2,420.6 |
|
|
|
Net sales |
|
4,165.0 |
|
3,998.5 |
|
4 |
% |
|
11,885.2 |
|
11,736.2 |
|
1 |
% |
Product and equipment cost of sales |
|
1,789.1 |
|
1,771.2 |
|
|
|
|
5,122.9 |
|
5,221.0 |
|
|
|
Service and lease cost of sales |
|
510.3 |
|
490.3 |
|
|
|
|
1,459.5 |
|
1,409.6 |
|
|
|
Cost of sales (1) |
|
2,299.4 |
|
2,261.5 |
|
2 |
% |
|
6,582.4 |
|
6,630.6 |
|
(1) |
% |
Selling, general and administrative expenses |
|
1,079.2 |
|
1,024.8 |
|
5 |
% |
|
3,196.9 |
|
3,178.2 |
|
1 |
% |
Special (gains) and charges (1) |
|
26.2 |
|
(332.6) |
|
|
|
|
80.3 |
|
(292.2) |
|
|
|
Operating income |
|
760.2 |
|
1,044.8 |
|
(27) |
% |
|
2,025.6 |
|
2,219.6 |
|
(9) |
% |
Other (income) expense |
|
(12.8) |
|
(12.9) |
|
(1) |
% |
|
(38.8) |
|
(38.1) |
|
2 |
% |
Interest expense, net |
|
55.3 |
|
70.4 |
|
(21) |
% |
|
176.8 |
|
220.8 |
|
(20) |
% |
Income before income taxes |
|
717.7 |
|
987.3 |
|
(27) |
% |
|
1,887.6 |
|
2,036.9 |
|
(7) |
% |
Provision for income taxes |
|
128.0 |
|
246.5 |
|
(48) |
% |
|
362.9 |
|
384.5 |
|
(6) |
% |
Net income including noncontrolling interest |
|
589.7 |
|
740.8 |
|
(20) |
% |
|
1,524.7 |
|
1,652.4 |
|
(8) |
% |
Net income attributable to noncontrolling interest |
|
4.7 |
|
4.3 |
|
|
|
|
13.0 |
|
12.9 |
|
|
|
Net income attributable to Ecolab |
|
$585.0 |
|
$736.5 |
|
(21) |
% |
|
$1,511.7 |
|
$1,639.5 |
|
(8) |
% |
|
|
|
|
|
|
|
|
|
|
|
|
|
|
|
Earnings attributable to Ecolab per common share |
|
|
|
|
|
|
|
|
|
|
|
|
||
Basic |
|
$2.06 |
|
$2.60 |
|
(21) |
% |
|
$5.33 |
|
$5.76 |
|
(7) |
% |
Diluted |
|
$2.05 |
|
$2.58 |
|
(21) |
% |
|
$5.30 |
|
$5.72 |
|
(7) |
% |
|
|
|
|
|
|
|
|
|
|
|
|
|
|
|
Weighted-average common shares outstanding |
|
|
|
|
|
|
|
|
|
|
|
|
||
Basic |
|
283.5 |
|
283.6 |
|
0 |
% |
|
283.5 |
|
284.6 |
|
0 |
% |
Diluted |
|
285.4 |
|
286.0 |
|
0 |
% |
|
285.3 |
|
286.8 |
|
(1) |
% |
|
|
|
|
|
|
|
|
|
|
|
|
|
|
|
(1) Cost of sales and Special (gains) and charges in the Consolidated Statement of Income above include the following: | ||||||||||||||
|
|
|
|
|
|
|
|
|
|
|
|
|
|
|
|
|
Third Quarter Ended |
|
|
|
Nine Months Ended |
|
|
||||||
|
|
September 30 |
|
|
|
|
September 30 |
|
|
|
||||
(millions) |
|
2025 |
|
2024 |
|
|
|
|
2025 |
|
2024 |
|
|
|
|
|
|
|
|
|
|
|
|
|
|
|
|
|
|
Cost of sales |
|
|
|
|
|
|
|
|
|
|
|
|
|
|
One Ecolab |
|
$0.3 |
|
$ - |
|
|
|
|
$7.6 |
|
$ - |
|
|
|
Other restructuring |
|
- |
|
0.9 |
|
|
|
|
- |
|
3.2 |
|
|
|
Subtotal (a) |
|
0.3 |
|
0.9 |
|
|
|
|
7.6 |
|
3.2 |
|
|
|
|
|
|
|
|
|
|
|
|
|
|
|
|
|
|
Special (gains) and charges |
|
|
|
|
|
|
|
|
|
|
|
|
|
|
One Ecolab |
|
17.4 |
|
24.4 |
|
|
|
|
83.3 |
|
38.9 |
|
|
|
Other restructuring |
|
- |
|
0.4 |
|
|
|
|
(12.0) |
|
20.1 |
|
|
|
Sale of global surgical solutions business |
|
- |
|
(364.0) |
|
|
|
|
2.4 |
|
(350.7) |
|
|
|
Acquisition and integration activities |
|
11.0 |
|
3.5 |
|
|
|
|
19.8 |
|
8.3 |
|
|
|
Other |
|
(2.2) |
|
3.1 |
|
|
|
|
(13.2) |
|
(8.8) |
|
|
|
Subtotal |
|
26.2 |
|
(332.6) |
|
|
|
|
80.3 |
|
(292.2) |
|
|
|
|
|
|
|
|
|
|
|
|
|
|
|
|
|
|
Total special (gains) and charges |
|
$26.5 |
|
($331.7) |
|
|
|
|
$87.9 |
|
($289.0) |
|
|
|
(a) Special charges of $0.3 million and $0.9 million in the third quarter of 2025 and 2024, respectively, and $7.6 million and $3.2 million for the first nine months of 2025 and 2024, respectively, were recorded in product and equipment cost of sales.
13
ECOLAB INC.
REPORTABLE SEGMENT INFORMATION
(unaudited)
|
|
Third Quarter Ended September 30 |
||||||||||||
|
|
Fixed Currency Rates |
|
Public Currency Rates |
||||||||||
|
|
|
|
|
|
% |
|
|
|
|
|
% |
||
(millions) |
|
2025 |
|
2024 |
|
Change |
|
2025 |
|
2024 |
|
Change |
||
Net Sales |
|
|
|
|
|
|
|
|
|
|
|
|
|
|
Global Water |
|
$1,953.5 |
|
$1,897.6 |
|
3 |
% |
|
$2,054.6 |
|
$1,966.4 |
|
4 |
% |
Global Institutional & Specialty |
|
1,544.8 |
|
1,525.7 |
|
1 |
% |
|
1,593.9 |
|
1,556.7 |
|
2 |
% |
Global Pest Elimination |
|
322.6 |
|
301.7 |
|
7 |
% |
|
331.8 |
|
307.2 |
|
8 |
% |
Global Life Sciences |
|
171.0 |
|
161.7 |
|
6 |
% |
|
184.7 |
|
168.2 |
|
10 |
% |
Subtotal at fixed currency rates |
|
3,991.9 |
|
3,886.7 |
|
3 |
% |
|
4,165.0 |
|
3,998.5 |
|
4 |
% |
Currency impact |
|
173.1 |
|
111.8 |
|
* |
|
|
- |
|
- |
|
* |
|
Consolidated reported GAAP net sales |
|
$4,165.0 |
|
$3,998.5 |
|
4 |
% |
|
$4,165.0 |
|
$3,998.5 |
|
4 |
% |
|
|
|
|
|
|
|
|
|
|
|
|
|
|
|
Operating Income (loss) |
|
|
|
|
|
|
|
|
|
|
|
|
|
|
Global Water |
|
$336.0 |
|
$324.8 |
|
3 |
% |
|
$358.8 |
|
$340.6 |
|
5 |
% |
Global Institutional & Specialty |
|
365.0 |
|
327.6 |
|
11 |
% |
|
375.2 |
|
334.7 |
|
12 |
% |
Global Pest Elimination |
|
67.4 |
|
60.5 |
|
11 |
% |
|
69.5 |
|
61.5 |
|
13 |
% |
Global Life Sciences |
|
28.1 |
|
23.9 |
|
18 |
% |
|
33.2 |
|
26.3 |
|
26 |
% |
Corporate |
|
(73.7) |
|
282.4 |
|
* |
|
|
(76.5) |
|
281.7 |
|
* |
|
Subtotal at fixed currency rates |
|
722.8 |
|
1,019.2 |
|
(29) |
% |
|
760.2 |
|
1,044.8 |
|
(27) |
% |
Currency impact |
|
37.4 |
|
25.6 |
|
* |
|
|
- |
|
- |
|
* |
|
Consolidated reported GAAP operating income |
|
$760.2 |
|
$1,044.8 |
|
(27) |
% |
|
$760.2 |
|
$1,044.8 |
|
(27) |
% |
|
|
|
|
|
|
|
|
|
|
|
|
|
|
|
|
|
Nine Months Ended September 30 |
||||||||||||
|
|
Fixed Currency Rates |
|
Public Currency Rates |
||||||||||
|
|
|
|
|
|
% |
|
|
|
|
|
% |
||
(millions) |
|
2025 |
|
2024 |
|
Change |
|
2025 |
|
2024 |
|
Change |
||
Net Sales |
|
|
|
|
|
|
|
|
|
|
|
|
|
|
Global Water |
|
$5,662.5 |
|
$5,515.8 |
|
3 |
% |
|
$5,858.3 |
|
$5,741.4 |
|
2 |
% |
Global Institutional & Specialty |
|
4,463.0 |
|
4,520.7 |
|
(1) |
% |
|
4,556.5 |
|
4,614.7 |
|
(1) |
% |
Global Pest Elimination |
|
912.0 |
|
852.2 |
|
7 |
% |
|
929.8 |
|
869.0 |
|
7 |
% |
Global Life Sciences |
|
514.7 |
|
490.8 |
|
5 |
% |
|
540.6 |
|
511.1 |
|
6 |
% |
Subtotal at fixed currency rates |
|
11,552.2 |
|
11,379.5 |
|
2 |
% |
|
11,885.2 |
|
11,736.2 |
|
1 |
% |
Currency impact |
|
333.0 |
|
356.7 |
|
* |
|
|
- |
|
- |
|
* |
|
Consolidated reported GAAP net sales |
|
$11,885.2 |
|
$11,736.2 |
|
1 |
% |
|
$11,885.2 |
|
$11,736.2 |
|
1 |
% |
|
|
|
|
|
|
|
|
|
|
|
|
|
|
|
Operating Income (loss) |
|
|
|
|
|
|
|
|
|
|
|
|
|
|
Global Water |
|
$902.3 |
|
$857.0 |
|
5 |
% |
|
$944.5 |
|
$908.7 |
|
4 |
% |
Global Institutional & Specialty |
|
1,023.0 |
|
914.5 |
|
12 |
% |
|
1,041.1 |
|
934.0 |
|
11 |
% |
Global Pest Elimination |
|
174.7 |
|
167.0 |
|
5 |
% |
|
178.2 |
|
170.1 |
|
5 |
% |
Global Life Sciences |
|
88.1 |
|
60.2 |
|
46 |
% |
|
97.4 |
|
67.1 |
|
45 |
% |
Corporate |
|
(231.2) |
|
141.7 |
|
* |
|
|
(235.6) |
|
139.7 |
|
* |
|
Subtotal at fixed currency rates |
|
1,956.9 |
|
2,140.4 |
|
(9) |
% |
|
2,025.6 |
|
2,219.6 |
|
(9) |
% |
Currency impact |
|
68.7 |
|
79.2 |
|
* |
|
|
|
|
- |
|
* |
|
Consolidated reported GAAP operating income |
|
$2,025.6 |
|
$2,219.6 |
|
(9) |
% |
|
$2,025.6 |
|
$2,219.6 |
|
(9) |
% |
* Not meaningful.
As shown in the “Fixed Currency Rates” tables above, we evaluate the performance of our international operations based on fixed currency exchange rates, which eliminate the impact of exchange rate fluctuations on our international operations. Amounts shown in the “Public Currency Rates” tables above reflect amounts translated at actual public average rates of exchange prevailing during the corresponding period and are provided for informational purposes. The difference between the fixed currency exchange rates and the public currency exchange rates is reported as “Currency impact” in the “Fixed Currency Rates” tables above.
The Corporate segment includes amortization from the Nalco and Purolite transactions intangible assets. The Corporate segment also includes special (gains) and charges reported on the Consolidated Statement of Income.
14
ECOLAB INC.
CONSOLIDATED BALANCE SHEETS
(unaudited)
|
|
September 30 |
|
December 31 |
September 30 |
||||
(millions) |
|
2025 |
|
2024 |
2024 |
||||
Assets |
|
|
|
|
|
|
|
|
|
Current assets |
|
|
|
|
|
|
|
|
|
Cash and cash equivalents |
|
$1,955.8 |
|
|
$1,256.8 |
|
|
$1,261.1 |
|
Accounts receivable, net |
|
3,114.1 |
|
|
2,865.0 |
|
|
2,883.0 |
|
Inventories |
|
1,534.9 |
|
|
1,464.9 |
|
|
1,572.4 |
|
Other current assets |
|
501.9 |
|
|
439.0 |
|
|
401.8 |
|
Total current assets |
|
7,106.7 |
|
|
6,025.7 |
|
|
6,118.3 |
|
|
|
|
|
|
|
|
|
|
|
Property, plant and equipment, net |
|
4,062.6 |
|
|
3,752.4 |
|
|
3,545.5 |
|
Goodwill |
|
8,113.0 |
|
|
7,907.3 |
|
|
7,898.7 |
|
Other intangible assets, net |
|
3,135.5 |
|
|
3,308.8 |
|
|
3,282.1 |
|
Operating lease assets |
|
767.7 |
|
|
723.2 |
|
|
688.2 |
|
Other assets |
|
712.1 |
|
|
670.4 |
|
|
568.8 |
|
Total assets |
|
$23,897.6 |
|
|
$22,387.8 |
|
|
$22,101.6 |
|
|
|
|
|
|
|
|
|
|
|
Liabilities and Equity |
|
|
|
|
|
|
|
|
|
Current liabilities |
|
|
|
|
|
|
|
|
|
Short-term debt |
|
$16.2 |
|
|
$615.7 |
|
|
$643.0 |
|
Accounts payable |
|
1,868.4 |
|
|
1,810.0 |
|
|
1,812.3 |
|
Compensation and benefits |
|
606.0 |
|
|
727.4 |
|
|
604.9 |
|
Income taxes |
|
188.0 |
|
|
127.0 |
|
|
235.1 |
|
Other current liabilities |
|
1,509.6 |
|
|
1,512.7 |
|
|
1,413.8 |
|
Total current liabilities |
|
4,188.2 |
|
|
4,792.8 |
|
|
4,709.1 |
|
|
|
|
|
|
|
|
|
|
|
Long-term debt |
|
8,052.7 |
|
|
6,949.2 |
|
|
6,974.5 |
|
Pension and postretirement benefits |
|
597.8 |
|
|
634.9 |
|
|
625.0 |
|
Deferred income taxes |
|
176.9 |
|
|
280.0 |
|
|
264.6 |
|
Operating lease liabilities |
|
600.8 |
|
|
575.5 |
|
|
551.4 |
|
Other liabilities |
|
527.3 |
|
|
366.2 |
|
|
401.5 |
|
Total liabilities |
|
14,143.7 |
|
|
13,598.6 |
|
|
13,526.1 |
|
|
|
|
|
|
|
|
|
|
|
Equity |
|
|
|
|
|
|
|
|
|
Common stock |
|
369.1 |
|
|
367.8 |
|
|
367.6 |
|
Additional paid-in capital |
|
7,448.5 |
|
|
7,159.6 |
|
|
7,108.2 |
|
Retained earnings |
|
12,475.9 |
|
|
11,517.1 |
|
|
11,228.4 |
|
Accumulated other comprehensive loss |
|
(1,903.9) |
|
|
(1,982.0) |
|
|
(1,853.8) |
|
Treasury stock |
|
(8,670.6) |
|
|
(8,305.2) |
|
|
(8,302.6) |
|
Total Ecolab shareholders’ equity |
|
9,719.0 |
|
|
8,757.3 |
|
|
8,547.8 |
|
Noncontrolling interest |
|
34.9 |
|
|
31.9 |
|
|
27.7 |
|
Total equity |
|
9,753.9 |
|
|
8,789.2 |
|
|
8,575.5 |
|
Total liabilities and equity |
|
$23,897.6 |
|
|
$22,387.8 |
|
|
$22,101.6 |
|
15
ECOLAB INC.
SUPPLEMENTAL NON-GAAP RECONCILIATIONS
(unaudited)
|
|
Third Quarter Ended |
|
Nine Months Ended |
|
||||||||
|
|
September 30 |
|
September 30 |
|
||||||||
(millions, except percent and per share) |
|
2025 |
|
2024 |
|
2025 |
|
2024 |
|
||||
|
|
|
|
|
|
|
|
|
|
|
|
|
|
Net sales |
|
|
|
|
|
|
|
|
|
|
|
|
|
Reported GAAP net sales |
|
$4,165.0 |
|
|
$3,998.5 |
|
|
$11,885.2 |
|
|
$11,736.2 |
|
|
Effect of foreign currency translation |
|
(173.1) |
|
|
(111.8) |
|
|
(333.0) |
|
|
(356.7) |
|
|
Non-GAAP fixed currency sales |
|
3,991.9 |
|
|
3,886.7 |
|
|
11,552.2 |
|
|
11,379.5 |
|
|
Effect of acquisitions and divestitures |
|
(25.8) |
|
|
(42.5) |
|
|
(77.7) |
|
|
(242.1) |
|
|
Non-GAAP organic sales |
|
$3,966.1 |
|
|
$3,844.2 |
|
|
$11,474.5 |
|
|
$11,137.4 |
|
|
|
|
|
|
|
|
|
|
|
|
|
|
|
|
Cost of sales |
|
|
|
|
|
|
|
|
|
|
|
|
|
Reported GAAP cost of sales |
|
$2,299.4 |
|
|
$2,261.5 |
|
|
$6,582.4 |
|
|
$6,630.6 |
|
|
Special (gains) and charges |
|
0.3 |
|
|
0.9 |
|
|
7.6 |
|
|
3.2 |
|
|
Non-GAAP adjusted cost of sales |
|
$2,299.1 |
|
|
$2,260.6 |
|
|
$6,574.8 |
|
|
$6,627.4 |
|
|
|
|
|
|
|
|
|
|
|
|
|
|
|
|
Gross profit |
|
|
|
|
|
|
|
|
|
|
|
|
|
Reported GAAP gross profit |
|
$1,865.6 |
|
|
$1,737.0 |
|
|
$5,302.8 |
|
|
$5,105.6 |
|
|
Special (gains) and charges |
|
0.3 |
|
|
0.9 |
|
|
7.6 |
|
|
3.2 |
|
|
Non-GAAP adjusted gross profit |
|
$1,865.9 |
|
|
$1,737.9 |
|
|
$5,310.4 |
|
|
$5,108.8 |
|
|
|
|
|
|
|
|
|
|
|
|
|
|
|
|
Gross margin |
|
|
|
|
|
|
|
|
|
|
|
|
|
Reported GAAP gross margin |
|
44.8 |
% |
|
43.4 |
% |
|
44.6 |
% |
|
43.5 |
% |
|
Non-GAAP adjusted gross margin |
|
44.8 |
% |
|
43.5 |
% |
|
44.7 |
% |
|
43.5 |
% |
|
|
|
|
|
|
|
|
|
|
|
|
|
|
|
Operating income |
|
|
|
|
|
|
|
|
|
|
|
|
|
Reported GAAP operating income |
|
$760.2 |
|
|
$1,044.8 |
|
|
$2,025.6 |
|
|
$2,219.6 |
|
|
Special (gains) and charges at public currency rates |
|
26.5 |
|
|
(331.7) |
|
|
87.9 |
|
|
(289.0) |
|
|
Non-GAAP adjusted operating income |
|
786.7 |
|
|
713.1 |
|
|
2,113.5 |
|
|
1,930.6 |
|
|
Effect of foreign currency translation |
|
(39.3) |
|
|
(25.6) |
|
|
(71.3) |
|
|
(79.1) |
|
|
Non-GAAP adjusted fixed currency operating income |
|
747.4 |
|
|
687.5 |
|
|
2,042.2 |
|
|
1,851.5 |
|
|
Effect of acquisitions and divestitures |
|
(4.9) |
|
|
(10.7) |
|
|
(9.1) |
|
|
(52.5) |
|
|
Non-GAAP organic operating income |
|
$742.5 |
|
|
$676.8 |
|
|
$2,033.1 |
|
|
$1,799.0 |
|
|
|
|
|
|
|
|
|
|
|
|
|
|
|
|
Operating income margin |
|
|
|
|
|
|
|
|
|
|
|
|
|
Reported GAAP operating income margin |
|
18.3 |
% |
|
26.1 |
% |
|
17.0 |
% |
|
18.9 |
% |
|
Non-GAAP adjusted fixed currency operating income margin |
|
18.7 |
% |
|
17.7 |
% |
|
17.7 |
% |
|
16.3 |
% |
|
Non-GAAP organic operating income margin |
|
18.7 |
% |
|
17.6 |
% |
|
17.7 |
% |
|
16.2 |
% |
|
|
|
|
|
|
|
|
|
|
|
|
|
|
|
16
ECOLAB INC.
SUPPLEMENTAL NON-GAAP RECONCILIATIONS
(unaudited)
|
|
Third Quarter Ended |
|
Nine Months Ended |
|
||||||||
|
|
September 30 |
|
September 30 |
|
||||||||
(millions, except percent and per share) |
|
2025 |
|
2024 |
|
2025 |
|
2024 |
|
||||
Net Income attributable to Ecolab |
|
|
|
|
|
|
|
|
|
|
|
|
|
Reported GAAP net income attributable to Ecolab |
|
$585.0 |
|
|
$736.5 |
|
|
$1,511.7 |
|
|
$1,639.5 |
|
|
Special (gains) and charges, after tax |
|
22.0 |
|
|
(230.3) |
|
|
67.7 |
|
|
(206.3) |
|
|
Discrete tax net expense (benefit) |
|
(16.3) |
|
|
15.8 |
|
|
(21.8) |
|
|
(42.7) |
|
|
Non-GAAP adjusted net income attributable to Ecolab |
|
$590.7 |
|
|
$522.0 |
|
|
$1,557.6 |
|
|
$1,390.5 |
|
|
|
|
|
|
|
|
|
|
|
|
|
|
|
|
Diluted EPS attributable to Ecolab |
|
|
|
|
|
|
|
|
|
|
|
|
|
Reported GAAP diluted EPS |
|
$2.05 |
|
|
$2.58 |
|
|
$5.30 |
|
|
$5.72 |
|
|
Special (gains) and charges, after tax |
|
0.08 |
|
|
(0.81) |
|
|
0.24 |
|
|
(0.72) |
|
|
Discrete tax net expense (benefit) |
|
(0.06) |
|
|
0.06 |
|
|
(0.08) |
|
|
(0.15) |
|
|
Non-GAAP adjusted diluted EPS |
|
$2.07 |
|
|
$1.83 |
|
|
$5.46 |
|
|
$4.85 |
|
|
|
|
|
|
|
|
|
|
|
|
|
|
|
|
Provision for Income Taxes |
|
|
|
|
|
|
|
|
|
|
|
|
|
Reported GAAP tax rate |
|
17.8 |
% |
|
25.0 |
% |
|
19.2 |
% |
|
18.9 |
% |
|
Special gains and charges |
|
- |
|
|
(2.9) |
|
|
0.2 |
|
|
(1.6) |
|
|
Discrete tax items |
|
2.2 |
|
|
(2.4) |
|
|
1.1 |
|
|
2.4 |
|
|
Non-GAAP adjusted tax rate |
|
20.0 |
% |
|
19.7 |
% |
|
20.5 |
% |
|
19.7 |
% |
|
17
ECOLAB INC.
SUPPLEMENTAL NON-GAAP RECONCILIATIONS
(unaudited)
|
|
Third Quarter Ended September 30 |
||||||||||
|
|
2025 |
|
2024 |
||||||||
(millions) |
|
Fixed Currency |
|
Impact of Acquisitions and Divestitures |
|
Organic |
|
Fixed Currency |
|
Impact of Acquisitions and Divestitures |
|
Organic |
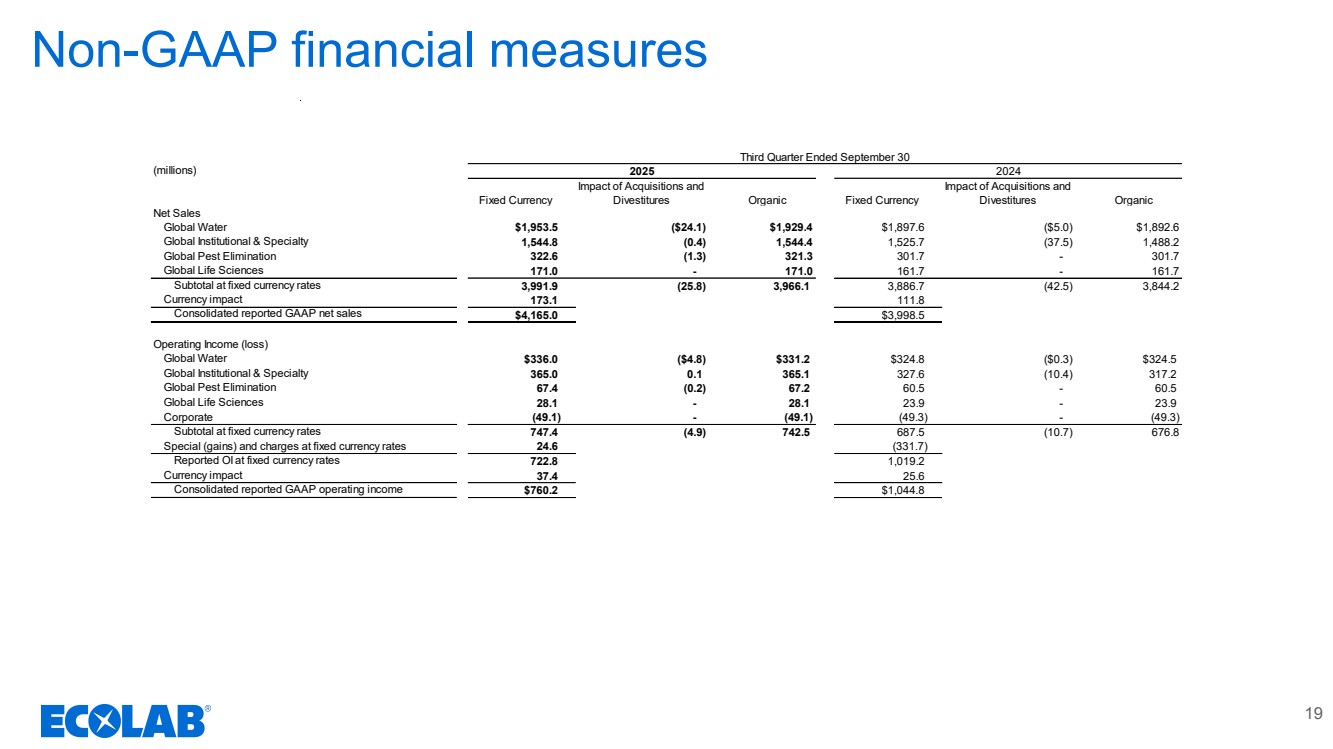
Net Sales |
|
|
|
|
|
|
|
|
|
|
|
|
Global Water |
|
$1,953.5 |
|
($24.1) |
|
$1,929.4 |
|
$1,897.6 |
|
($5.0) |
|
$1,892.6 |
Global Institutional & Specialty |
|
1,544.8 |
|
(0.4) |
|
1,544.4 |
|
1,525.7 |
|
(37.5) |
|
1,488.2 |
Global Pest Elimination |
|
322.6 |
|
(1.3) |
|
321.3 |
|
301.7 |
|
- |
|
301.7 |
Global Life Sciences |
|
171.0 |
|
- |
|
171.0 |
|
161.7 |
|
- |
|
161.7 |
Subtotal at fixed currency rates |
|
3,991.9 |
|
(25.8) |
|
3,966.1 |
|
3,886.7 |
|
(42.5) |
|
3,844.2 |
Currency impact |
|
173.1 |
|
|
|
|
|
111.8 |
|
|
|
|
Consolidated reported GAAP net sales |
|
$4,165.0 |
|
|
|
|
|
$3,998.5 |
|
|
|
|
|
|
|
|
|
|
|
|
|
|
|
|
|
Operating Income (loss) |
|
|
|
|
|
|
|
|
|
|
|
|
Global Water |
|
$336.0 |
|
($4.8) |
|
$331.2 |
|
$324.8 |
|
($0.3) |
|
$324.5 |
Global Institutional & Specialty |
|
365.0 |
|
0.1 |
|
365.1 |
|
327.6 |
|
(10.4) |
|
317.2 |
Global Pest Elimination |
|
67.4 |
|
(0.2) |
|
67.2 |
|
60.5 |
|
- |
|
60.5 |
Global Life Sciences |
|
28.1 |
|
- |
|
28.1 |
|
23.9 |
|
- |
|
23.9 |
Corporate |
|
(49.1) |
|
- |
|
(49.1) |
|
(49.3) |
|
- |
|
(49.3) |
Subtotal at fixed currency rates |
|
747.4 |
|
(4.9) |
|
742.5 |
|
687.5 |
|
(10.7) |
|
676.8 |
Special (gains) and charges at fixed currency rates |
|
24.6 |
|
|
|
|
|
(331.7) |
|
|
|
|
Reported OI at fixed currency rates |
|
722.8 |
|
|
|
|
|
1,019.2 |
|
|
|
|
Currency impact |
|
37.4 |
|
|
|
|
|
25.6 |
|
|
|
|
Consolidated reported GAAP operating income |
|
$760.2 |
|
|
|
|
|
$1,044.8 |
|
|
|
|
|
|
|
|
|
|
|
|
|
|
|
|
|
|
|
|
|
|
|
|
|
|
|
|
|
|
|
|
Nine Months Ended September 30 |
||||||||||
|
|
2025 |
|
2024 |
||||||||
(millions) |
|
Fixed Currency |
|
Impact of Acquisitions and Divestitures |
|
Organic |
|
Fixed Currency |
|
Impact of Acquisitions and Divestitures |
|
Organic |
Net Sales |
|
|
|
|
|
|
|
|
|
|
|
|
Global Water |
|
$5,662.5 |
|
($67.6) |
|
$5,594.9 |
|
$5,515.8 |
|
($24.6) |
|
$5,491.2 |
Global Institutional & Specialty |
|
4,463.0 |
|
(1.2) |
|
4,461.8 |
|
4,520.7 |
|
(217.5) |
|
4,303.2 |
Global Pest Elimination |
|
912.0 |
|
(8.9) |
|
903.1 |
|
852.2 |
|
- |
|
852.2 |
Global Life Sciences |
|
514.7 |
|
- |
|
514.7 |
|
490.8 |
|
- |
|
490.8 |
Subtotal at fixed currency rates |
|
11,552.2 |
|
(77.7) |
|
11,474.5 |
|
11,379.5 |
|
(242.1) |
|
11,137.4 |
Currency impact |
|
333.0 |
|
|
|
|
|
356.7 |
|
|
|
|
Consolidated reported GAAP net sales |
|
$11,885.2 |
|
|
|
|
|
$11,736.2 |
|
|
|
|
|
|
|
|
|
|
|
|
|
|
|
|
|
Operating Income (loss) |
|
|
|
|
|
|
|
|
|
|
|
|
Global Water |
|
$902.3 |
|
($8.8) |
|
$893.5 |
|
$857.0 |
|
$0.4 |
|
$857.4 |
Global Institutional & Specialty |
|
1,023.0 |
|
0.3 |
|
1,023.3 |
|
914.5 |
|
(52.9) |
|
861.6 |
Global Pest Elimination |
|
174.7 |
|
(0.6) |
|
174.1 |
|
167.0 |
|
- |
|
167.0 |
Global Life Sciences |
|
88.1 |
|
- |
|
88.1 |
|
60.2 |
|
- |
|
60.2 |
Corporate |
|
(145.9) |
|
- |
|
(145.9) |
|
(147.2) |
|
- |
|
(147.2) |
Subtotal at fixed currency rates |
|
2,042.2 |
|
(9.1) |
|
2,033.1 |
|
1,851.5 |
|
(52.5) |
|
1,799.0 |
Special (gains) and charges at fixed currency rates |
|
85.3 |
|
|
|
|
|
(288.9) |
|
|
|
|
Reported OI at fixed currency rates |
|
1,956.9 |
|
|
|
|
|
2,140.4 |
|
|
|
|
Currency impact |
|
68.7 |
|
|
|
|
|
79.2 |
|
|
|
|
Consolidated reported GAAP operating income |
|
$2,025.6 |
|
|
|
|
|
$2,219.6 |
|
|
|
|
18
ECOLAB INC.
SUPPLEMENTAL DILUTED EARNINGS PER SHARE INFORMATION
(unaudited)
The table below provides a reconciliation of diluted earnings per share, as reported, to the non-GAAP measure of adjusted diluted earnings per share.
|
|
First |
|
Second |
|
Six |
|
Third |
|
Nine |
|
Fourth |
|
|
|
|
|
Quarter |
|
Quarter |
|
Months |
|
Quarter |
|
Months |
|
Quarter |
|
Year |
|
|
|
Ended |
|
Ended |
|
Ended |
|
Ended |
|
Ended |
|
Ended |
|
Ended |
|
|
|
Mar. 31 |
|
June 30 |
|
June 30 |
|
Sept. 30 |
|
Sept. 30 |
|
Dec. 31 |
|
Dec. 31 |
|
|
|
2024 |
|
2024 |
|
2024 |
|
2024 |
|
2024 |
|
2024 |
|
2024 |
|
Diluted earnings per share, as reported (U.S. GAAP) |
|
$1.43 |
|
$1.71 |
|
$3.14 |
|
$2.58 |
|
$5.72 |
|
$1.66 |
|
$7.37 |
|
Adjustments: |
|
|
|
|
|
|
|
|
|
|
|
|
|
|
|
Special (gains) and charges (1) |
|
0.08 |
|
0.00 |
|
0.08 |
|
(0.81) |
|
(0.72) |
|
0.28 |
|
(0.44) |
|
Discrete tax expense (benefits) (2) |
|
(0.17) |
|
(0.03) |
|
(0.20) |
|
0.06 |
|
(0.15) |
|
(0.13) |
|
(0.28) |
|
Adjusted diluted earnings per share (Non-GAAP) |
|
$1.34 |
|
$1.68 |
|
$3.02 |
|
$1.83 |
|
$4.85 |
|
$1.81 |
|
$6.65 |
|
|
|
First |
|
Second |
|
Six |
|
Third |
|
Nine |
|
Fourth |
|
|
|
|
|
Quarter |
|
Quarter |
|
Months |
|
Quarter |
|
Months |
|
Quarter |
|
Year |
|
|
|
Ended |
|
Ended |
|
Ended |
|
Ended |
|
Ended |
|
Ended |
|
Ended |
|
|
|
Mar. 31 |
|
June 30 |
|
June 30 |
|
Sept. 30 |
|
Sept. 30 |
|
Dec. 31 |
|
Dec. 31 |
|
|
|
2025 |
|
2025 |
|
2025 |
|
2025 |
|
2025 |
|
2025 |
|
2025 |
|
Diluted earnings per share, as reported (U.S. GAAP) |
|
$1.41 |
|
$1.84 |
|
$3.25 |
|
$2.05 |
|
$5.30 |
|
|
|
|
|
Adjustments: |
|
|
|
|
|
|
|
|
|
|
|
|
|
|
|
Special (gains) and charges (3) |
|
0.09 |
|
0.07 |
|
0.16 |
|
0.08 |
|
0.24 |
|
|
|
|
|
Discrete tax expense (benefits) (4) |
|
0.00 |
|
(0.02) |
|
(0.02) |
|
(0.06) |
|
(0.08) |
|
|
|
|
|
Adjusted diluted earnings per share (Non-GAAP) |
|
$1.50 |
|
$1.89 |
|
$3.39 |
|
$2.07 |
|
$5.46 |
|
$0.00 |
|
$0.00 |
|
Per share amounts do not necessarily sum due to changes in shares outstanding and rounding.
(1) Special (gains) and charges for 2024 includes $23.1 million, $0.9 million, ($230.3) million and $79.6 million, net of tax, in the first, second, third and fourth quarters, respectively. These charges were primarily related to restructuring and the gain on the sale of our global surgical solutions business.
(2) Discrete tax expenses (benefits) for 2024 includes ($48.2) million, ($10.3) million, $15.8 million and ($35.9) million in the first, second, third and fourth quarters, respectively. These expenses (benefits) are primarily associated with capital losses, additional basis of foreign intangible assets and other discrete expenses (benefits).
(3) Special (gains) and charges for 2025 includes charges of $25.1 million, $20.6 million and $22.0 million, net of tax, in the first, second and third quarters, respectively. These charges were primarily related to One Ecolab.
(4) Discrete tax expenses (benefits) for 2025 includes ($0.5) million, ($5.0) million and ($16.3) million in the first, second and third quarters, respectively. These expenses (benefits) are primarily associated with share-based compensation excess tax benefits and other discrete expenses (benefits).
19
|
1 ECOLAB Third Quarter 2025 Supplemental |
|
Cautionary statement Forward-Looking Information This communication contains forward looking statements as that term is defined in the Private Securities Litigation Reform Act of 1995. These forward-looking statements include, but are not limited to, statements regarding macroeconomic conditions and our financial and business performance and prospects, including sales, earnings, special (gains) and charges, raw material costs, margins, pricing, currency translation, productivity, investments and new business. These statements are based on the current expectations of management. There are a number of risks and uncertainties that could cause actual results to differ materially from the forward-looking statements included in this communication. In particular, the ultimate results of any restructuring initiative depend on a number of factors, including the development of final plans, the impact of local regulatory requirements regarding employee terminations, the time necessary to develop and implement the restructuring initiatives and the level of success achieved through such actions in improving competitiveness, efficiency and effectiveness. Additional risks and uncertainties are set forth under Item 1A of our most recent Form 10-K, and our other public filings with the Securities and Exchange Commission (“SEC”), and include the impact of economic factors such as the worldwide economy, interest rates, foreign currency risk, reduced sales and earnings in our international operations resulting from the weakening of local currencies versus the U.S. dollar, demand uncertainty, supply chain challenges and inflation; the vitality of the markets we serve; exposure to global economic, political and legal risks related to our international operations, including international trade policies, geopolitical instability and the escalation of armed conflicts; our ability to successfully execute organizational change and management transitions; information technology infrastructure failures or breaches in data security; difficulty in procuring raw materials or fluctuations in raw material costs; our increasing reliance on artificial intelligence technologies in our products, services and operations; the occurrence of severe public health outbreaks not limited to COVID-19; our ability to acquire complementary businesses and to effectively integrate such businesses; our ability to execute key business initiatives; our ability to successfully compete with respect to value, innovation and customer support; the costs and effect of complying with laws and regulations; the occurrence of litigation or claims, including class action lawsuits; and other uncertainties or risks reported from time to time in our reports to the SEC. In light of these risks, uncertainties and factors, the forward-looking events discussed in this communication may not occur. We caution that undue reliance should not be placed on forward-looking statements, which speak only as of the date made. Ecolab does not undertake, and expressly disclaims, any duty to update any forward-looking statement, except as required by law. Non-GAAP Financial Information This communication includes Company information that does not conform to generally accepted accounting principles (GAAP). Management believes that a presentation of this information is meaningful to investors because it provides insight with respect to ongoing operating results of the Company and allows investors to better evaluate the financial results of the Company. These measures should not be viewed as an alternative to GAAP measures of performance. Furthermore, these measures may not be consistent with similar measures provided by other companies. Reconciliations of our non-GAAP measures included within this presentation are included in the “Non-GAAP Financial Measures” section of this presentation. |
|
Expect to deliver continued 12-15% EPS growth 3 Reported sales +4%, with accelerating pricing and continued volume growth Strong organic OI margin expansion, confident in delivering a 20% margin by 2027 Reported diluted EPS $2.05; adjusted diluted EPS $2.07, +13% Continue to expect 12-15% adjusted EPS growth in 2025 and beyond ▪ Organic sales +3%, driven by value price accelerating to 3% from 2% and continued 1% volume growth. ▪ Core performance was led by continued strong growth in Institutional & Specialty and accelerating growth in Food & Beverage. Ongoing soft market demand in Basic Industries and Paper was mitigated by good new business wins. ▪ Ecolab’s growth engines, which include Life Sciences, Pest Elimination, Global High-Tech and Ecolab Digital, collectively grew double-digits. ▪ Reported OI -27%, reflecting the comparison to last year’s gain on the sale of the global surgical solutions business. Organic OI +10%. ▪ Reported OI margin 18.3%. Organic OI margin 18.7%, +110 bps as solid sales growth and improved productivity was partially offset by growth-oriented investments in the business. ▪ As expected, Ecolab delivered another strong quarter of double-digit EPS growth. ▪ Performance was driven by accelerating pricing, volume growth, and continued strong organic operating income margin expansion. ▪ 2025: Ecolab is sharpening its 2025 adjusted EPS range to between $7.48 and $7.58, +12% to 14%. ▪ 4Q 2025: Expect fourth quarter 2025 adjusted diluted earnings per share in the $2.02 to $2.12 range, +12% to 17%. |
|
3Q overview ▪ Solid performance with reported sales +4% o Pricing accelerated to +3%, supported by ongoing customer value delivery. o Volume +1%, driven by good new business and breakthrough innovation. ▪ Organic growth led by Institutional & Specialty, Pest Elimination, and Life Sciences o Water +2%, accelerating Food & Beverage sales and continued double-digit growth in Global High-Tech more than offset a 2% headwind from Basic Industries and Paper. o Institutional & Specialty remained strong at +4%, reflecting continued good growth in hospitality and modestly lower sales to hospitals. o Pest Elimination +6%, fueled by the One Ecolab growth strategy. o Life Sciences +6%, led by strong double-digit growth in bioprocessing and pharmaceutical sales. ▪ Reported diluted EPS $2.05 ▪ Adjusted diluted EPS $2.07, +13% o Strong performance was fueled by accelerating pricing, continued volume growth, and strong organic operating income margin expansion. Sales EPS 4 |
|
Expect Strong Finish To 2025, 12-15% EPS Growth in 2026 4Q 2025 ▪ Ecolab expects fourth quarter 2025 adjusted diluted earnings per share in the $2.02 to $2.12 range, rising 12% to 17% compared with adjusted diluted earnings per share of $1.81 a year ago. ▪ Secular growth trends in water, hygiene, infection prevention, and digital technologies continue to fuel resilient, long-term demand for Ecolab’s innovative technologies and services. Strong momentum in Ecolab’s growth engines, which include Life Sciences, Pest Elimination, Global High-Tech and Ecolab Digital, is expected to continue. Ecolab’s investments in these areas position the company well to capitalize on these attractive long-term high-growth, high-margin opportunities. ▪ In the near-term, the global operating environment remains unpredictable, characterized by constantly evolving geopolitics and international trade policy, which are impacting end-market demand. Importantly, with these dynamic macroeconomic conditions, Ecolab’s confidence in its earnings growth trajectory is strong. The company remains focused on outperforming its end markets by delivering best-in-class value to customers, leveraging its One Ecolab growth strategy and its record breakthrough innovation pipeline. ▪ As a result, Ecolab is sharpening its 2025 adjusted EPS range to between $7.48 and $7.58, rising 12% to 14% compared with adjusted diluted earnings per share of $6.65 in 2024. 5 |
|
3Q 2025 sales growth detail 6 Amounts in the tables above do not necessarily sum due to rounding. Fixed Rate Organic % Change % Change Global Water Consolidated Light & Heavy 4% 2% Volume 1% Food & Beverage 4% 4% Pricing 3% Paper -4% -4% Organic 3% Total Global Water 3% 2% Acq./Div. 0% Fixed currency growth 3% Global Institutional & Specialty Currency impact 2% Institutional -1% 3% Total 4% Specialty 7% 7% Total Global Institutional & Specialty 1% 4% Global Pest Elimination 7% 6% Global Life Sciences 6% 6% Total 3% 3% % Change |
|
7 Sales +2% Light & Heavy All sales figures are organic unless otherwise noted Global Water Segment Q4: Expect modest sales growth as continued strong double-digit growth in Global High-tech more than offsets softer demand in Basic Industries. ▪ Growth in light and heavy reflected continued strong double-digit growth in Global High-tech and accelerating manufacturing sales growth, which more than offset ongoing soft end market demand in Basic Industries. o Manufacturing: Accelerating sales growth driven by continued good momentum in food & beverage, leveraging the One Ecolab enterprise selling strategy. o Basic Industries: Sales modestly declined as further new business wins were more than offset by continued soft end market demand in primary metals and chemicals. o High-tech: Continued strong double-digit sales growth driven by attractive share gains from our innovative cooling technologies for data centers and circular water programs for microelectronics. o Downstream: Stable sales reflected continued growth in North America, offset by softer sales in other international regions. ▪ The impact of increasing water demand, which is being amplified by the rapid build out of artificial intelligence infrastructure, continues to be a critical issue for our customers, and one that Ecolab is uniquely positioned to help them solve. Our innovative circular water solutions, digital technologies, and service expertise help our customers improve their performance, significantly reduce water consumption, and meet their sustainability objectives. |
|
8 Sales -4% Paper All sales figures are organic unless otherwise noted Global Water Segment Sales +4% Food & Beverage Q4: Anticipate good sales growth as strong new business wins and value pricing continue to outperform industry trends. ▪ Organic sales growth accelerated as new business wins and value pricing outperformed industry trends. Growth was led by good gains in beverage, dairy, and food. ▪ Regionally, North America, Latin America, and IMEA delivered strong growth, while sales in Europe and Asia Pacific were rather stable. ▪ We continue to benefit from our One Ecolab enterprise selling approach to customers, where we combine our industry-leading cleaning and sanitizing, water treatment and digital technologies to deliver significant customer value through improved food safety, lower operating costs and water usage optimization. Q4: Expect modestly lower sales as new business wins are offset by continued soft customer production rates. ▪ As expected, sales were modestly lower as continued new business wins were offset by continued soft customer production rates. ▪ Solid growth in tissue and towel was offset by softer demand in packaging. ▪ While soft customer production rates continue to present challenging market dynamics, our strong new business wins are largely mitigating these unfavorable market impacts. Good share gains continue to be driven by new innovation and our global service expertise, which help our customers improve their performance, optimize their costs, and reduce their water consumption. |
|
9 Sales +3% Institutional Sales +7% Specialty All sales figures are organic unless otherwise noted Global Institutional & Specialty Segment Q4: We expect continued growth in hospitality, partially offset by modestly lower sales to hospitals. ▪ Beginning in 2025, Ecolab’s healthcare business is being reported within the Institutional division. As expected, continued good growth in sales to hospitality customers was partially offset by modestly lower sales to hospitals. o Hospitality: Good growth continues to be driven by value pricing and attractive new business wins from our One Ecolab growth initiative. Growth continues to outperform end market trends as customers leverage our innovative products and service expertise that help improve performance, optimize labor, and reduce total costs. o Hospitals: Modestly lower organic sales reflected continued non-strategic, low margin business exits, which were partially offset by good value pricing. Our new business efforts are focused on attractive long-term growth opportunities in the infection prevention and instrument reprocessing areas to drive profitable long-term growth. ▪ We remain focused on driving attractive long-term growth by capitalizing on One Ecolab growth opportunities and harnessing digital innovations like DishIQ, KitchenIQ, and AquaIQ. These efforts are delivering enhanced total customer value and generating attractive new business wins for Ecolab. Q4: Expect continued strong sales growth driven by strong new business wins. ▪ As expected, Specialty delivered strong sales growth as robust new business wins more than offset the impact from previously disclosed non-strategic, low margin business exits. Strong fundamental performance continued to significantly outperform market trends. o Quick Service: Continued strong growth reflected good new business and our ongoing product and digital innovation that delivers leading food safety outcomes, labor optimization and lower total operating costs. Demand across the quick service industry for our labor and cost optimization technologies continues to be strong, which we are uniquely positioned to capture. o Food Retail: Sales growth accelerated, reflecting improved new business wins. These good wins are being driven by our One Ecolab growth initiative and new product and digital innovation. As a trusted food safety partner for retailers, we continue to expand our competitive differentiation by helping our customers protect their brand, improve their customer experience, and optimize their operational performance. |
|
10 Sales +6% Pest Elimination All sales figures are organic unless otherwise noted Global Pest Elimination Segment ▪ Continued strong organic growth was led by good gains in food & beverage, restaurants, and healthcare, which benefited from our One Ecolab enterprise selling approach. ▪ To fuel continued, strong long-term growth and market share gains, our focus is on rapidly accelerating the rollout of our digital pest intelligence program to provide customers with enhanced service and value. This leading digital offering, along with our high service levels, are expanding the total value delivered to customers, extending our competitive advantages, and enhancing our long-term growth opportunities. Q4: Expect continued strong growth, benefiting from new customer wins as we leverage our investments in pest intelligence. |
|
11 Sales +6% Life Sciences All sales figures are organic unless otherwise noted Global Life Sciences Segment Q4: Expect solid growth as good new business momentum and progressively improving industry trends overcome comparisons to last year’s very strong growth in bioprocessing sales. ▪ Accelerating sales growth reflected continued good new business wins that leverage our innovation, investments in new capabilities, and progressively improving industry trends. ▪ Continued double-digit growth in bioprocessing and pharmaceutical & personal care overcame ongoing capacity constraints within Life Sciences’ industrial water purification business. ▪ The long-term growth opportunities for the Life Sciences industry are very attractive. We continue to invest and innovate to further expand our global capabilities and technical expertise across contamination control and purification technologies including bioprocessing to capitalize on this long-term growth opportunity. |
|
Segment operating income performance ▪ Organic operating income increased 2% as sales growth and improved productivity overcame growth-oriented investments in the business. ▪ Global Water’s underlying performance was strong when excluding Basic Industries and Paper, which together reduced organic operating income growth by low double digits. ▪ Organic operating income increased 11% as strong sales growth was partially offset by growth-oriented investments, including pest intelligence. ($ millions – fixed currency, unaudited) 12 Global Water 3Q 2025 3Q 2024 Change Operating income $336.0 $324.8 3% Operating income margin 17.2% 17.1% 10 bps Organic operating income $331.2 $324.5 2% Organic operating income margin 17.2% 17.1% 10 bps Global Institutional & Specialty 3Q 2025 3Q 2024 Change Operating income $365.0 $327.6 11% Operating income margin 23.6% 21.5% 210 bps Organic operating income $365.1 $317.2 15% Organic operating income margin 23.6% 21.3% 230 bps Global Life Sciences 3Q 2025 3Q 2024 Change Operating income $28.1 $23.9 18% Operating income margin 16.4% 14.8% 160 bps Organic operating income $28.1 $23.9 18% Organic operating income margin 16.4% 14.8% 160 bps Global Pest Elimination 3Q 2025 3Q 2024 Change Operating income $67.4 $60.5 11% Operating income margin 20.9% 20.1% 80 bps Organic operating income $67.2 $60.5 11% Organic operating income margin 20.9% 20.1% 80 bps ▪ Organic operating income increased 18%, as strong sales growth was partially offset by growth-oriented investments in the business. ▪ Life Sciences’ current mid-teens organic operating income margin reflects strong underlying profitability and continued investments in breakthrough innovation, global capabilities, and capacity to unlock this very attractive, long-term growth opportunity. ▪ Organic operating income increased 15%, as good sales growth and improved supply chain operations was partially offset by growth-oriented investments in the business. |
|
Consolidated margin performance ▪ Gross margin expanded significantly, reflecting strong value pricing. ▪ SG&A to sales was impacted by growth-oriented investments in the business, including recent acquisitions. ▪ Operating margin expanded as solid sales growth and improved productivity was partially offset by growth-oriented investments in the business. Gross Margin SG&A Operating Margin 13 $ millions, unaudited 3Q 2025 3Q 2024 Change Gross profit $1,865.6 $1,737.0 7% Gross margin 44.8% 43.4% 140 bps Adjusted gross profit $1,865.9 $1,737.9 7% Adjusted gross margin 44.8% 43.5% 130 bps SG&A $1,079.2 $1,024.8 5% % of Sales 25.9% 25.6% 30 bps Reported operating income $760.2 $1,044.8 -27% Reported operating income margin 18.3% 26.1% -780 bps Adj. fixed currency operating income $747.4 $687.5 9% Adj. fixed currency operating income margin 18.7% 17.7% 100 bps Organic operating income $742.5 $676.8 10% Organic operating income margin 18.7% 17.6% 110 bps |
|
Balance sheet / cash flow * EBITDA and Adjusted EBITDA are non-GAAP measures. EBITDA is defined as net income including non-controlling interest with the sum of provision for income taxes, net interest expense, depreciation and amortization added back. Adjusted EBITDA further adds back special (gains) and charges impacting EBITDA. The inputs to EBITDA reflect the trailing twelve months of activity for the period presented. See “Non-GAAP Financial Measures” section of this presentation for corresponding reconciliations. 14 Summary Balance Sheet (millions, unaudited) 2025 2024 (millions, unaudited) 2025 2024 Cash and cash eq. $1,955.8 $1,261.1 Short-term debt $16.2 $643.0 Accounts receivable, net 3,114.1 2,883.0 Accounts payable 1,868.4 1,812.3 Inventories 1,534.9 1,572.4 Other current liabilities 2,303.6 2,253.8 Other current assets 501.9 401.8 Long-term debt 8,052.7 6,974.5 PP&E, net 4,062.6 3,545.5 Pension/Postretirement 597.8 625.0 Goodwill and intangibles 11,248.5 11,180.8 Other liabilities 1,305.0 1,217.5 Other assets 1,479.8 1,257.0 Total equity 9,753.9 8,575.5 Total assets $23,897.6 $22,101.6 Total liab. and equity $23,897.6 $22,101.6 Selected Cash Flow items (millions, unaudited) 2025 2024 (unaudited) 2025 2024 Cash from op. activities $1,862.5 $2,047.2 Total Debt/Total Capital 45.3% 47.0% Depreciation 493.8 473.7 Net Debt/Total Capital 38.5% 42.6% Amortization 226.5 226.2 Net Debt/EBITDA(*) 1.7 1.7 Capital expenditures 716.2 634.8 Net Debt/Adjusted EBITDA(*) 1.6 1.8 September 30 September 30 Nine Months Ended Selected Balance Sheet measures September 30 September 30 |
|
Non-GAAP financial measures 15 (millions, except percent and per share) Net sales Reported GAAP net sales $4,165.0 $3,998.5 $11,885.2 $11,736.2 Effect of foreign currency translation (173.1) (111.8) (333.0) (356.7) Non-GAAP fixed currency sales 3,991.9 3,886.7 11,552.2 11,379.5 Effect of acquisitions and divestitures (25.8) (42.5) (77.7) (242.1) Non-GAAP organic sales $3,966.1 $3,844.2 $11,474.5 $11,137.4 Cost of sales Reported GAAP cost of sales $2,299.4 $2,261.5 $6,582.4 $6,630.6 Special (gains) and charges 0.3 0.9 7.6 3.2 Non-GAAP adjusted cost of sales $2,299.1 $2,260.6 $6,574.8 $6,627.4 Gross profit Reported GAAP gross profit $1,865.6 $1,737.0 $5,302.8 $5,105.6 Special (gains) and charges 0.3 0.9 7.6 3.2 Non-GAAP adjusted gross profit $1,865.9 $1,737.9 $5,310.4 $5,108.8 Gross margin Reported GAAP gross margin 44.8 % 43.4 % 44.6 % 43.5 % Non-GAAP adjusted gross margin 44.8 % 43.5 % 44.7 % 43.5 % Third Quarter Ended Nine Months Ended September 30 September 30 2025 2024 2025 2024 |
|
Non-GAAP financial measures 16 (millions, except percent and per share) Operating income Reported GAAP operating income $760.2 $1,044.8 $2,025.6 $2,219.6 Special (gains) and charges at public currency rates 26.5 (331.7) 87.9 (289.0) Non-GAAP adjusted operating income 786.7 713.1 2,113.5 1,930.6 Effect of foreign currency translation (39.3) (25.6) (71.3) (79.1) Non-GAAP adjusted fixed currency operating income 747.4 687.5 2,042.2 1,851.5 Effect of acquisitions and divestitures (4.9) (10.7) (9.1) (52.5) Non-GAAP organic operating income $742.5 $676.8 $2,033.1 $1,799.0 Operating income margin Reported GAAP operating income margin 18.3 % 26.1 % 17.0 % 18.9 % Non-GAAP adjusted fixed currency operating income margin 18.7 % 17.7 % 17.7 % 16.3 % Non-GAAP organic operating income margin 18.7 % 17.6 % 17.7 % 16.2 % Net Income attributable to Ecolab Reported GAAP net income attributable to Ecolab $585.0 $736.5 $1,511.7 $1,639.5 Special (gains) and charges, after tax 22.0 (230.3) 67.7 (206.3) Discrete tax net expense (benefit) (16.3) 15.8 (21.8) (42.7) Non-GAAP adjusted net income attributable to Ecolab $590.7 $522.0 $1,557.6 $1,390.5 2025 2024 Third Quarter Ended Nine Months Ended September 30 September 30 2025 2024 |
|
Non-GAAP financial measures 17 Diluted EPS attributable to Ecolab Reported GAAP diluted EPS $2.05 $2.58 $5.30 $5.72 Special (gains) and charges, after tax 0.08 (0.81) 0.24 (0.72) Discrete tax net expense (benefit) (0.06) 0.06 (0.08) (0.15) Non-GAAP adjusted diluted EPS $2.07 $1.83 $5.46 $4.85 Provision for Income Taxes Reported GAAP tax rate 17.8 % 25.0 % 19.2 % 18.9 % Special gains and charges - (2.9) 0.2 (1.6) Discrete tax items 2.2 (2.4) 1.1 2.4 Non-GAAP adjusted tax rate 20.0 % 19.7 % 20.5 % 19.7 % 2025 2024 Third Quarter Ended Nine Months Ended September 30 September 30 2025 2024 |
|
Non-GAAP financial measures 18 (millions) EBITDA (trailing twelve months ended) Net income including non-controlling interest $2,004.2 $2,063.2 Provision for income taxes 417.7 511.2 Interest expense, net 238.5 291.2 Depreciation 655.0 627.1 Amortization 300.8 303.3 EBITDA $3,616.2 $3,796.0 Special (gains) and charges impacting EBITDA 193.3 (254.5) Adjusted EBITDA $3,809.5 $3,541.5 Third Quarter Ended September 30 2025 2024 |
|
Non-GAAP financial measures 19 (millions) Fixed Currency Impact of Acquisitions and Divestitures Organic Fixed Currency Impact of Acquisitions and Divestitures Organic Net Sales Global Water $1,953.5 ($24.1) $1,929.4 $1,897.6 ($5.0) $1,892.6 Global Institutional & Specialty 1,544.8 (0.4) 1,544.4 1,525.7 (37.5) 1,488.2 Global Pest Elimination 322.6 (1.3) 321.3 301.7 - 301.7 Global Life Sciences 171.0 - 171.0 161.7 - 161.7 Subtotal at fixed currency rates 3,991.9 (25.8) 3,966.1 3,886.7 (42.5) 3,844.2 Currency impact 173.1 111.8 Consolidated reported GAAP net sales $4,165.0 $3,998.5 Operating Income (loss) Global Water $336.0 ($4.8) $331.2 $324.8 ($0.3) $324.5 Global Institutional & Specialty 365.0 0.1 365.1 327.6 (10.4) 317.2 Global Pest Elimination 67.4 (0.2) 67.2 60.5 - 60.5 Global Life Sciences 28.1 - 28.1 23.9 - 23.9 Corporate (49.1) - (49.1) (49.3) - (49.3) Subtotal at fixed currency rates 747.4 (4.9) 742.5 687.5 (10.7) 676.8 Special (gains) and charges at fixed currency rates 24.6 (331.7) Reported OI at fixed currency rates 722.8 1,019.2 Currency impact 37.4 25.6 Consolidated reported GAAP operating income $760.2 $1,044.8 Third Quarter Ended September 30 2025 2024 |
|
20 Non-GAAP Financial Information: This communication and certain of the accompanying tables include financial measures that have not been calculated in accordance with accounting principles generally accepted in the U.S. (“GAAP”). These non-GAAP financial measures include: • fixed currency sales • organic sales • adjusted cost of sales • adjusted gross profit • adjusted gross margin • fixed currency operating income • adjusted operating income • adjusted fixed currency operating income • adjusted fixed currency operating income margin • organic operating income • organic operating income margin • adjusted tax rate • adjusted net income attributable to Ecolab • adjusted diluted earnings per share • EBITDA • Adjusted EBITDA We provide these measures as additional information regarding our operating results. We use these non-GAAP measures internally to evaluate our performance and in making financial and operational decisions, including with respect to incentive compensation. We believe that our presentation of these measures provides investors with greater transparency with respect to our results of operations and that these measures are useful for period-to-period comparison of results. Non-GAAP financial information |
|
21 Non-GAAP Financial Information (Continued): Our non-GAAP financial measures for adjusted cost of sales, adjusted gross margin, adjusted gross profit and adjusted operating income exclude the impact of special (gains) and charges and our non-GAAP financial measures for adjusted tax rate, adjusted net income attributable to Ecolab and adjusted diluted earnings per share further exclude the impact of discrete tax items. We include items within special (gains) and charges and discrete tax items that we believe can significantly affect the period-over-period assessment of operating results and not necessarily reflect costs and/or income associated with historical trends and future results. After tax special (gains) and charges are derived by applying the applicable local jurisdictional tax rate to the corresponding pre-tax special (gains) and charges. EBITDA is defined as net income including non-controlling interest with the sum of provision for income taxes, net interest expense, depreciation and amortization added back. Adjusted EBITDA further adds back special (gains) and charges impacting EBITDA. EBITDA and adjusted EBITDA are used in our net debt to EBITDA and net debt to adjusted EBITDA ratios, which we view as important indicators of the operational and financial health of our organization. We evaluate the performance of our international operations based on fixed currency rates of foreign exchange, which eliminate the translation impact of exchange rate fluctuations on our international results. Fixed currency amounts included in this release are based on translation into U.S. dollars at the fixed foreign currency exchange rates established by management at the beginning of 2025. We also provide our segment results based on public currency rates for informational purposes. Our reportable segments do not include the impact of intangible asset amortization from the Nalco and Purolite transactions or the impact of special (gains) and charges as these are not allocated to the Company’s reportable segments. Our non-GAAP financial measures for organic sales, organic operating income and organic operating income margin are at fixed currency and exclude the impact of special (gains) and charges, the results of our acquired businesses from the first twelve months post acquisition and the results of divested businesses from the twelve months prior to divestiture. Further, due to the sale of the global surgical solutions business on August 1, 2024, we have excluded the results of the business for the nine-month period ended September 30, 2024 from these organic measures to remain comparable to the corresponding periods in 2025. In addition, as part of the separation of ChampionX in 2020, we continue to provide certain products to ChampionX, which are recorded in product and equipment sales in the Global Water segment along with the related cost of sales. These transactions are removed from the consolidated results as part of the calculation of the impact of acquisitions and divestitures. These non-GAAP financial measures are not in accordance with, or an alternative to, GAAP and may be different from non-GAAP measures used by other companies. Investors should not rely on any single financial measure when evaluating our business. We recommend that investors view these measures in conjunction with the GAAP measures included in this news release. Reconciliations of our non-GAAP measures are included in the following “Non-GAAP Financial Measures” tables of this communication. We do not provide reconciliations for non-GAAP estimates on a forward-looking basis (including those contained in this news release) when we are unable to provide a meaningful or accurate calculation or estimation of reconciling items and the information is not available without unreasonable effort. This is due to the inherent difficulty of forecasting the timing and amount of various items that have not yet occurred, are out of our control and/or cannot be reasonably predicted, and that would impact reported earnings per share and the reported tax rate, the most directly comparable forward-looking GAAP financial measures to adjusted earnings per share and the adjusted tax rate. For the same reasons, we are unable to address the probable significance of the unavailable information. Non-GAAP financial information (cont.) |