UNITED STATES
SECURITIES AND EXCHANGE COMMISSION
Washington, D.C. 20549
FORM 8-K
CURRENT REPORT
PURSUANT TO SECTION 13 OR 15(d) OF THE
SECURITIES EXCHANGE ACT OF 1934
Date of Report (Date of earliest event reported): October 20, 2025
First United Corporation
(Exact name of registrant as specified in its charter)
| Maryland | 0-14237 | 52-1380770 | ||
| (State or other jurisdiction of | (Commission file number) | (IRS Employer | ||
| incorporation or organization) | Identification No.) |
19 South Second Street, Oakland, Maryland 21550
(Address of principal executive offices) (Zip Code)
(301) 334-9471
(Registrant’s telephone number, including area code)
N/A
(Former Name or Former Address, if Changed Since Last Report)
Check the appropriate box below if the Form 8-K filing is intended to simultaneously satisfy the filing obligations of the registrant under any of the following provisions:
| ¨ | Written communications pursuant to Rule 425 under the Securities Act (17 CFR 230.425) |
| ¨ | Soliciting material pursuant to Rule 14a-12 under the Exchange Act (17 CFR 240.14a-12) |
| ¨ | Pre-commencement communications pursuant to Rule 14d-2(b) under the Exchange Act (17 CFR 240.14d-2(b)) |
| ¨ | Pre-commencement communications pursuant to Rule 13e-4(c) under the Exchange Act (17 CFR 240.13e-4(c)) |
Securities registered pursuant to Section 12(b) of the Act:
| Title of each class | Trading Symbols | Name of each exchange on which registered |
| Common Stock | FUNC | Nasdaq Stock Market |
Indicate by check mark whether the registrant is an emerging growth company as defined in Rule 405 of the Securities Act of 1933 (17 CFR §230.405) or Rule 12b-2 of the Securities Exchange Act of 1934 (17 CFR §240.12b-2).
Emerging growth company ¨
If an emerging growth company, indicate by check mark if the registrant has elected not to use the extended transition period for complying with any new or revised financial accounting standards provided pursuant to Section 13(a) of the Exchange Act. ¨
INFORMATION TO BE INCLUDED IN THE REPORT
Item 2.02. Results of Operation and Financial Condition.
On October 20, 2025, First United Corporation (the “Corporation”) issued a press release describing its financial results for the three- and nine-months ended September 30, 2025. A copy of the press release is furnished herewith as Exhibit 99.1.
The information contained in this Item 2.02 shall not be deemed “filed” for purposes of Section 18 of the Securities Exchange Act of 1934, as amended (the “Exchange Act”), or incorporated by reference in any filing under the Securities Act of 1933, as amended (the “Securities Act”), or the Exchange Act, except as shall be expressly set forth by specific reference in such a filing.
Item 7.01. Regulation FD Disclosure.
On October 21, 2025, the Corporation published an investor presentation that discusses certain aspects of its financial results for the three- and nine-months ended September 30, 2025. A copy of the presentation is furnished herewith as Exhibit 99.2.
The information contained in this Item 7.01 shall not be deemed “filed” for purposes of Section 18 of the Exchange Act or incorporated by reference in any filing under the Securities Act or the Exchange Act, except as shall be expressly set forth by specific reference in such a filing.
Item 9.01. Financial Statements and Exhibits.
(d) Exhibits.
The exhibits filed or furnished with this report are listed in the following Exhibit Index:
| Exhibit No. | Description | |
| 99.1 | Press release dated October 20 20, 2025 (furnished herewith) | |
| 99.2 | Investor presentation dated October 21, 2025 (furnished herewith) | |
| 104 | Cover page interactive data file (embedded within the iXBRL document) |
-
SIGNATURES
Pursuant to the requirements of the Securities Exchange Act of 1934, the registrant has duly caused this report to be signed on its behalf by the undersigned hereunto duly authorized.
| FIRST UNITED CORPORATION | ||
| Dated: October 21, 2025 | By: | /s/ Tonya K. Sturm |
| Tonya K. Sturm | ||
| Senior Vice President & CFO | ||
-
Exhibit 99.1
FIRST UNITED CORPORATION ANNOUNCES
THIRD QUARTER 2025 FINANCIAL RESULTS
OAKLAND, MARYLAND— October 20, 2025: First United Corporation (the “Corporation”, “we”, “us”, and “our”) (NASDAQ: FUNC), a bank holding company and the parent company of First United Bank & Trust (the “Bank”), today announced financial results for the three- and nine-month periods ended September 30, 2025. Net income was $6.9 million for the third quarter of 2025, or $1.07 per diluted common share, compared to $5.8 million, or $0.89 per diluted common share, for the third quarter of 2024 and $6.0 million, or $0.92 per diluted common share, for the second quarter of 2025. Net income for the first nine months of 2025 was $18.7 million, or $2.88 per diluted common share, compared to $14.4 million, or $2.19 per diluted common share, for the same period of 2024. Annualized Return on Average Assets and Return on Average Equity for the nine-month period ended September 30, 2025 were 1.24% and 13.23%, respectively.
According to Carissa Rodeheaver, Chairman, President and CEO, “We are pleased to report another strong quarter, once again driven by increased net interest margin and expense control. Our commercial, mortgage and wealth relationship managers continue to deliver strong production, and our entire team remains focused on controlling expenses. The strong income allowed us to increase our dividend this quarter. ”
Third Quarter Financial Highlights:
| · | Net interest margin, on a non-GAAP, fully tax equivalent (“FTE”) basis, was 3.69% for the third quarter of 2025, reflecting increased loan yields and stable funding costs. |
| · | Strong loan production during the quarter, with $29.8 million in commercial loan originations and $20.8 million in residential mortgage originations, offset by unusually high payoffs. |
| · | Provision expense was $0.5 million in the third quarter resulting from reduced loan growth and a charge-off related to one non-accrual commercial relationship, partially offset by improved qualitative factors. |
| · | Operating income, including net gains, increased slightly by $0.2 million when compared to the linked quarter. |
| · | Operating expenses were stable compared to the linked quarter. |
| · | A cash dividend of $0.26 per common share was declared in the third quarter. |
Income Statement Overview
On a GAAP basis, net income for the third quarter of 2025 was $6.9 million. This compares to $6.0 million for the second quarter of 2025 and $5.8 million for the third quarter of 2024.
| Q3 2025 | Q2 2025 | Q3 2024 | ||||||||||
| Net Income, GAAP (millions) | $ | 6.9 | $ | 6.0 | $ | 5.8 | ||||||
| Diluted earnings per share, GAAP | $ | 1.07 | $ | 0.92 | $ | 0.89 | ||||||
The $1.2 million increase in quarterly net income when compared to the third quarter of 2024 was primarily driven by a $2.2 million increase in net interest income and a $0.3 million increase in non-interest income, partially offset by increases in provision expense of $0.2 million, non-interest expense of $0.7 million and income tax expense of $0.4 million. Comparing the third quarter of 2025 to the same period of 2024, interest and fees on loans increased by $2.0 million primarily due to the repricing of adjustable-rate loans and new production booked at higher rates. Quarterly interest expense increased by $0.3 million on a year-over-year basis. This increase was attributable to growth in our municipal deposit balances, offset slightly by reduced interest expense on short-term borrowings related to the repayment of $40.0 million in Bank Term Funding Program (“BTFP”) balances in September 2024. Other operating income increased by $0.3 million due to increases in wealth management income and net gains as a result of an investment sale transaction. Other operating expenses increased by $0.7 million due to a $0.4 million increase in salaries and benefit expenses, a $0.2 million increase in professional services, and a $0.2 million increase in data processing costs. These increases were offset by slight reductions in equipment, other real estate owned (“OREO”) and investor relations expenses.
Compared to the linked quarter, net income increased by $1.0 million as net interest income increased by $0.7 million due to an increase in interest and fees on loans of $0.8 million, a decrease in provision expense of $0.4 million, and an increase in other operating income of $0.2 million related to net gains on sales of investment securities, trust department income, and an incentive received on check fees. Non-interest expenses remained stable when comparing the linked quarter to the third quarter. Income tax expense increased by $0.3 million.
Net income for the first nine months of 2025 was $18.7 million compared to $14.4 million for the same period in 2024. Net interest income increased by $5.8 million due to a $6.4 million increase in interest income due to loans repricing at higher rates and new loan production booked at higher rates. Interest expense increased by $0.6 million driven by a $1.2 million increase in interest on deposits related to growth in our municipal balances, partially offset by a net reduction in borrowing costs of $0.7 million resulting from the repayment of $40.0 million in BTFP balances late in the third quarter of 2024. Provision for credit losses decreased by $0.4 million due primarily to strong credit quality, lower charge-offs and lower loan growth during the first nine months of 2025 when compared to the same time period in 2024. Other operating income increased by $0.6 million primarily due to a $0.4 million increase in trust department income and a $0.2 million increase on gains from the sales of residential mortgages and investment securities.. These increases were partially offset by a $1.0 million increase in other operating expenses that were primarily related to a $0.7 million increase in salaries and employee benefits as a result of increased salary expense as we continue to build our sales teams, a $0.5 million increase in data processing expenses related to software agreements, and a $0.3 million increase in professional services expenses from increased audit fees. These increases were partially offset by a $0.8 million decrease in equipment and occupancy expenses due primarily to reduced depreciation expense related to the closure of four branches early in 2024.
Net Interest Income and Net Interest Margin
Net interest income, on a non-GAAP, FTE basis, increased by $2.2 million for the third quarter of 2025 when compared to the third quarter of 2024. This increase was driven by an increase of $2.5 million in interest income due to a $2.0 million increase in interest income on loans resulting from an increase of 25 basis points in the overall yield on the loan portfolio. This increase in yield was attributable to upward repricing of adjustable-rate loans and an increase in average balances of $68.4 million. Interest income on investment securities increased by $0.2 million due to an increase in average balances of $9.0 million and an increase in yield of 17 basis points. The increase in the investment portfolio resulted from management’s strategic decision to reinvest cashflows in the higher rate environment to increase yield on the portfolio. Interest income on Federal funds sold increased by $0.2 million due to an increase of $37.4 million in average balances, partially offset by a decrease of 147 basis points in average rates. Interest expense increased by $0.3 million when compared to the third quarter of 2024. Interest expense paid on deposits increased by $0.4 million related to a $100.5 million increase in average balances, partially offset by a decrease of 6 basis points on the rate paid. Interest paid on short-term borrowings decreased by $0.5 million when compared to the same period of 2024 due to the repayment of the $40.0 million borrowing from the BTFP late in the third quarter of 2024. Interest paid on long-term borrowings increased by $0.4 million when compared to the third quarter of 2024 due to a $43.8 million increase in average balances, partially offset by a decrease of 80 basis points on rates paid.
Comparing the third quarter of 2025 to the second quarter of 2025, net interest income, on a non-GAAP, FTE basis, increased by $0.7 million. This increase was driven by a $0.9 million increase in interest income as a result of an increase in interest and fees on loans of $0.8 million as average loan balances increased by $12.4 million and average yield increased by 8 basis points. Interest expense increased by $0.2 million due to a $0.2 million increase in interest paid on deposits attributable to a $21.9 million increase in average balances and a slight increase in average yield of 1 basis point. Interest expense on borrowing costs remained stable when comparing the third quarter of 2025 to the linked quarter.
Comparing the nine months ended September 30, 2025 to the nine months ended September 30, 2024, net interest income, on a non-GAAP, FTE basis, increased by $5.8 million. Interest income increased by $6.4 million and was driven by an increase of $6.6 million on interest and fees on loans as average loan balances increased by $72.6 million and the overall yield increased by 32 basis points in correlation with upward repricing of adjustable-rate loans. Interest expense on deposits increased by $1.2 million as the average deposit balances increased by $87.6 million, driven by increases of $6.3 million in demand deposit accounts, $73.6 million in money market balances and $24.4 million in brokered time deposits, partially offset by decreases in savings balances of $15.2 million and $1.5 million in retail time deposits. Interest expense on short-term borrowings decreased by $1.4 million due to the Bank’s utilization of the BTFP program in 2024 and subsequent repayment late in the third quarter of 2024. Long-term borrowing costs increased $0.7 million as a result of an increase of $37.3 million in FHLB average balances, partially offset by a decrease in rate paid of 85 basis points. The net interest margin for the nine months ended September 30, 2025 was 3.64% compared to 3.34% for the nine months ended September 30, 2024.
Non-Interest Income
Other operating income, including net gains, for the third quarter of 2025 increased by $0.3 million when compared to the same period of 2024. This increase was driven by a $0.2 million increase in wealth management income, reflecting higher market valuations and expanded relationships with both new and existing clients. Additionally, $0.1 million in net gains from the sale of available-for-sale investments was recognized in the third quarter of 2025.
On a linked quarter basis, other operating income, including net gains, increased by $0.2 million. The increase was attributable to a $0.1 million cash incentive received in connection with check fees and $0.1 million in net gains from the sale of available-for-sale investments. Wealth management income was stable when compared to the prior quarter.
Other operating income for the nine months ended September 30, 2025 increased by $0.6 million when compared to the same period of 2024. This increase was attributable to a $0.4 million increase in wealth management income, driven by improving market conditions, increased annuity sales and growth in new and existing customer relationships. Gains on sales of residential mortgages increased by $0.1 million and gains on sales of investment securities increased by $0.1 million. Service charge and debit card income were both stable when comparing the first nine months of 2025 to the same period of 2024.
Non-Interest Expense
Operating expenses increased by $0.7 million in the third quarter of 2025 when compared to the third quarter of 2024. Salaries and employee benefits increased by $0.4 million due to a $0.4 million increase in salary expense related to normal merit increases effective April 1, 2025 and increased staffing levels as an effort to build out our West region and a $0.1 million increase in incentive expense, partially offset by decreases in employee life and health insurance expense due to decreased claims. Additionally, data processing and professional services expenses each increased by $0.2 million year-over-year.
Compared to the linked quarter, operating expenses were stable. Net OREO expenses decreased by $0.1 million, and data processing expenses and investor relations expenses each decreased by $0.1 million. These decreases were partially offset by a $0.3 million increase in salaries and employee benefits related to increased salary and incentive expense.
For the nine months ended September 30, 2025, non-interest expense increased by $1.0 million when compared to the nine months ended September 30, 2024. Salaries and employee benefits increased by $0.7 million related to normal merit increases effective April 1, 2025, increased salary expense as a result of increased staffing levels as we continue to expand our West region, increases in incentives, and 401K expenses offset by reduced life and health insurance costs related to reduced claims in 2025. Net OREO expenses increased by $0.1 million. Data processing expenses increased by $0.5 million primarily due to increased software agreements and professional services expenses increased by $0.3 million as a result of increased audit fees. These increases were partially offset by a $0.8 million decrease in occupancy and equipment expenses related to accelerated depreciation expense recognized in the first quarter of 2024 related to branch closures.
The effective income tax rates as a percentage of income for the nine-month periods ended September 30, 2025 and September 30, 2024 remained stable at 24.7% and 24.6%, respectively.
Balance Sheet Overview
Total assets at September 30, 2025 were $2.0 billion, representing a $51.0 million increase since December 31, 2024. During the first nine months of 2025, the investment portfolio increased by $8.9 million as bonds were purchased to lock in yield in anticipation of potential declines in long-term rates. Gross loans increased by $16.0 million as new production during the nine months of 2025 was mitigated by amortization and increased payoffs. Other assets, including deferred taxes, premises and equipment, bank owned life insurance, pension assets, accrued trust income receivable, and accrued interest receivable, increased by $11.3 million.
Total liabilities at September 30, 2025 were $1.8 billion, representing a $31.1 million increase since December 31, 2024. Total deposits increased by $104.1 million when compared to December 31, 2024. The increase in deposits was primarily driven by $50.0 million in new brokered time deposits obtained in January 2025 to fund the repayment of the $50.0 million in overnight borrowings outstanding at December 31, 2024. In addition, savings and money market accounts increased by $42.0 million, retail time deposits increased by $9.7 million, and non-interest-bearing deposits increased by $3.2 million. Interest-bearing demand deposits, primarily our ICS product, decreased slightly by $0.8 million due primarily to seasonal fluctuations in municipal deposit accounts. Short-term borrowings decreased by $45.2 million due to the purchase of the brokered time deposit mentioned previously which was partially offset by increases in the overnight investment sweep product. Long-term borrowings decreased by $25.0 million due to the full repayment of a matured $25.0 million Federal Home Loan Bank borrowing in September 2025.
Outstanding loans of $1.5 billion at September 30, 2025 reflected a $16.0 million increase since December 31, 2024.
|
Loan Type (in millions) |
Change since June 30, 2025 |
Change since December 31, 2024 |
||||||
| Commercial | $ | (3.7 | ) | $ | 18.3 | |||
| 1 to 4 Family Mortgages | $ | (0.6 | ) | $ | 2.5 | |||
| Consumer | $ | (1.4 | ) | $ | (4.8 | ) | ||
| Gross Loans | $ | (5.7 | ) | $ | 16.0 | |||
Since December 31, 2024, commercial real estate loans increased by $28.1 million, acquisition and development loans decreased by $1.3 million, commercial and industrial loans decreased by $8.5 million, residential mortgage loans increased by $2.5 million, and consumer loans decreased by $4.8 million.
New commercial loan production for the third quarter of 2025 was approximately $29.8 million. Year to date commercial production was approximately $139.0 million, which compares to $117.0 million for the nine months ended September 30, 2024. The commercial pipeline was strong as of September 30, 2025 at $50.4 million, and unfunded, commercial construction loans totaled approximately $42.8 million. Commercial amortization and payoffs were unusually high at approximately $29.4 million for the three months ended September 30, 2025. Included in that amount were payoffs of approximately $20.9 million during the third quarter primarily attributable to four relationships either utilizing cash to repay or consolidating debt.
New consumer mortgage loan production for the third quarter of 2025 was approximately $20.8 million, most of which was comprised of in-house mortgages booked to our portfolio. The pipeline of in-house, portfolio loans as of September 30, 2025 was $23.0 million. Unfunded commitments related to residential construction loans totaled $12.1 million at September 30, 2025.
Total deposits at September 30, 2025 increased by $104.1 million when compared to December 31, 2024.
|
Deposit Type (in millions) |
Change since June 30, 2025 |
Change since December 31, 2024 |
||||||
| Non-Interest-Bearing | $ | 4.2 | $ | 3.2 | ||||
| Interest-Bearing Demand | $ | 38.3 | $ | (0.8 | ) | |||
| Savings and Money Market | $ | 16.5 | $ | 42.0 | ||||
| Time Deposits- Retail | $ | 5.7 | $ | 9.7 | ||||
| Tim Deposits- Brokered | $ | 0.0 | $ | 50.0 | ||||
| Total Deposits | $ | 64.7 | $ | 104.1 | ||||
In January 2025, $50.0 million in brokered time deposits with an average interest rate of 4.24% were obtained to fund the repayment of $50.0 million in overnight borrowings that were outstanding on December 31, 2024. Savings and money market accounts increased by $42.0 million due primarily to the expansion of current and new relationships throughout the first nine months of 2025. Non-interest-bearing checking deposits increased by $3.2 million and interest-bearing checking deposits decreased by $0.8 million as we experienced seasonal fluctuations in municipal and commercial account balances and increased spending by businesses and consumers related to inflation. Retail time deposits increased by $9.7 million since December 31, 2024.
The book value of the Corporation’s common stock was $30.65 per share at September 30, 2025 compared to $27.71 per share at December 31, 2024. At September 30, 2025, there were 6,496,908 basic outstanding shares and 6,508,790 diluted outstanding shares of common stock. The increase in the book value at September 30, 2025 was due to the undistributed net income of $14.2 million for the first nine months of 2025.
Asset Quality
The allowance for credit losses (“ACL”) was $19.1 million at September 30, 2025 compared to $18.0 million at September 30, 2024 and $18.2 million at December 31, 2024. The provision for credit losses was $0.5 million for the quarter ended September 30, 2025 compared to $0.3 million for the quarter ended September 30, 2024 and $0.9 million for the second quarter of 2025. The increased provision expense recorded in the third quarter of 2025 when compared to the same period in 2024 resulted from increased net charge-offs of $0.4 million in the third quarter of 2025 compared to $0.1 million in the third quarter of 2024. The decrease in provision expense compared to the linked quarter was due to decreases in the overall loan portfolio and improved qualitative factors, partially offset by the increased net charge-offs primarily related to one non-accrual commercial and industrial relationship. Asset quality remained strong during the third quarter of 2025. The ratio of the ACL to loans outstanding remained stable at 1.28%at September 30, 2025 compared to 1.27% at June 30, 2025 and 1.24% at September 30, 2024.
The ratio of net charge offs to average loans was 0.08% for the nine months ended September 30, 2025, and 0.18% for the nine months ended September 30, 2024. The commercial and industrial portfolio had net charge offs of 0.41% and 0.53% for the nine-month periods ended September 30, 2025 and 2024, respectively, due primarily to charge offs on one non-accrual commercial relationship. The acquisition and development portfolio had net recoveries of 0.42% and 0.08% for the nine-month periods ended September 30, 2025 and 2024, respectively. This shift was due primarily to recoveries recognized in 2025 related to one relationship previously charged off in 2016. The decrease in net charge offs in consumer loans in the first nine months of 2025 was primarily driven by approximately $0.3 million in charge offs of demand deposit balances during the first quarter of 2024. Details of the ratios, by loan type, are shown below. Our special assets team continues to actively collect on charged-off loans, resulting in overall low net charge-off ratios.
| Ratio of Net (Charge Offs)/Recoveries to Average Loans | ||||||||
| 9/30/2025 | 9/30/2024 | |||||||
| Loan Type | (Charge Off) / Recovery | (Charge Off) / Recovery | ||||||
| Commercial Real Estate | 0.00 | % | 0.01 | % | ||||
| Acquisition & Development | 0.42 | % | 0.08 | % | ||||
| Commercial & Industrial | (0.41 | %) | (0.53 | %) | ||||
| Residential Mortgage | 0.01 | % | 0.01 | % | ||||
| Consumer | (1.06 | %) | (2.04 | %) | ||||
| Total Net (Charge Offs)/Recoveries | (0.08 | %) | (0.18 | %) | ||||
Non-accrual loans totaled $3.8 million at September 30, 2025 compared to $4.9 million at December 31, 2024. The decrease in non-accrual balances at September 30, 2025 was related to principal paydowns and the charge-off of $0.5 million of related to a non-accrual commercial and industrial relationship that was recorded during the third quarter of 2025.
Non-accrual loans that have been subject to partial charge-offs totaled $0.3 million and $0.7 million at September 30, 2025 and December 31, 2024, respectively. Loans secured by 1-4 family residential real estate properties in the process of foreclosure totaled $0.2 million and $1.6 million at September 30, 2025 and December 31, 2024, respectively. As a percentage of the loan portfolio, accruing loans past due 30 days or more were 0.26% at September 30, 2025 compared to 0.32% at December 31, 2024 and 0.37% as September 30, 2024.
ABOUT FIRST UNITED CORPORATION
First United Corporation is a Maryland corporation chartered in 1985 and a financial holding company registered with the Board of Governors of the Federal Reserve System under the Bank Holding Company Act of 1956, as amended, that elected financial holding company status in 2021. The Corporation’s primary business is serving as the parent company of the Bank, First United Statutory Trust I (“Trust I”) and First United Statutory Trust II (“Trust II” and together with Trust I, “the Trusts”), both Connecticut statutory business trusts. The Trusts were formed for the purpose of selling trust preferred securities that qualified as Tier 1 capital. The Bank has two consumer finance company subsidiaries- Oak First Loan Center, Inc., a West Virginia corporation, and OakFirst Loan Center, LLC, a Maryland limited liability company – and one subsidiary that it uses to hold real estate acquired through foreclosure or by deed in lieu of foreclosure – First OREO Trust, a Maryland statutory trust. In addition, the Bank owns 99.9% of the limited partnership interests in Liberty Mews Limited Partnership, a Maryland limited partnership formed for the purpose of acquiring, developing and operating low-income housing units in Garrett County, Maryland, and a 99.9% non-voting membership interest in MCC FUBT Fund, LLC, an Ohio limited liability company formed for the purpose of acquiring, developing and operating low-income housing units in Allegany County, Maryland and Mineral County, West Virginia. The Corporation’s website is www.mybank.com.
FORWARD-LOOKING STATEMENTS
This press release contains forward-looking statements as defined by the Private Securities Litigation Reform Act of 1995. Forward-looking statements do not represent historical facts, but are statements about management's beliefs, plans and objectives about the future, as well as its assumptions and judgments concerning such beliefs, plans and objectives. These statements are evidenced by terms such as "anticipate," "estimate," "should," "expect," "believe," "intend," and similar expressions. Although these statements reflect management's good faith beliefs and projections, they are not guarantees of future performance and they may not prove true. The beliefs, plans and objectives on which forward-looking statements are based involve risks and uncertainties that could cause actual results to differ materially from those addressed in the forward-looking statements. For a discussion of these risks and uncertainties, see the section of the periodic reports that First United Corporation files with the Securities and Exchange Commission entitled "Risk Factors". In addition, investors should understand that the Corporation is required under generally accepted accounting principles to evaluate subsequent events through the filing of the consolidated financial statements included in its Quarterly Report on Form 10-Q for the quarter ended September 30, 2025 and the impact that any such events have on our critical accounting assumptions and estimates made as of September 30, 2025, which could require us to make adjustments to the amounts reflected in this press release.
FIRST UNITED CORPORATION
Oakland, MD
Stock Symbol : FUNC
Financial Highlights - Unaudited
(Dollars in thousands, except per share data)
| Three Months Ended | Nine Months Ended | |||||||||||||||
| September 30, | September 30, | September 30, | September 30, | |||||||||||||
| 2025 | 2024 | 2025 | 2024 | |||||||||||||
| Results of Operations: | ||||||||||||||||
| Interest income | $ | 25,762 | $ | 23,257 | $ | 74,695 | $ | 68,268 | ||||||||
| Interest expense | 8,359 | 8,029 | 24,569 | 23,990 | ||||||||||||
| Net interest income | 17,403 | 15,228 | 50,126 | 44,278 | ||||||||||||
| Provision for credit losses | 510 | 264 | 2,026 | 2,404 | ||||||||||||
| Other operating income | 5,074 | 4,912 | 14,836 | 14,487 | ||||||||||||
| Net gains | 261 | 141 | 499 | 282 | ||||||||||||
| Other operating expense | 12,986 | 12,314 | 38,536 | 37,559 | ||||||||||||
| Income before taxes | $ | 9,242 | $ | 7,703 | $ | 24,899 | $ | 19,084 | ||||||||
| Income tax expense | 2,294 | 1,932 | 6,161 | 4,701 | ||||||||||||
| Net income | $ | 6,948 | $ | 5,771 | $ | 18,738 | $ | 14,383 | ||||||||
| Per share data: | ||||||||||||||||
| Basic net income per share | $ | 1.07 | $ | 0.89 | $ | 2.89 | $ | 2.20 | ||||||||
| Diluted net income per share | $ | 1.07 | $ | 0.89 | $ | 2.88 | $ | 2.19 | ||||||||
| Adjusted Basic net income (1) | $ | 1.07 | $ | 0.89 | $ | 2.89 | $ | 2.26 | ||||||||
| Adjusted Diluted net income (1) | $ | 1.07 | $ | 0.89 | $ | 2.88 | $ | 2.25 | ||||||||
| Dividends declared per share | $ | 0.26 | $ | 0.22 | $ | 0.70 | $ | 0.62 | ||||||||
| Book value | $ | 30.65 | $ | 26.90 | ||||||||||||
| Diluted book value | $ | 30.59 | $ | 26.84 | ||||||||||||
| Tangible book value per share | $ | 28.87 | $ | 25.06 | ||||||||||||
| Diluted Tangible book value per share | $ | 28.82 | $ | 25.01 | ||||||||||||
| Closing market value | $ | 36.77 | $ | 29.84 | ||||||||||||
| Market Range: | ||||||||||||||||
| High | $ | 38.41 | $ | 30.77 | ||||||||||||
| Low | $ | 32.02 | $ | 20.40 | ||||||||||||
| Shares outstanding at period end: Basic | 6,496,908 | 6,468,625 | ||||||||||||||
| Shares outstanding at period end: Diluted | 6,508,790 | 6,482,648 | ||||||||||||||
| Performance ratios: (Year to Date Period End, annualized) | ||||||||||||||||
| Return on average assets | 1.24 | % | 0.99 | % | ||||||||||||
| Adjusted return on average assets | 1.24 | % | 1.01 | % | ||||||||||||
| Return on average shareholders' equity | 13.23 | % | 11.52 | % | ||||||||||||
| Adjusted return on average shareholders' equity | 13.23 | % | 11.78 | % | ||||||||||||
| Net interest margin (Non-GAAP), includes tax exempt income of $160 and $176 | 3.64 | % | 3.34 | % | ||||||||||||
| Net interest margin GAAP | 3.63 | % | 3.32 | % | ||||||||||||
| Efficiency ratio - non-GAAP (1) | 58.73 | % | 62.46 | % | ||||||||||||
| (1) | Efficiency ratio is a non-GAAP measure calculated by dividing total operating expenses by the sum of tax equivalent net interest income and other operating income. |
| September 30, | December 31 | |||||||||||||||
| 2025 | 2024 | |||||||||||||||
| Financial Condition at period end: | ||||||||||||||||
| Assets | $ | 2,023,974 | $ | 1,973,022 | ||||||||||||
| Earning assets | $ | 1,784,056 | $ | 1,758,665 | ||||||||||||
| Gross loans | $ | 1,496,762 | $ | 1,480,793 | ||||||||||||
| Commercial Real Estate | $ | 554,418 | $ | 526,364 | ||||||||||||
| Acquisition and Development | $ | 93,968 | $ | 95,314 | ||||||||||||
| Commercial and Industrial | $ | 279,079 | $ | 287,534 | ||||||||||||
| Residential Mortgage | $ | 521,317 | $ | 518,815 | ||||||||||||
| Consumer | $ | 47,980 | $ | 52,766 | ||||||||||||
| Investment securities | $ | 278,898 | $ | 269,991 | ||||||||||||
| Total deposits | $ | 1,678,902 | $ | 1,574,829 | ||||||||||||
| Noninterest bearing | $ | 429,986 | $ | 426,737 | ||||||||||||
| Interest bearing | $ | 1,248,916 | $ | 1,148,092 | ||||||||||||
| Shareholders' equity | $ | 199,099 | $ | 179,295 | ||||||||||||
| Capital ratios: | ||||||||||||||||
| Tier 1 to risk weighted assets | 15.59 | % | 14.70 | % | ||||||||||||
| Common Equity Tier 1 to risk weighted assets | 13.68 | % | 12.79 | % | ||||||||||||
| Tier 1 Leverage | 12.10 | % | 11.88 | % | ||||||||||||
| Total risk based capital | 16.84 | % | 15.92 | % | ||||||||||||
| Asset quality: | ||||||||||||||||
| Net charge-offs for the quarter | $ | (435 | ) | $ | (362 | ) | ||||||||||
| Nonperforming assets: (Period End) | ||||||||||||||||
| Nonaccrual loans | $ | 3,825 | $ | 4,931 | ||||||||||||
| Loans 90 days past due and accruing | 801 | 918 | ||||||||||||||
| Total nonperforming loans and 90 day past due | $ | 4,626 | $ | 5,849 | ||||||||||||
| Other real estate owned | $ | 2,718 | $ | 3,062 | ||||||||||||
| Other repossessed assets | $ | 3,043 | $ | 2,802 | ||||||||||||
| Modified loans | $ | 998 | $ | 1,006 | ||||||||||||
| Allowance for credit losses to gross loans | 1.28 | % | 1.23 | % | ||||||||||||
| Allowance for credit losses to non-accrual loans | 499.06 | % | 368.49 | % | ||||||||||||
| Allowance for credit losses to non-performing assets | 183.78 | % | 155.13 | % | ||||||||||||
| Non-performing loans and 90 day past due loans to total loans | 0.31 | % | 0.39 | % | ||||||||||||
| Non-performing loans and 90 day past due loans to total assets | 0.23 | % | 0.30 | % | ||||||||||||
| Non-accrual loans to total loans | 0.26 | % | 0.33 | % | ||||||||||||
| Non-performing assets to total assets | 0.51 | % | 0.59 | % |
FIRST UNITED CORPORATION
Oakland, MD
Stock Symbol : FUNC
Financial Highlights - Unaudited
| September 30, | June 30, | March 31, | December 31, | September 30, | June 30, | March 31, | ||||||||||||||||||||||
| (Dollars in thousands, except per share data) | 2025 | 2025 | 2025 | 2024 | 2024 | 2024 | 2024 | |||||||||||||||||||||
| Results of Operations: | ||||||||||||||||||||||||||||
| Interest income | $ | 25,762 | $ | 24,871 | $ | 24,062 | $ | 23,725 | $ | 23,257 | $ | 23,113 | $ | 21,898 | ||||||||||||||
| Interest expense | 8,359 | 8,164 | 8,046 | 8,025 | 8,029 | 7,875 | 8,086 | |||||||||||||||||||||
| Net interest income | 17,403 | 16,707 | 16,016 | 15,700 | 15,228 | 15,238 | 13,812 | |||||||||||||||||||||
| Provision for credit losses | 510 | 860 | 656 | 529 | 264 | 1,194 | 946 | |||||||||||||||||||||
| Other operating income | 5,074 | 4,940 | 4,822 | 4,924 | 4,912 | 4,782 | 4,793 | |||||||||||||||||||||
| Net gains | 261 | 146 | 92 | 132 | 141 | 59 | 82 | |||||||||||||||||||||
| Other operating expense | 12,986 | 12,974 | 12,576 | 12,081 | 12,314 | 12,364 | 12,881 | |||||||||||||||||||||
| Income before taxes | $ | 9,242 | $ | 7,959 | $ | 7,698 | $ | 8,146 | $ | 7,703 | $ | 6,521 | $ | 4,860 | ||||||||||||||
| Income tax expense | 2,294 | 1,975 | 1,892 | 1,960 | 1,932 | 1,607 | 1,162 | |||||||||||||||||||||
| Net income | $ | 6,948 | $ | 5,984 | $ | 5,806 | $ | 6,186 | $ | 5,771 | $ | 4,914 | $ | 3,698 | ||||||||||||||
| Per share data: | ||||||||||||||||||||||||||||
| Basic net income per share | $ | 1.07 | $ | 0.92 | $ | 0.90 | $ | 0.95 | $ | 0.89 | $ | 0.75 | $ | 0.56 | ||||||||||||||
| Diluted net income per share | $ | 1.07 | $ | 0.92 | $ | 0.89 | $ | 0.95 | $ | 0.89 | $ | 0.75 | $ | 0.56 | ||||||||||||||
| Adjusted basic net income (1) | $ | 1.07 | $ | 0.92 | $ | 0.90 | $ | 0.95 | $ | 0.89 | $ | 0.75 | $ | 0.62 | ||||||||||||||
| Adjusted diluted net income (1) | $ | 1.07 | $ | 0.92 | $ | 0.89 | $ | 0.95 | $ | 0.89 | $ | 0.75 | $ | 0.62 | ||||||||||||||
| Dividends declared per share | $ | 0.26 | $ | 0.22 | $ | 0.22 | $ | 0.22 | $ | 0.22 | $ | 0.22 | $ | 0.20 | ||||||||||||||
| Book value | $ | 30.65 | $ | 29.43 | $ | 28.35 | $ | 27.71 | $ | 26.90 | $ | 25.39 | $ | 24.89 | ||||||||||||||
| Diluted book value | $ | 30.59 | $ | 29.38 | $ | 28.27 | $ | 27.65 | $ | 26.84 | $ | 25.34 | $ | 24.86 | ||||||||||||||
| Tangible book value per share | $ | 28.87 | $ | 27.64 | $ | 26.55 | $ | 25.89 | $ | 25.06 | $ | 23.55 | $ | 23.08 | ||||||||||||||
| Diluted Tangible book value per share | $ | 28.82 | $ | 27.59 | $ | 26.47 | $ | 25.83 | $ | 25.01 | $ | 23.49 | $ | 23.05 | ||||||||||||||
| Closing market value | $ | 36.77 | $ | 31.01 | $ | 30.02 | $ | 33.71 | $ | 29.84 | $ | 20.42 | $ | 22.91 | ||||||||||||||
| Market Range: | ||||||||||||||||||||||||||||
| High | $ | 38.41 | $ | 32.09 | $ | 41.61 | $ | 36.17 | $ | 30.77 | $ | 22.88 | $ | 23.85 | ||||||||||||||
| Low | $ | 32.02 | $ | 25.90 | $ | 29.38 | $ | 29.63 | $ | 20.40 | $ | 19.40 | $ | 21.21 | ||||||||||||||
| Shares outstanding at period end: Basic | 6,496,908 | 6,494,611 | 6,478,634 | 6,471,096 | 6,468,625 | 6,465,601 | 6,648,645 | |||||||||||||||||||||
| Shares outstanding at period end: Diluted | 6,508,790 | 6,506,493 | 6,497,454 | 6,485,119 | 6,482,648 | 6,479,624 | 6,657,239 | |||||||||||||||||||||
| Performance ratios: (Year to Date Period End, annualized) | ||||||||||||||||||||||||||||
| Return on average assets | 1.24 | % | 1.20 | % | 1.19 | % | 1.06 | % | 0.99 | % | 0.89 | % | 0.76 | % | ||||||||||||||
| Adjusted return on average assets (1) | 1.24 | % | 1.20 | % | 1.19 | % | 1.08 | % | 1.01 | % | 0.98 | % | 0.85 | % | ||||||||||||||
| Return on average shareholders' equity | 13.23 | % | 12.78 | % | 12.83 | % | 12.16 | % | 11.52 | % | 10.48 | % | 9.07 | % | ||||||||||||||
| Adjusted return on average shareholders' equity (1) | 13.23 | % | 12.78 | % | 12.83 | % | 12.42 | % | 11.78 | % | 11.52 | % | 10.11 | % | ||||||||||||||
| Net interest margin (Non-GAAP), includes tax exempt income of $160 and $176 | 3.64 | % | 3.61 | % | 3.56 | % | 3.38 | % | 3.34 | % | 3.31 | % | 3.12 | % | ||||||||||||||
| Net interest margin GAAP | 3.63 | % | 3.60 | % | 3.55 | % | 3.36 | % | 3.32 | % | 3.29 | % | 3.10 | % | ||||||||||||||
| Efficiency ratio - non-GAAP (1) | 58.73 | % | 59.66 | % | 59.95 | % | 61.31 | % | 62.46 | % | 63.48 | % | 65.71 | % | ||||||||||||||
| (1) | Efficiency ratio is a non-GAAP measure calculated by dividing total operating expenses by the sum of tax equivalent net interest income. |
| September 30, | June 30, | March 31, | December 31, | September 30, | June 30, | March 31, | ||||||||||||||||||||||
| 2025 | 2025 | 2025 | 2024 | 2024 | 2024 | 2024 | ||||||||||||||||||||||
| Financial Condition at period end: | ||||||||||||||||||||||||||||
| Assets | $ | 2,023,974 | $ | 2,007,471 | $ | 1,979,753 | $ | 1,973,022 | $ | 1,916,126 | $ | 1,868,599 | $ | 1,912,953 | ||||||||||||||
| Earning assets | $ | 1,784,056 | $ | 1,789,747 | $ | 1,762,891 | $ | 1,758,665 | $ | 1,722,346 | $ | 1,695,425 | $ | 1,695,962 | ||||||||||||||
| Gross loans | $ | 1,496,762 | $ | 1,502,481 | $ | 1,479,869 | $ | 1,480,793 | $ | 1,447,883 | $ | 1,422,975 | $ | 1,412,327 | ||||||||||||||
| Commercial Real Estate | $ | 554,418 | $ | 550,717 | $ | 532,764 | $ | 526,364 | $ | 502,828 | $ | 506,273 | $ | 492,819 | ||||||||||||||
| Acquisition and Development | $ | 93,968 | $ | 98,937 | $ | 94,063 | $ | 95,314 | $ | 92,909 | $ | 88,215 | $ | 83,424 | ||||||||||||||
| Commercial and Industrial | $ | 279,079 | $ | 281,484 | $ | 282,370 | $ | 287,534 | $ | 277,994 | $ | 260,168 | $ | 274,722 | ||||||||||||||
| Residential Mortgage | $ | 521,317 | $ | 521,968 | $ | 520,072 | $ | 518,815 | $ | 519,168 | $ | 511,354 | $ | 501,990 | ||||||||||||||
| Consumer | $ | 47,980 | $ | 49,375 | $ | 50,600 | $ | 52,766 | $ | 54,984 | $ | 56,965 | $ | 59,372 | ||||||||||||||
| Investment securities | $ | 278,898 | $ | 279,541 | $ | 275,143 | $ | 269,991 | $ | 267,214 | $ | 267,151 | $ | 278,716 | ||||||||||||||
| Total deposits | $ | 1,678,902 | $ | 1,614,207 | $ | 1,623,574 | $ | 1,574,829 | $ | 1,540,395 | $ | 1,537,071 | $ | 1,563,453 | ||||||||||||||
| Noninterest bearing | $ | 429,986 | $ | 425,784 | $ | 422,415 | $ | 426,737 | $ | 419,437 | $ | 423,970 | $ | 422,759 | ||||||||||||||
| Interest bearing | $ | 1,248,916 | $ | 1,188,423 | $ | 1,201,159 | $ | 1,148,092 | $ | 1,120,958 | $ | 1,113,101 | $ | 1,140,694 | ||||||||||||||
| Shareholders' equity | $ | 199,099 | $ | 191,147 | $ | 183,694 | $ | 179,295 | $ | 173,979 | $ | 164,177 | $ | 165,481 | ||||||||||||||
Capital ratios: |
||||||||||||||||||||||||||||
| Tier 1 to risk weighted assets | 15.59 | % | 15.22 | % | 14.87 | % | 14.70 | % | 14.61 | % | 14.51 | % | 14.58 | % | ||||||||||||||
| Common Equity Tier 1 to risk weighted assets | 13.68 | % | 13.32 | % | 12.97 | % | 12.79 | % | 12.66 | % | 12.54 | % | 12.60 | % | ||||||||||||||
| Tier 1 Leverage | 12.10 | % | 12.08 | % | 11.94 | % | 11.88 | % | 11.88 | % | 11.69 | % | 11.48 | % | ||||||||||||||
| Total risk based capital | 16.84 | % | 16.47 | % | 16.10 | % | 15.92 | % | 15.83 | % | 15.75 | % | 15.83 | % | ||||||||||||||
Asset quality: |
||||||||||||||||||||||||||||
| Net (charge-offs)/recoveries for the quarter | $ | (435 | ) | $ | (151 | ) | $ | (360 | ) | $ | (362 | ) | $ | (109 | ) | $ | (1,309 | ) | $ | (459 | ) | |||||||
| Nonperforming assets: (Period End) | ||||||||||||||||||||||||||||
| Nonaccrual loans | $ | 3,825 | $ | 3,813 | $ | 4,026 | $ | 4,931 | $ | 8,073 | $ | 9,438 | $ | 16,007 | ||||||||||||||
| Loans 90 days past due and accruing | 801 | 535 | 233 | 918 | 538 | 526 | 120 | |||||||||||||||||||||
| Total nonperforming loans and 90 day past due | $ | 4,626 | $ | 4,348 | $ | 4,259 | $ | 5,849 | $ | 8,611 | $ | 9,964 | $ | 16,127 | ||||||||||||||
| Other real estate owned | $ | 2,718 | $ | 3,035 | $ | 3,062 | $ | 3,062 | $ | 2,860 | $ | 2,978 | $ | 4,402 | ||||||||||||||
| Other repossessed assets | $ | 3,043 | $ | 2,802 | $ | 2,802 | $ | 2,802 | $ | 42 | $ | 32 | $ | 68 | ||||||||||||||
| Modified loans | $ | 998 | $ | 1,198 | $ | 1,021 | $ | 1,006 | $ | 1,016 | $ | 893 | $ | - | ||||||||||||||
| Allowance for credit losses to gross loans | 1.28 | % | 1.27 | % | 1.25 | % | 1.23 | % | 1.24 | % | 1.26 | % | 1.27 | % | ||||||||||||||
| Allowance for credit losses to non-accrual loans | 499.06 | % | 499.45 | % | 458.69 | % | 368.49 | % | 223.09 | % | 189.90 | % | 112.34 | % | ||||||||||||||
| Allowance for credit losses to non-performing assets | 183.78 | % | 186.98 | % | 182.43 | % | 155.13 | % | 157.00 | % | 138.49 | % | 87.59 | % | ||||||||||||||
| Non-performing loans and 90 day past due loans to total loans | 0.31 | % | 0.29 | % | 0.29 | % | 0.39 | % | 0.59 | % | 0.70 | % | 1.14 | % | ||||||||||||||
| Non-performing loans and 90 day past due loans to total assets | 0.23 | % | 0.22 | % | 0.22 | % | 0.30 | % | 0.45 | % | 0.53 | % | 0.84 | % | ||||||||||||||
| Non-accrual loans to total loans | 0.26 | % | 0.25 | % | 0.27 | % | 0.33 | % | 0.56 | % | 0.66 | % | 1.13 | % | ||||||||||||||
| Non-performing assets to total assets | 0.51 | % | 0.51 | % | 0.51 | % | 0.59 | % | 0.60 | % | 0.69 | % | 1.07 | % | ||||||||||||||
Consolidated Statement of Condition
| (Dollars in thousands - Unaudited) | September 30, 2025 | June 30, 2025 | March 31, 2025 | December 31, 2024 | ||||||||||||
| Assets | ||||||||||||||||
| Cash and due from banks | $ | 92,268 | $ | 77,313 | $ | 82,813 | $ | 77,020 | ||||||||
| Interest bearing deposits in banks | 2,907 | 1,800 | 1,618 | 1,307 | ||||||||||||
| Cash and cash equivalents | 95,175 | 79,113 | 84,431 | 78,327 | ||||||||||||
| Investment securities – available for sale (at fair value) | 105,060 | 103,582 | 99,998 | 94,494 | ||||||||||||
| Investment securities – held to maturity (at cost) | 172,818 | 174,951 | 174,144 | 175,497 | ||||||||||||
| Equity investments with readily determinable fair market values | 1,020 | 1,008 | 1,001 | — | ||||||||||||
| Restricted investment in bank stock, at cost | 4,628 | 5,815 | 5,815 | 5,768 | ||||||||||||
| Loans held for sale | 861 | 110 | — | 806 | ||||||||||||
| Loans | 1,496,762 | 1,502,481 | 1,479,869 | 1,480,793 | ||||||||||||
| Unearned fees | (473 | ) | (533 | ) | (457 | ) | (442 | ) | ||||||||
| Allowance for credit losses | (19,089 | ) | (19,044 | ) | (18,467 | ) | (18,170 | ) | ||||||||
| Net loans | 1,477,200 | 1,482,904 | 1,460,945 | 1,462,181 | ||||||||||||
| Premises and equipment, net | 30,369 | 29,644 | 30,010 | 30,081 | ||||||||||||
| Goodwill and other intangible assets | 11,526 | 11,609 | 11,691 | 11,773 | ||||||||||||
| Bank owned life insurance | 49,997 | 49,642 | 49,293 | 48,952 | ||||||||||||
| Deferred tax assets | 8,228 | 9,151 | 10,021 | 9,989 | ||||||||||||
| Other real estate owned, net | 2,718 | 3,035 | 3,062 | 3,062 | ||||||||||||
| Operating lease asset | 984 | 1,058 | 1,131 | 1,204 | ||||||||||||
| Pension asset | 21,382 | 18,537 | 16,064 | 17,824 | ||||||||||||
| Accrued interest receivable and other assets | 42,008 | 37,312 | 32,147 | 33,064 | ||||||||||||
| Total Assets | $ | 2,023,974 | $ | 2,007,471 | $ | 1,979,753 | $ | 1,973,022 | ||||||||
| Liabilities and Shareholders’ Equity | ||||||||||||||||
| Liabilities: | ||||||||||||||||
| Non-interest bearing deposits | $ | 429,986 | $ | 425,784 | $ | 422,415 | $ | 426,737 | ||||||||
| Interest bearing deposits | 1,248,916 | 1,188,423 | 1,201,159 | 1,148,092 | ||||||||||||
| Total deposits | 1,678,902 | 1,614,207 | 1,623,574 | 1,574,829 | ||||||||||||
| Short-term borrowings | 20,207 | 50,954 | 20,342 | 65,409 | ||||||||||||
| Long-term borrowings | 95,929 | 120,929 | 120,929 | 120,929 | ||||||||||||
| Operating lease liability | 1,152 | 1,231 | 1,308 | 1,384 | ||||||||||||
| Allowance for credit loss on off balance sheet exposures | 982 | 995 | 863 | 863 | ||||||||||||
| Accrued interest payable and other liabilities | 26,014 | 26,579 | 27,617 | 28,889 | ||||||||||||
| Dividends payable | 1,689 | 1,429 | 1,426 | 1,424 | ||||||||||||
| Total Liabilities | 1,824,875 | 1,816,324 | 1,796,059 | 1,793,727 | ||||||||||||
| Shareholders’ Equity: | ||||||||||||||||
| Common Stock – par value $0.01 per share; Authorized 25,000,000 shares; issued and outstanding 6,496,908 at September 30, 2025; 6,494,611 shares at June 30, 2025; 6,478,634 at March 31, 2025; and 6,471,096 at December 31, 2024 | 65 | 65 | 65 | 65 | ||||||||||||
| Surplus | 21,290 | 21,121 | 20,606 | 20,476 | ||||||||||||
| Retained earnings | 203,197 | 197,938 | 193,382 | 189,002 | ||||||||||||
| Accumulated other comprehensive loss | (25,453 | ) | (27,977 | ) | (30,359 | ) | (30,248 | ) | ||||||||
| Total Shareholders’ Equity | 199,099 | 191,147 | 183,694 | 179,295 | ||||||||||||
| Total Liabilities and Shareholders’ Equity | $ | 2,023,974 | $ | 2,007,471 | $ | 1,979,753 | $ | 1,973,022 | ||||||||
Historical Income Statement
| 2025 | 2024 | |||||||||||||||||||||||||||
| Q3 | Q2 | Q1 | Q4 | Q3 | Q2 | Q1 | ||||||||||||||||||||||
| In thousands | (Unaudited) | |||||||||||||||||||||||||||
| Interest income | ||||||||||||||||||||||||||||
| Interest and fees on loans | $ | 23,060 | $ | 22,294 | $ | 21,755 | $ | 21,299 | $ | 21,018 | $ | 20,221 | $ | 19,218 | ||||||||||||||
| Interest on investment securities | ||||||||||||||||||||||||||||
| Taxable | 1,826 | 1,776 | 1,763 | 1,672 | 1,647 | 1,697 | 1,744 | |||||||||||||||||||||
| Exempt from federal income tax | 57 | 57 | 45 | 47 | 56 | 53 | 53 | |||||||||||||||||||||
| Total investment income | 1,883 | 1,833 | 1,808 | 1,719 | 1,703 | 1,750 | 1,797 | |||||||||||||||||||||
| Other | 819 | 744 | 499 | 707 | 536 | 1,142 | 883 | |||||||||||||||||||||
| Total interest income | 25,762 | 24,871 | 24,062 | 23,725 | 23,257 | 23,113 | 21,898 | |||||||||||||||||||||
| Interest expense | ||||||||||||||||||||||||||||
| Interest on deposits | 7,009 | 6,788 | 6,683 | 6,585 | 6,579 | 6,398 | 6,266 | |||||||||||||||||||||
| Interest on short-term borrowings | 17 | 21 | 20 | 40 | 467 | 509 | 461 | |||||||||||||||||||||
| Interest on long-term borrowings | 1,333 | 1,355 | 1,343 | 1,400 | 983 | 968 | 1,359 | |||||||||||||||||||||
| Total interest expense | 8,359 | 8,164 | 8,046 | 8,025 | 8,029 | 7,875 | 8,086 | |||||||||||||||||||||
| Net interest income | 17,403 | 16,707 | 16,016 | 15,700 | 15,228 | 15,238 | 13,812 | |||||||||||||||||||||
| Credit loss expense/(credit) | ||||||||||||||||||||||||||||
| Loans | 480 | 728 | 657 | 522 | 195 | 1,251 | 961 | |||||||||||||||||||||
| Debt securities held to maturity | 43 | — | — | — | 14 | — | — | |||||||||||||||||||||
| Off balance sheet credit exposures | (13 | ) | 132 | (1 | ) | 7 | 55 | (57 | ) | (15 | ) | |||||||||||||||||
| Provision for credit losses | 510 | 860 | 656 | 529 | 264 | 1,194 | 946 | |||||||||||||||||||||
| Net interest income after provision for credit losses | 16,893 | 15,847 | 15,360 | 15,171 | 14,964 | 14,044 | 12,866 | |||||||||||||||||||||
| Other operating income | ||||||||||||||||||||||||||||
| Net gains on investments, available for sale | 97 | — | — | — | — | — | — | |||||||||||||||||||||
| Gains on sale of residential mortgage loans | 163 | 146 | 92 | 132 | 141 | 59 | 82 | |||||||||||||||||||||
| Losses on disposal of fixed assets | 1 | — | — | — | — | — | — | |||||||||||||||||||||
| Net gains | 261 | 146 | 92 | 132 | 141 | 59 | 82 | |||||||||||||||||||||
| Other Income | ||||||||||||||||||||||||||||
| Service charges on deposit accounts | 563 | 577 | 547 | 553 | 555 | 556 | 556 | |||||||||||||||||||||
| Other service charges | 218 | 214 | 206 | 211 | 236 | 225 | 215 | |||||||||||||||||||||
| Trust department | 2,448 | 2,386 | 2,323 | 2,323 | 2,328 | 2,255 | 2,188 | |||||||||||||||||||||
| Debit card income | 980 | 983 | 921 | 1,134 | 1,000 | 999 | 932 | |||||||||||||||||||||
| Bank owned life insurance | 355 | 348 | 341 | 345 | 340 | 334 | 326 | |||||||||||||||||||||
| Brokerage commissions | 346 | 370 | 421 | 295 | 297 | 362 | 495 | |||||||||||||||||||||
| Other | 164 | 62 | 63 | 63 | 156 | 51 | 81 | |||||||||||||||||||||
| Total other income | 5,074 | 4,940 | 4,822 | 4,924 | 4,912 | 4,782 | 4,793 | |||||||||||||||||||||
| Total other operating income | 5,335 | 5,086 | 4,914 | 5,056 | 5,053 | 4,841 | 4,875 | |||||||||||||||||||||
| Other operating expenses | ||||||||||||||||||||||||||||
| Salaries and employee benefits | 7,589 | 7,319 | 7,331 | 6,456 | 7,160 | 7,256 | 7,157 | |||||||||||||||||||||
| FDIC premiums | 266 | 267 | 245 | 260 | 256 | 285 | 269 | |||||||||||||||||||||
| Equipment | 515 | 565 | 578 | 490 | 627 | 635 | 923 | |||||||||||||||||||||
| Occupancy | 679 | 675 | 689 | 563 | 709 | 652 | 954 | |||||||||||||||||||||
| Data processing | 1,517 | 1,600 | 1,503 | 1,688 | 1,333 | 1,422 | 1,318 | |||||||||||||||||||||
| Marketing | 182 | 196 | 238 | 205 | 151 | 184 | 134 | |||||||||||||||||||||
| Professional services | 639 | 589 | 476 | 536 | 477 | 449 | 486 | |||||||||||||||||||||
| Contract labor | 127 | 166 | 163 | 181 | 149 | 84 | 183 | |||||||||||||||||||||
| Telephone | 89 | 96 | 98 | 99 | 97 | 103 | 109 | |||||||||||||||||||||
| Other real estate owned | 69 | 208 | 92 | 47 | 124 | 14 | 86 | |||||||||||||||||||||
| Investor relations | 57 | 132 | 62 | 65 | 84 | 91 | 53 | |||||||||||||||||||||
| Contributions | 90 | 78 | 56 | 53 | 65 | 66 | 50 | |||||||||||||||||||||
| Other | 1,167 | 1,083 | 1,045 | 1,438 | 1,082 | 1,123 | 1,159 | |||||||||||||||||||||
| Total other operating expenses | 12,986 | 12,974 | 12,576 | 12,081 | 12,314 | 12,364 | 12,881 | |||||||||||||||||||||
| Income before income tax expense | 9,242 | 7,959 | 7,698 | 8,146 | 7,703 | 6,521 | 4,860 | |||||||||||||||||||||
| Provision for income tax expense | 2,294 | 1,975 | 1,892 | 1,960 | 1,932 | 1,607 | 1,162 | |||||||||||||||||||||
| Net Income | $ | 6,948 | $ | 5,984 | $ | 5,806 | $ | 6,186 | $ | 5,771 | $ | 4,914 | $ | 3,698 | ||||||||||||||
| Basic net income per common share | $ | 1.07 | $ | 0.92 | $ | 0.90 | $ | 0.95 | $ | 0.89 | $ | 0.75 | $ | 0.56 | ||||||||||||||
| Diluted net income per common share | $ | 1.07 | $ | 0.92 | $ | 0.89 | $ | 0.95 | $ | 0.89 | $ | 0.75 | $ | 0.56 | ||||||||||||||
| Weighted average number of basic shares outstanding | 6,496 | 6,489 | 6,474 | 6,470 | 6,468 | 6,527 | 6,642 | |||||||||||||||||||||
| Weighted average number of diluted shares outstanding | 6,508 | 6,506 | 6,490 | 6,484 | 6,482 | 6,537 | 6,655 | |||||||||||||||||||||
| Dividends declared per common share | $ | 0.26 | $ | 0.22 | $ | 0.22 | $ | 0.22 | $ | 0.22 | $ | 0.20 | $ | 0.20 | ||||||||||||||
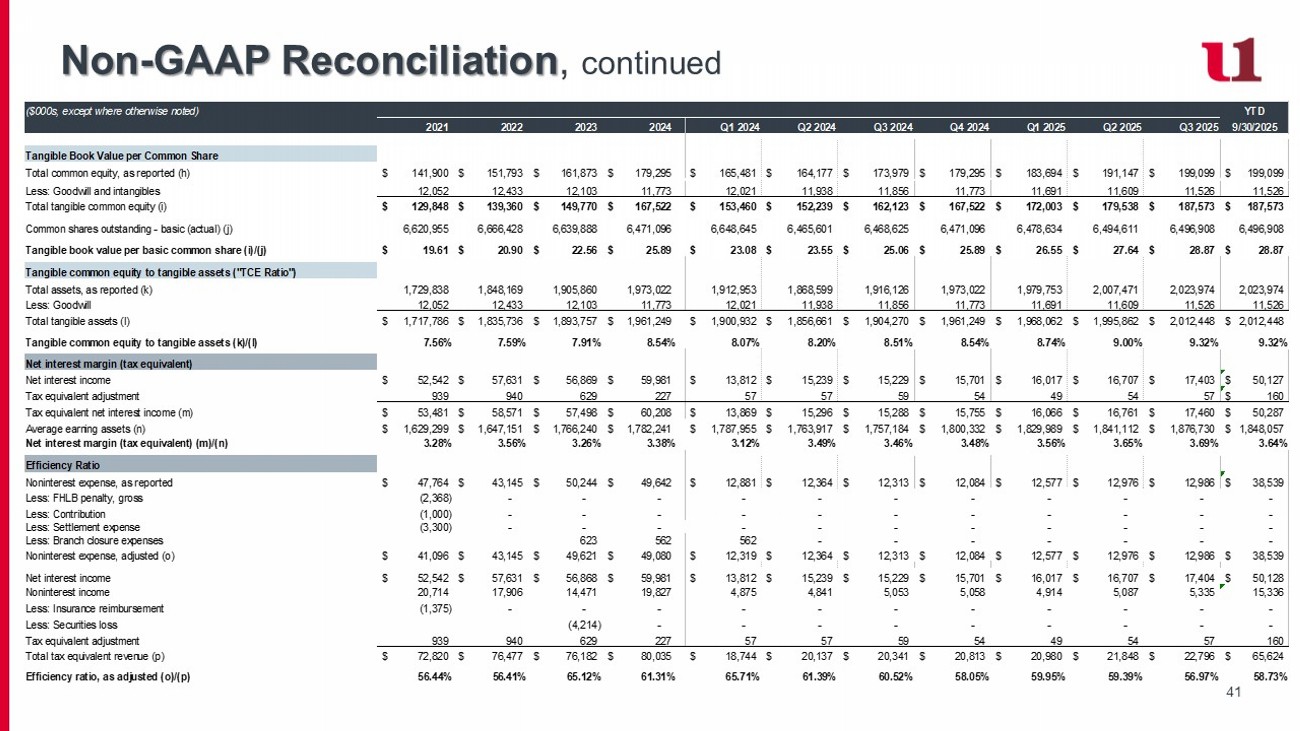
Non-GAAP Financial Measures (unaudited)
Reconciliation of as reported (GAAP) and non-GAAP financial measures
The following tables below provide a reconciliation of certain financial measures calculated under generally accepted accounting principles ("GAAP") (as reported) and non-GAAP. A non-GAAP financial measure is a numerical measure of historical or future financial performance, financial position or cash flows that excludes or includes amounts that are required to be disclosed in the most directly comparable measure calculated and presented in accordance with GAAP in the United States. The Company’s management believes the presentation of non-GAAP financial measures provide investors with a greater understanding of the Company’s operating results in addition to the results measured in accordance with GAAP. While management uses these non-GAAP measures in its analysis of the Company’s performance, this information should not be viewed as a substitute for financial results determined in accordance with GAAP or considered to be more important than financial results determined in accordance with GAAP.
The following non-GAAP financial measures exclude accelerated depreciation expenses related to the branch closures.
| Three months ended September 30, | Nine months ended September 30, | |||||||||||||||
| (in thousands, except for per share amount) | 2025 | 2024 | 2025 | 2024 | ||||||||||||
| Net income - as reported | $ | 6,948 | $ | 5,771 | $ | 18,738 | $ | 14,383 | ||||||||
| Adjustments: | ||||||||||||||||
| Accelerated depreciation expenses | — | — | — | 562 | ||||||||||||
| Income tax effect of adjustments | — | — | — | (137 | ) | |||||||||||
| Adjusted net income (non-GAAP) | $ | 6,948 | $ | 5,771 | $ | 18,738 | $ | 14,808 | ||||||||
| Diluted earnings per share - as reported | $ | 1.07 | $ | 0.89 | $ | 2.88 | $ | 2.19 | ||||||||
| Adjustments: | ||||||||||||||||
| Accelerated depreciation expenses | — | — | — | 0.08 | ||||||||||||
| Income tax effect of adjustments | — | — | — | (0.02 | ) | |||||||||||
| Adjusted diluted earnings per share (non-GAAP) | $ | 1.07 | $ | 0.89 | $ | 2.88 | $ | 2.25 | ||||||||
| As of or for the three months ended | As of or for the nine months ended | |||||||||||||||
| September 30, | September 30, | |||||||||||||||
| (in thousands, except per share data) | 2025 | 2024 | 2025 | 2024 | ||||||||||||
| Per Share Data | ||||||||||||||||
| Basic net income per share - as reported | $ | 1.07 | $ | 0.89 | $ | 2.89 | $ | 2.20 | ||||||||
| Basic net income per share - non-GAAP | $ | 1.07 | $ | 0.89 | $ | 2.89 | $ | 2.26 | ||||||||
| Diluted net income per share - as reported | $ | 1.07 | $ | 0.89 | $ | 2.88 | $ | 2.19 | ||||||||
| Diluted net income per share - non-GAAP | $ | 1.07 | $ | 0.89 | $ | 2.88 | $ | 2.25 | ||||||||
| Basic book value per share | $ | 30.65 | $ | 26.90 | ||||||||||||
| Diluted book value per share | $ | 30.59 | $ | 26.84 | ||||||||||||
|
Significant Ratios: |
As of or for the nine months ended |
|||||||||||||||
|
September 30, |
||||||||||||||||
| 2025 | 2024 | |||||||||||||||
| Return on Average Assets - as reported | 1.24 | % | 0.99 | % | ||||||||||||
| Accelerated depreciation expenses | - | 0.03 | % | |||||||||||||
| Income tax effect of adjustments | - | (0.01 | %) | |||||||||||||
| Adjusted Return on Average Assets (non-GAAP) | 1.24 | % | 1.01 | % | ||||||||||||
| Return on Average Equity - as reported | 13.23 | % | 11.52 | % | ||||||||||||
| Accelerated depreciation expenses | - | 0.34 | % | |||||||||||||
| Income tax effect of adjustments | - | (0.08 | %) | |||||||||||||
| Adjusted Return on Average Equity (non-GAAP) | 13.23 | % | 11.78 | % | ||||||||||||
| Three Months Ended | ||||||||||||||||||||||||
| September 30, | ||||||||||||||||||||||||
| 2025 | 2024 | |||||||||||||||||||||||
| (dollars in thousands) | Average Balance |
Interest | Average Yield/Rate |
Average Balance |
Interest | Average Yield/Rate |
||||||||||||||||||
| Assets | ||||||||||||||||||||||||
| Loans | $ | 1,501,876 | 23,072 | 6.09 | % | $ | 1,433,508 | $ | 21,035 | 5.84 | % | |||||||||||||
| Investment Securities: | ||||||||||||||||||||||||
| Taxable | 285,623 | 1,826 | 2.54 | % | 276,343 | 1,647 | 2.37 | % | ||||||||||||||||
| Non taxable | 7,516 | 102 | 5.38 | % | 7,795 | 100 | 5.10 | % | ||||||||||||||||
| Total | 293,139 | 1,928 | 2.61 | % | 284,138 | 1,747 | 2.44 | % | ||||||||||||||||
| Federal funds sold | 70,731 | 697 | 3.91 | % | 33,372 | 451 | 5.38 | % | ||||||||||||||||
| Interest-bearing deposits with other banks | 5,324 | 30 | 2.24 | % | 2,179 | 26 | 4.75 | % | ||||||||||||||||
| Other interest earning assets | 5,660 | 92 | 6.45 | % | 3,987 | 59 | 5.89 | % | ||||||||||||||||
| Total earning assets | 1,876,730 | 25,819 | 5.46 | % | 1,757,184 | 23,318 | 5.28 | % | ||||||||||||||||
| Allowance for credit losses | (19,343 | ) | (18,197 | ) | ||||||||||||||||||||
| Non-earning assets | 185,364 | 173,875 | ||||||||||||||||||||||
| Total Assets | $ | 2,042,751 | $ | 1,912,862 | ||||||||||||||||||||
| Liabilities and Shareholders’ Equity | ||||||||||||||||||||||||
| Deposits | ||||||||||||||||||||||||
| Interest-bearing demand deposits | $ | 367,771 | $ | 1,509 | 1.63 | % | $ | 370,040 | $ | 1,604 | 1.72 | % | ||||||||||||
| Interest-bearing money markets- retail | 489,088 | 3,834 | 3.11 | % | 422,393 | 3,793 | 3.57 | % | ||||||||||||||||
| Interest-bearing money markets- brokered | 436 | 1 | 0.91 | % | 1 | — | 0.10 | % | ||||||||||||||||
| Savings deposits | 163,433 | 43 | 0.10 | % | 176,799 | 44 | 0.10 | % | ||||||||||||||||
| Time deposits - retail | 148,955 | 1,064 | 2.83 | % | 141,354 | 1,021 | 2.87 | % | ||||||||||||||||
| Time deposits - brokered | 50,000 | 558 | 4.43 | % | 8,641 | 117 | 5.39 | % | ||||||||||||||||
| Total deposits | 1,219,683 | 7,009 | 2.28 | % | 1,119,228 | 6,579 | 2.34 | % | ||||||||||||||||
| Short-term borrowings | 21,378 | 17 | 0.32 | % | 57,553 | 467 | 3.23 | % | ||||||||||||||||
| Long-term borrowings | 117,668 | 1,333 | 4.49 | % | 73,864 | 983 | 5.29 | % | ||||||||||||||||
| Total interest-bearing liabilities | 1,358,729 | 8,359 | 2.44 | % | 1,250,645 | 8,029 | 2.55 | % | ||||||||||||||||
| Non-interest-bearing deposits | 456,773 | 479,232 | ||||||||||||||||||||||
| Other liabilities | 31,020 | 32,155 | ||||||||||||||||||||||
| Shareholders’ Equity | 196,229 | 170,753 | ||||||||||||||||||||||
| Total Liabilities and Shareholders’ Equity | $ | 2,042,751 | $ | 1,912,862 | ||||||||||||||||||||
| Net interest income and spread | $ | 17,460 | 3.02 | % | $ | 15,289 | 2.73 | % | ||||||||||||||||
| Net interest margin | 3.69 | % | 3.46 | % | ||||||||||||||||||||
| Nine Months Ended | ||||||||||||||||||||||||
| September 30, | ||||||||||||||||||||||||
| 2025 | 2024 | |||||||||||||||||||||||
| (dollars in thousands) | Average Balance |
Interest | Average Yield/ Rate |
Average Balance |
Interest | Average Yield/ Rate |
||||||||||||||||||
| Assets | ||||||||||||||||||||||||
| Loans | $ | 1,491,573 | $ | 67,144 | 6.02 | % | $ | 1,418,964 | $ | 60,506 | 5.70 | % | ||||||||||||
| Investment Securities: | ||||||||||||||||||||||||
| Taxable | 285,293 | 5,365 | 2.51 | % | 288,977 | 5,088 | 2.35 | % | ||||||||||||||||
| Non taxable | 7,158 | 284 | 5.30 | % | 7,800 | 289 | 4.95 | % | ||||||||||||||||
| Total | 292,451 | 5,649 | 2.58 | % | 296,777 | 5,377 | 2.42 | % | ||||||||||||||||
| Federal funds sold | 54,385 | 1,709 | 4.20 | % | 54,624 | 2,246 | 5.49 | % | ||||||||||||||||
| Interest-bearing deposits with other banks | 3,899 | 65 | 2.23 | % | 1,628 | 75 | 6.15 | % | ||||||||||||||||
| Other interest earning assets | 5,749 | 288 | 6.70 | % | 4,161 | 240 | 7.70 | % | ||||||||||||||||
| Total earning assets | 1,848,057 | 74,855 | 5.42 | % | 1,776,154 | 68,444 | 5.15 | % | ||||||||||||||||
| Allowance for loan losses | (18,812 | ) | (18,020 | ) | ||||||||||||||||||||
| Non-earning assets | 184,309 | 185,660 | ||||||||||||||||||||||
| Total Assets | $ | 2,013,554 | $ | 1,943,794 | ||||||||||||||||||||
| Liabilities and Shareholders’ Equity | ||||||||||||||||||||||||
| Deposits | ||||||||||||||||||||||||
| Interest-bearing demand deposits | $ | 368,384 | $ | 4,682 | 1.70 | % | $ | 362,102 | 4,541 | 1.68 | % | |||||||||||||
| Interest-bearing money markets- retail | 475,592 | 10,958 | 3.08 | % | 402,314 | 10,567 | 3.51 | % | ||||||||||||||||
| Interest-bearing money markets- brokered | 357 | 7 | 2.62 | % | 37 | 1 | 3.61 | % | ||||||||||||||||
| Savings deposits | 167,905 | 131 | 0.10 | % | 183,096 | 138 | 0.10 | % | ||||||||||||||||
| Time deposits - retail | 146,985 | 3,241 | 2.95 | % | 148,458 | 3,155 | 2.84 | % | ||||||||||||||||
| Time deposits - brokered | 45,398 | 1,461 | 4.30 | % | 20,967 | 841 | 5.36 | % | ||||||||||||||||
| Total deposits | 1,204,621 | 20,480 | 2.27 | % | 1,116,974 | 19,243 | 2.30 | % | ||||||||||||||||
| Short-term borrowings | 21,408 | 58 | 0.36 | % | 70,755 | 1,437 | 2.71 | % | ||||||||||||||||
| Long-term borrowings | 119,830 | 4,031 | 4.50 | % | 82,571 | 3,310 | 5.35 | % | ||||||||||||||||
| Total interest-bearing liabilities | 1,345,859 | 24,569 | 2.44 | % | 1,270,300 | 23,990 | 2.52 | % | ||||||||||||||||
| Non-interest-bearing deposits | 447,478 | 473,610 | ||||||||||||||||||||||
| Other liabilities | 30,795 | 33,134 | ||||||||||||||||||||||
| Shareholders’ Equity | 189,422 | 166,750 | ||||||||||||||||||||||
| Total Liabilities and Shareholders’ Equity | $ | 2,013,554 | $ | 1,943,794 | ||||||||||||||||||||
| Net interest income and spread | $ | 50,286 | 2.98 | % | $ | 44,454 | 2.63 | % | ||||||||||||||||
| Net interest margin | 3.64 | % | 3.34 | % | ||||||||||||||||||||
Exhibit 99.2

INVESTOR PRESENTATION Third Quarter 2025 MyBank.com 2 Forward looking statements This presentation contains forward - looking statements as defined by the Private Securities Litigation Reform Act of 1995 . Forward - looking statements do not represent historical facts, but are statements about management's beliefs, plans and objectives about the future, as well as its assumptions and judgments concerning such beliefs, plans and objectives . These statements are evidenced by terms such as "anticipate," "estimate," "should," "expect," "believe," "intend," and similar expressions . Although these statements reflect management's good faith beliefs and projections, they are not guarantees of future performance and they may not prove true . The beliefs, plans and objectives on which forward - looking statements are based involve risks and uncertainties that could cause actual results to differ materially from those addressed in the forward - looking statements . For a discussion of these risks and uncertainties, see the section of the periodic reports that First United Corporation files with the Securities and Exchange Commission entitled "Risk Factors . Whether actual results will conform to expectations and predictions is subject to known and unknown risks and uncertainties . Actual results could be materially different from management’s expectations . This presentation should be read in conjunction with our Annual Report on Form 10 - K , for the year ended December 31 , 2024 , including the sections of the report entitled “Risk Factors”, as well as the reports and other documents that we subsequently file with the Securities and Exchange Commission (“SEC”), which are available on the SEC’s website at www . sec . gov or at our website at www . mybank . com . Except as required by law, we do not intend to publish updates or revisions of any forward - looking statements we make to reflect new information, future events or otherwise .
Table of Contents I. II. III. Corporate Overview Financial Performance Appendices Pg. 4 Pg. 10 Pg. 32 Our Mission To enrich the lives of our associates, customers, communities and shareholders through uncommon commitment to service and customized financial solutions.
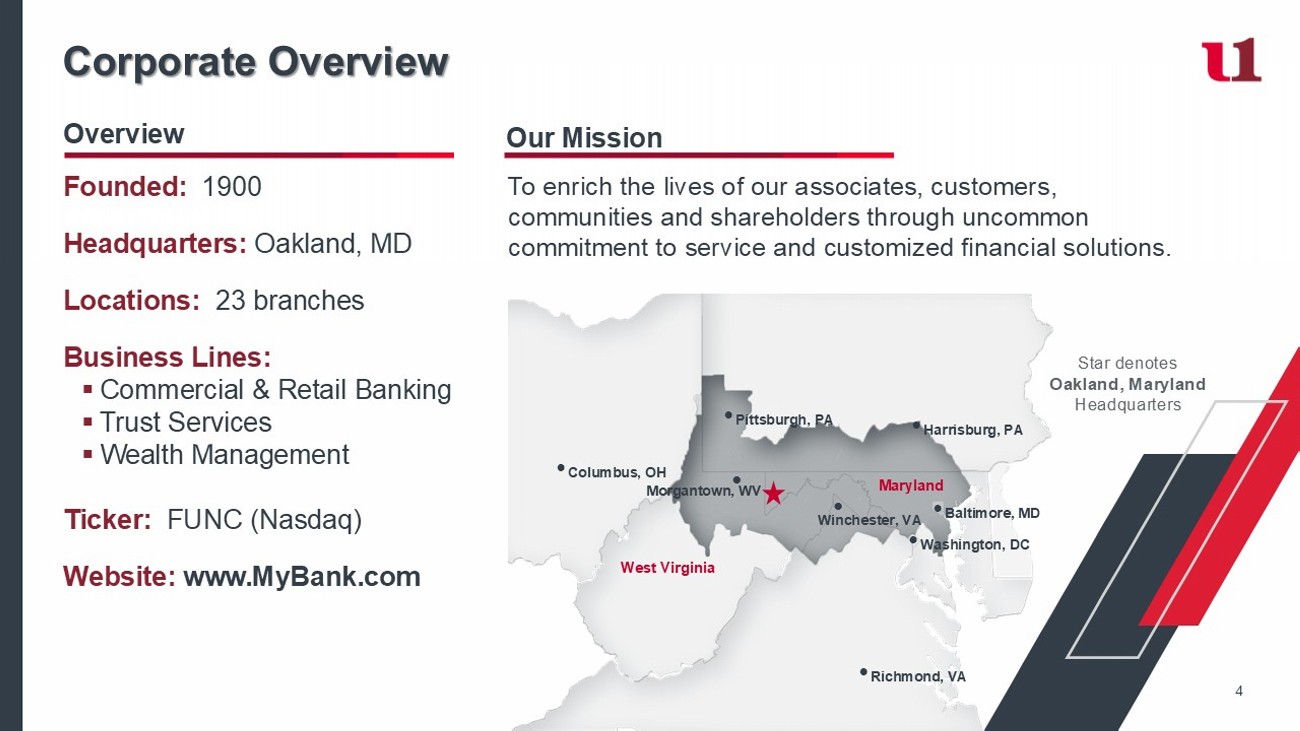
Corporate Overview Founded: 1900 Headquarters: Oakland, MD Locations: 23 branches Business Lines: ▪ Commercial & Retail Banking ▪ Trust Services ▪ Wealth Management Ticker: FUNC (Nasdaq) Website: www.MyBank.com Overview West Virginia Maryland • Pittsburgh, PA • Washington, DC • Columbus, OH • Baltimore, MD • Richmond, VA Morgantown, WV භ • Harrisburg, PA Winchester, VA භ Star denotes Oakland, Maryland Headquarters 4 East Region Central Region West Region $591,932 $449,269 $329,887 Loans (000s) $516,888 $765,622 $135,998 Deposits (000s) 5% 47% 2% Deposit Market Share (1) (at June 30, 2025) 11 9 3 Branches Note: Out of market loans representing $127 million and $50 million in brokered CDs are not reflected in this table (1) Source: FDIC Market Share Data, most current.
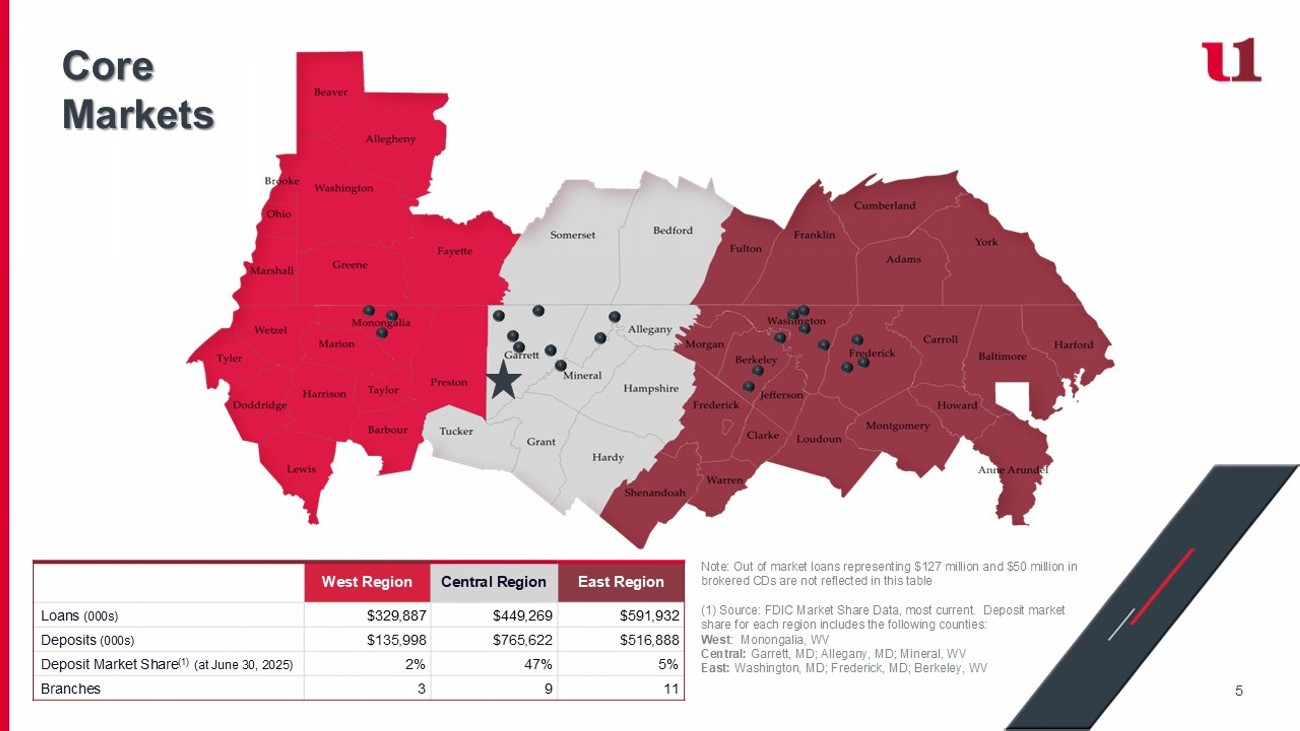
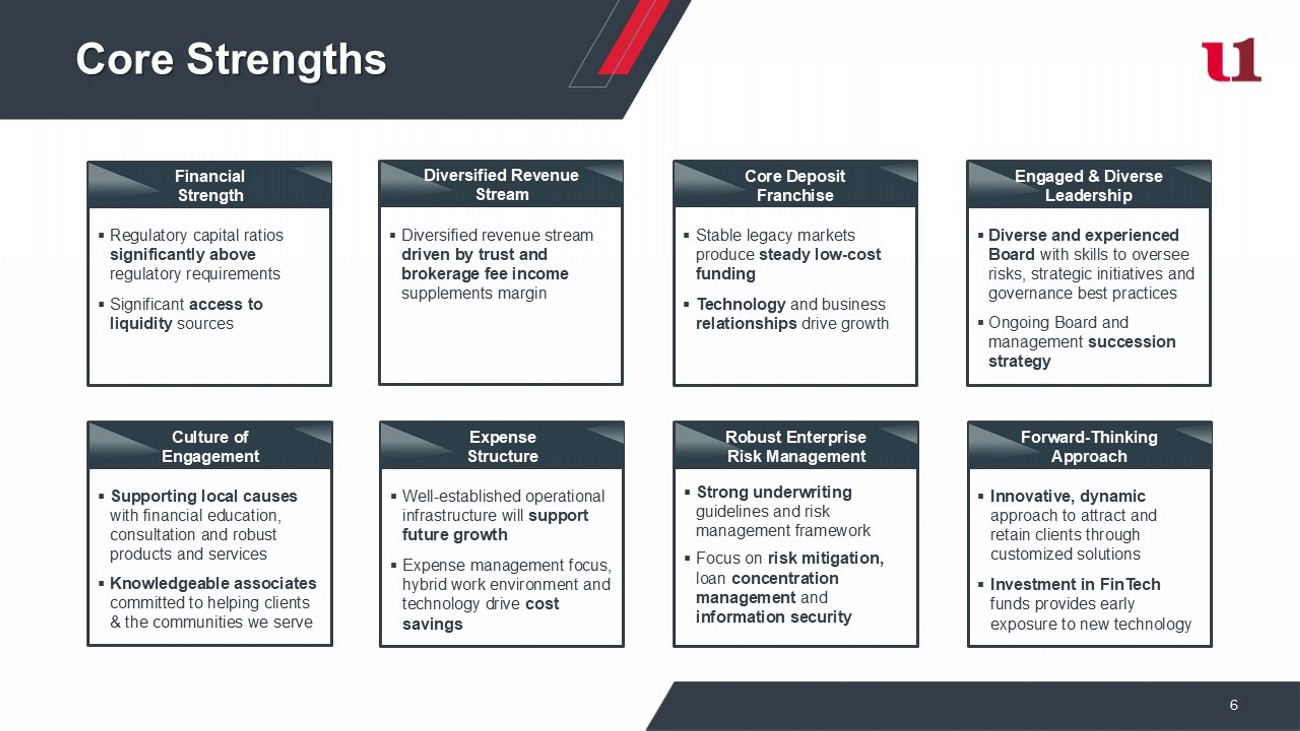
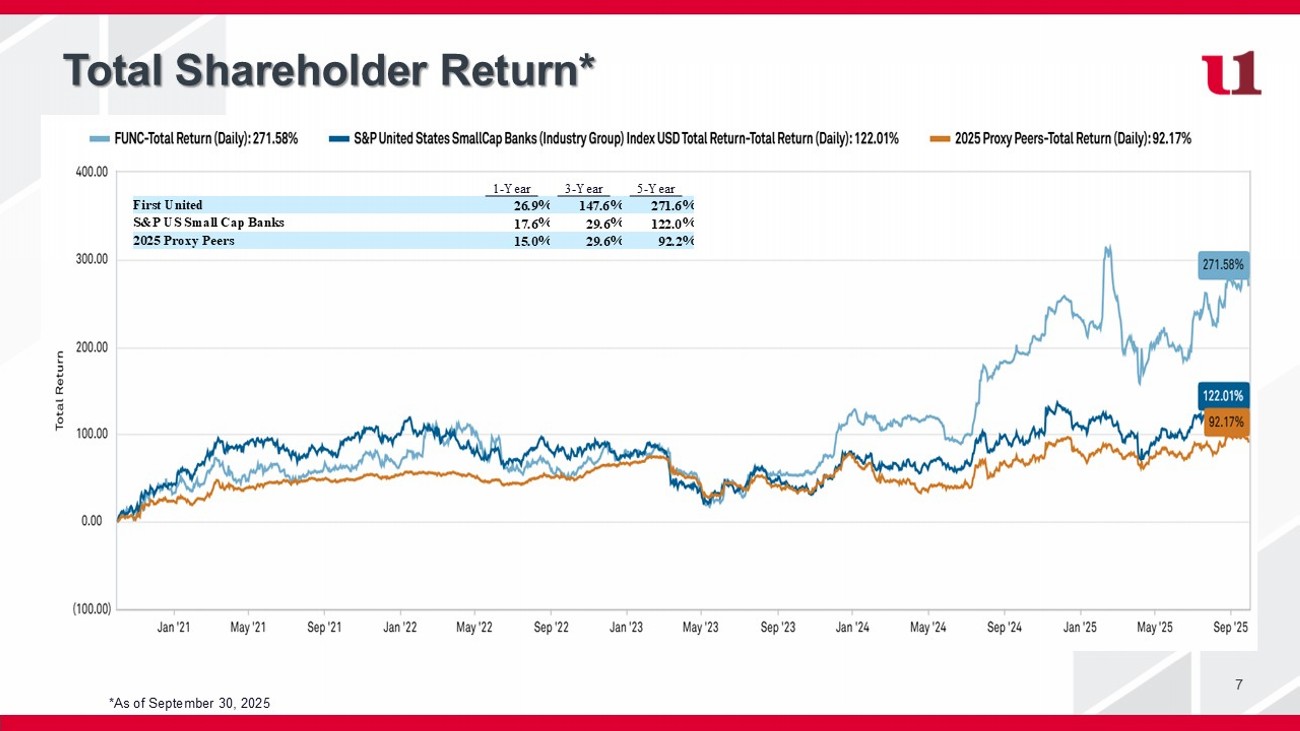
Deposit market share for each region includes the following counties: West : Monongalia, WV Central: Garrett, MD; Allegany, MD; Mineral, WV East: Washington, MD; Frederick, MD; Berkeley, WV Core Markets 5 6 Core Strengths ▪ Diversified revenue stream driven by trust and brokerage fee income supplements margin Diversified Revenue Stream ▪ Stable legacy markets produce steady low - cost funding ▪ Technology and business relationships drive growth Core Deposit Franchise ▪ Diverse and experienced Board with skills to oversee risks, strategic initiatives and governance best practices ▪ Ongoing Board and management succession strategy Engaged & Diverse Leadership ▪ Supporting local causes with financial education, consultation and robust products and services ▪ Knowledgeable associates committed to helping clients & the communities we serve Culture of Engagement ▪ Well - established operational infrastructure will support future growth ▪ Expense management focus, hybrid work environment and technology drive cost savings Expense Structure ▪ Strong underwriting guidelines and risk management framework ▪ Focus on risk mitigation, loan concentration management and information security Robust Enterprise Risk Management ▪ Innovative, dynamic approach to attract and retain clients through customized solutions ▪ Investment in FinTech funds provides early exposure to new technology Forward - Thinking Approach ▪ Regulatory capital ratios significantly above regulatory requirements ▪ Significant access to liquidity sources Financial Strength Total Shareholder Return* 7 *As of September 30, 2025 5 - Year 3 - Year 1 - Year % 271.6 % 147.6 % 26.9 First United % 122.0 % 29.6 % 17.6 S&P US Small Cap Banks % 92.2 % 29.6 % 15.0 2025 Proxy Peers
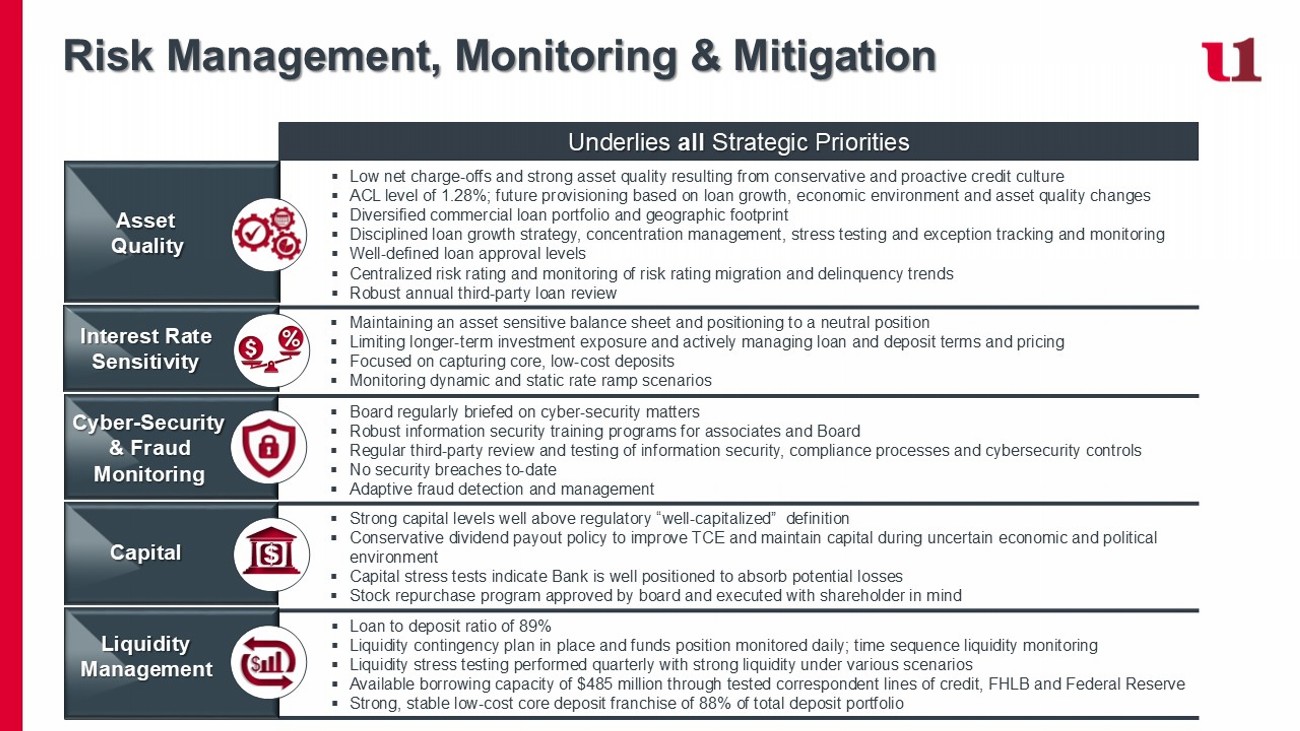
Risk Management, Monitoring & Mitigation Underlies all Strategic Priorities ▪ Low net charge - offs and strong asset quality resulting from conservative and proactive credit culture ▪ ACL level of 1.28%; future provisioning based on loan growth, economic environment and asset quality changes ▪ Diversified commercial loan portfolio and geographic footprint ▪ Disciplined loan growth strategy, concentration management, stress testing and exception tracking and monitoring ▪ Well - defined loan approval levels ▪ Centralized risk rating and monitoring of risk rating migration and delinquency trends ▪ Robust annual third - party loan review ▪ Maintaining an asset sensitive balance sheet and positioning to a neutral position ▪ Limiting longer - term investment exposure and actively managing loan and deposit terms and pricing ▪ Focused on capturing core, low - cost deposits ▪ Monitoring dynamic and static rate ramp scenarios ▪ Board regularly briefed on cyber - security matters ▪ Robust information security training programs for associates and Board ▪ Regular third - party review and testing of information security, compliance processes and cybersecurity controls ▪ No security breaches to - date ▪ Adaptive fraud detection and management ▪ Strong capital levels well above regulatory “well - capitalized” definition ▪ Conservative dividend payout policy to improve TCE and maintain capital during uncertain economic and political environment ▪ Capital stress tests indicate Bank is well positioned to absorb potential losses ▪ Stock repurchase program approved by board and executed with shareholder in mind ▪ Loan to deposit ratio of 89% ▪ Liquidity contingency plan in place and funds position monitored daily; time sequence liquidity monitoring ▪ Liquidity stress testing performed quarterly with strong liquidity under various scenarios ▪ Available borrowing capacity of $485 million through tested correspondent lines of credit, FHLB and Federal Reserve ▪ Strong, stable low - cost core deposit franchise of 88% of total deposit portfolio Cyber - Security & Fraud Monitoring Asset Quality Capital Liquidity Management Interest Rate Sensitivity 9 Strategic Pillars & Key Objectives Culture & Human Capital ▪ Attract and hire passionate, diverse talent to engage with clients and prospects across broader geographics.
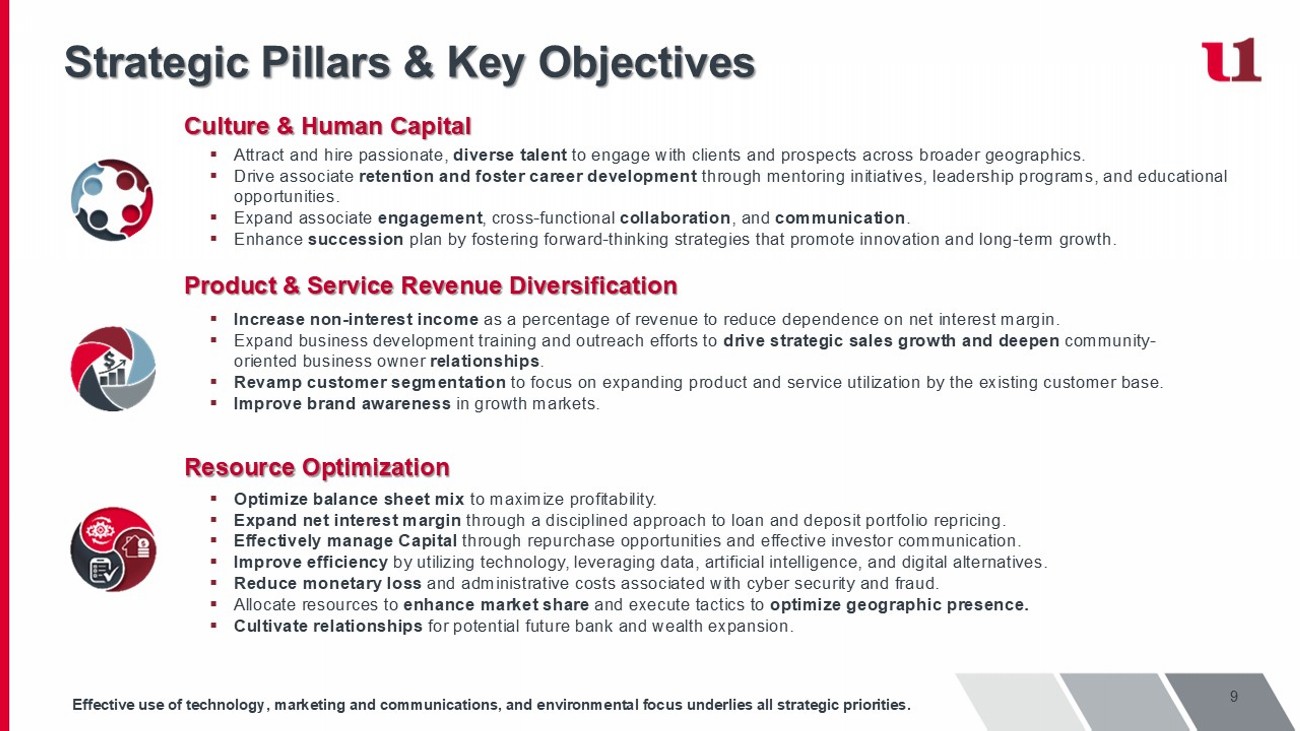
▪ Drive associate retention and foster career development through mentoring initiatives, leadership programs, and educational opportunities. ▪ Expand associate engagement , cross - functional collaboration , and communication . ▪ Enhance succession plan by fostering forward - thinking strategies that promote innovation and long - term growth. Product & Service Revenue Diversification ▪ Increase non - interest income as a percentage of revenue to reduce dependence on net interest margin. ▪ Expand business development training and outreach efforts to drive strategic sales growth and deepen community - oriented business owner relationships . ▪ Revamp customer segmentation to focus on expanding product and service utilization by the existing customer base. ▪ Improve brand awareness in growth markets. Resource Optimization ▪ Optimize balance sheet mix to maximize profitability. ▪ Expand net interest margin through a disciplined approach to loan and deposit portfolio repricing. ▪ Effectively manage Capital through repurchase opportunities and effective investor communication. ▪ Improve efficiency by utilizing technology, leveraging data, artificial intelligence, and digital alternatives. ▪ Reduce monetary loss and administrative costs associated with cyber security and fraud. ▪ Allocate resources to enhance market share and execute tactics to optimize geographic presence. ▪ Cultivate relationships for potential future bank and wealth expansion. Effective use of technology, marketing and communications, and environmental focus underlies all strategic priorities.
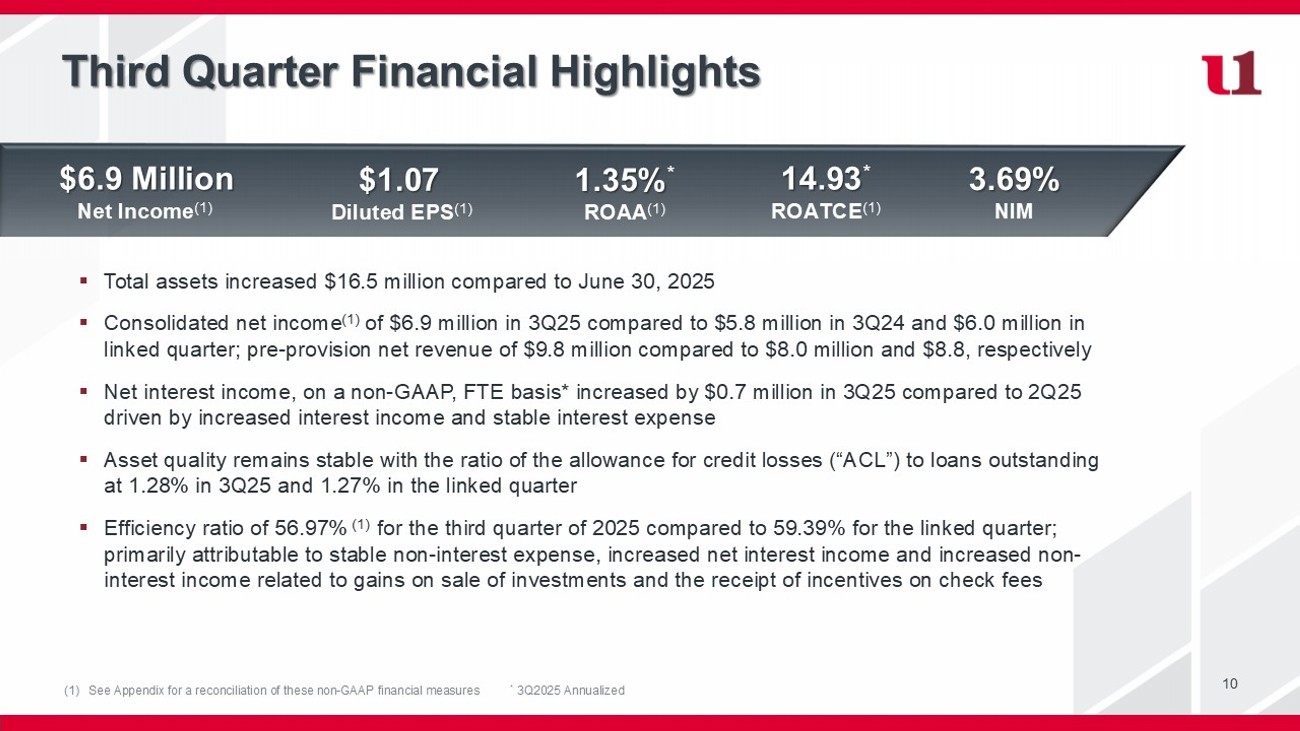
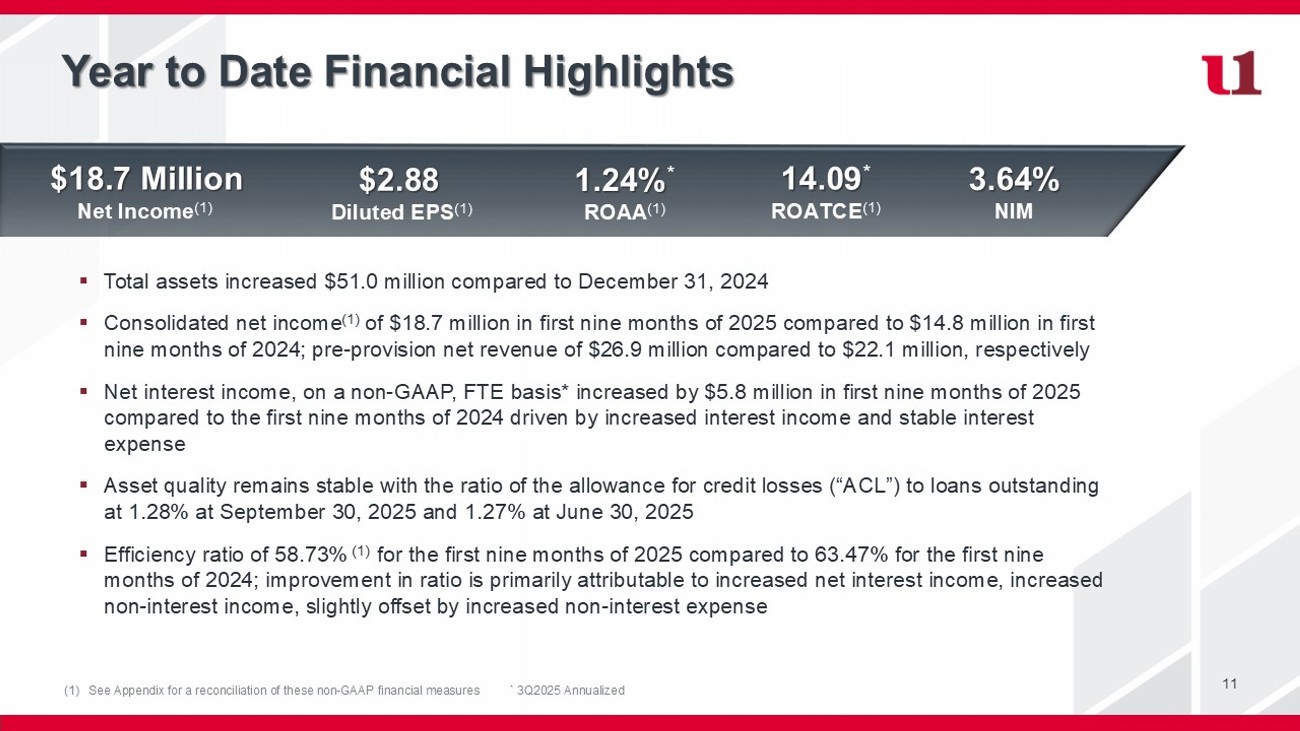
10 $6.9 Million Net Income (1) $1.07 Diluted EPS (1) 1.35% * ROAA (1) 14.93 * ROATCE (1) 3.69% NIM Third Quarter Financial Highlights ▪ Total assets increased $16.5 million compared to June 30, 2025 ▪ Consolidated net income (1) of $ 6.9 million in 3Q25 compared to $5.8 million in 3Q24 and $6.0 million in linked quarter; pre - provision net revenue of $9.8 million compared to $8.0 million and $8.8, respectively ▪ Net interest income, on a non - GAAP, FTE basis* increased by $0.7 million in 3Q25 compared to 2Q25 driven by increased interest income and stable interest expense ▪ Asset quality remains stable with the ratio of the allowance for credit losses (“ACL”) to loans outstanding at 1.28% in 3Q25 and 1.27% in the linked quarter ▪ Efficiency ratio of 56.97% (1) for the third quarter of 2025 compared to 59.39% for the linked quarter; primarily attributable to stable non - interest expense, increased net interest income and increased non - interest income related to gains on sale of investments and the receipt of incentives on check fees (1) See Appendix for a reconciliation of these non - GAAP financial measures * 3Q2025 Annualized 11 $18.7 Million Net Income (1) $2.88 Diluted EPS (1) 1.24% * ROAA (1) 14.09 * ROATCE (1) 3.64% NIM Year to Date Financial Highlights ▪ Total assets increased $51.0 million compared to December 31, 2024 ▪ Consolidated net income (1) of $18.7 million in first nine months of 2025 compared to $14.8 million in first nine months of 2024; pre - provision net revenue of $26.9 million compared to $22.1 million, respectively ▪ Net interest income, on a non - GAAP, FTE basis* increased by $5.8 million in first nine months of 2025 compared to the first nine months of 2024 driven by increased interest income and stable interest expense ▪ Asset quality remains stable with the ratio of the allowance for credit losses (“ACL”) to loans outstanding at 1.28% at September 30, 2025 and 1.27% at June 30, 2025 ▪ Efficiency ratio of 58.73% (1) for the first nine months of 2025 compared to 63.47% for the first nine months of 2024; improvement in ratio is primarily attributable to increased net interest income, increased non - interest income, slightly offset by increased non - interest expense (1) See Appendix for a reconciliation of these non - GAAP financial measures * 3Q2025 Annualized
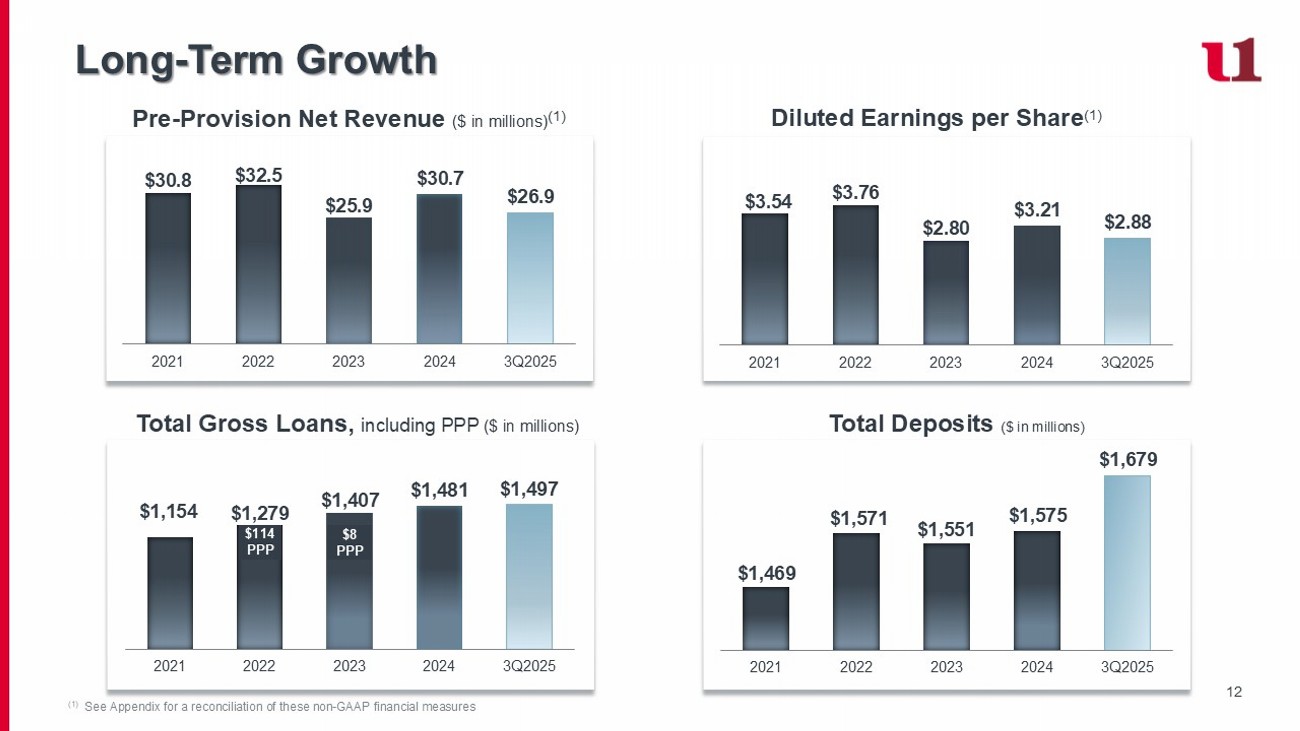
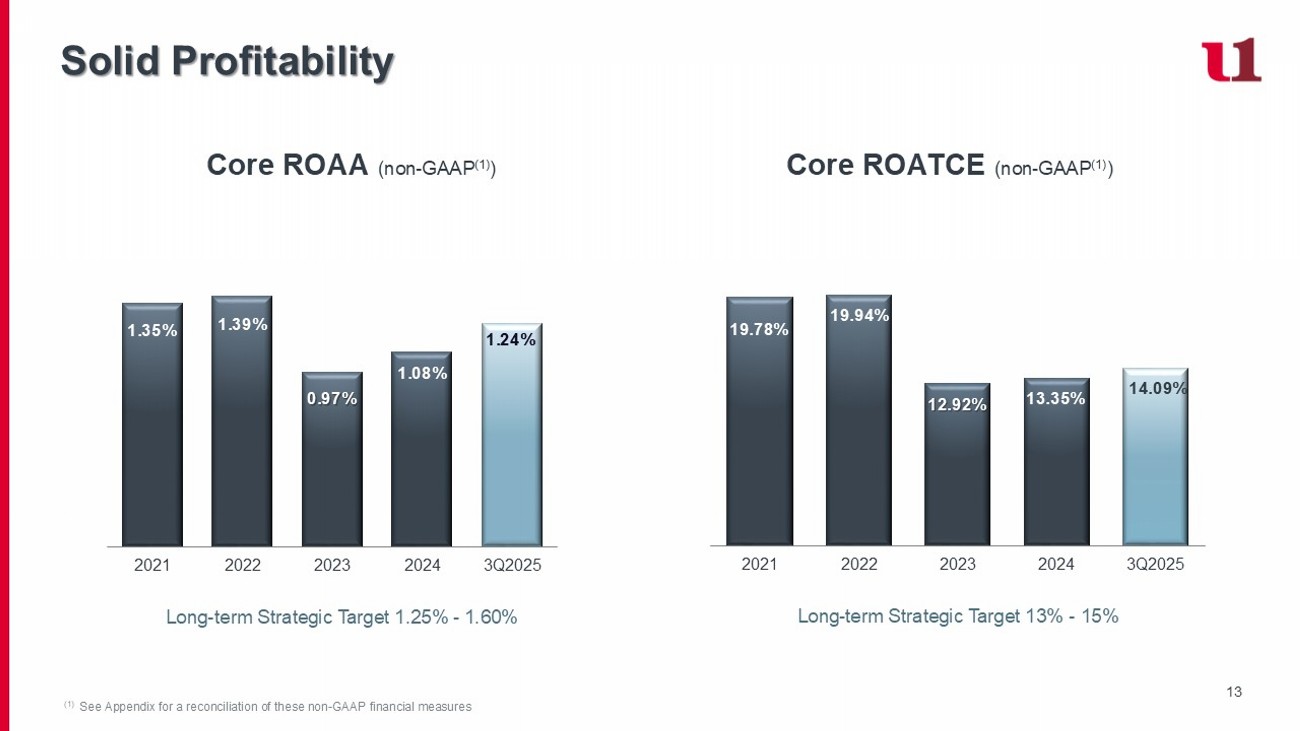
12 Long - Term Growth Pre - Provision Net Revenue ($ in millions) (1) $30.8 $32.5 $25.9 $30.7 $26.9 2021 2022 2023 2024 3Q2025 (1) See Appendix for a reconciliation of these non - GAAP financial measures $3.54 $3.76 $2.80 $3.21 $2.88 2021 2022 2023 2024 3Q2025 Diluted Earnings per Share (1) Total Deposits ($ in millions) $1,469 $1,571 $1,551 $1,575 $1,679 2021 2022 2023 2024 3Q2025 Total Gross Loans, including PPP ($ in millions) $1,154 $1,279 $1,407 $1,481 $1,497 2021 2022 2023 2024 3Q2025 $114 PPP $8 PPP 13 Solid Profitability (1) See Appendix for a reconciliation of these non - GAAP financial measures Long - term Strategic Target 13% - 15% Long - term Strategic Target 1.25% - 1.60% Core ROAA (non - GAAP (1) ) Core ROATCE (non - GAAP (1) ) 1.35% 1.39% 0.97% 1.08% 1.24% 2021 2022 2023 2024 3Q2025 19.78% 19.94% 12.92% 13.35% 14.09% 2021 2022 2023 2024 3Q2025
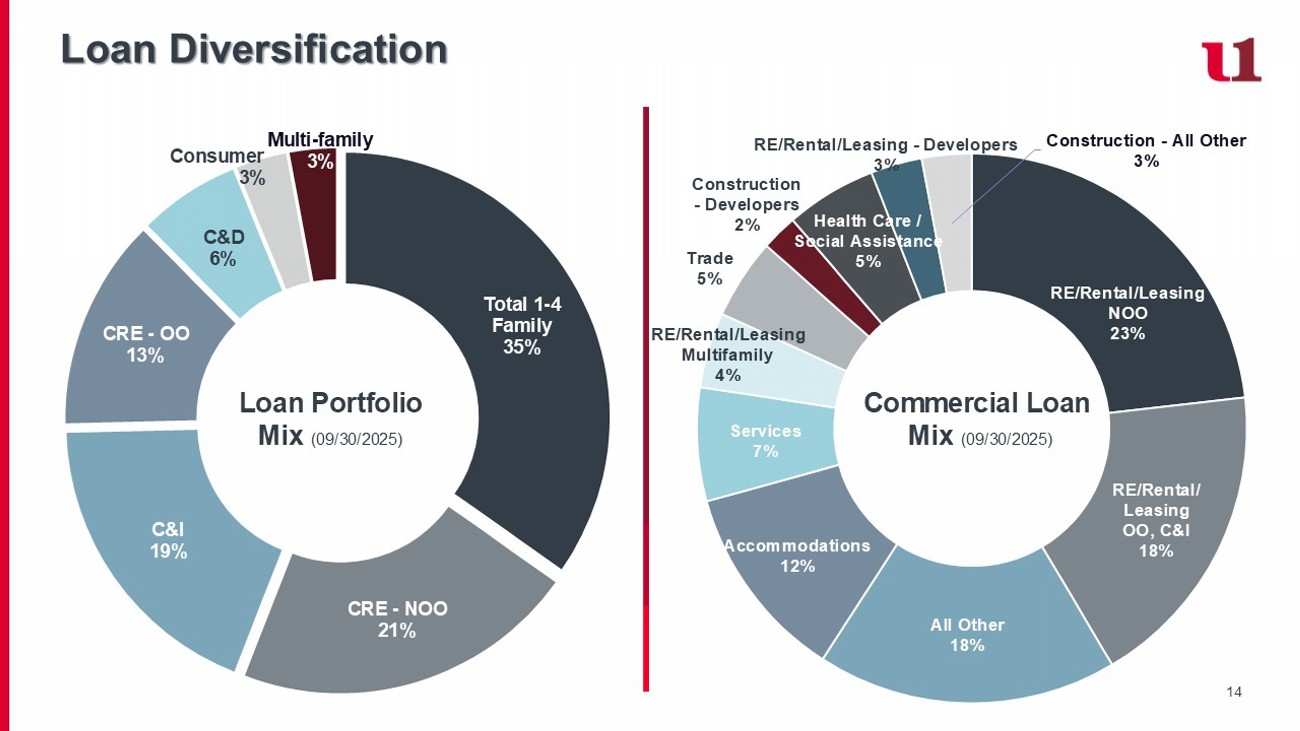
14 Total 1 - 4 Family 35% CRE - NOO 21% C&I 19% CRE - OO 13% C&D 6% Consumer 3% Multi - family 3% Loan Diversification Loan Portfolio Mix (09/30/2025) RE/Rental/Leasing NOO 23% RE/Rental/ Leasing OO, C&I 18% All Other 18% Accommodations 12% Services 7% RE/Rental/Leasing Multifamily 4% Trade 5% Construction - Developers 2% Health Care / Social Assistance 5% RE/Rental/Leasing - Developers 3% Construction - All Other 3% Commercial Loan Mix (09/30/2025)
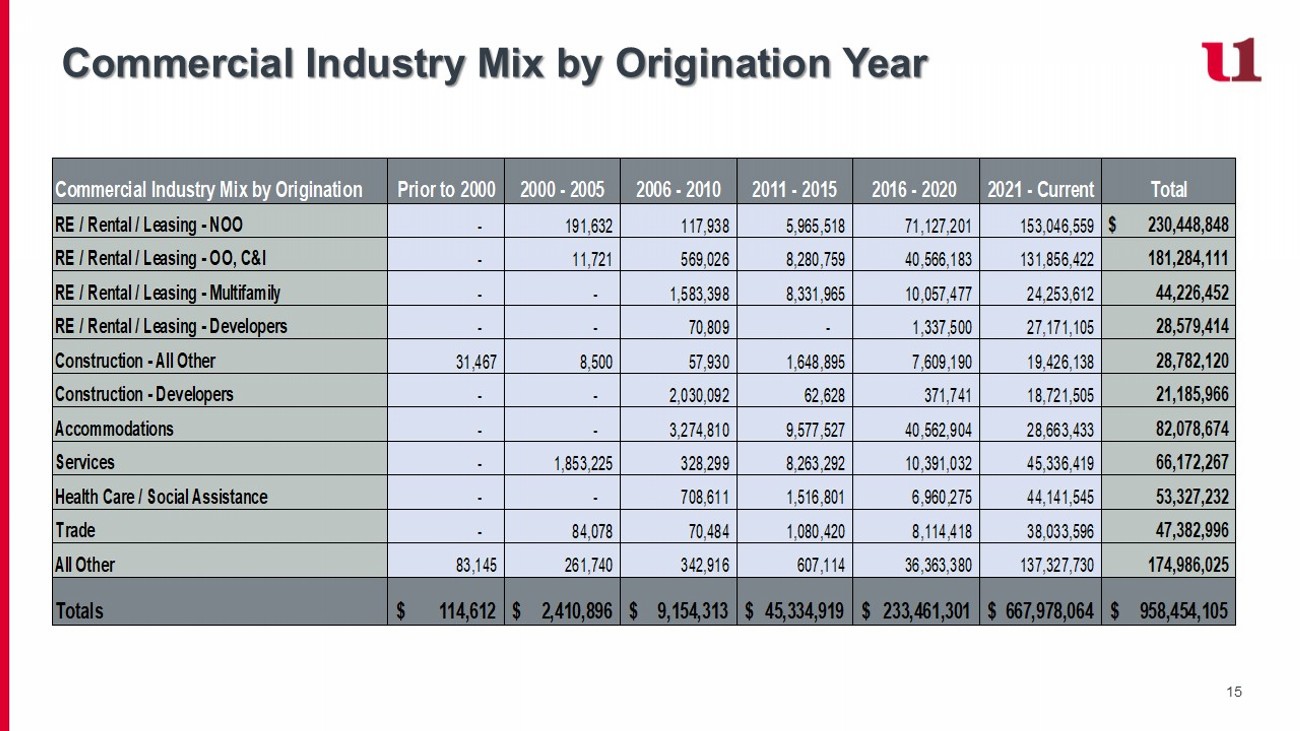
15 Commercial Industry Mix by Origination Year Commercial Industry Mix by Origination Prior to 2000 2000 - 2005 2006 - 2010 2011 - 2015 2016 - 2020 2021 - Current Total RE / Rental / Leasing - NOO - 191,632 117,938 5,965,518 71,127,201 153,046,559 230,448,848$ RE / Rental / Leasing - OO, C&I - 11,721 569,026 8,280,759 40,566,183 131,856,422 181,284,111 RE / Rental / Leasing - Multifamily - - 1,583,398 8,331,965 10,057,477 24,253,612 44,226,452 RE / Rental / Leasing - Developers - - 70,809 - 1,337,500 27,171,105 28,579,414 Construction - All Other 31,467 8,500 57,930 1,648,895 7,609,190 19,426,138 28,782,120 Construction - Developers - - 2,030,092 62,628 371,741 18,721,505 21,185,966 Accommodations - - 3,274,810 9,577,527 40,562,904 28,663,433 82,078,674 Services - 1,853,225 328,299 8,263,292 10,391,032 45,336,419 66,172,267 Health Care / Social Assistance - - 708,611 1,516,801 6,960,275 44,141,545 53,327,232 Trade - 84,078 70,484 1,080,420 8,114,418 38,033,596 47,382,996 All Other 83,145 261,740 342,916 607,114 36,363,380 137,327,730 174,986,025 Totals 114,612$ 2,410,896$ 9,154,313$ 45,334,919$ 233,461,301$ 667,978,064$ 958,454,105$ 16 Commercial Real Estate Focus on risk mitigation and managing of concentrations ▪ CRE / Total Capital: 233% ▪ ADC / Total Capital: 39% * There are no office buildings located in metropolitan markets or over four stories.
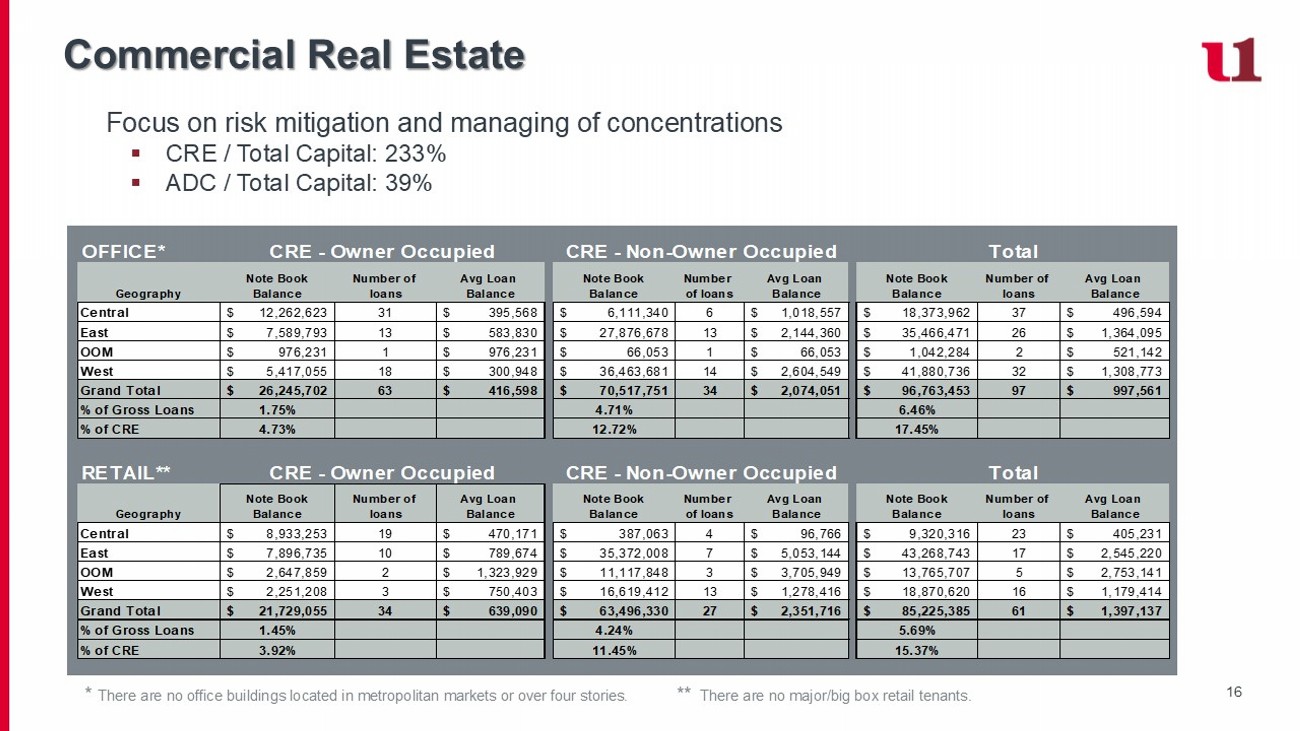
** There are no major/big box retail tenants. OFFICE* Geography Note Book Balance Number of loans Avg Loan Balance Note Book Balance Number of loans Avg Loan Balance Note Book Balance Number of loans Avg Loan Balance Central 12,262,623$ 31 395,568$ 6,111,340$ 6 1,018,557$ 18,373,962$ 37 496,594$ East 7,589,793$ 13 583,830$ 27,876,678$ 13 2,144,360$ 35,466,471$ 26 1,364,095$ OOM 976,231$ 1 976,231$ 66,053$ 1 66,053$ 1,042,284$ 2 521,142$ West 5,417,055$ 18 300,948$ 36,463,681$ 14 2,604,549$ 41,880,736$ 32 1,308,773$ Grand Total 26,245,702$ 63 416,598$ 70,517,751$ 34 2,074,051$ 96,763,453$ 97 997,561$ % of Gross Loans 1.75% 4.71% 6.46% % of CRE 4.73% 12.72% 17.45% RETAIL** Geography Note Book Balance Number of loans Avg Loan Balance Note Book Balance Number of loans Avg Loan Balance Note Book Balance Number of loans Avg Loan Balance Central 8,933,253$ 19 470,171$ 387,063$ 4 96,766$ 9,320,316$ 23 405,231$ East 7,896,735$ 10 789,674$ 35,372,008$ 7 5,053,144$ 43,268,743$ 17 2,545,220$ OOM 2,647,859$ 2 1,323,929$ 11,117,848$ 3 3,705,949$ 13,765,707$ 5 2,753,141$ West 2,251,208$ 3 750,403$ 16,619,412$ 13 1,278,416$ 18,870,620$ 16 1,179,414$ Grand Total 21,729,055$ 34 639,090$ 63,496,330$ 27 2,351,716$ 85,225,385$ 61 1,397,137$ % of Gross Loans 1.45% 4.24% 5.69% % of CRE 3.92% 11.45% 15.37% CRE - Owner Occupied CRE - Non-Owner Occupied Total CRE - Owner Occupied CRE - Non-Owner Occupied Total 17 Variable Rate Loans and Repricing * Includes personal lines of credit and home equity lines Loan Type Reprices Monthly % to Total Type Repricing Repricing 2025 % to Total Type Repricing Repricing 2026 % to Total Type Repricing Repricing 2027 + % to Total Type Repricing Grand Total Commercial Loans 39,583,668$ 17.3% 16,712,560$ 62.9% 21,287,303$ 42.2% 88,161,349$ 25.6% 165,744,880$ Commercial Lines of Credit 91,038,522 39.8% - 0.0% - 0.0% 379,999 0.1% 91,418,521 Commercial Floor Plans 34,671,076 15.2% - 0.0% - 0.0% - 0.0% 34,671,076 Mortgage - 0.0% 9,874,156 37.1% 29,119,638 57.8% 255,814,964 74.3% 294,808,758 Home Equity Lines (no Locks) 9,665,902 4.2% - 0.0% - 0.0% - 0.0% 9,665,902 Other Consumer Lines* 53,843,096 23.5% - 0.0% - 0.0% - 0.0% 53,843,096 Totals 228,802,264$ 100.0% 26,586,716$ 100.0% 50,406,941$ 100.0% 344,356,312$ 100.0% 650,152,233$
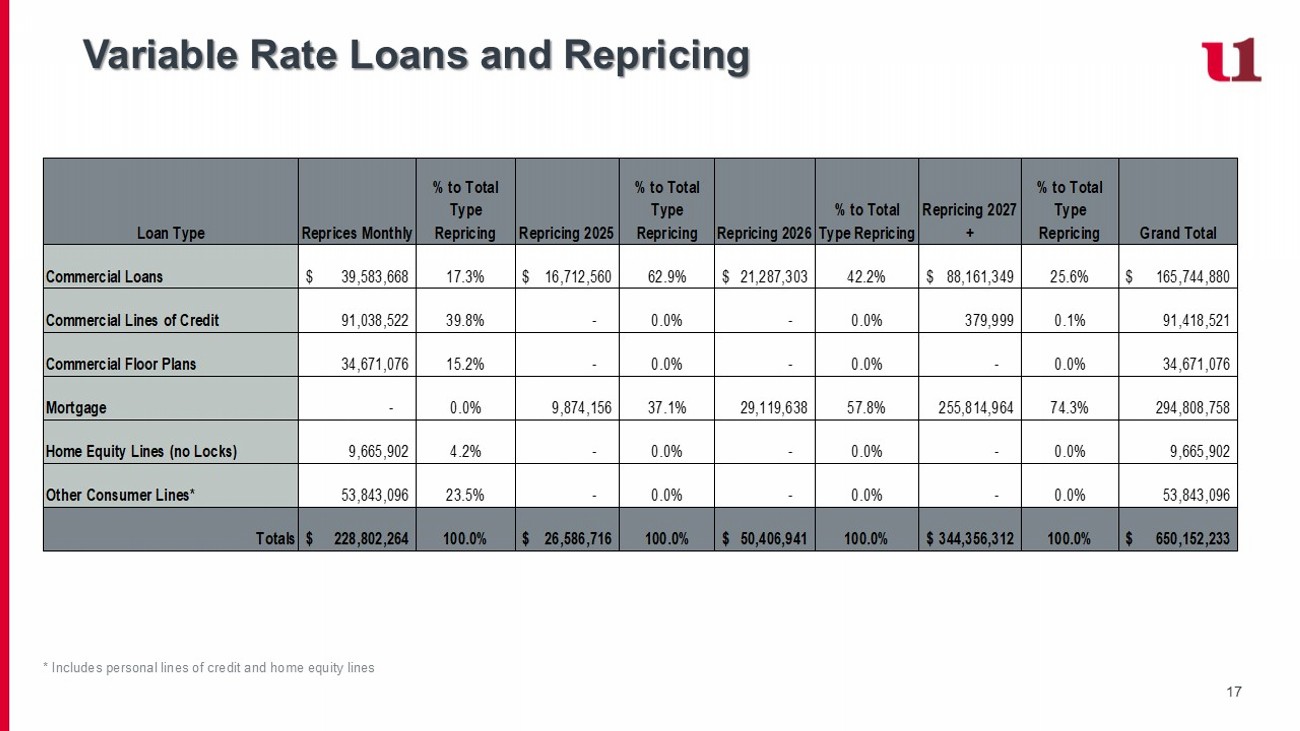
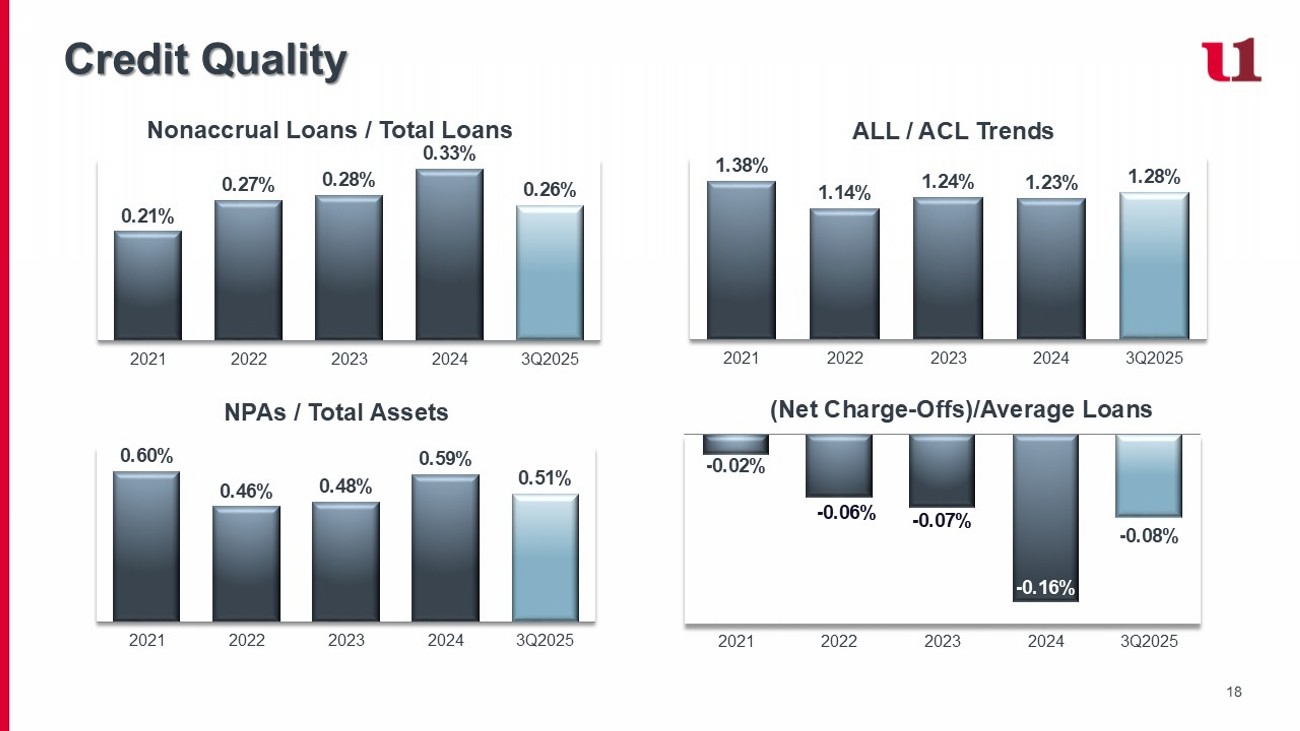
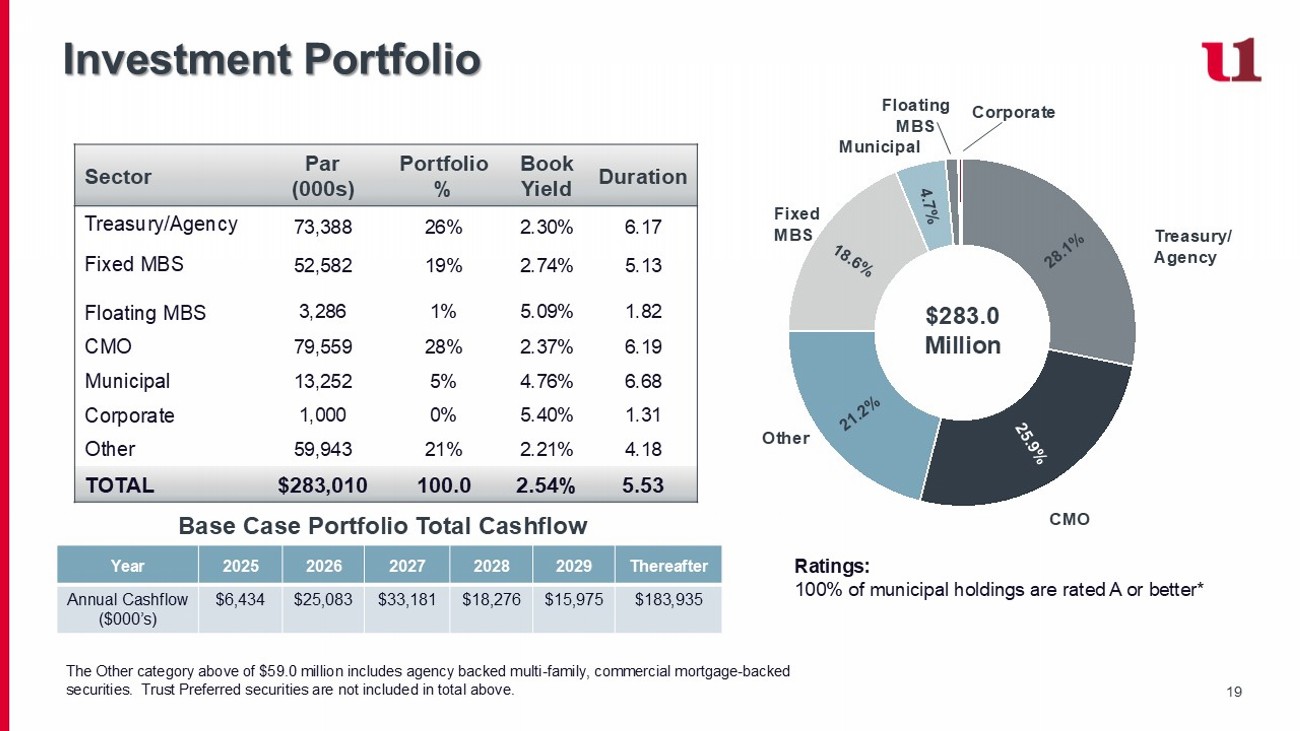
18 Credit Quality ALL / ACL Trends (Net Charge - Offs)/Average Loans Nonaccrual Loans / Total Loans NPAs / Total Assets 0.21% 0.27% 0.28% 0.33% 0.26% 2021 2022 2023 2024 3Q2025 0.60% 0.46% 0.48% 0.59% 0.51% 2021 2022 2023 2024 3Q2025 1.38% 1.14% 1.24% 1.23% 1.28% 2021 2022 2023 2024 3Q2025 - 0.02% --- - 0.06% - 0.07% - 0.16% - 0.08% 2021 2022 2023 2024 3Q2025 19 Investment Portfolio Duration Book Yield Portfolio % Par (000s) Sector 6.17 2.30% 26% 73,388 Treasury/Agency 5.13 1.82 2.74% 5.09% 19% 1% 52,582 3,286 Fixed MBS Floating MBS 6.19 2.37% 28% 79,559 CMO 6.68 4.76% 5% 13,252 Municipal 1.31 5.40% 0% 1,000 Corporate 4.18 2.21% 21% 59,943 Other 5.53 2.54% 100.0 $283,010 TOTAL Ratings: 100% of municipal holdings are rated A or better* $283.0 Million Thereafter 2029 2028 2027 2026 2025 Year $183,935 $15,975 $18,276 $33,181 $25,083 $6,434 Annual Cashflow ($000’s) Base Case Portfolio Total Cashflow Treasury/ Agency CMO Fixed MBS Other Municipal Corporate The Other category above of $59.0 million includes agency backed multi - family, commercial mortgage - backed securities. Trust Preferred securities are not included in total above.
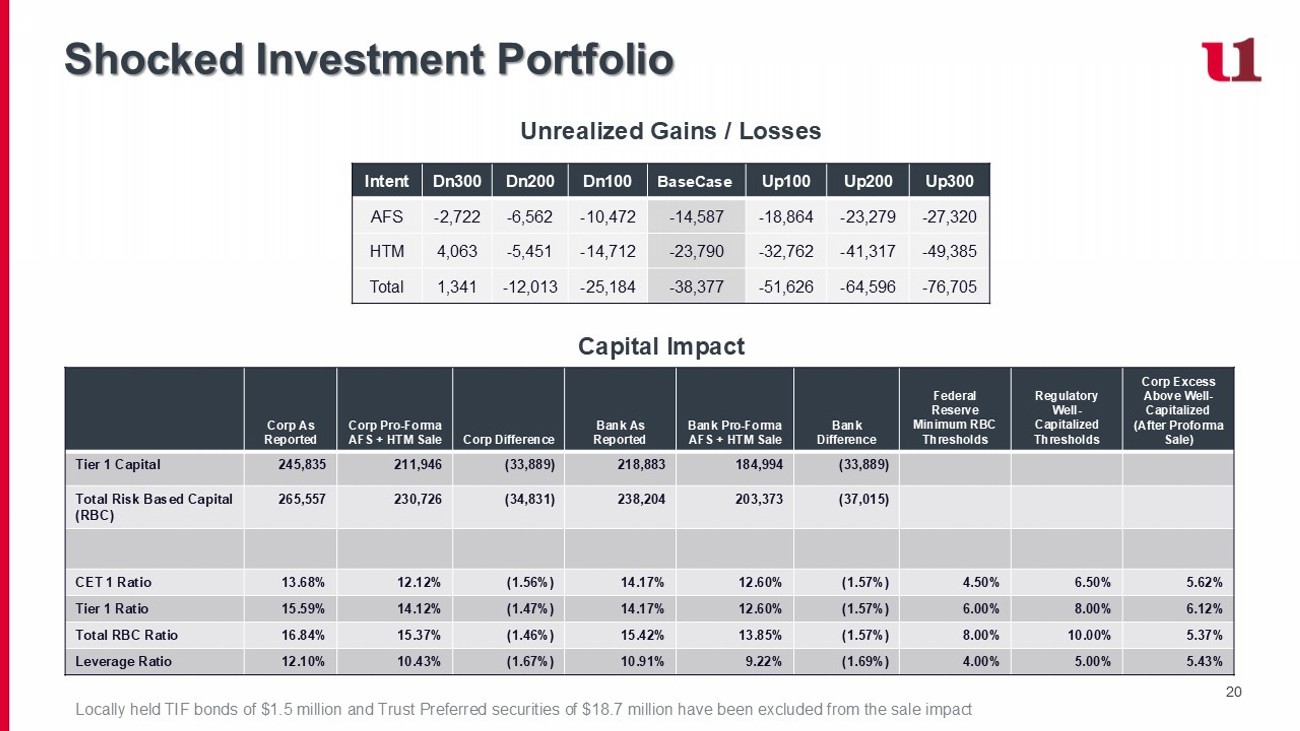
Floating MBS 20 Shocked Investment Portfolio Unrealized Gains / Losses Capital Impact Up300 Up200 Up100 BaseCase Dn100 Dn200 Dn300 Intent - 27,320 - 23,279 - 18,864 - 14,587 - 10,472 - 6,562 - 2,722 AFS - 49,385 - 41,317 - 32,762 - 23,790 - 14,712 - 5,451 4,063 HTM - 76,705 - 64,596 - 51,626 - 38,377 - 25,184 - 12,013 1,341 Total Corp Excess Above Well - Capitalized (After Proforma Sale) Regulatory Well - Capitalized Thresholds Federal Reserve Minimum RBC Thresholds Bank Difference Bank Pro - Forma AFS + HTM Sale Bank As Reported Corp Difference Corp Pro - Forma AFS + HTM Sale Corp As Reported (33,889) 184,994 218,883 (33,889) 211,946 245,835 Tier 1 Capital (37,015) 203,373 238,204 (34,831) 230,726 265,557 Total Risk Based Capital (RBC) 5.62% 6.50% 4.50% (1.57%) 12.60% 14.17% (1.56%) 12.12% 13.68% CET 1 Ratio 6.12% 8.00% 6.00% (1.57%) 12.60% 14.17% (1.47%) 14.12% 15.59% Tier 1 Ratio 5.37% 10.00% 8.00% (1.57%) 13.85% 15.42% (1.46%) 15.37% 16.84% Total RBC Ratio 5.43% 5.00% 4.00% (1.69%) 9.22% 10.91% (1.67%) 10.43% 12.10% Leverage Ratio Locally held TIF bonds of $1.5 million and Trust Preferred securities of $18.7 million have been excluded from the sale impac t 21 Deposits 34% 32% 28% 27% 26% 16% 23% 23% 25% 23% 39% 36% 37% 39% 39% 11% 8% 10% 9% 9% 0% 0% 2% 0% 3% 2021 2022 2023 2024 3Q2025 NIB Demand IB Demand MMA & Savings CDs - Retail CDs - Brokered $1.57 $1.42 $1.68 $1.57 $1.58 Deposit Composition ($ in billions as of 09/30/2025) 79% 81% 9 1% 94% 89% Loan to Deposit Ratio 2021 2022 2023 2024 3Q2025 Deposit levels relatively flat due to fierce competition for deposits and recent inflationary spending by consumers, businesses and municipalities.
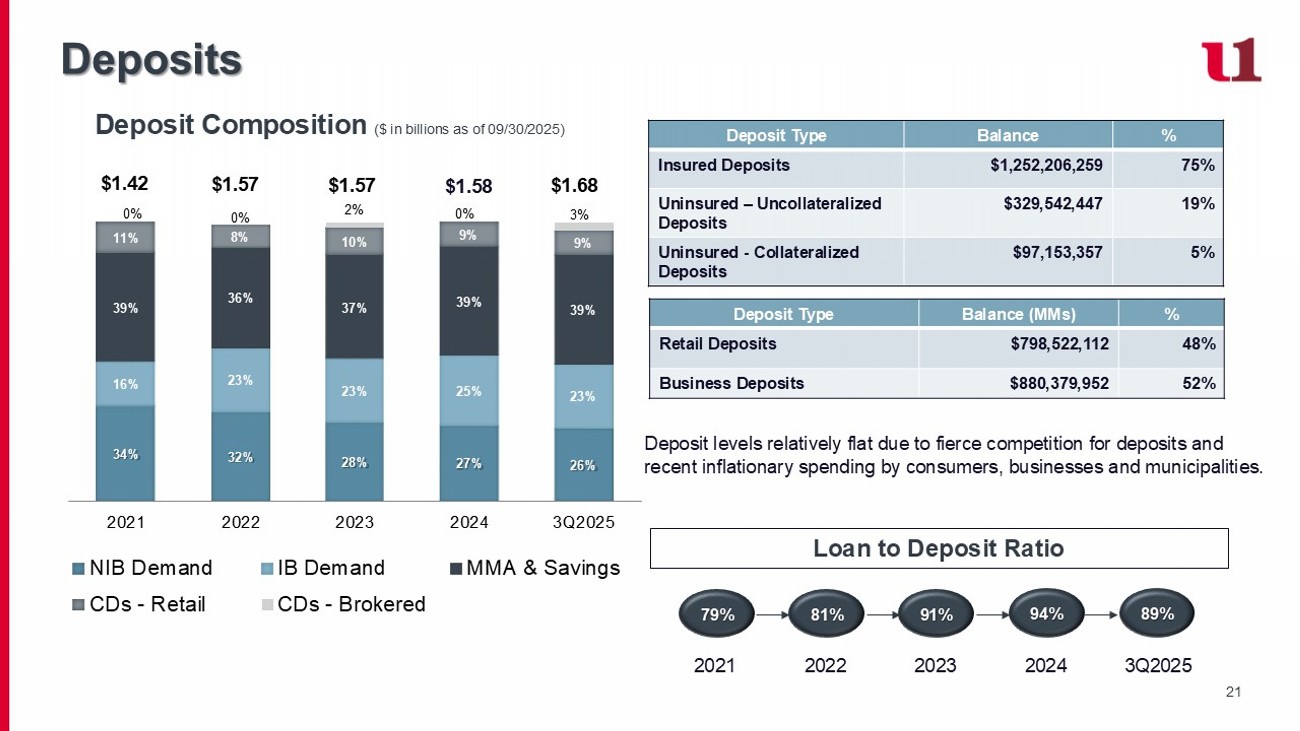
% Balance Deposit Type 75% $1,252,206,259 Insured Deposits 19% $329,542,447 Uninsured – Uncollateralized Deposits 5% $97,153,357 Uninsured - Collateralized Deposits % Balance (MMs) Deposit Type 48% $798,522,112 Retail Deposits 52% $880,379,952 Business Deposits 22 Funding 45% 46% 3% 6% Brokered Deposits Commercial Deposits Retail Deposits Borrowings Funding Mix Brokered/FHLB Maturities $25.0 $40.0 $25.0 $25.0 July 2026 March 2026 March 2026 January 2026 Dollars (in millions) FHLB Advance Federal Home Loan Bank Brokered CD 4.23% Brokered CD 4.22% 3.83% Brokered CD Federal Home Loan Bank 3.83% Fully repaid $25.0 million FHLB advance at maturity September 2025.
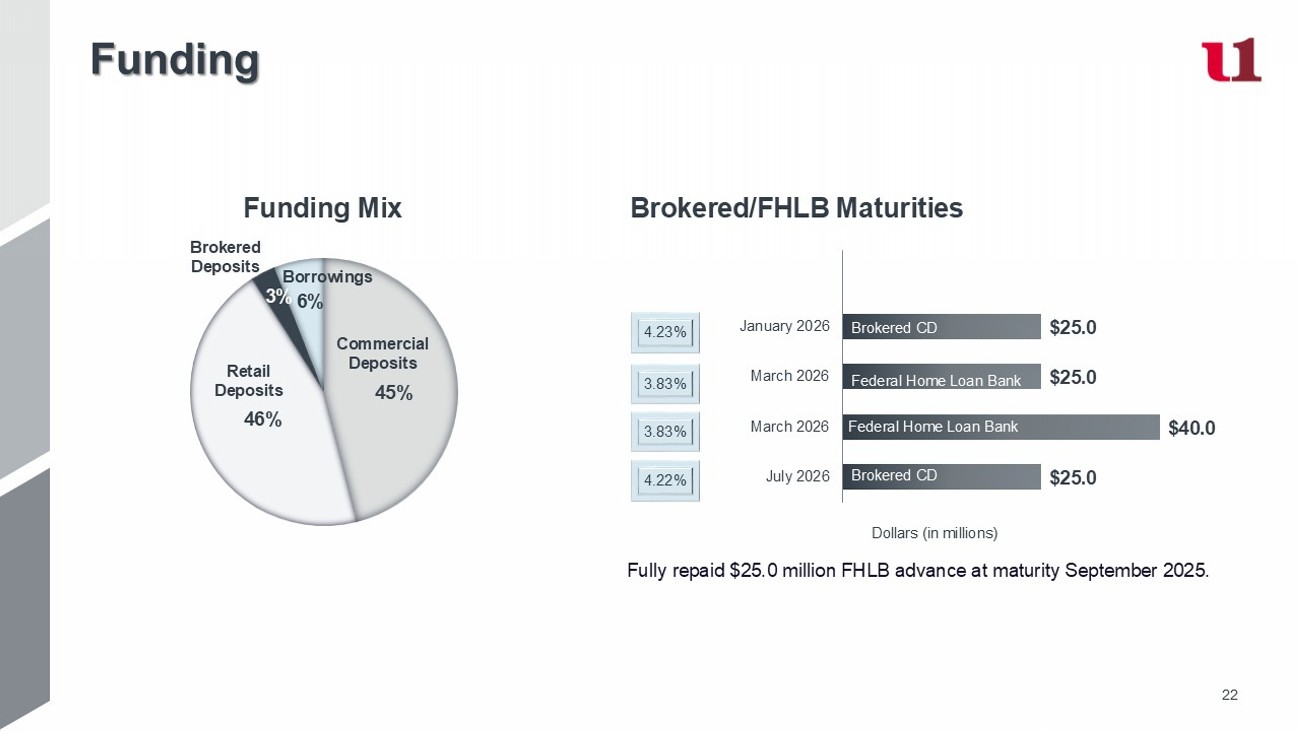
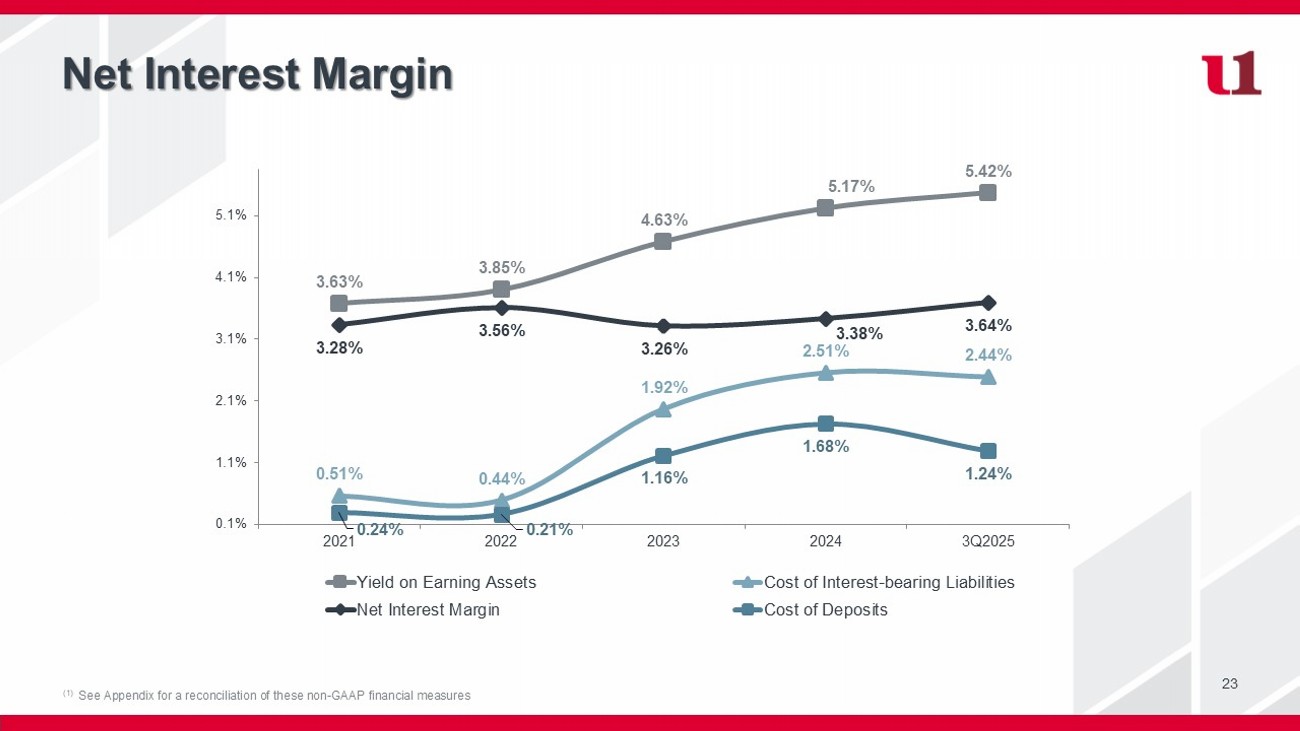
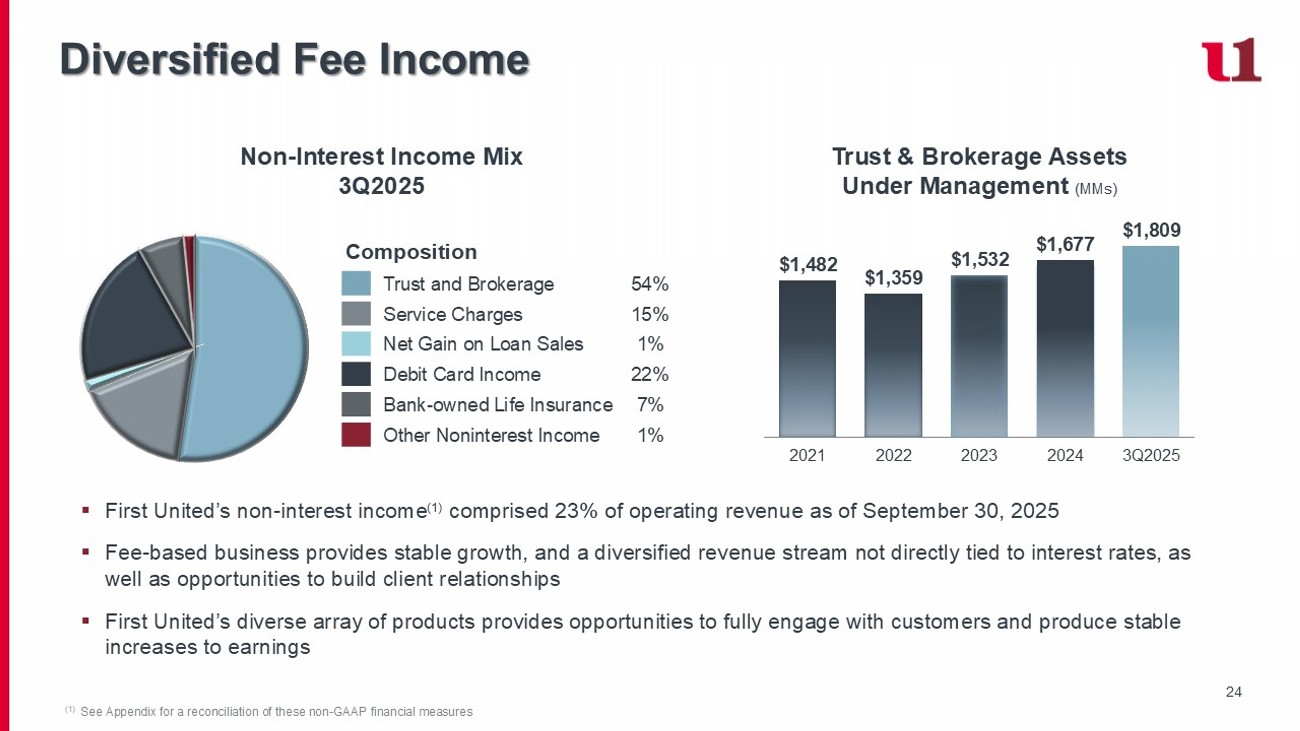
23 Net Interest Margin (1) See Appendix for a reconciliation of these non - GAAP financial measures 3.63% 3.85% 4.63% 5.17% 5.42% 0.51% 0.44% 1.92% 2.51% 2.44% 3.28% 3.56% 3.26% 3.38% 3.64% 0.24% 0.21% 1.16% 1.68% 1.24% 0.1% 1.1% 2.1% 3.1% 4.1% 5.1% 2021 2022 2023 2024 3Q2025 Yield on Earning Assets Cost of Interest-bearing Liabilities Net Interest Margin Cost of Deposits 24 Diversified Fee Income (1) See Appendix for a reconciliation of these non - GAAP financial measures Composition 54% Trust and Brokerage 15% Service Charges 1% Net Gain on Loan Sales 22% Debit Card Income 7% Bank - owned Life Insurance 1% Other Noninterest Income Non - Interest Income Mix 3Q2025 Trust & Brokerage Assets Under Management (MMs) ▪ First United’s non - interest income (1) comprised 23% of operating revenue as of September 30, 2025 ▪ Fee - based business provides stable growth, and a diversified revenue stream not directly tied to interest rates, as well as opportunities to build client relationships ▪ First United’s diverse array of products provides opportunities to fully engage with customers and produce stable increases to earnings $1,482 $1,359 $1,532 $1,677 $1,809 2021 2022 2023 2024 3Q2025 25 Committed to Efficiency & Innovation (1) See Appendix for a reconciliation of these non - GAAP financial measures Efficient operational platforms and fraud protection ▪ CardSuite Pro Premium Debit Card Fraud ▪ Better Customer Segmentation with complete picture of customer data ▪ ProfitStars forecasting model ▪ Automated Loan Booking ▪ Vericast Consumer Loan Lead Generator ▪ Project Management Enhancements ▪ AI Innovation Initiative ▪ U1 - Connect Customer Relationship Management Software Efficiency Ratio (1) Strategic Target 53% - 58% FinTech Investments ▪ Identity and Access Management ▪ FinTech Funds Solutions for a seamless and secure client experience: ▪ Zelle for Your Business ▪ Improved Customer Journey through Data Analytics ▪ New commercial loan software ▪ Consumer Online and Mobile Banking Digital Platform Upgrade ▪ Business Online and Mobile Banking Digital Platform Upgrade ▪ Check Fraud Prevention Solution Decrease in 3Q2025 due primarily to increased net interest income, increased non - interest income and controlled expenses.
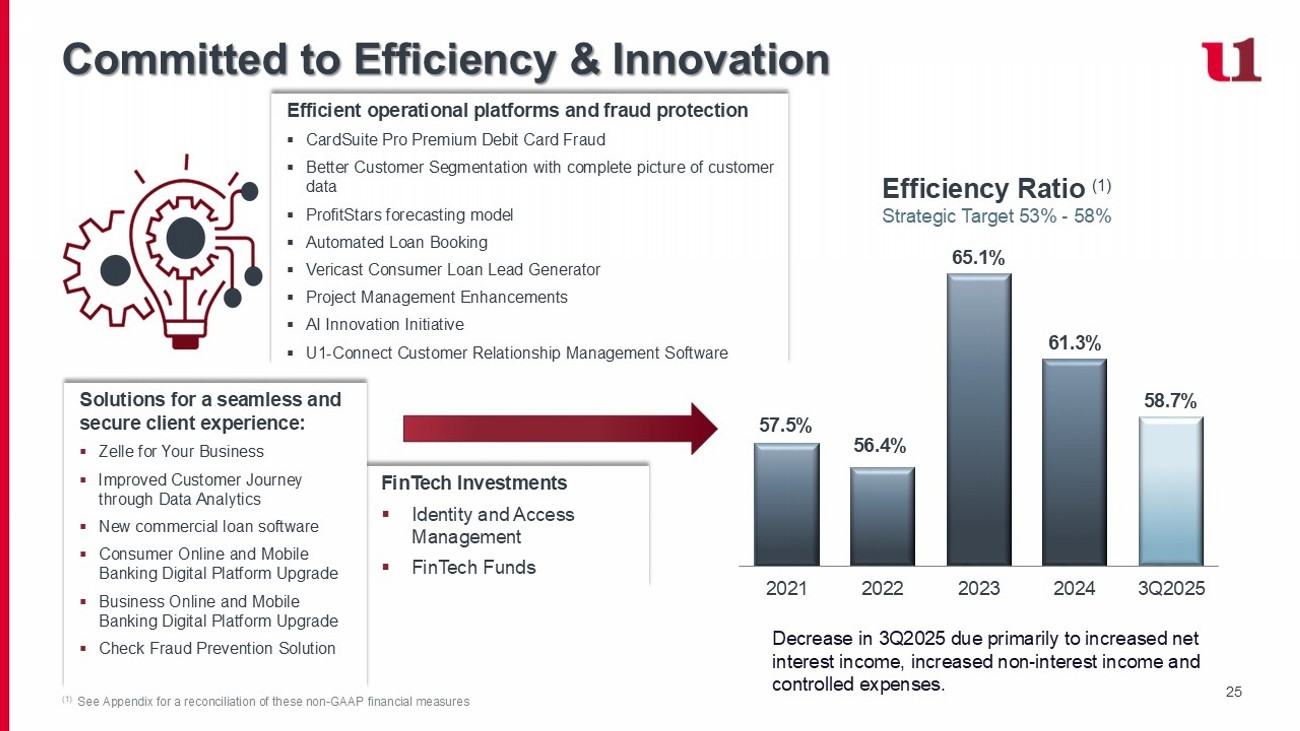
57.5% 56.4% 65.1% 61.3% 58.7% 2021 2022 2023 2024 3Q2025
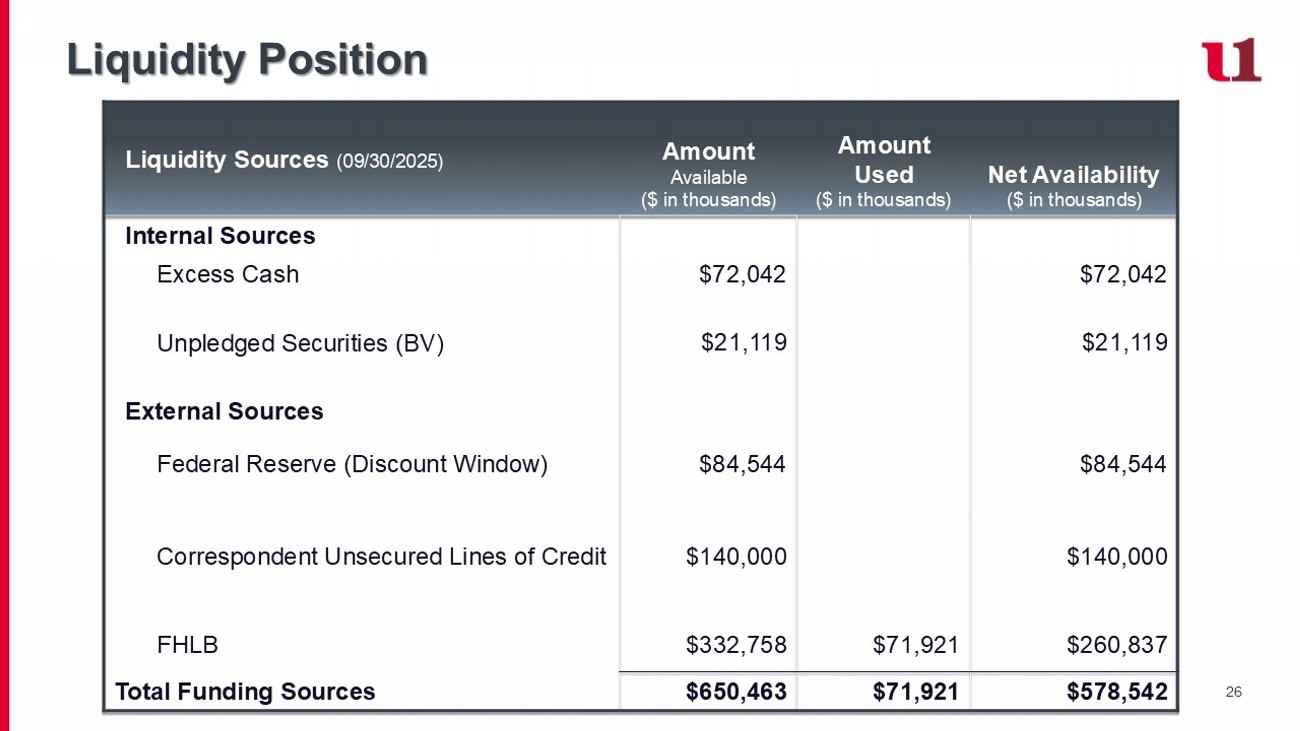
26 Liquidity Position Net Availability ($ in thousands) Amount Used ($ in thousands) Amount Available ($ in thousands) Liquidity Sources (09/30/2025) Internal Sources $72,042 $72,042 Excess Cash $21,119 $21,119 Unpledged Securities (BV) External Sources $84,544 $84,544 Federal Reserve (Discount Window) $140,000 $260,837 $71,921 $140,000 $332,758 Correspondent Unsecured Lines of Credit FHLB $578,542 $71,921 $650,463 Total Funding Sources 27 Interest Rate Risk (1) Standard Model Assumptions Interest Rate Risk Sensitivity ▪ The Bank’s interest rate risk position is stress tested under three interest rate ramp scenarios to determine the impact on net interest income, net income and capital under dynamic and static balance sheet conditions.
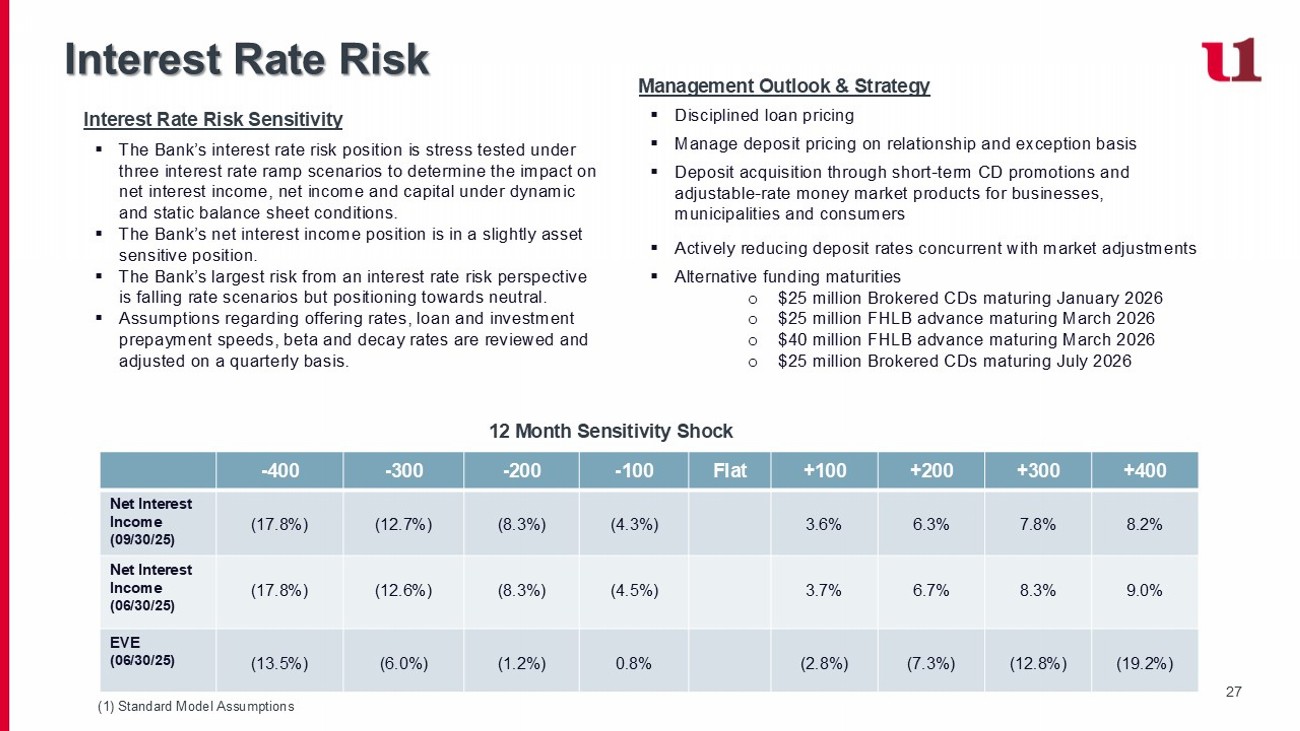
▪ The Bank’s net interest income position is in a slightly asset sensitive position. ▪ The Bank’s largest risk from an interest rate risk perspective is falling rate scenarios but positioning towards neutral. ▪ Assumptions regarding offering rates, loan and investment prepayment speeds, beta and decay rates are reviewed and adjusted on a quarterly basis. Management Outlook & Strategy ▪ Disciplined loan pricing ▪ Manage deposit pricing on relationship and exception basis ▪ Deposit acquisition through short - term CD promotions and adjustable - rate money market products for businesses, municipalities and consumers ▪ Actively reducing deposit rates concurrent with market adjustments ▪ Alternative funding maturities o $25 million Brokered CDs maturing January 2026 o $25 million FHLB advance maturing March 2026 o $40 million FHLB advance maturing March 2026 o $25 million Brokered CDs maturing July 2026 +400 +300 +200 +100 Flat - 100 - 200 - 300 - 400 8.2% 7.8% 6.3% 3.6% (4.3%) (8.3%) (12.7%) (17.8%) Net Interest Income (09/30/25) 9.0% 8.3% 6.7% 3.7% (4.5%) (8.3%) (12.6%) (17.8%) Net Interest Income (06/30/25) (19.2%) (12.8%) (7.3%) (2.8%) 0.8% (1.2%) (6.0%) (13.5%) EVE (06/30/25) 12 Month Sensitivity Shock 28 Capital Management CET1 Ratio Leverage Ratio Tier 1 Ratio Total Risk - Based Capital Ratio Regulatory Well - Capitalized 10% 5% 8% 6.5% 14.64% 15.06% 14.42% 14.70% 15.59% 2021 2022 2023 2024 3Q2025 15.89% 16.12% 15.64% 15.92% 16.84% 2021 2022 2023 2024 3Q2025 10.80% 11.46% 11.30% 11.88% 12.10% 2021 2022 2023 2024 3Q2025 12.50% 12.96% 12.44% 12.79% 13.68% 2021 2022 2023 2024 3Q2025 Strong capital levels allowing for continued growth.
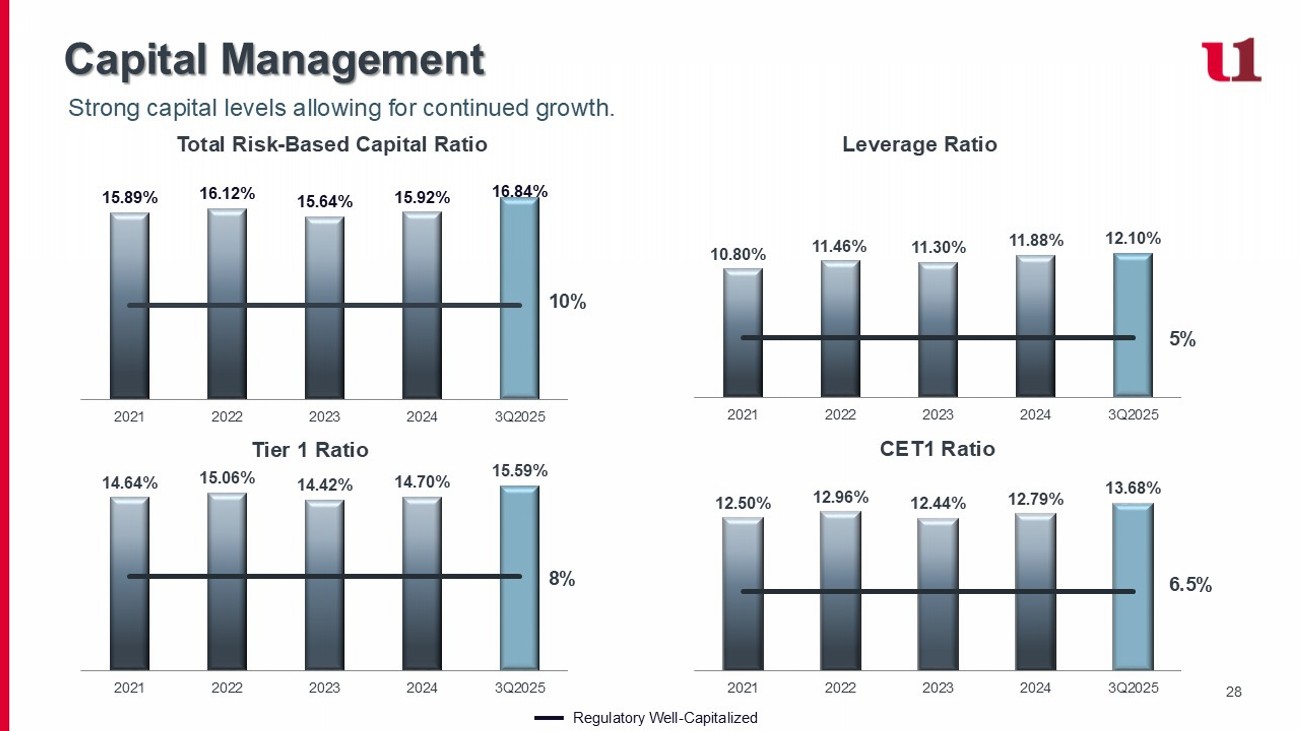
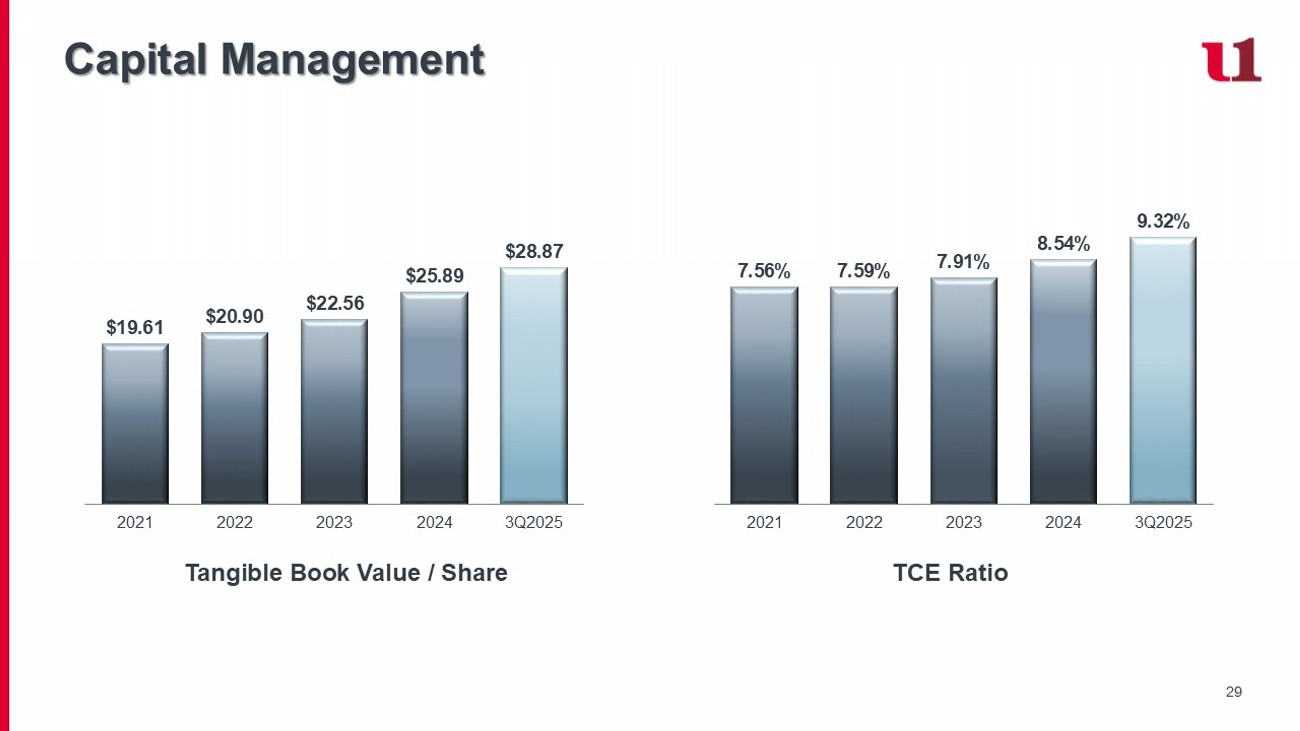
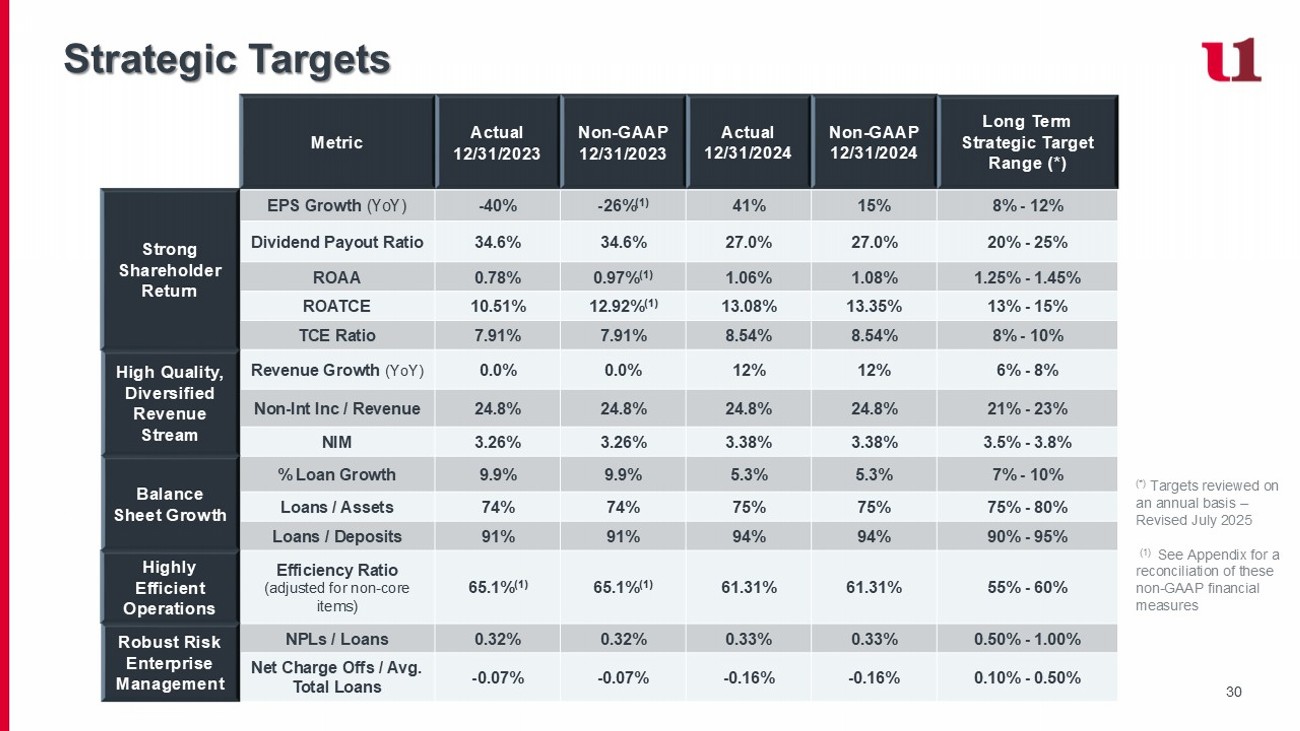
29 Capital Management Tangible Book Value / Share TCE Ratio $19.61 $20.90 $22.56 $25.89 $28.87 2021 2022 2023 2024 3Q2025 7.56% 7.59% 7.91% 8.54% 9.32% 2021 2022 2023 2024 3Q2025 30 Strategic Targets Long Term Strategic Target Range (*) Non - GAAP 12/31/2024 Actual 12/31/2024 Non - GAAP 12/31/2023 Actual 12/31/2023 Metric 8% - 12% 15% 41% - 26% (1) - 40% EPS Growth (YoY) Strong Shareholder Return 20% - 25% 27.0% 27.0% 34.6% 34.6% Dividend Payout Ratio 1.25% - 1.45% 1.08% 1.06% 0.97% (1) 0.78% ROAA 13% - 15% 13.35% 13.08% 12.92% (1) 10.51% ROATCE 8% - 10% 8.54% 8.54% 7.91% 7.91% TCE Ratio 6% - 8% 12% 12% 0.0% 0.0% Revenue Growth (YoY) High Quality, Diversified Revenue Stream 21% - 23% 24.8% 24.8% 24.8% 24.8% Non - Int Inc / Revenue 3.5% - 3.8% 3.38% 3.38% 3.26% 3.26% N IM 7% - 10% 5.3% 5.3% 9.9% 9.9% % Loan Growth Balance Sheet Growth 75% - 80% 75% 75% 74% 74% Loans / Assets 90% - 95% 94% 94% 91% 91% Loans / Deposits 55% - 60% 61.31% 61.31% 65.1% (1) 65.1% (1) Efficiency Ratio (adjusted for non - core items) Highly Efficient Operations 0.50% - 1.00% 0.33% 0.33% 0.32% 0.32% NPLs / Loans Robust Risk Enterprise Management 0.10% - 0.50% - 0.16% - 0.16% - 0.07% - 0.07% Net Charge Offs / Avg. Total Loans (*) Targets reviewed on an annual basis – Revised July 2025 (1) See Appendix for a reconciliation of these non - GAAP financial measures Strong Investor Relations & Shareholder Engagement Members of the Board and senior management routinely engage with shareholders and other stakeholders, and management regularly updates the Board in the context of ongoing investor discussions.

These engagements help the Board and management gather feedback on a variety of topics, including strategic and financial performance, executive compensation, Board composition, and leadership structure. Clear long - term strategic plan with performance targets x Dedicated Investor Relations contact x Investor conferences and prospective investor engagement x Investor presentations and periodic outreach to institutional and retail shareholders x How to contact your Board: Shareholders and interested parties wishing to contact our Board may send a letter to First United Corporation Board of Direc tor s, c/o Tonya K. Sturm, Secretary, First United Corporation, 19 South Second Street, Oakland, Maryland, 21550 - 0009 or by e - mail at tsturm@mybank.com. The Secretary will deliver all shareholder communications directly to the Board for consideration. 31 32 32 I. II. III. Management Team Board of Directors Non - GAAP Reconciliation Pg. 33 Pg. 34 Pg. 38 Appendices


33 33 Management Team Carissa L. Rodeheaver Chairman of the Board, President & CEO 33+ years career with First United with in - depth industry, wealth management, financial and operational experience Jason B. Rush SVP & Chief Operating Officer 30+ years with in - depth industry, retail, risk and compliance and operations experience Tonya K. Sturm SVP & Chief Financial Officer, Corp. Secretary & Treasurer 35+ years of banking, audit, credit, retail, risk and compliance and financial and operational experience R.L. Fisher SVP & Chief Revenue Officer 25+years with in - depth industry, retail, commercial and mortgage banking experience Keith R. Sanders SVP & Chief Wealth Officer 30+ years specializing in wealth management, estate planning, trust administration and financial planning Our leadership team reflects the diversity of thought from the communities we serve, executes on our strategy and drives shareholder returns. Julie W.

Peterson SVP & Chief Credit Officer 30+ years with in - depth industry, commercial banking, and credit experience 34 34 34 John F. Barr Independent Director Chairman of the Board, Ellsworth Electric, Inc. Sanu Chadha Independent Director Managing Partner, M&S Consulting Christy DiPietro Independent Director, Audit Chair Chartered Financial Analyst, Hidden Cove Advisory Patricia Milon Independent Director Principal, Milford Advisory Group, LLC I. Robert Rudy Independent Director President, I.R. Rudy’s, Inc. H. Andrew Walls, III Independent Director President, MPB Print & Sign Superstore Member, MEGBA, LLC Beth E. Moran Independent Director, The Law Offices of Beth E. Moran Brian Boal Lead Independent Director, Nomination & Governance Chair Boal & Associates, PC Carissa L. Rodeheaver Chairman of the Board, President & CEO First United Corporation and First United Bank & Trust Board of Directors Kevin Hessler Independent Director , Principal, LSWG, Inc. First United's Board of Directors represents individuals with varied backgrounds and viewpoints, contributing to its well - rounded leadership and governance structure.
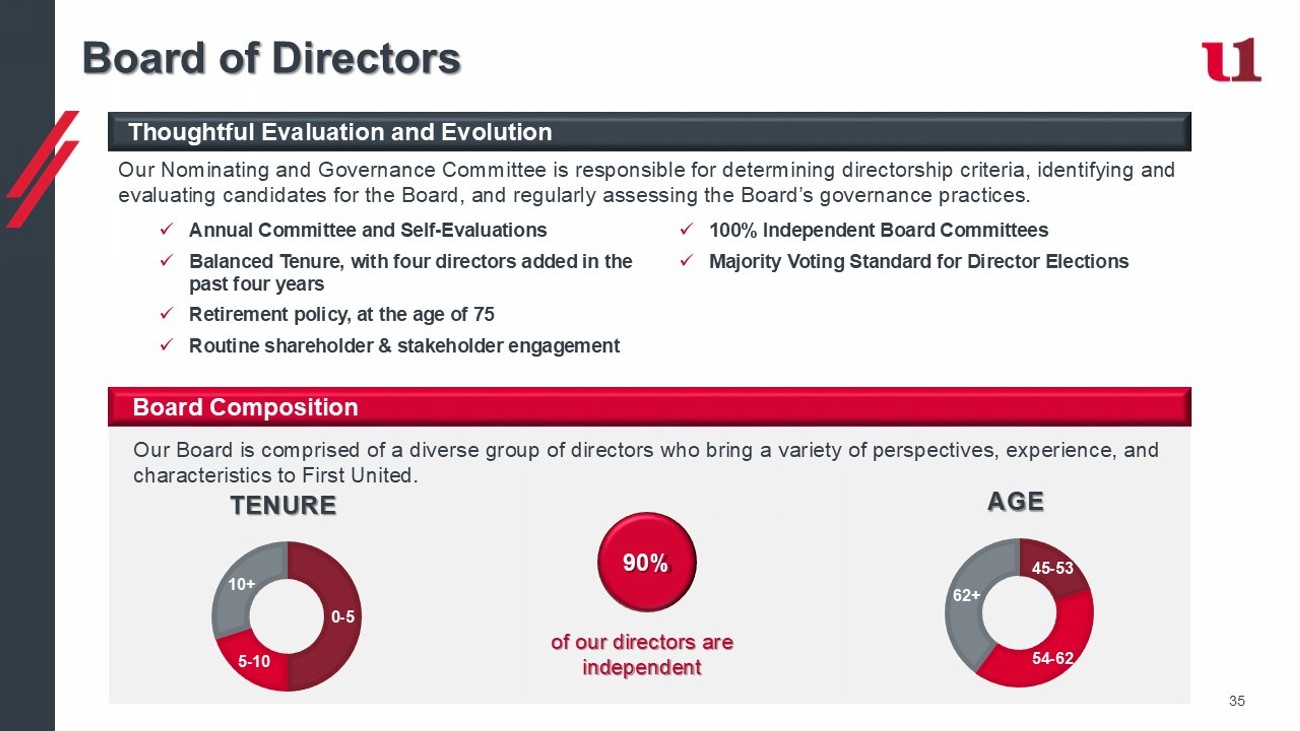
Board of Directors Thoughtful Evaluation and Evolution Our Board is comprised of a diverse group of directors who bring a variety of perspectives, experience, and characteristics to First United. Board Composition 90% of our directors are independent Our Nominating and Governance Committee is responsible for determining directorship criteria, identifying and evaluating candidates for the Board, and regularly assessing the Board’s governance practices. x 100% Independent Board Committees x Majority Voting Standard for Director Elections x Annual Committee and Self - Evaluations x Balanced Tenure, with four directors added in the past four years x Retirement policy, at the age of 75 x Routine shareholder & stakeholder engagement 0 - 5 5 - 10 10+ TENURE 45 - 53 54 - 62 62+ AGE 35 36 Board of Directors The First United board of directors brings a diverse range of skills, experiences, and backgrounds to the work of overseeing ris k and strategy.
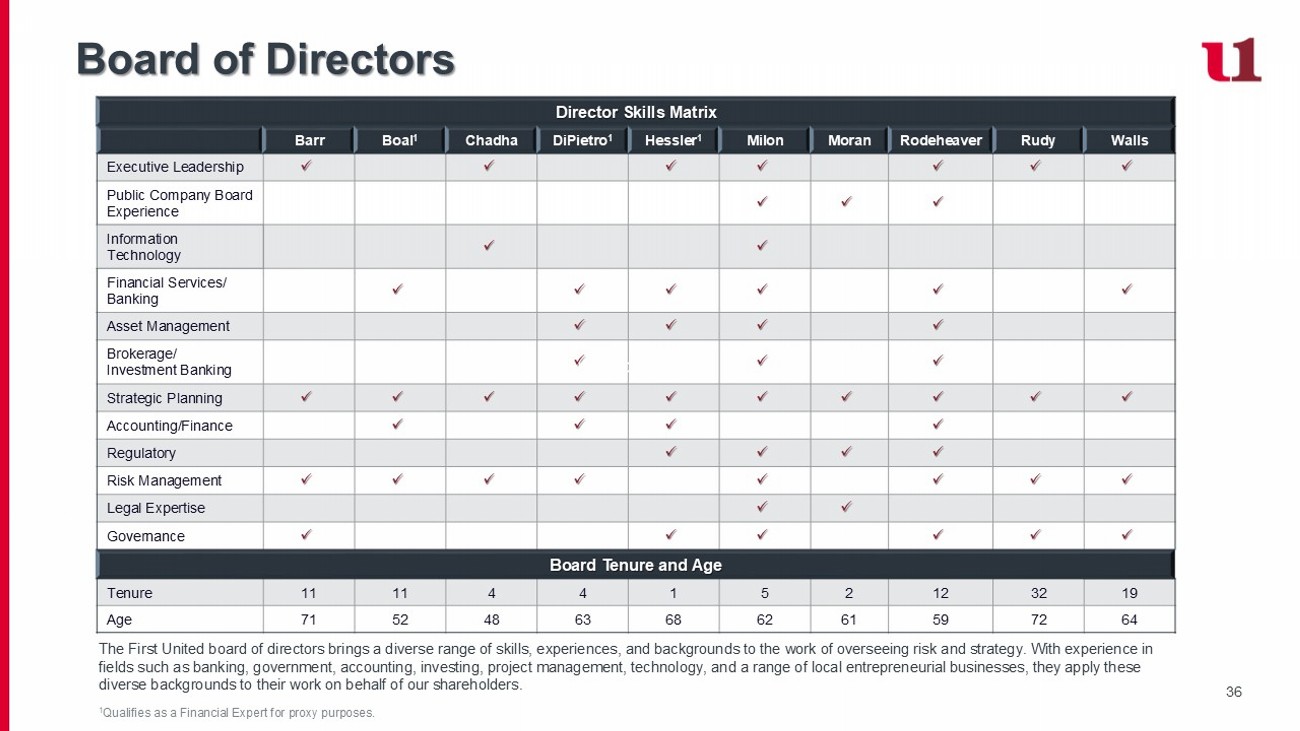
With experience in fields such as banking, government, accounting, investing, project management, technology, and a range of local entrepreneuri al businesses, they apply these diverse backgrounds to their work on behalf of our shareholders. Director Skills Matrix Walls Rudy Rodeheaver Moran Milon Hessler 1 DiPietro 1 Chadha Boal 1 Barr x x x x x x x Executive Leadership x x x Public Company Board Experience x x Information Technology x x x x x x Financial Services/ Banking x x x x Asset Management x x x Brokerage/ Investment Banking x x x x x x x x x x Strategic Planning x x x x Accounting/Finance x x x x Regulatory x x x x x x x x Risk Management x x Legal Expertise x x x x x x Governance Board Tenure and Age 19 32 12 2 5 1 4 4 11 11 Tenure 64 72 59 61 62 68 63 48 52 71 Age 1 Qualifies as a Financial Expert for proxy purposes. Brokered CD 37 Continuous Progress We continue to advance our Governance profile over time, recognizing the importance of our key stakeholders – including our customers and our communities – to our business.
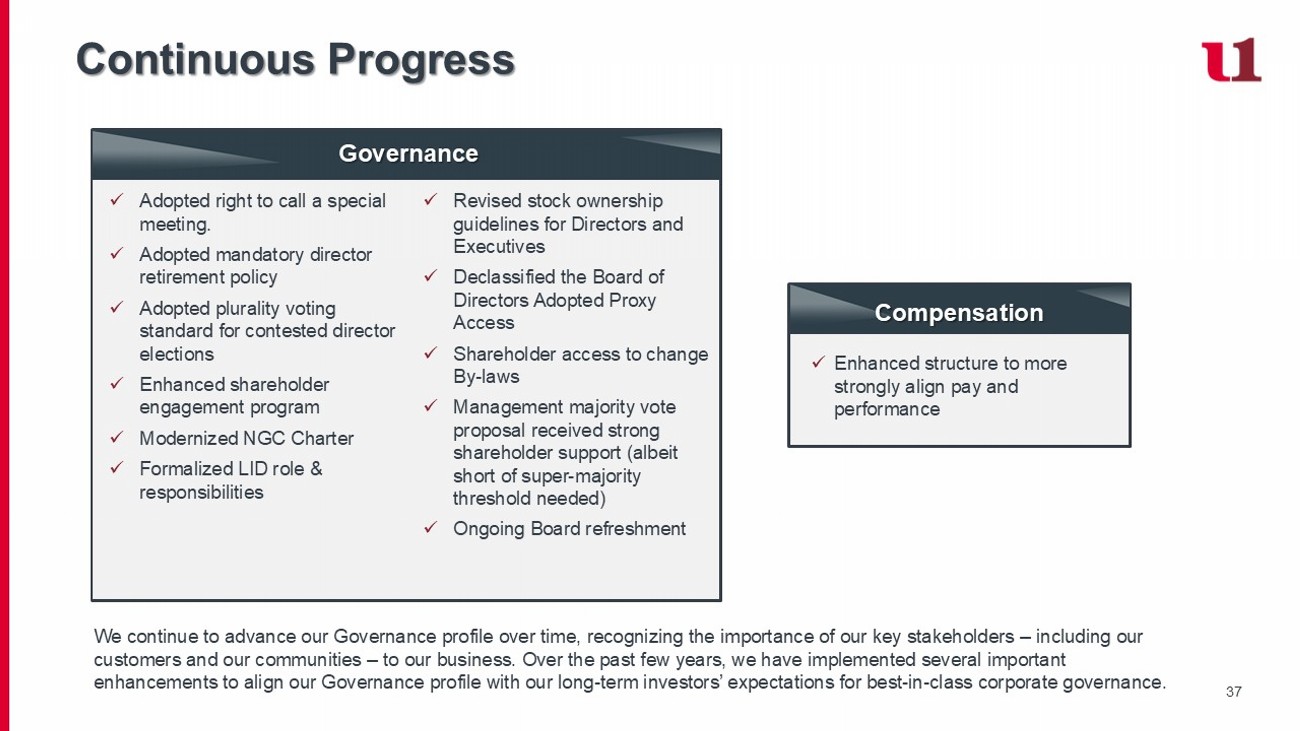
Over the past few years, we have implemented several important enhancements to align our Governance profile with our long - term investors’ expectations for best - in - class corporate governance. x Enhanced structure to more strongly align pay and performance Compensation Governance x Revised stock ownership guidelines for Directors and Executives x Declassified the Board of Directors Adopted Proxy Access x Shareholder access to change By - laws x Management majority vote proposal received strong shareholder support (albeit short of super - majority threshold needed) x Ongoing Board refreshment x Adopted right to call a special meeting.
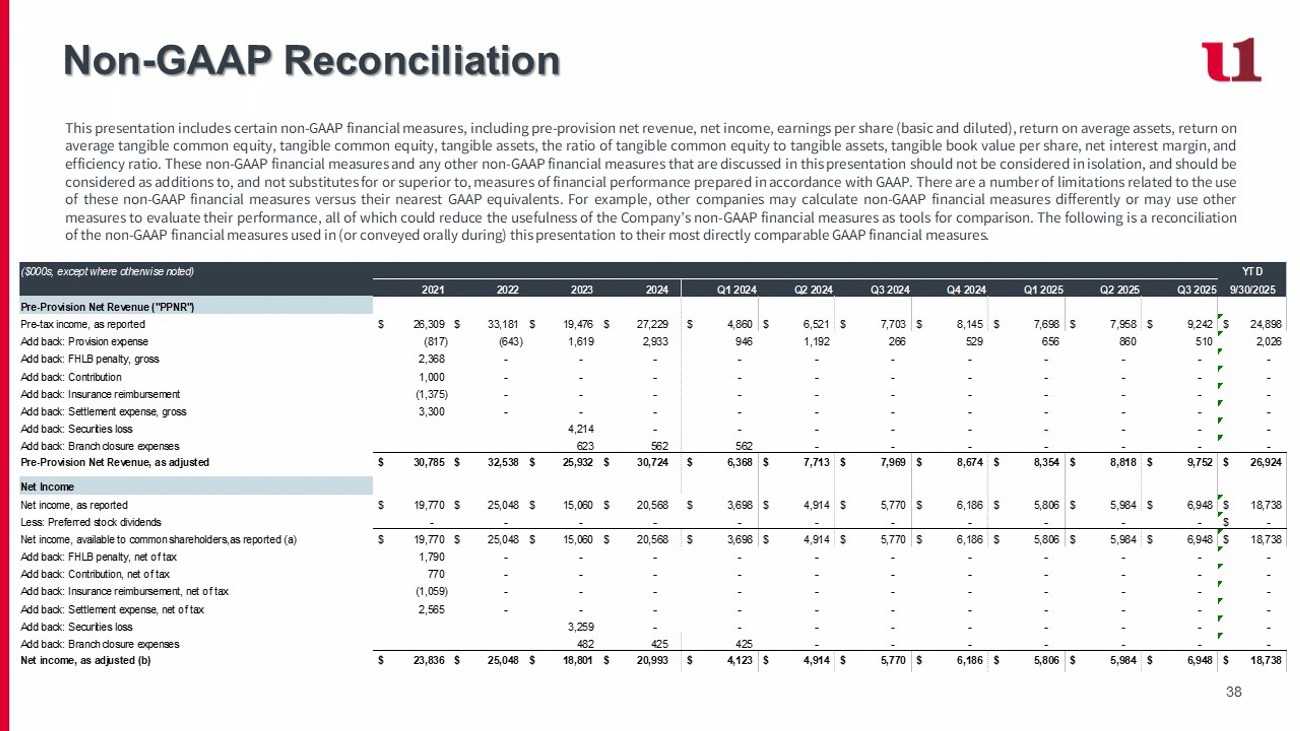
x Adopted mandatory director retirement policy x Adopted plurality voting standard for contested director elections x Enhanced shareholder engagement program x Modernized NGC Charter x Formalized LID role & responsibilities 38 This presentation includes certain non - GAAP financial measures, including pre - provision net revenue, net income, earnings per share (basic and diluted), return on average assets, return on average tangible common equity, tangible common equity, tangible assets, the ratio of tangible common equity to tangible assets, tangible book value per share, net interest margin, and efficiency ratio . These non - GAAP financial measures and any other non - GAAP financial measures that are discussed in this presentation should not be considered in isolation, and should be considered as additions to, and not substitutes for or superior to, measures of financial performance prepared in accordance with GAAP . There are a number of limitations related to the use of these non - GAAP financial measures versus their nearest GAAP equivalents . For example, other companies may calculate non - GAAP financial measures differently or may use other measures to evaluate their performance, all of which could reduce the usefulness of the Company’s non - GAAP financial measures as tools for comparison . The following is a reconciliation of the non - GAAP financial measures used in (or conveyed orally during) this presentation to their most directly comparable GAAP financial measures . Non - GAAP Reconciliation ($000s, except where otherwise noted) YTD 2021 2022 2023 2024 Q1 2024 Q2 2024 Q3 2024 Q4 2024 Q1 2025 Q2 2025 Q3 2025 9/30/2025 Pre-Provision Net Revenue ("PPNR") Pre-tax income, as reported 26,309$ 33,181$ 19,476$ 27,229$ 4,860$ 6,521$ 7,703$ 8,145$ 7,698$ 7,958$ 9,242$ 24,898$ Add back: Provision expense (817) (643) 1,619 2,933 946 1,192 266 529 656 860 510 2,026 Add back: FHLB penalty, gross 2,368 - - - - - - - - - - - Add back: Contribution 1,000 - - - - - - - - - - - Add back: Insurance reimbursement (1,375) - - - - - - - - - - - Add back: Settlement expense, gross 3,300 - - - - - - - - - - - Add back: Securities loss 4,214 - - - - - - - - - Add back: Branch closure expenses 623 562 562 - - - - - - - Pre-Provision Net Revenue, as adjusted 30,785$ 32,538$ 25,932$ 30,724$ 6,368$ 7,713$ 7,969$ 8,674$ 8,354$ 8,818$ 9,752$ 26,924$ Net Income Net income, as reported 19,770$ 25,048$ 15,060$ 20,568$ 3,698$ 4,914$ 5,770$ 6,186$ 5,806$ 5,984$ 6,948$ 18,738$ Less: Preferred stock dividends - - - - - - - - - - - -$ Net income, available to common shareholders,as reported (a) 19,770$ 25,048$ 15,060$ 20,568$ 3,698$ 4,914$ 5,770$ 6,186$ 5,806$ 5,984$ 6,948$ 18,738$ Add back: FHLB penalty, net of tax 1,790 - - - - - - - - - - - Add back: Contribution, net of tax 770 - - - - - - - - - - - Add back: Insurance reimbursement, net of tax (1,059) - - - - - - - - - - - Add back: Settlement expense, net of tax 2,565 - - - - - - - - - - - Add back: Securities loss 3,259 - - - - - - - - - Add back: Branch closure expenses 482 425 425 - - - - - - - Net income, as adjusted (b) 23,836$ 25,048$ 18,801$ 20,993$ 4,123$ 4,914$ 5,770$ 6,186$ 5,806$ 5,984$ 6,948$ 18,738$ 39 Non - GAAP Reconciliation , continued ($000s, except where otherwise noted) YTD 2021 2022 2023 2024 Q1 2024 Q2 2024 Q3 2024 Q4 2024 Q1 2025 Q2 2025 Q3 2025 9/30/2025 Weighted Average Common shares - basic (actual) (d) 6,710,463 6,649,740 6,685,676 6,527,077 6,643,898 6,526,553 6,467,597 6,470,259 6,474,368 6,489,245 6,496,122 6,486,579 Weighted Average Common shares - diluted (actual) (e) 6,716,587 6,661,055 6,701,243 6,539,521 6,655,637 6,536,546 6,481,620 6,484,282 6,489,990 6,505,753 6,508,004 6,501,249 Earnings Per Share - Basic Earnings Per Share - Basic, as reported (a)/(d) 2.95$ 3.77$ 2.25$ 3.15$ 0.56$ 0.75$ 0.89$ 0.95$ 0.90$ 0.92$ 1.07$ 2.89$ Add back: FHLB penalty, net of tax 0.27 - - - - - - - - - - - Add back: Contribution, net of tax 0.12 - - - - - - - - - - - Add back: Insurance reimbursement, net of tax (0.16) - - - - - - - - - - - Add back: Settlement expense, net of tax 0.37 - - - - - - - - - - - Add back: Securities loss 0.49 - - - - - - - - - Add back: Branch closure expenses 0.07 0.06 0.06 - - - - - - - Earnings Per Share - Basic, as adjusted (b)/(d) 3.54$ 3.77$ 2.81$ 3.21$ 0.62$ 0.75$ 0.89$ 0.95$ 0.90$ 0.92$ 1.07$ 2.89$ Earnings Per Share - Diluted Earnings Per Share - Diluted, as reported (a)/(e) 2.95$ 3.76$ 2.24$ 3.15$ 0.56$ 0.75$ 0.89$ 0.95$ 0.89$ 0.92$ 1.07$ 2.88$ Add back: FHLB penalty, net of tax 0.27 - - - - - - - - - - - Add back: Contribution, net of tax 0.12 - - - - - - - - - - - Add back: Insurance reimbursement, net of tax (0.16) - - - - - - - - - - - Add back: Settlement expense, net of tax 0.37 - - - - - - - - - - - Add back: Securities loss 0.49 - - - - - - - - - Add back: Branch closure expenses 0.07 0.06 0.06 - - - - - - - Earnings Per Share - Diluted, as adjusted (b)/(e) 3.54$ 3.76$ 2.80$ 3.21$ 0.62$ 0.75$ 0.89$ 0.95$ 0.89$ 0.92$ 1.07$ 2.88$
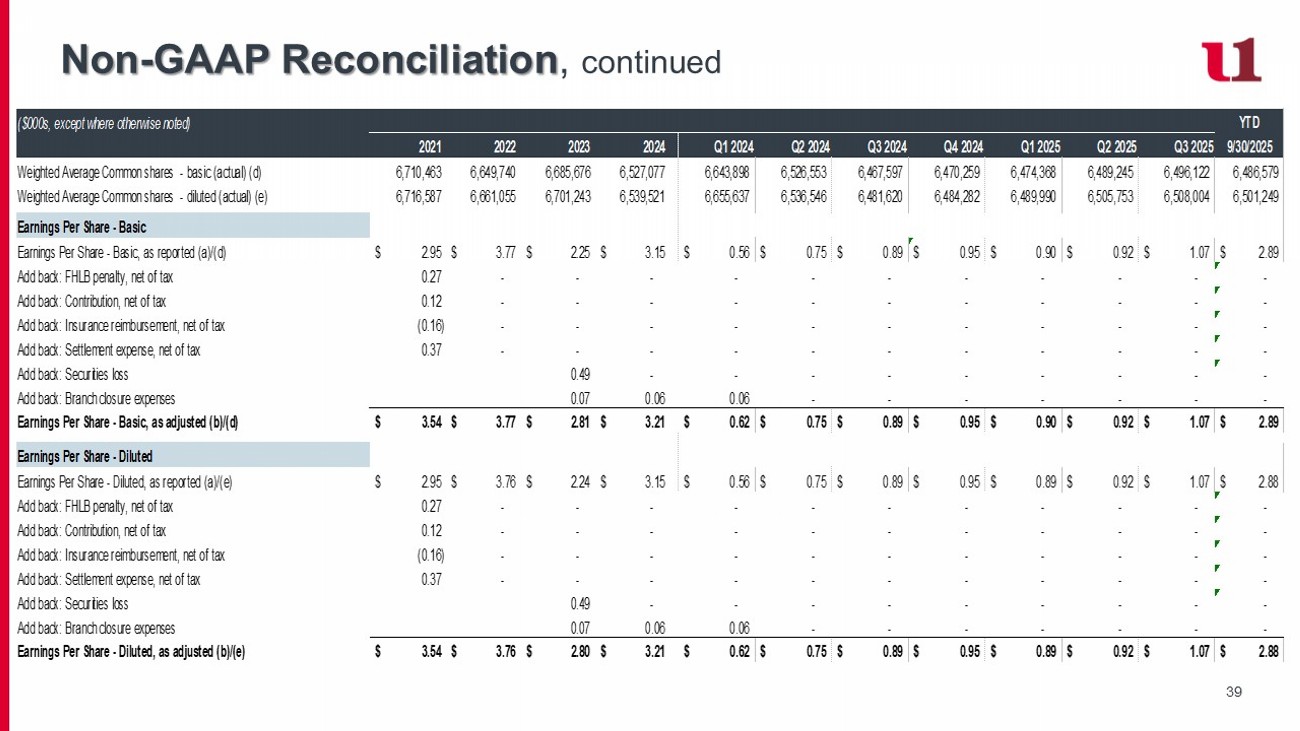
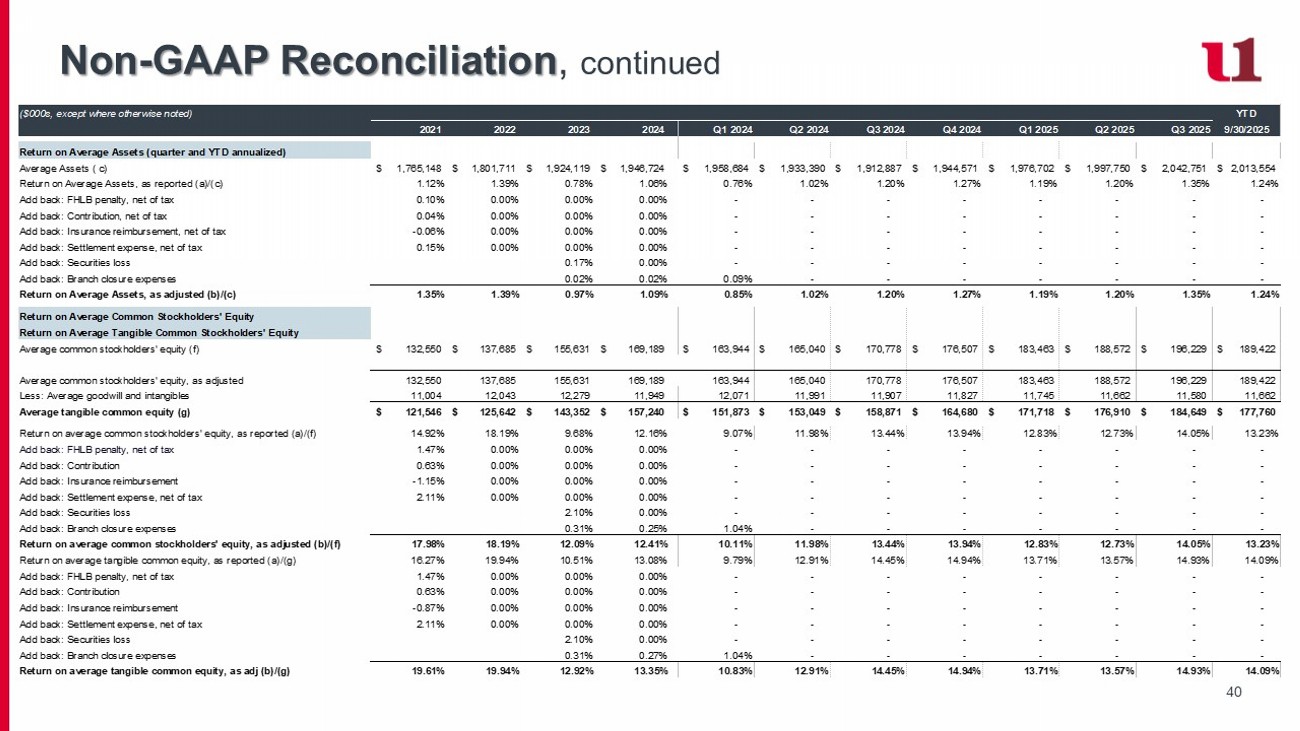
40 Non - GAAP Reconciliation , continued ($000s, except where otherwise noted) YTD 2021 2022 2023 2024 Q1 2024 Q2 2024 Q3 2024 Q4 2024 Q1 2025 Q2 2025 Q3 2025 9/30/2025 Return on Average Assets (quarter and YTD annualized) Average Assets ( c) 1,765,148$ 1,801,711$ 1,924,119$ 1,946,724$ 1,958,684$ 1,933,390$ 1,912,887$ 1,944,571$ 1,976,702$ 1,997,750$ 2,042,751$ 2,013,554$ Return on Average Assets, as reported (a)/(c) 1.12% 1.39% 0.78% 1.06% 0.76% 1.02% 1.20% 1.27% 1.19% 1.20% 1.35% 1.24% Add back: FHLB penalty, net of tax 0.10% 0.00% 0.00% 0.00% - - - - - - - - Add back: Contribution, net of tax 0.04% 0.00% 0.00% 0.00% - - - - - - - - Add back: Insurance reimbursement, net of tax -0.06% 0.00% 0.00% 0.00% - - - - - - - - Add back: Settlement expense, net of tax 0.15% 0.00% 0.00% 0.00% - - - - - - - - Add back: Securities loss 0.17% 0.00% - - - - - - - - Add back: Branch closure expenses 0.02% 0.02% 0.09% - - - - - - - Return on Average Assets, as adjusted (b)/(c) 1.35% 1.39% 0.97% 1.09% 0.85% 1.02% 1.20% 1.27% 1.19% 1.20% 1.35% 1.24% Return on Average Common Stockholders' Equity Return on Average Tangible Common Stockholders' Equity Average common stockholders' equity (f) 132,550$ 137,685$ 155,631$ 169,189$ 163,944$ 165,040$ 170,778$ 176,507$ 183,463$ 188,572$ 196,229$ 189,422$ Average common stockholders' equity, as adjusted 132,550 137,685 155,631 169,189 163,944 165,040 170,778 176,507 183,463 188,572 196,229 189,422 Less: Average goodwill and intangibles 11,004 12,043 12,279 11,949 12,071 11,991 11,907 11,827 11,745 11,662 11,580 11,662 Average tangible common equity (g) 121,546$ 125,642$ 143,352$ 157,240$ 151,873$ 153,049$ 158,871$ 164,680$ 171,718$ 176,910$ 184,649$ 177,760$ Return on average common stockholders' equity, as reported (a)/(f) 14.92% 18.19% 9.68% 12.16% 9.07% 11.98% 13.44% 13.94% 12.83% 12.73% 14.05% 13.23% Add back: FHLB penalty, net of tax 1.47% 0.00% 0.00% 0.00% - - - - - - - - Add back: Contribution 0.63% 0.00% 0.00% 0.00% - - - - - - - - Add back: Insurance reimbursement -1.15% 0.00% 0.00% 0.00% - - - - - - - - Add back: Settlement expense, net of tax 2.11% 0.00% 0.00% 0.00% - - - - - - - - Add back: Securities loss 2.10% 0.00% - - - - - - - - Add back: Branch closure expenses 0.31% 0.25% 1.04% - - - - - - - Return on average common stockholders' equity, as adjusted (b)/(f) 17.98% 18.19% 12.09% 12.41% 10.11% 11.98% 13.44% 13.94% 12.83% 12.73% 14.05% 13.23% Return on average tangible common equity, as reported (a)/(g) 16.27% 19.94% 10.51% 13.08% 9.79% 12.91% 14.45% 14.94% 13.71% 13.57% 14.93% 14.09% Add back: FHLB penalty, net of tax 1.47% 0.00% 0.00% 0.00% - - - - - - - - Add back: Contribution 0.63% 0.00% 0.00% 0.00% - - - - - - - - Add back: Insurance reimbursement -0.87% 0.00% 0.00% 0.00% - - - - - - - - Add back: Settlement expense, net of tax 2.11% 0.00% 0.00% 0.00% - - - - - - - - Add back: Securities loss 2.10% 0.00% - - - - - - - - Add back: Branch closure expenses 0.31% 0.27% 1.04% - - - - - - - Return on average tangible common equity, as adj (b)/(g) 19.61% 19.94% 12.92% 13.35% 10.83% 12.91% 14.45% 14.94% 13.71% 13.57% 14.93% 14.09% 41 Non - GAAP Reconciliation , continued ($000s, except where otherwise noted) YTD 2021 2022 2023 2024 Q1 2024 Q2 2024 Q3 2024 Q4 2024 Q1 2025 Q2 2025 Q3 2025 9/30/2025 Tangible Book Value per Common Share Total common equity, as reported (h) 141,900$ 151,793$ 161,873$ 179,295$ 165,481$ 164,177$ 173,979$ 179,295$ 183,694$ 191,147$ 199,099$ 199,099$ Less: Goodwill and intangibles 12,052 12,433 12,103 11,773 12,021 11,938 11,856 11,773 11,691 11,609 11,526 11,526 Total tangible common equity (i) 129,848$ 139,360$ 149,770$ 167,522$ 153,460$ 152,239$ 162,123$ 167,522$ 172,003$ 179,538$ 187,573$ 187,573$ Common shares outstanding - basic (actual) (j) 6,620,955 6,666,428 6,639,888 6,471,096 6,648,645 6,465,601 6,468,625 6,471,096 6,478,634 6,494,611 6,496,908 6,496,908 Tangible book value per basic common share (i)/(j) 19.61$ 20.90$ 22.56$ 25.89$ 23.08$ 23.55$ 25.06$ 25.89$ 26.55$ 27.64$ 28.87$ 28.87$ Tangible common equity to tangible assets ("TCE Ratio") Total assets, as reported (k) 1,729,838 1,848,169 1,905,860 1,973,022 1,912,953 1,868,599 1,916,126 1,973,022 1,979,753 2,007,471 2,023,974 2,023,974 Less: Goodwill 12,052 12,433 12,103 11,773 12,021 11,938 11,856 11,773 11,691 11,609 11,526 11,526 Total tangible assets (l) 1,717,786$ 1,835,736$ 1,893,757$ 1,961,249$ 1,900,932$ 1,856,661$ 1,904,270$ 1,961,249$ 1,968,062$ 1,995,862$ 2,012,448$ 2,012,448$ Tangible common equity to tangible assets (k)/(l) 7.56% 7.59% 7.91% 8.54% 8.07% 8.20% 8.51% 8.54% 8.74% 9.00% 9.32% 9.32% Net interest margin (tax equivalent) Net interest income 52,542$ 57,631$ 56,869$ 59,981$ 13,812$ 15,239$ 15,229$ 15,701$ 16,017$ 16,707$ 17,403$ 50,127$ Tax equivalent adjustment 939 940 629 227 57 57 59 54 49 54 57 160$ Tax equivalent net interest income (m) 53,481$ 58,571$ 57,498$ 60,208$ 13,869$ 15,296$ 15,288$ 15,755$ 16,066$ 16,761$ 17,460$ 50,287$ Average earning assets (n) 1,629,299$ 1,647,151$ 1,766,240$ 1,782,241$ 1,787,955$ 1,763,917$ 1,757,184$ 1,800,332$ 1,829,989$ 1,841,112$ 1,876,730$ 1,848,057$ Net interest margin (tax equivalent) (m)/(n) 3.28% 3.56% 3.26% 3.38% 3.12% 3.49% 3.46% 3.48% 3.56% 3.65% 3.69% 3.64% Efficiency Ratio Noninterest expense, as reported 47,764$ 43,145$ 50,244$ 49,642$ 12,881$ 12,364$ 12,313$ 12,084$ 12,577$ 12,976$ 12,986$ 38,539$ Less: FHLB penalty, gross (2,368) - - - - - - - - - - - Less: Contribution (1,000) - - - - - - - - - - - Less: Settlement expense (3,300) - - - - - - - - - - - Less: Branch closure expenses 623 562 562 - - - - - - - Noninterest expense, adjusted (o) 41,096$ 43,145$ 49,621$ 49,080$ 12,319$ 12,364$ 12,313$ 12,084$ 12,577$ 12,976$ 12,986$ 38,539$ Net interest income 52,542$ 57,631$ 56,868$ 59,981$ 13,812$ 15,239$ 15,229$ 15,701$ 16,017$ 16,707$ 17,404$ 50,128$ Noninterest income 20,714 17,906 14,471 19,827 4,875 4,841 5,053 5,058 4,914 5,087 5,335 15,336 Less: Insurance reimbursement (1,375) - - - - - - - - - - - Less: Securities loss (4,214) - - - - - - - - - Tax equivalent adjustment 939 940 629 227 57 57 59 54 49 54 57 160 Total tax equivalent revenue (p) 72,820$ 76,477$ 76,182$ 80,035$ 18,744$ 20,137$ 20,341$ 20,813$ 20,980$ 21,848$ 22,796$ 65,624$ Efficiency ratio, as adjusted (o)/(p) 56.44% 56.41% 65.12% 61.31% 65.71% 61.39% 60.52% 58.05% 59.95% 59.39% 56.97% 58.73%