UNITED STATES
SECURITIES AND EXCHANGE COMMISSION
Washington, D.C. 20549
Form 6-K
REPORT OF FOREIGN PRIVATE ISSUER
PURSUANT TO RULE 13a-16 OR 15d-16
UNDER THE SECURITIES EXCHANGE ACT OF 1934
For the month of September 2025
Commission File Number 001-42819
SAYONA MINING LIMITED
(Translation of registrant’s name into English)
Level 28,
10 Eagle Street
Brisbane, Queensland 4000
Australia
(Address of principal executive office)
Indicate by check mark whether the registrant files or will file annual reports under cover of Form 20-F or Form 40-F.
Form 20-F x Form 40-F ¨
Sayona Mining Limited (the “Registrant”) is filing the following exhibits on this Report on Form 6-K, each of which is hereby incorporated by reference:
Exhibit
SIGNATURE
Pursuant to the requirements of the Securities Exchange Act of 1934, the registrant has duly caused this report to be signed on its behalf by the undersigned, thereunto duly authorized.
| SAYONA MINING LIMITED | ||
| Date: September 16, 2025 | By: |
/s/ Dylan Roberts Name: Dylan Roberts |
| Title: Company Secretary and General Counsel | ||
Exhibit 99.1

NAL EXPANSION SCOPING STUDY CONFIRMS LOWER COSTS AND STRONG RETURNS
North American lithium producer Sayona Mining Limited (“Sayona”) (ASX:SYA; NASDAQ:ELVR; OTCQB:SYAXF) announced today outcomes of a Scoping Study for Expansion of the existing North American Lithium (NAL) operation, delivering additional annual concentrate production and reduced unit operating costs.
Highlights
| · | Process plant design feed rate increased from 4,200 tonnes per day (tpd) to 6,500 tpd; average Life of Mine (LOM) recovery of 71.2%; spodumene concentrate at grade of 5.4% Li2O. |
| · | The expansion project provides a total project post-tax NPV(8%) of C$1,284M, an increase of C$479M versus the base case NPV. |
| · | Incremental post-tax net cash flow of C$837M over the base case; IRR of 26.4% and payback of 46 months. |
| · | Annual nominal SC5.4 production rate of 315 ktpa following ramp-up of the expansion. |
| · | C1 unit cost of C$759/t (US$562/t)1 and AISC of C$920/t (US$681/t)1 once the expansion is fully operational vs base case C1 of C$935/t (US$692/t)1 and AISC of C$1,128/t (US$835/t)1. |
| · | Initial capex of C$366M, (US$270M)1. Construction forecast to be complete by end CY29. |
| · | The Company’s existing NAL Ore Reserves solely underpin the NAL Expansion production profile with a revised life of mine of 24 years. |
Sayona’s Chief Executive Officer and Managing Director, Lucas Dow, said: “The results of this Scoping Study mark another important milestone in Sayona’s strategy to build a long-life, low-cost lithium operation at North American Lithium. The study clearly demonstrates the strong economic case for expansion, with higher concentrate production, reduced unit costs and robust returns across a 24-year mine life.
“By incorporating a second concentrator line and leveraging flowsheet enhancements, we have been able to target improved recoveries and enhanced flexibility in plant operations. The flowsheet enhancements are driven by the deep operational knowledge gained through our recent path to record production. The ability to stagger maintenance shutdowns across two lines underpins overall plant availability of 92%, reinforcing our capacity to deliver consistent and reliable output.
“This expansion will allow Sayona to increase spodumene concentrate production to more than 300,000 tonnes per annum, further strengthening our position as North America’s leading hard-rock lithium producer. Importantly, this growth is being achieved using our existing Ore Reserves, highlighting the quality and scale of the NAL resource base.
“Looking ahead, we are confident that this project will continue to generate significant value for our shareholders, local communities and stakeholders. As global demand for lithium accelerates, Sayona is well positioned to play a pivotal role in supplying the critical materials needed for the clean energy transition.”
1 Converted at CAD/USD = 0.74

Scoping Study Highlights
Analysis of the financial model on the key economic assumptions indicates that the Project is robust in terms of operating costs and capex. The Project is most sensitive to changes in commodity prices, exchange rates, and recoveries.
The Project demonstrates robust operational and financial metrics, with the key Project assumptions and outputs shown in the tables below:
Table 1 – Main financial assumptions and results summary for the NAL Expansion Project
| Parameters | Base | Expansion | ||||||||
| Average Price 6% Li2O1 | USD$/t | $ | 1,387 | $ | 1,392 | |||||
| Life of mine (from 2025) | yrs | 35 | 24 | |||||||
| Total Waste | Mt | 337 | 336 | |||||||
| Total Ore | Mt | 47 | 47 | |||||||
| Strip Ratio | - | 7.1 | 7.1 | |||||||
| Average Annual ROM | Mt/y | 1.3 | 2.0 | |||||||
| Average Feed Grade | % Li2O | 1.11 | % | 1.11 | % | |||||
| LOM 5.4% Li2O Produced | Mt | 6.75 | 6.93 | |||||||
| Average Annual 5.4% Li2O production | kt/y | 192 | 315 | |||||||
Table 2 – Project Economics
| Project Economics | Base | Expansion | ||||||||
| LOM C1 Cost Concentrate | C$/t conc | 954 | 799 | |||||||
| LOM AISC | C$/t conc | 1,154 | 974 | |||||||
| C1 Cost of Concentrate | C$/t conc | 935 | 759 | |||||||
| AISC | C$/t conc | 1,128 | 920 | |||||||
| Total SUSEX | C$M | 512 | 517 | |||||||
| Total initial CAPEX | C$M | - | 366 | |||||||
| NPV (8%) (post-tax) | C$M | 805 | 1,284 | |||||||
| IRR Expansion (post-tax) | % | - | 26.4 | % | ||||||
| Payback (post-tax) | Months | - | 46 | |||||||
1 Average LOM SC6 pricing may vary between the cases due to longer mine life at the long-term US$1,350 price for the base case (2040 and beyond).
|
|
Sayona Mining Limited |
Notes:
| · | All costs and sales are presented in constant 2025 CAD, with no inflation or escalation factors considered. |
| · | $M = millions of dollars. |
| · | The financial analysis was performed on existing Ore Reserves as outlined in this report. |
| · | The valuation calculations are unlevered. |
| · | The average metallurgical recovery over the LOM is 71.2% for the expansion and 69.2% for the base case due to improvement in the mill flowsheet specifically attributable to ore-sorting and wet high-intensity magnetic separator (WHIMS) improvements. |
| · | Plant availability a is calculated at 92% given the flexibility introduced in the circuit and improvements in the design versus the base case plant availability of 89%. |
| · | Tonnes of concentrate are presented as dry metric tonnes. |
| · | An exchange rate of 0.74 CAD/USD was fixed over the LOM for the Project. |
| · | The average 6% Li2O concentrate price is based on a market analysis from Benchmark Mineral Intelligence for Q1 2025 as described in the market section and varies over the LOM from US$1,320/t to US$1,925/t. |
| · | Average LOM SC6 pricing may vary between the cases due to longer mine life at the long-term US$1,350 price for the base case (2040 and beyond). |
| · | A discount rate of 8% was used for the base case and expansion scenarios. |
| · | Net Cash Flow and valuation calculations include investment tax credit on CAPEX. |
| · | The numbers have been rounded. Any discrepancy in the totals is due to rounding effects. |
Cautionary Statements
The Scoping Study discussed herein has been undertaken to determine the feasibility of an expansion production plant constructed adjacent to the existing NAL operation. The Scoping Study is a preliminary technical and economic study of the feasibility of an expansion development of the NAL Operation. The Scoping Study is based on low-level technical and economic assessments, and is insufficient to provide assurance of an economic development case at this stage
The Scoping Study evaluation work and appropriate studies have provided Scoping level estimates of cost and rates of return. The production target underpinning financial forecasts included in the Scoping Study are based solely upon current Ore Reserves estimated in the Announcement (See Sayona ASX announcement dated 27 August 2025).
The Scoping Study is based on the material assumptions outlined elsewhere in this announcement. These include assumptions about the availability of funding. There is no certainty that the Project will be able to be funded when needed (nor any certainty as to the form such funding may take, such as disclosed in this announcement). It is also possible that such funding may only be available on terms that dilute or otherwise affect the value of the Company’s shares. While Sayona considers all of the material assumptions to be based on reasonable grounds, there is no certainty that they will prove to be correct or that the range of outcomes indicated by the Scoping Study will be achieved. This announcement contains forward-looking statements. Sayona has concluded it has a reasonable basis for providing the forward-looking statements included in this announcement. However, a number of factors could cause actual results, or expectations to differ materially from the results expressed or implied in the forward-looking statements. Given the uncertainties involved, investors should not make any investment decisions based solely on the results of the Scoping Study and are cautioned not to place undue reliance on the Scoping Study or the production targets referred to in this announcement.
|
|
Sayona Mining Limited |
Overview
The North American Lithium operation is a hard-rock lithium mining and concentration facility located in La Corne, within the Abitibi-Témiscamingue region of Quebec, Canada. NAL was successfully restarted in March 2023 and is currently permitted for 4,500 tpd of production.
The current processing operation consists of three distinct processing areas:
| · | Crushing and ore sorting of the ROM ore to produce an upgraded plant feed for downstream processing. |
| · | A spodumene concentrator producing a saleable spodumene concentrate using grinding, magnetic separation and flotation. |
| · | Dewatering of the final spodumene concentrate and the concentrator tailing material. |
The NAL process plant expansion is designed to increase the overall plant capacity to a design rate of 6,500 tpd representing a 44% increase versus the current permitted rate of 4,500 tpd. This will be achieved by:
| · | Replacement of the existing crushing and ore sorting area with a new circuit capable of processing 6,800 tpd of ROM ore. Crushed ore will be conveyed from the crushing and ore sorting area to a covered crushed ore stockpile with 15,000 tonnes live storage. The stockpile is designed to be equipped with 2 reclaim tunnels, each with 2 feeders and conveyors, providing feed to Concentrator 1 (existing) and Concentrator 2 (new). |
| · | The addition of a second concentrator (Concentrator 2) to be operated in parallel to the existing concentrator will enable a combined concentrator process rate of 6,500 tpd of feed using grinding, desliming, magnetic separation and spodumene flotation. |
| · | Additional concentrate filters, and replacement of the existing tails dewatering area with a new tailings thickener receiving tail streams from both the existing Concentrator 1 and new Concentrator 2. |
| · | Redundancy in existing WHIMS circuit is achieved by adding a third WHIMS. |
| · | Concentrate storage facility integrated into the existing plant building combining flows of Concentrator 1 and new Concentrator 2, improving on current plant concentrate rehandling. |
Property Status
The NAL Expansion Project properties (the “Properties”) are situated in the La Corne Township in the Abitibi-Témiscamingue region in the Province of Québec, Canada (Figure 1).
Site Access and Existing Infrastructure
The Project is located approximately 38km southeast of Amos, 15km west of Barraute and 60km north of Val-d’Or in the Province of Québec, Canada. The site is accessible by provincial Highway 111, connecting Val-d’Or and Amos, or alternatively by provincial Highway 397, connecting Val-d’Or and Barraute. An all-weather secondary road, known as Route du Lithium, connecting the site to the Val-d’Or – Amos highway, which was used to traverse the Property and which constrained pit operations, has now been relocated to avoid the mining area. The site is also accessible from Mont-Vidéo, through an all-weather road that connects further east to the Val-d’Or – Barraute highway.
The site is approximately 550km north of Montréal and is serviced by road, rail, and air. The town of Val-d’Or, with a population of approximately 32,750 residents (Canadian Census, 2021), is located 60km south of the Property, along the provincial Highway 111. Since Val-d’Or was founded in the 1920s, it has been a mining service centre. Val-d’Or is one of the largest communities in the Abitibi region and has all major services, including an airport with scheduled service from Montréal. Canadian National (CN) railway line is about 49km east of the Property, connecting east through to Montréal and west to the North American rail network. Val-d’Or is a 6-hour drive from Montréal, and there are daily bus services between Montréal and the other cities and towns in the Abitibi region.
The town of Amos, with a population of approximately 12,675 residents (Canadian Census, 2021), is located approximately 38km northwest of the NAL site. Amos is served by highways 109, 111, and 395 and the Amos/Magny airport.
|
|
Sayona Mining Limited |
A high-voltage power line (120 kV) passes approximately 2km to the west of the Property and a 25 kV electric line, running along the Route du Lithium, services the Mont-Vidéo ski and recreation area.

Figure 1 – NAL Property Location
Geology and Mineralisation
North American Lithium’s pegmatite dykes have been delineated over a strike length of approximately 3,550m and to a vertical depth of approximately 700m. Dykes have variable widths up to 70m. The model comprises 117 mineralised dykes which are generally more than 2m in thickness and open at depth (Figure 2).
The project is located in the region of The Archean Preissac-Lacorne syn- to post-tectonic intrusion that was emplaced in the southern Volcanic Zone of the Abitibi Greenstone Belt of the Superior Province of Québec. The rocks are split between granodiorite, volcanics, gabbro and the mineralised pegmatites dykes that are cross-cutting the granodiorite and the volcanics rocks.
Volcanic rocks on the property are represented by dark green mafic metavolcanics and medium grey silicified intermediate volcanics. The mafic rocks are medium grey to dark grey-green, and cryptocrystalline to very fine grained. Both mafic and intermediate volcanic rocks are affected by moderate to strong pervasive silicification, minor chloritisation and patchy to pervasive lithium alteration.
The granodiorite is medium grey to greenish grey, massive, coarse grained to porphyritic, and exhibits a salt-pepper appearance. The main mineral constituents are light grey to greenish white plagioclase (40-45 vol%), dark green to black amphibole, most likely hornblende (15-20 vol%), mica (20 vol%), represented by biotite and muscovite, grey quartz (10-15%vol) and minor epidote, chlorite and disseminated sulphides.
|
|
Sayona Mining Limited |

Figure 2 - Plan view illustrating the pegmatite dykes, the host rock and the 2025 Mineral Resource Estimate pit for the North American Lithium operation
|
|
Sayona Mining Limited |
Mineral Resources and Ore Reserves
The Scoping Study production schedule is solely based upon current NAL Ore Reserves as at June 30 2025.
The current Mineral Resource Estimate and Ore Reserve estimate are presented in Table 3 and Table 4 below. The Mineral Resource and Ore Reserve estimates were prepared by Competent Persons in accordance with the 2012 JORC Code.
Table 3 – North American Lithium – Mineral Resource Estimates (0.60% Li2O cut-off grade for the RPEEE pit and 0.70% Li2O cut-off grade for underground domain)
| Resource
Classification |
Method | Tonnes (Mt) | Li2O
Grade (%) |
Cut-Off Grade (%) | ||||||||||
| Indicated | Open Pit | 76.2 | 1.17 | 0.60 | ||||||||||
| Inferred | Open Pit | 8.6 | 1.13 | 0.60 | ||||||||||
| Indicated | Underground | - | - | - | ||||||||||
| Inferred | Underground | 10.3 | 1.01 | 0.70 | ||||||||||
| Total | 95.0 | 1.15 | ||||||||||||
The North American Lithium Ore Reserves have been estimated for a total of 48.6Mt of Proven and Probable Ore Reserves at an average grade of 1.11% Li2O, which is comprised of 0.3Mt of Proven Ore Reserves at an average grade of 1.01% Li2O and 48.2Mt of Probable Ore Reserves at an average grade of 1.11% Li2O, as shown in Table 4 below.
Table 4 – North American Lithium – Ore Reserves estimate, as at June 30, 2025
| Resource
Classification |
Tonnes (Mt) | Li2O
Grade (%) |
Cut-Off Grade (%) |
Fe Grade (%)2 | ||||||||||||
| Proved Ore Reserves | 0.3 | 1.01 | 0.60 | 1.55 | ||||||||||||
| Probable Ore Reserves | 48.2 | 1.11 | 0.60 | 0.82 | ||||||||||||
| Total | 48.6 | 1.11 | 0.60 | 0.83 | ||||||||||||
The information on Mineral Resources and Ore Reserves are extracted from the announcement entitled “NAL Resources and Reserves Increases” published on the ASX on 27th August 2025 and is available to view on the Sayona’s website or on the ASX. The company confirms that it is not aware of any new information or data that materially affects the information included in the original market announcement and, in the case of estimates of Mineral Resources or Ore Reserves, that all material assumptions and technical parameters underpinning the estimates in the relevant market announcement continue to apply and have not materially changed. The company confirms that the form and context in which the Competent Person’s findings are presented have not been materially modified from the original market announcement.
2 It should be noted that the Fe Grade (%) column in Table 4 was erroneously mislabeled as Fe2O3 Grade (%) in the comparable table of ASX release “NAL Resources and Reserve Increases” dated 27 August 2025. Both tables are correct and unchanged in all other respects.
|
|
Sayona Mining Limited |
Mine Design
The NAL final pit design, as shown in Figure 3, was based on a pit optimisation assessment which determined the economic limits of the deposit. The in-pit haul road has been designed on the hanging wall side of the deposit to maximise ore recovery within the pit shell, provide more direct access to the waste storage facilities and ROM and to provide access for the final mining pushback. The final pit reaches a maximum depth of approximately 380m below topography.

Figure 3 – NAL Final Pit Design
The final pit design was subdivided into a total of seven mining phases, with the physicals and ore grades contained within each phase shown in Table 5. Special attention was given to the historical underground openings when setting the physical limits for every phase, with consideration taken to ensure that the phase walls did not intersect the old workings. The current life-of-mine plan will be clear of all historic undergrounds by the end of 2030.
The following criteria were applied during the phase design construction:
| · | Minimum mining width of 60m considered between phases on the surface and 40m at the phase base; |
| · | Ease of access to different mining areas; |
| · | Mining and processing production rate; and |
| · | Physical constraints posed by historical underground workings. |
|
|
Sayona Mining Limited |
Table 5 – NAL Physicals by Phase
| Item | Units | Total | Phase 2 |
Phase 3 |
Phase 4 |
Phase
5 |
Phase 6 |
Phase 7 |
Phase 8 |
||||||||||||||||||
| Total In-Pit | Mt | 395.3 | 0.3 | 39.9 | 55.0 | 55.9 | 47.3 | 182.1 | 14.7 | ||||||||||||||||||
| Waste Rock | Mt | 347.1 | 0.2 | 33.9 | 47.7 | 49.8 | 40.3 | 162.2 | 13.0 | ||||||||||||||||||
| ROM Ore | Mt | 48.2 | 0.1 | 6.1 | 7.4 | 6.1 | 7.0 | 19.9 | 1.8 | ||||||||||||||||||
| Lithium Grade | % Li2O | 1.11 | % | 1.34 | % | 1.11 | % | 1.09 | % | 1.05 | % | 1.22 | % | 1.10 | % | 1.04 | % | ||||||||||
| Iron Grade | % Fe | 0.82 | % | 0.58 | % | 0.92 | % | 0.91 | % | 0.85 | % | 0.75 | % | 0.79 | % | 0.71 | % | ||||||||||
| Strip Ratio | twaste : tore | 7.2 | 3.1 | 5.6 | 6.5 | 8.2 | 5.7 | 8.2 | 7.3 | ||||||||||||||||||
The mining solids, which formed the basis of the life-of-mine schedule, were developed using the following process:
| · | In-situ solids were generated within each phase, based on the 2025 Mineral Resource estimate geological model, including the modelled qualities for all ore solids. |
| · | The in-situ solids, which were as small as 1.25m x 1.25m x 5m, were reblocked to 5m x 5m x 5m solids. |
| · | The quantities and the qualities of the 5m x 5m solids were then assessed to calculate the mineable quantities of ore within in each solid: |
| o | All 5m x 5m x 5m solids which contain more than 30m3 (approximately one truckload) of indicated ore, were assessed for potential Reserves. Approximately 16.9% of in-situ indicated ore was excluded from the Reserves at this step. |
| o | The quantity of dilution applied to the indicated ore fluctuated between 0% and 40% depending on the percentage of ore contained within each 5m x 5m x 5m solid. Dilution accounts for ~15.3% of all mined Reserves. |
| o | The loss values applied to the indicated ore fluctuated between 0% and 25% depending on the percentage of ore contained within each 5m x 5m x 5m solid. An average 7.0% loss was incurred on all mined Reserves. |
| o | All indicated ore with an Li2O grade >= 0.60% after the application of loss and dilution were included in the Reserves. All other material was classified as waste, including all inferred and unclassified ore which was converted to waste. |
The quantities and qualities for each solid were then imported into Spry mine scheduling software for detailed scheduling and haulage modelling.
The life-of-mine schedule for the scoping study utilised similar class equipment that is currently operating at NAL, with 200t class excavators added to the fleet as required to assist with maintaining the required stripping quantities. The annual ore tonnes and ROM feed grades for Li2O and Fe are shown in Figure 4.
|
|
Sayona Mining Limited |

Figure 4 – Annual Ore Processing
Annual movements from each of the phases across the life-of-mine is shown in Figure 5.

Figure 5 – Annual Quantities by Phase
NAL Expansion Concentrator Feed and Production Profile
The Scoping Study production schedule is based solely upon current NAL Ore Reserves as at June 30 2025.
The NAL Expansion concentrator ore feed will be blended at the ROM to control Li2O grade and Fe contamination. The average head grade is 1.11% Li2O over the LOM. Figure 4 presents yearly head feed tonnage and grade over the LOM.
The NAL Expansion increases the total process plant throughput to approximately 2.2 Mtpa with a process plant availability of 92%. Based on the LOM Plan, the circuit will on average produce a nominal 315 ktpa of spodumene flotation concentrate, with a 71.2% Li2O recovery at a target product grade of 5.4% Li2O once the expansion circuit is fully operational.
|
|
Sayona Mining Limited |
Metallurgy
The NAL deposit has undergone extensive metallurgical testwork. Metallurgical recovery assumptions are based on historical metallurgical tests and test work completed during 2018 – 2023. Testwork programs began in 2008 to establish the metallurgical character of the orebody, and allow the development of a process flowsheet, testing of that flowsheet, evaluate the impact of head grade on performance and then produce the engineering data for plant design. This testwork occurred under the supervision of independent QPs and Sayona representatives.
The testwork evaluated a number of processing techniques including flotation, DMS, LIMS and ore sorting. The progression of this testwork took the form of batch scale tests looking at flotation, DMS and grindability leading to locked cycle tests flotation tests and then pilot scale continuous tests. WHIMS and DMS were not included in the original flowsheet based on the outcomes of the testwork. The testwork outcomes formed the design basis of the NAL concentrator that commenced operation in March 2013 but ceased operation in September 2014. This was principally due to higher than anticipated dilution of the ore with host rock, and lower than target spodumene recovery and concentrate grade.
Subsequent testwork programs were undertaken to characterise and mitigate the effect of the dilution including hardness testing and WHIMS testwork (on both plant samples and pegmatite samples of varying levels of dilution of the two major dilution host rocks). The impact of the WHIMS on flotation was also examined, and the final spodumene flotation concentrate was 6% Li2O at an estimated testwork recovery of 80 to 83%.
Modifications were made to the plant based upon this testwork with the addition of WHIMS units prior to flotation and additional ore sorting capacity on the feed. The plant was restarted in 2017 following these changes and consistently achieved concentrate grades of 5.4 to 6.0 % Li2O at recoveries from 55 to 70%. The plant subsequently shutdown due to market conditions prior to name plate capacity being achieved.
Further modifications were made to the plant prior to the restart in 2023 but these were focused on operational issues identified from the previous operation rather than underlying metallurgical issues relating to the ore. (i.e. capacity related).
The 2023 DFS testwork assessed NAL/Authier ore feed blends and the figure below summarises the spodumene concentrate grade vs testwork recovery curve (DFS 2023).

Figure 6 – 2023 DFS testwork grade-recovery curve
A comparison of the global Li2O recovery comparing the testwork recovery curve (without any industrial derating) against the NAL operational quarterly performance data (from Q3 FY24 to Q4 FY25) is presented below. The recent quarterly performance (Q4 FY25) with a spodumene concentrate grade of 5.2% Li2O at 73% global recovery is also shown. The expansion forecast recovery curve also includes the datapoint of 71.2% recovery at 5.4% Li2O concentrate grade.
|
|
Sayona Mining Limited |

Figure 7 – Li2O Grade Recovery Curve including NAL Quarterly Performance
Historical metallurgical testwork from the above described previous phases, along with current operational performance has been used as the basis for the NAL expansion scoping study.
Based on the previous laboratory testwork and current operational performance, an average global recovery of 71.2% at a spodumene concentrate grade of 5.4% Li2O has been applied across the NAL Mine Plan for the purposes of the scoping study.
The impact of ore sorters was analysed through statistical methods for impact on recovery from operating data. A recovery increase of 2% above the base case is included in the above 71.2% with additional ore sorting performance testing underway.
|
|
Sayona Mining Limited |
Mineral Processing and Flowsheet
The current NAL operation has a design capacity of 4,200 tpd with a permitted rate of 4,500 tpd of Run of Mine ore to produce spodumene concentrate. It consists of three distinct processing areas:
| · | Crushing and ore sorting on the ROM ore sorting to produce an upgraded plant feed for downstream processing |
| · | A spodumene concentrator producing a saleable spodumene concentrate using grinding, desliming, magnetic separation and flotation |
| · | Dewatering of the final spodumene concentrate and the concentrator tailing material. |
The NAL process plant expansion is designed to increase the overall plant capacity to a design rate of 6,500 tpd. This will be achieved by via:
| · | Replacement of the crushing and ore sorting area with a new circuit capable of processing 6,800 tpd of ROM ore. Crushed ore is conveyed from the crushing and ore sorting area to a covered crushed ore stockpile with 15,000 tonnes live storage. The stockpile is equipped with 2 reclaim tunnels, each with 2 feeders and conveyors, providing feed to Concentrator 1 (existing) and Concentrator 2 (new). |
| · | The addition of a second concentrator (Concentrator 2) to be operated in parallel to the existing concentrator will enable a combined concentrator process rate of 6,500 tpd of feed using grinding, desliming, magnetic separation and spodumene flotation. |
| · | Additional concentrate filters, and replacement of the existing tails dewatering area with a new tailings thickener receiving tail streams from both the existing Concentrator 1 and new Concentrator 2. |
| · | Redundancy in existing WHIMS circuit is fulfilled by adding a third WHIMS. |
| · | Concentrate storage facility integrated into the existing plant building combining flows of Concentrator 1 and new Concentrator 2, improving on current plant concentrate rehandling. |
The upgraded design will be based on the existing facility, and as such the lithium recovery anticipated following this expansion is 71.2% (at SC5.4 grade) and based on current plant performance and improvements of ore sorting and WHIMS. Future testwork and increased lithium recovery initiatives are planned for the next stage of the project.
The NAL project expansion is designed to increase the circuit capacity, through the addition of new process equipment, and increase the production of saleable spodumene flotation concentrate.
The key process areas of the post expansion facility are as follows:
| · | Primary Crushing and Secondary Crushing (New) |
| · | Ore Sorting (New) |
| · | Tertiary Crushing and Fine Ore Storage (New) |
| · | Concentrator 1 (Existing) |
| o | Grinding and desliming |
| o | Magnetic Separation with addition of a redundant WHIMS (New) |
| o | Spodumene flotation |
| · | Concentrator 2 (New/Expansion) |
| o | Grinding and desliming |
| o | Magnetic Separation |
| o | Spodumene flotation |
| · | Spodumene Concentrate Dewatering – Concentrator 1 (Existing) |
| · | Spodumene Concentrate Dewatering – Concentrator 2 (New/Expansion) |
| · | Addition of concentrate storage and loadout facility (New/Expansion) |
| · | Tailings Thickening and storage at TSF (New/Expansion) |
|
|
Sayona Mining Limited |
The table below provides a high-level overview of the main design criteria for the NAL concentrator expansion.
Table 6 – General Process Design Criteria
| Criterion | Unit | Base | Expansion | |||||||||
| Crushing Plant Availability | % | 65 | 65 | |||||||||
| Ore Sorting Plant Availability | % | 65 | 65 | |||||||||
| Concentrator Availability | % | 89 | 92 | |||||||||
| Total ROM Crusher Feed | tpd | 4,385 | 6,800 | |||||||||
| Concentrator 1 Capacity (Existing) | tpd | 4,200 | 4,200 | |||||||||
| Concentrator 2 Capacity (New) | tpd | - | 2,300 | |||||||||
| Total Concentrator Capacity | tpd | 4,200 | 6,500 | |||||||||
| Total Concentrator Capacity (nominal) | Mt/y | 1.4 | 2.2 | |||||||||
| Concentrator Feed Grade | % Li2O | 1.11 | 1.11 | |||||||||
| Target Spodumene Concentrate Grade | % Li2O | 5.4 | 5.4 | |||||||||
| Overall Lithium Recovery | % Li2O | 69.2 | 71.2 | |||||||||
Note: all parameters are design rating unless noted otherwise
The post expansion block flow is given below in Figure 8 and Figure 9.
|
|
Sayona Mining Limited |

Figure 8 – Simplified Block Flow
A ROM blend feeds the coarse ore to the Primary Crusher at a top size of 900mm, and the crushed ore at a nominal Closed Size Setting (CSS) of 130mm is transferred to the Oversize Grizzley via the Primary Conveyor which screens the ore at 90mm. The +90mm oversize from the Grizzley is fed to the Secondary Crusher and the resultant re-crushed ore at a nominal CSS of 90mm is discharged onto the Primary Conveyor to join the material from the Primary Crusher and thus transferred to the Oversize Grizzly for rescreening.
The under-size material from the grizzly is transferred to Ore Sorting. Crushed material from Primary and Secondary Crushing is fed to the Sorter Screen where it is separated by size into 4 products:
| · | Material from the top deck (-90mm + 75mm) is transferred to the Primary Sorter Screen and wet screened. Washed over size material is fed to the Primary Sorter, while wet screen undersize nominally -4mm in size is transferred as a slurry to the existing Concentrator 1 rod mill. |
| · | Material from the second deck (-75mm + 50mm) is transferred to the Secondary Ore Sorter |
| · | Material from the bottom deck (-50mm + 25mm) is transferred to the Tertiary Ore Sorter |
| · | The screen undersize (-25mm) reports to the Fine Ore Conveyor for transfer to the Covered Stockpile. |
| · | Rejects from all sorters are conveyed to the rejects stockpile to be loaded by front end loader onto trucks for disposal with the mine waste. |
The sorter products are fed to the tertiary crushing circuit which consists of the Tertiary Crusher (nominal CSS of 18mm) in closed circuit with the Tertiary Crusher Screen (cut size = 20mm). The sorter stream is introduced to the circuit at the feed to the Tertiary Crusher Screen. Screen oversize is transferred to the Tertiary Crusher and the crushed material from the Tertiary Crusher returned to the screen.
|
|
Sayona Mining Limited |
The existing concentrator process flow is as follows:
| · | The grinding circuit consists of primary open circuit rod mill followed by a ball mill working in a closed circuit with 6 x Stack Sizer Screens. The rod mill is fed via conveyor at a design rate of 4,200 tpd by the dedicated reclaim feeders on the Covered Crushed Ore Stockpile and also receives the screen undersize slurry from the Primary Sorter Screen. |
| · | The Rod Mill product is pumped to the Ball Mill and the Ball Mill product is pumped to the Stack Sizer Screens. The oversize with a nominal P80 of 970 microns is returned to the ball mill. The undersize at a nominal P80 of 200 microns is deslimed by 17 x Primary Deslime Cyclones to remove slime material (nominal overflow cut size D50 = 10µm). The slime material reports to the Tailings Thickener. |
| · | The deslimed underflow from the above is diluted with process water and then pumped to a low-intensity magnetic separator (“LIMS”) followed by 2 x wet high-intensity magnetic separator (“WHIMS”) in parallel (2 Duty/1 Standby (new)). The magnetics extracted by both stages are combined and pumped to the Tailings Thickener. |
| · | The non-magnetic slurry from the above undergoes high-intensity conditioning at 55% w/w solids with a fatty acid collector in the Rougher Conditioning Tanks, 2 x 48 m3 tanks in series. The conditioned slurry is fed to the feed box of the rougher flotation circuit via gravity. |
The expansion concentrator process flow is as follows:
| · | The circuit is fed via conveyor from the dedicated reclaim feeders drawing material from underneath the Covered Crushed Ore Stockpile at a design rate of 2,300 tpd. |
| · | The grinding circuit consists of a single stage ball mill working in a closed circuit with 4 x Mill Cyclones targeting a grind size of P80 of 200 microns. Mill Cyclone underflow returns to the ball mill. Mill Cyclone overflow is deslimed by 12 x Primary Deslime Cyclones to remove slime material. The slime material reports to the Tailings Thickener. |
| · | The deslimed Primary Deslime Cyclone Underflow from the above is diluted with process water and pumped to a low-intensity magnetic separator (“LIMS”) followed by 2 x wet high-intensity magnetic separator (“WHIMS”) in parallel (1 Duty/1 Standby). The magnetics extracted by both stages are combined and pumped to the Tailings Thickener. |
| · | The non-magnetic slurry from the above undergoes high-intensity conditioning with a fatty acid collector at 55% w/w solids in the Rougher Conditioning Tanks, 2 x 26 m3 tanks in series. The conditioned slurry is fed to the feed box of the rougher flotation circuit via gravity. |
Spodumene concentrate is then pumped to the Concentrate Storage Tank which serves as a buffer between the upstream process and the downstream filtration. The spodumene concentrate slurry from the Storage Tank is fed to Concentrate Filters 2 and 3, two 32 m2 horizontal belt filters operated in parallel which dewater the concentrate down to a filter cake of nominally 8% moisture. This cake is discharged directly into the Concentrate Storage building.
The Tailings Thickener, a high-rate thickener receives the following tail streams from the Existing Concentrator (Concentrator 1) and the Expansion Concentrator (Concentrator 2).
| · | Slime Material from Primary Desliming |
| · | Magnetic Materials from Magnetic Separation |
| · | Slime Material from Scavenger Desliming |
| · | Scavenger Tailings |
| · | Cleaner 1 Tailings |
These combined tailings are thickened to 50% w/w solids with the aid of an anionic flocculant and the underflow is then pumped to the TSF for disposal. The overflow reports to Process Water Storage for reuse within the operation.
|
|
Sayona Mining Limited |

Figure 9 – Simplified Process Flow
|
|
Sayona Mining Limited |
Concentrator Production and Recoveries
The Expansion is scheduled to produce a design rate of 6,500 tpd of blended ore.
The crushing and sorting area of the plant, which includes primary, secondary, and tertiary crushing and screening, as well as ore sorting, is designed to operate with an availability of 65%. From the crushed ore storage silo, 6,500 tpd at 92% plant availability are then fed to the concentrator, which includes grinding mills, desliming, magnetic separation and flotation circuits, which make up the concentrator portion of the plant. The concentrator operates on a 24-hour per day and 7 days per week basis.
The expansion circuit provides additional operational flexibility including:
| · | 15,000 tonne live capacity within the crushed ore stockpile. Additional capacity is available with inclusion of a loader within the crushed ore dome and the existing crushed ore storage for longer outages. |
| · | The crushed ore storage dome can feed both the existing and expansion circuits which may improve the scheduling of planned outages while minimising plant downtime. |
For the purposes of this Scoping Study, an overall plant availability factor of 92% has been adopted for the expansion case. This reflects the operational strategy whereby maintenance shutdowns are scheduled on a staggered basis, allowing one processing line to continue operating while the alternate line undergoes planned maintenance. Further detailed availability analysis will be undertaken in the next phase.
Ramp-up for the expansion circuit is undertaken over a 9-month period with 60% of aggregate concentrate production over this period. Impacts for the existing circuit are anticipated to be minimal and included within the ramp up concentrate assumptions. Expansion to 6,500 tpd will require a series of studies and authorisations to be issued by government authorities. There is no indication at this time that these authorisations will not be obtained.

Figure 10 – Preliminary Layout – Expansion
|
|
Sayona Mining Limited |
Tailings Storage Facilities
The mine plan for NAL forecasts mining operations continuing beyond the capacity of the existing Tailings Storage Facility (TSF) No. 1. The current site includes a conventional tailings pond (TSF-1) as part of the tailings management infrastructure, located 500m south of the processing plant.
A second TSF (TSF-2) is required to encompass the current base case LOM. TSF-2 was originally envisaged as a dry tailings deposition management concept. After conducting an analysis of different mining residue disposal technologies, the choice of wet disposal was previously confirmed for the existing NAL operation over the duration of the existing LOM.
The recently published Ore Reserves require new waste management facilities (e.g., waste rock and tailings) to accommodate the volumes associated to these new reserves. The additional tailings will be managed in a new tailings facility (TSF-3). A preliminary location and design for TSF-3 has been undertaken for the purposes of the scoping study. The final location of the tailings and waste rock management facilities will be confirmed through a detailed Variant Analysis that will be conducted in the next phase of study. There is no indication at this time that it will be unfeasible to obtain the necessary approvals from government authorities.
Total tailings to be managed by the facilities over LOM is 41.8Mt.
Results from previous geochemical studies showed that waste rock is neither Acid Rock Draining (ARD), nor Metal Leaching (ML); therefore, no indication that special requirements are required by the Ministère de l’Environnement, de la Lutte contre les Changements Climatiques, de la Faune et des Parcs (MELCCFP) for stockpiling and water management.
Additional tailings and waste rock characterisation testwork is planned during the next phase of the project.
The plan view for the tailings storage facilities are displayed in Figure 11.

Figure 11 – Plan view – Preliminary Tailings storage facility locations
|
|
Sayona Mining Limited |
Infrastructure
Site infrastructure at the NAL operation is established and operating, the expansion requires additional infrastructure as outlined below.
The current site infrastructure includes:
| · | Open pit. |
| · | Processing plant and ROM ore pad. |
| · | Waste rock and overburden storage areas (WR#2, WR#3 & OB#1). |
| · | Conventional tailings pond (TSF-1). |
| · | TSF-2 (future). |
| · | Administration facility, including offices and personnel changing area (dry). |
| · | Workshop, tyre change, warehouse, and storage areas. |
| · | Fuel, lube, and oil storage facility. |
| · | Reticulated services, including power, lighting and communications, raw water and clean water for fire protection, process water and potable water, potable water treatment plant, sewage collection, treatment, and disposal. |
| · | Crushed ore dome. |
| · | Access roads. |
| · | Water management infrastructures. |
Additional infrastructure required for the expansion include:
| · | Expansion of the open pit. |
| · | New crushing and ore sorting circuit including crushed ore dome. |
| · | New grinding, magnetic separation and flotation. |
| · | Concentrate dewatering filters. |
| · | Tailings thickening. |
| · | Concentrate storage building. |
| · | Additional mechanical workshop, operation room, and supervisor offices. |
| · | Additional tailings management facilities: |
| o | TSF#3. |
| o | Additional waste stockpile area (HS#4) and associated water management structures. |
Multi-service buildings:
| · | Additional offices, engineering, administration etc. |
| · | Additional capacity for the mine change rooms, showers and ablutions. |
| · | Additional mine offices and mining dispatch control room. |
Mine maintenance shop:
| · | Two additional mining service bays. |
| · | Additional warehouse storage. |
| · | Additional supervisory and administration offices. |
| · | Wash bay. |
Auxiliary buildings:
| · | Warehouse domes. |
| · | Relocation of the mine fuel depot and additional capacity. |
|
|
Sayona Mining Limited |
Power Supply and Distribution
Power for the Project is taken at 120 kV from transmission line No. 1301, which is owned by the provincial utility company, Hydro Québec. This transmission line runs on the west side of the Project site and the spur feeding the plant is approximately 600m long.
The expansion infrastructure will be powered with electrical capacity originally allocated for the carbonate plant.
Water Management
The Project has no infrastructure in place to draw water from any external source for processing purposes and the expansion does not require the installation of water drawing infrastructure. Groundwater and run-off from the mine pit is recovered for use as fresh water in the process plant. All water used in the concentrator is recycled internally or is reclaimed from the tailings ponds, where levels must be managed seasonally.
To support the NAL expansion, a site-wide water balance was performed based on major infrastructure expansion footprint. The water balance shows an excess of water on the overall site for all stages of development. Water infrastructure (ponds and ditches) was added to the project to ensure proper environmental and operational water management.
Environment and Social
The NAL project has existing environmental permits for mining operations including the disposal of waste rock, storage of tailings, drawing water for process and the release of treated water to the environment. Sayona is currently operating in accordance with existing approvals by provincial and federal authorities. The concentrator has approval for throughput of 4,500 tpd.
The extension of mineral resources under Lac Lortie will require the approval from the Ministère des Ressources naturelles et des Forêts (MRNF) for the expansion of the existing mining lease. The MRNF will require an update to the Closure and Rehabilitation Plan and the update of the approval by the Ministère de l’Environnement, de la Lutte contre les Changements Climatiques, de la Faune et des Parcs (MELCCFP) of the environmental authorisation. The two authorisations must be obtained before the extension mining lease can be granted. Also, the process for authorising the extension of the mining lease includes consultation with the Communities of Interest (COI). This process includes public consultations, including First Nations, that will allow the communities to provide feedback regarding the expansion project.
The Department of Fisheries and Oceans Canada (DFO) will require that effects of mining activities on the fish habitat in Lac Lortie be offset by an approved habitat compensation project. Consultation will be undertaken with First Nations in design of the compensation project.
The NAL site is located in a recreational zoning class of the Municipality of La Corne as defined under local by-laws. This zoning allows mining activities however, consultation will be undertaken to ensure community acceptance with the aim to minimise impact on local recreational and tourism activities. Any possible effect on the Harricana moraine will be documented.
The increase in ore processing capacity is below the threshold for triggering both provincial and federal impact assessments. Both the plant’s processing capacity and the footprint of the new mining infrastructure are below the 50% increase threshold allowed under Canadian law. The environmental impact of additional mining activities (tailings management facilities, mine waste rock dump, etc.) will be evaluated during the next phase of studies.
A former tailings facility, under the responsibility of the Province of Quebec since 2010, is located within the mineral resource footprint. The management of tailings from previous mining operations are subject to specific conditions, depending on their geochemical characteristics. The MRNF has stated in 2010 that these tailings do not show acid rock drainage potential. However, the MELCCFP requirements for geochemical characterisation have increased since 2020 and a more comprehensive characterisation will be required.
|
|
Sayona Mining Limited |
Finally, the responsibility for historical infrastructure will be assessed and discussed with the MRNF as additional resources beyond current permits are accessed.
Project Schedule and Implementation
A preliminary project schedule was developed for the scoping study and is shown in Figure 12.
The project has identified an opportunity to accelerate the project timeline by moving directly to the Feasibility stage. This opportunity is currently under consideration and is not yet reflected in the project timeline.
Further development and detailed execution planning will be undertaken in the next phases.

Figure 12 – Indicative timeline
|
|
Sayona Mining Limited |
Capital (CAPEX) and Sustaining (SUSEX) Expenditures
Table 7 presents a summary of the capital costs including contingencies in millions of Canadian dollars ($M).
Table 7 – Summary of total expansion CAPEX by area
|
Area Currency: CAD |
CAPEX $M |
|||
| Direct Costs | ||||
| Infrastructure and Facilities | $ | 11.0 | ||
| Process Plant | $ | 172.8 | ||
| Indirect Costs | ||||
| Owner’s cost (including EPCM) | $ | 49.2 | ||
| Indirect costs | $ | 48.7 | ||
| TOTAL CAPEX | $ | 281.7 | ||
| Contingency (30%) | 84.5 | |||
| Total | $ | 366.2 | ||
Basis of Estimate
The estimate prepared is Class 5 Capital Cost Estimate (CCE) in line with the Association for the Advancement of Cost Engineering (AACE) with a nominal target accuracy range of -20/+35%. The level of estimation is supported by vendor quotation for major equipment and previous installation cost data at NAL for some items.
The estimate was developed from a combination of factoring from similar projects and more detailed estimating calculation in some areas. Equipment and material cost factors have been sourced from projects of similar scope and design with costs escalated where necessary.
The estimate was based on the following general approach:
| · | Major mechanical equipment costs for the expansion were obtained from vendor budget quotation. |
| · | Secondary and minor equipment was sourced from an in-house database for similar projects. |
| · | An estimate base date of July 2025. |
| · | An Estimate Base Currency of Canadian Dollars (CAD). |
| · | Project executed through EPCM delivery model. |
| · | All costs exclusive of escalation beyond the base date. |
| · | Exclusive of taxes. |
|
|
Sayona Mining Limited |
Sustaining Capital
Sustaining capital for the base case and expansion project was estimated using current operational budgets and factors of direct plant cost. Tailings SUSEX costs were derived using previous estimates and quantities applied over preliminary facility designs. The Expansion case includes additional sustaining costs for a second concentrator which are offset by the shorter mine life of this scenario.
Table 8 – Summary of sustaining capital
|
Area Currency: CAD |
Base $M | Expansion $M | ||||||
| TOTAL SUSTAINING CAPITAL | $ | 512 | $ | 517 | ||||
Operating Costs
The operating cost estimate (OPEX) for the base and expansion cases are calculated from NAL operating budgets. The base case includes a design feed rate of 4,200 tpd while the expansion case accounts for the associated increase in feed to 6,500 tpd.
The variation in costs under the base case relative to prior figures is primarily attributable to foreign exchange translation effects, inflation in labour and consumables, and the inclusion of cost, insurance and freight costs (CIF) under customer offtake arrangements. These cost increases have been partially offset by the inclusion of operational synergies.
The OPEX was developed in accordance with the requirement of a scoping level study with a nominal accuracy range of ±20%. The level of estimation is supported by actual operational information including salaries, consumables, maintenance costs and established contracts and therefore are more precise given this is a brownfield project.
The OPEX results represent annual steady state operations therefore no escalation or inflation is included within the estimate. A summary of the average LOM OPEX costs (all values in CAD$) and comparison between scenarios can be found in Table 9. OPEX costs are evaluated commencing as of Fiscal Year 2027.
Table 9 – Total OPEX Summary
| Item | Units | Base | Expansion | |||||||
| LOM | Yrs | 35 | 24 | |||||||
| Milling Rate | Mt/yr | 1.3 | 2.0 | |||||||
| Mining Cost (ore & waste) | C$/t mined | 8.9 | 7.6 | |||||||
| Processing Cost | C$/t milled | 42.2 | 35.4 | |||||||
| G&A | C$/t milled | 16.7 | 13.4 | |||||||
| Transport Cost | C$/t conc | 141.7 | 123.8 | |||||||
| Total OPEX | C$M | 7,150 | 6,062 | |||||||
| C1 Cost Concentrate | C$/t conc | 954 | 799 | |||||||
Principal drivers influencing C1 Cost reduction are driven by the following:
| · | 20% reduction in G&A per tonne processed resultant from relatively fixed costs between scenarios with adjustments required for additional head count, insurance and employee benefits. |
|
|
Sayona Mining Limited |
| · | 13% reduction in shipping costs per tonne concentrate directly related to increased movement of material and improvements in material handling on site with new concentrate loading facility reducing on site tramming of material and material loadout. |
| · | 16% reduction in Processing cost driven mostly by relative low increase in head count required (34% relative to plant increase of 55% capacity), addition of line power reticulation replacing diesel generators on site for pumping. Considering new crushing circuit capable of feeding new and existing plant reduction in current pre-crush facility costs are considered. Power costs and reagents have no impact between the scenarios as same unit rates are used. |
| · | 15% reduction in mining costs are estimated based on increased volume, use of larger shovels in waste and benefits from fixed management and administration costs relative to increased tonnage for both contractor and owner costs. |
Labour
All mine, processing plant and administration site staff personnel work 10-hour shifts on a 4 on / 3 off basis. Contracted mine operations will work 12-hour shifts. For the processing plant, operations and maintenance crews will work two 12-hour shifts. There will be four shift crews rotating on a 7 on / 7 off schedule.
Staffing requirements are built as bottom-up and based off existing operations. The main increases in labour between the base and expansion case are summarised from operational site roles. The plant increase covers the most significant increase which is attributable to additional operators for grinding and floatation extensions as well as increased maintenance (mechanical / piping / electrical / instrumentation). Mine technical services are augmented to cover increased throughput, assay treatment and geology support. G&A costs are impacted by an increase in site support for Health and Safety, Environment and Increased Surface and Warehousing support.
Table 10 – Staff and Hourly Count (Sayona Employees)
| Area | Base | Expansion | Change (%) | |||||||||
| G&A | 59 | 70 | 19 | % | ||||||||
| Plant | 125 | 168 | 43 | % | ||||||||
| Mine | 40 | 51 | 28 | % | ||||||||
| Total | 224 | 289 | 29 | % | ||||||||
Power
Power is estimated from current power consumption with rates as per contracted supply with Hydro Quebec scaled for the additional throughput. Power is calculated to account for $2.0 / t processed for both scenarios. In further studies the benefits of a complete load study will allow for closer estimate of power savings given the expansion.
Reagents
Reagent costs are calculated from NAL’s current operating contracts with consumptions escalated for the additional throughput.
|
|
Sayona Mining Limited |
Market and Lithium Price
The lithium market is projected to enter a deficit from 2030 onwards. From this point onwards there is an ever-growing deficit which will lead to either demand destruction or yet-to-be identified new supply coming online to bridge the supply gap (Figure 13).
It is forecast that the emerging deficit will push up lithium carbonate prices to a peak level in 2030 before prices retreat to the long-term incentive price by 2034. These prices will be sufficient to incentivise new supply to catch up with demand.
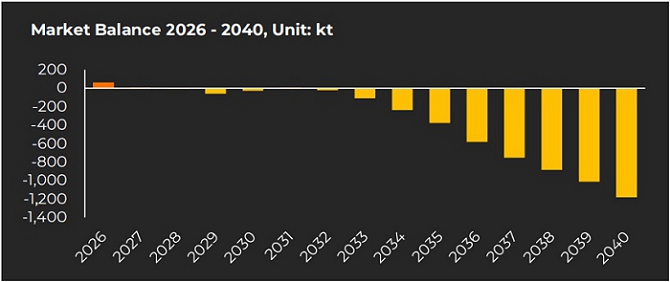
Figure 13 – Lithium Market Balance Forecast 2026 – 2040
Forecast lithium product sale prices for the Benchmark Mineral Intelligence (BMI) Q1 2025 base case scenario are shown in Figure 14. The average sale price of 6% spodumene concentrate in the BMI analysis averages approximately US$1,271 (base) and US$1,393/t (high) between 2026 and 2040.

Figure 14 – Lithium Product Price Forecast 2026 – 2040 (Base Case)
The scoping study utilises BMI Q1 2025 high price scenario and varies over the LOM from US$1,320/t to US$1,925/t with an SC6 price of US$1,350 adopted for years past the 2040 forecast period.
|
|
Sayona Mining Limited |
Recent spodumene price movements have been noted, however the commencement of production timeline for NAL Expansion aligns with medium-term product pricing.
Financial Analysis
The main highlights of the Project’s financial analysis are presented in Table 11 and Table 12. Financial Analysis was performed commencing as of Fiscal Year 2027.
Table 11 – Main financial assumptions and results summary for the NAL Expansion Project
| Parameters | Base | Expansion | ||||||||
| Average Price 6% Li2O | USD$/t | $ | 1,387 | $ | 1,392 | |||||
| Life of mine | yrs | 35 | 24 | |||||||
| Total Waste | Mt | 337 | 336 | |||||||
| Total Ore | Mt | 47 | 47 | |||||||
| Strip Ratio | - | 7.1 | 7.1 | |||||||
| Average Annual ROM | Mt/y | 1.3 | 2.0 | |||||||
| Average Feed Grade | % Li2O | 1.11 | % | 1.11 | % | |||||
| LOM 5.4% Li2O Produced | Mt | 6.75 | 6.93 | |||||||
| LOM Average Annual 5.4% Li2O | kt/y | 193.0 | 288.9 | |||||||
| Average Annual 5.4% Li2O production | kt/y | 192 | 315 | |||||||
Table 12 – Project Economics
| Project Economics | Base | Expansion | ||||||||
| Exchange Rate | CAD/USD | 1.35 | 1.35 | |||||||
| Mining Cost (ore and waste) | C$/t mined | 8.9 | 7.6 | |||||||
| Process cost | C$/t milled | 42.2 | 35.4 | |||||||
| G&A | C$/t milled | 16.7 | 13.4 | |||||||
| Transport Cost | C$/t conc | 141.7 | 123.8 | |||||||
| Total OPEX | C$M | 7,150 | 6,062 | |||||||
| LOM C1 Cost Concentrate | C$/t conc | 954 | 799 | |||||||
| LOM AISC | C$/t conc | 1,154 | 974 | |||||||
| C1 Cost of Concentrate | C$/t conc | 935 | 759 | |||||||
| AISC | C$/t conc | 1,128 | 920 | |||||||
|
|
Sayona Mining Limited |
| Project Economics | Base | Expansion | ||||||||
| Total SUSEX | C$M | 512 | 517 | |||||||
| Total initial CAPEX | C$M | - | 366 | |||||||
| Net Cash Flow (pre-tax) | C$M | 3,584 | 4,626 | |||||||
| NPV (8%) (pre-tax) | C$M | 1,170 | 1,798 | |||||||
| NPV Expansion Only (8%) (pre-tax) | C$M | - | 628 | |||||||
| IRR Expansion (pre-tax) | % | - | 26.4 | % | ||||||
| Payback (pre-tax) | Months | - | 36 | |||||||
| Net Cash Flow (post-tax) | C$M | 2,411 | 3,249 | |||||||
| NPV (8%) (post-tax) | C$M | 805 | 1,284 | |||||||
| NPV Expansion Only (8%) (post-tax) | C$M | - | 479 | |||||||
| IRR Expansion (post-tax) | % | - | 26.4 | % | ||||||
| Payback (post-tax) | Month | - | 46 | |||||||
Notes:
| · | All costs and sales are presented in constant 2025 CAD, with no inflation or escalation factors considered. |
| · | $M = millions of dollars. |
| · | The financial analysis was performed on existing Ore Reserves as outlined in this report. |
| · | The valuation calculations are unlevered. |
| · | The average metallurgical recovery over the LOM is 71.2% for the expansion and 69.2% for the base case due to improvement in the mill flowsheet specifically attributable to ore-sorting and WHIMS improvements. |
| · | Plant availability a is calculated at 92% given the flexibility introduced in the circuit and improvements in the design versus the base case plant availability of 89%. |
| · | Tonnes of concentrate are presented as dry metric tonnes. |
| · | An exchange rate of 0.74 CAD/USD was fixed over the LOM for the Project. |
| · | The average 6% Li2O concentrate price is based on a market analysis from Benchmark Mineral Intelligence for Q1 2025 as described in the market section and varies over the LOM from US$1,320/t to US$1,925/t. |
| · | Average LOM SC6 pricing may vary between the cases due to longer mine life at the long term $1,350 price for the base case (2040 and beyond). |
| · | A discount rate of 8% was used for the base case and expansion scenarios. |
| · | Net Cash Flow and valuation calculations include investment tax credit on CAPEX. |
| · | The numbers have been rounded. Any discrepancy in the totals is due to rounding effects. |
There are other costs that have been considered in the Project’s financial analysis, including the following.
Closure Cost
Closure and rehabilitation costs include a post-closure monitoring/inspection program, engineering, contracts, supervision, reporting, removal of Project infrastructure, (i.e., ponds, buildings, electrical poles, tanks, roads, etc.), and site restoration activities as per the Project site restoration plan submitted to governmental agencies.
Closure cost estimate was updated from 2024 closure cost as accepted by Ministry using the same cost per unit. The concept of closure remains unchanged from the previous closure plan. Additional areas were considered for the reclamation of TSF#3, HS#4. Reserves closure cost also includes an additional amount for demolition and restoration of crushing and mill expansion.
Reclamation and closure costs for the Expansion Project have been evaluated to be $62.4M, increased from the $60.4M base case.
|
|
Sayona Mining Limited |
Other Environmental Costs
Other environmental costs related to the Project include:
| · | Compensation for loss of wetlands and water bodies |
| · | Compensation for loss of fish habitats |
| · | Compensation for loss of forest land |
The calculated total for these other environmental costs is $25.6M for the expansion scenario.
Sensitivity Analysis
A sensitivity analysis was conducted on the factors presented below:
| · | Spodumene Price |
| · | Exchange Rate |
| · | Blended Li2O Grade |
| · | Opex |
| · | Project Capex |
| · | Sustaining Capex |
| · | Mill Recovery |
Post-Tax NPV(8%) sensitivities range from -30% to +30% for all factors. The impact of the NPV (in CAD $M) outputs was tested at discount rate of 8%. The results of the sensitivity analysis are summarised in Figure 15.
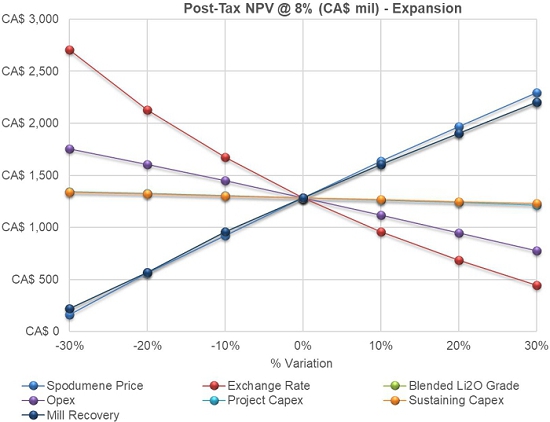
Figure 15 – Sensitivity analysis on NPV (8%)
|
|
Sayona Mining Limited |
Funding
Funding requirements will be determined during future phases of the project. If the Company proceeds with the expansion, Sayona will consider available funding options including cashflows from existing production, new loan facilities, equity investments, strategic partners, offtake funding or other sources.
Risks and Opportunities
Project Risk Assessment
Principal risks on the Project relate to obtaining permits, social license in the Project footprint, capital escalation, and geotechnical information related to placing of infrastructure.
As the mitigations identified will be applied in subsequent phases, the likelihood of such risks will diminish or be removed.
Project Opportunities
There are several opportunities, including the potential for cost reduction opportunities, process recovery enhancements and design improvements. Specific examples of opportunities being investigated in the next phase include the potential for owner operator mining, optimisation of recovery, ore sorting performance optimisation, mill utilisation across the two trains along with cost synergies and optimisation. Federal and Provincial government incentives have the potential to reduce the cost of the project either by direct support or tax incentives, and this will be pursued further in future work.
Announcement authorised for release by Sayona’s Board of Directors.
About Sayona Mining
Sayona Mining Limited is a North American lithium producer (ASX:SYA; NASDAQ:ELVR; OTCQB:SYAXF), with projects in Québec, Canada, United States, Ghana and Western Australia.
In Québec, Sayona’s assets comprise North American Lithium (100%) and a 60% stake in the Moblan Lithium Project in northern Québec. In the United States, Sayona has the Carolina Lithium project (100%) and in Ghana the Ewoyaa Lithium project (22.5%) in joint venture with Atlantic Lithium.
In Western Australia, the Company holds a large tenement portfolio in the Pilbara region prospective for gold and lithium.
For more information, please visit us at www.sayonamining.com.au
References to Previous ASX Releases
| · | Sayona ASX announcement “NAL Resources and Reserves Increases” dated 27 August 2025 |
| · | Sayona ASX announcement “Quarterly Activities Report - June 2025” dated 30 July 2025 |
| · | Sayona ASX announcement “Quarterly Activities Report - March 2025” dated 28 April 2025 |
| · | Sayona ASX announcement “Quarterly Activities Report - December 2024” dated 31 January 2025 |
| · | Sayona ASX announcement “Quarterly Activities Report - September 2024” dated 24 October 2024 |
| · | Sayona ASX announcement “Quarterly Activities/Appendix 5B Cash Flow Report” dated 25 July 2024 |
| · | Sayona ASX announcement “Quarterly Activities/Appendix 5B Cash Flow Report” dated 26 April 2024 |
|
|
Sayona Mining Limited |
Competent Person’s Statement
The information on Mineral Resources and Ore Reserves are extracted from the announcement entitled “NAL Resources and Reserves Increases” published on the ASX on 27th August 2025 and is available to view on the Sayona’s website or on the ASX. The Company confirms that it is not aware of any new information or data that materially affects the information included in the original market announcement and all material assumptions and technical parameters continue to apply and have not materially changed. The Company confirms that the form and context in which the Competent Person’s findings are presented have not been materially modified from the original market announcements
The information in this announcement and the ASX release dated 27th August 2025 that relates to Mineral Resources for the NAL project is based on and fairly represents information compiled by Mrs Emilie Gosselin, a member of the Ordre des Ingénieurs du Québec (OIQ). Mrs Gosselin is a full-time employee of BBA Inc. Mrs Gosselin has sufficient experience which is relevant to the style of mineralisation and type of deposit under consideration and to the activity which she is undertaking to qualify as a Competent Person as defined in the JORC Code (2012 Edition) of the “Australasian Code for Reporting of Exploration Results, Mineral Resources and Ore Reserves.” The Company confirms that the form and context in which the Competent Person’s findings are presented have not been materially modified from the original market announcements.
The information in this announcement and the ASX release dated 27th August 2025 relating to Ore Reserves for the North American Lithium project is based on, and fairly represents, information and supporting documentation prepared by Mr. Tony O’Connell an independent consultant employed by Optimal Mining Solutions Pty Ltd and is a member of the Australasian Institute of Mining and Metallurgy (AusIMM). Mr O’Connell has sufficient experience which is relevant to the type of deposits and mining method under consideration and to the activity which has been undertaken to qualify as a Competent Person as defined in the 2012 Edition of the “Australasian Code for Reporting of Exploration Results, Mineral Resources and Ore Reserves”. The Company confirms that the form and context in which the Competent Person’s findings are presented have not been materially modified from the original market announcements.
Forward Looking Statements
This ASX release contains certain forward-looking statements. Such statements include, but are not limited to, statements relating to “reserves” or “resources”. Forward-looking statements are based on certain assumptions and involve known and unknown risks, uncertainties and other factors, many of which are beyond Sayona’s control. Actual events or results may differ materially from the events or results expressed or implied in any forward-looking statement. There can be no assurance that such information will prove to be accurate as actual results and future events could differ materially from those anticipated in such forward-looking statements.
No representation, warranty, or guarantee, express or implied, is made by the Company, its directors, officers, employees, advisers, or agents that any forward-looking statement contained in this ASX release will be achieved or prove to be correct. Investors are cautioned not to place undue reliance on such statements. Except as required by law or the ASX Listing Rules, the Company undertakes no obligation to update any forward-looking statements after the date of this report to reflect events or circumstances after the date of this report or to reflect the occurrence of unanticipated events.
For more information, please contact:
Andrew Barber
Investor Relations
Ph: +617 3369 7058
|
|
Sayona Mining Limited |
Exhibit 99.2

ASX:SYA • NASDAQ:ELVR • OTCQB:SYAXF Elevra Lithium The Merger of Piedmont and Sayona SEPTEMBER 2025 Exhibit 99.2 Contents ELEVRA LITHIUM 2 Introduction 01 Corporate Overview 02 Synergies & Progress 03 Resource Base & Operations 04 Growth Projects 05 Strategy & Market Outlook 06 Financials & Guidance 07 Appendix 08

01 Introduction

#1 North American hard rock pure - play lithium producer. Significant combined lithium Ore Reserve Estimate of 106Mt @ 1.15% Li 2 O and M&I Mineral Resource estimate totalling 183Mt @ 1.16% Li 2 O 1 . Improved strategic relevance to global battery and EV supply chains. Aligns economic interests in pursuing NAL B rownfield expansion. Significantly strengthened balance sheet to support growth pipeline. Enhanced portfolio optionality to pursue growth. Potential to deliver into different supply - chain /products in a highly dynamic market. Consolidated North American Lithium (“NAL”) offtake economics. Complementary technical capabilities. Unified ownership structure enhancing scope for project optimisation. Material logistics, procurement and marketing synergies. Recapping the Merger Strategic Rationale Unlocking synergies, strengthening our market position and delivering long term value Scale Optimisation Growth 1. Combined spodumene ore reserve estimates and mineral resource estimates (in the measured and indicated category, inclusive of reserves and exclusive of inferred resources). Ore reserve and mineral resource estimates reported in accordance with the JORC code. Metrics as reported and shown on a net attributable basis following updated NAL and Moblan announcements in August 2025. Refer to the Appendix for supporting data. Strategic Rationale ELEVRA LITHIUM 4 Introducting Elevra Lithium Electricity Evoking energy, power and the shift towards electrification.

Era Marking a new chapter in sustainable industry and clean energy. The meaning behind the name Elevate Upward momentum, leadership and innovation. Providing a secure and reliable supply of lithium to power the future ELEVRA LITHIUM 5 Integrity Respect Resilience Collaboration Execution Elevra represents a company driving the energy transition forward, rising as a leader in the lithium and critical minerals sector Our Core Values ELEVRA LITHIUM 6


02 Corporate Overview

Merger Update • ~168mm shares on issue post consolidation. • Elevra pro - forma cash position of ~A$227mm 1 as at 30 June 2025, including proceeds of A$69mm from RCF, excluding merger completion costs. • Name change to the new entity expected in late September 2025 subject to ASIC regulatory approvals. • Post name change ASX shares of the merged company will be listed on the ASX under the ticker ELV whilst ADS shares will trade on the NASDAQ under the ticker ELVR. North America’s Leading Hard - Rock Lithium Producer A larger, stronger operating business with quality development projects ELEVRA LITHIUM 8 1. AUDUSD = 0.65. 205 kdmt FY25 record spodumene concentrate produced Scale Elevra is North America’s largest hard - rock lithium producer. Growth NAL expansion study results confirms lower costs and strong returns. Strategically Positioned Exporting globally, supplying the battery materials EV chain.

121Mt +35% resource at Moblan over previous Aug 2024 MRE A$1,198/t FY25 unit operating cost produced (FOB) 26.4% IRR (post - tax) from NAL expansion scoping study Highly Experienced and Diverse Board Structured to support and enable Elevra’s growth • Board of Directors of Elevra consists of a total of 8 members, including Dawne Hickton as Chair of the Board and Lucas Dow as Managing Director & CEO. • Highly experienced and diverse board representation with decades of combined executive experience. • The Audit and Risk Committee will be comprised of 4 Board members with Ms. Laurie Lefcourt serving as Chair, and the Nomination and Remuneration Committee will be comprised of 4 Board members with Ms. Dawne Hickton serving as Chair. Board of Directors Dawne Hickton Chair Allan Buckler Director Lucas Dow Managing Director & CEO Jeff Armstrong Director James Brown Director Laurie Lefcourt Director Christina Alvord Director Jorge M.

Beristain Director ELEVRA LITHIUM 9 Elevra’s Management Team Experienced team with strong operational and project development experience • Elevra is proud to introduce the company’s senior leadership team — a committed group of individuals ready to guide Elevra’s evolution and champion the company’s vision: to operate responsibly and grow sustainably. • The management team brings extensive experience and operational excellence in the lithium space.

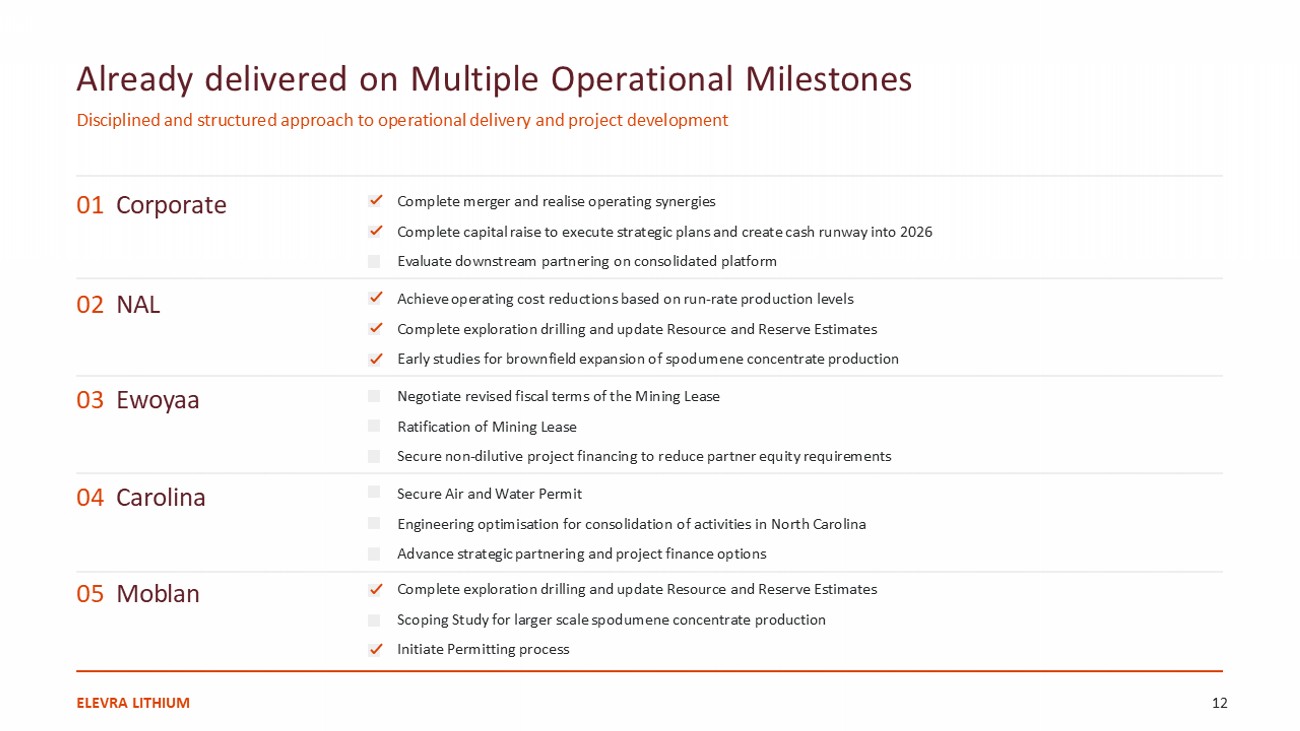
03 Synergies & Progress
Management Team Monique Parker Chief Sustainability Officer Dougal Elder Chief Financial Officer Lucas Dow Managing Director & CEO Dylan Roberts General Counsel & Company Secretary Sylvain Collard President Canada & Group COO Andrew Barber Chief Development & Investor Relations Officer Sandra Tremblay Chief People Officer Malissa Gordon Vice President, Government Affairs US ELEVRA LITHIUM 10 01 Corporate 02 NAL 03 Ewoyaa 04 Carolina 05 Moblan Already delivered on Multiple Operational Milestones Disciplined and structured approach to operational delivery and project development Complete merger and realise operating synergies Complete capital raise to execute strategic plans and create cash runway into 2026 Evaluate downstream partnering on consolidated platform Achieve operating cost reductions based on run - rate production levels Complete exploration drilling and update Resource and Reserve Estimates Early studies for brownfield expansion of spodumene concentrate production Negotiate revised fiscal terms of the Mining Lease Ratification of Mining Lease Secure non - dilutive project financing to reduce partner equity requirements Secure Air and Water Permit Engineering optimisation for consolidation of activities in North Carolina Advance strategic partnering and project finance options Complete exploration drilling and update Resource and Reserve Estimates Scoping Study for larger scale spodumene concentrate production Initiate Permitting process ELEVRA LITHIUM 12 Merger Synergies Good progress already made and on track to deliver synergies in excess of US$15M on an annual basis SG&A Optimisation of corporate and JV functions Reduction of corporate costs and overheads Consolidation of corporate offices Ability to re - route and share staff across various corporate functions and projects Asset Optimisation Enhanced management and technical expertise to expand production base NAL brownfield scoping study completed Reduce unit operating costs at NAL to improve cashflow generation through market cycles Strengthened positioning and balance sheet to optimise growth projects and pursue downstream supply - chain integration strategies Logistics and Procurement Removing de - synergies from previous NAL arrangement Marketing synergies through significantly expanded customer relationships Optimised project logistics and procurement to deliver lower operating cost profile Expected to be realised in 1H FY2026 ELEVRA LITHIUM 13


04 Resource Base & Operations NAL Mineral Resources 2025 JORC Estimate NAL Mineral Reserves 2025 JORC Estimate Cut - off Grade (%) Li 2 O Grade (%) Tonnes (Mt) Method Resource Classification 0.60 1.17 76.2 Open Pit Measured 0.60 1.13 8.6 Open Pit Inferred – – – Underground Indicated 0.70 1.02 10.3 Underground Inferred 1.15 95.0 Total Cut - off Grade (%) Li 2 O Grade (%) Tonnes (Mt) Reserve Category 0.60 1.01 0.3 Proved 0.60 1.11 48.2 Probable 0.60 1.11 48.6 Total NAL Increases Resource to 95Mt and Reserves to 49Mt 1 • Total Mineral Resource of 95Mt at 1.15% Li 2 O; this is an increase of +8% over the previous MRE (August 2024) of 87.9Mt at 1.13% Li 2 O • Increase in Reserves of +124% compared to previous estimate released i n March 2023 • Results from the updated MRE reinforce the project ' s potential for an extended mine life and/or increased production rate Significant Increase in Resource and Reserve Base Large resource base to support significant brownfield and greenfield developments ELEVRA LITHIUM 15 1. Refer to ASX Announcement on 27 August 2025 or Appendix for supporting data.

Aug 2021 Acquisition ¹ 57.7M tonnes 30.2 (0.8) 14.1 1.7 (8.0) 87.9M tonnes 95.0M tonnes Step Change Aug 2024 MRE Depletion Aug 2 4 to Mar 25 No UG Pillar Recovery 67.4 to 69.2 Updated Economic Parameters and Selling Price Change (US$1,395 5.4% Li 2 O) June 202 5 MRE MRE Total MRE Increase MRE Decrease 1.1x Increase 1.6x Increase +0.15% Grade Cutoff NAL 1.6x Increase in Resource Since Acquisition Increased resource base providing the foundation for a significant brownfield expansion • NAL represents one of North America’s single largest lithium resources , providing a strategically significant asset base with substantial growth potential • Since August 2024, MRE has increased from 87.9Mt to 95.0Mt, underpinned by successful drilling results which ha ve increased the resource base by 1.6x since the 2021 acquisition • Increase in Indicated category cut - off grade from 1.02% Li 2 O at August 2021 acquisition to 1.17% Li 2 O 2025 MRE 1. Based on latest 2017 MRE published prior to completion of acquisition in August 2021 .
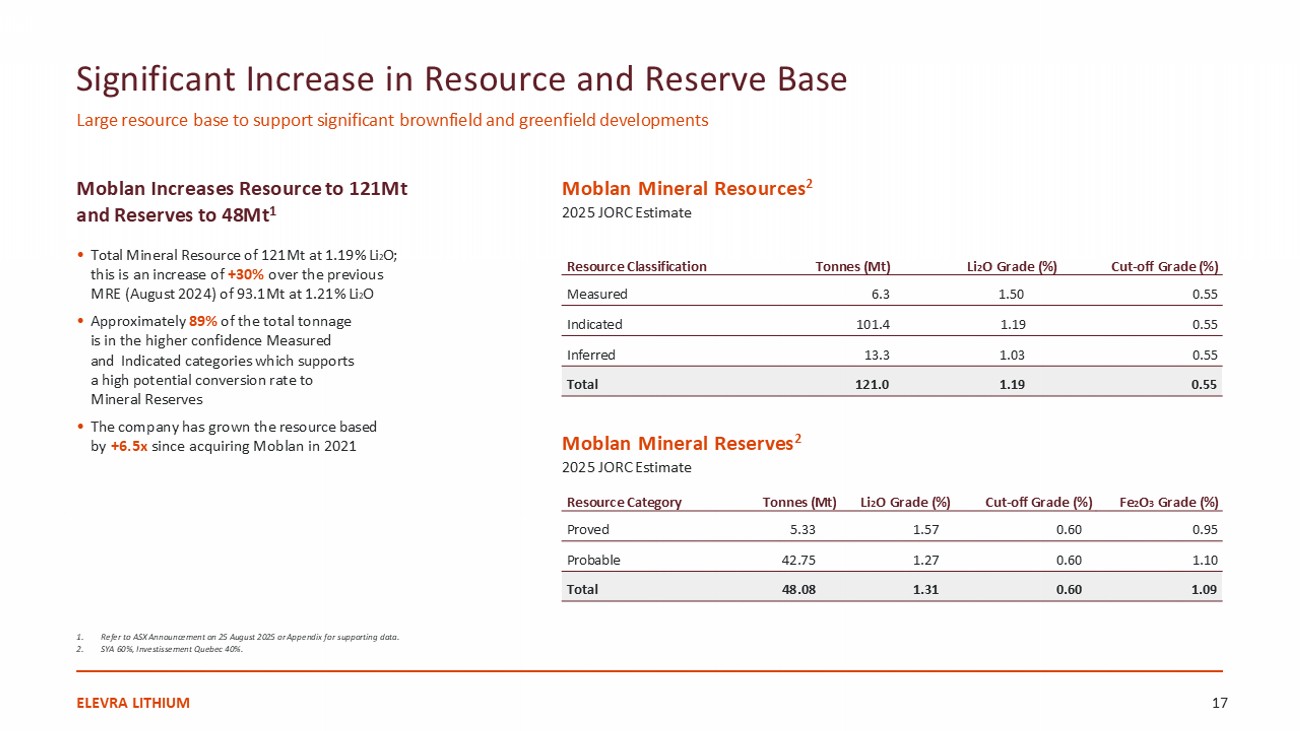
ELEVRA LITHIUM 16 0.1 New Geo Model Significant Increase in Resource and Reserve Base Large resource base to support significant brownfield and greenfield developments Moblan Increases Resource to 121Mt and Reserves to 48Mt 1 • Total Mineral Resource of 121Mt at 1.19% Li 2 O; this is an increase of +30% over the previous MRE (August 2024) of 93.1Mt at 1.21% Li 2 O • Approximately 89% of the total tonnage is in the higher confidence Measured and Indicated categories which supports a high potential conversion rate to Mineral Reserves • The company has grown the resource based by +6.5x since acquiring Moblan in 2021 Cut - off Grade (%) Li 2 O Grade (%) Tonnes (Mt) Resource Classification 0.55 1.50 6.3 Measured 0.55 1.19 101.4 Indicated 0.55 1.03 13.3 Inferred 0.55 1.19 121.0 Total Moblan Mineral Resources 2 2025 JORC Estimate Fe 2 O 3 Grade (%) Cut - off Grade (%) Li 2 O Grade (%) Tonnes (Mt) Resource Category 0.95 0.60 1.57 5.33 Proved 1.10 0.60 1.27 42.75 Probable 1.09 0.60 1.31 48.08 Total ELEVRA LITHIUM 17 Moblan Mineral Reserves 2 2025 JORC Estimate 1. Refer to ASX Announcement on 25 August 2025 or Appendix for supporting data. 2. SYA 60%, Investissement Quebec 40%.

16 77 93 28 121 Oct 2021 Acquisition 1 Aug 2024 MRE Aug 2025 MRE ~6.5x increase More Cohesive Resource Base Measured Mineral Resources Inferred Mineral Resources Indicated Mineral Resources Resources Pit Shell • Resource base continues to grow over the years from infill drilling with shallow mineralisation • Track record of expansion, with mineral resource increasing 6.5x since the October 2021 acquisition and a high level of certainty for conversion of resources to reserves • Improve d quality and consistency of ore body with anticipated increased project economics (more cohesive resource base) Moblan 6.5x Increase in Resource Since Acquisition Genuine Tier 1 deposit – long life, low cost with an expandable production profile 2024 Mineral Resources 2025 Mineral Resources ELEVRA LITHIUM 18 1. Total Measured, Indicated and Inferred based on latest 2019 MRE published prior to completion of acquisition in October 2021.

Select Hard - Rock Resource Benchmarking Attributable M+I+I Mineral Resource Estimate, Mt 1 Capital Intensity Benchmarking US$mm /kdmt p.a. 3 Leading Hard - Rock Resource Base in North America with Competitive Capital Intensity 1. Peer Mineral Resource Estimates (Measured, Indicated & Inferred) as reported, refer to supporting sources in Appendix. 2. Excludes Ewoyaa. 3. Incremental capacity increase based on initial/remaining capital requirements, refer to supporting sources in Appendix. Established producing asset base. Competitive capital intensity .

Elevra 2 Patriot Battery Metals Albemarle RioTinto Winsome Frontier Resources Lithium Critical RockTech Avalon Elements Lithium Advanced Materials 100 200 0 1 2 3 4 229 141 91 82 78 48 33 15 6 0 Elevra (NAL) 3.7 3.0 3.0 1.9 1.7 1.4 1.4 1.2 1.2 Patriot Battery Metals RioTinto (Galaxy) RioTinto (Whabouchi) Winsome Resources (Adina) Frontier Lithium (PAK) Albemarle (Kings Mt) Critical Elements (Rose) RockTech Lithium (Georgia) (Shaakichiuwaanaan) ELEVRA LITHIUM 19 Delivering production in line with FY25 budget • FY25 ore mined up 14% against PCP • Process plant utilisation achieves new record of 93% • Consistent lithium recoveries exceeding 73% in June quarter which was 5% higher against PCP • FY25 concentrate production of 205kt was a 31% increase on the prior year • Continued focus on safety improvement in FY26 NAL Operational Performance Demonstrated operating discipline laying the platform for sustained success and future growth NAL Global Recovery and Mill Utilisation NAL Concentrate Production and Unit Operating Costs ELEVRA LITHIUM 20 43% 57% 58% 62% 67% 68% 67% 68% 69% 73% 51% 71% 72% 75% 73% 83% 91% 90% 80% 93% 30% 40% 50% 60% 70% 80% 90% 100% Q3 FY23 Q4 FY23 Q1 FY24 Q2 FY24 Q3 FY24 Q4 FY24 Q1 FY25 Q2 FY25 Q3 FY25 Q4 FY25 Global Recovery (%) Mill Utilisation (%) 3,510 29,610 31,486 34,237 40,439 49,660 52,141 50,922 43,261 58,533 1,231 1,397 1,536 1,506 1,335 1,280 1,374 1,232 0 200 400 600 800 1000 1200 1400 1600 0 10,000 20,000 30,000 40,000 50,000 60,000 70,000 80,000 Q3 FY23 Q4 FY23 Q1 FY24 Q2 FY24 Q3 FY24 Q4 FY24 Q1 FY25 Q2 FY25 Q3 FY25 Q4 FY25 Concentrate Production (dmt) Unit Operating Costs (A$/dmt)

05 Growth Projects

Development Projects Unique set of development options combined with an operating asset ELEVRA LITHIUM 22 Leading North American open pit mining operator with nameplate capacity of 220kt of spodumene concentrate (30kt LCE per annum) • Brownfield expansion scoping study completed with strong economics • 25+ year life of mine • Indicated and Inferred Mineral Resource of 95Mt @ 1.15% Li 2 O • Nearly all of NAL is powered by clean and green hydroelectricity 1. Sayona has a 22.5% interest in the Ewoyaa Project and can earn a 50% interest prior to potential dilution. 2. See PLL ASX release 17 August 2023. North American Lithium (100%) 1 Low - cost lithium project targeting 365kt of high - grade, coarse - grained spodumene concentrate per annum • Elevra has an offtake agreement with Atlantic Lithium for 50% of spodumene concentrate production at market prices on a life - of - mine basis 2 • Elevra additionally exercised option to acquire 22.5% interest in Ewoyaa , having funded the Definitive Feasibility Study to completion Ewoyaa (22.5%) 1 2 High - grade, long - life project located close to key infrastructure and transport nodes with production target of 300kt per annum of spodumene concentrate • Drilling program achieved 6.5x increase in Resource base since acquisition • 20+ year life of mine • Measured, Indicated and Inferred Mineral Resource of 121Mt @ 1.19% Li 2 O • Strategically located at the southern most portion of the James Bay region of Quebec Moblan (60%) 3 Fully - integrated, strategically located U.S. asset to potentially produce battery - grade lithium at up to 60kt per annum at full production • Received finalised mining permit for construction, operation and reclamation in May 2024 • One of only two significant spodumene projects in the U.S.
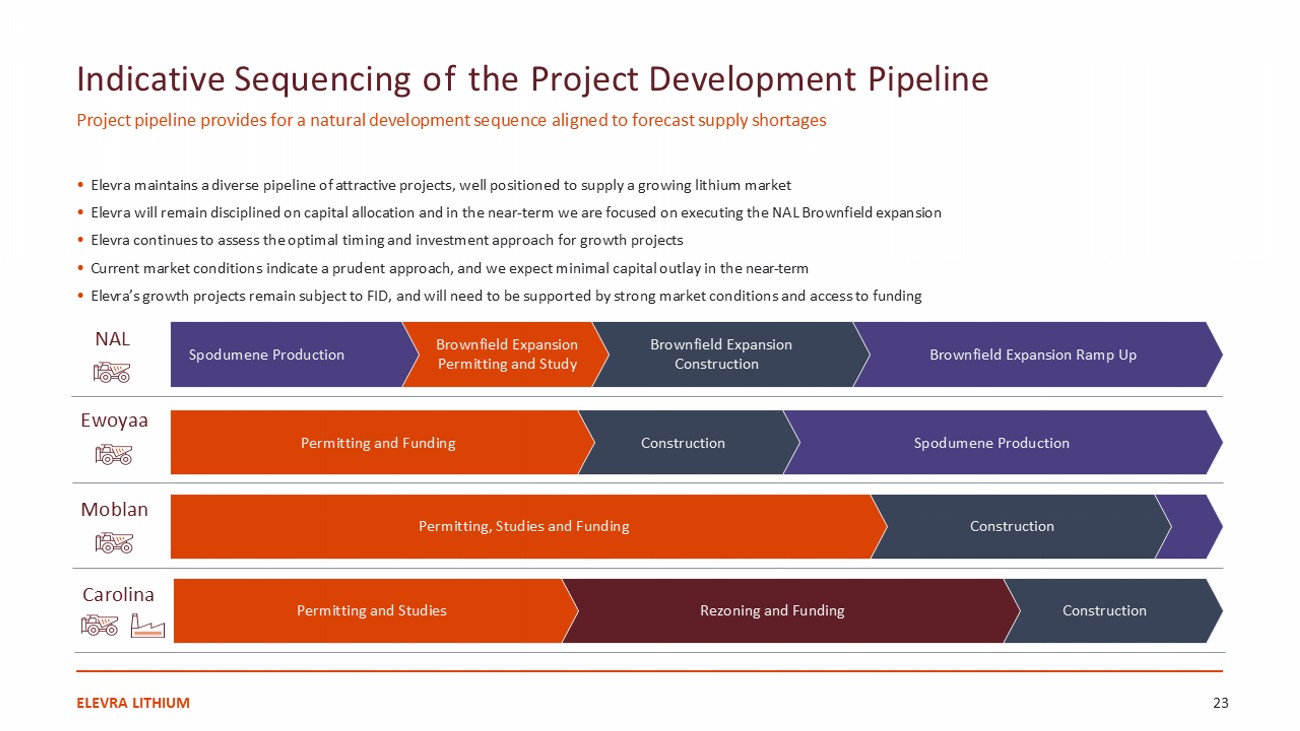
• Expected to benefit from exceptional infrastructure and close proximity to end customers Carolina (100%) 4 • Elevra maintains a diverse pipeline of attractive projects, well positioned to supply a growing lithium market • Elevra will remain disciplined on capital allocation and in the near - term we are focused on executing the NAL B rownfield expansion • Elevra continues to assess the optimal timing and investment approach for growth projects • Current market conditions indicate a prudent approach, and we expect minimal capital outlay in the near - term • Elevra’s growth projects remain subject to FID , and will need to be supported by strong market conditions and access to funding Indicative Sequencing of the Project Development Pipeline Project pipeline provides for a natural development sequence aligned to forecast supply shortages ELEVRA LITHIUM 23 Ewoyaa Spodumene Production Construction Permitting and Funding Moblan Carolina Potential FID Construction Permitting, Studies and Funding Construction Rezoning and Funding Permitting and Studies NAL Permitting Brownfield Expansion Ramp Up Brownfield Expansion Construction Brownfield Expansion Permitting and Study Spodumene Production • The brownfield expansion at NAL is supported by the significant increase in resource base of the surrounding acreage • Permitting expected to be a streamlined process given existing permit approvals at NAL • Second concentrator to be added on site to ramp up production Overview of NAL Brownfield Expansion 1 Risk profile significantly reduced as compared to greenfield projects in Quebec with superior location and existing logistics connectivity ELEVRA LITHIUM 24 1.

ASX release 15 September 2025

Elevra has completed a Scoping Study Assessing an Expansion of NAL Supported by a Larger Resource Base • Based off the scoping study results, targeting an increase in production from 19 5 – 210 ktpa (FY26 Guidance) to 315 ktpa nominal SC5.4 following ramp - up of the expansion • High grade of additional resources expected to deliver increased concentrate production and supports a reduction in the strip ratio and mining costs at an attractive capital intensity • Expected reduction in unit cash costs, improving margins and operational resilience • C1 unit cost of US$562/t and AISC of US$680/t once the expansion is fully operational 1 • Estimated initial capex of US$270mm, with expansion project to provide a total post - tax NPV(8%) of US$950mm 1 Impact of the NAL Brownfield Expansion Plan Driving unit costs down and strengthening NAL’s commercial competitiveness NAL Gross Production NAL Unit Costs 1. Converted at CADUSD = 0.74 per Scoping Study Results .

ELEVRA LITHIUM 25 Current FY26 Guidance Post NAL Brownfield Expansion 195 – 210 kdmt 315 kdmt Current FY26 Guidance Post NAL Brownfield Expansion US$765 – 830 / dmt US$562 / dmt Indicative NAL Brownfield Expansion Timetable A simplified project pathway as compared to greenfield project development — further refinement being undertaken Completed Scoping Study for NAL brownfield expansion completed in September 2025 In Progress Conduct additional required test work and evaluation during next phase of the project FY26 Commence incremental permitting ~2Q CY28 Commence construction 1Q CY30 – 3Q CY30 Increase production from 195 – 210 kdmt to 315 kdmt ~4Q CY29 Construction complete, commissioning commences Scoping Study Project Evaluation Permitting Construction Commission Ramp - up 1 2 3 4 5 6 ELEVRA LITHIUM 26 x Funding Plan Flexibility and a range of alternatives exist to fund Elevra’s development projects.

• Consolidating ownership of NAL provides optionality for alternative funding pathways including partnering with strategic investors • Capital raisings completed at merger announcement and completion provide runway for Elevra developments • Near - term focus on securing non - dilutive funding options leveraging Elevra’s strengthened balance sheet and cashflow generation 1. See Atlantic Lithium Limited ASX release 29 June 2023, “Ewoyaa Definitive Feasibility Study”. 2. The capital cost estimate excludes sunk costs, corporate costs, company overheads, exploration costs, project financing costs, working capital, exchange rate variations and escalation. ELEVRA LITHIUM 27 NAL Brownfield Expansion Ewoyaa Moblan and Carolina • Evaluating non - dilutive funding options such as secured loan and/or corporate loan which will be serviced by NAL cash flows • Engaging with potential financiers and strategic / offtake funding partners • Elevra progressing non - dilutive funding options such as DFC loan for project capex and customer funding for the early years of Elevra offtake • Subject to FID, the first US$70MM to be funded by Elevra and remainder to be funded based on project ownership (~47% Elevra ) • Funding options determined following completion of re - negotiation of financial terms • Evaluating strategic partnership and project financing options • Strong interest from partners given strategically located assets • US federal government support to fund and accelerate critical mineral projects; downstream integration will be an important decision factor US$270MM Subject to permitting and FID Subject to FID and market conditions Funding Strategy Est. Funding Required Funding Timing US$185MM 1,2 100% basis 06 Strategy & Market Outlook

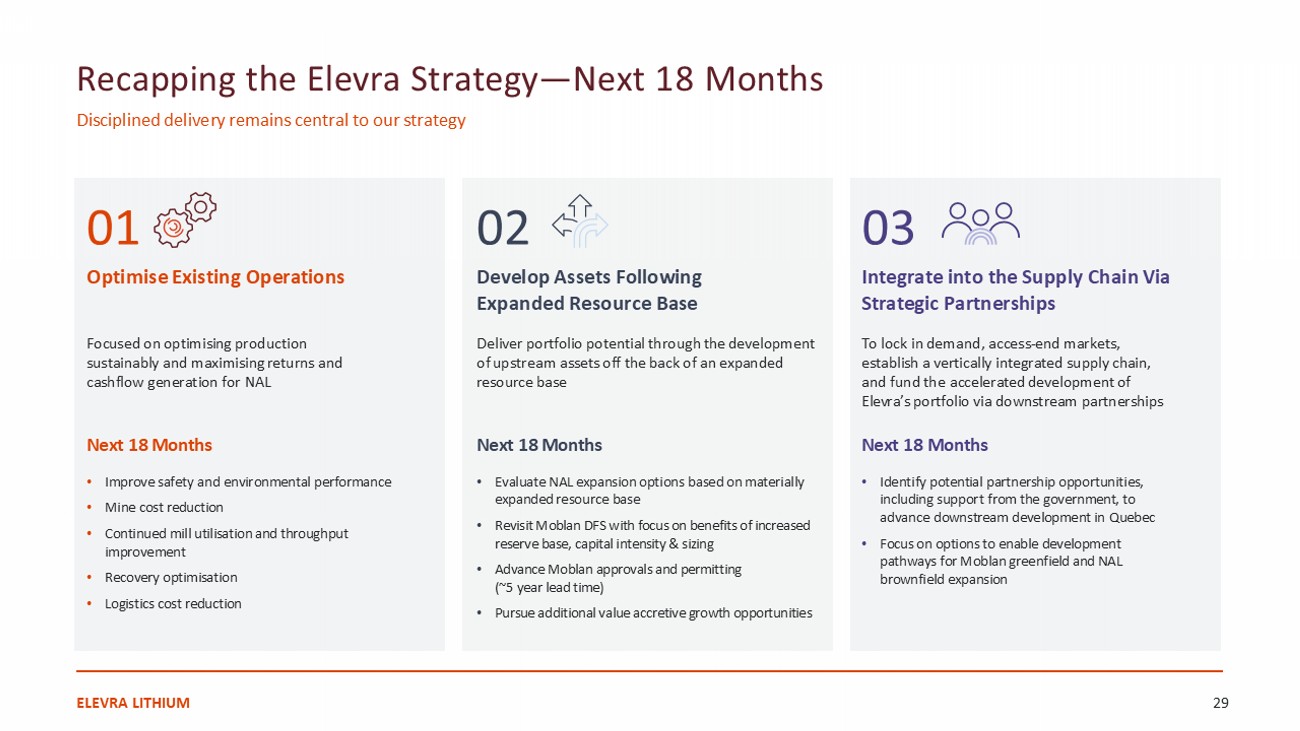

01 Optimise Existing Operations 02 Develop Assets Following Expanded Resource Base Deliver portfolio potential through the development of upstream assets off the back of an expanded resource base 03 Integrate into the Supply Chain Via Strategic Partnerships To lock in demand, access - end markets, establish a vertically integrated supply chain, and fund the accelerated development of Elevra’s portfolio via downstream partnerships Recapping the Elevra Strategy — Next 18 Months Disciplined delivery remains central to our strategy Next 18 Months Next 18 Months Next 18 Months • Improve safety and environmental performance • Mine cost reduction • Continued mill utilisation and throughput improvement • Recovery optimisation • Logistics cost reduction • Evaluate NAL expansion options based on materially expanded resource base • Revisit Moblan DFS with focus on benefits of increased reserve base, capital intensity & sizing • Advance Moblan approvals and permitting (~5 year lead time) • Pursue additional value accretive growth opportunities • Identify potential partnership opportunities , including support from the government , to advance downstream development in Quebec • Focus on options to enable development pathways for Moblan greenfield and NAL brownfield expansion ELEVRA LITHIUM 29 Focused on optimising production sustainably and maximising returns and cashflow generation for NAL Greenbushes Pilgangoora Mt Marion Wodgina Through - The - Cycle Production Ensures Maximised Profitability in Peak Cycle Environments Production incumbency is everything • Lithium price upcycles can last 2 – 3 years (most recently Sep 2021 – Jan 2023) but short spikes have primarily driven outsized profitability • Producing assets such as Greenbushes, Pilgangoora and Mt Marion invested through the downcycle which allowed them to fully capitalise at peak prices with expanded production • However, as Wodgina was placed into care and maintenance, it was not able to restart production efficiently during peak price periods and recorded zero profit over FY2022, whilst producing assets saw record profitability • Given the relatively short price cycles and the time/capex required to restart, it is critical to remain operational during market downturns in order to maximise earnings potential during strong price environments Gross Annual Production k t , June year end Profit A$MM, June year end 2,685 9,627 4,361 660 777 1,215 Spod (A$/t) ELEVRA LITHIUM 30 - 91 281 378 620 725 744 644 702 1,135 1,491 1,383 391 496 485 431 474 654 - 62 - 16 295 423 - 200 400 600 800 1,000 1,200 1,400 1,600 FY2019 FY2020 FY2021 FY2022 FY2023 FY2024 Despite price rebound, Wodgina was not able to transition from care and maintenance to production until FY2023 (29) (99) (51) 530 2,276 418 (214) (71) (63) 868 6,555 2,578 109 21 5 504 1,231 275 - 381 93 (3,000) (1,000) 1,000 3,000 5,000 7,000 9,000 FY2019 FY2020 FY2021 FY2022 FY2023 FY2024 Wodgina failed to realise any value during the first 12M of price upswing in 2021 Assets that remained producing through the cycle saw significant earnings growth 0.0 1.0 2.0 3.0 4.0 5.0 6.0 2025 2028 2031 2034 2037 2040 Battery Industrial Uplift in Demand with Strong Outlook into 2030 Elevra is well positioned to take advantage of forecast demand growth through its unique suite of development projects Global Lithium Demand Mt LCE North American Lithium Market Balance M t LCE CAGR 10% ELEVRA LITHIUM 31 (0.15) (0.18) (0.21) (0.23) (0.25) (0.27) (0.28) (0.30) (0.33) (0.37) (0.39) (0.42) (0.48) (0.53) (0.60) (0.65) (0.8) (0.6) (0.4) (0.2) 0.0 0.2 0.4 0.6 0.8 1.0 1.2 1.4 2025 2028 2031 2034 2037 2040 Market Balance Battery Demand Primary Supply Source: Benchmark Mineral Intelligence Q2 2025 Lithium Forecast Model
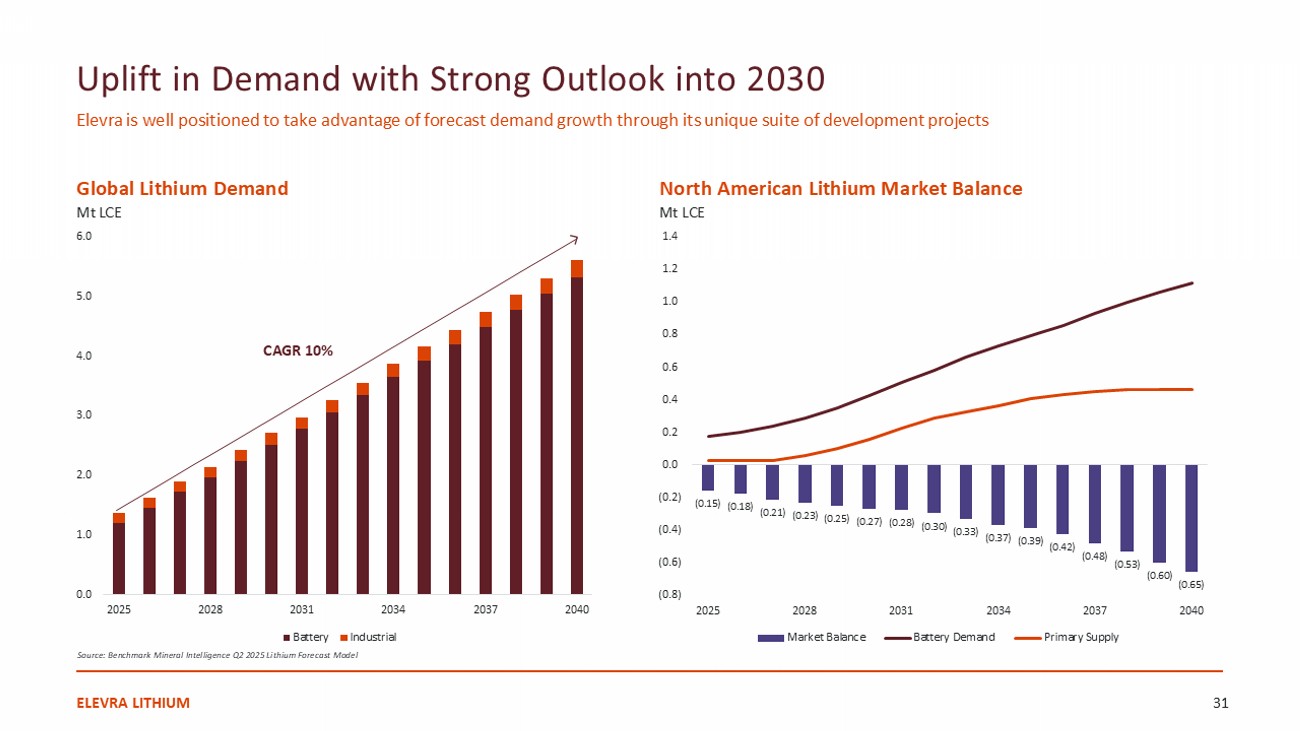

Commercial Strategy Focused on developing strategic partnerships where the commercial terms are superior to what can be achieved in the spot market LG Chem’s contract for 200kt over 4 years 2 . Tesla’s contract for 125kt over 3 years 1 . ELEVRA LITHIUM 32 Offtake Agreements and Sales Strategy • Offtake agreement between Sayona and Piedmont has been unwound through the merger consolidation • The underlying offtake agreements between Piedmont and Telsa/LG Chem remain in place including: • Remaining balance is currently being sold to international markets • International market sales prices are supplemented with a modest forward sales program that takes advantage of the contango that regularly exists in Lithium Hydroxide futures contracts Downstream Approach • Elevra will proactively engage with conventional and non - conventional technology providers as a supplier of feedstock to lithium chemical conversion facilities • A strong preference will be to support those groups that intend to construct facilities in North America and specifically in Quebec • There is an opportunity to form strategic partnerships with battery supply chain participants that are focused on ex - China supply 1. See PLL ASX release 4 January 2023 2. See PLL ASX release 16 February 2023 FY26 Guidance Another year focused on delivery, disciplined expenditure and continued improvement 1.

07 Financials & Guidance

Unit operating cost sold is calculated on an accruals basis and includes mining, processing, transport, port charges, site - based general and administration costs and cash based inventory movements, and excludes depreciation and amortisation charges, freight an d royalties. It is reported in A$/dmt sold, weighted average (CIF/FOB) including CIF Port of Québec. 2. Guidance assumes average annual exchange rates of AUD:CAD 0.88 and AUD:USD 0.65 . ELEVRA LITHIUM 34 Spodumene Concentrate Production Spodumene Concentrate Sales Unit Operation Costs Sold 1,2 • SC 5.3% product grade • 100% NAL production • SC 5.3% grade • 100% NAL sales • Shipment volumes have been deliberately weighted to the 2 nd quarter in each six month period in order to deliver into higher priced forward sales arrangements. Full year sales guidance remains unchanged.

08 Appendix

• Q1 ~25% vs Q2 ~75% • Q3 ~33% vs Q4 ~77% • SC 5.3% product grade • US$765 - $830 / dmt • A$ / dmt sold (weighted average CIF/FOB) • Unit operating costs includes costs of cost, insurance and freight costs (CIF) linked to customer offtakes 195,000 – 210,000 dmt Additional Information Proposed Guidance Capital Expenditures 2 • A$30m Sustaining Capital projects at NAL • Balance of spend on Growth Projects • Capital expenditure guidance excludes movements in capital creditors which amounted to A$5m 195,000 – 210,000 dmt A$1,175 – A$1,275 / dmt A$40m 1. Attributable basis, all estimates in table shown on 100% Basis. 2. Inflated at 2% p.a. to August 2025 from initial study date excluding capital contingencies where reported. Updated resource base ELEVRA LITHIUM 36 Inferred (%Li 2 O) Inferred (Mt) M+I Inclusive of Reserves M+I (%Li 2 O) Total M+I (Mt) Indicated (%Li 2 O) Indicated (Mt) Measured (% Li 2 O) Measured (Mt) Date Source Code Incremental Annual Target Production Rate (kt SC5.5 equiv.) Initial / Remaining Capex Estimate (US$MM) 2 Status Location Company Asset 1.2% 27.6 No 1.4% 63.9 1.4% 63.9 - - 31 - 12 - 24 Albemarle 10 - K (2024) S - K 1300 458 1,700 Non - Operating North Carolina, U.S. Albemarle Kings Mountain 1.3% 55.9 No 1.1% 18.1 1.1% 18.1 - - 31 - 12 - 24 Arcadium Lithium 10 - K (2024) S - K 1300 317 397 Non - Operating Québec, Canada Rio Tinto Galaxy (James Bay) 1.3% 8.3 No 1.4% 7.8 1.4% 7.8 - - 31 - 12 - 24 Arcadium Lithium 10 - K (2024) S - K 1300 235 330 Non - Operating Québec, Canada Rio Tinto (50%); IQ (50%) Whabouchi 1.4% 16.6 Yes 1.5% 35.2 1.5% 18.8 1.6% 16.4 09 - 07 - 25 Company Filing (NI 43 - 101 Technical Report) NI 43 - 101 218 661 Non - Operating Ontario, Canada Frontier Lithium (92.5%); Mitsubishi (7.5%) PAK 1.3% 33.3 Yes 1.4% 108.0 1.4% 108.0 - - 12 - 05 - 25 Company Announcement (Significant Mineral Resource Upgrade at Shaakichiuwaanaan Lithium Project) NI 43 - 101 436 617 Non - Operating Québec, Canada Patriot Battery Metals Shaakichiuwaanaan 1.0% 15.9 Yes 1.1% 28.2 1.1% 28.2 - - 31 - 12 - 24 Piedmont Lithium 10 - K (2024) S - K 1300 - - Non - Operating North Carolina, U.S. Elevra Lithium Carolina 1.0% 18.9 Yes 1.2% 76.2 1.2% 76.2 - - 27 - 08 - 25 Company Filing (NAL Resource and Reserves Increase) JORC 119 208 Operating Québec, Canada Elevra Lithium North American Lithium 1.0% 2.9 Yes 1.0% 14.1 1.0% 8.1 1.0% 6.0 11 - 10 - 22 Company Filing (Definitive Feasibility Study Confirms NAL Value with A$2.2B NPV) JORC - - Non - Operating Québec, Canada Elevra Lithium Authier 1.2% 13.3 Yes 1.2% 107.7 1.2% 101.4 1.5% 6.3 25 - 08 - 25 Company Filing (Moblan Increases Resource to 121Mt and Reserves to 48Mt) JORC - - Non - Operating Québec, Canada Elevra Lithium (60%); IQ (40%) Moblan 1.2% 16.5 Yes 1.1% 61.4 1.1% 61.4 - - 31 - 12 - 23 Company Filing (Adina Mineral Resource Increases 33% to 78Mt at 1.15% Li 2 O) JORC 280 348 Non - Operating Québec, Canada Winsome Resources Adina 0.8% 2.4 Yes 0.9% 30.6 0.9% 30.6 - - 03 - 04 - 17 Company Filing (Rose Lithium - Tantalum Project Feasibility Study) NI 43 - 101 163 488 Non - Operating Ontario, Canada Critical Elements Rose 1.5% 2.3 Yes 1.3% 13.0 1.4% 8.7 1.3% 4.3 30 - 01 - 25 Company Filing (Avalon Advanced Materials Announces 28% Increase in Measures and Indicated Mineral Resources at JV Separation Rapids Project in Ontario Canada) NI 43 - 101 15 317 Non - Operating Ontario, Canada Avalon Advanced Materials (40%); Sibelco (60%) Separation Rapids 1.0% 4.2 Yes 0.9% 10.6 0.9% 10.6 - - 10 - 08 - 23 Company Filing (Georgia Lake Pre - Feasibility Study) NI 43 - 101 109 203 Non - Operating Ontario, Canada RockTech Georgia Lake Supporting Data Leading Hard Rock Resource Base in North America Totalling 229Mt 1 Supporting Data Combined Lithium Ore Reserve Totalling 106Mt 1 Cut - off Grade (%) Li 2 O Grade (%) Tonnes (Mt) Reverse Category 0.60 1.01 0.3 Proved Ore Reserves 0.60 1.11 48.2 Probable Ore Reserves 0.60 1.11 48.6 Total 0.60 0.97 5.7 Proved Ore Reserves 0.60 1.03 4.9 Probable Ore Reserves 0.60 1.00 10.5 Total 0.60 1.57 5.33 Proved Ore Reserves 0.60 1.27 42.75 Probable Ore Reserves 0.60 1.31 48.08 Total - - Proven 1.10% 18.3 Probable 1.10% 18.3 Total Asset Source North American Lithium NAL Resources and Reserves Increases 27 August 2025 Authier NAL Resources and Reserves Increases 27 August 2025 Moblan Moblan Increases Resource to 121Mt and Reserve to 48Mt 25 August 2025 Carolina Piedmont 202 4 10 - K filing with the SEC 26 February 2025 ELEVRA LITHIUM 37 1.

Attributable basis, all estimates in table shown on 100% Basis.

Important Information and Disclaimer ELEVRA LITHIUM 38 Important Information and Disclaimer Statements in this presentation are made only as of the date of this presentation unless otherwise stated, and the information in this presentation remains subject to change without notice. Presentation for the Purposes of Providing Information Only This presentation is not a prospectus, disclosure document or offering document under Australian law or under the law of any other jurisdiction. It is for informational purposes only. This document does not constitute and should not be construed as, an offer to sell or a solicitation of an offer or invitation to subscribe for, buy, or sell securities in the Company. Any material used in this presentation is only an overview and summary of certain data selected by the management of the Company. The presentation does not purport to contain all the information that a prospective investor may require in evaluating a possible investment in the Company, nor does it contain all the information which would be required in a disclosure document prepared in accordance with the requirements of the Corporations Act and should not be used in isolation as a basis to invest in the Company. Recipients of this presentation must make their own independent investigations, consideration and evaluation of the Company. The distribution of this presentation in other jurisdictions outside of Australia may also be restricted by law and any restrictions should be observed. To avoid doubt, this presentation is not for distribution or dissemination within the US and Canada. Any failure to comply with such restrictions may constitute a violation of applicable securities laws. Disclaimer No representation or warranty, express or implied, is made as to the fairness, accuracy, completeness or correctness of the information, opinions or conclusions contained in or derived from this presentation or any omission from this presentation or of any other written or oral information or opinions provided now or in the future to any person. To the maximum extent permitted by law, neither the Company nor any of its affiliates, related bodies corporate and their respective officers, directors, employees, advisors and agents, nor any other person, accepts any liability as to or in relation to the accuracy or completeness of the information, statements, opinions, or matters (express or implied) arising out of, contained in or derived from this presentation or any omission from this presentation or of any other written of oral information or opinions provided now or in the future to any person. Forward Looking Statements This presentation may contain certain forward - looking statements. Such statements are only predictions, based on certain assumptions and involve known and unknown risks, uncertainties and other factors, many of which are beyond Sayona Mining Limited’s control. Actual events or results may differ materially from the events or results expected or implied in any forward - looking statement. The inclusion of such statements should not be regarded as a representation, warranty or prediction with respect to the accuracy of the underlying assumptions or that any forward - looking statements will be or are likely to be fulfilled. Sayona Mining Limited (Elevra Lithium) undertakes no obligation to update any forward - looking statement or other statement to reflect events or circumstances after the date of this presentation (subject to securities exchange disclosure requirements). The information in this presentation does not take into account the objectives, financial situation or particular needs of any person. Nothing contained in this presentation constitutes investment, legal, tax or other advice. The Company confirms that it is not aware of any new information or data that materially affects the information included in the original market announcement and all material assumptions and technical parameters continue to apply and have not materially changed. The Company confirms that the form and context in which the Competent Person’s findings are presented have not been materially modified from the original market announcements.

Important Information and Disclaimer ELEVRA LITHIUM 39 Cautionary Note to United States Investors Concerning Estimates of Measured, Indicated and Inferred Mineral Resources Standard for Assessing Mineral Reserves and Resources As a public company listed in Australia and the United States, Sayona Mining is required to comply with the resource estimation standards of both the JORC Code and S - K 1300. Certain of Sayona’s disclosures instead comply with the JORC Code or Canadian National Instrument 43 - 101, Standards of Disclosure for Mineral Projects (“NI 43 - 101”). Each of these standards contain specific meanings for terms such as “mineral resource”, “measured mineral resource”, “indicated mineral resource”, “inferred mineral resource”, “proven mineral reserves”, and “probable mineral reserves” for various types of technical studies. Although the principles for reporting mineral resources and reserves, including subcategories of measured, indicated, and inferred resources, are broadly similar under each set of standards, we caution you that estimates prepared solely under the JORC Code are not fully comparable to similarly titled measures disclosed under S - K 1300 or the other reporting and disclosure requirements of the U.S. federal securities laws, rules and regulations. Mineral Reserves and Resources of the Carolina Lithium Project Mineral reserve and mineral resource information contained in this presentation for the Carolina Lithium Project was prepared by Piedmont in accordance with S - K 1300 and the JORC Code. Mineral Reserves and Resources of the North American Lithium, Authier, and Moblan Projects Mineral reserve and mineral resource information contained in this presentation for the North American Lithium, Authier, and Moblan Projects were prepared in accordance with the JORC Code and NI 43 - 101. Such information was not prepared in accordance with S - K 1300.
