UNITED STATES
SECURITIES AND EXCHANGE COMMISSION
WASHINGTON, D.C. 20549
FORM 6-K
REPORT OF FOREIGN PRIVATE ISSUER
PURSUANT TO RULE 13a-16 OR 15d-16 UNDER
THE SECURITIES EXCHANGE ACT OF 1934
For the month of August 2025
Commission File Number: 001-39601
MINISO Group Holding Limited
8F, M Plaza, No. 109, Pazhou Avenue
Haizhu District, Guangzhou 510000, Guangdong Province
The People’s Republic of China
(Address of principal executive offices)
Indicate by check mark whether the registrant files or will file annual reports under cover of Form 20-F or Form 40-F.
Form 20-F x Form 40-F ¨
Exhibit Index
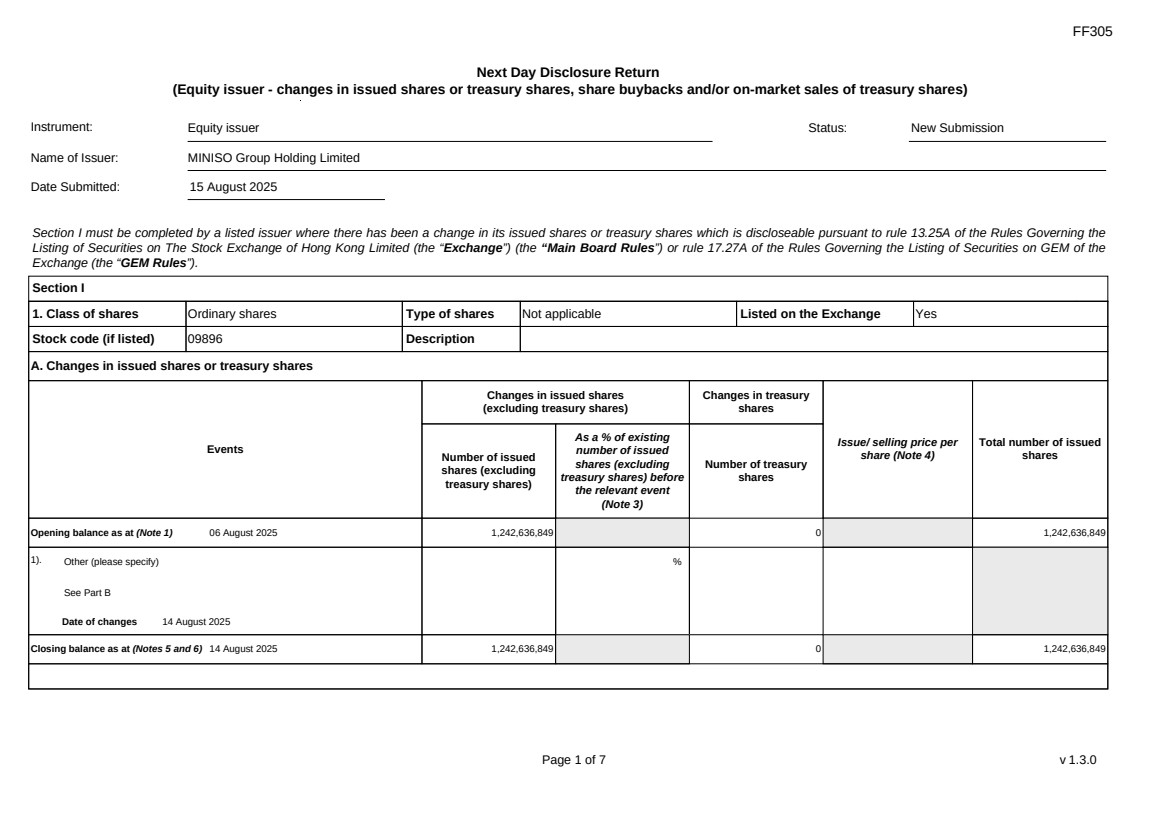
Exhibit 99.4 — Next Day Disclosure Return Dated August 15, 2025
Exhibit 99.5 — Next Day Disclosure Return Dated August 21, 2025
SIGNATURES
Pursuant to the requirements of the Securities Exchange Act of 1934, the registrant has duly caused this report to be signed on its behalf by the undersigned, thereunto duly authorized.
| MINISO Group Holding Limited | |||
| By | : | /s/ Jingjing Zhang | |
| Name | : | Jingjing Zhang | |
| Title | : | Chief Financial Officer | |
Date: August 22, 2025
Exhibit 99.1
MINISO Group Announces 2025 June Quarter and Interim Unaudited Financial Results
MINISO Group Delivers Accelerating Momentum: Same-Store GMV(1) Growth (the “SSSG”)
Turns Positive in June Quarter; Revenue Increased 23.1%; Operating Profit Increased
11.3%; Adjusted Diluted Earnings per ADS Increased 12.0%
MINISO Brand Resumes Net Store Network Expansion in Mainland China, with 30 Net New
Stores Opened in June Quarter
TOP TOY Brand Revenue Increased 87.0%, a New Growth Record for June Quarter
Announce Interim Dividend of US$0.2896 per ADS
GUANGZHOU, China, August 21, 2025 /PRNewswire/ -- MINISO Group Holding Limited (NYSE: MNSO; HKEX: 9896) (“MINISO”, “MINISO Group” or the “Company”), a global value retailer offering a variety of trendy lifestyle products featuring IP design, today announced its unaudited financial results for the three months and the six months ended June 30, 2025 (the “June Quarter” and the “First Half of 2025”, respectively).
Financial Highlights for the June Quarter
| · | Revenue increased 23.1% year over year to RMB4,966.1 million (US$693.2 million), above the high end of the Company’s previous guidance range of 18%-21%. |
| · | All three of the Company’s operating segments achieved a marked sequential improvement in SSSG(1) during the June quarter, propelling group-level SSSG(1) into positive territory after a mid-single digit contraction last quarter. |
| · | MINISO Brand’s SSSG(1) was flat year over year, underpinned by (i) low-single digit growth in mainland China, and (ii) low-single digit decline in overseas market. |
| · | TOP TOY Brand’s SSSG(1) advanced at a low-single digit growth rate year over year. |
| · | Gross margin was 44.3%, compared to 43.9% in the same period last year. |
| · | Operating profit increased 11.3% year over year to RMB836.2 million (US$116.7 million). |
| · | Adjusted operating profit(2) increased 8.5% year over year to RMB851.8 million (US$118.9 million), with adjusted operating margin of 17.2%, both ahead of the Company’s guidance. |
| · | Profit for the period was RMB489.5 million (US$68.3 million), compared to RMB591.4 million in the same period last year. |
| · | Adjusted net profit(2) increased 10.6% year over year to RMB691.5 million (US$96.5 million). |
| · | Adjusted net margin(2) was 13.9%, compared to 15.5% in the same period last year. |
| · | Adjusted EBITDA(2) increased 14.7% year over year to RMB1,149.5 million (US$160.5 million). |
| · | Adjusted EBITDA margin(2) was 23.1%, compared to 24.8% in the same period last year. |
| · | Adjusted basic and diluted earnings per ADS(2) were both RMB2.24 (US$0.31), increased by 12.0% year over year. |
Financial Highlights for the First Half of 2025
| · | Revenue increased 21.1% year over year to RMB9,393.1 million (US$1,311.2 million). |
| · | Gross profit increased 22.6% year over year to RMB4,156.9 million (US$580.3 million). |
| · | Gross margin was 44.3%, compared to 43.7% in the same period last year. |
| · | Operating profit increased 3.4% year over year to RMB1,545.9 million (US$215.8 million). |
| · | Adjusted operating profit(2) increased 1.7% year over year to RMB1,586.5 million (US$221.5 million), with adjusted operating margin of 16.9%. |
| · | Profit for the period was RMB906.0 million (US$126.5 million), compared with RMB1,177.4 million in the same period last year. |
| · | Adjusted net profit(2) was RMB1,278.7 million (US$178.5 million), compared with RMB1,241.9 million in the same period last year. |
| · | Adjusted net margin(2) was 13.6%, compared to 16.0% in the same period last year. |
| · | Adjusted EBITDA(2) increased 11.2% year over year to RMB2,186.8 million (US$305.3 million). |
| · | Adjusted EBITDA margin(2) was 23.3%, compared to 25.4% in the same period last year. |
| · | Adjusted basic and diluted earnings per ADS(2) was RMB4.16 (US$0.58) and RMB4.12 (US$0.58) respectively, compared with each of RMB3.96 in the same period last year. |
| · | Cash Position(3) was RMB7,466.1 million (US$1,042.2 million) as of June 30, 2025, compared to RMB6,698.1 million as of December 31, 2024. |
| · | Net cash from operating activities was RMB1,014.2 million (US$141.6 million). Capital expenditure was RMB434.8 million (US$60.7 million) and free cash flow was RMB579.4 million (US$80.9 million) for the First Half of 2025. |
Operational Highlights
| · | Total number of stores on group level was 7,905 as of June 30, 2025, representing a year-over-year increase of 842 net new stores. |
| · | Number of MINISO stores was 7,612 as of June 30, 2025, representing a year-over-year increase of 744 net new stores. |
| · | Number of MINISO stores in mainland China was 4,305 as of June 30, 2025, representing a year-over-year increase of 190 net new stores. |
| · | Number of MINISO stores in overseas markets reached 3,307 as of June 30, 2025, representing a year-over-year increase of 554 net new stores. |
| · | Number of TOP TOY stores was 293 as of June 30, 2025, representing a year-over-year increase of 98 net new stores. TOP TOY has also begun to expand into overseas markets since December quarter of 2024. This strategic move aligns with the Company's plan to expand globally and strengthen its brand presence. |
Notes:
| (1) | “Same-store GMV” refers to the GMV generated by those stores that opened prior to the beginning of the comparative periods and remained open as of the end of the comparative periods and closed for less than 30 days during both comparative periods. “SSSG” refers to the year-over-year growth of same-store GMV. |
| (2) | See the sections titled “Non-IFRS Financial Measures” and “Reconciliation of Non-IFRS Financial Measures” in this press release for more information. |
| (3) | “Cash position” refers to the combined balance of the Company’s cash and cash equivalents, restricted cash, term deposits with original maturity over three months, and other investments recorded as current assets. |
The following table provides a breakdown of the Company’s store network and its changes on a year-over-year basis. 74.5% of new MINISO stores in the past twelve months were located in overseas markets.
| As of | ||||||||||||
|
June 30, 2024 |
June 30, 2025 |
YoY | ||||||||||
| Number of stores on group level | 7,063 | 7,905 | 842 | |||||||||
| Number of MINISO stores | 6,868 | 7,612 | 744 | |||||||||
| Mainland China | 4,115 | 4,305 | 190 | |||||||||
| —Directly operated stores | 29 | 20 | (9 | ) | ||||||||
| —Stores operated under MINISO Retail Partner model | 4,063 | 4,258 | 195 | |||||||||
| —Stores operated under distributor model | 23 | 27 | 4 | |||||||||
| Overseas | 2,753 | 3,307 | 554 | |||||||||
| —Directly operated stores | 343 | 579 | 236 | |||||||||
| —Stores operated under MINISO Retail Partner model | 338 | 425 | 87 | |||||||||
| —Stores operated under distributor model | 2,072 | 2,303 | 231 | |||||||||
| Number of TOP TOY stores | 195 | 293 | 98 | |||||||||
| —Directly operated stores | 21 | 38 | 17 | |||||||||
| —Stores operated under MINISO Retail Partner model | 174 | 250 | 76 | |||||||||
| —Stores operated under distributor model | - | 5 | 5 | |||||||||
Mr. Guofu Ye, Founder, Chairman, and CEO of MINISO, commented, “We are gratified that MINISO Group accelerated growth in the June Quarter and we delivered a double-digit growth of operating profit which exceeded our expectations. It was encouraging that MINISO mainland China SSSG turned positive for the June Quarter and further accelerated entering the September quarter. The outperformance in MINISO mainland China in such a hyper-competitive domestic physical retail environment further underscores our strong execution and resilience of our business model. We estimate that same-store GMV in MINISO mainland China will achieve positive growth for the whole year of 2025."
"We are thrilled to see improvement in overseas same-store GMV in the June Quarter, especially in our strategic markets Europe and North America. As we look ahead at the second half of 2025, we expect that our investments in directly operated business will unleash the sales potential and optimize our margin profiles. We are optimistic about building on the momentum we have created and well positioned to deliver sustainable and high-quality growth overseas. We are also pleased that TOP TOY recorded another impressive revenue growth of 87.0%, marked by robust performance of pop toy products and stronger store networks. It is worth mentioning that TOP TOY recently has completed strategic financing by Temasek, with post-valuation of about HK$10 billion, demonstrating its market recognition in pop toy industry." Mr. Ye continued.
Mr. Eason Zhang, CFO of MINISO, commented, “We are encouraged by our better-than-expected quarterly performance in top line, growing by 23.1% year over year, accelerated from the last quarter. We now expect revenue growth to accelerate for the remainder of 2025. Gross margin reached 44.3%, increased by 0.4 percentage point year over year. Adjusted EBITDA for the June Quarter grew by 14.7% year over year to RMB1,149.5 million, accelerated from last quarter as well, with an adjusted EBITDA margin of 23.1%.”
"The board of the Company has approved an interim cash dividend for the First Half of 2025, with a total amount of approximately RMB639.5 million. Return to shareholders including share repurchases and cash dividends paid for the First Half of 2025 reached about RMB1,071 million, as about 84% of adjusted net profit, compared to about 55% in the same period last year. Our capital allocation strategy will also continue to balance fast growth and our commitment to bring stable and foreseeable returns to shareholders.” Mr. Zhang concluded.
Recent Developments
Interim Dividend Declaration
On August 21, 2025, the Company’s board of directors approved the distribution of an interim
cash dividend in the amount of US$0.2896 per ADS or US$0.0724 per ordinary share, to holders of ADSs and ordinary shares of record as of the close of business on September 5, 2025, New York Time and Beijing/Hong Kong Time, respectively. The ex-dividend date for the holders of ordinary shares in Hong Kong will be September 4, 2025; and the ex-dividend date for holders of ADSs will be September 5, 2025. The payment date is expected to be September 16, 2025 for holders of ordinary shares and September 19, 2025 for holders of ADSs. The aggregate amount of cash dividend to be paid is approximately US$89.3 million (RMB639.5 million at an exchange rate of RMB7.1636 to US$1.0000), which is approximately 50% of the Company’s adjusted net profit for the First Half of 2025 and will be distributed from additional paid-in capital and settled by a cash distribution. For holders of ordinary shares, in order to qualify for the interim cash dividend, all valid documents for the transfer of ordinary shares accompanied by the relevant share certificates must be lodged for registration with the Company’s Hong Kong share registrar, Computershare Hong Kong Investor Services Limited, at Shops 1712-1716, 17th Floor, Hopewell Centre, 183 Queen’s Road East, Wanchai, Hong Kong no later than 4:30 P.M. on September 5, 2025 (Beijing/Hong Kong Time).
Update on TOP TOY
TOP TOY recently has completed a round of strategic financing led by Temasek, a global investment company headquartered in Singapore. The post-transaction valuation of TOP TOY reached around HK$10 billion, demonstrating the market recognition of TOP TOY's business model, brand equity, and global expansion roadmap on a rapid growth trajectory of its pop toy business.
Financial Results for the June Quarter
Revenue was RMB4,966.1 million (US$693.2 million), representing an increase of 23.1% year over year.
Revenue from MINISO brand increased by 19.5% year over year to RMB4,563.2 million (US$637.0 million), including (i) an increase of 13.6% in revenue from MINISO brand in mainland China, accelerating from last quarter, and (ii) an increase of 28.6% in revenue from MINISO brand in overseas markets. Overseas revenue contributed to 42.6% of revenue from MINISO brand, compared to 39.5% in the same period last year.
Revenue from TOP TOY brand increased by 87.0% to RMB402.2 million (US$56.1 million).
For more information on the composition and year-over-year change of revenue, please refer to the “Unaudited Additional Information” in this press release.
Cost of sales was RMB2,767.2 million (US$386.3 million), representing an increase of 22.3% year over year.
Gross profit was RMB2,198.9 million (US$307.0 million), representing an increase of 24.0% year over year.
Gross margin was 44.3%, representing an increase of 0.4 percentage point year over year. The year-over-year increase in gross margin was primarily due to (i) higher revenue contribution from overseas markets, and (ii) higher gross margin of TOP TOY.
Selling and distribution expenses were RMB1,159.8 million (US$161.9 million), representing an increase of 40.4% year over year. Excluding share-based compensation expenses, selling and distribution expenses were RMB1,154.2 million (US$161.1 million), representing an increase of 42.8% year over year. The year-over-year increase was mainly attributable to the Company’s investments into directly operated stores to pursue the future success of the Company’s business, especially in strategic overseas markets such as the U.S. market. As of June 30, 2025, total number of directly operated stores on the group level was 637, compared to 393 as of June 30, 2024. In the June Quarter, revenue from directly operated stores increased 78.7%, while related expenses including rental and related expenses, depreciation and amortization expenses together with payroll excluding share-based compensation expenses increased 56.3%, decelerating from the year-over-year increase of 71.4% in last quarter. Promotion and advertising expenses increased 20.4%, as a percentage of revenue stabilizing at around 3% in both comparative periods. Licensing expenses increased 25.9%, as a percentage of revenue ranging from 2% to 3% in both comparative periods. Logistics expenses increased 21.3% year over year.
General and administrative expenses were RMB261.5 million (US$36.5 million), representing an increase of 15.1% year over year. Excluding share-based compensation expenses, general and administrative expenses were RMB251.4 million (US$35.1 million), representing an increase of 19.1% year over year. The year-over-year increase was primarily due to the increase of personnel-related expenses in relation to the growth of the Company’s business.
Other net income was RMB77.4 million (US$10.8 million), compared to RMB26.9 million in the same period last year. The year-over-year increase was mainly due to (i) an increase in investment income in wealth management products, and (ii) a net foreign exchange gain compared with a net foreign exchange loss in the same period last year.
Operating profit was RMB836.2 million (US$116.7 million), representing an increase of 11.3% year over year.
Adjusted operating profit(1) was RMB851.8 million (US$118.9 million), representing an increase of 8.5% year over year.
Net finance cost was RMB79.4 million (US$11.1 million), compared to net finance income of RMB9.0 million in the same period last year. The year-over-year increase in finance cost was due to (i) increased interest expenses in relation to the equity linked securities issued by the Company in January 2025 ( the “Equity Linked Securities”) and the bank loans used for acquisition of the equity interest of Yonghui Superstores Co., Ltd*(永輝超市股份有限公司) (the “Yonghui”), both of which have been excluded in non-IFRS financial measures(1), and (ii) increased interest expenses on lease liabilities corresponding to the Company’s investment in directly operated stores.
Share of loss of equity-accounted investees, net of tax was RMB136.9 million (US$19.1 million), compared to share of profit of RMB0.2 million in the same period last year. The year-over-year change was mainly attributable to share of loss in Yonghui, which has been excluded in non-IFRS financial measures(1).
Other gain was RMB6.7 million (US$0.9 million), mainly attributable to gain from fair value change of derivatives under mark-to-market impact, which was in relation to the Equity Linked Securities and has been excluded in non-IFRS financial measures(1).
Profit for the period was RMB489.5 million (US$68.3 million), compared to RMB591.4 million in the same period last year.
Adjusted net profit(1) was RMB691.5 million (US$96.5 million), increased by 10.6% year over year.
Adjusted net margin(1) was 13.9%, compared to 15.5% in the same period last year.
Adjusted EBITDA(1) was RMB1,149.5 million (US$160.5 million), representing an increase of 14.7% year over year.
Adjusted EBITDA margin(1) was 23.1%, compared to 24.8% in the same period last year.
Basic and diluted earnings per ADS were both RMB1.60 (US$0.22) in the June Quarter, compared with RMB1.88 in the same period last year.
Adjusted basic and diluted earnings per ADS(1) were both RMB2.24 (US$0.31) in the June Quarter, representing an increase of 12.0% year over year from RMB2.00 in the same period last year.
Financial Results for the First Half of 2025
Revenue was RMB9,393.1 million (US$1,311.2 million), representing an increase of 21.1% year over year.
Revenue from MINISO brand increased by 18.1% to RMB8,649.0 million (US$1,207.4 million), including (i) an increase of 11.4% in revenue from MINISO brand in mainland China, and (ii) an increase of 29.4% in revenue from MINISO brand in overseas markets. The overseas revenue contributed 40.9% of revenue from MINISO brand, compared to 37.3% in the same period last year.
Revenue from TOP TOY brand increased by 73.0% to RMB742.1 million (US$103.6 million), primarily powered by its rapid growth in average store counts.
For more information on the composition and year-over-year change of revenue, please refer to the “Unaudited Additional Information” in this press release.
Cost of sales was RMB5,236.2 million (US$730.9 million), representing an increase of 19.8% year over year.
Gross profit was RMB4,156.9 million (US$580.3 million), representing an increase of 22.6% year over year.
Gross margin reached historical high of 44.3% across previous first half of the years, representing an increase of 0.6 percentage point. The year-over-year increase in gross margin was primarily due to (i) higher revenue contribution from overseas markets, and (ii) higher gross margin of TOP TOY.
Other income was RMB5.4 million (US$0.8 million), compared to RMB12.7 million in the same period last year.
Selling and distribution expenses were RMB2,181.0 million (US$304.5 million), increased by 43.3% year over year. Excluding share-based compensation expenses, selling and distribution expenses were RMB2,167.1 million (US$302.5million), increased by 46.4% year over year.
General and administrative expenses were RMB503.7 million (US$70.3 million), increased by 20.3% year over year. Excluding share-based compensation expenses, general and administrative expenses were RMB477.0 million (US$66.6 million), increased by 20.6% year over year.
Other net income was RMB98.2 million (US$13.7 million), compared to RMB41.7 million in the same period last year. The year-over-year increase was mainly due to (i) an increase in investment income in wealth management products, and (ii) a net foreign exchange gain compared with a net foreign exchange loss in the same period last year.
Operating profit was RMB1,545.9 million (US$215.8 million), representing an increase of 3.4% year over year.
Adjusted operating profit(1) was RMB1,586.5 million (US$221.5 million), representing an increase of 1.7% year over year.
Net finance cost was RMB128.4 million (US$17.9 million), compared to net finance income of RMB34.0 million in the same period last year. The year-over-year increase in finance cost was due to (i) increased interest expenses in relation to the Equity Linked Securities and the bank loans used for acquisition of the equity interest of Yonghui, both of which have been excluded in non-IFRS financial measures(1), and (ii) increased interest expenses on lease liabilities corresponding to the Company’s investment in directly operated stores.
Share of loss of equity-accounted investees, net of tax was RMB138.9 million (US$19.4 million), compared with share of profit of RMB0.3 million in the same period last year. The year-over-year change was mainly attributable to share of loss in Yonghui, which has been excluded in non-IFRS financial measures(1).
Other expenses was RMB84.4 million (US$11.8 million), mainly attributable to loss from fair value change of derivatives under mark-to-market impact and issuance cost of derivatives, which were in relation to the Equity Linked Securities and have been excluded in non-IFRS financial measures(1).
Profit for the period was RMB906.0 million (US$126.5 million), compared to RMB1,177.4 million in the same period last year.
Adjusted net profit(1) was RMB1,278.7 million (US$178.5 million), compared to RMB1,241.9 million in the same period last year.
Adjusted net margin(1) was 13.6%, compared to 16.0% in the same period last year.
Adjusted EBITDA(1) increased 11.2% year over year to RMB2,186.8 million (US$305.3 million).
Adjusted EBITDA margin(1) was 23.3%, compared to 25.4% in the same period last year.
Basic earnings per ADS was RMB2.96 (US$0.41), compared to RMB3.76 in the same period last year.
Diluted earnings per ADS was RMB2.92 (US$0.41), compared to RMB3.76 in the same period last year.
Adjusted basic earnings per ADS(1) increased 5.1% year over year to RMB4.16 (US$0.58), compared to RMB3.96 in the same period last year.
Adjusted diluted earnings per ADS(1) increased 4.0% year over year to RMB4.12 (US$0.58), compared to RMB3.96 in the same period last year.
Cash position, which was the combined balance of the Company’s cash and cash equivalents, restricted cash, term deposits, and other investments recorded as current assets was RMB7,466.1 million (US$1,042.2 million) as of June 30, 2025, compared to RMB6,698.1 million as of December 31, 2024.
Net cash from operating activities was RMB1,014.2 million (US$141.6 million). Capital expenditure was RMB434.8 million (US$60.7 million) and free cash flow was RMB579.4 million (US$80.9 million) for the First Half of 2025.
Note:
(1) See the sections titled “Non-IFRS Financial Measures” and “Reconciliation of Non-IFRS Financial Measures” in this press release for more information.
Conference Call
The Company’s management will hold an earnings conference call at 5:00 A.M. Eastern Time on Thursday, August 21, 2025 (5:00 P.M. Beijing Time on the same day) to discuss the financial results. Simultaneous interpretation in English will be provided during the conference call. The conference call can be accessed by the following Zoom link or dialing the following numbers:
Access 1
Join Zoom meeting.
Zoom link: https://zoom.us/j/91975768223?pwd=9ExRKhgHx8Q8QQyhZBwhNzPa1p3rea.1
Meeting Number: 919 7576 8223
Meeting Passcode: 9896
Access 2
Listeners may access the call by dialing the following numbers with the same meeting number and passcode with access 1.
| United States: | +1 689 278 1000 (or +1 719 359 4580) |
| Hong Kong, China: | +852 5803 3730 (or +852 5803 3731) |
| United Kingdom: | +44 203 481 5237 (or +44 131 460 1196) |
| France: | +33 1 7037 9729 (or +33 1 7037 2246) |
| Singapore: | +65 3158 7288 (or +65 3165 1065) |
| Canada: | +1 438 809 7799 (or +1 204 272 7920) |
Access 3
Listeners can also access the meeting through the Company’s investor relations website at https://ir.miniso.com/.
The replay will be available approximately two hours after the conclusion of the live event at the Company’s investor relations website at https://ir.miniso.com/.
About MINISO Group
MINISO Group is a global value retailer offering a variety of trendy lifestyle products featuring IP design. The Company serves consumers primarily through its large network of MINISO stores, and promotes a relaxing, treasure-hunting and engaging shopping experience full of delightful surprises that appeals to all demographics. Aesthetically pleasing design, quality and affordability are at the core of every product in MINISO’s wide product portfolio, and the Company continually and frequently rolls out products with these qualities. Since the opening of its first store in China in 2013, the Company has built its flagship brand “MINISO” as a globally recognized retail brand and established a massive store network worldwide. For more information, please visit https://ir.miniso.com/.
Exchange Rate
The U.S. dollar (US$) amounts disclosed in this press release, except for those transaction amounts that were actually settled in U.S. dollars, are presented solely for the convenience of the readers. The conversion of Renminbi (RMB) into US$ in this press release is based on the exchange rate set forth in the H.10 statistical release of the Board of Governors of the Federal Reserve System as of June 30, 2025, which was RMB7.1636 to US$1.0000. The percentages stated in this press release are calculated based on the RMB amounts.
Non-IFRS Financial Measures
In evaluating the business, MINISO considers and uses adjusted operating profit, adjusted operating margin, adjusted net profit, adjusted net margin, adjusted EBITDA, adjusted EBITDA margin, adjusted basic and diluted net earnings per share and adjusted basic and diluted net earnings per ADS as supplemental measures to review and assess its operating performance. The presentation of these non-IFRS financial measures is not intended to be considered in isolation or as a substitute for the financial information prepared and presented in accordance with IFRS. MINISO defines adjusted operating profit as operating profit for the period excluding equity-settled share-based payment expenses. MINISO calculates adjusted operating margin by dividing adjusted operating profit by revenue for the same period. MINISO defines adjusted net profit as profit for the period excluding equity-settled share-based payment expenses, gain or loss from fair value change of derivatives, issuance cost of derivatives and interest expenses related to Equity Linked Securities, interest expenses related to the bank loans used for acquisition of the equity interest in Yonghui, and share of profit or loss of Yonghui, net of tax. MINISO calculates adjusted net margin by dividing adjusted net profit by revenue for the same period. MINISO defines adjusted EBITDA as adjusted net profit plus depreciation and amortization, finance costs excluding interest expenses related to Equity Linked Securities and interest expenses related to the bank loans used for acquisition of the equity interest in Yonghui and income tax expense. Adjusted EBITDA margin is computed by dividing adjusted EBITDA by revenue for the period. MINISO computes adjusted basic and diluted net earnings per ADS by dividing adjusted net profit attributable to the equity shareholders of the Company by the number of ADSs represented by the number of ordinary shares used in the basic and diluted earnings per share calculation on an IFRS basis. MINISO computes adjusted basic and diluted net earnings per share in the same way as it calculates adjusted basic and diluted net earnings per ADS, except that it uses the number of ordinary shares used in the basic and diluted earnings per share calculation on an IFRS basis as the denominator instead of the number of ADSs represented by these ordinary shares.
MINISO presents these non-IFRS financial measures because they are used by the management to evaluate its operating performance and formulate business plans. These non-IFRS financial measures enable the management to assess its operating results without considering the impacts of the aforementioned non-cash and other adjustment items that MINISO does not consider to be indicative of its operating performance in the future. Accordingly, MINISO believes that the use of these non-IFRS financial measures provides useful information to investors and others in understanding and evaluating its operating results in the same manner as the management and board of directors.
These non-IFRS financial measures are not defined under IFRS and are not presented in accordance with IFRS. These non-IFRS financial measures have limitations as analytical tools. One of the key limitations of using these non-IFRS financial measures is that they do not reflect all items of income and expense that affect MINISO’s operations. Further, these non-IFRS financial measures may differ from the non-IFRS information used by other companies, including peer companies, and therefore their comparability may be limited.
These non-IFRS financial measures should not be considered in isolation or construed as alternatives to profit, net profit margin, basic and diluted earnings per share and basic and diluted earnings per ADS, as applicable, or any other measures of performance or as indicators of MINISO’s operating performance. Investors are encouraged to review MINISO’s historical non-IFRS financial measures in light of the most directly comparable IFRS measures, as shown below. The non-IFRS financial measures presented here may not be comparable to similarly titled measures presented by other companies. Other companies may calculate similarly titled measures differently, limiting the usefulness of such measures when analyzing MINISO’s data comparatively. MINISO encourages you to review its financial information in its entirety and not rely on a single financial measure.
For more information on the non-IFRS financial measures, please see the table captioned “Reconciliation of Non-IFRS Financial Measures” set forth at the end of this press release.
Safe Harbor Statement
This announcement contains forward-looking statements. These statements are made under the “safe harbor” provisions of the U.S. Private Securities Litigation Reform Act of 1995. These forward-looking statements can be identified by words or phrases such as “may”, “will”, “expect”, “anticipate”, “aim”, “estimate”, “intend”, “plan”, “believe”, “is/are likely to”, “potential”, “continue” or other similar expressions. Among other things, the quotations from management in this announcement, as well as MINISO’s strategic and operational plans, contain forward-looking statements. MINISO may also make written or oral forward-looking statements in its periodic reports to the U.S. Securities and Exchange Commission (the “SEC”) and The Stock Exchange of Hong Kong Limited (the “HKEX”), in its annual report to shareholders, in press releases and other written materials and in oral statements made by its officers, directors or employees to third parties. Statements that are not historical facts, including statements about MINISO’s beliefs and expectations, are forward-looking statements. Forward-looking statements involve inherent risks and uncertainties. A number of factors could cause actual results to differ materially from those contained in any forward-looking statement, including but not limited to the following: MINISO’s mission, goals and strategies; future business development, financial conditions and results of operations; the expected growth of the retail market and the market of branded variety retail of lifestyle products in China and globally; expectations regarding demand for and market acceptance of MINISO’s products; expectations regarding MINISO’s relationships with consumers, suppliers, MINISO Retail Partners, local distributors, and other business partners; competition in the industry; proposed use of proceeds; and relevant government policies and regulations relating to MINISO’s business and the industry. Further information regarding these and other risks is included in MINISO’s filings with the SEC and the HKEX. All information provided in this press release and in the attachments is as of the date of this press release, and MINISO undertakes no obligation to update any forward-looking statement, except as required under applicable law.
Investor Relations Contacts:
MINISO Group Holding Limited
Email: ir@miniso.com
Phone: +86 (20) 36228788 Ext.8039
| MINISO GROUP HOLDING LIMITED | ||||||||||||
| UNAUDITED CONDENSED CONSOLIDATED STATEMENTS OF FINANCIAL POSITION | ||||||||||||
| (Expressed in thousands) | ||||||||||||
| As at | As at | |||||||||||
| December 31, 2024 | June 30, 2025 | |||||||||||
| (Audited) | (Unaudited) | |||||||||||
| RMB’000 | RMB’000 | US$’000 | ||||||||||
| ASSETS | ||||||||||||
| Non-current assets | ||||||||||||
| Property, plant and equipment | 1,436,939 | 1,702,062 | 237,599 | |||||||||
| Right-of-use assets | 4,172,083 | 4,635,139 | 647,040 | |||||||||
| Intangible assets | 8,802 | 7,545 | 1,053 | |||||||||
| Goodwill | 21,418 | 46,030 | 6,426 | |||||||||
| Deferred tax assets | 181,948 | 217,963 | 30,426 | |||||||||
| Other investments | 123,399 | 122,570 | 17,110 | |||||||||
| Trade and other receivables | 341,288 | 212,750 | 29,699 | |||||||||
| Term deposits | 140,183 | - | - | |||||||||
| Financial derivative assets | - | 799,751 | 111,641 | |||||||||
| Interests in equity-accounted investees | 38,567 | 6,171,304 | 861,481 | |||||||||
| 6,464,627 | 13,915,114 | 1,942,475 | ||||||||||
| Current assets | ||||||||||||
| Other investments | 100,000 | - | - | |||||||||
| Inventories | 2,750,389 | 2,836,348 | 395,939 | |||||||||
| Trade and other receivables | 2,207,013 | 2,430,263 | 339,252 | |||||||||
| Cash and cash equivalents | 6,328,121 | 7,115,183 | 993,241 | |||||||||
| Restricted cash | 1,026 | 5,527 | 772 | |||||||||
| Term deposits | 268,952 | 345,353 | 48,209 | |||||||||
| 11,655,501 | 12,732,674 | 1,777,413 | ||||||||||
| Total assets | 18,120,128 | 26,647,788 | 3,719,888 | |||||||||
| MINISO GROUP HOLDING LIMITED | ||||||||||||
| UNAUDITED CONDENSED CONSOLIDATED STATEMENTS
OF FINANCIAL POSITION (CONTINUED) |
||||||||||||
| (Expressed in thousands) | ||||||||||||
| As at | As at | |||||||||||
| December 31, 2024 | June 30, 2025 | |||||||||||
| (Audited) | (Unaudited) | |||||||||||
| RMB’000 | RMB’000 | US$’000 | ||||||||||
| EQUITY | ||||||||||||
| Share capital | 94 | 94 | 13 | |||||||||
| Additional paid-in capital | 4,683,577 | 3,956,803 | 552,348 | |||||||||
| Other reserves | 1,329,126 | 1,687,003 | 235,497 | |||||||||
| Retained earnings | 4,302,177 | 5,208,207 | 727,038 | |||||||||
| Equity attributable to equity shareholders of the Company | 10,314,974 | 10,852,107 | 1,514,896 | |||||||||
| Non-controlling interests | 40,548 | 46,812 | 6,535 | |||||||||
| Total equity | 10,355,522 | 10,898,919 | 1,521,431 | |||||||||
| LIABILITIES | ||||||||||||
| Non-current liabilities | ||||||||||||
| Contract liabilities | 35,145 | 27,758 | 3,875 | |||||||||
| Loans and borrowings | 4,310 | 5,589,413 | 780,252 | |||||||||
| Other payables | 59,842 | 73,586 | 10,272 | |||||||||
| Lease liabilities | 1,903,137 | 2,177,289 | 303,938 | |||||||||
| Financial derivative liabilities | - | 1,230,927 | 171,831 | |||||||||
| Deferred income | 34,983 | 34,501 | 4,816 | |||||||||
| 2,037,417 | 9,133,474 | 1,274,984 | ||||||||||
| MINISO GROUP HOLDING LIMITED | ||||||||||||
| UNAUDITED CONDENSED CONSOLIDATED STATEMENTS
OF FINANCIAL POSITION (CONTINUED) |
||||||||||||
| (Expressed in thousands) | ||||||||||||
| As at | As at | |||||||||||
| December 31, 2024 | June 30, 2025 | |||||||||||
| (Audited) | (Unaudited) | |||||||||||
| RMB’000 | RMB’000 | US$’000 | ||||||||||
| Current liabilities | ||||||||||||
| Contract liabilities | 323,292 | 290,706 | 40,581 | |||||||||
| Loans and borrowings | 566,955 | 1,707,170 | 238,312 | |||||||||
| Trade and other payables | 3,943,988 | 3,561,523 | 497,168 | |||||||||
| Lease liabilities | 635,357 | 883,423 | 123,321 | |||||||||
| Deferred income | 5,376 | 2,024 | 283 | |||||||||
| Current taxation | 252,221 | 170,549 | 23,808 | |||||||||
| 5,727,189 | 6,615,395 | 923,473 | ||||||||||
| Total liabilities | 7,764,606 | 15,748,869 | 2,198,457 | |||||||||
| Total equity and liabilities | 18,120,128 | 26,647,788 | 3,719,888 | |||||||||
| MINISO GROUP HOLDING LIMITED | ||||||||||||||||||||||||
|
UNAUDITED CONDENSED CONSOLIDATED STATEMENTS OF PROFIT OR LOSS AND OTHER COMPREHENSIVE INCOME |
||||||||||||||||||||||||
| (Expressed in thousands, except for per ordinary share and per ADS data) | ||||||||||||||||||||||||
| Three months ended June 30, | Six months ended June 30, | |||||||||||||||||||||||
| 2024 | 2025 | 2024 | 2025 | |||||||||||||||||||||
| (Unaudited) | (Unaudited) | (Unaudited) | (Unaudited) | |||||||||||||||||||||
| RMB’000 | RMB’000 | US$’000 | RMB’000 | RMB’000 | US$’000 | |||||||||||||||||||
| Revenue | 4,035,212 | 4,966,068 | 693,236 | 7,758,743 | 9,393,112 | 1,311,228 | ||||||||||||||||||
| Cost of sales | (2,261,884 | ) | (2,767,187 | ) | (386,284 | ) | (4,368,957 | ) | (5,236,194 | ) | (730,944 | ) | ||||||||||||
| Gross profit | 1,773,328 | 2,198,881 | 306,952 | 3,389,786 | 4,156,918 | 580,284 | ||||||||||||||||||
| Other income | 9,053 | 2,350 | 328 | 12,698 | 5,370 | 750 | ||||||||||||||||||
| Selling and distribution expenses | (826,061 | ) | (1,159,836 | ) | (161,907 | ) | (1,522,088 | ) | (2,181,022 | ) | (304,459 | ) | ||||||||||||
| General and administrative expenses | (227,232 | ) | (261,512 | ) | (36,506 | ) | (418,573 | ) | (503,656 | ) | (70,308 | ) | ||||||||||||
| Other net income | 26,867 | 77,404 | 10,805 | 41,696 | 98,239 | 13,714 | ||||||||||||||||||
| Credit loss on trade and other receivables | (2,939 | ) | (4,675 | ) | (653 | ) | (3,606 | ) | (13,450 | ) | (1,878 | ) | ||||||||||||
| Impairment loss on non-current assets | (1,492 | ) | (16,450 | ) | (2,296 | ) | (5,104 | ) | (16,450 | ) | (2,296 | ) | ||||||||||||
| Operating profit | 751,524 | 836,162 | 116,723 | 1,494,809 | 1,545,949 | 215,807 | ||||||||||||||||||
| Finance income | 33,716 | 28,921 | 4,037 | 74,606 | 65,836 | 9,190 | ||||||||||||||||||
| Finance costs | (24,686 | ) | (108,291 | ) | (15,117 | ) | (40,595 | ) | (194,236 | ) | (27,114 | ) | ||||||||||||
| Net finance income/(cost) | 9,030 | (79,370 | ) | (11,080 | ) | 34,011 | (128,400 | ) | (17,924 | ) | ||||||||||||||
| Share of profit/(loss) of equity-accounted investees, net of tax | 181 | (136,941 | ) | (19,116 | ) | 301 | (138,946 | ) | (19,396 | ) | ||||||||||||||
| Other gain/(expenses) | - | 6,659 | 930 | - | (84,412 | ) | (11,783 | ) | ||||||||||||||||
| Profit before taxation | 760,735 | 626,510 | 87,457 | 1,529,121 | 1,194,191 | 166,704 | ||||||||||||||||||
| Income tax expense | (169,310 | ) | (136,979 | ) | (19,122 | ) | (351,742 | ) | (288,201 | ) | (40,231 | ) | ||||||||||||
| Profit for the period | 591,425 | 489,531 | 68,335 | 1,177,379 | 905,990 | 126,473 | ||||||||||||||||||
| Attributable to: | ||||||||||||||||||||||||
| Equity shareholders of the Company | 587,630 | 489,688 | 68,357 | 1,170,102 | 906,030 | 126,479 | ||||||||||||||||||
| Non-controlling interests | 3,795 | (157 | ) | (22 | ) | 7,277 | (40 | ) | (6 | ) | ||||||||||||||
| Earnings per share for ordinary shares | ||||||||||||||||||||||||
| -Basic | 0.47 | 0.40 | 0.06 | 0.94 | 0.74 | 0.10 | ||||||||||||||||||
| -Diluted | 0.47 | 0.40 | 0.06 | 0.94 | 0.73 | 0.10 | ||||||||||||||||||
| Earnings per ADS | ||||||||||||||||||||||||
| (Each ADS represents 4 ordinary shares) | ||||||||||||||||||||||||
| -Basic | 1.88 | 1.60 | 0.22 | 3.76 | 2.96 | 0.41 | ||||||||||||||||||
| -Diluted | 1.88 | 1.60 | 0.22 | 3.76 | 2.92 | 0.41 | ||||||||||||||||||
| MINISO GROUP HOLDING LIMITED | ||||||||||||||||||||||||
|
UNAUDITED CONDENSED CONSOLIDATED STATEMENTS OF PROFIT OR LOSS AND OTHER COMPREHENSIVE INCOME (CONTINUED) |
||||||||||||||||||||||||
| (Expressed in thousands) | ||||||||||||||||||||||||
| Three months ended June 30, | Six months ended June 30, | |||||||||||||||||||||||
| 2024 | 2025 | 2024 | 2025 | |||||||||||||||||||||
| (Unaudited) | (Unaudited) | (Unaudited) | (Unaudited) | |||||||||||||||||||||
| RMB’000 | RMB’000 | US$’000 | RMB’000 | RMB’000 | US$’000 | |||||||||||||||||||
| Profit for the period | 591,425 | 489,531 | 68,335 | 1,177,379 | 905,990 | 126,473 | ||||||||||||||||||
| Items that may be reclassified subsequently to profit or loss: | ||||||||||||||||||||||||
| Exchange differences on translation of financial statements of foreign operations | 2,990 | 12,966 | 1,810 | 6,845 | 11,675 | 1,630 | ||||||||||||||||||
| Other comprehensive income for the period | 2,990 | 12,966 | 1,810 | 6,845 | 11,675 | 1,630 | ||||||||||||||||||
| Total comprehensive income for the period | 594,415 | 502,497 | 70,145 | 1,184,224 | 917,665 | 128,103 | ||||||||||||||||||
| Attributable to: | ||||||||||||||||||||||||
| Equity shareholders of the Company | 591,877 | 501,095 | 69,949 | 1,178,043 | 917,401 | 128,066 | ||||||||||||||||||
| Non-controlling interests | 2,538 | 1,402 | 196 | 6,181 | 264 | 37 | ||||||||||||||||||
| MINISO GROUP HOLDING LIMITED | ||||||||||||||||||||||||
| RECONCILIATION OF NON-IFRS FINANCIAL MEASURES | ||||||||||||||||||||||||
| (Expressed in thousands, except for per share, per ADS data and percentages) | ||||||||||||||||||||||||
| Three months ended June 30, | Six months ended June 30, | |||||||||||||||||||||||
| 2024 | 2025 | 2024 | 2025 | |||||||||||||||||||||
| (Unaudited) | (Unaudited) | (Unaudited) | (Unaudited) | |||||||||||||||||||||
| RMB’000 | RMB’000 | US$’000 | RMB’000 | RMB’000 | US$’000 | |||||||||||||||||||
| Reconciliation of profit for the period to adjusted net profit: | ||||||||||||||||||||||||
| Profit for the period | 591,425 | 489,531 | 68,335 | 1,177,379 | 905,990 | 126,473 | ||||||||||||||||||
| Add back: | ||||||||||||||||||||||||
| Equity-settled share-based payment expenses | 33,570 | 15,656 | 2,185 | 64,507 | 40,586 | 5,666 | ||||||||||||||||||
| (Gain)/loss from fair value change of derivatives(1) | - | (6,659 | ) | (930 | ) | - | 39,748 | 5,549 | ||||||||||||||||
| Issuance cost of derivatives(2) | - | - | - | - | 44,664 | 6,235 | ||||||||||||||||||
| Interest expenses related to Equity Linked Securities and the bank loans used for acquisition of the equity interest in Yonghui | - | 73,606 | 10,275 | - | 128,351 | 17,917 | ||||||||||||||||||
| -Interest expenses related to the Equity Linked Securities(3) | - | 49,358 | 6,890 | - | 89,885 | 12,547 | ||||||||||||||||||
| -Interest expenses related to the bank loans used for acquisition of the equity interest in Yonghui | - | 24,248 | 3,385 | - | 38,466 | 5,370 | ||||||||||||||||||
| Share of loss of Yonghui, net of tax | - | 119,335 | 16,659 | - | 119,335 | 16,659 | ||||||||||||||||||
| Adjusted net profit | 624,995 | 691,469 | 96,524 | 1,241,886 | 1,278,674 | 178,499 | ||||||||||||||||||
| Adjusted net margin | 15.5 | % | 13.9 | % | 13.9 | % | 16.0 | % | 13.6 | % | 13.6 | % | ||||||||||||
| Attributable to: | ||||||||||||||||||||||||
| Equity shareholders of the Company | 621,021 | 691,630 | 96,546 | 1,234,430 | 1,278,629 | 178,493 | ||||||||||||||||||
| Non-controlling interests | 3,974 | (161 | ) | (22 | ) | 7,456 | 45 | 6 | ||||||||||||||||
| Adjusted net earnings per share(4) | ||||||||||||||||||||||||
| -Basic | 0.50 | 0.56 | 0.08 | 0.99 | 1.04 | 0.15 | ||||||||||||||||||
| -Diluted | 0.50 | 0.56 | 0.08 | 0.99 | 1.03 | 0.14 | ||||||||||||||||||
| Adjusted net earnings per ADS (Each ADS represents 4 ordinary shares) | ||||||||||||||||||||||||
| -Basic | 2.00 | 2.24 | 0.31 | 3.96 | 4.16 | 0.58 | ||||||||||||||||||
| -Diluted | 2.00 | 2.24 | 0.31 | 3.96 | 4.12 | 0.58 | ||||||||||||||||||
| MINISO GROUP HOLDING LIMITED | ||||||||||||||||||||||||
| RECONCILIATION OF NON-IFRS FINANCIAL MEASURES (CONTINUED) | ||||||||||||||||||||||||
| (Expressed in thousands, except for percentages) | ||||||||||||||||||||||||
| Three months ended June 30, | Six months ended June 30, | |||||||||||||||||||||||
| 2024 | 2025 | 2024 | 2025 | |||||||||||||||||||||
| (Unaudited) | (Unaudited) | (Unaudited) | (Unaudited) | |||||||||||||||||||||
| RMB’000 | RMB’000 | US$’000 | RMB’000 | RMB’000 | US$’000 | |||||||||||||||||||
| Reconciliation of adjusted net profit for the period to adjusted EBITDA: | ||||||||||||||||||||||||
| Adjusted net profit | 624,995 | 691,469 | 96,524 | 1,241,886 | 1,278,674 | 178,499 | ||||||||||||||||||
| Add back: | ||||||||||||||||||||||||
| Depreciation and amortization | 183,029 | 286,344 | 39,972 | 333,131 | 554,016 | 77,338 | ||||||||||||||||||
| Finance costs excluding interest expenses related to the Equity Linked Securities and the bank loans used for acquisition of the equity interest in Yonghui | 24,686 | 34,685 | 4,842 | 40,595 | 65,885 | 9,197 | ||||||||||||||||||
| Income tax expense | 169,310 | 136,979 | 19,122 | 351,742 | 288,201 | 40,231 | ||||||||||||||||||
| Adjusted EBITDA | 1,002,020 | 1,149,477 | 160,460 | 1,967,354 | 2,186,776 | 305,265 | ||||||||||||||||||
| Adjusted EBITDA margin | 24.8 | % | 23.1 | % | 23.1 | % | 25.4 | % | 23.3 | % | 23.3 | % | ||||||||||||
Notes:
| (1) | The gain or loss from fair value change of derivatives was a non-cash gain or expense that was related to the fair value of the Equity Linked Securities and call spread. It was determined solely by movements in the underlying share price. |
| (2) | The issuance cost of derivatives was a one-off expense that was related to the Equity Linked Securities. |
| (3) | For the three months ended June 30, 2025, the RMB49,358,000 interest expenses related to the Equity Linked Securities included RMB44,413,000 non-cash portion and RMB4,945,000 cash expense. |
For the six months ended June 30, 2025, the RMB89,885,000 interest expenses related to the Equity Linked Securities included RMB80,815,000 non-cash portion and RMB9,070,000 cash expense.
| (4) | Adjusted basic and diluted net earnings per share are computed by dividing adjusted net profit attributable to the equity shareholders of the Company by the number of ordinary shares used in the basic and diluted earnings per share calculation on an IFRS basis. |
| MINISO GROUP HOLDING LIMITED | ||||||||||||||||||||||||||||||||
| UNAUDITED ADDITIONAL INFORMATION | ||||||||||||||||||||||||||||||||
| (Expressed in thousands, except for percentages) | ||||||||||||||||||||||||||||||||
| Three months ended June 30, | Six months ended June 30, | |||||||||||||||||||||||||||||||
| 2024 | 2025 | 2024 | 2025 | |||||||||||||||||||||||||||||
| RMB’000 | RMB’000 | US$’000 | YoY | RMB’000 | RMB’000 | US$’000 | YoY | |||||||||||||||||||||||||
| Revenue | ||||||||||||||||||||||||||||||||
| MINISO Brand | 3,818,008 | 4,563,226 | 637,001 | 19.5 | % | 7,324,665 | 8,649,004 | 1,207,355 | 18.1 | % | ||||||||||||||||||||||
| -Mainland China | 2,308,008 | 2,621,212 | 365,906 | 13.6 | % | 4,592,799 | 5,114,987 | 714,025 | 11.4 | % | ||||||||||||||||||||||
| -Overseas | 1,510,000 | 1,942,014 | 271,095 | 28.6 | % | 2,731,866 | 3,534,017 | 493,330 | 29.4 | % | ||||||||||||||||||||||
| TOP TOY Brand | 215,100 | 402,208 | 56,146 | 87.0 | % | 428,920 | 742,058 | 103,587 | 73.0 | % | ||||||||||||||||||||||
| Others(1) | 2,104 | 634 | 89 | (69.9 | )% | 5,158 | 2,050 | 286 | (60.3 | )% | ||||||||||||||||||||||
| 4,035,212 | 4,966,068 | 693,236 | 23.1 | % | 7,758,743 | 9,393,112 | 1,311,228 | 21.1 | % | |||||||||||||||||||||||
Note:
(1) “Others” refers to revenue generated from other operating segments such as “WonderLife”, which was a secondary brand targeting on lower-tier cities in mainland China, aggregated and presented as “others”. As the MINISO brand increasingly penetrated into lower-tier cities in mainland China, “WonderLife” has become marginalized.
| MINISO GROUP HOLDING LIMITED | ||||||||||||
| UNAUDITED ADDITIONAL INFORMATION | ||||||||||||
| NUMBER OF MINISO STORES IN MAINLAND CHINA | ||||||||||||
| As of | ||||||||||||
|
June 30, 2024 |
June 30, 2025 |
YoY | ||||||||||
| By City Tiers | ||||||||||||
| First-tier cities | 541 | 572 | 31 | |||||||||
| Second-tier cities | 1,705 | 1,774 | 69 | |||||||||
| Third- or lower-tier cities | 1,869 | 1,959 | 90 | |||||||||
| Total | 4,115 | 4,305 | 190 | |||||||||
| MINISO GROUP HOLDING LIMITED | ||||||||||||
| UNAUDITED ADDITIONAL INFORMATION | ||||||||||||
| NUMBER OF MINISO STORES IN OVERSEAS MARKETS | ||||||||||||
| As of | ||||||||||||
|
June 30, 2024 |
June 30, 2025 |
YoY | ||||||||||
| By Regions | ||||||||||||
| Asia excluding China | 1,484 | 1,695 | 211 | |||||||||
| North America | 234 | 394 | 160 | |||||||||
| Latin America | 584 | 661 | 77 | |||||||||
| Europe | 244 | 319 | 75 | |||||||||
| Others | 207 | 238 | 31 | |||||||||
| Total | 2,753 | 3,307 | 554 | |||||||||
*For identification purpose only
Exhibit 99.2
Hong Kong Exchanges and Clearing Limited and The Stock Exchange of Hong Kong Limited take no responsibility for the contents of this announcement, make no representation as to its accuracy or completeness and expressly disclaim any liability whatsoever for any loss howsoever arising from or in reliance upon the whole or any part of the contents of this announcement.
MINISO Group Holding Limited
名創優品集團控股有限公司
(A company incorporated in the Cayman Islands with limited liability)
(Stock Code: 9896)
INSIDE INFORMATION
UNAUDITED QUARTER AND INTERIM FINANCIAL RESULTS
FOR THE THREE MONTHS AND SIX MONTHS ENDED JUNE 30, 2025
|
This announcement is issued pursuant to Rule 13.09 of the Rules Governing the Listing of the Securities on The Stock Exchange of Hong Kong Limited and under Part XIVA of the Securities and Futures Ordinance (Cap. 571).
MINISO Group Holding Limited (“MINISO” or the “Company”) is pleased to announce the unaudited condensed consolidated results of the Company and its subsidiaries for the three months and six months ended June 30, 2025. |
The Company is pleased to announce the unaudited condensed consolidated results of the Company and its subsidiaries for the three months and six months ended June 30, 2025 published in accordance with applicable rules of the U.S. Securities and Exchange Commission (the “SEC”).
Attached hereto as Schedule I is the full text of the press release issued by the Company on August 21, 2025 (Eastern Standard Time), in relation to the unaudited financial results for the three months and six months ended June 30, 2025, some of which may constitute material inside information of the Company.
This announcement contains forward-looking statements. These statements are made under the “safe harbor” provisions of the U.S. Private Securities Litigation Reform Act of 1995. These forward-looking statements can be identified by words or phrases such as “may,” “will,” “expect,” “anticipate,” “aim,” “estimate,” “intend,” “plan,” “believe,” “is/are likely to,” “potential,” “continue” or other similar expressions. Among other things, the quotations from management in this announcement, as well as MINISO’s strategic and operational plans, contain forward-looking statements. MINISO may also make written or oral forward-looking statements in its periodic reports to the SEC and The Stock Exchange of Hong Kong Limited (the “HKEX”), in its annual report to shareholders, in press releases and other written materials and in oral statements made by its officers, directors or employees to third parties. Statements that are not historical facts, including statements about MINISO’s beliefs and expectations, are forward-looking statements. Forward-looking statements involve inherent risks and uncertainties. A number of factors could cause actual results to differ materially from those contained in any forward-looking statement, including but not limited to the following: MINISO’s mission, goals and strategies; future business development, financial conditions and results of operations; the expected growth of the retail market and the market of branded variety retail of lifestyle products in China and globally; expectations regarding demand for and market acceptance of MINISO’s products; expectations regarding MINISO’s relationships with consumers, suppliers, MINISO Retail Partners, local distributors, and other business partners; competition in the industry; proposed use of proceeds; and relevant government policies and regulations relating to MINISO’s business and the industry. Further information regarding these and other risks is included in MINISO’s filings with the SEC and the HKEX. All information provided in this announcement and in the attachments is as of the date of this announcement, and MINISO undertakes no obligation to update any forward-looking statement, except as required under applicable law.
The Company’s shareholders and potential investors are advised not to place undue reliance on the unaudited financial results for the three months and six months ended June 30, 2025 and to exercise caution in dealing in securities in the Company.
| By Order of the Board | |
| MINISO Group Holding Limited | |
| Mr. YE Guofu | |
| Executive Director and Chairman |
Hong Kong, August 21, 2025
As of the date of this announcement, the board of directors of the Company comprises Mr. YE Guofu as executive Director, Ms. XU Lili, Mr. ZHU Yonghua and Mr. WANG Yongping as independent non-executive Directors.
SCHEDULE I
MINISO Group Announces 2025 June Quarter and Interim Unaudited Financial Results
MINISO Group Delivers Accelerating Momentum: Same-Store GMV(1) Growth (the “SSSG”) Turns Positive in June Quarter; Revenue Increased 23.1%; Operating Profit Increased 11.3%;
Adjusted Diluted Earnings per ADS Increased 12.0%
MINISO Brand Resumes Net Store Network Expansion in Mainland China, with 30 Net New Stores Opened in June Quarter
TOP TOY Brand Revenue Increased 87.0%, a New Growth Record for June Quarter
Announce Interim Dividend of US$0.2896 per ADS
GUANGZHOU, China, August 21, 2025/PRNewswire/- MINISO Group Holding Limited (NYSE: MNSO; HKEX: 9896) (“MINISO”, “MINISO Group” or the “Company”), a global value retailer offering a variety of trendy lifestyle products featuring IP design, today announced its unaudited financial results for the three months and the six months ended June 30, 2025 (the “June Quarter” and the “First Half of 2025”, respectively).
Financial Highlights for the June Quarter
| · | Revenue increased 23.1% year over year to RMB4,966.1 million (US$693.2 million), above the high end of the Company’s previous guidance range of 18%-21%. |
| · | All three of the Company’s operating segments achieved a marked sequential improvement in SSSG(1) during the June quarter, propelling group-level SSSG(1) into positive territory after a mid-single digit contraction last quarter. |
| · | MINISO Brand’s SSSG(1) was flat year over year, underpinned by (i) low-single digit growth in mainland China, and (ii) low-single digit decline in overseas market. |
| · | TOP TOY Brand’s SSSG(1) advanced at a low-single digit growth rate year over year. |
| · | Gross margin was 44.3%, compared to 43.9% in the same period last year. |
| · | Operating profit increased 11.3% year over year to RMB836.2 million (US$116.7 million). |
| · | Adjusted operating profit(2) increased 8.5% year over year to RMB851.8 million (US$118.9 million), with adjusted operating margin of 17.2%, both ahead of the Company’s guidance. |
| · | Profit for the period was RMB489.5 million (US$68.3 million), compared to RMB591.4 million in the same period last year. |
| · | Adjusted net profit(2) increased 10.6% year over year to RMB691.5 million (US$96.5 million). |
| · | Adjusted net margin(2) was 13.9%, compared to 15.5% in the same period last year. |
| · | Adjusted EBITDA(2) increased 14.7% year over year to RMB1,149.5 million (US$160.5 million). |
| · | Adjusted EBITDA margin(2) was 23.1%, compared to 24.8% in the same period last year. |
| · | Adjusted basic and diluted earnings per ADS(2) were both RMB2.24 (US$0.31), increased by 12.0% year over year. |
Financial Highlights for the First Half of 2025
| · | Revenue increased 21.1% year over year to RMB9,393.1 million (US$1,311.2 million). |
| · | Gross profit increased 22.6% year over year to RMB4,156.9 million (US$580.3 million). |
| · | Gross margin was 44.3%, compared to 43.7% in the same period last year. |
| · | Operating profit increased 3.4% year over year to RMB1,545.9 million (US$215.8 million). |
| · | Adjusted operating profit(2) increased 1.7% year over year to RMB1,586.5 million (US$221.5 million), with adjusted operating margin of 16.9%. |
| · | Profit for the period was RMB906.0 million (US$126.5 million), compared with RMB1,177.4 million in the same period last year. |
| · | Adjusted net profit(2) was RMB1,278.7 million (US$178.5 million), compared with RMB1,241.9 million in the same period last year. |
| · | Adjusted net margin(2) was 13.6%, compared to 16.0% in the same period last year. |
| · | Adjusted EBITDA(2) increased 11.2% year over year to RMB2,186.8 million (US$305.3 million). |
| · | Adjusted EBITDA margin(2) was 23.3%, compared to 25.4% in the same period last year. |
| · | Adjusted basic and diluted earnings per ADS(2) was RMB4.16 (US$0.58) and RMB4.12 (US$0.58) respectively, compared with each of RMB3.96 in the same period last year. |
| · | Cash Position(3) was RMB7,466.1 million (US$1,042.2 million) as of June 30, 2025, compared to RMB6,698.1 million as of December 31, 2024. |
| · | Net cash from operating activities was RMB1,014.2 million (US$141.6 million). Capital expenditure was RMB434.8 million (US$60.7 million) and free cash flow was RMB579.4 million (US$80.9 million) for the First Half of 2025. |
Operational Highlights
| · | Total number of stores on group level was 7,905 as of June 30, 2025, representing a year-over-year increase of 842 net new stores. |
| · | Number of MINISO stores was 7,612 as of June 30, 2025, representing a year-over-year increase of 744 net new stores. |
| · | Number of MINISO stores in mainland China was 4,305 as of June 30, 2025, representing a year-over-year increase of 190 net new stores. |
| · | Number of MINISO stores in overseas markets reached 3,307 as of June 30, 2025, representing a year-over-year increase of 554 net new stores. |
| · | Number of TOP TOY stores was 293 as of June 30, 2025, representing a year-over-year increase of 98 net new stores. TOP TOY has also begun to expand into overseas markets since December quarter of 2024. This strategic move aligns with the Company’s plan to expand globally and strengthen its brand presence. |
Notes:
| (1) | “Same-store GMV” refers to the GMV generated by those stores that opened prior to the beginning of the comparative periods and remained open as of the end of the comparative periods and closed for less than 30 days during both comparative periods. “SSSG” refers to the year-over-year growth of same-store GMV. |
| (2) | See the sections titled “Non-IFRS Financial Measures” and “Reconciliation of Non-IFRS Financial Measures” in this press release for more information. |
| (3) | “Cash position” refers to the combined balance of the Company’s cash and cash equivalents, restricted cash, term deposits with original maturity over three months, and other investments recorded as current assets. |
The following table provides a breakdown of the Company’s store network and its changes on a year-over-year basis. 74.5% of new MINISO stores in the past twelve months were located in overseas markets.
| As of | ||||||||||||
| June 30, 2024 |
June 30, 2025 |
YoY | ||||||||||
| Number of stores on group level | 7,063 | 7,905 | 842 | |||||||||
| Number of MINISO stores | 6,868 | 7,612 | 744 | |||||||||
| Mainland China | 4,115 | 4,305 | 190 | |||||||||
| – Directly operated stores | 29 | 20 | (9 | ) | ||||||||
| – Stores operated under MINISO Retail Partner model | 4,063 | 4,258 | 195 | |||||||||
| – Stores operated under distributor model | 23 | 27 | 4 | |||||||||
| Overseas | 2,753 | 3,307 | 554 | |||||||||
| – Directly operated stores | 343 | 579 | 236 | |||||||||
| – Stores operated under MINISO Retail Partner model | 338 | 425 | 87 | |||||||||
| – Stores operated under distributor model | 2,072 | 2,303 | 231 | |||||||||
| Number of TOP TOY stores | 195 | 293 | 98 | |||||||||
| – Directly operated stores | 21 | 38 | 17 | |||||||||
| – Stores operated under MINISO Retail Partner model | 174 | 250 | 76 | |||||||||
| – Stores operated under distributor model | – | 5 | 5 | |||||||||
Mr. Guofu Ye, Founder, Chairman, and CEO of MINISO, commented, “We are gratified that MINISO Group accelerated growth in the June Quarter and we delivered a double-digit growth of operating profit which exceeded our expectations. It was encouraging that MINISO mainland China SSSG turned positive for the June Quarter and further accelerated entering the September quarter. The outperformance in MINISO mainland China in such a hyper-competitive domestic physical retail environment further underscores our strong execution and resilience of our business model. We estimate that same-store GMV in MINISO mainland China will achieve positive growth for the whole year of 2025.”
“We are thrilled to see improvement in overseas same-store GMV in the June Quarter, especially in our strategic markets Europe and North America. As we look ahead at the second half of 2025, we expect that our investments in directly operated business will unleash the sales potential and optimize our margin profiles. We are optimistic about building on the momentum we have created and well positioned to deliver sustainable and high-quality growth overseas. We are also pleased that TOP TOY recorded another impressive revenue growth of 87.0%, marked by robust performance of pop toy products and stronger store networks. It is worth mentioning that TOP TOY recently has completed strategic financing by Temasek, with post-valuation of about HK$10 billion, demonstrating its market recognition in pop toy industry.” Mr. Ye continued.
Mr. Eason Zhang, CFO of MINISO, commented, “We are encouraged by our better-than-expected quarterly performance in top line, growing by 23.1% year over year, accelerated from the last quarter. We now expect revenue growth to accelerate for the remainder of 2025. Gross margin reached 44.3%, increased by 0.4 percentage point year over year. Adjusted EBITDA for the June Quarter grew by 14.7% year over year to RMB1,149.5 million, accelerated from last quarter as well, with an adjusted EBITDA margin of 23.1%.”
“The board of the Company has approved an interim cash dividend for the First Half of 2025, with a total amount of approximately RMB639.5 million. Return to shareholders including share repurchases and cash dividends paid for the First Half of 2025 reached about RMB1,071 million, as about 84% of adjusted net profit, compared to about 55% in the same period last year. Our capital allocation strategy will also continue to balance fast growth and our commitment to bring stable and foreseeable returns to shareholders.” Mr. Zhang concluded.
Recent Developments
Interim Dividend Declaration
On August 21, 2025, the Company’s board of directors approved the distribution of an interim cash dividend in the amount of US$0.2896 per ADS or US$0.0724 per ordinary share, to holders of ADSs and ordinary shares of record as of the close of business on September 5, 2025, New York Time and Beijing/Hong Kong Time, respectively. The ex-dividend date for the holders of ordinary shares in Hong Kong will be September 4, 2025; and the ex-dividend date for holders of ADSs will be September 5, 2025. The payment date is expected to be September 16, 2025 for holders of ordinary shares and September 19, 2025 for holders of ADSs. The aggregate amount of cash dividend to be paid is approximately US$89.3 million (RMB639.5 million at an exchange rate of RMB7.1636 to US$1.0000), which is approximately 50% of the Company’s adjusted net profit for the First Half of 2025 and will be distributed from additional paid-in capital and settled by a cash distribution. For holders of ordinary shares, in order to qualify for the interim cash dividend, all valid documents for the transfer of ordinary shares accompanied by the relevant share certificates must be lodged for registration with the Company’s Hong Kong share registrar, Computershare Hong Kong Investor Services Limited, at Shops 1712-1716, 17th Floor, Hopewell Centre, 183 Queen’s Road East, Wanchai, Hong Kong no later than 4:30 P.M. on September 5, 2025 (Beijing/Hong Kong Time).
Update on TOP TOY
TOP TOY recently has completed a round of strategic financing led by Temasek, a global investment company headquartered in Singapore. The post-transaction valuation of TOP TOY reached around HK$10 billion, demonstrating the market recognition of TOP TOY’s business model, brand equity, and global expansion roadmap on a rapid growth trajectory of its pop toy business.
Financial Results for the June Quarter
Revenue was RMB4,966.1 million (US$693.2 million), representing an increase of 23.1% year over year.
Revenue from MINISO brand increased by 19.5% year over year to RMB4,563.2 million (US$637.0 million), including (i) an increase of 13.6% in revenue from MINISO brand in mainland China, accelerating from last quarter, and (ii) an increase of 28.6% in revenue from MINISO brand in overseas markets. Overseas revenue contributed to 42.6% of revenue from MINISO brand, compared to 39.5% in the same period last year.
Revenue from TOP TOY brand increased by 87.0% to RMB402.2 million (US$56.1 million).
For more information on the composition and year-over-year change of revenue, please refer to the “Unaudited Additional Information” in this press release.
Cost of sales was RMB2,767.2 million (US$386.3 million), representing an increase of 22.3% year over year.
Gross profit was RMB2,198.9 million (US$307.0 million), representing an increase of 24.0% year over year.
Gross margin was 44.3%, representing an increase of 0.4 percentage point year over year. The year-over-year increase in gross margin was primarily due to (i) higher revenue contribution from overseas markets, and (ii) higher gross margin of TOP TOY.
Selling and distribution expenses were RMB1,159.8 million (US$161.9 million), representing an increase of 40.4% year over year. Excluding share-based compensation expenses, selling and distribution expenses were RMB1,154.2 million (US$161.1 million), representing an increase of 42.8% year over year. The year-over-year increase was mainly attributable to the Company’s investments into directly operated stores to pursue the future success of the Company’s business, especially in strategic overseas markets such as the U.S. market. As of June 30, 2025, total number of directly operated stores on the group level was 637, compared to 393 as of June 30, 2024. In the June Quarter, revenue from directly operated stores increased 78.7%, while related expenses including rental and related expenses, depreciation and amortization expenses together with payroll excluding share-based compensation expenses increased 56.3%, decelerating from the year-over-year increase of 71.4% in last quarter. Promotion and advertising expenses increased 20.4%, as a percentage of revenue stabilizing at around 3% in both comparative periods. Licensing expenses increased 25.9%, as a percentage of revenue ranging from 2% to 3% in both comparative periods. Logistics expenses increased 21.3% year over year.
General and administrative expenses were RMB261.5 million (US$36.5 million), representing an increase of 15.1% year over year. Excluding share-based compensation expenses, general and administrative expenses were RMB251.4 million (US$35.1 million), representing an increase of 19.1% year over year. The year-over-year increase was primarily due to the increase of personnel-related expenses in relation to the growth of the Company’s business.
Other net income was RMB77.4 million (US$10.8 million), compared to RMB26.9 million in the same period last year. The year-over-year increase was mainly due to (i) an increase in investment income in wealth management products, and (ii) a net foreign exchange gain compared with a net foreign exchange loss in the same period last year.
Operating profit was RMB836.2 million (US$116.7 million), representing an increase of 11.3% year over year.
Adjusted operating profit(1) was RMB851.8 million (US$118.9 million), representing an increase of 8.5% year over year.
Net finance cost was RMB79.4 million (US$11.1 million), compared to net finance income of RMB9.0 million in the same period last year. The year-over-year increase in finance cost was due to (i) increased interest expenses in relation to the equity linked securities issued by the Company in January 2025 (the “Equity Linked Securities”) and the bank loans used for acquisition of the equity interest of Yonghui Superstores Co., Ltd* (永輝超市股份有限公司) (the “Yonghui”), both of which have been excluded in non-IFRS financial measures(1), and (ii) increased interest expenses on lease liabilities corresponding to the Company’s investment in directly operated stores.
Share of loss of equity-accounted investees, net of tax was RMB136.9 million (US$19.1 million), compared to share of profit of RMB0.2 million in the same period last year. The year-over-year change was mainly attributable to share of loss in Yonghui, which has been excluded in non-IFRS financial measures(1).
Other gain was RMB6.7 million (US$0.9 million), mainly attributable to gain from fair value change of derivatives under mark-to-market impact, which was in relation to the Equity Linked Securities and has been excluded in non-IFRS financial measures(1).
Profit for the period was RMB489.5 million (US$68.3 million), compared to RMB591.4 million in the same period last year.
Adjusted net profit(1) was RMB691.5 million (US$96.5 million), increased by 10.6% year over year.
Adjusted net margin(1) was 13.9%, compared to 15.5% in the same period last year.
Adjusted EBITDA(1) was RMB1,149.5 million (US$160.5 million), representing an increase of 14.7% year over year.
Adjusted EBITDA margin(1) was 23.1%, compared to 24.8% in the same period last year.
Basic and diluted earnings per ADS were both RMB1.60 (US$0.22) in the June Quarter, compared with RMB1.88 in the same period last year.
Adjusted basic and diluted earnings per ADS(1) were both RMB2.24 (US$0.31) in the June Quarter, representing an increase of 12.0% year over year from RMB2.00 in the same period last year.
Financial Results for the First Half of 2025
Revenue was RMB9,393.1 million (US$1,311.2 million), representing an increase of 21.1% year over year.
Revenue from MINISO brand increased by 18.1% to RMB8,649.0 million (US$1,207.4 million), including (i) an increase of 11.4% in revenue from MINISO brand in mainland China, and (ii) an increase of 29.4% in revenue from MINISO brand in overseas markets. The overseas revenue contributed 40.9% of revenue from MINISO brand, compared to 37.3% in the same period last year.
Revenue from TOP TOY brand increased by 73.0% to RMB742.1 million (US$103.6 million), primarily powered by its rapid growth in average store counts.
For more information on the composition and year-over-year change of revenue, please refer to the “Unaudited Additional Information” in this press release.
Cost of sales was RMB5,236.2 million (US$730.9 million), representing an increase of 19.8% year over year.
Gross profit was RMB4,156.9 million (US$580.3 million), representing an increase of 22.6% year over year.
Gross margin reached historical high of 44.3% across previous first half of the years, representing an increase of 0.6 percentage point. The year-over-year increase in gross margin was primarily due to (i) higher revenue contribution from overseas markets, and (ii) higher gross margin of TOP TOY.
Other income was RMB5.4 million (US$0.8 million), compared to RMB12.7 million in the same period last year.
Selling and distribution expenses were RMB2,181.0 million (US$304.5 million), increased by 43.3% year over year. Excluding share-based compensation expenses, selling and distribution expenses were RMB2,167.1 million (US$302.5 million), increased by 46.4% year over year.
General and administrative expenses were RMB503.7 million (US$70.3 million), increased by 20.3% year over year. Excluding share-based compensation expenses, general and administrative expenses were RMB477.0 million (US$66.6 million), increased by 20.6% year over year.
Other net income was RMB98.2 million (US$13.7 million), compared to RMB41.7 million in the same period last year. The year-over-year increase was mainly due to (i) an increase in investment income in wealth management products, and (ii) a net foreign exchange gain compared with a net foreign exchange loss in the same period last year.
Operating profit was RMB1,545.9 million (US$215.8 million), representing an increase of 3.4% year over year.
Adjusted operating profit(1) was RMB1,586.5 million (US$221.5 million), representing an increase of 1.7% year over year.
Net finance cost was RMB128.4 million (US$17.9 million), compared to net finance income of RMB34.0 million in the same period last year. The year-over-year increase in finance cost was due to (i) increased interest expenses in relation to the Equity Linked Securities and the bank loans used for acquisition of the equity interest of Yonghui, both of which have been excluded in non-IFRS financial measures(1), and (ii) increased interest expenses on lease liabilities corresponding to the Company’s investment in directly operated stores.
Share of loss of equity-accounted investees, net of tax was RMB138.9 million (US$19.4 million), compared with share of profit of RMB0.3 million in the same period last year. The year-over-year change was mainly attributable to share of loss in Yonghui, which has been excluded in non-IFRS financial measures(1).
Other expenses was RMB84.4 million (US$11.8 million), mainly attributable to loss from fair value change of derivatives under mark-to-market impact and issuance cost of derivatives, which were in relation to the Equity Linked Securities and have been excluded in non-IFRS financial measures(1).
Profit for the period was RMB906.0 million (US$126.5 million), compared to RMB1,177.4 million in the same period last year.
Adjusted net profit(1) was RMB1,278.7 million (US$178.5 million), compared to RMB1,241.9 million in the same period last year.
Adjusted net margin(1) was 13.6%, compared to 16.0% in the same period last year.
Adjusted EBITDA(1) increased 11.2% year over year to RMB2,186.8 million (US$305.3 million).
Adjusted EBITDA margin(1) was 23.3%, compared to 25.4% in the same period last year.
Basic earnings per ADS was RMB2.96 (US$0.41), compared to RMB3.76 in the same period last year.
Diluted earnings per ADS was RMB2.92 (US$0.41), compared to RMB3.76 in the same period last year.
Adjusted basic earnings per ADS(1) increased 5.1% year over year to RMB4.16 (US$0.58), compared to RMB3.96 in the same period last year.
Adjusted diluted earnings per ADS(1) increased 4.0% year over year to RMB4.12 (US$0.58), compared to RMB3.96 in the same period last year.
Cash position, which was the combined balance of the Company’s cash and cash equivalents, restricted cash, term deposits, and other investments recorded as current assets was RMB7,466.1 million (US$1,042.2 million) as of June 30, 2025, compared to RMB6,698.1 million as of December 31, 2024.
Net cash from operating activities was RMB1,014.2 million (US$141.6 million). Capital expenditure was RMB434.8 million (US$60.7 million) and free cash flow was RMB579.4 million (US$80.9 million) for the First Half of 2025.
Note:
| (1) | See the sections titled “Non-IFRS Financial Measures” and “Reconciliation of Non-IFRS Financial Measures” in this press release for more information. |
Conference Call
The Company’s management will hold an earnings conference call at 5:00 A.M. Eastern Time on Thursday, August 21, 2025 (5:00 P.M. Beijing Time on the same day) to discuss the financial results. Simultaneous interpretation in English will be provided during the conference call. The conference call can be accessed by the following Zoom link or dialing the following numbers:
Access 1
Join Zoom meeting.
Zoom link: https://zoom.us/j/91975768223?pwd=9ExRKhgHx8Q8QQyhZBwhNzPa1p3rea.1
Meeting Number: 919 7576 8223
Meeting Passcode: 9896
Access 2
Listeners may access the call by dialing the following numbers with the same meeting number and passcode with access 1.
| United States: | +1 689 278 1000 (or +1 719 359 4580) |
| Hong Kong, China: | +852 5803 3730 (or +852 5803 3731) |
| United Kingdom: | +44 203 481 5237 (or +44 131 460 1196) |
| France: | +33 1 7037 9729 (or +33 1 7037 2246) |
| Singapore: | +65 3158 7288 (or +65 3165 1065) |
| Canada: | +1 438 809 7799 (or +1 204 272 7920) |
Access 3
Listeners can also
access the meeting through the Company’s investor relations website at
https://ir.miniso.com/.
The replay will be available approximately two hours after the conclusion of the live event at the Company’s investor relations website at https://ir.miniso.com/.
About MINISO Group
MINISO Group is a global value retailer offering a variety of trendy lifestyle products featuring IP design. The Company serves consumers primarily through its large network of MINISO stores, and promotes a relaxing, treasure-hunting and engaging shopping experience full of delightful surprises that appeals to all demographics. Aesthetically pleasing design, quality and affordability are at the core of every product in MINISO’s wide product portfolio, and the Company continually and frequently rolls out products with these qualities. Since the opening of its first store in China in 2013, the Company has built its flagship brand “MINISO” as a globally recognized retail brand and established a massive store network worldwide. For more information, please visit https://ir.miniso.com/.
Exchange Rate
The U.S. dollar (US$) amounts disclosed in this press release, except for those transaction amounts that were actually settled in U.S. dollars, are presented solely for the convenience of the readers. The conversion of Renminbi (RMB) into US$ in this press release is based on the exchange rate set forth in the H.10 statistical release of the Board of Governors of the Federal Reserve System as of June 30, 2025, which was RMB7.1636 to US$1.0000. The percentages stated in this press release are calculated based on the RMB amounts.
Non-IFRS Financial Measures
In evaluating the business, MINISO considers and uses adjusted operating profit, adjusted operating margin, adjusted net profit, adjusted net margin, adjusted EBITDA, adjusted EBITDA margin, adjusted basic and diluted net earnings per share and adjusted basic and diluted net earnings per ADS as supplemental measures to review and assess its operating performance. The presentation of these non-IFRS financial measures is not intended to be considered in isolation or as a substitute for the financial information prepared and presented in accordance with IFRS. MINISO defines adjusted operating profit as operating profit for the period excluding equity-settled share-based payment expenses. MINISO calculates adjusted operating margin by dividing adjusted operating profit by revenue for the same period. MINISO defines adjusted net profit as profit for the period excluding equity-settled share-based payment expenses, gain or loss from fair value change of derivatives, issuance cost of derivatives and interest expenses related to Equity Linked Securities, interest expenses related to the bank loans used for acquisition of the equity interest in Yonghui, and share of profit or loss of Yonghui, net of tax. MINISO calculates adjusted net margin by dividing adjusted net profit by revenue for the same period. MINISO defines adjusted EBITDA as adjusted net profit plus depreciation and amortization, finance costs excluding interest expenses related to Equity Linked Securities and interest expenses related to the bank loans used for acquisition of the equity interest in Yonghui and income tax expense. Adjusted EBITDA margin is computed by dividing adjusted EBITDA by revenue for the period. MINISO computes adjusted basic and diluted net earnings per ADS by dividing adjusted net profit attributable to the equity shareholders of the Company by the number of ADSs represented by the number of ordinary shares used in the basic and diluted earnings per share calculation on an IFRS basis. MINISO computes adjusted basic and diluted net earnings per share in the same way as it calculates adjusted basic and diluted net earnings per ADS, except that it uses the number of ordinary shares used in the basic and diluted earnings per share calculation on an IFRS basis as the denominator instead of the number of ADSs represented by these ordinary shares.
MINISO presents these non-IFRS financial measures because they are used by the management to evaluate its operating performance and formulate business plans. These non-IFRS financial measures enable the management to assess its operating results without considering the impacts of the aforementioned non-cash and other adjustment items that MINISO does not consider to be indicative of its operating performance in the future. Accordingly, MINISO believes that the use of these non-IFRS financial measures provides useful information to investors and others in understanding and evaluating its operating results in the same manner as the management and board of directors.
These non-IFRS financial measures are not defined under IFRS and are not presented in accordance with IFRS. These non-IFRS financial measures have limitations as analytical tools. One of the key limitations of using these non-IFRS financial measures is that they do not reflect all items of income and expense that affect MINISO’s operations. Further, these non-IFRS financial measures may differ from the non-IFRS information used by other companies, including peer companies, and therefore their comparability may be limited.
These non-IFRS financial measures should not be considered in isolation or construed as alternatives to profit, net profit margin, basic and diluted earnings per share and basic and diluted earnings per ADS, as applicable, or any other measures of performance or as indicators of MINISO’s operating performance. Investors are encouraged to review MINISO’s historical non-IFRS financial measures in light of the most directly comparable IFRS measures, as shown below. The non-IFRS financial measures presented here may not be comparable to similarly titled measures presented by other companies. Other companies may calculate similarly titled measures differently, limiting the usefulness of such measures when analyzing MINISO’s data comparatively. MINISO encourages you to review its financial information in its entirety and not rely on a single financial measure.
For more information on the non-IFRS financial measures, please see the table captioned “Reconciliation of Non-IFRS Financial Measures” set forth at the end of this press release.
Safe Harbor Statement
This announcement contains forward-looking statements. These statements are made under the “safe harbor” provisions of the U.S. Private Securities Litigation Reform Act of 1995. These forward-looking statements can be identified by words or phrases such as “may”, “will”, “expect”, “anticipate”, “aim”, “estimate”, “intend”, “plan”, “believe”, “is/are likely to”, “potential”, “continue” or other similar expressions. Among other things, the quotations from management in this announcement, as well as MINISO’s strategic and operational plans, contain forward-looking statements. MINISO may also make written or oral forward-looking statements in its periodic reports to the U.S. Securities and Exchange Commission (the “SEC”) and The Stock Exchange of Hong Kong Limited (the “HKEX”), in its annual report to shareholders, in press releases and other written materials and in oral statements made by its officers, directors or employees to third parties. Statements that are not historical facts, including statements about MINISO’s beliefs and expectations, are forward-looking statements. Forward-looking statements involve inherent risks and uncertainties. A number of factors could cause actual results to differ materially from those contained in any forward-looking statement, including but not limited to the following: MINISO’s mission, goals and strategies; future business development, financial conditions and results of operations; the expected growth of the retail market and the market of branded variety retail of lifestyle products in China and globally; expectations regarding demand for and market acceptance of MINISO’s products; expectations regarding MINISO’s relationships with consumers, suppliers, MINISO Retail Partners, local distributors, and other business partners; competition in the industry; proposed use of proceeds; and relevant government policies and regulations relating to MINISO’s business and the industry. Further information regarding these and other risks is included in MINISO’s filings with the SEC and the HKEX. All information provided in this press release and in the attachments is as of the date of this press release, and MINISO undertakes no obligation to update any forward-looking statement, except as required under applicable law.
Investor Relations Contacts:
MINISO Group Holding Limited
Email: ir@miniso.com
Phone: +86 (20) 36228788 Ext.8039
MINISO GROUP HOLDING LIMITED
UNAUDITED CONDENSED CONSOLIDATED STATEMENTS OF FINANCIAL POSITION
(Expressed in thousands)
| As at December 31, 2024 (Audited) |
As at June 30, 2025 (Unaudited) |
|||||||||||
| RMB’000 | RMB’000 | US$’000 | ||||||||||
| ASSETS | ||||||||||||
| Non-current assets | ||||||||||||
| Property, plant and equipment | 1,436,939 | 1,702,062 | 237,599 | |||||||||
| Right-of-use assets | 4,172,083 | 4,635,139 | 647,040 | |||||||||
| Intangible assets | 8,802 | 7,545 | 1,053 | |||||||||
| Goodwill | 21,418 | 46,030 | 6,426 | |||||||||
| Deferred tax assets | 181,948 | 217,963 | 30,426 | |||||||||
| Other investments | 123,399 | 122,570 | 17,110 | |||||||||
| Trade and other receivables | 341,288 | 212,750 | 29,699 | |||||||||
| Term deposits | 140,183 | – | – | |||||||||
| Financial derivative assets | – | 799,751 | 111,641 | |||||||||
| Interests in equity-accounted investees | 38,567 | 6,171,304 | 861,481 | |||||||||
| 6,464,627 | 13,915,114 | 1,942,475 | ||||||||||
| Current assets | ||||||||||||
| Other investments | 100,000 | – | – | |||||||||
| Inventories | 2,750,389 | 2,836,348 | 395,939 | |||||||||
| Trade and other receivables | 2,207,013 | 2,430,263 | 339,252 | |||||||||
| Cash and cash equivalents | 6,328,121 | 7,115,183 | 993,241 | |||||||||
| Restricted cash | 1,026 | 5,527 | 772 | |||||||||
| Term deposits | 268,952 | 345,353 | 48,209 | |||||||||
| 11,655,501 | 12,732,674 | 1,777,413 | ||||||||||
| Total assets | 18,120,128 | 26,647,788 | 3,719,888 | |||||||||
MINISO GROUP HOLDING LIMITED
UNAUDITED CONDENSED CONSOLIDATED STATEMENTS OF FINANCIAL POSITION (CONTINUED)
(Expressed in thousands)
| As at December 31, 2024 (Audited) |
As at June 30, 2025 (Unaudited) |
|||||||||||
| RMB’000 | RMB’000 | US$’000 | ||||||||||
| EQUITY | ||||||||||||
| Share capital | 94 | 94 | 13 | |||||||||
| Additional paid-in capital | 4,683,577 | 3,956,803 | 552,348 | |||||||||
| Other reserves | 1,329,126 | 1,687,003 | 235,497 | |||||||||
| Retained earnings | 4,302,177 | 5,208,207 | 727,038 | |||||||||
| Equity attributable to equity shareholders of the Company | 10,314,974 | 10,852,107 | 1,514,896 | |||||||||
| Non-controlling interests | 40,548 | 46,812 | 6,535 | |||||||||
| Total equity | 10,355,522 | 10,898,919 | 1,521,431 | |||||||||
| LIABILITIES | ||||||||||||
| Non-current liabilities | ||||||||||||
| Contract liabilities | 35,145 | 27,758 | 3,875 | |||||||||
| Loans and borrowings | 4,310 | 5,589,413 | 780,252 | |||||||||
| Other payables | 59,842 | 73,586 | 10,272 | |||||||||
| Lease liabilities | 1,903,137 | 2,177,289 | 303,938 | |||||||||
| Financial derivative liabilities | – | 1,230,927 | 171,831 | |||||||||
| Deferred income | 34,983 | 34,501 | 4,816 | |||||||||
| 2,037,417 | 9,133,474 | 1,274,984 | ||||||||||
MINISO GROUP HOLDING LIMITED
UNAUDITED CONDENSED CONSOLIDATED STATEMENTS OF FINANCIAL POSITION (CONTINUED)
(Expressed in thousands)
| As at December 31, 2024 (Audited) |
As at June 30, 2025 (Unaudited) |
|||||||||||
| RMB’000 | RMB’000 | US$’000 | ||||||||||
| Current liabilities | ||||||||||||
| Contract liabilities | 323,292 | 290,706 | 40,581 | |||||||||
| Loans and borrowings | 566,955 | 1,707,170 | 238,312 | |||||||||
| Trade and other payables | 3,943,988 | 3,561,523 | 497,168 | |||||||||
| Lease liabilities | 635,357 | 883,423 | 123,321 | |||||||||
| Deferred income | 5,376 | 2,024 | 283 | |||||||||
| Current taxation | 252,221 | 170,549 | 23,808 | |||||||||
| 5,727,189 | 6,615,395 | 923,473 | ||||||||||
| Total liabilities | 7,764,606 | 15,748,869 | 2,198,457 | |||||||||
| Total equity and liabilities | 18,120,128 | 26,647,788 | 3,719,888 | |||||||||
MINISO GROUP HOLDING LIMITED
UNAUDITED CONDENSED CONSOLIDATED STATEMENTS OF PROFIT OR LOSS
AND OTHER COMPREHENSIVE INCOME
(Expressed in thousands, except for per ordinary share and per ADS data)
| Three months ended June 30, | Six months ended June 30, | |||||||||||||||||||||||
| 2024 | 2025 | 2024 | 2025 | |||||||||||||||||||||
| (Unaudited) | (Unaudited) | (Unaudited) | (Unaudited) | |||||||||||||||||||||
| RMB’000 | RMB’000 | US$’000 | RMB’000 | RMB’000 | US$’000 | |||||||||||||||||||
| Revenue | 4,035,212 | 4,966,068 | 693,236 | 7,758,743 | 9,393,112 | 1,311,228 | ||||||||||||||||||
| Cost of sales | (2,261,884 | ) | (2,767,187 | ) | (386,284 | ) | (4,368,957 | ) | (5,236,194 | ) | (730,944 | ) | ||||||||||||
| Gross profit | 1,773,328 | 2,198,881 | 306,952 | 3,389,786 | 4,156,918 | 580,284 | ||||||||||||||||||
| Other income | 9,053 | 2,350 | 328 | 12,698 | 5,370 | 750 | ||||||||||||||||||
| Selling and distribution expenses | (826,061 | ) | (1,159,836 | ) | (161,907 | ) | (1,522,088 | ) | (2,181,022 | ) | (304,459 | ) | ||||||||||||
| General and administrative expenses | (227,232 | ) | (261,512 | ) | (36,506 | ) | (418,573 | ) | (503,656 | ) | (70,308 | ) | ||||||||||||
| Other net income | 26,867 | 77,404 | 10,805 | 41,696 | 98,239 | 13,714 | ||||||||||||||||||
| Credit loss on trade and other receivables | (2,939 | ) | (4,675 | ) | (653 | ) | (3,606 | ) | (13,450 | ) | (1,878 | ) | ||||||||||||
| Impairment loss on non-current assets | (1,492 | ) | (16,450 | ) | (2,296 | ) | (5,104 | ) | (16,450 | ) | (2,296 | ) | ||||||||||||
| Operating profit | 751,524 | 836,162 | 116,723 | 1,494,809 | 1,545,949 | 215,807 | ||||||||||||||||||
| Finance income | 33,716 | 28,921 | 4,037 | 74,606 | 65,836 | 9,190 | ||||||||||||||||||
| Finance costs | (24,686 | ) | (108,291 | ) | (15,117 | ) | (40,595 | ) | (194,236 | ) | (27,114 | ) | ||||||||||||
| Net finance income/(cost) | 9,030 | (79,370 | ) | (11,080 | ) | 34,011 | (128,400 | ) | (17,924 | ) | ||||||||||||||
| Share of profit/(loss) of equity-accounted investees, net of tax | 181 | (136,941 | ) | (19,116 | ) | 301 | (138,946 | ) | (19,396 | ) | ||||||||||||||
| Other gain/(expenses) | – | 6,659 | 930 | – | (84,412 | ) | (11,783 | ) | ||||||||||||||||
| Profit before taxation | 760,735 | 626,510 | 87,457 | 1,529,121 | 1,194,191 | 166,704 | ||||||||||||||||||
| Income tax expense | (169,310 | ) | (136,979 | ) | (19,122 | ) | (351,742 | ) | (288,201 | ) | (40,231 | ) | ||||||||||||
| Profit for the period | 591,425 | 489,531 | 68,335 | 1,177,379 | 905,990 | 126,473 | ||||||||||||||||||
| Attributable to: | ||||||||||||||||||||||||
| Equity shareholders of the Company | 587,630 | 489,688 | 68,357 | 1,170,102 | 906,030 | 126,479 | ||||||||||||||||||
| Non-controlling interests | 3,795 | (157 | ) | (22 | ) | 7,277 | (40 | ) | (6 | ) | ||||||||||||||
| Earnings per share for ordinary shares | ||||||||||||||||||||||||
| – Basic | 0.47 | 0.40 | 0.06 | 0.94 | 0.74 | 0.10 | ||||||||||||||||||
| – Diluted | 0.47 | 0.40 | 0.06 | 0.94 | 0.73 | 0.10 | ||||||||||||||||||
| Earnings per ADS (Each ADS represents 4 ordinary shares) | ||||||||||||||||||||||||
| – Basic | 1.88 | 1.60 | 0.22 | 3.76 | 2.96 | 0.41 | ||||||||||||||||||
| – Diluted | 1.88 | 1.60 | 0.22 | 3.76 | 2.92 | 0.41 | ||||||||||||||||||
MINISO GROUP HOLDING LIMITED
UNAUDITED CONDENSED CONSOLIDATED STATEMENTS OF PROFIT OR LOSS
AND OTHER COMPREHENSIVE INCOME (CONTINUED)
(Expressed in thousands)
| Three months ended June 30, | Six months ended June 30, | |||||||||||||||||||||||
| 2024 | 2025 | 2024 | 2025 | |||||||||||||||||||||
| (Unaudited) | (Unaudited) | (Unaudited) | (Unaudited) | |||||||||||||||||||||
| RMB’000 | RMB’000 | US$’000 | RMB’000 | RMB’000 | US$’000 | |||||||||||||||||||
| Profit for the period | 591,425 | 489,531 | 68,335 | 1,177,379 | 905,990 | 126,473 | ||||||||||||||||||
| Items that may be reclassified subsequently to profit or loss: | ||||||||||||||||||||||||
| Exchange differences on translation of financial statements of foreign operations | 2,990 | 12,966 | 1,810 | 6,845 | 11,675 | 1,630 | ||||||||||||||||||
| Other comprehensive income for the period | 2,990 | 12,966 | 1,810 | 6,845 | 11,675 | 1,630 | ||||||||||||||||||
| Total comprehensive income for the period | 594,415 | 502,497 | 70,145 | 1,184,224 | 917,665 | 128,103 | ||||||||||||||||||
| Attributable to: | ||||||||||||||||||||||||
| Equity shareholders of the Company | 591,877 | 501,095 | 69,949 | 1,178,043 | 917,401 | 128,066 | ||||||||||||||||||
| Non-controlling interests | 2,538 | 1,402 | 196 | 6,181 | 264 | 37 | ||||||||||||||||||
MINISO GROUP HOLDING LIMITED
RECONCILIATION OF NON-IFRS FINANCIAL MEASURES
(Expressed in thousands, except for per share, per ADS data and percentages)
| Three months ended June 30, | Six months ended June 30, | |||||||||||||||||||||||
| 2024 | 2025 | 2024 | 2025 | |||||||||||||||||||||
| (Unaudited) | (Unaudited) | (Unaudited) | (Unaudited) | |||||||||||||||||||||
| RMB’000 | RMB’000 | US$’000 | RMB’000 | RMB’000 | US$’000 | |||||||||||||||||||
| Reconciliation of profit for the period to adjusted net profit: | ||||||||||||||||||||||||
| Profit for the period | 591,425 | 489,531 | 68,335 | 1,177,379 | 905,990 | 126,473 | ||||||||||||||||||
| Add back: | ||||||||||||||||||||||||
| Equity-settled share-based payment expenses | 33,570 | 15,656 | 2,185 | 64,507 | 40,586 | 5,666 | ||||||||||||||||||
| (Gain) /loss from fair value change of derivatives(1) | – | (6,659 | ) | (930 | ) | – | 39,748 | 5,549 | ||||||||||||||||
| Issuance cost of derivatives(2) | – | – | – | – | 44,664 | 6,235 | ||||||||||||||||||
| Interest expenses related to Equity Linked Securities and the bank loans used for acquisition of the equity interest in Yonghui | – | 73,606 | 10,275 | – | 128,351 | 17,917 | ||||||||||||||||||
| –Interest expenses related to the Equity Linked Securities(3) | – | 49,358 | 6,890 | – | 89,885 | 12,547 | ||||||||||||||||||
| – Interest expenses related to the bank loans used for acquisition of the equity interest in Yonghui | – | 24,248 | 3,385 | – | 38,466 | 5,370 | ||||||||||||||||||
| Share of loss of Yonghui, net of tax | – | 119,335 | 16,659 | – | 119,335 | 16,659 | ||||||||||||||||||
| Adjusted net profit | 624,995 | 691,469 | 96,524 | 1,241,886 | 1,278,674 | 178,499 | ||||||||||||||||||
| Adjusted net margin | 15.5 | % | 13.9 | % | 13.9 | % | 16.0 | % | 13.6 | % | 13.6 | % | ||||||||||||
| Attributable to: | ||||||||||||||||||||||||
| Equity shareholders of the Company | 621,021 | 691,630 | 96,546 | 1,234,430 | 1,278,629 | 178,493 | ||||||||||||||||||
| Non-controlling interests | 3,974 | (161 | ) | (22 | ) | 7,456 | 45 | 6 | ||||||||||||||||
| Adjusted net earnings per share(4) | ||||||||||||||||||||||||
| – Basic | 0.50 | 0.56 | 0.08 | 0.99 | 1.04 | 0.15 | ||||||||||||||||||
| – Diluted | 0.50 | 0.56 | 0.08 | 0.99 | 1.03 | 0.14 | ||||||||||||||||||
| Adjusted net earnings per ADS (Each ADS represents 4 ordinary shares) | ||||||||||||||||||||||||
| – Basic | 2.00 | 2.24 | 0.31 | 3.96 | 4.16 | 0.58 | ||||||||||||||||||
| – Diluted | 2.00 | 2.24 | 0.31 | 3.96 | 4.12 | 0.58 | ||||||||||||||||||
MINISO GROUP HOLDING LIMITED
RECONCILIATION OF NON-IFRS FINANCIAL MEASURES (CONTINUED)
(Expressed in thousands, except for percentages)
| Three months ended June 30, | Six months ended June 30, | |||||||||||||||||||||||
| 2024 | 2025 | 2024 | 2025 | |||||||||||||||||||||
| (Unaudited) | (Unaudited) | (Unaudited) | (Unaudited) | |||||||||||||||||||||
| RMB’000 | RMB’000 | US$’000 | RMB’000 | RMB’000 | US$’000 | |||||||||||||||||||
| Reconciliation of adjusted net profit for the period to adjusted EBITDA: | ||||||||||||||||||||||||
| Adjusted net profit | 624,995 | 691,469 | 96,524 | 1,241,886 | 1,278,674 | 178,499 | ||||||||||||||||||
| Add back: | ||||||||||||||||||||||||
| Depreciation and amortization | 183,029 | 286,344 | 39,972 | 333,131 | 554,016 | 77,338 | ||||||||||||||||||
| Finance costs excluding interest expenses related to the Equity Linked Securities and the bank loans used for acquisition of the equity interest in Yonghui | 24,686 | 34,685 | 4,842 | 40,595 | 65,885 | 9,197 | ||||||||||||||||||
| Income tax expense | 169,310 | 136,979 | 19,122 | 351,742 | 288,201 | 40,231 | ||||||||||||||||||
| Adjusted EBITDA | 1,002,020 | 1,149,477 | 160,460 | 1,967,354 | 2,186,776 | 305,265 | ||||||||||||||||||
| Adjusted EBITDA margin | 24.8 | % | 23.1 | % | 23.1 | % | 25.4 | % | 23.3 | % | 23.3 | % | ||||||||||||
Notes:
| (1) | The gain or loss from fair value change of derivatives was a non-cash gain or expense that was related to the fair value of the Equity Linked Securities and call spread. It was determined solely by movements in the underlying share price. |
| (2) | The issuance cost of derivatives was a one-off expense that was related to the Equity Linked Securities. |
| (3) | For the three months ended June 30, 2025, the RMB49,358,000 interest expenses related to the Equity Linked Securities included RMB44,413,000 non-cash portion and RMB4,945,000 cash expense. |
For the six months ended June 30, 2025, the RMB89,885,000 interest expenses related to the Equity Linked Securities included RMB80,815,000 non-cash portion and RMB9,070,000 cash expense.
| (4) | Adjusted basic and diluted net earnings per share are computed by dividing adjusted net profit attributable to the equity shareholders of the Company by the number of ordinary shares used in the basic and diluted earnings per share calculation on an IFRS basis. |
MINISO GROUP HOLDING LIMITED
UNAUDITED ADDITIONAL INFORMATION
(Expressed in thousands, except for percentages)
| Three months ended June 30, | Six months ended June 30, | |||||||||||||||||||||||||||||||
| 2024 | 2025 | 2024 | 2025 | |||||||||||||||||||||||||||||
| RMB’000 | RMB’000 | US$’000 | YoY | RMB’000 | RMB’000 | US$’000 | YoY | |||||||||||||||||||||||||
| Revenue | ||||||||||||||||||||||||||||||||
| MINISO Brand | 3,818,008 | 4,563,226 | 637,001 | 19.5 | % | 7,324,665 | 8,649,004 | 1,207,355 | 18.1 | % | ||||||||||||||||||||||
| – Mainland China | 2,308,008 | 2,621,212 | 365,906 | 13.6 | % | 4,592,799 | 5,114,987 | 714,025 | 11.4 | % | ||||||||||||||||||||||
| – Overseas | 1,510,000 | 1,942,014 | 271,095 | 28.6 | % | 2,731,866 | 3,534,017 | 493,330 | 29.4 | % | ||||||||||||||||||||||
| TOP TOY Brand | 215,100 | 402,208 | 56,146 | 87.0 | % | 428,920 | 742,058 | 103,587 | 73.0 | % | ||||||||||||||||||||||
| Others(1) | 2,104 | 634 | 89 | (69.9 | )% | 5,158 | 2,050 | 286 | (60.3 | )% | ||||||||||||||||||||||
| 4,035,212 | 4,966,068 | 693,236 | 23.1 | % | 7,758,743 | 9,393,112 | 1,311,228 | 21.1 | % | |||||||||||||||||||||||
Note:
| (1) | “Others” refers to revenue generated from other operating segments such as “WonderLife”, which was a secondary brand targeting on lower-tier cities in mainland China, aggregated and presented as “others”. As the MINISO brand increasingly penetrated into lower-tier cities in mainland China, “WonderLife” has become marginalized. |
MINISO GROUP HOLDING LIMITED
UNAUDITED ADDITIONAL INFORMATION
NUMBER OF MINISO STORES IN MAINLAND CHINA
| As of | ||||||||||||
| June 30, 2024 |
June 30, 2025 |
YoY | ||||||||||
| By City Tiers | ||||||||||||
| First-tier cities | 541 | 572 | 31 | |||||||||
| Second-tier cities | 1,705 | 1,774 | 69 | |||||||||
| Third – or lower-tier cities | 1,869 | 1,959 | 90 | |||||||||
| Total | 4,115 | 4,305 | 190 | |||||||||
MINISO GROUP HOLDING LIMITED
UNAUDITED ADDITIONAL INFORMATION
NUMBER OF MINISO STORES IN OVERSEAS MARKETS
| As of | ||||||||||||
| June 30, 2024 |
June 30, 2025 |
YoY | ||||||||||
| By Regions | ||||||||||||
| Asia excluding China | 1,484 | 1,695 | 211 | |||||||||
| North America | 234 | 394 | 160 | |||||||||
| Latin America | 584 | 661 | 77 | |||||||||
| Europe | 244 | 319 | 75 | |||||||||
| Others | 207 | 238 | 31 | |||||||||
| Total | 2,753 | 3,307 | 554 | |||||||||
* For identification purpose only
Exhibit 99.3
Hong Kong Exchanges and Clearing Limited and The Stock Exchange of Hong Kong Limited take no responsibility for the contents of this announcement, make no representation as to its accuracy or completeness and expressly disclaim any liability whatsoever for any loss howsoever arising from or in reliance upon the whole or any part of the contents of this announcement.
MINISO Group Holding Limited
名創優品集團控股有限公司
(A company incorporated in the Cayman Islands with limited liability)
(Stock Code: 9896)
INTERIM RESULTS ANNOUNCEMENT
FOR THE SIX MONTHS ENDED JUNE 30, 2025
The board (the “Board”) of directors (the “Directors”) of MINISO Group Holding Limited (the “Company”) is pleased to announce the interim consolidated results of the Company and its subsidiaries (the “Group”) for the six months ended June 30, 2025 (the “Reporting Period”), together with the comparative figures for the corresponding period in 2024. These interim results have been reviewed by the audit committee of the Board (the “Audit Committee”).
In this announcement, “we”, “us”, “our” and “MINISO” refer to the Company and where the context otherwise requires, the Group.
FINANCIAL PERFORMANCE HIGHLIGHTS
| For the six months ended | Year-over- | |||||||||||
| June 30, | Year (“YoY”) | |||||||||||
| 2024 | 2025 | Change (%) | ||||||||||
| (Renminbi (“RMB”) in thousands, except percentages and per share data) |
||||||||||||
| Revenue | 7,758,743 | 9,393,112 | 21.1 | % | ||||||||
| Gross profit | 3,389,786 | 4,156,918 | 22.6 | % | ||||||||
| Operating profit | 1,494,809 | 1,545,949 | 3.4 | % | ||||||||
| Profit before taxation | 1,529,121 | 1,194,191 | (21.9 | )% | ||||||||
| Profit for the period | 1,177,379 | 905,990 | (23.1 | )% | ||||||||
| Profit for the period attributable to: | ||||||||||||
| – Equity shareholders of the Company | 1,170,102 | 906,030 | (22.6 | )% | ||||||||
| – Non-controlling interests | 7,277 | (40 | ) | (100.5 | )% | |||||||
| Earnings per ordinary share (the “Share(s)”): | ||||||||||||
| –Basic (RMB) | 0.94 | 0.74 | (21.3 | )% | ||||||||
| –Diluted (RMB) | 0.94 | 0.73 | (22.3 | )% | ||||||||
| Adjusted net profit (a non-IFRS measure) | 1,241,886 | 1,278,674 | 3.0 | % | ||||||||
| Adjusted net earnings per Share (a non-IFRS measure) | ||||||||||||
| –Basic (RMB) | 0.99 | 1.04 | 5.1 | % | ||||||||
| –Diluted (RMB) | 0.99 | 1.03 | 4.0 | % | ||||||||
| Adjusted EBITDA (a non-IFRS measure) | 1,967,354 | 2,186,776 | 11.2 | % | ||||||||
NON-IFRS FINANCIAL MEASURES
In evaluating the business, MINISO considers and uses adjusted net profit, adjusted EBITDA and adjusted basic and diluted net earnings per Share as supplemental measures to review and assess its operating performance. The presentation of these non-IFRS financial measures is not intended to be considered in isolation or as a substitute for the financial information prepared and presented in accordance with IFRS. MINISO defines adjusted net profit as profit for the period excluding equity-settled share-based payment expenses, gain or loss from fair value change of derivatives, issuance cost of derivatives and interest expenses related to the Equity Linked Securities (as defined below) and interest expenses related to the bank loans used for acquisition of the equity interest in Yonghui Superstores Co., Ltd (永輝超市股份有限公司) (“Yonghui”), and share of loss of Yonghui, net of tax. MINISO defines adjusted EBITDA as adjusted net profit plus depreciation and amortization, finance costs excluding interest expenses related to the Equity Linked Securities and interest expenses related to the bank loans used for acquisition of the equity interest in Yonghui and income tax expense. MINISO computes adjusted basic and diluted net earnings per Share by dividing adjusted net profit attributable to the equity shareholders of the Company by the number of Shares used in the basic and diluted earnings per Share calculation on an IFRS basis. MINISO computes adjusted basic and diluted net earnings per Share in the same way as it calculates adjusted basic and diluted net earnings per ADS (as defined below), except that it uses the number of Shares used in the basic and diluted earnings per Share calculation on an IFRS basis as the denominator instead of the number of ADSs represented by these Shares.
MINISO presents these non-IFRS financial measures because they are used by the management to evaluate its operating performance and formulate business plans. These non-IFRS financial measures enable the management to assess its operating results without considering the impacts of the aforementioned non-cash and other adjustment items that MINISO does not consider to be indicative of its operating performance in the future. Accordingly, MINISO believes that the use of these non-IFRS financial measures provides useful information to investors and others in understanding and evaluating its operating results in the same manner as the management and the Board.
These non-IFRS financial measures are not defined under IFRS and are not presented in accordance with IFRS. These non-IFRS financial measures have limitations as analytical tools. One of the key limitations of using these non-IFRS financial measures is that they do not reflect all items of income and expense that affect MINISO’s operations. Further, these non-IFRS financial measures may differ from the non-IFRS information used by other companies, including peer companies, and therefore their comparability may be limited.
These non-IFRS financial measures should not be considered in isolation or construed as alternatives to profit, basic and diluted earnings per Share, as applicable, or any other measures of performance or as indicators of MINISO’s operating performance. Investors are encouraged to review MINISO’s historical non-IFRS financial measures in light of the most directly comparable IFRS measures, as shown below. The non-IFRS financial measures presented here may not be comparable to similarly titled measures presented by other companies. Other companies may calculate similarly titled measures differently, limiting the usefulness of such measures when analyzing MINISO’s data comparatively. MINISO encourages you to review its financial information in its entirety and not rely on a single financial measure.
The following table reconciles our adjusted net profit and adjusted EBITDA, both non-IFRS measures, for the six months ended June 30, 2024 and 2025 to the most directly comparable financial measure calculated and presented in accordance with IFRS, which is profit for the period.
| For the six months ended June 30, |
||||||
| 2024 | 2025 | |||||
| (RMB in thousands) | ||||||
| Profit for the period | 1,177,379 | 905,990 | ||||
| Add back: | ||||||
| Equity-settled share-based payment expenses | 64,507 | 40,586 | ||||
| Loss from fair value change of derivatives(1) | – | 39,748 | ||||
| Issuance cost of derivatives(2) | – | 44,664 | ||||
| Interest expenses related to the Equity Linked Securities and the bank loans used for acquisition of the equity interest in Yonghui | – | 128,351 | ||||
| –Interest expenses related to the Equity Linked Securities(3) | – | 89,885 | ||||
| – Interest expenses related to the bank loans used for acquisition of the equity interest in Yonghui | – | 38,466 | ||||
| Share of loss of Yonghui, net of tax | – | 119,335 | ||||
| Adjusted net profit (a non-IFRS measure) | 1,241,886 | 1,278,674 | ||||
| Add back: | ||||||
| Depreciation and amortization | 333,131 | 554,016 | ||||
| Finance costs excluding interest expenses related to the Equity Linked Securities and the bank loans used for acquisition of the equity interest in Yonghui | 40,595 | 65,885 | ||||
| Income tax expense | 351,742 | 288,201 | ||||
| Adjusted EBITDA (a non-IFRS measure) | 1,967,354 | 2,186,776 | ||||
Notes:
| (1) | The RMB39,748,000 loss from fair value change of derivatives was a non-cash expense that was related to the fair value of the Equity Linked Securities and call spread. It was determined solely by movements in the underlying share price. |
| (2) | The RMB44,664,000 issuance cost of derivatives was a one-off expense that was related to the Equity Linked Securities. |
| (3) | The RMB89,885,000 interest expenses related to the Equity Linked Securities included RMB80,815,000 non-cash portion and RMB9,070,000 cash expense. |
BUSINESS REVIEW AND OUTLOOK
Business Review for the Reporting Period
We are a global value retailer offering a variety of trendy lifestyle products featuring IP design. Since we opened our first store in China in 2013, we have successfully incubated two brands – “MINISO” and “TOP TOY”. We have built our flagship brand “MINISO” as a globally recognized retail brand and established a store network worldwide. Our flagship brand “MINISO” offers a frequently-refreshed assortment of lifestyle products covering diverse consumer needs, and consumers are attracted to our products’ trendiness, creativeness, high quality and affordability.
During the six months ended June 30, 2025, the total number of MINISO stores in mainland China and overseas markets increased from 7,504 as of December 31, 2024 to 7,612 as of June 30, 2025. The number of TOP TOY stores increased from 276 as of December 31, 2024 to 293 as of June 30, 2025. For the six months ended June 30, 2025, the aggregate GMV of the Group reached approximately RMB16.7 billion.
Brands and Products
For the six months ended June 30, 2025, we launched an average of around 1,800 SKUs in “MINISO” channels per month, and we offered consumers a wide selection of SKUs, the vast majority of which are under the “MINISO” brand. Our MINISO product offering spans across 11 major categories, including home decor, small electronics, textile, accessories, beauty tools, toys, cosmetics, personal care, snacks, fragrance and perfumes, stationery and gifts.
Under the “TOP TOY” brand, we offered more than 11,000 SKUs as of June 30, 2025 across major pop toy categories such as model figures, 3D building blocks, vinyl plush toys, and other pop toys.
Store Network
As of June 30, 2025, we served consumers primarily through a network of over 7,600 MINISO stores, including over 4,300 MINISO stores in mainland China and over 3,300 MINISO stores in overseas markets. The following table shows the number of MINISO stores in mainland China and overseas as of the dates presented:
| As of June 30, | ||||||
| 2024 | 2025 | |||||
| Number of MINISO stores | ||||||
| Mainland China | 4,115 | 4,305 | ||||
| Directly operated stores | 29 | 20 | ||||
| Stores operated under MINISO Retail Partner model | 4,063 | 4,258 | ||||
| Stores operated under distributor model | 23 | 27 | ||||
| Overseas | 2,753 | 3,307 | ||||
| Directly operated stores | 343 | 579 | ||||
| Stores operated under MINISO Retail Partner model | 338 | 425 | ||||
| Stores operated under distributor model | 2,072 | 2,303 | ||||
| Total | 6,868 | 7,612 | ||||
We have expanded our TOP TOY store network in mainland China since 2020. TOP TOY has also begun to expand to overseas markets since 2024. This strategic move aligns with the Company’s plan to expand globally and strengthen its brand presence. As of June 30, 2025, we had a total of 293 TOP TOY stores, 283 of which are located in mainland China. The following table shows the number of TOP TOY stores worldwide as of the dates presented:
| As of June 30, | ||||||
| 2024 | 2025 | |||||
| Number of TOP TOY stores | ||||||
| Directly operated stores | 21 | 38 | ||||
| Stores operated under MINISO Retail Partner model | 174 | 250 | ||||
| Stores operated under distributor model | – | 5 | ||||
| Total | 195 | 293 | ||||
Store operations in mainland China
As of June 30, 2025, apart from 20 directly operated MINISO stores, 27 distributor MINISO stores and 33 directly operated TOP TOY stores, all of our other MINISO and TOP TOY stores in mainland China were operated under the MINISO Retail Partner model.
The following table shows the aggregate numbers of MINISO stores in mainland China for the periods indicated:
| For the six months ended June 30, |
||||||
| 2024 | 2025 | |||||
| Directly operated stores | ||||||
| Number of stores at the beginning of the period | 26 | 25 | ||||
| Net increase/(decrease) in number of stores during the period | 3 | (5 | ) | |||
| Number of stores at the end of the period | 29 | 20 | ||||
| Stores operated under MINISO Retail Partner model | ||||||
| Number of stores at the beginning of the period | 3,878 | 4,335 | ||||
| Net increase/(decrease) in number of stores during the period | 185 | (77 | ) | |||
| Number of stores at the end of the period | 4,063 | 4,258 | ||||
| Stores operated under distributor model | ||||||
| Number of stores at the beginning of the period | 22 | 26 | ||||
| Net increase in number of stores during the period | 1 | 1 | ||||
| Number of stores at the end of the period | 23 | 27 | ||||
The following table shows the aggregate numbers of MINISO stores in mainland China by city-tiers as of the dates presented:
| As of June 30, | ||||||
| 2024 | 2025 | |||||
| Number of MINISO stores in mainland China | ||||||
| First-tier cities | 541 | 572 | ||||
| Second-tier cities | 1,705 | 1,774 | ||||
| Third- or lower-tier cities | 1,869 | 1,959 | ||||
| Total | 4,115 | 4,305 | ||||
The MINISO Retail Partner model represents a mutually beneficial relationship between us and the MINISO Retail Partners, where we achieve rapid store network expansion with consistent brand image and consumer experience in an asset-light manner, and our MINISO Retail Partners attain attractive investment opportunities. Our MINISO Retail Partners are also motivated to maintain a loyal relationship with us. As of June 30, 2025, there were 1,079 MINISO Retail Partners that invested in MINISO stores in mainland China, and 677 of them had invested for over three years.
The following table shows the number of our MINISO Retail Partners that invested in MINISO stores in mainland China for the period indicated:
| For the six months ended June 30, |
||||||
| 2024 | 2025 | |||||
| Number of MINISO Retail Partners at the beginning of the period(1) | 1,049 | 1,071 | ||||
| Net (decrease)/increase in number of MINISO Retail Partners during the period | (4 | ) | 8 | |||
| Number of MINISO Retail Partners at the end of the period | 1,045 | 1,079 | ||||
Note:
| (1) | Number of MINISO Retail Partners at a given date is calculated based on the number of individuals and entities with effective contractual relationships with us at that date. |
We had 1 distributor for the MINISO brand in Tibet, China during the six months ended June 30, 2025. As of the date of this announcement, there has been no conversion of our franchisees in mainland China from a MINISO Retail Partner to a distributor, or vice versa.
The majority of our TOP TOY stores in mainland China are operated under the MINISO Retail Partner model as well. As of June 30, 2024 and 2025, we had 47 and 70 Retail Partners operating TOP TOY stores, respectively. Some Retail Partners in mainland China may invest in both MINISO and TOP TOY stores.
Store operations in overseas markets
We have adopted flexible store operation models, including direct operation, MINISO Retail Partner model and the distributor model, as we expand our global networks, depending on the growth potential, local regulation and other factors in the markets. In consideration of the evolving local regulatory requirements, market conditions and their operational needs, our overseas franchisees may sometimes convert from a MINISO Retail Partner to a distributor, or vice versa.
As of June 30, 2025, in overseas markets, there were 579 stores directly operated by us, and 425 and 2,303 stores operated under the MINISO Retail Partner model and distributor model, respectively.
The following table shows the aggregate number of MINISO stores in overseas markets for the periods indicated:
| For the six months ended June 30, |
||||||
| 2024 | 2025 | |||||
| Directly operated stores | ||||||
| Number of stores at the beginning of the period | 238 | 503 | ||||
| Net increase in number of stores during the period | 105 | 76 | ||||
| Number of stores at the end of the period | 343 | 579 | ||||
| Stores operated under MINISO Retail Partner model | ||||||
| Number of stores at the beginning of the period | 283 | 404 | ||||
| Net increase in number of stores during the period | 55 | 21 | ||||
| Number of stores at the end of the period | 338 | 425 | ||||
| Stores operated under distributor model | ||||||
| Number of stores at the beginning of the period | 1,966 | 2,211 | ||||
| Net increase in number of stores during the period | 106 | 92 | ||||
| Number of stores at the end of the period | 2,072 | 2,303 | ||||
The following table shows the number of the distribution of MINISO stores in overseas markets by region as of the dates presented:
| As of June 30, | ||||||
| 2024 | 2025 | |||||
| Number of MINISO stores in overseas markets | ||||||
| Asia excluding China | 1,484 | 1,695 | ||||
| North America | 234 | 394 | ||||
| Latin America | 584 | 661 | ||||
| Europe | 244 | 319 | ||||
| Others | 207 | 238 | ||||
| Total | 2,753 | 3,307 | ||||
In the majority of overseas markets, we expand our store network by collaborating with local distributors with abundant local resources and retail experiences. The following table shows the number of our distributors in MINISO overseas markets for the period indicated:
| For the six months ended June 30, |
||||||
| 2024 | 2025 | |||||
| Number of distributors at the beginning of the period(1) | 230 | 252 | ||||
| Net (decrease)/increase in number of distributors during the period(2) | (1 | ) | 17 | |||
| Number of distributors at the end of the period(1) | 229 | 269 | ||||
Notes:
| (1) | Number of distributors at a given date is calculated based on the number of individuals and entities with effective contractual relationships with us at that date. |
| (2) | Change of contracting entities by the same distributor is not taken into account in the calculation of numbers of new or terminated distributors. |
As of June 30, 2024 and 2025, we had 101 and 117 MINISO Retail Partners in overseas markets, respectively. The increase in the number of MINISO Retail Partners for the six months ended June 30, 2025 was primarily due to increase in the number of MINISO Retail Partners in Indonesia and Vietnam.
Other Key Operating Data
The following tables set forth certain of key operating data of MINISO stores in mainland China and overseas markets, respectively:
| For the six months ended June 30, |
||||||
| 2024 | 2025 | |||||
| MINISO stores in mainland China | ||||||
| MINISO stores’ GMV(1) (RMB in millions) | 7,097 | 7,800 | ||||
| Total number of transactions (in millions) | 184.3 | 198.9 | ||||
| Total sales volume of SKUs (in millions) | 486.4 | 527.4 | ||||
| Average spending per transaction (RMB) | 38.5 | 39.2 | ||||
| Average selling price (RMB) | 14.6 | 14.8 | ||||
| Same-store(2) GMV Growth (%) | Down low-single digit | Down low-single digit | ||||
Notes:
| (1) | Includes GMV generated through MINISO offline stores and Online to Offline (“O2O”) platforms. |
| (2) | Includes stores that opened prior to the beginning of the comparative periods and remained open as of the end of the comparative periods and closed for less than 30 days during both comparative periods. |
| For the six months ended June 30, |
||||||
| 2024 | 2025 | |||||
| MINISO stores in overseas markets | ||||||
| MINISO stores’ GMV (RMB in millions) | 6,401 | 7,330 | ||||
| Asia excluding China | 2,353 | 2,567 | ||||
| North America | 844 | 1,414 | ||||
| Latin America | 2,383 | 2,257 | ||||
| Europe | 527 | 744 | ||||
| Others | 294 | 348 | ||||
| Same-store(1) GMV Growth (%) | Up mid-teens | Down mid-single digit | ||||
| Asia excluding China | Up mid-teens | Down mid-single digit | ||||
| North America | Up low-teens | Down mid-single digit | ||||
| Latin America | 20%~25% | Down high-single digit | ||||
| Europe | Up low-teens | Down low-single digit | ||||
| Others | Down low-single digit | Up high-single digit | ||||
Note:
| (1) | Includes stores that (i) were opened prior to the beginning of the comparative periods, (ii) were remained open as of the end of the comparative periods, and (iii) were closed for less than 30 days during both comparative periods. The impact of foreign exchange is excluded by adopting a constant currency exchange rate in both comparative periods. |
The following table sets forth the GMV of MINISO brand worldwide through online channels for the periods indicated:
| For the six months ended June 30, |
||||||
| 2024 | 2025 | |||||
| (RMB in millions) | ||||||
| MINISO brand worldwide | ||||||
| Total GMV through online channels(1) | 395 | 558 | ||||
| Note: |
| (1) | Excludes GMV through O2O platforms in mainland China which is accounted for in GMV through offline channels. |
Our TOP TOY brand started operating in December 2020 in mainland China. For the six months ended June 30, 2025, our TOP TOY brand achieved a total GMV of RMB1,048.0 million through multi-channels: (1) RMB794.9 million from TOP TOY stores in mainland China; (2) RMB126.6 million through online channels; (3) RMB126.5 million of GMV from other channels.
The following table sets forth certain of our key operating data of TOP TOY stores in mainland China:
| For the six months ended June 30, |
||||||
| 2024 | 2025 | |||||
| TOP TOY stores in mainland China | ||||||
| TOP TOY stores’ GMV (RMB in millions) | 521 | 795 | ||||
| Total number of transactions (in millions) | 4.7 | 7.2 | ||||
| Total sales volume of SKUs (in millions) | 8.9 | 14.2 | ||||
| Average spending per transaction (RMB) | 111.2 | 109.8 | ||||
| Average selling price (RMB) | 58.8 | 56.1 | ||||
| Same-store(1) GMV Growth (%) | Up mid-teens | Down low-single digit | ||||
Note:
| (1) | Includes stores that opened prior to the beginning of the comparative periods and remained open as of the end of the comparative periods and closed for less than 30 days during both comparative periods. |
Recent Developments after the Reporting Period
Update on TOP TOY
TOP TOY recently has completed a round of strategic financing led by Temasek, a global investment company headquartered in Singapore. The post-transaction valuation of TOP TOY reached approximately HK$10 billion, demonstrating the market recognition of TOP TOY’s business model, brand equity, and global expansion roadmap on a rapid growth trajectory of its pop toy business.
Business Outlook
Confronting the ever-evolving macroeconomic and geopolitical environment, the Group demonstrates its significant risk resilience and agility through years of accumulated overseas expansion experience, diversified global footprint and global operational capabilities. Looking into the second half of 2025, we will continue to uphold our core philosophy for delivering long-term value by solid execution of our strategy: focusing on affordability, globalization and product innovation.
For our MINISO brand in mainland China, we will remain focused on achieving high quality growth by expanding and upgrading our store network to promote a relaxing, immersive and engaging shopping experience full of delightful surprises with treasure-hunting elements to our customers, unlocking the sales potential via different innovative themed store at the same time. We will also continue to innovate, introducing new product offerings with aesthetically pleasant designs, high product quality and high affordability, optimizing product-market fit, thereby fully leveraging on our multi-sales channels to create synergy with our diversified product offerings.
For our MINISO brand in the overseas markets, we will firmly pursue globalization strategy by expanding our overseas store footprint, adopting diversified yet localized tactics adaptive to different overseas markets, and further strengthening our cooperation with overseas business partners to capture every local market trend globally. Meanwhile, through execution of IP cooperation and the strategic roll-out of stellar products in different markets, we will continue to enhance MINISO brand awareness through product differentiation and adaptation as well as the refinement of store model. As our globalization process progresses, we will further facilitate our robust development in overseas markets through enhancing the efficiency of localized operations in each and every geographical region.
For our TOP TOY, we were pleased to see that it has embarked on globalization since the December quarter in 2024. Moving forward, we will continue to optimize TOP TOY’s product offerings and enhance operational efficiency to increase its market share and strengthen its brand image.
MANAGEMENT DISCUSSION AND ANALYSIS
| For the six months ended June 30, |
||||||||
| 2024 | 2025 | |||||||
| (RMB in thousands) | ||||||||
| Revenue | 7,758,743 | 9,393,112 | ||||||
| Cost of sales | (4,368,957 | ) | (5,236,194 | ) | ||||
| Gross profit | 3,389,786 | 4,156,918 | ||||||
| Other income | 12,698 | 5,370 | ||||||
| Selling and distribution expenses | (1,522,088 | ) | (2,181,022 | ) | ||||
| General and administrative expenses | (418,573 | ) | (503,656 | ) | ||||
| Other net income | 41,696 | 98,239 | ||||||
| Credit loss on trade and other receivables | (3,606 | ) | (13,450 | ) | ||||
| Impairment loss on non-current assets | (5,104 | ) | (16,450 | ) | ||||
| Operating profit | 1,494,809 | 1,545,949 | ||||||
| Finance income | 74,606 | 65,836 | ||||||
| Finance costs | (40,595 | ) | (194,236 | ) | ||||
| Net finance income/(costs) | 34,011 | (128,400 | ) | |||||
| Share of profit/(loss) of equity-accounted investees, net of tax | 301 | (138,946 | ) | |||||
| Other expenses | – | (84,412 | ) | |||||
| Profit before taxation | 1,529,121 | 1,194,191 | ||||||
| Income tax expense | (351,742 | ) | (288,201 | ) | ||||
| Profit for the period | 1,177,379 | 905,990 | ||||||
| Profit for the period attributable to: | ||||||||
| – Equity shareholders of the Company | 1,170,102 | 906,030 | ||||||
| – Non-controlling interests | 7,277 | (40 | ) | |||||
Revenues
Our total revenue was RMB9,393.1 million for the six months ended June 30, 2025 (for the six months ended June 30, 2024: RMB7,758.7 million), representing an increase of 21.1% year over year, which was driven by the following factors: (i) an increase of 11.4% in revenue from MINISO brand in mainland China, (ii) an increase of 29.4% in revenue from MINISO brand in overseas markets, and (iii) an increase of 73% in revenue from TOP TOY brand.
Cost of Sales
Our cost of sales was RMB5,236.2 million for the six months ended June 30, 2025 (for the six months ended June 30, 2024: RMB4,369.0 million), representing an increase of 19.8% year over year.
Gross Profit and Gross Margin
Our gross profit was RMB4,156.9 million for the six months ended June 30, 2025 (for the six months ended June 30, 2024: RMB3,389.8 million), and gross margin was 44.3% for the six months ended June 30, 2025 (for the six months ended June 30, 2024: 43.7%), representing an increase of 0.6 percentage point. The increase in gross margin was mainly attributable to (i) higher revenue contribution from overseas markets, and (ii) higher gross margin of TOP TOY due to a shift in product mix towards more profitable products.
Selling and Distribution Expenses
Our selling and distribution expenses were RMB2,181.0 million for the six months ended June 30, 2025 (for the six months ended June 30, 2024: RMB1,522.1 million), increased by 43.3% year over year. Excluding equity-based compensation expenses, our selling and distribution expenses were RMB2,167.1 million for the six months ended June 30, 2025 (for the six months ended June 30, 2024: RMB1,480.6 million). The year-over-year increase was mainly attributable to our investments into directly operated stores to pursue the future success of our business, especially in strategic overseas markets such as the U.S. market. As of June 30, 2025, total number of directly operated stores on the group level was 637, compared to 393 as of June 30, 2024. For the six months ended June 30, 2025, the revenue from directly operated stores increased 81.7%, while related expenses including rental and related expenses, depreciation and amortization expenses together with payroll excluding share-based compensation expenses increased 63.4%. Licensing expenses increased 31.5%, as a percentage of revenue ranging from 2% to 3% in both comparative periods. Promotion and advertising expenses increased 6.2%, as a percentage of revenue stabilizing at around 3% in both comparative periods. Logistics expenses increased 25.5% year over year.
General and Administrative Expenses
Our general and administrative expenses were RMB503.7 million for the six months ended June 30, 2025 (for the six months ended June 30, 2024: RMB418.6 million), increased by 20.3% year over year. Excluding equity-settled share-based payment expenses, our general and administrative expenses were RMB477.0 million for the six months ended June 30, 2025 (for the six months ended June 30, 2024: RMB395.6 million), increased by 20.6% year over year. The year-over-year increase was primarily due to the increase of personnel-related expenses in relation to the development of our business.
Other Net Income
Our other net income was RMB98.2 million for the six months ended June 30, 2025 (for the six months ended June 30, 2024: RMB41.7 million). The year-over-year increase was mainly due to an increase in investment income in wealth management products, and a net foreign exchange gain compared with a net foreign exchange loss in the same period last year.
Operating Profit
As a result of the foregoing, we recorded operating profit of RMB1,545.9 million for the six months ended June 30, 2025 (for the six months ended June 30, 2024: RMB1,494.8 million), increased by 3.4% year over year.
Net Finance Income/(Costs)
Our net finance costs was RMB128.4 million for the six months ended June 30, 2025 (for the six months ended June 30, 2024: net finance income RMB34.0 million). The year-over-year increase in net finance costs was due to (i) increased interest expenses in relation to the Equity Linked Securities and the bank loans used for acquisition of the equity interest of Yonghui, both of which have been excluded in non-IFRS financial measures, and (ii) increased interest expenses on lease liabilities corresponding to our investment in directly operated stores.
Income Tax Expense
We recorded income tax expense of RMB288.2 million for the six months ended June 30, 2025 (for the six months ended June 30, 2024: RMB351.7 million).
Share of Profit/(Loss) of Equity-Accounted Investees, Net of Tax
Our share of loss of equity-accounted investees, net of tax was 138.9 million for the six months ended June 30, 2025 (for the six months ended June 30, 2024: share of profit of RMB0.3 million). The year-over-year change was mainly attributable to share of loss in Yonghui, which has been excluded in non-IFRS financial measures.
Other Expenses
Our other expenses were RMB84.4 million for the six months ended June 30, 2025 (for the six months ended June 30, 2024: nil), mainly attributable to loss from a fair value change of derivatives under mark-to-market impact, which is in relation to the Equity Linked Securities and has been excluded in non-IFRS financial measures.
Profit for the Period
As a result of the foregoing, we recorded a profit of RMB906.0 million for the six months ended June 30, 2025 (for the six months ended June 30, 2024: RMB1,177.4 million).
Adjusted Net Profit (a non-IFRS measure)
We recorded an adjusted net profit of RMB1,278.7 million for the six months ended June 30, 2025 (for the six months ended June 30, 2024: RMB1,241.9 million), which represents profit for the period excluding equity-settled share-based payment expenses, loss from fair value change of derivatives, issuance cost of derivatives and interest expenses related to the Equity Linked Securities and interest expenses related to the bank loans used for acquisition of the equity interest in Yonghui, and share of loss of Yonghui, net of tax.
Adjusted EBITDA (a non-IFRS measure)
We recorded an adjusted EBITDA of RMB2,186.8 million for the six months ended June 30, 2025 (for the six months ended June 30, 2024: RMB1,967.4 million), which represents adjusted net profit plus depreciation and amortization, finance costs excluding interest expenses related to the Equity Linked Securities and interest expenses related to the bank loans used for acquisition of the equity interest in Yonghui and income tax expense.
Net Cash from Operating Activities and Free Cash Flow
Our net cash from operating activities was RMB1,014.2 million for the six months ended June 30, 2025 (for the six months ended June 30, 2024: RMB1,293.8 million). Our capital expenditure was RMB434.8 million for the six months ended June 30, 2025 (for the six months ended June 30, 2024: RMB302.8 million), and free cash flow was RMB579.4 million for the six months ended June 30, 2025 (for the six months ended June 30, 2024: RMB991.0 million).
Current Ratio
Our current ratio decreased from 2.4 as of June 30, 2024 to 1.9 as of June 30, 2025, primarily due to increase in short-term loans and borrowings, lease liabilities relating to directly operated stores, and trade payables related to our inventories.
OTHER INFORMATION ABOUT OUR FINANCIAL PERFORMANCE
Liquidity and Source of Funding
During the six months ended June 30, 2025, we funded our cash requirements principally through cash generated from our operations. As of June 30, 2025, our cash, cash equivalents, restricted cash, term deposits, and other investments recorded in current assets were RMB7,466.1 million (as of December 31, 2024: RMB6,698.1 million).
Issue of the Equity Linked Securities and Entry into the Call Spread
In January 2025, we entered into a subscription agreement with UBS AG Hong Kong Branch and The Hongkong and Shanghai Banking Corporation Limited for the issuance of equity linked securities by us, which were convertible debt securities that shall be settled wholly in cash, with an aggregate principal amount of US$550,000,000 and an expected maturity date on January 14, 2032 (the “Equity Linked Securities”). The Equity Linked Securities have been approved by the Singapore Exchange Securities Trading Limited (the “SGX-ST”) to be listed and quoted on the Official List of the SGX-ST. The initial exercise price of the Equity Linked Securities was US$8.2822 per Share, subject to adjustment upon the occurrence of certain customary prescribed corporate actions. As a result of the distribution of the final cash dividend for the fiscal year ended December 31, 2024 (the “2024 Final Dividend”), the Equity Linked Securities exercise price was adjusted from US$8.2822 per Share, to US$8.1516 per Share, with effect from April 9, 2025, being the date immediately after the record date of the 2024 Final Dividend.
Further, we and UBS AG, London Branch and The Hongkong and Shanghai Banking Corporation Limited (the “Call Spread Counterparties”) entered into a call spread (the “Call Spread”), which is separate from, but is part and parcel of, the Equity Linked Securities, and comprise:
| (a) | Lower Strike Call: a call option transaction granted by the Call Spread Counterparties to the Company, exercisable at the discretion of the Company, entitling the Company to (a) the difference, settled in cash, between the exercise price of the lower strike call, which is equivalent to the exercise price of the Securities, and the volume weighted average price per Share over a specified period of trading days, converted to U.S. dollars at the prevailing exchange rate, and multiplied by (b) the number of Shares underlying the lower strike call being exercised; and |
| (b) | Upper Strike Warrant: a call option transaction with an expected exercise price (the “Upper Strike Exercise Price”) of HK$102.1 per Share, representing a premium of 110.0% over the Delta Reference Price (for reference and illustration only) and a premium of 99.9% over the Stock Reference Price, granted by the Company to the Call Spread Counterparties, exercisable at the discretion of the Call Spread Counterparties, which would entitle the Call Spread Counterparties to receive newly allotted and issued Shares (the “Upper Strike Shares”), the maximum number of which was subject to adjustment upon the occurrence of certain customary prescribed corporate actions. As at January 7, 2025, the maximum number of Upper Strike Shares that may be issued was 66,407,407 Shares (representing approximately 5.31% of the then total issued and outstanding Shares), which did not exceed and was issued under the general mandate granted by the Shareholders to the Directors on June 20, 2024 to allot and issue new Shares. Following the distribution of the 2024 Final Dividend, the Upper Strike Exercise Price was adjusted to HK$100.5 per Share, and the maximum number of the Upper Strike Shares was adjusted to 67,471,717 Shares. We has received approval from the Listing Committee of The Stock Exchange of Hong Kong Limited (the “Hong Kong Stock Exchange” or “HKEX”) for the listing of, and permission to deal in, the Upper Strike Shares issuable under the Upper Strike Warrant. |
The Call Spread was structured such that the timing, size and economics of the exercises under the Call Spread was able to match the exercises under the Equity Linked Securities. This overall structure will enable us to raise funds in a form similar to convertible debt securities, whilst deferring potential dilution to a higher effective exercise price.
We raised total net proceeds of US$457,079,647 (equivalent to HK$3,553,839,963) from the offering and sale of the Equity Linked Securities and the Call Spread. We planned to use the net proceeds for overseas store network expansion, supply chain optimization and development, brand building and promotion, additional overseas working capital and other general corporate purposes, and to purchase its Shares and/or ADSs (American Depositary Shares (the “ADS(s)”)(each representing four Shares)) from time to time pursuant to its share repurchase programs.
For further details, please refer to the announcements of us dated January 7, 2025, January 14, 2025 and April 24, 2025 in relation to the issue of the Equity Linked Securities and entry into the Call Spread by our Company.
Material Acquisitions and Disposals
Very Substantial Acquisition of Shares in Yonghui Superstores Co., Ltd
On September 23, 2024, our Company through our wholly-owned subsidiary, entered into share purchase agreements with independent third parties, respectively, to acquire an aggregate of 2,668,135,376 shares in Yonghui (representing approximately 29.4% of its entire issued share capital), at the consideration in the amount of RMB6,270,118,134 (equivalent to approximately HK$6,916,461,457, converted at the exchange rate of RMB0.90655 to HK$1.0000 for illustrative purpose only) (the “Yonghui Acquisition”). Yonghui, a listed company on the Shanghai Stock Exchange (stock code: 601933), is a retail chain operator featuring fresh produce management, mainly operates hypermarkets, supermarkets and community supermarkets, and has approximately 775 outlets spanning across about 29 provinces and municipalities across the mainland China as of December 31, 2024.
The Yonghui Acquisition was approved by our shareholders at the extraordinary general meeting of us held on January 17, 2025, and has already been completed in the first quarter of 2025.
As one or more of the applicable percentage ratios (as defined under Rule 14.07 of the Rules Governing the listing of Securities on the Hong Kong Stock Exchange (the “Listing Rules”)) in respect of the Yonghui Acquisition exceeds 100% on an aggregated basis pursuant to Rule 14.22 of the Listing Rules, the Yonghui Acquisition constitutes a very substantial acquisition under Chapter 14 of the Listing Rules. For details, please refer to our announcement dated September 23, 2024 and our circular dated November 22, 2024.
Save as disclosed above, we did not have any other material acquisitions or disposals of subsidiaries, consolidated affiliated entities or associated companies during the six months ended June 30, 2025.
Significant Investments
The Yonghui Acquisition was completed in the first quarter of 2025. Our equity interests in Yonghui has been accounted for as investments in associates using the equity method in our consolidated financial statements since its completion. As of June 30, 2025, we continued to hold approximately 29.4% of the issued share capital of Yonghui. For the six months ended June 30, 2025, we recorded a loss of RMB119.3 million for the investment in Yonghui. As we continue to be optimistic about the development of the offline retail industry in mainland China, we believe that the investment in Yonghui is in line with the Group’s investment strategy.
Save as disclosed above, we did not make or hold any other significant investments during the six months ended June 30, 2025.
Future Plans for Material Investments or Capital Assets
As of June 30, 2025, we did not have detailed future plans for material investments or capital assets.
Pledge of Assets
As of June 30, 2025, our equity interests in equity-accounted investees of approximately RMB4,308.2 million were pledged as securities for obtaining banking borrowings, an industry common practice for borrowings used for acquisitions.
Cash Management Policy
We believe we can make better use of our cash by making appropriate investments in short-term investment products, which generate income without interfering with our business operation or capital expenditures. Our investment decisions with respect to financial products are made on a case-by-case basis and after due and careful consideration of a number of factors, including, but not limited to, the market conditions, the economic developments, the anticipated investment conditions, the investment cost, the duration of the investment and the expected benefit and potential loss of the investment. We have established a set of internal control measures which allow us to achieve reasonable returns on our investment while mitigating our exposure to high investment risks. These policies and measures were formulated by our senior management.
In order to make full use of idle funds, enhance the utilization rate of surplus funds, and increase our income, under the premise of not affecting our normal business activities, subject to approval from our chief financial officer, we may purchase a certain amount of wealth management products from financial institutions. According to our internal policies, the manager of our treasury department should make proposals to invest in wealth management products to our chief financial officer and such proposals must be reviewed and approved by our chief financial officer. In assessing a proposal to invest in wealth management products, a number of criteria must be met, including but not limited to the following:
| · | the purchase of wealth management products is limited to low-risk products such as term deposits, principal-guaranteed and interest-paying products, treasury notes issued by banks, and wealth management products with risk level below R2. The purchase of high-risk financial instruments such as securities and futures is strictly prohibited. |
| · | the expected return of the purchased wealth management products should be not lower than bank’s deposit interest rate for term deposits of the same period, the product structure should be relatively simple, and the purchases should be made from financial institutions with large operation scale, overall strength and good credit standing. |
| · | the treasury department is responsible for setting up a detailed ledger for wealth management products, the manager of the treasury department manages the financial products, and tracks the progress and safety of wealth management products. In the event of an abnormal situation, the manager of the treasury department should report the situation to the chief financial officer in a timely manner so that we can take effective measures immediately to reduce potential losses. |
Gearing Ratio
As of June 30, 2025, our gearing ratio was 66.9%, calculated as loans and borrowings divided by total equity as of the end of the period and multiplied by 100%.
Foreign Exchange Risk
Our financial reporting currency is RMB and changes in foreign exchange rates can significantly affect our reported results and consolidated trends. In addition, our results of operations, including margins, are affected by the fluctuation in foreign exchange rates. Our international operations generate revenues primarily in U.S. dollars. Generally, a weakening of RMB against U.S. dollar has a positive effect on our results of operations, while a strengthening of RMB against U.S. dollar has the opposite effect. We have not used any derivative financial instruments to hedge exposure to such risk. To the extent that we need to convert U.S. dollars into RMB for our operations, appreciation of RMB against U.S. dollar would have an adverse effect on RMB amount we receive from the conversion. Conversely, if we decide to convert RMB into U.S. dollars for the purpose of making payments for dividends on our ordinary shares or ADSs or for other business purposes, appreciation of U.S. dollar against RMB would have a negative effect on U.S. dollar amounts available to us.
Contingent Liabilities
Commitment of Tax Payments
In connection with the acquisition of land use right and the construction of the headquarters building in Guangzhou, we entered into a letter of intent on November 26, 2020 with the local government of the district where our new headquarters building is located and committed to pay an aggregate amount of tax levies of no less than RMB965.0 million to the local government in Guangzhou for a five-year period starting from January 1, 2021, with RMB160.0 million in 2021, RMB175.0 million in 2022, RMB190.0 million in 2023, RMB210.0 million in 2024 and RMB230.0 million in 2025. If we fail to meet the committed amount for any of the five calendar years, we will have to compensate for the shortfall.
We had met the commitments for the calendar years of 2021, 2022, 2023 and 2024, and therefore, we were not required to make any compensation to the local government. In March 2025, we provided a performance guarantee of RMB230.0 million issued by a commercial bank to this local government in respect of the commitment of tax payments for the calendar year of 2025, which is valid from April 1, 2025 to March 31, 2026. The Directors have assessed that, based on the projection of and actual relevant taxes and surcharges paid and payable during the calendar year of 2025, we will be able to meet the commitment for the calendar year of 2025, and thus, it is not probable that we need to make any compensation to the local government under the above performance guarantee. As such, no provision has been made in respect of this matter as of June 30, 2025.
Securities class action
In August 2022, a putative federal securities class action was filed against us and certain of its officers and Directors (“Defendants”), alleging that Defendants made misleading misstatements or omissions regarding our business operations and financials in violation of the Securities Act of 1933 and the Securities Exchange Act of 1934. The action is captioned In re MINISO Group Holding Limited Securities Litigation, 1:22-cv-09864 (S.D.N.Y.). We and other defendants filed a motion to dismiss the operative complaint, and the motion was granted by the court in February 2024, with leave to amend. Plaintiffs subsequently filed a motion for reconsideration of the court’s decision, which was denied by the court. Plaintiffs then filed a further amended complaint and the parties are now engaging in another round of motion-to-dismiss briefing, which is expected to be complete by late September 2025. As of June 30, 2025, the Directors were unable to assess the outcome of the action or reliably estimate the potential losses, if any.
Capital Commitment
As of June 30, 2025, our capital commitment was RMB630.9 million, compared to RMB633.5 million as of December 31, 2024, which is mainly attributable to the construction of the headquarters building.
Employees and Remuneration
We had a total of 7,204 full-time employees as of June 30, 2025, including 2,824 in mainland China and 4,380 in certain overseas countries and regions, up from 5,245 full-time employees one year ago. The following table sets forth the number of our employees categorized by function as of June 30, 2025.
| Function | Number
of Employees |
|||
| Product Development and Supply Chain Management | 1,183 | |||
| General and Administrative | 565 | |||
| Operations | 4,699 | |||
| Sales and Marketing | 184 | |||
| Technology | 216 | |||
| Business Development | 204 | |||
| Logistics | 153 | |||
| Total | 7,204 | |||
Our total remuneration cost incurred for the six months ended June 30, 2025 was RMB929.9 million, while it was RMB685.5 million for the six months ended June 30, 2024.
The number of employees employed by us varies from time to time depending on needs and employees are remunerated based on industry practice. The remuneration policy and package of the Group’s employees are periodically reviewed. Apart from pension funds and in-house training programs, discretionary bonuses, share awards and share options from our share incentive plan may be awarded to employees according to the assessment of individual performance.
CORPORATE GOVERNANCE
The Board is committed to achieving high corporate governance standards. The Board believes that high corporate governance standards are essential in providing a framework for us to safeguard the interests of its shareholders and to enhance corporate value and accountability.
Compliance with the Corporate Governance Code
We have complied with all the applicable code provisions of the Corporate Governance Code (the “Corporate Governance Code”) set forth in Part 2 of Appendix C1 to the Listing Rules for the six months ended June 30, 2025, save for the following.
Code provision C.2.1 of the Corporate Governance Code recommends, but does not require, that the roles of chairman of the Board and chief executive officer should be separate and should not be performed by the same individual.
We deviate from this code provision as we do not have a separate chairman and chief executive officer and Mr. Ye Guofu (“Mr. Ye”) currently performs these two roles of us. Mr. Ye is our founder and has extensive experience in our business operations and management. The Board believes that vesting the roles of both chairperson and chief executive officer in the same person has the benefit of ensuring consistent leadership within our Group and enables more effective and efficient overall strategic planning for our Group. The Board considers that the balance of power and authority for the present arrangement will not be impaired and this structure will enable our Company to make and implement decisions promptly and effectively. The Board will continue to review and consider splitting the roles of chairman of the Board and the chief executive officer of our Company if and when it is appropriate taking into account the circumstances of the Group as a whole.
Compliance with the Model Code for Securities Transactions by Directors
We have adopted the Management Trading of Securities Policy (the “Code”), with terms no less exacting that the Model Code for Securities Transactions by Directors of Listed Issuers as set out in Appendix C3 to the Listing Rules, as its own securities dealing code to regulate all dealings by Directors and relevant employees of securities in the Company and other matters covered by the Code.
Specific enquiry has been made of all the Directors and each of the Directors has confirmed that he/she has complied with the Code during the six months ended June 30, 2025.
Audit Committee
We have established an Audit Committee in compliance with Rule 3.21 of the Listing Rules and the Corporate Governance Code.
The Audit Committee comprises three independent non-executive Directors, namely Ms. XU Lili, Mr. ZHU Yonghua and Mr. WANG Yongping. Ms. XU Lili, being the chairwoman of the Audit Committee, is appropriately qualified as required under Rule 3.10(2) of the Listing Rules.
The primary duties of the Audit Committee are:
| (a) | to monitor the integrity of our financial statements and our compliance with legal and regulatory requirements as they relate to our financial statements and accounting matters; |
| (b) | to review the adequacy of our internal control over financial reporting; and |
| (c) | to review all related party transactions for potential conflict of interest situations and approving all such transactions. |
The Audit Committee has reviewed our unaudited interim financial information for the six months ended June 30, 2025. The Audit Committee has also discussed matters with respect to the accounting policies and practices adopted by us and internal control and financial reporting matters with senior management members of us.
In addition, our independent auditor, Ernst & Young, has reviewed our unaudited interim financial information for the six months ended June 30, 2025 in accordance with Hong Kong Standard on Review Engagements 2410 “Review of Interim Financial Information Performed by the Independent Auditor of the Entity” as issued by the Hong Kong Institute of Certified Public Accountants.
OTHER INFORMATION
Purchase, Sale or Redemption of our Listed Securities
During the six months ended June 30, 2025, the Company repurchased a total of 8,167,600 Shares of our Company at an aggregate consideration (including all the relevant expenses) of HK$262.7 million on the HKEX and a total of 824,961 ADSs at an aggregate consideration (including all the relevant expenses) of US$14.1 million on the New York Stock Exchange (the “NYSE”). As of the date of this announcement, the repurchased Shares and ADSs are pending cancellation, and would not receive any interim dividend.
Particulars of the repurchases made by us during the six months ended June 30, 2025 are as follows:
HKEX
| Aggregate | ||||||||||||||||
| consideration | ||||||||||||||||
| paid (including) | ||||||||||||||||
| No. of Shares | Price paid per Share | all the relevant | ||||||||||||||
| Trading Month | repurchased | Highest price | Lowest price | expenses | ||||||||||||
| (HK$) | (HK$) | (HK$’000) | ||||||||||||||
| March 2025 | 1,266,600 | 38.00 | 34.85 | 47,037 | ||||||||||||
| April 2025 | 5,163,200 | 38.00 | 27.05 | 154,897 | ||||||||||||
| May 2025 | 554,600 | 38.00 | 33.10 | 19,421 | ||||||||||||
| June 2025 | 1,183,200 | 36.90 | 32.75 | 41,322 | ||||||||||||
NYSE
| Aggregate | ||||||||||||||||
| consideration | ||||||||||||||||
| paid (including) | ||||||||||||||||
| No. of Shares | Price paid per Share | all the relevant | ||||||||||||||
| Trading Month | repurchased | Highest price | Lowest price | expenses | ||||||||||||
| (US$) | (US$) | (US$’000) | ||||||||||||||
| March 2025 | 52,600 | 4.63 | 4.59 | 242 | ||||||||||||
| April 2025 | 1,621,224 | 4.88 | 3.51 | 6,613 | ||||||||||||
| May 2025 | 585,652 | 4.71 | 4.19 | 2,625 | ||||||||||||
| June 2025 | 1,040,368 | 4.73 | 4.20 | 4,666 | ||||||||||||
Save as disclosed above, neither our Company nor any of our subsidiaries purchased, sold, or redeemed any of the Company’s securities listed on the HKEX or on the NYSE during the six months ended June 30, 2025. Our Company did not hold any treasury shares (as defined under the Listing Rules) as of June 30, 2025.
Use of Proceeds from the Global Offering
On July 13, 2022, the Shares of the Company were listed on the Main Board of the HKEX. The net proceeds from the global offering were HK$482.1 million. As of December 31, 2024, we have fully utilized the net proceeds in accordance with such intended purposes within 48 months from the listing of its Shares on the HKEX as expected.
Interim Dividend
On March 21, 2025, the Board approved the distribution of a final cash dividend in the amount of US$0.3268 per ADS or US$0.0817 per Share, which has been paid on April 17, 2025 for holders of Shares and April 23, 2025 for holders of ADSs. The aggregate amount of cash dividend paid was approximately US$101.3 million (RMB726.9 million at an exchange rate of RMB7.1760 to US$1.0000).
On August 21, 2025, the Board approved the distribution of an interim cash dividend in the amount of US$0.2896 per ADS or US$0.0724 per Share, to holders of ADSs and Shares of record as of the close of business on September 5, 2025, New York Time and Beijing/Hong Kong Time, respectively. The ex-dividend date for holders of Shares in Hong Kong will be September 4, 2025; and the ex-dividend date for holders of ADSs will be September 5, 2025. The payment date is expected to be on September 16, 2025 for holders of Shares and around September 19, 2025 for holders of ADSs. The aggregate amount of cash dividend to be paid is approximately US$89.3 million (RMB639.5 million at an exchange rate of RMB7.1636 to US$1.0000), which is approximately 50% of our adjusted net profit for the six months ended June 30, 2025 and will be distributed from additional paid-in capital and settled by a cash distribution.
For holders of Shares, in order to qualify for the interim dividend, all valid documents for the transfer of Shares accompanied by the relevant share certificates must be lodged for registration with our Hong Kong share registrar, Computershare Hong Kong Investor Services Limited, at Shops 1712-1716, 17th Floor, Hopewell Centre, 183 Queen’s Road East, Wanchai, Hong Kong no later than 4:30 P.M. on September 5, 2025 (Beijing/Hong Kong Time).
Unaudited consolidated statement of profit or loss
(Expressed in thousands of Renminbi, except for per share data)
| For the six months ended June 30, |
|||||||||||
| Notes | 2024 | 2025 | |||||||||
| RMB’000 | RMB’000 | ||||||||||
| Revenue | 4 | 7,758,743 | 9,393,112 | ||||||||
| Cost of sales | 5 | (4,368,957 | ) | (5,236,194 | ) | ||||||
| Gross profit | 3,389,786 | 4,156,918 | |||||||||
| Other income | 12,698 | 5,370 | |||||||||
| Selling and distribution expenses | 5 | (1,522,088 | ) | (2,181,022 | ) | ||||||
| General and administrative expenses | 5 | (418,573 | ) | (503,656 | ) | ||||||
| Other net income | 6 | 41,696 | 98,239 | ||||||||
| Credit loss on trade and other receivables | (3,606 | ) | (13,450 | ) | |||||||
| Impairment loss on non-current assets | (5,104 | ) | (16,450 | ) | |||||||
| Operating profit | 1,494,809 | 1,545,949 | |||||||||
| Finance income | 74,606 | 65,836 | |||||||||
| Finance costs | (40,595 | ) | (194,236 | ) | |||||||
| Net finance income/(costs) | 7 | 34,011 | (128,400 | ) | |||||||
| Share of profit/(loss) of equity-accounted investees, net of tax | 301 | (138,946 | ) | ||||||||
| Other expenses | – | (84,412 | ) | ||||||||
| Profit before taxation | 1,529,121 | 1,194,191 | |||||||||
| Income tax expense | 8 | (351,742 | ) | (288,201 | ) | ||||||
| Profit for the period | 1,177,379 | 905,990 | |||||||||
| Attributable to: | |||||||||||
| Equity shareholders of the Company | 1,170,102 | 906,030 | |||||||||
| Non-controlling interests | 7,277 | (40 | ) | ||||||||
| Profit for the period | 1,177,379 | 905,990 | |||||||||
| Earnings per Share | |||||||||||
| Basic earnings per Share (RMB) | 9 | 0.94 | 0.74 | ||||||||
| Diluted earnings per Share (RMB) | 9 | 0.94 | 0.73 | ||||||||
Unaudited consolidated statement of profit or loss and other comprehensive income
(Expressed in thousands of Renminbi)
| For the six months ended June 30, |
||||||||
| 2024 | 2025 | |||||||
| RMB’000 | RMB’000 | |||||||
| Profit for the period | 1,177,379 | 905,990 | ||||||
| Items that may be reclassified subsequently to profit or loss: | ||||||||
| Exchange differences on translation of financial statements of foreign operations | 6,845 | 11,675 | ||||||
| Other comprehensive income for the period | 6,845 | 11,675 | ||||||
| Total comprehensive income for the period | 1,184,224 | 917,665 | ||||||
| Attributable to: | ||||||||
| Equity shareholders of the Company | 1,178,043 | 917,401 | ||||||
| Non-controlling interests | 6,181 | 264 | ||||||
| Total comprehensive income for the period | 1,184,224 | 917,665 | ||||||
Unaudited consolidated statement of financial position
(Expressed in thousands of Renminbi)
| Notes | As of December 31, 2024 |
As of June 30, 2025 |
|||||||||
| RMB’000 | RMB’000 | ||||||||||
| ASSETS | |||||||||||
| Non-current assets | |||||||||||
| Property, plant and equipment | 1,436,939 | 1,702,062 | |||||||||
| Right-of-use assets | 4,172,083 | 4,635,139 | |||||||||
| Intangible assets | 8,802 | 7,545 | |||||||||
| Goodwill | 21,418 | 46,030 | |||||||||
| Deferred tax assets | 181,948 | 217,963 | |||||||||
| Other Investments | 10 | 123,399 | 122,570 | ||||||||
| Trade and other Receivables | 12 | 341,288 | 212,750 | ||||||||
| Term deposits | 140,183 | – | |||||||||
| Financial derivative assets | – | 799,751 | |||||||||
| Interests in equity-accounted investees | 38,567 | 6,171,304 | |||||||||
| 6,464,627 | 13,915,114 | ||||||||||
| Current assets | |||||||||||
| Other investments | 10 | 100,000 | – | ||||||||
| Inventories | 11 | 2,750,389 | 2,836,348 | ||||||||
| Trade and other receivables | 12 | 2,207,013 | 2,430,263 | ||||||||
| Cash and cash equivalents | 13 | 6,328,121 | 7,115,183 | ||||||||
| Restricted cash | 1,026 | 5,527 | |||||||||
| Term deposits | 268,952 | 345,353 | |||||||||
| 11,655,501 | 12,732,674 | ||||||||||
| Total assets | 18,120,128 | 26,647,788 | |||||||||
Unaudited consolidated statement of financial position (continued)
(Expressed in thousands of Renminbi)
| Notes | As of December 31, 2024 |
As of June 30, 2025 |
|||||||||
| RMB’000 | RMB’000 | ||||||||||
| EQUITY | |||||||||||
| Share capital | 15(a) | 94 | 94 | ||||||||
| Additional paid-in capital | 4,683,577 | 3,956,803 | |||||||||
| Other reserves | 1,329,126 | 1,687,003 | |||||||||
| Retained earnings | 4,302,177 | 5,208,207 | |||||||||
| Equity attributable to equity shareholders of the Company | 10,314,974 | 10,852,107 | |||||||||
| Non-controlling interests | 40,548 | 46,812 | |||||||||
| Total equity | 10,355,522 | 10,898,919 | |||||||||
| LIABILITIES | |||||||||||
| Non-current liabilities | |||||||||||
| Contract liabilities | 35,145 | 27,758 | |||||||||
| Loans and borrowings | 4,310 | 5,589,413 | |||||||||
| Other payables | 14 | 59,842 | 73,586 | ||||||||
| Lease liabilities | 1,903,137 | 2,177,289 | |||||||||
| Financial derivative liabilities | – | 1,230,927 | |||||||||
| Deferred income | 34,983 | 34,501 | |||||||||
| 2,037,417 | 9,133,474 | ||||||||||
| Current liabilities | |||||||||||
| Contract liabilities | 323,292 | 290,706 | |||||||||
| Loans and borrowings | 566,955 | 1,707,170 | |||||||||
| Trade and other payables | 14 | 3,943,988 | 3,561,523 | ||||||||
| Lease liabilities | 635,357 | 883,423 | |||||||||
| Deferred income | 5,376 | 2,024 | |||||||||
| Current taxation | 252,221 | 170,549 | |||||||||
| 5,727,189 | 6,615,395 | ||||||||||
| Total liabilities | 7,764,606 | 15,748,869 | |||||||||
| Total equity and liabilities | 18,120,128 | 26,647,788 | |||||||||
Unaudited consolidated statement of changes in equity
(Expressed in thousands of Renminbi)
| Attributable to equity shareholders of the Company | ||||||||||||||||||||||||||||||||||||||||||||||||
| Share capital |
Additional paid-in capital |
Merger reserve |
Treasury shares |
Call option on equity |
Share-based payment reserve |
Translation reserve |
PRC statutory reserve |
Retained earnings |
Total | Non- controlling interests |
Total equity |
|||||||||||||||||||||||||||||||||||||
| RMB’000 | RMB’000 | RMB’000 | RMB’000 | RMB’000 | RMB’000 | RMB’000 | RMB’000 | RMB’000 | RMB’000 | RMB’000 | RMB’000 | |||||||||||||||||||||||||||||||||||||
| Balance at January 1, 2024 | 95 | 6,331,375 | 117,912 | (157,610 | ) | – | 959,906 | 23,761 | 170,599 | 1,722,157 | 9,168,195 | 23,022 | 9,191,217 | |||||||||||||||||||||||||||||||||||
| Changes in equity for the six months ended June 30, 2024 | ||||||||||||||||||||||||||||||||||||||||||||||||
| Profit for the period | – | – | – | – | – | – | – | – | 1,170,102 | 1,170,102 | 7,277 | 1,177,379 | ||||||||||||||||||||||||||||||||||||
| Other comprehensive income for the period | – | – | – | – | – | – | 7,941 | – | – | 7,941 | (1,096 | ) | 6,845 | |||||||||||||||||||||||||||||||||||
| Total comprehensive income for the period | – | – | – | – | – | – | 7,941 | – | 1,170,102 | 1,178,043 | 6,181 | 1,184,224 | ||||||||||||||||||||||||||||||||||||
| Dividend declared and paid to equity shareholders of the Company | – | (643,176 | ) | – | – | – | – | – | – | – | (643,176 | ) | – | (643,176 | ) | |||||||||||||||||||||||||||||||||
| Dividend declared and paid to non-controlling interests | – | – | – | – | – | – | – | – | – | – | (1,612 | ) | (1,612 | ) | ||||||||||||||||||||||||||||||||||
| Exercise of share options and subscription of restricted share units | – | * | 468 | – | – | – | – | – | – | – | 468 | – | 468 | |||||||||||||||||||||||||||||||||||
| Repurchase of Shares | – | – | – | (70,847 | ) | – | – | – | – | – | (70,847 | ) | – | (70,847 | ) | |||||||||||||||||||||||||||||||||
| Cancellation of Shares | – | * | (144,407 | ) | – | 144,407 | – | – | – | – | – | – | – | – | ||||||||||||||||||||||||||||||||||
| Equity settled share-based transactions | – | – | – | – | – | 64,507 | – | – | – | 64,507 | – | 64,507 | ||||||||||||||||||||||||||||||||||||
| Acquisition of non-controlling interests | – | (415 | ) | – | – | – | – | – | – | – | (415 | ) | 415 | – | ||||||||||||||||||||||||||||||||||
| Balance at June 30, 2024 | 95 | 5,543,845 | 117,912 | (84,050 | ) | – | 1,024,413 | 31,702 | 170,599 | 2,892,259 | 9,696,775 | 28,006 | 9,724,781 | |||||||||||||||||||||||||||||||||||
* The amount was less than RMB1,000
Unaudited consolidated statement of changes in equity (continued)
(Expressed in thousands of Renminbi)
| Attributable to equity shareholders of the Company | ||||||||||||||||||||||||||||||||||||||||||||||||
| Share
capital |
Additional paid-in capital |
Merger reserve |
Treasury shares |
Call
option on equity |
Share-based payment reserve |
Translation reserve |
PRC
statutory reserve |
Retained earnings |
Total | Non-
controlling interests |
Total equity |
|||||||||||||||||||||||||||||||||||||
| RMB’000 | RMB’000 | RMB’000 | RMB’000 | RMB’000 | RMB’000 | RMB’000 | RMB’000 | RMB’000 | RMB’000 | RMB’000 | RMB’000 | |||||||||||||||||||||||||||||||||||||
| Balance at January 1, 2025 | 94 | 4,683,577 | 117,912 | (84,049 | ) | – | 1,045,090 | 42,034 | 208,139 | 4,302,177 | 10,314,974 | 40,548 | 10,355,522 | |||||||||||||||||||||||||||||||||||
| Changes in equity for the six months ended June 30, 2025 | ||||||||||||||||||||||||||||||||||||||||||||||||
| Profit for the period | – | – | – | – | – | – | – | – | 906,030 | 906,030 | (40 | ) | 905,990 | |||||||||||||||||||||||||||||||||||
| Other comprehensive income for the period | – | – | – | – | – | – | 11,371 | – | – | 11,371 | 304 | 11,675 | ||||||||||||||||||||||||||||||||||||
| Total comprehensive income for the period | – | – | – | – | – | – | 11,371 | – | 906,030 | 917,401 | 264 | 917,665 | ||||||||||||||||||||||||||||||||||||
| Dividend declared and paid to equity shareholders of the Company | – | (726,875 | ) | – | – | – | – | – | – | – | (726,875 | ) | – | (726,875 | ) | |||||||||||||||||||||||||||||||||
| Repurchase of Shares | – | – | – | (344,490 | ) | – | – | – | – | – | (344,490 | ) | – | (344,490 | ) | |||||||||||||||||||||||||||||||||
| Equity settled share-based transactions | – | – | – | – | – | 40,586 | – | – | – | 40,586 | – | 40,586 | ||||||||||||||||||||||||||||||||||||
| Issuance of Shares in respect of vesting of restricted share units | – | * | – | – | – | – | – | – | – | – | – | * | – | – | * | |||||||||||||||||||||||||||||||||
| Exercise of share options and subscription of restricted share units | – | * | 101 | – | – | – | – | – | – | – | 101 | – | 101 | |||||||||||||||||||||||||||||||||||
| Recognition of upper-strike call option | – | – | – | – | 650,711 | – | – | – | – | 650,711 | – | 650,711 | ||||||||||||||||||||||||||||||||||||
| Capital contribution from non-controlling interests | – | – | – | – | – | – | – | – | – | – | 6,000 | 6,000 | ||||||||||||||||||||||||||||||||||||
| Deregistration of a subsidiary | – | – | – | – | – | – | – | (301 | ) | – | (301 | ) | – | (301 | ) | |||||||||||||||||||||||||||||||||
| Balance at June 30, 2025 | 94 | 3,956,803 | 117,912 | (428,539 | ) | 650,711 | 1,085,676 | 53,405 | 207,838 | 5,208,207 | 10,852,107 | 46,812 | 10,898,919 | |||||||||||||||||||||||||||||||||||
* The amount was less than RMB1,000
Unaudited consolidated statement of cash flows
(Expressed in thousands of Renminbi)
| For the six months ended June 30, | ||||||||
| 2024 | 2025 | |||||||
| RMB’000 | RMB’000 | |||||||
| Cash flows from operating activities | ||||||||
| Cash generated from operations | 1,649,204 | 1,375,599 | ||||||
| Income tax paid | (355,448 | ) | (361,376 | ) | ||||
| Net cash from operating activities | 1,293,756 | 1,014,223 | ||||||
| Cash flows from investing activities | ||||||||
| Payment for purchases of property, plant, equipment and intangible assets | (302,784 | ) | (434,774 | ) | ||||
| Proceeds from disposal of property, plant and equipment and intangible assets | 3,166 | 18,301 | ||||||
| Payment for purchases of other investments | (4,176,438 | ) | (4,934,017 | ) | ||||
| Proceeds from disposal of other investments | 4,077,046 | 5,039,690 | ||||||
| Placement of term deposits | (256,855 | ) | (84,028 | ) | ||||
| Maturity of term deposits | 181,299 | 151,814 | ||||||
| Interest income | 68,249 | 62,538 | ||||||
| Investment income from other investments | 18,360 | 44,007 | ||||||
| Acquisition of a subsidiary | – | 4,323 | ||||||
| Payments for investments in equity-accounted investees | – | (6,277,893 | ) | |||||
| Net cash used in investing activities | (387,957 | ) | (6,410,039 | ) | ||||
| Cash flows from financing activities | ||||||||
| Proceeds from subscription of restricted share units and exercise of share options | 468 | 101 | ||||||
| Proceeds from loans and borrowings | – | 4,354,718 | ||||||
| Repayment of loans and borrowings | – | (43,467 | ) | |||||
| Payment of capital element and interest element of lease liabilities | (414,592 | ) | (395,762 | ) | ||||
| Payment for repurchase of Shares | (36,914 | ) | (303,091 | ) | ||||
| Dividends paid to equity shareholders of the Company | (643,176 | ) | (726,875 | ) | ||||
| Dividends paid to non-controlling interests | (1,612 | ) | – | |||||
| Payment for purchases of options | – | (1,207,782 | ) | |||||
| Proceeds from issue of options | – | 650,711 | ||||||
| Proceeds from issue of the Equity Linked Securities, net of issuance costs | – | 3,842,864 | ||||||
| Capital injection from non-controlling interests | – | 6,000 | ||||||
| Net cash (used in)/from financing activities | (1,095,826 | ) | 6,177,417 | |||||
| Net (decrease)/increase in cash and cash equivalents | (190,027 | ) | 781,601 | |||||
| Cash and cash equivalents at the beginning of the period | 6,415,441 | 6,328,121 | ||||||
| Effect of movements in exchange rates on cash held | 1,318 | 5,461 | ||||||
| Cash and cash equivalents at the end of the period | 6,226,732 | 7,115,183 | ||||||
Notes to the unaudited interim financial information
(Expressed in thousands of Renminbi, unless otherwise indicated)
1 Basis of preparation
This interim financial report for the six months ended June 30, 2025 has been prepared in accordance with the applicable disclosure provisions of the Rules Governing the Listing of Securities on the HKEX, including compliance with International Accounting Standard (“IAS”) 34, Interim financial reporting, issued by the International Accounting Standards Board (“IASB”). It was authorized for issue on August 21, 2025.
The interim financial report has been prepared in accordance with the same accounting policies adopted in the consolidated financial statements for the year ended December 31, 2024, except for the accounting policy changes that are expected to be reflected in the 2025 annual financial statements. Details of any changes in accounting policies are set out in Note 2.
The preparation of an interim financial report in conformity with IAS 34 requires management to make judgements, estimates and assumptions that affect the application of policies and reported amounts of assets and liabilities, income and expenses on a year to date basis. Actual results may differ from these estimates.
This interim financial report contains condensed consolidated financial statements and selected explanatory notes. The notes include an explanation of events and transactions that are significant to an understanding of the changes in financial position and performance of the Group since the consolidated financial statements for the year ended December 31, 2024. The condensed consolidated interim financial statements and notes thereon do not include all of the information required for a full set of financial statements prepared in accordance with IFRS Accounting Standards.
The interim financial report is unaudited, but has been reviewed by Ernst & Young in accordance with Hong Kong Standard on Review Engagements 2410, Review of interim financial information performed by the independent auditor of the entity, issued by the Hong Kong Institute of Certified Public Accountants.
2 Basis of preparation
The accounting policies adopted in the preparation of the interim financial report are consistent with those applied in the preparation of the Group’s annual consolidated financial statements for the year ended December 31, 2024, except for the adoption of the following amended IFRS Accounting Standard for the first time for the current period’s financial information.
| · | Amendments to IAS 21, Lack of Exchangeability |
The revised standards have had no significant financial effect on these financial statements.
| 3 | Segment reporting |
The Group manages its businesses by divisions, which are organized by a mixture of both brands and geography. In a manner consistent with the way in which information is reported internally to the Group’s most senior executive management for the purposes of resource allocation and performance assessment. On January 1, 2025, the Group changed its segment disclosure to separate MINISO brand into MINISO brand – Mainland China and MINISO brand – Overseas. As a result, the Group has presented three reportable segments of MINISO brand-Mainland China, MINISO brand-Overseas and TOP TOY brand for the six months ended June 30, 2024 and 2025. The Group retrospectively revised prior period segment information to conform to current period presentation.
| Reportable segments | Operations | |
| MINISO brand – Mainland China | Design, buying and sale of lifestyle products | |
| MINISO brand – Overseas | Design, buying and sale of lifestyle products | |
| TOP TOY brand | Design, buying and sale of pop toys |
| (i) | Segment results and other material items |
Information related to each reportable segment is set out below. Segment profit before taxation is used to measure performance because management believes that this information is the most relevant in evaluating the results of the respective segments.
| For the six months ended 30 June 2024 | ||||||||||||||||||
| MINISO brand | ||||||||||||||||||
| Mainland China |
Overseas | Sub-total | TOP TOY brand |
Unallocated amounts |
Total | |||||||||||||
| RMB’000 | RMB’000 | RMB’000 | RMB’000 | RMB’000 | RMB’000 | |||||||||||||
| External revenue | 4,592,799 | 2,731,866 | 7,324,665 | 428,920 | 5,158 | 7,758,743 | ||||||||||||
| Intersegment revenue | 1,391,138 | 1,624 | 1,392,762 | 5,648 | 278,467 | 1,676,877 | ||||||||||||
| Segment revenue | 5,983,937 | 2,733,490 | 8,717,427 | 434,568 | 283,625 | 9,435,620 | ||||||||||||
| Elimination of intersegment revenue | (1,676,877 | ) | ||||||||||||||||
| Consolidated revenue | 7,758,743 | |||||||||||||||||
| Operating profit | 939,584 | 526,810 | 1,466,394 | 34,119 | (5,704 | ) | 1,494,809 | |||||||||||
| Finance income | 38,352 | 33,590 | 71,942 | 702 | 1,962 | 74,606 | ||||||||||||
| Finance costs | (10,776 | ) | (27,567 | ) | (38,343 | ) | (2,252 | ) | – | (40,595 | ) | |||||||
| Share of profit/(loss) of equity-accounted investees, net of tax | – | 301 | 301 | – | – | 301 | ||||||||||||
| Profit before taxation | 967,160 | 533,134 | 1,500,294 | 32,569 | (3,742 | ) | 1,529,121 | |||||||||||
| Income tax expenses | (351,742 | ) | ||||||||||||||||
| Profit for the period | 1,177,379 | |||||||||||||||||
| Other material items | ||||||||||||||||||
| Depreciation and amortization | (94,323 | ) | (198,479 | ) | (292,802 | ) | (33,053 | ) | (7,276 | ) | (333,131 | ) | ||||||
| Credit loss on trade and other receivables | (3,247 | ) | 92 | (3,155 | ) | (432 | ) | (19 | ) | (3,606 | ) | |||||||
| Impairment loss on non-current assets | – | (3,752 | ) | (3,752 | ) | (1,352 | ) | – | (5,104 | ) | ||||||||
| Additions to non-current assets during the period* | 136,777 | 1,176,388 | 1,313,165 | 58,473 | 111,119 | 1,482,757 | ||||||||||||
| For the six months ended 30 June 2025 | ||||||||||||||||||
| MINISO brand | ||||||||||||||||||
| Mainland China |
Overseas | Sub-total | TOP TOY brand |
Unallocated amounts |
Total | |||||||||||||
| RMB’000 | RMB’000 | RMB’000 | RMB’000 | RMB’000 | RMB’000 | |||||||||||||
| External revenue | 5,114,987 | 3,534,017 | 8,649,004 | 742,058 | 2,050 | 9,393,112 | ||||||||||||
| Intersegment revenue | 1,442,983 | 2,683 | 1,445,666 | 22,986 | 226,329 | 1,694,981 | ||||||||||||
| Segment revenue | 6,557,970 | 3,536,700 | 10,094,670 | 765,044 | 228,379 | 11,088,093 | ||||||||||||
| Elimination of intersegment revenue | (1,694,981 | ) | ||||||||||||||||
| Consolidated revenue | 9,393,112 | |||||||||||||||||
| Operating profit | 927,721 | 583,991 | 1,511,712 | 51,027 | (16,790 | ) | 1,545,949 | |||||||||||
| Finance income | 49,352 | 14,472 | 63,824 | 532 | 1,480 | 65,836 | ||||||||||||
| Finance costs | (15,391 | ) | (46,383 | ) | (61,774 | ) | (4,092 | ) | (128,370 | ) | (194,236 | ) | ||||||
| Other expenses | – | – | – | – | (84,412 | ) | (84,412 | ) | ||||||||||
| Share of profit/(loss) of equity-accounted investees, net of tax | – | (19,611 | ) | (19,611 | ) | – | (119,335 | ) | (138,946 | ) | ||||||||
| Profit before taxation | 961,682 | 532,469 | 1,494,151 | 47,467 | (347,427 | ) | 1,194,191 | |||||||||||
| Income tax expenses | (288,201 | ) | ||||||||||||||||
| Profit for the period | 905,990 | |||||||||||||||||
| Other material items | ||||||||||||||||||
| Depreciation and amortization | (128,713 | ) | (344,443 | ) | (473,156 | ) | (64,988 | ) | (15,872 | ) | (554,016 | ) | ||||||
| Credit loss on trade and other receivables | (10,231 | ) | (2,618 | ) | (12,849 | ) | (601 | ) | – | (13,450 | ) | |||||||
| Impairment loss on non-current assets | (204 | ) | (16,246 | ) | (16,450 | ) | – | – | (16,450 | ) | ||||||||
| Additions to non-current assets during the period* | 317,345 | 762,393 | 1,079,738 | 220,875 | 155,079 | 1,455,692 | ||||||||||||
| Note: | |
| * | The additions to non-current assets include additions to property, plant and equipment, right-of-use assets and intangible assets. |
| (ii) | Segment assets and liabilities |
| As of December 31, 2024 | ||||||||||||||||||
| MINISO brand | ||||||||||||||||||
| Mainland China |
Overseas | Sub-total | TOP TOY brand |
Unallocated amounts |
Total | |||||||||||||
| RMB’000 | RMB’000 | RMB’000 | RMB’000 | RMB’000 | RMB’000 | |||||||||||||
| Segment assets | 6,540,003 | 5,575,856 | 12,115,859 | 939,552 | – | 13,055,411 | ||||||||||||
| Assets relating to construction of headquarters building | – | – | – | – | 2,275,477 | 2,275,477 | ||||||||||||
| Assets relating to an investment holding company | – | – | – | – | 2,508,145 | 2,508,145 | ||||||||||||
| Apartments for use as staff quarters | – | – | – | – | 229,252 | 229,252 | ||||||||||||
| Other unallocated assets | – | – | – | – | 51,843 | 51,843 | ||||||||||||
| Consolidated total assets | 18,120,128 | |||||||||||||||||
| Segment liabilities | 3,738,723 | 3,186,945 | 6,925,668 | 681,475 | – | 7,607,143 | ||||||||||||
| Liabilities relating to construction of headquarters building | – | – | – | – | 118,507 | 118,507 | ||||||||||||
| Other unallocated liabilities | – | – | – | – | 38,956 | 38,956 | ||||||||||||
| Consolidated total liabilities | 7,764,606 | |||||||||||||||||
| As of June 30, 2025 | ||||||||||||||||||
| MINISO brand | ||||||||||||||||||
| Mainland China |
Overseas | Sub-total | TOP TOY brand |
Unallocated amounts |
Total | |||||||||||||
| RMB’000 | RMB’000 | RMB’000 | RMB’000 | RMB’000 | RMB’000 | |||||||||||||
| Segment assets | 9,152,135 | 6,784,685 | 15,936,820 | 891,207 | – | 16,828,027 | ||||||||||||
| Assets relating to construction of headquarters building | – | – | – | – | 2,415,236 | 2,415,236 | ||||||||||||
| Assets relating to an investment holding company | – | – | – | – | 6,155,052 | 6,155,052 | ||||||||||||
| Apartments for use as staff quarters | – | – | – | – | 208,010 | 208,010 | ||||||||||||
| Financial derivative assets | – | – | – | – | 799,751 | 799,751 | ||||||||||||
| Other unallocated assets | – | – | – | – | 241,712 | 241,712 | ||||||||||||
| Consolidated total assets | 26,647,788 | |||||||||||||||||
| Segment liabilities | 4,313,716 | 3,634,299 | 7,948,015 | 601,266 | – | 8,549,281 | ||||||||||||
| Liabilities relating to construction of headquarters building | – | – | – | – | 109,139 | 109,139 | ||||||||||||
| Liabilities relating to an investment holding company | – | – | – | – | 3,457,000 | 3,457,000 | ||||||||||||
| Liabilities relating to the Equity Linked Securities | – | – | – | – | 2,366,934 | 2,366,934 | ||||||||||||
| Financial derivative liabilities | – | – | – | – | 1,230,927 | 1,230,927 | ||||||||||||
| Other unallocated liabilities | – | – | – | – | 35,588 | 35,588 | ||||||||||||
| Consolidated total liabilities | 15,748,869 | |||||||||||||||||
| (iii) | Geographic information |
The geographic information analyses the Group’s revenue and non-current assets by the Group’s country of domicile and other regions. In presenting the geographic information, segment revenue has been based on the geographic locations of customers and segment assets are based on the geographic locations of the assets.
| For the six months ended June 30, | ||||||||
| 2024 | 2025 | |||||||
| RMB’000 | RMB’000 | |||||||
| i. Revenue | ||||||||
| Mainland China | 5,026,729 | 5,827,157 | ||||||
| Asia excluding China | 1,116,364 | 1,227,907 | ||||||
| North America | 763,281 | 1,295,324 | ||||||
| Latin America | 600,038 | 589,936 | ||||||
| Europe | 140,334 | 273,564 | ||||||
| Others | 111,997 | 179,224 | ||||||
| 7,758,743 | 9,393,112 | |||||||
| As of December 31, 2024 |
As of June 30, 2025 |
|||||||
| RMB’000 | RMB’000 | |||||||
| ii. Non-current assets | ||||||||
| Mainland China | 3,626,187 | 3,829,216 | ||||||
| Asia excluding China | 413,285 | 506,108 | ||||||
| North America | 1,725,032 | 1,939,106 | ||||||
| Europe | 72,168 | 131,891 | ||||||
| Others | 143,858 | 197,205 | ||||||
| 5,980,530 | 6,603,526 | |||||||
Non-current assets exclude deferred tax assets, financial derivative assets, non-current other investments, non-current term deposits and interests in equity-accounted investees.
| 4 | Revenue |
The Group’s revenue is primarily derived from the sale of lifestyle and pop toy products through self-operated stores, franchised stores, offline distributors in the PRC and overseas and online sales conducted through the Group’s self-operated online stores on third-party e-commerce platforms and through online distributors. Other sources of revenue mainly include license fees, sales-based royalties and sales-based management and consultation service fees from franchisees and distributors.
| (i) | Disaggregation of revenue |
In the following table, revenue from contracts with customers is disaggregated by major products and service lines and timing of revenue recognition.
| For the six months ended June 30, | ||||||
| 2024 | 2025 | |||||
| RMB’000 | RMB’000 | |||||
| Major products/service lines | ||||||
| – Sales of lifestyle and pop toy products | ||||||
| – Retail sales in self-operated stores | 1,205,709 | 2,190,668 | ||||
| – Product sales to franchisees | 3,995,768 | 4,298,817 | ||||
| – Sales to offline distributors | 1,395,170 | 1,512,084 | ||||
| – Online sales | 402,688 | 573,208 | ||||
| – Other sales channels | 29,745 | 61,813 | ||||
| Sub-total | 7,029,080 | 8,636,590 | ||||
| – License fees, sales-based royalties, and sales-based management and consultation service fees |
||||||
| – License fees | 34,215 | 63,869 | ||||
| – Sales-based royalties | 75,098 | 80,536 | ||||
| – Sales-based management and consultation service fees | 328,704 | 363,280 | ||||
| Sub-total | 438,017 | 507,685 | ||||
| – Others* | 291,646 | 248,837 | ||||
| 7,758,743 | 9,393,112 | |||||
| Timing of revenue recognition | ||||||
| – Point in time | 7,314,994 | 8,873,311 | ||||
| – Over time | 443,749 | 519,801 | ||||
| Revenue from contracts with customers | 7,758,743 | 9,393,112 | ||||
Note:
| * | Others mainly represented sales of fixtures to franchisees and distributors and membership fee income. |
For the six months ended June 30, 2025, the Group did not have any customers with revenue exceeding 10% of the Group’s total revenue (six months ended June 30, 2024: none).
| (ii) | Seasonality of operations |
The Group’s business is subject to seasonal fluctuation, typically with relatively stronger performance in the quarters ended September 30 and December 31, which is mainly due to the higher retail demand in holiday seasons in certain regions. As a result, the Group typically reports lower revenues for the six months ended June 30 than the six months ended December 31.
5 Expenses by nature
| For the six months ended June 30, | ||||||||
| 2024 | 2025 | |||||||
| RMB’000 | RMB’000 | |||||||
| Cost of inventories (Note 11) | 4,256,426 | 5,081,747 | ||||||
| Payroll and employee benefits | 685,492 | 929,882 | ||||||
| Rental and related expenses | 113,395 | 185,788 | ||||||
| Depreciation and amortization | 333,131 | 554,016 | ||||||
| Licensing expenses | 183,158 | 240,795 | ||||||
| Promotion and advertising expenses | 247,158 | 262,544 | ||||||
| Logistics expenses | 225,974 | 292,963 | ||||||
| Travelling expenses | 55,950 | 61,964 | ||||||
| Other expenses | 208,934 | 311,173 | ||||||
| Total cost of sales, selling and distribution and general and administrative expenses | 6,309,618 | 7,920,872 | ||||||
6 Other net income
| For the six months ended June 30, | ||||||||
| 2024 | 2025 | |||||||
| RMB’000 | RMB’000 | |||||||
| Net foreign exchange (losses)/gains | (12,392 | ) | 36,570 | |||||
| (Losses)/gains on disposal of property, plant and equipment and intangible assets | (892 | ) | 2,719 | |||||
| Investment income from other investments | 18,360 | 43,809 | ||||||
| Gains on revaluation of the previously held equity-accounted investees | – | 8,600 | ||||||
| Scrap income | 5,352 | 5,189 | ||||||
| Net change in fair value of other investments | 14,154 | (829 | ) | |||||
| Reversal of litigation compensation | 300 | – | ||||||
| Gains relating to cancellation and modification of lease contracts | 9,578 | 4,607 | ||||||
| Gain on disposal of a subsidiary | 8,759 | – | ||||||
| Others | (1,523 | ) | (2,426 | ) | ||||
| 41,696 | 98,239 | |||||||
7 Net finance income/(costs)
| For the six months ended June 30, | ||||||||
| 2024 | 2025 | |||||||
| RMB’000 | RMB’000 | |||||||
| Finance income | ||||||||
| – Interest income | 74,606 | 65,836 | ||||||
| Finance costs | ||||||||
| – Interest on loans and borrowings | (120 | ) | (47,032 | ) | ||||
| – Interest on the Equity Linked Securities | – | (89,885 | ) | |||||
| – Interest on lease liabilities | (40,475 | ) | (57,319 | ) | ||||
| (40,595 | ) | (194,236 | ) | |||||
| Net finance income/(costs) | 34,011 | (128,400 | ) | |||||
8 Income taxes
| (a) | Taxation recognized in consolidated profit or loss: |
| For the six months ended June 30, | ||||||||
| 2024 | 2025 | |||||||
| RMB’000 | RMB’000 | |||||||
| Amounts recognized in consolidated profit or loss | ||||||||
| Current tax | ||||||||
| Provision for the period | 364,138 | 324,216 | ||||||
| Deferred tax | ||||||||
| Origination and reversal of temporary differences | (12,396 | ) | (36,015 | ) | ||||
| Tax expense | 351,742 | 288,201 | ||||||
| (b) | Reconciliation between actual tax expense and accounting profit at applicable tax rates: |
| For the six months ended June 30, | ||||||||
| 2024 | 2025 | |||||||
| RMB’000 | RMB’000 | |||||||
| Profit before taxation | 1,529,121 | 1,194,191 | ||||||
| Notional tax on profit before taxation, calculated at the rates applicable to profits in the jurisdictions concerned | 390,545 | 330,783 | ||||||
| Tax effect of share-based payment expenses | 15,126 | (4,562 | ) | |||||
| Tax effect of other non-deductible expenses | 9,677 | 557 | ||||||
| Effect of preferential tax treatments on assessable profits of certain subsidiaries | (50,670 | ) | (55,001 | ) | ||||
| Tax effect of additional deduction on research and development costs | – | (5,478 | ) | |||||
| Tax effect of exempted and non-taxable income | (5,957 | ) | (1,162 | ) | ||||
| Effect of unused tax losses being utilized | – | (12,678 | ) | |||||
| Effect of deductible temporary differences and unused tax losses (utilized)/not recognized | (1,171 | ) | 42,909 | |||||
| Others | (5,808 | ) | (7,167 | ) | ||||
| Actual tax expenses | 351,742 | 288,201 | ||||||
9 Earnings per Share
| (a) | Basic earnings per Share |
For the six months ended June 30, 2025, the calculation of basic earnings per Share has been based on the profit attributable to ordinary equity shareholders of the Company of RMB906,030,000 (six months ended June 30, 2024: RMB1,170,102,000) and the weighted average number of Shares outstanding of 1,230,765,469 Shares (six months ended June 30, 2024: 1,242,154,721 Shares), which were calculated as follows:
| For the six months ended June 30, | ||||||||
| 2024 | 2025 | |||||||
| Number of Shares |
Number of Shares |
|||||||
| Issued Shares at January 1, 2025 and 2024 | 1,243,332,789 | 1,233,993,805 | ||||||
| Effect of Shares released from the exercise of share options and subscription of restricted share units | 769,834 | 990,027 | ||||||
| Effect of repurchase of Shares (Note 15(b)) | (1,947,902 | ) | (4,218,363 | ) | ||||
| Weighted average number of Shares | 1,242,154,721 | 1,230,765,469 | ||||||
| (b) | Diluted earnings per Share |
Diluted earnings per Share is calculated by adjusting the weighted average number of Shares outstanding to assume conversion of all potential dilutive ordinary shares.
For the six months ended June 30, 2025, the calculation of diluted earnings per Share was based on the profit attributable to ordinary equity shareholders of the Company of RMB906,030,000 (six months ended June 30, 2024: RMB1,170,102,000) and the weighted average number of Shares of 1,236,003,168 Shares (six months ended June 30, 2024: 1,247,504,123 Shares), after adjusting by the dilutive effect of share incentive plan, calculated as follows:
| For the six months ended June 30, | |||||
| 2024 | 2025 | ||||
|
Number of Shares |
Number of Shares |
||||
| Weighted average number of Shares, basic | 1,242,154,721 | 1,230,765,469 | |||
| Dilutive effect of share incentive plan | 5,349,402 | 5,237,699 | |||
| Weighted average number of Shares, diluted | 1,247,504,123 | 1,236,003,168 | |||
| 10 | Other investment |
| As of December 31, | As of June 30, | ||||
| 2024 | 2025 | ||||
| RMB’000 | RMB’000 | ||||
| Financial assets measured at FVTPL: | |||||
| Non-current | |||||
| – Investment in an unlisted limited partnership enterprise | 123,399 | 122,570 | |||
| Current | |||||
| – Investment in structured deposit | 100,000 | – |
| 11 | Inventories |
| As of December 31, | As of June 30, | ||||
| 2024 | 2025 | ||||
| RMB’000 | RMB’000 | ||||
| Finished goods | 2,742,092 | 2,828,637 | |||
| Low-value consumables | 8,297 | 7,711 | |||
| 2,750,389 | 2,836,348 |
The analysis of the amount of inventories recognized as an expense and included in profit or loss is as follows:
| For the six months ended June 30, | |||||
| 2024 | 2025 | ||||
| RMB’000 | RMB’000 | ||||
| Carrying amount of inventories sold | 4,226,389 | 5,035,082 | |||
| Write-down of inventories | 30,037 | 46,665 | |||
| Cost of inventories recognized in consolidated statements of profit or loss | 4,256,426 | 5,081,747 | |||
| 12 | Trade and other receivables |
| As of December 31, | As of June 30, | ||||
| 2024 | 2025 | ||||
| RMB’000 | RMB’000 | ||||
| Non-current | |||||
| Trade receivables | 14,653 | 8,262 | |||
| Less: loss allowance | (18 | ) | (10 | ) | |
| Trade receivables, net of loss allowance (ii) | 14,635 | 8,252 | |||
| Amounts due from related parties | 16,708 | 16,490 | |||
| Deposits | 193,810 | 110,858 | |||
| Prepayments for lease | 72,000 | 20,000 | |||
| Value-added tax (“VAT”) recoverable | 44,135 | 57,150 | |||
| 341,288 | 212,750 | ||||
| Current (i) | |||||
| Trade receivables | 742,622 | 828,391 | |||
| Less: loss allowance | (67,699 | ) | (71,991 | ) | |
| Trade receivables, net of loss allowance | 674,923 | 756,400 | |||
| Amounts due from related parties | 45,424 | 28,848 | |||
| Miscellaneous expenses paid on behalf of franchisees | 642,073 | 702,088 | |||
| VAT recoverable | 208,221 | 233,975 | |||
| Rental deposits | 71,001 | 162,419 | |||
| Receivables due from online payment platforms and banks (iii) | 77,990 | 108,024 | |||
| Prepayments for inventories | 73,538 | 90,079 | |||
| Prepayments for licensing expenses | 65,040 | 69,213 | |||
| Prepayments for promotion and advertising expenses | 30,349 | 21,940 | |||
| Prepayments for repurchase of Shares | 70,518 | 29,118 | |||
| Others | 247,936 | 228,159 | |||
| 2,207,013 | 2,430,263 |
Notes:
| (i) | All of trade and other receivables classified as current portion are expected to be recovered or recognized as expense within one year. |
| (ii) | Trade receivables relating to certain sales of fixtures to franchisees are collected by installments within the periods ranging from 29 to 34 months and the portion which is expected to be recovered after one year is classified as non-current. All other trade debtors are due within 30 to 180 days from the date of revenue recognition for domestic and overseas customers respectively. |
| (iii) | Receivables due from banks and online payment platforms mainly represent the amounts due from banks for offline sales made through customer credit/debit cards and other online payment platforms that require overnight processing by the collection banks. The amounts also include the proceeds of online sales through e-commerce platforms collected by and retained in third-party online payment platforms. Withdrawal of the balances retained in online payment platforms could be made anytime upon the Group’s instructions. |
Aging analysis
As of the end of each reporting period, the aging analysis of trade receivables, based on the invoice date and net of loss allowance, is as follows:
| As of December 31, | As of June 30, | ||||
| 2024 | 2025 | ||||
| RMB’000 | RMB’000 | ||||
| Non-current portion | |||||
| Within 90 days | 1,093 | 329 | |||
| 91 to 180 days | 3,536 | 646 | |||
| 181 to 360 days | 4,779 | 3,558 | |||
| 361 to 540 days | 5,076 | 3,474 | |||
| Over 540 days | 151 | 245 | |||
| 14,635 | 8,252 | ||||
| Current portion | |||||
| Within 90 days | 508,247 | 530,308 | |||
| 91 to 180 days | 119,343 | 152,826 | |||
| 181 to 360 days | 34,987 | 65,250 | |||
| 361 to 540 days | 10,837 | 6,959 | |||
| Over 540 days | 1,509 | 1,057 | |||
| 674,923 | 756,400 |
| 13 | Cash and cash equivalents |
| As of December 31, | As of June 30, | ||||
| 2024 | 2025 | ||||
| RMB’000 | RMB’000 | ||||
| Cash on hand | 4,465 | 3,941 | |||
| Cash at bank | 6,323,656 | 7,111,242 | |||
| Cash and cash equivalents as presented in the consolidated statements of financial position and in the consolidated statements of cash flows | 6,328,121 | 7,115,183 |
| 14 | Trade and other payables |
| As of December 31, | As of June 30, | ||||
| 2024 | 2025 | ||||
| RMB’000 | RMB’000 | ||||
| Non-current | |||||
| Payable relating to construction projects | 59,842 | 73,586 | |||
| Current | |||||
| Trade payables (i) | 1,278,535 | 967,491 | |||
| Payroll payable | 148,352 | 132,089 | |||
| Accrued expenses | 375,588 | 288,906 | |||
| Other taxes payable | 58,899 | 95,379 | |||
| Deposits | 1,839,844 | 1,831,627 | |||
| Payable relating to leasehold improvements | 93,514 | 70,474 | |||
| Payable relating to construction projects | 25,579 | 733 | |||
| Amounts due to related parties | 8,123 | 8,709 | |||
| Others | 115,554 | 166,115 | |||
| 3,943,988 | 3,561,523 |
The credit period granted by suppliers is 30 to 90 days.
Deposits received from suppliers, distributors and franchisees may be repayable to suppliers, distributors and franchisees after more than one year. All of the other trade payables, other payables, accruals and amounts due to related parties or franchisees are expected to be settled within one year or are repayable on demand.
Note:
| (i) | Aging analysis |
As of the end of reporting period, the aging analysis of trade payables, based on the invoice date, is as follows:
| As of December 31, | As of June 30, | ||||
| 2024 | 2025 | ||||
| RMB’000 | RMB’000 | ||||
| Within 1 month | 1,203,435 | 827,309 | |||
| 1 to 3 months | 54,490 | 65,417 | |||
| 3 months to 1 year | 14,210 | 60,925 | |||
| Over 1 year | 6,400 | 13,840 | |||
| 1,278,535 | 967,491 |
| 15 | Capital and reserves |
| (a) | Share capital and additional paid-in capital |
As of June 30, 2025, analysis of the Company’s issued Shares including treasury shares reserved for the share incentive plan, was as follows:
| Number of Shares | ||||||||||
| Outstanding Shares | Treasury shares | Total issued Shares | Share capital | |||||||
| RMB’000 | ||||||||||
| As of January 1, 2025 | 1,233,993,805 | 15,878,028 | 1,249,871,833 | 94 | ||||||
| Issuance of Shares in respect of vesting of restricted share units (i) | 1,465,524 | – | 1,465,524 | – | * | |||||
| Exercise of share options and subscription of restricted share units (ii) | 442,056 | (442,056 | ) | – | – | * | ||||
| Repurchase of Shares (Note 15(b)) | (11,467,444 | ) | 11,467,444 | – | – | |||||
| As of June 30, 2025 | 1,224,433,941 | 26,903,416 | 1,251,337,357 | 94 | ||||||
* The amount was less than RMB1,000.
Notes:
| (i) | During the six months ended June 30, 2025, the Company issued 1,465,524 Shares in respect of vesting of restricted shares units. |
| (ii) | During the six months ended June 30, 2025, 442,056 of restricted shares units and share options were vested and exercised, and were released from treasury shares into Shares. |
| (b) | Repurchase and cancellation of shares |
On August 30, 2024, the board of directors authorized a new share repurchase program under which the Company may repurchase up to HKD2 billion of its shares within a period of 12 months starting from August 30, 2024 (the “2024 Share Repurchase Program”). The validity of the 2024 Share Repurchase Program was subsequently extended to June 30, 2026, as announced on March 21, 2025.
During the six months ended June 30, 2025, the Company repurchased ordinary shares under the 2024 Share Repurchase Program as follows, and the cost of these shares held by the Group was recorded in treasury shares:
| Shares repurchased on the NYSE | Shares repurchased on the HKEX | ||||||||||||||||||
| Number of | Highest | Lowest | Aggregate | Number of | Highest | Lowest | Aggregate | ||||||||||||
| Shares | price paid | price paid | purchase | Shares | price paid | price paid | purchase | ||||||||||||
| Month | repurchased | per Share | per Share | price paid | repurchased | per Share | per Share | price paid | |||||||||||
| USD | USD | USD’000 | HKD | HKD | HKD’000 | ||||||||||||||
| March 2025 | 52,600 | 4.63 | 4.59 | 242 | 1,266,600 | 38.00 | 34.85 | 47,037 | |||||||||||
| April 2025 | 1,621,224 | 4.88 | 3.51 | 6,613 | 5,163,200 | 38.00 | 27.05 | 154,897 | |||||||||||
| May 2025 | 585,652 | 4.71 | 4.19 | 2,625 | 554,600 | 38.00 | 33.10 | 19,421 | |||||||||||
| June 2025 | 1,040,368 | 4.73 | 4.20 | 4,666 | 1,183,200 | 36.90 | 32.75 | 41,322 | |||||||||||
| Total | 3,299,844 | 14,146 | 8,167,600 | 262,677 | |||||||||||||||
| Equivalent to RMB’000 | 101,745 | 242,745 | |||||||||||||||||
| (c) | Dividends |
During the six months ended June 30, 2025, special cash dividends of USD0.0817 per Share, amounting to USD101,292,000 (equivalent to RMB726,875,000), were declared and paid by the Company. The dividends were distributed from additional paid-in capital.
Special cash dividends of USD0.0724 per Share, amounting to USD89.3 million, were proposed and approved by the board of directors of the Company on August 21, 2025. The dividends will be distributed from additional paid-in capital and have not been recognized as liabilities as of June 30, 2025.
| 16 | Events after the reporting period |
| (i) | Dividend declaration |
On August 21, 2025, special cash dividends of USD0.0724 per Share, amounting to USD89.3 million (equivalent to RMB639.5 million), were proposed and approved by the board of directors of the Company. The dividends will be distributed from additional paid-in capital and settled by a cash distribution.
| (ii) | Update on TOP TOY |
TOP TOY recently has completed a round of strategic financing led by Temasek, a global investment company headquartered in Singapore. The post-transaction valuation of TOP TOY reached approximately HK$10 billion.
PUBLICATION OF THE INTERIM RESULTS ANNOUNCEMENT AND INTERIM REPORT
This interim results announcement is published on the websites of the HKEX at http://www.hkexnews.hk and the Company at ir.miniso.com. The interim report of the Company for the six months ended June 30, 2025 will be made available for review on the above websites in due course.
| By order of the Board | |
| MINISO Group Holding Limited | |
| Mr. YE Guofu | |
| Executive Director and Chairman |
Hong Kong, August 21, 2025
As of the date of this announcement, the Board comprises Mr. YE Guofu as executive Director, Ms. XU Lili, Mr. ZHU Yonghua and Mr. WANG Yongping as independent non-executive Directors.
|
FF305 Page 1 of 7 v 1.3.0 Next Day Disclosure Return (Equity issuer - changes in issued shares or treasury shares, share buybacks and/or on-market sales of treasury shares) Instrument: Equity issuer Status: New Submission Name of Issuer: MINISO Group Holding Limited Date Submitted: 15 August 2025 Section I must be completed by a listed issuer where there has been a change in its issued shares or treasury shares which is discloseable pursuant to rule 13.25A of the Rules Governing the Listing of Securities on The Stock Exchange of Hong Kong Limited (the “Exchange”) (the “Main Board Rules”) or rule 17.27A of the Rules Governing the Listing of Securities on GEM of the Exchange (the “GEM Rules”). Section I 1. Class of shares Ordinary shares Type of shares Not applicable Listed on the Exchange Yes Stock code (if listed) 09896 Description A. Changes in issued shares or treasury shares Events Changes in issued shares (excluding treasury shares) Number of issued shares (excluding treasury shares) As a % of existing number of issued shares (excluding treasury shares) before the relevant event (Note 3) Changes in treasury shares Number of treasury shares Issue/ selling price per share (Note 4) Total number of issued shares Opening balance as at (Note 1) 06 August 2025 1,242,636,849 0 1,242,636,849 1). Other (please specify) See Part B Date of changes 14 August 2025 % Closing balance as at (Notes 5 and 6) 14 August 2025 1,242,636,849 0 1,242,636,849 |
|
FF305 Page 2 of 7 v 1.3.0 B. Shares redeemed or repurchased for cancellation but not yet cancelled as at the closing balance date (Notes 5 and 6) 1). Shares repurchased for cancellation but not yet cancelled Date of changes 14 August 2025 1,200 0.0001 % USD 4.875 |
|
FF305 Page 3 of 7 v 1.3.0 Confirmation Pursuant to Main Board Rule 13.25C / GEM Rule 17.27C, we hereby confirm to the best knowledge, information and belief that, in relation to each issue of shares or sale or transfer of treasury shares as set out in Section I, it has been duly authorised by the board of directors of the listed issuer and carried out in compliance with all applicable listing rules, laws and other regulatory requirements and, insofar as applicable: (Note 7) (i) all money due to the listed issuer in respect of the issue of shares, or sale or transfer of treasury shares has been received by it; (ii) all pre-conditions for the listing imposed by the Main Board Rules / GEM Rules under "Qualifications of listing" have been fulfilled; (iii) all (if any) conditions contained in the formal letter granting listing of and permission to deal in the securities have been fulfilled; (iv) all the securities of each class are in all respects identical (Note 8); (v) all documents required by the Companies (Winding Up and Miscellaneous Provisions) Ordinance to be filed with the Registrar of Companies have been duly filed and that compliance has been made with all other legal requirements; (vi) all the definitive documents of title have been delivered/are ready to be delivered/are being prepared and will be delivered in accordance with the terms of issue, sale or transfer; (vii) completion has taken place of the purchase by the issuer of all property shown in the listing document to have been purchased or agreed to be purchased by it and the purchase consideration for all such property has been duly satisfied; and (viii) the trust deed/deed poll relating to the debenture, loan stock, notes or bonds has been completed and executed, and particulars thereof, if so required by law, have been filed with the Registrar of Companies. Notes to Section I: 1. Please insert the closing balance date of the last Next Day Disclosure Return published pursuant to Main Board Rule 13.25A / GEM Rule 17.27A or Monthly Return pursuant to Main Board Rule 13.25B / GEM Rule 17.27B, whichever is the later. 2. Please set out all changes in issued shares or treasury shares requiring disclosure pursuant to Main Board Rule 13.25A / GEM Rule 17.27A together with the relevant dates of changes. Each category will need to be disclosed individually with sufficient information to enable the user to identify the relevant category in the listed issuer's Monthly Return. For example, multiple issues of shares as a result of multiple exercises of share options under the same share option scheme or of multiple conversions under the same convertible note must be aggregated and disclosed as one category. However, if the issues resulted from exercises of share options under 2 share option schemes or conversions of 2 convertible notes, these must be disclosed as 2 separate categories. 3. The percentage change in the number of issued shares (excluding treasury shares) of the listed issuer is to be calculated by reference to the opening balance of the number of issued shares (excluding treasury shares) being disclosed in this Next Day Disclosure Return. |
|
FF305 Page 4 of 7 v 1.3.0 4. In the case of a share repurchase or redemption, the “issue/ selling price per share” shall be construed as “repurchase price per share” or “redemption price per share”. Where shares have been issued/ sold/ repurchased/ redeemed at more than one price per share, a volume-weighted average price per share should be given. 5. The closing balance date is the date of the last relevant event being disclosed. 6. For repurchase or redemption of shares, disclosure is required when the relevant event has occurred (subject to the provisions of Main Board Rules 10.06(4)(a), 13.25A and 13.31 / GEM Rules 13.13(1), 17.27A and 17.35), even if the repurchased or redeemed shares have not yet been cancelled. If repurchased or redeemed shares are to be cancelled upon settlement of such repurchase or redemption after the closing balance date, they shall remain part of the issued shares as at the closing balance date in Part A. Details of these repurchased or redeemed shares shall be disclosed in Part B. 7. Items (i) to (viii) are suggested forms of confirmation. The listed issuer may amend the item(s) that is/are not applicable to meet individual cases. 8. “Identical” means in this context: - the securities are of the same nominal value with the same amount called up or paid up; - they are entitled to dividend/interest at the same rate and for the same period, so that at the next ensuing distribution, the dividend/interest payable per unit will amount to exactly the same sum (gross and net); and - they carry the same rights as to unrestricted transfer, attendance and voting at meetings and rank pari passu in all other respects. |
|
FF305 Page 5 of 7 v 1.3.0 Section II must also be completed by a listed issuer where it has made a repurchase of shares which is discloseable under Main Board Rule 10.06(4)(a) / GEM Rule 13.13(1). Repurchase report Section II 1. Class of shares Ordinary shares Type of shares Not applicable Listed on the Exchange Yes Stock code (if listed) 09896 Description A. Repurchase report Trading date Number of shares repurchased Method of repurchase (Note 1) Repurchase price per share or highest repurchase price per share $ Lowest repurchase price per share $ Aggregate price paid $ 1). 14 August 2025 1,200 On another stock exchange New York Stock Exchange USD 4.875 USD 4.875 USD 5,850 Total number of shares repurchased 1,200 Aggregate price paid $ USD 5,850 Number of shares repurchased for cancellation 1,200 Number of shares repurchased for holding as treasury shares 0 B. Additional information for issuer who has a primary listing on the Exchange 1). Date of the resolution granting the repurchase mandate 12 June 2025 2). Total number of shares which the issuer is authorised to repurchase under the repurchase mandate 124,122,899 3). Number of shares repurchased on the Exchange or another stock exchange under the repurchase mandate (a) 3,664,816 4). As a % of number of issued shares (excluding treasury shares) as at the date of the resolution granting the repurchase mandate (a) x 100 / number of issued shares (excluding treasury shares) as at the date of the resolution granting the repurchase mandate 0.295257 % 5). Moratorium period for any issue of new shares, or sale or transfer of treasury shares after the share repurchase(s) set out in Part A (Note 2) Up to 13 September 2025 |
|
FF305 Page 6 of 7 v 1.3.0 We hereby confirm that the repurchases made on the Exchange set out in Part A above were made in accordance with the Main Board Rules / GEM Rules and that there have been no material changes to the particulars contained in the Explanatory Statement dated ................24 April 2025.......................... which has been filed with the Exchange. We also confirm that any repurchases made on another stock exchange set out in Part A above were made in accordance with the domestic rules applying to repurchases on that other stock exchange. Remarks: Repurchase of 300 ADSs (representing 1,200 ordinary shares) on the NYSE on August 14, 2025 U.S. time pursuant to a 10b5-1 repurchase program entered by the Company. Notes to Section II: 1. Please state whether the repurchase was made on the Exchange, on another stock exchange (stating the name of the exchange), by private arrangement or by general offer. 2. Subject to the carve-out set out in Main Board Rule 10.06(3)(a)/ GEM Rule 13.12, an issuer may not (i) make a new issue of shares, or a sale or transfer of any treasury shares; or (ii) announce a proposed new issue of shares, or a sale or transfer of any treasury shares, for a period of 30 days after any purchase by it of shares, whether on the Exchange or otherwise, without the prior approval of the Exchange. |
|
FF305 Page 7 of 7 v 1.3.0 Section III must also be completed by a listed issuer where it has made a sale of treasury shares on the Exchange or any other stock exchange on which the issuer is listed which is discloseable under Main Board Rule 10.06B / GEM Rule 13.14B. Report of on-market sale of treasury shares Not applicable Submitted by: Ye Guofu (Name) Title: Director (Director, Secretary or other Duly Authorised Officer) |
|
FF305 Page 1 of 7 v 1.3.0 Next Day Disclosure Return (Equity issuer - changes in issued shares or treasury shares, share buybacks and/or on-market sales of treasury shares) Instrument: Equity issuer Status: New Submission Name of Issuer: MINISO Group Holding Limited Date Submitted: 21 August 2025 Section I must be completed by a listed issuer where there has been a change in its issued shares or treasury shares which is discloseable pursuant to rule 13.25A of the Rules Governing the Listing of Securities on The Stock Exchange of Hong Kong Limited (the “Exchange”) (the “Main Board Rules”) or rule 17.27A of the Rules Governing the Listing of Securities on GEM of the Exchange (the “GEM Rules”). Section I 1. Class of shares Ordinary shares Type of shares Not applicable Listed on the Exchange Yes Stock code (if listed) 09896 Description A. Changes in issued shares or treasury shares Events Changes in issued shares (excluding treasury shares) Number of issued shares (excluding treasury shares) As a % of existing number of issued shares (excluding treasury shares) before the relevant event (Note 3) Changes in treasury shares Number of treasury shares Issue/ selling price per share (Note 4) Total number of issued shares Opening balance as at (Note 1) 14 August 2025 1,242,636,849 0 1,242,636,849 1). Other (please specify) See Part B Date of changes 21 August 2025 % Closing balance as at (Notes 5 and 6) 21 August 2025 1,242,636,849 0 1,242,636,849 |
|
FF305 Page 2 of 7 v 1.3.0 B. Shares redeemed or repurchased for cancellation but not yet cancelled as at the closing balance date (Notes 5 and 6) 1). Shares repurchased for cancellation but not yet cancelled Date of changes 21 August 2025 16,000 0.0013 % HKD 37.9355 |
|
FF305 Page 3 of 7 v 1.3.0 Confirmation Pursuant to Main Board Rule 13.25C / GEM Rule 17.27C, we hereby confirm to the best knowledge, information and belief that, in relation to each issue of shares or sale or transfer of treasury shares as set out in Section I, it has been duly authorised by the board of directors of the listed issuer and carried out in compliance with all applicable listing rules, laws and other regulatory requirements and, insofar as applicable: (Note 7) (i) all money due to the listed issuer in respect of the issue of shares, or sale or transfer of treasury shares has been received by it; (ii) all pre-conditions for the listing imposed by the Main Board Rules / GEM Rules under "Qualifications of listing" have been fulfilled; (iii) all (if any) conditions contained in the formal letter granting listing of and permission to deal in the securities have been fulfilled; (iv) all the securities of each class are in all respects identical (Note 8); (v) all documents required by the Companies (Winding Up and Miscellaneous Provisions) Ordinance to be filed with the Registrar of Companies have been duly filed and that compliance has been made with all other legal requirements; (vi) all the definitive documents of title have been delivered/are ready to be delivered/are being prepared and will be delivered in accordance with the terms of issue, sale or transfer; (vii) completion has taken place of the purchase by the issuer of all property shown in the listing document to have been purchased or agreed to be purchased by it and the purchase consideration for all such property has been duly satisfied; and (viii) the trust deed/deed poll relating to the debenture, loan stock, notes or bonds has been completed and executed, and particulars thereof, if so required by law, have been filed with the Registrar of Companies. Notes to Section I: 1. Please insert the closing balance date of the last Next Day Disclosure Return published pursuant to Main Board Rule 13.25A / GEM Rule 17.27A or Monthly Return pursuant to Main Board Rule 13.25B / GEM Rule 17.27B, whichever is the later. 2. Please set out all changes in issued shares or treasury shares requiring disclosure pursuant to Main Board Rule 13.25A / GEM Rule 17.27A together with the relevant dates of changes. Each category will need to be disclosed individually with sufficient information to enable the user to identify the relevant category in the listed issuer's Monthly Return. For example, multiple issues of shares as a result of multiple exercises of share options under the same share option scheme or of multiple conversions under the same convertible note must be aggregated and disclosed as one category. However, if the issues resulted from exercises of share options under 2 share option schemes or conversions of 2 convertible notes, these must be disclosed as 2 separate categories. 3. The percentage change in the number of issued shares (excluding treasury shares) of the listed issuer is to be calculated by reference to the opening balance of the number of issued shares (excluding treasury shares) being disclosed in this Next Day Disclosure Return. |
|
FF305 Page 4 of 7 v 1.3.0 4. In the case of a share repurchase or redemption, the “issue/ selling price per share” shall be construed as “repurchase price per share” or “redemption price per share”. Where shares have been issued/ sold/ repurchased/ redeemed at more than one price per share, a volume-weighted average price per share should be given. 5. The closing balance date is the date of the last relevant event being disclosed. 6. For repurchase or redemption of shares, disclosure is required when the relevant event has occurred (subject to the provisions of Main Board Rules 10.06(4)(a), 13.25A and 13.31 / GEM Rules 13.13(1), 17.27A and 17.35), even if the repurchased or redeemed shares have not yet been cancelled. If repurchased or redeemed shares are to be cancelled upon settlement of such repurchase or redemption after the closing balance date, they shall remain part of the issued shares as at the closing balance date in Part A. Details of these repurchased or redeemed shares shall be disclosed in Part B. 7. Items (i) to (viii) are suggested forms of confirmation. The listed issuer may amend the item(s) that is/are not applicable to meet individual cases. 8. “Identical” means in this context: - the securities are of the same nominal value with the same amount called up or paid up; - they are entitled to dividend/interest at the same rate and for the same period, so that at the next ensuing distribution, the dividend/interest payable per unit will amount to exactly the same sum (gross and net); and - they carry the same rights as to unrestricted transfer, attendance and voting at meetings and rank pari passu in all other respects. |
|
FF305 Page 5 of 7 v 1.3.0 Section II must also be completed by a listed issuer where it has made a repurchase of shares which is discloseable under Main Board Rule 10.06(4)(a) / GEM Rule 13.13(1). Repurchase report Section II 1. Class of shares Ordinary shares Type of shares Not applicable Listed on the Exchange Yes Stock code (if listed) 09896 Description A. Repurchase report Trading date Number of shares repurchased Method of repurchase (Note 1) Repurchase price per share or highest repurchase price per share $ Lowest repurchase price per share $ Aggregate price paid $ 1). 21 August 2025 16,000 On the Exchange HKD 38 HKD 37.8 HKD 606,968 Total number of shares repurchased 16,000 Aggregate price paid $ HKD 606,968 Number of shares repurchased for cancellation 16,000 Number of shares repurchased for holding as treasury shares 0 B. Additional information for issuer who has a primary listing on the Exchange 1). Date of the resolution granting the repurchase mandate 12 June 2025 2). Total number of shares which the issuer is authorised to repurchase under the repurchase mandate 124,122,899 3). Number of shares repurchased on the Exchange or another stock exchange under the repurchase mandate (a) 3,680,816 4). As a % of number of issued shares (excluding treasury shares) as at the date of the resolution granting the repurchase mandate (a) x 100 / number of issued shares (excluding treasury shares) as at the date of the resolution granting the repurchase mandate 0.296546 % 5). Moratorium period for any issue of new shares, or sale or transfer of treasury shares after the share repurchase(s) set out in Part A (Note 2) Up to 20 September 2025 We hereby confirm that the repurchases made on the Exchange set out in Part A above were made in accordance with the Main Board Rules / GEM Rules and that there have been no material changes to the particulars contained in the Explanatory Statement dated ................24 April 2025.......................... which has been filed with the Exchange. We also confirm that any repurchases |
|
FF305 Page 6 of 7 v 1.3.0 made on another stock exchange set out in Part A above were made in accordance with the domestic rules applying to repurchases on that other stock exchange. Remarks: Repurchase of 16,000 ordinary shares on August 21, 2025 pursuant to a Hong Kong automatic share repurchase plan entered by the Company. Notes to Section II: 1. Please state whether the repurchase was made on the Exchange, on another stock exchange (stating the name of the exchange), by private arrangement or by general offer. 2. Subject to the carve-out set out in Main Board Rule 10.06(3)(a)/ GEM Rule 13.12, an issuer may not (i) make a new issue of shares, or a sale or transfer of any treasury shares; or (ii) announce a proposed new issue of shares, or a sale or transfer of any treasury shares, for a period of 30 days after any purchase by it of shares, whether on the Exchange or otherwise, without the prior approval of the Exchange. |
|
FF305 Page 7 of 7 v 1.3.0 Section III must also be completed by a listed issuer where it has made a sale of treasury shares on the Exchange or any other stock exchange on which the issuer is listed which is discloseable under Main Board Rule 10.06B / GEM Rule 13.14B. Report of on-market sale of treasury shares Not applicable Submitted by: Ye Guofu (Name) Title: Director (Director, Secretary or other Duly Authorised Officer) |