UNITED STATES
SECURITIES AND EXCHANGE COMMISSION
WASHINGTON, D.C. 20549
FORM 8-K
CURRENT REPORT
Pursuant to Section 13 OR 15(d) of the Securities Exchange Act of 1934
Date of Report (Date of earliest event reported): August 6, 2025
American Public Education, Inc.
(Exact name of registrant as specified in its charter)
| Delaware | 001-33810 | 01-0724376 | ||
| (State or other jurisdiction of incorporation) |
(Commission File Number) |
(IRS Employer Identification No.) |
|
111 W. Congress Street Charles Town, West Virginia |
25414 | |
| (Address of principal executive offices) | (Zip Code) |
Registrant’s telephone number, including area code: 304-724-3700
Check the appropriate box below if the Form 8-K filing is intended to simultaneously satisfy the filing obligation of the registrant under any of the following provisions:
| ¨ | Written communications pursuant to Rule 425 under the Securities Act (17 CFR 230.425) |
| ¨ | Soliciting material pursuant to Rule 14a-12 under the Exchange Act (17 CFR 240.14a-12) |
| ¨ | Pre-commencement communications pursuant to Rule 14d-2(b) under the Exchange Act (17 CFR 240.14d-2(b)) |
| ¨ | Pre-commencement communications pursuant to Rule 13e-4(c) under the Exchange Act (17 CFR 240.13e-4(c)) |
Securities registered pursuant to Section 12(b) of the Act:
| Title of each class | Trading Symbol(s) | Name of each exchange on which registered |
| Common Stock, $0.01 par value per share | APEI | Nasdaq Global Select Market |
Indicate by check mark whether the registrant is an emerging growth company as defined in Rule 405 of the Securities Act of 1933 (§230.405 of this chapter) or Rule 12b-2 of the Exchange Act of 1934 (§240.12b-2 of this chapter).
Emerging growth company ¨
If an emerging growth company, indicate by check mark if the registrant has elected not to use the extended transition period for complying with any new or revised financial accounting standards provided pursuant to Section 13(a) of the Exchange Act. ¨
Section 2 – Financial Information
| Item 2.02 | Results of Operations and Financial Condition. |
On August 6, 2025, American Public Education, Inc. (the “Company”) issued a press release reporting financial results for the three and six months ended June 30, 2025. A copy of the Company’s press release is attached to this report as Exhibit 99.1 and is incorporated in this report by reference. The Company has scheduled a webcast for 5:00 p.m. ET on August 6, 2025, to discuss its financial results, and slides for that webcast are attached to this report as Exhibit 99.2 and are incorporated in this report by reference.
Section 9 – Financial Statements and Exhibits
| Item 9.01 | Financial Statements and Exhibits. |
| (d) | Exhibits |
| 99.1 | American Public Education, Inc. press release dated August 6, 2025, reporting financial results for the three and six months ended June 30, 2025. | |
| 99.2 | American Public Education, Inc. slides for August 6, 2025 conference call and Webcast for the three and six months ended June 30, 2025. | |
| 104 | Cover Page Interactive Data File (embedded within the Inline XBRL document). |
SIGNATURES
Pursuant to the requirements of the Securities Exchange Act of 1934, the registrant has duly caused this report to be signed on its behalf by the undersigned hereunto duly authorized.
| American Public Education, Inc. | |||
| Date: | August 6, 2025 | By: | /s/ Richard W. Sunderland, Jr. |
| Richard W. Sunderland, Jr., | |||
| Executive Vice President and Chief Financial Officer | |||
Exhibit 99.1

American Public Education Reports Second Quarter 2025 Financial Results
Q2 2025 Revenue, Net Income, and Adjusted EBITDA Exceeded Guidance
Simplification Continues with Sale of Graduate School USA, Redemption of All Preferred Equity, and Sale of Two Administrative Office Buildings
CHARLES TOWN, W.V. – August 6, 2025 -- American Public Education, Inc. (Nasdaq: APEI), a portfolio of education companies providing online and campus-based postsecondary education to over 105,000 students through three subsidiary institutions, has reported unaudited financial and operational results for the second quarter ended June 30, 2025.
Key Second Quarter 2025 Highlights
| · | Consolidated revenue for Q2 2025 increased 6.5% year-over-year to $162.8 million. |
| · | Net loss available to common stockholders in Q2 2025 was ($0.3) million, which reflects a $3.5 million loss on the redemption of the preferred equity, compared to a net loss available to common stockholders of ($1.2) million in Q2 2024. |
| · | Q2 2025 Adjusted EBITDA increased 38.2% to $15.1 million compared to $10.9 million in Q2 2024. |
| · | Reconfirming full year 2025 revenue estimate of between $650 million and $660 million. Resetting guidance for full year 2025 net income available to common stockholders to a range between $18 and $24 million to reflect losses associated with the sale of Graduate School USA and a loss on the preferred equity redemption. Increasing guidance for full year 2025 Adjusted EBITDA to a range between $81 million and $88 million. |
| · | Simplification continues with the redemption of all of the Series A Senior Preferred Stock, and the sale of two administrative office buildings in Charles Town, WV. |
Key Regulatory Updates
| · | In May 2025, the Department of Education released Rasmussen University (“RU”) from the temporary growth restrictions that restricted Rasmussen University from adding new programs and locations and were imposed in connection with APEI’s acquisition of Rasmussen University in 2021. |
| · | In addition, also in May 2025, ED released RU’s $24.5 million letter of credit stemming from its 2020 composite score, and the related cash was thereby no longer restricted. |
Key Subsequent Event
| · | APEI completed the sale of Graduate School USA on July 25, 2025. |
Management Commentary
"At APEI, we continue to simplify our business, execute on our growth strategy and deliver on our stated financial results,” said Angela Selden, President and Chief Executive Officer of APEI. “We exceeded the expectations we set for the second quarter with continued enrollment growth in our education units.”
“Our balance sheet was further improved through the redemption of our preferred equity, which will save approximately $6 million of go-forward annual cash expenses, and completed the sale of two corporate administrative buildings. In the second quarter, the Department of Education released the letter of credit of $24.5 million of cash that was previously held as restricted cash on our balance sheet. Finally, we are pleased to announce that we have completed the sale of GSUSA, which closed on July 25, 2025.”
Second Quarter 2025 Financial Results
| · | Total consolidated revenue for the three months ended June 30, 2025, was $162.8 million, an increase of $9.9 million, or 6.5%, compared to $152.9 million in the prior year period. The increase in revenue was primarily due to a $6.5 million increase in revenue in our RU Segment, a $4.7 million increase in our American Public University System (“APUS”) Segment, and a $1.7 million increase in our Hondros College of Nursing (“HCN”) Segment. |
| · | Total costs and expenses for the three months ended June 30, 2025, were $155.7 million, an increase of $5.1 million, or 3.4%, compared to $150.7 million in the prior year. The increase in costs and expenses was due primarily to increases in employee compensation costs, professional fees, and classroom and course materials costs, partially offset by decreases in information technology costs, depreciation and amortization expenses, and occupancy costs. |
| o | Instructional costs and services expenses for the three months ended June 30, 2025, were $78.4 million, an increase of $2.2 million, or 2.9%, compared to $76.2 million in the prior year period. |
| o | Selling and promotional expenses for the three months ended June 30, 2025, were $35.0 million, an increase of $1.2 million, or 3.6%, compared to $33.8 million in the prior year |
| o | General and administrative expenses for the three months ended June 30, 2025, were $38.1 million, an increase of $3.7 million, or 10.8%, compared to $34.4 million in the prior year and include $1.7 million in professional fees related to the planned combination of APUS, RU, and HCN into one consolidated institution that will be a system encompassing all APUS, RU, and HCN programs, campuses, and operations and the sale of Graduate School USA. General and administrative expenses as a percentage of revenue increased to 23.4% for the three months ended June 30, 2025, from 22.5% for the three months ended June 30, 2024. |
| · | Net loss available to common stockholders was ($0.3) million, or ($0.02) per diluted common share for the three months ended June 30, 2025, compared to a net loss of ($1.2) million, or ($0.06) per diluted common share in the prior year period. Included in the second quarter 2025 net loss is a $3.5 million loss on redemption of preferred stock. |
| · | Adjusted EBITDA was $15.1 million for the three months ended June 30, 2025, compared to $10.9 million in the prior year period. Adjusted EBITDA excludes adjustment for stock compensation, loss on disposals of long-lived assets, transition services, severance expense, other professional fees, and loss on leases. |
Balance Sheet and Liquidity
Total cash, cash equivalents, and restricted cash was $176.6 million at June 30, 2025, compared to $158.9 million and December 31, 2024, representing an increase of $17.6 million, or 11.1%. Total unrestricted cash and cash equivalents was $174.9 million at June 30, 2025 compared to $131.9 million at December 31, 2024.
Registrations and Enrollment
| Q2 2025 | Q2 2024 | % Change | ||||
| American Public University System1 | ||||||
| For the three months ended
June 30, Net Course Registrations |
96,400 | 89,800 | 7.3% | |||
| Rasmussen University2 | ||||||
| For the three months ended
June 30, Total Student Enrollment |
14,600 | 13,600 | 7.4% | |||
| Hondros College of Nursing3 | ||||||
| For the three months ended
June 30, Total Student Enrollment |
3,700 | 3,300 | 13.5% |
| 1. | APUS Net Course Registrations represents the approximate aggregate number of courses for which students remain enrolled after the date by which they may drop a course without financial penalty. Excludes students in doctoral programs. |
| 2. | RU Total Student Enrollment represents students in an active status as of the full-term census or billing date. |
| 3. | HCN Total Student Enrollment represents the approximate number of students enrolled in a course after the date by which students may drop a course without financial penalty. |
Second Quarter and Full Year 2025 Outlook
The following statements are based on APEI's current expectations. These statements are forward-looking and actual results may differ materially. APEI undertakes no obligation to update publicly any forward-looking statements for any reason unless required by law. Refer to APEI's earnings conference call and presentation for further details.
| Third Quarter 2025 Guidance | ||||
| (Approximate) | (% Yr/Yr Change) | |||
| APUS Net course registrations | 97,000 to 99,000 | 5% to 7% | ||
| HCN Student enrollment | 3,700 | 18% | ||
| RU Student enrollment | 14,900 | 10% | ||
| - On-ground Healthcare | 6,700 | 12% | ||
| - Online | 8,200 | 11% | ||
| ($ in millions except EPS) | ||||
| APEI Consolidated revenue | $159.0 – $161.0 | 4% to 5% | ||
| APEI Net loss/income available to common stockholders | ($2.9) – ($0.8) | n.a. | ||
| APEI Adjusted EBITDA | $15.0 – $17.0 | 16% to 32% | ||
| APEI Diluted EPS | ($0.15) – ($0.04) | n.a. | ||
| Full Year 2025 Guidance | ||||
| (Approximate) | (% Yr/Yr Change) | |||
| ($ in millions) | ||||
| APEI Consolidated Revenue | $650 – $660 | 4% to 6% | ||
| APEI Net income available to common stockholders | $18 – $24 | 84% to 142% | ||
| APEI Adjusted EBITDA | $81 – $88 | 12% to 22% | ||
| APEI Capital Expenditure (CapEx) | $18 – $22 | (14%) to 4% | ||
Non-GAAP Financial Measures
This press release contains the non-GAAP financial measures of EBITDA (earnings before interest, taxes, depreciation, and amortization) and adjusted EBITDA (EBITDA less non-cash expenses such as stock compensation and non-recurring expenses). APEI believes that the use of these measures is useful because they allow investors to better evaluate APEI's operating profit and cash generation capabilities.
For the three months ended June 30, 2025, and 2024, adjusted EBITDA excludes stock compensation, loss on disposals of long-lived assets, loss on assets held for sale, other professional fees and loss on leases.
These non-GAAP measures should not be considered in isolation or as an alternative to measures determined in accordance with generally accepted accounting principles in the United States (GAAP). The principal limitation of our non-GAAP measures is that they exclude expenses that are required by GAAP to be recorded. In addition, non-GAAP measures are subject to inherent limitations as they reflect the exercise of judgment by management about which expenses are excluded.
APEI is presenting EBITDA and adjusted EBITDA in connection with its GAAP results and urges investors to review the reconciliation of EBITDA and adjusted EBITDA to the comparable GAAP financial measures that is included in the tables following this press release (under the captions "GAAP Net Income to Adjusted EBITDA," and "GAAP Outlook Net Income to Outlook Adjusted EBITDA") and not to rely on any single financial measure to evaluate its business.
About American Public Education
American Public Education, Inc. (Nasdaq: APEI), through its institutions American Public University System, Rasmussen University, and Hondros College of Nursing provides education that transforms lives, advances careers, and improves communities.
APUS, which operates through American Military University and American Public University, is the leading educator to active-duty military and veteran students* and serves approximately 88,000 adult learners worldwide via accessible and affordable higher education.
Rasmussen University is a 125-year-old nursing and health sciences-focused institution that serves approximately 14,900 students across its 20 campuses in six states and online. It also has schools of Business, Technology, Design, Early Childhood Education and Justice Studies.
Hondros College of Nursing focuses on educating pre-licensure nursing students at eight campuses (six in Ohio, one in Indiana, and one in Michigan). It is the largest educator of PN (LPN) nurses in the state of Ohio** and serves approximately 3,700 total students.
Both APUS and Rasmussen University are institutionally accredited by the Higher Learning Commission (HLC), an institutional accreditation agency recognized by the U.S. Department of Education. Hondros is accredited by the Accrediting Bureau of Health Education Schools (ABHES). Graduate School USA is accredited by the Accrediting Council for Continuing Education & Training (ACCET). For additional information, visit www.apei.com.
*Based on FY 2019 Department of Defense tuition assistance data, as reported by Military Times, and Veterans Administration student enrollment data as of 2024.
**Based on information compiled by the National Council of State Boards of Nursing and Ohio Board of Nursing.
Forward Looking Statements
Statements made in this press release regarding APEI or its subsidiaries that are not historical facts are forward-looking statements based on current expectations, assumptions, estimates and projections about APEI and the industry. In some cases, forward-looking statements can be identified by words such as "anticipate," "believe," "seek," "could," "estimate," "expect," "intend," "may," "plan," "should," "will," "would," and similar words or their opposites. Forward-looking statements include, without limitation, statements regarding the Company's future path, expected growth, registration, enrollments, revenues, net income, Adjusted EBITDA and EBITDA, capital expenditures, the growth and profitability of Rasmussen University and plans with respect to recent, current and future initiatives.
Forward-looking statements are subject to risks and uncertainties that could cause actual results to differ materially from those expressed or implied by such statements. Such risks and uncertainties include, among others, risks related to: APEI's failure to comply with regulatory and accrediting agency requirements, including the "90/10 Rule", and to maintain institutional accreditation and the impacts of any actions APEI may take to prevent or correct such failure; changes in the postsecondary education regulatory environment as a result of U.S. federal elections, including any changes by or as a result of actions of the current administration to the operations of the Department of Education or changes to or the elimination or implementation of laws, regulations, standards, policies, and practices; potential or actual government shutdowns; the impact, timing, and projected benefits of the planned combination of APUS, RU, and HCN into one consolidated institution; APEI's dependence on the effectiveness of its ability to attract students who persist in its institutions' programs; changing market demands; declines in enrollments at APEI's subsidiaries; APEI's inability to effectively market its institutions' programs; APEI's inability to maintain strong relationships with the military and maintain course registrations and enrollments from military students; the loss or disruption of APEI's ability to receive funds under Title IV or tuition assistance programs or the reduction, elimination, or suspension of federal funds; adverse effects of changes APEI makes to improve the student experience and enhance the ability to identify and enroll students who are likely to succeed; APEI's need to successfully adjust to future market demands by updating existing programs and developing new programs; APEI's loss of eligibility to participate in Title IV programs or ability to process Title IV financial aid; economic and market conditions and changes in interest rates; difficulties involving acquisitions; APEI's indebtedness and preferred stock, including the refinancing or redemption thereof; APEI's dependence on and the need to continue to invest in its technology infrastructure, including with respect to third-party vendors; the inability to recognize the anticipated benefits of APEI's cost savings and revenue generating efforts; APEI's ability to manage and limit its exposure to bad debt; and the various risks described in the "Risk Factors" section and elsewhere in APEI's Annual Report on Form 10-K for the year ended December 31, 2024, and in other filings with the SEC. You should not place undue reliance on any forward-looking statements. APEI undertakes no obligation to update publicly any forward-looking statements for any reason, unless required by law, even if new information becomes available or other events occur in the future.
Company Contact
Frank Tutalo
Director, Public Relations
American Public Education, Inc.
ftutalo@apei.com
571-358-3042
Investor Relations Brian M. Prenoveau, CFA (In thousands, except per share data)
MZ North America
Direct: 561-489-5315
APEI@mzgroup.us
American Public Education, Inc.
Consolidated Statement of Income
| Three Months Ended | ||||||||
| June 30, | ||||||||
| 2025 | 2024 | |||||||
| (unaudited) | ||||||||
| Revenue | $ | 162,766 | $ | 152,895 | ||||
| Costs and expenses: | ||||||||
| Instructional costs and services | 78,423 | 76,216 | ||||||
| Selling and promotional | 35,048 | 33,838 | ||||||
| General and administrative | 38,147 | 34,426 | ||||||
| Depreciation and amortization | 4,088 | 5,232 | ||||||
| Loss on leases | - | 779 | ||||||
| Loss on disposals of long-lived assets | 35 | 184 | ||||||
| Total costs and expenses | 155,741 | 150,675 | ||||||
| Income from operations before interest and income taxes | 7,025 | 2,220 | ||||||
| Interest expense, net | (1,108 | ) | (785 | ) | ||||
| Income before income taxes | 5,917 | 1,435 | ||||||
| Income tax expense | 1,421 | (16 | ) | |||||
| Equity investment loss | - | (1,080 | ) | |||||
| Net income | $ | 4,496 | $ | 371 | ||||
| Preferred stock dividends | 1,319 | 1,531 | ||||||
| Loss on redemption of preferred stock | 3,501 | - | ||||||
| Net loss available to common stockholders | $ | (324 | ) | $ | (1,160 | ) | ||
| Loss per common share: | ||||||||
| Basic | $ | (0.02 | ) | $ | (0.07 | ) | ||
| Diluted | $ | (0.02 | ) | $ | (0.06 | ) | ||
| Weighted average number of common shares: | ||||||||
| Basic | 18,034 | 17,627 | ||||||
| Diluted | 18,597 | 18,134 | ||||||
| Three Months Ended | ||||||||
| Segment Information: | June 30, | |||||||
| 2025 | 2024 | |||||||
| Revenue: | ||||||||
| APUS Segment | $ | 81,731 | $ | 77,048 | ||||
| RU Segment | $ | 59,521 | $ | 53,034 | ||||
| HCN Segment | $ | 18,134 | $ | 16,409 | ||||
| Corporate and other1 | $ | 3,380 | $ | 6,404 | ||||
| Income (loss) from operations before interest and income taxes: | ||||||||
| APUS Segment | $ | 21,442 | $ | 18,291 | ||||
| RU Segment | $ | (1,976 | ) | $ | (8,826 | ) | ||
| HCN Segment | $ | (402 | ) | $ | (744 | ) | ||
| Corporate and other | $ | (12,039 | ) | $ | (6,501 | ) | ||
American Public Education, Inc.
Consolidated Balance Sheet
(In thousands)
| As of June 30, 2025 |
As of December 31, 2024 |
|||||||
| (Unaudited) | ||||||||
| ASSETS | ||||||||
| Current assets: | ||||||||
| Cash, cash equivalents, and restricted cash | $ | 176,579 | $ | 158,941 | ||||
| Accounts receivable, net of allowance of $19,788 in 2025 and $19,280 in 2024 | 37,575 | 62,465 | ||||||
| Prepaid expenses | 18,308 | 13,748 | ||||||
| Income tax receivable | 2,496 | 949 | ||||||
| Assets held for sale | - | 24,469 | ||||||
| Total current assets | 234,958 | 260,572 | ||||||
| Property and equipment, net | 72,613 | 73,383 | ||||||
| Operating lease assets, net | 89,477 | 94,776 | ||||||
| Deferred income taxes | 45,957 | 47,311 | ||||||
| Intangible assets, net | 28,221 | 28,221 | ||||||
| Goodwill | 59,593 | 59,593 | ||||||
| Other assets, net | 6,550 | 6,247 | ||||||
| Total assets | $ | 537,369 | $ | 570,103 | ||||
| LIABILITIES AND STOCKHOLDERS’ EQUITY | ||||||||
| Current liabilities: | ||||||||
| Accounts payable | $ | 10,067 | $ | 7,847 | ||||
| Accrued compensation and benefits | 20,317 | 20,546 | ||||||
| Accrued liabilities | 14,109 | 13,735 | ||||||
| Deferred revenue and student deposits | 24,967 | 23,474 | ||||||
| Lease liabilities, current | 13,447 | 13,553 | ||||||
| Total current liabilities | 82,907 | 79,155 | ||||||
| Lease liabilities, long-term | 88,160 | 93,645 | ||||||
| Long-term debt, net | 94,062 | 93,424 | ||||||
| Total liabilities | $ | 265,129 | $ | 266,224 | ||||
| Stockholders’ equity: | ||||||||
| Preferred stock, $.01 par value; 10,000,000 shares authorized; 400 shares issued and outstanding in 2024, ($117,439 liquidation preference per share, $46,976 in aggregate, for 2024) (Note 12) | - | 39,691 | ||||||
| Common stock, $.01 par value; 100,000,000 shares authorized; 18,061,599 issued and outstanding in 2025; 17,712,575 issued and outstanding in 2024 | 180 | 177 | ||||||
| Additional paid-in capital | 306,756 | 305,823 | ||||||
| Accumulated other comprehensive loss | (28 | ) | (7 | ) | ||||
| Accumulated deficit | (34,668 | ) | (41,805 | ) | ||||
| Total stockholders’ equity | 272,240 | 303,879 | ||||||
| Total liabilities and stockholders’ equity | $ | 537,369 | $ | 570,103 | ||||
GAAP Net Income to Adjusted EBITDA:
The following table sets forth the reconciliation of the Company’s reported GAAP net income to the calculation of adjusted EBITDA for the three and six months ended June 30, 2025 and 2024:
| Three Months Ended | Six Months Ended | |||||||||||||||
| June 30, | June 30, | |||||||||||||||
| (in thousands, except per share data) | 2025 | 2024 | 2025 | 2024 | ||||||||||||
| Net (loss) income available to common stockholders | $ | (324 | ) | $ | (1,160 | ) | $ | 7,137 | $ | (2,179 | ) | |||||
| Preferred dividends | 1,319 | 1,531 | 2,751 | 3,066 | ||||||||||||
| Loss on redemption of preferred stock | 3,501 | - | 3,501 | - | ||||||||||||
| Net income | $ | 4,496 | $ | 371 | $ | 13,389 | $ | 887 | ||||||||
| Income tax expense | 1,421 | (16 | ) | 3,887 | 1,197 | |||||||||||
| Interest expense, net | 1,108 | 785 | 1,995 | 911 | ||||||||||||
| Equity investment loss | - | 1,080 | - | 4,407 | ||||||||||||
| Depreciation and amortization | 4,088 | 5,232 | 8,080 | 10,360 | ||||||||||||
| EBITDA | 11,113 | 7,452 | 27,351 | 17,762 | ||||||||||||
| Loss on assets held for sale | - | - | 1,527 | - | ||||||||||||
| Loss on leases | - | 779 | - | 3,715 | ||||||||||||
| Other professional fees | 1,715 | - | 2,704 | - | ||||||||||||
| Stock compensation | 2,238 | 1,823 | 4,501 | 3,741 | ||||||||||||
| Loss on disposals of long-lived assets | 35 | 184 | 265 | 212 | ||||||||||||
| Transition services costs | - | 182 | - | 2,047 | ||||||||||||
| Severance | - | 505 | - | 505 | ||||||||||||
| Adjusted EBITDA | $ | 15,101 | $ | 10,925 | $ | 36,348 | $ | 27,982 | ||||||||
GAAP Outlook Net Income to Outlook Adjusted EBITDA:
The following table sets forth the reconciliation of the Company’s outlook GAAP net income to the calculation of outlook adjusted EBITDA for the three months ending September 30, 2025 and twelve months ending December 31, 2025:
| Three Months Ending | Twelve Months Ending | |||||||||||||||
| September 30, 2025 | December 31, 2025 | |||||||||||||||
| (in thousands, except per share data) | Low | High | Low | High | ||||||||||||
| Net income/(loss) available to common stockholders | $ | (2,859 | ) | $ | (759 | ) | $ | 18,528 | $ | 24,733 | ||||||
| Preferred dividends | - | - | 2,751 | 2,751 | ||||||||||||
| Loss on redemption of preferred stock | - | - | 3,501 | 3,501 | ||||||||||||
| Net Income/(Loss) | (2,859 | ) | (759 | ) | 24,780 | 30,985 | ||||||||||
| Income tax expense/(benefit) | (1,225 | ) | (325 | ) | 9,165 | 11,460 | ||||||||||
| Interest expense | 1,476 | 1,476 | 4,857 | 4,857 | ||||||||||||
| Loss on minority investment | - | - | - | - | ||||||||||||
| Depreciation and amortization | 4,555 | 4,555 | 17,360 | 17,360 | ||||||||||||
| EBITDA | 1,947 | 4,947 | 56,163 | 64,663 | ||||||||||||
| Stock compensation | 2,229 | 2,229 | 8,890 | 8,890 | ||||||||||||
| Professional Services | 980 | 980 | 4,280 | 4,280 | ||||||||||||
| Transition services cost | 1,345 | 1,345 | 1,375 | 1,375 | ||||||||||||
| Loss on Sale of GSUSA | 8,500 | 7,000 | 8,500 | 7,000 | ||||||||||||
| Other loses | - | - | 1,792 | 1,792 | ||||||||||||
| Adjusted EBITDA | $ | 15,000 | $ | 16,500 | $ | 81,000 | $ | 88,000 | ||||||||
Exhibit 99.2

2Q 2025 Earnings Presentation August 2025
FORWARD - LOOKING STATEMENTS Statements made in this presentation regarding American Public Education, Inc . or its subsidiary institutions (“APEI” or the “Company”) that are not historical facts are forward - looking statements based on current expectations, assumptions, estimates and projections about APEI and the industry . In some cases, forward looking statements can be identified by words such as “anticipate,” “believe,” “seek,” “could,” “estimate,” “expect,” “intend,” “may,” “plan,” “potentially,” “project,” “should,” “will,” “would,” and similar words or their opposites . Forward - looking statements include, without limitation, statements regarding expectations for growth, registration, enrollments, demand, revenues, net income, earnings per share, EBITDA and Adjusted EBITDA, capital expenditures, free cash flow, and plans with respect to and future impacts of recent, current and future initiatives, including the planned combination of APUS, RU and HCN into one consolidated institution, campus and corporate center consolidation, and redemption of preferred stock . Forward - looking statements are subject to risks and uncertainties that could cause actual results to differ materially from those expressed or implied by such statements . Such risks and uncertainties include, among others, risks related to : the Company’s failure to comply with regulatory and accrediting agency requirements, including the “ 90 / 10 Rule”, and to maintain institutional accreditation and the impacts of any actions the Company may take to prevent or correct such failure ; changes in the postsecondary education regulatory environment as a result of U . S . federal elections, including any changes by or as a result of actions of the current administration to the operations of the Department of Education or changes to or the elimination or implementation of laws, regulations, standards, policies, and practices ; potential or actual government shutdowns, as well as government budget and federal workforce uncertainty ; the impact, timing, and projected benefits of the planned combination the Company’s dependence on the effectiveness of its ability to attract students who persist in its subsidiary institutions’ programs ; declines in enrollments at the Company’s subsidiary institutions ; the Company’s inability to effectively brand or market its subsidiary institutions and its subsidiary institutions’ programs ; the Company’s inability to maintain strong relationships with the military and maintain course registrations and enrollments from military students ; the loss or disruption of the Company’s ability to receive funds under Title IV or tuition assistance programs or the reduction, elimination, or suspension of federal funds ; adverse effects of changes the Company makes to improve the student experience and enhance the ability to identify and enroll students who are likely to succeed ; the Company’s need to successfully adjust to future market demands including updating existing programs and developing new programs ; the Company’s loss of eligibility to participate in Title IV programs or ability to process Title IV financial aid ; economic and market conditions and changes in interest rates ; difficulties involving acquisitions ; the Company’s indebtedness and preferred stock, including the refinancing or redemption thereof ; the Company’s dependence on and the need to continue to invest in its technology infrastructure, including with respect to third - party vendors ; the inability to recognize the anticipated benefits of the Company’s cost savings and revenue generating efforts ; the Company’s ability to manage and limit its exposure to bad debt ; and the risk factors described in the risk factor section and elsewhere in the Company’s most recent annual report on Form 10 - K and quarterly report on Form 10 - Q and in the Company’s other SEC filings . You should not place undue reliance on any forward - looking statements . The Company undertakes no obligation to update publicly any forward - looking statements for any reason, unless required by law, even if new information becomes available or other events occur in the future .
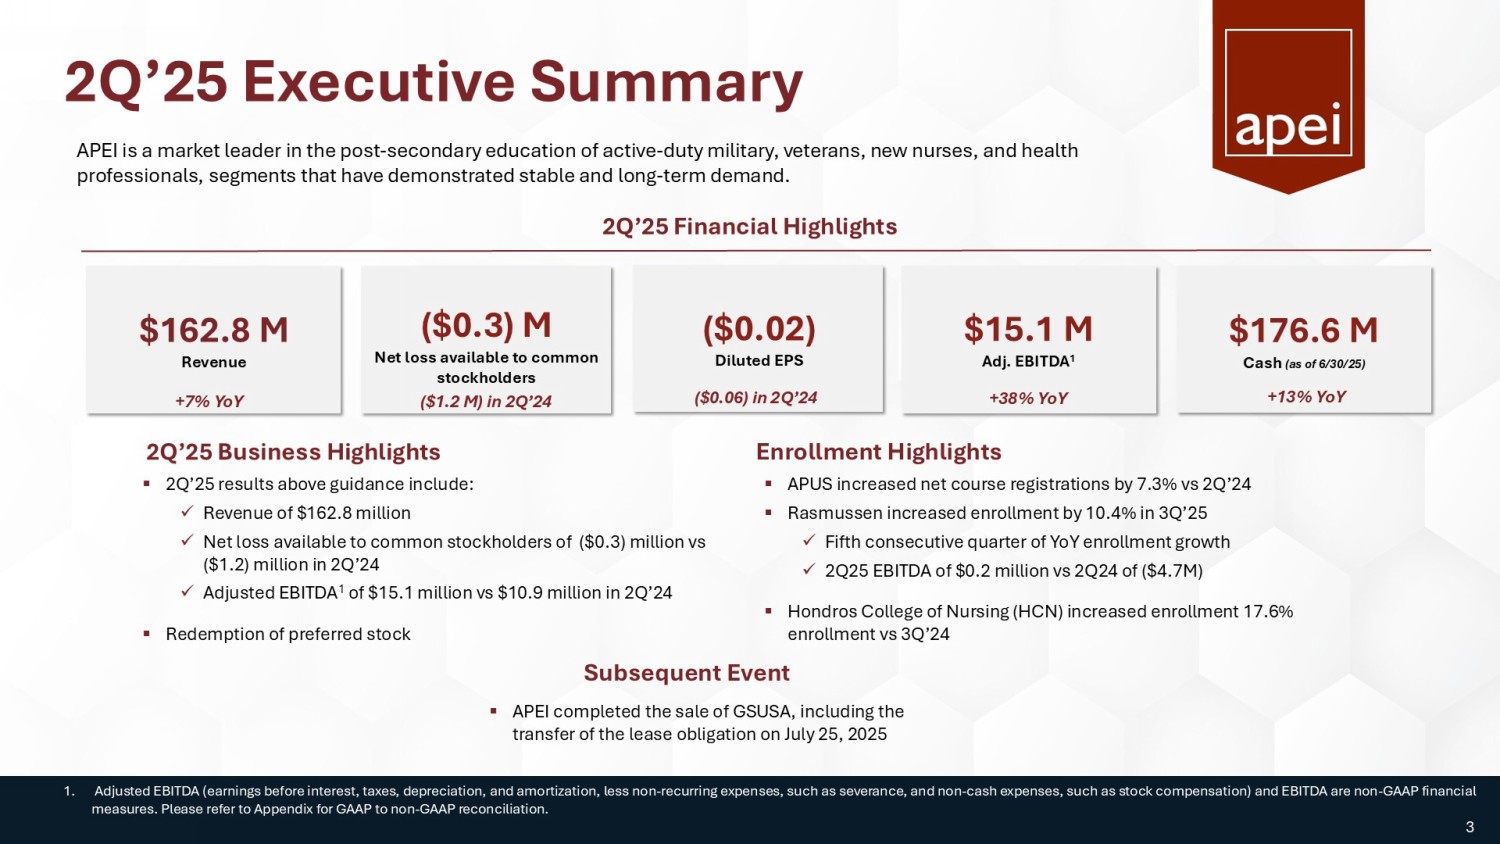
2Q’25 Executive Summary $162.8 M Revenue $15.1 M Adj. EBITDA 1 ($0.3) M Net loss available to common stockholders $176.6 M Cash (as of 6/30/25) 1. Adjusted EBITDA (earnings before interest, taxes, depreciation, and amortization, less non - recurring expenses, such as severanc e, and non - cash expenses, such as stock compensation) and EBITDA are non - GAAP financial measures. Please refer to Appendix for GAAP to non - GAAP reconciliation. ($0.02) Diluted EPS ▪ 2Q’25 results above guidance include: x Revenue of $162.8 million x Net loss available to common stockholders of ($0.3) million vs ($1.2) million in 2Q’24 x Adjusted EBITDA 1 of $15.1 million vs $10.9 million in 2Q’24 ▪ Redemption of preferred stock 2Q’25 Business Highlights APEI is a market leader in the post - secondary education of active - duty military, veterans, new nurses, and health professionals, segments that have demonstrated stable and long - term demand. 2Q’25 Financial Highlights +7% YoY +38% YoY +13% YoY ▪ APUS increased net course registrations by 7.3% vs 2Q’24 ▪ Rasmussen increased enrollment by 10.4% in 3Q’25 x Fifth consecutive quarter of YoY enrollment growth x 2Q25 EBITDA of $0.2 million vs 2Q24 of ($4.7M) ▪ Hondros College of Nursing (HCN) increased enrollment 17.6% enrollment vs 3Q’24 ($1.2 M) in 2Q’24 ($0.06) in 2Q’24 Enrollment Highlights 3 Subsequent Event ▪ APEI completed the sale of GSUSA, including the transfer of the lease obligation on July 25, 2025 Financial Highlights APEI is a market leader in the post - secondary education of active - duty military, veterans, new nurses, and health professionals, segments that have demonstrated stable and long - term demand.
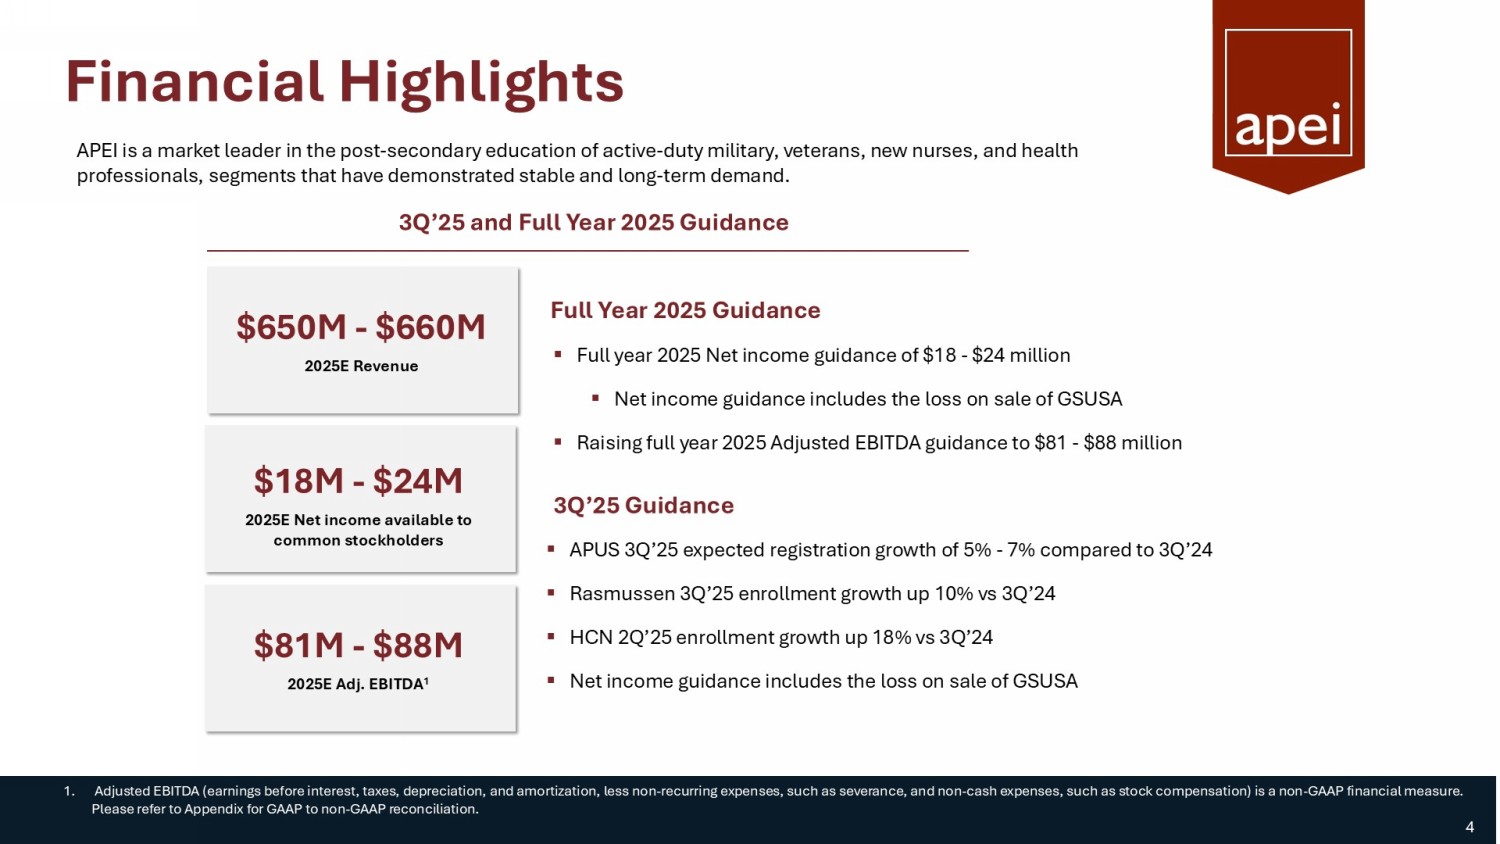
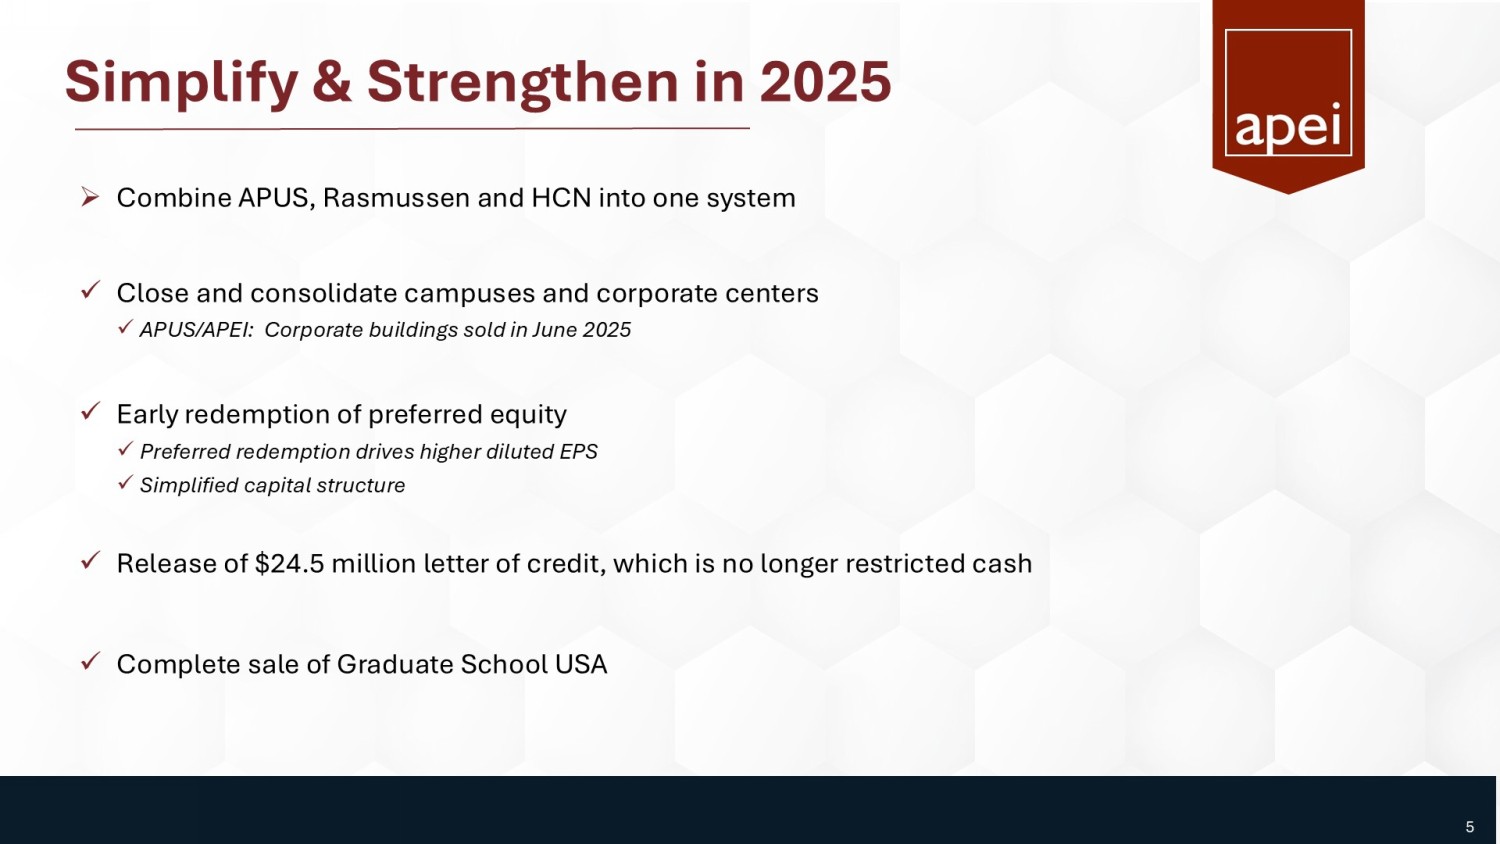
3Q’25 and Full Year 2025 Guidance $650M - $660M 2025E Revenue $18M - $24M 2025E Net income available to common stockholders $81M - $88M 2025E Adj. EBITDA 1 ▪ APUS 3Q’25 expected registration growth of 5% - 7% compared to 3Q’24 ▪ Rasmussen 3Q’25 enrollment growth up 10% vs 3Q’24 ▪ HCN 2Q’25 enrollment growth up 18% vs 3Q’24 ▪ Net income guidance includes the loss on sale of GSUSA 1. Adjusted EBITDA (earnings before interest, taxes, depreciation, and amortization, less non - recurring expenses, such as severanc e, and non - cash expenses, such as stock compensation) is a non - GAAP financial measure. Please refer to Appendix for GAAP to non - GAAP reconciliation. ▪ Full year 2025 Net income guidance of $18 - $24 million ▪ Net income guidance includes the loss on sale of GSUSA ▪ Raising full year 2025 Adjusted EBITDA guidance to $81 - $88 million Full Year 2025 Guidance 3Q’25 Guidance 4 Simplify & Strengthen in 2025 » Combine APUS, Rasmussen and HCN into one system x Close and consolidate campuses and corporate centers x APUS/APEI: Corporate buildings sold in June 2025 x Early redemption of preferred equity x Preferred redemption drives higher diluted EPS x Simplified capital structure x Release of $24.5 million letter of credit, which is no longer restricted cash x Complete sale of Graduate School USA 5
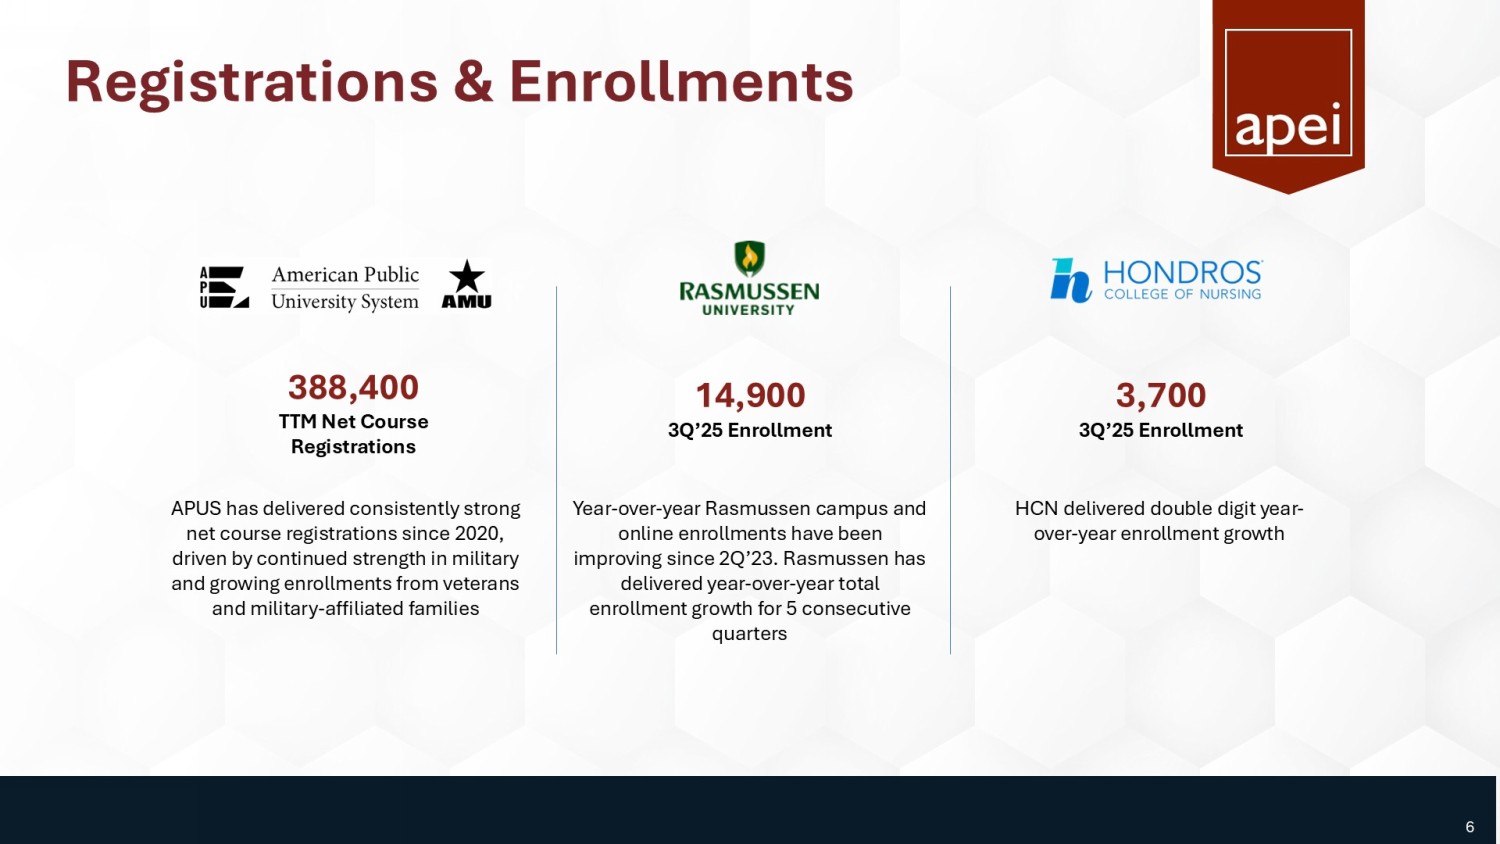
Registrations & Enrollments 388,400 TTM Net Course Registrations 14,900 3Q’25 Enrollment APUS has delivered consistently strong net course registrations since 2020, driven by continued strength in military and growing enrollments from veterans and military - affiliated families Year - over - year Rasmussen campus and online enrollments have been improving since 2Q’23.
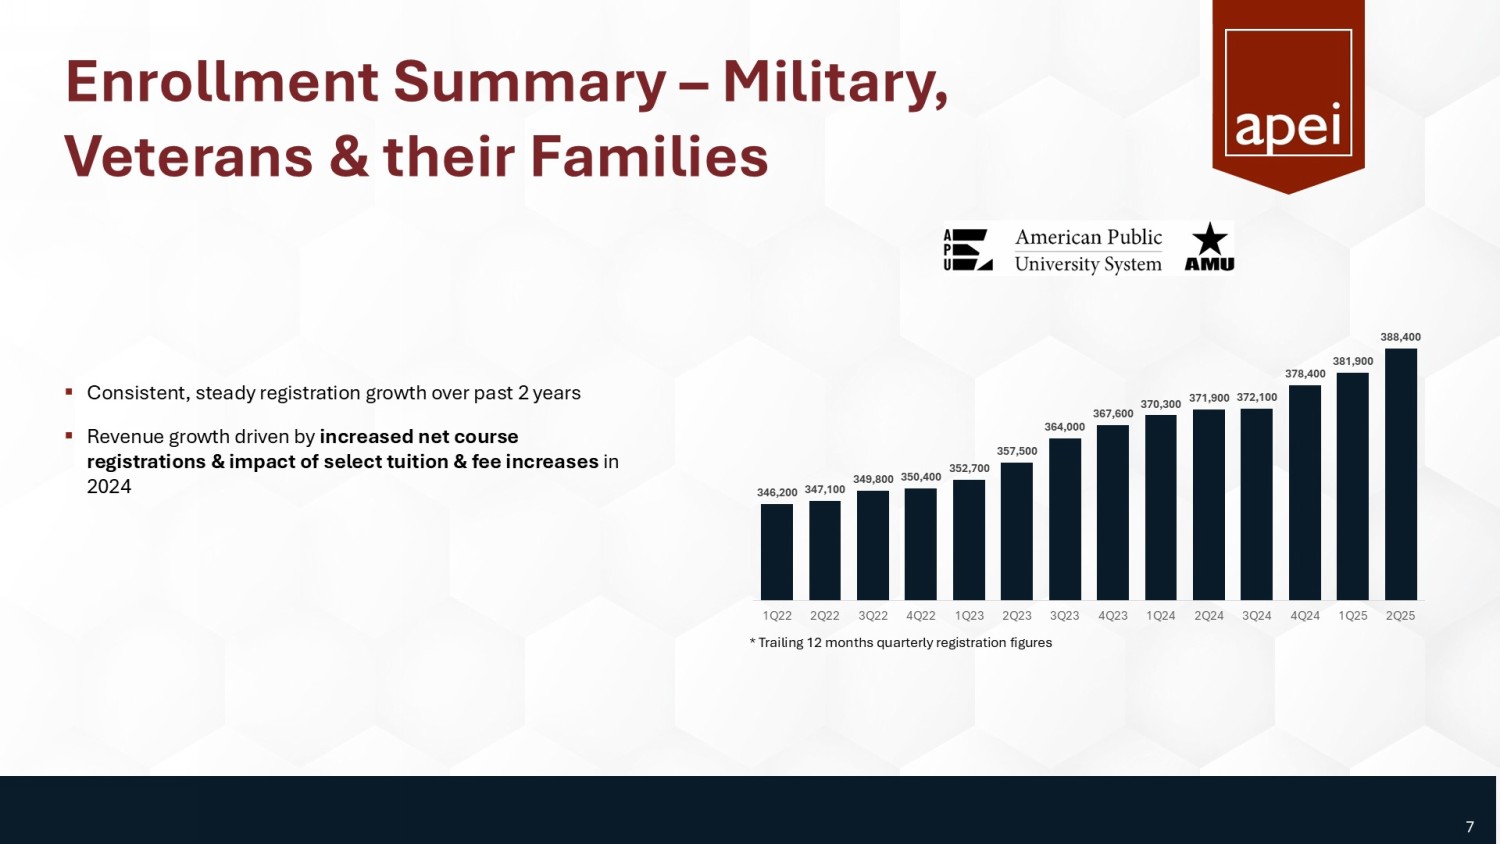
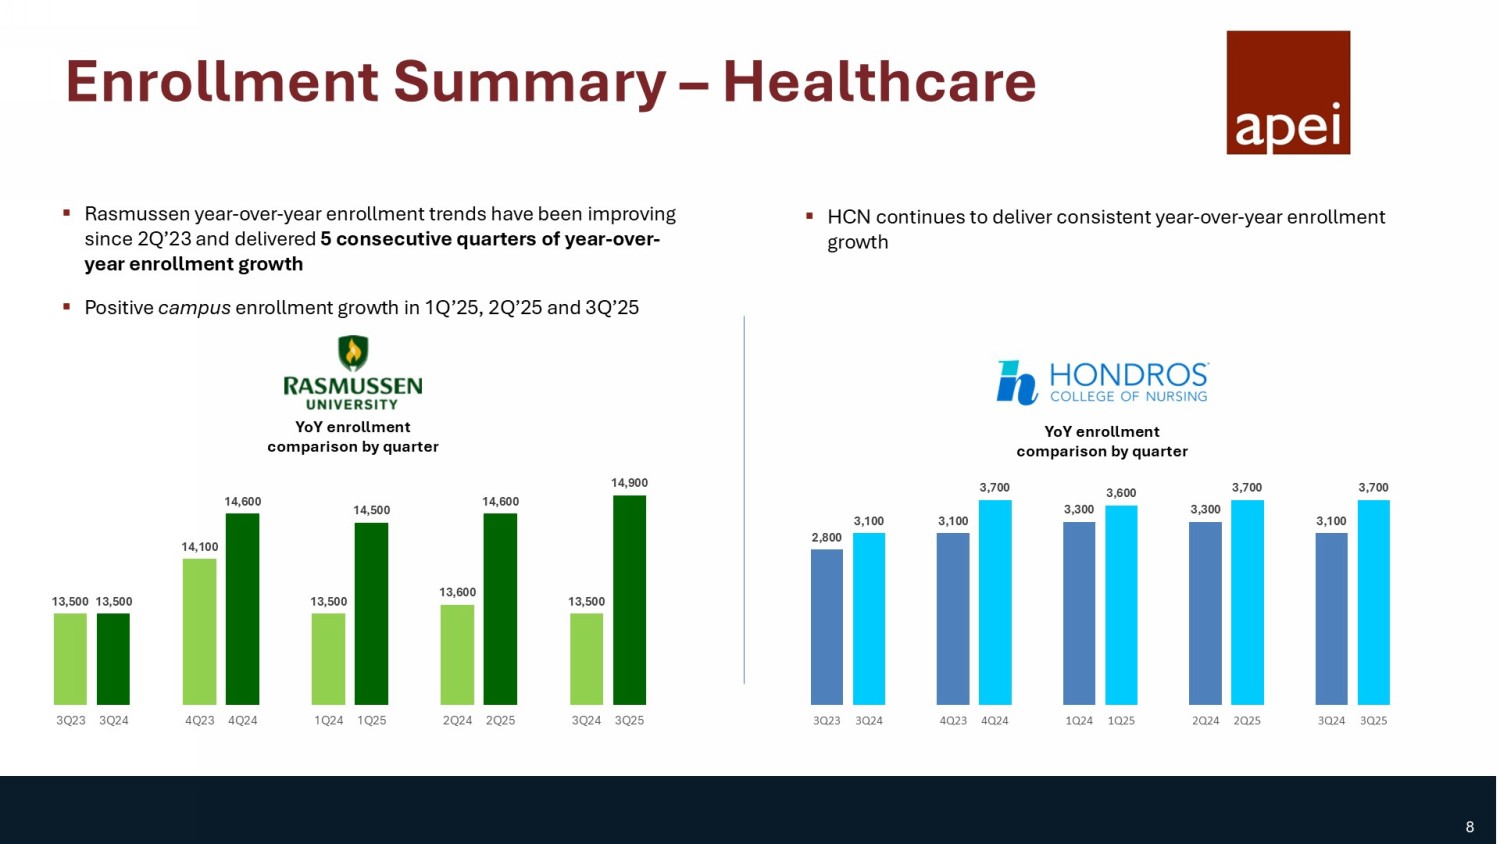
Rasmussen has delivered year - over - year total enrollment growth for 5 consecutive quarters HCN delivered double digit year - over - year enrollment growth 3,700 3Q’25 Enrollment 6 Enrollment Summary – Military, Veterans & their Families * Trailing 12 months quarterly registration figures ▪ Consistent, steady registration growth over past 2 years ▪ Revenue growth driven by increased net course registrations & impact of select tuition & fee increases in 2024 346,200 347,100 349,800 350,400 352,700 357,500 364,000 367,600 370,300 371,900 372,100 378,400 381,900 388,400 1Q22 2Q22 3Q22 4Q22 1Q23 2Q23 3Q23 4Q23 1Q24 2Q24 3Q24 4Q24 1Q25 2Q25 7 Enrollment Summary – Healthcare ▪ Rasmussen year - over - year enrollment trends have been improving since 2Q’23 and delivered 5 consecutive quarters of year - over - year enrollment growth ▪ Positive campus enrollment growth in 1Q’25, 2Q’25 and 3Q’25 YoY enrollment comparison by quarter YoY enrollment comparison by quarter ▪ HCN continues to deliver consistent year - over - year enrollment growth 13,500 13,500 14,100 14,600 13,500 14,500 13,600 14,600 13,500 14,900 3Q23 3Q24 4Q23 4Q24 1Q24 1Q25 2Q24 2Q25 3Q24 3Q25 2,800 3,100 3,100 3,700 3,300 3,600 3,300 3,700 3,100 3,700 3Q23 3Q24 4Q23 4Q24 1Q24 1Q25 2Q24 2Q25 3Q24 3Q25 8

Financial Update
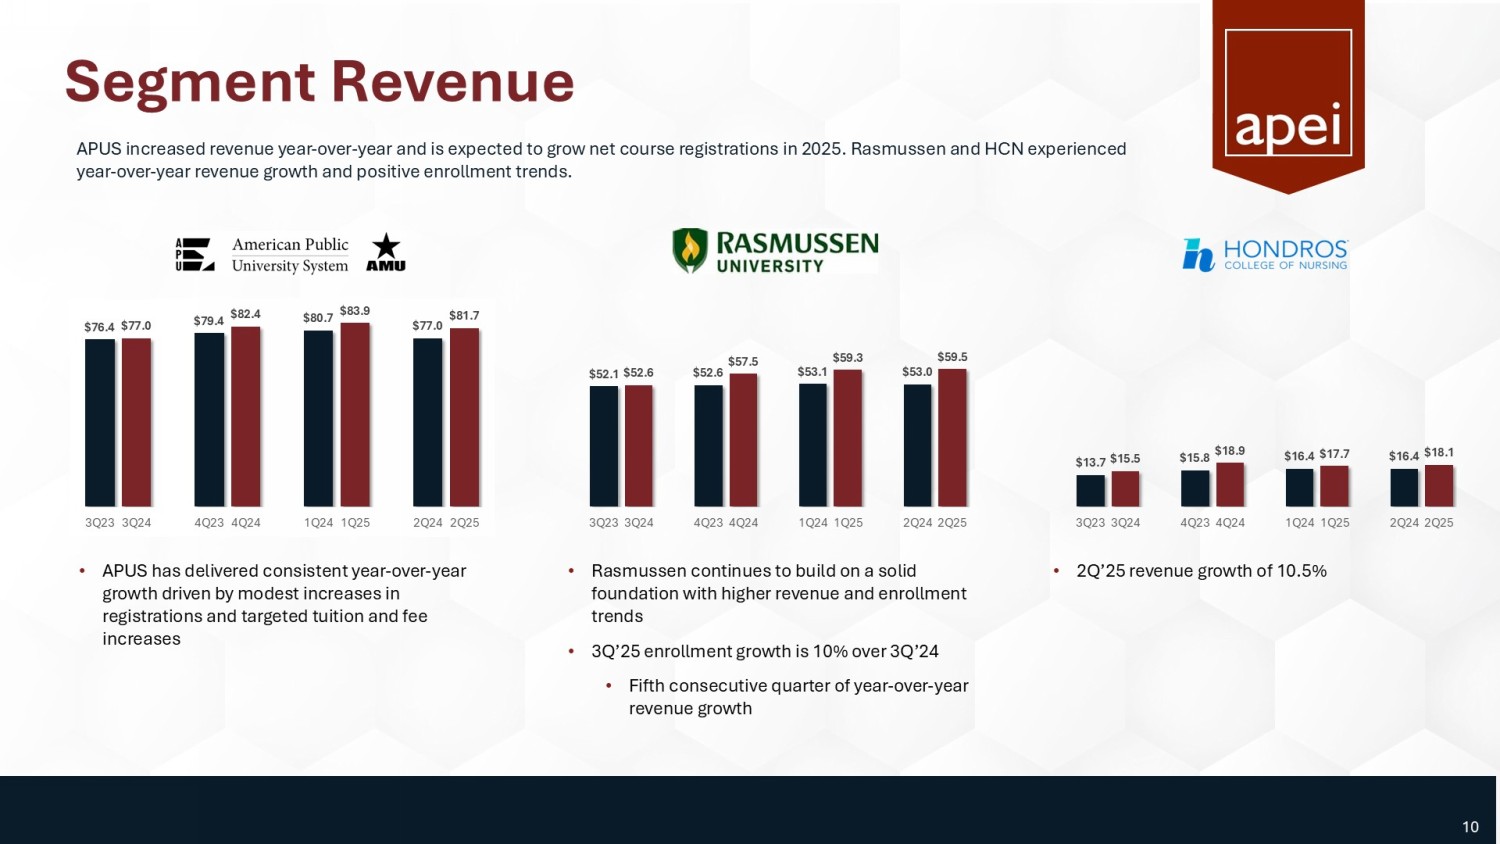
Segment Revenue • APUS has delivered consistent year - over - year growth driven by modest increases in registrations and targeted tuition and fee increases • Rasmussen continues to build on a solid foundation with higher revenue and enrollment trends • 3Q’25 enrollment growth is 10% over 3Q’24 • Fifth consecutive quarter of year - over - year revenue growth • 2Q’25 revenue growth of 10.5% APUS increased revenue year - over - year and is expected to grow net course registrations in 2025. Rasmussen and HCN experienced year - over - year revenue growth and positive enrollment trends. $76.4 $77.0 $79.4 $82.4 $80.7 $83.9 $77.0 $81.7 3Q23 3Q24 4Q23 4Q24 1Q24 1Q25 2Q24 2Q25 $52.1 $52.6 $52.6 $57.5 $53.1 $59.3 $53.0 $59.5 3Q23 3Q24 4Q23 4Q24 1Q24 1Q25 2Q24 2Q25 $13.7 $15.5 $15.8 $18.9 $16.4 $17.7 $16.4 $18.1 3Q23 3Q24 4Q23 4Q24 1Q24 1Q25 2Q24 2Q25 10 Profitability ▪ 2Q’25 EBITDA margin of 27% on $81.7 million in revenue TTM Adj.
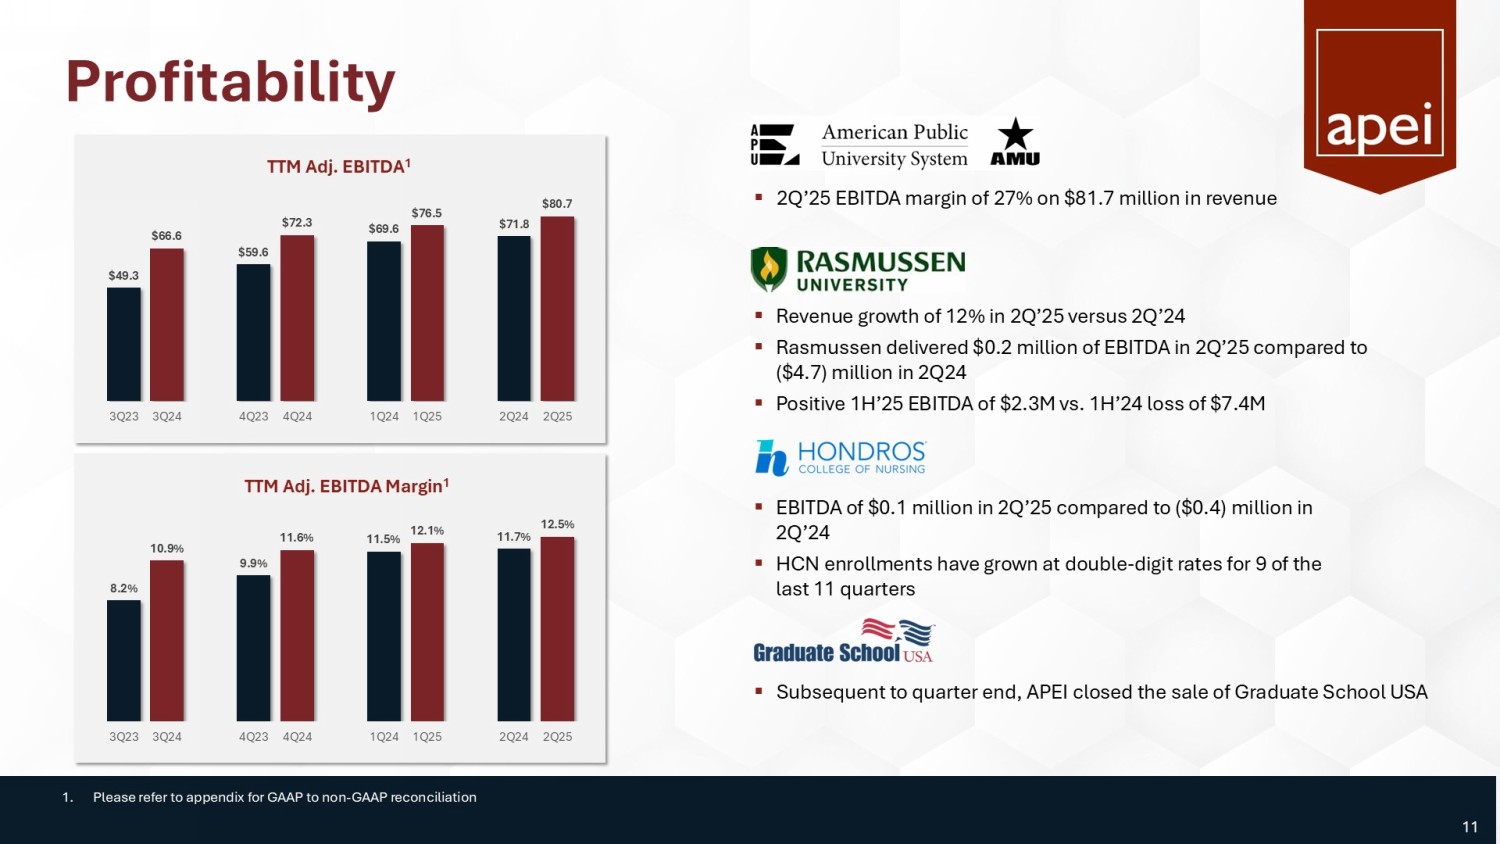
EBITDA 1 TTM Adj. EBITDA Margin 1 ▪ Revenue growth of 12% in 2Q’25 versus 2Q’24 ▪ Rasmussen delivered $0.2 million of EBITDA in 2Q’25 compared to ($4.7) million in 2Q24 ▪ Positive 1H’25 EBITDA of $2.3M vs. 1H’24 loss of $7.4M ▪ EBITDA of $0.1 million in 2Q’25 compared to ($0.4) million in 2Q’24 ▪ HCN enrollments have grown at double - digit rates for 9 of the last 11 quarters ▪ Subsequent to quarter end, APEI closed the sale of Graduate School USA 1.
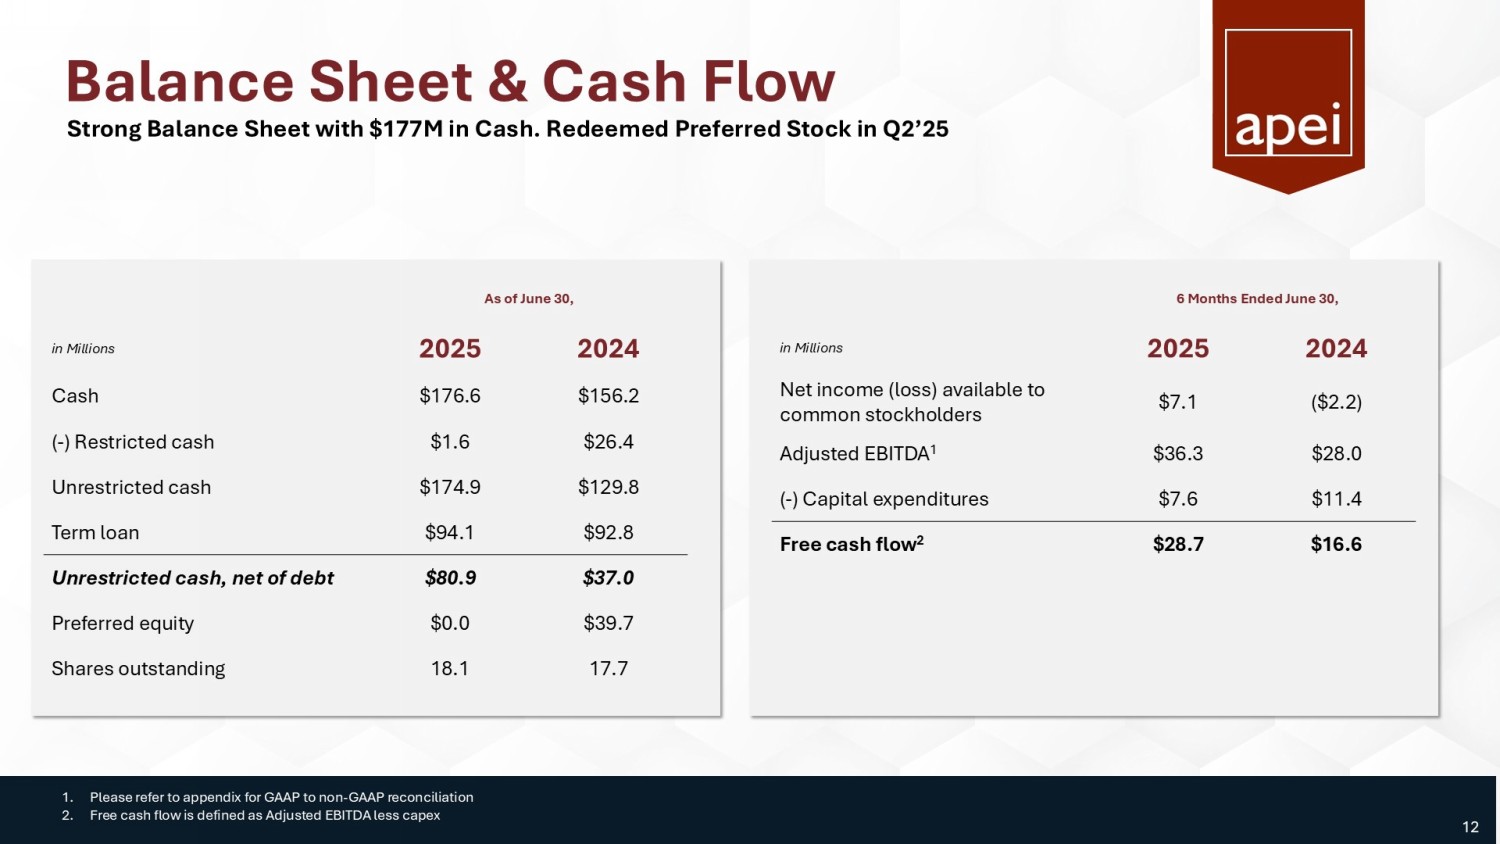
Please refer to appendix for GAAP to non - GAAP reconciliation $49.3 $66.6 $59.6 $72.3 $69.6 $76.5 $71.8 $80.7 3Q23 3Q24 4Q23 4Q24 1Q24 1Q25 2Q24 2Q25 8.2% 10.9% 9.9% 11.6% 11.5% 12.1% 11.7% 12.5% 3Q23 3Q24 4Q23 4Q24 1Q24 1Q25 2Q24 2Q25 11 Balance Sheet & Cash Flow 6 Months Ended June 30, 2024 2025 in Millions ($2.2) $7.1 Net income (loss) available to common stockholders $28.0 $36.3 Adjusted EBITDA 1 $11.4 $7.6 ( - ) Capital expenditures $16.6 $28.7 Free cash flow 2 As of June 30, 2024 2025 in Millions $156.2 $176.6 Cash $26.4 $1.6 ( - ) Restricted cash $129.8 $174.9 Unrestricted cash $92.8 $94.1 Term loan $37.0 $80.9 Unrestricted cash, net of debt $39.7 $0.0 Preferred equity 17.7 18.1 Shares outstanding Strong Balance Sheet with $177M in Cash. Redeemed Preferred Stock in Q2’25 1. Please refer to appendix for GAAP to non - GAAP reconciliation 2.
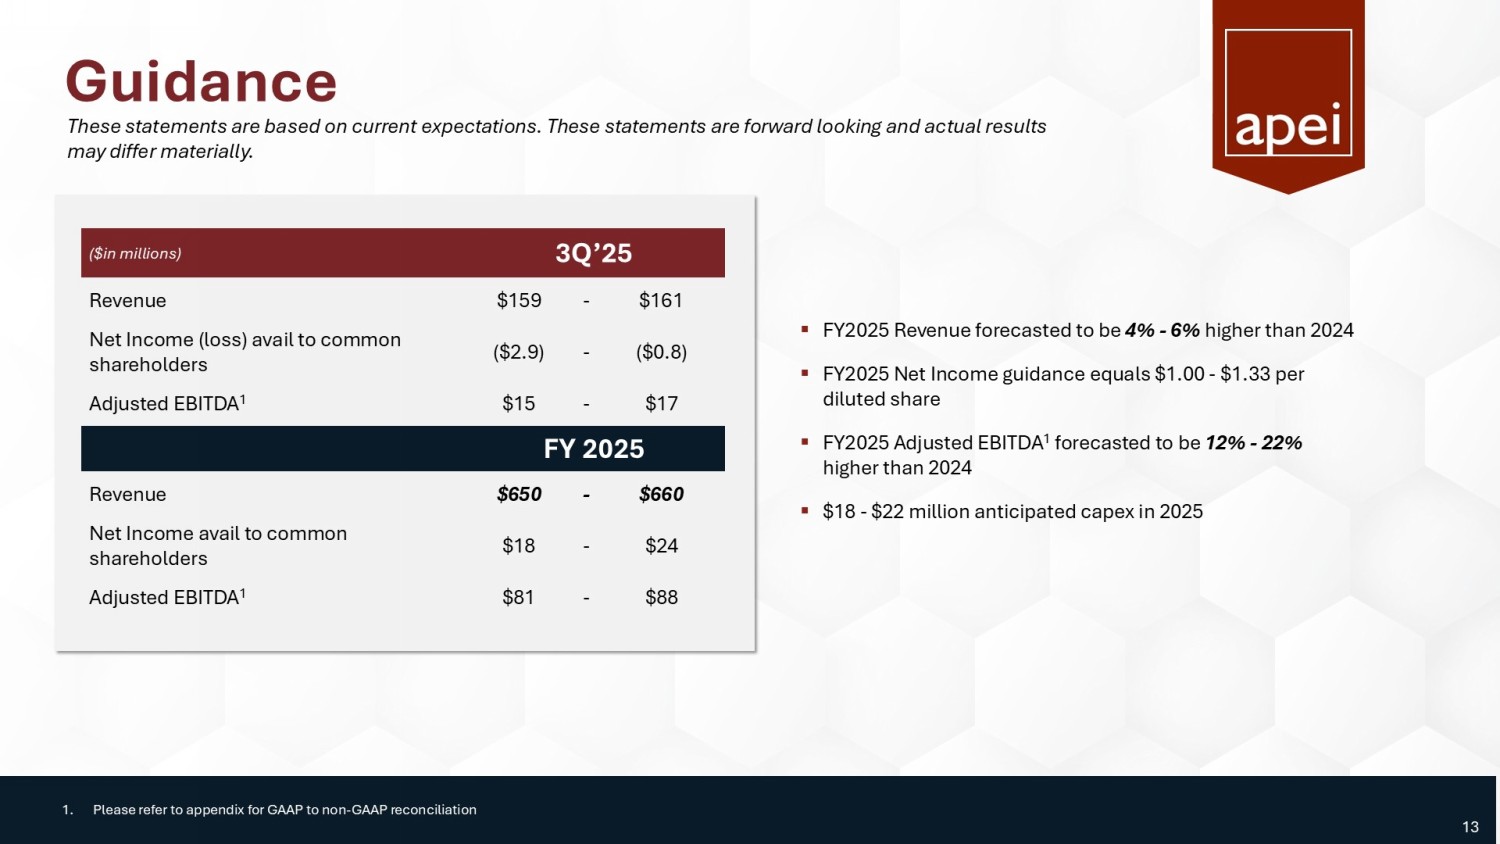
Free cash flow is defined as Adjusted EBITDA less capex 12 Guidance 3Q’25 ($in millions) $161 - $159 Revenue ($0.8) - ($2.9) Net Income (loss) avail to common shareholders $17 - $15 Adjusted EBITDA 1 FY 2025 $660 - $650 Revenue $24 - $18 Net Income avail to common shareholders $88 - $81 Adjusted EBITDA 1 ▪ FY2025 Revenue forecasted to be 4% - 6% higher than 2024 ▪ FY2025 Net Income guidance equals $1.00 - $1.33 per diluted share ▪ FY2025 Adjusted EBITDA 1 forecasted to be 12% - 22% higher than 2024 ▪ $18 - $22 million anticipated capex in 2025 1. Please refer to appendix for GAAP to non - GAAP reconciliation These statements are based on current expectations. These statements are forward looking and actual results may differ materially. 13 INVESTMENT HIGHLIGHTS Large Addressable Market Online education expected to increase to >$100 billion in 5 years Demand for nurses estimated to be 200,000+ per year Solid ROI for Education & Stable Long - Term Demand APUS in top 11% for student return on educational investment 1 Improving Performance and Operating Leverage Solid growth, margins and cash flow performance at APUS Rasmussen delivering positive enrollment and positive EBITDA Simplifying Business Operations Consolidating three separate institutions into one university system Redeemed preferred equity in 2Q’25 Completed sale of two corporate buildings Completed sale of GSUSA 1.
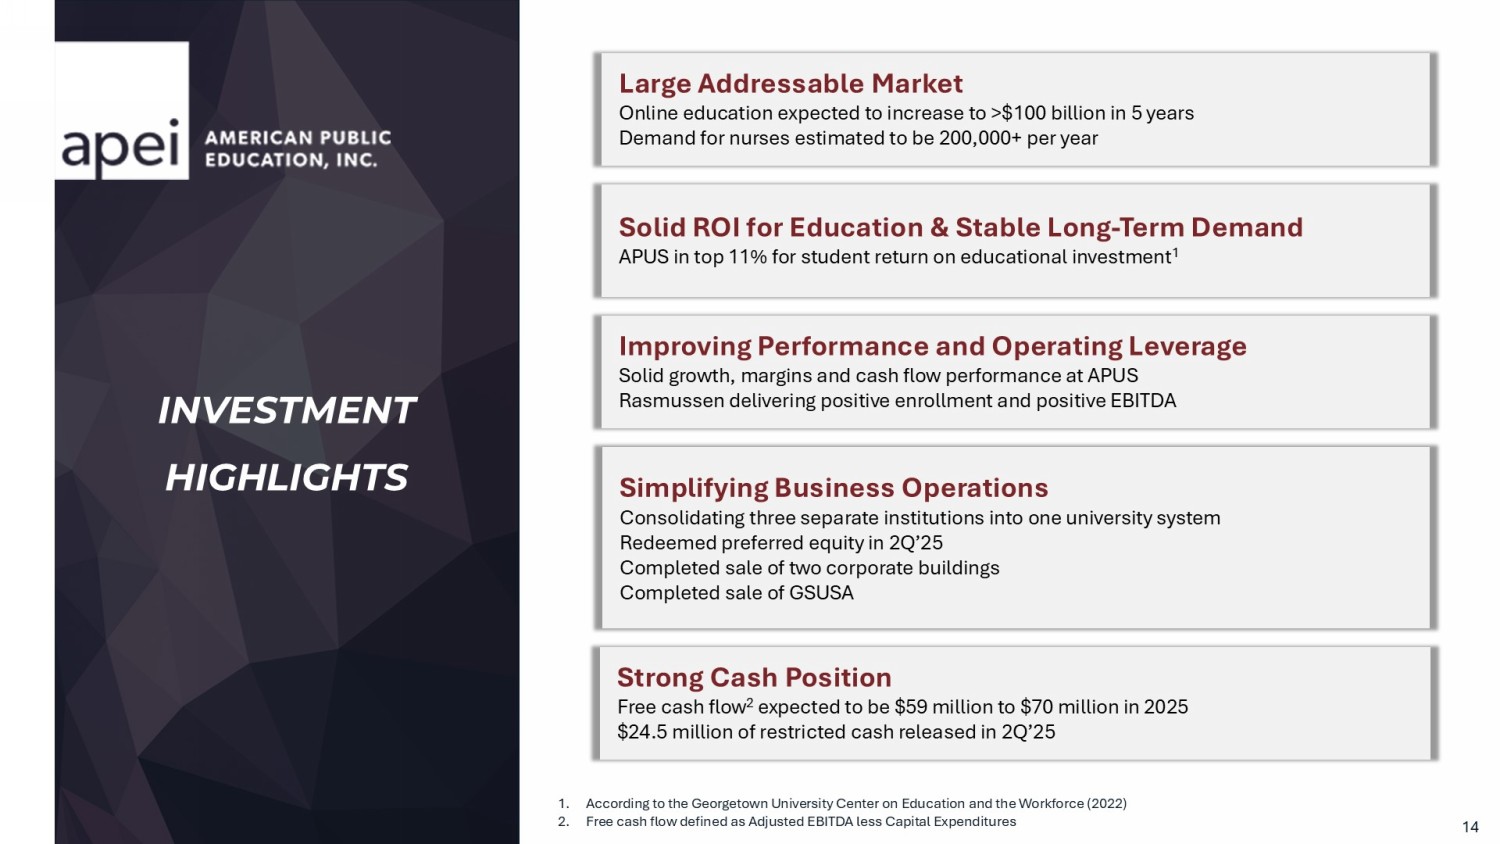
According to the Georgetown University Center on Education and the Workforce (2022) 2.

Appendix
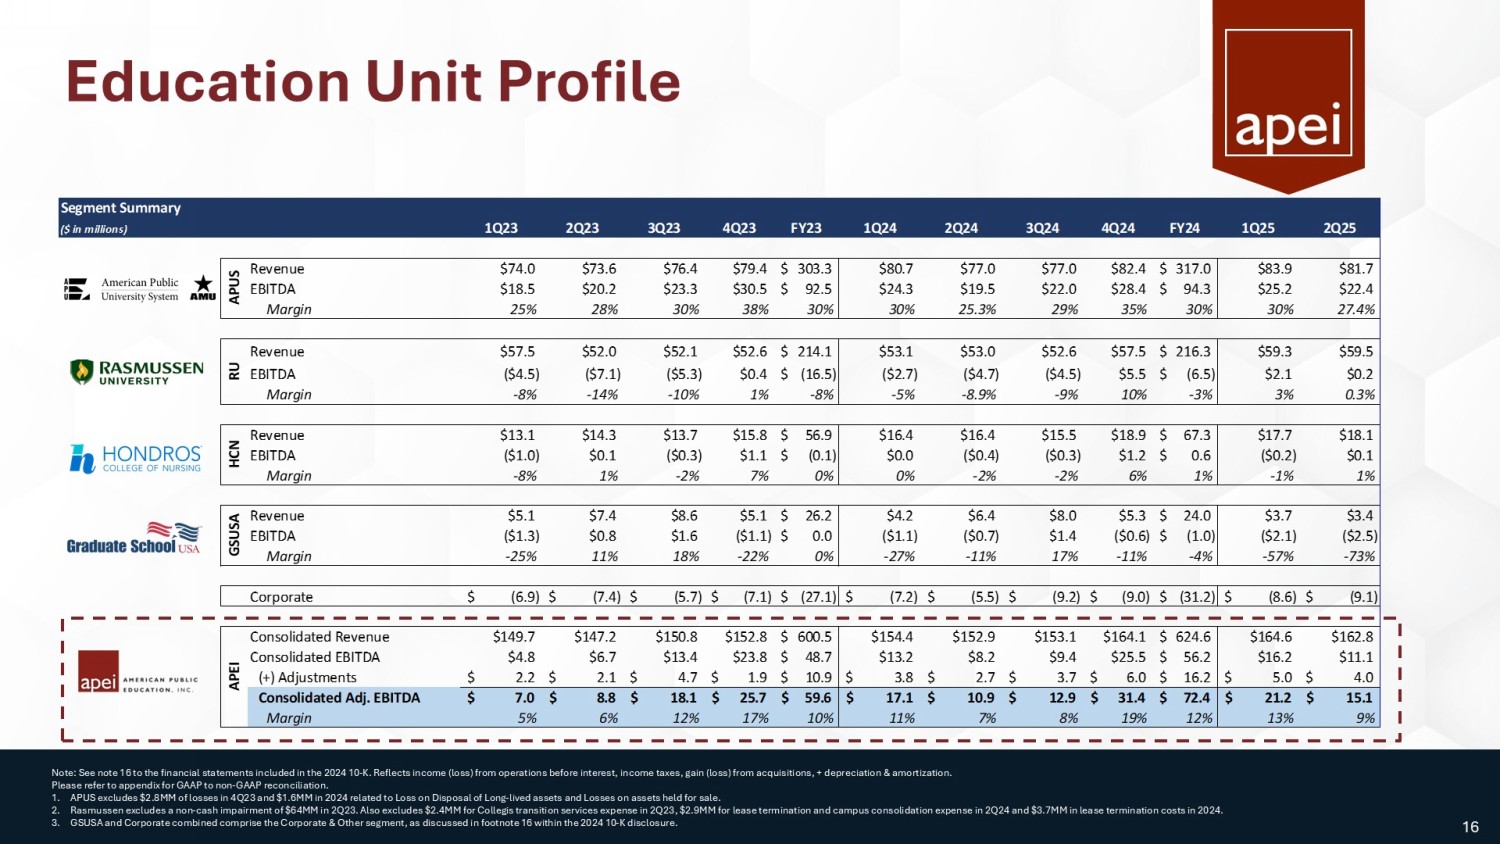
Free cash flow defined as Adjusted EBITDA less Capital Expenditures Strong Cash Position Free cash flow 2 expected to be $59 million to $70 million in 2025 $24.5 million of restricted cash released in 2Q’25 14 Education Unit Profile Note: See note 16 to the financial statements included in the 2024 10 - K. Reflects income (loss) from operations before interest, income taxes, gain (loss) from acquisitions, + depreciation & amortization. Please refer to appendix for GAAP to non - GAAP reconciliation. 1. APUS excludes $2.8MM of losses in 4Q23 and $1.6MM in 2024 related to Loss on Disposal of Long - lived assets and Losses on assets held for sale. 2. Rasmussen excludes a non - cash impairment of $64MM in 2Q23. Also excludes $2.4MM for Collegis transition services expense in 2Q23, $2.9MM for lease termination and campus consolidation expense in 2Q24 and $3.7MM in leas e termination costs in 2024. 3. GSUSA and Corporate combined comprise the Corporate & Other segment, as discussed in footnote 16 within the 2024 10 - K disclosure . 16 Segment Summary ($ in millions) 1Q23 2Q23 3Q23 4Q23 FY23 1Q24 2Q24 3Q24 4Q24 FY24 1Q25 2Q25 Revenue $74.0 $73.6 $76.4 $79.4 303.3$ $80.7 $77.0 $77.0 $82.4 317.0$ $83.9 $81.7 EBITDA $18.5 $20.2 $23.3 $30.5 92.5$ $24.3 $19.5 $22.0 $28.4 94.3$ $25.2 $22.4 Margin 25% 28% 30% 38% 30% 30% 25.3% 29% 35% 30% 30% 27.4% Revenue $57.5 $52.0 $52.1 $52.6 214.1$ $53.1 $53.0 $52.6 $57.5 216.3$ $59.3 $59.5 EBITDA ($4.5) ($7.1) ($5.3) $0.4 (16.5)$ ($2.7) ($4.7) ($4.5) $5.5 (6.5)$ $2.1 $0.2 Margin -8% -14% -10% 1% -8% -5% -8.9% -9% 10% -3% 3% 0.3% Revenue $13.1 $14.3 $13.7 $15.8 56.9$ $16.4 $16.4 $15.5 $18.9 67.3$ $17.7 $18.1 EBITDA ($1.0) $0.1 ($0.3) $1.1 (0.1)$ $0.0 ($0.4) ($0.3) $1.2 0.6$ ($0.2) $0.1 Margin -8% 1% -2% 7% 0% 0% -2% -2% 6% 1% -1% 1% Revenue $5.1 $7.4 $8.6 $5.1 26.2$ $4.2 $6.4 $8.0 $5.3 24.0$ $3.7 $3.4 EBITDA ($1.3) $0.8 $1.6 ($1.1) 0.0$ ($1.1) ($0.7) $1.4 ($0.6) (1.0)$ ($2.1) ($2.5) Margin -25% 11% 18% -22% 0% -27% -11% 17% -11% -4% -57% -73% Corporate (6.9)$ (7.4)$ (5.7)$ (7.1)$ (27.1)$ (7.2)$ (5.5)$ (9.2)$ (9.0)$ (31.2)$ (8.6)$ (9.1)$ Consolidated Revenue $149.7 $147.2 $150.8 $152.8 600.5$ $154.4 $152.9 $153.1 $164.1 624.6$ $164.6 $162.8 Consolidated EBITDA $4.8 $6.7 $13.4 $23.8 48.7$ $13.2 $8.2 $9.4 $25.5 56.2$ $16.2 $11.1 (+) Adjustments 2.2$ 2.1$ 4.7$ 1.9$ 10.9$ 3.8$ 2.7$ 3.7$ 6.0$ 16.2$ 5.0$ 4.0$ Consolidated Adj.
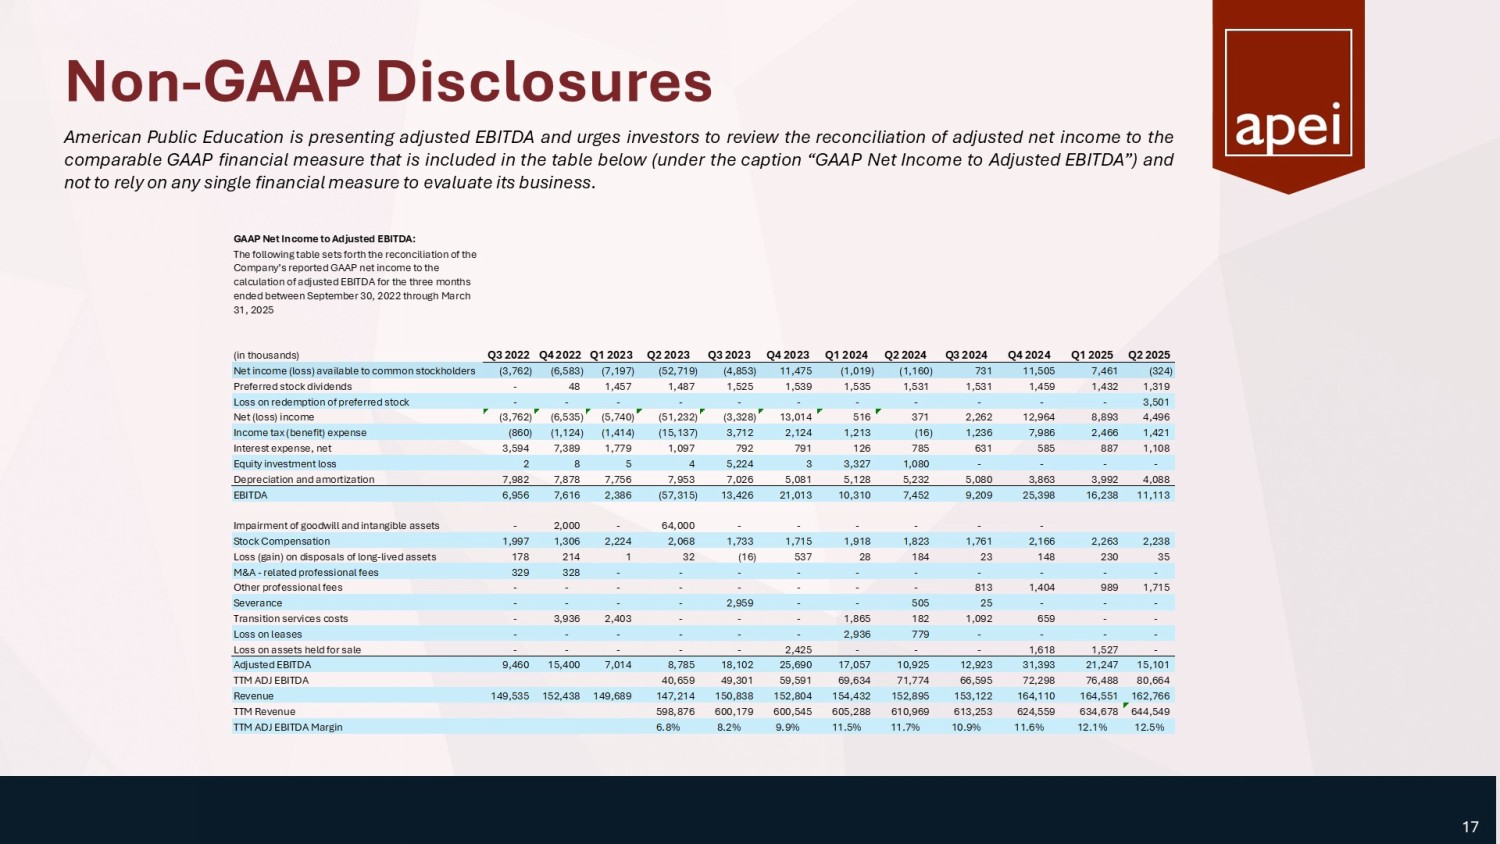
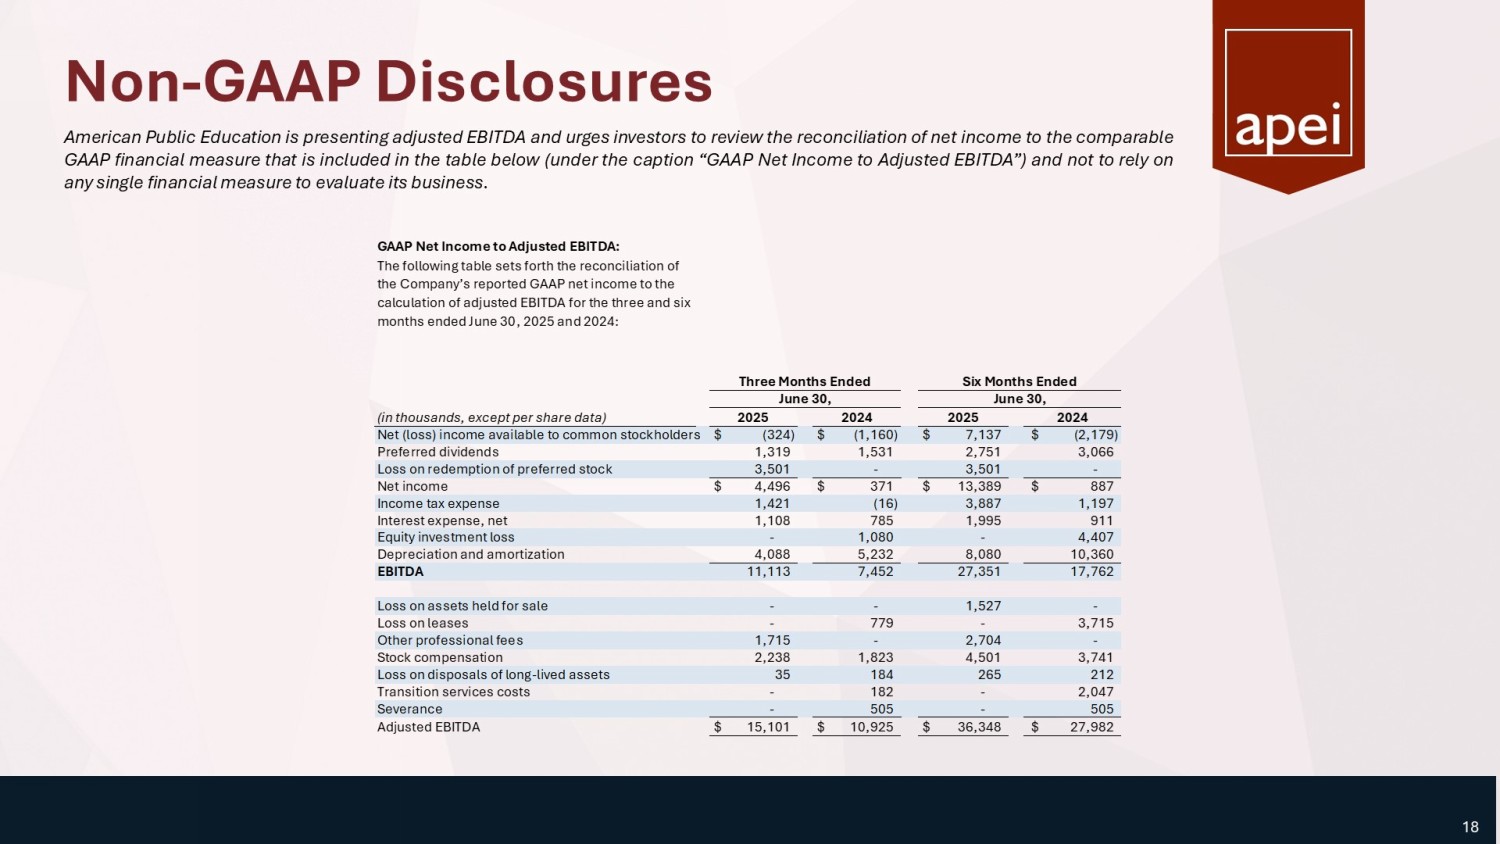
EBITDA 7.0$ 8.8$ 18.1$ 25.7$ 59.6$ 17.1$ 10.9$ 12.9$ 31.4$ 72.4$ 21.2$ 15.1$ Margin 5% 6% 12% 17% 10% 11% 7% 8% 19% 12% 13% 9% APEI APUS RU HCN GSUSA Non - GAAP Disclosures American Public Education is presenting adjusted EBITDA and urges investors to review the reconciliation of adjusted net income to the comparable GAAP financial measure that is included in the table below (under the caption “GAAP Net Income to Adjusted EBITDA”) and not to rely on any single financial measure to evaluate its business . 17 GAAP Net Income to Adjusted EBITDA: The following table sets forth the reconciliation of the Company’s reported GAAP net income to the calculation of adjusted EBITDA for the three months ended between September 30, 2022 through March 31, 2025 (in thousands) Q3 2022 Q4 2022 Q1 2023 Q2 2023 Q3 2023 Q4 2023 Q1 2024 Q2 2024 Q3 2024 Q4 2024 Q1 2025 Q2 2025 Net income (loss) available to common stockholders (3,762) (6,583) (7,197) (52,719) (4,853) 11,475 (1,019) (1,160) 731 11,505 7,461 (324) Preferred stock dividends - 48 1,457 1,487 1,525 1,539 1,535 1,531 1,531 1,459 1,432 1,319 Loss on redemption of preferred stock - - - - - - - - - - - 3,501 Net (loss) income (3,762) (6,535) (5,740) (51,232) (3,328) 13,014 516 371 2,262 12,964 8,893 4,496 Income tax (benefit) expense (860) (1,124) (1,414) (15,137) 3,712 2,124 1,213 (16) 1,236 7,986 2,466 1,421 Interest expense, net 3,594 7,389 1,779 1,097 792 791 126 785 631 585 887 1,108 Equity investment loss 2 8 5 4 5,224 3 3,327 1,080 - - - - Depreciation and amortization 7,982 7,878 7,756 7,953 7,026 5,081 5,128 5,232 5,080 3,863 3,992 4,088 EBITDA 6,956 7,616 2,386 (57,315) 13,426 21,013 10,310 7,452 9,209 25,398 16,238 11,113 Impairment of goodwill and intangible assets - 2,000 - 64,000 - - - - - - Stock Compensation 1,997 1,306 2,224 2,068 1,733 1,715 1,918 1,823 1,761 2,166 2,263 2,238 Loss (gain) on disposals of long-lived assets 178 214 1 32 (16) 537 28 184 23 148 230 35 M&A - related professional fees 329 328 - - - - - - - - - - Other professional fees - - - - - - - - 813 1,404 989 1,715 Severance - - - - 2,959 - - 505 25 - - - Transition services costs - 3,936 2,403 - - - 1,865 182 1,092 659 - - Loss on leases - - - - - - 2,936 779 - - - - Loss on assets held for sale - - - - - 2,425 - - - 1,618 1,527 - Adjusted EBITDA 9,460 15,400 7,014 8,785 18,102 25,690 17,057 10,925 12,923 31,393 21,247 15,101 TTM ADJ EBITDA 40,659 49,301 59,591 69,634 71,774 66,595 72,298 76,488 80,664 Revenue 149,535 152,438 149,689 147,214 150,838 152,804 154,432 152,895 153,122 164,110 164,551 162,766 TTM Revenue 598,876 600,179 600,545 605,288 610,969 613,253 624,559 634,678 644,549 TTM ADJ EBITDA Margin 6.8% 8.2% 9.9% 11.5% 11.7% 10.9% 11.6% 12.1% 12.5% Non - GAAP Disclosures GAAP Net Income to Adjusted EBITDA: The following table sets forth the reconciliation of the Company’s reported GAAP net income to the calculation of adjusted EBITDA for the three and six months ended June 30, 2025 and 2024: (in thousands, except per share data) Net (loss) income available to common stockholders $ (324) $ (1,160) $ 7,137 $ (2,179) Preferred dividends 1,319 1,531 2,751 3,066 Loss on redemption of preferred stock 3,501 - 3,501 - Net income $ 4,496 $ 371 $ 13,389 $ 887 Income tax expense 1,421 (16) 3,887 1,197 Interest expense, net 1,108 785 1,995 911 Equity investment loss - 1,080 - 4,407 Depreciation and amortization 4,088 5,232 8,080 10,360 EBITDA 11,113 7,452 27,351 17,762 Loss on assets held for sale - - 1,527 - Loss on leases - 779 - 3,715 Other professional fees 1,715 - 2,704 - Stock compensation 2,238 1,823 4,501 3,741 Loss on disposals of long-lived assets 35 184 265 212 Transition services costs - 182 - 2,047 Severance - 505 - 505 Adjusted EBITDA $ 15,101 $ 10,925 $ 36,348 $ 27,982 Three Months Ended June 30, 2025 2024 Six Months Ended June 30, 2025 2024 18 American Public Education is presenting adjusted EBITDA and urges investors to review the reconciliation of net income to the comparable GAAP financial measure that is included in the table below (under the caption “GAAP Net Income to Adjusted EBITDA”) and not to rely on any single financial measure to evaluate its business .
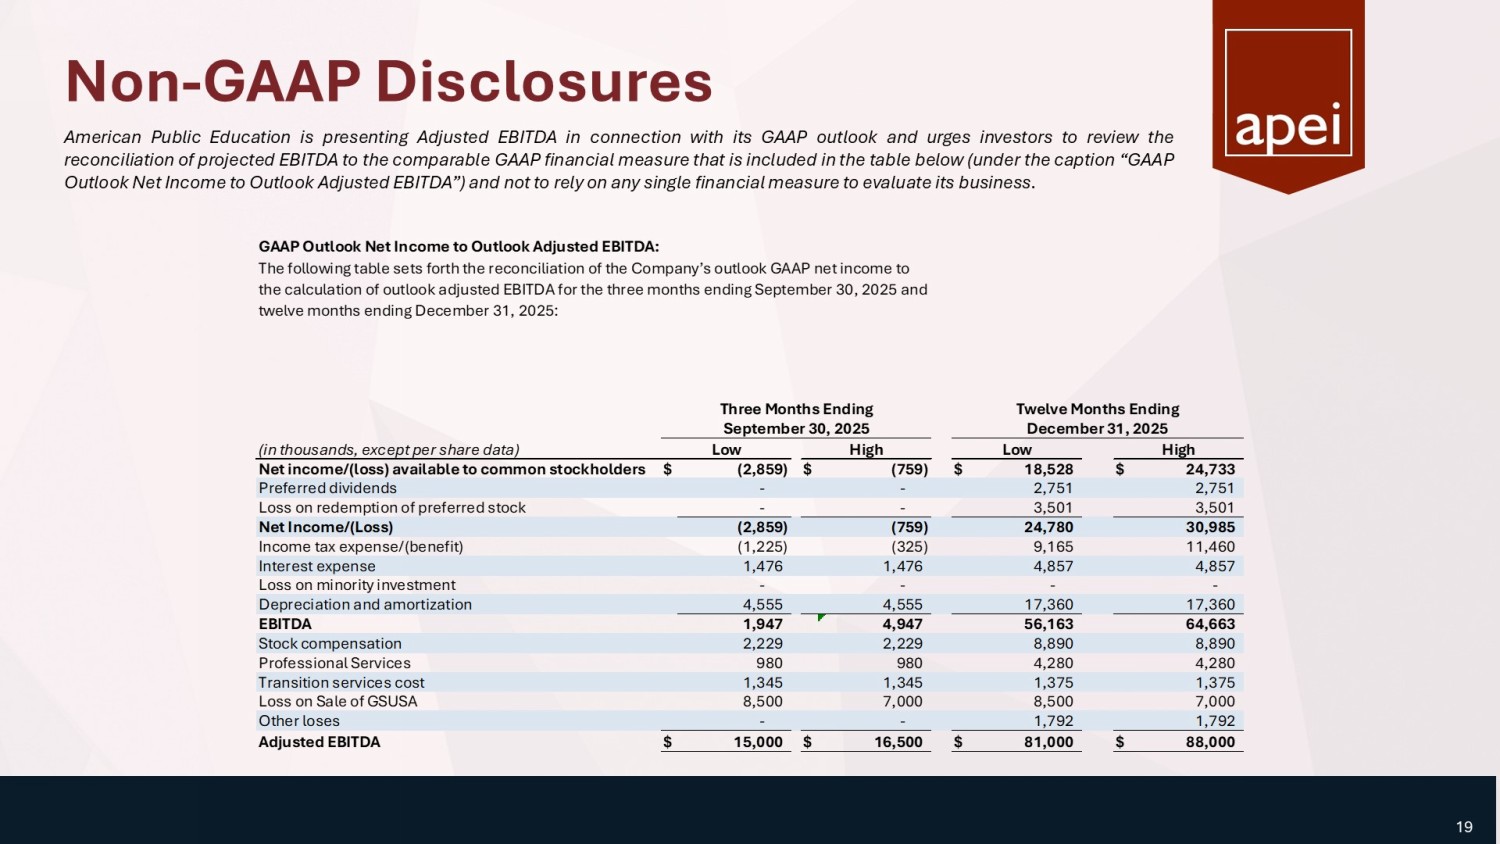
Non - GAAP Disclosures American Public Education is presenting Adjusted EBITDA in connection with its GAAP outlook and urges investors to review the reconciliation of projected EBITDA to the comparable GAAP financial measure that is included in the table below (under the caption “GAAP Outlook Net Income to Outlook Adjusted EBITDA”) and not to rely on any single financial measure to evaluate its business . 19 GAAP Outlook Net Income to Outlook Adjusted EBITDA: (in thousands, except per share data) Net income/(loss) available to common stockholders$ (2,859) $ (759) $ 18,528 $ 24,733 Preferred dividends - - 2,751 2,751 Loss on redemption of preferred stock - - 3,501 3,501 Net Income/(Loss) (2,859) (759) 24,780 30,985 Income tax expense/(benefit) (1,225) (325) 9,165 11,460 Interest expense 1,476 1,476 4,857 4,857 Loss on minority investment - - - - Depreciation and amortization 4,555 4,555 17,360 17,360 EBITDA 1,947 4,947 56,163 64,663 Stock compensation 2,229 2,229 8,890 8,890 Professional Services 980 980 4,280 4,280 Transition services cost 1,345 1,345 1,375 1,375 Loss on Sale of GSUSA 8,500 7,000 8,500 7,000 Other loses - - 1,792 1,792 Adjusted EBITDA $ 15,000 $ 16,500 $ 81,000 $ 88,000 The following table sets forth the reconciliation of the Company’s outlook GAAP net income to the calculation of outlook adjusted EBITDA for the three months ending September 30, 2025 and twelve months ending December 31, 2025: Three Months Ending Twelve Months Ending September 30, 2025 December 31, 2025 Low High Low High Thank You Company Rick Sunderland Chief Financial Officer investorrelations@apei.com Investor Relations Brian M. Prenoveau, CFA MZ Group 561 - 489 - 5315 APEI@mzgroup.us