SECURITIES AND EXCHANGE COMMISSION
Washington, D.C. 20549
FORM 6-K
REPORT OF FOREIGN PRIVATE ISSUER
Pursuant to Rule 13a-16 or 15d-16 of the
Securities Exchange Act of 1934
For the month of August 2025
Commission file number: 001-32749
FRESENIUS MEDICAL CARE AG
(Translation of registrant's name into English)
Else-Kröner Strasse 1
61346 Bad Homburg
Germany
(Address of principal executive offices)
Indicate by check mark whether the registrant files or will file annual reports under cover of Form 20-F or Form 40-F.
Form 20-F x Form 40-F ¨
On August 5, 2025, Fresenius Medical Care AG (the “Company”) issued a Press Release announcing its second quarter results for the period ending June 30, 2025. A copy of the Press Release is furnished as Exhibit 99.1 and the corresponding financial figures as Exhibit 99.2.
The attached Press Release contains non-GAAP financial measures. For purposes of Regulation G, a non-GAAP financial measure is a numerical measure of a company’s performance, financial position, or cash flows that either excludes or includes amounts that are not normally excluded or included in the most directly comparable measure calculated and presented in accordance with generally accepted accounting principles. To supplement our second quarter 2025 consolidated financial results presented in accordance with International Financial Reporting Standards, or IFRS, we have used non-GAAP financial measures, including (a) EBITDA, or operating income excluding interest, taxes, depreciation and amortization, (b) free cash flow, (c) net leverage ratio (ratio of net debt to adjusted EBITDA) and (d) results presented in constant currency and as adjusted for special items identified in the Press Release and associated tables. These non-GAAP measures are provided to enhance the user’s overall understanding of our current financial performance and our prospects for the future. In addition, because we have historically reported certain non-GAAP financial measures in our financial results, we believe the inclusion of these non-IFRS financial measures provides consistency and comparability in our financial reporting to prior periods for which these non-GAAP financial measures were previously reported. These non-GAAP financial measures should not be used as a substitute for or be considered superior to GAAP financial measures. Reconciliation of the non-GAAP financial measures to the most comparable IFRS financial measures are included in the attached Financial Statements. As the reconciliation of amounts stated in Constant Currency is inherent in the disclosure included in the Press Release, we believe that a separate reconciliation would not provide any additional benefit.
The Exhibits attached hereto, shall not be deemed “filed” for purposes of Section 18 of the Securities and Exchange Act of 1934 (the “Exchange Act”) or otherwise subject to the liabilities of that section, nor shall they be deemed incorporated by reference in any filing under the Securities Act of 1933 or the Exchange Act, regardless of any general incorporation language in such filing.
EXHIBITS
The following exhibits are being furnished with this Report:
| Exhibit 99.1 | Press release issued on August 5, 2025. |
| Exhibit 99.2 | Complete overview of the second quarter 2025 and first six months 2025. |
SIGNATURES
Pursuant to the requirements of the Securities Exchange Act of 1934, the Registrant has duly caused this report to be signed on its behalf by the undersigned thereunto duly authorized.
DATE: August 5, 2025
| Fresenius Medical Care AG | ||
| By: | /s/ Helen Giza | |
| Name: | Helen Giza | |
| Title: | Chief Executive Officer and Chair of the Management Board | |
| By: | /s/ Martin Fischer | |
| Name: | Martin Fischer | |
| Title: | Chief Financial Officer and member of the Management Board |
Exhibit 99.1

| Press Release | Media contact |
| Christine Peters | |
| T +49 160 60 66 770 | |
| Christine.Peters@FreseniusMedicalCare.com | |
| Contact for analysts and investors | |
| Dr. Dominik Heger | |
| T +49 6172 609 2525 | |
| Dominik.Heger@FreseniusMedicalCare.com | |
| www.freseniusmedicalcare.com |
Fresenius Medical Care delivers strong organic revenue growth and double-digit operating income growth in the second quarter of 2025
| ● | Strong organic revenue growth1 of 7% driven by all operating segments |
| ● | Stable U.S. same market treatment development driven by accelerating patient inflow |
| ● | FME25+ savings of EUR 58 million contributed to earnings |
| ● | Operating income2 grew by 13% at constant currency, further driving margin expansion |
| ● | Stable reported operating income and 20% increase in reported net income3 |
| ● | Operating cash flow improved strongly by 75%, net leverage ratio improved to 2.7x |
| ● | FY 2025 outlook confirmed |
| ● | First tranche of announced share buyback to be initiated in August |
Bad Homburg, Germany (August 5, 2025) – “In the second quarter of 2025, we further improved our operational performance as strong organic revenue growth and double-digit operating income growth put us fully on track to deliver our full year 2025 financial outlook”, said Helen Giza, Chief Executive Officer of Fresenius Medical Care AG. “Organic revenue growth of 7% was supported by all operating segments. The overall phasing of earnings in the first half of the year developed in line with our planning. Strong profitability gains in Care Enablement led to double-digit operating income growth. Care Delivery also drove improvements in operating income and margin, despite flat U.S. volume development. We remain encouraged by the strong and accelerating momentum in patient referrals that continued in the second quarter. However, this positive development in patient inflow was offset by higher-than-expected patient outflow driven by continued elevated mortality and a greater number of missed treatments following the severe flu season in the first months of the year. In the second half of the year, we expect to realize further significant operational and financial improvements.” Giza added: “Reflecting our confidence and the strong cash generation, we are about to initiate the first tranche of the announced share buyback in August.”
1 At constant currency, adjusted for certain reconciling items including revenue from acquisitions, closed or sold operations and differences in dialysis days
2 Adjusted for special items; for further details please see the reconciliation attached to the press release
3 Net income attributable to shareholders of Fresenius Medical Care AG Fresenius Medical Care, the world’s leading provider of products and services for individuals with renal disease, maintained strong focus on the execution of its strategic plan.
Page
Key figures Q2 and H1 2025 (unaudited)
| Q2 2025 | Q2 2024 | Growth | Growth | H1 2025 | H1 2024 | Growth | Growth | |||||||||||||||||||||||||
| EUR m | EUR m | yoy | yoy, cc | EUR m | EUR m | yoy | yoy, cc | |||||||||||||||||||||||||
| Revenue | 4,792 | 4,766 | 1 | % | 5 | % | 9,673 | 9,491 | 2 | % | 3 | % | ||||||||||||||||||||
| Operating income | 425 | 425 | 0 | % | 3 | % | 757 | 671 | 13 | % | 13 | % | ||||||||||||||||||||
| excl. special items2 | 476 | 436 | 9 | % | 13 | % | 933 | 838 | 11 | % | 12 | % | ||||||||||||||||||||
| Net income3 | 225 | 187 | 20 | % | 23 | % | 376 | 258 | 46 | % | 46 | % | ||||||||||||||||||||
| excl. special items2 | 268 | 212 | 26 | % | 30 | % | 514 | 400 | 28 | % | 29 | % | ||||||||||||||||||||
| Basic EPS (EUR) | 0.77 | 0.64 | 20 | % | 23 | % | 1.28 | 0.88 | 46 | % | 46 | % | ||||||||||||||||||||
| excl. special items2 | 0.91 | 0.72 | 26 | % | 30 | % | 1.75 | 1.36 | 28 | % | 29 | % | ||||||||||||||||||||
yoy = year-on-year, cc = at constant currency, EPS = earnings per share
Strategic execution on track
During the second quarter of 2025, the FME25+ transformation program continued its positive momentum, delivering EUR 58 million additional sustainable savings while related one-time costs, treated as special items, amounted to EUR 53 million. The Company confirms its full year FME25+ target of around EUR 180 million additional annual savings, totaling to EUR 1,050 million by year end 2027. The Company assumes related one-time costs of EUR 100 million to 150 million in 2025 and EUR 1,000 million to 1,050 million for the total program.
The Company continues the execution of its portfolio optimization plan to exit non-core and margin-dilutive assets. Special items associated with portfolio optimization amounted to negative EUR 6 million in the second quarter.
All transactions that were realized as part of Fresenius Medical Care’s portfolio optimization plan in 2024 are estimated to negatively impact full year 2025 Group revenue growth by around one percent. Related costs will be treated as special items in operating income.
As part of the new capital allocation framework, as presented at its recent Capital Markets Day, Fresenius Medical Care commits to return excess capital to shareholders. The Company announced an initial share buyback of EUR 1 billion within two years. The Company intends to initiate the first tranche of the program in August.
Page
Organic revenue growth1 across all segments
In the second quarter 2025, Group revenue increased by 1% (+5% at constant currency, +7% organic1) to EUR 4,792 million. Divestitures realized as part of the portfolio optimization plan affected the revenue development by -110 basis points.
Care Delivery revenue decreased by 3% (+1% at constant currency, +4% organic1) to EUR 3,381 million. Divestitures realized as part of the portfolio optimization plan affected the revenue development by -190 basis points.
In Care Delivery U.S., revenue decreased by 2% (+3% at constant currency, +3% organic1) to EUR 2,817 million. Reimbursement rate increases and a favorable payor mix development had a positive impact while exchange rates developed unfavorably. The severe flu season in the U.S. in the first months of the year resulted in significantly increased mortality compared to the elevated mortality level in the prior year. This impacted the treatment numbers in the second quarter and for the remainder of the year. The effect was partially offset in the second quarter by an accelerated number of patient new starts. Therefore, U.S. same market treatment growth came in flat year-on-year.
In Care Delivery International, revenue decreased by 8% (-8% at constant currency, +5% organic1) to EUR 564 million. The effect of closed or sold operations, mainly related to portfolio optimization, were partially offset by organic growth1. Same market treatment growth amounted to +1.7%.
Fresenius Medical Care now reports Value-Based Care, previously part of Care Delivery, as a standalone segment. The new segmentation reflects the growing importance of this business and the Company’s clear commitment towards enhancing financial reporting transparency. Value-Based Care revenue grew by 22% (+28% at constant currency, +28% organic1) to EUR 506 million, mainly driven by significantly higher number of member months due to contract expansion, while exchange rates developed unfavorably.
Care Enablement revenue declined by 1% (+3% at constant currency, +3% organic1) to EUR 1,348 million. Volume growth and continued positive pricing momentum was offset by unfavorable exchange rate effects.
Within Inter-segment eliminations4, revenue for services provided and products transferred between the operating segments at fair market value came in 10% below prior year at negative EUR 443 million (-6% at constant currency). In line with the new segment reporting, services provided by the Care Delivery segment for patients managed under the Value-Based Care segment are now being included within inter-segment eliminations.
4 The Company transfers products from the Care Enablement segment to the Care Delivery segment at fair market value. Services provided by the Care Delivery segment for patients managed under the Value-Based Care segment are also provided at fair market value. The associated internal revenues and expenses and all other consolidation of transactions are included within “Inter-segment eliminations”.
Page
In the first half 2025, Group revenue increased by 2% (+3% at constant currency, +6% organic¹) to EUR 9,673 million. Divestitures realized as part of the portfolio optimization plan impacted the revenue development by -190 basis points. Care Delivery revenue decreased by 2% (-1% at constant currency, +3% organic1) to EUR 6,828 million, with Care Delivery U.S. growing by 1% (+2% at constant currency, +2% organic1) to EUR 5,709 million and Care Delivery International decreasing by 14% (-14% at constant currency, +5% organic1) to EUR 1,119 million. Divestitures realized as part of the portfolio optimization plan affected the revenue development of Care Delivery by -300 basis points and the revenue development of Care Delivery International by -1,600 basis points. U.S. same market treatment growth came in flat while International same market treatment growth improved to 2.1%. Value-Based Care revenue increased by 24% (+25% at constant currency, +25% organic1) to EUR 1,035 million. Care Enablement revenue increased by 2% (+4% at constant currency, +4% organic1) to EUR 2,715 million. Inter-segment eliminations decreased by 7% (-6% at constant currency) to a deduction of EUR 905 million.
Double-digit operating income growth and further margin expansion
In the second quarter 2025, Group Operating income remained stable (+3% at constant currency) at EUR 425 million, resulting in a margin of 8.9% (Q2 2024: 8.9%). Operating income excluding special items increased by 9% (+13% at constant currency) to EUR 476 million, resulting in a margin2 of 9.9% (Q2 2024: 9.1%). Divestitures realized during the second quarter were neutral on operating income margin development.
Operating income in Care Delivery increased by 3% (+9% at constant currency) to EUR 346 million, resulting in a margin of 10.2% (Q2 2024: 9.6%). Operating income excluding special items came in flat (+5% at constant currency) at EUR 378 million, resulting in a margin2 of 11.2% (Q2 2024: 10.9%). Compared to previous year, operating income development was driven by positive price effects, the impact from phosphate binders, and savings from the FME25+ program. The development was negatively impacted by higher personnel expenses due to planned merit increases and unfavorable medical benefit costs as well as other inflationary cost increases.
Operating income in Value-Based Care amounted to a loss of EUR 9 million, compared to a loss of EUR 6 million in the prior year, resulting in a margin of -1.7% (Q2 2024: -1.5%). Identically, operating income excluding special items amounted to a loss of EUR 9 million, compared to a loss of EUR 6 million in the prior year, resulting in a margin2 of -1.7% (Q2 2024: -1.5%). The development was mainly driven by an unfavorable savings rate and inflation, while the effect from an increase in member months contributed positively.
Operating income in Care Enablement increased by 36% (+39% at constant currency) to EUR 89 million, resulting in a margin of 6.6% (Q2 2024: 4.8%). Operating income excluding special items significantly increased by 76% (+79% at constant currency) to EUR 117 million, resulting in a margin2 of 8.7% (Q2 2024: 4.9%). The improvement compared to the previous year’s quarter was mainly driven by globally higher volumes and positive pricing developments as well as savings from the FME25+ program. These positive effects were partially offset by inflationary cost increases, which developed in line with expectations.
Page
Operating income for Corporate amounted to EUR 7 million (Q2 2024: EUR 36 million). Humacyte remeasurements, treated as special items in the Corporate line, amounted to EUR 10 million and virtual power purchase agreements contributed EUR 15 million. Operating income excluding special items amounted to a loss of EUR 2 million (Q2 2024: EUR 5 million).
In the first half 2025, Group operating income increased by 13% (13% at constant currency) to EUR 757 million, resulting in a margin of 7.8% (H1 2024: 7.1%). Operating income excluding special items increased by 11% (+12% at constant currency) to EUR 933 million, resulting in a margin2 of 9.6% (H1 2024: 8.8%). Divestitures realized during the half year were neutral on operating income margin development. In Care Delivery, operating income increased by 33% (+34% at constant currency) to EUR 666 million, resulting in a margin of 9.8% (H1 2024: 7.2%). Operating income excluding special items increased by 4% (+5% at constant currency) to EUR 734 million, resulting in a margin2 of 10.7% (H1 2024: 10.1%). In Value-Based Care operating income amounted to a loss of EUR 6 million compared to an income of EUR 15 million in the prior year, resulting in a margin of -0.5% (H1 2024: 1.8%). Operating income excluding special items amounted to a loss of EUR 5 million compared to an income of EUR 15 million in the prior year, resulting in a margin2 of -0.5% (H1 2024: 1.8%). In Care Enablement, operating income increased by 35% (+36% at constant currency) to EUR 183 million, resulting in a margin of 6.8% (H1 2024: 5.1%). Operating income excluding special items increased by 62% (+63% at constant currency) to EUR 231 million, resulting in a margin2 of 8.5% (H1 2024: 5.4%).
Net income3 increased by 20% (+23% at constant currency) to EUR 225 million in the second quarter 2025. Net income excluding special items increased by 26% (+30% at constant currency) to EUR 268 million.
In the first half 2025, net income3 increased by 46% (+46% at constant currency) to EUR 376 million. Net income excluding special items increased by 28% (+29% at constant currency) to EUR 514 million.
Basic earnings per share (EPS) increased by 20% (+23% at constant currency) to EUR 0.77 in the second quarter 2025. Basic EPS excluding special items increased by 26% (+30% at constant currency) to EUR 0.91.
In the first half 2025, basic EPS increased by 46% (+46% at constant currency) to EUR 1.28. Basic EPS excluding special items increased by 28% (+29% at constant currency) to EUR 1.75.
Strong cash flow development and further improved net leverage ratio
In the second quarter 2025, Fresenius Medical Care improved operating cash flow by 75% to EUR 775 million (Q2 2024: EUR 442 million), resulting in a margin of 16.2% (Q2 2024: 9.3%). The operating cash flow development was mainly driven by a favorable working capital development and phasing of federal income tax payments in the U.S. In the first half 2025, operating cashflow improved by 65% to EUR 938 million (H1 2024: EUR 570 million), resulting in a margin of 9.7% (H1 2024: 6.0%).
Page
Free cash flow5 significantly increased by 117% to EUR 628 million in the second quarter 2025 (Q2 2024: EUR 289 million), resulting in a margin of 13.1% (Q2 2024: 6.1%). In the first half 2025, Fresenius Medical Care generated free cash flow of EUR 649 million (H1 2024: EUR 287 million), resulting in a margin of 6.7% (H1 2024: 3.0%).
Total net debt and lease liabilities were further reduced to EUR 9,315 million (Q2 2024: EUR 10,658 million). The net leverage ratio (net debt/EBITDA) improved to 2.7x in Q2 2025 (Q1 2025: 2.8x). Upon maturity, the Company redeemed a EUR 500 million bond on July 11, 2025.
Patients, clinics and employees
As of June 30, 2025, Fresenius Medical Care treated 300,339 patients in 3,676 dialysis clinics worldwide and had 112,445 employees (headcount) globally, compared to 112,035 employees as of March 31, 2025.
Outlook 2025 confirmed
Fresenius Medical Care confirms its outlook for fiscal 2025 and expects revenue growth to be positive to a low-single digit percent rate compared to prior year. The Company expects operating income excluding special items to grow by a high-teens to high-twenties percent rate compared to prior year.
The expected growth rates for 2025 are at constant currency, excluding special items in operating income. The 2024 basis for the revenue outlook is EUR 19,336 million and for the operating income outlook is EUR 1,797 million.
Media conference call
Fresenius Medical Care will host a media conference call to discuss the results of the second quarter and first half of 2025 today, August 5, 2025, at 9:30 a.m. CEST / 3:30 a.m. EDT. The media conference call is for journalists, who can register via the following link: Registration. Details on the media conference call are also available on the Fresenius Medical Care website in the “Media” section: media call. Attendees who would like to follow the presentation parallel to the conference call can register here for the webcast. The webcast will only be broadcasted in “listen only” mode.
Investor conference call
Fresenius Medical Care will host a conference call for analysts and investors to discuss the results of the second quarter 2025 today, August 5, 2025, at 2:00 p.m. CEST / 8:00 a.m. EDT. Details are available on the Fresenius Medical Care website in the “Investors” section. A replay and a transcript will be available shortly after the call.
Please refer to our statement of earnings included at the end of this press release and to the attachments as separate PDF files for a complete overview of the results of the second quarter 2025. Our form 6-K disclosure provides more details.
5 Net cash provided by / used in operating activities, after capital expenditures, before acquisitions, investments, and dividends
Page
About Fresenius Medical Care:
Fresenius Medical Care is the world's leading provider of products and services for individuals with renal diseases of which around 4.2 million patients worldwide regularly undergo dialysis treatment. Through its network of 3,676 dialysis clinics, Fresenius Medical Care provides dialysis treatments for approx. 300,000 patients around the globe. Fresenius Medical Care is also the leading provider of dialysis products such as dialysis machines or dialyzers. Fresenius Medical Care is listed on the Frankfurt Stock Exchange (FME) and on the New York Stock Exchange (FMS).
For more information visit the Company’s website at www.freseniusmedicalcare.com.
Disclaimer:
This release contains forward-looking statements that are subject to various risks and uncertainties. Actual results could differ materially
from those described in these forward-looking statements due to various factors, including, but not limited to, changes in business,
economic and competitive conditions, legal changes, regulatory approvals, results of clinical studies, foreign exchange rate fluctuations,
uncertainties in litigation or investigative proceedings, and the availability of financing. These and other risks and uncertainties
are detailed in Fresenius Medical Care’s reports filed with the U.S. Securities and Exchange Commission. Fresenius Medical Care
does not undertake any responsibility to update the forward-looking statements in this release.
Page
Page
Page
Page
Exhibit 99.2
Fresenius Medical Care AG
COMPLETE OVERVIEW OF THE SECOND QUARTER AND FIRST HALF YEAR 2025
August 5, 2025
Investor Relations
phone: +49 6172 609 2525
email: ir@freseniusmedicalcare.com
| Content: | ||
| Statement of earnings | page 2 | |
| Segment information | page 3 | |
| Balance sheet | page 4 | |
| Cash flow | page 5 | |
| Revenue development by segment | page 6 | |
| Key metrics | page 7 | |
| Reconciliation results excl. special items | page 8 | |
| Outlook 2025 | page 9 |
Disclaimer
This release contains forward-looking statements that are subject to various risks and uncertainties. Actual results could differ materially from those described in these forward-looking statements due to various factors, including, but not limited to, changes in business, economic and competitive conditions, legal changes, regulatory approvals, impacts related to COVID-19, results of clinical studies, foreign exchange rate fluctuations, uncertainties in litigation or investigative proceedings, and the availability of financing. These and other risks and uncertainties are detailed in Fresenius Medical Care AG’s reports filed with the U.S. Securities and Exchange Commission. Fresenius Medical Care AG does not undertake any responsibility to update the forward-looking statements in this release.
Rounding adjustments applied to individual numbers and percentages may result in these figures differing immaterially from their absolute values. Furthermore, totals and subtotals in tables may differ slightly from unrounded figures due to rounding in accordance with commercial rounding conventions.
Copyright by Fresenius Medical Care AG

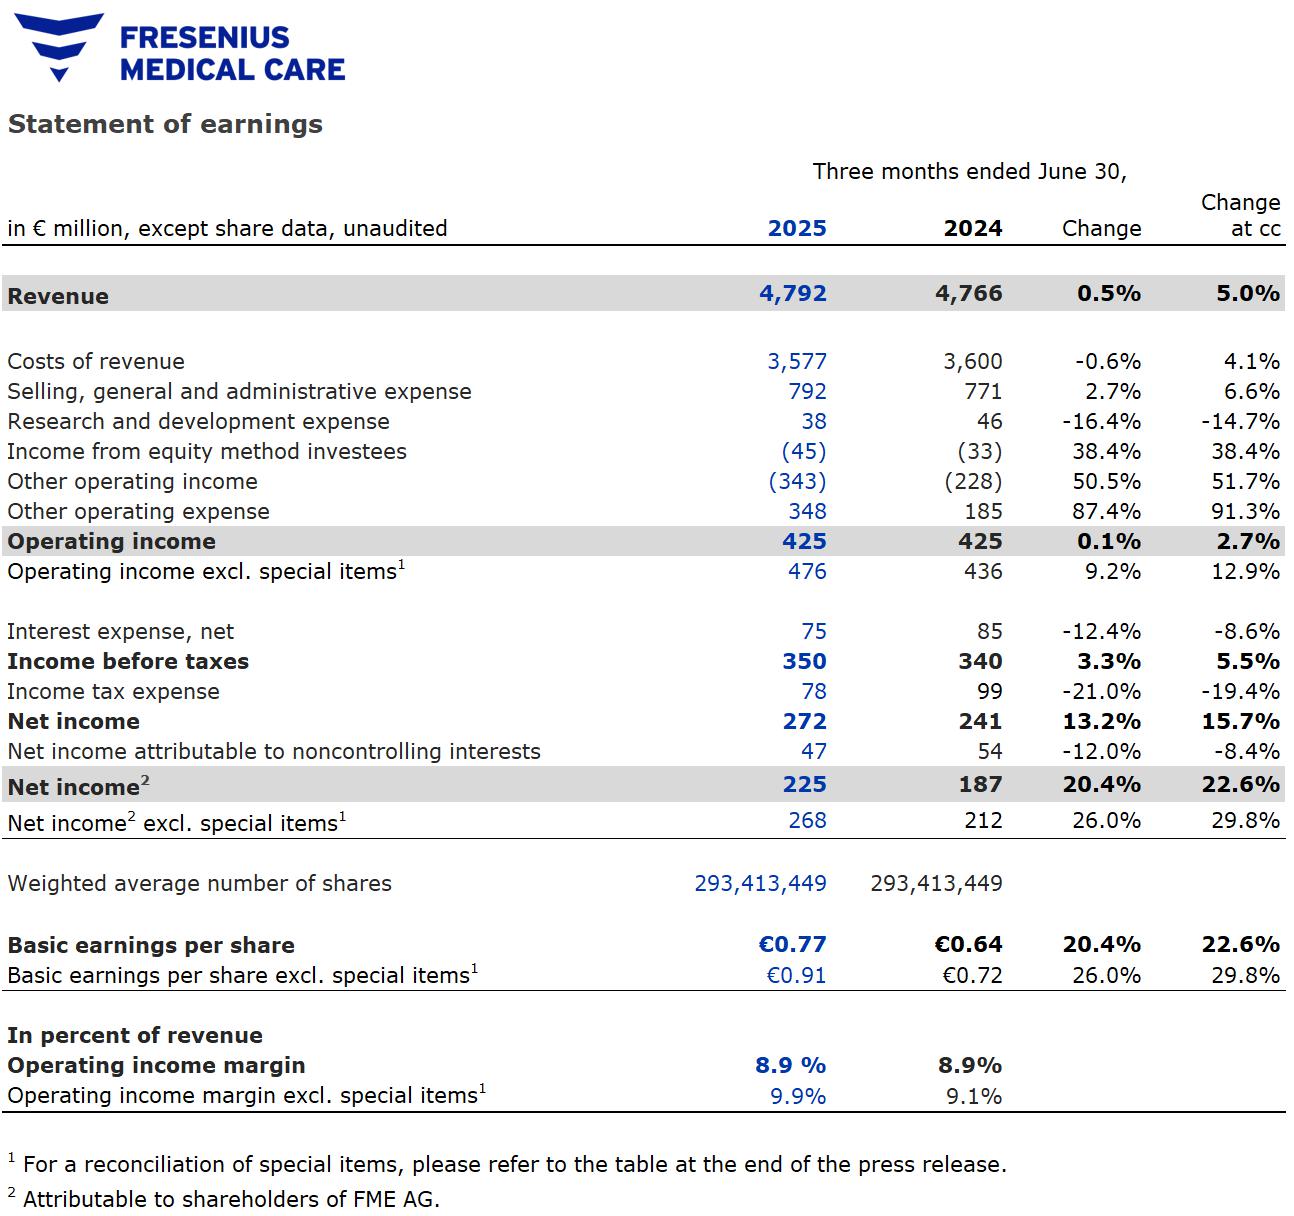
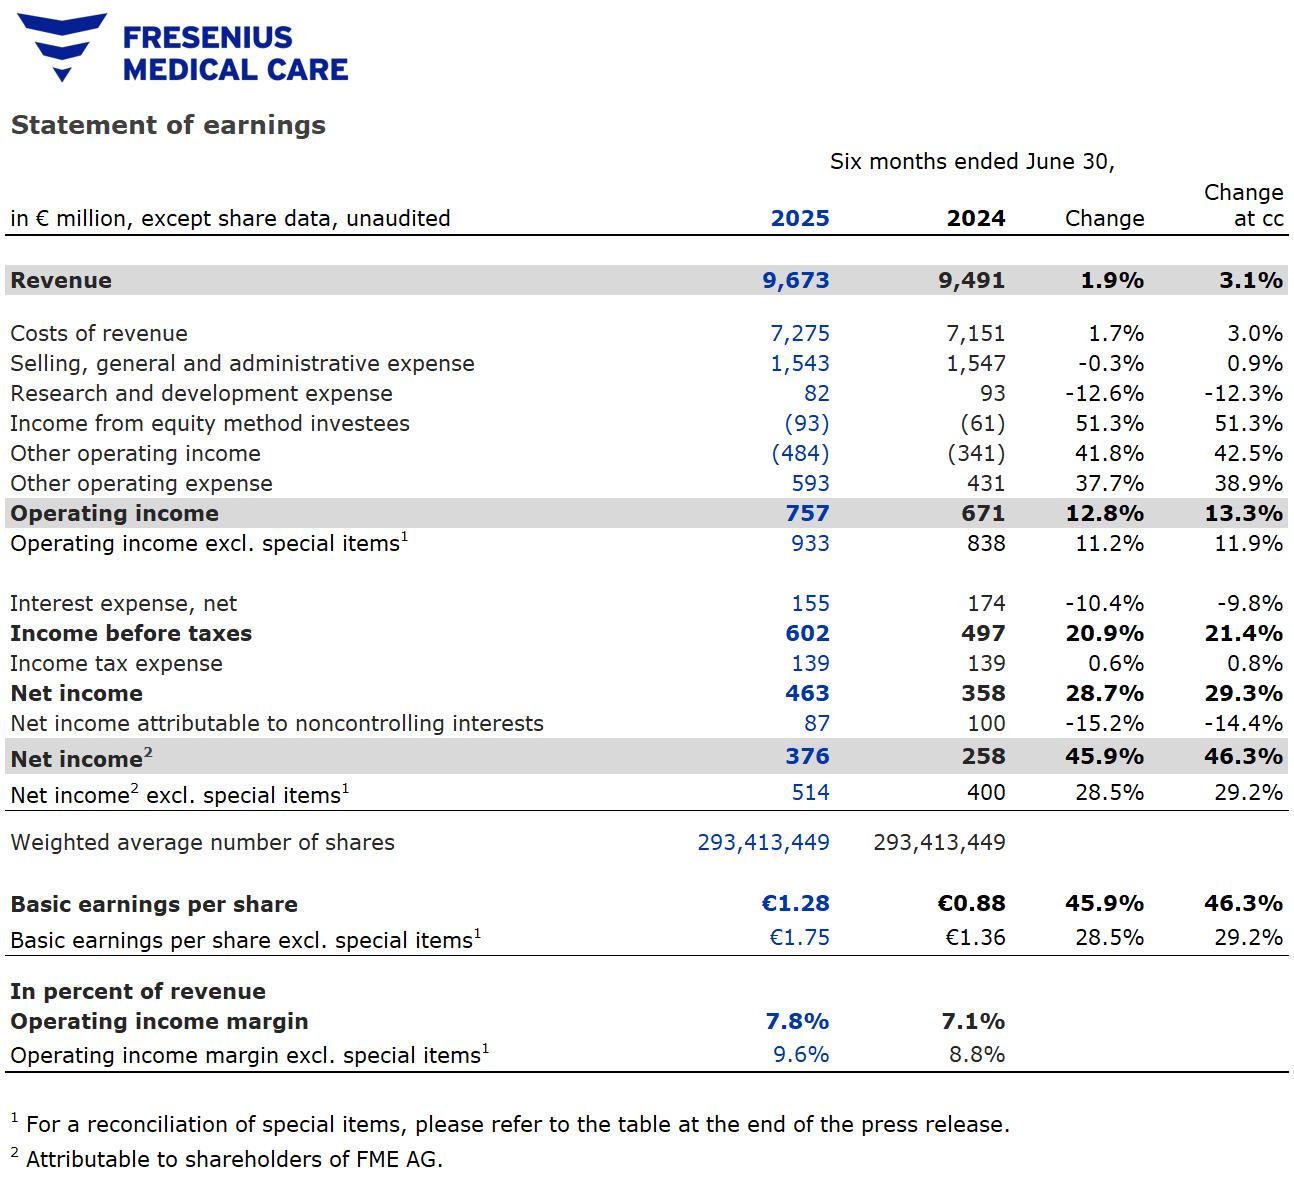
Statement of earnings
| Three months ended June 30, | Six months ended June 30, | |||||||||||||||||||||||||||||||
| in € million, except share data, unaudited | 2025 | 2024 | Change | Change at cc |
2025 | 2024 | Change | Change at cc |
||||||||||||||||||||||||
| Total revenue | 4,792 | 4,766 | 0.5 | % | 5.0 | % | 9,673 | 9,491 | 1.9 | % | 3.1 | % | ||||||||||||||||||||
| Costs of revenue | 3,577 | 3,600 | -0.6 | % | 4.1 | % | 7,275 | 7,151 | 1.7 | % | 3.0 | % | ||||||||||||||||||||
| Selling, general and administrative expense | 792 | 771 | 2.7 | % | 6.6 | % | 1,543 | 1,547 | -0.3 | % | 0.9 | % | ||||||||||||||||||||
| Research and development expense | 38 | 46 | -16.4 | % | -14.7 | % | 82 | 93 | -12.6 | % | -12.3 | % | ||||||||||||||||||||
| Income from equity method investees | (45 | ) | (33 | ) | 38.4 | % | 38.4 | % | (93 | ) | (61 | ) | 51.3 | % | 51.3 | % | ||||||||||||||||
| Other operating income | (343 | ) | (228 | ) | 50.5 | % | 51.7 | % | (484 | ) | (341 | ) | 41.8 | % | 42.5 | % | ||||||||||||||||
| Other operating expense | 348 | 185 | 87.4 | % | 91.3 | % | 593 | 431 | 37.7 | % | 38.9 | % | ||||||||||||||||||||
| Operating income | 425 | 425 | 0.1 | % | 2.7 | % | 757 | 671 | 12.8 | % | 13.3 | % | ||||||||||||||||||||
| Operating income excl. special items 1 | 476 | 436 | 9.2 | % | 12.9 | % | 933 | 838 | 11.2 | % | 11.9 | % | ||||||||||||||||||||
| Interest income | (22 | ) | (18 | ) | 23.1 | % | 29.4 | % | (37 | ) | (33 | ) | 10.2 | % | 14.3 | % | ||||||||||||||||
| Interest expense | 97 | 103 | -6.3 | % | -2.0 | % | 192 | 207 | -7.1 | % | -5.9 | % | ||||||||||||||||||||
| Interest expense, net | 75 | 85 | -12.4 | % | -8.6 | % | 155 | 174 | -10.4 | % | -9.8 | % | ||||||||||||||||||||
| Income before income taxes | 350 | 340 | 3.3 | % | 5.5 | % | 602 | 497 | 20.9 | % | 21.4 | % | ||||||||||||||||||||
| Income tax expense | 78 | 99 | -21.0 | % | -19.4 | % | 139 | 139 | 0.6 | % | 0.8 | % | ||||||||||||||||||||
| Net income | 272 | 241 | 13.2 | % | 15.7 | % | 463 | 358 | 28.7 | % | 29.3 | % | ||||||||||||||||||||
| Net income attributable to noncontrolling interests | 47 | 54 | -12.0 | % | -8.4 | % | 87 | 100 | -15.2 | % | -14.4 | % | ||||||||||||||||||||
| Net income attributable to shareholders of FME AG | 225 | 187 | 20.4 | % | 22.6 | % | 376 | 258 | 45.9 | % | 46.3 | % | ||||||||||||||||||||
| Net income attributable to shareholders of FME AG excl. special items 1 | 268 | 212 | 26.0 | % | 29.8 | % | 514 | 400 | 28.5 | % | 29.2 | % | ||||||||||||||||||||
| Weighted average number of shares | 293,413,449 | 293,413,449 | 293,413,449 | 293,413,449 | ||||||||||||||||||||||||||||
| Basic earnings per share | € | 0.77 | € | 0.64 | 20.4 | % | 22.6 | % | € | 1.28 | € | 0.88 | 45.9 | % | 46.3 | % | ||||||||||||||||
| Basic earnings per ADS | € | 0.38 | € | 0.32 | 20.4 | % | 22.6 | % | € | 0.64 | € | 0.44 | 45.9 | % | 46.3 | % | ||||||||||||||||
| Operating income | 425 | 425 | 0.1 | % | 2.7 | % | 757 | 671 | 12.8 | % | 13.3 | % | ||||||||||||||||||||
| Depreciation, amortization and impairment loss | 376 | 387 | -3.0 | % | 1.0 | % | 769 | 899 | -14.4 | % | -13.5 | % | ||||||||||||||||||||
| EBITDA | 801 | 812 | -1.4 | % | 1.8 | % | 1,526 | 1,570 | -2.8 | % | -2.1 | % | ||||||||||||||||||||
| In percent of revenue | ||||||||||||||||||||||||||||||||
| Operating income margin | 8.9 | % | 8.9 | % | 7.8 | % | 7.1 | % | ||||||||||||||||||||||||
| Operating income margin excl. special items 1 | 9.9 | % | 9.1 | % | 9.6 | % | 8.8 | % | ||||||||||||||||||||||||
| EBITDA margin | 16.7 | % | 17.0 | % | 15.8 | % | 16.5 | % | ||||||||||||||||||||||||
1 For a reconciliation of special items, please refer to the table on page 8.
| Statement of earnings | page |
August 5, 2025 |
Segment information
| Three months ended June 30, | Six months ended June 30, | |||||||||||||||||||||||||||||||
| unaudited | 2025 | 2024 | Change | Change at cc |
2025 | 2024 | Change | Change at cc |
||||||||||||||||||||||||
| Total | ||||||||||||||||||||||||||||||||
| Revenue in € million | 4,792 | 4,766 | 0.5 | % | 5.0 | % | 9,673 | 9,491 | 1.9 | % | 3.1 | % | ||||||||||||||||||||
| Operating income in € million | 425 | 425 | 0.1 | % | 2.7 | % | 757 | 671 | 12.8 | % | 13.3 | % | ||||||||||||||||||||
| Operating income in € million excl. special items 1 | 476 | 436 | 9.2 | % | 12.9 | % | 933 | 838 | 11.2 | % | 11.9 | % | ||||||||||||||||||||
| Operating income margin | 8.9 | % | 8.9 | % | 7.8 | % | 7.1 | % | ||||||||||||||||||||||||
| Operating income margin excl. special items 1 | 9.9 | % | 9.1 | % | 9.6 | % | 8.8 | % | ||||||||||||||||||||||||
| Days sales outstanding (DSO) 2 | 63 | 76 | ||||||||||||||||||||||||||||||
| Employees (headcount) | 112,445 | 113,639 | ||||||||||||||||||||||||||||||
| Care Delivery segment | ||||||||||||||||||||||||||||||||
| Revenue in € million | 3,381 | 3,481 | -2.9 | % | 1.3 | % | 6,828 | 6,962 | -1.9 | % | -1.1 | % | ||||||||||||||||||||
| Operating income in € million | 346 | 335 | 3.4 | % | 9.4 | % | 666 | 502 | 32.7 | % | 34.0 | % | ||||||||||||||||||||
| Operating income in € million excl. special items 1 | 378 | 379 | -0.3 | % | 5.3 | % | 734 | 704 | 4.1 | % | 5.2 | % | ||||||||||||||||||||
| Operating income margin | 10.2 | % | 9.6 | % | 9.8 | % | 7.2 | % | ||||||||||||||||||||||||
| Operating income margin excl. special items 1 | 11.2 | % | 10.9 | % | 10.7 | % | 10.1 | % | ||||||||||||||||||||||||
| Days sales outstanding (DSO) 2 | 58 | 75 | ||||||||||||||||||||||||||||||
| Value-Based Care segment | ||||||||||||||||||||||||||||||||
| Revenue in € million | 506 | 415 | 22.0 | % | 28.4 | % | 1,035 | 838 | 23.5 | % | 24.7 | % | ||||||||||||||||||||
| Operating income in € million | (9 | ) | (6 | ) | 44.9 | % | 44.2 | % | (6 | ) | 15 | n.a. | n.a. | |||||||||||||||||||
| Operating income in € million excl. special items 1 | (9 | ) | (6 | ) | 44.4 | % | 43.2 | % | (5 | ) | 15 | n.a. | n.a. | |||||||||||||||||||
| Operating income margin | -1.7 | % | -1.5 | % | -0.5 | % | 1.8 | % | ||||||||||||||||||||||||
| Operating income margin excl. special items 1 | -1.7 | % | -1.5 | % | -0.5 | % | 1.8 | % | ||||||||||||||||||||||||
| Days sales outstanding (DSO) 2 | 29 | 41 | ||||||||||||||||||||||||||||||
| Care Enablement segment | ||||||||||||||||||||||||||||||||
| Revenue in € million | 1,348 | 1,363 | -1.1 | % | 3.4 | % | 2,715 | 2,660 | 2.0 | % | 4.1 | % | ||||||||||||||||||||
| Operating income in € million | 89 | 65 | 36.4 | % | 39.1 | % | 183 | 135 | 35.3 | % | 35.9 | % | ||||||||||||||||||||
| Operating income in € million excl. special items 1 | 117 | 66 | 75.7 | % | 79.4 | % | 231 | 142 | 62.1 | % | 63.0 | % | ||||||||||||||||||||
| Operating income margin | 6.6 | % | 4.8 | % | 6.8 | % | 5.1 | % | ||||||||||||||||||||||||
| Operating income margin excl. special items 1 | 8.7 | % | 4.9 | % | 8.5 | % | 5.4 | % | ||||||||||||||||||||||||
| Days sales outstanding (DSO) 2 | 92 | 94 | ||||||||||||||||||||||||||||||
| Inter-segment eliminations 3 | ||||||||||||||||||||||||||||||||
| Revenue in € million | (443 | ) | (493 | ) | -10.1 | % | -6.1 | % | (905 | ) | (969 | ) | -6.7 | % | -5.9 | % | ||||||||||||||||
| Operating income in € million | (8 | ) | (5 | ) | 57.7 | % | 64.5 | % | (12 | ) | (3 | ) | 206.1 | % | 210.6 | % | ||||||||||||||||
| Operating income in € million excl. special items 1 | (8 | ) | (8 | ) | 4.6 | % | 9.1 | % | (12 | ) | (9 | ) | 24.3 | % | 26.2 | % | ||||||||||||||||
| Corporate | ||||||||||||||||||||||||||||||||
| Operating income in € million | 7 | 36 | -80.4 | % | n.a. | (74 | ) | 22 | n.a. | n.a. | ||||||||||||||||||||||
| Operating income in € million excl. special items 1 | (2 | ) | 5 | n.a. | n.a. | (15 | ) | (14 | ) | 3.4 | % | 24.5 | % | |||||||||||||||||||
1 For a reconciliation of special items, please refer to the table on page 8.
2 Includes receivables related to assets held for sale.
3 Services provided by the Care Delivery segment in the U.S. for patients managed under the Value-Based Care segment are provided at fair market value. The Company also transfers products from the Care Enablement segment to the Care Delivery segment at fair market value. The associated internal revenues and expenses and all other consolidation of transactions are included within “Inter-segment eliminations”.
cc = constant currency. Changes in revenue, operating income and net income attributable to shareholders of FME AG include the impact of changes in foreign currency exchange rates. We calculate and present these financial measures using both IFRS Accounting Standards and at constant exchange rates to show changes in these metrics and other items without giving effect to period-to-period currency fluctuations. Under IFRS Accounting Standards, amounts received in local (non-euro) currency are translated into euro at the average exchange rate for the period presented. Once we translate the local currency for the constant currency, we then calculate the change, as a percentage, of the current period using the prior period exchange rates versus the prior period. The single quarter results are calculated as the variance between the current year-to-date results less the preceding quarter’s year-to-date which makes the single quarter subject to further foreign exchange fluctuation. This resulting percentage is a non-IFRS measure referring to a change as a percentage at constant currency. These currency-adjusted financial measures are identifiable by the designated term "Constant Currency".
| Segment information | Page |
August 5, 2025 |
Balance sheet
| June 30, | December 31, | |||||||
| in € million, except for net leverage ratio, unaudited | 2025 | 2024 | ||||||
| Assets | ||||||||
| Cash and cash equivalents | 1,715 | 1,180 | ||||||
| Trade accounts and other receivables from unrelated parties | 3,196 | 3,367 | ||||||
| Inventories | 1,996 | 2,068 | ||||||
| Other current assets | 1,229 | 1,308 | ||||||
| Goodwill and intangible assets | 14,874 | 16,541 | ||||||
| Right-of-use assets | 3,209 | 3,612 | ||||||
| Other non-current assets | 5,072 | 5,491 | ||||||
| Total assets | 31,291 | 33,567 | ||||||
| Liabilities and equity | ||||||||
| Accounts payable to unrelated parties | 685 | 904 | ||||||
| Other current liabilities | 4,976 | 4,756 | ||||||
| Non-current liabilities | 11,303 | 12,138 | ||||||
| Total equity | 14,327 | 15,769 | ||||||
| Total liabilities and equity | 31,291 | 33,567 | ||||||
| Equity/assets ratio | 46 | % | 47 | % | ||||
| Debt and lease liabilities | ||||||||
| Short-term debt from unrelated parties | 24 | 2 | ||||||
| Current portion of long-term debt | 990 | 575 | ||||||
| Current portion of lease liabilities from unrelated parties | 564 | 616 | ||||||
| Current portion of lease liabilities from related parties | 26 | 25 | ||||||
| Long-term debt, less current portion | 6,327 | 6,261 | ||||||
| Lease liabilities from unrelated parties, less current portion | 3,017 | 3,412 | ||||||
| Lease liabilities from related parties, less current portion | 77 | 88 | ||||||
| Debt and lease liabilities included within liabilities directly associated with | ||||||||
| assets held for sale | 10 | 9 | ||||||
| Total debt and lease liabilities | 11,035 | 10,988 | ||||||
| Minus: Cash and cash equivalents 1 | (1,720 | ) | (1,185 | ) | ||||
| Total net debt and lease liabilities | 9,315 | 9,803 | ||||||
| Reconciliation of annualized adjusted EBITDA and net leverage ratio to the most directly comparable IFRS Accounting Standards financial measure | ||||||||
| Net income | 844 | 741 | ||||||
| Income tax expense | 317 | 316 | ||||||
| Interest income | (75 | ) | (72 | ) | ||||
| Interest expense | 392 | 407 | ||||||
| Depreciation and amortization | 1,509 | 1,536 | ||||||
| Adjustments 2 | 474 | 450 | ||||||
| Annualized adjusted EBITDA | 3,461 | 3,378 | ||||||
| Net leverage ratio | 2.7 | 2.9 | ||||||
1 Includes cash and cash equivalents included within assets held for sale.
2 Acquisitions and divestitures made for the last twelve months with a purchase price above a €50 M threshold as defined in the Syndicated Credit Facility (2025: -€3 M; 2024: -€23 M), non-cash charges, primarily related to pension expense (2025: €52 M; 2024: €52 M), impairment loss (2025: €104 M; 2024: €207 M) and special items, including costs related to the FME25+ Program (2025: €182 M; 2024: €164 M), Legacy Portfolio Optimization (2025: €77 M; 2024: €113 M), Legal Form Conversion Costs (2025: €8 M; 2024: €9 M) and Humacyte Remeasurements (2025: €54 M; 2024: -€72 M).
| Balance sheet | Page |
August 5, 2025 |
Cash flow statement
| Three months ended June 30, | Six months ended June 30, | |||||||||||||||
| in € million, unaudited | 2025 | 2024 | 2025 | 2024 | ||||||||||||
| Operating activities | ||||||||||||||||
| Net income | 272 | 241 | 463 | 358 | ||||||||||||
| Depreciation, amortization and impairment loss | 376 | 387 | 769 | 899 | ||||||||||||
| Change in trade accounts and other receivables from unrelated parties | 194 | (23 | ) | (113 | ) | (692 | ) | |||||||||
| Change in inventories | (16 | ) | (15 | ) | (87 | ) | (56 | ) | ||||||||
| Change in other working capital and non-cash items | (51 | ) | (148 | ) | (94 | ) | 61 | |||||||||
| Net cash provided by (used in) operating activities | 775 | 442 | 938 | 570 | ||||||||||||
| In percent of revenue | 16.2 | % | 9.3 | % | 9.7 | % | 6.0 | % | ||||||||
| Investing activities | ||||||||||||||||
| Purchases of property, plant and equipment and capitalized development costs | (154 | ) | (159 | ) | (300 | ) | (293 | ) | ||||||||
| Proceeds from sale of property, plant and equipment | 7 | 6 | 11 | 10 | ||||||||||||
| Capital expenditures, net | (147 | ) | (153 | ) | (289 | ) | (283 | ) | ||||||||
| Free cash flow | 628 | 289 | 649 | 287 | ||||||||||||
| In percent of revenue | 13.1 | % | 6.1 | % | 6.7 | % | 3.0 | % | ||||||||
| Acquisitions and investments, net of cash acquired, and purchases of intangible assets | (9 | ) | (6 | ) | (15 | ) | (6 | ) | ||||||||
| Investments in debt securities | 0 | 0 | (11 | ) | 0 | |||||||||||
| Proceeds from divestitures, net of cash disposed | 1 | 461 | 20 | 501 | ||||||||||||
| Proceeds from sale of debt securities | 13 | 21 | 45 | 42 | ||||||||||||
| Free cash flow after investing activities | 633 | 765 | 688 | 824 | ||||||||||||
| Cash flow | Page |
August 5, 2025 |
Revenue development by segment
| Same market | ||||||||||||||||||||||||
| Change | Organic | treatment | ||||||||||||||||||||||
| in € million, unaudited | 2025 | 2024 | Change | at cc | growth | growth 1 | ||||||||||||||||||
| Three months ended June 30, | ||||||||||||||||||||||||
| Total revenue | 4,792 | 4,766 | 0.5 | % | 5.0 | % | 6.7 | % | ||||||||||||||||
| Care Delivery segment | 3,381 | 3,481 | -2.9 | % | 1.3 | % | 3.6 | % | 0.5 | % | ||||||||||||||
| Thereof: U.S. | 2,817 | 2,867 | -1.7 | % | 3.4 | % | 3.4 | % | 0.0 | % | ||||||||||||||
| Thereof: International | 564 | 614 | -8.2 | % | -8.1 | % | 4.5 | % | 1.7 | % | ||||||||||||||
| Value-Based Care segment | 506 | 415 | 22.0 | % | 28.4 | % | 28.4 | % | ||||||||||||||||
| Care Enablement segment | 1,348 | 1,363 | -1.1 | % | 3.4 | % | 3.4 | % | ||||||||||||||||
| Inter-segment eliminations | (443 | ) | (493 | ) | -10.1 | % | -6.1 | % | ||||||||||||||||
| Thereof: Care Delivery segment | (118 | ) | (125 | ) | -5.1 | % | -0.3 | % | ||||||||||||||||
| Thereof: Care Enablement segment | (325 | ) | (368 | ) | -11.8 | % | -8.1 | % | ||||||||||||||||
| Six months ended June 30, | ||||||||||||||||||||||||
| Total revenue | 9,673 | 9,491 | 1.9 | % | 3.1 | % | 6.1 | % | ||||||||||||||||
| Care Delivery segment | 6,828 | 6,962 | -1.9 | % | -1.1 | % | 2.8 | % | 0.7 | % | ||||||||||||||
| Thereof: U.S. | 5,709 | 5,662 | 0.8 | % | 1.8 | % | 2.4 | % | 0.0 | % | ||||||||||||||
| Thereof: International | 1,119 | 1,300 | -14.0 | % | -13.8 | % | 4.7 | % | 2.1 | % | ||||||||||||||
| Value-Based Care segment | 1,035 | 838 | 23.5 | % | 24.7 | % | 24.7 | % | ||||||||||||||||
| Care Enablement segment | 2,715 | 2,660 | 2.0 | % | 4.1 | % | 4.1 | % | ||||||||||||||||
| Inter-segment eliminations | (905 | ) | (969 | ) | -6.7 | % | -5.9 | % | ||||||||||||||||
| Thereof: Care Delivery segment | (238 | ) | (241 | ) | -1.4 | % | -0.4 | % | ||||||||||||||||
| Thereof: Care Enablement segment | (667 | ) | (728 | ) | -8.4 | % | -7.7 | % | ||||||||||||||||
1 Same market treatment growth = organic growth less price effects
| Revenue development by segment | Page |
August 5, 2025 |
Key metrics
| Six months ended June 30, | ||||||||||||||||||||||||||||||||||||
| Care Delivery segment | Clinics | Patients | Treatments | |||||||||||||||||||||||||||||||||
| unaudited | 2025 | 2024 | Growth in % yoy |
2025 | 2024 | Growth in % yoy |
2025 | 2024 | Growth
in % yoy |
|||||||||||||||||||||||||||
| Total | 3,676 | 3,757 | -2 | % | 300,339 | 311,037 | -3 | % | 22,314,266 | 24,119,809 | -7 | % | ||||||||||||||||||||||||
| Thereof: U.S. | 2,627 | 2,628 | 0 | % | 206,259 | 206,306 | 0 | % | 15,327,129 | 15,412,884 | -1 | % | ||||||||||||||||||||||||
| Thereof: International | 1,049 | 1,129 | -7 | % | 94,080 | 104,731 | -10 | % | 6,987,137 | 8,706,925 | -20 | % | ||||||||||||||||||||||||
yoy = year-on-year
| Six months ended June 30, | ||||||||||||||||||||||||
| Value-Based Care segment U.S. | Member Months | Membership | ||||||||||||||||||||||
| Growth | Growth | |||||||||||||||||||||||
| unaudited | 2025 | 2024 | in % yoy |
2025 | 2024 | in % yoy |
||||||||||||||||||
| Total U.S. | 869,968 | 747,976 | 16 | % | 147,532 | 122,303 | 21 | % | ||||||||||||||||
| Key metrics | Page |
August 5, 2025 |
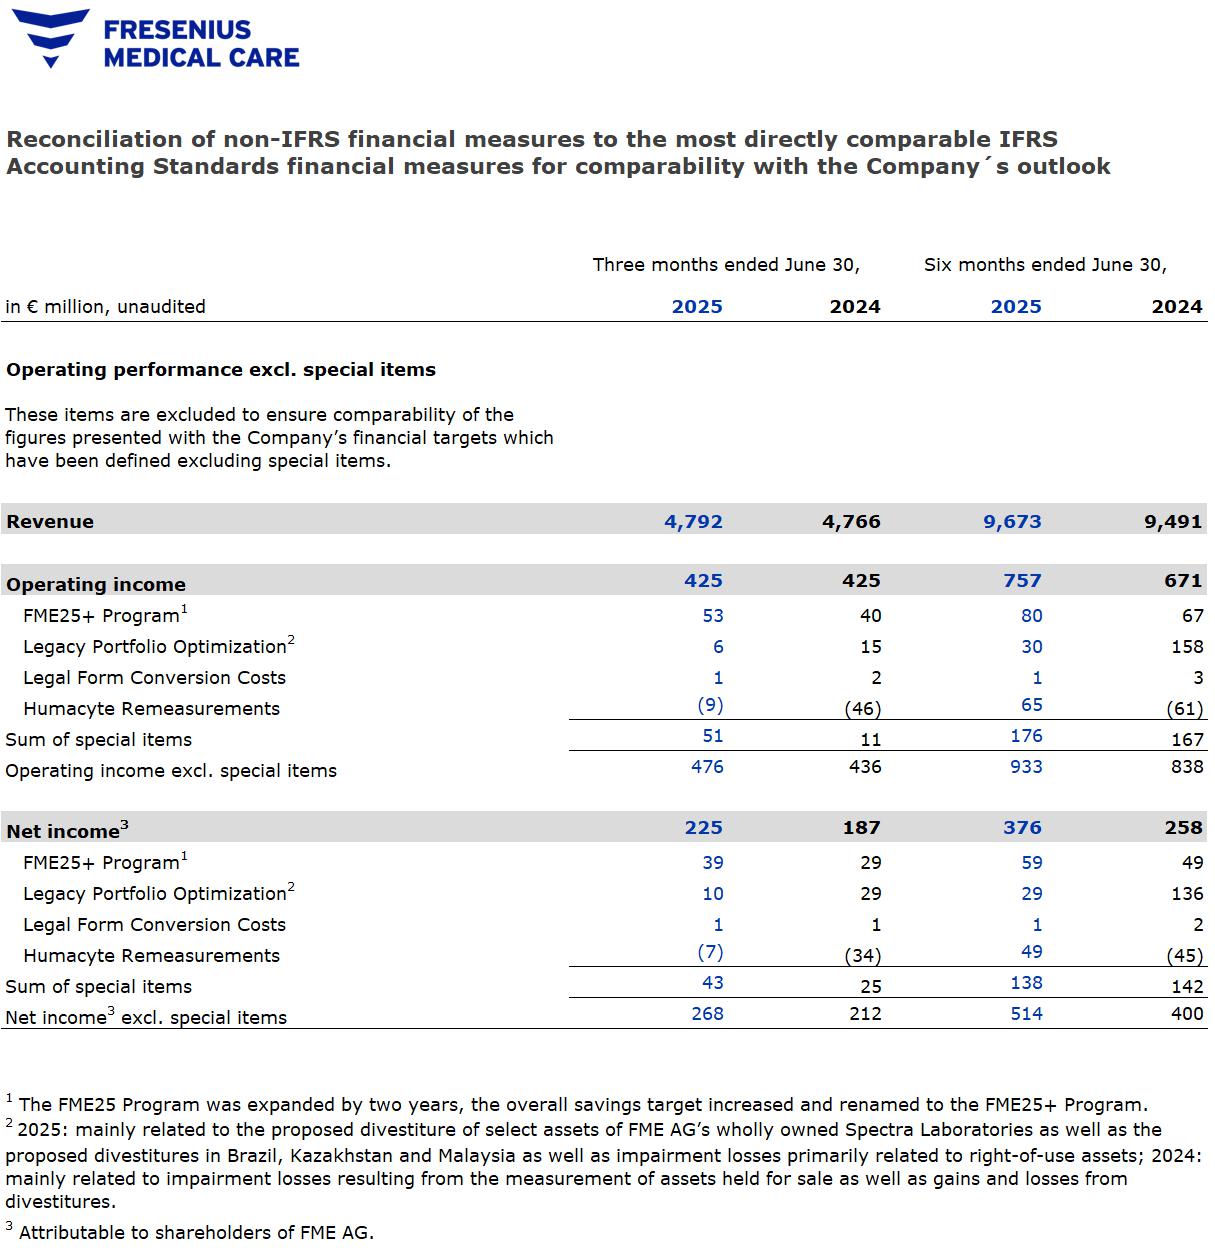
Reconciliation of non-IFRS financial measures to the most directly comparable IFRS Accounting Standards financial measures for comparability with the Company´s outlook
| Special items | Special items | |||||||||||||||||||||||||||||||||||||||||||||||||||||||||||||||||||||||
| in € million, except share data, unaudited | Results 2025 |
FME25+ Program1 |
Legacy Portfolio Optimization2 |
Legal Form Conversion Costs |
Humacyte Remeasurements |
Sum of special items |
Results 2025 excl. special items |
Currency translation effects |
Results 2025 excl. special items at cc |
Results 2024 |
FME25+ Program1 |
Legacy Portfolio Optimization2 |
Legal Form Conversion Costs |
Humacyte Remeasurements |
Sum of special items |
Results 2024 excl. special items |
Change excl. special items |
Change excl. special items at cc |
||||||||||||||||||||||||||||||||||||||||||||||||||||||
| Three months ended June 30, | ||||||||||||||||||||||||||||||||||||||||||||||||||||||||||||||||||||||||
| Total revenue | 4,792 | — | — | — | — | — | 4,792 | 215 | 5,007 | 4,766 | — | — | — | — | — | 4,766 | 0.5 | % | 5.0 | % | ||||||||||||||||||||||||||||||||||||||||||||||||||||
| Care Delivery segment | 3,381 | — | — | — | — | — | 3,381 | 147 | 3,528 | 3,481 | — | — | — | — | — | 3,481 | -2.9 | % | 1.3 | % | ||||||||||||||||||||||||||||||||||||||||||||||||||||
| Thereof: U.S. | 2,817 | — | — | — | — | — | 2,817 | 146 | 2,963 | 2,867 | — | — | — | — | — | 2,867 | -1.7 | % | 3.4 | % | ||||||||||||||||||||||||||||||||||||||||||||||||||||
| Thereof: International | 564 | — | — | — | — | — | 564 | 1 | 565 | 614 | — | — | — | — | — | 614 | -8.2 | % | -8.1 | % | ||||||||||||||||||||||||||||||||||||||||||||||||||||
| Value-Based Care segment | 506 | — | — | — | — | — | 506 | 26 | 532 | 415 | — | — | — | — | — | 415 | 22.0 | % | 28.4 | % | ||||||||||||||||||||||||||||||||||||||||||||||||||||
| Care Enablement segment | 1,348 | — | — | — | — | — | 1,348 | 61 | 1,409 | 1,363 | — | — | — | — | — | 1,363 | -1.1 | % | 3.4 | % | ||||||||||||||||||||||||||||||||||||||||||||||||||||
| Inter-segment eliminations | (443 | ) | — | — | — | — | — | (443 | ) | (19 | ) | (462 | ) | (493 | ) | — | — | — | — | — | (493 | ) | -10.1 | % | -6.1 | % | ||||||||||||||||||||||||||||||||||||||||||||||
| EBITDA | 801 | 49 | (2 | ) | 1 | (9 | ) | 39 | 840 | 31 | 871 | 812 | 34 | 23 | 2 | (46 | ) | 13 | 825 | 1.8 | % | 5.6 | % | |||||||||||||||||||||||||||||||||||||||||||||||||
| Total operating income | 425 | 53 | 6 | 1 | (9 | ) | 51 | 476 | 16 | 492 | 425 | 40 | 15 | 2 | (46 | ) | 11 | 436 | 9.2 | % | 12.9 | % | ||||||||||||||||||||||||||||||||||||||||||||||||||
| Care Delivery segment | 346 | 26 | 6 | — | — | 32 | 378 | 21 | 399 | 335 | 16 | 28 | — | — | 44 | 379 | -0.3 | % | 5.3 | % | ||||||||||||||||||||||||||||||||||||||||||||||||||||
| Value-Based Care segment | (9 | ) | 0 | — | — | — | 0 | (9 | ) | 0 | (9 | ) | (6 | ) | — | — | — | — | — | (6 | ) | 44.4 | % | 43.2 | % | |||||||||||||||||||||||||||||||||||||||||||||||
| Care Enablement segment | 89 | 27 | 0 | — | 1 | 28 | 117 | 3 | 120 | 65 | 24 | (11 | ) | 0 | (12 | ) | 1 | 66 | 75.7 | % | 79.4 | % | ||||||||||||||||||||||||||||||||||||||||||||||||||
| Inter-segment eliminations | (8 | ) | — | — | — | — | — | (8 | ) | (1 | ) | (9 | ) | (5 | ) | — | (3 | ) | — | — | (3 | ) | (8 | ) | 4.6 | % | 9.1 | % | ||||||||||||||||||||||||||||||||||||||||||||
| Corporate | 7 | 0 | — | 1 | (10 | ) | (9 | ) | (2 | ) | (7 | ) | (9 | ) | 36 | 0 | 1 | 2 | (34 | ) | (31 | ) | 5 | n.a. | n.a. | |||||||||||||||||||||||||||||||||||||||||||||||
| Interest expense, net | 75 | — | — | — | — | — | 75 | 3 | 78 | 85 | — | — | — | — | — | 85 | -12.4 | % | -8.6 | % | ||||||||||||||||||||||||||||||||||||||||||||||||||||
| Income tax expense | 78 | 14 | (4 | ) | 0 | (2 | ) | 8 | 86 | 4 | 90 | 99 | 11 | (14 | ) | 1 | (12 | ) | (14 | ) | 85 | 2.5 | % | 5.8 | % | |||||||||||||||||||||||||||||||||||||||||||||||
| Net income attributable to noncontrolling interests | 47 | — | — | — | — | — | 47 | 1 | 48 | 54 | — | — | — | — | — | 54 | -12.0 | % | -8.4 | % | ||||||||||||||||||||||||||||||||||||||||||||||||||||
| Net income3 | 225 | 39 | 10 | 1 | (7 | ) | 43 | 268 | 8 | 276 | 187 | 29 | 29 | 1 | (34 | ) | 25 | 212 | 26.0 | % | 29.8 | % | ||||||||||||||||||||||||||||||||||||||||||||||||||
| Basic earnings per share | € | 0.77 | € | 0.13 | € | 0.03 | € | 0.00 | € | (0.02 | ) | € | 0.14 | € | 0.91 | € | 0.03 | € | 0.94 | € | 0.64 | € | 0.10 | € | 0.10 | € | 0.00 | € | (0.12 | ) | € | 0.08 | € | 0.72 | 26.0 | % | 29.8 | % | ||||||||||||||||||||||||||||||||||
| Six months ended June 30, | ||||||||||||||||||||||||||||||||||||||||||||||||||||||||||||||||||||||||
| Total revenue | 9,673 | — | — | — | — | — | 9,673 | 116 | 9,789 | 9,491 | — | — | — | — | — | 9,491 | 1.9 | % | 3.1 | % | ||||||||||||||||||||||||||||||||||||||||||||||||||||
| Care Delivery segment | 6,828 | — | — | — | — | — | 6,828 | 58 | 6,886 | 6,962 | — | — | — | — | — | 6,962 | -1.9 | % | -1.1 | % | ||||||||||||||||||||||||||||||||||||||||||||||||||||
| Thereof: U.S. | 5,709 | — | — | — | — | — | 5,709 | 56 | 5,765 | 5,662 | — | — | — | — | — | 5,662 | 0.8 | % | 1.8 | % | ||||||||||||||||||||||||||||||||||||||||||||||||||||
| Thereof: International | 1,119 | — | — | — | — | — | 1,119 | 2 | 1,121 | 1,300 | — | — | — | — | — | 1,300 | -14.0 | % | -13.8 | % | ||||||||||||||||||||||||||||||||||||||||||||||||||||
| Value-Based Care segment | 1,035 | — | — | — | — | — | 1,035 | 10 | 1,045 | 838 | — | — | — | — | — | 838 | 23.5 | % | 24.7 | % | ||||||||||||||||||||||||||||||||||||||||||||||||||||
| Care Enablement segment | 2,715 | — | — | — | — | — | 2,715 | 55 | 2,770 | 2,660 | — | — | — | — | — | 2,660 | 2.0 | % | 4.1 | % | ||||||||||||||||||||||||||||||||||||||||||||||||||||
| Inter-segment eliminations | (905 | ) | — | — | — | — | — | (905 | ) | (7 | ) | (912 | ) | (969 | ) | — | — | — | — | — | (969 | ) | -6.7 | % | -5.9 | % | ||||||||||||||||||||||||||||||||||||||||||||||
| EBITDA | 1,526 | 77 | 16 | 1 | 65 | 159 | 1,685 | 13 | 1,698 | 1,570 | 60 | 50 | 3 | (61 | ) | 52 | 1,622 | 3.9 | % | 4.7 | % | |||||||||||||||||||||||||||||||||||||||||||||||||||
| Total operating income | 757 | 80 | 30 | 1 | 65 | 176 | 933 | 6 | 939 | 671 | 67 | 158 | 3 | (61 | ) | 167 | 838 | 11.2 | % | 11.9 | % | |||||||||||||||||||||||||||||||||||||||||||||||||||
| Care Delivery segment | 666 | 40 | 28 | — | — | 68 | 734 | 7 | 741 | 502 | 27 | 175 | — | — | 202 | 704 | 4.1 | % | 5.2 | % | ||||||||||||||||||||||||||||||||||||||||||||||||||||
| Value-Based Care segment | (6 | ) | 1 | — | — | — | 1 | (5 | ) | 0 | (5 | ) | 15 | — | — | — | — | — | 15 | n.a. | n.a. | |||||||||||||||||||||||||||||||||||||||||||||||||||
| Care Enablement segment | 183 | 38 | 2 | — | 8 | 48 | 231 | 2 | 233 | 135 | 40 | (11 | ) | 0 | (22 | ) | 7 | 142 | 62.1 | % | 63.0 | % | ||||||||||||||||||||||||||||||||||||||||||||||||||
| Inter-segment eliminations | (12 | ) | — | — | — | — | — | (12 | ) | (2 | ) | (14 | ) | (3 | ) | — | (6 | ) | — | — | (6 | ) | (9 | ) | 24.3 | % | 26.2 | % | ||||||||||||||||||||||||||||||||||||||||||||
| Corporate | (74 | ) | 1 | — | 1 | 57 | 59 | (15 | ) | (1 | ) | (16 | ) | 22 | 0 | 0 | 3 | (39 | ) | (36 | ) | (14 | ) | 3.4 | % | 24.5 | % | |||||||||||||||||||||||||||||||||||||||||||||
| Interest expense, net | 155 | — | — | — | — | — | 155 | 1 | 156 | 174 | — | — | — | — | — | 174 | -10.4 | % | -9.8 | % | ||||||||||||||||||||||||||||||||||||||||||||||||||||
| Income tax expense | 139 | 21 | 1 | 0 | 16 | 38 | 177 | 2 | 179 | 139 | 18 | 22 | 1 | (16 | ) | 25 | 164 | 8.4 | % | 9.0 | % | |||||||||||||||||||||||||||||||||||||||||||||||||||
| Net income attributable to noncontrolling interests | 87 | — | — | — | — | — | 87 | 0 | 87 | 100 | — | — | — | — | — | 100 | -15.2 | % | -14.4 | % | ||||||||||||||||||||||||||||||||||||||||||||||||||||
| Net income3 | 376 | 59 | 29 | 1 | 49 | 138 | 514 | 3 | 517 | 258 | 49 | 136 | 2 | (45 | ) | 142 | 400 | 28.5 | % | 29.2 | % | |||||||||||||||||||||||||||||||||||||||||||||||||||
| Basic earnings per share | € | 1.28 | € | 0.20 | € | 0.10 | € | 0.00 | € | 0.17 | € | 0.47 | € | 1.75 | € | 0.01 | € | 1.76 | € | 0.88 | € | 0.16 | € | 0.46 | € | 0.01 | € | (0.15 | ) | € | 0.48 | € | 1.36 | 28.5 | % | 29.2 | % | |||||||||||||||||||||||||||||||||||
1 The FME25 Program was expanded by two years, the overall savings target increased and renamed to the FME25+ Program.
2 2025: mainly related to the proposed divestiture of select assets of FME AG’s wholly owned Spectra Laboratories as well as the proposed divestitures in Brazil, Kazakhstan and Malaysia as well as impairment losses primarily related to right-of-use assets; 2024: mainly related to impairment losses resulting from the measurement of assets held for sale as well as gains and losses from divestitures.
3 Attributable to shareholders of FME AG.
| Reconciliation results excl. special items | Page |
August 5, 2025 |
Outlook 2025
| Results 2024 | Outlook
2025 (at Constant Currency) |
|||||
| Revenue1 | € | 19,336 M | Positive to a low-single digit percentage rate growth | |||
| Operating income1 | € | 1,797 M | High-teens to high-twenties percentage rate growth | |||
1 Outlook 2025 is based on the assumptions outlined in the earnings release for the fourth quarter and full year of 2024 and excludes special items. Special items include the costs related to the FME25+ Program, the impacts from Legacy Portfolio Optimization, the Legal Form Conversion Costs, the Humacyte Remeasurements and other effects that are unusual in nature and have not been foreseeable or not foreseeable in size or impact at the time of providing the outlook. The growth rates are based on the results 2024 excluding the costs related to the FME25+ Program (€180 M for operating income), the impacts from Legacy Portfolio Optimization (€288 M for operating income), the Legal Form Conversion Costs (€9 M for operating income) and the Humacyte Remeasurements (-€72 M for operating income).
| Outlook 2025 | Page |
August 5, 2025 |