UNITED STATES
SECURITIES AND EXCHANGE COMMISSION
Washington, D.C. 20549
FORM 6-K
REPORT OF FOREIGN PRIVATE ISSUER
PURSUANT TO RULE 13a-16 OR 15d-16
UNDER THE SECURITIES EXCHANGE ACT OF 1934
For the month of July 2025
Commission File Number 001-42611
ISOENERGY LTD.
(Exact name of Registrant as specified in its charter)
N/A
(Translation of Registrant’s name into English)
217 Queen Street West, Suite 401
Toronto, Ontario
M5V 0R2
Tel: 1-833-572-2333
(Address of principal executive offices)
Indicate by check mark whether the registrant files or will file annual reports under cover of Form 20-F or Form 40-F:
Form 20-F ¨ Form 40-F x
INCORPORATION BY REFERENCE
The exhibit to this report on Form 6-K is incorporated by reference into, and as an exhibit to, the Registration Statements on Form F-10 (Commission File No. 333-287236) and Form S-8 (Commission File No. 333-287876) of the registrant, IsoEnergy Ltd.
EXHIBIT INDEX
| Exhibit Number | Description |
SIGNATURES
Pursuant to the requirements of the Securities Exchange Act of 1934, as amended, the registrant has duly caused this report to be signed on its behalf by the undersigned, thereunto duly authorized.
| ISOENERGY LTD. | ||
| Date: July 31, 2025 | By: | /s/ Graham du Preez |
| Name: Graham du Preez | ||
| Title: Chief Financial Officer | ||
Exhibit 99.1

MANAGEMENT’S DISCUSSION AND ANALYSIS
For the Three and Six Months Ended June 30, 2025 and 2024
Dated: July 31, 2025
ISOENERGY LTD.
For the three and six months ended June 30, 2025 and 2024
GENERAL INFORMATION
This Management’s Discussion and Analysis (“MD&A”) is management’s interpretation of the results and financial condition of IsoEnergy Ltd. and its subsidiaries (“IsoEnergy” or the “Company”) for the three and six months ended June 30, 2025 and includes events up to the date of this MD&A. This discussion should be read in conjunction with the unaudited condensed consolidated interim financial statements for the three and six months ended June 30, 2025 and 2024 and the notes thereto (the “Interim Financial Statements”) and other corporate filings, including the Company’s audited consolidated financial statements for the years ended December 31, 2024 and 2023 and the notes thereto (the “Annual Financial Statements”) and Annual Information Form for the year ended December 31, 2024 (the “AIF”), which are available under the Company’s profile on SEDAR+ at www.sedarplus.ca and in the Company’s initial registration Form 40-F available on EDGAR at www.sec.gov. All dollar figures stated herein are expressed in Canadian dollars and referenced as “$”, unless otherwise specified. Monetary amounts expressed in US dollars and Australian dollars are referenced as “US$” and “AUD$”, respectively. This MD&A contains forward-looking information. Please see “Note Regarding Forward-Looking Information” for a discussion of certain of the risks, uncertainties and assumptions used to develop the Company’s forward-looking information.
Technical Disclosure
All scientific and technical information in this MD&A has been reviewed and approved by Dr. Dan Brisbin, P.Geo., Ph.D., IsoEnergy’s Vice-President, Exploration. Dr. Brisbin is a “Qualified Person” for the purposes of National Instrument 43-101 - Standards of Disclosure for Mineral Projects (“NI 43-101”). Dr. Brisbin has verified the data disclosed, including sampling, analytical and test data.
All chemical analyses disclosed in this MD&A were completed for the Company by SRC Geoanalytical Laboratories in Saskatoon, Saskatchewan, which is independent of the Company.
All references in this MD&A to “Mineral Resource”, “Inferred Mineral Resource”, “Indicated Mineral Resource”, and “Mineral Reserve” have the meanings ascribed to those terms by the Canadian Institute of Mining, Metallurgy and Petroleum, as the CIM Definition Standards on Mineral Resources and Mineral Reserves adopted by CIM Council, as amended.
For additional information regarding the Company’s 100% owned Larocque East, Tony M, and Radio Projects and its 50% owned Thorburn Lake Project, including its Quality Assurance and Quality Control (“QA/QC”) and data verification procedures, please see the AIF and corresponding technical reports entitled “Technical Report on the Larocque East Project, Northern Saskatchewan, Canada” prepared by SLR Consulting (Canada) Ltd. and dated effective July 8, 2022 (the “Larocque East Technical Report”), “Technical Report on the Tony M Mine, Utah, USA, Report for NI 43-101” prepared by SLR International Corporation and dated effective September 9, 2022 (the “Tony M Technical Report”), “Technical Report for the Radio Project, Northern Saskatchewan” prepared by Tim Maunula, P. Geo. and dated effective August 19, 2016 and “Technical Report for the Thorburn Lake Project, Northern Saskatchewan” prepared by Tim Maunula, P. Geo. and dated effective September 26, 2016, all of which are available under the Company’s profile on SEDAR+ at www.sedarplus.ca.
Each of the Mineral Resource estimates with respect to the properties of IsoEnergy contained in this MD&A, except for the Larocque East Project and the Tony M Mine, are considered to be “historical estimates” as defined under NI 43-101 and are not considered to be current by IsoEnergy. See “Historical Estimates” for additional details.
|
|
ISOENERGY LTD.
For the three and six months ended June 30, 2025 and 2024
Differences in United States and Canadian Reporting Practices
This MD&A has been prepared in accordance with the requirements of the securities laws in effect in Canada, which differ in certain material respects from the disclosure requirements promulgated by the Securities and Exchange Commission (the “SEC”). For example, the terms “mineral reserve”, “proven mineral reserve”, “probable mineral reserve”, “mineral resource”, “measured mineral resource”, “indicated mineral resource” and “inferred mineral resource” are Canadian mining terms as defined in accordance with NI 43-101 and the Canadian Institute of Mining, Metallurgy and Petroleum (the “CIM”) - CIM Definition Standards on Mineral Resources and Mineral Reserves, adopted by the CIM Council, as amended. These definitions differ from the definitions in the disclosure requirements promulgated by the SEC. Accordingly, information contained in this MD&A may not be comparable to similar information made public by U.S. companies reporting pursuant to SEC disclosure requirements. The Company prepares its financial statements, which are referred to in this MD&A, in accordance with International Financial Reporting Standards (“IFRS”) as issued by the International Accounting Standards Board (“IASB”), and the audit of its annual financial statements is subject to Canadian auditing and auditor independence standards.
Industry and Economic Factors that May Affect the Business
The business of mining for minerals involves a high degree of risk. IsoEnergy is an exploration and development company and is subject to risks and challenges similar to companies in a comparable stage and industry. These risks include, but are not limited to, the challenges of securing adequate capital; exploration, development and operational risks inherent in the mining industry; changes in government policies and regulations; the ability to obtain the necessary permitting; as well as global economic and uranium price volatility; all of which are uncertain.
As with other companies involved with mineral exploration and development, the Company is subject to cost inflation on exploration drilling and development activities and the Company may experience difficulty and / or delays in securing goods (including spare parts) and services from time-to-time.
The underlying value of the Company’s exploration and development assets is dependent upon the existence and economic recovery of Mineral Reserves and is subject to, among others, the risks and challenges identified above. Changes in future conditions could require material write-downs of the carrying value of the Company’s exploration and development assets. The Company does not have any current Mineral Reserves.
In particular, the Company does not generate revenue. As a result, IsoEnergy continues to be dependent on third party financing to continue exploration and development activities on the Company’s properties. Accordingly, the Company’s future performance will be most affected by its access to financing, whether debt, equity or other means. Access to such financing, in turn, is affected by general economic conditions, the price of uranium, exploration risks and the other factors some of which are described in the section entitled “Risk Factors” included below.
ABOUT ISOENERGY
IsoEnergy was incorporated on February 2, 2016 under the Business Corporations Act (British Columbia) to acquire certain exploration assets of NexGen Energy Ltd. (“NexGen”). On October 19, 2016, IsoEnergy was listed on the TSX Venture Exchange (“TSXV”). On June 20, 2024, the Company completed its continuance from the province of British Columbia to the province of Ontario under the same name. The Company’s common shares were delisted from the TSXV and began trading on the Toronto Stock Exchange (the “TSX”) on July 8, 2024 under the trading symbol “ISO”. On March 20, 2025, the Company completed the consolidation of its issued and outstanding common shares on the basis of one post-consolidation common share for every four pre-consolidation common shares (the “Share Consolidation”). Throughout this MD&A, references to common shares, stock options, restricted share units and per share amounts are restated to post-consolidation amounts where applicable. The Share Consolidation was implemented in connection with the Company’s application to list its common shares on the NYSE American LLC (the “NYSE American”). On May 5, 2025, the Company’s common shares began trading on the NYSE American under the trading symbol “ISOU”. As of the date hereof, NexGen holds approximately 30.9% of IsoEnergy’s outstanding common shares.
|
|
ISOENERGY LTD.
For the three and six months ended June 30, 2025 and 2024
The principal business activity of IsoEnergy is the acquisition, exploration and development of uranium mineral properties in Canada, the United Sates, and Australia.
* Equity holdings include investments in NexGen, Premier American Uranium Inc., Atha Energy Corp., Purepoint Uranium Inc., and Future Fuels Inc., based on market close of July 30, 2025, and Jaguar Uranium Inc. and Royal Uranium Inc. at cost translated to Canadian dollars using the Bank of Canada USD:CAD exchange rate on the same date.
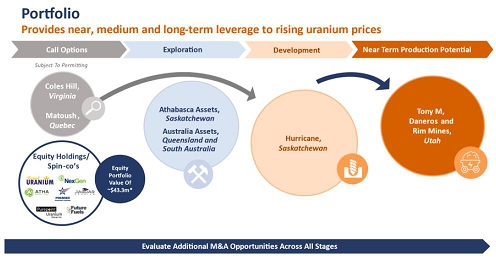
The Company is currently advancing it’s Larocque East Project in the Athabasca Basin, Saskatchewan, Canada, which is home to the Hurricane deposit (“Hurricane” or “Hurricane Deposit”), which has the world's highest grade published Indicated uranium Mineral Resource – 48.6 million pounds of U3O8 at an average grade of 34.5% contained in 63,800 tonnes. The Company also holds a portfolio of permitted, past-producing conventional uranium mines in Utah with toll milling agreements in place with Energy Fuels Inc. (“Energy Fuels”). These mines are currently on stand-by, ready for a potential restart as market conditions permit, positioning IsoEnergy as a near-term uranium producer. The Company also has a 50% interest in a joint venture formed on December 18, 2024 with Purepoint Uranium Group Inc. (“Purepoint Uranium”), with respect to a portfolio of exploration projects in the Athabasca Basin (the “Purepoint Joint Venture”). The Company’s projects are at varying stages of exploration and development, providing near, medium, and long-term leverage to rising uranium prices. None of the Company’s projects are currently in production and no decisions have been made to bring any of the Company’s projects to the production stage.
IsoEnergy’s uranium mineral properties are reflected below.

| 1. | For additional information please refer to the Tony M Technical Report. | |
| 2. | This estimate is a “historical estimate” as defined under NI 43-101. A Qualified Person has not done sufficient work to classify the historical estimate as current mineral resources and the Company is not treating the historical estimate as current mineral resources. See “Historical Estimates” below for additional details. | |
| 3. | For additional information please refer to the Larocque East Technical Report. | |
| 4. | Jurisdiction rankings are based on the Investment Attractiveness Index from the Fraser Institute Annual Survey of Mining Companies 2024. |
As an exploration stage company, IsoEnergy does not have revenues and is expected to generate operating losses. As of June 30, 2025, the Company had cash and cash equivalents of $84,666,913, an accumulated deficit of $99,326,901 and adjusted working capital of $124,922,827 (as defined in “Non-IFRS Financial Measures” below).
|
|
ISOENERGY LTD.
For the three and six months ended June 30, 2025 and 2024
YEAR-TO-DATE 2025 HIGHLIGHTS
| · | Exploration update in the Athabasca Basin |
A total of 6,396 metres of drilling in 17 diamond drill holes were successfully completed early in 2025 along the Larocque East Project focused on the Larocque regional geological-geophysical corridor (“Larocque Trend”), which hosts the Hurricane Deposit (Figure 4). Drilling intersected strongly elevated radioactivity along the eastern extensions of the Hurricane Deposit’s Main and South trends (Figure 2), as well as at Area D, 2.8 kilometres east (Figure 4), highlighting the potential for additional uranium zones near the deposit and along the Larocque Trend. The summer 2025 drill program at Larocque East has commenced and is expected to encompass a total of 20 diamond drill holes for 7,600 metres of drilling following up on encouraging results from the winter 2025 program. This will be followed by 3,400 metres of drilling in four holes on the Hawk project. The inaugural drill program at the Dorado project, operated through the Purepoint Joint Venture, focused on the Q48 target and intersected uranium mineralization in four holes and led to the recent discovery of the Nova zone.
Additional work has been completed or is planned to be completed in summer 2025 to advance a pipeline of exploration targets across the Athabasca Basin, including helicopter-borne MobileMT surveys at the East Rim project, ground electromagnetic (“EM”) and Ambient Noise Tomography (“ANT”) surveys on the Hawk project, and prospecting work at the Bulyea River, East Rim, and Evergreen projects.
| · | Commencement of key work programs at Tony M |
The Company has initiated several work programs at the Tony M Mine that are intended to optimize operational readiness and reduce future production costs. Technical studies are underway, including ore sorting and High-Pressure Slurry Ablation (“HPSA”) testing programs, as well as an enhanced evaporation study. Multiple mining methods are being evaluated to optimize future production scenarios. The Tony M Mine remains fully permitted and these efforts will inform a potential production decision targeted for later in 2025.
| · | Exercise of put option on Joint Venture Agreement with Purepoint Uranium |
On January 14, 2025, the Company exercised a put option to sell to Purepoint Uranium 10% of the Company’s initial participation interest in the Purepoint Joint Venture in exchange for 4,000,000 common shares of Purepoint Uranium. After the exercise of the put option, each of the Company and Purepoint Uranium holds a 50% interest in the Purepoint Joint Venture.
| · | Terminated transaction with Anfield Energy |
On January 14, 2025, Anfield Energy Inc. (“Anfield Energy”) provided IsoEnergy with notice of termination of the previously announced arrangement agreement pursuant to which, among other things, IsoEnergy agreed to acquire all the issued and outstanding common shares of Anfield Energy by way of a court-approved plan of arrangement (the “AEC Arrangement”). IsoEnergy had provided a bridge loan (“Bridge Loan”) to Anfield Energy in the form of a promissory note of approximately $6.0 million and an indemnity for up to US$3.0 million in principal (the “Indemnity”) with respect to certain of Anfield Energy’s property obligations. On January 21, 2025, the Bridge Loan was fully repaid, including accrued interest at 15% per annum. On March 3, 2025, the Indemnity was released in full.
| · | Sale of Mountain Lake property |
On February 14, 2025, the Company completed the sale of its Mountain Lake property located in Nunavut pursuant to an asset purchase agreement with Future Fuels Inc. (“Future Fuels”). As consideration for this sale, the Company received 12,500,000 common shares of Future Fuels on closing, a 2% NSR payable on all future uranium production from Mountain Lake, of which half can be repurchased by Future Fuels for $1.0 million, and a 1% NSR payable on all future uranium production on all other Future Fuels properties. The Company is entitled to receive an additional 2,500,000 common shares of Future Fuels on the earliest date practicable such that it will not result in the Company owning or controlling more than 19.99% of all outstanding common shares of Future Fuels.
|
|
ISOENERGY LTD.
For the three and six months ended June 30, 2025 and 2024
| · | Flow Through Financing and Concurrent Private Placement |
On February 28, 2025, the Company closed a financing with a syndicate of underwriters (the “Underwriters”) under a bought deal financing arrangement (the “February 2025 Flow-Through Financing”) whereby the Company issued 1,333,825 “flow-through” common shares at a price of $15.00 per share, for gross proceeds of approximately $20.0 million. The Underwriters were paid a cash commission of 6.0% of the gross proceeds of the February 2025 Flow-Through Financing.
The proceeds from the February 2025 Flow-Through Financing are required to be spent on eligible “Canadian exploration expenses” that will qualify as “flow-through critical mineral mining expenditures” (in each case as defined in the Income Tax Act (Canada) (the “Tax Act”)) by December 31, 2026 and the Company is required to renounce the full amount of the gross proceeds of the financing to the subscribers of the flow-through shares no later than December 31, 2025.
Concurrent with the February 2025 Flow-Through Financing, the Company completed a non-brokered private placement with NexGen to issue 625,000 common shares at a price of $10.00 per share for total gross proceeds of approximately $6.3 million (the “Concurrent Private Placement”). The Concurrent Private Placement enabled NexGen to maintain its pro-rata ownership interest in the Company at approximately 31.8%.
| · | Share Consolidation |
On March 20, 2025, the Company completed the consolidation of the Company’s issued and outstanding common shares on the basis of one post-consolidation common share for every four pre-consolidation common shares and any fractional shares were rounded down to the nearest whole common share. The Share Consolidation was effected following approval from the Company’s Board of Directors and regulatory approval from the TSX. The Share Consolidation was implemented in connection with the Company’s application to list its common shares on the NYSE American.
| · | Listing on the NYSE American |
On May 5, 2025, the Company’s common shares commenced trading on the NYSE American under the trading symbol “ISOU”.
| · | Sale of royalty assets |
On May 15, 2025, the Company completed the sale of all the current royalty interests held by IsoEnergy and its subsidiary with respect to properties in Nunavut and Argentina, to Royal Uranium Inc. (“Royal Uranium”) for 8,000,000 Royal Uranium shares at a price of $0.35 per share, for total proceeds of $2,800,000.
| · | Launch of At-The-Market equity program |
On June 2, 2025, the Company entered into an equity distribution agreement (the “Distribution Agreement”) with a group of agents (the “Agents”). The Distribution Agreements allows to Company to distribute up to $75.0 million of its common shares, through the Agents, through the NYSE American or TSX (the “ATM Program”).
| · | Bought Deal Financing |
On June 24, 2025, the Company issued 5,121,500 common shares at a price of $10.00 per share for gross proceeds of $51.2 million (the “Bought Deal Financing”). A cash commission of up to 5% of the gross proceeds of the financing was paid to the brokers involved in the Bought Deal Financing. NexGen participated in the Bought Deal Financing and purchased 1,200,000 common shares.
|
|
ISOENERGY LTD.
For the three and six months ended June 30, 2025 and 2024
| · | Sustainability Report |
On July 15, 2025, the Company released its inaugural sustainability report for the year ended December 31, 2024 (the “Sustainability Report”). The Sustainability Report highlights the Company’s progress in advancing its global uranium portfolio with a focus on environmental stewardship, Indigenous partnerships, and responsible governance, and marks a milestone in the Company’s evolution. The full Sustainability Report is available on the Company’s website at www.isoenergy.ca.
| · | Common share issuances and stock options (1) |
In the six months ended June 30, 2025, the Company issued 180,000 common shares on the exercise of stock options for proceeds of $277,200 and granted 516,375 stock options at an exercise price of $11.72. The Company issued 1,221,818 common shares to Queens Road Capital Investment Ltd. (“QRC”) as a result of QRC’s election to convert US$3,000,000 of the US$6,000,000 principal of the unsecured convertible debentures issued on August 18, 2020 (the “2020 Debentures”). The Company also elected to issue 16,666 common shares to Critical Path Minerals Corp. to satisfy the 1st anniversary payment due related to the Company’s purchase of the Bulyea River project (Figure 1).
(1) Common share issuances and stock options granted in the six months ended June 30, 2025 above are presented on a post-consolidation basis. Refer to the discussion on the Share Consolidation, as described above in “About IsoEnergy”.
DISCUSSION OF OPERATIONS
Six months ended June 30, 2025
During the six months ended June 30, 2025, the Company incurred $9,406,468 of exploration and evaluation spending on its exploration properties globally, as set out below. Most of the spending was at the Company’s Larocque East Project in the Athabasca Basin as further discussed below. See “Outlook” below for future exploration plans.
Exploration and evaluation spending
| Canada | United States | Australia | Total | |||||||||||||
| Drilling | $ | 3,258,690 | $ | - | $ | - | $ | 3,258,690 | ||||||||
| Geological and geophysical | 1,532,983 | 88,566 | - | 1,621,549 | ||||||||||||
| Labour and wages | 716,879 | 541,867 | 104,684 | 1,363,430 | ||||||||||||
| Camp costs | 859,805 | 54,964 | 23,990 | 938,759 | ||||||||||||
| Engineering and underground access | 41,085 | 370,364 | - | 411,449 | ||||||||||||
| Community relations | 255,996 | - | - | 255,996 | ||||||||||||
| Travel | 136,026 | 40,421 | 27,152 | 203,599 | ||||||||||||
| Health and safety and environmental | 141,300 | 2,482 | 38,377 | 182,159 | ||||||||||||
| Geochemistry and assays | 142,541 | - | - | 142,541 | ||||||||||||
| Claim holding costs and advance royalties | 17,518 | 71,092 | 31,725 | 120,335 | ||||||||||||
| Extension of claim refunds | (10,713 | ) | - | - | (10,713 | ) | ||||||||||
| Other | 168,918 | 111,916 | 26,096 | 306,930 | ||||||||||||
| Cash expenditures | $ | 7,261,028 | $ | 1,281,672 | $ | 252,024 | $ | 8,794,724 | ||||||||
| Share-based compensation | 618,242 | 253,778 | 14,427 | 886,447 | ||||||||||||
| Foreign exchange movements | - | (278,522 | ) | 3,819 | (274,703 | ) | ||||||||||
| Total expenditures | $ | 7,879,270 | $ | 1,256,928 | $ | 270,270 | $ | 9,406,468 | ||||||||
|
|
ISOENERGY LTD.
For the three and six months ended June 30, 2025 and 2024
Canada
Expenditures on the Company’s properties in the Athabasca Basin (Figure 1) and Quebec were primarily focused on the following projects during the six months ended June 30, 2025:
| Larocque East |
Hawk | Purepoint JV | East Rim | Other | Total | |||||||||||||||||||
| Drilling | $ | 2,657,684 | $ | 69,574 | $ | 531,432 | $ | - | $ | - | $ | 3,258,690 | ||||||||||||
| Geological and geophysical | 26,493 | 623,139 | 3,500 | 672,576 | 207,275 | 1,532,983 | ||||||||||||||||||
| Camp costs | 711,466 | 39,841 | 92,732 | - | 15,766 | 859,805 | ||||||||||||||||||
| Labour and wages | 441,381 | 68,311 | 85,931 | 43,451 | 77,805 | 716,879 | ||||||||||||||||||
| Community Relations | 152,811 | 49,903 | 26,117 | 19,841 | 7,324 | 255,996 | ||||||||||||||||||
| Geochemistry and assays | 142,263 | - | - | - | 278 | 142,541 | ||||||||||||||||||
| Travel | 96,197 | 1,403 | 17,044 | - | 21,382 | 136,026 | ||||||||||||||||||
| Health and safety and environmental | 129,188 | 1,750 | 1,657 | 1,540 | 7,165 | 141,300 | ||||||||||||||||||
| Engineering | - | - | - | - | 41,085 | 41,085 | ||||||||||||||||||
| Claim holding costs | 1,519 | - | 350 | 525 | 15,124 | 17,518 | ||||||||||||||||||
| Net extension of claim refunds | - | - | - | - | (10,713 | ) | (10,713 | ) | ||||||||||||||||
| Other | 13,397 | 4,933 | 75,693 | 1,143 | 73,752 | 168,918 | ||||||||||||||||||
| Cash expenditures | $ | 4,372,399 | $ | 858,854 | $ | 834,456 | $ | 739,076 | $ | 456,243 | 7,261,028 | |||||||||||||
| Share-based compensation | 382,868 | 77,732 | 73,601 | 68,399 | 15,642 | 618,242 | ||||||||||||||||||
| Total expenditures | $ | 4,755,267 | $ | 936,586 | $ | 908,057 | $ | 807,475 | $ | 471,885 | $ | 7,879,270 | ||||||||||||
Figure 1 – Athabasca Basin Property Location Map

|
|
ISOENERGY LTD.
For the three and six months ended June 30, 2025 and 2024
Larocque East Project
Winter 2025 – Diamond Drilling and Geophysical Work
The winter 2025 drilling program focused on testing resource expansion targets near the Hurricane Deposit and at the Target Area D 2.8 kilometres east-northeast of Hurricane along the prospective Larocque Trend where ANT surveys in 2023 and 2024 outlined prospective velocity anomalies. The winter 2025 drilling program was designed to drill at these identified targets and 17 diamond drill holes totalling 6,396 metres were completed. The drilling intersected strongly elevated radioactivity in five holes along the eastern extensions of the Hurricane Deposit main and south trends, as well as at Area D, 2.8 kilometres east of Hurricane, highlighting the potential for additional zones of uranium mineralization both immediately on strike of Hurricane and regionally along the 9 kilometres of the Larocque Trend on the Project (Figures 2 and 4).
A total of 13 holes were completed to test three interpreted structural trends at Hurricane (Figure 2). Four holes (LE25-194, 195, 198, 203) were drilled to test the projected eastern extension of the faults that control the main high-grade portion of Hurricane (the “Main Trend”). Seven holes (LE25-197, 199, 200, 201, 207, 208, 210) were drilled to test the projected extension of faults that control the Hurricane southern high-grade lens (the “South Trend”). Two holes (LE25-196, 205A) were drilled to test a structure intersected in historic drill holes in the middle sandstone north of Hurricane at the unconformity.
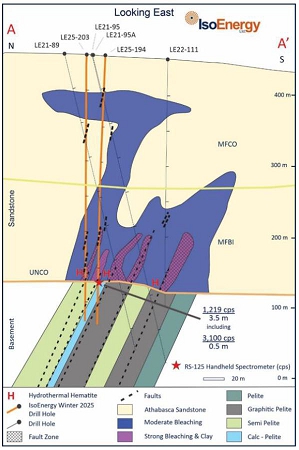
In the Main Trend, hole LE25-194 tested down-dip of structure and anomalous geochemistry intersected in LE21-89 and LE21-95A (Figure 3). Hole LE25-194 intersected widespread moderate to strongly bleached core through most of the sandstone. Strong pervasive bleaching, clay alteration and desilicification were intersected below 295 metres. Moderate hematite and grey alteration, typical of Hurricane were intersected immediately above the unconformity associated with strongly elevated radioactivity over 3.5 metres from 316.0 to 319.5 metres which included a 0.5 metre-long interval with an average RS-125 spectrometer value of 3,100 counts per second (“cps”) and a corresponding gamma ray (“2PGA”) probe value of 30,829 cps. Mineralization styles include worm-rock replacement, fault-controlled and disseminated. Hole LE25-198 drilled 100 metres east of hole LE25-194, intersected widespread bleaching throughout the sandstone. Clay and limonite alteration, centered on a fault, were intersected from 259 to 263 metres. A broad structural zone with continuous strong bleaching, desilicification, and clay alteration is present below 287 metres. Fault-controlled hydrothermal hematite and weak grey alteration were intersected approximately 10 metres above the unconformity, indicating the hole overshot the ideal target. Strong pervasive limonite and clay alteration continued to the unconformity at 316.5 metres. The basement rock immediately below the unconformity is moderately argillitized and chloritized, with above-background radioactivity as measured on core and by downhole gamma probing extending from 314.0 metres in sandstone down to 321.1 metres in basement. Peak values recorded on drill core with the RS-125 spectrometer and with the 2PGA downhole probe are 625 cps average over a 0.5 metre interval and 26,503 cps respectively. Hole LE25-198 is interpreted to have overshot the target, and potential for mineralization remains high to the north. Hole LE25-203 tested north of hole LE25-194 and intersected strong bleaching, moderate clay and desilicification centred on structural zones below 283 metres. Fault-controlled hematite alteration was intersected at 320.3 metres. A peak of 4,809 cps was recorded on the 2PGA probe at 325.0 metres, one metre below the unconformity.
In the South Trend, hole LE25-207 was drilled between holes LE21-101 and LE22-115A to test for continuity of mineralization. Hole LE25-207 intersected moderate bleaching beginning at 245 metres. Elevated radioactivity was intersected within hematitic breccia at 293 metres. Strong structurally controlled bleaching and moderate clay alteration were observed from 301 metres to the unconformity at 323.8 metres, with significant core loss recorded from 308 to 323 metres. Strongly elevated radioactivity was recorded over 6.0 metres from 323.0 metres in the sandstone to 329.0 metres in the basement (Figure 5). The interval included RS-125 spectrometer and 2PGA probe values of 8,800 cps averaged over a 0.5 metre interval and 30,096 cps, respectively. Hole LE25-210 tested down-dip of the sandstone structure intersected in hole LE22-118A. Strong bleaching, clay alteration, and desilicification were observed below 251 metres. Weak to moderate fault-controlled hematite alteration was intersected at 319.5 metres and 323.6 metres. Continuous radioactivity exceeding 350 cps was intersected in sandstone at 319 metres and extended into the basement to 324 metres. The highest radioactivity measured on core of 3,700 cps averaged over a 0.5 metre interval and a corresponding 2PGA downhole probe peak of 20,280 cps were recorded within a basement-hosted fault, highlighting the potential for a basement extension of Hurricane.
|
|
ISOENERGY LTD.
For the three and six months ended June 30, 2025 and 2024
Drilling in Area D along the Larocque Trend had the best radioactivity intercept to date outside of the Hurricane deposit area and confirms regional potential. Four holes (LE25-202, 204, 206 and 209) were completed this winter (Figure 4). Three holes on one section in the northwest end of Target Area D in which strongly anomalous radioactivity was intersected are summarized below.
Hole LE25-202, the first drill hole on section (Figure 5), intersected weak to moderate bleaching in the upper sandstone. In the lower sandstone, below 206 metres, alteration is moderate to strong with a broad bleached, clay and desilicified zone centred on faults. Moderate to strong limonite in present over a 10 metre interval below 254 metres. The hole intersected unconformity at 270.3 metres and hematitic breccia immediately below unconformity. A second hematitic fault was intersected at 282 metres before the drill hole intersected a moderately hematitic radioactive zone from 286.5 to 291.0 metres. Blebs and fracture-hosted uranium mineralization are associated with the highest RS-125 spectrometer value reading of 6,200 cps over 0.5 metres. Hole LE25-204, drilled to the south and designed to test down dip of the LE25-202 intersection, intersected broad bleaching throughout the sandstone. Moderate clay alteration and desilicification with significant core loss were intersected below 245 metres to unconformity at 262.9 metres.
A new geophysical model generated from joint inversion of ground loop domain EM and direct current resistivity data collected during historic EM and resistivity surveys, has highlighted a previously underexplored conductive structure 800 metres north of the main Hurricane conductor (Figure 6). This 2,500-metre trend has been inadequately tested by two historic drill holes, which is referred to as Area K and exhibits two geophysical features like those at Hurricane (Figure 4).
Summer 2025 – Diamond Drilling and Resource Expansion
The summer 2025 drilling program has commenced, with a total of 20 diamond drill holes totalling 7,600 metres planned testing Areas D, E, F, and K along a six-kilometre prospective segment of the Larocque Trend (Figure 4).
See the Company’s press releases dated April 23, 2025 entitled “IsoEnergy Intersects Strongly Elevated Radioactivity in Multiple Holes Immediately Along Strike of Hurricane and In Step-Out Target Area D, 2.8km East” and dated June 12, 2025 entitled “IsoEnergy Commences Athabasca Basin Summer 2025 Exploration Program” for additional information regarding the results of the 2025 winter exploration program and plans for the summer 2025 exploration program, respectively.
|
|
ISOENERGY LTD.
For the three and six months ended June 30, 2025 and 2024
Figure 2 – Location of winter 2025 drill holes with respect to the Hurricane Deposit resource footprint (blue) and the ANT seismic low velocity zone in which the deposit occurs, and projected Hurricane mineralization-controlling fault zones. RS-125 spectrometer values are highest averages over 0.5 metre intervals.

Figure 3 – Main Trend: Cross section through LE25-194 and LE25-203 on the Main Trend looking east.
|
|
ISOENERGY LTD.
For the three and six months ended June 30, 2025 and 2024
Figure 4 – Compilation map of Larocque East project showing the Hurricane deposit, winter 2025 and summer 2024 drill hole locations and ANT seismic velocity anomalies (A though J) on a plan view of the 2025 conductivity model 50 metres below the unconformity. 20 drill holes planned for the summer will test targets at Hurricane, in target areas D, E and F, and at the untested northern conductive trend (Target K)

Figure 5 – Cross section through LE25-202, 204 and 206 on the west end of Target Area ‘D’ looking east.

|
|
ISOENERGY LTD.
For the three and six months ended June 30, 2025 and 2024
Figure 6 – Joint resistivity – electromagnetic inversion model of the Larocque East project that highlights an untested 2,500m northern conductivity trend

Purepoint Joint Venture – Dorado Project
2025 – Drilling and Geophysical Work
Initial drilling at the Q48 target at the Dorado project, which was completed by Purepoint Uranium as the operator of the exploration program, intersected uranium mineralization in four holes and led to the “Nova Discovery” intercepts at the Q48 target area. The recent Nova Discovery further defines the mineralized trend at the Q48 target as a steeply dipping, uranium-bearing structure hosted within the basement rocks, underscoring the potential scale and strength of the system emerging at the Dorado project.
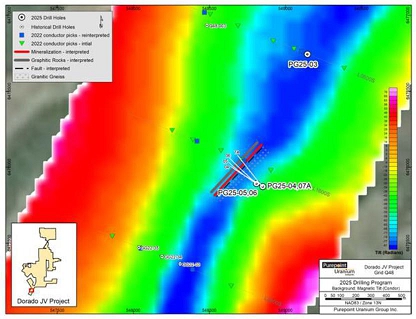
Drill hole PG25-04 targeted the Q48 conductor, approximately 800 metres northwest of the Company’s previous drilling in 2022 (Figure 7). This drill hole was collared with a dip of -60 degrees and encountered Athabasca sandstone to a depth of 321 metres. Clay altered granitic gneiss and pegmatites were drilled to 393 meteres then garnet-rich pelitic gneiss, with local pyrite and graphite, was drilled to the completion depth of 489 metres. The altered radioactive gouge seams were hosted by a chloritized pegmatite and returned an average of 64,220 cps over 0.4 metres.
|
|
ISOENERGY LTD.
For the three and six months ended June 30, 2025 and 2024
Drill hole PG25-05 was collared using the same azimuth as PG25-04 and intercepted radioactive structure approximately 40 metres up-dip of the latter hole (Figure 7). This drill hole encountered unconformity at 309 metres, clay altered granitic gneiss and pegmatites to 371 metres, then garnet-rich pelitic gneiss, with local pyrite and graphite, was drilled to the completion depth of 498 metres.
Drill hole PG25-06 targeted the brittle fault associated with mineralization at the unconformity (Figure 7). The drill hole was collared with a dip of -64 degrees and encountered Athabasca sandstone to a depth of 316 metres. Granitic gneiss displaying paleo-weathering alteration was drilled to 341 metres then generally unaltered granite, pegmatites and pelitic gneiss was drilled to the completion depth of 482 metres. Projection of the Nova Discovery zone mineralization suggests the radioactive sandstone interval of 1,040 cps over 2.3 metres in the Mount Sopris 2PGA-1000 downhole gamma probe is related to the primary mineral structure.
Drill hole PG25-07A resulted in a large 70 metre step out to the northeast of the PG25-05 mineralized intercept. The unconformity was intersected at a depth of 322 metres and the drill hole intercepted the radioactive structure approximately 40 metres up-dip of PG25-05.
The Q48 target zone lies within the southern portion of the Dorado project and is characterized by a steeply dipping, north-south trending conductive package identified through geophysical surveys. Drilling by the Company in 2022 confirmed that the conductive trend at the Q48 target hosts structure, shearing, and alteration, characteristics of uranium-bearing hydrothermal systems in the Athabasca Basin. The recently discovered Nova zone shows mineralization within granitic gneiss at 382.3 metres and extends into pelitic gneiss to a depth of 396.3 metres returning an average of 11,100 cps over 14.0 metres. A primary mineralized structure of the Nova zone is hosted in sheared, reddish-brown altered granitic gneiss with pitchblende that returned an average of 82,300 cps over 0.6 metres with a peak of 110,800 cps. A second strongly mineralized interval occurs within lost pelitic gneiss core and returned an average of 46,000 cps over 0.4 metres. All assays from the current 2025 drill program at the Dorado project are pending.
See the Company’s press releases dated July 8, 2025 entitled “IsoEnergy and Purepoint Confirm Uranium Discovery In Initial Drilling at the Dorado Joint Venture Project” and dated July 23, 2025 entitled “IsoEnergy and Purepoint Extend High-Grade Mineralization at the Dorado JV with a 70 Metre Step-Out Peaking at 110,800 CPS” for additional information regarding the results of the 2025 exploration program at the Dorado project.
Figure 7 – Location map of 2025 drill program at Q48 target area and the new Nova Discovery
|
|
ISOENERGY LTD.
For the three and six months ended June 30, 2025 and 2024
Hawk
Exploration work for summer 2025 at the Hawk project include a stepwise moving loop EM survey to more accurately locate conductors for drill hole targeting. ANT surveys over the northern portion of the project are in progress with the aim to test for the extension of the existing ANT velocity anomaly along the conductivity corridor in an area where there is 35 metres of unconformity elevation change between 2023 drill holes HK23-01 and HK23-02. Four diamond drill holes totalling 3,400 metres will be planned to be drilled to target coincident EM conductors and ANT velocity anomalies along a sparsely drill-tested 12-kilometre-long prospective corridor once interpretations of 2025 geophysical survey results are received and integrated with existing geoscience information. Previous drilling at the Hawk project intersected structural disruption, alteration, and elevated uranium geochemistry and radiometric responses, which are consistent with a setting conductive to unconformity-style uranium mineralization (Figure 8).
Figure 8 – Hawk project map showing the locations of the planned summer 2025 geophysical surveys. The locations of four drill holes planned for late in the summer will be finalized after interpretation of the geophysical survey results. Locations of past drill holes, interpreted ground EM conductors, and drill intersected faults are shown on a colour ZTEM conductivity map.

East Rim
A helicopter-borne MobileMT conductivity and magnetic survey was completed over the East Rim project. Data processing and interpretation are in progress and information obtained for the survey will inform targets for future exploration programs on the East Rim project.
Other Canadian projects
The majority of exploration and evaluation costs incurred for other projects in Canada during the six months ended June 30, 2025, relate to assessment report writing and community engagement payments accrued for properties in the Athabasca Basin, as well as beginning an updated technical report for the Dieter Lake property in Quebec, and community engagement work and site visits to the Matoush and Dieter Lake properties in Quebec. See “Outlook” below for further details on the 2025 exploration program plans for the Company’s properties in Canada.
|
|
ISOENERGY LTD.
For the three and six months ended June 30, 2025 and 2024
United States
Expenditure on the Company’s properties in the United States was as follows during the six months ended June 30, 2025:
| Tony M | Other | Total | ||||||||||
| Labour and wages | $ | 182,958 | $ | 358,909 | $ | 541,867 | ||||||
| Engineering and underground access | 164,437 | 205,927 | 370,364 | |||||||||
| Geological and geophysical | - | 88,566 | 88,566 | |||||||||
| Claim holding costs and advance royalties | 30,444 | 40,648 | 71,092 | |||||||||
| Camp costs | 27,369 | 27,595 | 54,964 | |||||||||
| Travel | 27,868 | 12,553 | 40,421 | |||||||||
| Health, safety and environmental | 1,732 | 750 | 2,482 | |||||||||
| Other | 35,939 | 75,977 | 111,916 | |||||||||
| Cash expenditures | $ | 470,747 | $ | 810,925 | $ | 1,281,672 | ||||||
| Share-based compensation | 169,273 | 84,505 | 253,778 | |||||||||
| Foreign exchange movements | (278,522 | ) | - | (278,522 | ) | |||||||
| Total expenditures | $ | 361,498 | $ | 895,430 | $ | 1,256,928 | ||||||
Tony M Mine
The Company has commenced ore sorting and high-pressure slurry ablation testing programs to evaluate material processing and reduce haulage and operating costs, as well as an evaporation study with the aim to reduce capital costs and increase evaporation rates at the existing evaporation pond infrastructure at the Tony M Mine. For the ore sorting study, the Company has engaged Steinert Group to test sensor-based ore sorting on mineralized material from the Tony M Mine. This study utilizes technology that uses a combination of 3D, color, induction, and x-ray sensors to identify and separate target material, with the potential to: reduce haulage costs by concentrating mineralization and lowering transport volumes to the White Mesa Mill, where toll-milling will take place; improve mining productivity by reducing waste and enhancing ore advance rates; and minimize dilution through more precise material handling. The Company is also testing mineralized material from Tony M at Disa Technologies using their patented HPSA process. This process uses high-pressure slurry streams to separate uranium coatings from sand grains, with the intended benefit of improving process efficiency and reducing costs. Lastly, the Company is working with RWI Enhanced Evaporation to evaluate the use of landshark evaporators on the Tony M Mine evaporation pond. Preliminary results suggest that enhanced evaporation could eliminate the need for constructing additional pond capacity, reducing future dewatering timelines and associated costs for the later stages of mining.
The Company continues to secure and install new equipment on site, and intends to use the results of the above studies as inputs for an updated technical and economic study to be commenced later in 2025. See “Outlook” below for further details on the Company’s planned 2025 work program at the Tony M Mine.
Utah Exploration
In 2025 to date, the Company has continued to carry out geological fieldwork to advance understanding of the local sedimentary architecture and uranium mineralization controls at the Tony M Mine and surrounding claims, Daneros Mine, Rim Mine, and Sage Plain project. This new geological information is being integrated with the interpretation of the results of seismic, EM, and induced polarization surveys conducted in 2024 and compiled historic data to identify the most prospective areas for future work.
|
|
ISOENERGY LTD.
For the three and six months ended June 30, 2025 and 2024
Claim Staking and Claim Maintenance
The Company staked additional ground adjacent to the Tony M Mine during the six months ended June 30, 2025 at a cost of $2,630 and incurred $71,092 in expenditure on annual state lease fees, advance royalties, other short-term lease payments, and land management fees related to the Company’s properties in Utah.
The Company has renegotiated the royalty on the Utah Trust Lands (SITLA) lease at the Tony M Mine. The royalty on uranium production was previously 8% gross and has been reduced to 3%. In addition, the advanced minimum royalty has been meaningfully reduced.
Year ended December 31, 2024
During the year ended December 31, 2024, the Company incurred $23,495,786 of exploration and evaluation spending primarily on its exploration properties in Canada and in Utah, as set out below. Total exploration and evaluation spending in the year ended December 31, 2024 excludes $378,879 spent on properties in Argentina, which the Company disposed of during the year ended December 31, 2024.
Exploration and evaluation spending from continuing operations
| Canada | United States | Australia | Total | |||||||||||||
| Drilling | $ | 6,000,455 | $ | 154,306 | $ | - | $ | 6,154,761 | ||||||||
| Geological & geophysical | 4,968,309 | 522,167 | 5,895 | 5,496,371 | ||||||||||||
| Labour & wages | 1,537,927 | 1,290,233 | 247,070 | 3,075,230 | ||||||||||||
| Camp costs | 1,936,029 | 83,738 | - | 2,019,767 | ||||||||||||
| Claim holding costs and advance royalties | 50,449 | 1,236,488 | 226,100 | 1,513,037 | ||||||||||||
| Engineering and underground access | 70,687 | 1,150,702 | - | 1,221,389 | ||||||||||||
| Travel | 364,385 | 247,757 | 33,430 | 645,572 | ||||||||||||
| Community relations | 575,462 | - | - | 575,462 | ||||||||||||
| Health and safety and environmental | 444,369 | 43,566 | 73,635 | 561,570 | ||||||||||||
| Geochemistry & Assays | 312,268 | 48,391 | 2,119 | 362,778 | ||||||||||||
| Extension of claim refunds | (67,713 | ) | - | - | (67,713 | ) | ||||||||||
| Other | 254,853 | 153,439 | 75,601 | 483,893 | ||||||||||||
| Cash expenditures | $ | 16,447,480 | $ | 4,930,787 | $ | 663,850 | $ | 22,042,117 | ||||||||
| Share-based compensation | 1,095,546 | 343,121 | 11,041 | 1,449,708 | ||||||||||||
| Foreign exchange movements | - | 4,528 | (567 | ) | 3,961 | |||||||||||
| Total expenditures | $ | 17,543,026 | $ | 5,278,436 | $ | 674,324 | $ | 23,495,786 | ||||||||
|
|
ISOENERGY LTD.
For the three and six months ended June 30, 2025 and 2024
Expenditure on the Company’s properties in Canada during the year ended December 31, 2024 was primarily on Larocque East, Hawk, Matoush, and East Rim, as set out below. Spending at Matoush also included travel and labour and wages related to community engagement work.
| Larocque East | Hawk | Matoush | East Rim | Other | Total | |||||||||||||||||||
| Drilling | $ | 4,757,266 | $ | 1,243,189 | $ | - | $ | - | $ | - | $ | 6,000,455 | ||||||||||||
| Geological & geophysical | 1,816,725 | 151,953 | 811,982 | 538,928 | 1,648,721 | 4,968,309 | ||||||||||||||||||
| Camp costs | 1,282,932 | 483,469 | 134,789 | - | 34,839 | 1,936,029 | ||||||||||||||||||
| Labour & wages | 867,305 | 205,730 | 178,760 | 72,371 | 213,761 | 1,537,927 | ||||||||||||||||||
| Community relations | 321,550 | 73,500 | 1,299 | 14,600 | 164,513 | 575,462 | ||||||||||||||||||
| Health and safety and environmental | 402,329 | 18,048 | 533 | 4,099 | 19,360 | 444,369 | ||||||||||||||||||
| Travel | 252,175 | 24,894 | 87,294 | - | 22 | 364,385 | ||||||||||||||||||
| Geochemistry & Assays | 219,942 | 51,924 | 40,000 | 402 | - | 312,268 | ||||||||||||||||||
| Engineering | 70,687 | - | - | - | - | 70,687 | ||||||||||||||||||
| Claim holding costs | - | - | 50,449 | - | - | 50,449 | ||||||||||||||||||
| Extension of claim refunds | - | - | - | (21,529 | ) | (46,184 | ) | (67,713 | ) | |||||||||||||||
| Other | 76,896 | 56,168 | 48,355 | 20,983 | 52,451 | 254,853 | ||||||||||||||||||
| Cash expenditures | 10,067,807 | 2,308,875 | 1,353,461 | 629,854 | 2,087,483 | 16,447,480 | ||||||||||||||||||
| Share-based compensation | 725,609 | 166,516 | 6,162 | 44,899 | 152,360 | 1,095,546 | ||||||||||||||||||
| Total expenditures | $ | 10,793,416 | $ | 2,475,391 | $ | 1,359,623 | $ | 674,753 | $ | 2,239,843 | $ | 17,543,026 | ||||||||||||
Expenditure on the Company’s properties in the United States during the year ended December 31, 2024, was primarily focused on reopening access to the Tony M Mine and exploration activities on Henry Mountains, Daneros, and Sage Plain in Utah, as set out below:
| Tony M | Other | Total | ||||||||||
| Labour and wages | $ | 1,254,659 | $ | 35,574 | $ | 1,290,233 | ||||||
| Claim holding costs and advance royalties | 1,191,257 | 45,231 | 1,236,488 | |||||||||
| Engineering and underground access | 1,150,702 | - | 1,150,702 | |||||||||
| Geological & geophysical | 496,671 | 25,496 | 522,167 | |||||||||
| Camp costs | 81,921 | 1,817 | 83,738 | |||||||||
| Travel | 245,060 | 2,697 | 247,757 | |||||||||
| Drilling | 154,306 | - | 154,306 | |||||||||
| Geochemistry and assays | 48,391 | - | 48,391 | |||||||||
| Health and safety and environmental | 43,566 | - | 43,566 | |||||||||
| Other | 153,172 | 267 | 153,439 | |||||||||
| Cash expenditures | 4,819,705 | 111,082 | 4,930,787 | |||||||||
| Share-based compensation | 343,121 | - | 343,121 | |||||||||
| Foreign exchange movements | 4,528 | - | 4,528 | |||||||||
| Total expenditures | $ | 5,167,354 | $ | 111,082 | $ | 5,278,436 | ||||||
|
|
ISOENERGY LTD.
For the three and six months ended June 30, 2025 and 2024
OUTLOOK
The Company intends to actively explore all of its exploration projects as and when resources permit. The nature and extent of further exploration on any of the Company’s properties, however, will depend on the results of completed and ongoing exploration activities, an assessment of the Company’s recently acquired properties and the Company’s financial resources.
Activities in Canada for 2025 include completing the summer exploration programs at Larocque East, Hawk, and East Rim, with the continued focus of testing resource expansion potential near the Hurricane Deposit and evaluating greenfield targets along the Larocque Trend, as further outlined in “Discussion of Operations” above. Activities in Canada for 2025 also include completing the 2025 drilling program at the Dorado Project, where Purepoint Uranium is the operator. Planned activities on other IsoEnergy projects include prospecting, sampling, and mapping at the Bulyea River, East Rim, and Evergreen projects in the Athabasca Basin, completing an updated technical report for the Dieter Lake project, continuing geochemical sampling and geophysical work at Matoush based on 2024 exploration results, and proposing future exploration work.
The Company’s planned work program at the Tony M Mine in 2025 includes completing the ore sorting study, evaporation trade-off study, and evaluation of multiple mining methods. The ore sorting study is being undertaken in an effort to reduce haulage costs to the Energy Fuels White Mesa Mill. The evaporation trade-off study has shown some early potential for minimising the cost, work and timeline for full dewatering of the underground when the mine is put back into production. Results of these studies, when completed, could provide important inputs for a technical and economic study, which could begin later this year and would include a mine plan, production rates, expected operational costs and capital requirements. In any such plan, the price of uranium will be a key factor.
The Company intends to undertake internal technical studies on several non-material properties in 2025.
SELECTED FINANCIAL INFORMATION
Management is responsible for the Interim Financial Statements referred to in this MD&A. The Audit Committee of the Board of Directors (the “Board”) has been delegated the responsibility to review the Interim Financial Statements and MD&A and make recommendations to the Board. The Board is responsible for final approval of the Interim Financial Statements and MD&A.
The Interim Financial Statements have been prepared in accordance with IAS 34, Interim Financial Reporting as issued by the IFRS and interpretations of the International Financial Reporting Interpretations Committee (“IFRIC”). The Company’s presentation currency and the functional currency of its Canadian operations is Canadian dollars; the functional currency of its Australian operations is the Australian dollar; and the functional currency of its United States operations and the Argentinian discontinued operations is the US dollar.
The Company’s Interim Financial Statements have been prepared using IFRS applicable to a going concern, which assumes that the Company will be able to realize its assets and discharge its liabilities in the normal course of business for the foreseeable future. The ability of the Company to continue as a going concern is dependent on its ability to obtain financing and achieve future profitable operations.
|
|
ISOENERGY LTD.
For the three and six months ended June 30, 2025 and 2024
Financial Position
The following financial data is derived from and should be read in conjunction with the Interim Financial Statements and the Annual Financial Statements. As an exploration stage company, IsoEnergy does not have revenues.
| June 30, 2025 | December 31, 2024 |
December 31, 2023 Restated |
||||||||||
| Exploration and evaluation assets | $ | 263,830,842 | $ | 262,291,098 | $ | 274,756,338 | ||||||
| Total assets | 410,630,810 | 340,835,023 | 347,198,222 | |||||||||
| Total current liabilities | 27,578,269 | 35,103,977 | 41,065,120 | |||||||||
| Total non-current liabilities | 2,815,142 | 2,567,887 | 3,112,545 | |||||||||
| Adjusted working capital (1) | 124,922,827 | 56,116,942 | 51,644,330 | |||||||||
| Cash dividends declared per share | Nil | Nil | Nil | |||||||||
| (1) | Adjusted working capital is a non-IFRS financial measure, as discussed below, and is defined as current assets less current liabilities, excluding flow-though share premium liabilities and convertible debenture liabilities. |
In the six months ended June 30, 2025, the Company capitalized $9,406,468 of exploration and evaluation costs, as further described in “Discussion of Operations” above. Exploration and evaluation assets of $1,060,000 relating to 10% of the Company’s interest in the Purepoint Joint Venture and $151,010 relating to the Mountain Lake property were disposed of, as further described in “Year-to-date 2025 Highlights” above. Total assets increased primarily due to $51,215,000 raised in the Bought Deal Financing and $26,257,375 raised in the February 2025 Flow-Through Financing and Concurrent Private Placement, with associated share issuance costs of $4,463,707. Total assets also increased due to the fair value of marketable securities increasing by $9,482,825, primarily from $8,625,000 of Future Fuels common shares received on the disposal of the Mountain Lake property, $2,800,000 of Royal Uranium common shares on the disposal of certain of the Company’s royalty assets, and $1,060,000 of Purepoint Uranium common shares received from the exercise of the put option in the Purepoint Joint Venture, offset by a fair value loss related to marketable securities of $3,252,175 during the six months ended June 30, 2025.
Current liabilities on June 30, 2025, include a flow through share premium liability of $7,648,249 and $380,331 related to the February 2025 Flow-Through Financing and the February 2024 Private Placement (as defined below), respectively. Accounts payable and accrued liabilities increased by $67,637 during the six months ended June 30, 2025 mostly as a result of additional professional fees and public company costs related to the Company’s listing on the NYSE American and Bought Deal Financing, as well as timing variances related to the start of the 2025 winter exploration program at Larocque East and the 2025 summer exploration programs in the Athabasca Basin. The fair value of the Company’s 2020 Debentures and the US$4 million in principle of unsecured convertible debentures issued on December 6, 2022 (the “2022 Debentures” and collectively with the 2020 Debentures, the “Debentures”) decreased by $14,298,515 during the six months ended June 30, 2025 mostly due to the partial conversion of US$3 million principal of the 2020 Debentures, further described in “Year-to-date 2025 Highlights” above and discussed in “Results of Operations” below.
Adjusted working capital increased during the six months ended June 30, 2025 mainly due to the Bought Deal Financing, February 2025 Flow-Through Financing, and Concurrent Private Placement, as well as an increase in the fair value of marketable securities during the period, partly offset by exploration and evaluation spending discussed above.
|
|
ISOENERGY LTD.
For the three and six months ended June 30, 2025 and 2024
Results of Operations
The following financial data is derived from and should be read in conjunction with the Interim Financial Statements.
| For the three months ended June 30 | For the six months ended June 30 | |||||||||||||||
| 2025 | 2024 | 2025 | 2024 | |||||||||||||
| General and administrative costs | ||||||||||||||||
| Share-based compensation | $ | 1,101,397 | $ | 1,054,796 | $ | 3,047,236 | $ | 2,231,325 | ||||||||
| Administrative salaries, contractor and directors’ fees | 788,798 | 802,078 | 1,584,112 | 1,873,115 | ||||||||||||
| Investor relations | 302,131 | 244,021 | 523,087 | 450,660 | ||||||||||||
| Office and administrative | 293,457 | 184,524 | 537,457 | 405,985 | ||||||||||||
| Professional and consultant fees | 889,659 | 701,840 | 1,950,470 | 1,360,712 | ||||||||||||
| Travel | 90,292 | 117,686 | 266,317 | 263,750 | ||||||||||||
| Public company costs | 480,127 | 94,788 | 625,853 | 260,954 | ||||||||||||
| Total general and administrative costs | $ | (3,945,861 | ) | (3,199,733 | ) | $ | (8,534,532 | ) | (6,846,501 | ) | ||||||
| Interest income | 364,387 | 563,560 | 674,684 | 1,050,077 | ||||||||||||
| Interest expense | (34,179 | ) | (20,413 | ) | (76,058 | ) | (40,303 | ) | ||||||||
| Interest on convertible debentures | (226,594 | ) | (311,288 | ) | (489,144 | ) | (618,095 | ) | ||||||||
| Fair value gain (loss) on convertible debentures | 627,079 | (2,856,776 | ) | 338,497 | (4,755,860 | ) | ||||||||||
| Gain on disposal of assets | 820,394 | - | 11,189,425 | - | ||||||||||||
| Foreign exchange (loss) gain | (75,864 | ) | (38,579 | ) | (68,945 | ) | 12,534 | |||||||||
| Other income | 92,020 | 27,322 | 523,941 | 46,702 | ||||||||||||
| (Loss) income from operations | $ | (2,378,618 | ) | (5,835,907 | ) | $ | 3,557,868 | (11,151,446 | ) | |||||||
| Deferred income tax recovery (expense) | 491,348 | (168,253 | ) | (339,523 | ) | 488,674 | ||||||||||
| (Loss) income from continuing operations | $ | (1,887,270 | ) | (6,004,160 | ) | $ | 3,218,345 | (10,662,772 | ) | |||||||
| Loss from discontinued operations (1) | - | (55,133 | ) | - | (126,499 | ) | ||||||||||
| (Loss) income for period | $ | (1,887,270 | ) | $ | (6,059,293 | ) | $ | 3,218,345 | $ | (10,789,271 | ) | |||||
| (Loss) income per share – basic (2) | $ | (0.04 | ) | $ | (0.13 | ) | $ | 0.07 | $ | (0.24 | ) | |||||
| (Loss) income per share – diluted (2) | $ | (0.03 | ) | $ | (0.13 | ) | $ | 0.07 | $ | (0.24 | ) | |||||
| Loss per share relating to discontinued operations – basic and diluted (1)(2) | Nil | $ | (0.00 | ) | Nil | $ | (0.00 | ) | ||||||||
| (1) | Loss from discontinued operations, net of tax, relates to the Argentina reporting segment, which was disposed of during the year ended December 31, 2024. | |
| (2) | (Loss) income per share amounts in the comparative period were retroactively restated on a post-consolidation basis. Refer to the discussion on the Share Consolidation, as described above in “About IsoEnergy”. |
Three months ended June 30, 2025
During the three months ended June 30, 2025, the Company recorded a net loss of $1,887,270, compared to a net loss of $6,059,293 in the three months ended June 30, 2024. Included in the net loss for the three months ended June 30, 2024, is a $55,133 loss from discontinued operations relating to the Argentina reporting segment that was sold in 2024. The main driver of the difference between the two periods was a gain on the sale of certain royalty assets of $820,394, a fair value gain on the Debentures of $627,079, and a deferred income tax recovery of $491,348, partially offset by an increase in general and administrative costs of $746,128. Other factors causing the difference between the two periods is further described below.
|
|
ISOENERGY LTD.
For the three and six months ended June 30, 2025 and 2024
General and administrative costs
Share-based compensation was $1,101,397 in the three months ended June 30, 2025, compared to $1,054,796 in the three months ended June 30, 2024. The share-based compensation expense is a non-cash charge based on the Black-Scholes value of stock options, calculated using the graded vesting method. Stock options granted to directors, consultants and employees typically vest in three tranches – 1/3 immediately, 1/3 on the first anniversary of the grant date, and the remaining 1/3 on the second anniversary of the grant date, with the corresponding share-based compensation expense being recognized over this period. The similar expense in both periods is consistent with the fact that there were no material grants of stock options in either period.
Administrative salaries, contractor and directors’ fees of $788,798 for the three months ended June 30, 2025, decreased slightly from $802,078 during the prior period primarily due to a smaller management team as compared to the prior period.
Investor relations expenses relate primarily to costs incurred in communicating with existing and potential shareholders, conferences and marketing. The increase in the current period is primarily from additional marketing services in Europe engaged.
Office and administrative expenses primarily consist of office operating costs and other general administrative costs. The increase in office and administrative expenses from the prior period is primarily from the Company being responsible for all costs for its new office in Saskatoon, Saskatchewan, whereas previously it shared its office and office-related services in that city with NexGen.
Professional and consultant fees were $889,659 for the three months ended June 30, 2025, compared to $701,840 for the three months ended June 30, 2024. Professional fees were higher mainly due to legal fees incurred for the Company’s listing on the NYSE American, increased business development activities, and legal fees related to the now terminated AEC Arrangement, including costs incurred for completing customary termination procedures such as repayment of the Bridge Loan and release of the Indemnity.
Travel expenses primarily relate to travel and accommodation costs for conferences, business development activities, public relations activities, and general corporate purposes. Travel costs decreased slightly from the prior period mainly due to the timing of site visits undertaken compared to the prior period.
Public company costs consist primarily of costs associated with the Company’s continuous disclosure obligations, listing fees, directors and officers insurance, transfer agent costs, press releases and other shareholder communications. The increase in public company costs from $94,788 to $480,127 is primarily due to the additional costs of uplisting to the NYSE American, including the initial listing and sustaining fees, additional insurance requirements, and filing costs.
Other items
The Company recorded interest income of $364,387 in the three months ended June 30, 2025, compared to $563,560 in the three months ended June 30, 2024, which represents interest earned on cash balances. The amounts were lower in the three months ended June 30, 2025 mainly due to a lower average cash balance and a decrease in interest rates earned on cash.
Interest expense on the Debentures was $226,594 in the three months ended June 30, 2025, which was lower than the $311,288 in the three months ended June 30, 2024. The 2020 Debentures and 2022 Debentures bear interest of 8.5% and 10%, respectively, per annum and are payable, with a combination of cash and common shares of the Company, on June 30 and December 31. The principal amount of the 2020 Debentures decreased in the period following the conversion of US$3 million of the US$6 million principal of the 2020 Debentures.
|
|
ISOENERGY LTD.
For the three and six months ended June 30, 2025 and 2024
The fair value of the Debentures on June 30, 2025 was $15,980,791 compared to $16,607,205 on March 31, 2025. The decrease in the fair value of the Debentures is primarily due to the strengthening of the Canadian dollar against the US dollar during the three months. The decrease in fair value include a decrease in the fair value of the Debentures of $627,079 included in the statement of income, partially offset by a fair value gain attributable to the change in credit risk of $665 included in other comprehensive income (loss). The Company’s Debentures are classified as measured at fair value through profit and loss. In accordance with IFRS 9 – Financial Instruments, the part of a fair value change due to an entity’s own credit risk is presented in other comprehensive income (loss). As of June 30, 2025, the discount on the 2020 Debentures is assumed to be 0%, as it is assumed that the 2020 Debentures can be converted immediately and the shares received can be sold at the fair market value of the conversion shares, with no additional discount. As of June 30, 2025, the time to maturity of the 2020 Debentures and 2022 Debentures was 0.1 and 2.4 years, respectively.
Foreign exchange loss was $75,864 in the three months ended June 30, 2025, compared to a loss of $38,579 in the three months ended June 30, 2024, and mainly relates to exchange movements on working capital in United States dollars held by the Company. The Company has larger US dollar denominated cash balances compared to the prior period, which combined with the weakening of the US dollar compared to the Canadian dollar, led to an increased foreign exchange loss.
Other income was $92,021 in the three months ended June 30, 2025, compared to $27,322 in the three months ended June 30, 2024. This primarily relates to higher timber sales and an increase in rental income earned from the Company’s operations in the US.
The Company records a deferred tax recovery or expense which is comprised of a recovery on losses or expense on gains recognized in the period and, when applicable, the release of flow-through share premium liability which is offset by the renunciation of flow-through share expenditures to shareholders. In the three months ended June 30, 2025, this resulted in a recovery of $491,348, compared to an expense of $168,253 in the three months ended June 30, 2024. The increase in expense is due to a larger proportion of flow-through share spending renounced during the three months ended June 30, 2025.
Six months ended June 30, 2025
During the six months ended June 30, 2025, the Company recorded net income of $3,218,345, compared to net loss of $10,789,271 in the six months ended June 30, 2024. Included in the net loss for the six months ended June 30, 2024, is a $126,499 loss from discontinued operations relating to the Argentina reporting segment that was sold in 2024. The main driver of the difference between the two periods was a gain on the sale of the Mountain Lake property and certain royalty assets of $11,189,425 and a fair value gain on the Debentures of $338,497 in the 6 months ended June 30, 2025, partially offset by an increase in general and administrative costs of $1,688,031. Other factors causing the difference between the two periods is further described below.
General and administrative costs
Share-based compensation was $3,047,236 in the six months ended June 30, 2025, compared to $2,231,325 in the six months ended June 30, 2024. The share-based compensation expense is a non-cash charge based on the Black-Scholes value of stock options, calculated using the graded vesting method. Stock options granted to directors, consultants and employees typically vest in three tranches – 1/3 immediately, 1/3 on the first anniversary of the grant date, and the remaining 1/3 on the second anniversary of the grant date, with the corresponding share-based compensation expense being recognized over this period. The increase in the current period was primarily due to stock options granted during the six months ended June 30, 2025 while no material amounts were granted in the prior period.
Administrative salaries, contractor and directors’ fees of $1,584,112 for the six months ended June 30, 2025, decreased from $1,873,115 during the prior period primarily due to a smaller management team as compared to the prior period.
|
|
ISOENERGY LTD.
For the three and six months ended June 30, 2025 and 2024
Investor relations expenses relate primarily to costs incurred in communicating with existing and potential shareholders, conferences and marketing. The variance between the two periods is for similar reasons discussed above for the three months ended June 30, 2025.
Office and administrative expenses primarily consist of office operating costs and other general administrative costs. The variance between the two periods is for similar reasons discussed above for the three months ended June 30, 2025.
Professional and consultant fees were $1,950,470 for the six months ended June 30, 2025, compared to $1,360,712 for the six months ended June 30, 2024. Professional fees were higher mainly due to similar reasons discussed above for the three months ended June 30, 2025.
Travel expenses primarily relate to travel and accommodation costs for conferences, business development activities, public relations activities, and general corporate purposes. Travel costs between the two periods remained mostly similar as the timing of business development and corporate activities mostly offset the timing of site visits between the two periods.
Public company costs consist primarily of costs associated with the Company’s continuous disclosure obligations, listing fees, directors and officers insurance, transfer agent costs, press releases and other shareholder communications. The increase in public company costs from the prior period is for similar reasons discussed above for the three months ended June 30, 2025.
Other items
The Company recorded interest income of $674,684 in the six months ended June 30, 2025, compared to $1,050,077 in the three months ended June 30, 2024, which represents interest earned on cash balances and the Bridge Loan advanced to Anfield Energy. The amounts were lower in the six months ended June 30, 2025 mainly due to a lower average cash balance and a decrease in interest rates earned on cash, partially offset by interest earned on the Bridge Loan to Anfield Energy, which was fully repaid in January 2025.
Interest expense on the Debentures was $489,144 in the six months ended June 30, 2025, which was lower than the $618,095 in the six months ended June 30, 2024. The reasons for the decrease in the interest expense on the Debentures between the two periods are for similar reasons discussed above for the three months ended June 30, 2025.
The fair value of the Debentures on June 30, 2025 was $15,980,791 compared to $30,279,306 on December 31, 2024. The decrease in the fair value of the Debentures is primarily due to the partial conversion of the 2020 Debentures which resulted in debentures with a fair value of $13,928,728 being derecognized. The fair value was further decreased by a fair value gain on the Debentures of $338,497 included in the statement of income and a fair value gain attributable to the change in credit risk of $31,290 included in other comprehensive income (loss).
Foreign exchange loss was $68,945 in the six months ended June 30, 2025, compared to a gain of $12,534 in the six months ended June 30, 2024, and mainly relates to the same fluctuations discussed above for the three months ended June 30, 2025.
Other income was $523,942 in the six months ended June 30, 2025, compared to $46,702 in the six months ended June 30, 2024. This primarily relates to higher timber sales and an increase in rental income earned from the Company’s operations in the US.
The Company records a deferred tax recovery or expense which is comprised of a recovery on losses or expense on gains recognized in the period and, when applicable, the release of flow-through share premium liability which is offset by the renunciation of flow-through share expenditures to shareholders. In the six months ended June 30, 2025, this resulted in an expense of $339,523, compared to a recovery of $488,674 in the six months ended June 30, 2024. The increase in expense is mainly due to a gain in the period as compared to a loss in the prior period and a smaller proportion of flow-through share spending renounced during the six months ended June 30, 2025.
|
|
ISOENERGY LTD.
For the three and six months ended June 30, 2025 and 2024
SUMMARY OF QUARTERLY RESULTS
The following information is derived from the Company’s Interim and Annual Financial Statements prepared in accordance with IFRS. The information below should be read in conjunction with the Company’s interim and annual financial statements for each of the past seven quarters.
| Jun. 30, 2025 | Mar. 31, 2025 | Dec. 31, 2024 | Sep. 30, 2024 | |||||||||||||
| Revenue | Nil | Nil | Nil | Nil | ||||||||||||
| Net (loss) income | $ | (1,887,270 | ) | $ | 5,105,615 | $ | (35,505,105 | ) | $ | 4,159,285 | ||||||
| Net (loss) income per share: (1) | ||||||||||||||||
| Basic | $ | (0.04 | ) | $ | 0.11 | $ | (0.80 | ) | $ | 0.08 | ||||||
| Diluted | $ | (0.03 | ) | $ | 0.10 | $ | (0.88 | ) | $ | (0.00 | ) | |||||
| Loss from discontinued operations (2) | Nil | Nil | Nil | $ | (1,859 | ) | ||||||||||
| Loss from discontinued operations per share – basic and diluted (1)(2) | Nil | Nil | Nil | $ | (0.00 | ) | ||||||||||
| Jun. 30, 2024 | Mar. 31, 2024 | Dec. 31, 2023 | Sep. 30, 2023 | |||||||||||||
| Revenue | Nil | Nil | Nil | Nil | ||||||||||||
| Net (loss) income | $ | (6,059,293 | ) | $ | (4,729,978 | ) | $ | 4,630,838 | $ | (21,988,054 | ) | |||||
| Net (loss) income per share: (1) | ||||||||||||||||
| Basic | $ | (0.13 | ) | $ | 0.16 | $ | 0.16 | $ | (0.80 | ) | ||||||
| Diluted | $ | (0.13 | ) | $ | (0.08 | ) | $ | (0.08 | ) | $ | (0.80 | ) | ||||
| Loss from discontinued operations (2) | $ | (55,133 | ) | $ | (71,366 | ) | $ | (17,856 | ) | Nil | ||||||
| Loss from discontinued operations per share – basic and diluted (1)(2) | $ | (0.00 | ) | $ | (0.00 | ) | $ | (0.00 | ) | Nil | ||||||
| (1) | (Loss) income per share amounts in the past seven quarters presented are retroactively restated on a post-consolidation basis. Refer to the discussion on the Share Consolidation, as described above in “About IsoEnergy”. | |
| (2) | Loss from discontinued operations relates to the Argentina reporting segment, as described above. |
IsoEnergy does not derive any revenue from its operations. Its primary focus is the acquisition, exploration and development of mineral properties. As a result, the income (loss) per period has fluctuated depending on the Company’s activity level and periodic variances in certain items. Quarterly periods are therefore not comparable. As part of the Company’s strategy to evaluate additional Merger and Acquisition (“M&A”) opportunities throughout the life cycle of mineral properties, the Company may incur gains or losses related to such transactions or incur expenses for M&A opportunities that do not materialize. In the three months ended June 30, 2025, a gain of $820,394 was recorded on the sale of certain of the Company’s royalty assets; in three months ended March 31, 2025, a $10,369,031 gain was recorded on the sale of the Mountain Lake property; in the three months ended December 31, 2024, a loss of $25,616,241 was recorded from the contribution of exploration and evaluation assets to the Purepoint Joint Venture; and in the three months ended June 30, 2024, a $5,300,611 gain was recorded on the disposal of its Argentina assets.
The Company also assesses for indicators of impairment on its property and equipment and exploration and evaluation assets quarterly, as required by the relevant IFRS. If such indicators are identified, an analysis to determine its recoverable value is performed and if such amount is lower than the carrying value, a loss is recognized for the difference. In the three months ended December 31, 2024, the Company identified indicators of impairment on certain exploration and evaluation assets located in the Athabasca Basin primarily as a result of the loss on the formation of the Purepoint Joint Venture and recorded a write-down of $14,342,736.
|
|
ISOENERGY LTD.
For the three and six months ended June 30, 2025 and 2024
In the third quarter of 2020, the Company issued the 2020 Debentures and in the fourth quarter of 2022 issued the 2022 Debentures, both of which are accounted for as measured at fair value through profit and loss, which has resulted in a gain on the revaluation of the Debentures in the three months ended June 30, 2023, three months ended December 31, 2023, three months ended September 30, 2024, three months ended December 31, 2024, three months ended June 30, 2025, and losses in every other period.
LIQUIDITY AND CAPITAL RESOURCES
IsoEnergy has no revenue-producing operations, earns only minimal interest income on cash, and is expected to have recurring operating losses. As of June 30, 2025, the Company had an accumulated deficit of $99,326,901.
During the six months ended June 30, 2025, the Company utilized cash on hand to invest $8,826,282 (net of changes in accounts payable) in exploration and evaluation assets, $6,313,318 for expenditure on its corporate and business development activities, including movements in working capital, and was repaid $6,168,995 including interest on the Bridge Loan previously advanced to Anfield Energy.
During the six months ended June 30, 2025, the Company received $73,008,668 in net proceeds from the Bought Deal Financing, February 2025 Flow-Through Financing, and the Concurrent Private Placement with NexGen.
As of the date of this MD&A, the Company has approximately $81.7 million in cash, $43.3 million in marketable securities and $125.3 million in adjusted working capital.
The Company has fully funded its global exploration and pre-development activities, as well as any corporate initiatives and general working capital, up to the end of December 31, 2025 and beyond.
The ability of the Company to continue as a going concern is dependent on its ability to obtain financing and achieve future profitable operations.
Should the Company require additional financing under its $200 million base shelf prospectus filed on September 5, 2024 or otherwise, Management will determine whether to accept any offer to finance, weighing such factors as the financing terms, the results of exploration programs and technical studies, the Company’s share price at the time and current market conditions, among others. Circumstances that could impair the Company’s ability to raise additional funds include general economic conditions, the price of uranium and certain other factors set forth under “Risk Factors” below and above under “Industry and Economic Factors that May Affect the Business”. A failure to obtain financing as and when required, could require the Company to reduce its exploration and corporate activity levels.
Use of Proceeds
On December 6, 2023, the Company received the proceeds from a $36.6 million financing initially closed in escrow on October 19, 2023. The net proceeds of the financing were to be used to advance exploration and development of the Company’s uranium assets, as well as for working capital and general corporate purposes. On February 9, 2024, the Company completed a brokered “bought-deal” private placement for gross proceeds of $23 million (the “February 2024 Private Placement”). The proceeds from the February 2024 Private Placement are required to be spent on eligible “Canadian exploration expenses” that will qualify as “flow-through critical mineral mining expenditures” (in each case as defined in the Tax Act) by December 31, 2025.
|
|
ISOENERGY LTD.
For the three and six months ended June 30, 2025 and 2024
On February 28, 2025, the Company received gross proceeds of $20.0 million from the February 2025 Flow-Through Financing and $6.3 million from the Concurrent Private Placement. The proceeds from the February 2025 Flow-Through Financing are required to be spent on eligible “Canadian exploration expenses” that will qualify as “flow-through critical mineral mining expenditures” (in each case as defined in the Tax Act) by December 31, 2026. The proceeds of Concurrent Private Placement of the financing were to be used for other non-qualifying exploration of the Company’s Canadian properties, costs associated with the listing on the NYSE American, and for working capital and general corporate purposes.
On June 24, 2025, the Company received gross proceeds of $51.2 million from the Bought Deal Financing. The proceeds of the Bought Deal Offering are expected to be used to fund continued development and further exploration of the Company’s mineral properties, and for general corporate purposes.
The gross proceeds received from these financings have been used as follows:
| Proceeds | Anticipated use of proceeds |
Use of proceeds to June 30, 2025 |
Remaining at June 30, 2025 |
|||||||||
| December 6, 2023 financing: | ||||||||||||
| Exploration and development, working capital, and general corporate purposes | $ | 36,605,250 | $ | 26,232,372 | $ | 10,372,878 | ||||||
| February 2024 Private Placement: | ||||||||||||
| Canadian exploration expenses | 23,000,000 | 20,622,929 | 2,377,071 | |||||||||
| February 2025 Flow-Through Financing: | ||||||||||||
| Canadian exploration expenses in 2025 | 9,420,000 | 886,754 | 8,533,246 | |||||||||
| Canadian exploration expenses in 2026 | 10,587,375 | - | 10,587,375 | |||||||||
| Concurrent Private Placement: | ||||||||||||
| Other exploration expenses | 750,000 | - | 750,000 | |||||||||
| NYSE American listing costs | 2,000,000 | 768,657 | 1,231,343 | |||||||||
| Costs associated with the February 2024 Flow-Through Financing | 1,600,000 | 1,600,000 | - | |||||||||
| General corporate purposes | 1,900,000 | - | 1,900,000 | |||||||||
| Bought Deal Financing: | ||||||||||||
| Development and exploration | 39,515,000 | - | 39,515,000 | |||||||||
| Equity investments and acquisition- related expenditures | 5,000,000 | - | 5,000,000 | |||||||||
| General corporate purposes | 4,400,000 | - | 4,400,000 | |||||||||
| Costs associated with the Bought Deal Financing | 2,300,000 | 2,300,000 | - | |||||||||
| $ | 137,077,625 | $ | 52,410,712 | $ | 84,666,913 | |||||||
The balance of the proceeds remaining in treasury are intended to be applied towards the intended uses described above. The Company’s properties are in good standing with the applicable governmental authority. Other than the contractually agreed upon exploration budget in 2025 for the Purepoint Joint Venture, the Company does not have any contractually imposed expenditure requirements.
The Company has not paid any dividends and management does not expect that this will change in the near future. Working capital is mainly held in cash, cash deposits available on short-term demand, and marketable securities, all of which are highly liquid.
|
|
ISOENERGY LTD.
For the three and six months ended June 30, 2025 and 2024
COMMITMENTS AND CONTINGENCIES
The Company’s significant undiscounted commitments at June 30, 2025 are as follows. The Debentures are classified as a current liability, however the counterparty conversion option allows the principal to be converted to common shares.
| Less than 1 year | 1 to 3 years | 4 to 5 years | Total | |||||||||||||
| Accounts payable and accrued liabilities | $ | 3,415,933 | $ | - | $ | - | $ | 3,415,933 | ||||||||
| Debentures | 15,980,791 | - | - | 15,980,791 | ||||||||||||
| Flow-through share premium liabilities | 8,028,580 | - | - | 8,028,580 | ||||||||||||
| Purepoint Joint Venture advances | 1,334,000 | - | - | 1,334,000 | ||||||||||||
| Lease liabilities | 197,976 | 324,559 | 77,733 | 600,268 | ||||||||||||
| $ | 28,957,280 | $ | 324,559 | $ | 77,733 | $ | 29,359,572 | |||||||||
Flow-through funding commitments
The premium received for a flow-through share, which is the price received for the share in excess of the market price of the share, is recorded as a flow-through share premium liability. This liability is subsequently reduced when the required exploration expenditures are made, on a pro rata basis, and accordingly, a recovery of flow-through premium is then recorded as a reduction in the deferred tax expense to the extent that deferred income tax assets are available.
As of June 30, 2025, the Company is obligated to spend $2,377,071 on eligible exploration expenditures by December 31, 2025 related to the February 2024 Private Placement and $19,120,621 on eligible exploration expenditures by December 31, 2026 related to the February 2025 Flow-Through Financing.
Contingent payment obligations
The Company has an obligation to make a contingent payment of $500,000 related to the acquisition of the West Newcastle Range, Teddy Mountain and Ardmore East Projects, if either of the following milestones are met within eight years:
| · | a NI 43-101 compliant Mineral Resource estimate for the West Newcastle Range and Teddy Mountain Projects is prepared where the Mineral Resource estimate is greater than or equal to 6.0 million pounds of U₃O₈; or |
| · | with respect to the Ardmore East Project, the Mineral Resources estimate is greater than or equal to 6.0 million pounds of U₃O₈ equivalent. |
Royalties and Environmental Obligations
In addition to applicable federal, provincial/state and municipal severance taxes, duties and advance royalties, the Company’s exploration and evaluation properties are subject to certain royalties, which may or may not be payable in future, depending on whether revenue is derived from the claims or leases to which these royalties are applicable.
The Company’s mining and exploration activities are subject to various laws and regulations governing the protection of the environment. These laws and regulations are continually changing and generally becoming more restrictive. The Company believes its operations are materially in compliance with all applicable laws and regulations. The Company has made, and expects to make in the future, expenditures to comply with such laws and regulations.
|
|
ISOENERGY LTD.
For the three and six months ended June 30, 2025 and 2024
OUTSTANDING SHARE DATA(1)
The authorized capital of IsoEnergy consists of an unlimited number of common shares. As of the date of this MD&A, there were 53,377,771 common shares, 4,053,832 stock options, and 87,500 RSUs outstanding, each stock option entitling the holder to purchase one common share of IsoEnergy.
In August 2020, the Company issued the 2020 Debentures with an 8.5% coupon and a five-year term, which are convertible at $3.52 per share; and in December 2022, the Company issued the 2022 Debentures with a 10% coupon and a five-year term, which are convertible at $17.32 per share. The Company has US$3 million and US$4 million principal remaining outstanding from the 2020 Debentures and 2022 Debentures, respectively.
Stock options outstanding as of the date of this MD&A, and the range of exercise prices thereof are set forth below:
| Range of exercise prices |
Number of options |
Weighted average exercise price |
Number of options exercisable |
Weighted average exercise price |
Weighted average remaining contractual life (years) |
|||||||||||||||
| $4.20 - $10.44 | 334,862 | $ | 9.70 | 334,862 | $ | 9.70 | 2.6 | |||||||||||||
| $10.45 - $12.44 | 1,017,276 | 11.73 | 673,026 | 11.73 | 3.1 | |||||||||||||||
| $12.45 - $15.24 | 1,323,327 | 13.25 | 858,577 | 13.51 | 3.1 | |||||||||||||||
| $15.25 - $16.48 | 490,000 | 15.96 | 490,000 | 15.96 | 1.4 | |||||||||||||||
| $16.49 - $18.16 | 590,483 | 16.56 | 423,816 | 16.57 | 3.0 | |||||||||||||||
| $18.17 - $20.40 | 297,884 | 19.92 | 297,884 | 19.92 | 1.4 | |||||||||||||||
| 4,053,832 | $ | 13.88 | 3,078,165 | $ | 14.14 | 2.7 | ||||||||||||||
OFF-BALANCE SHEET ARRANGEMENTS
The Company had no off-balance sheet arrangements as of June 30, 2025 or as of the date hereof.
NON-IFRS FINANCIAL MEASURES
Working capital and adjusted working capital are non-IFRS financial measures included in this MD&A, as discussed below. We believe that working capital and adjusted working capital, in addition to conventional measures prepared in accordance with IFRS, provide investors with an improved ability to evaluate the underlying financial position of the Company. These non-IFRS financial measures are intended to provide additional information and should not be considered in isolation or as a substitute for measures of performance prepared in accordance with IFRS. This financial measure does not have any standardized meaning prescribed under IFRS and therefore may not be comparable to those of other issuers.
Non-IFRS financial measures are defined in National Instrument 52-112 – Non-GAAP and Other Financial Measures Disclosure as a financial measure disclosed that (a) depicts the historical or expected future financial performance, financial position or cash flow of an entity, (b) with respect to its composition, excludes an amount that is included in, or includes an amount that is excluded from, the composition of the most directly comparable financial measure disclosed in the primary financial statements of the entity, (c) is not disclosed in the financial statements of the entity, and (d) is not a ratio, fraction, percentage or similar representation.
| (1) | Amounts are retroactively restated on a post-consolidation basis. Refer to the discussion on the Share Consolidation, as described above in “About IsoEnergy”. |
|
|
ISOENERGY LTD.
For the three and six months ended June 30, 2025 and 2024
The adjusted working capital amount disclosed in this MD&A would be considered a non-IFRS financial measure and is defined as current assets less current liabilities, excluding flow-though share premium liabilities and debenture liabilities, as calculated below:
| Current assets | $ | 128,491,725 | ||
| Current liabilities | (27,578,269 | ) | ||
| Working capital | 100,913,456 | |||
| Flow-through share premium liability | 8,028,580 | |||
| Debentures | 15,980,791 | |||
| Adjusted working capital | $ | 124,922,827 |
TRANSACTIONS WITH RELATED PARTIES
NexGen is a related party of the Company due to its ownership in the Company and the overlapping members of the Board between NexGen and the Company. The Company’s key management personnel and directors are related parties. The following companies are related parties due to their relationship to the Company: Atha Energy Corp. (“Atha Energy”), Premier American Uranium Inc. (“Premier American Uranium”), Green Shift Commodities Ltd. (“Green Shift”), and Purepoint Uranium.
Key management personnel include those persons having authority and responsibility for planning, directing and controlling the activities of the Company as a whole. The Company has determined that key management personnel consist of members of the Board and the Company’s senior officers.
Remuneration attributed to key management personnel is summarized as follows. The amounts below in the prior period include short-term compensation and share-based compensation paid to the former President and Executive Vice-President, Exploration & Development, who resigned on August 31, 2024 and October 31, 2024, respectively.
| Three months ended June 30, 2025 | Short term compensation | Share-based compensation | Total | |||||||||
| Expensed to the statement of income (loss) and comprehensive income | $ | 432,501 | $ | 952,474 | $ | 1,384,975 | ||||||
| Capitalized to exploration and evaluation assets | 63,921 | 71,477 | 135,398 | |||||||||
| $ | 496,422 | $ | 1,023,951 | $ | 1,520,373 | |||||||
| Six months ended June 30, 2025 | Short term compensation | Share-based compensation | Total | |||||||||
| Expensed to the statement of income (loss) and comprehensive income | $ | 867,464 | $ | 2,612,468 | $ | 3,479,932 | ||||||
| Capitalized to exploration and evaluation assets | 128,244 | 201,739 | 329,983 | |||||||||
| $ | 995,708 | $ | 2,814,207 | $ | 3,809,915 | |||||||
|
|
ISOENERGY LTD.
For the three and six months ended June 30, 2025 and 2024
| Three months ended June 30, 2024 | Short term compensation | Share-based compensation | Total | |||||||||
| Expensed to the statement of income (loss) and comprehensive income | $ | 499,355 | $ | 856,382 | $ | 1,355,737 | ||||||
| Capitalized to exploration and evaluation assets | 28,582 | 90,518 | 119,100 | |||||||||
| $ | 527,937 | $ | 946,900 | $ | 1,474,837 | |||||||
| Six months ended June 30, 2024 | Short term compensation | Share-based compensation | Total | |||||||||
| Expensed to the statement of income (loss) and comprehensive income | $ | 898,180 | $ | 1,673,388 | $ | 2,571,568 | ||||||
| Capitalized to exploration and evaluation assets | 153,192 | 144,892 | 298,084 | |||||||||
| $ | 1,051,372 | $ | 1,818,280 | $ | 2,869,652 | |||||||
As of June 30, 2025:
| · | $39,878 (December 31, 2024: $1,120,402) was included in accounts payable and accrued liabilities owed to related parties and directors and officers; and | |
| · | $130,956 (December 31, 2024: $99,449) due from related companies was included in accounts receivable. |
During the six months ended June 30, 2025, the Company:
| · | reimbursed NexGen $5,540 (2024: $16,016) for use of NexGen’s office space; and | |
| · | received $20,539 (2024: $8,502) from Premier American Uranium primarily as reimbursement for salaries (2024: Latitude Uranium Inc. (acquired by Atha Energy in 2024) and Green Shift for equipment rentals and as reimbursement for office expenses and salaries). |
On February 9, 2024, NexGen’s shareholding in the Company was diluted from 33.8% to 33.1% as a result of the issuance of 920,000 flow through common shares(1) of the Company pursuant to the February 2024 Private Placement, in which NexGen did not participate. On January 19, 2025, NexGen’s shareholding was reduced to 31.8% as a result of the issuance of common shares on the conversion of US$3,000,000 of principal of 2020 Debentures. Concurrent with the February 2025 Flow-Through Financing, NexGen’s shareholding in the Company was maintained at 31.8% as a result of subscribing to 625,000 common shares(1) of the Company as part of the Concurrent Private Placement. NexGen’s shareholding in the Company was diluted from 31.8% to 30.9% as a result of the Bought Deal Financing, of which NexGen purchased 1,200,000 common shares.
(1) Common shares issued are retroactively restated on a post-consolidation basis. Refer to the discussion on the Share Consolidation, as described above in “About IsoEnergy”.
|
|
ISOENERGY LTD.
For the three and six months ended June 30, 2025 and 2024
CRITICAL ACCOUNTING JUDGMENTS, ESTIMATES AND ASSUMPTIONS
The preparation of the Interim Financial Statements requires management to make judgments, estimates and assumptions that affect the reported amounts of assets, liabilities, and contingent liabilities at the date of the Interim Financial Statements and the reported amounts of revenues and expenses during the reporting period. Estimates and assumptions are continuously evaluated and are based on management’s experience and other factors, including expectations of future events that are believed to be reasonable in the circumstances. Uncertainty about these judgments, estimates and assumptions could result in outcomes that require a material adjustment to the carrying amount of the asset or liability affected in future periods. Information about significant areas of judgement, estimation uncertainty and assumptions considered by management in preparing the Interim Financial Statements are the same as described in the Annual Financial Statements.
CHANGES IN ACCOUNTING POLICIES INCLUDING INITIAL ADOPTION
The Interim Financial Statements were prepared in accordance with IAS 34 and its interpretations adopted by the IASB and follow the same accounting policies and methods as described in the Annual Financial Statements, including the adoption of the following accounting policy amendment as required.
Amendment to IAS 21 – Lack of exchangeability
The IASB has issued an amendment to IAS 21 – The Effects of Changes in Foreign Exchange Rates when one foreign currency cannot be exchanged into another. This may occur because of government-imposed controls on capital imports or exports, or a limitation on the volume of foreign currency transactions that can be undertaken at an official exchange rate. The amendment clarifies when a currency is considered exchangeable into another currency and how an entity estimates a spot rate for currencies that lack exchangeability. The amendment is effective for annual reporting periods beginning on or after January 1, 2025, with early adoption permitted.
The Company adopted this amendment on January 1, 2025 as required. There were no changes to the Interim Financial Statements from adopting this amendment.
CAPITAL MANAGEMENT AND RESOURCES
The Company manages its capital structure, defined as total equity plus debt, and adjusts it, based on the funds available to the Company, in order to support the acquisition, exploration and evaluation of assets. The Board does not impose quantitative return on capital criteria for management, but rather relies on the expertise of the Company’s management to sustain the future development of the business.
In the management of capital, the Company considers all types of funding alternatives, including equity, debt and other means and is dependent on third party financing. Although the Company has been successful in raising funds to date, there is no assurance that the Company will be successful in obtaining required financing in the future or that such financing will be available on terms acceptable to the Company.
The properties in which the Company currently has an interest are in the exploration and development stage. As such the Company, has historically relied on the equity markets to fund its activities. The Company will continue to assess new properties and seek to acquire an interest in additional properties if it determines that there is sufficient geologic or economic potential and if it has adequate financial resources to do so.
Management reviews its capital management approach on an on-going basis and believes that this approach, given the relative size of the Company, is reasonable. The Company is not subject to externally imposed capital requirements. There were no changes in the Company’s approach to capital management during the period.
|
|
ISOENERGY LTD.
For the three and six months ended June 30, 2025 and 2024
FINANCIAL INSTRUMENTS
The Company’s financial instruments consist of cash and cash equivalents, accounts receivable, marketable securities, accounts payable and accrued liabilities, and convertible debentures.
Fair Value Measurement
The Company classifies the fair value of financial instruments according to the following hierarchy based on the amount of observable inputs used to value the instrument:
| · | Level 1 – quoted prices in active markets for identical assets or liabilities. |
| · | Level 2 – inputs other than quoted prices included in Level 1 that are observable for the asset or liability, either directly (i.e. as prices) or indirectly (i.e. derived from prices). |
| · | Level 3 – inputs for the asset or liability that are not based on observable market data. |
The fair values of the Company’s cash and cash equivalents, accounts receivable, and accounts payable and accrued liabilities approximate their carrying value, due to their short-term maturities or liquidity.
The Debentures are re-measured at fair value at each reporting date with any change in fair value recognized in profit or loss, except for the change in fair value that is attributable to change in credit risk, which is presented in other comprehensive income (loss). The Debentures are classified as Level 2.
The marketable securities are re-measured at fair value at each reporting date with any change in fair value recognized in other comprehensive income (loss). The common shares included in marketable securities are Level 1, except for the common shares of Jaguar Uranium and Royal Uranium, which are Level 3 and their fair value is primarily based on the price of their most recent share issuances. The warrants included in marketable securities are Level 2.
Financial instrument risk exposure
As of June 30, 2025, the Company’s financial instrument risk exposure and the impact thereof on the Company’s financial instruments are summarized below:
| (a) | Credit Risk |
Credit risk is the risk that one party to a financial instrument will fail to discharge an obligation and cause the other party to incur a financial loss. As at June 30, 2025, the Company has cash on deposit and cash equivalents with large banks in Canada, the United States, and Australia. Credit risk is concentrated as a significant amount of the Company’s cash and cash equivalents is held at one financial institution. Management believes the risk of loss to be remote.
The Company’s accounts receivable mostly consists of input tax credits receivable from the Governments of Canada and Australia and amounts receivable from related parties. Accordingly, the Company does not believe it is subject to significant credit risk. The Company’s loan receivable from Anfield Energy includes interest receivable and was repaid in its entirety during the six months ended June 30, 2025.
(b) Liquidity Risk
Liquidity risk is the risk that an entity will encounter difficulty in raising funds to meet its obligations under financial instruments. The Company manages liquidity risk by maintaining sufficient cash balances that are accessible on deposit or on short-term notice. Liquidity requirements are managed based on expected cash flows to ensure that there is sufficient capital to meet short-term obligations. As at June 30, 2025, the Company had an adjusted working capital balance of $124,922,827, including cash and cash equivalents of $84,666,913.
|
|
ISOENERGY LTD.
For the three and six months ended June 30, 2025 and 2024
| (c) | Market Risk |
Market risk is the risk of loss that may arise from changes in market factors such as interest rates, foreign exchange rates and commodity and equity prices.
| (i) | Interest Rate Risk |
Interest rate risk is the risk that the future cash flows from a financial instrument will fluctuate due to changes in market interest rates. The Company holds its cash and cash equivalents in bank accounts that earn variable interest rates. Due to the short-term nature of these financial instruments, fluctuations in market rates do not have a significant impact on the estimated fair value of the Company’s cash and cash equivalent balances as of June 30, 2025. The interest on the Debentures is fixed and not subject to market fluctuations.
| (ii) | Foreign Currency Risk |
The functional currency of the Company is the Canadian dollar. Certain of the Company’s subsidiaries use the US dollar and Australian dollar as functional currencies. The Company is affected by currency transaction risk and currency translation risk. Consequently, fluctuations of the Canadian dollar in relation to other currencies impact the fair value of financial assets, liabilities and operating results. Financial assets and liabilities subject to currency translation risk primarily include US dollar and Australian dollar denominated cash, US dollar and Australian dollar accounts receivable, US dollar and Australian dollar marketable securities, US dollar and Australian dollar accounts payable and accrued liabilities, and the Debentures. The Company maintains Canadian, US and Australian dollar bank accounts.
The Company is exposed to foreign exchange risk on its US dollar denominated cash, accounts payable and accrued liabilities, accounts receivable, marketable securities and Debentures. At its respective maturity dates, the principal amounts of the Debentures are due in full, and prior to then at a premium upon the occurrence of certain events, including a change of control. The Company holds sufficient US dollars to make all cash interest payments due under the Debentures until maturity but not to pay the principal amount. Accordingly, the Company is subject to risks associated with fluctuations in the Canadian/US dollar exchange rate that may make the Debentures more costly to repay.
A 5% change in the US dollar exchange rate can result in a net increase or decrease in the Company’s US dollar-based cash, accounts receivable, marketable securities, accounts payable and accrued liabilities, and Debentures of $28,817 that would flow through the consolidated statement of income (loss) and comprehensive income.
The Company is also exposed to foreign exchange risk on its Australian dollar denominated cash, accounts receivable, marketable securities, and accounts payable and accrued liabilities. Accordingly, the Company is subject to risks associated with fluctuations in the Canadian/Australian dollar exchange rate that may impact on its operating results.
A 5% change in the Australian dollar can increase or decrease the value of the Company’s Australian dollar-based cash, accounts receivable, marketable securities, and accounts payable and accrued liabilities and accounts receivable by $58,867 that would flow through consolidated statement of income (loss) and comprehensive income.
|
|
ISOENERGY LTD.
For the three and six months ended June 30, 2025 and 2024
| (iii) | Price Risk |
The Company is exposed to price risk with respect to commodity and equity prices. Equity price risk is defined as the potential adverse impact of movements in individual equity prices or general movements in the level of the stock market on the Company’s financial performance. Commodity price risk is defined as the potential adverse impact of commodity price movements and volatilities on financial performance and economic value. Future declines in commodity prices may impact the valuation of long-lived assets. The Company closely monitors the commodity prices of uranium, individual equity movements, and the stock market. The Company holds marketable securities which are subject to equity price risk.
RISK FACTORS
The operations of the Company are speculative due to the high-risk nature of its business which is the exploration and development of mineral properties.
Regulatory Factors and International Trade Restrictions
The international uranium industry, including the supply of uranium concentrates, is relatively small, highly competitive and heavily regulated. Worldwide demand for uranium is directly tied to the demand for electricity produced by the nuclear power industry, which is also subject to extensive government regulation and policies. The development of mines and related facilities is contingent upon governmental approvals that are complex and time consuming to obtain and which, depending upon the location of the project, involve multiple governmental agencies. The duration and success of such approvals are subject to many variables outside of the Company’s control. Any significant delays in obtaining or renewing such permits or licences in the future could have a material adverse effect on the Company.
In addition, the international marketing and trade of uranium is subject to potential changes in governmental policies, regulatory requirements and international trade restrictions (including trade agreements, customs, duties and taxes), which are beyond the control of the Company. Changes in regulatory requirements, customs, duties or taxes may affect the supply of uranium to the United States and Europe, which are currently the largest consumption markets for uranium in the world, as well as the future of supply to developing markets, such as China and India.
In particular, pursuant to an executive order, the United States has recently enacted significant new import tariffs on trade and transactions with Canada and other trading partners. Canada has announced proposed retaliatory import tariffs on trade and transactions from the United States. There is significant uncertainty surrounding further changes in governmental policy, particularly with respect to such trade policies, treaties and tariffs. These developments, and any similar further changes in governmental policy, may have a material adverse effect on global economic conditions and financial markets. The full economic impact of any such changes in governmental policy on the Company remains uncertain and is dependent on the severity and duration of the tariffs and any other measures imposed which, if prolonged, could increase costs and decrease demand for any minerals that may be extracted by the Company.
For a comprehensive list of the risks and uncertainties facing the Company, please see “Risk Factors” in the Company’s AIF and the “Industry and Economic Factors that May Affect the Business” included above in the Overall Performance section of this MD&A. These are not the only risks and uncertainties that the Company faces. Additional risks and uncertainties not presently known to the Company or that the Company currently considers immaterial may also impair its business operations. These risk factors could materially affect the Company's future operating results and could cause actual events to differ materially from those described in forward-looking statements relating to the Company. Further risk factors are discussed in more detail in the Company’s AIF.
|
|
ISOENERGY LTD.
For the three and six months ended June 30, 2025 and 2024
SEGMENT INFORMATION
The Company has one operating segment, being the acquisition, exploration and development of uranium properties. The Company’s non-current assets are in three countries: Canada, the United States and Australia, with the corporate office in Canada. The geographic segmented disclosure of the Company’s financial information is as follows. Certain comparative amounts for the prior period have been reclassified to conform to the current period’s presentation.
| As at June 30, 2025 | Canada | United States | Australia | Total | ||||||||||||
| Current assets | $ | 127,520,008 | $ | 826,365 | $ | 145,352 | $ | 128,491,725 | ||||||||
| Property and equipment | 836,419 | 14,865,478 | - | 15,701,897 | ||||||||||||
| Exploration and evaluation assets | 102,467,860 | 135,302,057 | 26,060,925 | 263,830,842 | ||||||||||||
| Other non-current assets | - | 2,193,604 | 412,742 | 2,606,346 | ||||||||||||
| Total assets | $ | 230,824,287 | $ | 153,187,504 | $ | 26,619,019 | $ | 410,630,810 | ||||||||
| Total liabilities | $ | 27,959,856 | $ | 1,751,842 | $ | 681,713 | $ | 30,393,411 | ||||||||
| As at December 31, 2024 | Canada | United States | Australia | Total | ||||||||||||
| Current assets | $ | 59,282,638 | $ | 193,709 | $ | 110,056 | $ | 59,586,403 | ||||||||
| Property and equipment | 689,410 | 15,542,892 | - | 16,232,302 | ||||||||||||
| Exploration and evaluation assets | 95,738,413 | 141,027,791 | 25,524,894 | 262,291,098 | ||||||||||||
| Other non-current assets | - | 2,314,201 | 411,019 | 2,725,220 | ||||||||||||
| Total assets | $ | 155,710,461 | $ | 159,078,593 | $ | 26,045,969 | $ | 340,835,023 | ||||||||
| Total liabilities | $ | 35,220,994 | $ | 1,837,525 | $ | 613,345 | $ | 37,671,864 | ||||||||
| Three months ended June 30, 2025 | Canada | United States | Australia | Total | ||||||||||||
| Share-based compensation | $ | 1,084,648 | $ | - | $ | 16,749 | $ | 1,101,397 | ||||||||
| Administrative salaries, contractor and director fees | 745,685 | 26,533 | 16,580 | 788,798 | ||||||||||||
| Investor relations | 302,131 | - | - | 302,131 | ||||||||||||
| Office and administrative | 252,355 | 34,193 | 6,909 | 293,457 | ||||||||||||
| Professional and consultant fees | 774,975 | 114,684 | - | 889,659 | ||||||||||||
| Travel | 97,594 | 3,814 | (11,116 | ) | 90,292 | |||||||||||
| Public company costs | 480,127 | - | - | 480,127 | ||||||||||||
| Total general and administrative expenditure | $ | 3,737,515 | $ | 179,224 | $ | 29,122 | $ | 3,945,861 | ||||||||
| Six months ended June 30, 2025 | Canada | United States | Australia | Total | ||||||||||||
| Share-based compensation | $ | 3,001,688 | $ | - | $ | 45,548 | $ | 3,047,236 | ||||||||
| Administrative salaries, contractor and director fees | 1,483,117 | 67,607 | 33,388 | 1,584,112 | ||||||||||||
| Investor relations | 523,087 | - | - | 523,087 | ||||||||||||
| Office and administrative | 466,432 | 55,835 | 15,190 | 537,457 | ||||||||||||
| Professional and consultant fees | 1,770,457 | 180,013 | - | 1,950,470 | ||||||||||||
| Travel | 262,503 | 3,814 | - | 266,317 | ||||||||||||
| Public company costs | 625,853 | - | - | 625,853 | ||||||||||||
| Total general and administrative expenditure | $ | 8,133,137 | $ | 307,269 | $ | 94,126 | $ | 8,534,532 | ||||||||
|
|
ISOENERGY LTD.
For the three and six months ended June 30, 2025 and 2024
| Three months ended June 30, 2024 | Canada | United States | Australia | Total | ||||||||||||
| Share-based compensation | $ | 1,033,202 | $ | - | $ | 21,594 | $ | 1,054,796 | ||||||||
| Administrative salaries, contractor and director fees | 755,559 | 17,469 | 29,050 | 802,078 | ||||||||||||
| Investor relations | 244,021 | - | - | 244,021 | ||||||||||||
| Office and administrative | 152,732 | 24,088 | 7,704 | 184,524 | ||||||||||||
| Professional and consultant fees | 611,276 | 90,564 | - | 701,840 | ||||||||||||
| Travel | 116,108 | - | 1,578 | 117,686 | ||||||||||||
| Public company costs | 94,788 | - | - | 94,788 | ||||||||||||
| Total general and administrative expenditure | $ | 3,007,686 | $ | 132,121 | $ | 59,926 | $ | 3,199,733 | ||||||||
| Six months ended June 30, 2024 | Canada | United States | Australia | Total | ||||||||||||
| Share-based compensation | $ | 2,188,137 | $ | - | $ | 43,188 | $ | 2,231,325 | ||||||||
| Administrative salaries, contractor and director fees | 1,794,697 | 37,222 | 41,196 | 1,873,115 | ||||||||||||
| Investor relations | 450,660 | - | - | 450,660 | ||||||||||||
| Office and administrative | 319,671 | 69,335 | 16,979 | 405,985 | ||||||||||||
| Professional and consultant fees | 1,101,572 | 259,140 | - | 1,360,712 | ||||||||||||
| Travel | 259,900 | - | 3,850 | 263,750 | ||||||||||||
| Public company costs | 260,954 | - | - | 260,954 | ||||||||||||
| Total general and administrative expenditure | $ | 6,375,591 | $ | 365,697 | $ | 105,213 | $ | 6,846,501 | ||||||||
The Company disposed of all net assets in the Argentina reporting segment in the year ended December 31, 2024. All income and expenses associated with the Argentina reporting segment are classified as discontinued operations. Results for the comparative period include:
| Three months ended June 30, 2024 |
Six months ended June 30, 2024 |
|||||||
| Office and administrative expenses | $ | 55,133 | $ | 89,443 | ||||
| Professional and consultant fees | - | 37,056 | ||||||
| Loss from discontinued operations | $ | (55,133 | ) | $ | (126,499 | ) | ||
DISCLOSURE CONTROLS AND INTERNAL CONTROL OVER FINANCIAL REPORTING
Disclosure Controls and Procedures
Disclosure controls and procedures are designed to provide reasonable assurance that material information is gathered and reported to management, including the Chief Executive Officer (“CEO”) and Chief Financial Officer (“CFO”), as appropriate to allow for timely decisions about public disclosures. The Company’s management, with the participation of its CEO and CFO, has evaluated the effectiveness of the design and operation of the Company’s disclosure controls and procedures, as defined in the rules of the US Securities and Exchange Commission and Canadian Securities Administrators. Based on the results of that evaluation, the Company’s CEO and CFO have concluded that, as of June 30, 2025, the Company’s disclosure controls and procedures framework provides reasonable assurance that the information required to be disclosed by the Company in reports it files is recorded, processed, summarized and reported, within the appropriate time periods and is accumulated and communicated to management, including the CEO and CFO, as appropriate to allow timely decisions regarding required information to be disclosed. Internal control over financial reporting are part of disclosure controls and procedures as they related to the production of financial statements in accordance with IFRS.
|
|
ISOENERGY LTD.
For the three and six months ended June 30, 2025 and 2024
Changes in Internal Control over Financial Reporting
Management, including the CEO and CFO, has evaluated the Company’s internal controls over financial reporting to determine whether any changes occurred during the period that have materially affected, or are reasonably likely to materially affect, the Company’s internal controls over financial reporting. During the six months ended June 30, 2025 there have been no significant changes in internal control over financial reporting that have materially affected, or are reasonably likely to materially affect, the Company’s internal control over financial reporting. Under the supervision and with the participation of management, including the CEO and CFO, management will continue to monitor and evaluate the design and effectiveness of its internal controls over financial reporting and disclosure controls and procedures, and may make modifications from time to time as considered necessary.
Limitations of Controls and Procedures
The Company’s management, including the CEO and CFO, believe that any control system, no matter how well conceived and operated, can provide only reasonable, not absolute, assurance that the objectives of the control system are met. Further, the design of a control system must reflect the fact that there are resource constraints, and the benefits of controls must be considered relative to their costs. Because of the inherent limitations in all control systems, they cannot provide absolute assurance that all control issues and instances of fraud, if any, within the Company have been prevented or detected. These inherent limitations include the realities that judgments in decision-making can be faulty, and that breakdowns can occur because of simple error or mistake. Additionally, controls can be circumvented by the individual acts of some persons, by collusion of two or more people, or by unauthorized override of the control. The design of any systems of controls also is based in part upon certain assumptions about the likelihood of future events, and there can be no assurance that any design will succeed in achieving its stated goals under all potential future conditions. Accordingly, because of the inherent limitations in a cost-effective control system, misstatements due to error or fraud may occur and not be detected.
|
|
ISOENERGY LTD.
For the three and six months ended June 30, 2025 and 2024
NOTE REGARDING FORWARD-LOOKING INFORMATION
This MD&A contains “forward-looking statements” (also referred to as “forward-looking information”) within the meaning of applicable Canadian securities legislation and US securities laws. “Forward-looking information” includes, but is not limited to, statements with respect to the activities, events or developments that the Company expects or anticipates will or may occur in the future, including, without limitation, the potential issuance of additional securities under the Company’s base shelf prospectus or otherwise, certain statements relating to “flow-through shares” as defined in the Tax Act, and the tax considerations relating thereto, the Company’s planned exploration and development activities and the anticipated results of ongoing and future exploration and development activities; capital expenditures and proposed work programs at the Company’s properties, the potential for, success of and anticipated timing of commencement of future commercial production at IsoEnergy’s properties, including expectations with respect to any permitting, development or other work that may be required to bring any of the projects into development or production. Generally, but not always, forward-looking information and statements can be identified by the use of words such as “plans”, “expects”, “is expected”, “budget”, “scheduled”, “estimates”, “forecasts”, “intends”, “anticipates”, or “believes” or the negative connotation thereof or variations of such words and phrases or state that certain actions, events or results “may”, “could”, “would”, “might” or “will be taken”, “occur” or “be achieved” or the negative connotation thereof. Statements relating to “mineral resources” may also be deemed forward-looking information as they involve estimates of the mineralization that will be encountered if a mineral deposit is developed and mined.
Such forward-looking information and statements are based on numerous assumptions, including material assumptions and estimates related to the below factors that, while the Company considers them reasonable as of the date of this MD&A, they are inherently subject to significant business, economic and competitive uncertainties and contingencies. Such assumptions include among others, that the results of planned exploration activities are completed as anticipated, that the results of the planned exploration activities are as anticipated, that the anticipated cost of planned exploration activities are as anticipated, that the Company will be able to execute its strategy as expected, that new mining techniques will have beneficial applications as expected and be available for use by the Company, continued engagement and collaboration with the communities and stakeholders, that general business and economic conditions will not change in a material adverse manner, including the price of uranium, that financing will be available if and when needed and on reasonable terms, and that third party contractors, equipment and supplies and governmental and other approvals required to conduct the Company’s planned exploration activities will be available on reasonable terms and in a timely manner. Although the assumptions made by the Company in providing forward-looking information or making forward-looking statements are considered reasonable by management at the time, there can be no assurance that such assumptions will prove to be accurate.
Forward-looking information and statements also involve known and unknown risks and uncertainties and other factors, which may cause actual events or results in future periods to differ materially from any projections of future events or results expressed or implied by such forward-looking information or statements, including, among others: negative operating cash flow and dependence on third party financing, uncertainty of additional financing, risks associated with the uncertainty of exploration results and estimates and that the mineral resource potential will be achieved on exploration projects, the Company having no known mineral reserves, resources may not be converted to reserves, the limited operating history of the Company, the influence of a large shareholder, alternative sources of energy and uranium prices, aboriginal title and consultation issues, reliance on key management and other personnel, actual results of exploration activities being different than anticipated, changes in exploration programs based upon results, availability of third party contractors, availability of equipment and supplies, failure of equipment to operate as anticipated; accidents, effects of weather and other natural phenomena and other risks associated with the mineral exploration industry, environmental risks, changes in laws and regulations, community relations and delays in obtaining governmental or other approvals and the risk factors with respect to the Company set out in the AIF and the Company’s other filings with the Canadian and US securities regulators and available under IsoEnergy’s profile on SEDAR+ at www.sedarplus.ca and EDGAR at www.sec.gov.
|
|
ISOENERGY LTD.
For the three and six months ended June 30, 2025 and 2024
Although the Company has attempted to identify important factors that could cause actual results to differ materially from those contained in the forward-looking information or implied by forward-looking information, there may be other factors that cause results not to be as anticipated, estimated or intended. There can be no assurance that forward-looking information and statements will prove to be accurate, as actual results and future events could differ materially from those anticipated, estimated or intended. Accordingly, readers should not place undue reliance on forward-looking statements or information. The Company undertakes no obligation to update or reissue forward-looking information as a result of new information or events except as required by applicable securities laws.
HISTORICAL ESTIMATES
Each of the mineral resource estimates contained in this MD&A, except for the Larocque East Project and Tony M Mine, are considered to be “historical estimates” as defined under NI 43-101, and have been sourced as follows:
| · | Daneros Mine: Reported by Energy Fuels in a technical report entitled “Updated Report on the Daneros Mine Project, San Juan County, Utah, U.S.A.”, prepared by Douglas C. Peters, C. P. G., of Peters Geosciences, dated March 2, 2018; | |
| · | Sage Plain Project: Reported by Energy Fuels in a technical report entitled “Updated Technical Report on Sage Plain Project (Including the Calliham Mine)”, prepared by Douglas C. Peters, CPG of Peters Geosciences, dated March 18, 2015; | |
| · | Coles Hill: Reported by Virginia Uranium Holdings Inc. in a technical report entitled “NI43-101 preliminary economic assessment update (revised)”, prepared by John I Kyle of Lyntek Incorporated dated Agust 19, 2013; | |
| · | Dieter Lake: Dated 2006 and reported by Fission Energy Corp. in a company report entitled “Technical Report on the Dieter Lake Property, Quebec, Canada” dated October 7, 2011; | |
| · | Matoush: Dated December 7, 2012 and reported by Strateco Resources Inc. in a press release dated December 7, 2012; | |
| · | Ben Lomond: Dated as of 1982, and reported by Mega Uranium Ltd. in a company report entitled “Technical Report on the Mining Leases Covering the Ben Lomond Uranium-Molybdenum Deposit Queensland, Australia” dated July 16, 2005; and | |
| · | Milo Project: Reported by Gmb Resources Ltd. in a scoping study entitled “Milo Project Scoping Study” prepared by Peter Owens and Basile Dean of Mining One Consultants, dated March 6, 2013. |
In each instance, the historical estimate is reported using the categories of mineral resources and mineral reserves as defined by the Canadian Institute CIM Definition Standards for Mineral Reserves, and mineral reserves at that time, and these “historical estimates” are not considered by IsoEnergy to be current. In each instance, the reliability of the historical estimate is considered reasonable, but a Qualified Person has not done sufficient work to classify the historical estimate as a current mineral resource, and IsoEnergy is not treating the historical estimate as a current mineral resource. The historical information provides an indication of the exploration potential of the properties but may not be representative of expected results.
For the Daneros Mine, as disclosed in the above noted technical report, the historical estimate was prepared by Energy Fuels using a wireframe model of the mineralized zone based on an outside bound of a 0.05% eU3O8 grade cutoff at a minimum thickness of 1 foot. Surface drilling would need to be conducted to confirm resources and connectivity of resources in order to verify the Daneros historical estimate as a current mineral resource.
|
|
ISOENERGY LTD.
For the three and six months ended June 30, 2025 and 2024
For the Sage Plain Project, as disclosed in the above noted technical report, the historical estimate was prepared by Peters Geosciences using a modified polygonal method. An exploration program would need to be conducted, including twinning of historical drill holes, in order to verify the Sage Plain historical estimate as a current mineral resource.
For the Coles Hill Project, as disclosed in the above noted revised preliminary economic assessment, the historical estimated was prepared by John I Kyle of Lyntek Incorporated. Twinning of a selection of certain holes would need to be completed along with updating of mining, processing and certain cost estimates in order to verify the Coles Hill Project historical resource estimate as a current mineral resource estimate.
For Dieter Lake, as disclosed in the above noted technical report, the historical estimate was prepared by Davis & Guo using the Thiessen (Voronoi) polygon method. Data constraints used were 200 ppm, 500 ppm, and 1000ppm U3O8 over a minimum of 1 metre thickness. Polygons created had radii of 200 metres. A rock density of 2.67g/cm3 was used. An exploration program would need to be completed, including twinning of historical drill holes, in order to verify the Dieter Lake historical estimate as a current mineral resource.
For Matoush, as disclosed in the above noted press release, the historical estimate was prepared by RPA using block U3O8 grades within a wireframe model that were estimated by ordinary kriging. The historical estimate was estimated at a cut-off grade of 0.1% U3O8 and using an average long-term uranium price of US$75 per pound. Six zones make up the historical estimate at Matoush: am-15, mt-34, mt-22, mt-02, mt-06, and mt-36. Each zone is made up of one or more lenses, most of which strike north (009°) and dip steeply (87°) to the east. Outlines of the mineralized lenses were interpreted on ten-metre spaced vertical sections. Minimum criteria of 0.10% U3O8 over 1.5 metre true thickness was used as a guide. An exploration program would need to be conducted, including twinning of historical drill holes, in order to verify the Matoush historical estimate as a current mineral resource.
For Ben Lomond, as disclosed in the above noted technical report, the historical estimate was prepared by the Australian Atomic Energy Commission (AAEC) using a sectional method. The parameters used in the selection of the ore intervals were a minimum true thickness of 0.5 metres and maximum included waste (true thickness) of 5 metres. Resource zones were outlined on 25 metre sections using groups of intersections, isolated intersections were not included. The grades from the composites were area weighted to give the average grade above a threshold of 500 ppm uranium. The area was measured on each 25 metre section to give the tonnage at a bulk density of 2.603. An exploration program would need to be conducted, including twinning of historical drill holes, in order to verify the Ben Lomond historical estimate as a current mineral resource.
For the Milo Project, as disclosed in the above noted scoping study, the historical estimate was prepared by Peter Owens and Basile Dean of Mining One Consultants. An exploration program would need to be conducted, including twinning of a selection of certain holes, along with updating of mining processing and certain cost estimates in order to verify the Milo Project historical resource estimate as a current mineral resource estimate.
APPROVAL
The Audit Committee and the Board of IsoEnergy have approved the disclosure contained in this MD&A. A copy of this MD&A will be provided to anyone who requests it and can be located, along with additional information, on the Company’s profile on SEDAR+ at www.sedarplus.ca, on EDGAR at www.sec.gov, or by contacting one of the corporate offices, located at Suite 900 – 410 22nd Street E, Saskatoon, Saskatchewan, S7K 5T6 and 217 Queen St. West, Suite 303, Toronto, Ontario, M5V 0P5.
|
|
Exhibit 99.2

Unaudited Condensed Consolidated Interim Financial Statements of
ISOENERGY LTD.
For the three and six months ended June 30, 2025 and 2024
ISOENERGY LTD.
CONDENSED CONSOLIDATED INTERIM STATEMENTS OF FINANCIAL POSITION
(Expressed in Canadian Dollars)
As at
| Note | June 30, 2025 | December 31, 2024 | ||||||||
| ASSETS | ||||||||||
| Current | ||||||||||
| Cash and cash equivalents | $ | 84,666,913 | $ | 21,294,663 | ||||||
| Accounts receivable | 646,413 | 500,249 | ||||||||
| Prepaid expenses | 2,514,507 | 489,921 | ||||||||
| Loan receivable | 6b | - | 6,120,503 | |||||||
| Marketable securities | 7 | 40,663,892 | 31,181,067 | |||||||
| $ | 128,491,725 | 59,586,403 | ||||||||
| Non-Current | ||||||||||
| Property and equipment | 8 | 15,701,897 | 16,232,302 | |||||||
| Exploration and evaluation assets | 9 | 263,830,842 | 262,291,098 | |||||||
| Environmental bonds | 10 | 2,606,346 | 2,725,220 | |||||||
| TOTAL ASSETS | $ | 410,630,810 | $ | 340,835,023 | ||||||
| LIABILITIES | ||||||||||
| Current | ||||||||||
| Accounts payable and accrued liabilities | $ | 3,415,933 | $ | 3,348,296 | ||||||
| Convertible debentures | 11 | 15,980,791 | 30,279,306 | |||||||
| Current portion of lease liabilities | 12 | 152,965 | 121,165 | |||||||
| Flow-through share premium liabilities | 13 | 8,028,580 | 1,355,210 | |||||||
| $ | 27,578,269 | 35,103,977 | ||||||||
| Non-Current | ||||||||||
| Long-term portion of lease liabilities | 12 | 361,602 | 281,721 | |||||||
| Asset retirement obligation | 10 | 2,164,986 | 2,026,975 | |||||||
| Deferred income tax liability | 14 | 288,554 | 259,191 | |||||||
| TOTAL LIABILITIES | $ | 30,393,411 | $ | 37,671,864 | ||||||
| EQUITY | ||||||||||
| Share capital | 15 | $ | 444,890,234 | $ | 362,941,599 | |||||
| Share option and warrant reserve | 15 | 35,998,015 | 33,154,239 | |||||||
| Accumulated deficit | (99,326,901 | ) | (102,545,246 | ) | ||||||
| Accumulated other comprehensive income | (1,323,949 | ) | 9,612,567 | |||||||
| TOTAL EQUITY | $ | 380,237,399 | $ | 303,163,159 | ||||||
| TOTAL LIABILITIES AND EQUITY | $ | 410,630,810 | $ | 340,835,023 | ||||||
Nature of operations (Note 2)
Material accounting policies (Note 5)
Commitments (Notes 11, 12, 13)
Subsequent events (Note 6a, 10)
The accompanying notes are an integral part of the condensed consolidated interim financial statements
These condensed consolidated interim financial statements were authorized for issue by the Board of Directors on July 31, 2025
| “Philip Williams” | “Peter Netupsky” | |||
| Philip Williams, CEO, Director | Peter Netupsky, Director |
ISOENERGY LTD.
CONDENSED CONSOLIDATED INTERIM STATEMENTS OF INCOME (LOSS) AND COMPREHENSIVE LOSS
(Expressed in Canadian Dollars)
| For the
three months ended June 30 |
For the six months ended June 30 |
|||||||||||||||||
| Note | 2025 | 2024 | 2025 | 2024 | ||||||||||||||
| General and administrative costs | ||||||||||||||||||
| Share-based compensation | 15,16 | $ | 1,101,397 | $ | 1,054,796 | $ | 3,047,236 | $ | 2,231,325 | |||||||||
| Administrative salaries, contractor and director fees | 16 | 788,798 | 802,078 | 1,584,112 | 1,873,115 | |||||||||||||
| Investor relations | 302,131 | 244,021 | 523,087 | 450,660 | ||||||||||||||
| Office and administrative | 16 | 293,457 | 184,524 | 537,457 | 405,985 | |||||||||||||
| Professional and consultant fees | 889,659 | 701,840 | 1,950,470 | 1,360,712 | ||||||||||||||
| Travel | 90,292 | 117,686 | 266,317 | 263,750 | ||||||||||||||
| Public company costs | 480,127 | 94,788 | 625,853 | 260,954 | ||||||||||||||
| Total general and administrative costs | $ | (3,945,861 | ) | $ | (3,199,733 | ) | $ | (8,534,532 | ) | $ | (6,846,501 | ) | ||||||
| Interest income | 364,387 | 563,560 | 674,684 | 1,050,077 | ||||||||||||||
| Interest expense | 10,12 | (34,179 | ) | (20,413 | ) | (76,058 | ) | (40,303 | ) | |||||||||
| Interest on convertible debentures | 11 | (226,594 | ) | (311,288 | ) | (489,144 | ) | (618,095 | ) | |||||||||
| Fair value gain (loss) on convertible debentures | 11 | 627,079 | (2,856,776 | ) | 338,497 | (4,755,860 | ) | |||||||||||
| Gain on disposal of assets | 6d,6e | 820,394 | - | 11,189,425 | - | |||||||||||||
| Foreign exchange (loss) gain | (75,864 | ) | (38,579 | ) | (68,945 | ) | 12,534 | |||||||||||
| Other income | 92,020 | 27,322 | 523,941 | 46,702 | ||||||||||||||
| (Loss) income from operations | $ | (2,378,618 | ) | $ | (5,835,907 | ) | $ | 3,557,868 | $ | (11,151,446 | ) | |||||||
| Deferred income tax recovery (expense) | 14 | 491,348 | (168,253 | ) | (339,523 | ) | 488,674 | |||||||||||
| (Loss) income from continuing operations | $ | (1,887,270 | ) | $ | (6,004,160 | ) | $ | 3,218,345 | $ | (10,662,772 | ) | |||||||
| Loss from discontinued operations, net of tax | 6a | - | (55,133 | ) | - | (126,499 | ) | |||||||||||
| (Loss) income for the period | $ | (1,887,270 | ) | $ | (6,059,293 | ) | $ | 3,218,345 | $ | (10,789,271 | ) | |||||||
| Other comprehensive (loss) income | ||||||||||||||||||
| Change in fair value of convertible debentures attributable to the change in credit risk | 11 | (665 | ) | 52,276 | 31,290 | 23,903 | ||||||||||||
| Change in fair value of marketable securities | 7 | 2,497,949 | (5,157,396 | ) | (3,252,175 | ) | (373,410 | ) | ||||||||||
| Currency translation adjustment | (8,174,015 | ) | 2,445,764 | (8,150,169 | ) | 5,549,070 | ||||||||||||
| Deferred tax (expense) recovery | 14 | (342,092 | ) | 696,249 | 434,538 | (33,437 | ) | |||||||||||
| Total other comprehensive (loss) income | $ | (6,018,823 | ) | $ | (1,963,107 | ) | $ | (10,936,516 | ) | $ | 5,166,126 | |||||||
| Total comprehensive loss for the period | $ | (7,906,093 | ) | $ | (8,022,400 | ) | $ | (7,718,171 | ) | $ | (5,623,145 | ) | ||||||
| (Loss) income per common share – continuing operations1 | ||||||||||||||||||
| Basic | $ | (0.04 | ) | $ | (0.13 | ) | $ | 0.07 | $ | (0.24 | ) | |||||||
| Diluted | $ | (0.03 | ) | $ | (0.13 | ) | $ | 0.07 | $ | (0.24 | ) | |||||||
| Weighted average number of common shares outstanding1 | ||||||||||||||||||
| Basic | 48,494,148 | 44,645,637 | 47,474,898 | 44,305,581 | ||||||||||||||
| Diluted | 49,705,694 | 44,645,637 | 48,690,134 | 44,305,581 | ||||||||||||||
Loss per common share associated with discontinued operations (Note 6a)
1 All per share amounts and weighted average common shares outstanding have been retroactively restated for all periods presented (Note 15).
The accompanying notes are an integral part of the condensed consolidated interim financial statements
ISOENERGY LTD.
CONDENSED CONSOLIDATED INTERIM STATEMENTS OF CHANGES IN EQUITY
(Expressed in Canadian Dollars)
| Note | Number
of common shares1 |
Share capital | Share option and warrant reserve |
Accumulated deficit |
Accumulated other comprehensive income (loss) |
Total | ||||||||||||||||||||
| Balance as at January 1, 2024 | 43,225,744 | $ | 334,963,627 | $ | 29,188,821 | $ | (60,410,155 | ) | $ | (721,736 | ) | $ | 303,020,557 | |||||||||||||
| Shares issued in private placements | 15 | 920,000 | 23,000,000 | - | - | - | 23,000,000 | |||||||||||||||||||
| Share issue cost, net of tax | 15 | - | (1,242,784 | ) | - | - | - | (1,242,784 | ) | |||||||||||||||||
| Premium on flow-through shares | 13 | - | (3,680,000 | ) | - | - | - | (3,680,000 | ) | |||||||||||||||||
| Shares issued on the exercise of stock options | 15 | 220,810 | 4,204,189 | (1,762,505 | ) | - | - | 2,441,684 | ||||||||||||||||||
| Shares issued on the exercise of warrants | 15 | 274,808 | 4,446,881 | (819,407 | ) | - | - | 3,627,474 | ||||||||||||||||||
| Shares issued to settle liability | 15 | 31,318 | 524,998 | - | - | - | 524,998 | |||||||||||||||||||
| Shares issued to settle interest | 11,15 | 10,313 | 171,200 | - | - | - | 171,200 | |||||||||||||||||||
| Share-based payments | 15 | - | - | 2,752,002 | - | - | 2,752,002 | |||||||||||||||||||
| Loss for the period | - | - | - | (10,789,271 | ) | - | (10,789,271 | ) | ||||||||||||||||||
| Other comprehensive income for the period | - | - | - | - | 5,166,126 | 5,166,126 | ||||||||||||||||||||
| Balance as at June 30, 2024 | 44,682,993 | $ | 362,388,111 | $ | 29,358,911 | $ | (71,199,426 | ) | $ | 4,444,390 | $ | 324,991,986 | ||||||||||||||
| Balance as at January 1, 2025 | 44,716,934 | $ | 362,941,599 | $ | 33,154,239 | $ | (102,545,246 | ) | $ | 9,612,567 | $ | 303,163,159 | ||||||||||||||
| Shares issued in flow-through share financing | 15 | 1,333,825 | 20,007,375 | - | - | - | 20,007,375 | |||||||||||||||||||
| Shares issued in bought deal financing | 15 | 5,121,500 | 51,215,000 | - | - | - | 51,215,000 | |||||||||||||||||||
| Shares issued in private placement | 13 | 625,000 | 6,250,000 | - | - | - | 6,250,000 | |||||||||||||||||||
| Share issue cost, net of tax | 15 | - | (3,258,506 | ) | - | - | - | (3,258,506 | ) | |||||||||||||||||
| Premium on flow-through shares | 13 | - | (8,002,950 | ) | - | - | - | (8,002,950 | ) | |||||||||||||||||
| Shares issued on the exercise of stock options | 15 | 248,237 | 1,528,148 | (1,089,907 | ) | - | - | 438,241 | ||||||||||||||||||
| Shares issued on partial conversion of debentures | 11,15 | 1,221,818 | 13,928,728 | - | - | - | 13,928,728 | |||||||||||||||||||
| Shares issued for exploration and evaluation asset | 9a,15 | 16,666 | 161,160 | - | - | - | 161,160 | |||||||||||||||||||
| Shares issued to settle interest | 11,15 | 11,968 | 119,680 | - | - | - | 119,680 | |||||||||||||||||||
| Share-based payments | 15,16 | - | - | 3,933,683 | - | - | 3,933,683 | |||||||||||||||||||
| Income for the period | - | - | - | 3,218,345 | - | 3,218,345 | ||||||||||||||||||||
| Other comprehensive loss for the period | - | - | - | - | (10,936,516 | ) | (10,936,516 | ) | ||||||||||||||||||
| Balance as at June 30, 2025 | 53,295,948 | $ | 444,890,234 | $ | 35,998,015 | $ | (99,326,901 | ) | $ | (1,323,949 | ) | $ | 380,237,399 | |||||||||||||
1 The number of outstanding common shares issued have been retroactively restated for all periods presented (Note 15).
The accompanying notes are an integral part of the condensed consolidated interim financial statements
ISOENERGY LTD.
CONDENSED CONSOLIDATED INTERIM STATEMENTS OF CASH FLOWS
(Expressed in Canadian Dollars)
| For the
three months ended June 30 |
For the
six months ended June 30 |
|||||||||||||||||
| Note | 2025 | 2024 | 2025 | 2024 | ||||||||||||||
| Cash flows used in operating activities | ||||||||||||||||||
| (Loss) income for the period | $ | (1,887,270 | ) | $ | (6,059,293 | ) | $ | 3,218,345 | $ | (10,789,271 | ) | |||||||
| Items not involving cash: | ||||||||||||||||||
| Share-based compensation | 15 | 1,101,397 | 1,054,796 | 3,047,236 | 2,231,325 | |||||||||||||
| Deferred income tax (recovery) expense | 14 | (491,348 | ) | 168,253 | 339,523 | (488,674 | ) | |||||||||||
| Interest on convertible debentures | 11 | 226,594 | 311,288 | 489,144 | 618,095 | |||||||||||||
| Fair value (gain) loss on convertible debentures | 11 | (627,079 | ) | 2,856,776 | (338,497 | ) | 4,755,860 | |||||||||||
| Gain on disposal of assets | 6d,6e | (820,394 | ) | - | (11,189,425 | ) | - | |||||||||||
| Depreciation expense | 8,19 | 74,820 | 70,779 | 144,591 | 122,837 | |||||||||||||
| Interest and accretion | 10,12 | 34,179 | 32,343 | 76,058 | 64,828 | |||||||||||||
| Interest income on loan receivable | 6b | - | - | (48,492 | ) | - | ||||||||||||
| Foreign exchange loss (gain) | 102,905 | (5,687 | ) | 99,102 | (35,674 | ) | ||||||||||||
| Changes in non-cash working capital | ||||||||||||||||||
| Accounts receivable | (153,377 | ) | 287,597 | (146,148 | ) | 423,590 | ||||||||||||
| Prepaid expenses | (1,651,518 | ) | (869,238 | ) | (1,451,645 | ) | (714,255 | ) | ||||||||||
| Accounts payable and accrued liabilities | 805,414 | (1,040,137 | ) | (553,110 | ) | (1,157,463 | ) | |||||||||||
| $ | (3,285,677 | ) | $ | (3,192,523 | ) | $ | (6,313,318 | ) | $ | (4,968,802 | ) | |||||||
| Cash flows used in investing activities | ||||||||||||||||||
| Additions to exploration and evaluation assets | 9a, 19 | $ | (6,436,214 | ) | $ | (4,802,964 | ) | $ | (8,826,282 | ) | $ | (7,879,037 | ) | |||||
| Acquisition of exploration and evaluation assets | 9a, 19 | - | (288,463 | ) | (2,630 | ) | (572,336 | ) | ||||||||||
| Additions to property and equipment | 8, 19 | (15,188 | ) | (473,280 | ) | (279,497 | ) | (495,954 | ) | |||||||||
| Acquisitions of marketable securities | 7 | (250,000 | ) | (821,771 | ) | (250,000 | ) | (821,771 | ) | |||||||||
| Receipt of loan receivable, including interest | 6b | - | - | 6,168,995 | - | |||||||||||||
| $ | (6,701,402 | ) | $ | (6,386,478 | ) | $ | (3,189,414 | ) | $ | (9,769,098 | ) | |||||||
| Cash flows from (used in) financing activities | ||||||||||||||||||
| Shares issued | 15 | $ | 51,215,000 | $ | - | $ | 77,472,375 | $ | 23,000,000 | |||||||||
| Share issuance cost | 15 | (2,388,250 | ) | - | (4,463,707 | ) | (1,702,444 | ) | ||||||||||
| Shares issued for warrant exercise | 15 | - | - | - | 3,627,474 | |||||||||||||
| Shares issued for option exercise | 15 | 161,041 | 405,373 | 438,241 | 2,441,684 | |||||||||||||
| Interest payment on debentures | 11 | (327,346 | ) | (451,671 | ) | (354,885 | ) | (451,671 | ) | |||||||||
| Lease liability payments | 12 | (39,000 | ) | (39,000 | ) | (78,000 | ) | (78,000 | ) | |||||||||
| $ | 48,621,445 | $ | (85,298 | ) | $ | 73,014,024 | $ | 26,837,043 | ||||||||||
| Effects of exchange rate changes on cash | (142,737 | ) | 15,275 | (139,042 | ) | 47,446 | ||||||||||||
| Change in cash and cash equivalents | $ | 38,491,629 | $ | (9,649,024 | ) | $ | 63,372,250 | $ | 12,146,589 | |||||||||
| Cash and cash equivalents, beginning of period | 46,175,284 | 58,828,863 | 21,294,663 | 37,033,250 | ||||||||||||||
| Cash in disposal group | 6a | - | (58,966 | ) | - | (58,966 | ) | |||||||||||
| Cash and cash equivalents, end of period | $ | 84,666,913 | $ | 49,120,873 | $ | 84,666,913 | $ | 49,120,873 | ||||||||||
| Cash and cash equivalents is comprised of: | ||||||||||||||||||
| Cash | $ | 69,508,131 | $ | 49,120,873 | $ | 69,508,131 | $ | 49,120,873 | ||||||||||
| Short-term cash deposit | 15,158,782 | - | 15,158,782 | - | ||||||||||||||
| Cash and cash equivalents | $ | 84,666,913 | $ | 49,120,873 | $ | 84,666,913 | $ | 49,120,873 | ||||||||||
Cash flows associated with discontinued operations (Note 6a)
Supplemental disclosure with respect to cash flows (Note 19)
The accompanying notes are an integral part of the condensed consolidated interim financial statements
ISOENERGY LTD.
NOTES TO THE CONDENSED CONSOLIDATED INTERIM FINANCIAL STATEMENTS
(Expressed in Canadian Dollars)
FOR THE THREE AND SIX MONTHS ENDED JUNE 30, 2025 AND 2024
| 1. | REPORTING ENTITY |
IsoEnergy Ltd. (“IsoEnergy”, or the “Company”) is engaged in the acquisition, exploration and development of uranium properties in Canada, the United States of America and Australia. The Company’s registered and records office is located at 217 Queen Street West, Unit 401, Toronto, Ontario M5V 0R2. On June 20, 2024, the Company announced its continuance from the province of British Columbia to the province of Ontario under the same name. The Company’s common shares were previously listed on the TSX Venture Exchange (the “TSXV”), prior to being listed on the Toronto Stock Exchange (the “TSX”) on July 8, 2024 under the symbol “ISO”. The Company’s common shares began trading on the New York Stock Exchange American LLC (“NYSE-A”) on May 5, 2025 under the symbol “ISOU”.
The Company primarily holds its mineral interests directly or indirectly through the following wholly owned subsidiaries:
| · | Consolidated Uranium Inc. (“Consolidated Uranium”) (Ontario, Canada) |
| · | ICU Australia Pty Ltd. (Australia) |
| · | Management X Pty Ltd. (Australia) |
| · | CUR Australia Pty Ltd. (Australia) |
| · | 12942534 Canada Ltd. (Canada) |
| · | Virginia Uranium Inc. (Virginia, United States) |
| · | CUR Sage Plain Uranium, LLC (Utah, United States) |
| · | CUR Henry Mountains Uranium, LLC (Utah, United States) |
| · | White Canyon Uranium, LLC (Utah, United States) |
| · | 2596190 Alberta Ltd. (Alberta, Canada) (Note 9a) |
As of June 30, 2025, NexGen Energy Ltd (“NexGen”) holds 30.9% of IsoEnergy’s outstanding common shares.
| 2. | NATURE OF OPERATIONS |
As an exploration and development stage company, the Company does not have revenues and historically has recurring operating losses. As at June 30, 2025, the Company had accumulated losses of $99,326,901 and adjusted working capital of $124,922,827 (adjusted working capital is defined as current assets less current liabilities, excluding flow-though share premium liabilities and debenture liabilities). The Company depends on external financing for its operational expenses.
The business of exploring for and mining of minerals involves a high degree of risk. As an exploration company, IsoEnergy is subject to risks and challenges similar to companies at a comparable stage. These risks include, but are not limited to, negative operating cash flow and dependence on third party financing; the uncertainty of additional financing; the Company’s limited operating history; the lack of known mineral reserves; the influence of a large shareholder; alternate sources of energy and uranium prices; aboriginal title and consultation issues; risks related to exploration activities generally; reliance upon key management and other personnel; title to properties; uninsurable risks; conflicts of interest; permits and licenses; environmental and other regulatory requirements; political regulatory risks; competition; and the volatility of share prices.
These Unaudited Condensed Consolidated Interim Financial Statements for the three and six months ended June 30, 2025 and 2024 (the “Interim Financial Statements”) have been prepared using International Financial Reporting Standards (“IFRS”) applicable to a going concern, which assumes that the Company will be able to realize its assets and discharge its liabilities in the normal course of business for the foreseeable future. The ability of the Company to continue as a going concern is dependent on its ability to obtain financing and achieve future profitable operations.
The underlying value of IsoEnergy’s exploration and evaluation assets is dependent upon the existence and economic recovery of mineral resources or reserves and is subject to, but not limited to, the risks and challenges identified above.
ISOENERGY LTD.
NOTES TO THE CONDENSED CONSOLIDATED INTERIM FINANCIAL STATEMENTS
(Expressed in Canadian Dollars)
FOR THE THREE AND SIX MONTHS ENDED JUNE 30, 2025 AND 2024
| 3. | BASIS OF PRESENTATION |
Statement of Compliance
The Interim Financial Statements have been prepared in accordance with International Accounting Standard (“IAS”) 34, Interim Financial Reporting. They do not include all of the information required by IFRS for annual financial statements and should be read in conjunction with the audited consolidated annual financial statements as at and for the year ended December 31, 2024.
Basis of Presentation
The Interim Financial Statements have been prepared on a historical cost basis, except for certain financial instruments which have been measured at fair value. In addition, the Interim Financial Statements have been prepared using the accrual basis of accounting except for cash flow information. All monetary amounts expressed in the Interim Financial Statements are referenced as Canadian dollar amounts (“$”), unless otherwise noted. Monetary amounts expressed in US dollars and Australian dollars are referenced as (“US$”) and (“AUD$”), respectively. The Interim Financial Statements are presented in Canadian dollars, which is the functional currency of the Company and its Canadian subsidiaries. The functional currency for the Company’s subsidiaries in the United States is US dollars. The functional currency for the Company’s subsidiaries in Australia is Australian dollars.
The Interim Financial Statements of the Company consolidate the accounts of the Company and its subsidiaries. All intercompany transactions, balances, and unrealized gains and losses from intercompany transactions are eliminated on consolidation. As at June 30, 2025, the Company held a 50% interest in an unincorporated joint venture with Purepoint Uranium Group Inc. (“Purepoint Uranium”), comprising of a portfolio of exploration and evaluation assets located in Saskatchewan, Canada (the “Purepoint Joint Venture”). The Company accounts for the Purepoint Joint Venture as a joint operation and has proportionately consolidated its share of assets, liabilities, incomes and expenses.
Subsidiaries consist of entities over which the Company is exposed to, or has rights to, variable returns as well as the ability to affect those returns through the power to direct the relevant activities of the entity. Subsidiaries are fully consolidated from the date control is transferred to the Company and are de-consolidated from the date control ceases.
| 4. | CRITICAL ACCOUNTING JUDGMENTS, ESTIMATES AND ASSUMPTIONS |
The preparation of the Interim Financial Statements requires management to make judgments, estimates and assumptions that affect the reported amounts of assets, liabilities, and contingent liabilities at the date of the financial statements and the reported amounts of revenues and expenses during the reporting period. Estimates and assumptions are continuously evaluated and are based on management’s experience and other factors, including expectations of future events that are believed to be reasonable in the circumstances. Uncertainty about these judgments, estimates and assumptions could result in outcomes that require a material adjustment to the carrying amount of the asset or liability affected in future periods.
Information about significant areas of judgement and estimation uncertainty considered by management in preparing the financial statements are set out in Note 4 to the consolidated annual financial statements for the year ended December 31, 2024 and have been consistently followed in preparation of the Interim Financial Statements.
| 5. | MATERIAL ACCOUNTING POLICIES |
The accounting policies followed by the Company are set out in the consolidated annual financial statements for the year ended December 31, 2024 and have been consistently followed in the preparation of the Interim Financial Statements, except as described below.
| Amendment to IAS 21 – Lack of exchangeability |
The International Accounting Standards Board (“IASB”) issued an amendment to IAS 21 – The Effects of Changes in Foreign Exchange Rates when one foreign currency cannot be exchanged into another. This may occur because of government-imposed controls on capital imports or exports, or a limitation on the volume of foreign currency transactions that can be undertaken at an official exchange rate. The amendment clarifies when a currency is considered exchangeable into another currency and how an entity estimates a spot rate for currencies that lack exchangeability. The amendment is effective for annual reporting periods beginning on or after January 1, 2025.
The Company adopted this amendment on January 1, 2025 as required. There were no changes to the Interim Financial Statements from adopting this amendment.
ISOENERGY LTD.
NOTES TO THE CONDENSED CONSOLIDATED INTERIM FINANCIAL STATEMENTS
(Expressed in Canadian Dollars)
FOR THE THREE AND SIX MONTHS ENDED JUNE 30, 2025 AND 2024
| 6. | TRANSACTIONS |
| (a) | Sale of Argentina assets and discontinued operation |
On July 19, 2024, the Company completed the sale of all of its shares in a previously wholly held subsidiary, 2847312 Ontario Inc., which held all of the Company’s assets in the Argentina reporting segment, to a third-party buyer, Jaguar Uranium Corp. (“Jaguar Uranium” or the “Buyer”). The net assets of the Argentina reporting segment primarily included the Laguna Salada project and the Huemul project. All income and expenses related to the Argentina reporting segment were presented as a discontinued operation as at December 31, 2024.
Consideration received from the sale primarily included:
| · | US$10.0 million of common shares of the Buyer, being 2,000,000 shares at a price of US$5.00 per share. Should the Buyer complete a public listing or a concurrent financing at less than the price of US$5.00 per share, the Company is entitled to additional common shares (“Top Up Shares”) of the Buyer such that the total common shares held maintains a value of US$10.0 million, with the amount of Top Up Shares issued limited to a minimum price of US$4.00 per share. Should the Buyer not complete a public listing or not complete a concurrent financing within 12 months of the closing date, the Company is entitled to additional common shares of the Buyer (the “Additional Jaguar Uranium Shares”). Subsequent to June 30, 2025, the Company became entitled to receive the Additional Jaguar Uranium Shares as a result of the Buyer not completing a public listing within the specified timeframe. |
| · | Net Smelter Returns (“NSR”) royalty of 2% on all production from the Laguna Salada project (“Laguna Salada NSR”). The Buyer retains a buy-back option for 1% of the Laguna Salada NSR, exercisable for 7 years at a price of US$2.5 million. |
| · | NSR royalty of 1% on all production from the Huemul project (“Huemul NSR”). The Company retained a buy-back option on an existing royalty agreement on the Huemul project (“Huemul Buy-back Option”). |
The Company accounts for the Top Up Shares and Additional Jaguar Uranium Shares as contingent assets and no value was recognized at the time of sale or as at June 30, 2025. The Company determined the carrying amount of the Laguna Salada NSR, Huemul NSR, and the Buy-back Option to be $nil at the time of the sale.
The gain on disposal of the asset group was as follows:
| Common shares received | $ | 13,727,000 | ||
| Disposal costs incurred | (165,037 | ) | ||
| Reclassification of cumulative currency translation adjustments | (1,686 | ) | ||
| Net proceeds | $ | 13,560,277 | ||
| Cash | 24,728 | |||
| Accounts receivable | 52,850 | |||
| Exploration and evaluation assets (Note 9b) | 8,182,088 | |||
| Net assets sold | $ | 8,259,666 | ||
| Gain on disposal of Argentina assets | $ | 5,300,611 |
The results from the discontinued operations of the Argentina reporting segment include:
| For the
three months ended June 30 |
For the
six months ended June 30 |
|||||||||||||||
| 2025 | 2024 | 2025 | 2024 | |||||||||||||
| Office and administrative expenses | $ | - | $ | 55,133 | $ | - | $ | 89,443 | ||||||||
| Professional and consultant fees | - | - | - | 37,056 | ||||||||||||
| Loss from discontinued operations | $ | - | $ | (55,133 | ) | $ | - | $ | (126,499 | ) | ||||||
| Basic and diluted loss per share – discontinued operations | $ | - | $ | (0.00 | ) | $ | - | $ | (0.00 | ) | ||||||
There are no cash flow amounts included in the statement of cash flows for the three and six months ended June 30, 2025. Net cash used in operating activities during the three and six months ended June 30, 2024 was $26,220 and $36,767, respectively. Net cash from investing activities of the Argentina reporting segment during the three and six months ended June 30, 2024 was $39,352 and $67,557, respectively, which is inclusive of non-cash changes in accounts payable directly related to exploration and evaluation assets. The effects of exchange rate changes on cash during the three and six months ended June 30, 2024 was $282 and $949, respectively.
ISOENERGY LTD.
NOTES TO THE CONDENSED CONSOLIDATED INTERIM FINANCIAL STATEMENTS
(Expressed in Canadian Dollars)
FOR THE THREE AND SIX MONTHS ENDED JUNE 30, 2025 AND 2024
| 6. | TRANSACTIONS (continued) |
| (b) | Terminated transaction with Anfield Energy Inc. |
On October 1, 2024, the Company and Anfield Energy Inc. (“Anfield Energy”) entered into a definitive agreement (the “Arrangement Agreement”), pursuant to which IsoEnergy would acquire all of the issued and outstanding common shares of Anfield Energy by way of a court-approved plan of arrangement (the “AEC Arrangement”).
In connection with the AEC Arrangement, IsoEnergy provided a bridge loan in the form of a promissory note of approximately $6.0 million to Anfield Energy, with an interest rate of 15% per annum and a maturity date of April 1, 2025 (the “Bridge Loan”). The Bridge Loan was issued for purposes of satisfying working capital and other obligations of Anfield Energy through to the closing of the proposed transaction. IsoEnergy also provided an indemnity for up to US$3.0 million in principal with respect to certain of Anfield Energy’s property obligations (the “Indemnity”). The Bridge Loan and the Indemnity were both secured by a security interest in all the assets, property and undertaking of Anfield Energy and guaranteed by certain subsidiaries of Anfield Energy. The Bridge Loan, Indemnity and related security were subordinate to certain senior indebtedness of Anfield. The Bridge Loan was immediately repayable, among other circumstances, in the event the Arrangement Agreement is terminated by either IsoEnergy or Anfield Energy for any reason.
The Arrangement Agreement provided that either party could unilaterally terminate the Arrangement Agreement if all conditions precedent had not been satisfied by December 31, 2024. Anfield Energy terminated the Arrangement Agreement on January 14, 2025.
Included in the loan receivable as at December 31, 2024, was $5,899,864 advanced to Anfield Energy under the Bridge Loan and accrued interest of $220,639. Anfield Energy repaid the full amount due under the Bridge Loan, including accrued interest, on January 21, 2025. The Company received a full and final release from the Indemnity on March 3, 2025.
| (c) | Joint Venture Agreement with Purepoint Uranium |
On October 21, 2024, the Company entered into a contribution agreement with Purepoint Uranium in connection with the creation of an unincorporated joint venture for the exploration and development of a portfolio of uranium properties in northern Saskatchewan’s Athabasca Basin. The Purepoint Joint Venture is governed by a formal joint venture agreement (the “Joint Venture Agreement”) and not through any other separate legal vehicle or entity. The Joint Venture Agreement closed on December 18, 2024 following a concurrent financing completed by Purepoint Uranium (the “Purepoint Financing”) and receipt of all regulatory approvals. Both companies contributed assets from its current portfolio of exploration projects to create the Purepoint Joint Venture.
The Purepoint Joint Venture is comprised of three projects: Dorado, Aurora, and the Celeste Block (together, the “Joint Venture Properties”) which were contributed from each party, as follows:
| · | IsoEnergy: Geiger, Thorburn Lake, Full Moon, Edge, Collins Bay Extension, North Thorburn, 2Z Lake, and Madison |
| · | Purepoint Uranium: Turnor Lake and Red Willow |
The Company initially held a 60% interest and Purepoint Uranium initially held a 40% interest in the Purepoint Joint Venture. The Joint Venture Agreement included an option to adjust the interests to 50% for each party through the exercise of mutually exclusive put and call options, such that the Company had an option to sell (the “Put Option”) and Purepoint Uranium had an option to acquire (the “Call Option”) 10% of IsoEnergy’s initial interest in exchange for 4,000,000 common shares of Purepoint Uranium.
The Company exercised its Put Option on January 14, 2025 and the interests in the Purepoint Joint Venture for both the Company and Purepoint Uranium are now 50%. After the exercise of the put option, the Company’s carrying amount in the Purepoint Joint Venture was reduced by $1,060,000, based on the closing share price of Purepoint Uranium on the exercise date. After the exercise of the Put Option, the Company holds a further option to purchase an additional 1% interest in the Purepoint Joint Venture from Purepoint Uranium in exchange for $2.0 million (the “Additional Option”). The Additional Option expires on the earlier of February 28, 2026 or 60 days following a material uranium discovery.
The ownership interests of each party are subject to standard dilution if either party fails to contribute to approved programs or expenditures of the Joint Venture Properties. If either party’s interest is reduced to 10% or less, then that party will relinquish its entire interest in the Purepoint Joint Venture in exchange for a 2% NSR royalty on the Joint Venture Properties. The remaining party can purchase 1% of the NSR royalty for $2.0 million.
Purepoint Uranium will act as the operator for the Joint Venture Properties in the exploration phase. Once the Joint Venture Properties advance to the pre-development stage, the Company will assume the role of operator.
The Company has advances to the Purepoint Joint Venture, net of exploration and evaluation incurred, of $360,797 included in prepaid expenses as of June 30, 2025 (December 31, 2024: $nil). The Company’s share of exploration and evaluation costs incurred during the three and six months ended June 30, 2025 was $773,872 and $805,203, respectively (2024 - $nil) and are included in exploration and evaluation assets (Note 9).
ISOENERGY LTD.
NOTES TO THE CONDENSED CONSOLIDATED INTERIM FINANCIAL STATEMENTS
(Expressed in Canadian Dollars)
FOR THE THREE AND SIX MONTHS ENDED JUNE 30, 2025 AND 2024
| 6. | TRANSACTIONS (continued) |
| (d) | Sale of Mountain Lake property |
On November 13, 2024, the Company entered into an asset purchase agreement with Future Fuels Inc. (“Future Fuels”) pursuant to which the Company agreed to sell all its right, title and interest in the Mountain Lake property located in Nunavut.
The sale closed on February 14, 2025. The Company received the following as consideration on closing:
| · | $8,625,000 common shares of Future Fuels, being 12,500,000 shares at a fair value of $0.69 per share based on the closing share price of Future Fuels on the sale closing date. |
| · | 2% NSR royalty payable on all production from Mountain Lake, of which 1% can be repurchased by Future Fuels for $1,000,000 (the “Mountain Lake NSR”). |
| · | 1% NSR royalty on all uranium production from Future Fuels’ properties in Nunavut other than Mountain Lake (the “Nunavut NSR”). |
The Company is entitled to receive an additional 2,500,000 common shares of Future Fuels (the “Deferred Shares”), issuable on the earliest date practicable such that it will not result in the Company owning or controlling more than 19.99% of the outstanding common shares of Future Fuels. The Company did not recognize any consideration for the Deferred Shares as this is a contingent asset where the realisation of income is not virtually certain at this time.
The Company recognized $1,936,944 in royalty assets for the Mountain Lake NSR and Nunavut NSR as a current asset, based on its indicative fair value. The Company initiated negotiations and eventually agreed to the sale of the Mountain Lake NSR and Nunavut NSR, to an unrelated third-party buyer, shortly after closing the sale with Future Fuels (Note 6e).
The Company and Future Fuels entered into an investor rights agreement, providing the Company with the right to nominate one director to the Future Fuels board of directors and to participate in future equity financings of Future Fuels to maintain its pro rata share ownership.
The gain on sale of the Mountain Lake property is as follows:
| Common shares received | $ | 8,625,000 | ||
| Royalty assets received | 1,936,944 | |||
| Disposal costs incurred | (41,903 | ) | ||
| Net proceeds | $ | 10,520,041 | ||
| Exploration and evaluation assets (Note 9b) | 151,010 | |||
| Net assets sold | $ | 151,010 | ||
| Gain on sale of Mountain Lake property | $ | 10,369,031 |
| (e) | Sale of Royalty Assets |
On May 15, 2025, the Company, along with its wholly owned subsidiary, Consolidated Uranium, completed a royalty purchase agreement with Royal Uranium Inc. (“Royal Uranium”) pursuant to which the Company agreed to sell all its royalty assets, which includes the Laguna Salada NSR, Huemul NSR, Huemul Buy-back Option, Mountain Lake NSR, and Nunavut NSR (all together, the “Royalty Assets”). Consideration received from the sale of the Royalty Assets was $2,800,000 of common shares of Royal Uranium, being 8,000,000 shares at a price of $0.35 per share. The royalty purchase agreement assigned consideration of $1,936,944 to the Mountain Lake NSR and Nunavut NSR and $863,056 to the Laguna Salada NSR, Huemul NSR and Huemul Buy-back Option. The Company and Royal Uranium entered into an investor rights agreement, providing the Company with the right to nominate one director to the Royal Uranium board of directors and to participate in future equity financings of Royal Uranium to maintain its pro rata share ownership.
The gain on sale of the Royalty Assets is as follows:
| Common shares received | $ | 2,800,000 | ||
| Disposal costs incurred | (42,662 | ) | ||
| Net proceeds | $ | 2,757,338 | ||
| Royalty assets (Note 6d) | 1,936,944 | |||
| Net assets sold | $ | 1,936,944 | ||
| Gain on sale of Royalty Assets | $ | 820,394 |
ISOENERGY LTD.
NOTES TO THE CONDENSED CONSOLIDATED INTERIM FINANCIAL STATEMENTS
(Expressed in Canadian Dollars)
FOR THE THREE AND SIX MONTHS ENDED JUNE 30, 2025 AND 2024
| 7. | MARKETABLE SECURITES |
The carrying value of marketable securities is based on the estimated fair value of the common shares and warrants, respectively determined using published closing share prices and the Black-Scholes option pricing model, or other available information if published share prices are not available. Subscription receipts are valued at cost.
| Subscription Receipts |
Common Shares | Warrants | Total | |||||||||||||
| Balance, January 1, 2024 | $ | 2,000,000 | $ | 14,698,546 | $ | 337,144 | $ | 17,035,690 | ||||||||
| Acquired during the period | - | 2,627,665 | 519,625 | 3,147,290 | ||||||||||||
| Common shares of Jaguar Uranium received from disposal of Argentina assets (Note 6a) | - | 13,727,000 | - | 13,727,000 | ||||||||||||
| Subscription receipts converted to common shares | (2,000,000 | ) | 2,000,000 | - | - | |||||||||||
| Change in fair value recorded in Other comprehensive income | - | (2,413,215 | ) | (315,698 | ) | (2,728,913 | ) | |||||||||
| Balance, December 31, 2024 | $ | - | $ | 30,639,996 | $ | 541,071 | $ | 31,181,067 | ||||||||
| Acquired during the period | - | 250,000 | - | 250,000 | ||||||||||||
| Common shares of Purepoint Uranium received from exercise of put option (Note 6c) | - | 1,060,000 | - | 1,060,000 | ||||||||||||
| Common shares of Future Fuels received from sale of Mountain Lake (Note 6d) | - | 8,625,000 | - | 8,625,000 | ||||||||||||
| Common shares of Future Fuels received from sale of Royalty Assets (Note 6e) | 2,800,000 | - | 2,800,000 | |||||||||||||
| Change in fair value recorded in Other comprehensive income | - | (3,214,253 | ) | (37,922 | ) | (3,252,175 | ) | |||||||||
| Balance, June 30, 2025 | $ | - | $ | 40,160,743 | $ | 503,149 | $ | 40,663,892 | ||||||||
On June 30, 2025, marketable securities consisted of the following securities:
| Common Shares | Warrants | |||||||
| NexGen | 279,791 | - | ||||||
| Premier American Uranium Inc. | 4,245,841 | 167,708 | ||||||
| Atha Energy Corp. | 10,535,281 | 791,144 | ||||||
| Jaguar Uranium | 2,000,000 | - | ||||||
| Toro Energy Limited | 6,000,000 | - | ||||||
| Purepoint Uranium | 7,333,334 | 3,333,334 | ||||||
| Future Fuels | 12,500,000 | - | ||||||
| Royal Uranium | 8,000,000 | - | ||||||
On May 7, 2024, the Company subscribed to 335,417 subscription receipts of Premier American Uranium Inc. (“Premier American Uranium”) (the “PUR Subscription Receipts”) at a price of $2.45 per PUR Subscription Receipt for total consideration of $821,771. Each PUR Subscription Receipt entitled the Company to receive one unit of Premier American Uranium, comprising one common share and one-half of one common share purchase warrant of Premier American Uranium upon the satisfaction of certain escrow release conditions. The escrow release conditions were lifted on June 27, 2024, at which point the PUR Subscription Receipts were converted into 335,417 common shares and 167,708 common share purchase warrants of Premier American Uranium.
ISOENERGY LTD.
NOTES TO THE CONDENSED CONSOLIDATED INTERIM FINANCIAL STATEMENTS
(Expressed in Canadian Dollars)
FOR THE THREE AND SIX MONTHS ENDED JUNE 30, 2025 AND 2024
| 7. | MARKETABLE SECURITES (continued) |
On December 28, 2023, the Company subscribed to 2,000,000 subscription receipts of Atha Energy Corp. (“Atha Energy”) (the “Atha Subscription Receipts”) at a price of $1.00 per Atha Subscription Receipt. Each Atha Subscription Receipt entitled the Company to receive one common share of Atha Energy upon the satisfaction of certain escrow release conditions, including the receipt of all necessary approvals relating to Atha Energy’s proposed acquisition of Latitude Uranium Inc. (“Latitude Uranium”) announced on December 7, 2023.
On March 8, 2024, in connection with completion of Atha Energy’s acquisition of Latitude Uranium, the Atha Subscription Receipts were converted into 2,000,000 shares of Atha Energy and the Company’s 5,907,600 shares of Latitude Uranium were exchanged for 1,635,814 shares of Atha Energy. The 2,857,150 Latitude Uranium warrants can be exercised to acquire 791,144 Atha Energy shares at a price per Atha Energy share of $1.8058.
On April 19, 2024, Atha Energy completed the acquisition of 92 Energy Ltd. (“92 Energy”) and the Company’s 10,755,000 92 Energy shares were exchanged for 6,274,467 Atha Energy shares.
On April 22, 2025, the Company subscribed to 625,000 Atha Energy shares for $250,000.
On July 19, 2024, the Company received 2,000,000 common shares of Jaguar Uranium (the “Jaguar Uranium Shares”) following the completion of the sale of its Argentina assets (Note 6a). The Company recorded an initial investment of $13,727,000 (US$10,000,000) for the Jaguar Uranium Shares. The Company requires consent from Jaguar Uranium should the Company trade or otherwise transfer the Jaguar Uranium Shares prior to Jagar Uranium completing a public listing.
On October 2, 2024, the Company purchased 6,000,000 common shares of Toro Energy Limited (“Toro Energy”) at a price of AUD$0.24 per common share.
On November 22, 2024, in connection with the Purepoint Financing (Note 6c), the Company purchased 3,333,334 units of Purepoint Uranium (“Purepoint Unit”). Each Purepoint Unit consists of one common share and one common share purchase warrant purchased at a price of $0.30 per unit for total consideration of $1,000,000. The Company received another 4,000,000 common shares of Purepoint Uranium at a price of $0.265 per common share on January 14, 2025 as a result of the Company exercising its Put Option in the Joint Venture Agreement (Note 6c).
On February 14, 2025, the Company received 12,500,000 common shares of Future Fuels from the sale of the Mountain Lake property. The Company recorded an initial investment of $8,625,000 based on the share price of Future Fuels on the sale date (Note 6d).
On May 15, 2025, the Company received 8,000,000 common shares of Royal Uranium from the sale of the Royalty Assets. The Company recorded an initial investment of $2,800,000 based on its indicative fair value (Note 6e).
The following assumptions were used to estimate the fair value of the Purepoint Uranium, Premier American Uranium, and Atha Energy warrants on June 30, 2025 and December 31, 2024:
| June 30, 2025 | ||||||||||||
| Purepoint Uranium | Premier American Uranium | Atha Energy | ||||||||||
| Expected stock price volatility | 125.17 | % | 90.84 | % | 85.76 | % | ||||||
| Expected life of warrants (years) | 2.4 | 0.9 | 0.8 | |||||||||
| Risk free interest rate | 2.60 | % | 2.60 | % | 2.60 | % | ||||||
| Expected dividend yield | 0.00 | % | 0.00 | % | 0.00 | % | ||||||
| Share price | $ | 0.24 | $ | 1.17 | $ | 0.61 | ||||||
| Exercise price | $ | 0.40 | $ | 3.50 | $ | 1.81 | ||||||
| Fair value per warrant | $ | 0.14 | $ | 0.08 | $ | 0.03 | ||||||
| December 31, 2024 | ||||||||||||
| Purepoint Uranium | Premier American Uranium | Atha Energy | ||||||||||
| Expected stock price volatility | 122.76 | % | 96.37 | % | 82.20 | % | ||||||
| Expected life of warrants (years) | 2.9 | 1.4 | 1.3 | |||||||||
| Risk free interest rate | 2.92 | % | 2.92 | % | 2.92 | % | ||||||
| Expected dividend yield | 0.00 | % | 0.00 | % | 0.00 | % | ||||||
| Share price | $ | 0.22 | $ | 1.44 | $ | 0.56 | ||||||
| Exercise price | $ | 0.40 | $ | 3.50 | $ | 1.81 | ||||||
| Fair value per warrant | $ | 0.14 | $ | 0.29 | $ | 0.05 | ||||||
ISOENERGY LTD.
NOTES TO THE CONDENSED CONSOLIDATED INTERIM FINANCIAL STATEMENTS
(Expressed in Canadian Dollars)
FOR THE THREE AND SIX MONTHS ENDED JUNE 30, 2025 AND 2024
| 8. | PROPERTY AND EQUIPMENT |
The following is a summary of the carrying values of property and equipment:
| Land and buildings |
Vehicles and equipment |
Right-of- use asset |
Leasehold improve- ments |
Furniture | Total | |||||||||||||||||||
| Cost | ||||||||||||||||||||||||
| Balance, January 1, 2024 | $ | 12,228,068 | $ | 1,860,156 | $ | 497,263 | $ | 125,848 | $ | 28,487 | $ | 14,739,822 | ||||||||||||
| Additions | - | 604,534 | - | - | 13,992 | 618,526 | ||||||||||||||||||
| Foreign exchange movement | 1,074,694 | 162,606 | - | - | - | 1,237,300 | ||||||||||||||||||
| Balance, December 31, 2024 | $ | 13,302,762 | $ | 2,627,296 | $ | 497,263 | $ | 125,848 | $ | 42,479 | $ | 16,595,648 | ||||||||||||
| Additions | - | 147,154 | 168,673 | 79,681 | 49,165 | 444,673 | ||||||||||||||||||
| Foreign exchange movement | (636,955 | ) | (179,380 | ) | - | - | - | (816,335 | ) | |||||||||||||||
| Balance, June 30, 2025 | $ | 12,665,807 | $ | 2,595,070 | $ | 665,936 | $ | 205,529 | $ | 91,644 | $ | 16,223,986 | ||||||||||||
| Accumulated depreciation | ||||||||||||||||||||||||
| Balance, January 1, 2024 | $ | - | $ | 89,991 | $ | 8,553 | $ | 2,161 | $ | 489 | $ | 101,194 | ||||||||||||
| Depreciation | - | 101,794 | 121,737 | 30,922 | 7,699 | 262,152 | ||||||||||||||||||
| Balance, December 31, 2024 | $ | - | $ | 191,785 | $ | 130,290 | $ | 33,083 | $ | 8,188 | $ | 363,346 | ||||||||||||
| Depreciation | - | 52,791 | 72,134 | 24,002 | 9,816 | 158,743 | ||||||||||||||||||
| Balance, June 30, 2025 | $ | - | $ | 244,576 | $ | 202,424 | $ | 57,085 | $ | 18,004 | $ | 522,089 | ||||||||||||
| Net book value: | ||||||||||||||||||||||||
| Balance, December 31, 2024 | $ | 13,302,762 | $ | 2,435,511 | $ | 366,973 | $ | 92,765 | $ | 34,291 | $ | 16,232,302 | ||||||||||||
| Balance, June 30, 2025 | $ | 12,665,807 | $ | 2,350,494 | $ | 463,512 | $ | 148,444 | $ | 73,640 | $ | 15,701,897 | ||||||||||||
ISOENERGY LTD.
NOTES TO THE CONDENSED CONSOLIDATED INTERIM FINANCIAL STATEMENTS
(Expressed in Canadian Dollars)
FOR THE THREE AND SIX MONTHS ENDED JUNE 30, 2025 AND 2024
| 9. | EXPLORATION AND EVALUATION ASSETS |
The following is a summary of the carrying value of the acquisition costs and expenditures on the Company’s exploration and evaluation assets.
| Note | June 30, 2025 | December 31, 2024 | ||||||||
| Acquisition costs: | ||||||||||
| Acquisition costs, opening | $ | 197,635,680 | $ | 227,424,953 | ||||||
| Additions | 9a | 163,790 | 856,259 | |||||||
| Asset retirement obligation change in estimate | 10 | 165,923 | (75,608 | ) | ||||||
| Acquisition costs in disposal group | 6a | - | (7,736,915 | ) | ||||||
| Disposals and impairment of assets | 9b | (1,065,567 | ) | (33,853,518 | ) | |||||
| Foreign exchange movement | (6,985,427 | ) | 11,020,509 | |||||||
| Acquisition costs, closing | $ | 189,914,399 | $ | 197,635,680 | ||||||
| Exploration and evaluation costs: | ||||||||||
| Exploration costs, opening | $ | 64,655,418 | $ | 47,331,385 | ||||||
| Additions: | ||||||||||
| Drilling | 3,258,690 | 6,154,761 | ||||||||
| Geological and geophysical | 1,621,549 | 5,524,677 | ||||||||
| Labour and wages | 1,363,430 | 3,283,034 | ||||||||
| Camp costs | 938,759 | 2,019,767 | ||||||||
| Share-based compensation | 15 | 886,447 | 1,449,708 | |||||||
| Engineering and underground access | 411,449 | 1,300,104 | ||||||||
| Community relations | 255,996 | 575,462 | ||||||||
| Travel | 203,599 | 681,660 | ||||||||
| Health and safety and environmental | 182,159 | 561,570 | ||||||||
| Geochemistry and assays | 142,541 | 362,934 | ||||||||
| Claim holding costs and advance royalties | 120,335 | 1,537,485 | ||||||||
| Net extension of claim refunds | (10,713 | ) | (67,713 | ) | ||||||
| Other | 306,930 | 484,744 | ||||||||
| Foreign exchange movement | (274,703 | ) | 6,472 | |||||||
| Total exploration and evaluation in the period | $ | 9,406,468 | $ | 23,874,665 | ||||||
| Exploration and evaluation costs in disposal group | 6a | - | (445,173 | ) | ||||||
| Disposals and impairment of assets | 9b | (145,443 | ) | (6,105,459 | ) | |||||
| Exploration and evaluation, closing | $ | 73,916,443 | $ | 64,655,418 | ||||||
| Total costs, closing | $ | 263,830,842 | $ | 262,291,098 | ||||||
All claims are subject to minimum expenditure commitments. The Company expects to incur the minimum expenditures to maintain the claims.
| (a) | Additions |
In the six months ended June 30, 2025, the Company elected to issue 16,666 common shares with a value of $161,160 to complete the 1st anniversary payment to retain its 100% interest in the Bulyea River property. In addition, the Company spent $2,630 to stake claims adjacent to its Tony M mine.
In the year ended December 31, 2024, the fair value of a contingent liability pursuant to the acquisition of the Ben Lomond property increased by $278,152 and the increase in value has been recognized as an increase in the acquisition cost of Ben Lomond. In addition, the Company spent $408,449 to stake claims to the northwest of the Tony M mine, spent $163,887 to purchase all the outstanding common shares of 2596190 Alberta Ltd., which holds a 100% interest in the Bulyea River property, and spent $5,771 to stake several property extensions adjacent to its Evergreen property during the year ended December 31, 2024.
ISOENERGY LTD.
NOTES TO THE CONDENSED CONSOLIDATED INTERIM FINANCIAL STATEMENTS
(Expressed in Canadian Dollars)
FOR THE THREE AND SIX MONTHS ENDED JUNE 30, 2025 AND 2024
| 9. | EXPLORATION AND EVALUATION ASSETS (continued) |
| (b) | Disposals and impairment |
In the six months ended June 30, 2025, the Company derecognized $1,060,000 of exploration and evaluation assets as a result of exercising the put option in the Joint Venture Agreement (Note 6c) and derecognized $151,010 of exploration and evaluation assets on completion of the sale of the Mountain Lake property in Nunavut (Note 6d).
In the year ended December 31, 2024, the Company recorded a loss of $25,616,241 on the contribution of assets to the form the Purepoint Joint Venture with Purepoint Uranium (Note 6c). In the year ended December 31, 2024, the Company identified indicators of impairment on its Radio and Carlson Creek properties primarily because of the loss on the contribution of assets to form the Purepoint Joint Venture. The Company wrote the Radio and Carlson Creek properties down to their estimated fair values of $365,268 and $335,501, respectively, and recorded an impairment loss of $14,342,736 as a result.
| 10. | ENVIRONMENTAL BONDS AND ASSET RETIREMENT OBLIGATIONS |
Environmental bonds have been posted with regulatory authorities in Utah, Unites States and Queensland, Australia to secure asset retirement obligations, as well as the reclamation related to recently reclaimed and future exploration work. Subsequent to June 30, 2025, the Company posted an additional AUD$352,066 after an updated rehabilitation cost estimate was approved by the regulatory authority for the Ben Lomond property in Queensland, Australia.
June 30, 2025 |
December 31, 2024 | |||||||
| Opening balance, start of period | $ | 2,725,220 | $ | 2,542,047 | ||||
| Foreign exchange movement | (118,874 | ) | 183,173 | |||||
| Balance, end of period | $ | 2,606,346 | $ | 2,725,220 | ||||
The Company has recognized a provision for environmental rehabilitation in respect of the Tony M, Daneros and Rim mineral properties in Utah, United States and the Ben Lomond property in Queensland, Australia. The provision is based on the applicable regulatory body’s estimates of projected reclamation costs.
| June 30, 2025 | December 31, 2024 | |||||||
| Opening balance, start of period | $ | 2,026,975 | $ | 1,895,472 | ||||
| Accretion | 51,553 | 82,178 | ||||||
| Change in estimates | 165,923 | (75,608 | ) | |||||
| Foreign exchange movement | (79,465 | ) | 124,933 | |||||
| Balance, end of period | $ | 2,164,986 | $ | 2,026,975 | ||||
The estimated undiscounted amount of the asset retirement obligations as at June 30, 2025 is $2,402,371 (December 31, 2024: $2,369,440). The expected timing of cash flows in respect of each provision is based on the estimated start of reclamation activities. The asset retirement obligations are estimated based on the following key assumptions:
| At June 30, 2025 | United States | Australia | ||||||
| Inflation rate | 2.70 | % | 2.70 | % | ||||
| Discount rate | 4.48 | % | 3.85 | % | ||||
| At December 31, 2024 | United States | Australia | ||||||
| Inflation rate | 2.70 | % | 1.80 | % | ||||
| Discount rate | 4.48 | % | 4.41 | % | ||||
ISOENERGY LTD.
NOTES TO THE CONDENSED CONSOLIDATED INTERIM FINANCIAL STATEMENTS
(Expressed in Canadian Dollars)
FOR THE THREE AND SIX MONTHS ENDED JUNE 30, 2025 AND 2024
| 11. | CONVERTIBLE DEBENTURES |
2020 Debentures
On August 18, 2020, IsoEnergy entered into an agreement with Queen’s Road Capital Investment Ltd. (“QRC”) for a US$6 million private placement of unsecured convertible debentures (the “2020 Debentures”). The 2020 Debentures carry a coupon (“Interest”) of 8.5% per annum, of which 6% is payable in cash and 2.5% payable in common shares of the Company, over a 5-year term. The coupon on the 2020 Debentures can be reduced to 7.5% per annum on the public dissemination by the Company of an economically positive preliminary economic assessment study, at which point the cash component of the Interest will be reduced to 5% per annum. The Company received gross proceeds of $7,902,000 (US$6,000,000) on issuance of the 2020 Debentures.
On January 19, 2025, QRC elected to convert US$3,000,000 of the principal of the 2020 Debentures for 1,221,818 common shares of the Company (Note 15). Fair value of $13,928,728 of the principal converted was derecognized, which was determined based on the closing share price of the Company on the date of conversion. Interest of $27,539 owed on the US$3,000,000 principal from January 1, 2025 to the date of the conversion was settled in cash. The remaining principal amount of the 2020 Debentures (converted into Canadian dollars) is convertible into common shares of the Company at QRC’s option at a conversion price (the “Conversion Price”) of $3.52 per share, up to a maximum (the “Maximum Conversion Shares”) of 1,150,788 common shares.
In the three and six months ended June 30, 2025, the Company incurred interest expense of $88,216 and $207,248, respectively (2024: $174,458 and $346,405, respectively) on the 2020 Debentures.
2022 Debentures
On December 6, 2022, IsoEnergy entered into an agreement with QRC for a US$4 million private placement of unsecured convertible debentures (the “2022 Debentures” and together with the 2020 Debentures, the “Debentures”). The 2022 Debentures carry Interest at 10% per annum, of which 7.5% is payable in cash and 2.5% payable in common shares of the Company, over a 5-year term. The principal amount of the 2022 Debentures (converted into Canadian dollars) is convertible into common shares of the Company at the holder’s option at a Conversion Price of $17.32 per share, up to 366,070 Maximum Conversion Shares. The Company received gross proceeds of $5,459,600 (US$4,000,000) on issuance of the 2022 Debentures.
In the three and six months ended June 30, 2025, the Company incurred interest expense of $138,378 and $281,896, respectively (2024: $136,830 and $271,690, respectively) on the 2022 Debentures.
General terms of the Debentures
Interest is payable semi-annually on June 30 and December 31, and common shares of the Company issued as partial payment of Interest are, subject to TSX approval, issuable at a price equal to the 20-day volume-weighted average trading price (“VWAP”) of the Company’s common shares on the TSX on the twenty days prior to the date such Interest is due.
On the conversion of any portion of the principal amount of the Debentures, if the number of common shares to be issued on such conversion, taking into account all common shares issued in respect of all prior conversions of such Debentures, would result in the common shares to be issued exceeding the Maximum Conversion Shares for such Debentures, on conversion QRC shall be entitled to receive a payment (an “Exchange Rate Fee”) equal to the number of common shares that are not issued as a result of exceeding the Maximum Conversion Shares, multiplied by the 20-day VWAP. IsoEnergy can elect to pay any such Exchange Rate Fee in cash or, subject to the TSX approval, in common shares of the Company.
The Company will be entitled, on or after the third anniversary of the date of issuance of such Debentures, at any time the 20-day VWAP of the Company’s shares listed on the TSX exceeds 130% of the applicable Conversion Price, to redeem such Debentures at par plus accrued and unpaid Interest.
Upon completion of a change of control (which also requires in the case of the holders’ right to redeem the Debentures, a change in the Chief Executive Officer of the Company), the holders of the Debentures or the Company may require the Company to purchase or the holders to redeem, as the case may be, any outstanding Debentures in cash at: (i) on or prior to August 18, 2023 for the 2020 Debentures and on or prior to December 6, 2025 for the 2022 Debentures, 130% of the principal amount; and (ii) at any time thereafter, 115% of the principal amount, in each case plus accrued but unpaid interest, if any. In addition, upon the public announcement of a change of control that is supported by the Board of Directors, the Company may require the holders of the Debentures to convert the Debentures into common shares at the Conversion Price provided the consideration payable upon the change of control exceeds the Conversion Price and is payable in cash.
ISOENERGY LTD.
NOTES TO THE CONDENSED CONSOLIDATED INTERIM FINANCIAL STATEMENTS
(Expressed in Canadian Dollars)
FOR THE THREE AND SIX MONTHS ENDED JUNE 30, 2025 AND 2024
| 11. | CONVERTIBLE DEBENTURES (continued) |
The Company revalues the Debentures to fair value at the end of each reporting period with the change in the period related to credit risk recorded in Other Comprehensive Income or Loss (“OCI”) and other changes in fair value in the period recorded in the income or loss for the period.
| Six months ended June 30, 2025 | 2022 Debentures |
2020 Debentures |
Total | |||||||||
| Fair value, start of period | $ | 4,870,701 | $ | 25,408,605 | $ | 30,279,306 | ||||||
| Partial conversion of 2020 Debentures | - | (13,928,728 | ) | (13,928,728 | ) | |||||||
| Change in fair value in the period included in profit and loss | (133,706 | ) | (204,791 | ) | (338,497 | ) | ||||||
| Change in fair value in the period included in OCI | (31,290 | ) | - | (31,290 | ) | |||||||
| Fair value, end of period | $ | 4,705,705 | $ | 11,275,086 | $ | 15,980,791 | ||||||
| Year ended December 31, 2024 | 2022 Debentures |
2020 Debentures |
Total | |||||||||
| Fair value, start of period | $ | 5,884,208 | $ | 31,564,033 | $ | 37,448,241 | ||||||
| Change in fair value in the period included in profit and loss | (948,228 | ) | (6,155,428 | ) | (7,103,656 | ) | ||||||
| Change in fair value in the period included in OCI | (65,279 | ) | - | (65,279 | ) | |||||||
| Fair value, end of period | $ | 4,870,701 | $ | 25,408,605 | $ | 30,279,306 | ||||||
The following relevant assumptions were used to estimate the fair value of the Debentures:
| 2022 Debentures | 2020 Debentures1 | |||||||||||||||
|
June 30, 2025 |
December 31, 2024 |
June 30, 2025 |
December 31, 2024 |
|||||||||||||
| Expected stock price volatility | 50.00 | % | 44.00 | % | - | - | ||||||||||
| Expected life (years) | 2.4 | 2.9 | - | - | ||||||||||||
| Risk free interest rate | 2.42 | % | 2.68 | % | - | - | ||||||||||
| Expected dividend yield | 0.00 | % | 0.00 | % | - | - | ||||||||||
| Credit spread | 23.54 | % | 23.05 | % | - | - | ||||||||||
| Underlying share price of the Company | $ | 9.70 | $ | 10.36 | $ | 9.70 | $ | 10.36 | ||||||||
| Conversion price | $ | 17.32 | $ | 17.32 | $ | 3.52 | $ | 3.52 | ||||||||
| Exchange rate ($:US$) | 1.3639 | 1.4388 | 1.3639 | 1.4388 | ||||||||||||
Note 1: The discount on the 2020 Debentures is assumed to be 0% as it is assumed that the 2020 Debentures can be converted immediately and the shares received on conversion can be sold at fair market value.
ISOENERGY LTD.
NOTES TO THE CONDENSED CONSOLIDATED INTERIM FINANCIAL STATEMENTS
(Expressed in Canadian Dollars)
FOR THE THREE AND SIX MONTHS ENDED JUNE 30, 2025 AND 2024
| 12. | LEASE LIABILITIES |
The Company has recognized lease liabilities on its office leases:
|
June 30, 2025 |
December 31, 2024 | |||||||
| Opening balance, start of period | $ | 402,886 | $ | 512,566 | ||||
| Acquired during the period | 165,176 | - | ||||||
| Interest expense | 24,505 | 46,320 | ||||||
| Payments | (78,000 | ) | (156,000 | ) | ||||
| Balance, end of period | $ | 514,567 | $ | 402,886 | ||||
| Less: Current portion | (152,965 | ) | (121,165 | ) | ||||
| Long-term lease liabilities | $ | 361,602 | $ | 281,721 | ||||
During the six months ended June 30, 2025, the Company entered into an office lease, which commenced on February 1, 2025 for lease payments of $3,498 per month from August 1, 2025 to January 31, 2027, and then increased to $3,887 per month until February 28, 2030. The discount rate applied to the lease was 8%. Minimum undiscounted lease payments for the next twelve months are $197,976, for the next twenty-four months after that are $324,559, and beyond that are $77,733.
| 13. | COMMITMENTS |
Flow-through funding commitments
The Company has raised funds through the issuance of flow-through shares. Based on Canadian tax law, the Company is required to spend this amount on eligible exploration expenditures by December 31 of the year following the year in which the shares were issued.
The premium received for a flow-through share, which is the price received for the share in excess of the market price of the share, is recorded as a flow-through share premium liability. This liability is subsequently reduced when the required exploration expenditures are made, on a pro rata basis, and accordingly, a recovery of flow-through premium is then recorded as a reduction in the deferred tax expense to the extent that deferred income tax assets are available.
The Company issued flow-through shares on February 9, 2024 for gross proceeds of $23,000,000 (the “2024 FTS Liability”) (Note 15) and has incurred $20,622,929 in eligible exploration expenditures up to June 30, 2025. As of June 30, 2025, the Company is obligated to spend $2,377,071 on eligible exploration expenditures by December 31, 2025.
The Company issued flow-through shares on February 28, 2025 for gross proceeds of $20,007,375 (the “2025 FTS Liability”) (Note 15) and has incurred $886,754 in eligible exploration expenditures up to June 30, 2025. As of June 30, 2025, the Company is obligated to spend $19,120,621 on eligible exploration expenditures by December 31, 2026.
The flow-through share premium liability is comprised of:
|
June 30, 2025 |
December 31, 2024 |
|||||||
| Balance, opening | $ | 1,355,210 | $ | - | ||||
| Liability incurred on flow-through shares issued | 8,002,950 | 3,680,000 | ||||||
| Settlement of flow-through share liabilities on expenditures | (1,329,580 | ) | (2,324,790 | ) | ||||
| Balance, closing | $ | 8,028,580 | $ | 1,355,210 | ||||
Contingent payment obligations
The Company has an obligation to make a contingent payment of $500,000 related to the acquisition of the West Newcastle Range, Teddy Mountain and Ardmore East projects, if either of the following milestones are met within eight years:
| · | a National Instrument 43-101 compliant mineral resource estimate for the West Newcastle Range and Teddy Mountain projects is prepared where the mineral resource estimate is greater than or equal to 6.0 million pounds of U₃O₈; or |
| · | with respect to the Ardmore East project the mineral resources estimate is greater than or equal to 6.0 million pounds of U₃O₈ equivalent. |
ISOENERGY LTD.
NOTES TO THE CONDENSED CONSOLIDATED INTERIM FINANCIAL STATEMENTS
(Expressed in Canadian Dollars)
FOR THE THREE AND SIX MONTHS ENDED JUNE 30, 2025 AND 2024
| 13. | COMMITMENTS (continued) |
Royalties
In addition to applicable federal, provincial/state and municipal property taxes, duties and advance royalties, the Company’s exploration and evaluation properties are subject to certain royalties, which may or may not be payable in the future, depending on whether revenue is derived from the claims or leases to which these royalties are applicable.
Contractual arrangements
The Company has an obligation to fund its share of the approved exploration budget for the Purepoint Joint Venture (Note 6c). The Company’s share of the approved exploration budget for the year ending December 31, 2025 is $2,500,000.
The purchase agreement for the Bulyea River property, which closed on June 28, 2024, includes a provision for the return of the Bulyea River property to Critical Path Minerals Corp. (“Critical Path Minerals”), if the Company does not or chooses to not make the following payments to Critical Path Minerals by the following dates:
| · | On or before the 2nd anniversary of the closing date of sale: $300,000 in cash or common shares or a combination thereof, at the election of the Company; |
| · | On or before the 3rd anniversary of the closing date of sale: $350,000 in cash or common shares or a combination thereof, at the election of the Company; |
| · | Incur minimum expenditures of $2,000,000 within 36 months of the closing date of sale; and |
| · | Within 30 days after a published technical report containing a current mineral resource estimate for the Bulyea River property: $1,000,000 in cash or common shares or a combination thereof, at the election of the Company |
| 14. | INCOME TAXES |
Deferred income tax (expense) recovery comprises:
| For the
three months ended June 30 |
For the
six months ended June 30 |
|||||||||||||||
| 2025 | 2024 | 2025 | 2024 | |||||||||||||
| Deferred income tax (expense) recovery related to operations | $ | (328,798 | ) | $ | (785,627 | ) | $ | (1,669,103 | ) | $ | (532,315 | ) | ||||
| Settlement of flow-through share liability on expenditures | 820,146 | 617,374 | 1,329,580 | 1,020,989 | ||||||||||||
| Deferred income tax recovery (expense) | $ | 491,348 | $ | (168,253 | ) | $ | (339,523 | ) | $ | 488,674 | ||||||
In the three and six months ended June 30, 2025, the Company recognized a deferred tax (expense) recovery of $(342,092) and $434,538, respectively (2024: recovery of $696,249 and expense of $33,437, respectively) related to the change in the fair value of the marketable securities recorded in OCI.
In the three and six months ended June 30, 2025, the Company incurred $2,950,340 and $6,092,994, respectively (2024: $3,858,590 and $6,381,184, respectively) of eligible exploration expenditures in respect of its 2024 FTS Liability commitment. In the three and six months ended June 30, 2025, the Company incurred $870,230 and $886,754, respectively (2024: $nil) of eligible exploration expenditures in respect of its 2025 FTS Liability commitment.
Share issuance costs presented in the statements of changes in equity in the six months ended June 30, 2025, are net of a deferred tax impact of $1,205,201 (2024: $459,660).
ISOENERGY LTD.
NOTES TO THE CONDENSED CONSOLIDATED INTERIM FINANCIAL STATEMENTS
(Expressed in Canadian Dollars)
FOR THE THREE AND SIX MONTHS ENDED JUNE 30, 2025 AND 2024
| 15. | SHARE CAPITAL |
Authorized Capital - Unlimited number of common shares with no par value.
| Issued |
On March 20, 2025, the Company completed a consolidation of its issued and outstanding common shares on the basis of one new post-consolidation common share for every four existing pre-consolidation common shares. No fractional common shares were issued and any fractional shares were rounded down to the nearest whole common share. The number of common shares, restricted share units, stock options, and all per share amounts have been retroactively restated for all periods presented.
For the six months ended June 30, 2025:
| (a) | During the six months ended June 30, 2025, the Company issued: |
| · | 1,221,818 common shares to QRC from the conversion of US$3,000,000 of the principal of the 2020 Debentures (Note 11). |
| · | 248,237 common shares on the exercise of stock options for proceeds of $438,241. As a result of the exercises, $1,089,907 was reclassified from reserves to share capital. |
| · | 11,968 common shares to QRC to settle $119,680 of interest expense on the Debentures (Note 11). |
| · | 16,666 common shares to Critical Path Minerals with a fair value of $161,160 to retain its 100% interest in the Bulyea River property (Note 9a). |
| (b) | On February 28, 2025, the Company issued 1,333,825 flow through common shares at a price of $15.00 per share for gross proceeds of $20,007,375. Share issuance cost was $1,515,084, net of tax of $560,373. Concurrently, the Company issued 625,000 common shares to NexGen at a price of $10.00 per share for gross proceeds of $6,250,000 as part of a private placement. |
| (c) | On June 24, 2025, the Company issued 5,121,500 common shares at a price of $10.00 per share for gross proceeds of $51,215,500 in a bought deal financing. Share issuance cost was $2,729,375, net of tax of $461,127. |
For the year ended December 31, 2024:
| (d) | During the year ended December 31, 2024, the Company issued: |
| · | 239,865 common shares on the exercise of stock options for proceeds of $2,630,019. As a result of the exercises, $1,950,028 was reclassified from reserves to share capital. |
| · | 274,808 common shares on the exercise of warrants for proceeds of $3,627,474. As a result of the exercises, $819,407 was reclassified from reserves to share capital. |
| · | 25,265 common shares to QRC to settle $348,830 of interest expense on the Debentures (see Note 11). |
| (e) | On February 9, 2024, the Company issued 920,000 flow through common shares at a price of $25.00 per share for gross proceeds of $23,000,000. Share issuance cost was $1,242,784, net of tax of $459,660. |
| (f) | On April 29, 2024, the Company issued 31,318 common shares valued at $524,998 and made a cash payment of $525,002 to settle the Company’s obligation to make a payment of $1,050,000 to Mega Uranium pursuant to the acquisition of the Ben Lomond property in 2022. |
Restricted Share Units
Pursuant to the Company’s Omnibus Long-Term Incentive Plan (“Omnibus Plan”), the directors may, from time to time, authorize the issuance of Restricted Share Units (a “RSU” or RSUs”) to directors, officers, employees and consultants of the Company. Each RSU once vested, is exercised and a common share is issued for zero consideration to the participant.
RSUs issued and outstanding on the dates set forth below are summarized as follows:
| Number of RSUs | Weighted
average grant date fair value |
|||||||
| Outstanding January 1, 2024 | - | $ | - | |||||
| Granted | 87,500 | 10.60 | ||||||
| Outstanding December 31, 2024 | 87,500 | $ | 10.60 | |||||
| Outstanding June 30, 2025 | 87,500 | $ | 10.60 | |||||
ISOENERGY LTD.
NOTES TO THE CONDENSED CONSOLIDATED INTERIM FINANCIAL STATEMENTS
(Expressed in Canadian Dollars)
FOR THE THREE AND SIX MONTHS ENDED JUNE 30, 2025 AND 2024
| 15. | SHARE CAPITAL (continued) |
Restricted Share Units (continued)
Share-based compensation related to the vesting of the grant date fair value of the RSUs are as follows:
| For the
three months ended June 30 |
For the
six months ended June 30 |
|||||||||||||||
| 2025 | 2024 | 2025 | 2024 | |||||||||||||
| Expensed to the statement of income and comprehensive income | $ | 121,143 | $ | - | $ | 240,956 | $ | - | ||||||||
| Capitalized to exploration and evaluation assets | 20,190 | - | 40,158 | - | ||||||||||||
| $ | 141,333 | $ | - | $ | 281,114 | $ | - | |||||||||
Stock Options
Pursuant to the Company’s Omnibus Plan, directors may, from time to time, authorize the issuance of options to directors, officers, employees and consultants of the Company, enabling them to acquire up to 10% of the issued and outstanding common shares of the Company. The options can be granted for a maximum term of 10 years and are subject to vesting provisions as determined by the Board of Directors of the Company.
Stock option transactions and the number of stock options outstanding on the dates set forth below are summarized as follows:
| Number of options | Weighted average exercise price per share |
|||||||
| Outstanding January 1, 2024 | 3,943,032 | $ | 13.28 | |||||
| Granted | 647,000 | 12.68 | ||||||
| Expired | (421,136 | ) | 14.16 | |||||
| Forfeited | (46,583 | ) | 14.04 | |||||
| Exercised | (239,865 | ) | 10.96 | |||||
| Outstanding December 31, 2024 | 3,882,448 | $ | 13.20 | |||||
| Granted | 516,375 | $ | 11.72 | |||||
| Expired | (14,931 | ) | 17.04 | |||||
| Exercised | (248,237 | ) | 1.77 | |||||
| Outstanding, June 30, 2025 | 4,135,655 | $ | 13.69 | |||||
| Number of options exercisable | 3,061,863 | $ | 14.00 | |||||
As at June 30, 2025, the Company has stock options outstanding and exercisable as follows:
| Range of exercise prices |
Number of options |
Weighted average exercise price |
Number of options exercisable |
Weighted average exercise price |
Weighted average remaining contractual life (years) |
|||||||||||||||
| $4.04 - $10.44 | 416,685 | $ | 8.72 | 318,560 | $ | 8.29 | 2.2 | |||||||||||||
| $10.45 - $12.44 | 1,017,276 | 11.73 | 673,026 | 11.73 | 3.2 | |||||||||||||||
| $12.45 - $15.24 | 1,323,327 | 13.25 | 858,577 | 13.51 | 3.2 | |||||||||||||||
| $15.25 - $16.48 | 490,000 | 15.96 | 490,000 | 15.96 | 1.5 | |||||||||||||||
| $16.49 - $18.16 | 590,483 | 16.56 | 423,816 | 16.57 | 3.1 | |||||||||||||||
| $18.17 - $20.40 | 297,884 | 19.92 | 297,884 | 19.92 | 1.5 | |||||||||||||||
| 4,135,655 | $ | 13.69 | 3,061,863 | $ | 14.00 | 2.8 | ||||||||||||||
The majority of options granted vest 1/3 on the grant date and 1/3 each year thereafter. Replacement options issued to Consolidated Uranium option holders in 2023 were all vested on the date of issuance.
ISOENERGY LTD.
NOTES TO THE CONDENSED CONSOLIDATED INTERIM FINANCIAL STATEMENTS
(Expressed in Canadian Dollars)
FOR THE THREE AND SIX MONTHS ENDED JUNE 30, 2025 AND 2024
| 15. | SHARE CAPITAL (continued) |
Stock Options (continued)
The Company uses the Black-Scholes option pricing model to calculate the fair value of granted stock options. The model requires management to make estimates, which are subjective and may not be representative of actual results. Changes in assumptions can materially affect fair value estimates.
The following weighted average assumptions were used to estimate the grant date fair values:
|
June 30, 2025 |
December 31, 2024 | |||||||
| Expected stock price volatility | 62.42 | % | 61.57 | % | ||||
| Expected life of options (years) | 5.0 | 5.0 | ||||||
| Risk free interest rate | 2.87 | % | 2.98 | % | ||||
| Expected dividend yield | 0.00 | % | 0.00 | % | ||||
| Weighted average exercise price | $ | 11.72 | $ | 12.67 | ||||
| Weighted average fair value per option granted | $ | 6.44 | $ | 6.90 | ||||
The Company has share-based compensation related to options that vested or forfeited in the period. Share-based compensation related to options for the three and six months ended June 30 are as follows:
| For the
three months ended June 30 |
For the
six months ended June 30 |
|||||||||||||||
| 2025 | 2024 | 2025 | 2024 | |||||||||||||
| Expensed to the statement of income and comprehensive income | $ | 980,254 | $ | 1,054,796 | $ | 2,806,280 | $ | 2,231,325 | ||||||||
| Capitalized to exploration and evaluation assets | 289,062 | 226,686 | 846,289 | 520,677 | ||||||||||||
| $ | 1,269,316 | $ | 1,281,482 | $ | 3,652,569 | $ | 2,752,002 | |||||||||
Warrants
Warrant transactions and the number of warrants outstanding on the dates set forth below are summarized as follows:
| Number
of underlying shares |
Weighted
average exercise price per share |
|||||||
| Outstanding January 1, 2024 | 276,652 | $ | 13.20 | |||||
| Expired | (1,844 | ) | 13.20 | |||||
| Exercised | (274,808 | ) | 13.20 | |||||
| Outstanding December 31, 2024 | - | $ | - | |||||
| Outstanding, June 30, 2025 | - | $ | - | |||||
ISOENERGY LTD.
NOTES TO THE CONDENSED CONSOLIDATED INTERIM FINANCIAL STATEMENTS
(Expressed in Canadian Dollars)
FOR THE THREE AND SIX MONTHS ENDED JUNE 30, 2025 AND 2024
| 16. | RELATED PARTY TRANSACTIONS AND KEY MANAGEMENT PERSONNEL COMPENSATION |
NexGen is a related party of the Company due to its ownership in the Company and the overlapping members of the Board of Directors between NexGen and the Company. The Company’s key management personnel and directors are related parties. The following companies are related parties due to their relationship to the Company: Atha Energy (who acquired Latitude Uranium; Note 7), Premier American Uranium, Green Shift Commodities Ltd. (“Green Shift”), and Purepoint Uranium (Note 6c).
Key management personnel include those persons having authority and responsibility for planning, directing and controlling the activities of the Company as a whole. The Company has determined that key management personnel consists of executive and non-executive members of the Company’s Board of Directors and senior officers.
Remuneration attributed to key management personnel is summarized as follows. The amounts presented in the comparative period include short-term compensation and share-based compensation paid to the former President and Executive Vice President, Exploration & Development, who resigned on August 31, 2024 and October 31, 2024, respectively.
| Three months ended June 30, 2025 | Short term compensation |
Share-based compensation |
Total | |||||||||
| Expensed to the statement of income (loss) and comprehensive income | $ | 432,501 | $ | 952,474 | $ | 1,384,975 | ||||||
| Capitalized to exploration and evaluation assets | 63,921 | 71,477 | 135,398 | |||||||||
| $ | 496,422 | $ | 1,023,951 | $ | 1,520,373 | |||||||
| Six months ended June 30, 2025 | Short term compensation |
Share-based compensation |
Total | |||||||||
| Expensed to the statement of income (loss) and comprehensive income | $ | 867,464 | $ | 2,612,468 | $ | 3,479,932 | ||||||
| Capitalized to exploration and evaluation assets | 128,244 | 201,739 | 329,983 | |||||||||
| $ | 995,708 | $ | 2,814,207 | $ | 3,809,915 | |||||||
| Three months ended June 30, 2024 | Short term compensation |
Share-based compensation |
Total | |||||||||
| Expensed to the statement of income (loss) and comprehensive income | $ | 499,355 | $ | 856,382 | $ | 1,355,737 | ||||||
| Capitalized to exploration and evaluation assets | 28,582 | 90,518 | 119,100 | |||||||||
| $ | 527,937 | $ | 946,900 | $ | 1,474,837 | |||||||
| Six months ended June 30, 2024 | Short term compensation |
Share-based compensation |
Total | |||||||||
| Expensed to the statement of income (loss) and comprehensive income | $ | 898,180 | $ | 1,673,388 | $ | 2,571,568 | ||||||
| Capitalized to exploration and evaluation assets | 153,192 | 144,892 | 298,084 | |||||||||
| $ | 1,051,372 | $ | 1,818,280 | $ | 2,869,652 | |||||||
As of June 30, 2025:
| · | $39,878 (December 31, 2024: $1,120,402) was included in accounts payable and accrued liabilities owing to related parties and directors and officers; and |
| · | $130,956 (December 31, 2024: $99,449) due from related companies was included in accounts receivable. |
During the six months ended June 30, 2025, the Company:
| · | reimbursed NexGen $5,540 (2024: $16,016) for use of NexGen’s office space; and |
| · | received $20,539 (2024: $8,502) from Premier American Uranium primarily as reimbursement for salaries (2024: Latitude Uranium and Green Shift for equipment rentals and as reimbursement for office expenses and salaries). |
ISOENERGY LTD.
NOTES TO THE CONDENSED CONSOLIDATED INTERIM FINANCIAL STATEMENTS
(Expressed in Canadian Dollars)
FOR THE THREE AND SIX MONTHS ENDED JUNE 30, 2025 AND 2024
| 16. | RELATED PARTY TRANSACTIONS AND KEY MANAGEMENT PERSONNEL COMPENSATION (continued) |
On February 9, 2024, NexGen’s shareholding in the Company was diluted from 33.8% to 33.1% as a result of the issuance of 920,000 flow through common shares of the Company pursuant to the private placement on February 9, 2024 (Note 13), which NexGen did not participate in.
On January 19, 2025, NexGen’s shareholding was diluted to 31.8% as a result of the issuance of common shares on the conversion of US$3,000,000 of principal of 2020 Debentures (Note 11). Concurrent with the flow through financing on February 28, 2025, NexGen’s shareholding in the Company was maintained at 31.8% as a result of subscribing to 625,000 common shares of the Company in a private placement (Note 15).
On June 24, 2025, NexGen’s shareholding was diluted to 30.9% as a result of the issuance of 5,121,500 common shares as part of a bought deal financing, which NexGen participated in and bought 1,200,000 common shares (Note 15).
| 17. | FINANCIAL INSTRUMENTS |
The Company’s financial instruments consist of cash and cash equivalents, accounts receivable, marketable securities, accounts payable and accrued liabilities, and convertible debentures.
Fair Value Measurement
The Company classifies the fair value of financial instruments according to the following hierarchy based on the amount of observable inputs used to value the instrument:
| · | Level 1 – quoted prices in active markets for identical assets or liabilities. |
| · | Level 2 – inputs other than quoted prices included in Level 1 that are observable for the asset or liability, either directly (i.e. as prices) or indirectly (i.e. derived from prices). |
| · | Level 3 – inputs for the asset or liability that are not based on observable market data. |
The fair values of the Company’s cash and cash equivalents, accounts receivable, and accounts payable and accrued liabilities approximate their carrying value, due to their short-term maturities or liquidity.
The Debentures are re-measured at fair value at each reporting date with any change in fair value recognized in profit or loss, except for the change in fair value that is attributable to change in credit risk, which is presented in other comprehensive income (loss) (Note 11). The Debentures are classified as Level 2.
The marketable securities are re-measured at fair value at each reporting date with any change in fair value recognized in other comprehensive income (loss) (Note 7). The common shares included in marketable securities are Level 1, except for the common shares of Jaguar Uranium and Royal Uranium, which are Level 3 and their fair value is primarily based on the price of their most recent share issuances. The warrants included in marketable securities are Level 2.
Financial instrument risk exposure
As at June 30, 2025, the Company’s financial instrument risk exposure and the impact thereof on the Company’s financial instruments are summarized below:
| (a) | Credit Risk |
Credit risk is the risk that one party to a financial instrument will fail to discharge an obligation and cause the other party to incur a financial loss. As at June 30, 2025, the Company has cash on deposit and cash equivalents with large banks in Canada, the United States, and Australia. Credit risk is concentrated as a significant amount of the Company’s cash and cash equivalents is held at one financial institution. Management believes the risk of loss to be remote.
The Company’s accounts receivable mostly consists of input tax credits receivable from the Governments of Canada and Australia and amounts receivable from related parties. Accordingly, the Company does not believe it is subject to significant credit risk. The Company’s loan receivable from Anfield Energy included interest receivable and was repaid in its entirety during the six months ended June 30, 2025.
| (b) | Liquidity Risk |
Liquidity risk is the risk that an entity will encounter difficulty in raising funds to meet its obligations under financial instruments. The Company manages liquidity risk by maintaining sufficient cash balances that are accessible on deposit or on short-term notice. Liquidity requirements are managed based on expected cash flows to ensure that there is sufficient capital to meet short-term obligations. As at June 30, 2025, the Company had an adjusted working capital balance of $124,922,827 (adjusted working capital is defined as current assets less current liabilities, excluding flow-though share premium liabilities and debenture liabilities), including cash and cash equivalents of $84,666,913.
ISOENERGY LTD.
NOTES TO THE CONDENSED CONSOLIDATED INTERIM FINANCIAL STATEMENTS
(Expressed in Canadian Dollars)
FOR THE THREE AND SIX MONTHS ENDED JUNE 30, 2025 AND 2024
| 17. | FINANCIAL INSTRUMENTS (continued) |
Financial instrument risk exposure (continued)
| (c) | Market Risk |
Market risk is the risk of loss that may arise from changes in market factors such as interest rates, foreign exchange rates and commodity and equity prices.
| (i) | Interest Rate Risk |
Interest rate risk is the risk that the future cash flows from a financial instrument will fluctuate due to changes in market interest rates. The Company holds its cash and cash equivalents in bank accounts that earn variable interest rates. Due to the short-term nature of these financial instruments, fluctuations in market rates do not have a significant impact on the estimated fair value of the Company’s cash and cash equivalent balances as of June 30, 2025. The interest on the Debentures is fixed and not subject to market fluctuations.
| (ii) | Foreign Currency Risk |
The functional currency of the Company is the Canadian dollar. Certain of the Company’s subsidiaries use the US dollar and Australian dollar as functional currencies. The Company is affected by currency transaction risk and currency translation risk. Consequently, fluctuations of the Canadian dollar in relation to other currencies impact the fair value of financial assets, liabilities and operating results. Financial assets and liabilities subject to currency translation risk primarily include US dollar and Australian dollar denominated cash, US dollar and Australian dollar accounts receivable, US dollar and Australian dollar marketable securities, US dollar and Australian dollar accounts payable and accrued liabilities, and the Debentures. The Company maintains Canadian, US and Australian dollar bank accounts.
The Company is exposed to foreign exchange risk on its US dollar denominated cash, accounts payable and accrued liabilities, accounts receivable, marketable securities and Debentures. At its respective maturity dates, the principal amounts of the Debentures are due in full, and prior to then at a premium upon the occurrence of certain events, including a change of control. The Company holds sufficient US dollars to make all cash interest payments due under the Debentures until maturity but not to pay the principal amount. Accordingly, the Company is subject to risks associated with fluctuations in the Canadian/US dollar exchange rate that may make the Debentures more costly to repay.
A 5% change in the US dollar exchange rate can result in a net increase or decrease in the Company’s US dollar-based cash, accounts receivable, marketable securities, accounts payable and accrued liabilities, and Debentures of $28,817 that would flow through the consolidated statement of income (loss) and comprehensive income.
The Company is also exposed to foreign exchange risk on its Australian dollar denominated cash, accounts receivable, marketable securities, and accounts payable and accrued liabilities. Accordingly, the Company is subject to risks associated with fluctuations in the Canadian/Australian dollar exchange rate that may impact on its operating results.
A 5% change in the Australian dollar can increase or decrease the value of the Company’s Australian dollar-based cash, accounts receivable, marketable securities, and accounts payable and accrued liabilities and accounts receivable by $58,867 that would flow through consolidated statement of income (loss) and comprehensive income.
| (iii) | Price Risk |
The Company is exposed to price risk with respect to commodity and equity prices. Equity price risk is defined as the potential adverse impact of movements in individual equity prices or general movements in the level of the stock market on the Company’s financial performance. Commodity price risk is defined as the potential adverse impact of commodity price movements and volatilities on financial performance and economic value. Future declines in commodity prices may impact the valuation of long-lived assets. The Company closely monitors the commodity prices of uranium, individual equity movements, and the stock market. The Company holds marketable securities which are subject to equity price risk.
ISOENERGY LTD.
NOTES TO THE CONDENSED CONSOLIDATED INTERIM FINANCIAL STATEMENTS
(Expressed in Canadian Dollars)
FOR THE THREE AND SIX MONTHS ENDED JUNE 30, 2025 AND 2024
| 18. | SEGMENT INFORMATION |
The Company has identified its operating segments based on the internal reports that are reviewed and used by the chief executive officer and the executive management in assessing performance and in determining the allocation of resources. The Company has one operating segment, being the acquisition, exploration and development of uranium properties.
Geographically, the Company’s non-current assets and general and administrative expenditure are identified by country, being Canada, the United States, and Australia, with the corporate office in Canada. Geographic disclosure is as follows. Certain comparative amounts for the prior period have been reclassified to conform to the current period’s presentation.
| As at June 30, 2025 | Canada | United States | Australia | Total | ||||||||||||
| Current assets | $ | 127,520,008 | $ | 826,365 | $ | 145,352 | $ | 128,491,725 | ||||||||
| Property and equipment | 836,419 | 14,865,478 | - | 15,701,897 | ||||||||||||
| Exploration and evaluation assets | 102,467,860 | 135,302,057 | 26,060,925 | 263,830,842 | ||||||||||||
| Other non-current assets | - | 2,193,604 | 412,742 | 2,606,346 | ||||||||||||
| Total assets | $ | 230,824,287 | $ | 153,187,504 | $ | 26,619,019 | $ | 410,630,810 | ||||||||
| Total liabilities | $ | 27,959,856 | $ | 1,751,842 | $ | 681,713 | $ | 30,393,411 | ||||||||
| As at December 31, 2024 | Canada | United States | Australia | Total | ||||||||||||
| Current assets | $ | 59,282,638 | $ | 193,709 | $ | 110,056 | $ | 59,586,403 | ||||||||
| Property and equipment | 689,410 | 15,542,892 | - | 16,232,302 | ||||||||||||
| Exploration and evaluation assets | 95,738,413 | 141,027,791 | 25,524,894 | 262,291,098 | ||||||||||||
| Other non-current assets | - | 2,314,201 | 411,019 | 2,725,220 | ||||||||||||
| Total assets | $ | 155,710,461 | $ | 159,078,593 | $ | 26,045,969 | $ | 340,835,023 | ||||||||
| Total liabilities | $ | 35,220,994 | $ | 1,837,525 | $ | 613,345 | $ | 37,671,864 | ||||||||
| Three months ended June 30, 2025 | Canada | United States | Australia | Total | ||||||||||||
| Share-based compensation | $ | 1,084,648 | $ | - | $ | 16,749 | $ | 1,101,397 | ||||||||
| Administrative salaries, contractor and director fees | 745,685 | 26,533 | 16,580 | 788,798 | ||||||||||||
| Investor relations | 302,131 | - | - | 302,131 | ||||||||||||
| Office and administrative | 252,355 | 34,193 | 6,909 | 293,457 | ||||||||||||
| Professional and consultant fees | 774,975 | 114,684 | - | 889,659 | ||||||||||||
| Travel | 97,594 | 3,814 | (11,116 | ) | 90,292 | |||||||||||
| Public company costs | 480,127 | - | - | 480,127 | ||||||||||||
| Total general and administrative expenditure | $ | 3,737,515 | $ | 179,224 | $ | 29,122 | $ | 3,945,861 | ||||||||
| Six months ended June 30, 2025 | Canada | United States | Australia | Total | ||||||||||||
| Share-based compensation | $ | 3,001,688 | $ | - | $ | 45,548 | $ | 3,047,236 | ||||||||
| Administrative salaries, contractor and director fees | 1,483,117 | 67,607 | 33,388 | 1,584,112 | ||||||||||||
| Investor relations | 523,087 | - | - | 523,087 | ||||||||||||
| Office and administrative | 466,432 | 55,835 | 15,190 | 537,457 | ||||||||||||
| Professional and consultant fees | 1,770,457 | 180,013 | - | 1,950,470 | ||||||||||||
| Travel | 262,503 | 3,814 | - | 266,317 | ||||||||||||
| Public company costs | 625,853 | - | - | 625,853 | ||||||||||||
| Total general and administrative expenditure | $ | 8,133,137 | $ | 307,269 | $ | 94,126 | $ | 8,534,532 | ||||||||
ISOENERGY LTD.
NOTES TO THE CONDENSED CONSOLIDATED INTERIM FINANCIAL STATEMENTS
(Expressed in Canadian Dollars)
FOR THE THREE AND SIX MONTHS ENDED JUNE 30, 2025 AND 2024
| Three months ended June 30, 2024 | Canada | United States | Australia | Total | ||||||||||||
| Share-based compensation | $ | 1,033,202 | $ | - | $ | 21,594 | $ | 1,054,796 | ||||||||
| Administrative salaries, contractor and director fees | 755,559 | 17,469 | 29,050 | 802,078 | ||||||||||||
| Investor relations | 244,021 | - | - | 244,021 | ||||||||||||
| Office and administrative | 152,732 | 24,088 | 7,704 | 184,524 | ||||||||||||
| Professional and consultant fees | 611,276 | 90,564 | - | 701,840 | ||||||||||||
| Travel | 116,108 | - | 1,578 | 117,686 | ||||||||||||
| Public company costs | 94,788 | - | - | 94,788 | ||||||||||||
| Total general and administrative expenditure | $ | 3,007,686 | $ | 132,121 | $ | 59,926 | $ | 3,199,733 | ||||||||
| Six months ended June 30, 2024 | Canada | United States | Australia | Total | ||||||||||||
| Share-based compensation | $ | 2,188,137 | $ | - | $ | 43,188 | $ | 2,231,325 | ||||||||
| Administrative salaries, contractor and director fees | 1,794,697 | 37,222 | 41,196 | 1,873,115 | ||||||||||||
| Investor relations | 450,660 | - | - | 450,660 | ||||||||||||
| Office and administrative | 319,671 | 69,335 | 16,979 | 405,985 | ||||||||||||
| Professional and consultant fees | 1,101,572 | 259,140 | - | 1,360,712 | ||||||||||||
| Travel | 259,900 | - | 3,850 | 263,750 | ||||||||||||
| Public company costs | 260,954 | - | - | 260,954 | ||||||||||||
| Total general and administrative expenditure | $ | 6,375,591 | $ | 365,697 | $ | 105,213 | $ | 6,846,501 | ||||||||
The Company disposed of all net assets in the Argentina reporting segment in the year ended December 31, 2024 and all associated income and expenses in the comparative period are classified as discontinued operations (Note 6a).
| 19. | SUPPLEMENTAL DISCLOSURE WITH RESPECT TO CASH FLOWS |
There was no cash paid for income tax in the three and six months ended June 30, 2025 and 2024.
Non-cash transactions in the three and six months ended June 30, 2025 and 2024 included:
| (a) | A non-cash transaction in the three and six months ended June 30, 2025 of $309,252 and $886,447, respectively (2024: $226,686 and $520,677, respectively) related to share-based payments was included in exploration and evaluation assets (Note 15). |
| (b) | Acquisition of exploration and evaluation assets in the three and six months ended June 30, 2025 are presented net of a non-cash increase to asset retirement obligation of $165,923 (2024: $nil). Additions to exploration and evaluation assets in the three and six months ended June 30, 2025 are presented net of a non-cash (decrease) increase in accounts payable of $(1,113,618) and $518,433, respectively (2024: $460,755 and $2,009,667, respectively) and depreciation of $6,823 and $14,152, respectively (2024: $4,898 and $6,339, respectively) directly related to exploration and evaluation assets (Note 9). |
| (c) | Additions to property and equipment in the six months ended June 30, 2025 are presented net of a non-cash increase in right-of-use assets of $165,176 (Note 8). |
| (d) | The Company issued 1,221,818 common shares to QRC with a fair value of $13,928,728 in the six months ended June 30, 2025 following the conversion of US$3 million of the 2020 Debentures (Note 11). The Company issued 11,968 common shares with a fair value of $119,680 to QRC to settle a portion of the interest owing on the Debentures in the six months ended June 30, 2025 (2024: 10,313 common shares with a fair value of $171,200) (Note 11). |
| (e) | The Company received $1,060,000 of common shares of Purepoint Uranium in exchange for 10% of the Company’s interest in the Purepoint Joint Venture, with no gain or loss recorded on the exercise of the Put Option during the six months ended June 30, 2025 (Note 6c). |
| (f) | Acquisitions of exploration and evaluation assets in the six months ended June 30, 2025 include the issuance of 16,666 common shares with a fair value of $161,160 to complete the 1st anniversary payment to retain its 100% interest in the Bulyea River property. Acquisitions of exploration and evaluation assets in the six months ended June 30, 2024 are presented net of a non-cash increase in contingent payments of $278,152 (Note 9a). |